UNITED STATES
SECURITIES AND EXCHANGE COMMISSION
Washington, D.C. 20549
FORM
CERTIFIED SHAREHOLDER REPORT OF REGISTERED
MANAGEMENT INVESTMENT COMPANIES
INVESTMENT COMPANY ACT FILE NUMBER: 811-22047
| EXACT NAME OF REGISTRANT AS SPECIFIED IN CHARTER: | |
| ADDRESS OF PRINCIPAL EXECUTIVE OFFICES: |
2020 Calamos Court Naperville, Illinois 60563-2787 |
| NAME AND ADDRESS OF AGENT FOR SERVICE: |
John P. Calamos, Sr., Founder, Chairman and Calamos Advisors LLC 2020 Calamos Court Naperville, Illinois 60563-2787 |
REGISTRANT’S TELEPHONE NUMBER, INCLUDING AREA CODE: (630) 245-7200
DATE OF FISCAL YEAR END:
DATE OF REPORTING PERIOD: November 1, 2022 through October 31, 2023
ITEM 1(a). REPORT TO SHAREHOLDERS.

TIMELY INFORMATION INSIDE


Visit www.calamos.com/paperless to enroll. You can view shareholder communications, including fund prospectuses, annual reports and other shareholder materials online long before the printed publications arrive by traditional mail.
Family of Closed-End Funds
ANNUAL REPORT OCTOBER 31, 2023
Domestic Funds
Calamos Convertible Opportunities and Income Fund (Ticker: CHI)
Calamos Convertible and High Income Fund (Ticker: CHY)
Calamos Strategic Total Return Fund (Ticker: CSQ)
Calamos Dynamic Convertible and Income Fund (Ticker: CCD)
Global Funds
Calamos Global Dynamic Income Fund (Ticker: CHW)
Calamos Global Total Return Fund (Ticker: CGO)
Calamos Long/Short Equity & Dynamic Income Trust (Ticker: CPZ)
Experience and Foresight
Calamos is a trusted and leading provider of closed-end funds that use a diversified blend of convertible securities, equities, fixed income, and alternative investments across innovative investment strategies to support competitive distributions throughout a market cycle.
Our Managed Distribution Policy
(for Calamos Convertible Opportunities and Income Fund, Calamos Convertible and High Income Fund, Calamos Strategic Total Return Fund, Calamos Dynamic Convertible and Income Fund, and Calamos Long/Short Equity & Dynamic Income Fund)
Closed-end fund investors often seek a steady stream of income. Recognizing this important need, certain Calamos closed-end funds adhere to a managed distribution policy in which we aim to provide consistent monthly distributions through the disbursement of the following:
• Net investment income
• Net realized short-term capital gains
• Net realized long-term capital gains
• And, if necessary, return of capital
We set distributions at levels that we believe are sustainable for the long term. Each Fund's current monthly distribution per share as of October 31, 2023 is as follows:
• Calamos Convertible Opportunities and Income Fund: $0.0950
• Calamos Convertible and High Income Fund: $0.1000
• Calamos Strategic Total Return Fund: $0.1025
• Calamos Dynamic Convertible and Income Fund: $0.1950
• Calamos Long/Short Equity & Dynamic Income Fund: $0.1400
Our team focuses on delivering an attractive monthly distribution, while maintaining a long-term emphasis on risk management. The level of a Fund's distribution can be greatly influenced by market conditions, including the interest rate environment, the individual performance of securities held by the funds, our view of retaining leverage, fund tax considerations, and regulatory requirements.
You should not draw any conclusions about a Fund's investment performance from the amount of its distribution or from the terms of a Fund's plan. The Funds' Board of Trustees may amend or terminate the managed distribution policy at any time without prior notice to the Fund's shareholders. However, at this time there are no reasonably foreseeable circumstances that might cause the termination of a Fund's managed distribution policy.
For more information about any of the Calamos closed-end funds, we encourage you to contact your financial advisor or Calamos Investments at 800.582.6959 (Monday through Friday from 8:00 a.m. to 6:00 p.m., Central Time). You can also visit us at www.calamos.com.
TABLE OF CONTENTS
Letter to Shareholders | 1 | ||||||
| The Calamos Closed-End Funds: An Overview | 5 | ||||||
Additional Information About the Funds | 7 | ||||||
Investment Team Discussion | |||||||
| Investment Objective, Principal Investment Strategies and Principal Risks | |||||||
The Funds | |||||||
| Calamos Convertible Opportunities and Income Fund | 41 | ||||||
| Calamos Convertible and High Income Fund | 48 | ||||||
Calamos Strategic Total Return Fund | 57 | ||||||
| Calamos Dynamic Convertible and Income Fund | 63 | ||||||
Calamos Global Dynamic Income Fund | 69 | ||||||
Calamos Global Total Return Fund | 74 | ||||||
| Calamos Long/Short Equity & Dynamic Income Trust | 81 | ||||||
Principal Risks of the Funds | 90 | ||||||
Schedules of Investments | 110 | ||||||
Statements of Assets and Liabilities | 225 | ||||||
Statements of Operations | 227 | ||||||
Statements of Changes In Net Assets | 229 | ||||||
Statements of Cash Flows | 232 | ||||||
Notes to Financial Statements | 239 | ||||||
Financial Highlights | 254 | ||||||
| Report of Independent Registered Public Accounting Firm | 267 | ||||||
| Trustee Approval of Management Agreements | 268 | ||||||
Trustees and Officers | 271 | ||||||
Results of 2023 Annual Meeting | |||||||
Tax Information | 277 | ||||||
About Closed-End Funds | 278 | ||||||
Managed and Level Distribution Policies | 279 | ||||||
Automatic Dividend Reinvestment Plan | 280 | ||||||
| Additional Fund Information: Delaware Statutory Trust Act – Control Share Acquisitions | 281 | ||||||
Letter to Shareholders

JOHN P. CALAMOS, SR.
Founder, Chairman, and Global Chief Investment Officer
Dear Fellow Shareholder:
Welcome to your annual report for the 12 months ending October 31, 2023. In this report, you will find commentary from our portfolio management teams, a listing of portfolio holdings, financial statements and highlights, and detailed information about the performance and positioning of the Calamos Closed-End Funds.
A new report format developed to help you with your asset allocation decisions
Each Calamos Closed-End Fund is designed to serve income-oriented investors by providing steady, competitive distributions through a multi-asset, risk-managed, and flexible approach. Since we launched our first closed-end fund in 2002, we have selectively expanded our offerings to provide investors with access to the income and return opportunities of an evolving global economy.
Today, our closed-end suite includes seven offerings, including enhanced fixed income and total return funds, focused on either the US or global markets. (Please see page 5 for an overview of the funds.) Whereas we previously provided an individual report for each of our funds, this consolidated report now includes information about all of them. We hope you will welcome this format as an opportunity to learn more about the different ways we can help you pursue your income and total return goals.
Innovative multi-asset approaches designed to provide steady, attractive income
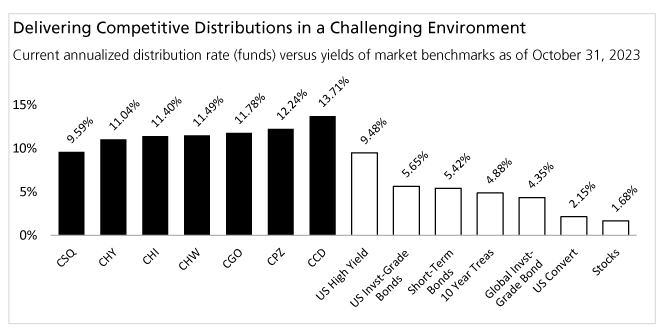
For investors seeking income, we understand the importance of providing a predictable amount of cash from month to month. Each of our closed-end funds is managed with the goal of providing steady (although not assured) monthly distributions through managed rate or level rate distribution policies. As the chart below shows, as of the end of the reporting period, the funds each offered attractive annualized distribution rates versus the yields of market benchmarks. We believe this speaks to the potential benefits of each fund's multi-asset class approach.
www.calamos.com
1
Letter to Shareholders
Performance data quoted represents past performance, which is no guarantee of future results. Current performance may be lower or higher than the performance quoted. The principal value of an investment will fluctuate so that your shares, when sold, may be worth more or less than their original cost. You can purchase or sell common shares daily. Like any other stock, the market price will fluctuate with the market. Upon sale, your shares may have a market price that is above or below net asset value and may be worth more or less than your original investment.
Perspectives on premiums and discounts
I'm often asked about my thoughts on premiums and discounts—specifically, whether investors should be concerned if their fund is trading at a discount to net asset value. Over time, it's quite normal for a closed-end fund to trade at a discount. At Calamos, our teams have a saying, "the flipside of volatility is opportunity." In other words, we recognize that short-term selloffs provide excellent occasions to add favorite positions at a lower cost. Similarly, I believe that for long-term fund investors, when a Calamos closed-end fund trades at a discount, it could be an attractive buying opportunity.
Market review
The reporting period was remarkable for its many ups and downs. Market turmoil reflected uncertainty about interest rates and Federal Reserve policy, energy prices, and inflation. Investors also grappled with anxiety due to a variety of events, including the failures of Silicon Valley Bank and Signature Bank, an autoworkers strike, and contentious debt ceiling negotiations in a polarized US Congress. Emerging secular themes—most notably advances in artificial intelligence and weight loss drugs—disrupted the markets as investors considered which companies and industries were positioned to win or lose.
The final months of the reporting period proved particularly difficult as investors grappled with deepening concerns about the sustainability of corporate earnings, consumer health, and the trajectory of economic growth. Although the Federal Reserve paused its rate tightening in September, the central bank dashed hopes of imminent rate cuts by reinforcing prior guidance that rates would
CALAMOS CLOSED-END FAMILY OF FUNDS ANNUAL REPORT
2
Letter to Shareholders
be higher for longer. The yield of the US 10-Year Treasury Bond reached multi-decade highs, while the onset of the Israel-Hamas war intensified geopolitical uncertainty.
Outlook
We see many signs pointing to slower economic growth and increasing risks across sectors. Higher interest rates will take time to work through the economy, with far-reaching consequences for businesses and consumers. Global manufacturing data is trending down, and fuel prices are putting significant pressure on many companies and households. Meanwhile, retailers will likely struggle as consumer nest eggs amassed during the pandemic dwindle and student loan repayments resume. Fiscal policy uncertainty, already elevated, will intensify as the US presidential election approaches. We expect geopolitical crosscurrents will take a toll on individual markets, sectors and industries. Monetary policy will also remain a focal point for the markets as investors contemplate the Federal Reserve's next moves. Against this backdrop, we expect saw-toothed and volatile markets to continue.
Asset allocation considerations
When global financial markets are as turbulent as they have been over recent months, investors may be tempted to retreat to the sidelines or give into short-term thinking. Income-oriented investors have faced added uncertainties as rates have risen. However, as we've noted in the past, jumping in and out of the market is a dangerous strategy—investors tend to capture the downturns and miss the upturns. Instead, establishing an asset allocation that aligns with your needs and risk tolerance is a far better course. Our teams are unwavering in their commitment to you and remain dedicated to seeking competitive distributions while paying close attention to the market risks.
We believe our funds, which have multiple levers for pursuing income and total returns, will be better positioned than those with more limited tools at their disposal. For example, we have the flexibility to invest across fixed income markets. Our bond holdings, such as high yield bonds and convertible bonds, have typically been less susceptible to interest rate changes than longer-duration investment-grade corporate or municipal bonds. Additionally, we believe the funds' judicious use of leverage can continue to provide long-term benefits to shareholders, despite the more recent headwinds of higher interest rates.
In the commentaries that follow, you'll read about the many ways our teams are pursuing competitive distributions and returns while seeking to manage the risks in the current environment. In addition to learning more about your current funds, I invite you to learn more about our other offerings as well. As always, thank you for your continued trust. All of us at Calamos Investments are honored that you have chosen us to help you achieve your asset allocation goals.
Sincerely,

John P. Calamos, Sr.
Founder, Chairman and Global Chief Investment Officer
www.calamos.com
3
Letter to Shareholders
Before investing, carefully consider a fund's investment objectives, risks, charges and expenses. Please see the prospectus containing this and other information or call 800-582-6959. Please read the prospectus carefully. Performance data represents past performance, which is no guarantee of future results. Current performance may be lower or higher than the performance quoted.
Diversification and asset allocation do not guarantee a profit or protection against a loss. Investments in alternative strategies may not be suitable for all investors.
Source: Calamos Advisors LLC.
Investments in overseas markets pose special risks, including currency fluctuation and political risks. These risks are generally intensified for investments in emerging markets. Countries, regions, and sectors mentioned are presented to illustrate countries, regions, and sectors in which a fund may invest. There are certain risks involved with investing in convertible securities in addition to market risk, such as call risk, dividend risk, liquidity risk and default risk, which should be carefully considered prior to investing.
Shares of closed-end funds frequently trade at a discount which is a market price that is below their net asset value.
Current Annualized Distribution Rate is the Fund's most recent distribution, expressed as an annualized percentage of the Fund's current market price per share. Estimates are calculated on a tax basis rather than on a generally accepted accounting principles (GAAP) basis but should not be used for tax reporting purposes. Distributions are subject to re-characterization for tax purposes after the end of the fiscal year. This information is not legal or tax advice. Consult a professional regarding your specific legal or tax matters. Under the level rate distribution policy of CGO and CHW and the managed rate distribution policy of CHI, CHY, CSQ, CCD, and CPZ the distributions paid to common shareholders may include net investment income, net realized short-term capital gains and return of capital. When the net investment income and net realized short-term capital gains are not sufficient, a portion of the level rate distribution will be a return of capital. In addition, a limited number of distributions per calendar year may include net realized long-term capital gains. Distribution rate may vary. Dividend yield is shown for stocks, current yield is shown for convertibles, yield to worst for remaining indexes. There are material differences between the indexes and the Calamos closed-end funds. Indexes are unmanaged, do not include fees and expenses and are not available for direct investments. Stocks are represented by the S&P 500 Index; US investment grade bonds are represented by the Bloomberg US Aggregate Bond Index; global investment grade bonds are represented by the Bloomberg Global Aggregate Index; short term bonds are represented by Bloomberg US Govt/Credit 1-3 Year Index and high yield bonds are represented by the ICE BofA US High Yield Index.
Current annualized distribution rate is the Fund's most recent distribution, expressed as an annualized percentage of the Fund's current market price per share. The Distribution Details for the distribution paid on 10/19/23, nearest the end of the reporting period are as follows. CHI: The Fund's distribution was $0.0950 per share. Based on our current estimates, we anticipate that approximately $0.0000 is paid from ordinary income, approximately $0.0650 is paid from short-term capital gains, approximately $0.0300 is paid from long-term capital gains and that approximately $0.0000 represents a return of capital. CHY: The Fund's distribution was $0.1000 per share. Based on our current estimates, we anticipate that approximately $0.0000 is paid from ordinary income, approximately $0.0617 is paid from short-term capital gains, approximately $0.0383 is paid from long-term capital gains and that approximately $0.0000 represents a return of capital. CHW: The Fund's distribution was $0.0500 per share. Based on our current estimates, we anticipate that approximately $0.0000 is paid from ordinary income, approximately $0.0500 is paid from short-term capital gains, approximately $0.0000 is paid from long-term capital gains and that approximately $0.0000 represents a return of capital. CSQ: The Fund's distribution was $0.1025 per share. Based on our current estimates, we anticipate that approximately $0.0000 is paid from ordinary income, approximately $0.0000 is paid from short-term capital gains, approximately $0.1025 is paid from long-term capital gains and that approximately $0.0000 represents a return of capital. CCD: The Fund's distribution was $0.1950 per share. Based on our current estimates, we anticipate that approximately $0.0000 is paid from ordinary income, approximately $0.1337 is paid from short-term capital gains, approximately $0.0613 is paid from long-term capital gains and that approximately $0.0000 represents a return of capital. CGO: The Fund's distribution was $0.0800 per share. Based on our current estimates, we anticipate that approximately $0.0000 is paid from ordinary income, approximately $0.0800 is paid from short-term capital gains, approximately $0.0000 is paid from long-term capital gains and that approximately $0.0000 represents a return of capital. CPZ: The Fund's distribution was $0.1400 per share. Based on our current estimates, we anticipate that approximately $0.0000 is paid from ordinary income, approximately $0.1400 is paid from short-term capital gains, approximately $0.0000 is paid from long-term capital gains and that approximately $0.0000 represents a return of capital.
Fund holdings are subject to change daily. The Funds are actively managed. The information contained herein is based on internal research derived from various sources and does not purport to be statements of all material facts relating to the securities mentioned. The information contained herein, while not guaranteed as to accuracy or completeness, has been obtained from sources we believe to be reliable.
Opinions are as of the publication date, subject to change and may not come to pass.
This information is being provided for informational purposes only and should not be considered investment advice or an offer to buy or sell any security in the portfolio.
CALAMOS CLOSED-END FAMILY OF FUNDS ANNUAL REPORT
4
The Calamos Closed-End Funds: An Overview
Offering Domestic and Global Strategies
Calamos closed-end funds draw upon decades of our pioneering experience, including a long history of opportunistically blending asset classes to capture upside potential while seeking to manage downside risk.
Closed-end funds issue a fixed number of shares through an initial public offering and trade on an exchange. They often employ leverage to pursue high current income or returns, but are primarily valued for their regular attractive distributions by investors seeking a steady income stream. Calamos closed-end funds adhere to distribution policies* that aim to provide consistent monthly distributions through the disbursement of the following:
• Net investment income
• Net realized short-term capital gains
• Net realized long-term capital gains
• And, if necessary, return of capital
We set distributions at levels that we believe are sustainable for the long term yet highly competitive versus other sources of yield. In addition, our team emphasizes ongoing risk management. The level of a fund's distribution can be influenced by market conditions, including the interest rate environment, the individual performance of securities, our view of retaining leverage, fund tax considerations, and regulatory requirements. It's important not to draw conclusions about your fund's investment performance from the amount of its distribution.
Although the funds share a focus on producing income, they can be broadly grouped into two categories: domestic and global.
DOMESTIC** | US ENHANCED FIXED INCOME Calamos Convertible Opportunities and Income Fund (Ticker: CHI) Invests in convertible securities and corporate high-yield bonds, primarily in US markets. Calamos Convertible and High Income Fund (Ticker: CHY) Invests in convertible securities and corporate high-yield bonds, primarily in US markets. | ||||||
| US TOTAL RETURN Calamos Strategic Total Return Fund (Ticker: CSQ) Invests in equities, higher-yielding convertible securities, and corporate bonds, primarily in US markets. Calamos Dynamic Convertible and Income Fund (Ticker: CCD) Invests in convertibles and other fixed-income securities, primarily in US markets. To help generate income and achieve a favorable risk/reward profile, the investment team can also sell options. | |||||||
www.calamos.com
5
The Calamos Closed-End Funds: An Overview
GLOBAL | GLOBAL ENHANCED FIXED INCOME Calamos Global Dynamic Income Fund (Ticker: CHW) Invests in equities, convertibles, and income-producing securities of various rated and unrated instruments in both US and non-US markets, and may use other income-producing strategies for hedging purposes. The Fund may invest between 40% to 100% of its managed assets in securities of foreign issuers. | ||||||
| GLOBAL TOTAL RETURN Calamos Global Total Return Fund (Ticker: CGO) Invests in equities, convertibles and income-producing securities of various rated and unrated instruments in both US and non-US markets. Will invest at least 50% in equities and between 40% and 100% of its managed assets in securities of foreign issuers. Calamos Long/Short Equity & Dynamic Income Trust (Ticker: CPZ) Invests at least 50% of its managed assets in a risk-managed long/short global equity strategy, with the balance invested in a broad array of income-producing assets, including preferred stocks and high yield bonds. The Fund May invest up to 50% of its managed assets in securities of foreign issuers; will not invest more than 25% in a single country, and may invest up to 20% in emerging market countries. | |||||||
* CHI, CHY, CSQ, CPZ, and CCD adhere to a managed distribution policy, and CHW and CGO adhere to a level distribution policy. Both distribution policies represent the investment company's commitment to providing common shareholders with a predictable but not assured level of cash flow. The funds' Board of Trustees may amend or terminate the managed or level distribution policies without prior notice to the funds' shareholders. However, at this time, there are no reasonably foreseeable circumstances that might cause the termination of the funds' distribution policies.
** Although these Funds primarily invest in the securities of US issuers, CHI and CHY may invest up to 25%, CSQ up to 35%, and CCD up to 50% of managed assets in securities of foreign issuers.
CALAMOS CLOSED-END FAMILY OF FUNDS ANNUAL REPORT
6
Additional Information About the Funds (Unaudited)
Calamos Convertible Opportunities and Income Fund
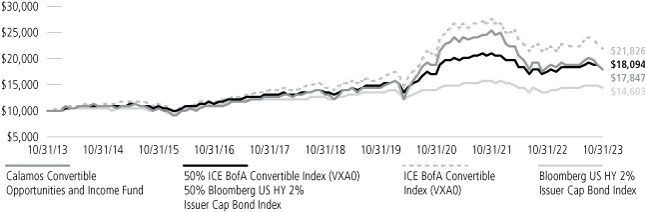
GROWTH OF $10,000: FOR THE 10-YEAR PERIOD ENDED 10/31/23
AVERAGE ANNUAL TOTAL RETURN† AS OF 10/31/23
| 1 YEAR | 5 YEARS | 10 YEARS | SINCE INCEPTION | ||||||||||||||||
Calamos Convertible Opportunities and Income Fund | |||||||||||||||||||
Market Value | 3.37 | % | 9.94 | % | 7.19 | % | 8.72 | % | |||||||||||
NAV | -2.27 | 6.47 | 5.96 | 8.41 | |||||||||||||||
50%VXAO-50%BBGUSHY2%Cap Index | 2.88 | 6.05 | 6.11 | 7.65 | |||||||||||||||
ICE BofA All US Convertible Index (VXA0) | -0.48 | 8.73 | 8.12 | 8.05 | |||||||||||||||
Bloomberg US HY 2% Issuer Cap Bond Index | 6.23 | 3.04 | 3.86 | 6.97 | |||||||||||||||
Performance data quoted represents past performance, which is no guarantee of future results. Current performance may be lower or higher than the performance quoted. The principal value and investment return of an investment will fluctuate so that your shares, when redeemed, may be worth more or less than their original cost. Average annual total return measures net investment income and capital gain or loss from portfolio investments as an annualized average. All performance shown assumes reinvestment of dividends and capital gain distributions. Source: State Street Corporation and Morningstar Direct.
† Average annual total return measures net investment income and capital gain or loss from portfolio investments as an annualized average assuming reinvestment of dividends and capital gains distributions.
NOTES:
The graphs do not reflect the income taxes that you would pay on fund distributions or the redemption of fund shares. Fund performance includes reinvestment of dividends.
The 50%VXAO-50%BBGUSHY2%Cap Index is blended from 50% - ICE BofA Convertibles Index (VXA0) and 50% - Bloomberg US Corp HY 2% Issuer Cap Bond Index.
The ICE BofA All US Convertibles Index is comprised of approximately 700 issues of only convertible bonds and preferreds of all qualities.
The Bloomberg US Corporate High Yield 2% Issuer Capped Index measures the performance of high-yield corporate bonds with a maximum allocation of 2% to any one issuer.
Index returns assume reinvestment of dividends and do not reflect deduction of fees and expenses. It is not possible to invest directly in an index.
www.calamos.com
7
Additional Information About the Funds (Unaudited)
Calamos Convertible Opportunities and Income Fund
Senior Securities
The following table sets forth information regarding the Fund's outstanding bank loans, and mandatory redeemable preferred shares ("MRPS") as of the end of each of the Fund's last ten fiscal years, as applicable. The information in the table shown below comes from the Fund's financial statements for the fiscal year ended October 31, 2023, and each of the prior nine years then ended, all of which have been audited by Deloitte & Touche LLP, the Fund's independent registered public accounting firm.
| FISCAL YEAR ENDED | TOTAL AMOUNT OUTSTANDING | ASSET COVERAGE | LIQUIDATING PREFERENCE PER PREFERRED SHARE(c) | AVERAGE MARKET VALUE PER PREFERRED SHARE | TYPE OF SENIOR SECURITY | ||||||||||||||||||
October 31, 2023 | $ | 314,400,000 | $ | 3,564 | (a) | — | — | Loan | |||||||||||||||
October 31, 2023 | $ | 133,000,000 | 211 | (b) | 25 | 25 | (d) | MRPS | |||||||||||||||
October 31, 2022 | $ | 339,400,000 | 3,630 | (a) | — | — | Loan | ||||||||||||||||
October 31, 2022 | $ | 133,000,000 | 232 | (b) | 25 | 25 | (d) | MRPS | |||||||||||||||
October 31, 2021 | $ | 399,400,000 | 4,116 | (a) | — | — | Loan | ||||||||||||||||
October 31, 2021 | $ | 133,000,000 | 309 | (b) | 25 | 25 | (d) | MRPS | |||||||||||||||
October 31, 2020 | $ | 288,400,000 | 4,431 | (a) | — | — | Loan | ||||||||||||||||
October 31, 2020 | $ | 100,000,000 | 319 | (b) | 25 | 25 | (d) | MRPS | |||||||||||||||
October 31, 2019 | $ | 277,400,000 | 4,080 | (a) | — | — | Loan | ||||||||||||||||
October 31, 2019 | $ | 100,000,000 | 283 | (b) | 25 | 25 | (d) | MRPS | |||||||||||||||
October 31, 2018 | $ | 288,000,000 | 3,921 | (a) | — | — | Loan | ||||||||||||||||
October 31, 2018 | $ | 100,000,000 | 282 | (b) | 25 | 25 | (d) | MRPS | |||||||||||||||
October 31, 2017 | $ | 275,000,000 | 4,265 | (a) | — | — | Loan | ||||||||||||||||
October 31, 2017 | $ | 100,000,000 | 293 | (b) | 25 | 25 | (d) | MRPS | |||||||||||||||
October 31, 2016 | $ | 306,000,000 | 3,454 | (a) | — | — | Loan | ||||||||||||||||
October 31, 2015 | $ | 353,000,000 | 3,316 | (a) | — | — | Loan | ||||||||||||||||
October 31, 2014 | $ | 360,000,000 | 3,588 | (a) | — | — | Loan | ||||||||||||||||
(a) Calculated by subtracting the Fund's total liabilities (not including notes payable) from the Fund's total assets and dividing this by the amount of notes payable outstanding, and by multiplying the result by 1,000.
(b) Calculated by subtracting the Fund's total liabilities (not including MRPS) from the Fund's total assets and dividing this by the number of MRPS outstanding, and by multiplying the result by 25.
(c) "Liquidating Preference per Preferred Share" means the amount to which a holder of preferred shares would be entitled upon the liquidation of the Fund in preference to common shareholders, expressed as a dollar amount per preferred share.
(d) The MRPS are not listed on any exchange or automated quotation system. The MRPS are considered debt of the issuer; and the liquidation preference approximates fair value.
Summary of Fund Expenses
The following table and example contain information about the costs and expenses that common shareholders will bear directly or indirectly. In accordance with Commission requirements, the table below shows our expenses, including interest payments on borrowed funds, and preferred stock dividend payments, as a percentage of our average net assets as of October 31, 2023, and not as a percentage of gross assets or managed assets.
By showing expenses as a percentage of average net assets, expenses are not expressed as a percentage of all of the assets we invest. The table and example are based on our capital structure as of October 31, 2023. As of October 31, 2023, the Fund had utilized $314 million of the $430 million available under the SSB Agreement ($260 million in advances outstanding, and $54 million in structural leverage consisting of collateral received from counterparties via SSB in connection with securities on loan), representing 28.1% of the Fund's managed assets as of that date, and had $133 million in MRPS outstanding, representing 11.9% of the Fund's managed assets. Combined, the borrowings under the SSB Agreement and the outstanding MRPS represented 39.9% of the Fund's managed assets.
CALAMOS CLOSED-END FAMILY OF FUNDS ANNUAL REPORT
8
Additional Information About the Funds (Unaudited)
SHAREHOLDER TRANSACTION EXPENSES | |||||||
Sales Load (as a percentage of offering price) | — | (1) | |||||
Offering Expenses Borne by the Fund (as a percentage of offering price) | — | (1) | |||||
Dividend Reinvestment Plan Fees (per sales transaction fee)(2) | $ | 15.00 | |||||
| ANNUAL EXPENSES | PERCENTAGE OF AVERAGE NET ASSETS ATTRIBUTABLE TO COMMON SHAREHOLDERS | ||||||
Management Fee(3) | 1.29 | % | |||||
Interest Payments on Borrowed Funds(4) | 2.39 | % | |||||
Preferred Stock Dividend Payments(5) | 0.62 | % | |||||
Other Expenses(6) | 0.10 | % | |||||
Total Annual Expenses | 4.40 | % | |||||
The following example illustrates the expenses that common shareholders would pay on a $1,000 investment in common shares, assuming (1) total annual expenses of 4.40% of net assets attributable to common shareholders; (2) a 5% annual return; and (3) all distributions are reinvested at net asset value:
1 YEAR | 3 YEARS | 5 YEARS | 10 YEARS | ||||||||||||||||
Total Expenses Paid by Common Shareholders(7) | $ | 44 | $ | 133 | $ | 223 | $ | 453 | |||||||||||
The example should not be considered a representation of future expenses. Actual expenses may be greater or less than those assumed. Moreover, our actual rate of return may be greater or less than the hypothetical 5% return shown in the example.
(1) If the securities to which this prospectus relates are sold to or through underwriters, the prospectus supplement will set forth any applicable sales load and the estimated offering expenses borne by us.
(2) Shareholders will pay a $15.00 transaction fee plus a $0.02 per share brokerage charge if they direct the Plan Agent (as defined below) to sell common shares held in a Plan account. In addition, each participant will pay a pro rata share of brokerage commissions incurred with respect to the Plan Agent's open-market purchases in connection with the reinvestment of dividends or distributions. If a participant elects to have the Plan Agent sell part or all of his or her common shares and remit the proceeds, such participant will be charged his or her pro rata share of brokerage commissions on the shares sold. See "Dividends and Distributions on Common Shares; Automatic Dividend Reinvestment Plan".
(3) The Fund pays Calamos an annual management fee, payable monthly in arrears, for its investment management services in an amount equal to 0.80% of the Fund's average weekly managed assets. In accordance with the requirements of the Commission, the table above shows the Fund's management fee as a percentage of average net assets attributable to common shareholders. By showing the management fee as a percentage of net assets, the management fee is not expressed as a percentage of all of the assets the Fund intends to invest. For purposes of the table, the management fee has been converted to 1.29% of the Fund's average weekly net assets as of October 31, 2023 by dividing the total dollar amount of the management fee by the Fund's average weekly net assets (managed assets less outstanding leverage).
(4) Reflects interest expense paid on $240 million in average borrowings under the SSB Agreement, plus $83 million in additional average structural leverage related to certain securities lending programs, as described under "Leverage".
(5) Reflects estimated dividend expense on $133 million aggregate liquidation preference of mandatory redeemable preferred shares outstanding. See "Leverage".
(6) "Other Expenses" are based on estimated amounts for the Fund's current fiscal year.
(7) The example does not include sales load or estimated offering costs, which would cause the expenses shown in the example to increase. In connection with an offering of common shares, the applicable prospectus supplement will set forth an example including sales load and estimated offering costs.
Effects of Leverage
The SSB Agreement provides for credit availability for the Fund, such that it may borrow up to $430 million. As of October 31, 2023, the Fund had utilized $314 million of the $430 million available under the SSB Agreement ($260 million of advances outstanding, and $54 million in structural leverage consisting of collateral received from counterparties via State Street Bank and Trust Company in connection with securities on loan), representing 28.1% of the Fund's managed assets as of that date,
www.calamos.com
9
Additional Information About the Funds (Unaudited)
and had $133 million of MRP Shares outstanding, representing 11.9% of the Fund's managed assets. Combined, the borrowings under the SSB Agreement and the outstanding MRP Shares represented 39.9% of the Fund's managed assets. Interest on the SSB Agreement was charged on the drawn amount at the rate of the Overnight Bank Financing Rate ("OBFR") plus 0.80%, payable monthly in arrears, from November 1, 2022, through June 30, 2023. The rate from July 1, 2023, through October 31, 2023, was OBFR plus 0.52%. Interest on overdue amounts or interest on the drawn amount paid during an event of default was charged OBFR plus 2.80% from November 1, 2022, through June 30, 2023. The rate from July 1, 2023, through October 31, 2023, was charged at OBFR plus 2.52%. These rates represent floating rates of interest that may change over time. The SSB Agreement has a commitment fee of 0.10% of any undrawn amount.
As of October 31, 2023, the interest rate charged under the SSB Agreement was 5.84%.
The Fund's MRP Shareholders are entitled to receive monthly cash dividends, at a currently effective dividend rate per annum for each series of MRP Shares as follows (subject to adjustment as described in the Fund's prospectus): 4.00% for Series B MRP Shares, 4.24% for Series C MRP Shares, 2.45% for Series D MRP Shares, and 2.68% for Series E MRP Shares.
To cover the interest expense on the borrowings under the SSB Agreement (including "net income" payments made with respect to borrowings offset by collateral for securities on loan) and the dividend payments associated with the MRP Shares, based on rates in effect on October 31, 2023, the Fund's portfolio would need to experience an annual return of 2.06% (before giving effect to expenses associated with senior securities).
The following table illustrates the hypothetical effect on the return to a holder of the Fund's common shares of the leverage obtained by us (and utilized on October 31, 2023). The purpose of this table is to assist you in understanding the effects of leverage. As the table shows, leverage generally increases the return to common shareholders when portfolio return is positive and greater than the cost of leverage and decreases the return when the portfolio return is negative or less than the cost of leverage. The figures appearing in the table are hypothetical and actual returns may be greater or less than those appearing in the table.
Assumed Portfolio Return (Net of Expenses) | (10.00 | )% | (5.00 | )% | 0.00 | % | 5.00 | % | 10.00 | % | |||||||||||||
Corresponding Common Share Return(1) | (20.13 | )% | (11.78 | )% | (3.43 | )% | 4.92 | % | 13.27 | % | |||||||||||||
(1) Includes interest expense on the borrowings under the SSB Agreement, accrued at interest rates in effect on October 31, 2023 of 5.84%, and dividend expense on the MRP Shares.
Market and Net Asset Value Information
Our common shares have traded both at a premium and a discount to NAV. We cannot predict whether our shares will trade in the future at a premium or discount to NAV. The provisions of the 1940 Act generally require that the public offering price of common shares (less any underwriting commissions and discounts) must equal or exceed the NAV per share of a company's common stock (calculated within 48 hours of pricing). Our issuance of common shares may have an adverse effect on prices in the secondary market for our common shares by increasing the number of common shares available, which may put downward pressure on the market price for our common shares. Shares of common stock of closed-end investment companies frequently trade at a discount from NAV.
The following table sets forth for each of the periods indicated the high and low closing market prices for our common shares on Nasdaq, the NAV per share and the premium or discount to NAV per share at which our common shares were trading. NAV is shown for the last business day of each quarter. See "Net Asset Value" for information as to the determination of our NAV.
CALAMOS CLOSED-END FAMILY OF FUNDS ANNUAL REPORT
10
Additional Information About the Funds (Unaudited)
MARKET PRICE(1) | NET ASSET VALUE AT QUARTER | PREMIUM/ (DISCOUNT) TO NET ASSET VALUE(3) | |||||||||||||||||||||
QUARTER ENDED | HIGH | LOW | END(2) | HIGH | LOW | ||||||||||||||||||
October 31, 2023 | $ | 11.32 | $ | 10.00 | $ | 8.99 | 15.20 | % | 4.56 | % | |||||||||||||
July 31, 2023 | $ | 11.36 | $ | 9.90 | $ | 10.51 | 10.21 | % | 1.53 | % | |||||||||||||
April 30, 2023 | $ | 12.34 | $ | 10.21 | $ | 9.94 | 16.91 | % | 1.49 | % | |||||||||||||
January 31, 2023 | $ | 12.09 | $ | 10.51 | $ | 10.61 | 15.03 | % | 3.89 | % | |||||||||||||
October 31, 2022 | $ | 12.90 | $ | 9.66 | $ | 10.25 | 14.01 | % | -3.36 | % | |||||||||||||
July 31, 2022 | $ | 13.00 | $ | 10.17 | $ | 11.18 | 16.28 | % | -2.33 | % | |||||||||||||
April 30, 2022 | $ | 14.50 | $ | 11.81 | $ | 12.05 | 4.69 | % | -4.58 | % | |||||||||||||
January 31, 2022 | $ | 16.34 | $ | 12.96 | $ | 13.62 | 4.21 | % | -4.14 | % | |||||||||||||
October 31, 2021 | $ | 15.90 | $ | 14.93 | $ | 15.49 | 3.31 | % | -0.20 | % | |||||||||||||
July 31, 2021 | $ | 15.45 | $ | 14.01 | $ | 15.05 | 1.25 | % | -1.34 | % | |||||||||||||
April 30, 2021 | $ | 15.32 | $ | 13.65 | $ | 15.33 | -1.54 | % | -8.08 | % | |||||||||||||
January 31, 2021 | $ | 14.13 | $ | 10.94 | $ | 15.07 | -9.19 | % | -12.97 | % | |||||||||||||
Source: Fund Accounting Records
(1) Based on high and low closing market price per share during the respective quarter and does not reflect commissions.
(2) Based on the NAV calculated on the close of business on the last business day of each calendar quarter.
(3) Premium and discount information is shown for the days when the Fund experienced its high and low closing market prices, respectively, per share during the respective quarter.
www.calamos.com
11
Additional Information About the Funds (Unaudited)
Calamos Convertible and High Income Fund
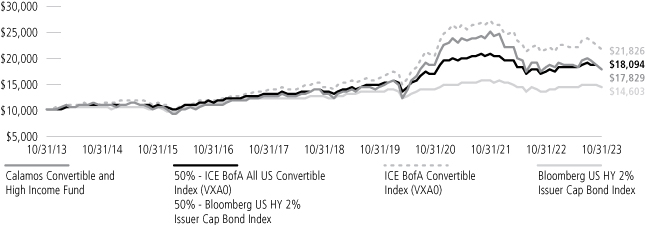
GROWTH OF $10,000: FOR THE 10-YEAR PERIOD ENDED 10/31/23
AVERAGE ANNUAL TOTAL RETURN† AS OF 10/31/23
| 1 YEAR | 5 YEARS | 10 YEARS | SINCE INCEPTION | ||||||||||||||||
Calamos Convertible and High Income Fund | |||||||||||||||||||
Market Value | 10.32 | % | 9.81 | % | 8.24 | % | 8.19 | % | |||||||||||
NAV | -1.99 | 6.56 | 5.95 | 7.72 | |||||||||||||||
50%VXAO-50%BBGUSHY2%Cap Index | 2.88 | 6.05 | 6.11 | 7.42 | |||||||||||||||
ICE BofA All US Convertible Index (VXA0) | -0.48 | 8.73 | 8.12 | 7.96 | |||||||||||||||
Bloomberg US HY 2% Issuer Cap Bond Index | 6.23 | 3.04 | 3.86 | 6.61 | |||||||||||||||
Performance data quoted represents past performance, which is no guarantee of future results. Current performance may be lower or higher than the performance quoted. The principal value and investment return of an investment will fluctuate so that your shares, when redeemed, may be worth more or less than their original cost. Average annual total return measures net investment income and capital gain or loss from portfolio investments as an annualized average. All performance shown assumes reinvestment of dividends and capital gain distributions. Source: State Street Corporation and Morningstar Direct.
† Average annual total return measures net investment income and capital gain or loss from portfolio investments as an annualized average assuming reinvestment of dividends and capital gains distributions.
NOTES:
The 50%VXAO-50%BBGUSHY2%Cap Index is blended from 50% - ICE BofA All US Convertibles Index (VXA0) and 50% - Bloomberg US HY 2% Issuer Capped Index.
The ICE BofA All US Convertibles Index is comprised of approximately 700 issues of only convertible bonds and preferreds of all qualities.
The Bloomberg US Corporate High Yield 2% Issuer Capped Index measures the performance of high-yield corporate bonds with a maximum allocation of 2% to any one issuer.
Index returns assume reinvestment of dividends and do not reflect deduction of fees and expenses. It is not possible to invest directly in an index.
CALAMOS CLOSED-END FAMILY OF FUNDS ANNUAL REPORT
12
Additional Information About the Funds (Unaudited)
Calamos Convertible and High Income Fund
Senior Securities
The following table sets forth information regarding the Fund's outstanding bank loans, and mandatory redeemable preferred shares ("MRPS") as of the end of each of the Fund's last ten fiscal years, as applicable. The information in the table shown below comes from the Fund's financial statements for the fiscal year ended October 31, 2023, and each of the prior nine years then ended, all of which have been audited by Deloitte & Touche LLP, the Fund's independent registered public accounting firm.
| FISCAL YEAR ENDED | TOTAL AMOUNT OUTSTANDING | ASSET COVERAGE | LIQUIDATING PREFERENCE PER PREFERRED SHARE(c) | AVERAGE MARKET VALUE PER PREFERRED SHARE | TYPE OF SENIOR SECURITY | ||||||||||||||||||
October 31, 2023 | $ | 340,400,000 | $ | 3,556 | (a) | — | — | Loan | |||||||||||||||
October 31, 2023 | $ | 145,000,000 | 209 | (b) | 25 | 25 | (d) | MRPS | |||||||||||||||
October 31, 2022 | $ | 365,400,000 | 3,635 | (a) | — | — | Loan | ||||||||||||||||
October 31, 2022 | $ | 145,000,000 | 229 | (b) | 25 | 25 | (d) | MRPS | |||||||||||||||
October 31, 2021 | $ | 435,400,000 | 4,106 | (a) | — | — | Loan | ||||||||||||||||
October 31, 2021 | $ | 145,000,000 | 308 | (b) | 25 | 25 | (d) | MRPS | |||||||||||||||
October 31, 2020 | $ | 318,400,000 | 4,386 | (a) | — | — | Loan | ||||||||||||||||
October 31, 2020 | $ | 110,000,000 | 317 | (b) | 25 | 25 | (d) | MRPS | |||||||||||||||
October 31, 2019 | $ | 303,900,000 | 4,055 | (a) | — | — | Loan | ||||||||||||||||
October 31, 2019 | $ | 110,000,000 | 280 | (b) | 25 | 25 | (d) | MRPS | |||||||||||||||
October 31, 2018 | $ | 315,500,000 | 3,904 | (a) | — | — | Loan | ||||||||||||||||
October 31, 2018 | $ | 110,000,000 | 280 | (b) | 25 | 25 | (d) | MRPS | |||||||||||||||
October 31, 2017 | $ | 302,500,000 | 4,236 | (a) | — | — | Loan | ||||||||||||||||
October 31, 2017 | $ | 110,000,000 | 291 | (b) | 25 | 25 | (d) | MRPS | |||||||||||||||
October 31, 2016 | $ | 337,000,000 | 3,440 | (a) | — | — | Loan | ||||||||||||||||
October 31, 2015 | $ | 398,000,000 | 3,258 | (a) | — | — | Loan | ||||||||||||||||
October 31, 2014 | $ | 400,000,000 | 3,575 | (a) | — | — | Loan | ||||||||||||||||
(a) Calculated by subtracting the Fund's total liabilities (not including notes payable) from the Fund's total assets and dividing this by the amount of notes payable outstanding, and by multiplying the result by 1,000.
(b) Calculated by subtracting the Fund's total liabilities (not including MRPS) from the Fund's total assets and dividing this by the number of MRPS outstanding, and by multiplying the result by 25.
(c) "Liquidating Preference per Preferred Share" means the amount to which a holder of preferred shares would be entitled upon the liquidation of the Fund in preference to common shareholders, expressed as a dollar amount per preferred share.
(d) The MRPS are not listed on any exchange or automated quotation system. The MRPS are considered debt of the issuer; and the liquidation preference approximates fair value.
Summary of Fund Expenses
The following table and example contain information about the costs and expenses that common shareholders will bear directly or indirectly. In accordance with Commission requirements, the table below shows our expenses, including interest payments on borrowed funds, and preferred stock dividend payments, as a percentage of our average net assets as of October 31, 2023, and not as a percentage of gross assets or managed assets.
By showing expenses as a percentage of average net assets, expenses are not expressed as a percentage of all of the assets we invest. The table and example are based on our capital structure as of October 31, 2023. As of October 31, 2023, the Fund had utilized $340 million of the $480 million available under the SSB Agreement ($291 million in advances outstanding, and $49 million in structural leverage consisting of collateral received from counterparties via SSB in connection with securities on loan), representing 28.1% of the Fund's managed assets as of that date, and had $145 million in MRPS outstanding, representing 12.0% of the Fund's managed assets. Combined, the borrowings under the SSB Agreement and the outstanding MRPS represented 40.1% of the Fund's managed assets.
www.calamos.com
13
Additional Information About the Funds (Unaudited)
SHAREHOLDER TRANSACTION EXPENSES | |||||||
Sales Load (as a percentage of offering price) | — | (1) | |||||
Offering Expenses Borne by the Fund (as a percentage of offering price) | — | (1) | |||||
Dividend Reinvestment Plan Fees (per sales transaction fee)(2) | $ | 15.00 | |||||
| ANNUAL EXPENSES | PERCENTAGE OF AVERAGE NET ASSETS ATTRIBUTABLE TO COMMON SHAREHOLDERS | ||||||
Management Fee(3) | 1.29 | % | |||||
Interest Payments on Borrowed Funds(4) | 2.39 | % | |||||
Preferred Stock Dividend Payments(5) | 0.63 | % | |||||
Other Expenses(6) | 0.10 | % | |||||
Total Annual Expenses | 4.41 | % | |||||
The following example illustrates the expenses that common shareholders would pay on a $1,000 investment in common shares, assuming (1) total annual expenses of 4.41% of net assets attributable to common shareholders; (2) a 5% annual return; and (3) all distributions are reinvested at net asset value:
1 YEAR | 3 YEARS | 5 YEARS | 10 YEARS | ||||||||||||||||
Total Expenses Paid by Common Shareholders(7) | $ | 44 | $ | 133 | $ | 223 | $ | 454 | |||||||||||
The example should not be considered a representation of future expenses. Actual expenses may be greater or less than those assumed. Moreover, our actual rate of return may be greater or less than the hypothetical 5% return shown in the example.
(1) If the securities to which this prospectus relates are sold to or through underwriters, the prospectus supplement will set forth any applicable sales load and the estimated offering expenses borne by us.
(2) Shareholders will pay a $15.00 transaction fee plus a $0.02 per share brokerage charge if they direct the Plan Agent (as defined below) to sell common shares held in a Plan account. In addition, each participant will pay a pro rata share of brokerage commissions incurred with respect to the Plan Agent's open-market purchases in connection with the reinvestment of dividends or distributions. If a participant elects to have the Plan Agent sell part or all of his or her common shares and remit the proceeds, such participant will be charged his or her pro rata share of brokerage commissions on the shares sold. See "Dividends and Distributions on Common Shares; Automatic Dividend Reinvestment Plan".
(3) The Fund pays Calamos an annual management fee, payable monthly in arrears, for its investment management services in an amount equal to 0.80% of the Fund's average weekly managed assets. In accordance with the requirements of the Commission, the table above shows the Fund's management fee as a percentage of average net assets attributable to common shareholders. By showing the management fee as a percentage of net assets, the management fee is not expressed as a percentage of all of the assets the Fund intends to invest. For purposes of the table, the management fee has been converted to 1.29% of the Fund's average weekly net assets as of October 31, 2023 by dividing the total dollar amount of the management fee by the Fund's average weekly net assets (managed assets less outstanding leverage).
(4) Reflects interest expense paid on $254 million in average borrowings under the SSB Agreement, plus $96 million in additional average structural leverage related to certain securities lending programs, as described under "Leverage".
(5) Reflects estimated dividend expense on $145 million aggregate liquidation preference of mandatory redeemable preferred shares outstanding. See "Leverage".
(6) "Other Expenses" are based on estimated amounts for the Fund's current fiscal year.
(7) The example does not include sales load or estimated offering costs, which would cause the expenses shown in the example to increase. In connection with an offering of common shares, the applicable prospectus supplement will set forth an example including sales load and estimated offering costs.
Effects of Leverage
The SSB Agreement provides for credit availability for the Fund, such that it may borrow up to $480 million. As of October 31, 2023, the Fund had utilized $340 million of the $480 million available under the SSB Agreement ($291 million of advances outstanding, and $49 million in structural leverage consisting of collateral received from counterparties via State Street Bank and Trust Company in connection with securities on loan), representing 28.1% of the Fund's managed assets as of that date,
CALAMOS CLOSED-END FAMILY OF FUNDS ANNUAL REPORT
14
Additional Information About the Funds (Unaudited)
and had $145 million of MRP Shares outstanding, representing 12.0% of the Fund's managed assets. Combined, the borrowings under the SSB Agreement and the outstanding MRP Shares represented 40.1% of the Fund's managed assets. Interest on the SSB Agreement was charged on the drawn amount at the rate of the Overnight Bank Financing Rate ("OBFR") plus 0.80%, payable monthly in arrears, from November 1, 2022, through June 30, 2023. The rate from July 1, 2023, through October 31, 2023, was OBFR plus 0.52%. Interest on overdue amounts or interest on the drawn amount paid during an event of default was charged OBFR plus 2.80% from November 1, 2022, through June 30, 2023. The rate from July 1, 2023, through October 31, 2023, was charged at OBFR plus 2.52%. These rates represent floating rates of interest that may change over time. The SSB Agreement has a commitment fee of 0.10% of any undrawn amount.
As of October 31, 2023, the interest rate charged under the SSB Agreement was 5.84%.
The Fund's MRP Shareholders are entitled to receive monthly cash dividends, at a currently effective dividend rate per annum for each series of MRP Shares as follows (subject to adjustment as described in the Fund's prospectus): 4.00% for Series B MRP Shares, 4.24% for Series C MRP Shares, 2.45% for Series D MRP Shares, and 2.68% for Series E MRP Shares.
To cover the interest expense on the borrowings under the SSB Agreement (including "net income" payments made with respect to borrowings offset by collateral for securities on loan) and the dividend payments associated with the MRP Shares, based on rates in effect on October 31, 2023, the Fund's portfolio would need to experience an annual return of 2.06% (before giving effect to expenses associated with senior securities).
The following table illustrates the hypothetical effect on the return to a holder of the Fund's common shares of the leverage obtained by us (and utilized on October 31, 2023). The purpose of this table is to assist you in understanding the effects of leverage. As the table shows, leverage generally increases the return to common shareholders when portfolio return is positive and greater than the cost of leverage and decreases the return when the portfolio return is negative or less than the cost of leverage. The figures appearing in the table are hypothetical and actual returns may be greater or less than those appearing in the table.
Assumed Portfolio Return (Net of Expenses) | (10.00 | )% | (5.00 | )% | 0.00 | % | 5.00 | % | 10.00 | % | |||||||||||||
Corresponding Common Share Return(1) | (20.13 | )% | (11.78 | )% | (3.43 | )% | 4.92 | % | 13.27 | % | |||||||||||||
(1) Includes interest expense on the borrowings under the SSB Agreement, accrued at interest rates in effect on October 31, 2023 of 5.84%, and dividend expense on the MRP Shares.
Market and Net Asset Value Information
Our common shares have traded both at a premium and a discount to NAV. We cannot predict whether our shares will trade in the future at a premium or discount to NAV. The provisions of the 1940 Act generally require that the public offering price of common shares (less any underwriting commissions and discounts) must equal or exceed the NAV per share of a company's common stock (calculated within 48 hours of pricing). Our issuance of common shares may have an adverse effect on prices in the secondary market for our common shares by increasing the number of common shares available, which may put downward pressure on the market price for our common shares. Shares of common stock of closed-end investment companies frequently trade at a discount from NAV.
The following table sets forth for each of the periods indicated the high and low closing market prices for our common shares on Nasdaq, the NAV per share and the premium or discount to NAV per share at which our common shares were trading. NAV is shown for the last business day of each quarter. See "Net Asset Value" for information as to the determination of our NAV.
www.calamos.com
15
Additional Information About the Funds (Unaudited)
MARKET PRICE(1) | NET ASSET VALUE AT QUARTER | PREMIUM/ (DISCOUNT) TO NET ASSET VALUE(3) | |||||||||||||||||||||
QUARTER ENDED | HIGH | LOW | END(2) | HIGH | LOW | ||||||||||||||||||
October 31, 2023 | $ | 11.64 | $ | 10.79 | $ | 9.49 | 15.01 | % | 3.65 | % | |||||||||||||
July 31, 2023 | $ | 11.56 | $ | 10.03 | $ | 11.09 | 4.51 | % | -3.00 | % | |||||||||||||
April 30, 2023 | $ | 12.77 | $ | 10.58 | $ | 10.50 | 14.88 | % | -0.28 | % | |||||||||||||
January 31, 2023 | $ | 12.38 | $ | 10.55 | $ | 11.19 | 10.73 | % | 0.38 | % | |||||||||||||
October 31, 2022 | $ | 13.38 | $ | 10.09 | $ | 10.81 | 10.88 | % | -3.54 | % | |||||||||||||
July 31, 2022 | $ | 13.26 | $ | 10.69 | $ | 11.77 | 12.66 | % | -2.32 | % | |||||||||||||
April 30, 2022 | $ | 15.21 | $ | 12.64 | $ | 12.70 | 4.37 | % | -3.38 | % | |||||||||||||
January 31, 2022 | $ | 17.08 | $ | 13.68 | $ | 14.37 | 4.05 | % | -4.07 | % | |||||||||||||
October 31, 2021 | $ | 16.61 | $ | 15.50 | $ | 16.38 | 1.37 | % | -1.90 | % | |||||||||||||
July 31, 2021 | $ | 16.45 | $ | 14.91 | $ | 15.89 | 2.17 | % | -0.47 | % | |||||||||||||
April 30, 2021 | $ | 16.10 | $ | 14.28 | $ | 16.18 | -1.95 | % | -8.87 | % | |||||||||||||
January 31, 2021 | $ | 15.01 | $ | 11.54 | $ | 15.90 | -8.75 | % | -12.91 | % | |||||||||||||
Source: Fund Accounting Records
(1) Based on high and low closing market price per share during the respective quarter and does not reflect commissions.
(2) Based on the NAV calculated on the close of business on the last business day of each calendar quarter.
(3) Premium and discount information is shown for the days when the Fund experienced its high and low closing market prices, respectively, per share during the respective quarter.
CALAMOS CLOSED-END FAMILY OF FUNDS ANNUAL REPORT
16
Additional Information About the Funds (Unaudited)
Calamos Strategic Total Return Fund
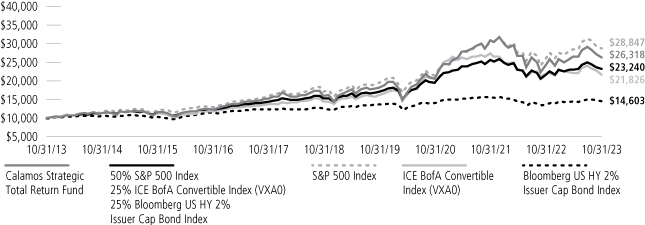
GROWTH OF $10,000: FOR THE 10-YEAR PERIOD ENDED 10/31/23
AVERAGE ANNUAL TOTAL RETURN† AS OF 10/31/23
| 1 YEAR | 5 YEARS | 10 YEARS | SINCE INCEPTION | ||||||||||||||||
Calamos Strategic Total Return Fund | |||||||||||||||||||
Market Value | 1.80 | % | 10.41 | % | 10.95 | % | 7.89 | % | |||||||||||
NAV | 7.89 | 10.47 | 10.16 | 8.39 | |||||||||||||||
50%SPX-25%VXAO-25%BBGUSHY2%Cap Index | 6.59 | 8.78 | 8.80 | 8.29 | |||||||||||||||
S&P 500 Index | 10.14 | 11.01 | 11.18 | 9.16 | |||||||||||||||
ICE BofA All US Convertibles Index (VXA0) | -0.48 | 8.73 | 8.12 | 7.42 | |||||||||||||||
Bloomberg US HY 2% Issuer Cap Bond Index | 6.23 | 3.04 | 3.86 | 6.17 | |||||||||||||||
Performance data quoted represents past performance, which is no guarantee of future results. Current performance may be lower or higher than the performance quoted. The principal value and investment return of an investment will fluctuate so that your shares, when redeemed, may be worth more or less than their original cost. Average annual total return measures net investment income and capital gain or loss from portfolio investments as an annualized average. All performance shown assumes reinvestment of dividends and capital gain distributions. Source: State Street Corporation and Morningstar Direct.
† Average annual total return measures net investment income and capital gain or loss from portfolio investments as an annualized average assuming reinvestment of dividends and capital gains distributions.
NOTES:
The 50%SPX-25%VXA0-25%BBGUSHY2%Cap Index is blended from 50% - S&P 500 Index (SPX), 25% - ICE BofA All US Convertibles Index (VXA0) and 25% - Bloomberg US HY 2% Issuer Capped Index.
The S&P 500 Index is an unmanaged index generally considered representative of the US stock market.
The ICE BofA All US Convertibles Index is comprised of approximately 700 issues of only convertible bonds and preferreds of all qualities.
The Bloomberg US Corporate High Yield 2% Issuer Capped Index measures the performance of high-yield corporate bonds with a maximum allocation of 2% to any one issuer.
Index returns assume reinvestment of dividends and do not reflect deduction of fees and expenses. It is not possible to invest directly in an index.
www.calamos.com
17
Additional Information About the Funds (Unaudited)
Calamos Strategic Total Return Fund
Senior Securities
The following table sets forth information regarding the Fund's outstanding bank loans, and mandatory redeemable preferred shares ("MRPS") as of the end of each of the Fund's last ten fiscal years, as applicable. The information in the table shown below comes from the Fund's financial statements for the fiscal year ended October 31, 2023, and each of the prior nine years then ended, all of which have been audited by Deloitte & Touche LLP, the Fund's independent registered public accounting firm.
| FISCAL YEAR ENDED | TOTAL AMOUNT OUTSTANDING | ASSET COVERAGE | LIQUIDATING PREFERENCE PER PREFERRED SHARE(c) | AVERAGE MARKET VALUE PER PREFERRED SHARE | TYPE OF SENIOR SECURITY | ||||||||||||||||||
October 31, 2023 | $ | 800,500,000 | $ | 4,090 | (a) | — | — | Loan | |||||||||||||||
October 31, 2023 | $ | 323,500,000 | 253 | (b) | 25 | 25 | (d) | MRPS | |||||||||||||||
October 31, 2022 | $ | 800,500,000 | 4,098 | (a) | — | — | Loan | ||||||||||||||||
October 31, 2022 | $ | 323,500,000 | 254 | (b) | 25 | 25 | (d) | MRPS | |||||||||||||||
October 31, 2021 | $ | 880,000,000 | 4,673 | (a) | — | — | Loan | ||||||||||||||||
October 31, 2021 | $ | 304,000,000 | 338 | (b) | 25 | 25 | (d) | MRPS | |||||||||||||||
October 31, 2020 | $ | 703,000,000 | 4,276 | (a) | — | — | Loan | ||||||||||||||||
October 31, 2020 | $ | 242,000,000 | 311 | (b) | 25 | 25 | (d) | MRPS | |||||||||||||||
October 31, 2019 | $ | 668,000,000 | 4,357 | (a) | — | — | Loan | ||||||||||||||||
October 31, 2019 | $ | 242,000,000 | 301 | (b) | 25 | 25 | (d) | MRPS | |||||||||||||||
October 31, 2018 | $ | 713,000,000 | 3,995 | (a) | — | — | Loan | ||||||||||||||||
October 31, 2018 | $ | 242,000,000 | 294 | (b) | 25 | 25 | (d) | MRPS | |||||||||||||||
October 31, 2017 | $ | 543,000,000 | 5,077 | (a) | — | — | Loan | ||||||||||||||||
October 31, 2017 | $ | 242,000,000 | 285 | (b) | 25 | 25 | (d) | MRPS | |||||||||||||||
October 31, 2016 | $ | 682,000,000 | 3,521 | (a) | — | — | Loan | ||||||||||||||||
October 31, 2015 | $ | 716,000,000 | 3,518 | (a) | — | — | Loan | ||||||||||||||||
October 31, 2014 | $ | 725,000,000 | 3,665 | (a) | — | — | Loan | ||||||||||||||||
(a) Calculated by subtracting the Fund's total liabilities (not including notes payable) from the Fund's total assets and dividing this by the amount of notes payable outstanding, and by multiplying the result by 1,000.
(b) Calculated by subtracting the Fund's total liabilities (not including MRPS) from the Fund's total assets and dividing this by the number of MRPS outstanding, and by multiplying the result by 25.
(c) "Liquidating Preference per Preferred Share" means the amount to which a holder of preferred shares would be entitled upon the liquidation of the Fund in preference to common shareholders, expressed as a dollar amount per preferred share.
(d) The MRPS are not listed on any exchange or automated quotation system. The MRPS are considered debt of the issuer; and the liquidation preference approximates fair value.
Summary of Fund Expenses
The following table and example contain information about the costs and expenses that common shareholders will bear directly or indirectly. In accordance with Commission requirements, the table below shows our expenses, including interest payments on borrowed funds, and preferred stock dividend payments, as a percentage of our average net assets as of October 31, 2023, and not as a percentage of gross assets or managed assets.
By showing expenses as a percentage of average net assets, expenses are not expressed as a percentage of all of the assets we invest. The table and example are based on our capital structure as of October 31, 2023. As of October 31, 2023, the Fund had utilized $801 million of the $1.13 billion available under the SSB Agreement ($735 million in advances outstanding and $66 million in structural leverage consisting of collateral received from counterparties via SSB in connection with securities on loan), representing 24.5% of the Fund's managed assets as of that date, and had $323.5 million in MRPS outstanding, representing 9.9% of the Fund's managed assets. Combined, the borrowings under the SSB Agreement and the outstanding MRPS represented 34.3% of the Fund's managed assets.
CALAMOS CLOSED-END FAMILY OF FUNDS ANNUAL REPORT
18
Additional Information About the Funds (Unaudited)
SHAREHOLDER TRANSACTION EXPENSES | |||||||
Sales Load (as a percentage of offering price) | — | (1) | |||||
Offering Expenses Borne by the Fund (as a percentage of offering price) | — | (1) | |||||
Dividend Reinvestment Plan Fees (per sales transaction fee)(2) | $ | 15.00 | |||||
| ANNUAL EXPENSES | PERCENTAGE OF AVERAGE NET ASSETS ATTRIBUTABLE TO COMMON SHAREHOLDERS | ||||||
Management Fee(3) | 1.50 | % | |||||
Interest Payments on Borrowed Funds(4) | 1.97 | % | |||||
Preferred Stock Dividend Payments(5) | 0.55 | % | |||||
Other Expenses(6) | 0.07 | % | |||||
Total Annual Expenses | 4.09 | % | |||||
The following example illustrates the expenses that common shareholders would pay on a $1,000 investment in common shares, assuming (1) total annual expenses of 4.09% of net assets attributable to common shareholders; (2) a 5% annual return; and (3) all distributions are reinvested at net asset value:
1 YEAR | 3 YEARS | 5 YEARS | 10 YEARS | ||||||||||||||||
Total Expenses Paid by Common Shareholders(7) | $ | 41 | $ | 124 | $ | 209 | $ | 428 | |||||||||||
The example should not be considered a representation of future expenses. Actual expenses may be greater or less than those assumed. Moreover, our actual rate of return may be greater or less than the hypothetical 5% return shown in the example.
(1) If the securities to which this prospectus relates are sold to or through underwriters, the prospectus supplement will set forth any applicable sales load and the estimated offering expenses borne by us.
(2) Shareholders will pay a $15.00 transaction fee plus a $0.02 per share brokerage charge if they direct the Plan Agent (as defined below) to sell common shares held in a Plan account. In addition, each participant will pay a pro rata share of brokerage commissions incurred with respect to the Plan Agent's open-market purchases in connection with the reinvestment of dividends or distributions. If a participant elects to have the Plan Agent sell part or all of his or her common shares and remit the proceeds, such participant will be charged his or her pro rata share of brokerage commissions on the shares sold. See "Dividends and Distributions on Common Shares; Automatic Dividend Reinvestment Plan".
(3) The Fund pays Calamos an annual management fee, payable monthly in arrears, for its investment management services in an amount equal to 1.00% of the Fund's average weekly managed assets. In accordance with the requirements of the Commission, the table above shows the Fund's management fee as a percentage of average net assets attributable to common shareholders. By showing the management fee as a percentage of net assets, the management fee is not expressed as a percentage of all of the assets the Fund intends to invest. For purposes of the table, the management fee has been converted to 1.50% of the Fund's average weekly net assets as of October 31, 2023 by dividing the total dollar amount of the management fee by the Fund's average weekly net assets (managed assets less outstanding leverage).
(4) Reflects interest expense paid on $65 million in average borrowings under the SSB Agreement, plus $736 million in additional average structural leverage related to certain securities lending programs, as described under "Leverage".
(5) Reflects estimated dividend expense on $323.5 million aggregate liquidation preference of mandatory redeemable preferred shares outstanding. See "Leverage".
(6) "Other Expenses" are based on estimated amounts for the Fund's current fiscal year.
(7) The example does not include sales load or estimated offering costs, which would cause the expenses shown in the example to increase. In connection with an offering of common shares, the applicable prospectus supplement will set forth an example including sales load and estimated offering costs.
Effects of Leverage
The SSB Agreement provides for credit availability for the Fund, such that it may borrow up to $1.13 billion. As of October 31, 2023, the Fund had utilized $801 million of the $1.13 billion available under the SSB Agreement ($735 million of advances outstanding, and $66 million in structural leverage consisting of collateral received from counterparties via State Street Bank and Trust Company in
www.calamos.com
19
Additional Information About the Funds (Unaudited)
connection with securities on loan), representing 24.5% of the Fund's managed assets as of that date, and had $323.5 million of MRP Shares outstanding, representing 24.5% of the Fund's managed assets. Combined, the borrowings under the SSB Agreement and the outstanding MRP Shares represented 34.3% of the Fund's managed assets. Interest on the SSB Agreement was charged on the drawn amount at the rate of the Overnight Bank Financing Rate ("OBFR") plus 0.80%, payable monthly in arrears, from November 1, 2022, through June 30, 2023. The rate from July 1, 2023, through October 31, 2023, was OBFR plus 0.52%. Interest on overdue amounts or interest on the drawn amount paid during an event of default was charged OBFR plus 2.80% from November 1, 2022, through June 30, 2023. The rate from July 1, 2023, through October 31, 2023, was charged at OBFR plus 2.52%. These rates represent floating rates of interest that may change over time. The SSB Agreement has a commitment fee of 0.10% of any undrawn amount.
As of October 31, 2023, the interest rate charged under the SSB Agreement was 5.84%.
The Fund's MRP Shareholders are entitled to receive monthly cash dividends, at a currently effective dividend rate per annum for each series of MRP Shares as follows (subject to adjustment as described in the Fund's prospectus): 4.00% for Series B MRP Shares, 4.24% for Series C MRP Shares, 2.45% for Series D MRP Shares and 3.66% for Series F MRP Shares. To cover the interest expense on the borrowings under the SSB Agreement (including "net income" payments made with respect to borrowings offset by collateral for securities on loan) and the dividend payments associated with the MRP Shares, based on rates in effect on October 31, 2023, the Fund's portfolio would need to experience an annual return of 1.79% (before giving effect to expenses associated with senior securities).
The following table illustrates the hypothetical effect on the return to a holder of the Fund's common shares of the leverage obtained by us (and utilized on October 31, 2023). The purpose of this table is to assist you in understanding the effects of leverage. As the table shows, leverage generally increases the return to common shareholders when portfolio return is positive and greater than the cost of leverage and decreases the return when the portfolio return is negative or less than the cost of leverage. The figures appearing in the table are hypothetical and actual returns may be greater or less than those appearing in the table.
Assumed Portfolio Return (Net of Expenses) | (10.00 | )% | (5.00 | )% | 0.00 | % | 5.00 | % | 10.00 | % | |||||||||||||
Corresponding Common Share Return(1) | (17.93 | )% | (10.33 | )% | (2.73 | )% | 4.87 | % | 12.47 | % | |||||||||||||
(1) Includes interest expense on the borrowings under the SSB Agreement, accrued at interest rates in effect on October 31, 2023 of 5.84%, and dividend expense on the MRP Shares.
Market and Net Asset Value Information
Our common shares have traded both at a premium and a discount to NAV. We cannot predict whether our shares will trade in the future at a premium or discount to NAV. The provisions of the 1940 Act generally require that the public offering price of common shares (less any underwriting commissions and discounts) must equal or exceed the NAV per share of a company's common stock (calculated within 48 hours of pricing). Our issuance of common shares may have an adverse effect on prices in the secondary market for our common shares by increasing the number of common shares available, which may put downward pressure on the market price for our common shares. Shares of common stock of closed-end investment companies frequently trade at a discount from NAV.
The following table sets forth for each of the periods indicated the high and low closing market prices for our common shares on Nasdaq, the NAV per share and the premium or discount to NAV per share at which our common shares were trading. NAV is shown for the last business day of each quarter. See "Net Asset Value" for information as to the determination of our NAV.
CALAMOS CLOSED-END FAMILY OF FUNDS ANNUAL REPORT
20
Additional Information About the Funds (Unaudited)
MARKET PRICE(1) | NET ASSET VALUE AT QUARTER | PREMIUM/ (DISCOUNT) TO NET ASSET VALUE(3) | |||||||||||||||||||||
QUARTER ENDED | HIGH | LOW | END(2) | HIGH | LOW | ||||||||||||||||||
October 31, 2023 | $ | 15.28 | $ | 12.54 | $ | 13.41 | 2.99 | % | -4.80 | % | |||||||||||||
July 31, 2023 | $ | 15.28 | $ | 13.29 | $ | 15.23 | 0.86 | % | -3.56 | % | |||||||||||||
April 30, 2023 | $ | 14.91 | $ | 13.15 | $ | 14.10 | 3.77 | % | -2.41 | % | |||||||||||||
January 31 ,2023 | $ | 14.62 | $ | 12.94 | $ | 14.14 | 2.58 | % | -1.14 | % | |||||||||||||
October 31, 2022 | $ | 15.94 | $ | 12.20 | $ | 13.57 | 3.86 | % | -2.92 | % | |||||||||||||
July 31, 2022 | $ | 15.90 | $ | 12.60 | $ | 14.98 | 2.40 | % | -5.75 | % | |||||||||||||
April 30, 2022 | $ | 18.33 | $ | 15.33 | $ | 15.54 | 1.38 | % | -2.72 | % | |||||||||||||
January 31, 2022 | $ | 19.58 | $ | 16.66 | $ | 17.70 | 3.21 | % | -2.96 | % | |||||||||||||
October 31, 2021 | $ | 18.98 | $ | 17.51 | $ | 18.62 | 1.93 | % | 0.52 | % | |||||||||||||
July 31, 2021 | $ | 18.41 | $ | 16.55 | $ | 17.99 | 1.77 | % | -1.55 | % | |||||||||||||
April 30, 2021 | $ | 18.36 | $ | 15.91 | $ | 17.43 | 5.58 | % | 0.13 | % | |||||||||||||
January 31, 2021 | $ | 16.04 | $ | 12.84 | $ | 12.84 | -1.72 | % | 4.46 | % | |||||||||||||
Source: Fund Accounting Records
(1) Based on high and low closing market price per share during the respective quarter and does not reflect commissions.
(2) Based on the NAV calculated on the close of business on the last business day of each calendar quarter.
(3) Premium and discount information is shown for the days when the Fund experienced its high and low closing market prices, respectively, per share during the respective quarter.
www.calamos.com
21
Additional Information About the Funds (Unaudited)
Calamos Dynamic Convertible and Income Fund
GROWTH OF $10,000: SINCE INCEPTION (03/31/15) THROUGH 10/31/23
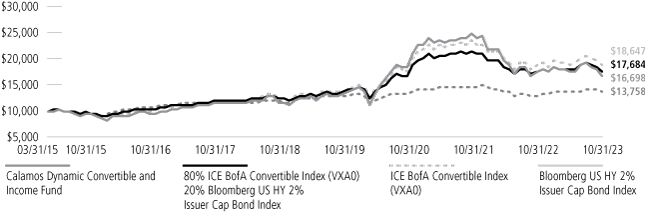
AVERAGE ANNUAL TOTAL RETURN† AS OF 10/31/23
| 1 YEAR |
5 YEARS |
SINCE INCEPTION |
|||||||||||||
|
Calamos Dynamic Convertible and Income Fund |
|||||||||||||||
|
Market Value |
-12.56 |
% |
7.99 |
% |
5.45 |
% |
|||||||||
|
NAV |
-4.26 |
7.52 |
6.14 |
||||||||||||
|
80%VXAO-20%BBGUSHY2%Cap Index |
0.87 |
7.70 |
6.93 |
||||||||||||
|
ICE BofA All US Convertibles Index (VXA0) |
-0.48 |
8.73 |
7.60 |
||||||||||||
|
Bloomberg US HY 2% Issuer Cap Bond Index |
6.23 |
3.04 |
3.81 |
||||||||||||
Performance data quoted represents past performance, which is no guarantee of future results. Current performance may be lower or higher than the performance quoted. The principal value and investment return of an investment will fluctuate so that your shares, when redeemed, may be worth more or less than their original cost. Average annual total return measures net investment income and capital gain or loss from portfolio investments as an annualized average. All performance shown assumes reinvestment of dividends and capital gain distributions. Source: State Street Corporation and Morningstar Direct.
† Average annual total return measures net investment income and capital gain or loss from portfolio investments as an annualized average assuming reinvestment of dividends and capital gains distributions.
NOTES:
The graphs do not reflect the income taxes that you would pay on fund distributions or the redemption of fund shares. Fund performance includes reinvestment of dividends.
The 80%VXAO-20%BBGUSHY2%Cap Index is blended from 80% - ICE BofA Convertibles Index (VXA0) and 20% - Bloomberg US HY 2% Issuer Capped Index.
The ICE BofA All US Convertibles Index is comprised of approximately 700 issues of only convertible bonds and preferreds of all qualities. Since inception data for the index is shown from 6/30/97, since data is only available for full monthly periods.
The Bloomberg US Corporate High Yield 2% Issuer Capped Index measures the performance of high-yield corporate bonds with a maximum allocation of 2% to any one issuer.
Index returns assume reinvestment of dividends and do not reflect deduction of fees and expenses. It is not possible to invest directly in an index.
CALAMOS CLOSED-END FAMILY OF FUNDS ANNUAL REPORT
22
Additional Information About the Funds (Unaudited)
Calamos Dynamic Convertible and Income Fund
Senior Securities
The following table sets forth information regarding the Fund's outstanding bank loans, and mandatory redeemable preferred shares ("MRPS") as of the end of each of the Fund's last ten fiscal years, as applicable. The information in the table shown below comes from the Fund's financial statements for the fiscal year ended October 31, 2023, and each of the prior eight years then ended, all of which have been audited by Deloitte & Touche LLP, the Fund's independent registered public accounting firm.
| FISCAL YEAR ENDED | TOTAL AMOUNT OUTSTANDING |
ASSET COVERAGE |
LIQUIDATING PREFERENCE PER PREFERRED SHARE(c) |
AVERAGE MARKET VALUE PER PREFERRED SHARE |
TYPE OF SENIOR SECURITY |
||||||||||||||||||
|
October 31, 2023 |
$ |
210,000,000 |
$ |
3,626 |
(a) |
— |
— |
Loan |
|||||||||||||||
|
October 31, 2023 |
$ |
92,000,000 |
207 |
(b) |
25 |
25 |
(d) |
MRPS |
|||||||||||||||
|
October 31, 2022 |
$ |
230,000,000 |
3,690 |
(a) |
— |
— |
Loan |
||||||||||||||||
|
October 31, 2022 |
$ |
92,000,000 |
231 |
(b) |
25 |
25 |
(d) |
MRPS |
|||||||||||||||
|
October 31, 2021 |
$ |
270,000,000 |
4,261 |
(a) |
— |
— |
Loan |
||||||||||||||||
|
October 31, 2021 |
$ |
92,000,000 |
313 |
(b) |
25 |
25 |
(d) |
MRPS |
|||||||||||||||
|
October 31, 2020 |
$ |
204,600,000 |
4,304 |
(a) |
— |
— |
Loan |
||||||||||||||||
|
October 31, 2020 |
$ |
64,000,000 |
344 |
(b) |
25 |
25 |
(d) |
MRPS |
|||||||||||||||
|
October 31, 2019 |
$ |
180,600,000 |
4,055 |
(a) |
— |
— |
Loan |
||||||||||||||||
|
October 31, 2019 |
$ |
64,000,000 |
286 |
(b) |
25 |
25 |
(d) |
MRPS |
|||||||||||||||
|
October 31, 2018 |
$ |
187,500,000 |
3,887 |
(a) |
— |
— |
Loan |
||||||||||||||||
|
October 31, 2018 |
$ |
64,000,000 |
285 |
(b) |
25 |
25 |
(d) |
MRPS |
|||||||||||||||
|
October 31, 2017 |
$ |
169,000,000 |
4,413 |
(a) |
— |
— |
Loan |
||||||||||||||||
|
October 31, 2017 |
$ |
64,000,000 |
291 |
(b) |
25 |
25 |
(d) |
MRPS |
|||||||||||||||
|
October 31, 2016 |
$ |
195,000,000 |
3,447 |
(a) |
— |
— |
Loan |
||||||||||||||||
|
October 31, 2015 |
$ |
220,000,000 |
3,398 |
(a) |
— |
— |
Loan |
||||||||||||||||
(a) Calculated by subtracting the Fund's total liabilities (not including notes payable) from the Fund's total assets and dividing this by the amount of notes payable outstanding, and by multiplying the result by 1,000.
(b) Calculated by subtracting the Fund's total liabilities (not including MRPS) from the Fund's total assets and dividing this by the number of MRPS outstanding, and by multiplying the result by 25.
(c) "Liquidating Preference per Preferred Share" means the amount to which a holder of preferred shares would be entitled upon the liquidation of the Fund in preference to common shareholders, expressed as a dollar amount per preferred share.
(d) The MRPS are not listed on any exchange or automated quotation system. The MRPS are considered debt of the issuer; and the liquidation preference approximates fair value.
Summary of Fund Expenses
The following table and example contain information about the costs and expenses that common shareholders will bear directly or indirectly. In accordance with Commission requirements, the table below shows our expenses, including interest payments on borrowed funds, and preferred stock dividend payments, as a percentage of our average net assets as of October 31, 2023, and not as a percentage of gross assets or managed assets.
By showing expenses as a percentage of average net assets, expenses are not expressed as a percentage of all of the assets we invest. The table and example are based on our capital structure as of October 31, 2023. As of October 31, 2023, the Fund had utilized $210 million of the $370 million available under the SSB Agreement ($195 million in advances outstanding and $15 million in structural leverage consisting of collateral received from counterparties via SSB in connection with securities on loan), representing 27.6% of the Fund's managed assets as of that date, and had $92 million in MRPS outstanding, representing 12.1% of the Fund's managed assets. Combined, the borrowings under the SSB Agreement and the outstanding MRPS represented 39.7% of the Fund's managed assets.
www.calamos.com
23
Additional Information About the Funds (Unaudited)
|
SHAREHOLDER TRANSACTION EXPENSES |
|||||||
|
Sales Load (as a percentage of offering price) |
— |
(1) |
|||||
|
Offering Expenses Borne by the Fund (as a percentage of offering price) |
— |
(1) |
|||||
|
Dividend Reinvestment Plan Fees (per sales transaction fee)(2) |
$ |
15.00 |
|||||
| ANNUAL EXPENSES | PERCENTAGE OF AVERAGE NET ASSETS ATTRIBUTABLE TO COMMON SHAREHOLDERS |
||||||
|
Management Fee(3) |
1.59 |
% |
|||||
|
Interest Payments on Borrowed Funds(4) |
2.31 |
% |
|||||
|
Preferred Stock Dividend Payments(5) |
0.61 |
% |
|||||
|
Other Expenses(6) |
0.11 |
% |
|||||
|
Total Annual Expenses |
4.62 |
% |
|||||
The following example illustrates the expenses that common shareholders would pay on a $1,000 investment in common shares, assuming (1) total annual expenses of 4.62% of net assets attributable to common shareholders; (2) a 5% annual return; and (3) all distributions are reinvested at net asset value:
|
1 YEAR |
3 YEARS |
5 YEARS |
10 YEARS |
||||||||||||||||
|
Total Expenses Paid by Common Shareholders(7) |
$ |
46 |
$ |
139 |
$ |
233 |
$ |
471 |
|||||||||||
The example should not be considered a representation of future expenses. Actual expenses may be greater or less than those assumed. Moreover, our actual rate of return may be greater or less than the hypothetical 5% return shown in the example.
(1) If the securities to which this prospectus relates are sold to or through underwriters, the prospectus supplement will set forth any applicable sales load and the estimated offering expenses borne by us.
(2) Shareholders will pay a $15.00 transaction fee plus a $0.02 per share brokerage charge if they direct the Plan Agent (as defined below) to sell common shares held in a Plan account. In addition, each participant will pay a pro rata share of brokerage commissions incurred with respect to the Plan Agent's open-market purchases in connection with the reinvestment of dividends or distributions. If a participant elects to have the Plan Agent sell part or all of his or her common shares and remit the proceeds, such participant will be charged his or her pro rata share of brokerage commissions on the shares sold. See "Dividends and Distributions on Common Shares; Automatic Dividend Reinvestment Plan".
(3) The Fund pays Calamos an annual management fee, payable monthly in arrears, for its investment management services in an amount equal to 1.00% of the Fund's average weekly managed assets. In accordance with the requirements of the Commission, the table above shows the Fund's management fee as a percentage of average net assets attributable to common shareholders. By showing the management fee as a percentage of net assets, the management fee is not expressed as a percentage of all of the assets the Fund intends to invest. For purposes of the table, the management fee has been converted to 1.59% of the Fund's average weekly net assets as of October 31, 2023 by dividing the total dollar amount of the management fee by the Fund's average weekly net assets (managed assets less outstanding leverage).
(4) Reflects interest expense paid on $166 million in average borrowings under the SSB Agreement, plus $52 million in additional average structural leverage related to certain securities lending programs, as described under "Leverage".
(5) Reflects estimated dividend expense on $92 million aggregate liquidation preference of mandatory redeemable preferred shares outstanding. See "Leverage".
(6) "Other Expenses" are based on estimated amounts for the Fund's current fiscal year.
(7) The example does not include sales load or estimated offering costs, which would cause the expenses shown in the example to increase. In connection with an offering of common shares, the applicable prospectus supplement will set forth an example including sales load and estimated offering costs.
Effects of Leverage
The SSB Agreement provides for credit availability for the Fund, such that it may borrow up to $370 million. As of October 31, 2023, the Fund had utilized $210 million of the $370 million available under the SSB Agreement ($195 million of advances outstanding, and $15 million in structural leverage consisting of collateral received from counterparties via State Street Bank and Trust Company in connection with securities on loan), representing 27.6% of the Fund's managed assets as of that date,
CALAMOS CLOSED-END FAMILY OF FUNDS ANNUAL REPORT
24
Additional Information About the Funds (Unaudited)
and had $92 million of MRP Shares outstanding, representing 12.1% of the Fund's managed assets. Combined, the borrowings under the SSB Agreement and the outstanding MRP Shares represented 39.7% of the Fund's managed assets. Interest on the SSB Agreement was charged on the drawn amount at the rate of the Overnight Bank Financing Rate ("OBFR") plus 0.80%, payable monthly in arrears, from November 1, 2022, through June 30, 2023. The rate from July 1, 2023, through October 31, 2023, was OBFR plus 0.52%. Interest on overdue amounts or interest on the drawn amount paid during an event of default was charged OBFR plus 2.80% from November 1, 2022, through June 30, 2023. The rate from July 1, 2023, through October 31, 2023, was charged at OBFR plus 2.52%. These rates represent floating rates of interest that may change over time. The SSB Agreement has a commitment fee of 0.10% of any undrawn amount.
As of October 31, 2023, the interest rate charged under the SSB Agreement was 5.84%.
The Fund's MRP Shareholders are entitled to receive monthly cash dividends, at a currently effective dividend rate per annum for each series of MRP Shares as follows (subject to adjustment as described in the Fund's prospectus): 4.00% for Series B MRP Shares, 4.24% for Series C MRP Shares, 2.45% for Series D MRP Shares, and 2.68% for Series E MRP Shares.
To cover the interest expense on the borrowings under the SSB Agreement (including "net income" payments made with respect to borrowings offset by collateral for securities on loan) and the dividend payments associated with the MRP Shares, based on rates in effect on October 31, 2023, the Fund's portfolio would need to experience an annual return of 2.03% (before giving effect to expenses associated with senior securities).
The following table illustrates the hypothetical effect on the return to a holder of the Fund's common shares of the leverage obtained by us (and utilized on October 31, 2023). The purpose of this table is to assist you in understanding the effects of leverage. As the table shows, leverage generally increases the return to common shareholders when portfolio return is positive and greater than the cost of leverage and decreases the return when the portfolio return is negative or less than the cost of leverage. The figures appearing in the table are hypothetical and actual returns may be greater or less than those appearing in the table.
|
Assumed Portfolio Return (Net of Expenses) |
(10.00 |
)% |
(5.00 |
)% |
0.00 |
% |
5.00 |
% |
10.00 |
% |
|||||||||||||
|
Corresponding Common Share Return(1) |
(19.97 |
)% |
(11.67 |
)% |
(3.37 |
)% |
4.93 |
% |
13.23 |
% |
|||||||||||||
(1) Includes interest expense on the borrowings under the SSB Agreement, accrued at interest rates in effect on October 31, 2023 of 5.84%, and dividend expense on the MRP Shares.
Market and Net Asset Value Information
Our common shares have traded both at a premium and a discount to NAV. We cannot predict whether our shares will trade in the future at a premium or discount to NAV. The provisions of the 1940 Act generally require that the public offering price of common shares (less any underwriting commissions and discounts) must equal or exceed the NAV per share of a company's common stock (calculated within 48 hours of pricing). Our issuance of common shares may have an adverse effect on prices in the secondary market for our common shares by increasing the number of common shares available, which may put downward pressure on the market price for our common shares. Shares of common stock of closed-end investment companies frequently trade at a discount from NAV.
The following table sets forth for each of the periods indicated the high and low closing market prices for our common shares on Nasdaq, the NAV per share and the premium or discount to NAV per share at which our common shares were trading. NAV is shown for the last business day of each quarter. See "Net Asset Value" for information as to the determination of our NAV.
www.calamos.com
25
Additional Information About the Funds (Unaudited)
|
MARKET PRICE(1) |
NET ASSET VALUE AT QUARTER |
PREMIUM/ (DISCOUNT) TO NET ASSET VALUE(3) |
|||||||||||||||||||||
|
QUARTER ENDED |
HIGH |
LOW |
END(2) |
HIGH |
LOW |
||||||||||||||||||
|
October 31, 2023 |
$ |
21.20 |
$ |
17.06 |
$ |
17.24 |
5.20 |
% |
-0.99 |
% |
|||||||||||||
|
July 31, 2023 |
$ |
24.12 |
$ |
20.88 |
$ |
20.65 |
22.57 |
% |
2.19 |
% |
|||||||||||||
|
April 30, 2023 |
$ |
23.79 |
$ |
20.35 |
$ |
19.27 |
15.24 |
% |
5.88 |
% |
|||||||||||||
|
January 31, 2023 |
$ |
23.37 |
$ |
20.20 |
$ |
20.77 |
12.95 |
% |
3.64 |
% |
|||||||||||||
|
October 31, 2022 |
$ |
24.90 |
$ |
20.00 |
$ |
20.19 |
9.21 |
% |
1.35 |
% |
|||||||||||||
|
July 31, 2022 |
$ |
25.30 |
$ |
20.08 |
$ |
22.08 |
11.14 |
% |
-1.03 |
% |
|||||||||||||
|
April 30, 2022 |
$ |
28.18 |
$ |
23.32 |
$ |
23.97 |
4.51 |
% |
-5.26 |
% |
|||||||||||||
|
January 31, 2022 |
$ |
33.42 |
$ |
25.78 |
$ |
27.28 |
4.47 |
% |
-4.34 |
% |
|||||||||||||
|
October 31, 2021 |
$ |
32.62 |
$ |
29.97 |
$ |
31.73 |
2.80 |
% |
0.94 |
% |
|||||||||||||
|
July 31, 2021 |
$ |
33.05 |
$ |
29.03 |
$ |
30.52 |
9.15 |
% |
-0.85 |
% |
|||||||||||||
|
April 30, 2021 |
$ |
33.76 |
$ |
29.30 |
$ |
31.36 |
4.26 |
% |
-6.45 |
% |
|||||||||||||
|
January 31, 2021 |
$ |
29.98 |
$ |
22.39 |
$ |
30.79 |
-6.52 |
% |
-10.62 |
% |
|||||||||||||
Source: Fund Accounting Records
(1) Based on high and low closing market price per share during the respective quarter and does not reflect commissions.
(2) Based on the NAV calculated on the close of business on the last business day of each calendar quarter.
(3) Premium and discount information is shown for the days when the Fund experienced its high and low closing market prices, respectively, per share during the respective quarter.
CALAMOS CLOSED-END FAMILY OF FUNDS ANNUAL REPORT
26
Additional Information About the Funds (Unaudited)
Calamos Global Dynamic Income Fund
GROWTH OF $10,000: FOR THE 10-YEAR PERIOD ENDED 10/31/23
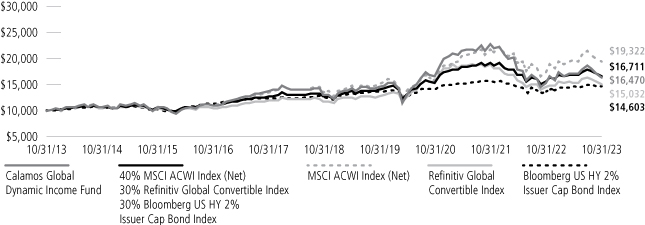
AVERAGE ANNUAL TOTAL RETURN† AS OF 10/31/23
| 1 YEAR |
5 YEARS |
10 YEARS |
SINCE INCEPTION |
||||||||||||||||
|
Calamos Global Dynamic Income Fund |
|||||||||||||||||||
|
Market Value |
2.40 |
% |
2.85 |
% |
4.99 |
% |
3.56 |
% |
|||||||||||
|
NAV |
8.29 |
4.66 |
5.12 |
4.73 |
|||||||||||||||
|
40%ACWI(NR)-30%RefinitivGlblCv-30%BBGUSHY2%Cap Index |
7.43 |
5.63 |
5.27 |
5.31 |
|||||||||||||||
|
MSCI ACWI Index (Net) |
10.50 |
7.47 |
6.81 |
5.01 |
|||||||||||||||
|
Refinitiv Global Convertible index |
4.33 |
5.12 |
4.16 |
4.44 |
|||||||||||||||
|
Bloomberg US HY 2% Issuer Cap Bond Index |
6.23 |
3.04 |
3.86 |
5.84 |
|||||||||||||||
Performance data quoted represents past performance, which is no guarantee of future results. Current performance may be lower or higher than the performance quoted. The principal value and investment return of an investment will fluctuate so that your shares, when redeemed, may be worth more or less than their original cost. Average annual total return measures net investment income and capital gain or loss from portfolio investments as an annualized average. All performance shown assumes reinvestment of dividends and capital gain distributions. Source: State Street Corporation and Morningstar Direct.
† Average annual total return measures net investment income and capital gain or loss from portfolio investments as an annualized average assuming reinvestment of dividends and capital gains distributions.
NOTES:
The 40%ACWI(NR)-30%RefinitivGlblCv-30%BBGHY2%Cap Index is blended from 40% - MSCI ACWI Index (Net), 30% - Refinitiv Global Convertible Bond Index and 30% - Bloomberg US Corporate High Yield 2% Issuer Capped Index.
The MSCI ACWI Index (Net) is a free float-adjusted market-capitalization-weighted index that is designed to measure the equity market performance of developed markets and emerging markets. The index is calculated in both US dollars and local currencies. Net return basis approximates the minimum possible reinvestment of regular cash distributions by deducting withholding tax based on the maximum rate of the company's country of incorporation applicable to institutional investors.
The Refinitiv Global Convertible Bond Index (USD) is designed to represent the global convertible market.
The Bloomberg US Corporate High Yield 2% Issuer Capped Index measures the performance of high-yield corporate bonds with a maximum allocation of 2% to any one issuer.
Index returns assume reinvestment of dividends and do not reflect deduction of fees and expenses. It is not possible to invest directly in an index.
www.calamos.com
27
Additional Information About the Funds (Unaudited)
Calamos Global Dynamic Income Fund
Senior Securities
| FISCAL YEAR ENDED | TOTAL AMOUNT OUTSTANDING |
ASSET COVERAGE |
LIQUIDATING PREFERENCE PER PREFERRED SHARE(c) |
AVERAGE MARKET VALUE PER PREFERRED SHARE |
TYPE OF SENIOR SECURITY |
||||||||||||||||||
|
October 31, 2023 |
$ |
|
$ |
|
(a) |
— |
— |
Loan |
|||||||||||||||
|
October 31, 2023 |
$ |
|
|
(b) |
|
|
(d) |
MRPS |
|||||||||||||||
|
October 31, 2022 |
$ |
|
|
(a) |
— |
— |
Loan |
||||||||||||||||
|
October 31, 2022 |
$ |
|
|
(b) |
|
|
(d) |
MRPS |
|||||||||||||||
|
October 31, 2021 |
$ |
|
|
(a) |
— |
— |
Loan |
||||||||||||||||
|
October 31, 2021 |
$ |
|
|
(b) |
|
|
(d) |
MRPS |
|||||||||||||||
|
October 31, 2020 |
$ |
|
|
(a) |
— |
— |
Loan |
||||||||||||||||
|
October 31, 2020 |
$ |
|
|
(b) |
|
|
(d) |
MRPS |
|||||||||||||||
|
October 31, 2019 |
$ |
|
|
(a) |
— |
— |
Loan |
||||||||||||||||
|
October 31, 2019 |
$ |
|
|
(b) |
|
|
(d) |
MRPS |
|||||||||||||||
|
October 31, 2018 |
$ |
|
|
(a) |
— |
— |
Loan |
||||||||||||||||
|
October 31, 2018 |
$ |
|
|
(b) |
|
|
(d) |
MRPS |
|||||||||||||||
|
October 31, 2017 |
$ |
|
|
(a) |
— |
— |
Loan |
||||||||||||||||
|
October 31, 2017 |
$ |
|
|
(b) |
|
|
(d) |
MRPS |
|||||||||||||||
|
October 31, 2016 |
$ |
|
|
(a) |
— |
— |
Loan |
||||||||||||||||
|
October 31, 2015 |
$ |
|
|
(a) |
— |
— |
Loan |
||||||||||||||||
|
October 31, 2014 |
$ |
|
|
(a) |
— |
— |
Loan |
||||||||||||||||
(a) Calculated by subtracting the Fund's total liabilities (not including notes payable) from the Fund's total assets and dividing this by the amount of notes payable outstanding, and by multiplying the result by 1,000.
(b) Calculated by subtracting the Fund's total liabilities (not including MRPS) from the Fund's total assets and dividing this by the number of MRPS outstanding, and by multiplying the result by 25.
(c) "Liquidating Preference per Preferred Share" means the amount to which a holder of preferred shares would be entitled upon the liquidation of the Fund in preference to common shareholders, expressed as a dollar amount per preferred share.
(d)
Summary of Fund Expenses
The following table and example contain information about the costs and expenses that common shareholders will bear directly or indirectly. In accordance with Commission requirements, the table below shows our expenses, including interest payments on borrowed funds, and preferred stock dividend payments, as a percentage of our average net assets as of October 31, 2023, and not as a percentage of gross assets or managed assets.
By showing expenses as a percentage of average net assets, expenses are not expressed as a percentage of all of the assets we invest. The table and example are based on our capital structure as of October 31, 2023. As of October 31, 2023, the Fund had utilized $131 million of the $265 million available under the SSB Agreement ($116 million in advances outstanding, and $15 million in structural leverage consisting of collateral received from counterparties via SSB in connection with securities on loan), representing 22.4% of the Fund's managed assets as of that date, and had $70 million in MRPS
CALAMOS CLOSED-END FAMILY OF FUNDS ANNUAL REPORT
28
Additional Information About the Funds (Unaudited)
outstanding, representing 12.0% of the Fund's managed assets. Combined, the borrowings under the SSB Agreement and the outstanding MRPS represented 34.4% of the Fund's managed assets.
|
SHAREHOLDER TRANSACTION EXPENSES |
|||||||
|
Sales Load (as a percentage of offering price) |
|
(1) |
|||||
|
Offering Expenses Borne by the Fund (as a percentage of offering price) |
|
(1) |
|||||
|
Dividend Reinvestment Plan Fees (per sales transaction fee)(2) |
$ |
|
|||||
| ANNUAL EXPENSES | PERCENTAGE OF AVERAGE NET ASSETS ATTRIBUTABLE TO COMMON SHAREHOLDERS |
||||||
|
Management Fee(3) |
|
% |
|||||
|
Interest Payments on Borrowed Funds(4) |
|
% |
|||||
|
Preferred Stock Dividend Payments(5) |
|
% |
|||||
|
Other Expense(6) |
|
% |
|||||
|
Total Annual Expenses |
|
% |
|||||
The following example illustrates the expenses that common shareholders would pay on a $1,000 investment in common shares, assuming (1) total annual expenses of 3.68% of net assets attributable to common shareholders; (2) a 5% annual return; and (3) all distributions are reinvested at net asset value:
|
1 YEAR |
3 YEARS |
5 YEARS |
10 YEARS |
||||||||||||||||||
|
Total Expenses Paid by Common Shareholders(7) |
$ |
|
|
$ |
|
$ |
|
$ |
|
||||||||||||
The example should not be considered a representation of future expenses. Actual expenses may be greater or less than those assumed. Moreover, our actual rate of return may be greater or less than the hypothetical 5% return shown in the example.
(1) If the securities to which this prospectus relates are sold to or through underwriters, the prospectus supplement will set forth any applicable sales load and the estimated offering expenses borne by us.
(2) Shareholders will pay a $15.00 transaction fee plus a $0.02 per share brokerage charge if they direct the Plan Agent (as defined below) to sell common shares held in a Plan account. In addition, each participant will pay a pro rata share of brokerage commissions incurred with respect to the Plan Agent's open-market purchases in connection with the reinvestment of dividends or distributions. If a participant elects to have the Plan Agent sell part or all of his or her common shares and remit the proceeds, such participant will be charged his or her pro rata share of brokerage commissions on the shares sold. See "Dividends and Distributions on Common Shares; Automatic Dividend Reinvestment Plan".
(3) The Fund pays Calamos an annual management fee, payable monthly in arrears, for its investment management services in an amount equal to 1.00% of the Fund's average weekly managed assets. In accordance with the requirements of the Commission, the table above shows the Fund's management fee as a percentage of average net assets attributable to common shareholders. By showing the management fee as a percentage of net assets, the management fee is not expressed as a percentage of all of the assets the Fund intends to invest. For purposes of the table, the management fee has been converted to 1.43% of the Fund's average weekly net assets as of October 31, 2023 by dividing the total dollar amount of the management fee by the Fund's average weekly net assets (managed assets less outstanding leverage).
(4) Reflects interest expense paid on $50 million in average borrowings under the SSB Agreement, plus $59 million in additional average structural leverage related to certain securities lending programs, as described under "Leverage".
(5) Reflects estimated dividend expense on $70 million aggregate liquidation preference of mandatory redeemable preferred shares outstanding. See "Leverage".
(6)
(7) The example does not include sales load or estimated offering costs, which would cause the expenses shown in the example to increase. In connection with an offering of common shares, the applicable prospectus supplement will set forth an example including sales load and estimated offering costs.
Effects of Leverage
The SSB Agreement provides for credit availability for the Fund, such that it may borrow up to $265 million. As of October 31, 2023, the Fund had utilized $131 million of the $265 million available under the SSB Agreement ($116 million of advances outstanding, and $15 million in structural leverage consisting of collateral received from counterparties via State Street Bank and Trust Company in
www.calamos.com
29
Additional Information About the Funds (Unaudited)
connection with securities on loan), representing 22.4% of the Fund's managed assets as of that date, and had $70 million of MRP Shares outstanding, representing 12.0% of the Fund's managed assets. Combined, the borrowings under the SSB Agreement and the outstanding MRP Shares represented 34.4% of the Fund's managed assets. Interest on the SSB Agreement was charged on the drawn amount at the rate of the Overnight Bank Financing Rate ("OBFR") plus 0.80%, payable monthly in arrears, from November 1, 2022, through June 30, 2023. The rate from July 1, 2023, through October 31, 2023, was OBFR plus 0.52%. Interest on overdue amounts or interest on the drawn amount paid during an event of default was charged OBFR plus 2.80% from November 1, 2022, through June 30, 2023. The rate from July 1, 2023, through October 31, 2023, was charged at OBFR plus 2.52%. These rates represent floating rates of interest that may change over time. The SSB Agreement has a commitment fee of 0.10% of any undrawn amount.
As of October 31, 2023, the interest rate charged under the SSB Agreement was 5.84%.
The Fund's MRP Shareholders are entitled to receive monthly cash dividends, at a currently effective dividend rate per annum for each series of MRP Shares as follows (subject to adjustment as described in the Fund's prospectus): 4.00% for Series B MRP Shares, 4.24% for Series C MRP Shares, 2.45% for Series D MRP Shares, and 2.68% for Series E MRP Shares.
To cover the interest expense on the borrowings under the SSB Agreement (including "net income" payments made with respect to borrowings offset by collateral for securities on loan) and the dividend payments associated with the MRP Shares, based on rates in effect on October 31, 2023, the Fund's portfolio would need to experience an annual return of 1.75% (before giving effect to expenses associated with senior securities).
The following table illustrates the hypothetical effect on the return to a holder of the Fund's common shares of the leverage obtained by us (and utilized on October 31, 2023). The purpose of this table is to assist you in understanding the effects of leverage. As the table shows, leverage generally increases the return to common shareholders when portfolio return is positive and greater than the cost of leverage and decreases the return when the portfolio return is negative or less than the cost of leverage. The figures appearing in the table are hypothetical and actual returns may be greater or less than those appearing in the table.
|
Assumed Portfolio Return (Net of Expenses) |
(10.00 |
)% |
(5.00 |
)% |
0.00 |
% |
5.00 |
% |
10.00 |
% |
|||||||||||||
|
Corresponding Common Share Return(1) |
( |
)% |
( |
)% |
( |
)% |
|
% |
|
% |
|||||||||||||
(1) Includes interest expense on the borrowings under the SSB Agreement, accrued at interest rates in effect on October 31, 2023 of 5.84%, and dividend expense on the MRP Shares.
Market and Net Asset Value Information
Our common shares have traded both at a premium and a discount to NAV. We cannot predict whether our shares will trade in the future at a premium or discount to NAV. The provisions of the 1940 Act generally require that the public offering price of common shares (less any underwriting commissions and discounts) must equal or exceed the NAV per share of a company's common stock (calculated within 48 hours of pricing). Our issuance of common shares may have an adverse effect on prices in the secondary market for our common shares by increasing the number of common shares available, which may put downward pressure on the market price for our common shares. Shares of common stock of closed-end investment companies frequently trade at a discount from NAV.
The following table sets forth for each of the periods indicated the high and low closing market prices for our common shares on Nasdaq, the NAV per share and the premium or discount to NAV per share at which our common shares were trading. NAV is shown for the last business day of each quarter. See "Net Asset Value" for information as to the determination of our NAV.
CALAMOS CLOSED-END FAMILY OF FUNDS ANNUAL REPORT
30
Additional Information About the Funds (Unaudited)
|
MARKET PRICE(1) |
NET ASSET VALUE AT QUARTER |
PREMIUM/ (DISCOUNT) TO NET ASSET VALUE(3) |
|||||||||||||||||||||
|
QUARTER ENDED |
HIGH |
LOW |
END(2) |
HIGH |
LOW |
||||||||||||||||||
|
October 31, 2023 |
$ |
|
$ |
|
$ |
|
- |
% |
- |
% |
|||||||||||||
|
July 31, 2023 |
$ |
|
$ |
|
$ |
|
- |
% |
- |
% |
|||||||||||||
|
April 30, 2023 |
$ |
|
$ |
|
$ |
|
- |
% |
- |
% |
|||||||||||||
|
January 31, 2023 |
$ |
|
$ |
|
$ |
|
- |
% |
- |
% |
|||||||||||||
|
October 31, 2022 |
$ |
|
$ |
|
$ |
|
|
% |
- |
% |
|||||||||||||
|
July 31, 2022 |
$ |
|
$ |
|
$ |
|
|
% |
- |
% |
|||||||||||||
|
April 30, 2022 |
$ |
|
$ |
|
$ |
|
|
% |
- |
% |
|||||||||||||
|
January 31, 2022 |
$ |
|
$ |
|
$ |
|
|
% |
- |
% |
|||||||||||||
|
October 31, 2021 |
$ |
|
$ |
|
$ |
|
|
% |
- |
% |
|||||||||||||
|
July 31, 2021 |
$ |
|
$ |
|
$ |
|
|
% |
|
% |
|||||||||||||
|
April 30, 2021 |
$ |
|
$ |
|
$ |
|
|
% |
- |
% |
|||||||||||||
|
January 31, 2021 |
$ |
|
$ |
|
$ |
|
- |
% |
- |
% |
|||||||||||||
Source: Fund Accounting Records
(1) Based on high and low closing market price per share during the respective quarter and does not reflect commissions.
(2) Based on the NAV calculated on the close of business on the last business day of each calendar quarter.
(3) Premium and discount information is shown for the days when the Fund experienced its high and low closing market prices, respectively, per share during the respective quarter.
www.calamos.com
31
Additional Information About the Funds (Unaudited)
Calamos Global Total Return Fund
GROWTH OF $10,000: FOR THE 10-YEAR PERIOD ENDED 10/31/23
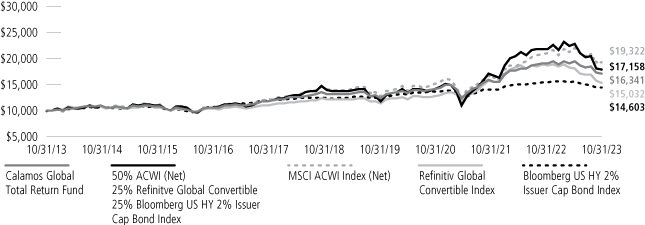
AVERAGE ANNUAL TOTAL RETURN† AS OF 10/31/23
| 1 YEAR |
5 YEARS |
10 YEARS |
SINCE INCEPTION |
||||||||||||||||
|
Calamos Global Total Return Fund |
|||||||||||||||||||
|
Market Value |
-0.98 |
% |
2.94 |
% |
4.29 |
% |
5.83 |
% |
|||||||||||
|
NAV |
5.26 |
4.98 |
5.03 |
6.76 |
|||||||||||||||
|
50%ACWI(NR)-25%RefinitivGlblCv-25%BBGUSHY2%Cap Index |
7.96 |
5.97 |
5.55 |
6.43 |
|||||||||||||||
|
MSCI ACWI Index (Net) |
10.50 |
7.47 |
6.81 |
6.56 |
|||||||||||||||
|
Refinitiv Global Convertible index |
4.33 |
5.12 |
4.16 |
5.61 |
|||||||||||||||
|
Bloomberg US HY 2% Issuer Cap Bond Index |
6.23 |
3.04 |
3.86 |
6.16 |
|||||||||||||||
Performance data quoted represents past performance, which is no guarantee of future results. Current performance may be lower or higher than the performance quoted. The principal value and investment return of an investment will fluctuate so that your shares, when redeemed, may be worth more or less than their original cost. Average annual total return measures net investment income and capital gain or loss from portfolio investments as an annualized average. All performance shown assumes reinvestment of dividends and capital gain distributions. Source: State Street Corporation and Morningstar Direct.
† Average annual total return measures net investment income and capital gain or loss from portfolio investments as an annualized average assuming reinvestment of dividends and capital gains distributions.
NOTES:
The graphs do not reflect the income taxes that you would pay on fund distributions or the redemption of fund shares. Fund performance includes reinvestment of dividends.
The 50%ACWI(NR)-25%RefinitivGlblCv-25%BBGUSHY2%Cap Index is blended from 50% - MSCI ACWI Index (MXWD), 25% - Refinitiv Global Convertible Bond Index and 25% - Bloomberg US HY 2% Issuer Capped Index.
The MSCI ACWI Index (Net) is a free float-adjusted market-capitalization-weighted index that is designed to measure the equity market performance of developed markets and emerging markets. The index is calculated in both US dollars and local currencies. Net return basis approximates the minimum possible reinvestment of regular cash distributions by deducting withholding tax based on the maximum rate of the company's country of incorporation applicable to institutional investors.
The Refinitiv Global Convertible Bond Index (USD) is designed to represent the global convertible market.
The Bloomberg US Corporate High Yield 2% Issuer Capped Index measures the performance of high-yield corporate bonds with a maximum allocation of 2% to any one issuer.
Index returns assume reinvestment of dividends and do not reflect deduction of fees and expenses. It is not possible to invest directly in an index.
CALAMOS CLOSED-END FAMILY OF FUNDS ANNUAL REPORT
32
Additional Information About the Funds (Unaudited)
Calamos Global Total Return Fund
Senior Securities
The following table sets forth information regarding the Fund's outstanding bank loans, and mandatory redeemable preferred shares ("MRPS") as of the end of each of the Fund's last ten fiscal years, as applicable. The information in the table shown below comes from the Fund's financial statements for the fiscal year ended October 31, 2023, and each of the prior nine years then ended, all of which have been audited by Deloitte & Touche LLP, the Fund's independent registered public accounting firm.
| FISCAL YEAR ENDED | TOTAL AMOUNT OUTSTANDING |
ASSET COVERAGE |
LIQUIDATING PREFERENCE PER PREFERRED SHARE(c) |
AVERAGE MARKET VALUE PER PREFERRED SHARE |
TYPE OF SENIOR SECURITY |
||||||||||||||||||
|
October 31, 2023 |
$ |
30,100,000 |
$ |
4,541 |
(a) |
— |
— |
Loan |
|||||||||||||||
|
October 31, 2023 |
$ |
17,000,000 |
201 |
(b) |
25 |
25 |
(d) |
MRPS |
|||||||||||||||
|
October 31, 2022 |
$ |
26,000,000 |
5,276 |
(a) |
— |
— |
Loan |
||||||||||||||||
|
October 31, 2022 |
$ |
17,000,000 |
202 |
(b) |
25 |
25 |
(d) |
MRPS |
|||||||||||||||
|
October 31, 2021 |
$ |
50,500,000 |
4,281 |
(a) |
— |
— |
Loan |
||||||||||||||||
|
October 31, 2021 |
$ |
17,000,000 |
318 |
(b) |
25 |
25 |
(d) |
MRPS |
|||||||||||||||
|
October 31, 2020 |
$ |
37,000,000 |
4,213 |
(a) |
— |
— |
Loan |
||||||||||||||||
|
October 31, 2020 |
$ |
12,000,000 |
325 |
(b) |
25 |
25 |
(d) |
MRPS |
|||||||||||||||
|
October 31, 2019 |
$ |
38,300,000 |
3,938 |
(a) |
— |
— |
Loan |
||||||||||||||||
|
October 31, 2019 |
$ |
12,000,000 |
314 |
(b) |
25 |
25 |
(d) |
MRPS |
|||||||||||||||
|
October 31, 2018 |
$ |
43,000,000 |
3,621 |
(a) |
— |
— |
Loan |
||||||||||||||||
|
October 31, 2018 |
$ |
12,000,000 |
324 |
(b) |
25 |
25 |
(d) |
MRPS |
|||||||||||||||
|
October 31, 2017 |
$ |
36,000,000 |
4,490 |
(a) |
— |
— |
Loan |
||||||||||||||||
|
October 31, 2017 |
$ |
12,000,000 |
337 |
(b) |
25 |
25 |
(d) |
MRPS |
|||||||||||||||
|
October 31, 2016 |
$ |
42,000,000 |
3,456 |
(a) |
— |
— |
Loan |
||||||||||||||||
|
October 31, 2015 |
$ |
44,000,000 |
3,556 |
(a) |
— |
— |
Loan |
||||||||||||||||
|
October 31, 2014 |
$ |
49,000,000 |
3,455 |
(a) |
— |
— |
Loan |
||||||||||||||||
(a) Calculated by subtracting the Fund's total liabilities (not including notes payable) from the Fund's total assets and dividing this by the amount of notes payable outstanding, and by multiplying the result by 1,000.
(b) Calculated by subtracting the Fund's total liabilities (not including MRPS) from the Fund's total assets and dividing this by the number of MRPS outstanding, and by multiplying the result by 25.
(c) "Liquidating Preference per Preferred Share" means the amount to which a holder of preferred shares would be entitled upon the liquidation of the Fund in preference to common shareholders, expressed as a dollar amount per preferred share.
(d) The MRPS are not listed on any exchange or automated quotation system. The MRPS are considered debt of the issuer; and the liquidation preference approximates fair value.
Summary of Fund Expenses
The following table and example contain information about the costs and expenses that common shareholders will bear directly or indirectly. In accordance with Commission requirements, the table below shows our expenses, including interest payments on borrowed funds, and preferred stock dividend payments, as a percentage of our average net assets as of October 31, 2023, and not as a percentage of gross assets or managed assets.
By showing expenses as a percentage of average net assets, expenses are not expressed as a percentage of all of the assets we invest. The table and example are based on our capital structure as of October 31, 2023. As of October 31, 2023, the Fund had utilized $30 million of the $55 million available under the SSB Agreement ($24 million in advances outstanding, and $6 million in structural leverage consisting of collateral received from counterparties via SSB in connection with securities on loan), representing 22.0% of the Fund's managed assets as of that date, and had $17 million in MRPS outstanding, representing 12.4% of the Fund's managed assets. Combined, the borrowings under the SSB Agreement and the outstanding MRPS represented 34.5% of the Fund's managed assets.
www.calamos.com
33
Additional Information About the Funds (Unaudited)
|
SHAREHOLDER TRANSACTION EXPENSES |
|||||||
|
Sales Load (as a percentage of offering price) |
— |
(1) |
|||||
|
Offering Expenses Borne by the Fund (as a percentage of offering price) |
— |
(1) |
|||||
|
Dividend Reinvestment Plan Fees (per sales transaction fee)(2) |
$ |
15.00 |
|||||
| ANNUAL EXPENSES | PERCENTAGE OF AVERAGE NET ASSETS ATTRIBUTABLE TO COMMON SHAREHOLDERS |
||||||
|
Management Fee(3) |
1.43 |
% |
|||||
|
Interest Payments on Borrowed Funds(4) |
1.39 |
% |
|||||
|
Preferred Stock Dividend Payments(5) |
0.60 |
% |
|||||
|
Other Expenses(6) |
0.44 |
% |
|||||
|
Total Annual Expenses |
3.86 |
% |
|||||
The following example illustrates the expenses that common shareholders would pay on a $1,000 investment in common shares, assuming (1) total annual expenses of 3.86% of net assets attributable to common shareholders; (2) a 5% annual return; and (3) all distributions are reinvested at net asset value:
|
1 YEAR |
3 YEARS |
5 YEARS |
10 YEARS |
||||||||||||||||
|
Total Expenses Paid by Common Shareholders(7) |
$ |
39 |
$ |
118 |
$ |
199 |
$ |
410 |
|||||||||||
The example should not be considered a representation of future expenses. Actual expenses may be greater or less than those assumed. Moreover, our actual rate of return may be greater or less than the hypothetical 5% return shown in the example.
(1) If the securities to which this prospectus relates are sold to or through underwriters, the prospectus supplement will set forth any applicable sales load and the estimated offering expenses borne by us.
(2) Shareholders will pay a $15.00 transaction fee plus a $0.02 per share brokerage charge if they direct the Plan Agent (as defined below) to sell common shares held in a Plan account. In addition, each participant will pay a pro rata share of brokerage commissions incurred with respect to the Plan Agent's open-market purchases in connection with the reinvestment of dividends or distributions. If a participant elects to have the Plan Agent sell part or all of his or her common shares and remit the proceeds, such participant will be charged his or her pro rata share of brokerage commissions on the shares sold. See "Dividends and Distributions on Common Shares; Automatic Dividend Reinvestment Plan".
(3) The Fund pays Calamos an annual management fee, payable monthly in arrears, for its investment management services in an amount equal to 1.00% of the Fund's average weekly managed assets. In accordance with the requirements of the Commission, the table above shows the Fund's management fee as a percentage of average net assets attributable to common shareholders. By showing the management fee as a percentage of net assets, the management fee is not expressed as a percentage of all of the assets the Fund intends to invest. For purposes of the table, the management fee has been converted to 1.43% of the Fund's average weekly net assets as of October 31, 2023 by dividing the total dollar amount of the management fee by the Fund's average weekly net assets (managed assets less outstanding leverage).
(4) Reflects interest expense paid on $10 million in average borrowings under the SSB Agreement, plus $15 million in additional average structural leverage related to certain securities lending programs, as described under "Leverage".
(5) Reflects estimated dividend expense on $17 million aggregate liquidation preference of mandatory redeemable preferred shares outstanding. See "Leverage".
(6) "Other Expenses" are based on estimated amounts for the Fund's current fiscal year.
(7) The example does not include sales load or estimated offering costs, which would cause the expenses shown in the example to increase. In connection with an offering of common shares, the applicable prospectus supplement will set forth an example including sales load and estimated offering costs.
Effects of Leverage
The SSB Agreement provides for credit availability for the Fund, such that it may borrow up to $55 million. As of October 31, 2023, the Fund had utilized $30 million of the $55 million available under the SSB Agreement ($24 million of advances outstanding, and $6 million in structural leverage consisting of collateral received from counterparties via State Street Bank and Trust Company in connection with securities on loan), representing 22.0% of the Fund's managed assets as of that date,
CALAMOS CLOSED-END FAMILY OF FUNDS ANNUAL REPORT
34
Additional Information About the Funds (Unaudited)
and had $17 million of MRP Shares outstanding, representing 12.4% of the Fund's managed assets. Combined, the borrowings under the SSB Agreement and the outstanding MRP Shares represented 34.5% of the Fund's managed assets. Interest on the SSB Agreement was charged on the drawn amount at the rate of the Overnight Bank Financing Rate ("OBFR") plus 0.80%, payable monthly in arrears, from November 1, 2022, through June 30, 2023. The rate from July 1, 2023, through October 31, 2023, was OBFR plus 0.52%. Interest on overdue amounts or interest on the drawn amount paid during an event of default was charged OBFR plus 2.80% from November 1, 2022, through June 30, 2023. The rate from July 1, 2023, through October 31, 2023, was charged at OBFR plus 2.52%. These rates represent floating rates of interest that may change over time. The SSB Agreement has a commitment fee of 0.10% of any undrawn amount.
As of October 31, 2023, the interest rate charged under the SSB Agreement was 5.84%.
The Fund's MRP Shareholders are entitled to receive monthly cash dividends, at a currently effective dividend rate per annum for each series of MRP Shares as follows (subject to adjustment as described in the Fund's prospectus): 4.00% for Series B MRP Shares, 4.24% for Series C MRP Shares, 2.45% for Series D MRP Shares, and 2.68% for Series E MRP Shares.
To cover the interest expense on the borrowings under the SSB Agreement (including "net income" payments made with respect to borrowings offset by collateral for securities on loan) and the dividend payments associated with the MRP Shares, based on rates in effect on October 31, 2023, the Fund's portfolio would need to experience an annual return of 1.72% (before giving effect to expenses associated with senior securities).
The following table illustrates the hypothetical effect on the return to a holder of the Fund's common shares of the leverage obtained by us (and utilized on October 31, 2023). The purpose of this table is to assist you in understanding the effects of leverage. As the table shows, leverage generally increases the return to common shareholders when portfolio return is positive and greater than the cost of leverage and decreases the return when the portfolio return is negative or less than the cost of leverage. The figures appearing in the table are hypothetical and actual returns may be greater or less than those appearing in the table.
|
Assumed Portfolio Return (Net of Expenses) |
(10.00 |
)% |
(5.00 |
)% |
0.00 |
% |
5.00 |
% |
10.00 |
% |
|||||||||||||
|
Corresponding Common Share Return(1) |
(17.94 |
)% |
(10.29 |
)% |
(2.64 |
)% |
5.01 |
% |
12.66 |
% |
|||||||||||||
(1) Includes interest expense on the borrowings under the SSB Agreement, accrued at interest rates in effect on October 31, 2023 of 5.84%, and dividend expense on the MRP Shares.
Market and Net Asset Value Information
Our common shares have traded both at a premium and a discount to NAV. We cannot predict whether our shares will trade in the future at a premium or discount to NAV. The provisions of the 1940 Act generally require that the public offering price of common shares (less any underwriting commissions and discounts) must equal or exceed the NAV per share of a company's common stock (calculated within 48 hours of pricing). Our issuance of common shares may have an adverse effect on prices in the secondary market for our common shares by increasing the number of common shares available, which may put downward pressure on the market price for our common shares. Shares of common stock of closed-end investment companies frequently trade at a discount from NAV.
The following table sets forth for each of the periods indicated the high and low closing market prices for our common shares on Nasdaq, the NAV per share and the premium or discount to NAV per share at which our common shares were trading. NAV is shown for the last business day of each quarter. See "Net Asset Value" for information as to the determination of our NAV.
www.calamos.com
35
Additional Information About the Funds (Unaudited)
|
MARKET PRICE(1) |
NET ASSET VALUE AT QUARTER |
PREMIUM/ (DISCOUNT) TO NET ASSET VALUE(3) |
|||||||||||||||||||||
|
QUARTER ENDED |
HIGH |
LOW |
END(2) |
HIGH |
LOW |
||||||||||||||||||
|
October 31, 2023 |
$ |
9.75 |
$ |
7.92 |
$ |
9.11 |
-5.12 |
% |
-12.00 |
% |
|||||||||||||
|
July 31, 2023 |
$ |
9.84 |
$ |
9.00 |
$ |
10.60 |
-5.34 |
% |
-10.55 |
% |
|||||||||||||
|
April 30, 2023 |
$ |
10.48 |
$ |
9.15 |
$ |
10.12 |
0.39 |
% |
-8.88 |
% |
|||||||||||||
|
January 31, 2023 |
$ |
10.12 |
$ |
8.82 |
$ |
10.49 |
-3.53 |
% |
-9.38 |
% |
|||||||||||||
|
October 31, 2022 |
$ |
12.51 |
$ |
8.80 |
$ |
9.59 |
23.81 |
% |
-5.09 |
% |
|||||||||||||
|
July 31, 2022 |
$ |
12.98 |
$ |
10.49 |
$ |
10.82 |
11.78 |
% |
1.25 |
% |
|||||||||||||
|
April 30, 2022 |
$ |
14.80 |
$ |
12.85 |
$ |
11.87 |
12.08 |
% |
-1.89 |
% |
|||||||||||||
|
January 31, 2022 |
$ |
16.25 |
$ |
13.50 |
$ |
14.07 |
3.32 |
% |
-1.58 |
% |
|||||||||||||
|
October 31, 2021 |
$ |
17.30 |
$ |
15.27 |
$ |
15.82 |
8.60 |
% |
0.00 |
% |
|||||||||||||
|
July 31, 2021 |
$ |
16.35 |
$ |
15.40 |
$ |
15.17 |
5.89 |
% |
3.08 |
% |
|||||||||||||
|
April 30, 2021 |
$ |
16.26 |
$ |
14.65 |
$ |
15.39 |
2.59 |
% |
-0.68 |
% |
|||||||||||||
|
January 31, 2021 |
$ |
15.84 |
$ |
11.72 |
$ |
14.77 |
2.13 |
% |
-3.14 |
% |
|||||||||||||
Source: Fund Accounting Records
(1) Based on high and low closing market price per share during the respective quarter and does not reflect commissions.
(2) Based on the NAV calculated on the close of business on the last business day of each calendar quarter.
(3) Premium and discount information is shown for the days when the Fund experienced its high and low closing market prices, respectively, per share during the respective quarter.
CALAMOS CLOSED-END FAMILY OF FUNDS ANNUAL REPORT
36
Additional Information About the Funds (Unaudited)
Calamos Long/Short Equity & Dynamic Income Trust
GROWTH OF $10,000: SINCE INCEPTION (11/30/19) THROUGH 10/31/23
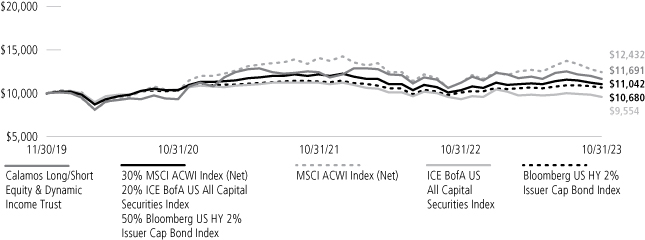
AVERAGE ANNUAL TOTAL RETURN† AS OF 10/31/23
| 1 YEAR | SINCE INCEPTION | ||||||||||
Calamos Long/Short Equity & Dynamic Income Trust | |||||||||||
Market Value | -2.85 | % | -0.75 | % | |||||||
NAV | 4.32 | 4.06 | |||||||||
30%MSCIACWI(NR)-20%ICOS-50%BBGUSHY2%Cap Index | 6.75 | 2.52 | |||||||||
MSCI ACWI Index (Net) | 10.50 | 5.58 | |||||||||
ICE BofA US All Capital Securities Index | 1.99 | -1.18 | |||||||||
Bloomberg US HY 2% Issuer Cap Bond Index | 6.23 | 1.70 | |||||||||
Performance data quoted represents past performance, which is no guarantee of future results. Current performance may be lower or higher than the performance quoted. The principal value and investment return of an investment will fluctuate so that your shares, when redeemed, may be worth more or less than their original cost. Average annual total return measures net investment income and capital gain or loss from portfolio investments as an annualized average. All performance shown assumes reinvestment of dividends and capital gain distributions. Source: State Street Corporation and Morningstar Direct.
† Average annual total return measures net investment income and capital gain or loss from portfolio investments as an annualized average assuming reinvestment of dividends and capital gains distributions.
NOTES:
The 30%MSCIACWI(NR)-20%ICOS-50%BBGUSHY2%Cap Index is blended from 30% - MSCI ACWI Index (MXWD), 20% - ICE BofA US All Capital Securities Index and 50% - Bloomberg US HY 2% Issuer Capped Index.
The MSCI ACWI Index (Net) is a free float-adjusted market-capitalization-weighted index that is designed to measure the equity market performance of developed markets and emerging markets. The index is calculated in both US dollars and local currencies. Net return basis approximates the minimum possible reinvestment of regular cash distributions by deducting withholding tax based on the maximum rate of the company's country of incorporation applicable to institutional investors.
The ICE BofA US All Capital Securities Index is a subset of the ICE BofA US Corporate and US High Yield Index including all fixed-to floating rate, perpetual callable and capital securities, and fixed-rate preferred securities.
The Bloomberg US Corporate High Yield 2% Issuer Capped Index measures the performance of high-yield corporate bonds with a maximum allocation of 2% to any one issuer.
Index returns assume reinvestment of dividends and do not reflect deduction of fees and expenses. It is not possible to invest directly in an index.
www.calamos.com
37
Additional Information About the Funds (Unaudited)
Calamos Long/Short Equity & Dynamic Income Trust
Senior Securities
The following table sets forth information regarding the Fund's outstanding bank loans, and mandatory redeemable preferred shares ("MRPS") as of the end of each of the Fund's last ten fiscal years, as applicable. The information in the table shown below comes from the Fund's financial statements for the fiscal year ended October 31, 2023, and each of the prior three years then ended, all of which have been audited by Deloitte & Touche LLP, the Fund's independent registered public accounting firm.
| FISCAL YEAR ENDED | TOTAL AMOUNT OUTSTANDING | ASSET COVERAGE(a) | LIQUIDATING PREFERENCE PER PREFERRED SHARE(b) | AVERAGE MARKET VALUE PER PREFERRED SHARE | TYPE OF SENIOR SECURITY | ||||||||||||||||||
October 31, 2023 | $ | 120,000,000 | $ | 3,706 | — | — | Loan | ||||||||||||||||
October 31, 2022 | $ | 120,000,000 | 3,890 | — | — | Loan | |||||||||||||||||
October 31, 2021 | $ | 120,000,000 | 4,521 | — | — | Loan | |||||||||||||||||
October 31, 2020* | $ | 69,200,000 | 5,949 | — | — | Loan | |||||||||||||||||
* Commencement of operations was November 29, 2019.
(1) Calculated by subtracting the Fund's total liabilities (not including notes payable) from the Fund's total assets and dividing this by the amount of notes payable outstanding, and by multiplying the result by 1,000.
(2) "Liquidating Preference per Preferred Share" means the amount to which a holder of preferred shares would be entitled upon the liquidation of the Fund in preference to common shareholders, expressed as a dollar amount per preferred share.
Summary of Fund Expenses
The following table and example contain information about the costs and expenses that common shareholders will bear directly or indirectly. In accordance with Commission requirements, the table below shows our expenses, including interest payments on borrowed funds, and preferred stock dividend payments, as a percentage of our average net assets as of October 31, 2023, and not as a percentage of gross assets or managed assets.
By showing expenses as a percentage of average net assets, expenses are not expressed as a percentage of all of the assets we invest. The table and example are based on our capital structure as of October 31, 2023. As of October 31, 2023, the Fund had utilized $120 million of the $150 million available under the SSB Agreement ($118 million in advances outstanding and $2 million in structural leverage consisting of collateral received from counterparties via SSB in connection with securities on loan), representing 27.0% of the Fund's managed assets.
SHAREHOLDER TRANSACTION EXPENSES | |||||||
Sales Load (as a percentage of offering price) | — | (1) | |||||
Offering Expenses Borne by the Fund (as a percentage of offering price) | — | (1)(1) | |||||
Dividend Reinvestment Plan Fees (per sales transaction fee)(2) | $ | 15.00 | |||||
| ANNUAL EXPENSES | PERCENTAGE OF AVERAGE NET ASSETS ATTRIBUTABLE TO COMMON SHAREHOLDERS | ||||||
Management Fee(3) | 1.81 | % | |||||
Interest Payments on Borrowed Funds(4) | 1.89 | % | |||||
Dividend Expense on Short Sales | 0.65 | % | |||||
Other Expenses(5) | 0.16 | % | |||||
Acquired Fund Fees and Expenses(6) | 0.00 | % | |||||
Total Annual Expenses | 4.51 | % | |||||
CALAMOS CLOSED-END FAMILY OF FUNDS ANNUAL REPORT
38
Additional Information About the Funds (Unaudited)
The following example illustrates the expenses that common shareholders would pay on a $1,000 investment in common shares, assuming (1) total annual expenses of 4.51% of net assets attributable to common shareholders; (2) a 5% annual return; and (3) all distributions are reinvested at net asset value:
1 YEAR | 3 YEARS | 5 YEARS | 10 YEARS | ||||||||||||||||
Total Expenses Paid by Common Shareholders(7) | $ | 45 | $ | 136 | $ | 228 | $ | 462 | |||||||||||
The example should not be considered a representation of future expenses. Actual expenses may be greater or less than those assumed. Moreover, our actual rate of return may be greater or less than the hypothetical 5% return shown in the example.
(1) If the securities to which this prospectus relates are sold to or through underwriters, the prospectus supplement will set forth any applicable sales load and the estimated offering expenses borne by us.
(2) Shareholders will pay a $15.00 transaction fee plus a $0.02 per share brokerage charge if they direct the Plan Agent (as defined below) to sell common shares held in a Plan account. In addition, each participant will pay a pro rata share of brokerage commissions incurred with respect to the Plan Agent's open-market purchases in connection with the reinvestment of dividends or distributions. If a participant elects to have the Plan Agent sell part or all of his or her common shares and remit the proceeds, such participant will be charged his or her pro rata share of brokerage commissions on the shares sold. See "Dividends and Distributions on Common Shares; Automatic Dividend Reinvestment Plan".
(3) The Fund pays Calamos an annual management fee, payable monthly in arrears, for its investment management services in an amount equal to 1.35% of the Fund's average weekly managed assets. In accordance with the requirements of the Commission, the table above shows the Fund's management fee as a percentage of average net assets attributable to common shareholders. By showing the management fee as a percentage of net assets, the management fee is not expressed as a percentage of all of the assets the Fund intends to invest. For purposes of the table, the management fee has been converted to 1.81% of the Fund's average weekly net assets as of October 31, 2023 by dividing the total dollar amount of the management fee by the Fund's average weekly net assets (managed assets less outstanding leverage).
(4) Reflects interest expense paid on $61 million in average borrowings under the SSB Agreement, plus $59 million in additional average structural leverage related to certain securities lending programs, as described under "Leverage".
(5) "Other Expenses" are based on estimated amounts for the Fund's current fiscal year.
(6) "Acquired Fund Fees and Expenses" are the indirect costs of investing in other investment companies such as money market funds and ETFs.
(7) The example does not include sales load or estimated offering costs, which would cause the expenses shown in the example to increase. In connection with an offering of common shares, the applicable prospectus supplement will set forth an example including sales load and estimated offering costs.
Effects of Leverage
The SSB Agreement provides for credit availability for the Fund, such that it may borrow up to $150 million. As of October 31, 2023, the Fund had utilized $120 million of the $150 million available under the SSB Agreement ($118 million of advances outstanding, and $2 million in structural leverage consisting of collateral received from counterparties via State Street Bank and Trust Company in connection with securities on loan), representing 27.0% of the Fund's managed assets as of that date. Interest on the SSB Agreement was charged on the drawn amount at the rate of the Overnight Bank Financing Rate ("OBFR") plus 0.80%, payable monthly in arrears, from November 1, 2022, through June 30, 2023. The rate from July 1, 2023, through October 31, 2023, was OBFR plus 0.52%. Interest on overdue amounts or interest on the drawn amount paid during an event of default was charged OBFR plus 2.80% from November 1, 2022, through June 30, 2023. The rate from July 1, 2023, through October 31, 2023, was charged at OBFR plus 2.52%. These rates represent floating rates of interest that may change over time. The SSB Agreement has a commitment fee of 0.10% of any undrawn amount.
As of October 31, 2023, the interest rate charged under the SSB Agreement was 5.84%.
To cover the interest expense on the borrowings under the SSB Agreement (including "net income" payments made with respect to borrowings offset by collateral for securities on loan) and the dividend payments associated with the MRP Shares, based on rates in effect on October 31, 2023, the Fund's portfolio would need to experience an annual return of 1.58% (before giving effect to expenses associated with senior securities).
The following table illustrates the hypothetical effect on the return to a holder of the Fund's common shares of the leverage obtained by us (and utilized on October 31, 2023). The purpose of this table is to assist you in understanding the effects of leverage. As the table shows, leverage generally increases the return to common shareholders when portfolio return is positive and greater than the cost of
www.calamos.com
39
Additional Information About the Funds (Unaudited)
leverage and decreases the return when the portfolio return is negative or less than the cost of leverage. The figures appearing in the table are hypothetical and actual returns may be greater or less than those appearing in the table.
Assumed Portfolio Return (Net of Expenses) | (10.00 | )% | (5.00 | )% | 0.00 | % | 5.00 | % | 10.00 | % | |||||||||||||
Corresponding Common Share Return(1) | (15.87 | )% | (9.02 | )% | (2.17 | )% | 4.68 | % | 11.53 | % | |||||||||||||
(1) Includes interest expense on the borrowings under the SSB Agreement, accrued at interest rates in effect on October 31, 2023 of 5.84%, and dividend expense on the MRP Shares.
Market and Net Asset Value Information
Our common shares have traded both at a premium and a discount to NAV. We cannot predict whether our shares will trade in the future at a premium or discount to NAV. The provisions of the 1940 Act generally require that the public offering price of common shares (less any underwriting commissions and discounts) must equal or exceed the NAV per share of a company's common stock (calculated within 48 hours of pricing). Our issuance of common shares may have an adverse effect on prices in the secondary market for our common shares by increasing the number of common shares available, which may put downward pressure on the market price for our common shares. Shares of common stock of closed-end investment companies frequently trade at a discount from NAV.
The following table sets forth for each of the periods indicated the high and low closing market prices for our common shares on Nasdaq, the NAV per share and the premium or discount to NAV per share at which our common shares were trading. NAV is shown for the last business day of each quarter. See "Net Asset Value" for information as to the determination of our NAV.
MARKET PRICE(1) | NET ASSET VALUE AT QUARTER | PREMIUM/ (DISCOUNT) TO NET ASSET VALUE(3) | |||||||||||||||||||||
QUARTER ENDED | HIGH | LOW | END(2) | HIGH | LOW | ||||||||||||||||||
October 31, 2023 | $ | 15.60 | $ | 13.44 | $ | 16.53 | -12.53 | % | -17.90 | % | |||||||||||||
July 31, 2023 | $ | 15.89 | $ | 14.69 | $ | 18.21 | -12.98 | % | -16.33 | % | |||||||||||||
April 30, 2023 | $ | 17.12 | $ | 14.78 | $ | 17.77 | -10.52 | % | -14.31 | % | |||||||||||||
January 31, 2023 | $ | 16.86 | $ | 15.13 | $ | 19.04 | -9.60 | % | -14.80 | % | |||||||||||||
October 31, 2022 | $ | 18.68 | $ | 14.72 | $ | 17.66 | -5.78 | % | -13.34 | % | |||||||||||||
July 31, 2022 | $ | 18.75 | $ | 15.99 | $ | 19.11 | -6.48 | % | -14.75 | % | |||||||||||||
April 30, 2022 | $ | 20.95 | $ | 18.53 | $ | 20.14 | 0.00 | % | -8.19 | % | |||||||||||||
January 31, 2022 | $ | 20.89 | $ | 18.36 | $ | 21.79 | -3.12 | % | -10.17 | % | |||||||||||||
October 31, 2021 | $ | 20.95 | $ | 19.52 | $ | 21.52 | -6.01 | % | -7.66 | % | |||||||||||||
July 31, 2021 | $ | 21.33 | $ | 19.53 | $ | 21.62 | -7.38 | % | -6.82 | % | |||||||||||||
April 30, 2021 | $ | 20.78 | $ | 17.84 | $ | 22.92 | -10.04 | % | -12.51 | % | |||||||||||||
January 31, 2021 | $ | 18.47 | $ | 14.40 | $ | 19.77 | -9.42 | % | -18.14 | % | |||||||||||||
Source: Fund Accounting Records
(1) Based on high and low closing market price per share during the respective quarter and does not reflect commissions.
(2) Based on the NAV calculated on the close of business on the last business day of each calendar quarter.
(3) Premium and discount information is shown for the days when the Fund experienced its high and low closing market prices, respectively, per share during the respective quarter.
CALAMOS CLOSED-END FAMILY OF FUNDS ANNUAL REPORT
40
Calamos Convertible Opportunities and Income Fund (Unaudited)
CALAMOS CONVERTIBLE OPPORTUNITIES AND INCOME FUND
INVESTMENT TEAM DISCUSSION
Please discuss the Fund's strategy and role within an asset allocation.
Calamos Convertible Opportunities and Income Fund (CHI) is an enhanced fixed-income offering that seeks total return through capital appreciation and current income. It provides an alternative to funds investing exclusively in investment-grade fixed-income instruments and seeks to be less sensitive to interest rate moves. Like all Calamos closed-end funds, the Fund invests in multiple asset classes and aims to provide a steady stream of distributions paid out monthly.
The Fund invests in a diversified portfolio of convertible securities and high-yield bonds. The allocation to each asset class is dynamic and reflects our view of the economic landscape and the potential of individual securities. By utilizing these asset classes in combination, we believe the Fund is well positioned to generate capital gains and income. The broader range of security types also provides increased opportunities to manage the portfolio's risk/reward characteristics over full market cycles.
We seek companies with respectable balance sheets, reliable debt servicing, and good prospects for sustainable growth. We are also investing in cyclical companies poised to perform well in a post-pandemic environment, with earnings expansion potential resulting from pent-up consumer demand. Although we invest primarily in securities of US issuers, we favor companies that actively participate in markets with geographically diversified revenue streams and global-scale business strategies.
Given the heightened market volatility, we prefer convertibles with balanced risk/reward attributes while maintaining an underweight to the most equity-sensitive convertibles, which can lack favorable downside risk mitigation.
How did the Fund perform over the annual period?
The Fund returned -2.27% on a net asset value (NAV) basis and 3.37% on a market price basis for the 12 months ended October 31, 2023 ("annual period"), versus 2.88% for the comparator index comprising 50% ICE BofA All US Convertibles Index and 50% Bloomberg US Corporate High Yield 2% Issuer Capped Index for the same period. At the end of the annual period, the Fund's shares traded at an 11.23% premium to the NAV.
How do NAV and market price returns differ?
Closed-end funds trade on exchanges, where factors other than the value of the underlying securities might drive the price of shares or market price. For example, general market sentiment or future expectations might influence the market price. A fund's NAV return measures the actual return of the individual securities in the portfolio, less fund expenses. It also measures how a manager was able to capitalize on market opportunities. Because we believe closed-end funds are best utilized long term within asset allocations, we deem that the NAV return is the better measure of a fund's performance. However, when managing our Fund, we strongly consider actions and policies to optimize its overall price performance and returns based on market value.
TOTAL RETURN*
Common Shares – Inception 6/26/02
1 Year | Since Inception** | ||||||||||
On Market Price | 3.27 | % | 8.72 | % | |||||||
On NAV | -2.27 | % | 8.41 | % | |||||||
*Total return measures net investment income and net realized gain or loss from Fund investments, and change in net unrealized appreciation and depreciation, assuming reinvestment of income and net realized gains distributions.
**Annualized since inception.
SECTOR WEIGHTINGS
Information Technology | 21.3 | % | |||||
Consumer Discretionary | 18.5 | ||||||
Health Care | 15.7 | ||||||
Industrials | 9.6 | ||||||
Communication Services | 8.9 | ||||||
Financials | 7.0 | ||||||
Energy | 5.9 | ||||||
Utilities | 3.4 | ||||||
Materials | 3.1 | ||||||
Consumer Staples | 1.9 | ||||||
Real Estate | 0.7 | ||||||
Airlines | 0.6 | ||||||
Special Purpose Acquisition Companies | 0.4 | ||||||
Sector weightings are based on managed assets and may vary over time. Sector Weightings exclude any government/sovereign bonds or options on broad market indexes the Fund may hold.
www.calamos.com
41
Calamos Convertible Opportunities and Income Fund (Unaudited)
ASSET ALLOCATION AS OF 10/31/23
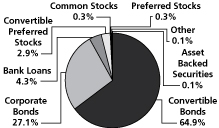
Fund asset allocations are based on total investments and may vary over time.
SINCE INCEPTION MARKET PRICE AND NAV HISTORY THROUGH 10/31/23
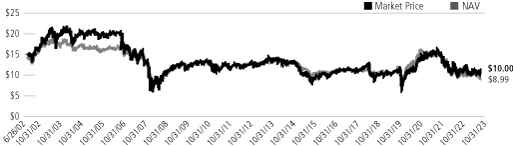
Performance data quoted represents past performance, which is no guarantee of future results. Current performance may be lower or higher than the performance quoted. The principal value of an investment will fluctuate so that your shares, when sold, may be worth more or less than their original cost. Returns at NAV reflect the deduction of the Fund's management fee, debt leverage costs and all other applicable fees and expenses. You can obtain performance data current to the most recent month end by visiting www.calamos.com.
Please discuss the Fund's distributions during the reporting period.
We employ a managed distribution policy within this Fund with the goal of providing shareholders a consistent distribution stream. At the end of the annual period, the Fund's monthly distribution rate was $0.0950 per share, and the annualized distribution rate on the Fund's market price was 11.40%.
We believe both the Fund's distribution rate and level remained attractive and competitive, given that yield opportunities are limited in much of the marketplace, despite recent Fed tightening. As of October 31, 2023, the dividend yield of S&P 500 Index stocks averaged 1.68%. Although higher than a year ago, yields within the US government bond market were relatively low, with the 10-year US Treasury yielding 4.88%.
What factors influenced performance over the annual period?
On an unleveraged basis, our convertible bond holdings performed in line with the ICE BofA All US Convertibles Index. Holdings in the information technology and industrials sectors were helpful to performance, whereas holdings in financials and energy were not.
During the annual period, investors focused on the Federal Reserve's response to persistent inflation and the potential for a recession. Geopolitical concerns, regional bank stress, rising fuel prices, and potential impacts of the United Auto Workers strike also made headlines and induced volatility. Despite these headwinds, the equity market began to recover from 2022's lows, and the S&P 500 Index returned 10.14% over the period. However, the higher-for-longer interest rate environment stoked volatility in the bond market, and the Bloomberg US Aggregate Bond Index rose just 0.36%.
The convertible market is well represented by small and mid-sized growth issuers, which lagged the broader equity market as evidenced by the Russell 2500 Growth Index's -4.80% return. More than half of the convertible market was priced below par on average during the reporting period, and convertibles (-0.48%) held up much better than their underlying stocks (-8.2%).
CALAMOS CLOSED-END FAMILY OF FUNDS ANNUAL REPORT
42
Calamos Convertible Opportunities and Income Fund (Unaudited)
Our high-yield bond holdings slightly underperformed relative to the Bloomberg US High Yield 2% Issuer Capped Index. Our selection in the energy and financials sectors contributed to results, while our selection in the communication services and consumer discretionary sectors trailed.
High yield spreads were modestly tighter, closing at 437 basis points on an option-adjusted basis, down from 464 in the prior year. Despite the perceived stability, the trading range for spreads during the period was 150 basis points wide, reflecting the volatility across markets. Lower quality outperformed as CCCs returned 7.4%, B-rated paper returned 6.8%, and more rate-sensitive BBs returned 5.3%. After increasing for most of the year, trailing 12-month defaults came in at 2.6% on a par-weighted basis. We expect this measure to climb and close the 2023 calendar year near the 3.0% average of the post-GFC era. The best performing sectors in the Bloomberg US High Yield 2% Issuer Capped Index were finance companies (+10.9%), consumer cyclicals (+10.2%), and brokers and asset managers (+3.5), whereas communications (+0.8%), electric utilities (+3.1%), and transportation (+3.3%) represented the laggards.
Other factors that contributed and detracted from Fund performance included the following:
◼ On an unleveraged basis, the portfolio underperformed the comparator index. Our relative overweight in convertibles and underweight in corporate bonds relative to the index hindered performance.
◼ Our use of put options was beneficial relative to the comparator index.
◼ Our selection of corporate bonds was not helpful to returns.
◼ The Fund benefitted from leading security selection and an average overweight stance in information technology, specifically in the data processing & outsourced services and the communications equipment industries.
◼ Security selection and an average underweight stance in industrials contributed to performance, specifically in the electrical components & equipment and the industrial machinery & supplies & components industries.
◼ Conversely, security selection and an average underweight stance in the consumer discretionary sector weakened return over the period. In particular, positions in the hotels, resorts & cruise lines and the automobile manufacturers industries lagged.
◼ Security selection and an average underweight stance in energy lost ground on a relative basis, specifically in the oil & gas drilling and the oil & gas exploration & production industries.
How is the Fund positioned?
As of October 31, 2023, approximately 66% of our portfolio as a percent of net assets was invested in convertible securities. We believe this allocation will enable our shareholders to take advantage of selective opportunities in the general equity markets. In the long term, we believe patient investors will be rewarded through an allocation to convertibles and select high-yield bonds at current levels that may offer attractive valuations.
We focus on actively managing the risk/reward trade-offs within the portfolio. The characteristics of convertible securities vary: some convertibles are more bond-like, some are more equity-like, and others offer balance. We have maintained a preference for the balanced portion of the convertible market to take advantage
www.calamos.com
43
Calamos Convertible Opportunities and Income Fund (Unaudited)
of recent equity-valuation resets. Balanced convertibles provide a favorable asymmetric payoff profile by offering an attractive level of upside equity participation with less exposure to downside moves. We also see opportunities in the bond-like segment of the convertible market in issues that can benefit from spread compression while offering attractive yields and sound structural risk mitigation during equity market weakness. Within this segment of the convertible market, most issuers retain substantial cash balances along with minimal near-term refinancing risk. We are selective in the group's most distressed names.
The market's reaction to the November Fed meeting has driven Treasury yields further from the Fed's forward rate path expectations. However, Chair Powell noted multiple times that the dot plots released quarterly should only be viewed as snapshots in time that loses applicability with each incoming data point. Futures markets now indicate four rate cuts will occur in 2024, down from the five cuts the market had priced in at the midyear point. We have been gradually increasing portfolio durations in expectation of peak-Fed policy rates and a greater likelihood that the next rate move will be a cut. As of October 31, 2023, the average duration was 2.6 years.
From a sector standpoint, the portfolio's largest absolute weights are in information technology and consumer discretionary, while the smallest sector weights with holdings are in real estate and consumer staples. We maintain relative overweight positions in health care and information technology, with health care equipment (in health care) and semiconductors (in information technology) among the overweight industries. The largest industry underweight positions are asset management & custody banks (in financials) and communications equipment (in information technology).
Allocations to financials and consumer discretionary rose during the period, with increased weights in transaction & payment processing services and broadline retail. The information technology allocation decreased during the period with a reduction in semiconductors, while the weight to utilities also decreased modestly, with a paring back of independent power producers and energy traders.
We continue to hold our largest rated-bond allocations in the BB tier. We believe this exposure offers investors a better risk/reward dynamic while providing regular income. The average credit quality of the portfolio of rated bonds (BB) is higher than that of the ICE BofA All US Convertibles Index. This is typical for the Fund because our credit process tends to guide us away from the most speculative corporate securities. That said, we do selectively invest in lower-credit securities when we believe the risk/reward dynamics favor investors. We continue to find value in out-of-benchmark positions in leveraged loans and investment-grade credit.
Although the Fund tends to be US-centric because of the compelling risk/reward of investments, we are investing in global businesses that seek the best opportunities worldwide and diversify their revenue streams. Overall, we believe our companies are performing well fundamentally, earning attractive cash flow margins, improving their credit profiles, and utilizing reasonable debt levels to fund their operations.
What are your closing thoughts for Fund shareholders?
Volatility has historically created opportunity in the convertible asset class. Any stabilization of the macro backdrop could shift narrow, larger-cap-driven S&P 500 leadership into broader strength, which we believe would benefit convertibles since many issuers lean toward more mid-cap, growth-oriented companies. Should
CALAMOS CLOSED-END FAMILY OF FUNDS ANNUAL REPORT
44
Calamos Convertible Opportunities and Income Fund (Unaudited)
the market continue to prove challenging, convertibles are situated near their bond floor and would be expected to provide defensive attributes.
Convertible new issuance was subdued in 2022 but has improved in 2023 with higher coupons and lower conversion premiums that are more favorable to investors. So far in 2023, global convertible issuance totaled $65.1 billion, surpassing the $39.6 billion in 2022. We've also been encouraged to see more investment-grade companies issue convertibles. We remain optimistic about issuance prospects and believe the pace will continue to be strong as companies increasingly recognize the lower-borrowing-cost benefits of issuing convertibles in lieu of traditional bonds. The combination of a sizable amount of debt maturing in 2025 across bond markets and the Fed's higher-for-longer interest rate stance could accelerate near-term issuance. Increased issuance should broaden the convertible market landscape and the number of investable opportunities.
Although progress may have changed direction, aggregate leverage and interest coverage continue to look healthy from our perspective. We will monitor the situation closely to determine if a new trend toward weakness is emerging or if results are becoming more volatile as instability in input prices, labor costs, and consumer behavior impact outcomes. Credit spreads in both the investment-grade and high-yield markets have widened slightly as strong balance sheets and technicals have offset the growing suspicion that results in coming quarters will be weaker.
We agree that monetary policy is currently restrictive, as evidenced by trailing 12-month inflation (core PCE) below the fed funds effective rate and real yields on Treasury Inflation Protected Securities well above 2% across the maturity spectrum. We expect future months and quarters to show a drop in consumer and business investment as a reduction in disposable income through higher borrowing costs rolls into more areas of economic activity. We are squarely in the "impatiently waiting" phase, looking to ascertain how much economic momentum will be lost from past policy changes. There is still a high level of uncertainty concerning potential economic outcomes, and a recession cannot be dismissed.
A Note About Your Fund's Portfolio Management Team. Mr. Chuck Carmody, CFA, was named Co-Portfolio Manager of the Fund in December 2023. He joined Calamos in 2004. Since 2022, he has served as Senior Vice President, Co-Portfolio Manager of Calamos Advisors. Previously, in 2016, he was named Vice President, Co-Portfolio Manager, as well as Senior Trader, High Yield, Calamos Advisors. From 2010 to 2016, he held other senior fixed income trading roles at the firm. The Fund's Prospectus contains information relating to the other portfolio managers, as well as Calamos Advisors' "team of teams" approach to portfolio management. The Fund's Statement of Additional Information provides additional information about the Portfolio Managers' compensation, other accounts managed by the Portfolio Managers, and the Portfolio Managers' ownership of securities in the Fund.
www.calamos.com
45
Calamos Convertible Opportunities and Income Fund (CHI) (Unaudited)
INVESTMENT OBJECTIVE AND STRATEGIES
Investment Objective
The Fund's investment objective is to provide total return through a combination of capital appreciation and current income.
Principal Investment Strategies
Under normal circumstances, the Fund invests at least 80% of its managed assets in a diversified portfolio of convertible securities and non-convertible income securities.* The portion of the Fund's assets invested in convertible securities and non-convertible income securities will vary from time to time consistent with the Fund's investment objective, changes in equity prices and changes in interest rates and other economic and market factors, although, under normal circumstances, the Fund will invest at least 35% of its managed assets in convertible securities.
The Fund invests in securities with a broad range of maturities. The average term to maturity of the Fund's securities typically will range from two to ten years. "Managed assets" means the Fund's total assets (including any assets attributable to any leverage that may be outstanding) minus total liabilities (other than debt representing financial leverage).
The Fund is not limited in the percentage of its assets invested in convertible securities, and investment in convertible securities forms an important part of the Fund's principal investment strategies.
A convertible security is a debt security, debenture, note or preferred stock that is exchangeable for an equity security (typically common stock of the same issuer) at a predetermined price (the "conversion price"). Depending upon the relationship of the conversion price to the market value of the underlying security, a convertible security may trade more like an equity security than a debt instrument. The Fund may invest in convertible securities of any rating.
The Fund may invest in "synthetic" convertible instruments. A synthetic convertible instrument is a financial instrument (or two or more securities held in tandem) that is designed to simulate the economic characteristics of another instrument (i.e., a convertible security) through the combined economic features of a collection of other securities or assets. Calamos may create a synthetic convertible instrument by combining separate securities that possess the two principal characteristics of a true convertible security, i.e., a fixed-income security ("fixed-income component", which may be a convertible or non-convertible security) and the right to acquire an equity security ("convertible component"). The fixed-income component is achieved by investing in fixed-income securities such as bonds, preferred stocks and money market instruments. The convertible component is achieved by investing in warrants or options to buy common stock at a certain exercise price, or options on a stock index. The fixed income and convertible components may have different issuers, and either component may change at any time.
The Fund may also invest in synthetic convertible instruments created by third parties, typically investment banks. Synthetic convertible instruments created by such parties may be designed to simulate the characteristics of traditional convertible securities or may be designed to alter or emphasize a particular feature. Synthetic convertible instruments may include structured notes, equity-linked notes, mandatory convertibles and combinations of securities and instruments, such as a debt instrument combined with a forward contract. The Fund's holdings of synthetic convertible instruments are considered convertible securities for purposes of the Fund's policy to invest at least 35% of its managed assets in convertible securities and 80% of its managed assets in a diversified portfolio of convertible securities and non-convertible income securities.
The Fund will also invest in non-convertible income securities. The Fund's investments in non-convertible income securities may have fixed or variable principal payments and all types of interest rate and dividend payment and reset terms, including fixed rate, adjustable rate, zero coupon, contingent, deferred, payment in kind and auction rate features.
A substantial portion of the Fund's assets may be invested in below investment grade (high yield, high risk) securities for either current income or capital appreciation or both. These securities are rated Ba or lower by Moody's Investors Service, Inc. or BB or lower by Standard & Poor's Financial Services, LLC, a subsidiary of The McGraw-Hill Companies, Inc. or are unrated securities of comparable quality as determined by Calamos, the Fund's investment adviser. The Fund may invest in high yield securities of any rating. The Fund may, but currently does not intend to, invest up to 5% of its managed assets in distressed securities that are in default or the issuers of which are in bankruptcy.
* This is a non-fundamental policy and may be changed by the Board of Trustees of the Fund provided that shareholders are provided with at least 60 days' prior written notice of any change as required by the rules under the 1940 Act.
CALAMOS CLOSED-END FAMILY OF FUNDS ANNUAL REPORT
46
Calamos Convertible Opportunities and Income Fund (CHI) (Unaudited)
Although the Fund primarily invests in securities of US issuers, the Fund may invest up to 25% of its net assets in securities of foreign issuers in developed and emerging markets, including debt and equity securities of corporate issuers and debt securities of government issuers.
The Fund may seek to generate income from option premiums by writing (selling) options. The Fund may write (sell) call options (i) on a portion of the equity securities (including equity securities obtainable by the Fund through the exercise of its rights with respect to convertible securities it owns) in the Fund's portfolio and (ii) on broad-based securities indices (such as the Standard and Poor's 500® Index ("S&P 500") or the MSCI EAFE® Index ("MSCI EAFE"), which is an index of international equity stocks) or certain ETFs (exchange traded funds) that trade like common stocks but seek to replicate such market indices. In addition, to seek to offset some of the risk of a potential decline in value of certain long positions, the Fund may also purchase put options on individual securities, broad-based securities indices (such as the S&P 500 or the MSCI EAFE), or certain ETFs that trade like common stocks but seek to replicate such market indices.
The Fund may invest without limit in certain securities ("Rule 144A Securities"), such as convertible and debt securities, that are typically purchased in transactions exempt from the registration requirements of the 1933 Act pursuant to Rule 144A under that Act. Under the supervision and oversight of the Fund's Board of Trustees, Calamos will determine whether Rule 144A Securities are liquid. Typically, the Fund purchases Rule 144A Securities only if Calamos has determined them to be liquid.
The Fund may invest in loan participations and other direct claims against a borrower. The corporate loans in which the Fund may invest primarily consist of direct obligations of a borrower and may include debtor in possession financings pursuant to Chapter 11 of the US Bankruptcy Code, obligations of a borrower issued in connection with a restructuring pursuant to Chapter 11 of the US Bankruptcy Code, leveraged buy-out loans, leveraged recapitalization loans, receivables purchase facilities, and privately placed notes. The Fund may invest in a corporate loan at origination as a co-lender or by acquiring in the secondary market participations in, assignments of or novations of a corporate loan. Many such loans are secured, although some may be unsecured. Such loans may be in default at the time of purchase. In addition, loan participations involve a risk of insolvency of the lending bank or other financial intermediary. The markets in such loans are not regulated by federal securities laws or the Commission.
The Fund may invest in other securities of various types to the extent consistent with its investment objective. Normally, the Fund invests substantially all of its assets to meet its investment objective. For temporary defensive purposes, the Fund may depart from its principal investment strategies and invest part or all of its assets in securities with remaining maturities of less than one year or cash equivalents; or it may hold cash. During such periods, the Fund may not be able to achieve its investment objective. There are no restrictions as to the ratings of debt securities acquired by the Fund or the portion of the Fund's assets that may be invested in debt securities in a particular ratings category.
The Fund currently uses, and may in the future use, financial leverage. The Fund has obtained financial leverage (i) under an Amended and Restated Liquidity Agreement with State Street Bank and Trust Company that allows the Fund to borrow up to $430 million and (ii) through the issuance of four series of Mandatory Redeemable Preferred Shares ("MRPS" or "MRP Shares") with an aggregate liquidation preference of $133.0 million.
www.calamos.com
47
Calamos Convertible and High Income Fund (Unaudited)
TOTAL RETURN*
Common Shares – Inception 5/28/03
1 Year | Since Inception** | ||||||||||
On Market Price | 10.32 | % | 8.19 | % | |||||||
On NAV | -1.99 | % | 7.72 | % | |||||||
*Total return measures net investment income and net realized gain or loss from Fund investments, and change in net unrealized appreciation and depreciation, assuming reinvestment of income and net realized gains distributions.
**Annualized since inception.
SECTOR WEIGHTINGS
Information Technology | 21.6 | % | |||||
Consumer Discretionary | 18.6 | ||||||
Health Care | 15.9 | ||||||
Industrials | 9.7 | ||||||
Communication Services | 9.0 | ||||||
Financials | 7.0 | ||||||
Energy | 5.9 | ||||||
Utilities | 3.4 | ||||||
Materials | 3.0 | ||||||
Consumer Staples | 1.9 | ||||||
Real Estate | 0.7 | ||||||
Airlines | 0.6 | ||||||
Special Purpose Acquisition Companies | 0.4 | ||||||
Sector weightings are based on managed assets and may vary over time. Sector Weightings exclude any government/sovereign bonds or options on broad market indexes the Fund may hold.
CALAMOS CONVERTIBLE AND HIGH INCOME FUND
INVESTMENT TEAM DISCUSSION
Please discuss the Fund's strategy and role within an asset allocation.
Calamos Convertible and High Income Fund (CHY) is an enhanced fixed-income offering that seeks total return through capital appreciation and current income. It provides an alternative to funds investing exclusively in investment-grade fixed-income instruments and seeks to be less sensitive to interest rates. Like all Calamos closed-end funds, the Fund seeks to provide a steady stream of distributions paid out monthly and invests in multiple asset classes that may be reweighted in an effort to optimize returns.
The Fund invests in a diversified portfolio of convertible and high-yield securities. The allocation to each asset class is dynamic and reflects our view of the economic landscape and the potential of individual securities. By utilizing these asset classes in combination, we believe the Fund is well positioned to generate capital gains and income. The broader range of security types also provides increased opportunities to manage the portfolio's risk/reward characteristics over full market cycles.
We seek companies with respectable balance sheets, reliable debt servicing, and good prospects for sustainable growth. Although we invest primarily in securities of US issuers, we favor companies that actively participate in globalization with geographically diversified revenue streams and global-scale business strategies.
Given the heightened market volatility, we prefer convertibles with balanced risk/reward attributes while maintaining an underweight to the most equity-sensitive convertibles, which generally lack favorable downside risk mitigation.
How did the Fund perform over the annual period?
The Fund returned -1.99% on a net asset value (NAV) basis and 10.32% on a market price basis for the twelve months ended October 31, 2023 ("annual period"), versus 2.88% for the comparator Index comprising 50% ICE BofA All US Convertibles Index and 50% Bloomberg US Corporate High Yield 2% Issuer Capped Index for the same period. At the end of the reporting period, the Fund's shares traded at a 14.54% premium to NAV.
How do NAV and market price returns differ?
Closed-end funds trade on exchanges, where factors other than the value of the underlying securities might drive the price of shares or market price. For example, general market sentiment or future expectations might influence the market price. A fund's NAV return measures the actual return of the individual securities in the portfolio, less fund expenses. It also measures how a manager was able to capitalize on market opportunities. Because we believe closed-end funds are best utilized long term within asset allocations, we deem that the NAV return is the better measure of a fund's performance. However, when managing our Fund, we strongly consider actions and policies to optimize its overall price performance and returns based on market value.
CALAMOS CLOSED-END FAMILY OF FUNDS ANNUAL REPORT
48
Calamos Convertible and High Income Fund (Unaudited)
SINCE INCEPTION MARKET PRICE AND NAV HISTORY THROUGH 10/31/23
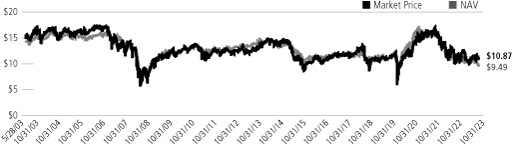
Performance data quoted represents past performance, which is no guarantee of future results. Current performance may be lower or higher than the performance quoted. The principal value of an investment will fluctuate so that your shares, when sold, may be worth more or less than their original cost. Returns at NAV reflect the deduction of the Fund's management fee, debt leverage costs and all other applicable fees and expenses. You can obtain performance data current to the most recent month end by visiting www.calamos.com.
Please discuss the Fund's distributions during the annual period.
We employ a managed distribution policy within this Fund with the goal of providing shareholders with a consistent distribution stream. At the end of the period, the Fund's monthly distribution rate was $0.1000 per share, and the annualized distribution rate on the Fund's market price was 11.04%.
We believe the Fund's distribution rate and level remained attractive and competitive despite rising yields in financial assets. For example, as of October 31, 2023, the dividend yield of S&P 500 Index stocks averaged 1.68%. Yields were also relatively low within the US government bond market, with the 10-year US Treasury yielding 4.88%.
What factors influenced performance over the annual period?
On an unleveraged basis, our convertible bond holdings performed in line with the ICE BofA All US Convertibles Index. Holdings in the information technology and industrials sectors were helpful to performance, whereas our holdings in financials and energy were not.
During the annual period, investors focused on the Federal Reserve's response to persistent inflation and the potential for a recession. Geopolitical concerns, regional bank stress, rising fuel prices, and potential impacts of the United Auto Workers strike also made headlines and induced volatility. Despite these headwinds, the equity market began to recover from 2022's lows, and the S&P 500 Index returned 10.14% over the period. However, the higher-for-longer interest rate environment stoked volatility in the bond market, and the Bloomberg US Aggregate Bond Index rose just 0.36%.
The convertible market is well represented by small and mid-sized growth issuers, which lagged the broader equity market as evidenced by the Russell 2500 Growth Index's -4.80% return. More than half of the convertible market was priced below par on average during the reporting period, and convertibles (-0.48%) held up much better than their underlying stocks (-8.2%).
ASSET ALLOCATION AS OF 10/31/23
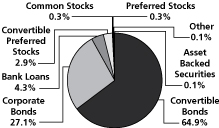
Fund asset allocations are based on total investments and may vary over time.
www.calamos.com
49
Calamos Convertible and High Income Fund (Unaudited)
Our high-yield bond holdings slightly underperformed relative to the Bloomberg US High Yield 2% Issuer Capped Index. Our selection in the energy and financials sectors contributed to results, while our selection in the communication services and consumer discretionary sectors trailed.
High-yield spreads were modestly tighter, closing at 437 basis points on an option-adjusted basis, down from 464 in the prior year. Despite the perceived stability, the trading range for spreads during the period was 150 basis points wide, reflecting the volatility across markets. Lower quality outperformed as CCCs returned 7.4%, B-rated paper returned 6.8%, and more rate-sensitive BBs returned 5.3%. After increasing for most of the year, trailing 12-month defaults came in at 2.6% on a par-weighted basis. We expect this measure to climb and close the 2023 calendar year near the 3.0% average of the post-GFC era. The best-performing sectors in the Bloomberg US High Yield 2% Issuer Capped Index were finance companies (+10.9%), consumer cyclicals (+10.2%), and brokers and asset managers (+3.5), whereas communications (+0.8%), electric utilities (+3.1%), and transportation (+3.3%) represented the laggards.
Other factors that contributed and detracted from Fund performance included the following:
◼ On an unleveraged basis, the portfolio underperformed the comparator index. Our relative overweight in convertibles and underweight in corporate bonds relative to the index hindered performance.
◼ Our use of put options was beneficial relative to the comparator index.
◼ Our selection of corporate bonds was not helpful to returns.
◼ The Fund benefited from leading security selection and an average overweight stance in information technology, specifically in the data processing & outsourced services and the communications equipment industries.
◼ Security selection and an average underweight stance in industrials contributed to performance, specifically in the electrical components & equipment and the industrial machinery & supplies & components industries.
◼ Conversely, security selection and an average underweight stance within the consumer discretionary sector weakened return over the period. In particular, positions in the hotels, resorts & cruise lines industry and automobile manufacturers lagged.
◼ Security selection and an average underweight stance in energy lost ground on a relative basis, specifically in the oil & gas drilling and the oil & gas exploration & production industries.
How is the Fund positioned?
As of October 31, 2023, approximately 66% of our portfolio as a percent of net assets was invested in convertible securities. We believe this allocation will enable our shareholders to take advantage of selective opportunities in the general equity markets. In the long term, we think patient investors will be rewarded through an allocation to convertibles and select high-yield bonds at current levels that may offer attractive valuations.
We focus on actively managing the risk/reward trade-offs within the portfolio. The characteristics of convertible securities vary: some convertibles are more bond-like, some are more equity-like, and others offer balance. We have maintained a
CALAMOS CLOSED-END FAMILY OF FUNDS ANNUAL REPORT
50
Calamos Convertible and High Income Fund (Unaudited)
preference for the balanced portion of the convertible market to take advantage of recent equity-valuation resets. Balanced convertibles provide a favorable asymmetric payoff profile by offering an attractive level of upside equity participation with less exposure to downside moves. We also see opportunities in the bond-like segment of the convertible market in issues that can benefit from spread compression while offering attractive yields and sound structural risk mitigation during equity market weakness. Within this segment of the convertible market, most issuers retain substantial cash balances along with minimal near-term refinancing risk. We are selective in the group's most distressed names.
The market's reaction to the November Fed meeting has driven Treasury yields further from the Fed's forward rate path expectations. However, Powell noted multiple times that the dot plots released quarterly should only be viewed as a snapshot in time that loses applicability with each incoming data point. Futures markets now indicate four rate cuts will occur in 2024, down from the five cuts the market had priced in at the midyear point. We have been gradually increasing portfolio durations in expectation of peak-Fed policy rates and a greater likelihood that the next rate move will be a cut. As of October 31, 2023, the average duration was 2.6 years.
From a sector standpoint, the portfolio's largest absolute weights are in information technology and health care, while the smallest sector weights with holdings are in real estate and consumer staples. We maintain relative overweight positions in health care and information technology, with health care equipment (in health care) and semiconductors (in information technology) among the overweight industries. The largest industry underweight positions are asset management & custody banks and communications equipment.
Allocations to financials and consumer discretionary rose during the period, with increased weights in transaction & payment processing services and broadline retail. The information technology allocation decreased during the period, with a reduction in semiconductors, while the weight to utilities also decreased modestly, with a paring back in independent power producers and energy traders.
We continue to hold our largest rated bond allocations in the BB tier. We believe this exposure offers investors a better risk/reward dynamic while providing regular income. The average (BB) credit quality of the portfolio's bonds is higher than that of the ICE BofA All US Convertibles Index. This higher relative credit is typical for the Fund because our process tends to guide us away from the most speculative corporate securities. That said, we selectively invest in lower-credit securities when we believe the risk/reward dynamics favor our investors. We continue to find value in out-of-benchmark positions in leveraged loans and investment-grade credit.
Although the Fund tends to be US-centric because of the compelling risk/reward of investments, we invest in global businesses that seek the best opportunities worldwide and diversify their revenue streams. Overall, we believe our companies are performing well fundamentally, earning attractive cash flow margins, improving their credit profiles, and utilizing reasonable debt levels to fund their operations.
From a credit-quality perspective, the Fund is positioned with a relative underweight in the BB category and a corresponding overweight in out-of-benchmark BBB-rated issuers. We continue to find value in out-of-benchmark positions in leveraged loans and investment-grade credit.
www.calamos.com
51
Calamos Convertible and High Income Fund (Unaudited)
A Note About Your Fund's Portfolio Management Team. Mr. Chuck Carmody, CFA, was named Co-Portfolio Manager of the Fund in December 2023. He joined Calamos in 2004. Since 2022, he has served as Senior Vice President, Co-Portfolio Manager of Calamos Advisors. Previously, in 2016, he was named Vice President, Co-Portfolio Manager, as well as Senior Trader, High Yield, Calamos Advisors. From 2010 to 2016, he held other senior fixed income trading roles at the firm. The Fund's Prospectus contains information relating to the other portfolio managers, as well as Calamos Advisors' "team of teams" approach to portfolio management. The Fund's Statement of Additional Information provides additional information about the Portfolio Managers' compensation, other accounts managed by the Portfolio Managers, and the Portfolio Managers' ownership of securities in the Fund.
What are your closing thoughts for Fund shareholders?
Volatility has historically created opportunity in the convertible asset class. Any stabilization of the macro backdrop could shift narrow, larger-cap-driven S&P 500 leadership into broader strength, which we believe would benefit convertibles since many issuers lean toward more mid-cap, growth-oriented companies.
Should the market continue to prove challenging, convertibles are situated near their bond floor and would be expected to provide defensive attributes.
Convertible new issuance was subdued in 2022 but has improved in 2023 with higher coupons and lower conversion premiums that are more favorable to investors. So far in 2023, global convertible issuance totaled $65.1 billion, surpassing the $39.6 billion in 2022. We've also been encouraged to see more investment-grade companies issue convertibles. We remain optimistic about issuance prospects and believe the pace will continue to be strong as companies increasingly recognize the lower-borrowing-cost benefits of issuing convertibles in lieu of traditional bonds. The combination of a sizable amount of debt maturing in 2025 across bond markets and the Fed's higher-for-longer interest rate stance could accelerate near-term issuance. Increased issuance should broaden the convertible market landscape and the number of investable opportunities.
Although progress may have changed direction, aggregate leverage and interest coverage continue to look healthy from our perspective. We will monitor the situation closely to determine if a new trend toward weakness is emerging or if results are becoming more volatile as instability in input prices, labor costs, and consumer behavior impact outcomes. Credit spreads in investment-grade and high-yield markets have widened slightly as strong balance sheets and technicals have offset the growing suspicion that results in coming quarters will be weaker.
We agree that monetary policy is currently restrictive, as evidenced by trailing 12-month inflation (core PCE) below the fed funds effective rate and real yields on Treasury Inflation Protected Securities well above 2% across the maturity spectrum. We expect future months and quarters to show a drop in consumer and business investment as a reduction in disposable income through higher borrowing costs rolls into more areas of economic activity. We are squarely in the "impatiently waiting" phase, looking to ascertain how much economic momentum will be lost from past policy changes. There is still a high level of uncertainty concerning potential economic outcomes, and a recession cannot be dismissed.
CALAMOS CLOSED-END FAMILY OF FUNDS ANNUAL REPORT
52
Calamos Convertible and High Income Fund (CHY) (Unaudited)
INVESTMENT OBJECTIVE AND STRATEGY
Investment Objective
The Fund's investment objective is to provide total return through a combination of capital appreciation and current income.
Principal Investment Strategies
Under normal circumstances, the Fund invests at least 80% of its managed assets in a diversified portfolio of convertible securities and below investment grade (high yield/high risk) non-convertible debt securities.* The portion of the Fund's assets invested in convertible securities and below investment grade (high yield/high risk) non-convertible debt securities will vary from time to time consistent with the Fund's investment objective, changes in equity prices and changes in interest rates and other economic and market factors, although, under normal circumstances, the Fund will invest at least 20% of its managed assets in convertible securities and at least 20% of its managed assets in below investment grade (high yield/high risk) non-convertible debt securities (so long as, under normal circumstances, the combined total equals at least 80% of the Fund's managed assets).
The Fund invests in securities with a broad range of maturities. The average term to maturity of the Fund's securities typically will range from two to ten years. "Managed assets" means the Fund's total assets (including any assets attributable to any leverage that may be outstanding) minus total liabilities (other than debt representing financial leverage).
The Fund's derivative activities are principally focused on the following derivatives: interest rate swaps, convertible securities, synthetic convertible instruments, options on individual securities, index options and forward currency exchange contracts. However, the Fund reserves the right to invest in other derivative instruments to the extent it is consistent with the Fund's investment objective and restrictions.
Investment in convertible securities forms an important part of the Fund's principal investment strategies. Under normal circumstances, the Fund will invest at least 20% of its managed assets in convertible securities. A convertible security is a debt security, debenture, note or preferred stock that is exchangeable for an equity security (typically common stock of the same issuer) at a predetermined price (the "conversion price"). Depending upon the relationship of the conversion price to the market value of the underlying security, a convertible security may trade more like an equity security than a debt instrument. The Fund may invest in convertible securities of any rating.
The Fund may invest in "synthetic" convertible instruments. A synthetic convertible instrument is a financial instrument (or two or more securities held in tandem) that is designed to simulate the economic characteristics of another instrument (i.e., a convertible security) through the combined economic features of a collection of other securities or assets. Calamos may create a synthetic convertible instrument by combining separate securities that possess the two principal characteristics of a true convertible security, i.e., a fixed-income security ("fixed-income component", which may be a convertible or non-convertible security) and the right to acquire an equity security ("convertible component"). The fixed-income component is achieved by investing in fixed-income securities such as bonds, preferred stocks and money market instruments. The convertible
* This is a non-fundamental policy and may be changed by the Board of Trustees of the Fund provided that shareholders are provided with at least 60 days' prior written notice of any change as required by the rules under the 1940 Act.
www.calamos.com
53
Calamos Convertible and High Income Fund (CHY) (Unaudited)
component is achieved by investing in warrants or options to buy common stock at a certain exercise price, or options on a stock index. The fixed income and convertible components may have different issuers, and either component may change at any time.
The Fund may also invest in synthetic convertible instruments created by third parties, typically investment banks. Synthetic convertible instruments created by such parties may be designed to simulate the characteristics of traditional convertible securities or may be designed to alter or emphasize a particular feature. Synthetic convertible instruments may include structured notes, equity-linked notes, mandatory convertibles and combinations of securities and instruments, such as a debt instrument combined with a forward contract. The Fund's holdings of synthetic convertible instruments are considered convertible securities for purposes of the Fund's policy to invest at least 20% of its managed assets in convertible securities and 80% of its managed assets in a diversified portfolio of convertible securities and below investment grade (high yield/high risk) non-convertible debt securities.
Investment in high yield securities forms an important part of the Fund's principal investment strategies. The Fund will invest in high yield securities for either current income or capital appreciation or both. Under normal circumstances, the Fund will invest at least 20% of its managed assets in high yield non-convertible debt securities. These securities are rated Ba or lower by Moody's Investors Service, Inc. ("Moody's") or BB or lower by Standard & Poor's Financial Services, LLC, a subsidiary of The McGraw-Hill Companies, Inc. ("Standard & Poor's") or are unrated securities of comparable quality as determined by Calamos, the Fund's investment adviser. The Fund may invest in high yield securities of any rating. The Fund may, but currently does not intend to, invest up to 5% of its managed assets in distressed securities that are in default or the issuers of which are in bankruptcy.
Although the Fund primarily invests in securities of US issuers, the Fund may invest up to 25% of its managed assets in securities of foreign issuers in developed and emerging markets, including debt and equity securities of corporate issuers and debt securities of government issuers. The Fund may invest up to 15% of its managed assets in securities of foreign issuers in emerging markets.
The Fund may invest without limit in certain securities ("Rule 144A Securities"), such as convertible and debt securities, that are typically purchased in transactions exempt from the registration requirements of the 1933 Act pursuant to Rule 144A under that Act. Under the supervision and oversight of the Fund's Board of Trustees, Calamos will determine whether Rule 144A Securities are liquid. Typically, the Fund purchases Rule 144A Securities only if Calamos has determined them to be liquid.
The Fund may invest in loan participations and other direct claims against a borrower. The corporate loans in which the Fund may invest primarily consist of direct obligations of a borrower and may include debtor in possession financings pursuant to Chapter 11 of the US Bankruptcy Code, obligations of a borrower issued in connection with a restructuring pursuant to Chapter 11 of the US Bankruptcy Code, leveraged buy-out loans, leveraged recapitalization loans, receivables purchase facilities, and privately placed notes. The Fund may invest in a corporate loan at origination as a co-lender or by acquiring in the secondary market participations in, assignments of or novations of a corporate loan. Many such loans are secured, although some may be unsecured. Such loans may be in default at the time of purchase. In addition, loan participations involve a risk of
CALAMOS CLOSED-END FAMILY OF FUNDS ANNUAL REPORT
54
Calamos Convertible and High Income Fund (CHY) (Unaudited)
insolvency of the lending bank or other financial intermediary. The markets in such loans are not regulated by federal securities laws or the Commission.
The Fund may seek to generate income from option premiums by writing (selling) options. The Fund may write (sell) call options (i) on a portion of the equity securities (including equity securities obtainable by the Fund through the exercise of its rights with respect to convertible securities it owns) in the Fund's portfolio and (ii) on broad-based securities indices (such as the Standard and Poor's 500® Index ("S&P 500") or the MSCI EAFE® Index ("MSCI EAFE"), which is an index of international equity stocks) or certain ETFs (exchange traded funds) that trade like common stocks but seek to replicate such market indices.
In addition, to seek to offset some of the risk of a potential decline in value of certain long positions, the Fund may also purchase put options on individual securities, broad-based securities indices (such as the S&P 500 or MSCI EAFE) or certain ETFs that trade like common stocks but seek to replicate market indices.
The Fund may invest up to 10% of its managed assets in the equity securities (including common units) of master limited partnerships ("MLPs"). Convertible securities are excluded from this limitation. MLPs are investment vehicles generally organized under state law as limited partnerships or limited liability companies. MLPs typically issue general partner and limited partner interests, or managing member and member interests, and MLP-issued securities are often listed and traded on a securities exchange. Such securities are structured by contract and may incorporate both equity-like and debt-like components. The general partner or manager of the MLP generally controls the operation and management of the MLP, and typically is eligible for certain incentive distributions under the terms of the MLP. The Fund will not typically invest in general partner or manager interests of MLPs. Limited partner or member interests in MLPs may have either preferred or subordinated rights to MLP assets and distributions.
The Fund may invest in securities of real estate investment trusts ("REITs"), including debt securities they may issue. REITs primarily invest in income-producing real estate or real estate related loans or interests. REITs are generally classified as equity REITs, mortgage REITs or a combination of equity and mortgage REITs. Equity REITs invest the majority of their assets directly in real property and derive income primarily from the collection of rents. Equity REITs can also realize capital gains by selling properties that have appreciated in value. Mortgage REITs invest the majority of their assets in real estate mortgages and derive income from the collection of interest payments. REITs are not taxed on income distributed to shareholders provided they comply with the applicable requirements of the Internal Revenue Code of 1986, as amended (the "Code"). The Fund will indirectly bear its proportionate share of any management and other expenses paid by REITs in which it invests in addition to the expenses paid by the Fund. Debt securities issued by REITs are, for the most part, general and unsecured obligations and are subject to risks associated with REITs.
The Fund may invest in other securities of various types to the extent consistent with its investment objective. Normally, the Fund invests substantially all of its assets to meet its investment objective. For temporary defensive purposes, the Fund may depart from its principal investment strategies and invest part or all of its assets in securities with remaining maturities of less than one year or cash equivalents; or it may hold cash. During such periods, the Fund may not be able to achieve its investment objective. There are no restrictions as to the ratings of
www.calamos.com
55
Calamos Convertible and High Income Fund (CHY) (Unaudited)
debt securities acquired by the Fund or the portion of the Fund's assets that may be invested in debt securities in a particular ratings category.
The Fund currently uses, and may in the future use, financial leverage. The Fund has obtained financial leverage (i) under an Amended and Restated Liquidity Agreement with State Street Bank and Trust Company that allows the Fund to borrow up to $480 million and (ii) through the issuance of four series of Mandatory Redeemable Preferred Shares ("MRPS" or "MRP Shares") with an aggregate liquidation preference of $145 million.
CALAMOS CLOSED-END FAMILY OF FUNDS ANNUAL REPORT
56
Calamos Strategic Total Return Fund (Unaudited)
CALAMOS STRATEGIC TOTAL RETURN FUND
INVESTMENT TEAM DISCUSSION
Please discuss the Fund's strategy and role within an asset allocation.
Calamos Strategic Total Return Fund (CSQ) is a total-return-oriented offering that seeks to provide a steady stream of income paid out monthly. We invest in a diversified portfolio of equities, convertible securities and high-yield bonds. The allocation to each asset class is dynamic and reflects our view of the economic landscape and the potential of individual securities to contribute to the portfolio. By using the asset classes in combination, we believe the Fund can be optimally positioned to generate capital gains and income over the long term. This broader range of security types also provides us with increased opportunities to manage the risk and reward characteristics of the portfolio over full market cycles. Through this approach, we seek to offer investors an attractive monthly distribution and equity participation.
While we are often more heavily weighted in the securities of US issuers, we favor companies actively participating in globalization with geographically diversified revenue streams and global business strategies. We emphasize companies we believe offer reliable debt servicing, respectable balance sheets, solid free cash flow, and good prospects for sustainable growth. Those profitable companies should be more resilient to inflationary pressures and rising interest rates.
How did the Fund perform over the annual period?
The Fund returned 7.94% on a net asset value (NAV) basis and 1.84% on a market price basis for the 12 months ended October 31, 2023 ("annual period") versus a return of 6.59% for a comparator index comprising 50% S&P 500 Index, 25% ICE BofA All US Convertibles Index and 25% Bloomberg US Corporate High Yield 2% Issuer Capped Index over the same period. At the end of the reporting period, the Fund's shares traded at a -4.33% discount to NAV.
How do NAV and market price returns differ?
Closed-end funds trade on exchanges, where factors other than the value of the underlying securities might drive the price of shares or market price. For example, the market price might be influenced by general market sentiment or future expectations. A fund's NAV return measures the actual return of the individual securities in the portfolio, less fund expenses. It also measures how a manager was able to capitalize on market opportunities. Because we believe closed-end funds are best utilized long term within asset allocations, we deem that the NAV return is the better measure of a fund's performance. However, when managing our Fund, we strongly consider actions and policies that will optimize its overall price performance and returns based on market value.
TOTAL RETURN*
Common Shares – Inception 3/26/04
1 Year | Since Inception** | ||||||||||
On Market Price | 1.80 | % | 7.89 | % | |||||||
On NAV | 7.89 | % | 8.39 | % | |||||||
*Total return measures net investment income and net realized gain or loss from Fund investments, and change in net unrealized appreciation or depreciation, assuming reinvestment of income and net realized gains distributions.
**Annualized since inception.
SECTOR WEIGHTINGS
Information Technology | 22.5 | % | |||||
Consumer Discretionary | 13.0 | ||||||
Financials | 12.0 | ||||||
Health Care | 11.5 | ||||||
Communication Services | 9.7 | ||||||
Industrials | 8.6 | ||||||
Energy | 5.8 | ||||||
Consumer Staples | 5.0 | ||||||
Utilities | 2.9 | ||||||
Materials | 2.7 | ||||||
Real Estate | 1.6 | ||||||
Airlines | 0.3 | ||||||
Special Purpose Acquisition Companies | 0.1 | ||||||
Other | 0.1 | ||||||
Sector weightings are based on managed assets and may vary over time. Sector Weightings exclude any government/sovereign bonds or options on broad market indexes the Fund may hold.
www.calamos.com
57
Calamos Strategic Total Return Fund (Unaudited)
ASSET ALLOCATION AS OF 10/31/23
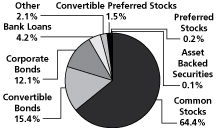
Fund asset allocations are based on total investments and may vary over time.
SINCE INCEPTION MARKET PRICE AND NAV HISTORY THROUGH 10/31/23
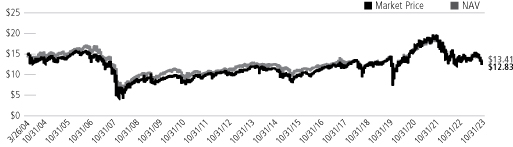
Performance data quoted represents past performance, which is no guarantee of future results. Current performance may be lower or higher than the performance quoted. The principal value of an investment will fluctuate so that your shares, when sold, may be worth more or less than their original cost. Returns at NAV reflect the deduction of the Fund's management fee, debt leverage costs and all other applicable fees and expenses. You can obtain performance data current to the most recent month end by visiting www.calamos.com.
Please discuss the Fund's distributions during the reporting period.
We employ a managed distribution policy within this Fund with the goal of providing shareholders with a consistent distribution stream. The Fund's monthly distribution rate on October 31, 2023, was $0.1025 per share, and its annualized distribution rate based on market price was 9.59%.
We believe the Fund's distribution rate and level remained attractive and competitive because yield opportunities are limited in much of the marketplace despite recent Fed tightening. For example, as of October 31, 2023, the dividend yield of S&P 500 Index stocks was 1.68%. Although higher than a year ago, yields within the US government bond market were relatively low, with the 10-year US Treasury yielding 4.88%.
What factors influenced performance over the annual period?
Equity markets rallied over the course of the period, lifting off lows from the market sell-off that began in late 2021 when the Fed and central bankers around the world began raising interest rates in an effort to tackle inflation. The Fed hiked the fed funds rate in historically short order (300 basis points in approximately six months), and the broad market, not surprisingly, did not react favorably, falling by -24% from late December 2021 through early October 2022. At the onset of this annual period, investors were pleased to see data suggesting that inflation had likely peaked, which many believed would allow the Fed to slow down its furious pace of interest rate hikes.
Cyclical stocks and beleaguered value stocks led the market in the initial months of the reporting period, but that leadership was short-lived as the Fed continued to promote a hawkish narrative. During these 12 months, the Fed would raise rates an additional 225 basis points. In March 2023, two of the largest bank failures in history, Silicon Valley Bank and Credit Suisse, sent investors flocking to the large-cap growth stocks of companies with significant balance sheets and ties to AI (artificial intelligence). Toward the end of the period, investors continued to grapple with questions of whether the Fed could induce a soft landing for the US economy while reining in inflation or whether a recession would result from the significant change in the cost of capital. Geopolitical risks increased with the onset of conflict between Hamas and Israel in October 2023. Those cumulative concerns weighed on the markets, with the S&P 500 Index, a measure of the US equity market, declining by -10% toward the end of the annual period.
CALAMOS CLOSED-END FAMILY OF FUNDS ANNUAL REPORT
58
Calamos Strategic Total Return Fund (Unaudited)
For the annual period, the US equity market, as represented by the S&P 500 Index, gained 10.14%, although it should be noted that an equal-weighted S&P 500 Index went nowhere on the year, with a total return of -0.75%. Small-cap stocks, represented by the Russell 2000 Index, dropped -8.57% for the annual period, and mid-cap stocks, as measured by the Russell Midcap Index, also struggled with a -1.01% return. Mega-cap growth stocks performed best and carried the bulk of the overall S&P 500 Index's return, particularly those tied to AI with solid balance sheets (and perhaps less concerned about borrowing from banks or raising capital in a higher-interest-rate environment). The top eight names in the S&P 500 Index by market cap, representing approximately 26% of the index's market cap, are primarily tech-related, stronger-balance-sheet companies, accounting for 85% of the market's gain over the period.
Within the S&P 500 Index, communication services (+36%) and information technology (+31%) were significant outperformers led by mega-cap growth names and were the only two sectors to beat the overall market. Consumer discretionary (+8%), industrials (+6%), and materials (+5%) delivered positive returns, but all other sectors finished in negative territory for the reporting period. Energy (-2%), financials (-3%), consumer staples (-3%), health care (-5%), real estate (-7%), and utilities (-8%) rounded out performance by sector.
The convertible market is well represented by small and mid-sized growth issuers, which lagged the broader equity market as evidenced by the Russell 2500 Growth Index's -4.80% return. More than half of the convertible market was priced below par on average during the reporting period, and convertibles (-0.48%) held up much better than their underlying stocks (-8.2%).
High yield spreads were modestly tighter, closing at 437 basis points on an option-adjusted basis, down from 464 in the prior year. Despite the perceived stability, the trading range for spreads during the period was 150 basis points wide, reflecting the volatility across markets. Lower quality outperformed as CCCs returned 7.4%, B-rated paper returned 6.8%, and more rate-sensitive BBs returned 5.3%.
Other factors that contributed and detracted from Fund performance included the following:
◼ On an unleveraged basis, the portfolio slightly outperformed the comparator index during the period.
◼ Our overweight and selection in stocks relative to the comparator index were beneficial to returns, as was our selection in convertible preferred stocks,
◼ Our selection in convertible bonds detracted from returns, as did our selection in corporate bonds.
The Fund's leading security selection in information technology positively contributed to relative performance. In particular, positions in the semiconductors and the systems software industries assisted relative performance. Leading security selection and an average underweight allocation in communication services, specifically in the interactive media & services and cable & satellite industries, contributed to performance.
Over the period, security selection and an average underweight stance within the consumer discretionary sector weakened return. Specifically, positions in automobile manufacturers and the hotels, resorts & cruise lines industry lagged. Security selection and an average overweight allocation in financials, specifically in diversified banks and multi-sector holdings, also lost ground on a relative basis.
www.calamos.com
59
Calamos Strategic Total Return Fund (Unaudited)
How is the Fund positioned?
At the beginning of 2023, we outlined the case for increasing the Fund's risk by focusing on selective areas of the economy that we believed should show improving economic growth in 2023 and 2024, in addition to companies that could improve returns on capital during that time. Our premise to selectively add risk was based on several factors, including our convictions about the long-term US economic growth trajectory, positive policy changes, and improvements in certain parts of the economy, despite opposing forces slowing growth down in other economic sectors. In aggregate, the events of the first three quarters of 2023 (the slowing of central bank rate increases, moderate slowing of inflation and economic growth, corporate cost-cutting measures, and accelerated spending in AI-related areas) have supported that risk profile. Risk-asset returns were positive during this time, although there was a significant dispersion of returns across sectors and industries.
We believe the best positioning for this environment is a more neutral or defensive risk posture, with risk in specific areas with real growth tailwinds, in companies with improving returns on capital in 2024, and in equities and fixed income with valuations at favorable expected risk-adjusted returns. We see compelling prospects for companies that have exposure to new products and geographic growth opportunities (in health care, electric vehicles, and AI-related infrastructure and software), specific infrastructure spending areas (in materials and industrials), and the normalization of supply chains and areas of the service economy. Regarding asset-class positioning, we maintain a relatively high allocation to common stocks and convertibles, whose combined exposure represents approximately 80% of the portfolio's assets as of October 31, 2023.
We focus on actively managing the risk/reward trade-offs within the portfolio. The characteristics of convertible securities vary: some are more bond-like, some are more equity-like, and others offer balance. We have maintained a preference for the balanced portion of the convertible market to take advantage of recent equity-valuation resets. Balanced convertibles provide a favorable asymmetric payoff profile by offering an attractive level of upside equity participation with less exposure to downside moves.
We are still favoring higher-credit-quality companies with improving free cash flow. We selectively use options and convertible bonds to gain exposure to higher-risk industries. From an asset-class perspective, cash and short-term Treasuries remain useful tools for lowering volatility in a multi-asset-class portfolio, given their yields. The portfolio's average credit quality is BB+. This is typical for the Fund because our credit process tends to guide us away from the most speculative corporate securities. However, we recognize that opportunities exist among lower-credit securities to enhance performance.
In terms of economic sectors, the largest absolute allocations reside in information technology and consumer discretionary, whereas the smallest sector weight allocations with holdings are found in real estate and materials. On a relative basis, systems software and technology hardware, storage & peripherals are among the overweight industries. Application software and biotechnology are among the underweight industries.
Allocations to information technology and communication services rose with increased weights in systems software and interactive media & services. The health care allocation decreased during the period, while the weight to consumer staples also decreased modestly with a paring back in pharmaceuticals and soft drinks & non-alcoholic beverages.
CALAMOS CLOSED-END FAMILY OF FUNDS ANNUAL REPORT
60
Calamos Strategic Total Return Fund (Unaudited)
We are also aware of the fact that rising interest rates may have a detrimental effect on longer-term fixed-income securities. Consequently, managing the duration of the fixed-income assets of our portfolio is a priority in mitigating this potential impact. As of October 31, 2023, the weighted average duration of the bonds in the portfolio is 2.6 years, which is low compared to longer-duration fixed-income instruments.
We believe that over time the prudent use of leverage should enhance total return and support the Fund's distribution rate. As of October 31, 2023, the Fund's leverage was approximately 34%.
What are your closing thoughts for Fund shareholders?
As we look toward the end of 2023 and into 2024, the growth outlook appears more muted than at the beginning of 2023. Opposing economic forces have become more balanced as policy shifts (the elimination of some government policies and a cost-cutting agenda in the US Congress), offsetting positive end-demand trends at the consumer and corporate levels. We continue to see slowing but positive economic growth over the next year, but the timing for a reacceleration in growth is more difficult to predict. In addition to this more balanced growth view, the growth outlook for many parts of the US economy continues to shift. For example, energy prices rose in the final months of the period versus a decline in the first part of the year, and travel consumption has slowed from the fast pace over the summer. Therefore, we remain vigilant in identifying short-term cyclical investment themes. We continue to assess the investment opportunities within this environment, further focusing on real growth and return improvement areas. Finally, we continue to monitor security and asset-class valuations to target appropriate returns in this volatile environment.
Convertible new issuance was subdued in 2022 but has improved in 2023 with higher coupons and lower conversion premiums that are more favorable to investors. So far in 2023, global convertible issuance totaled $65.1 billion, surpassing the $39.6 billion in 2022. We've also been encouraged to see more investment-grade companies issue convertibles. We remain optimistic about issuance prospects and believe the pace will continue to be strong as companies increasingly recognize the lower-borrowing-cost benefits of issuing convertibles in lieu of traditional bonds. The combination of a sizable amount of debt maturing in 2025 across bond markets and the Fed's higher-for-longer interest rate stance could accelerate near-term issuance. Increased issuance should broaden the convertible market landscape and the number of investable opportunities.
Although progress may have changed direction, aggregate leverage and interest coverage remain healthy based on our evaluation. We will monitor the situation closely to determine if a new trend toward weakness is emerging or if results are becoming more volatile as instability in input prices, labor costs, and consumer behavior impact outcomes. Credit spreads in the investment-grade and high-yield markets have widened slightly as strong balance sheets and technicals have offset the growing suspicion that results in coming quarters will be weaker.
We remain confident that the positive long-term growth trajectory of the US economy and the cash-flow-generation capabilities of US companies are intact. The ability of management teams to identify emerging short and long-term trends and the adaptability of business models and cost structures are central to our long-term favorable view. We see attractive long-term upside in the US equity market from current market levels, which we believe are at fair value for a majority of US companies.
A Note About Your Fund's Portfolio Management Team. Mr. Chuck Carmody, CFA, was named Co-Portfolio Manager of the Fund in December 2023. He joined Calamos in 2004. Since 2022, he has served as Senior Vice President, Co-Portfolio Manager of Calamos Advisors. Previously, in 2016, he was named Vice President, Co-Portfolio Manager, as well as Senior Trader, High Yield, Calamos Advisors. From 2010 to 2016, he held other senior fixed income trading roles at the firm. The Fund's Prospectus contains information relating to the other portfolio managers, as well as Calamos Advisors' "team of teams" approach to portfolio management. The Fund's Statement of Additional Information provides additional information about the Portfolio Managers' compensation, other accounts managed by the Portfolio Managers, and the Portfolio Managers' ownership of securities in the Fund.
www.calamos.com
61
Calamos Strategic Total Return Fund (CSQ) (Unaudited)
INVESTMENT OBJECTIVE AND STRATEGIES
Investment Objective
The Fund's investment objective is to provide total return through a combination of capital appreciation and current income.
Principal Investment Strategies
Under normal circumstances, the Fund will invest primarily in a portfolio common and preferred stocks, convertible securities and income-producing securities such as investment grade and below investment grade (high yield/high risk) debt securities. The Fund, under normal circumstances, will invest at least 50% of its managed assets in equity securities (including securities that are convertible into equity securities).
The Fund may invest up to 35% of its managed assets in securities of foreign issuers, including debt and equity securities of corporate issuers and debt securities of government issuers in developed and emerging markets.
The Fund may invest up to 15% of its managed assets in securities of foreign issuers in emerging markets. "Managed assets" means the Fund's total assets (including any assets attributable to any leverage that may be outstanding) minus total liabilities (other than debt representing financial leverage).
Calamos will dynamically allocate the Fund's investments among multiple asset classes (rather than maintaining a fixed or static allocation), seeking to obtain an appropriate balance of risk and reward on a long-term basis through all market cycles using multiple strategies and combining them to seek to achieve favorable risk adjusted returns.
Calamos analyzes securities for the Fund's portfolio using an approach that focuses on assessing a total enterprise value before assessing the value of the securities issued by a company. Calamos seeks to assess the value of an issuer's total enterprise by studying its financial statements, including its balance sheet. Once enterprise value is determined, Calamos seeks to assess the value of the issuer's different types of securities, taking into account the business risk of the issuer, its competitive position and the seniority of each type of security relative to the rest of the issuer's capital structure. This approach serves as the basis for the Calamos research team's design and use of proprietary models which, along with risk management and portfolio construction techniques, assist in determining whether a given security presents an investment opportunity for the Fund.
The Fund may seek to generate income from option premiums by writing (selling) options. The Fund may write (sell) call options (i) on a portion of the equity securities (including equity securities obtainable by the Fund through the exercise of its rights with respect to convertible securities it owns) in the Fund's portfolio and (ii) on broad-based securities indices (such as the Standard and Poor's 500® Index ("S&P 500") or the MSCI EAFE® Index ("MSCI EAFE"), which is an index of international equity stocks) or certain ETFs (exchange traded funds) that trade like common stocks but seek to replicate such market indices.
The Fund currently uses, and may in the future use, financial leverage. The Fund has obtained financial leverage (i) under an Amended and Restated Liquidity Agreement with State Street Bank and Trust Company ("SSB Agreement") that allows the Fund to borrow up to $1.13 billion and (ii) through the issuance of four series of Mandatory Redeemable Preferred Shares ("MRPS" or "MRP Shares") with an aggregate liquidation preference of $323.5 million.
CALAMOS CLOSED-END FAMILY OF FUNDS ANNUAL REPORT
62
Calamos Dynamic Convertible and Income Fund (Unaudited)
CALAMOS DYNAMIC CONVERTIBLE AND INCOME FUND
INVESTMENT TEAM DISCUSSION
Please discuss the Fund's strategy and role within an asset allocation.
Calamos Dynamic Convertible and Income Fund (CCD) is a total-return-oriented fund that seeks to provide steady income paid out monthly. We invest in a diversified portfolio of convertible and high-yield securities. The allocation to each asset class is dynamic and reflects our view of the economic landscape as well as the potential of individual securities. By combining asset classes, we believe the Fund is well positioned to generate capital gains and income over the long term. The dynamic allocation of security types also provides us with opportunities to manage the risk/reward characteristics of the portfolio over full market cycles.
Through this approach, we seek to offer investors an attractive monthly distribution. The product provides an alternative to funds investing exclusively in investment-grade fixed-income instruments. It seeks to be less sensitive to interest rates while delivering equity exposure using convertibles. We seek companies with respectable balance sheets, reliable debt servicing, and good prospects for sustainable growth. Although we invest primarily in securities of US issuers, we favor companies actively participating in globalization with geographically diverse revenue streams and global-scale business strategies.
How did the Fund perform over the annual period?
The Fund returned -4.26% on a net asset value (NAV) basis and -12.56% on a market price basis for the 12 months ended October 31, 2023 ("annual period"), versus a return of 0.87% for a comparator index comprising 80% ICE BofA All US Convertibles Index and 20% Bloomberg US Corporate High Yield 2% Issuer Capped Index over the same period. At the end of the annual period, the Fund's shares traded at a -0.99% discount to NAV.
How do NAV and market price returns differ?
Closed-end funds trade on exchanges where factors other than the value of underlying securities may drive the price of shares. The price of a share in the market is called market value. Factors unrelated to the performance of a fund's holdings, such as general market sentiment or future expectations, may influence the market price. A fund's NAV return measures the actual return of the individual securities in the portfolio less fund expenses; it also measures how a manager capitalized on market opportunities. Because we believe closed-end funds are best used long term within asset allocations, we think the NAV return is the better measure of a fund's performance. However, when managing our Fund, we strongly consider actions and policies that we believe can potentially optimize overall price performance and market value.
TOTAL RETURN*
Common Shares – Inception 3/27/15
1 Year | Since Inception** | ||||||||||
On Market Price | -12.56 | % | 5.45 | % | |||||||
On NAV | -4.26 | % | 6.14 | % | |||||||
*Total return measures net investment income and net realized gain or loss from Fund investments, and change in net unrealized appreciation or depreciation, assuming reinvestment of income and net realized gains distributions.
**Annualized since inception.
SECTOR WEIGHTINGS
Information Technology | 26.3 | % | |||||
Health Care | 18.1 | ||||||
Consumer Discretionary | 18.1 | ||||||
Industrials | 8.6 | ||||||
Communication Services | 7.4 | ||||||
Utilities | 4.7 | ||||||
Financials | 4.5 | ||||||
Energy | 4.0 | ||||||
Materials | 2.5 | ||||||
Consumer Staples | 1.4 | ||||||
Real Estate | 0.7 | ||||||
Airlines | 0.2 | ||||||
Special Purpose Acquisition Companies | 0.1 | ||||||
Sector weightings are based on managed assets and may vary over time. Sector Weightings exclude any government/sovereign bonds or options on broad market indexes the Fund may hold.
www.calamos.com
63
Calamos Dynamic Convertible and Income Fund (Unaudited)
ASSET ALLOCATION AS OF 10/31/23
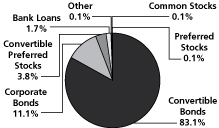
Fund asset allocations are based on total investments and may vary over time.
SINCE INCEPTION MARKET PRICE AND NAV HISTORY THROUGH 10/31/23
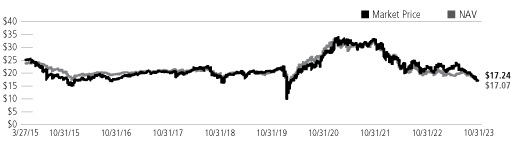
Performance data quoted represents past performance, which is no guarantee of future results. Current performance may be lower or higher than the performance quoted. The principal value of an investment will fluctuate so that your shares, when sold, may be worth more or less than their original cost. Returns at NAV reflect the deduction of the Fund's management fee, debt leverage costs and all other applicable fees and expenses. You can obtain performance data current to the most recent month end by visiting www.calamos.com.
Please discuss the Fund's distributions during the reporting period.
We employ a managed distribution policy within this Fund with the goal of providing shareholders with a consistent distribution stream. At the end of the period, the Fund's monthly distribution rate was $0.1950 per share. On October 31, 2023, the annualized distribution rate on the Fund's market price was 13.71%.
We believe the Fund's distribution rate and level remained attractive and competitive, given that yield opportunities are limited in much of the marketplace despite recent Fed tightening. As of October 31, 2023, the dividend yield of S&P 500 Index stocks was 1.68%. Yields were also relatively low within the US government bond market, with the 10-year US Treasury yielding 4.88%.
What factors influenced performance over the annual period?
During the annual period, investors focused on the Federal Reserve's response to persistent inflation and the potential for a recession. Geopolitical concerns, regional bank stress, rising fuel prices, and potential impacts of the United Auto Workers strike also made headlines and induced volatility. Despite these headwinds, the equity market began to recover from 2022's lows, and the S&P 500 Index returned 10.14% over the period. The higher-for-longer interest rate environment continued to stoke volatility in the bond market, and the Bloomberg US Aggregate Bond Index rose just 0.36%.
The convertible market is well represented by small and mid-sized growth issuers, which lagged the broader equity market as evidenced by the Russell 2500 Growth Index's -4.80% return. More than half of the convertible market was priced below par on average during the reporting period, and convertibles (-0.48%) held up much better than their underlying stocks (-8.2%).
High-yield spreads were modestly tighter, closing at 437 basis points on an option-adjusted basis, down from 464 in the prior year. Despite the perceived stability, the trading range for spreads during the period was 150 basis points wide, reflecting the volatility across markets. Lower quality outperformed as CCCs returned 7.4%, B-rated paper returned 6.8%, and more rate-sensitive BBs returned 5.3%. After increasing for most of the year, trailing 12-month defaults
CALAMOS CLOSED-END FAMILY OF FUNDS ANNUAL REPORT
64
Calamos Dynamic Convertible and Income Fund (Unaudited)
came in at 2.6% on a par-weighted basis. We expect this measure to climb and close the 2023 calendar year near the 3.0% average of the post-GFC era. The best-performing sectors in the Bloomberg US High Yield 2% Issuer Capped Index were finance companies (+10.9%), consumer cyclicals (+10.2%), and brokers and asset managers (+3.5), whereas communications (+0.8%), electric utilities (+3.1%), and transportation (+3.3%) represented the laggards.
Other factors that contributed to and detracted from Fund performance included the following:
◼ On an unleveraged basis, the Fund's convertible bond holdings performed in line with the ICE BofA All US Convertibles Index. Holdings in the information technology and industrials sectors were helpful to performance, whereas holdings in financials and energy were not.
◼ On an unleveraged basis, the portfolio underperformed the comparator index. Our relative overweight and selection in convertibles and underweight and selection in corporate bonds proved detrimental to performance.
◼ Our use of options and our exposure to Treasury bonds were both beneficial relative to the comparator index.
◼ From a sector standpoint, the Fund benefited from favorable security selection and an average overweight stance in information technology, as holdings in semiconductors and communications equipment boosted relative returns.
◼ Security selection and an average underweight allocation in industrials added to the Fund's performance. Within this sector, the main contributors were the electrical components & equipment and the industrial machinery & supplies & components industries.
◼ Conversely, security selection and an average underweight position within the energy sector weakened return over the period, specifically holdings in the oil & gas drilling and the oil & gas exploration & production industries.
◼ Security selection and an average underweight position within the transaction & payment processing services and mortgage REITs industries of the financials sector lagged.
How is the Fund positioned?
As of October 31, 2023, approximately 84% of our portfolio as a percent of net assets was invested in convertible securities. We believe this allocation will enable our shareholders to take advantage of selective opportunities in the general equity markets. In the long term, we think that patient investors will be rewarded through an allocation to convertibles and select high-yield bonds at current levels that may offer attractive valuations.
We focus on actively managing the risk/reward trade-offs within the portfolio. The characteristics of convertible securities vary: some convertibles are more bond-like, some are more equity-like, and others offer balance. We have maintained a preference for the balanced portion of the convertible market to take advantage of recent equity-valuation resets. Balanced convertibles provide a favorable asymmetric payoff profile by offering attractive levels of upside equity participation with less exposure to downside moves. We also see opportunities in the bond-like segment of the convertible market in issues that can benefit from spread compression while offering attractive yields and sound structural risk mitigation
www.calamos.com
65
Calamos Dynamic Convertible and Income Fund (Unaudited)
during equity market weakness. Within this segment of the convertible market, most issuers retain substantial cash balances along with minimal near-term refinancing risk. We are selective in the group's most distressed names.
The market's reaction to the November Fed meeting has driven Treasury yields further from the Fed's forward rate path expectations. However, Chair Powell noted multiple times that the dot plots released quarterly should only be viewed as snapshots in time that loses applicability with each incoming data point. Futures markets now indicate four rate cuts will occur in 2024, down from the five cuts the market had priced in at the midyear point. We have been gradually increasing portfolio durations in expectation of peak-Fed policy rates and a greater likelihood that the next rate move will be a cut. As of October 31, 2023, the average duration was 2.2 years.
Regarding economic sectors, the portfolio's largest absolute weights are in information technology and health care. Conversely, consumer staples and real estate represent the smallest absolute sector weights with holdings. On a relative basis, the largest industry overweight positions are in health care equipment and leisure facilities. Significant industry underweight positions are in communications equipment and biotechnology.
The financials allocation increased during the period, while the weight to consumer discretionary also rose modestly, with increased weights in transaction & payment processing services and home furnishing retail. The information technology allocation decreased during the period, with a reduction in semiconductors, while the weight to energy also declined modestly, with a paring back in oil & gas exploration & production.
The average (BB+) credit quality of the rated securities in the portfolio is higher than that of the ICE BofA All US Convertibles Index. This higher relative credit is typical for the Fund because our process tends to guide us away from the most speculative corporate securities while still providing regular income. That said, we selectively invest in lower-credit securities when we believe the risk/return dynamics favor our investors.
Although the Fund tends to be US-centric because of the compelling risk/reward of investments, we invest in global businesses that can seek the best opportunities worldwide and diversify their revenue streams. Overall, we hold that our portfolio companies are performing well fundamentally, earning attractive cash flow margins, improving their credit profiles, and utilizing reasonable debt levels to fund their operations.
Over the longer term, we believe in the prudent use of leverage as a means to enhance total return and support the Fund's distribution rate over time. As of October 31, 2023, our amount of leveraged assets was approximately 40%.
What are your closing thoughts for Fund shareholders?
Volatility has historically created opportunity in the convertible asset class. Any stabilization of the macro backdrop could shift narrow, larger-cap-driven S&P 500 leadership into broader strength, which we believe would benefit convertibles since many issuers lean toward more mid-cap, growth-oriented companies.
Should the market continue to prove challenging, convertibles are situated near their bond floor and would be expected to provide defensive attributes.
CALAMOS CLOSED-END FAMILY OF FUNDS ANNUAL REPORT
66
Calamos Dynamic Convertible and Income Fund (Unaudited)
Convertible new issuance was subdued in 2022 but has improved in 2023 with higher coupons and lower conversion premiums that are more favorable to investors. So far in 2023, global convertible issuance totaled $65.1 billion, surpassing the $39.6 billion in 2022. We've also been encouraged to see more investment-grade companies issue convertibles. We remain optimistic about issuance prospects and believe the pace will continue to be strong as companies increasingly recognize the lower-borrowing-cost benefits of issuing convertibles in lieu of traditional bonds. The combination of a sizable amount of debt maturing in 2025 across bond markets and the Fed's higher-for-longer interest rate stance could accelerate near-term issuance. Increased issuance should broaden the convertible market landscape and the number of investable opportunities.
Although progress may have changed direction, aggregate leverage, and interest coverage continue to look healthy based on our evaluation. We will monitor the situation closely to determine if a new trend toward weakness is emerging or if results are becoming more volatile as instability in input prices, labor costs, and consumer behavior impact outcomes. Credit spreads in the investment-grade and high-yield markets have widened slightly as strong balance sheets and technicals have offset the growing suspicion that results in coming quarters will be weaker.
We agree that monetary policy is currently restrictive, as evidenced by trailing 12-month inflation (core PCE) below the fed funds effective rate and real yields on Treasury Inflation Protected Securities well above 2% across the maturity spectrum. We expect future months and quarters to show a drop in consumer and business investment as a reduction in disposable income through higher borrowing costs rolls into more areas of economic activity. We are squarely in the "impatiently waiting" phase, looking to ascertain how much economic momentum will be lost from past policy changes. There is still a high level of uncertainty concerning potential economic outcomes, and a recession cannot be dismissed.
A Note About Your Fund's Portfolio Management Team. Mr. Chuck Carmody, CFA, was named Co-Portfolio Manager of the Fund in December 2023. He joined Calamos in 2004. Since 2022, he has served as Senior Vice President, Co-Portfolio Manager of Calamos Advisors. Previously, in 2016, he was named Vice President, Co-Portfolio Manager, as well as Senior Trader, High Yield, Calamos Advisors. From 2010 to 2016, he held other senior fixed income trading roles at the firm. The Fund's Prospectus contains information relating to the other portfolio managers, as well as Calamos Advisors' "team of teams" approach to portfolio management. The Fund's Statement of Additional Information provides additional information about the Portfolio Managers' compensation, other accounts managed by the Portfolio Managers, and the Portfolio Managers' ownership of securities in the Fund.
www.calamos.com
67
Calamos Dynamic Convertible and Income Fund (CCD) (Unaudited)
INVESTMENT OBJECTIVE AND STRATEGIES
Investment Objective
The Fund's investment objective is to provide total return through a combination of capital appreciation and current income.
Principal Investment Strategies
Under normal circumstances, the Fund will invest primarily in a portfolio of convertible securities (including synthetic convertible instruments, which are single instruments, or multiple instruments held in concert, that are composed of two or more securities with investment characteristics that, when taken together, resemble those of traditional convertible securities) and debt and equity income-producing securities, as well as other investments that generate current income and dividends, including but not limited to common and preferred stocks, investment grade and below investment grade (high-yield or "junk") bonds, loans, equity-linked notes, and floating rate securities (referred to throughout as "income-producing securities"). With regard to the synthetic convertible instruments, the fixed income and convertible components may have different issuers, and either component may change at any time. Under normal circumstances, at least 80% of the Fund's managed assets will be invested in convertible securities and income-producing securities, with at least 50% of the Fund's managed assets invested in convertible securities (including synthetic convertibles).* The Fund may invest up to 50% of its managed assets in securities of foreign issuers, with up to 15% of its managed assets in securities issued by foreign issuers in emerging markets.
The Fund may invest up to 20% of its managed assets in high-yield non-convertible bonds (excluding such securities held to create synthetic convertible instruments). In addition, the Fund may invest all or substantially all of its managed assets in below investment grade convertible securities (including non-convertible securities held to create synthetic convertible instruments); provided that, the Fund may invest up to 15% of its managed assets in convertible and non-convertible securities rated below B3 by Moody's or below B- by Standard & Poor's. As such, the Fund's portfolio may at times consist entirely or primarily of below investment grade securities, including high-yield bonds. The Fund may invest up to 15% of its managed assets in illiquid securities. The Fund may invest up to 10% of its managed assets in the equity securities of REITs and up to 10% of its managed assets in the equity securities of MLPs; however, convertible securities are excluded from each of these limitations. The Fund may invest in securities with a broad range of maturities. "Managed assets" means the Fund's total assets (including any assets attributable to any leverage that may be outstanding) minus total liabilities (other than debt representing financial leverage).
The Fund may seek to generate income from option premiums by writing (selling) options. The Fund may write (sell) call options (i) on a portion of the equity securities (including securities that are convertible into equity securities) in the Fund's portfolio, (ii) on a portion of a convertible security that it owns at the time it writes the call, and (iii) on broad-based securities indexes (such as the Standard and Poor's 500® Index ("S&P 500") or the MSCI EAFE® Index ("MSCI EAFE")) or certain ETFs (exchange traded funds) that trade like common stocks but seek to replicate such market indexes.
The Fund currently uses, and may in the future use, financial leverage. The Fund has obtained financial leverage (i) under an Amended and Restated Liquidity Agreement with State Street Bank and Trust Company ("SSB Agreement") that allows the Fund to borrow up to $370 million and (ii) through the issuance of four series of Mandatory Redeemable Preferred Shares ("MRPS" or "MRP Shares") with an aggregate liquidation preference of $92 million.
Term Structure
Absent shareholder approval to amend the limited term provision of the Fund's Agreement and Declaration of Trust, the Fund's Agreement and Declaration of Trust provides that it will cease to exist at the close of business on the fifteenth anniversary of the effective date of the Fund's registration statement, March 26, 2030, except for the purpose of satisfying any existing debts or obligations, collecting and distributing its assets and doing all other acts required to liquidate and wind up its business and affairs. If the Fund's Board of Trustees believes that under then current market conditions it is in the best interests of the Fund to do so, the Fund may extend the Termination Date for one year, to March 26, 2031, without a shareholder vote, upon the affirmative vote of three-quarters of the Trustees then in office. Upon termination, the Fund will distribute substantially all of its net assets to shareholders, after making appropriate provision for any liabilities of the Fund. The Fund's investment objective and policies are not designed to seek to return to investors that purchase common shares in this offering their initial investment of $25 per common share on the Termination Date, and such investors and investors that purchase common shares after the completion of this offering may receive more or less than their original investment upon termination.
* This is a non-fundamental policy and may be changed by the Board of Trustees of the Fund provided that shareholders are provided with at least 60 days' prior written notice of any change as required by the rules under the 1940 Act.
CALAMOS CLOSED-END FAMILY OF FUNDS ANNUAL REPORT
68
Calamos Global Dynamic Income Fund (Unaudited)
CALAMOS GLOBAL DYNAMIC INCOME FUND
INVESTMENT TEAM DISCUSSION
Please discuss the Fund's strategy and role within an asset allocation.
Calamos Global Dynamic Income Fund (CHW) is a global enhanced fixed-income offering that seeks to provide an attractive monthly distribution with a secondary objective of capital appreciation. We believe the Fund offers a diversified way to participate in the long-term potential of global markets.
In this portfolio, we draw upon our team's wide-ranging experience in an array of asset classes. We utilize a highly flexible approach, investing in equities, convertible securities, and high-yield securities. We also can employ alternative strategies such as covered call writing and convertible arbitrage. We seek to generate income through covered call writing by selling ("writing") options on market indexes. In the convertible arbitrage strategy, we invest in convertible securities and short sell the convertibles' underlying equities to generate income and hedge against risk.
We hold that this broad mandate enhances our ability to capitalize on market volatility, manage potential downside risks, and generate more income versus traditional fixed income funds. The allocation to each asset class and strategy is dynamic, reflecting our view of the economic landscape and the potential of individual securities. By combining asset classes and strategies, we believe the Fund is well positioned to generate income and capital gains. The broader range of security types also provides increased opportunities to manage the risk/reward characteristics of the portfolio over full market cycles.
We invest in both US and non-US companies, with at least 40% of assets invested in non-US companies. We emphasize companies with reliable debt servicing, respectable balance sheets, and sustainable growth prospects. Regardless of a company's country of domicile, we favor companies with geographically diversified revenue streams and global business strategies.
How did the Fund perform over the annual period?
The Fund returned 8.29% on a net asset value (NAV) basis and 2.40% on a market price basis for the 12 months ended October 31, 2023 ("annual period"), versus a return of 7.43% for a comparator index comprising 40% MSCI ACWI Index, 30% Refinitiv Global Convertible Bond Index, and 30% Bloomberg US High Yield 2% Issuer Capped Index. At the end of the reporting period, the Fund's shares traded at a -12.85% discount to NAV.
How do NAV and market price returns differ?
Closed-end funds trade on exchanges, where factors other than the value of the underlying securities might drive the price of shares or market price. For example, general market sentiment or future expectations might influence the market price. A fund's NAV return measures the actual return of the individual securities in the portfolio, less fund expenses. It also measures how a manager was able to capitalize on market opportunities. Because we believe closed-end funds are best utilized long term within asset allocations, we deem that the NAV return is the better measure of a fund's performance. However, when managing our Fund, we strongly consider actions and policies to optimize its overall price performance and returns based on market value.
TOTAL RETURN*
Common Shares – Inception 6/27/07
1 Year | Since Inception** | ||||||||||
On Market Price | 2.40 | % | 3.56 | % | |||||||
On NAV | 8.29 | % | 4.73 | % | |||||||
*Total return measures net investment income and net realized gain or loss from Fund investments, and change in net unrealized appreciation and depreciation, assuming reinvestment of income and net realized gains distributions.
**Annualized since inception.
SECTOR WEIGHTINGS
Information Technology | 21.6 | % | |||||
Consumer Discretionary | 16.0 | ||||||
Industrials | 13.0 | ||||||
Financials | 12.1 | ||||||
Health Care | 9.9 | ||||||
Communication Services | 7.4 | ||||||
Energy | 6.9 | ||||||
Consumer Staples | 4.4 | ||||||
Materials | 4.0 | ||||||
Utilities | 1.3 | ||||||
Real Estate | 1.2 | ||||||
Airlines | 0.3 | ||||||
Other | 0.2 | ||||||
Special Purpose Acquisition Companies | 0.2 | ||||||
Sector weightings are based on managed assets and may vary over time. Sector Weightings exclude any government/sovereign bonds or options on broad market indexes the Fund may hold.
www.calamos.com
69
Calamos Global Dynamic Income Fund (Unaudited)
ASSET ALLOCATION AS OF 10/31/23
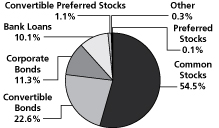
SINCE INCEPTION MARKET PRICE AND NAV HISTORY THROUGH 10/31/23
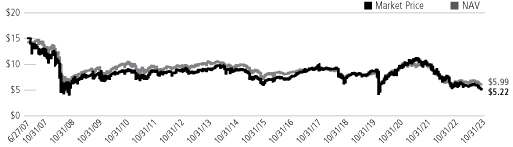
Performance data quoted represents past performance, which is no guarantee of future results. Current performance may be lower or higher than the performance quoted. The principal value of an investment will fluctuate so that your shares, when sold, may be worth more or less than their original cost. Returns at NAV reflect the deduction of the Fund's management fee, debt leverage costs and all other applicable fees and expenses. You can obtain performance data current to the most recent month end by visiting www.calamos.com.
Please discuss the Fund's distributions during the annual period.
We employ a level distribution policy within this Fund with the goal of providing shareholders with a consistent distribution stream. In each month of the period, the Fund distributed $0.0500 per share, resulting in an annualized distribution rate of 11.49% of market price as of October 31, 2023.
The Fund's distribution rate and level remained attractive and competitive despite rising interest rates and higher-yielding securities in much of the marketplace. For example, at period end, the dividend yield of S&P 500 Index stocks was 1.68%, and US government bond yields were elevated, with the 10-year US Treasury yielding 4.88%.
What factors influenced performance over the annual period?
Global stocks and bonds experienced periods of significant volatility and rotation but pushed higher and delivered positive returns over the period. Investors navigated an environment characterized by tighter monetary policy and higher interest rates but also moderating inflation and resilient corporate earnings.
The Federal Reserve increased rates six times over the period by an additional 225 basis points, bringing the target rate to 5.25% – 5.50%. Meanwhile, markets were beset by the anticipation of ongoing Fed reactions and ongoing intentions.
The Fund navigated volatile markets by employing its active blend of convertible securities, high-yield bonds, US equities, international equities, and convertible arbitrage.
Other factors that contributed to and detracted from Fund performance included the following:
◼ On an unleveraged basis, the portfolio performed in line with the comparator index. Our overweight and selection in stocks and underweight and selection in convertible preferred stocks was beneficial to returns relative to the index, whereas our selection in convertible bonds and our overweight in put options were detrimental to returns.
CALAMOS CLOSED-END FAMILY OF FUNDS ANNUAL REPORT
70
Calamos Global Dynamic Income Fund (Unaudited)
◼ Selection in the health care sector, notably in the pharmaceuticals industry, contributed to returns relative to the comparator index. In addition, an overweight and selection in the information technology sector, primarily in the semiconductor industry, helped returns.
◼ Conversely, selection in the financials sector, primarily in diversified banks, weighed on results relative to the comparator index, as did selection in the consumer discretionary sector, primarily in automobile manufacturers.
◼ From a country perspective, our selection in the US proved beneficial to performance relative to the comparator index.
◼ From a country perspective, our overweight and selection in China dragged on relative returns.
How is the Fund positioned?
The Fund's regional and country positioning reflects the combined inputs from our top-down global framework and our bottom-up security analysis. Our investment team evaluates macroeconomic factors and growth opportunities and actively integrates them into the investment decision-making process. To tap into selective growth potential in the global economy, we favor quality growth companies with quality balance sheets, strong brands, free cash flows, and experienced management—businesses poised to withstand market volatility.
The financials allocation increased during the period, and the weight to consumer discretionary also rose modestly, with increased weights in transaction & payment processing services and home furnishing retail. The allocations to information technology and energy decreased during the period, with reductions in the semiconductor and the oil & gas exploration & production industries.
In terms of economic sectors, the largest allocations reside in information technology and consumer discretionary on an absolute basis, whereas the smallest sector allocations with holdings are found within utilities and real estate. We maintain overweight allocations in the semiconductors and diversified banks industries. The largest industry underweight positions are in application software and biotechnology.
From a regional standpoint, the portfolio's largest weights are in the United States and Emerging Asia, while the smallest absolute weights are in EMEA and Emerging Latin America. We maintain relative overweight positions in Emerging Asia and Europe, while the portfolio is underweight in the United States and Japan compared to the index. Overall, we maintained relatively stable weights.
The portfolio's average credit quality is BB+. This is typical for the Fund because our credit process tends to guide us away from the most speculative corporate securities. That said, we recognize that opportunities exist for lower-credit securities to enhance performance.
We are cognizant of rising interest rates and inflation. Although the Fund invests primarily in equities, the weighted average duration of the bonds in our portfolio is only 2.4 years (as of October 31, 2023). This relatively low duration average is expected to mitigate the volatility that our fixed-income securities might incur in a rising-rate environment.
We believe that over time, the use of leverage may enhance total return and support the Fund's distribution rate. As of October 31, 2023, our amount of leveraged assets was approximately 34%.
www.calamos.com
71
Calamos Global Dynamic Income Fund (Unaudited)
A Note About Your Fund's Portfolio Management Team. Mr. Chuck Carmody, CFA, was named Co-Portfolio Manager of the Fund in December 2023. He joined Calamos in 2004. Since 2022, he has served as Senior Vice President, Co-Portfolio Manager of Calamos Advisors. Previously, in 2016, he was named Vice President, Co-Portfolio Manager, as well as Senior Trader, High Yield, Calamos Advisors. From 2010 to 2016, he held other senior fixed income trading roles at the firm. The Fund's Prospectus contains information relating to the other portfolio managers, as well as Calamos Advisors' "team of teams" approach to portfolio management. The Fund's Statement of Additional Information provides additional information about the Portfolio Managers' compensation, other accounts managed by the Portfolio Managers, and the Portfolio Managers' ownership of securities in the Fund.
What are your closing thoughts for Fund shareholders?
Global markets continue to navigate complex conditions. We are analyzing many market drivers, including central bank policy, the inflationary backdrop, corporate earnings, and geopolitical tensions. Considering the global economy and evolving monetary policy, the financial markets remain uncertain, and we expect volatility to continue until these risks are resolved. Given this backdrop, we continue to identify ways to capitalize on volatility, including a range of opportunities at the thematic, regional, and market-cap levels.
Regarding Fund positioning, we emphasize companies with attractive earnings, pricing power, cash flow, and supportive valuations. From a sector perspective, we see opportunities in technology, industrials, health care, consumer, and energy with leading fundamentals. We believe our active, risk-managed investment approach and long-term perspective position us to take advantage of the volatility and opportunities in global markets.
We hold that fiscal and monetary policy, especially rate hikes, are likely to remain important factors affecting corporate debt refinancing. Geopolitical factors may also spur market volatility as we continue into next year. With increased volatility, active management is imperative to manage risk and optimize opportunities. Our exposure to convertible bonds, approximately 23% of net assets as of October 31, 2023, should allow us to participate in an upswing in equities in a risk-managed manner while not incurring the volatility of longer-duration bonds in a rising-rate environment.
CALAMOS CLOSED-END FAMILY OF FUNDS ANNUAL REPORT
72
Calamos Global Dynamic Income Fund (CHW) (Unaudited)
INVESTMENT OBJECTIVES AND STRATEGIES
Investment Objective
The Fund's investment objective is to generate a high level of current income with a secondary objective of capital appreciation.
Principal Investment Strategies
Under normal circumstances, the Fund invests primarily in a globally diversified portfolio of convertible instruments, common and preferred stocks, and income-producing securities such as investment grade and below investment grade (high yield/high risk) debt securities. The Fund may also use other income-producing strategies, including options, swaps and other derivative instruments, for both investment and hedging purposes. The Fund, under normal circumstances, invests at least 40% of its managed assets in securities of foreign issuers in developed and emerging markets, including debt and equity securities of corporate issuers and debt securities of government issuers. "Managed assets" means the Fund's total assets (including any assets attributable to any leverage that may be outstanding) minus total liabilities (other than debt representing financial leverage).
The Fund seeks to maintain a balanced approach to geographic portfolio diversification. The Fund may invest up to 100% of its managed assets in securities of foreign issuers in developed and emerging markets, including debt and equity securities of corporate issuers and debt securities of government issuers. The Fund uses a number of investment strategies to achieve its objectives and invests in a wide variety of financial instruments. These instruments include global convertible, exchangeable instruments, as well as "synthetic" convertible instruments. With regard to the synthetic convertible instruments, the fixed income and convertible components may have different issuers, and either component may change at any time. The Fund also invests in global equities or equity-linked securities with high income potential. From time to time, the Fund invests in Rule 144A securities, foreign exchange contracts or securities with imbedded foreign exchange hedges, and high yield bonds of companies rated BB or lower.
In general, the Fund seeks out companies with a long-term track record of high dividend payout consistent with dividend growth. In certain circumstances, the Fund may invest in underlying companies it believes have substantial prospects for price appreciation even if the there is little or no dividend growth potential. From time to time, the Fund may sell index options or single stock options (either listed or "over the counter") to enhance the overall yield of the Fund or, in the opinion of the Adviser, reduce portfolio volatility. The Fund may purchase options to hedge or engage in other hedging activities including the purchase or sale of futures, swaps or options on equities, indices, currencies, interest rates or credits.
The Fund does not seek to maintain any target allocation among asset classes and, at any time, its allocation among asset classes may vary significantly over time as the portfolio is actively managed.
The Fund may seek to generate income from option premiums by writing (selling) options. The Fund may write (sell) call options (i) on a portion of the equity securities (including equity securities obtainable by the Fund through the exercise of its rights with respect to convertible securities it owns) in the Fund's portfolio and (ii) on broad-based securities indices (such as the Standard and Poor's 500® Index ("S&P 500") or the MSCI EAFE® Index ("MSCI EAFE"), which is an index of international equity stocks) or certain ETFs (exchange traded funds) that trade like common stocks but seek to replicate such market indices.
The Fund currently uses, and may in the future use, financial leverage. The Fund has obtained financial leverage (i) under an Amended and Restated Liquidity Agreement with State Street Bank and Trust Company ("SSB Agreement") that allows the Fund to borrow up to $265 million and (ii) through the issuance of four series of Mandatory Redeemable Preferred Shares ("MRPS" or "MRP Shares") with an aggregate liquidation preference of $70 million.
www.calamos.com
73
Calamos Global Total Return Fund (Unaudited)
TOTAL RETURN*
Common Shares – Inception 10/27/05
1 Year | Since Inception** | ||||||||||
On Market Price | -0.98 | % | 5.83 | % | |||||||
On NAV | 5.26 | % | 6.76 | % | |||||||
*Total return measures net investment income and net realized gain or loss from Fund investments, and change in net unrealized appreciation and depreciation, assuming reinvestment of income and net realized gains distributions.
**Annualized since inception.
SECTOR WEIGHTINGS
Information Technology | 21.1 | % | |||||
Consumer Discretionary | 16.2 | ||||||
Industrials | 12.9 | ||||||
Financials | 11.3 | ||||||
Health Care | 9.7 | ||||||
Communication Services | 7.3 | ||||||
Energy | 6.8 | ||||||
Consumer Staples | 4.6 | ||||||
Materials | 3.2 | ||||||
Real Estate | 1.3 | ||||||
Other | 1.1 | ||||||
Utilities | 0.9 | ||||||
Airlines | 0.2 | ||||||
Special Purpose Acquisition Companies | 0.1 | ||||||
Sector weightings are based on managed assets and may vary over time. Sector Weightings exclude any government/sovereign bonds or options on broad market indexes the Fund may hold.
CALAMOS GLOBAL TOTAL RETURN FUND
INVESTMENT TEAM DISCUSSION
Please discuss the Fund's strategy and role within an asset allocation.
Calamos Global Total Return Fund (CGO) is a total-return-oriented offering that seeks to provide an attractive monthly distribution. The Fund invests in a diversified portfolio of global equities, convertible securities and high yield bonds. The allocation to each asset class is dynamic and reflects our view of the economic landscape and the potential of individual securities. By combining these asset classes, we believe the Fund can be optimally positioned over the long term to generate capital gains and income. This broader range of security types also provides increased opportunities to manage the risk/reward characteristics of the portfolio over full market cycles. Through this approach, we seek to offer investors an attractive monthly distribution and equity participation.
We believe having a relatively high level of exposure to convertible and equity assets is advantageous for the portfolio, albeit on a selective and risk-managed basis, as we consider both geopolitical turmoil and the impact of rising interest rates.
We invest in both US and non-US companies, favoring companies with geographically diversified revenue streams and global business strategies. We emphasize companies that we believe offer reliable debt servicing, respectable balance sheets, and sustainable growth prospects.
How did the Fund perform over the annual period?
The Fund returned 5.26% on a net asset value (NAV) basis and -0.98% on a market price basis for the 12 months ended October 31, 2023 ("annual period"), versus a return of 7.96% for a comparator index comprising 50% MSCI ACWI Index (Net Returns), 25% Refinitiv Global Convertible Bond Index, and 25% Bloomberg US Corporate High Yield 2% Issuer Capped Index. At the end of the reporting period, the Fund's shares traded at a -10.54% discount to net asset value.
How do NAV and market price returns differ?
Closed-end funds trade on exchanges, where factors other than the value of the underlying securities might drive the price of shares or market price. For example, general market sentiment or future expectations might influence the market price. A fund's NAV return measures the actual return of the individual securities in the portfolio, less fund expenses. It also measures how a manager was able to capitalize on market opportunities. Because we believe closed-end funds are best utilized long term within asset allocations, we deem that the NAV return is the better measure of a fund's performance. However, when managing our Fund, we strongly consider actions and policies to optimize its overall price performance and returns based on market value.
CALAMOS CLOSED-END FAMILY OF FUNDS ANNUAL REPORT
74
Calamos Global Total Return Fund (Unaudited)
SINCE INCEPTION MARKET PRICE AND NAV HISTORY THROUGH 10/31/23
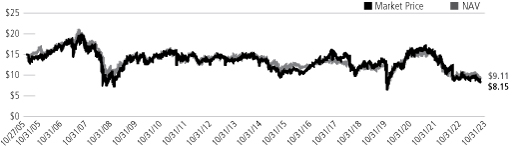
Performance data quoted represents past performance, which is no guarantee of future results. Current performance may be lower or higher than the performance quoted. The principal value of an investment will fluctuate so that your shares, when sold, may be worth more or less than their original cost. Returns at NAV reflect the deduction of the Fund's management fee, debt leverage costs and all other applicable fees and expenses. You can obtain performance data current to the most recent month end by visiting www.calamos.com.
Please discuss the Fund's distributions during the annual period.
We employ a level rate distribution policy within this Fund with the goal of providing shareholders with a consistent distribution stream. Over the period, the Fund consistently distributed $0.0800 per share, resulting in a current annualized distribution rate of 11.78% of the market price as of October 31, 2023.
The Fund's distribution rate and level remained attractive and competitive relative to other investment alternatives. For example, as of October 31, 2023, the dividend yield of S&P 500 Index stocks averaged approximately 1.68%. Although higher than a year ago, yields within the US government bond market were relatively low, with the 10-year US Treasury yielding 4.88%.
What factors influenced performance over the annual period?
Global stocks and bonds experienced periods of significant volatility and rotation but pushed higher and delivered positive returns over the period. Investors navigated an environment characterized by tighter monetary policy and higher interest rates but also moderating inflation and resilient corporate earnings.
The Federal Reserve made six rate increases over the period (totaling an additional 225 basis points), bringing the target rate to 5.25% – 5.50%, a 22-year high. Meanwhile, markets were beset by the anticipation of ongoing Fed reactions and ongoing intentions.
The Fund navigated volatile markets while employing an active blend of common stocks, convertibles, high-yield bonds, and options. That said, improvements in the global equity markets contributed to the Fund's positive performance over the annual period. The Fund's NAV return trailed the comparator index over the period primarily because of lagging individual security selection and its selection of convertible bonds.
Other factors that contributed to and detracted from the Fund's performance included the following:
◼ On an unleveraged basis, the portfolio underperformed the comparator index during the period. Our use of Treasury bonds and selection in convertible bonds
ASSET ALLOCATION AS OF 10/31/23
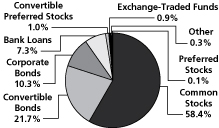
www.calamos.com
75
Calamos Global Total Return Fund (Unaudited)
was not beneficial to returns relative to the index, whereas our overweight and selection in equities supported returns.
◼ The Fund benefitted from favorable security selection and an average underweight position in health care, as holdings in pharmaceuticals and biotechnology added to relative returns.
◼ Security selection and an average overweight position in information technology, specifically in the semiconductors and communications equipment industries, contributed to performance.
◼ Security selection and an average overweight position in Europe added value to portfolio performance, especially holdings in Denmark and Switzerland. Moreover, security selection in Canada propelled relative performance in this period.
◼ Conversely, security selection within the consumer discretionary sector weakened return over the period. Automobile manufacturers lagged, as did hotels, resorts & cruise lines.
◼ Security selection and an average overweight stance in financials, specifically in the diversified banks and investment banking & brokerage industries, lagged.
◼ Security selection and an average overweight allocation in Emerging Asia detracted from the portfolio's performance. The portfolio's securities fell short of benchmark constituents, especially those in China and Singapore. Moreover, security selection in Japan dampened relative results.
How is the Fund positioned?
The Fund's regional and country positioning reflects the combined inputs from our top-down global framework and our bottom-up security analysis. Our investment team evaluates macroeconomic factors as well as growth opportunities and actively integrates these into the investment decision-making process. To tap into selective growth potential in the global economy, we favor growth companies with high-quality balance sheets, strong brands, free cash flows, and experienced management—businesses poised to withstand market volatility.
Regarding Fund positioning, we emphasize companies with favorable pricing power, strong earnings momentum, quality balance sheets, and attractive valuations. From a sector standpoint, the portfolio's largest absolute weights are in information technology and consumer discretionary on an absolute basis, while the smallest sector weights with holdings are in utilities and real estate. We maintain overweight allocations in information technology and consumer discretionary versus the index. Semiconductors (within information technology) and broadline retail (within consumer discretionary) constitute the most significant relative overweights. The largest industry underweight positions are application software (information technology) and biotechnology (health care).
Allocations to information technology and consumer discretionary rose during the period, with increased weights in semiconductors and broadline retail. By contrast, allocations to consumer staples and materials decreased, with reductions to packaged foods & meats and diversified metals & mining.
From a regional standpoint, the portfolio's largest weights are in the United States and Emerging Asia, while the smallest absolute weights reside in EMEA and Emerging Latin America. We maintain relative overweight positions in Emerging Asia and Europe, while the portfolio has underweights in the United States and
CALAMOS CLOSED-END FAMILY OF FUNDS ANNUAL REPORT
76
Calamos Global Total Return Fund (Unaudited)
Japan. Allocations to Emerging Asia increased during the period, with additions to China and India. By contrast, the allocation to the United States decreased over the period.
The portfolio's average credit quality is BB+. This is typical for the Fund because our credit process tends to guide us away from the most speculative corporate securities. That said, we recognize that opportunities to enhance performance exist among lower-credit securities.
We are aware of rising interest rates and inflation. Although the Fund invests primarily in equities, the weighted average duration of the bonds in the portfolio is only 2.3 years (as of October 31, 2023). This relatively low-duration average is expected to mitigate portfolio volatility in a rising-rate environment, relative to portfolios with higher-duration bond holdings.
We believe in the prudent use of leverage as a means of enhancing total return and supporting the Fund's distribution rate. As of October 31, 2023, our amount of leveraged assets was approximately 34%.
What are your closing thoughts for Fund shareholders?
Global markets continue to navigate a set of complex conditions. We are analyzing many market drivers, including central bank policy, the inflationary backdrop, corporate earnings, and geopolitical tensions. Considering the global economy and evolving monetary policy, the financial markets remain uncertain, and we expect volatility to continue until these risks are resolved. Given this backdrop, we continue to identify ways to capitalize on volatility, including a range of opportunities at the thematic, regional, and market-cap levels.
In terms of Fund positioning, we emphasize companies with attractive earnings, pricing power, cash flow, and supportive valuations. From a sector perspective, we see opportunities in technology, industrials, health care, consumer, and energy with leading fundamentals. We believe our active, risk-managed investment approach and long-term perspective position us to take advantage of the volatility and opportunities in global markets.
We believe that fiscal and monetary policy, especially rate hikes, are likely to remain important factors that affect the corporate refinancing of debt. Geopolitical factors may also spur market volatility as we continue into next year. With increased volatility, active management is imperative to both manage risk and optimize opportunities. Our exposure to convertible bonds, approximately 22% (percent of net assets) as of October 31, 2023, should allow us to participate in an upswing in equities in a risk-managed manner while not incurring the volatility of longer-duration bonds in a rising-rate environment.
A Note About Your Fund's Portfolio Management Team. Mr. Chuck Carmody, CFA, was named Co-Portfolio Manager of the Fund in December 2023. He joined Calamos in 2004. Since 2022, he has served as Senior Vice President, Co-Portfolio Manager of Calamos Advisors. Previously, in 2016, he was named Vice President, Co-Portfolio Manager, as well as Senior Trader, High Yield, Calamos Advisors. From 2010 to 2016, he held other senior fixed income trading roles at the firm. The Fund's Prospectus contains information relating to the other portfolio managers, as well as Calamos Advisors' "team of teams" approach to portfolio management. The Fund's Statement of Additional Information provides additional information about the Portfolio Managers' compensation, other accounts managed by the Portfolio Managers, and the Portfolio Managers' ownership of securities in the Fund.
www.calamos.com
77
Calamos Global Total Return Fund (CGO) (Unaudited)
INVESTMENT OBJECTIVE AND STRATEGIES
Investment Objective
The Fund's investment objective is to provide total return through a combination of capital appreciation and current income.
Principal Investment Strategies
Under normal circumstances, the Fund will invest primarily in a portfolio of common and preferred stocks, convertible securities and income producing securities such as investment grade and below investment grade (high yield/high risk) debt securities. The Fund, under normal circumstances, will invest at least 50% of its managed assets in equity securities (including securities that are convertible into equity securities). The Fund may invest up to 100% of its managed assets in securities of foreign issuers, including debt and equity securities of corporate issuers and debt securities of government issuers, in developed and emerging markets. Under normal circumstances, the Fund will invest at least 40% of its managed assets in securities of foreign issuers. The Fund will invest in the securities of issuers of several different countries throughout the world, in addition to the United States. "Managed assets" means the total assets of the Fund (including any assets attributable to any leverage that may be outstanding) minus the sub of accrued liabilities (other than debt representing financial leverage). For this purpose, the liquidation preference on the preferred shares will not constitute a liability.
Calamos will dynamically allocate the Fund's investments among multiple asset classes (rather than maintaining a fixed or static allocation), seeking to obtain an appropriate balance of risk and reward on a long-term basis through all market cycles using multiple strategies and combining them to seek to achieve favorable risk adjusted returns.
The Fund will attempt to keep a consistent balance between risk and reward over the course of different market cycles, through various combinations of stocks, bonds, and/or convertible securities, to achieve what Calamos believes to be an appropriate blend for the then current market. As the market environment changes, portfolio securities may change in an attempt to achieve a relatively consistent risk level over time. At some points in a market cycle, one type of security may make up a substantial portion of the Fund's portfolio, while at other times certain securities may have minimal or no representation, depending on market conditions.
The Fund may also seek to generate income from option premiums by writing (selling) options (with an aggregate notional value of up to 33% of the value of the Fund's managed assets). The Fund will opportunistically employ a strategy of writing options. The extent of option writing activity will depend upon market conditions and Calamos' ongoing assessment of the attractiveness of writing options on the Fund's equity holdings. The Fund's derivative activities are principally focused on the following derivatives: interest rate swaps, convertible securities, synthetic convertible instruments, options on individual securities, index options and forward currency exchange contracts ("forward contracts"). However, the Fund reserves the right to invest in other derivative instruments to the extent it is consistent with the Fund's investment objective and restrictions. The Fund may write (sell) call options (i) on a portion of the equity securities (including equity securities obtainable by the Fund through the exercise of its rights with respect to convertible securities it owns) in the Fund's portfolio and (ii) on broad-based securities indices (such as the Standard and Poor's 500® Index ("S&P 500") or the MSCI EAFE® Index ("MSCI EAFE"), which is an index of international equity stocks) or certain ETFs (exchange traded funds) that trade like common stocks but seek to replicate such market indices.
Under normal circumstances, the Fund will invest at least 50% of its managed assets in equity securities (including securities that are convertible into equity securities). The Fund may invest in preferred stocks and convertible securities of any rating, including below investment grade. Equity securities, such as common stock, generally represent an ownership interest in a company. Therefore, the Fund participates in the financial success or failure of any company in which it has an equity interest. The price of equity securities, particularly common stocks, are sensitive to general movements in the stock market. A drop in the stock market may depress the price of equity securities held by the Fund.
The Fund may invest in debt securities, including debt securities of US and foreign corporate issuers (also known as corporate bonds). Holders of corporate bonds, as creditors, have a prior legal claim over common and preferred stockholders as to both income and assets of the issuer for the principal and interest due them and may have a prior claim over other creditors if liens or mortgages are involved. Interest on corporate bonds may be fixed or floating, or the securities may be zero coupon fixed income securities which pay no interest. Corporate bonds contain elements of both interest rate risk and credit risk. The market value of a corporate bond generally may be expected to rise and fall inversely with changes in interest rates and
CALAMOS CLOSED-END FAMILY OF FUNDS ANNUAL REPORT
78
Calamos Global Total Return Fund (CGO) (Unaudited)
may also be affected by the credit rating of the issuer, the issuer's performance and perceptions of the issuer in the marketplace.
The Fund may invest in high yield securities for either current income or capital appreciation or both. These securities are rated below investment grade—i.e., rated "Ba" or lower by Moody's Investors Service, Inc. ("Moody's") or "BB" or lower by Standard & Poor's Financial Services, LLC, a subsidiary of The McGraw-Hill Companies, Inc. ("Standard & Poor's"), or are unrated securities of comparable quality as determined by Calamos, the Fund's investment adviser. The Fund may invest in high yield securities of any rating. Nonconvertible debt securities rated below investment grade are commonly referred to as "junk bonds" and are considered speculative with respect to the issuer's capacity to pay interest and repay principal.
The Fund may invest up to 100% of its managed assets in securities of foreign issuers in developed and emerging markets, including debt and equity securities of corporate issuers and debt securities of government issuers. A foreign issuer is a foreign government or a company organized under the laws of a foreign country.
The Fund may invest in convertible securities. A convertible security is a debt security, debenture, note or preferred stock that is exchangeable for an equity security (typically of the same issuer) at a predetermined price (the "conversion price"). Depending upon the relationship of the conversion price to the market value of the underlying security, a convertible security may trade more like an equity security than a debt instrument. The Fund may invest in convertible securities of any rating. Securities that are convertible into equity securities are considered equity securities for purposes of the Fund's policy to invest at least 50% of its managed assets in equity securities.
The Fund may invest in "synthetic" convertible instruments. A synthetic convertible instrument is a financial instrument (or two or more securities held in tandem) that is designed to simulate the economic characteristics of another instrument (i.e., a convertible security) through the combined economic features of a collection of other securities or assets. Calamos may create a synthetic convertible instrument by combining separate securities that possess the two principal characteristics of a true convertible security, i.e., a fixed-income security ("fixed-income component", which may be a convertible or non-convertible security) and the right to acquire an equity security ("convertible component"). The fixed-income component is achieved by investing in fixed-income securities such as bonds, preferred stocks and money market instruments. The convertible component is achieved by investing in warrants or options to buy common stock at a certain exercise price, or options on a stock index. The fixed income and convertible components may have different issuers, and either component may change at any time.
The Fund may also invest in synthetic convertible instruments created by third parties, typically investment banks. Synthetic convertible instruments created by such parties may be designed to simulate the characteristics of traditional convertible securities or may be designed to alter or emphasize a particular feature. Synthetic convertible instruments may include structured notes, equity-linked notes, mandatory convertibles and combinations of securities and instruments, such as a debt instrument combined with a forward contract. The Fund's holdings of synthetic convertible instruments are considered equity securities for purposes of the Fund's policy to invest at least 50% of its managed assets in equity securities. If the Fund purchases a synthetic convertible instrument, a component of which is an option, such option will not be considered an option for the purpose of the Fund's limitations on options described below.
The Fund may invest without limit in certain securities ("Rule 144A Securities"), such as convertible and debt securities, that are typically purchased in transactions exempt from the registration requirements of the 1933 Act pursuant to Rule 144A under that Act. Under the supervision and oversight of the Fund's Board of Trustees, Calamos will determine whether Rule 144A Securities are liquid. Typically, the Fund purchases Rule 144A Securities only if Calamos has determined them to be liquid.
The securities in which the Fund invests may include zero coupon securities, which are debt obligations that are issued or purchased at a significant discount from face value. The discount approximates the total amount of interest the security will accrue and compound over the period until maturity or the particular interest payment date at a rate of interest reflecting the market rate of the security at the time of issuance. Zero coupon securities do not require the periodic payment of interest. These investments benefit the issuer by mitigating its need for cash to meet debt service, but generally require a higher rate of return to attract investors who are willing to defer receipt of cash. These investments may experience greater volatility in market value than US government or other securities that make regular payments of interest. The Fund accrues income on these investments for tax and accounting purposes, which is distributable to shareholders and which, because no cash is received at the time of accrual, may require the liquidation of other portfolio securities to satisfy the Fund's distribution
www.calamos.com
79
Calamos Global Total Return Fund (CGO) (Unaudited)
obligations, in which case the Fund will forego the opportunity to purchase additional income producing assets with the liquidation proceeds. Zero coupon US government securities include STRIPS and CUBES, which are issued by the US Treasury as component parts of US Treasury bonds and represent scheduled interest and principal payments on the bonds.
The Fund may invest in other securities of various types to the extent consistent with its investment objective. Normally, the Fund invests substantially all of its assets to meet its investment objective. For temporary defensive purposes, the Fund may depart from its principal investment strategies and invest part or all of its assets in securities with remaining maturities of less than one year or cash equivalents; or it may hold cash. During such periods, the Fund may not be able to achieve its investment objective. There are no restrictions as to the ratings of debt securities acquired by the Fund or the portion of the Fund's assets that may be invested in debt securities in a particular ratings category.
The Fund currently uses, and may in the future use, financial leverage. The Fund has obtained financial leverage (i) under an Amended and Restated Liquidity Agreement with State Street Bank and Trust Company that allows the Fund to borrow up to $55 million and (ii) through the issuance of four series of Mandatory Redeemable Preferred Shares ("MRPS" or "MRP Shares") with an aggregate liquidation preference of $17 million.
CALAMOS CLOSED-END FAMILY OF FUNDS ANNUAL REPORT
80
Calamos Long/Short Equity & Dynamic Income Trust (Unaudited)
CALAMOS LONG/SHORT EQUITY & DYNAMIC INCOME TRUST
INVESTMENT TEAM DISCUSSION
Please discuss the Fund's strategy and role within an asset allocation.
Calamos Long/Short Equity & Dynamic Income Trust (CPZ) is a closed-end fund that seeks to provide current income and risk-managed capital appreciation. The Fund provides hedged market exposure through Calamos' time-tested global long/short equity strategy. In addition to seeking to provide an attractive monthly distribution, the Fund's multi-asset income strategy is structured to be potentially less vulnerable to volatile financial markets by actively managing risk with dynamic asset allocation.
The Fund will typically invest at least 80% of its managed assets in a globally diversified portfolio of equity securities, including common stocks, preferred stocks, convertible securities, and exchange traded funds. At least 50% of the portfolio' managed assets are invested in the long/short equity strategy. The Fund may invest up to 20% of its managed assets in global income-producing securities, including high-yield and investment-grade corporate debt.
How did the Fund perform over the annual period?
For the 12 months ended October 31, 2023 ("annual period"), the Fund returned 4.32% on a net asset value (NAV) basis and -2.85% on market price, versus a 6.75% return for the comparator index comprising 50% Bloomberg US Corporate High Yield 2% Issuer Capped Index, 30% MSCI ACWI Index and 20% ICE BofA US All Capital Securities Index.
The Fund's shares traded at a -16.94% discount to NAV on October 31, 2023, compared with a discount of -10.82% 12 months earlier. Portfolio returns coupled with our belief that the Fund was well positioned to generate income and deliver capital appreciation going forward served as an impetus to raise the Fund's distribution rate three times, representing a total $0.0300 per share increase since inception. The Fund's monthly distribution stands at $0.1400 per share as of October 31, 2023, which equates to an annualized distribution rate of 12.24%. Distribution increases are a way for shareholders to benefit directly from the portfolio's returns.
How do NAV and market price returns differ?
Closed-end funds trade on exchanges, where factors other than the value of the underlying securities might drive the price of shares or market price. For example, general market sentiment or future expectations might influence the market price. A fund's NAV return measures the actual return of the individual securities in the portfolio, less fund expenses. It also measures how a manager was able to capitalize on market opportunities. Because we believe closed-end funds are best utilized long term within asset allocations, we deem that the NAV return is the better measure of a fund's performance. However, when managing our Fund, we strongly consider actions and policies to optimize its overall price performance and returns based on market value.
TOTAL RETURN*
Common Shares – Inception 11/29/19
1 Year | Since Inception** | ||||||||||
On Market Price | -2.85 | % | -0.75 | % | |||||||
On NAV | 4.32 | % | 4.06 | % | |||||||
*Total return measures net investment income and net realized gain or loss from Fund investments, and change in net unrealized appreciation or depreciation, assuming reinvestment of income and net realized gains distributions.
**Annualized since inception.
SECTOR WEIGHTINGS
Industrials | 22.6 | % | |||||
Financials | 18.6 | ||||||
Consumer Discretionary | 12.3 | ||||||
Information Technology | 11.6 | ||||||
Health Care | 11.1 | ||||||
Communication Services | 5.9 | ||||||
Other | 3.5 | ||||||
Energy | 3.0 | ||||||
Consumer Staples | 2.5 | ||||||
Utilities | 2.0 | ||||||
Materials | 1.5 | ||||||
Real Estate | 0.3 | ||||||
Airlines | 0.3 | ||||||
Special Purpose Acquisition Companies | 0.2 | ||||||
Sector weightings are based on managed assets and may vary over time. Sector Weightings exclude any government/sovereign bonds or options on broad market indexes the Fund may hold.
www.calamos.com
81
Calamos Long/Short Equity & Dynamic Income Trust (Unaudited)
ASSET ALLOCATION AS OF 10/31/23
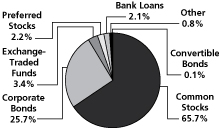
Fund asset allocations are based on total investments and may vary over time.
SINCE INCEPTION MARKET PRICE AND NAV HISTORY THROUGH 10/31/23
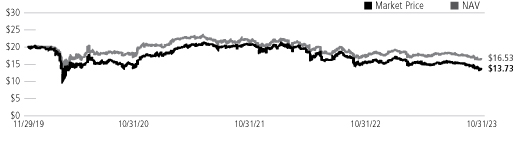
Performance data quoted represents past performance, which is no guarantee of future results. Current performance may be lower or higher than the performance quoted. The principal value of an investment will fluctuate so that your shares, when sold, may be worth more or less than their original cost. Returns at NAV reflect the deduction of the Fund's management fee, debt leverage costs and all other applicable fees and expenses. You can obtain performance data current to the most recent month end by visiting www.calamos.com.
What factors influenced performance over the annual period?
The annual period was extraordinary by most standards, marked by both a European war and the more recent war in the Middle East. Despite calls for a recession, a healthy US job market, firm housing prices, and consumer spending all thwarted that expectation. The Federal Reserve made six rate increases over the period (totaling an additional 225 basis points), bringing the target rate to 5.25% – 5.50%, a 22-year high. While many expected interest rate cuts to be on the table in early 2024, that appears to be unlikely, even though inflationary pressures appear to be abating.
The boyant mood earlier in the year was fueled by the promise of AI, strong summer travel, and further disinflation—all amidst a resilient economy and healthy earnings releases. The consensus capitulated to this optimism, and we concluded that the controlling narrative of disinflation momentum had run its course and would give way to a more ambiguous outlook.
The key feature of the Q3 correction has been its controlled character, particularly in the context of the dramatic move higher in US interest rates. Our hesitation in turning outright bearish reflects the judgment that the US will remain in a disinflation rather than deflation setting through 2024. The impressive GDP releases for Q3 (+8.6% nominal) underline this momentum of US economic activity, which implies the challenge for equities is a question of "price" rather than fundamentals.
Positive real interest rates imply a new emphasis on the time value of money. In 2023, the market has rewarded high free cash flows that can compete with higher bond yields, high-quality balance sheets and secular thematic growth. Other pockets of sectors and styles have been punished depending upon their sensitivity to higher rates. In 2022, higher rates primarily impacted the fast-growing technology and concept names. In Q3, the less profitable and higher leveraged names were punished regardless of sector and style.
Finally, 2023 has highlighted how powerful secular themes can overcome traditional sector and style behavior. In a later-cycle environment where the rate of change for corporate fundamentals grinds to less exciting levels, investors can
CALAMOS CLOSED-END FAMILY OF FUNDS ANNUAL REPORT
82
Calamos Long/Short Equity & Dynamic Income Trust (Unaudited)
overly discount the perceived winners and losers. This overshooting is likely true for AI and obesity (GLP-1) drugs. We anticipate much of this fever pitch to reverse in 2024.
High yield spreads were modestly tighter, closing at 437 basis points on an option-adjusted basis, down from 464 in the prior year. Despite the perceived stability, the trading range for spreads during the period was 150 basis points wide, reflecting the volatility across markets. Lower quality outperformed as CCCs returned 7.4%, B-rated paper returned 6.8%, and more rate-sensitive BBs returned 5.3%. After increasing for most of the year, trailing 12-month defaults came in at 2.6% on a par-weighted basis. We expect this measure to climb and close the 2023 calendar year near the 3.0% post-GFC average. The best-performing sectors in the Bloomberg US High Yield 2% Issuer Capped Index were finance companies (+10.9%), consumer cyclicals (+10.2%), and brokers and asset managers (+3.5), whereas communications (+0.8%), electric utilities (+3.1%), and transportation (+3.3%) represented the significant laggards.
Fund Performance Drivers
We have focused on cyclicals that we believed were still poised to outperform due to the realization of pent-up demand post-pandemic, such as airlines, hotels, gaming, transportation, and defensive stocks, offering compelling valuations. We remain underweight in the poorest quality compartment of long-duration technology and high-multiple consumer staples but have maintained or increased exposure to mega-cap growth (quality GARP). We focused primarily on US positions because we believed opportunities were far less favorable abroad.
Given the overall positive market returns for the period, our hedges on US equity markets have not been helpful over the period.
The Fund's long positions in communication services, consumer discretionary, and information technology as well as short positions on a market index later in the period were the largest contributors. Conversely, short positions in information technology, and long positions in industrials, financials, and health care companies, hindered performance. Both our long and short positions in the consumer staples sector hindered performance over the period.
Preferred Securities. On an unleveraged basis, the Fund's preferred securities performed in line with the ICE BofA United States All Capital Securities Index during the period. Security selection among financials, namely property and casualty insurance companies and energy companies focused on oil & gas storage and transportation, contributed positively to returns. Security selection in real estate, namely other specialized REITs, and the overweight and selection in communication services, specifically alternative carriers, weighed on performance.
High Yield. On an unleveraged basis, the Fund's high-yield securities slightly underperformed the Bloomberg US High Yield 2% Issuer Capped Index for the period. Here again, security selection within the energy services industry was helpful to returns. In addition, the Fund's security selection in health care, namely an overweight in facilities operators, aided returns. Conversely, the Fund's selection in the materials sector, namely container companies, did not support performance, nor did the selection in the consumer discretionary sector, specifically in casinos and gaming companies.
www.calamos.com
83
Calamos Long/Short Equity & Dynamic Income Trust (Unaudited)
Please discuss how the Fund uses leverage.
Given the general financial market improvement that occurred during the annual period, our use of leverage was accretive to performance both on an absolute and relative basis. Increased income earned on bond and preferred investments and rebates earned on our long/short hedging offset higher leverage costs. However, leverage can offer positive reinvestment dynamics over time and has historically been beneficial to the returns of our closed-end funds. Our percentage of leverage was 27% as of October 31, 2023.
How is the Fund positioned?
Long/Short Equity Strategy
The Fund's Long/Short Sleeve underperformed relative to the MSCI ACWI ex USA Index over the period. Net equity exposure (delta-adjusted) concluded the annual period at approximately 14% versus approximately 52% at the end of October 2021. The Fund leaned modestly out of equity risk throughout the period as markets became unsettled by higher interest rates, persistent inflation, the interpretation of Fed policy, the continuing war in Ukraine, a new war in the Middle East, energy concerns in Europe, and increasing economic challenges for China.
The two major themes within technology have been slowing cloud services and further excitement around potential applications for artificial intelligence (AI) following the launch of ChatGPT. The major cloud providers dominate both themes, and we are positioned accordingly. Investors began 2023 concerned about slowing demand for such companies, yet attention quickly shifted to which ones stands to benefit most by incorporating AI into existing and new product offerings.
The Fund has avoided the high multiple, long-duration software names in the past year and this decision feels correct in a "higher for longer" rate setting. While the group's sensitivity to rates is diminishing, many names are merely controversial rather than crowded and profitability is scarce if one factors in stock compensation. It will take years before cash flows can credibly support current valuations. Today's "time value of money" implies investors will be slow to re-embrace "growth at any price."
Outside technology, the Fund favors names that will benefit from a sustained economic expansion into 2024. At the end of the period, our largest exposure was in industrials. The broadest exposures in the sector included diversified industrials and transports. These rallied impressively in H1 but retreated sharply in Q3 2023.
Exposure to selective airlines remains intact. The pricing outlook for airfares should stay constructive for longer than expected due to structural changes on the capacity front. Higher financing costs, pilot shortages, and equipment delays have made it difficult for the lowest-cost players to add capacity. Meanwhile, the recovery in corporate and international travel has gained steam. The post-pandemic inflation surge implies the existing fleets of the legacy carriers cannot be replaced anywhere near their embedded costs, with positive implications for future returns.
Regarding consumer discretionary, also a large Fund position, the portfolio remains biased away from goods in favor of services including core long positions in large hotel enterprises that benefit from corporate and international travel and
CALAMOS CLOSED-END FAMILY OF FUNDS ANNUAL REPORT
84
Calamos Long/Short Equity & Dynamic Income Trust (Unaudited)
sustained revenue per available room (RevPAR) strength. We maintain select leisure-oriented names within the sector.
Health care is the one defensive sector where the Fund has been adding exposure. We like its diversified growth theme, given the cyclicality of other parts of the portfolio, and its credible valuation versus other defensives. It has underperformed in 2023 but is showing relative strength against broader defensives.
Energy remains problematic. The key swing factor will be China, the primary source of consumption growth in recent decades. The setup for higher crude prices was ideal in 2022, yet the inability of markets to benefit from the war-related shortage fears points to a new dynamic in global oil markets.
Financials have been controversial and banks have struggled to garner support in the wake of the March collapses. Higher rates, tepid loan demand, and reduced capital returns in the face of heightened regulatory requirements have all weighed on the industry. We reduced long exposures over the period.
Finally, global investors have discovered the Chinese economic recovery from a disastrous 2022 is underwhelming. There is hope for policy stimulus later in 2023, but this overlooks China's structural problems. China's troubles start with an abrupt downshift in economic potential due to its overcommitment to a centralized investment-led growth model, which can experience abrupt downturns in return on invested capital.
This Achilles heel points to the necessity for far-reaching structural reforms, but these are inherently political. The ability of the system to adapt is hindered by the reality that the entire system—interest rates, access to credit, tax policy, operating licenses, and so forth—is geared to this model. We await the response of the Chinese leadership in late autumn, whose success or failure to regenerate economic vibrancy holds implications for global interest rates in 2024. We have avoided China and had little exposure to other global markets throughout the period.
Dynamic Income Strategy
In preferreds, our largest allocation was in the financials sector, specifically banks. Banks are taking advantage of higher yields on securities and loans to generate higher levels of net interest income, especially those with a low-cost core-deposit funding model. This positive momentum has been offset partially by lower capital markets activity, including underwriting, advisory, and trading. Asset quality at banks and other finance companies remains strong, as should be expected given high employment rates. Energy, utilities and communication services were other sectors with large preferreds exposures.
Among bond holdings, the Fund is currently overweight retailers, pharmaceuticals, and airlines. Several of our retail positions are secured by real estate portfolios with conservative valuations. The Fund's airline positions are mostly secured by planes and loyalty programs. Consumer cyclical services, electric utilities, and technology industries comprise the Fund's largest underweights. The underweight in consumer cyclical services is largely the result of relative value decisions in favor of higher-income opportunities in other industries.
From a credit-quality perspective, the Fund is relatively underweight in below-investment-grade categories and has a corresponding out-of-benchmark allocation to BBB-rated debt.
www.calamos.com
85
Calamos Long/Short Equity & Dynamic Income Trust (Unaudited)
Over the annual period, the team has added to positions in the energy sector, primarily through new positions in independent producers and midstream companies. New holdings in the leisure and automotive industries drove an increase in consumer cyclical exposure. Also, we reduced the portfolio exposure to the other financial sector primarily by eliminating a commercial property management company.
The market's reaction to the November Fed meeting has driven Treasury yields further from the Fed's expectations for its forward rate path. However, Powell noted multiple times that the dot plots released quarterly should only be viewed as a snapshot in time that loses applicability with each incoming data point. Futures markets now indicate four rate cuts will occur in 2024, down from the five cuts the market had priced in at the midyear point. Anticipating the Fed's next move has also led us to selectively reduce our leveraged loan positions, although we maintain a significant loan allocation across mandates based on relative value and seniority considerations.
In our estimation, credit spreads reflect an outlook that is too sanguine. We are beginning to see a deterioration in fundamentals within the leveraged finance space. Although it is too early to determine if this is a wobble or a new trend forming, we are actively reducing exposure to credits we evaluate to be more exposed to a downturn in cyclical activity, those with weak contingent liquidity, or exposure to a rapid deterioration of asset value. Based on our fundamentally driven investment philosophy, we believe there are select high-yield issuers who are compensating investors well for associated risks, and we are maintaining allocations in those areas.
Please discuss the Fund's distributions during the annual period.
Within this Fund, we employ a managed distribution policy with the goal of providing shareholders a consistent distribution stream. The monthly per share distribution rate at the end of the period was $0.1400, up from $0.1100 at inception in November 2019 and representing a 27% increase. Interest rates rose sharply during the annual period, and the yield on the 10-year US Treasury rose from 4.10% to 4.88% by period end, while S&P 500 stocks yielded 1.68% on average. Needless to say, the Fund's 12.24% annualized distribution rate compared favorably to both these fixed income and equity alternatives.
What are your closing thoughts for Fund shareholders?
The timing of the next recession is hard to predict because so much of today's landscape is "different this time." Higher lending rates and tighter bank standards have been blunted by healthy balance sheets and robust corporate earnings. Recession may come later than many expect as the drag of higher rates is offset by fading supply shocks, the legacy of pandemic savings, and pro-cyclical fiscal support.
If the adage that "Bond Markets Never Lie" is true, what are they telling us? Real interest rates have risen more than 100 basis points in 2023, with much of this move occurring since June. While equities have struggled in the past quarter, the pullback has been orderly and, for the major equity benchmarks, underwhelming given the sizable move in rates. Either investors do not believe this rate move will prove long-lasting, or markets are telling us there is a new resiliency to the economic outlook.
CALAMOS CLOSED-END FAMILY OF FUNDS ANNUAL REPORT
86
Calamos Long/Short Equity & Dynamic Income Trust (Unaudited)
Bond markets rarely lie. The US 10-year yield has explained almost two-thirds of the cross-equity return distributions1 in 2023—one of the highest readings in six decades.2 This implies that rate pressures are becoming acute in parts of the economy regardless of its supportive features. These pressures need to culminate soon in a manner that moderates economic activity and eases financial conditions into 2024.
Progress on inflation and surprisingly resilient economic growth allowed the Federal Reserve to pause its rate-hiking campaign at its September and November meetings. The extended pause allows the committee to evaluate incoming data for another six weeks. It's clear the Fed is looking for continued improvement in PCE Core Services (ex-housing). However, the message between the September and November meetings changed. A recession is still not the base case for the Fed, as they aim for a soft landing. But apart from inflation, they have broadened the variables they are watching closely to determine whether an adequate level of restrictive policy has been met. Specifically, they are monitoring more balance in the labor market and a broader set of financial conditions driven by markets.
We expect future months and quarters to show a drop in consumer and business investment as a reduction in disposable income through higher borrowing costs rolls into more areas of economic activity. We are squarely in the "impatiently waiting" phase, looking to ascertain how much economic momentum will be lost from past policy changes. There is still a high level of uncertainty concerning potential economic outcomes, and a recession cannot be dismissed.
1 The aggregate of individual stock deviations of performance versus the equity benchmark and the degree to which these deviations are correlated (or explained) by movements in the US 10-year yield.
2 Today's result ranks in the top 15 readings of the past 70 years and more than 4X the average of that period.
www.calamos.com
87
Calamos Long/Short Equity & Dynamic Income Trust (CPZ) (Unaudited)
INVESTMENT OBJECTIVE AND STRATEGIES
Investment Objective
The Fund's investment objective is to seek current income and risk-managed capital appreciation.
Principal Investment Strategies
The Fund will invest, under normal circumstances, at least 80% of its managed assets in a globally diversified portfolio comprised of equity securities which are defined to include common stock, preferred stock, convertible securities, and exchange-traded funds ("ETFs") (the "Equity Sleeve"),* as well as long and short equity positions managed pursuant to a long/short equity strategy (the "Long/Short Component"). The Long/Short Component will comprise at least 50% of the Fund's managed assets with a focus on absolute returns in a risk-managed format. The Fund may invest up to 20% of its managed assets opportunistically in globally diversified income-producing securities, including high-yield and investment grade corporate securities, leveraged loans, distressed debt securities, securitized products, US Treasuries and sovereign debt issued by foreign governments (the "Fixed Income Sleeve"). "Managed assets" means the Fund's total assets (including any assets attributable to any financial leverage that may be outstanding) minus the sum of liabilities (other than debt representing financial leverage).
The Fund will invest in common stock, preferred stock and convertible securities (including synthetic convertible instruments) issued by both US and foreign companies without regard to market capitalization. Convertible securities include, but are not limited to, any corporate debt security, debentures, notes or preferred stock that may be converted into equity securities of companies around the world, including in emerging markets. A synthetic convertible instrument is a financial instrument (or two or more securities held in tandem) that is designed to simulate the economic characteristics of a convertible security through the combined features of a debt instrument and a security providing an option on an equity security.
In the Long/Short Component, the Fund seeks to achieve its investment objective by taking long positions in companies that are expected to outperform the equity markets, while taking short positions in companies that are expected to underperform the equity markets and/or for hedging purposes. A long position arises where the Fund holds a security in its portfolio. The Fund will have a short position where it sells a security it does not own by delivery of a borrowed security. The Fund may maintain long and short positions through the use of derivative instruments, such as options, futures and forward contracts. The Fund's Long/Short Component utilizes a variety of methods to evaluate long and short equity investments of various market capitalizations to find securities that the Adviser believes offer the potential for capital gains, including common stock and American Depositary Receipts ("ADRs") of issuers of all market capitalizations, including other investment companies (including ETFs) that track or otherwise provide exposure to such sectors. As part of this strategy, the Adviser seeks to invest in industries, sectors and securities that it believes are more attractive on either a relative basis or on an absolute basis. In addition to purchasing, or taking "long" positions in equity securities, the Fund's investment strategy includes short selling, and may include investments in derivatives, ETFs, and/or fixed income securities.
In the Fixed Income Sleeve, the Fund will mainly invest in a globally-diversified portfolio of income producing securities including, highyield and investment grade corporate securities, leveraged loans, distressed debt securities, securitized products, US Treasuries and sovereign debt issued by foreign governments. Some of the loans in which the Fund may invest may be "covenant-lite" loans, which means the loans contain fewer or no maintenance covenants than other loans and do not include terms which allow the lender to monitor the performance of the borrower and declare a default if certain criteria are breached.
The Fund may invest up to 50% of its managed assets in securities of foreign issuers; provided, however, the Fund will not invest more than 25% of its managed assets in securities of issuers located in a single country other than the US and 20% of its managed assets in securities of issuers located in emerging market countries. The Fund may invest up to 30% of its managed assets in securities of European domiciled issuers.
The Fund's derivative activities are principally focused on the following derivatives: interest rate swaps, convertible securities, synthetic convertible instruments, options on individual securities, index options, long calls, short calls, long puts, short puts and protective puts. The Fund may utilize derivatives for investment and hedging purposes. In addition, as a non-fundamental policy, the Fund may also invest up to 20% of its managed assets in derivatives for non-hedging purposes. The use of
* This is a non-fundamental policy and may be changed by the Board of Trustees of the Fund provided that shareholders are provided with at least 60 days' prior written notice of any change as required by the rules under the 1940 Act.
CALAMOS CLOSED-END FAMILY OF FUNDS ANNUAL REPORT
88
Calamos Long/Short Equity & Dynamic Income Trust (CPZ) (Unaudited)
derivatives for non-hedging purposes may be considered more speculative than other types of investments. However, the Fund reserves the right to invest in other derivative instruments to the extent consistent with the Fund's investment objective and restrictions.
The portions of the Fund's assets invested in the aforementioned sleeves and securities will vary from time to time consistent with the Fund's investment objective. In addition, the Adviser has appointed a committee consisting of senior management (the "CPZ Allocation Committee") to determine the percentage of the Fund's assets to be allocated to each such sleeve. The CPZ Allocation Committee meets quarterly, or more frequently if needed, to review and adjust the specific allocation ranges based upon its judgment of economic, market and regulatory conditions in a manner consistent with the Fund's investment objective. Actual allocations may vary at any time due to market movements, changes in equity prices, changes in interest rates and other economic factors.
The Fund currently uses, and may in the future use, financial leverage. The Fund has obtained financial leverage under an Amended and Restated Liquidity Agreement with State Street Bank and Trust Company ("SSB Agreement") that allows the Fund to borrow up to $150 million.
Term Structure
The Fund will dissolve on the twelfth anniversary of the effective date of the Fund's registration statement (the "Dissolution Date"); provided, that if the Board of Trustees (the "Board") believes that, under then-current market conditions, it is in the best interests of the Fund to do so, the Fund may extend the Dissolution Date: (i) once for up to one year, and (ii) once for up to an additional six months, in each case upon the affirmative vote of a majority of the Board and without Shareholder (as defined below) approval. In addition, as of a date within twelve months preceding the Dissolution Date, the Board may cause the Fund to conduct a tender offer to all Shareholders to purchase Shares (as defined below) of the Fund at a price equal to the NAV per Share on the expiration date of the tender offer (the "Eligible Tender Offer"). The Board has established that, following the Eligible Tender Offer, the Fund must have at least $100 million of net assets to ensure the continued viability of the Fund (the "Dissolution Threshold"). In the Eligible Tender Offer, the Fund will offer to purchase all Shares tendered by each Shareholder; provided, that if the number of properly tendered Shares would result in the Fund's net assets totaling less than the Dissolution Threshold, the Eligible Tender Offer will be terminated and no Common Shares will be repurchased pursuant to the Eligible Tender Offer. Instead, the Fund will begin (or continue) liquidating or winding up its portfolio and proceed to dissolve on the Dissolution Date. The investment adviser to the Fund, Calamos, will pay all costs and expenses associated with the making of the Eligible Tender Offer, other than brokerage and related transaction costs associated with disposition of portfolio investments in connection with the Eligible Tender Offer, which will be borne by the Fund and its Shareholders. The Eligible Tender Offer, if pursued, will be made, and Shareholders will be notified thereof, in accordance with the requirements of the 1940 Act, the Securities Exchange Act of 1934 (the "Exchange Act") and the applicable tender offer rules thereunder (including Rule 13e-4 and Regulation 14E under the Exchange Act). If the number of properly tendered Shares would result in the Fund's net assets totaling greater than the Dissolution Threshold, all Shares properly tendered and not withdrawn will be purchased by the Fund pursuant to the terms of the Eligible Tender Offer. Following the completion of the Eligible Tender Offer, the Board may eliminate the Dissolution Date upon the affirmative vote of a majority of the Board and without Shareholder approval. In making a decision to eliminate the Dissolution Date to provide for the Fund's perpetual existence, the Board will take such actions with respect to the continued operations of the Fund as it deems to be in the best interests of the Fund, based on market conditions at such time, the extent of Shareholder participation in the Eligible Tender Offer and all other factors deemed relevant by the Board in consultation with the Adviser, taking into account that the Adviser may have a potential conflict of interest in seeking to convert to a perpetual trust. The Fund is not a so called "target date" or "life cycle" fund whose asset allocation becomes more conservative over time as its target date, often associated with retirement, approaches. In addition, the Fund is not a "target term" fund whose investment objective is to return its original NAV on the Dissolution Date. The Fund's investment objective and policies are not designed to seek to return to investors that purchase Shares in this offering their initial investment of $20.00 per Share on the Dissolution Date or in the Eligible Tender Offer, and such investors and investors that purchase Shares after the completion of this offering may receive more or less than their original investment upon dissolution or in the Eligible Tender Offer.
www.calamos.com
89
Principal Risks of the Funds
The factors that are most likely to have a material effect on a particular Fund's portfolio as a whole are called "principal risks." Each Fund is subject to the principal risks indicated below, whether through direct investment or derivative positions. Each Fund may be subject to additional risks other than those identified and described below because the types of investments made by a Fund can change over time.
|
Portfolio Level Risks |
CPZ |
CGO |
CCD |
CSQ |
CHW |
CHI |
CHY |
||||||||||||||||||||||||
|
American Depositary Receipts Risk |
x |
x |
x |
x |
x |
x |
x |
||||||||||||||||||||||||
|
Antitakeover Provisions |
x |
x |
x |
x |
x |
x |
x |
||||||||||||||||||||||||
|
Cash Holdings Risk |
x |
x |
x |
x |
x |
x |
x |
||||||||||||||||||||||||
|
Contingent Liabilities Risk |
x |
x |
x |
x |
x |
x |
x |
||||||||||||||||||||||||
|
Convertible Hedging/Short Sales Risk |
x |
||||||||||||||||||||||||||||||
|
Convertible Securities Risk |
x |
x |
x |
x |
x |
x |
x |
||||||||||||||||||||||||
|
Correlation Risk |
x |
||||||||||||||||||||||||||||||
|
Counterparty and Settlement Risk |
x |
x |
x |
x |
x |
x |
x |
||||||||||||||||||||||||
|
Covenant-Lite Loans Risk |
x |
x |
x |
x |
x |
x |
x |
||||||||||||||||||||||||
|
Credit Risk |
x |
x |
x |
x |
x |
x |
x |
||||||||||||||||||||||||
|
Debt Securities Risk |
x |
x |
x |
x |
x |
x |
x |
||||||||||||||||||||||||
|
Decline in Net Asset Value Risk |
x |
x |
x |
x |
x |
x |
|||||||||||||||||||||||||
|
Default Risk |
x |
x |
x |
x |
x |
x |
x |
||||||||||||||||||||||||
|
Derivatives Risk |
x |
x |
x |
x |
x |
x |
x |
||||||||||||||||||||||||
|
Diminished Voting Power and Excess Cash Risk |
x |
x |
x |
x |
x |
x |
x |
||||||||||||||||||||||||
|
Duration Mismatch Risk |
x |
||||||||||||||||||||||||||||||
|
Duration Risk |
x |
x |
x |
x |
x |
x |
x |
||||||||||||||||||||||||
|
Early Redemption Risk |
x |
x |
x |
x |
x |
x |
x |
||||||||||||||||||||||||
|
Emerging Markets Risk |
x |
x |
x |
x |
x |
x |
x |
||||||||||||||||||||||||
|
Equity Securities Risk |
x |
x |
x |
x |
x |
x |
x |
||||||||||||||||||||||||
|
Fixed Income Securities Risk |
x |
||||||||||||||||||||||||||||||
|
Foreign Securities Risk |
x |
x |
x |
x |
x |
x |
x |
||||||||||||||||||||||||
|
Forward Currency Exchange Contract Risks |
x |
x |
x |
x |
x |
x |
x |
||||||||||||||||||||||||
|
Futures and Forward Contracts Risk |
x |
x |
x |
x |
|||||||||||||||||||||||||||
|
General Derivative Risks |
x |
||||||||||||||||||||||||||||||
|
Geographic Concentration Risk |
x |
x |
x |
||||||||||||||||||||||||||||
|
Geographic Focus Risk |
x |
x |
x |
x |
|||||||||||||||||||||||||||
|
High Yield Securities Risk |
x |
x |
x |
x |
x |
x |
x |
||||||||||||||||||||||||
|
Interest Rate Risk |
x |
x |
x |
x |
x |
x |
x |
||||||||||||||||||||||||
|
Interest Rate Transactions Risk |
x |
x |
x |
x |
x |
x |
x |
||||||||||||||||||||||||
|
Leverage Risk |
x |
||||||||||||||||||||||||||||||
|
Liquidity Risk |
x |
x |
x |
x |
x |
x |
x |
||||||||||||||||||||||||
|
Management Risk |
x |
x |
x |
x |
x |
x |
x |
||||||||||||||||||||||||
|
Market Discount Risk |
x |
||||||||||||||||||||||||||||||
|
Master Limited Partnership Risk |
x |
x |
x |
x |
|||||||||||||||||||||||||||
|
Maturity Risk |
x |
x |
x |
x |
x |
x |
x |
||||||||||||||||||||||||
|
Non-Convertible Income Securities Risk |
x |
x |
x |
x |
x |
x |
x |
||||||||||||||||||||||||
|
Non-US Government Obligation Risk |
x |
x |
x |
x |
x |
x |
|||||||||||||||||||||||||
|
Other Investment Companies (including ETFs) Risk |
x |
x |
x |
x |
x |
x |
|||||||||||||||||||||||||
|
Portfolio Selection Risk |
x |
x |
x |
x |
x |
x |
x |
||||||||||||||||||||||||
|
Portfolio Turnover Risk |
x |
x |
x |
x |
x |
x |
x |
||||||||||||||||||||||||
|
Preferred Share Liquidation Preference Risk |
x |
||||||||||||||||||||||||||||||
|
Recent Market Events |
x |
x |
x |
x |
x |
x |
x |
||||||||||||||||||||||||
|
REIT Risk |
x |
x |
x |
x |
x |
x |
|||||||||||||||||||||||||
CALAMOS CLOSED-END FAMILY OF FUNDS ANNUAL REPORT
90
Principal Risks of the Funds
|
Portfolio Level Risks |
CPZ |
CGO |
CCD |
CSQ |
CHW |
CHI |
CHY |
||||||||||||||||||||||||
|
Risks Associated with Options |
x |
x |
x |
x |
x |
x |
x |
||||||||||||||||||||||||
|
Rule 144A Securities Risk |
x |
x |
x |
x |
x |
x |
x |
||||||||||||||||||||||||
|
Sector Risk |
x |
x |
x |
x |
x |
x |
x |
||||||||||||||||||||||||
|
Short Selling Risk |
x |
x |
x |
||||||||||||||||||||||||||||
|
Synthetic Convertible Instruments Risk |
x |
x |
x |
x |
x |
x |
x |
||||||||||||||||||||||||
|
Tax Risk |
x |
x |
x |
x |
x |
x |
x |
||||||||||||||||||||||||
|
US Government Security Risk |
x |
x |
x |
x |
x |
x |
x |
||||||||||||||||||||||||
|
Volatility Risk |
x |
||||||||||||||||||||||||||||||
|
Fund Level and Other Risks |
CPZ |
CGO |
CCD |
CSQ |
CHW |
CHI |
CHY |
||||||||||||||||||||||||
|
Currency Risk |
x |
x |
x |
x |
x |
x |
x |
||||||||||||||||||||||||
|
Cybersecurity Risk |
x |
x |
x |
x |
x |
x |
x |
||||||||||||||||||||||||
|
Inflation Risk |
x |
x |
x |
x |
x |
x |
x |
||||||||||||||||||||||||
|
Leverage Risk |
x |
x |
x |
x |
x |
x |
x |
||||||||||||||||||||||||
|
Limited Term Risk |
x |
x |
|||||||||||||||||||||||||||||
|
Loan Risk |
x |
x |
x |
x |
x |
x |
x |
||||||||||||||||||||||||
|
Market Discount Risk |
x |
x |
x |
x |
x |
x |
x |
||||||||||||||||||||||||
|
Market Disruption Risk |
x |
x |
x |
x |
x |
x |
x |
||||||||||||||||||||||||
|
Market Impact Risk |
x |
x |
x |
x |
x |
x |
x |
||||||||||||||||||||||||
|
Ratings and Asset Coverage Risk |
x |
x |
x |
x |
x |
x |
x |
||||||||||||||||||||||||
|
Reduction of Leverage Risk |
x |
x |
x |
x |
x |
x |
x |
||||||||||||||||||||||||
|
Regulatory Risk |
x |
||||||||||||||||||||||||||||||
|
Secondary Market Risk |
x |
x |
x |
x |
x |
x |
x |
||||||||||||||||||||||||
|
Senior Leverage Risk |
x |
x |
x |
x |
x |
x |
|||||||||||||||||||||||||
www.calamos.com
91
Principal Risks of the Funds
Portfolio Level Risks
American Depositary Receipts Risk. The stocks of most foreign companies that trade in the US markets are traded as ADRs. US depositary banks issue these stocks. Each ADR represents one or more shares of foreign stock or a fraction of a share. The price of an ADR corresponds to the price of the foreign stock in its home market, adjusted to the ratio of the ADRs to foreign company shares. Therefore, while purchasing a security on a US exchange, the risks inherently associated with foreign investing still apply to ADRs.
Antitakeover Provisions. The Fund's Agreement and Declaration of Trust and By-Laws include provisions that could limit the ability of other entities or persons to acquire control of the Fund or to change the composition of its Board of Trustees. Such provisions could limit the ability of shareholders to sell their shares at a premium over prevailing market prices by discouraging a third party from seeking to obtain control of the Fund. These provisions include staggered terms of office for the Trustees, advance notice requirements for shareholder proposals, and super-majority voting requirements for certain transactions with affiliates, converting the Fund to an open-end investment company or a merger, asset sale or similar transaction. Holders of preferred shares have voting rights in addition to and separate from the voting rights of common shareholders with respect to certain of these matters. Holders of any preferred shares, voting separately as a single class, have the right to elect at least two Trustees at all times. The holders of preferred shares or debt, if any, on the one hand, and the holders of the common shares, on the other, may have interests that conflict with each other in certain situations, including conflicts that relate to the fees and expenses of the Fund.
Cash Holdings Risk. To the extent the Fund holds cash positions, the Fund risks achieving lower returns and potential lost opportunities to participate in market appreciation which could negatively impact the Fund's performance and ability to achieve its investment objective.
Contingent Liabilities Risk. Entering into derivative contracts in order to pursue the Fund's various hedging strategies could require the Fund to fund cash payments in the future under certain circumstances, including an event of default or other early termination event, or the decision by a counterparty to request margin in the form of securities or other forms of collateral under the terms of the derivative contract or applicable laws. The amounts due with respect to a derivative contract would generally be equal to the unrealized loss of the open positions with the respective counterparty and could also include other fees and charges. These payments are contingent liabilities and therefore may not appear on the Fund's balance sheet. The Fund's ability to fund these contingent liabilities will depend on the liquidity of the Fund's assets and access to capital at the time, and the need to fund these contingent liabilities could adversely impact the Fund's financial condition.
Convertible Hedging/Short Sales Risk. The Fund may incur a loss (without limit) as a result of a short sale if the market value of the borrowed security increases between the date of the short sale and the date the Fund replaces the security. The Fund may be unable to repurchase the borrowed security at a particular time or at an acceptable price. If the market price of the common stock issuable upon exercise of a convertible security increases above the conversion price on the convertible security, the price of the convertible security will increase. The Fund's increased liability on the short position would, in whole or in part, reduce this gain. If the price of the common stock declines, any decline in the price of the convertible security would offset, in whole or in part, the Fund's gain on the short position. The use of short sales could increase the Fund's exposure to the market, magnify losses and increase the volatility of returns.
Convertible Securities Risk. The value of a convertible security is influenced by both the yield of non- convertible securities of comparable issuers and by the value of the underlying common stock. The value of a convertible security viewed without regard to its conversion feature (i.e., strictly on the basis of its yield) is sometimes referred to as its "investment value." A convertible security's investment value tends to decline as prevailing interest rate levels increase. Conversely, a convertible security's investment value tends to increase as prevailing interest rate levels decline.
Correlation Risk. Imperfect correlation between the value of derivative instruments and the underlying assets of the Fund creates the possibility that the loss on such instruments may be greater than the gain in the value of the underlying assets in the Fund's portfolio.
Counterparty and Settlement Risk (all Funds except CPZ). Trading options, futures contracts, swaps and other derivative financial instruments entails credit risk with respect to the counterparties with whom and through which the Fund trades. Such instruments when traded over the counter do not include the same protections as may apply to trading derivatives on organized Calamos—We note that CPZ includes a more robust version of this risk disclosure. We think it is appropriate to include this version as well. exchanges. Substantial losses may arise from the insolvency, bankruptcy or default of a counterparty and risk of settlement default of parties with whom the Fund trades securities. This risk may be heightened
CALAMOS CLOSED-END FAMILY OF FUNDS ANNUAL REPORT
92
Principal Risks of the Funds
during volatile market conditions. Settlement mechanisms in emerging markets are generally less developed and reliable than those in more developed countries, thus increasing the risks. In the past, broker-dealers and other financial institutions have experienced extreme financial difficulty, sometimes resulting in bankruptcy of the institution. Although Calamos monitors the creditworthiness of the Fund's counterparties, there can be no assurance that the Fund's counterparties will not experience similar difficulties, possibly resulting in losses to the Fund. If a counterparty becomes bankrupt, or otherwise fails to perform its obligations under a derivative contract due to financial difficulties, the Fund may experience significant delays in obtaining any recovery under the derivative contract in a bankruptcy or other reorganization proceeding. The Fund may obtain only a limited recovery or may obtain no recovery in such circumstances. Material exposure to a single or small group of counterparties increases the Fund's counterparty risk.
Counterparty and Settlement Risk (CPZ). Trading options, futures contracts, swaps and other derivative financial instruments entails credit risk with respect to the counterparties with whom and through which the Fund trades. Such instruments when traded over the counter do not include the same protections as may apply to trading derivatives on organized exchanges. Substantial losses may arise from the insolvency, bankruptcy or default of a counterparty and risk of settlement default of parties with whom the Fund trades securities. This risk may be heightened during volatile market conditions. Settlement mechanisms in emerging markets are generally less developed and reliable than those in more developed countries, thus increasing the risks. Counterparty risk is the risk that the other party in a derivative transaction will not fulfill its contractual obligation. Changes in the credit quality of the Fund's counterparties with respect to its derivative transactions may affect the value of those instruments. By entering into derivatives, the Fund assumes the risk that its counterparties could experience financial hardships that could call into question their continued ability to perform their obligations. As a result, concentrations of such derivatives in any one counterparty would subject the Fund to an additional degree of risk with respect to defaults by such counterparty.
"Covenant-Lite" Loans Risk. Some of the loans in which the Fund may invest may be "covenant-lite" loans, which means the loans contain fewer or no maintenance covenants than other loans and do not include terms which allow the lender to monitor the performance of the borrower and declare a default if certain criteria are breached. The Fund may experience delays in enforcing its rights on its holdings of covenant-lite loans.
However, a convertible security's market value tends to reflect the market price of the common stock of the issuing company when that stock price is greater than the convertible security's "conversion price." The conversion price is defined as the predetermined price at which the convertible security could be exchanged for the associated stock. As the market price of the underlying common stock declines, the price of the convertible security tends to be influenced more by the yield of the convertible security and changes in interest rates. Thus, the convertible security may not decline in price to the same extent as the underlying common stock. In the event of a liquidation of the issuing company, holders of convertible securities would be paid before the company's common stockholders.
If a counterparty becomes bankrupt or otherwise fails to perform its obligations under a derivative contract due to financial difficulties, such bankruptcy or failure to perform is likely to result in a default under such derivative contract, unless such default is cured. Default by a party with whom the Fund enters into a hedging transaction may result in the loss of unrealized profits, leaving the Fund with unsecured exposure and force the Fund to cover its resale commitments, if any, at the then current market price. It may not always be possible to dispose of or close out a hedging position without the consent of the hedging counterparty, and the Fund may not be able to enter into an offsetting contract in order to cover its risk. The Fund cannot assure its shareholders that a liquid secondary market will exist for hedging instruments purchased or sold, and the Fund may be required to maintain a position until exercise or expiration, which could result in losses.
Furthermore, upon the bankruptcy of a counterparty, the Fund may experience significant delays in obtaining any recovery under the derivative contract in a dissolution, assignment for the benefit of creditors, liquidation, winding-up, bankruptcy, or other analogous proceeding. In addition, in the event of the insolvency of a counterparty to a derivative transaction, the derivative transaction would typically be terminated at its fair market value. If the Fund is owed this fair market value in the termination of the derivative transaction and its claim is unsecured, the Fund will be treated as a general creditor of such counterparty, and will not have any claim with respect to the underlying security. The Fund may obtain only a limited recovery or may obtain no recovery in such circumstances and the enforceability of agreements for hedging transactions may depend on compliance with applicable statutory and other regulatory requirements and, depending on the identity of the counterparty, applicable international requirements.
www.calamos.com
93
Principal Risks of the Funds
Certain interest rate and credit default swaps are subject to mandatory clearing, in which case a central clearing counterparty stands between each buyer and seller and effectively guarantees performance of each derivative contract, to the extent of its available resources for such purpose. As a result, the counterparty risk is now shifted from bilateral risk between the parties to the individual credit risk of the central clearing counterparty and the futures commission merchant through which the Fund holds its cleared position. Even in such case, there can be no assurance that a clearing house, or its members, will satisfy the clearing house's obligations to the Fund. Uncleared derivatives have no such protection; each party bears the risk that its direct counterparty will default.
Credit Risk. An issuer of a fixed income security could be downgraded or default. If the Fund holds securities that have been downgraded, or that default on payment, the Fund's performance could be negatively affected.
Debt Securities Risk. The Fund may invest in debt securities, including corporate bonds and high yield securities. In addition to the risks described elsewhere in the Fund's prospectus (such as high yield securities risk and interest rate risk), debt securities are subject to certain additional risks, including issuer risk and reinvestment risk. Issuer risk is the risk that the value of debt securities may decline for a number of reasons which directly relate to the issuer, such as management performance, leverage and reduced demand for the issuer's goods and services. Reinvestment risk is the risk that income from the Fund's portfolio will decline if the Fund invests the proceeds from matured, traded or called bonds at market interest rates that are below the Fund portfolio's current earnings rate. A decline in income could affect the market price of the Fund's common shares or the overall return of the Fund.
Decline in Net Asset Value Risk. A material decline in the Fund's NAV may impair the Fund's ability to maintain required levels of asset coverage for any outstanding borrowings or any debt securities or preferred shares.
Default Risk. Default risk refers to the risk that a company that issues a convertible or debt security will be unable to fulfill its obligations to repay principal and interest. The lower a debt security is rated, the greater its default risk. As a result, the Fund may incur cost and delays in enforcing its rights against the defaulting issuer.
Derivatives Risk. Generally, derivatives are financial contracts whose value depends on, or is derived from, the value of an underlying asset, reference rate or index, and may relate to individual debt or equity instruments, interest rates, currencies or currency exchange rates, commodities, related indexes and other assets. The Fund may utilize a variety of derivative instruments including, but not limited to, interest rate swaps, caps, and floors, convertible securities, synthetic convertible instruments, options on individual securities, index options, long calls, covered calls, long puts, cash-secured short puts and protective puts for hedging, risk management and investment purposes.
The Fund's use of derivative instruments involves investment risks and transaction costs to which the Fund would not be subject absent the use of these instruments and, accordingly, may result in losses greater than if they had not been used. The use of derivative instruments may have risks including, among others, leverage risk, duration mismatch risk, correlation risk, liquidity risk, interest rate risk, volatility risk, credit risk, management risk and counterparty risk. Derivatives also involve the risk of mispricing or improper valuation and the risk that changes in the value of a derivative may not correlate perfectly with an underlying asset, interest rate or index. Suitable derivative transactions may not be available in all circumstances and there can be no assurance that the Fund will engage in these transactions to reduce exposure to other risks when that would be beneficial.
Furthermore, the skills needed to employ derivatives strategies are different from those needed to select portfolio securities and, in connection with such strategies, the Fund makes predictions with respect to market conditions, liquidity, currency movements, market values, interest rates and other applicable factors, which may be inaccurate. Thus, the use of derivative instruments may require the Fund to sell or purchase portfolio securities at inopportune times or for prices below or above the current market values, may limit the amount of appreciation the Fund can realize on an investment or may cause the Fund to hold a security that it might otherwise want to sell. Tax rules governing the Fund's transactions in derivative instruments may also affect whether gains and losses recognized by the Fund are treated as ordinary or capital, accelerate the recognition of income or gains to the Fund, defer losses to the Fund, and cause adjustments in the holding periods of the Fund's securities, thereby affecting, among other things, whether capital gains and losses are treated as short-term or long-term. These rules could therefore affect the amount, timing and/or character of distributions to shareholders. In addition, there may be situations in which the Fund elects not to use derivative instruments that result in losses greater than if they had been used. Amounts paid by the Fund as premiums and cash or other assets held in margin accounts with respect to the Fund's derivative instruments would not be available to the Fund for other investment purposes, which may result in lost
CALAMOS CLOSED-END FAMILY OF FUNDS ANNUAL REPORT
94
Principal Risks of the Funds
opportunities for gain. Derivative instruments can be illiquid, may disproportionately increase losses and may have a potentially large impact on Fund performance.
Diminished Voting Power and Excess Cash Risk. The voting power of current shareholders will be diluted to the extent that such shareholders do not purchase shares in any future common share offerings or do not purchase sufficient shares to maintain their percentage interest. In addition, if the Fund is unable to invest the proceeds of such offering as intended, its per share distribution may decrease (or may consist of return of capital) and the Fund may not participate in market advances to the same extent as if such proceeds were fully invested as planned.
Duration Mismatch Risk. The duration of a derivative instrument may be significantly different than the duration of the related liability or asset.
Duration Risk. Duration measures the time-weighted expected cash flows of a fixed-income security, which can determine its sensitivity to changes in the general level of interest rates. The value of securities with longer durations tend to be more sensitive to interest rate changes than securities with shorter durations. The longer the Fund's dollar-weighted average duration, the more its value can generally be expected to be sensitive to interest rate changes than a fund with a shorter dollar-weighted average duration. Duration differs from maturity in that it considers a security's coupon payments in addition to the amount of time until the security matures. Various techniques may be used to shorten or lengthen the Fund's duration. As the value of a security changes over time, so will its duration.
Early Redemption Risk. The Fund may voluntarily redeem preferred shares or may be forced to redeem preferred shares to meet regulatory requirements and the asset coverage requirements of the preferred shares. Such redemptions may be at a time that is unfavorable to holders of the preferred shares
Emerging Markets Risk. Emerging market countries may have relatively unstable governments and economies based on only a few industries, which may cause greater instability. The value of emerging market securities will likely be particularly sensitive to changes in the economies of such countries. These countries are also more likely to experience higher levels of inflation, deflation or currency devaluations, which could adversely affect the value of the Fund's investments and hurt those countries' economies and securities markets. Securities issued in these countries may be more volatile and less liquid than securities issued in foreign countries with more developed economies or markets. Loss may also result from the imposition of exchange controls, confiscations and other government restrictions, or from problems in share registration, settlement, custody, or other operational risks.
Equity Securities Risk. Equity investments are subject to greater fluctuations in market value than other asset classes as a result of such factors as the issuer's business performance, investor perceptions, stock market trends and general economic conditions. Equity securities are subordinated to bonds and other debt instruments in a company's capital structure in terms of priority to corporate income and liquidation payments. The Fund may invest in preferred stocks and convertible securities of any rating, including below investment grade.
Below investment grade securities or comparable unrated securities are considered predominantly speculative with respect to the issuer's ability to pay interest and principal and are susceptible to default or decline in market value due to adverse economic and business developments. The market values for below investment grade securities tend to be very volatile, and these securities are generally less liquid than investment- grade debt securities. For these reasons, your investment in the Fund is subject to the following specific risks:
• increased price sensitivity to changing interest rates and to a deteriorating economic environment;
• greater risk of loss due to default or declining credit quality;
• adverse company specific events are more likely to render the issuer unable to make interest and/or principal payments; and
• if a negative perception of the below investment grade market develops, the price and liquidity of below investment grade securities may be depressed. This negative perception could last for a significant period of time.
Fixed Income Securities Risk. The Fund may invest in fixed income securities, including corporate, municipal, and government bonds. Fixed income securities are subject to the risk of decreasing value in periods of increasing interest rates, as well as the risk that the issuer of such securities could be downgraded or default, causing the credit rating of the securities to drop and thus generally decreasing the value of such securities.
www.calamos.com
95
Principal Risks of the Funds
Foreign Securities Risk. Investments in non-US issuers may involve unique risks compared to investing in securities of US issuers. These risks are more pronounced to the extent that the Fund invests a significant portion of its non-US investments in one region or in the securities of emerging market issuers. These risks may include:
• less information may be available about non-US issuers or markets due to less rigorous disclosure or accounting standards or regulatory practices in foreign jurisdictions;
• many non-US markets are smaller, less liquid and more volatile. In a changing market, Calamos may not be able to sell the Fund's portfolio securities at times, in amounts and at prices it considers reasonable;
• an adverse effect of currency exchange rate changes or controls on the value of the Fund's investments;
• the economies of non-US countries may grow at slower rates than expected or may experience a downturn or recession;
• economic, political and social developments may adversely affect the securities markets in foreign jurisdictions, including expropriation and nationalization;
• the difficulty in obtaining or enforcing a court judgment in non-US countries;
• restrictions on foreign investments in non-US jurisdictions;
• difficulties in effecting the repatriation of capital invested in non-US countries;
• withholding and other non-US taxes may decrease the Fund's return;
• the ability for the Public Company Accounting Oversight Board, which regulates auditors of US public companies, is unable to inspect audit work papers in certain foreign countries;
• often limited rights and few practical remedies to pursue shareholder claims, including class actions or fraud claims, and the ability of the Commission, the US Department of Justice and other authorities to bring and enforce actions against foreign issuers or foreign persons is limited; and
• dividend income the Fund receives from foreign securities may not be eligible for the special tax treatment applicable to qualified dividend income.
Based upon the Fund's test for determining whether an issuer is a "foreign issuer", it is possible that an issuer of securities in which the Fund invests could be organized under the laws of a foreign country, yet still conduct a substantial portion of its business in the US or have substantial assets in the US. In this case, such a "foreign issuer" may be subject to the market conditions in the US to a greater extent than it may be subject to the market conditions in the country of its organization.
There may be less publicly available information about non-US markets and issuers than is available with respect to US securities and issuers. Non-US companies generally are not subject to accounting, auditing and financial reporting standards, practices and requirements comparable to those applicable to US companies. The trading markets for most non-US securities are generally less liquid and subject to greater price volatility than the markets for comparable securities in the United States. The markets for securities in certain emerging markets are in the earliest stages of their development. Even the markets for relatively widely traded securities in certain non-US markets, including emerging market countries, may not be able to absorb, without price disruptions, a significant increase in trading volume or trades of a size customarily undertaken by institutional investors in the United States. Additionally, market making and arbitrage activities are generally less extensive in such markets, which may contribute to increased volatility and reduced liquidity.
Economies and social and political conditions in individual countries may differ unfavorably from those in the United States. Non-US economies may have less favorable rates of growth of gross domestic product, rates of inflation, currency valuation, capital reinvestment, resource self-sufficiency and balance of payments positions. Many countries have experienced substantial, and in some cases extremely high, rates of inflation for many years. Inflation and rapid fluctuations in inflation rates have had, and may continue to have, very negative effects on the economies and securities markets of certain emerging countries. Unanticipated political or social developments may also affect the values of the Fund's investments and the availability to the Fund of additional investments in such countries.
Forward Currency Exchange Contracts Risk. Forward contracts are contractual agreements to purchase or sell a specified currency at a specified future date (or within a specified time period) at a price set at the time of the contract. The Fund may
CALAMOS CLOSED-END FAMILY OF FUNDS ANNUAL REPORT
96
Principal Risks of the Funds
not fully benefit from, or may lose money on, forward currency exchange transactions if changes in currency exchange rates do not occur as anticipated or do not correspond accurately to changes in the value of the Fund's holdings.
Futures and Forward Contracts Risk. Futures contracts provide for the future sale by one party and purchase by another of a specific asset at a specific time and price (with or without delivery required). Futures contracts are standardized contracts traded on a recognized exchange. An option on a futures contract gives the purchaser the right, in exchange for a premium, to assume a position in a futures contract at a specified exercise price during the term of the option. Futures and forward contracts are subject to counterparty risk, meaning that the party who issues the derivatives (the clearinghouse or the broker holding the Fund's position for a futures contract or the counterparty for a forward contract) may experience a significant credit event and may be unwilling or unable to make timely settlement payments or otherwise honor its obligations.
General Derivative Risks. Derivatives also involve the risk of mispricing or improper valuation and the risk that changes in the value of a derivative may not correlate perfectly with an underlying asset, interest rate or index. Suitable derivative transactions may not be available in all circumstances and there can be no assurance that the Fund will engage in these transactions to reduce exposure to other risks when that would be beneficial. Furthermore, the skills needed to employ derivatives strategies are different from those needed to select portfolio securities and, in connection with such strategies, the Fund may make predictions with respect to market conditions, liquidity, currency movements, market values, interest rates and other applicable factors, which may be inaccurate. Thus, the use of derivative instruments may require the Fund to sell or purchase portfolio securities at inopportune times or for prices below or above the current market values, may limit the amount of appreciation the Fund can realize on an investment or may cause the Fund to hold a security that it might otherwise want to sell. Tax rules governing the Fund's transactions in derivative instruments may also affect whether gains and losses recognized by the Fund are treated as ordinary or capital, accelerate the recognition of income or gains to the Fund, defer losses to the Fund, and cause adjustments in the holding periods of the Fund's securities, thereby affecting, among other things, whether capital gains and losses are treated as short-term or long-term. These rules could therefore affect the amount, timing and/or character of distributions to shareholders. In addition, there may be situations in which the Fund elects not to use derivative instruments that result in losses greater than if they had been used. Amounts paid by the Fund as premiums and cash or other assets held in margin accounts with respect to the Fund's derivative instruments would not be available to the Fund for other investment purposes, which may result in lost opportunities for gain. Derivative instruments can be illiquid, may disproportionately increase losses and may have a potentially large impact on Fund performance.
Geographic Concentration Risk. Investments in a particular country or geographic region may be particularly susceptible to political, diplomatic or economic conditions and regulatory requirements. To the extent the Fund concentrates its investments in a particular country, region or group of regions, the Fund may be more volatile than a more geographically diversified fund.
Geographic Focus Risk. Investments in a particular country or geographic region may be particularly susceptible to political, diplomatic or economic conditions and regulatory requirements. To the extent the Fund focuses its investments in a particular country, region or group of regions, the Fund may be more volatile than a more geographically diversified fund.
High Yield Securities Risk. The Fund may invest in high yield securities of any rating. Investment in high yield securities involves substantial risk of loss. Below investment grade non-convertible debt securities or comparable unrated securities are commonly referred to as "junk bonds" and are considered predominantly speculative with respect to the issuer's ability to pay interest and principal and are susceptible to default or decline in market value due to adverse economic and business developments. The market values for high yield securities tend to be very volatile, and these securities are less liquid than investment grade debt securities. For these reasons, your investment in the Fund is subject to the following specific risks:
• increased price sensitivity to changing interest rates and to a deteriorating economic environment;
• greater risk of loss due to default or declining credit quality;
• adverse company specific events are more likely to render the issuer unable to make interest and/or principal payments; and
• if a negative perception of the high yield market develops, the price and liquidity of high yield securities may be depressed. This negative perception could last for a significant period of time.
www.calamos.com
97
Principal Risks of the Funds
Adverse changes in economic conditions are more likely to lead to a weakened capacity of a high yield issuer to make principal payments and interest payments than an investment grade issuer. The principal amount of high yield securities outstanding has proliferated in the past decade as an increasing number of issuers have used high yield securities for corporate financing. An economic downturn could severely affect the ability of highly leveraged issuers to service their debt obligations or to repay their obligations upon maturity. The Fund may incur additional expenses to the extent it is required to seek recovery upon a default in payment of principal or interest on its portfolio holdings. In certain circumstances, the Fund may be required to foreclose on an issuer's assets and take possession of its property or operations. In such circumstances, the Fund would incur additional costs in disposing of such assets and potential liabilities from operating any business acquired.
The secondary market for high yield securities may not be as liquid as the secondary market for more highly rated securities, a factor which may have an adverse effect on the Fund's ability to dispose of a particular security. There are fewer dealers in the market for high yield securities than for investment grade obligations. The prices quoted by different dealers may vary significantly and the spread between the bid and asked price is generally much larger than for higher quality instruments. Under adverse market or economic conditions, the secondary market for high yield securities could contract further, independent of any specific adverse changes in the condition of a particular issuer, and these instruments may become illiquid. As a result, the Fund could find it more difficult to sell these securities or may be able to sell the securities only at prices lower than if such securities were widely traded. Prices realized upon the sale of such lower rated or unrated securities, under these circumstances, may be less than the prices used in calculating the Fund's NAV.
Interest Rate Risk. In addition to the risks described above, debt securities, including high yield securities, are subject to certain risks, including:
• if interest rates go up, the value of debt securities in the Fund's portfolio generally will decline;
• during periods of declining interest rates, the issuer of a security may exercise its option to prepay principal earlier than scheduled, forcing the Fund to reinvest in lower yielding securities. This is known as call or prepayment risk. Debt securities frequently have call features that allow the issuer to repurchase the security prior to its stated maturity. An issuer may redeem an obligation if the issuer can refinance the debt at a lower cost due to declining interest rates or an improvement in the credit standing of the issuer;
• during periods of rising interest rates, the average life of certain types of securities may be extended because of slower than expected principal payments. This may lock in a below market interest rate, increase the estimated period until the security is paid in full and reduce the value of the security. This is known as extension risk;
• rising interest rates could result in an increase in the cost of the Fund's leverage and could adversely affect the ability of the Fund to meet asset coverage requirements with respect to leverage;
• variable rate securities generally are less sensitive to interest rate changes but may decline in value if their interest rates do not rise as much, or as quickly, as interest rates in general. When the Fund holds variable rate securities, a decrease in market interest rates will adversely affect the income received from such securities and the NAV of the Fund's shares; and
• to the extent the Federal Reserve Board continues to raise interest rates, there is a risk that interest rates across the financial system may also rise. Increases in volatility and interest rates in the fixed-income market may expose the Fund to heightened interest rate risk.
Interest Rate Transactions Risk. The Fund may enter into an interest rate swap, cap or floor transaction to attempt to protect itself from increasing dividend or interest expenses on its leverage resulting from increasing short-term interest rates and to hedge its portfolio securities. A decline in interest rates may result in a decline in the value of the swap or cap, which may result in a decline in the NAV of the Fund.
Depending on the state of interest rates in general, the Fund's use of interest rate swap or cap transactions could enhance or harm the overall performance of the common shares. To the extent there is a decline in interest rates, the value of the interest rate swap or cap could decline and could result in a decline in the NAV of the common shares. In addition, if the counterparty to an interest rate swap or cap defaults, the Fund would not be able to use the anticipated net receipts under the swap or cap to offset the dividend or interest payments on the Fund's leverage or offset certain losses in its portfolio. Depending on whether the Fund would be entitled to receive net payments from the counterparty on the swap or cap, which in turn would depend on the general state of short-term interest rates at that point in time, such a default could negatively impact the performance of the common shares. In addition, at the time an interest rate swap or cap transaction
CALAMOS CLOSED-END FAMILY OF FUNDS ANNUAL REPORT
98
Principal Risks of the Funds
reaches its scheduled termination date, there is a risk that the Fund would not be able to obtain a replacement transaction or that the terms of the replacement would not be as favorable as on the expiring transaction. If either of these events occurs, it could have a negative impact on the performance of the common shares.
If the Fund fails to maintain a required 200% asset coverage of the liquidation value of any outstanding preferred shares or if the Fund loses its rating on its preferred shares or fails to maintain other covenants with respect to the preferred shares, the Fund may be required to redeem some or all of the preferred shares. Similarly, the Fund could be required to prepay the principal amount of any debt securities or other borrowings. Such redemption or prepayment would likely result in the Fund seeking to terminate early all or a portion of any swap or cap transaction. Early termination of a swap could result in a termination payment by or to the Fund. Early termination of a cap could result in a termination payment to the Fund. The Fund intends to segregate with its custodian cash or liquid securities having a value at least equal to the Fund's net payment obligations under any swap transaction, marked-to-market daily.
Currently, certain categories of interest rate swaps are subject to mandatory clearing, and more are expected to be cleared in the future. The counterparty risk for cleared derivatives is generally lower than for uncleared OTC derivative transactions because generally a clearing organization becomes substituted for each counterparty to a cleared derivative contract and, in effect, guarantees the parties' performance under the contract as each party to a trade looks only to the clearing house for performance of financial obligations. However, there can be no assurance that a clearing house, or its members, will satisfy the clearing house's obligations to the Fund.
Leverage Risk. The derivative instruments in which the Fund may invest will give rise to forms of financial leverage, which may magnify the risk of owning such instruments. Derivatives generally involve leverage in the sense that the investment exposure created by the derivatives may be significantly greater than the Fund's initial investment in the derivative. Accordingly, if the Fund enters into a derivative transaction, it could lose substantially more than the principal amount invested.
Additionally, as a closed-end investment company registered with the SEC, the Fund is subject to the federal securities laws, including the 1940 Act, the rules thereunder, and various SEC and SEC staff interpretive positions. In accordance with these laws, rules and positions, the Fund may "set aside" liquid assets (often referred to as "asset segregation"), or engage in other SEC or staff-approved measures, to "cover" open positions with respect to certain portfolio management techniques, such as engaging in reverse repurchase agreements, dollar rolls, entering into credit default swaps or futures contracts, or purchasing securities on a when-issued or delayed delivery basis, that may be considered senior securities under the 1940 Act. The Fund intends to cover its derivative positions by maintaining an amount of cash or liquid securities in a segregated account equal to the face value of those positions and by offsetting derivative positions against one another or against other assets to manage the effective market exposure resulting from derivatives in its portfolio. To the extent that the Fund does not segregate liquid assets or otherwise cover its obligations under such transactions, such transactions will be treated as senior securities representing indebtedness for purposes of the requirement under the 1940 Act that the Fund may not enter into any such transactions if the Fund's borrowings would thereby exceed 33 1/3% of its managed assets, less all liabilities and indebtedness of the Fund not represented by senior securities. However, these transactions, even if covered, may represent a form of economic leverage and will create risks. In addition, these segregation and coverage requirements could result in the Fund maintaining securities positions that it would otherwise liquidate, segregating assets at a time when it might be disadvantageous to do so or otherwise restricting portfolio management. Such segregation and cover requirements will not limit or offset losses on related positions.
Liquidity Risk. The Fund may invest without limit in securities that, at the time of investment, are illiquid (i.e., any investment that the Fund reasonably expects cannot be sold or disposed of in current market conditions in seven calendar days or less without the sale or disposition significantly changing the market value of the investment). The Fund may also invest without limit in Rule 144A Securities determined to be liquid. Calamos, under the supervision and oversight of the Board of Trustees, will determine whether Rule 144A Securities are illiquid (that is, not readily marketable). Illiquid securities may be difficult to dispose of at a fair price at the times when the Fund believes it is desirable to do so. Investment of the Fund's assets in illiquid securities may restrict the Fund's ability to take advantage of market opportunities. The market price of illiquid securities generally is more volatile than that of more liquid securities, which may adversely affect the price that the Fund pays for or recovers upon the sale of illiquid securities. Illiquid securities are also more difficult to value and may be fair valued in which case Calamos' judgment may play a greater role in the valuation process. The risks associated with illiquid securities may be particularly acute in situations in which the Fund's operations require cash and could result in the Fund borrowing to meet its short-term needs or incurring losses on the sale of illiquid securities. The Fund may also invest without limitation in securities that have not been registered for public sale, but that are eligible for purchase and sale by certain qualified institutional buyers.
www.calamos.com
99
Principal Risks of the Funds
Management Risk. Calamos' judgment about the attractiveness, relative value or potential appreciation of a particular sector, security or investment strategy may prove to be incorrect.
Market Discount Risk. The market price of exchanged-listed preferred shares that the Fund may issue may also be affected by such factors as the Fund's use of leverage, dividend stability, portfolio credit quality, liquidity, and the Fund's dividends paid (which are, in turn, affected by expenses), call protection for portfolio securities and interest rate movements.
Master Limited Partnerships Risk. Investments in MLPs involve risks that differ from investments in common stock. Holders of MLP common units are subject to certain risks inherent in the structure of MLPs, including (i) tax risks, (ii) risk related to limited control of management or the general partner or managing member, (iii) limited rights to vote on matters affecting the MLP, except with respect to extraordinary transactions, (iv) conflicts of interest between the general partner or managing member and its affiliates, on the one hand, and the limited partners or members, on the other hand, including those arising from incentive distribution payments or corporate opportunities, and (v) cash flow risks. MLP common units and other equity securities can be affected by macro-economic and other factors affecting the stock market in general, expectations of interest rates, investor sentiment towards MLPs or the energy sector, changes in a particular issuer's financial condition, or unfavorable or unanticipated poor performance of a particular issuer (in the case of MLPs, generally measured in terms of distributable cash flow). Prices of common units of individual MLPs and other equity securities also can be affected by fundamentals unique to the partnership or company, including cash flow growth, cash generating power and distribution coverage.
Although certain MLPs may trade on national securities exchanges, certain MLPs may trade less frequently than those of larger companies due to their market capitalizations. Due to limited trading volumes of certain MLPs, the prices of such MLPs may display abrupt or erratic movements at times. Additionally, it may be more difficult for the Fund to buy and sell significant amounts of such securities without an unfavorable impact on prevailing market prices. The Fund's investment in securities that are less actively traded or over time experience decreased trading volume may restrict its ability to dispose of the securities at a fair price. Such a situation may prevent the Fund from limiting losses or realizing gains. This also may adversely affect the Fund's ability to make dividend distributions to shareholders.
MLPs are generally treated as partnerships for US federal income tax purposes. Partnerships do not pay US federal income tax at the partnership level. Rather, each partner is allocated a share of the partnership's income, gains, losses, deductions and expenses. A change in current tax law, or a change in the business of a given MLP, could result in an MLP being treated as a corporation for US federal income tax purposes. As a result, the amount of cash available for distribution by the MLP would be reduced and the after-tax return to the Fund with respect to its investment in such MLPs would be materially reduced. Thus, if any of the MLPs owned by the Fund were treated as corporations for US federal income tax purposes, it could result in a reduction in the value of the Fund.
Maturity Risk. Interest rate risk will generally affect the price of a fixed income security more if the security has a longer maturity. Fixed income securities with longer maturities will therefore be more volatile than other fixed income securities with shorter maturities. Conversely, fixed income securities with shorter maturities will be less volatile but generally provide lower potential returns than fixed income securities with longer maturities. The average maturity of the Fund's investments may affect the volatility of the Fund's share price.
Non-Convertible Income Securities Risk. The Fund will also invest in non-convertible income securities. The Fund's investments in non-convertible income securities may have fixed or variable principal payments and all types of interest rate and dividend payment and reset terms, including fixed rate, adjustable rate, zero coupon, contingent, deferred, payment in kind and auction rate features. Recent events in the fixed-income markets, including the potential impact of the Federal Reserve Board tapering its quantitative easing program, may expose the Fund to heightened interest rate risk and volatility as a result of a rise in interest rates. In addition, the Fund is subject to the risk that interest rates may exhibit increased volatility, which could cause the Fund's net asset value ("NAV") to fluctuate more. A decrease in fixed-income market maker capacity may act to decrease liquidity in the fixed-income markets and act to further increase volatility, affecting the Fund's return.
Non-US Government Obligation Risk. An investment in debt obligations of non-US governments and their political subdivisions involves special risks that are not present in corporate debt obligations. The non-US issuer of the sovereign debt or the non-US governmental authorities that control the repayment of the debt may be unable or unwilling to repay principal or interest when due, and the Fund may have limited recourse in the event of a default. During periods of economic uncertainty, the market prices of sovereign debt may be more volatile than prices of debt obligations of US issuers.
CALAMOS CLOSED-END FAMILY OF FUNDS ANNUAL REPORT
100
Principal Risks of the Funds
Other Investment Companies (including ETFs) Risk. Investments in the securities of other investment companies, including ETFs, may involve duplication of advisory fees and certain other expenses. By investing in another investment company or ETF, the Fund becomes a shareholder thereof. As a result, Fund shareholders indirectly bear the Fund's proportionate share of the fees and expenses indirectly paid by shareholders of the other investment company or ETF, in addition to the fees and expenses Fund shareholders bear in connection with the Fund's own operations. If the investment company or ETF fails to achieve its investment objective, the value of the Fund's investment will decline, adversely affecting the Fund's performance. In addition, closed-end investment company and ETF shares potentially may trade at a discount or a premium and are subject to brokerage and other trading costs, which could result in greater expenses to the Fund. In addition, the Fund may engage in short sales of the securities of other investment companies. When the Fund shorts securities of another investment company, it borrows shares of that investment company which it then sells. The Fund closes out a short sale by purchasing the security that it has sold short and returning that security to the entity that lent the security.
Portfolio Selection Risk. The value of your investment may decrease if the investment adviser's judgment about the attractiveness, value or market trends affecting a particular security, issuer, industry or sector or about market movements is incorrect.
Portfolio Turnover Risk. The portfolio managers may actively and frequently trade securities or other instruments in the Fund's portfolio to carry out its investment strategies. A high portfolio turnover rate increases transaction costs, which may increase the Fund's expenses. Frequent and active trading may also cause adverse tax consequences for investors in the Fund due to an increase in short term capital gains.
Preferred Share Liquidation Preference Risk. Preferred shares, if issued and outstanding, will be junior in liquidation and with respect to distribution rights to debt securities and any other borrowings. Senior securities representing indebtedness may constitute a substantial lien and burden on preferred shares by reason of their prior claim against our income and against our net assets in liquidation. The Fund may not be permitted to declare dividends or other distributions with respect to any series of preferred shares unless at such time the Fund meets applicable asset coverage requirements and the payment of principal or interest is not in default with respect to any borrowings.
Recent Market Events. Since the 2008 financial crisis, financial markets throughout the world have experienced increased periods of volatility, depressed valuations, decreased liquidity and heightened uncertainty and turmoil. This turmoil resulted in unusual and extreme volatility in the equity and debt markets, in the prices of individual securities and in the world economy. Events that have contributed to these market conditions include, but are not limited to, major cybersecurity events, geopolitical events (such as wars (including Russia's military invasion of the Ukraine), terror attacks, natural or environmental disasters, country instability, and public health emergencies), measures to address budget deficits, downgrading of sovereign debt, declines in oil and commodity prices, dramatic changes in currency exchange rates, and public sentiment. In addition, many governments and quasi-governmental entities throughout the world have responded to the turmoil with a variety of significant fiscal and monetary policy changes, including, but not limited to, direct capital infusions into companies, new monetary programs and dramatically lower interest rates.
The full extent of the political, economic and legal consequences of Brexit are not yet fully known, and the long-term impact of Brexit on the UK, the EU and the broader global economy may be significant. As a result of the political divisions within the UK and between the UK and the EU that the referendum vote has highlighted and the uncertain consequences of Brexit, the UK and European economies and the broader global economy could be significantly impacted, potentially resulting in increased market volatility and illiquidity, political, economic, and legal uncertainty, and lower economic growth for companies that rely significantly on Europe for their business activities and revenues. Any further exits from the EU, or the possibility of such exits, or the abandonment of the Euro, may cause additional market disruption globally and introduce new legal and regulatory uncertainties.
In addition, policy and legislative changes in the United States and in other countries are changing many aspects of financial regulation. The impact of these changes on the markets, and the practical implications for market participants, may not be fully known for some time. Widespread disease and virus epidemics and pandemics, such as the coronavirus outbreak, could likewise be highly disruptive, adversely affecting individual companies, sectors, industries, markets, currencies, interest and inflation rates, credit ratings, investor sentiment, and other factors affecting the value of the Fund's investments.
REIT Risk. Investing in real estate investment trusts ("REITs") involves certain unique risks in addition to those risks associated with investing in the real estate industry in general. An equity REIT may be affected by changes in the value of the underlying properties owned by the REIT. A mortgage REIT may be affected by changes in interest rates and the ability of the issuers of
www.calamos.com
101
Principal Risks of the Funds
its portfolio mortgages to repay their obligations. REITs are dependent upon the skills of their managers and are not diversified. REITs are generally dependent upon maintaining cash flows to repay borrowings and to make distributions to shareholders and are subject to the risk of default by lessees or borrowers. REITs whose underlying assets are concentrated in properties used by a particular industry, such as health care, are also subject to risks associated with such industry.
REITs (especially mortgage REITs) are also subject to interest rate risks. When interest rates decline, the value of a REIT's investment in fixed rate obligations can be expected to rise. Conversely, when interest rates rise, the value of a REIT's investment in fixed rate obligations can be expected to decline. If the REIT invests in adjustable rate mortgage loans the interest rates on which are reset periodically, yields on a REIT's investments in such loans will gradually align themselves to reflect changes in market interest rates. This causes the value of such investments to fluctuate less dramatically in response to interest rate fluctuations than would investments in fixed rate obligations.
REITs may have limited financial resources, may utilize significant amounts of leverage, may trade less frequently and in a limited volume and may be subject to more abrupt or erratic price movements than larger company securities. Historically, REITs have been more volatile in price than the larger capitalization stocks included in Standard & Poor's 500 Stock Index.
Risks Associated with Options (all Funds except CPZ). There are several risks associated with transactions in options. For example, there are significant differences between the securities markets and options markets that could result in an imperfect correlation among these markets, causing a given transaction not to achieve its objectives. A decision as to whether, when and how to use options involves the exercise of skill and judgment, and even a well- conceived transaction may be unsuccessful to some degree because of market behavior or unexpected events. The Fund's ability to utilize options successfully will depend on Calamos' ability to predict pertinent market movements, which cannot be assured.
The Fund may sell options on individual securities and securities indices. All call options sold by the Fund must be "covered." Even though the Fund will receive the option premium to help protect it against loss, a call option sold by the Fund exposes the Fund during the term of the option to possible loss of opportunity to realize appreciation in the market price of the underlying security or instrument and may require the Fund to hold a security or instrument that it might otherwise have sold. In addition, a loss on a call option sold may be greater than the premium received. The Fund may purchase and sell put options on individual securities and securities indices. In selling put options, there is a risk that the Fund may be required to buy the underlying security at a disadvantageous price above the market price.
Risks Associated with Options (CPZ). The Fund may use options, including on the Fund's convertible securities or during the creation of synthetic convertible instruments. There are several risks associated with transactions in options. For example, there are significant differences between the securities markets and options markets that could result in an imperfect correlation among these markets, causing a given transaction not to achieve its objectives. A decision as to whether, when and how to use options involves the exercise of skill and judgment, and even a well-conceived transaction may be unsuccessful to some degree because of market behavior or unexpected events. The Fund's ability to utilize options successfully will depend on Calamos' ability to predict pertinent market movements, which cannot be assured.
The Fund intends to seek to generate income from option premiums by writing (selling) options. The Fund may write (sell) call options (i) on a portion of the equity securities (including securities that are convertible into equity securities) in the Fund's portfolio, (ii) on a portion of the equity securities the Fund has a right to receive upon conversion of a convertible security that it owns at the time it writes the call, and (iii) on broad-based securities indexes (such as the S&P 500 or MSCI EAFE) or certain ETFs that trade like common stocks but seek to replicate such market indexes. All call options sold by the Fund must be "covered", other than those sold in the Long/Short Component. For example, a call option written by the Fund will require the Fund to hold the securities subject to the call (or securities convertible into the needed securities without additional consideration) or to segregate cash or liquid assets sufficient to purchase and deliver the securities if the call is exercised. Even though the Fund will receive the option premium to help protect it against loss, a call option sold by the Fund exposes the Fund during the term of the option to possible loss of opportunity to realize appreciation in the market price of the underlying security or instrument and may require the Fund to hold a security or instrument that it might otherwise have sold. The Fund may purchase and sell put options on individual securities and securities indices. In selling put options, there is a risk that the Fund may be required to buy the underlying security at a disadvantageous price above the market price. A put option written by the Fund requires the Fund to segregate cash or liquid assets equal to the exercise price minus any margin the Fund is required to post.
Rule 144A Securities Risk. The Fund may invest in securities that are issued and sold through transactions under Rule 144A of the Securities Act of 1933. Under the supervision and oversight of the Board of Trustees, Calamos will determine whether
CALAMOS CLOSED-END FAMILY OF FUNDS ANNUAL REPORT
102
Principal Risks of the Funds
Rule 144A Securities are illiquid. If qualified institutional buyers are unwilling to purchase these Rule 144A Securities, the percentage of the Fund's assets invested in illiquid securities would increase. Typically, the Fund purchases Rule 144A Securities only if the Fund's adviser has determined them to be liquid. If any Rule 144A Security held by the Fund should become illiquid, the value of the security may be reduced and a sale of the security may be more difficult.
Sector Risk. To the extent the Fund invests a significant portion of its assets in a particular sector, a greater portion of the Fund's performance may be affected by the general business and economic conditions affecting that sector. Each sector may share economic risk with the broader market, however there may be economic risks specific to each sector. As a result, returns from those sectors may trail returns from the overall stock market and it is possible that the Fund may underperform the broader market, or experience greater volatility.
Short Selling Risk. The Fund will engage in short sales for investment and risk management purposes, including when the Adviser believes an investment will underperform due to a greater sensitivity to earnings growth of the issuer, default risk or interest rates. In times of unusual or adverse market, economic, regulatory or political conditions, the Fund may not be able, fully or partially, to implement its short selling strategy. Periods of unusual or adverse market, economic, regulatory or political conditions may exist for extended periods of time.
Short sales are transactions in which the Fund sells a security or other instrument that it does not own but can borrow in the market. Short selling allows the Fund to profit from a decline in market price to the extent such decline exceeds the transaction costs and the costs of borrowing the securities and to obtain a low cost means of financing long investments that the Adviser believes are attractive. If a security sold short increases in price, the Fund may have to cover its short position at a higher price than the short sale price, resulting in a loss. The Fund will have substantial short positions and must borrow those securities to make delivery to the buyer under the short sale transaction. The Fund may not be able to borrow a security that it needs to deliver or it may not be able to close out a short position at an acceptable price and may have to sell related long positions earlier than it had expected. Thus, the Fund may not be able to successfully implement its short sale strategy due to limited availability of desired securities or for other reasons. Also, there is the risk that the counterparty to a short sale may fail to honor its contractual terms, causing a loss to the Fund.
Generally, the Fund will have to pay a fee or premium to borrow securities and will be obligated to repay the lender of the security any dividends or interest that accrues on the security during the term of the loan. The amount of any gain from a short sale will be decreased, and the amount of any loss increased, by the amount of such fee, premium, dividends, interest or expense the Fund pays in connection with the short sale.
Until the Fund replaces a borrowed security, it may be required to maintain a segregated account of cash or liquid assets with a broker or custodian to cover the Fund's short position. Generally, securities held in a segregated account cannot be sold unless they are replaced with other liquid assets. The Fund's ability to access the pledged collateral may also be impaired in the event the broker becomes bankrupt, insolvent or otherwise fails to comply with the terms of the contract. In such instances the Fund may not be able to substitute or sell the pledged collateral and may experience significant delays in obtaining any recovery in a bankruptcy or other reorganization proceeding. The Fund may obtain only a limited recovery or may obtain no recovery in these circumstances. Additionally, the Fund must maintain sufficient liquid assets (less any additional collateral pledged to the broker), marked-to-market daily, to cover the borrowed securities obligations. This may limit the Fund's investment flexibility, as well as its ability to meet other current obligations.
Because losses on short sales arise from increases in the value of the security sold short, such losses are theoretically unlimited. By contrast, a loss on a long position arises from decreases in the value of the security and is limited by the fact that a security's value cannot decrease below zero. The Adviser's use of short sales in combination with long positions in the Fund's portfolio in an attempt to improve performance or reduce overall portfolio risk may not be successful and may result in greater losses or lower positive returns than if the Fund held only long positions. It is possible that the Fund's long securities positions will decline in value at the same time that the value of its short securities positions increase, thereby increasing potential losses to the Fund. In addition, the Fund's short selling strategies will limit its ability to fully benefit from increases in the fixed-income markets.
By investing the proceeds received from selling securities short, the Fund could be deemed to be employing a form of leverage, which creates special risks. The use of leverage may increase the Fund's exposure to long securities positions and make any change in the Fund's NAV greater than it would be without the use of leverage. This could result in increased
www.calamos.com
103
Principal Risks of the Funds
volatility of returns. There is no guarantee that any leveraging strategy the Fund employs will be successful during any period in which it is employed.
Synthetic Convertible Instruments Risk. The value of a synthetic convertible instrument may respond differently to market fluctuations than a convertible instrument because a synthetic convertible instrument is composed of two or more separate securities, each with its own market value. In addition, if the value of the underlying common stock or the level of the index involved in the convertible component falls below the exercise price of the warrant or option, the warrant or option may lose all value. Synthetic convertible instruments created by other parties have the same attributes of a convertible security; however, the issuer of the synthetic convertible instrument assumes the credit risk associated with the investment, rather than the issuer of the underlying equity security into which the instrument is convertible. Investing in synthetic convertible instruments also involves the risk that the Fund does not achieve the investment exposure desired by Calamos. The Fund remains subject to the credit risk associated with the counterparty creating the synthetic convertible instrument.
Tax Risk. The Fund may invest in certain securities, such as certain convertible securities and high yield securities, for which the federal income tax treatment may not be clear or may be subject to re-characterization by the Internal Revenue Service ("IRS"). It could be more difficult for the Fund to comply with certain federal income tax requirements applicable to regulated investment companies if the tax characterization of the Fund's investments is not clear or if the tax treatment of the income from such investments was successfully challenged by the IRS. In addition, the tax treatment of the Fund may be affected by future interpretations of the Internal Revenue Code of 1986, as amended and changes in the tax laws and regulations, all of which may apply with retroactive effect.
US Government Security Risk. Some securities issued by US Government agencies or government sponsored enterprises are not backed by the full faith and credit of the US and may only be supported by the right of the agency or enterprise to borrow from the US Treasury. There can be no assurance that the US Government will always provide financial support to those agencies or enterprises.
Volatility Risk. Risk may arise in connection with the use of derivative instruments from volatility of interest rates and the prices of reference instruments.
Fund Level and Other Risks
Currency Risk. To the extent that the Fund invests in securities or other instruments denominated in or indexed to foreign currencies, changes in currency exchange rates bring an added dimension of risk. Currency fluctuations could negatively impact investment gains or add to investment losses. Although the Fund may attempt to hedge against currency risk, the hedging instruments may not always perform as the Fund expects and could produce losses. Suitable hedging instruments may not be available for currencies of emerging market countries. The Fund's investment adviser may determine not to hedge currency risks, even if suitable instruments appear to be available.
Cybersecurity Risk. Investment companies, such as the Fund, and their service providers are exposed to operational and information security risks resulting from cyberattacks, which may result in financial losses to a fund and its shareholders. Cyber-attacks include, among other behaviors, stealing or corrupting data maintained online or digitally, denial of service attacks on websites, "ransomware" that renders systems inoperable until ransom is paid, the unauthorized release of confidential information, or various other forms of cybersecurity breaches. Cyber-attacks affecting the Fund or the Adviser, custodian, transfer agent, distributor, administrator, intermediaries, trading counterparties, and other third-party service providers may adversely impact the Fund or the companies in which the Fund invests, causing the Fund's investments to lose value or to prevent a shareholder redemption or purchase from clearing in a timely manner.
Inflation Risk. Inflation is the reduction in the purchasing power of money resulting from an increase in the price of goods and services. Inflation risk is the risk that the inflation adjusted or "real" value of an investment in preferred stock or debt securities or the income from that investment will be worth less in the future. As inflation occurs, the real value of the preferred stock or debt securities and the dividend payable to holders of preferred stock or interest payable to holders of debt securities declines.
Leverage Risk (for all Funds except CPZ). The Fund has issued indebtedness and preferred shares and may borrow money or issue debt securities as permitted by the 1940 Act. As of October 31, 2023, the Fund has leverage in the form of borrowings under the SSB Agreement and outstanding MRP Shares. Leverage is the potential for the Fund to participate in gains and losses on an amount that exceeds the Fund's investment. The borrowing of money or issuance of debt securities
CALAMOS CLOSED-END FAMILY OF FUNDS ANNUAL REPORT
104
Principal Risks of the Funds
and preferred shares represents the leveraging of the Fund's common shares. As a non-fundamental policy, the Fund may not issue preferred shares or borrow money and/or issue debt securities with an aggregate liquidation preference and aggregate principal amount exceeding 38% of the Fund's managed assets as measured at the time of borrowing or issuance of the new securities. However, the Board of Trustees reserves the right to issue preferred shares or debt securities or borrow to the extent permitted by the 1940 Act and the Fund's policies.
Leverage creates risks which may adversely affect the return for the holders of common shares, including:
• the likelihood of greater volatility in the NAV and market price of the Fund's common shares;
• fluctuations in the dividend rates on any preferred shares borne by the Fund or in interest rates on borrowings and short-term debt;
• increased operating costs, which are effectively borne by common shareholders, may reduce the Fund's total return; and
• the potential for a decline in the value of an investment acquired with borrowed funds, while the Fund's obligations under such borrowing or preferred shares remain fixed.
In addition, the rights of lenders and the holders of preferred shares and debt securities issued by the Fund will be senior to the rights of the holders of common shares with respect to the payment of dividends or to the payment of assets upon liquidation. Holders of preferred shares have voting rights in addition to and separate from the voting rights of common shareholders. The holders of preferred shares or debt, if any, on the one hand, and the holders of the common shares, on the other, may have interests that conflict in certain situations.
Leverage is a speculative technique that could adversely affect the returns to common shareholders. Leverage can cause the Fund to lose money and can magnify the effect of any losses. To the extent the income or capital appreciation derived from securities purchased with funds received from leverage exceeds the cost of leverage, the Fund's return will be greater than if leverage had not been used. Conversely, if the income or capital appreciation from the securities purchased with such funds is not sufficient to cover the cost of leverage or if the Fund incurs capital losses, the return of the Fund will be less than if leverage had not been used, and therefore the amount available for distribution to common shareholders as dividends and other distributions will be reduced or potentially eliminated.
The Fund will pay, and common shareholders will effectively bear, any costs and expenses relating to any borrowings and to the issuance and ongoing maintenance of preferred shares or debt securities. Such costs and expenses include the higher management fee resulting from the use of any such leverage, offering and/or issuance costs, and interest and/or dividend expense and ongoing maintenance. These conditions may, directly or indirectly, result in higher leverage costs to common shareholders.
Certain types of borrowings may result in the Fund being subject to covenants in credit agreements, including those relating to asset coverage, borrowing base and portfolio composition requirements and additional covenants that may affect the Fund's ability to pay dividends and distributions on common shares in certain instances. The Fund may also be required to pledge its assets to the lenders in connection with certain types of borrowings. The Fund may be subject to certain restrictions on investments imposed by guidelines of and covenants with rating agencies which may issue ratings for the preferred shares or short-term debt instruments issued by the Fund. These guidelines and covenants may impose asset coverage or portfolio composition requirements that are more stringent than those imposed by the 1940 Act. The Board of Trustees reserves the right to change the amount and type of leverage that the Fund uses, and reserves the right to implement changes to the Fund's borrowings that it believes are in the long-term interests of the Fund and its shareholders, even if such changes impose a higher interest rate or other costs or impacts over the intermediate, or short-term time period. There is no guarantee that the Fund will maintain leverage at the current rate, and the Board of Trustees reserves the right to raise, decrease, or eliminate the Fund's leverage exposure.
If the Fund's ability to make dividends and distributions on its common shares is limited, such limitation could, under certain circumstances, impair the ability of the Fund to maintain its qualification for taxation as a regulated investment company or to reduce or eliminate tax at the Fund level, which would have adverse tax consequences for common shareholders. To the extent that the Fund is required, in connection with maintaining 1940 Act asset coverage requirements or otherwise, or elects to redeem any preferred shares or debt securities or prepay any borrowings, the Fund may need to liquidate investments to fund such redemptions or prepayments. Liquidation at times of adverse economic conditions may result in capital loss and reduce returns to common shareholders.
www.calamos.com
105
Principal Risks of the Funds
Because Calamos' investment management fee is a percentage of the Fund's managed assets, Calamos' fee will be higher if the Fund is leveraged and Calamos will have an incentive to be more aggressive and leverage the Fund. Consequently, the Fund and Calamos may have differing interests in determining whether to leverage the Fund's assets. Any additional use of leverage by the Fund effected through new, additional or increased credit facilities or the issuance of preferred shares would require approval by the Board. In considering whether to approve the use of additional leverage, the Board would be presented with all relevant information necessary to make a determination whether or not additional leverage through those means would be in the best interests of the Fund, including information regarding any potential conflicts of interest.
Leverage Risk (CPZ). The Fund anticipates that it will issue indebtedness and may issue preferred shares or borrow money or issue debt securities as permitted by the 1940 Act. As of October 31, 2023, the Fund has leverage in the form of borrowings under the SSB Agreement. Leverage is the potential for the Fund to participate in gains and losses on an amount that exceeds the Fund's investment. The borrowing of money or issuance of debt securities and preferred shares represents the leveraging of the Fund's common shares. As a non-fundamental policy, the Fund may not issue preferred shares or borrow money and issue debt securities with an aggregate liquidation preference and aggregate principal amount exceeding 38% of the Fund's total assets. However, the Board reserves the right to issue preferred shares or borrow to the extent permitted by the 1940 Act and the Fund's policies. Investments of short sale proceeds and economic leverage through derivatives are not counted as borrowings.
Leverage creates risks which may adversely affect the return for the holders of common shares, including:
• the likelihood of greater volatility in the NAV and market price of the Fund's common shares;
• fluctuations in the interest rates on borrowings and short-term debt;
• increased operating costs, which are effectively borne by common shareholders, may reduce the Fund's total return; and
• the potential for a decline in the value of an investment acquired with borrowed funds, while the Fund's obligations under such borrowing remain fixed.
The Fund's use of leverage is premised upon the expectation that the Fund's preferred share dividends or borrowing cost will be lower than the return the Fund achieves on its investments with the proceeds of the issuance of senior securities or borrowing. Such difference in return may result from the Fund's higher credit rating or the short-term nature of its borrowing compared to the lower credit quality, long-term nature of its investments. Because Calamos seeks to invest the Fund's managed assets (including the assets obtained from leverage) in a portfolio of potentially higher yielding investments or portfolio investments with the potential for capital appreciation, the holders of common shares will be the beneficiaries of the incremental return but will bear the risk of loss on investments made with the leverage proceeds. Should the differential between the Fund's return on investments made with the proceeds of leverage and the cost of the leverage narrow, the incremental return "pick up" will be reduced or the Fund may incur losses. Furthermore, if long-term interest rates rise without a corresponding increase in the yield on the Fund's portfolio investments or the Fund otherwise incurs losses on its investments, the Fund's NAV attributable to its common shares will reflect the decline in the value of portfolio holdings resulting therefrom.
Leverage is a speculative technique that could adversely affect the returns to holders of common shares. Leverage can cause the Fund to lose money and can magnify the effect of any losses. To the extent the income or capital appreciation derived from securities purchased with funds received from leverage exceeds the cost of leverage, the Fund's return will be greater than if leverage had not been used. Conversely, if the income or capital appreciation from the securities purchased with such funds is not sufficient to cover the cost of leverage or if the Fund incurs capital losses, the return of the Fund will be less than if leverage had not been used, and therefore the amount available for distribution to common shareholders as dividends and other distributions will be reduced or potentially eliminated.
The Fund will pay, and common shareholders will effectively bear, any costs and expenses relating to any borrowings and to the issuance and ongoing maintenance of debt. Such costs and expenses include the higher management fee resulting from the use of any such leverage, offering and/or issuance costs, and interest expense and ongoing maintenance. These conditions may, directly or indirectly, result in higher leverage costs to common shareholders.
Certain types of borrowings may result in the Fund being subject to covenants in credit agreements, including those relating to asset coverage, borrowing base and portfolio composition requirements and additional covenants that may affect the Fund's ability to pay dividends and distributions on common shares in certain instances. The Fund may also be required to
CALAMOS CLOSED-END FAMILY OF FUNDS ANNUAL REPORT
106
Principal Risks of the Funds
pledge its assets to the lenders in connection with certain types of borrowings. The Fund may be subject to certain restrictions on investments imposed by guidelines of rating agencies which may issue ratings for the short-term debt instruments issued by the Fund. These guidelines may impose asset coverage or portfolio composition requirements that are more stringent than those imposed by the 1940 Act.
If the Fund's ability to make dividends and distributions on its common shares is limited, such limitation could, under certain circumstances, impair the ability of the Fund to maintain its qualification for taxation as a regulated investment company or to reduce or eliminate tax at the Fund level, which would have adverse tax consequences for common shareholders. To the extent that the Fund is required, in connection with maintaining 1940 Act asset coverage requirements or otherwise, or elects to redeem any senior securities or prepay any borrowings, the Fund may need to liquidate investments to fund such redemptions or prepayments. Liquidation at times of adverse economic conditions may result in capital loss and reduce returns to common shareholders.
Because Calamos' investment management fee is a percentage of the Fund's managed assets, Calamos' fee will be higher if the Fund is leveraged and Calamos will have an incentive to be more aggressive and leverage the Fund. Consequently, the Fund and Calamos may have differing interests in determining whether to leverage the Fund's assets. Any additional use of leverage by the Fund would require approval by the Board. In considering whether to approve the use of additional leverage, the Board would be presented with all relevant information necessary to make a determination whether or not additional leverage would be in the best interests of the Fund, including information regarding any potential conflicts of interest.
Limited Term Risk. Unless the limited term provision of the Fund's Declaration of Trust is amended by shareholders in accordance with the Declaration of Trust, or unless the Fund completes the Eligible Tender Offer and converts to perpetual existence, the Fund will dissolve on the Dissolution Date. The Fund is not a so called "target date" or "life cycle" fund whose asset allocation becomes more conservative over time as its target date, often associated with retirement, approaches. In addition, the Fund is not a "target term" fund whose investment objective is to return its original NAV on the Dissolution Date. The Fund's investment objective and policies are not designed to seek to return to investors that purchase Shares in this offering their initial investment of $20.00 per Share on the Dissolution Date or in the Eligible Tender Offer, and such investors and investors that purchase Shares after the completion of this offering may receive more or less than their original investment upon dissolution or in the Eligible Tender Offer.
Because the assets of the Fund will be liquidated in connection with the dissolution, the Fund will incur transaction costs in connection with dispositions of portfolio securities. The Fund does not limit its investments to securities having a maturity date prior to the Dissolution Date and may be required to sell portfolio securities when it otherwise would not, including at times when market conditions are not favorable, which may cause the Fund to lose money. In particular, the Fund's portfolio may still have large exposures to illiquid securities as the Dissolution Date approaches, and losses due to portfolio liquidation may be significant. During the winddown period, beginning one year before the Dissolution Date, the Fund may begin liquidating all or a portion of the Fund's portfolio, and may deviate from its investment policies and may not achieve its investment objective. During the wind-down period, the Fund's portfolio composition may change as more of its portfolio holdings are called or sold and portfolio holdings are disposed of in anticipation of dissolution. The disposition of portfolio investments by the Fund could cause market prices of such instruments, and hence the NAV and market price of the Shares, to decline. In addition, disposition of portfolio investments will cause the Fund to incur increased brokerage and related transaction expenses. The Fund may receive proceeds from the disposition of portfolio investments that are less than the valuations of such investments by the Fund. Rather than reinvesting the proceeds of matured, called or sold securities, the Fund may invest such proceeds in short term or other lower yielding securities or hold the proceeds in cash, which may adversely affect its performance and the market price of the Shares. The Fund may distribute the proceeds in one or more liquidating distributions prior to the final liquidation, which may cause fixed expenses to increase when expressed as a percentage of assets under management. Upon dissolution, it is anticipated that the Fund will have distributed substantially all of its net assets to Shareholders, although securities for which no market exists or securities trading at depressed prices, if any, may be placed in a liquidating trust. Shareholders will bear the costs associated with establishing and maintaining a liquidating trust, if necessary. Securities placed in a liquidating trust may be held for an indefinite period of time until they can be sold or pay out all of their cash flows. The Fund cannot predict the amount, if any, of securities that will be required to be placed in a liquidating trust. If the Fund conducts the Eligible Tender Offer, the Fund anticipates that funds to pay the aggregate purchase price of Shares accepted for purchase pursuant to the tender offer will be first derived from any cash on hand and then from the proceeds from the sale of portfolio investments held by the Fund. In addition, the Fund may be required to dispose of portfolio investments in connection with any reduction in the Fund's outstanding leverage necessary in order to maintain the Fund's desired leverage ratios following a tender offer. The risks related to the disposition of securities
www.calamos.com
107
Principal Risks of the Funds
in connection with the Fund's dissolution also would be present in connection with the disposition of securities in connection with the Eligible Tender Offer. It is likely that during the pendency of a tender offer, and possibly for a time thereafter, the Fund will hold a greater than normal percentage of its total assets in cash and cash equivalents, which may impede the Fund's ability to achieve its investment objective and decrease returns to Shareholders. If the Fund's tax basis for the investments sold is less than the sale proceeds, the Fund will recognize capital gains, which the Fund will generally distribute to Shareholders. In addition, the Fund's purchase of tendered Shares pursuant to a tender offer will have tax consequences for tendering Shareholders and may have tax consequences for non-tendering Shareholders. The purchase of Shares by the Fund pursuant to a tender offer will have the effect of increasing the proportionate interest in the Fund of non-tendering Shareholders. All Shareholders remaining after a tender offer will be subject to proportionately higher expenses due to the reduction in the Fund's total assets resulting from payment for the tendered Shares. Such reduction in the Fund's total assets may also result in less investment flexibility, reduced diversification and greater volatility for the Fund, and may have an adverse effect on the Fund's investment performance. The Fund is not required to conduct the Eligible Tender Offer. If the Fund conducts the Eligible Tender Offer, there can be no assurance that the number of tendered Shares would not result in the Fund's net assets totaling less than the Dissolution Threshold, in which case the Eligible Tender Offer will be terminated, no Shares will be repurchased pursuant to the Eligible Tender Offer and the Fund will dissolve on the Dissolution Date (subject to possible extensions). Following the completion of the Eligible Tender Offer in which the number of tendered Shares would result in the Fund's net assets totaling greater than the Dissolution Threshold, the Board may eliminate the Dissolution Date upon the affirmative vote of a majority of the Board and without a Shareholder vote. Thereafter, the Fund will have a perpetual existence. The Adviser may have a conflict of interest in recommending to the Board that the Dissolution Date be eliminated and the Fund have a perpetual existence. The Fund is not required to conduct additional tender offers following the Eligible Tender Offer and conversion to perpetual existence. Therefore, remaining Shareholders may not have another opportunity to participate in a tender offer. Shares of closed-end management investment companies frequently trade at a discount from their NAV, and as a result remaining Shareholders may only be able to sell their Shares at a discount to NAV.
Loan Risk. The Fund may invest in loans which may not be (i) rated at the time of investment, (ii) registered with the SEC or (iii) listed on a securities exchange. There may not be as much public information available regarding these loans as is available for other Fund investments, such as exchange-listed securities. As well, there may not be an active trading market for some loans, meaning they may be illiquid and more difficult to value than other more liquid securities. Settlement periods for loans are longer than for exchange traded securities, typically ranging between 1 and 3 weeks, and in some cases much longer. There is no central clearinghouse for loan trades, and the loan market has not established enforceable settlement standards or remedies for failure to settle. Because the interest rates of floating-rate loans in which the Fund may invest may reset frequently, if market interest rates fall, the loans' interest rates will be reset to lower levels, potentially reducing the Fund's income. Because the adviser may wish to invest in the publicly traded securities of an obligor, the Fund may not have access to material non-public information regarding the obligor to which other investors have access
Market Discount Risk. The Fund's common shares have traded both at a premium and at a discount relative to NAV. Common shares of closed-end investment companies frequently trade at a discount from NAV, but in some cases trade above NAV. The risk of the Fund's common shares trading at a discount is a risk separate from the risk of a decline in the Fund's NAV as a result of investment activities. The Fund's NAV may be reduced immediately following an offering by the offering costs for common shares or other securities, which will be borne entirely by all common shareholders. The Fund's common shares are designed primarily for long-term investors, and you should not purchase common shares if you intend to sell them shortly after purchase. Whether shareholders will realize a gain or loss upon the sale of the Fund's common shares depends upon whether the market value of the shares at the time of sale is above or below the price the shareholder paid, taking into account transaction costs for the shares, and is not directly dependent upon the Fund's NAV. Because the market value of the Fund's common shares will be determined by factors such as the relative demand for and supply of the shares in the market, general market conditions and other factors beyond the control of the Fund, the Fund cannot predict whether its common shares will trade at, below or above the Fund's NAV, or below or above the public offering price for the common shares.
Market Disruption Risk. Certain events have a disruptive effect on the securities markets, such as terrorist attacks, war and other geopolitical events, earthquakes, storms and other disasters. The Fund cannot predict the effects of similar events in the future on the US economy or any foreign economy.
Market Impact Risk. The sale of the Fund's common shares (or the perception that such sales may occur) may have an adverse effect on prices in the secondary market for the Fund's common shares. An increase in the number of common shares available may put downward pressure on the market price for the Fund's common shares. These sales also might
CALAMOS CLOSED-END FAMILY OF FUNDS ANNUAL REPORT
108
Principal Risks of the Funds
make it more difficult for the Fund to sell additional equity securities in the future at a time and price the Fund deems appropriate.
Ratings and Asset Coverage Risk. To the extent that senior securities are rated, a rating does not eliminate or necessarily mitigate the risks of investing in the Fund's senior securities, and a rating may not fully or accurately reflect all of the credit and market risks associated with that senior security. A rating agency could downgrade the rating of the Fund's shares of preferred stock or debt securities, which may make such securities less liquid in the secondary market, though potentially with higher resulting interest rates. If a rating agency downgrades the rating assigned to a senior security, the Fund may alter its portfolio or redeem the senior security. The Fund may voluntarily redeem senior securities under certain circumstances
Reduction of Leverage Risk. A Fund may take action to reduce the amount of leverage it employs. Reduction of the leverage employed by the Fund, including by redemption of preferred shares (if applicable), will in turn reduce the amount of assets available for investment in portfolio securities. This reduction in leverage may negatively impact the Fund's financial performance, including the Fund's ability to sustain current levels of distributions on common shares.
The Board reserves the right to change the amount and type of leverage that the Fund uses, and reserves the right to implement changes to the Fund's borrowings that it believes are in the best long-term interests of the Fund and its shareholders, even if such changes impose a higher interest rate or other costs or impacts over the intermediate, or short-term time period. There is no guarantee that the Fund will maintain leverage at the current rate, and the Board reserves the right to raise, decrease, or eliminate the Fund's leverage exposure.
Regulatory Risk. The enforceability of agreements underlying hedging transactions may depend on compliance with applicable statutory and other regulatory requirements and, depending on the identity of the counterparty, applicable international requirements. New or amended regulations may be imposed by the CFTC, the SEC, the Federal Reserve or other financial regulators, other governmental regulatory authorities or self-regulatory organizations that supervise the financial markets that could adversely affect the Fund. In particular, these agencies are empowered to promulgate a variety of new rules pursuant to recently enacted financial reform legislation in the United States. The Fund also may be adversely affected by changes in the enforcement or interpretation of existing statues and rules by these governmental regulatory authorities or self-regulatory organizations. In addition, the securities and futures markets are subject to comprehensive statutes, regulations and margin requirements. For instance, the Dodd-Frank Wall Street Reform and Consumer Protection Act ("Dodd-Frank Act") could have an adverse effect on the Fund's ability to use derivative instruments. The Dodd-Frank Act is designed to impose stringent regulation on the over-the-counter derivatives market in an attempt to increase transparency and accountability and provides for, among other things, new clearing, execution, margin, reporting, recordkeeping, business conduct, disclosure, position limit, minimum net capital and registration requirements. Although the CFTC has released final rules relating to clearing, execution, reporting, risk management, compliance, position limit, anti-fraud, consumer protection, portfolio reconciliation, documentation, recordkeeping, business conduct, margin requirements and registration requirements under the Dodd-Frank Act, many of the provisions are subject to further final rulemaking, and thus the Dodd-Frank Act's ultimate impact remains unclear. New regulations could, among other things, restrict the Fund's ability to engage in derivatives transactions (for example, by making certain types of derivatives transactions no longer available to our funds), increase the costs of using these instruments (for example, by increasing margin, capital or reporting requirements) and/or make them less effective and, as a result, the Fund may be unable to execute its investment strategy. Limits or restrictions applicable to the counterparties with which the Fund engages in derivative transactions could also prevent the Fund from using these instruments, affect the pricing or other factors relating to these instruments or may change availability of certain investments. It is unclear how the regulatory changes will affect counterparty risk.
Secondary Market Risk. The market value of exchange-listed preferred shares that the Fund may issue will be determined by factors such as the relative demand for and supply of the preferred shares in the market, general market conditions and other factors beyond the control of the Fund. It may be difficult to predict the trading patterns of preferred shares, including the effective costs of trading. There is a risk that the market for preferred shares may be thinly traded and relatively illiquid compared to the market for other types of securities.
Senior Leverage Risk. Preferred shares will be junior in liquidation and with respect to distribution rights to debt securities and any other borrowings. Senior securities representing indebtedness may constitute a substantial lien and burden on preferred shares by reason of their prior claim against the Fund's income and against the Fund's net assets in liquidation. The Fund may not be permitted to declare dividends or other distributions with respect to any series of preferred shares unless at such time the Fund meets applicable asset coverage requirements and the payment of principal or interest is not in default with respect to any borrowings.
www.calamos.com
109
Convertible Opportunities and Income Fund Schedule of Investments October 31, 2023
| PRINCIPAL AMOUNT | VALUE | ||||||||||
ASSET BACKED SECURITY (0.1%) | |||||||||||
Other (0.1%) | |||||||||||
765,000 | SVC ABS, LLC Series 2023-1A, Class C* 6.700%, 02/20/53 (Cost $703,821) | $ | 677,715 | ||||||||
CORPORATE BONDS (44.0%) | |||||||||||
Airlines (0.8%) | |||||||||||
166,400 | Air Canada Pass Through Trust Series 2015-2, Class B* 5.000%, 06/15/25 | 165,576 | |||||||||
879,561 | Alaska Airlines Pass Through Trust Series 2020-1, Class A*µ 4.800%, 02/15/29 | 824,430 | |||||||||
413,374 | Alaska Airlines Pass Through Trust Series 2020-1, Class B* 8.000%, 02/15/27 | 412,610 | |||||||||
1,051,960 | American Airlines Pass Through Trust Series 2021-1, Class B 3.950%, 01/11/32 | 897,206 | |||||||||
597,500 | American Airlines, Inc. / AAdvantage Loyalty IP, Ltd.* 5.500%, 04/20/26 | 581,248 | |||||||||
239,000 | 5.750%, 04/20/29 | 215,719 | |||||||||
968,267 | British Airways Pass Through Trust Series 2021-1, Class B* 3.900%, 03/15/33 | 841,327 | |||||||||
997,118 | JetBlue Pass Through Trust Series 2020-1, Class B 7.750%, 05/15/30 | 991,404 | |||||||||
670,000 | Spirit Loyalty Cayman, Ltd. / Spirit IP Cayman, Ltd.* 8.000%, 09/20/25 | 497,535 | |||||||||
5,427,055 | |||||||||||
Communication Services (5.1%) | |||||||||||
500,000 | Altice France Holding, SA* 10.500%, 05/15/27 | 275,660 | |||||||||
1,100,000 | Altice France, SA* 5.500%, 10/15/29 | 761,783 | |||||||||
1,160,000 | APi Group DE, Inc.* 4.750%, 10/15/29 | 1,000,291 | |||||||||
1,413,000 | Arrow Bidco, LLC* 9.500%, 03/15/24 | 1,431,906 | |||||||||
1,025,000 | Ashtead Capital, Inc.* 2.450%, 08/12/31 | 756,122 | |||||||||
1,193,000 | Audacy Capital Corp.* 6.750%, 03/31/29 | 19,386 | |||||||||
448,000 | 6.500%, 05/01/27 | 6,720 | |||||||||
856,000 | Cincinnati Bell Telephone Company, LLC 6.300%, 12/01/28 | 692,701 | |||||||||
940,000 | Clear Channel Outdoor Holdings, Inc.* 9.000%, 09/15/28 | 916,641 | |||||||||
| PRINCIPAL AMOUNT | VALUE | ||||||||||
1,465,000 | Consolidated Communications, Inc.*^ 6.500%, 10/01/28 | $ | 1,162,727 | ||||||||
1,550,000 | CSC Holdings, LLC* 5.500%, 04/15/27 | 1,295,676 | |||||||||
1,450,000 | 5.375%, 02/01/28 | 1,156,201 | |||||||||
1,350,000 | 4.625%, 12/01/30 | 685,732 | |||||||||
1,125,000 | 4.500%, 11/15/31 | 744,232 | |||||||||
1,100,000 | 5.750%, 01/15/30 | 579,865 | |||||||||
750,000 | Diamond Sports Group, LLC / Diamond Sports Finance Company*@ 6.625%, 08/15/27 | 9,510 | |||||||||
540,000 | 5.375%, 08/15/26 | 6,620 | |||||||||
2,420,000 | Directv Financing, LLC / Directv Financing Co-Obligor, Inc.* 5.875%, 08/15/27 | 2,120,888 | |||||||||
1,000,000 | Frontier California, Inc. 6.750%, 05/15/27 | 923,320 | |||||||||
605,000 | Frontier Communications Holdings, LLC* 5.000%, 05/01/28 | 525,073 | |||||||||
239,000 | 8.750%, 05/15/30 | 227,989 | |||||||||
1,039,000 | Frontier Florida, LLC@ 6.860%, 02/01/28 | 956,462 | |||||||||
1,445,000 | Frontier North, Inc.@ 6.730%, 02/15/28 | 1,340,483 | |||||||||
835,000 | Go Daddy Operating Company, LLC / GD Finance Company, Inc.* 3.500%, 03/01/29 | 705,734 | |||||||||
250,000 | 5.250%, 12/01/27 | 236,393 | |||||||||
355,000 | iHeartCommunications, Inc.^ 8.375%, 05/01/27 | 217,885 | |||||||||
355,000 | 5.250%, 08/15/27* | 260,577 | |||||||||
731,000 | Intelsat Jackson Holdings, SA@& 9.750%, 07/15/25* | 1 | |||||||||
475,000 | 5.500%, 08/01/23 | — | |||||||||
1,215,000 | LCPR Senior Secured Financing DAC* 6.750%, 10/15/27 | 1,100,936 | |||||||||
722,947 | Ligado Networks, LLC* 15.500%, 11/01/23 15.500% PIK rate | 182,226 | |||||||||
720,000 | Lumen Technologies, Inc. 7.600%, 09/15/39 | 195,941 | |||||||||
485,000 | 4.000%, 02/15/27*^ | 331,609 | |||||||||
240,000 | 7.650%, 03/15/42 | 64,642 | |||||||||
478,000 | Match Group Holdings II, LLC* 3.625%, 10/01/31 | 370,096 | |||||||||
810,000 | Nexstar Media, Inc.* 5.625%, 07/15/27 | 729,389 | |||||||||
1,410,000 | Paramount Global 4.900%, 08/15/44 | 888,215 | |||||||||
336,000 | Qwest Corp. 7.250%, 09/15/25 | 322,661 | |||||||||
477,000 | Scripps Escrow II, Inc.* 3.875%, 01/15/29 | 362,320 | |||||||||
239,000 | 5.375%, 01/15/31 | 148,512 | |||||||||
CALAMOS CLOSED-END FAMILY OF FUNDS ANNUAL REPORT
110
Convertible Opportunities and Income Fund Schedule of Investments October 31, 2023
| PRINCIPAL AMOUNT | VALUE | ||||||||||
810,000 | Scripps Escrow, Inc.* 5.875%, 07/15/27 | $ | 606,334 | ||||||||
1,250,000 | Sirius XM Radio, Inc.* 5.500%, 07/01/29 | 1,108,675 | |||||||||
963,000 | 4.000%, 07/15/28 | 819,340 | |||||||||
475,000 | 3.125%, 09/01/26 | 426,783 | |||||||||
239,000 | 3.875%, 09/01/31^ | 180,022 | |||||||||
874,000 | Spanish Broadcasting System, Inc.* 9.750%, 03/01/26 | 544,668 | |||||||||
2,430,000 | Sprint, LLCµ 7.125%, 06/15/24 | 2,443,827 | |||||||||
1,080,000 | Stagwell Global, LLC* 5.625%, 08/15/29 | 893,549 | |||||||||
755,000 | Telecom Italia Capital, SA 6.000%, 09/30/34 | 621,878 | |||||||||
953,000 | Telesat Canada / Telesat, LLC* 4.875%, 06/01/27 | 570,618 | |||||||||
385,000 | Time Warner Cable, LLC 7.300%, 07/01/38 | 360,614 | |||||||||
1,100,000 | United States Cellular Corp.^ 6.700%, 12/15/33 | 1,047,585 | |||||||||
360,000 | Univision Communications, Inc.* 8.000%, 08/15/28 | 341,179 | |||||||||
480,000 | Viasat, Inc.* 5.625%, 04/15/27 | 419,971 | |||||||||
34,098,168 | |||||||||||
Consumer Discretionary (9.4%) | |||||||||||
1,162,000 | Abercrombie & Fitch Management Company* 8.750%, 07/15/25 | 1,181,382 | |||||||||
955,000 | Adams Homes, Inc.* 9.250%, 10/15/28 | 937,428 | |||||||||
1,195,000 | Adient Global Holdings Company* 8.250%, 04/15/31 | 1,169,379 | |||||||||
764,000 | American Axle & Manufacturing, Inc. 6.875%, 07/01/28 | 680,923 | |||||||||
837,000 | Ashton Woods USA, LLC / Ashton Woods Finance Company* 4.625%, 08/01/29 | 680,272 | |||||||||
705,000 | 6.625%, 01/15/28 | 647,042 | |||||||||
1,208,000 | At Home Group, Inc.* 4.875%, 07/15/28 | 419,780 | |||||||||
1,264,000 | Bath & Body Works, Inc. 6.694%, 01/15/27 | 1,224,980 | |||||||||
1,200,000 | 6.875%, 11/01/35 | 1,060,668 | |||||||||
400,000 | Benteler International AG*^ 10.500%, 05/15/28 | 404,452 | |||||||||
604,000 | Caesars Entertainment, Inc.*^ 4.625%, 10/15/29 | 497,267 | |||||||||
472,000 | 8.125%, 07/01/27 | 467,912 | |||||||||
1,020,000 | Carnival Corp.* 6.000%, 05/01/29 | 862,675 | |||||||||
481,000 | 7.625%, 03/01/26^ | 467,970 | |||||||||
481,000 | 4.000%, 08/01/28 | 419,062 | |||||||||
60,000 | 7.000%, 08/15/29 | 58,945 | |||||||||
| PRINCIPAL AMOUNT | VALUE | ||||||||||
1,130,000 | Carriage Services, Inc.*^ 4.250%, 05/15/29 | $ | 925,391 | ||||||||
195,000 | Carvana Company* 14.000%, 06/01/31 | 146,757 | |||||||||
165,000 | 13.000%, 06/01/30 | 123,826 | |||||||||
110,000 | 12.000%, 12/01/28 | 82,382 | |||||||||
2,130,000 | CCO Holdings, LLC / CCO Holdings Capital Corp.* 5.125%, 05/01/27 | 1,962,582 | |||||||||
1,685,000 | 4.500%, 08/15/30 | 1,354,268 | |||||||||
1,100,000 | 6.375%, 09/01/29 | 1,011,340 | |||||||||
1,055,000 | 4.750%, 03/01/30 | 871,514 | |||||||||
951,000 | 4.250%, 02/01/31 | 740,962 | |||||||||
565,000 | 5.000%, 02/01/28 | 506,184 | |||||||||
478,000 | 4.750%, 02/01/32 | 373,648 | |||||||||
478,000 | CDI Escrow Issuer, Inc.* 5.750%, 04/01/30 | 428,355 | |||||||||
750,000 | Cedar Fair, LP^ 5.250%, 07/15/29 | 648,668 | |||||||||
478,000 | Churchill Downs, Inc.* 6.750%, 05/01/31 | 446,906 | |||||||||
790,000 | Dana, Inc. 4.250%, 09/01/30 | 628,611 | |||||||||
723,000 | 4.500%, 02/15/32 | 566,673 | |||||||||
1,200,000 | DISH DBS Corp. 5.250%, 12/01/26* | 970,764 | |||||||||
763,000 | 7.750%, 07/01/26 | 511,996 | |||||||||
595,000 | 7.375%, 07/01/28 | 335,461 | |||||||||
480,000 | 5.125%, 06/01/29 | 247,709 | |||||||||
946,000 | DISH Network Corp.* 11.750%, 11/15/27 | 937,817 | |||||||||
1,365,000 | Empire Resorts, Inc.* 7.750%, 11/01/26 | 1,117,839 | |||||||||
1,058,000 | Everi Holdings, Inc.* 5.000%, 07/15/29 | 889,947 | |||||||||
1,000,000 | Ford Motor Company^ 6.100%, 08/19/32 | 925,800 | |||||||||
1,525,000 | Ford Motor Credit Company, LLC 4.000%, 11/13/30 | 1,257,484 | |||||||||
1,245,000 | 7.200%, 06/10/30 | 1,243,593 | |||||||||
1,150,000 | 5.113%, 05/03/29 | 1,044,453 | |||||||||
865,000 | 7.350%, 11/04/27 | 876,280 | |||||||||
800,000 | 2.900%, 02/16/28 | 681,256 | |||||||||
425,000 | 7.350%, 03/06/30 | 427,610 | |||||||||
359,000 | Gap, Inc.* 3.875%, 10/01/31 | 258,993 | |||||||||
490,000 | General Motors Company 5.200%, 04/01/45 | 363,213 | |||||||||
1,660,000 | goeasy, Ltd.* 5.375%, 12/01/24^ | 1,631,564 | |||||||||
881,000 | 4.375%, 05/01/26 | 798,582 | |||||||||
515,000 | Goodyear Tire & Rubber Company^ 5.250%, 07/15/31 | 420,044 | |||||||||
407,000 | Group 1 Automotive, Inc.* 4.000%, 08/15/28 | 351,778 | |||||||||
See accompanying Notes to Schedule of Investments
www.calamos.com
111
Convertible Opportunities and Income Fund Schedule of Investments October 31, 2023
| PRINCIPAL AMOUNT | VALUE | ||||||||||
1,026,000 | Guitar Center, Inc.*^& 8.500%, 01/15/26 | $ | 867,144 | ||||||||
770,000 | International Game Technology, PLC* 6.250%, 01/15/27 | 751,312 | |||||||||
286,394 | JetBlue Pass Through Trust Series 2019-2, Class B 8.000%, 11/15/27 | 288,312 | |||||||||
842,000 | Kohl's Corp. 5.550%, 07/17/45 | 486,811 | |||||||||
955,000 | LCM Investments Holdings II, LLC* 8.250%, 08/01/31 | 915,301 | |||||||||
965,000 | Liberty Interactive, LLC 8.250%, 02/01/30 | 254,229 | |||||||||
937,000 | Life Time, Inc.* 8.000%, 04/15/26^ | 915,739 | |||||||||
480,000 | 5.750%, 01/15/26 | 465,533 | |||||||||
480,000 | Light & Wonder International, Inc.* 7.500%, 09/01/31 | 469,488 | |||||||||
360,000 | Lindblad Expeditions Holdings, Inc.* 9.000%, 05/15/28 | 352,908 | |||||||||
616,000 | Lindblad Expeditions, LLC* 6.750%, 02/15/27 | 560,116 | |||||||||
635,000 | M/I Homes, Inc. 3.950%, 02/15/30 | 508,121 | |||||||||
1,601,000 | Macy's Retail Holdings, LLC 6.700%, 07/15/34* | 1,234,483 | |||||||||
490,000 | 4.300%, 02/15/43 | 268,883 | |||||||||
1,130,000 | Mclaren Finance, PLC* 7.500%, 08/01/26 | 975,586 | |||||||||
1,219,000 | Midwest Gaming Borrower, LLC / Midwest Gaming Finance Corp.* 4.875%, 05/01/29 | 1,017,585 | |||||||||
575,000 | Newell Brands, Inc. 5.200%, 04/01/26 | 543,128 | |||||||||
500,000 | Nordstrom, Inc. 5.000%, 01/15/44 | 301,095 | |||||||||
465,000 | 4.250%, 08/01/31^ | 340,901 | |||||||||
1,105,000 | PENN Entertainment, Inc.*^ 4.125%, 07/01/29 | 859,314 | |||||||||
600,000 | PetSmart, Inc. / PetSmart Finance Corp.* 7.750%, 02/15/29 | 553,356 | |||||||||
300,000 | 4.750%, 02/15/28 | 265,689 | |||||||||
1,340,000 | Premier Entertainment Sub, LLC / Premier Entertainment Finance Corp.*^ 5.625%, 09/01/29 | 943,079 | |||||||||
2,360,000 | Rite Aid Corp.*@ 8.000%, 11/15/26 | 1,641,120 | |||||||||
478,000 | Royal Caribbean Cruises, Ltd.* 7.250%, 01/15/30 | 472,876 | |||||||||
1,350,000 | Simmons Foods, Inc. / Simmons Prepared Foods, Inc. / Simmons Pet Food, Inc. / Simmons Feed* 4.625%, 03/01/29 | 1,097,793 | |||||||||
| PRINCIPAL AMOUNT | VALUE | ||||||||||
1,925,000 | Six Flags Entertainment Corp.*^ 7.250%, 05/15/31 | $ | 1,773,329 | ||||||||
1,090,000 | Sonic Automotive, Inc.*^ 4.625%, 11/15/29 | 908,973 | |||||||||
698,000 | Speedway Motorsports, LLC / Speedway Funding II, Inc.* 4.875%, 11/01/27 | 625,080 | |||||||||
1,965,000 | Station Casinos, LLC* 4.500%, 02/15/28 | 1,698,959 | |||||||||
589,000 | Taylor Morrison Communities, Inc.* 5.750%, 01/15/28 | 536,526 | |||||||||
240,000 | Viking Cruises, Ltd.* 9.125%, 07/15/31 | 236,112 | |||||||||
1,100,000 | Vista Outdoor, Inc.* 4.500%, 03/15/29 | 1,024,760 | |||||||||
480,000 | Windsor Holdings III, LLC* 8.500%, 06/15/30 | 471,216 | |||||||||
950,000 | ZF North America Capital, Inc.* 7.125%, 04/14/30 | 924,635 | |||||||||
300,000 | 6.875%, 04/14/28 | 291,645 | |||||||||
63,131,524 | |||||||||||
Consumer Staples (1.9%) | |||||||||||
1,090,000 | 1375209 B.C., Ltd.*^ 9.000%, 01/30/28 | 1,059,720 | |||||||||
970,000 | B&G Foods, Inc.* 8.000%, 09/15/28 | 946,953 | |||||||||
1,099,000 | Central Garden & Pet Company* 4.125%, 04/30/31 | 878,376 | |||||||||
1,092,000 | Edgewell Personal Care Company* 4.125%, 04/01/29 | 918,296 | |||||||||
1,331,000 | Energizer Holdings, Inc.*^ 4.375%, 03/31/29 | 1,095,865 | |||||||||
240,000 | 6.500%, 12/31/27 | 225,485 | |||||||||
1,415,000 | JBS USA LUX, SA / JBS USA Food Company / JBS USA Finance, Inc. 5.500%, 01/15/30^ | 1,294,626 | |||||||||
595,000 | 5.125%, 02/01/28µ | 558,818 | |||||||||
370,000 | 5.750%, 04/01/33 | 325,774 | |||||||||
621,000 | New Albertsons, LP 7.750%, 06/15/26 | 627,912 | |||||||||
957,000 | Performance Food Group, Inc.* 4.250%, 08/01/29 | 812,062 | |||||||||
700,000 | Pilgrim's Pride Corp. 4.250%, 04/15/31 | 578,361 | |||||||||
442,000 | Post Holdings, Inc.* 5.750%, 03/01/27 | 422,017 | |||||||||
909,000 | Prestige Brands, Inc.* 3.750%, 04/01/31 | 724,637 | |||||||||
815,000 | United Natural Foods, Inc.*^ 6.750%, 10/15/28 | 637,794 | |||||||||
1,500,000 | Vector Group, Ltd.* 5.750%, 02/01/29 | 1,273,695 | |||||||||
See accompanying Notes to Schedule of Investments
CALAMOS CLOSED-END FAMILY OF FUNDS ANNUAL REPORT
112
Convertible Opportunities and Income Fund Schedule of Investments October 31, 2023
| PRINCIPAL AMOUNT | VALUE | ||||||||||
480,000 | Williams Scotsman, Inc.* 7.375%, 10/01/31 | $ | 473,966 | ||||||||
12,854,357 | |||||||||||
Energy (5.7%) | |||||||||||
959,000 | Antero Resources Corp.* 5.375%, 03/01/30 | 876,564 | |||||||||
958,000 | Apache Corp. 5.100%, 09/01/40 | 745,880 | |||||||||
750,000 | Buckeye Partners, LP 3.950%, 12/01/26 | 684,518 | |||||||||
500,000 | 5.850%, 11/15/43 | 354,130 | |||||||||
1,335,000 | Callon Petroleum Company*^ 7.500%, 06/15/30 | 1,294,122 | |||||||||
477,000 | Cheniere Energy, Inc.µ 4.625%, 10/15/28 | 436,073 | |||||||||
720,000 | Chesapeake Energy Corp.* 6.750%, 04/15/29 | 706,486 | |||||||||
1,341,000 | Civitas Resources, Inc.* 8.750%, 07/01/31 | 1,355,094 | |||||||||
715,000 | Continental Resources, Inc.* 2.875%, 04/01/32 | 529,665 | |||||||||
475,000 | 5.750%, 01/15/31 | 440,943 | |||||||||
742,000 | DT Midstream, Inc.* 4.125%, 06/15/29 | 638,981 | |||||||||
941,000 | Earthstone Energy Holdings, LLC* 8.000%, 04/15/27 | 955,275 | |||||||||
360,000 | 9.875%, 07/15/31 | 388,480 | |||||||||
555,000 | Enbridge, Inc.^‡ 7.375%, 01/15/83 5 year CMT + 3.71% | 516,466 | |||||||||
1,400,000 | Energy Transfer, LP‡ 8.656%, 11/01/66 3 mo. USD SOFR + 3.28% | 1,144,640 | |||||||||
700,000 | 6.500%, 11/01/35 5 year CMT + 5.69% | 636,125 | |||||||||
1,235,000 | EnLink Midstream Partners, LP 9.780%, 11/01/35‡ 3 mo. USD LIBOR + 4.11% | 1,102,867 | |||||||||
1,015,000 | 4.850%, 07/15/26 | 959,713 | |||||||||
600,000 | Enlink Midstream, LLC* 6.500%, 09/01/30 | 576,864 | |||||||||
1,580,000 | EQM Midstream Partners, LP* 7.500%, 06/01/27 | 1,570,773 | |||||||||
719,000 | Genesis Energy, LP / Genesis Energy Finance Corp. 8.875%, 04/15/30 | 699,105 | |||||||||
478,000 | 6.250%, 05/15/26 | 456,328 | |||||||||
955,000 | Gulfport Energy Corp. 8.000%, 05/17/26* | 955,401 | |||||||||
940,000 | 6.375%, 05/15/25@& | 1 | |||||||||
287,284 | 8.000%, 05/17/26 | 287,405 | |||||||||
1,340,000 | Hilcorp Energy I, LP / Hilcorp Finance Company* 6.000%, 04/15/30 | 1,191,488 | |||||||||
| PRINCIPAL AMOUNT | VALUE | ||||||||||
717,000 | Howard Midstream Energy Partners, LLC* 6.750%, 01/15/27 | $ | 681,881 | ||||||||
940,000 | Magnolia Oil & Gas Operating, LLC / Magnolia Oil & Gas Finance Corp.* 6.000%, 08/01/26 | 899,373 | |||||||||
500,000 | Moss Creek Resources Holdings, Inc.* 10.500%, 05/15/27 | 494,870 | |||||||||
455,000 | 7.500%, 01/15/26 | 435,553 | |||||||||
720,000 | Nabors Industries, Inc.* 7.375%, 05/15/27 | 674,237 | |||||||||
720,000 | Nabors Industries, Ltd.* 7.500%, 01/15/28 | 636,221 | |||||||||
952,000 | New Fortress Energy, Inc.* 6.750%, 09/15/25 | 885,969 | |||||||||
478,000 | 6.500%, 09/30/26 | 428,522 | |||||||||
479,000 | Oceaneering International, Inc.* 6.000%, 02/01/28 | 439,257 | |||||||||
1,025,000 | Parkland Corp.* 5.875%, 07/15/27 | 985,691 | |||||||||
506,000 | Patterson-UTI Energy, Inc. 5.150%, 11/15/29 | 452,040 | |||||||||
238,000 | Permian Resources Operating LLC* 7.000%, 01/15/32 | 232,883 | |||||||||
960,000 | Plains All American Pipeline, LP‡ 9.736%, 11/01/35 3 mo. USD LIBOR + 4.11% | 906,182 | |||||||||
1,340,000 | Rockcliff Energy II, LLC* 5.500%, 10/15/29 | 1,216,264 | |||||||||
480,000 | Southwestern Energy Company 5.375%, 02/01/29 | 444,686 | |||||||||
479,000 | 4.750%, 02/01/32 | 412,400 | |||||||||
239,000 | Sunoco, LP / Sunoco Finance Corp. 4.500%, 04/30/30 | 205,638 | |||||||||
1,363,250 | Transocean, Inc.* 8.750%, 02/15/30 | 1,362,146 | |||||||||
600,000 | Venture Global Calcasieu Pass, LLC* 6.250%, 01/15/30 | 566,412 | |||||||||
240,000 | 4.125%, 08/15/31 | 194,014 | |||||||||
240,000 | 3.875%, 08/15/29 | 201,036 | |||||||||
1,195,000 | Venture Global LNG, Inc.* 8.375%, 06/01/31 | 1,141,225 | |||||||||
715,000 | 8.125%, 06/01/28 | 694,708 | |||||||||
480,000 | 9.875%, 02/01/32 | 487,138 | |||||||||
240,000 | 9.500%, 02/01/29 | 243,607 | |||||||||
899,000 | Vital Energy, Inc. 9.500%, 01/15/25 | 903,873 | |||||||||
570,000 | 7.750%, 07/31/29* | 515,166 | |||||||||
120,000 | 9.750%, 10/15/30 | 117,690 | |||||||||
1,000,000 | VOC Escrow, Ltd.* 5.000%, 02/15/28 | 902,070 | |||||||||
1,195,000 | Weatherford International, Ltd.* 8.625%, 04/30/30 | 1,209,364 | |||||||||
38,473,503 | |||||||||||
See accompanying Notes to Schedule of Investments
www.calamos.com
113
Convertible Opportunities and Income Fund Schedule of Investments October 31, 2023
| PRINCIPAL AMOUNT | VALUE | ||||||||||
Financials (7.2%) | |||||||||||
1,280,000 | Acrisure, LLC / Acrisure Finance, Inc.* 7.000%, 11/15/25 | $ | 1,243,546 | ||||||||
1,440,000 | Aethon United BR, LP / Aethon United Finance Corp.* 8.250%, 02/15/26 | 1,431,950 | |||||||||
1,363,000 | AG Issuer, LLC* 6.250%, 03/01/28 | 1,263,065 | |||||||||
1,675,000 | Alliant Holdings Intermediate, LLC / Alliant Holdings Co-Issuer* 6.750%, 10/15/27 | 1,530,079 | |||||||||
1,087,000 | Ally Financial, In c. 4.700%, 11/01/35‡ 5 year CMT + 3.87% | 710,278 | |||||||||
445,000 | Ally Financial, Inc. 4.700%, 11/01/35‡ 7 year CMT + 3.48% | 260,374 | |||||||||
402,000 | 8.000%, 11/01/31 | 393,104 | |||||||||
1,923,000 | AmWINS Group, Inc.* 4.875%, 06/30/29 | 1,650,780 | |||||||||
1,069,000 | Aviation Capital Group, LLC*µ 3.500%, 11/01/27 | 939,587 | |||||||||
400,000 | Avolon Holdings Funding, Ltd.*µ 5.500%, 01/15/26 | 385,544 | |||||||||
1,916,000 | BroadStreet Partners, Inc.*^ 5.875%, 04/15/29 | 1,671,863 | |||||||||
905,000 | Brookfield Property REIT, Inc. / BPR Cumulus, LLC / BPR Nimbus, LLC / GGSI Sellco, LLC* 4.500%, 04/01/27 | 755,241 | |||||||||
605,000 | 5.750%, 05/15/26 | 554,876 | |||||||||
1,000,000 | Burford Capital Global Financial, LLC* 6.875%, 04/15/30 | 905,340 | |||||||||
1,250,000 | Credit Acceptance Corp. 6.625%, 03/15/26^ | 1,191,450 | |||||||||
869,000 | 5.125%, 12/31/24* | 841,374 | |||||||||
960,000 | Cushman & Wakefield U.S. Borrower LLC*^ 8.875%, 09/01/31 | 912,096 | |||||||||
1,247,000 | Enact Holdings, Inc.*µ 6.500%, 08/15/25 | 1,228,183 | |||||||||
1,398,000 | Global Net Lease, Inc. / Global Net Lease Operating Partnership, LP* 3.750%, 12/15/27 | 1,061,809 | |||||||||
1,000,000 | GTCR W-2 Merger Sub, LLC* 7.500%, 01/15/31 | 987,190 | |||||||||
1,430,000 | HUB International, Ltd.* 5.625%, 12/01/29^ | 1,234,476 | |||||||||
735,000 | 7.000%, 05/01/26 | 716,875 | |||||||||
718,000 | Icahn Enterprises, LP / Icahn Enterprises Finance Corp. 4.375%, 02/01/29 | 557,125 | |||||||||
1,300,000 | ILFC E-Capital Trust II*‡ 7.459%, 12/21/65 3 mo. USD LIBOR + 1.80% | 977,821 | |||||||||
| PRINCIPAL AMOUNT | VALUE | ||||||||||
1,990,000 | Iron Mountain, Inc.* 5.250%, 03/15/28 | $ | 1,823,278 | ||||||||
240,000 | 7.000%, 02/15/29 | 233,100 | |||||||||
2,435,000 | Jefferies Finance, LLC / JFIN Co-Issuer Corp.* 5.000%, 08/15/28 | 1,953,235 | |||||||||
1,874,000 | Ladder Capital Finance Holdings, LLLP / Ladder Capital Finance Corp.* 5.250%, 10/01/25 | 1,786,672 | |||||||||
478,000 | 4.750%, 06/15/29 | 385,832 | |||||||||
875,000 | LD Holdings Group, LLC* 6.125%, 04/01/28 | 490,306 | |||||||||
985,000 | Level 3 Financing, Inc.* 4.250%, 07/01/28 | 557,796 | |||||||||
804,000 | 3.400%, 03/01/27^ | 748,122 | |||||||||
480,000 | 4.625%, 09/15/27 | 323,957 | |||||||||
720,000 | LPL Holdings, Inc.* 4.000%, 03/15/29 | 619,466 | |||||||||
955,000 | Macquarie Airfinance Holdings, Ltd.* 8.125%, 03/30/29 | 941,926 | |||||||||
1,498,000 | MetLife, Inc. 6.400%, 12/15/66 | 1,407,356 | |||||||||
1,300,000 | Nationstar Mortgage Holdings, Inc.* 5.500%, 08/15/28 | 1,151,982 | |||||||||
1,038,000 | Navient Corp. 5.000%, 03/15/27 | 915,495 | |||||||||
525,000 | 4.875%, 03/15/28 | 435,577 | |||||||||
1,100,000 | Necessity Retail REIT, Inc. / American Finance Operating Partner, LP* 4.500%, 09/30/28 | 824,615 | |||||||||
670,000 | OneMain Finance Corp. 9.000%, 01/15/29^ | 655,106 | |||||||||
660,000 | 3.875%, 09/15/28 | 525,631 | |||||||||
479,000 | 7.125%, 03/15/26^ | 466,201 | |||||||||
476,000 | Park Intermediate Holdings, LLC / PK Domestic Property, LLC / PK Finance Co-Issuer*^ 5.875%, 10/01/28 | 429,852 | |||||||||
1,493,000 | PHH Mortgage Corp.* 7.875%, 03/15/26 | 1,294,744 | |||||||||
1,100,000 | RHP Hotel Properties, LP / RHP Finance Corp.* 4.500%, 02/15/29 | 937,695 | |||||||||
450,000 | Rocket Mortgage, LLC / Rocket Mortgage Co-Issuer, Inc.* 3.875%, 03/01/31 | 348,300 | |||||||||
445,000 | 3.625%, 03/01/29 | 362,230 | |||||||||
220,000 | 2.875%, 10/15/26 | 192,139 | |||||||||
943,000 | StoneX Group, Inc.* 8.625%, 06/15/25 | 948,649 | |||||||||
1,123,000 | United Wholesale Mortgage, LLC* 5.500%, 04/15/29 | 940,782 | |||||||||
480,000 | 5.750%, 06/15/27 | 438,014 | |||||||||
See accompanying Notes to Schedule of Investments
CALAMOS CLOSED-END FAMILY OF FUNDS ANNUAL REPORT
114
Convertible Opportunities and Income Fund Schedule of Investments October 31, 2023
| PRINCIPAL AMOUNT | VALUE | ||||||||||
478,000 | Uniti Group, LP / Uniti Group Finance, Inc. / CSL Capital, LLC* 10.500%, 02/15/28 | $ | 460,902 | ||||||||
465,000 | 6.500%, 02/15/29 | 302,380 | |||||||||
1,100,000 | VZ Secured Financing, BV* 5.000%, 01/15/32 | 838,277 | |||||||||
1,017,000 | XHR, LP* 6.375%, 08/15/25 | 992,541 | |||||||||
48,136,184 | |||||||||||
Health Care (2.9%) | |||||||||||
1,934,000 | Bausch Health Companies, Inc.* 11.000%, 09/30/28^ | 1,183,918 | |||||||||
382,000 | 14.000%, 10/15/30 | 210,440 | |||||||||
359,000 | 6.125%, 02/01/27^ | 200,573 | |||||||||
1,917,000 | CHS/Community Health Systems, Inc.* 6.125%, 04/01/30 | 745,176 | |||||||||
1,100,000 | 8.000%, 03/15/26 | 1,007,160 | |||||||||
538,000 | 6.875%, 04/15/29 | 222,092 | |||||||||
120,000 | 5.250%, 05/15/30 | 85,315 | |||||||||
1,926,000 | DaVita, Inc.* 4.625%, 06/01/30 | 1,511,159 | |||||||||
1,139,000 | 3.750%, 02/15/31 | 820,012 | |||||||||
717,000 | Embecta Corp.* 5.000%, 02/15/30 | 569,929 | |||||||||
240,000 | 6.750%, 02/15/30 | 199,075 | |||||||||
470,000 | Encompass Health Corp. 4.750%, 02/01/30 | 407,998 | |||||||||
470,000 | 4.500%, 02/01/28 | 424,137 | |||||||||
1,109,000 | HCA, Inc.^ 7.500%, 11/06/33 | 1,138,433 | |||||||||
300,000 | Jazz Securities DAC* 4.375%, 01/15/29 | 260,949 | |||||||||
411,879 | Mallinckrodt International Finance, SA / Mallinckrodt CB, LLC*@ 10.000%, 06/15/29 | 29,276 | |||||||||
1,215,000 | Medline Borrower, LP* 3.875%, 04/01/29 | 1,026,371 | |||||||||
1,208,000 | 5.250%, 10/01/29^ | 1,029,530 | |||||||||
1,760,000 | Organon & Company / Organon Foreign Debt Co-Issuer, BV* 5.125%, 04/30/31 | 1,378,573 | |||||||||
450,000 | 4.125%, 04/30/28 | 389,444 | |||||||||
1,025,000 | Team Health Holdings, Inc.* 6.375%, 02/01/25 | 823,034 | |||||||||
2,250,000 | Tenet Healthcare Corp. 6.250%, 02/01/27 | 2,164,770 | |||||||||
1,315,000 | 6.875%, 11/15/31 | 1,214,810 | |||||||||
1,215,000 | Teva Pharmaceutical Finance Netherlands III, BV 5.125%, 05/09/29^ | 1,060,622 | |||||||||
800,000 | 4.750%, 05/09/27 | 726,264 | |||||||||
440,000 | 3.150%, 10/01/26 | 387,323 | |||||||||
19,216,383 | |||||||||||
| PRINCIPAL AMOUNT | VALUE | ||||||||||
Industrials (6.3%) | |||||||||||
1,100,000 | ACCO Brands Corp.*^ 4.250%, 03/15/29 | $ | 913,627 | ||||||||
740,000 | AerCap Holdings, NV^‡ 5.875%, 10/10/79 5 year CMT + 4.54% | 696,059 | |||||||||
965,000 | Air Lease Corp.‡ 4.125%, 11/01/35 5 year CMT + 3.15% | 694,250 | |||||||||
1,600,000 | Albertsons Companies, Inc. / Safeway, Inc. / New Albertsons, LP / Albertsons, LLC* 4.625%, 01/15/27 | 1,505,968 | |||||||||
720,000 | 5.875%, 02/15/28 | 690,761 | |||||||||
713,000 | 3.500%, 03/15/29 | 608,467 | |||||||||
1,100,000 | Allegiant Travel Company* 7.250%, 08/15/27 | 1,001,858 | |||||||||
240,000 | American Airlines Group, Inc.* 3.750%, 03/01/25 | 224,722 | |||||||||
538,000 | Arcosa, Inc.* 4.375%, 04/15/29 | 471,078 | |||||||||
2,450,000 | ARD Finance, SA* 6.500%, 06/30/27 7.250% PIK rate | 1,430,604 | |||||||||
753,000 | Beacon Roofing Supply, Inc.* 4.125%, 05/15/29 | 632,919 | |||||||||
477,000 | Bombardier, Inc.* 7.875%, 04/15/27 | 459,590 | |||||||||
956,000 | BWX Technologies, Inc.* 4.125%, 04/15/29 | 827,045 | |||||||||
1,000,000 | Cascades, Inc. / Cascades USA, Inc.* 5.375%, 01/15/28 | 908,780 | |||||||||
239,000 | Delta Air Lines, Inc. / SkyMiles IP, Ltd.*µ 4.750%, 10/20/28 | 224,643 | |||||||||
1,265,000 | Deluxe Corp.* 8.000%, 06/01/29 | 1,002,601 | |||||||||
717,000 | Eco Material Technologies, Inc.* 7.875%, 01/31/27 | 682,225 | |||||||||
478,000 | Emerald Debt Merger Sub, LLC* 6.625%, 12/15/30 | 455,371 | |||||||||
475,000 | EnerSys* 4.375%, 12/15/27 | 426,669 | |||||||||
580,000 | Graham Packaging Company, Inc.* 7.125%, 08/15/28 | 450,933 | |||||||||
625,000 | Graphic Packaging International, LLC* 4.750%, 07/15/27 | 584,056 | |||||||||
446,000 | 3.500%, 03/01/29 | 374,627 | |||||||||
1,054,000 | Great Lakes Dredge & Dock Corp.*^ 5.250%, 06/01/29 | 863,511 | |||||||||
2,244,000 | H&E Equipment Services, Inc.* 3.875%, 12/15/28 | 1,905,605 | |||||||||
See accompanying Notes to Schedule of Investments
www.calamos.com
115
Convertible Opportunities and Income Fund Schedule of Investments October 31, 2023
| PRINCIPAL AMOUNT | VALUE | ||||||||||
1,438,000 | Hawaiian Brand Intellectual Property, Ltd. / HawaiianMiles Loyalty, Ltd.* 5.750%, 01/20/26 | $ | 1,063,832 | ||||||||
1,250,000 | Herc Holdings, Inc.* 5.500%, 07/15/27 | 1,177,512 | |||||||||
1,120,000 | IEA Energy Services, LLC* 6.625%, 08/15/29 | 1,069,936 | |||||||||
564,000 | JELD-WEN, Inc.* 4.625%, 12/15/25 | 535,772 | |||||||||
500,000 | 4.875%, 12/15/27 | 426,940 | |||||||||
1,575,000 | Ken Garff Automotive, LLC* 4.875%, 09/15/28 | 1,342,136 | |||||||||
955,000 | Knife River Holding Company* 7.750%, 05/01/31 | 952,928 | |||||||||
474,000 | MasTec, Inc.*µ 4.500%, 08/15/28 | 416,783 | |||||||||
588,000 | Moog, Inc.* 4.250%, 12/15/27 | 533,928 | |||||||||
1,198,000 | Newfold Digital Holdings Group, Inc.*^ 6.000%, 02/15/29 | 792,034 | |||||||||
940,000 | Novelis Corp.* 4.750%, 01/30/30 | 801,397 | |||||||||
360,000 | OI European Group, BV* 4.750%, 02/15/30 | 306,533 | |||||||||
1,100,000 | Pactiv Evergreen Group Issuer, Inc. / Pactiv Evergreen Group Issuer, LLC*^ 4.000%, 10/15/27 | 968,462 | |||||||||
1,449,000 | Patrick Industries, Inc.*^ 4.750%, 05/01/29 | 1,191,237 | |||||||||
470,000 | QVC, Inc. 5.450%, 08/15/34 | 200,182 | |||||||||
743,000 | Sealed Air Corp.* 6.125%, 02/01/28 | 707,574 | |||||||||
239,000 | 5.000%, 04/15/29^ | 213,291 | |||||||||
450,000 | Sensata Technologies, BV* 4.000%, 04/15/29 | 383,121 | |||||||||
479,000 | Sensata Technologies, Inc.* 3.750%, 02/15/31 | 384,091 | |||||||||
717,000 | Sinclair Television Group, Inc.* 4.125%, 12/01/30 | 451,294 | |||||||||
475,000 | 5.500%, 03/01/30 | 258,357 | |||||||||
955,000 | Standard Industries, Inc.* 5.000%, 02/15/27 | 884,588 | |||||||||
773,000 | Stericycle, Inc.*^ 3.875%, 01/15/29 | 660,498 | |||||||||
717,000 | STL Holding Company, LLC* 7.500%, 02/15/26 | 673,399 | |||||||||
1,299,000 | TransDigm, Inc. 6.250%, 03/15/26* | 1,271,227 | |||||||||
1,035,000 | 6.875%, 12/15/30* | 1,001,663 | |||||||||
710,000 | 6.750%, 08/15/28* | 691,000 | |||||||||
700,000 | 7.500%, 03/15/27 | 700,098 | |||||||||
| PRINCIPAL AMOUNT | VALUE | ||||||||||
960,000 | Tronox, Inc.* 4.625%, 03/15/29 | $ | 754,656 | ||||||||
389,717 | United Airlines Pass Through Trust Series 2019-2, Class B 3.500%, 11/01/29 | 345,398 | |||||||||
961,000 | Vertiv Group Corp.* 4.125%, 11/15/28 | 841,019 | |||||||||
1,004,000 | Wabash National Corp.* 4.500%, 10/15/28 | 832,547 | |||||||||
855,000 | Waste Pro USA, Inc.*^ 5.500%, 02/15/26 | 788,780 | |||||||||
565,000 | Williams Scotsman, Inc.* 4.625%, 08/15/28 | 502,681 | |||||||||
42,160,863 | |||||||||||
Information Technology (2.0%) | |||||||||||
478,000 | Booz Allen Hamilton, Inc.* 4.000%, 07/01/29 | 422,194 | |||||||||
557,000 | Coherent Corp.*^ 5.000%, 12/15/29 | 473,584 | |||||||||
1,114,000 | CommScope Technologies, LLC* 6.000%, 06/15/25 | 672,923 | |||||||||
895,000 | CommScope, Inc.* 4.750%, 09/01/29 | 611,401 | |||||||||
602,000 | Dell International, LLC / EMC Corp.µ 6.020%, 06/15/26 | 602,680 | |||||||||
478,000 | Dun & Bradstreet Corp.*^ 5.000%, 12/15/29 | 411,864 | |||||||||
480,000 | Fair Isaac Corp.* 4.000%, 06/15/28 | 428,232 | |||||||||
1,050,000 | KBR, Inc.* 4.750%, 09/30/28 | 925,943 | |||||||||
1,050,000 | MPH Acquisition Holdings, LLC* 5.750%, 11/01/28^ | 784,088 | |||||||||
480,000 | 5.500%, 09/01/28 | 401,462 | |||||||||
477,000 | NCL Corp., Ltd.* 8.125%, 01/15/29 | 466,668 | |||||||||
478,000 | NCR Voyix Corp.* 5.125%, 04/15/29 | 411,591 | |||||||||
723,000 | ON Semiconductor Corp.* 3.875%, 09/01/28 | 621,404 | |||||||||
705,000 | Open Text Corp.* 3.875%, 02/15/28 | 614,104 | |||||||||
475,000 | 6.900%, 12/01/27 | 474,088 | |||||||||
359,000 | 3.875%, 12/01/29 | 294,728 | |||||||||
359,000 | Open Text Holdings, Inc.*^ 4.125%, 12/01/31 | 283,028 | |||||||||
1,080,000 | Playtika Holding Corp.* 4.250%, 03/15/29 | 871,927 | |||||||||
1,350,000 | TTM Technologies, Inc.* 4.000%, 03/01/29 | 1,110,672 | |||||||||
680,000 | Twilio, Inc. 3.625%, 03/15/29 | 567,508 | |||||||||
236,000 | 3.875%, 03/15/31^ | 188,902 | |||||||||
See accompanying Notes to Schedule of Investments
CALAMOS CLOSED-END FAMILY OF FUNDS ANNUAL REPORT
116
Convertible Opportunities and Income Fund Schedule of Investments October 31, 2023
| PRINCIPAL AMOUNT | VALUE | ||||||||||
1,200,000 | Viavi Solutions, Inc.* 3.750%, 10/01/29 | $ | 955,380 | ||||||||
1,100,000 | ZoomInfo Technologies, LLC / ZoomInfo Finance Corp.*^ 3.875%, 02/01/29 | 909,513 | |||||||||
13,503,884 | |||||||||||
Materials (1.9%) | |||||||||||
500,000 | ArcelorMittal, SA^ 7.000%, 10/15/39 | 475,560 | |||||||||
534,000 | ATI, Inc.^ 5.875%, 12/01/27 | 497,362 | |||||||||
242,000 | Carpenter Technology Corp. 7.625%, 03/15/30 | 240,425 | |||||||||
715,000 | Chemours Company* 4.625%, 11/15/29 | 553,324 | |||||||||
1,530,000 | Clearwater Paper Corp.* 4.750%, 08/15/28 | 1,352,076 | |||||||||
716,000 | Cleveland-Cliffs, Inc.* 6.750%, 04/15/30 | 665,236 | |||||||||
478,000 | Commercial Metals Company 4.125%, 01/15/30 | 404,560 | |||||||||
239,000 | 4.375%, 03/15/32 | 193,143 | |||||||||
1,115,000 | Constellium, SE*^ 3.750%, 04/15/29 | 918,236 | |||||||||
477,000 | HB Fuller Company 4.250%, 10/15/28 | 414,007 | |||||||||
475,000 | INEOS Finance, PLC*^ 6.750%, 05/15/28 | 444,172 | |||||||||
725,000 | JW Aluminum Continuous Cast Company*^ 10.250%, 06/01/26 | 723,209 | |||||||||
1,090,000 | Kaiser Aluminum Corp.* 4.625%, 03/01/28 | 911,098 | |||||||||
120,000 | 4.500%, 06/01/31 | 88,763 | |||||||||
235,000 | LSF11 A5 HoldCo, LLC*^ 6.625%, 10/15/29 | 192,820 | |||||||||
1,260,000 | Mercer International, Inc. 5.125%, 02/01/29 | 989,642 | |||||||||
483,000 | 12.875%, 10/01/28* | 488,439 | |||||||||
935,000 | OCI, NV* 6.700%, 03/16/33 | 865,352 | |||||||||
720,000 | Owens-Brockway Glass Container, Inc.*^ 7.250%, 05/15/31 | 659,794 | |||||||||
472,000 | 6.625%, 05/13/27 | 449,750 | |||||||||
1,105,000 | Silgan Holdings, Inc. 4.125%, 02/01/28 | 985,605 | |||||||||
478,000 | Trinseo Materials Operating SCA / Trinseo Materials Finance, Inc.* 5.125%, 04/01/29 | 204,799 | |||||||||
12,717,372 | |||||||||||
| PRINCIPAL AMOUNT | VALUE | ||||||||||
Other (0.1%) | |||||||||||
500,000 | Gen Digital, Inc.* 7.125%, 09/30/30^ | $ | 487,405 | ||||||||
500,000 | 6.750%, 09/30/27 | 487,560 | |||||||||
974,965 | |||||||||||
Real Estate (0.4%) | |||||||||||
764,000 | EPR Properties 3.750%, 08/15/29 | 603,789 | |||||||||
750,000 | Forestar Group, Inc.* 5.000%, 03/01/28 | 661,545 | |||||||||
502,000 | 3.850%, 05/15/26 | 450,515 | |||||||||
1,073,000 | MIWD Holdco II, LLC / MIWD Finance Corp.* 5.500%, 02/01/30 | 852,359 | |||||||||
465,000 | Service Properties Trust 5.250%, 02/15/26 | 417,426 | |||||||||
2,985,634 | |||||||||||
Special Purpose Acquisition Companies (0.2%) | |||||||||||
955,000 | Fertitta Entertainment, LLC / Fertitta Entertainment Finance Company, Inc.* 6.750%, 01/15/30^ | 759,894 | |||||||||
477,000 | 4.625%, 01/15/29 | 402,726 | |||||||||
1,162,620 | |||||||||||
Utilities (0.1%) | |||||||||||
350,000 | PPL Capital Funding, Inc.‡ 8.317%, 03/30/67 3 mo. USD LIBOR + 2.67% | 317,117 | |||||||||
450,000 | Vistra Corp.*‡ 7.000%, 11/01/67 5 year CMT + 5.74% | 411,660 | |||||||||
250,000 | 8.000%, 11/01/67 5 year CMT + 6.93% | 237,845 | |||||||||
966,622 | |||||||||||
| TOTAL CORPORATE BONDS(Cost $326,717,137) | 295,809,134 | ||||||||||
CONVERTIBLE BONDS (105.0%) | |||||||||||
Communication Services (9.5%) | |||||||||||
720,000 | Cable One, Inc.µ 0.000%, 03/15/26 | 589,457 | |||||||||
8,500,000 | Liberty Media Corp.* 3.750%, 03/15/28 | 9,367,255 | |||||||||
8,250,000 | 2.375%, 09/30/53µ | 7,999,612 | |||||||||
9,000,000 | Liberty Media Corp.-Liberty Formula One 2.250%, 08/15/27 | 8,970,570 | |||||||||
5,250,000 | Match Group Financeco 3, Inc.*µ 2.000%, 01/15/30 | 4,266,518 | |||||||||
6,000,000 | Perficient, Inc.µ 0.125%, 11/15/26 | 4,802,940 | |||||||||
14,500,000 | Sea, Ltd. 0.250%, 09/15/26 | 11,530,110 | |||||||||
www.calamos.com
117
Convertible Opportunities and Income Fund Schedule of Investments October 31, 2023
| PRINCIPAL AMOUNT | VALUE | ||||||||||
| Snap, Inc.µ 10,500,000 | 0.000%, 05/01/27 | $ | 7,820,925 | ||||||||
5,750,000 | 0.750%, 08/01/26 | 5,076,215 | |||||||||
3,500,000 | Zillow Group, Inc.µ 1.375%, 09/01/26 | 3,676,470 | |||||||||
64,100,072 | |||||||||||
Consumer Discretionary (20.0%) | |||||||||||
11,500,000 | Airbnb, Inc.µ 0.000%, 03/15/26 | 9,963,600 | |||||||||
4,500,000 | Booking Holdings, Inc.µ 0.750%, 05/01/25 | 6,862,095 | |||||||||
4,250,000 | Carnival Corp.*µ 5.750%, 12/01/27 | 5,035,485 | |||||||||
6,750,000 | Chegg, Inc.µ 0.000%, 09/01/26 | 5,243,535 | |||||||||
14,191,000 | DISH Network Corp. 0.000%, 12/15/25 | 8,706,746 | |||||||||
1,195,000 | 2.375%, 03/15/24µ | 1,145,061 | |||||||||
11,500,000 | DraftKings Holdings, Inc.µ 0.000%, 03/15/28 | 8,535,875 | |||||||||
12,750,000 | Etsy, Inc.µ 0.125%, 09/01/27 | 10,075,560 | |||||||||
16,750,000 | Ford Motor Companyµ 0.000%, 03/15/26 | 15,289,567 | |||||||||
8,750,000 | Liberty Broadband Corp.*µ 3.125%, 03/31/53 | 8,680,438 | |||||||||
2,435,000 | Lucid Group, Inc.* 1.250%, 12/15/26 | 1,342,075 | |||||||||
10,250,000 | Marriott Vacations Worldwide Corp.*µ 3.250%, 12/15/27 | 8,690,667 | |||||||||
9,750,000 | Rivian Automotive, Inc.* 4.625%, 03/15/29 | 10,278,255 | |||||||||
5,750,000 | Shake Shack, Inc.µ 0.000%, 03/01/28 | 4,252,240 | |||||||||
15,000,000 | Vail Resorts, Inc.µ^ 0.000%, 01/01/26 | 13,133,100 | |||||||||
13,500,000 | Wayfair, Inc.µ 3.250%, 09/15/27 | 13,009,140 | |||||||||
4,250,000 | Wynn Macau, Ltd.* 4.500%, 03/07/29 | 4,335,510 | |||||||||
134,578,949 | |||||||||||
Consumer Staples (1.1%) | |||||||||||
2,886,000 | Enovis Corp.* 3.875%, 10/15/28 | 3,015,148 | |||||||||
4,500,000 | Post Holdings, Inc. 2.500%, 08/15/27 | 4,295,565 | |||||||||
7,310,713 | |||||||||||
Energy (3.0%) | |||||||||||
1,500,000 | EQT Corp.µ 1.750%, 05/01/26 | 4,361,100 | |||||||||
4,890,000 | Nabors Industries, Inc.*µ 1.750%, 06/15/29 | 3,664,175 | |||||||||
| PRINCIPAL AMOUNT | VALUE | ||||||||||
4,250,000 | Northern Oil & Gas, Inc. 3.625%, 04/15/29 | $ | 5,019,548 | ||||||||
2,750,000 | Pioneer Natural Resources Company 0.250%, 05/15/25 | 7,017,917 | |||||||||
9,411,000 | SunEdison, Inc.@ 0.250%, 01/15/49* | 94,110 | |||||||||
898,000 | 0.000%, 10/01/49 | 8,980 | |||||||||
20,165,830 | |||||||||||
Financials (1.3%) | |||||||||||
8,750,000 | Morgan Stanley Finance, LLC 1.000%, 11/23/27 | 8,870,750 | |||||||||
Health Care (22.5%) | |||||||||||
4,500,000 | Alnylam Pharmaceuticals, Inc.µ 1.000%, 09/15/27 | 3,905,370 | |||||||||
5,500,000 | Alphatec Holdings, Inc.µ 0.750%, 08/01/26 | 4,698,705 | |||||||||
5,702,000 | BioMarin Pharmaceutical, Inc.µ 0.599%, 08/01/24 | 5,498,496 | |||||||||
9,500,000 | CONMED Corp.µ 2.250%, 06/15/27 | 8,893,425 | |||||||||
12,250,000 | CryoPort, Inc.*µ 0.750%, 12/01/26 | 9,694,037 | |||||||||
15,831,000 | Dexcom, Inc.µ 0.250%, 11/15/25 | 15,027,893 | |||||||||
8,000,000 | 0.375%, 05/15/28* | 7,056,480 | |||||||||
4,250,000 | Envista Holdings Corp.*µ 1.750%, 08/15/28 | 3,677,270 | |||||||||
6,750,000 | Exact Sciences Corp.µ 0.375%, 03/15/27 | 5,880,600 | |||||||||
7,250,000 | Halozyme Therapeutics, Inc.µ 1.000%, 08/15/28 | 6,378,768 | |||||||||
4,250,000 | Insmed, Inc. 0.750%, 06/01/28 | 4,130,915 | |||||||||
4,500,000 | Insulet Corp.µ 0.375%, 09/01/26 | 4,168,575 | |||||||||
9,125,000 | Integer Holdings Corp.* 2.125%, 02/15/28 | 10,044,617 | |||||||||
4,500,000 | Integra LifeSciences Holdings Corp.µ 0.500%, 08/15/25 | 4,059,495 | |||||||||
4,500,000 | Ionis Pharmaceuticals, Inc. 0.000%, 04/01/26 | 4,358,025 | |||||||||
9,950,000 | Jazz Investments I, Ltd. 2.000%, 06/15/26 | 10,101,538 | |||||||||
3,721,000 | Lantheus Holdings, Inc.*µ 2.625%, 12/15/27 | 4,128,524 | |||||||||
10,250,000 | NeoGenomics, Inc.µ 0.250%, 01/15/28 | 7,407,368 | |||||||||
8,500,000 | Omnicell, Inc.µ 0.250%, 09/15/25 | 7,556,245 | |||||||||
8,000,000 | Pacira BioSciences, Inc.µ 0.750%, 08/01/25 | 7,196,800 | |||||||||
See accompanying Notes to Schedule of Investments
CALAMOS CLOSED-END FAMILY OF FUNDS ANNUAL REPORT
118
Convertible Opportunities and Income Fund Schedule of Investments October 31, 2023
| PRINCIPAL AMOUNT | VALUE | ||||||||||
3,750,000 | Sarepta Therapeutics, Inc.µ 1.250%, 09/15/27 | $ | 3,193,313 | ||||||||
8,250,000 | Shockwave Medical, Inc.*µ 1.000%, 08/15/28 | 7,999,282 | |||||||||
6,750,000 | Tandem Diabetes Care, Inc.*µ 1.500%, 05/01/25 | 6,372,878 | |||||||||
151,428,619 | |||||||||||
Industrials (8.3%) | |||||||||||
4,125,000 | Advanced Energy Industries, Inc.*µ 2.500%, 09/15/28 | 3,812,738 | |||||||||
4,250,000 | Axon Enterprise, Inc.*^ 0.500%, 12/15/27 | 4,584,942 | |||||||||
4,125,000 | Fluor Corp.* 1.125%, 08/15/29 | 3,982,234 | |||||||||
7,250,000 | John Bean Technologies Corp.µ 0.250%, 05/15/26 | 6,524,347 | |||||||||
4,250,000 | Middleby Corp. 1.000%, 09/01/25 | 4,414,518 | |||||||||
3,000,000 | Parsons Corp. 0.250%, 08/15/25 | 3,935,520 | |||||||||
7,000,000 | Southwest Airlines Companyµ^ 1.250%, 05/01/25 | 6,671,000 | |||||||||
4,000,000 | Tetra Tech, Inc.*µ 2.250%, 08/15/28 | 3,874,760 | |||||||||
20,000,000 | Uber Technologies, Inc.µ 0.000%, 12/15/25 | 18,284,000 | |||||||||
56,084,059 | |||||||||||
Information Technology (32.8%) | |||||||||||
8,250,000 | Akamai Technologies, Inc.µ 1.125%, 02/15/29* | 8,122,208 | |||||||||
4,500,000 | 0.375%, 09/01/27 | 4,584,015 | |||||||||
9,250,000 | Bentley Systems, Inc. 0.125%, 01/15/26 | 8,829,032 | |||||||||
7,500,000 | BILL Holdings, Inc.µ 0.000%, 12/01/25 | 7,128,450 | |||||||||
3,250,000 | Camtek, Ltd.* 0.000%, 12/01/26 | 3,507,465 | |||||||||
5,750,000 | Confluent, Inc.µ 0.000%, 01/15/27 | 4,640,940 | |||||||||
7,500,000 | CyberArk Software, Ltd.µ 0.000%, 11/15/24 | 8,586,000 | |||||||||
6,250,000 | Datadog, Inc. 0.125%, 06/15/25 | 6,882,750 | |||||||||
6,000,000 | DigitalOcean Holdings, Inc.µ 0.000%, 12/01/26 | 4,514,760 | |||||||||
9,066,000 | Enphase Energy, Inc.µ 0.000%, 03/01/26 | 7,731,757 | |||||||||
5,750,000 | Five9, Inc.µ 0.500%, 06/01/25 | 5,261,883 | |||||||||
2,000,000 | MongoDB, Inc.~ 0.250%, 01/15/26 | 3,412,600 | |||||||||
| PRINCIPAL AMOUNT | VALUE | ||||||||||
6,000,000 | NCL Corp., Ltd.µ 1.125%, 02/15/27 | $ | 4,653,240 | ||||||||
4,500,000 | 2.500%, 02/15/27 | 3,610,440 | |||||||||
3,000,000 | 5.375%, 08/01/25 | 3,184,440 | |||||||||
7,500,000 | Okta, Inc.µ 0.125%, 09/01/25 | 6,714,900 | |||||||||
4,000,000 | 0.375%, 06/15/26 | 3,430,520 | |||||||||
17,250,000 | ON Semiconductor Corp.*µ 0.500%, 03/01/29 | 15,165,165 | |||||||||
5,500,000 | Palo Alto Networks, Inc. 0.375%, 06/01/25 | 13,431,110 | |||||||||
2,000,000 | Q2 Holdings, Inc.µ 0.750%, 06/01/26 | 1,737,940 | |||||||||
4,125,000 | Rapid7, Inc.*µ 1.250%, 03/15/29 | 3,990,608 | |||||||||
11,250,000 | Repay Holdings Corp.*µ 0.000%, 02/01/26 | 9,003,937 | |||||||||
4,000,000 | Seagate HDD Cayman* 3.500%, 06/01/28 | 4,149,360 | |||||||||
13,750,000 | Shift4 Payments, Inc.µ 0.000%, 12/15/25 | 12,522,125 | |||||||||
6,600,000 | SK Hynix, Inc. 1.750%, 04/11/30 | 7,985,736 | |||||||||
11,500,000 | Splunk, Inc.µ 1.125%, 06/15/27 | 10,870,835 | |||||||||
10,000,000 | Tyler Technologies, Inc.^ 0.250%, 03/15/26 | 9,509,000 | |||||||||
12,250,000 | Unity Software, Inc.µ 0.000%, 11/15/26 | 9,600,080 | |||||||||
6,250,000 | Wix.com, Ltd. 0.000%, 08/15/25 | 5,542,250 | |||||||||
8,750,000 | Wolfspeed, Inc. 1.875%, 12/01/29* | 5,226,550 | |||||||||
5,338,000 | 0.250%, 02/15/28 | 3,291,624 | |||||||||
4,250,000 | Workiva, Inc.*µ 1.250%, 08/15/28 | 3,860,360 | |||||||||
8,000,000 | Zscaler, Inc. 0.125%, 07/01/25 | 9,767,520 | |||||||||
220,449,600 | |||||||||||
Materials (2.4%) | |||||||||||
1,500,000 | ATI, Inc. 3.500%, 06/15/25 | 3,711,240 | |||||||||
3,500,000 | Ivanhoe Mines, Ltd.* 2.500%, 04/15/26 | 4,024,685 | |||||||||
4,991,000 | Lithium Americas Corp. 1.750%, 01/15/27 | 3,369,424 | |||||||||
6,306,000 | MP Materials Corp.*µ 0.250%, 04/01/26 | 5,195,892 | |||||||||
16,301,241 | |||||||||||
Other (0.1%) | |||||||||||
475,000 | Multiplan Corp.* 6.000%, 10/15/27 7.000% PIK rate | 315,884 | |||||||||
See accompanying Notes to Schedule of Investments
www.calamos.com
119
Convertible Opportunities and Income Fund Schedule of Investments October 31, 2023
| PRINCIPAL AMOUNT | VALUE | ||||||||||
Real Estate (0.7%) | |||||||||||
6,000,000 | Pebblebrook Hotel Trustµ 1.750%, 12/15/26 | $ | 4,771,380 | ||||||||
Utilities (3.3%) | |||||||||||
4,250,000 | CMS Energy Corp.* 3.375%, 05/01/28 | 4,024,070 | |||||||||
15,250,000 | PPL Capital Funding, Inc.* 2.875%, 03/15/28 | 13,985,470 | |||||||||
4,250,000 | Southern Company*µ 3.875%, 12/15/25 | 4,175,540 | |||||||||
22,185,080 | |||||||||||
| TOTAL CONVERTIBLE BONDS(Cost $809,229,108) | 706,562,177 | ||||||||||
BANK LOANS (7.0%)¡ | |||||||||||
Airlines (0.2%) | |||||||||||
720,000 | American Airlines, Inc.‡ 10.427%, 04/20/28 3 mo. SOFR + 4.75% | 731,250 | |||||||||
738,750 | Mileage Plus Holdings, LLC‡ 10.798%, 06/21/27 3 mo. SOFR + 5.25% | 762,545 | |||||||||
1,493,795 | |||||||||||
Communication Services (0.2%) | |||||||||||
126,698 | Clear Channel Outdoor Holdings, Inc.‡ 9.145%, 08/21/26 1 mo. SOFR + 3.50% | 121,999 | |||||||||
317,944 | DIRECTV Financing, LLC‡ 10.325%, 08/02/27 1 mo. SOFR + 5.00% | 309,940 | |||||||||
1,505,000 | Entercom Media Corp.‡ 8.145%, 11/18/24 3 mo. SOFR + 2.50% | 661,967 | |||||||||
485,000 | Telesat Canada‡ 8.434%, 12/07/26 3 mo. SOFR + 2.75% | 334,286 | |||||||||
1,428,192 | |||||||||||
Consumer Discretionary (1.3%) | |||||||||||
458,111 | American Axle and Manufacturing, Inc.‡ 9.007%, 12/13/29 3 mo. SOFR + 3.50% | 457,158 | |||||||||
305,264 | American Axle and Manufacturing, Inc.‡ 8.941%, 12/13/29 1 mo. SOFR + 3.50% | 304,629 | |||||||||
965,150 | Caesars Entertainment Corp.‡ 8.674%, 02/06/30 1 mo. SOFR + 3.25% | 962,872 | |||||||||
972,563 | Carnival Corp.‡ 8.336%, 08/08/27 1 mo. SOFR + 3.00% | 956,758 | |||||||||
| PRINCIPAL AMOUNT | VALUE | ||||||||||
980,075 | Hanesbrands, Inc.‡ 9.074%, 03/08/30 1 mo. SOFR + 3.75% | $ | 969,049 | ||||||||
530,816 | Life Time Fitness, Inc.‡ 10.130%, 01/15/26 3 mo. SOFR + 4.75% | 531,944 | |||||||||
1,105,558 | Petco Health and Wellness Company, Inc.‡ 8.902%, 03/03/28 3 mo. SOFR + 3.25% | 1,082,833 | |||||||||
2,386,325 | PetSmart, Inc.‡ 9.174%, 02/11/28 1 mo. SOFR + 3.75% | 2,361,221 | |||||||||
599,326 | TKC Holdings, Inc.‡ 10.939%, 05/15/28 1 mo. LIBOR + 5.50% | 575,353 | |||||||||
245,000 | Windsor Holdings III, LLC‡ 9.815%, 08/01/30 1 mo. SOFR + 4.50% | 244,585 | |||||||||
8,446,402 | |||||||||||
Consumer Staples (0.2%) | |||||||||||
960,000 | Star Parent, Inc.‡ 9.386%, 09/27/30 3 mo. LIBOR + 4.00% | 917,765 | |||||||||
500,000 | United Natural Foods, Inc.‡ 8.689%, 10/22/25 1 mo. SOFR + 3.25% | 499,305 | |||||||||
1,417,070 | |||||||||||
Energy (0.3%) | |||||||||||
475,000 | New Fortress Energy, Inc.‡ 0.000%, 10/23/30 | 439,375 | |||||||||
1,200,200 | Par Petroleum, LLC‡ 9.773%, 02/28/30 3 mo. SOFR + 4.25% | 1,198,700 | |||||||||
1,638,075 | |||||||||||
Financials (1.3%) | |||||||||||
240,000 | Advisor Group, Inc.‡ 9.824%, 08/17/28 1 mo. SOFR + 4.50% | 239,205 | |||||||||
950,213 | Alliant Holdings Intermediate, LLC‡ 8.835%, 11/05/27 1 mo. SOFR + 3.50% | 948,089 | |||||||||
526,001 | Amynta Agency Borrower, Inc.‡ 10.325%, 02/28/28 1 mo. SOFR + 5.00% | 526,369 | |||||||||
192,271 | Amynta Agency Borrower, Inc.‡ 10.424%, 02/28/28 1 mo. SOFR + 5.00% | 192,405 | |||||||||
989,950 | AssuredPartners, Inc.‡ 8.824%, 02/12/27 1 mo. SOFR + 3.50% | 982,525 | |||||||||
See accompanying Notes to Schedule of Investments
CALAMOS CLOSED-END FAMILY OF FUNDS ANNUAL REPORT
120
Convertible Opportunities and Income Fund Schedule of Investments October 31, 2023
| PRINCIPAL AMOUNT | VALUE | ||||||||||
738,150 | Avolon TLB Borrower 1 LLC‡ 7.839%, 06/22/28 1 mo. SOFR + 2.50% | $ | 739,180 | ||||||||
873,728 | Castlelake Aviation, Ltd.! 0.000%, 10/22/26 | 873,182 | |||||||||
471,438 | Castlelake Aviation, Ltd.‡ 8.421%, 10/22/27 3 mo. SOFR + 2.75% | 470,891 | |||||||||
952,800 | Hub International, Ltd.‡ 9.365%, 11/10/29 3 mo. SOFR + 4.00% | 952,662 | |||||||||
1,761,452 | Jazz Financing Lux Sarl‡ 8.939%, 05/05/28 1 mo. SOFR + 3.50% | 1,762,914 | |||||||||
1,331,550 | VFH Parent, LLC‡ 8.427%, 01/13/29 1 mo. SOFR + 3.00% | 1,325,032 | |||||||||
9,012,454 | |||||||||||
Health Care (0.8%) | |||||||||||
1,677,793 | Amneal Pharmaceuticals, LLC‡ 8.939%, 05/04/25 1 mo. SOFR + 3.50% | 1,647,525 | |||||||||
526,015 | Icon Luxembourg Sarl‡ 7.902%, 07/03/28 3 mo. SOFR + 2.25% | 526,928 | |||||||||
1,001,248 | Mallinckrodt International Finance, SA‡ 12.703%, 09/30/27 1 mo. SOFR + 7.25% | 762,896 | |||||||||
988,235 | Padagis, LLC‡ 10.434%, 07/06/28 3 mo. SOFR + 4.75% | 880,355 | |||||||||
131,057 | PRA Health Sciences, Inc. 7.902%, 07/03/28 3 mo. SOFR + 2.25% | 131,285 | |||||||||
2,374,245 | Team Health Holdings, Inc.‡ 10.633%, 03/02/27 3 mo. SOFR + 5.25% | 1,716,045 | |||||||||
6,770 | Team Health Holdings, Inc.‡ 10.577%, 03/02/27 1 mo. SOFR + 5.25% | 4,893 | |||||||||
5,669,927 | |||||||||||
Industrials (0.8%) | |||||||||||
469,200 | ACProducts, Inc.‡ 9.902%, 05/17/28 3 mo. SOFR + 4.25% | 374,447 | |||||||||
607,313 | Air Canada‡ 9.128%, 08/11/28 3 mo. SOFR + 3.50% | 607,464 | |||||||||
1,225,738 | ChampionX Corp.‡ 8.177%, 06/07/29 1 mo. SOFR + 2.75% | 1,231,290 | |||||||||
607,538 | Emrld Borrower, LP‡ 8.380%, 05/31/30 3 mo. SOFR + 3.00% | 606,967 | |||||||||
| PRINCIPAL AMOUNT | VALUE | ||||||||||
1,125,750 | Scientific Games International, Inc.‡ 8.435%, 04/14/29 1 mo. SOFR + 3.00% | $ | 1,126,105 | ||||||||
521,063 | Summit Materials, LLC‡ 8.571%, 12/14/27 3 mo. SOFR + 3.00% | 523,913 | |||||||||
931,224 | United Airlines, Inc.‡ 9.189%, 04/21/28 1 mo. SOFR + 3.75% | 930,642 | |||||||||
5,400,828 | |||||||||||
Information Technology (0.7%) | |||||||||||
948,697 | Banff Merger Sub, Inc.‡ 9.189%, 10/02/25 1 mo. SOFR + 3.75% | 948,896 | |||||||||
807,701 | Camelot Finance SA‡ 8.439%, 10/30/26 1 mo. SOFR + 3.00% | 807,621 | |||||||||
670,000 | Central Parent, Inc.! 0.000%, 07/06/29 | 667,069 | |||||||||
243,163 | Central Parent, Inc.‡ 9.406%, 07/06/29 3 mo. SOFR + 4.00% | 242,099 | |||||||||
962,194 | Dun & Bradstreet Corp.‡ 8.176%, 02/06/26 1 mo. SOFR + 2.75% | 962,194 | |||||||||
891,298 | II-VI, Inc.‡ 8.189%, 07/02/29 1 mo. SOFR + 2.75% | 890,879 | |||||||||
4,518,758 | |||||||||||
Materials (0.8%) | |||||||||||
720,000 | Chemours Company‡ 8.824%, 08/18/28 1 mo. SOFR + 2.50% | 702,000 | |||||||||
972,563 | Ineos US Finance, LLC‡ 8.825%, 02/18/30 1 mo. SOFR + 3.50% | 953,568 | |||||||||
1,185,710 | Innophos, Inc.‡ 8.689%, 02/05/27 1 mo. SOFR + 3.25% | 1,175,335 | |||||||||
1,206,975 | LSF11 A5 Holdco, LLC‡ 9.674%, 10/15/28 1 mo. SOFR + 4.25% | 1,186,233 | |||||||||
497,455 | Trinseo Materials Operating SCA‡ 7.939%, 05/03/28 1 mo. SOFR + 2.50% | 397,313 | |||||||||
983,781 | WR Grace & Company‡ 9.402%, 09/22/28 3 mo. SOFR + 3.75% | 967,795 | |||||||||
5,382,244 | |||||||||||
Special Purpose Acquisition Companies (0.4%) | |||||||||||
474,000 | Clydesdale Acquisition Holdings, Inc.‡ 9.599%, 04/13/29 1 mo. SOFR + 4.18% | 459,683 | |||||||||
See accompanying Notes to Schedule of Investments
www.calamos.com
121
Convertible Opportunities and Income Fund Schedule of Investments October 31, 2023
| PRINCIPAL AMOUNT | VALUE | ||||||||||
241,325 | Fertitta Entertainment, LLC‡ 9.324%, 01/27/29 1 mo. SOFR + 4.00% | $ | 236,370 | ||||||||
1,019,700 | Oscar AcquisitionCo, LLC‡ 9.990%, 04/29/29 3 mo. SOFR + 4.50% | 994,952 | |||||||||
990,000 | Patagonia Holdco, LLC‡ 11.117%, 08/01/29 3 mo. SOFR + 5.75% | 858,825 | |||||||||
2,549,830 | |||||||||||
| TOTAL BANK LOANS(Cost $48,802,327) | 46,957,575 | ||||||||||
| NUMBER OF SHARES | VALUE | ||||||||||
CONVERTIBLE PREFERRED STOCKS (4.7%) | |||||||||||
Energy (0.0%) | |||||||||||
26 | Gulfport Energy Corp.# 10.000%, 15.000% PIK rate | 230,750 | |||||||||
Financials (1.9%) | |||||||||||
83,465 | Apollo Global Management, Inc. 6.750%, 07/31/26 | 4,015,501 | |||||||||
8,100 | Bank of America Corp.‡ ‡‡ 7.250% | 8,530,920 | |||||||||
12,546,421 | |||||||||||
Industrials (0.5%) | |||||||||||
75,625 | Chart Industries, Inc. 6.750%, 12/15/25 | 3,717,725 | |||||||||
Utilities (2.3%) | |||||||||||
141,020 | AES Corp.^ 6.875%, 02/15/24 | 8,500,686 | |||||||||
180,300 | NextEra Energy, Inc.^ 6.926%, 09/01/25 | 6,768,462 | |||||||||
15,269,148 | |||||||||||
| TOTAL CONVERTIBLE PREFERRED STOCKS(Cost $42,772,967) | 31,764,044 | ||||||||||
WARRANTS (0.0%)# | |||||||||||
Energy (0.0%) | |||||||||||
47,739 | Mcdermott International, Ltd.& 06/30/27, Strike $15.98 | 5 | |||||||||
42,965 | Mcdermott International, Ltd. 06/30/27, Strike $12.33 | 4 | |||||||||
| TOTAL WARRANTS(Cost $18,376) | 9 | ||||||||||
| NUMBER OF SHARES | VALUE | ||||||||||
COMMON STOCKS (0.5%) | |||||||||||
Communication Services (0.0%) | |||||||||||
20,285 | Altice USA, Inc. - Class A# | $ | 58,624 | ||||||||
6,819 | Cumulus Media, Inc. - Class Aµ | 30,754 | |||||||||
1 | Frontier Communications Parent, Inc.µ# | 18 | |||||||||
89,396 | |||||||||||
Energy (0.5%) | |||||||||||
8,836 | Chaparral Energy, Inc. - Class A&# | 393,202 | |||||||||
2,869 | Chesapeake Energy Corp.µ^ | 246,964 | |||||||||
67,000 | Energy Transfer, LP | 881,050 | |||||||||
39,795 | Enterprise Products Partners, LP | 1,036,262 | |||||||||
6,644 | EP Energy Corp.&# | 17,440 | |||||||||
8,557 | ONEOK, Inc.^ | 557,916 | |||||||||
3,132,834 | |||||||||||
Special Purpose Acquisition Company (0.0%) | |||||||||||
11,411 | Intelsat Emergence, SA&# | 271,011 | |||||||||
| TOTAL COMMON STOCKS(Cost $5,363,925) | 3,493,241 | ||||||||||
PREFERRED STOCKS (0.4%) | |||||||||||
Communication Services (0.1%) | |||||||||||
11,875 | United States Cellular Corp.µ 5.500%, 06/01/70 | 173,612 | |||||||||
11,375 | 5.500%, 03/01/70 | 169,033 | |||||||||
342,645 | |||||||||||
Consumer Discretionary (0.1%) | |||||||||||
6,122 | Guitar Center, Inc.&# | 645,871 | |||||||||
Energy (0.2%) | |||||||||||
29,680 | NuStar Energy, LP‡ 11.315% 3 mo. USD LIBOR + 5.64% | 744,968 | |||||||||
7,294 | 12.438 3 mo. USD LIBOR + 6.77%% | 185,778 | |||||||||
43,000 | NuStar Logistics, LP‡ 12.390%, 01/15/43 3 mo. USD SOFR + 7.00% | 1,117,140 | |||||||||
2,047,886 | |||||||||||
| TOTAL PREFERRED STOCKS(Cost $3,137,405) | 3,036,402 | ||||||||||
RIGHTS (0.0%)# | |||||||||||
Communication Services (0.0%) | |||||||||||
2 | Intelsat Jackson Holdings, SA, (Expires 12/15/25) | — | |||||||||
2 | Intelsat Jackson Holdings, SA, (Expires 12/15/25) | — | |||||||||
| TOTAL RIGHTS(Cost $—) | — | ||||||||||
See accompanying Notes to Schedule of Investments
CALAMOS CLOSED-END FAMILY OF FUNDS ANNUAL REPORT
122
Convertible Opportunities and Income Fund Schedule of Investments October 31, 2023
| NUMBER OF CONTRACTS/ NOTIONAL AMOUNT | VALUE | ||||||||||
PURCHASED OPTIONS (0.2%)# | |||||||||||
Consumer Discretionary (0.1%) | |||||||||||
580 | Amazon.com, Inc. | ||||||||||
| 7,719,220 | Call, 01/19/24, Strike $127.50 | $ | 704,700 | ||||||||
Information Technology (0.1%) | |||||||||||
300 | Palo Alto Networks, Inc. | ||||||||||
7,290,600 | Call, 01/19/24, Strike $250.00 | 471,000 | |||||||||
| TOTAL PURCHASED OPTIONS(Cost $1,579,635) | 1,175,700 | ||||||||||
| TOTAL INVESTMENTS (161.9%)(Cost $1,238,324,701) | 1,089,475,997 | ||||||||||
| MANDATORY REDEEMABLE PREFERRED SHARES, AT LIQUIDATION VALUE (-19.8%) | (133,000,000 | ) | |||||||||
LIABILITIES, LESS OTHER ASSETS (-42.1%) | (283,694,268 | ) | |||||||||
NET ASSETS (100.0%) | $ | 672,781,729 | |||||||||
NOTES TO SCHEDULE OF INVESTMENTS
* Securities issued and sold pursuant to a Rule 144A transaction are exempted from the registration requirement of the Securities Act of 1933, as amended. These securities may only be sold to qualified institutional buyers ("QIBs"), such as the Fund. Any resale of these securities must generally be effected through a sale that is registered under the Act or otherwise exempted from such registration requirements.
µ Security, or portion of security, is held in a segregated account as collateral for note payable aggregating a total value of $465,410,737.
^ Security, or portion of security, is on loan.
@ In default status and considered non-income producing.
& Illiquid security.
‡ Variable rate security. The rate shown is the rate in effect at October 31, 2023.
~ Security, or portion of security, is segregated as collateral (or potential collateral for future transactions) for written options. The aggregate value of such securities is $2,132,875.
¡ Bank loans generally are subject to mandatory and/or optional prepayment. As a result, the actual remaining maturity of bank loans may be substantially less than the stated maturities shown.
! This position represents an unsettled loan commitment at period end. Certain details associated with this purchase are not known prior to the settlement date, including coupon rate, which will be adjusted on settlement date.
# Non-income producing security.
‡‡ Perpetual maturity.
Note: The date on options represents the expiration date of the option contract. The option contract may be exercised at any date on or before the date shown.
See accompanying Notes to Schedule of Investments
www.calamos.com
123
Convertible Opportunities and Income Fund Schedule of Investments October 31, 2023
The following table summarizes the Fund's investments and derivative financial instruments categorized in the fair value hierarchy as of October 31, 2023 (see Note 1):
LEVEL 1 | LEVEL 2 | LEVEL 3 | TOTAL | ||||||||||||||||
Assets: | |||||||||||||||||||
Corporate Bonds | $ | — | $ | 295,809,134 | $ | — | $ | 295,809,134 | |||||||||||
Convertible Bonds | — | 706,562,177 | — | 706,562,177 | |||||||||||||||
Bank Loans | — | 46,957,575 | — | 46,957,575 | |||||||||||||||
Convertible Preferred Stocks | 31,533,294 | 230,750 | — | 31,764,044 | |||||||||||||||
Warrants | — | 9 | — | 9 | |||||||||||||||
Common Stocks | 2,811,588 | 681,653 | — | 3,493,241 | |||||||||||||||
Preferred Stocks | 2,216,919 | 819,483 | — | 3,036,402 | |||||||||||||||
Asset Backed Securities | — | 677,715 | — | 677,715 | |||||||||||||||
Purchased Options | 1,175,700 | — | — | 1,175,700 | |||||||||||||||
Total | $ | 37,737,501 | $ | 1,051,738,496 | $ | — | $ | 1,089,475,997 | |||||||||||
See accompanying Notes to Schedule of Investments
CALAMOS CLOSED-END FAMILY OF FUNDS ANNUAL REPORT
124
Convertible and High Income Fund Schedule of Investments October 31, 2023
| PRINCIPAL AMOUNT | VALUE | ||||||||||
ASSET BACKED SECURITY (0.1%) | |||||||||||
Other (0.1%) | |||||||||||
| 850,000 | SVC ABS, LLC Series 2023-1A, Class C* 6.700%, 02/20/53 (Cost $782,023) | $ | 753,016 | ||||||||
CORPORATE BONDS (44.2%) | |||||||||||
Airlines (0.8%) | |||||||||||
| 173,333 | Air Canada Pass Through Trust Series 2015-2, Class B* 5.000%, 06/15/25 | 172,475 | |||||||||
| 956,044 | Alaska Airlines Pass Through Trust Series 2020-1, Class A*µ 4.800%, 02/15/29 | 896,119 | |||||||||
| 440,686 | Alaska Airlines Pass Through Trust Series 2020-1, Class B* 8.000%, 02/15/27 | 439,870 | |||||||||
| 1,132,040 | American Airlines Pass Through Trust Series 2021-1, Class B 3.950%, 01/11/32 | 965,506 | |||||||||
| 652,500 | American Airlines, Inc. / AAdvantage Loyalty IP, Ltd.* 5.500%, 04/20/26 | 634,752 | |||||||||
| 261,000 | 5.750%, 04/20/29 | 235,576 | |||||||||
| 1,047,130 | British Airways Pass Through Trust Series 2021-1, Class B* 3.900%, 03/15/33 | 909,851 | |||||||||
| 1,082,121 | JetBlue Pass Through Trust Series 2020-1, Class B 7.750%, 05/15/30 | 1,075,920 | |||||||||
| 725,000 | Spirit Loyalty Cayman, Ltd. / Spirit IP Cayman, Ltd.* 8.000%, 09/20/25 | 538,378 | |||||||||
5,868,447 | |||||||||||
Communication Services (5.0%) | |||||||||||
| 600,000 | Altice France Holding, SA* 10.500%, 05/15/27 | 330,792 | |||||||||
| 1,200,000 | Altice France, SA* 5.500%, 10/15/29 | 831,036 | |||||||||
| 1,255,000 | APi Group DE, Inc.* 4.750%, 10/15/29 | 1,082,212 | |||||||||
| 1,543,000 | Arrow Bidco, LLC* 9.500%, 03/15/24 | 1,563,645 | |||||||||
| 1,100,000 | Ashtead Capital, Inc.* 2.450%, 08/12/31 | 811,448 | |||||||||
| 1,307,000 | Audacy Capital Corp.* 6.750%, 03/31/29 | 21,239 | |||||||||
| 490,000 | 6.500%, 05/01/27 | 7,350 | |||||||||
| 952,000 | Cincinnati Bell Telephone Company, LLC 6.300%, 12/01/28 | 770,387 | |||||||||
| 1,025,000 | Clear Channel Outdoor Holdings, Inc.* 9.000%, 09/15/28 | 999,529 | |||||||||
| 1,585,000 | Consolidated Communications, Inc.*^ 6.500%, 10/01/28 | 1,257,967 | |||||||||
| PRINCIPAL AMOUNT | VALUE | ||||||||||
| 1,685,000 | CSC Holdings, LLC* 5.500%, 04/15/27 | $ | 1,408,525 | ||||||||
| 1,630,000 | 5.375%, 02/01/28 | 1,299,729 | |||||||||
| 1,600,000 | 4.625%, 12/01/30 | 812,720 | |||||||||
| 1,220,000 | 4.500%, 11/15/31 | 807,079 | |||||||||
| 1,150,000 | 5.750%, 01/15/30 | 606,223 | |||||||||
| 750,000 | Diamond Sports Group, LLC / Diamond Sports Finance Company*@ 6.625%, 08/15/27 | 9,510 | |||||||||
| 585,000 | 5.375%, 08/15/26 | 7,172 | |||||||||
| 2,605,000 | Directv Financing, LLC / Directv Financing Co-Obligor, Inc.* 5.875%, 08/15/27 | 2,283,022 | |||||||||
| 1,060,000 | Frontier California, Inc. 6.750%, 05/15/27 | 978,719 | |||||||||
| 658,000 | Frontier Communications Holdings, LLC* 5.000%, 05/01/28 | 571,072 | |||||||||
| 261,000 | 8.750%, 05/15/30 | 248,976 | |||||||||
| 1,165,000 | Frontier Florida, LLC@ 6.860%, 02/01/28 | 1,072,452 | |||||||||
| 1,555,000 | Frontier North, Inc.@ 6.730%, 02/15/28 | 1,442,527 | |||||||||
| 905,000 | Go Daddy Operating Company, LLC / GD Finance Company, Inc.* 3.500%, 03/01/29 | 764,897 | |||||||||
| 270,000 | 5.250%, 12/01/27 | 255,304 | |||||||||
| 395,000 | iHeartCommunications, Inc. 8.375%, 05/01/27^ | 242,435 | |||||||||
| 395,000 | 5.250%, 08/15/27* | 289,938 | |||||||||
| 790,000 | Intelsat Jackson Holdings, SA& 9.750%, 07/15/25* | 1 | |||||||||
| 510,000 | 5.500%, 08/01/23 | 1 | |||||||||
| 1,295,000 | LCPR Senior Secured Financing DAC* 6.750%, 10/15/27 | 1,173,425 | |||||||||
| 791,137 | Ligado Networks, LLC* 15.500%, 11/01/23 15.500% PIK rate | 199,414 | |||||||||
| 785,000 | Lumen Technologies, Inc. 7.600%, 09/15/39 | 213,630 | |||||||||
| 525,000 | 4.000%, 02/15/27*^ | 358,958 | |||||||||
| 263,000 | 7.650%, 03/15/42 | 70,836 | |||||||||
| 522,000 | Match Group Holdings II, LLC* 3.625%, 10/01/31 | 404,164 | |||||||||
| 875,000 | Nexstar Media, Inc.* 5.625%, 07/15/27 | 787,920 | |||||||||
| 1,530,000 | Paramount Global 4.900%, 08/15/44 | 963,808 | |||||||||
| 367,000 | Qwest Corp. 7.250%, 09/15/25 | 352,430 | |||||||||
| 514,000 | Scripps Escrow II, Inc.* 3.875%, 01/15/29 | 390,424 | |||||||||
| 257,000 | 5.375%, 01/15/31 | 159,697 | |||||||||
| 930,000 | Scripps Escrow, Inc.*^ 5.875%, 07/15/27 | 696,161 | |||||||||
See accompanying Notes to Schedule of Investments
www.calamos.com
125
Convertible and High Income Fund Schedule of Investments October 31, 2023
| PRINCIPAL AMOUNT | VALUE | ||||||||||
| 1,350,000 | Sirius XM Radio, Inc.* 5.500%, 07/01/29 | $ | 1,197,369 | ||||||||
| 1,044,000 | 4.000%, 07/15/28 | 888,256 | |||||||||
| 515,000 | 3.125%, 09/01/26 | 462,722 | |||||||||
| 261,000 | 3.875%, 09/01/31 | 196,593 | |||||||||
| 957,000 | Spanish Broadcasting System, Inc.* 9.750%, 03/01/26 | 596,393 | |||||||||
| 1,915,000 | Sprint, LLCµ 7.125%, 06/15/24 | 1,925,896 | |||||||||
| 1,170,000 | Stagwell Global, LLC* 5.625%, 08/15/29 | 968,011 | |||||||||
| 805,000 | Telecom Italia Capital, SA 6.000%, 09/30/34 | 663,062 | |||||||||
| 1,042,000 | Telesat Canada / Telesat, LLC* 4.875%, 06/01/27 | 623,908 | |||||||||
| 420,000 | Time Warner Cable, LLC 7.300%, 07/01/38 | 393,397 | |||||||||
| 1,186,000 | United States Cellular Corp.^ 6.700%, 12/15/33 | 1,129,487 | |||||||||
| 390,000 | Univision Communications, Inc.* 8.000%, 08/15/28 | 369,611 | |||||||||
| 525,000 | Viasat, Inc.* 5.625%, 04/15/27 | 459,344 | |||||||||
36,420,823 | |||||||||||
Consumer Discretionary (9.5%) | |||||||||||
| 1,257,000 | Abercrombie & Fitch Management Company* 8.750%, 07/15/25 | 1,277,967 | |||||||||
| 1,055,000 | Adams Homes, Inc.* 9.250%, 10/15/28 | 1,035,588 | |||||||||
| 1,305,000 | Adient Global Holdings Company*^ 8.250%, 04/15/31 | 1,277,021 | |||||||||
| 830,000 | American Axle & Manufacturing, Inc. 6.875%, 07/01/28 | 739,746 | |||||||||
| 913,000 | Ashton Woods USA, LLC / Ashton Woods Finance Company* 4.625%, 08/01/29 | 742,041 | |||||||||
| 780,000 | 6.625%, 01/15/28 | 715,876 | |||||||||
| 1,325,000 | At Home Group, Inc.* 4.875%, 07/15/28 | 460,438 | |||||||||
| 1,369,000 | Bath & Body Works, Inc. 6.694%, 01/15/27 | 1,326,739 | |||||||||
| 1,285,000 | 6.875%, 11/01/35 | 1,135,799 | |||||||||
| 600,000 | Benteler International AG*^ 10.500%, 05/15/28 | 606,678 | |||||||||
| 657,000 | Caesars Entertainment, Inc.*^ 4.625%, 10/15/29 | 540,902 | |||||||||
| 512,000 | 8.125%, 07/01/27 | 507,566 | |||||||||
| 1,100,000 | Carnival Corp.* 6.000%, 05/01/29 | 930,336 | |||||||||
| 523,000 | 4.000%, 08/01/28 | 455,653 | |||||||||
| 520,000 | 7.625%, 03/01/26^ | 505,913 | |||||||||
| 65,000 | 7.000%, 08/15/29 | 63,857 | |||||||||
| PRINCIPAL AMOUNT | VALUE | ||||||||||
| 1,219,000 | Carriage Services, Inc.*^ 4.250%, 05/15/29 | $ | 998,276 | ||||||||
| 209,000 | Carvana Company* 14.000%, 06/01/31 | 157,293 | |||||||||
| 176,000 | 13.000%, 06/01/30 | 132,081 | |||||||||
| 117,000 | 12.000%, 12/01/28 | 87,625 | |||||||||
| 2,250,000 | CCO Holdings, LLC / CCO Holdings Capital Corp.* 5.125%, 05/01/27 | 2,073,150 | |||||||||
| 1,825,000 | 4.500%, 08/15/30 | 1,466,789 | |||||||||
| 1,200,000 | 6.375%, 09/01/29 | 1,103,280 | |||||||||
| 1,150,000 | 4.750%, 03/01/30 | 949,992 | |||||||||
| 1,035,000 | 4.250%, 02/01/31 | 806,410 | |||||||||
| 540,000 | 5.000%, 02/01/28 | 483,786 | |||||||||
| 522,000 | 4.750%, 02/01/32 | 408,042 | |||||||||
| 522,000 | CDI Escrow Issuer, Inc.* 5.750%, 04/01/30 | 467,785 | |||||||||
| 810,000 | Cedar Fair, LP^ 5.250%, 07/15/29 | 700,561 | |||||||||
| 520,000 | Churchill Downs, Inc.* 6.750%, 05/01/31 | 486,174 | |||||||||
| 855,000 | Dana, Inc. 4.250%, 09/01/30 | 680,332 | |||||||||
| 782,000 | 4.500%, 02/15/32 | 612,916 | |||||||||
| 1,300,000 | DISH DBS Corp. 5.250%, 12/01/26* | 1,051,661 | |||||||||
| 828,000 | 7.750%, 07/01/26 | 555,613 | |||||||||
| 650,000 | 7.375%, 07/01/28 | 366,470 | |||||||||
| 530,000 | 5.125%, 06/01/29 | 273,512 | |||||||||
| 1,049,000 | DISH Network Corp.* 11.750%, 11/15/27 | 1,039,926 | |||||||||
| 1,510,000 | Empire Resorts, Inc.* 7.750%, 11/01/26 | 1,236,584 | |||||||||
| 1,142,000 | Everi Holdings, Inc.* 5.000%, 07/15/29 | 960,605 | |||||||||
| 1,075,000 | Ford Motor Company^ 6.100%, 08/19/32 | 995,235 | |||||||||
| 1,650,000 | Ford Motor Credit Company, LLC 4.000%, 11/13/30 | 1,360,557 | |||||||||
| 1,350,000 | 7.200%, 06/10/30 | 1,348,474 | |||||||||
| 1,280,000 | 5.113%, 05/03/29 | 1,162,522 | |||||||||
| 945,000 | 7.350%, 11/04/27 | 957,323 | |||||||||
| 800,000 | 2.900%, 02/16/28 | 681,256 | |||||||||
| 450,000 | 7.350%, 03/06/30 | 452,763 | |||||||||
| 200,000 | 4.950%, 05/28/27 | 187,702 | |||||||||
| 391,000 | Gap, Inc.* 3.875%, 10/01/31 | 282,079 | |||||||||
| 510,000 | General Motors Company 5.200%, 04/01/45 | 378,038 | |||||||||
| 1,795,000 | goeasy, Ltd.* 5.375%, 12/01/24 | 1,764,252 | |||||||||
| 962,000 | 4.375%, 05/01/26^ | 872,005 | |||||||||
| 560,000 | Goodyear Tire & Rubber Company^ 5.250%, 07/15/31 | 456,747 | |||||||||
| 445,000 | Group 1 Automotive, Inc.* 4.000%, 08/15/28 | 384,622 | |||||||||
See accompanying Notes to Schedule of Investments
CALAMOS CLOSED-END FAMILY OF FUNDS ANNUAL REPORT
126
Convertible and High Income Fund Schedule of Investments October 31, 2023
| PRINCIPAL AMOUNT | VALUE | ||||||||||
| 1,116,000 | Guitar Center, Inc.*^& 8.500%, 01/15/26 | $ | 943,210 | ||||||||
| 825,000 | International Game Technology, PLC* 6.250%, 01/15/27 | 804,977 | |||||||||
| 311,703 | JetBlue Pass Through Trust Series 2019-2, Class B 8.000%, 11/15/27 | 313,791 | |||||||||
| 928,000 | Kohl's Corp. 5.550%, 07/17/45 | 536,532 | |||||||||
| 1,040,000 | LCM Investments Holdings II, LLC* 8.250%, 08/01/31 | 996,767 | |||||||||
| 1,045,000 | Liberty Interactive, LLC 8.250%, 02/01/30 | 275,305 | |||||||||
| 1,008,000 | Life Time, Inc.* 8.000%, 04/15/26 | 985,128 | |||||||||
| 525,000 | 5.750%, 01/15/26 | 509,177 | |||||||||
| 525,000 | Light & Wonder International, Inc.* 7.500%, 09/01/31 | 513,503 | |||||||||
| 390,000 | Lindblad Expeditions Holdings, Inc.* 9.000%, 05/15/28 | 382,317 | |||||||||
| 672,000 | Lindblad Expeditions, LLC* 6.750%, 02/15/27 | 611,036 | |||||||||
| 685,000 | M/I Homes, Inc. 3.950%, 02/15/30 | 548,130 | |||||||||
| 1,744,000 | Macy's Retail Holdings, LLC 6.700%, 07/15/34* | 1,344,746 | |||||||||
| 500,000 | 4.300%, 02/15/43 | 274,370 | |||||||||
| 1,200,000 | Mclaren Finance, PLC* 7.500%, 08/01/26 | 1,036,020 | |||||||||
| 1,329,000 | Midwest Gaming Borrower, LLC / Midwest Gaming Finance Corp.* 4.875%, 05/01/29 | 1,109,409 | |||||||||
| 625,000 | Newell Brands, Inc. 5.200%, 04/01/26 | 590,356 | |||||||||
| 500,000 | Nordstrom, Inc. 5.000%, 01/15/44 | 301,095 | |||||||||
| 499,000 | 4.250%, 08/01/31 | 365,827 | |||||||||
| 1,195,000 | PENN Entertainment, Inc.*^ 4.125%, 07/01/29 | 929,304 | |||||||||
| 650,000 | PetSmart, Inc. / PetSmart Finance Corp.* 7.750%, 02/15/29 | 599,469 | |||||||||
| 325,000 | 4.750%, 02/15/28 | 287,830 | |||||||||
| 1,460,000 | Premier Entertainment Sub, LLC / Premier Entertainment Finance Corp.*^ 5.625%, 09/01/29 | 1,027,533 | |||||||||
| 2,564,000 | Rite Aid Corp.*@ 8.000%, 11/15/26 | 1,782,980 | |||||||||
| 520,000 | Royal Caribbean Cruises, Ltd.* 7.250%, 01/15/30 | 514,426 | |||||||||
| 1,475,000 | Simmons Foods, Inc. / Simmons Prepared Foods, Inc. / Simmons Pet Food, Inc. / Simmons Feed* 4.625%, 03/01/29 | 1,199,440 | |||||||||
| PRINCIPAL AMOUNT | VALUE | ||||||||||
| 2,090,000 | Six Flags Entertainment Corp.*^ 7.250%, 05/15/31 | $ | 1,925,329 | ||||||||
| 1,173,000 | Sonic Automotive, Inc.*^ 4.625%, 11/15/29 | 978,188 | |||||||||
| 753,000 | Speedway Motorsports, LLC / Speedway Funding II, Inc.* 4.875%, 11/01/27 | 674,334 | |||||||||
| 2,125,000 | Station Casinos, LLC* 4.500%, 02/15/28 | 1,837,296 | |||||||||
| 636,000 | Taylor Morrison Communities, Inc.* 5.750%, 01/15/28 | 579,339 | |||||||||
| 260,000 | Viking Cruises, Ltd.* 9.125%, 07/15/31 | 255,788 | |||||||||
| 1,215,000 | Vista Outdoor, Inc.* 4.500%, 03/15/29 | 1,131,894 | |||||||||
| 525,000 | Windsor Holdings III, LLC* 8.500%, 06/15/30 | 515,392 | |||||||||
| 1,025,000 | ZF North America Capital, Inc.* 7.125%, 04/14/30 | 997,632 | |||||||||
| 300,000 | 6.875%, 04/14/28 | 291,645 | |||||||||
68,674,073 | |||||||||||
Consumer Staples (1.9%) | |||||||||||
| 1,178,000 | 1375209 B.C., Ltd.* 9.000%, 01/30/28 | 1,145,275 | |||||||||
| 1,050,000 | B&G Foods, Inc.* 8.000%, 09/15/28 | 1,025,052 | |||||||||
| 1,191,000 | Central Garden & Pet Company* 4.125%, 04/30/31 | 951,907 | |||||||||
| 1,188,000 | Edgewell Personal Care Company* 4.125%, 04/01/29 | 999,025 | |||||||||
| 1,445,000 | Energizer Holdings, Inc.* 4.375%, 03/31/29 | 1,189,726 | |||||||||
| 260,000 | 6.500%, 12/31/27^ | 244,275 | |||||||||
| 1,575,000 | JBS USA LUX, SA / JBS USA Food Company / JBS USA Finance, Inc. 5.500%, 01/15/30^ | 1,441,015 | |||||||||
| 650,000 | 5.125%, 02/01/28µ | 610,474 | |||||||||
| 390,000 | 5.750%, 04/01/33 | 343,383 | |||||||||
| 672,000 | New Albertsons, LP 7.750%, 06/15/26 | 679,479 | |||||||||
| 1,043,000 | Performance Food Group, Inc.* 4.250%, 08/01/29 | 885,038 | |||||||||
| 775,000 | Pilgrim's Pride Corp. 4.250%, 04/15/31 | 640,328 | |||||||||
| 477,000 | Post Holdings, Inc.* 5.750%, 03/01/27 | 455,435 | |||||||||
| 986,000 | Prestige Brands, Inc.* 3.750%, 04/01/31 | 786,019 | |||||||||
| 855,000 | United Natural Foods, Inc.*^ 6.750%, 10/15/28 | 669,097 | |||||||||
| 1,628,000 | Vector Group, Ltd.* 5.750%, 02/01/29 | 1,382,384 | |||||||||
See accompanying Notes to Schedule of Investments
www.calamos.com
127
Convertible and High Income Fund Schedule of Investments October 31, 2023
| PRINCIPAL AMOUNT | VALUE | ||||||||||
| 530,000 | Williams Scotsman, Inc.* 7.375%, 10/01/31 | $ | 523,338 | ||||||||
13,971,250 | |||||||||||
Energy (5.8%) | |||||||||||
| 1,041,000 | Antero Resources Corp.* 5.375%, 03/01/30 | 951,516 | |||||||||
| 1,037,000 | Apache Corp. 5.100%, 09/01/40 | 807,387 | |||||||||
| 810,000 | Buckeye Partners, LP 3.950%, 12/01/26 | 739,279 | |||||||||
| 545,000 | 5.850%, 11/15/43 | 386,002 | |||||||||
| 1,460,000 | Callon Petroleum Company*^ 7.500%, 06/15/30 | 1,415,295 | |||||||||
| 520,000 | Cheniere Energy, Inc.µ 4.625%, 10/15/28 | 475,384 | |||||||||
| 780,000 | Chesapeake Energy Corp.* 6.750%, 04/15/29 | 765,359 | |||||||||
| 1,465,000 | Civitas Resources, Inc.* 8.750%, 07/01/31 | 1,480,397 | |||||||||
| 775,000 | Continental Resources, Inc.* 2.875%, 04/01/32 | 574,112 | |||||||||
| 515,000 | 5.750%, 01/15/31 | 478,075 | |||||||||
| 808,000 | DT Midstream, Inc.* 4.125%, 06/15/29 | 695,817 | |||||||||
| 1,024,000 | Earthstone Energy Holdings, LLC* 8.000%, 04/15/27 | 1,039,534 | |||||||||
| 390,000 | 9.875%, 07/15/31 | 420,853 | |||||||||
| 600,000 | Enbridge, Inc.‡ 7.375%, 01/15/83 5 year CMT + 3.71% | 558,342 | |||||||||
| 1,520,000 | Energy Transfer, LP‡ 8.656%, 11/01/66 3 mo. SOFR + 3.28% | 1,242,752 | |||||||||
| 764,000 | 6.500%, 11/01/35 5 year CMT + 5.69% | 694,285 | |||||||||
| 1,300,000 | EnLink Midstream Partners, LP 9.780%, 11/01/35‡ 3 mo. LIBOR + 4.11% | 1,160,913 | |||||||||
| 1,125,000 | 4.850%, 07/15/26 | 1,063,721 | |||||||||
| 650,000 | Enlink Midstream, LLC* 6.500%, 09/01/30 | 624,936 | |||||||||
| 1,730,000 | EQM Midstream Partners, LP* 7.500%, 06/01/27 | 1,719,897 | |||||||||
| 765,000 | Genesis Energy, LP / Genesis Energy Finance Corp. 8.875%, 04/15/30 | 743,832 | |||||||||
| 467,000 | 6.250%, 05/15/26 | 445,826 | |||||||||
| 1,105,000 | Gulfport Energy Corp. 8.000%, 05/17/26* | 1,105,464 | |||||||||
| 1,015,000 | 6.375%, 05/15/25& | 1 | |||||||||
| 310,206 | 8.000%, 05/17/26 | 310,336 | |||||||||
| 1,460,000 | Hilcorp Energy I, LP / Hilcorp Finance Company* 6.000%, 04/15/30 | 1,298,188 | |||||||||
| PRINCIPAL AMOUNT | VALUE | ||||||||||
| 782,000 | Howard Midstream Energy Partners, LLC* 6.750%, 01/15/27 | $ | 743,698 | ||||||||
| 1,015,000 | Magnolia Oil & Gas Operating, LLC / Magnolia Oil & Gas Finance Corp.* 6.000%, 08/01/26 | 971,132 | |||||||||
| 540,000 | Moss Creek Resources Holdings, Inc.* 10.500%, 05/15/27 | 534,460 | |||||||||
| 495,000 | 7.500%, 01/15/26 | 473,844 | |||||||||
| 780,000 | Nabors Industries, Inc.* 7.375%, 05/15/27 | 730,423 | |||||||||
| 780,000 | Nabors Industries, Ltd.* 7.500%, 01/15/28 | 689,239 | |||||||||
| 1,041,000 | New Fortress Energy, Inc.* 6.750%, 09/15/25 | 968,796 | |||||||||
| 522,000 | 6.500%, 09/30/26 | 467,968 | |||||||||
| 529,000 | Oceaneering International, Inc.* 6.000%, 02/01/28 | 485,109 | |||||||||
| 1,110,000 | Parkland Corp.* 5.875%, 07/15/27 | 1,067,432 | |||||||||
| 551,000 | Patterson-UTI Energy, Inc. 5.150%, 11/15/29 | 492,241 | |||||||||
| 260,000 | Permian Resources Operating LLC* 7.000%, 01/15/32 | 254,410 | |||||||||
| 1,040,000 | Plains All American Pipeline, LP‡ 9.736%, 11/01/35 3 mo. LIBOR + 4.11% | 981,698 | |||||||||
| 1,460,000 | Rockcliff Energy II, LLC* 5.500%, 10/15/29 | 1,325,184 | |||||||||
| 525,000 | Southwestern Energy Company 5.375%, 02/01/29 | 486,376 | |||||||||
| 521,000 | 4.750%, 02/01/32 | 448,560 | |||||||||
| 261,000 | Sunoco, LP / Sunoco Finance Corp. 4.500%, 04/30/30 | 224,567 | |||||||||
| 1,480,100 | Transocean, Inc.* 8.750%, 02/15/30 | 1,478,901 | |||||||||
| 650,000 | Venture Global Calcasieu Pass, LLC* 6.250%, 01/15/30 | 613,613 | |||||||||
| 260,000 | 4.125%, 08/15/31 | 210,181 | |||||||||
| 260,000 | 3.875%, 08/15/29 | 217,789 | |||||||||
| 1,300,000 | Venture Global LNG, Inc.* 8.375%, 06/01/31 | 1,241,500 | |||||||||
| 780,000 | 8.125%, 06/01/28 | 757,864 | |||||||||
| 525,000 | 9.875%, 02/01/32 | 532,807 | |||||||||
| 265,000 | 9.500%, 02/01/29 | 268,983 | |||||||||
| 979,000 | Vital Energy, Inc. 9.500%, 01/15/25 | 984,306 | |||||||||
| 605,000 | 7.750%, 07/31/29* | 546,799 | |||||||||
| 132,000 | 9.750%, 10/15/30 | 129,459 | |||||||||
| 1,045,000 | VOC Escrow, Ltd.* 5.000%, 02/15/28 | 942,663 | |||||||||
| 1,308,000 | Weatherford International, Ltd.* 8.625%, 04/30/30 | 1,323,722 | |||||||||
41,791,227 | |||||||||||
See accompanying Notes to Schedule of Investments
CALAMOS CLOSED-END FAMILY OF FUNDS ANNUAL REPORT
128
Convertible and High Income Fund Schedule of Investments October 31, 2023
| PRINCIPAL AMOUNT | VALUE | ||||||||||
Financials (7.2%) | |||||||||||
| 1,387,000 | Acrisure, LLC / Acrisure Finance, Inc.* 7.000%, 11/15/25 | $ | 1,347,498 | ||||||||
| 1,562,000 | Aethon United BR, LP / Aethon United Finance Corp.* 8.250%, 02/15/26 | 1,553,268 | |||||||||
| 1,496,000 | AG Issuer, LLC* 6.250%, 03/01/28 | 1,386,313 | |||||||||
| 1,830,000 | Alliant Holdings Intermediate, LLC / Alliant Holdings Co-Issuer* 6.750%, 10/15/27 | 1,671,668 | |||||||||
| 1,653,000 | Ally Financial, Inc. 4.700%, 11/01/35 7 year CMT + 3.48%‡ | 1,047,326 | |||||||||
| 434,000 | 8.000%, 11/01/31 | 424,396 | |||||||||
| 2,082,000 | AmWINS Group, Inc.* 4.875%, 06/30/29 | 1,787,272 | |||||||||
| 1,146,000 | Aviation Capital Group, LLC*µ 3.500%, 11/01/27 | 1,007,265 | |||||||||
| 425,000 | Avolon Holdings Funding, Ltd.*µ 5.500%, 01/15/26 | 409,641 | |||||||||
| 2,084,000 | BroadStreet Partners, Inc.* 5.875%, 04/15/29 | 1,818,457 | |||||||||
| 985,000 | Brookfield Property REIT, Inc. / BPR Cumulus, LLC / BPR Nimbus, LLC / GGSI Sellco, LLC* 4.500%, 04/01/27 | 822,002 | |||||||||
| 657,000 | 5.750%, 05/15/26 | 602,568 | |||||||||
| 1,000,000 | Burford Capital Global Financial, LLC* 6.875%, 04/15/30 | 905,340 | |||||||||
| 1,335,000 | Credit Acceptance Corp. 6.625%, 03/15/26^ | 1,272,469 | |||||||||
| 1,045,000 | 5.125%, 12/31/24* | 1,011,779 | |||||||||
| 1,045,000 | Cushman & Wakefield U.S. Borrower LLC*^ 8.875%, 09/01/31 | 992,855 | |||||||||
| 1,346,000 | Enact Holdings, Inc.*µ 6.500%, 08/15/25 | 1,325,689 | |||||||||
| 1,503,000 | Global Net Lease, Inc. / Global Net Lease Operating Partnership, LP* 3.750%, 12/15/27 | 1,141,559 | |||||||||
| 1,050,000 | GTCR W-2 Merger Sub, LLC* 7.500%, 01/15/31 | 1,036,549 | |||||||||
| 1,571,000 | HUB International, Ltd.* 5.625%, 12/01/29 | 1,356,197 | |||||||||
| 817,000 | 7.000%, 05/01/26 | 796,853 | |||||||||
| 781,000 | Icahn Enterprises, LP / Icahn Enterprises Finance Corp. 4.375%, 02/01/29 | 606,009 | |||||||||
| 1,420,000 | ILFC E-Capital Trust II*‡ 7.459%, 12/21/65 3 mo. LIBOR + 1.80% | 1,068,081 | |||||||||
| 2,155,000 | Iron Mountain, Inc.* 5.250%, 03/15/28 | 1,974,454 | |||||||||
| 262,000 | 7.000%, 02/15/29 | 254,468 | |||||||||
| PRINCIPAL AMOUNT | VALUE | ||||||||||
| 2,640,000 | Jefferies Finance, LLC / JFIN Co-Issuer Corp.* 5.000%, 08/15/28 | $ | 2,117,676 | ||||||||
| 2,029,000 | Ladder Capital Finance Holdings, LLLP / Ladder Capital Finance Corp.* 5.250%, 10/01/25 | 1,934,449 | |||||||||
| 522,000 | 4.750%, 06/15/29 | 421,348 | |||||||||
| 960,000 | LD Holdings Group, LLC* 6.125%, 04/01/28 | 537,936 | |||||||||
| 1,080,000 | Level 3 Financing, Inc.* 4.250%, 07/01/28 | 611,593 | |||||||||
| 869,000 | 3.400%, 03/01/27^ | 808,605 | |||||||||
| 525,000 | 4.625%, 09/15/27 | 354,328 | |||||||||
| 774,000 | LPL Holdings, Inc.* 4.000%, 03/15/29 | 665,926 | |||||||||
| 1,055,000 | Macquarie Airfinance Holdings, Ltd.* 8.125%, 03/30/29 | 1,040,557 | |||||||||
| 1,623,000 | MetLife, Inc. 6.400%, 12/15/66 | 1,524,792 | |||||||||
| 1,415,000 | Nationstar Mortgage Holdings, Inc.* 5.500%, 08/15/28 | 1,253,888 | |||||||||
| 1,133,000 | Navient Corp. 5.000%, 03/15/27 | 999,283 | |||||||||
| 565,000 | 4.875%, 03/15/28 | 468,764 | |||||||||
| 1,200,000 | Necessity Retail REIT, Inc. / American Finance Operating Partner, LP* 4.500%, 09/30/28 | 899,580 | |||||||||
| 730,000 | OneMain Finance Corp. 9.000%, 01/15/29^ | 713,772 | |||||||||
| 715,000 | 3.875%, 09/15/28 | 569,433 | |||||||||
| 518,000 | 7.125%, 03/15/26^ | 504,159 | |||||||||
| 517,000 | Park Intermediate Holdings, LLC / PK Domestic Property, LLC / PK Finance Co-Issuer* 5.875%, 10/01/28 | 466,877 | |||||||||
| 1,602,000 | PHH Mortgage Corp.* 7.875%, 03/15/26 | 1,389,270 | |||||||||
| 1,200,000 | RHP Hotel Properties, LP / RHP Finance Corp.* 4.500%, 02/15/29 | 1,022,940 | |||||||||
| 475,000 | Rocket Mortgage, LLC / Rocket Mortgage Co-Issuer, Inc.* 3.625%, 03/01/29 | 386,650 | |||||||||
| 470,000 | 3.875%, 03/01/31 | 363,780 | |||||||||
| 240,000 | 2.875%, 10/15/26 | 209,606 | |||||||||
| 1,047,000 | StoneX Group, Inc.* 8.625%, 06/15/25 | 1,053,272 | |||||||||
| 1,212,000 | United Wholesale Mortgage, LLC* 5.500%, 04/15/29 | 1,015,341 | |||||||||
| 525,000 | 5.750%, 06/15/27 | 479,078 | |||||||||
| 525,000 | Uniti Group, LP / Uniti Group Finance, Inc. / CSL Capital, LLC* 6.500%, 02/15/29 | 341,397 | |||||||||
| 520,000 | 10.500%, 02/15/28 | 501,400 | |||||||||
See accompanying Notes to Schedule of Investments
www.calamos.com
129
Convertible and High Income Fund Schedule of Investments October 31, 2023
| PRINCIPAL AMOUNT | VALUE | ||||||||||
| 1,200,000 | VZ Secured Financing, BV* 5.000%, 01/15/32 | $ | 914,484 | ||||||||
| 1,091,000 | XHR, LP* 6.375%, 08/15/25 | 1,064,761 | |||||||||
52,254,921 | |||||||||||
Health Care (2.9%) | |||||||||||
| 2,092,000 | Bausch Health Companies, Inc.* 11.000%, 09/30/28 | 1,280,639 | |||||||||
| 413,000 | 14.000%, 10/15/30 | 227,518 | |||||||||
| 391,000 | 6.125%, 02/01/27 | 218,452 | |||||||||
| 2,075,000 | CHS/Community Health Systems, Inc.* 6.125%, 04/01/30 | 806,594 | |||||||||
| 1,180,000 | 8.000%, 03/15/26 | 1,080,408 | |||||||||
| 594,000 | 6.875%, 04/15/29 | 245,209 | |||||||||
| 130,000 | 5.250%, 05/15/30 | 92,425 | |||||||||
| 2,079,000 | DaVita, Inc.* 4.625%, 06/01/30 | 1,631,204 | |||||||||
| 1,220,000 | 3.750%, 02/15/31 | 878,327 | |||||||||
| 783,000 | Embecta Corp.* 5.000%, 02/15/30 | 622,391 | |||||||||
| 260,000 | 6.750%, 02/15/30 | 215,665 | |||||||||
| 525,000 | Encompass Health Corp. 4.750%, 02/01/30 | 455,742 | |||||||||
| 525,000 | 4.500%, 02/01/28 | 473,770 | |||||||||
| 1,234,000 | HCA, Inc.^ 7.500%, 11/06/33 | 1,266,750 | |||||||||
| 340,000 | Jazz Securities DAC* 4.375%, 01/15/29 | 295,742 | |||||||||
| 445,578 | Mallinckrodt International Finance, SA / Mallinckrodt CB, LLC*@ 10.000%, 06/15/29 | 31,672 | |||||||||
| 1,297,000 | Medline Borrower, LP* 5.250%, 10/01/29^ | 1,105,381 | |||||||||
| 1,295,000 | 3.875%, 04/01/29 | 1,093,951 | |||||||||
| 1,900,000 | Organon & Company / Organon Foreign Debt Co-Issuer, BV* 5.125%, 04/30/31 | 1,488,232 | |||||||||
| 450,000 | 4.125%, 04/30/28 | 389,443 | |||||||||
| 1,103,000 | Team Health Holdings, Inc.* 6.375%, 02/01/25 | 885,665 | |||||||||
| 2,465,000 | Tenet Healthcare Corp. 6.250%, 02/01/27 | 2,371,626 | |||||||||
| 1,420,000 | 6.875%, 11/15/31 | 1,311,810 | |||||||||
| 1,320,000 | Teva Pharmaceutical Finance Netherlands III, BV 5.125%, 05/09/29^ | 1,152,281 | |||||||||
| 1,000,000 | 4.750%, 05/09/27^ | 907,830 | |||||||||
| 500,000 | 3.150%, 10/01/26 | 440,140 | |||||||||
20,968,867 | |||||||||||
Industrials (6.3%) | |||||||||||
| 1,200,000 | ACCO Brands Corp.*^ 4.250%, 03/15/29 | 996,684 | |||||||||
| 825,000 | AerCap Holdings, NV^‡ 5.875%, 10/10/79 5 year CMT + 4.54% | 776,012 | |||||||||
| PRINCIPAL AMOUNT | VALUE | ||||||||||
| 1,055,000 | Air Lease Corp.‡ 4.125%, 11/01/35 5 year CMT + 3.15% | $ | 758,999 | ||||||||
| 1,750,000 | Albertsons Companies, Inc. / Safeway, Inc. / New Albertsons, LP / Albertsons, LLC* 4.625%, 01/15/27 | 1,647,152 | |||||||||
| 780,000 | 5.875%, 02/15/28 | 748,324 | |||||||||
| 779,000 | 3.500%, 03/15/29 | 664,791 | |||||||||
| 1,200,000 | Allegiant Travel Company* 7.250%, 08/15/27 | 1,092,936 | |||||||||
| 260,000 | American Airlines Group, Inc.* 3.750%, 03/01/25 | 243,448 | |||||||||
| 587,000 | Arcosa, Inc.* 4.375%, 04/15/29 | 513,983 | |||||||||
| 2,650,000 | ARD Finance, SA* 6.500%, 06/30/27 7.250% PIK rate | 1,547,388 | |||||||||
| 821,000 | Beacon Roofing Supply, Inc.* 4.125%, 05/15/29 | 690,075 | |||||||||
| 533,000 | Bombardier, Inc.* 7.875%, 04/15/27 | 513,546 | |||||||||
| 1,044,000 | BWX Technologies, Inc.* 4.125%, 04/15/29 | 903,175 | |||||||||
| 1,078,000 | Cascades, Inc. / Cascades USA, Inc.* 5.375%, 01/15/28 | 979,665 | |||||||||
| 257,000 | Delta Air Lines, Inc. / SkyMiles IP, Ltd.*µ 4.750%, 10/20/28 | 241,562 | |||||||||
| 1,360,000 | Deluxe Corp.* 8.000%, 06/01/29 | 1,077,895 | |||||||||
| 783,000 | Eco Material Technologies, Inc.* 7.875%, 01/31/27 | 745,025 | |||||||||
| 520,000 | Emerald Debt Merger Sub, LLC* 6.625%, 12/15/30 | 495,383 | |||||||||
| 500,000 | EnerSys* 4.375%, 12/15/27 | 449,125 | |||||||||
| 634,000 | Graham Packaging Company, Inc.* 7.125%, 08/15/28 | 492,916 | |||||||||
| 675,000 | Graphic Packaging International, LLC* 4.750%, 07/15/27 | 630,781 | |||||||||
| 484,000 | 3.500%, 03/01/29 | 406,545 | |||||||||
| 1,141,000 | Great Lakes Dredge & Dock Corp.*^ 5.250%, 06/01/29 | 934,787 | |||||||||
| 2,438,000 | H&E Equipment Services, Inc.* 3.875%, 12/15/28 | 2,070,350 | |||||||||
| 1,549,000 | Hawaiian Brand Intellectual Property, Ltd. / HawaiianMiles Loyalty, Ltd.* 5.750%, 01/20/26 | 1,145,950 | |||||||||
| 1,350,000 | Herc Holdings, Inc.* 5.500%, 07/15/27 | 1,271,714 | |||||||||
| 1,210,000 | IEA Energy Services, LLC* 6.625%, 08/15/29 | 1,155,913 | |||||||||
See accompanying Notes to Schedule of Investments
CALAMOS CLOSED-END FAMILY OF FUNDS ANNUAL REPORT
130
Convertible and High Income Fund Schedule of Investments October 31, 2023
| PRINCIPAL AMOUNT | VALUE | ||||||||||
| 727,000 | JELD-WEN, Inc.* 4.625%, 12/15/25 | $ | 690,614 | ||||||||
| 540,000 | 4.875%, 12/15/27 | 461,095 | |||||||||
| 1,690,000 | Ken Garff Automotive, LLC* 4.875%, 09/15/28 | 1,440,133 | |||||||||
| 1,040,000 | Knife River Holding Company* 7.750%, 05/01/31 | 1,037,743 | |||||||||
| 515,000 | MasTec, Inc.*µ 4.500%, 08/15/28 | 452,834 | |||||||||
| 650,000 | Moog, Inc.* 4.250%, 12/15/27 | 590,226 | |||||||||
| 1,302,000 | Newfold Digital Holdings Group, Inc.*^ 6.000%, 02/15/29 | 860,791 | |||||||||
| 1,040,000 | Novelis Corp.* 4.750%, 01/30/30 | 886,652 | |||||||||
| 390,000 | OI European Group, BV* 4.750%, 02/15/30 | 332,077 | |||||||||
| 1,200,000 | Pactiv Evergreen Group Issuer, Inc. / Pactiv Evergreen Group Issuer, LLC*^ 4.000%, 10/15/27 | 1,056,504 | |||||||||
| 1,573,000 | Patrick Industries, Inc.*^ 4.750%, 05/01/29 | 1,293,179 | |||||||||
| 525,000 | QVC, Inc. 5.450%, 08/15/34 | 223,608 | |||||||||
| 809,000 | Sealed Air Corp.* 6.125%, 02/01/28 | 770,427 | |||||||||
| 261,000 | 5.000%, 04/15/29^ | 232,924 | |||||||||
| 400,000 | Sensata Technologies, BV* 4.000%, 04/15/29 | 340,552 | |||||||||
| 519,000 | Sensata Technologies, Inc.* 3.750%, 02/15/31 | 416,165 | |||||||||
| 774,000 | Sinclair Television Group, Inc.* 4.125%, 12/01/30 | 487,171 | |||||||||
| 515,000 | 5.500%, 03/01/30^ | 280,114 | |||||||||
| 1,030,000 | Standard Industries, Inc.* 5.000%, 02/15/27 | 954,058 | |||||||||
| 835,000 | Stericycle, Inc.* 3.875%, 01/15/29 | 713,474 | |||||||||
| 779,000 | STL Holding Company, LLC* 7.500%, 02/15/26 | 731,629 | |||||||||
| 1,404,000 | TransDigm, Inc. 6.250%, 03/15/26* | 1,373,982 | |||||||||
| 1,125,000 | 6.875%, 12/15/30* | 1,088,764 | |||||||||
| 815,000 | 7.500%, 03/15/27 | 815,114 | |||||||||
| 790,000 | 6.750%, 08/15/28* | 768,860 | |||||||||
| 1,039,000 | Tronox, Inc.* 4.625%, 03/15/29 | 816,758 | |||||||||
| 421,811 | United Airlines Pass Through Trust Series 2019-2, Class B 3.500%, 11/01/29 | 373,843 | |||||||||
| 1,039,000 | Vertiv Group Corp.* 4.125%, 11/15/28 | 909,281 | |||||||||
| 1,095,000 | Wabash National Corp.* 4.500%, 10/15/28 | 908,007 | |||||||||
| PRINCIPAL AMOUNT | VALUE | ||||||||||
| 915,000 | Waste Pro USA, Inc.* 5.500%, 02/15/26 | $ | 844,133 | ||||||||
| 604,000 | Williams Scotsman, Inc.* 4.625%, 08/15/28 | 537,379 | |||||||||
45,882,215 | |||||||||||
Information Technology (2.0%) | |||||||||||
| 521,000 | Booz Allen Hamilton, Inc.* 4.000%, 07/01/29 | 460,173 | |||||||||
| 604,000 | Coherent Corp.*^ 5.000%, 12/15/29 | 513,545 | |||||||||
| 1,136,000 | CommScope Technologies, LLC*^ 6.000%, 06/15/25 | 686,212 | |||||||||
| 955,000 | CommScope, Inc.*^ 4.750%, 09/01/29 | 652,389 | |||||||||
| 660,000 | Dell International, LLC / EMC Corp.µ 6.020%, 06/15/26 | 660,746 | |||||||||
| 522,000 | Dun & Bradstreet Corp.*^ 5.000%, 12/15/29 | 449,776 | |||||||||
| 520,000 | Fair Isaac Corp.* 4.000%, 06/15/28 | 463,918 | |||||||||
| 1,130,000 | KBR, Inc.* 4.750%, 09/30/28 | 996,490 | |||||||||
| 1,130,000 | MPH Acquisition Holdings, LLC* 5.750%, 11/01/28^ | 843,827 | |||||||||
| 520,000 | 5.500%, 09/01/28 | 434,918 | |||||||||
| 528,000 | NCL Corp., Ltd.* 8.125%, 01/15/29 | 516,564 | |||||||||
| 522,000 | NCR Voyix Corp.* 5.125%, 04/15/29 | 449,479 | |||||||||
| 771,000 | ON Semiconductor Corp.* 3.875%, 09/01/28 | 662,659 | |||||||||
| 780,000 | Open Text Corp.* 3.875%, 02/15/28 | 679,435 | |||||||||
| 525,000 | 6.900%, 12/01/27 | 523,992 | |||||||||
| 391,000 | 3.875%, 12/01/29 | 320,999 | |||||||||
| 391,000 | Open Text Holdings, Inc.*^ 4.125%, 12/01/31 | 308,257 | |||||||||
| 1,168,000 | Playtika Holding Corp.* 4.250%, 03/15/29 | 942,973 | |||||||||
| 1,450,000 | TTM Technologies, Inc.* 4.000%, 03/01/29 | 1,192,944 | |||||||||
| 725,000 | Twilio, Inc. 3.625%, 03/15/29 | 605,063 | |||||||||
| 259,000 | 3.875%, 03/15/31^ | 207,311 | |||||||||
| 1,300,000 | Viavi Solutions, Inc.* 3.750%, 10/01/29 | 1,034,995 | |||||||||
| 1,200,000 | ZoomInfo Technologies, LLC / ZoomInfo Finance Corp.* 3.875%, 02/01/29 | 992,196 | |||||||||
14,598,861 | |||||||||||
Materials (1.9%) | |||||||||||
| 555,000 | ArcelorMittal, SA^ 7.000%, 10/15/39 | 527,872 | |||||||||
See accompanying Notes to Schedule of Investments
www.calamos.com
131
Convertible and High Income Fund Schedule of Investments October 31, 2023
| PRINCIPAL AMOUNT | VALUE | ||||||||||
| 500,000 | ATI, Inc. 5.875%, 12/01/27 | $ | 465,695 | ||||||||
| 258,000 | Carpenter Technology Corp. 7.625%, 03/15/30 | 256,320 | |||||||||
| 780,000 | Chemours Company*^ 4.625%, 11/15/29 | 603,626 | |||||||||
| 1,640,000 | Clearwater Paper Corp.* 4.750%, 08/15/28 | 1,449,284 | |||||||||
| 780,000 | Cleveland-Cliffs, Inc.* 6.750%, 04/15/30 | 724,698 | |||||||||
| 522,000 | Commercial Metals Company 4.125%, 01/15/30 | 441,800 | |||||||||
| 261,000 | 4.375%, 03/15/32 | 210,922 | |||||||||
| 1,210,000 | Constellium, SE*^ 3.750%, 04/15/29 | 996,471 | |||||||||
| 512,000 | HB Fuller Company 4.250%, 10/15/28 | 444,385 | |||||||||
| 525,000 | INEOS Finance, PLC*^ 6.750%, 05/15/28 | 490,928 | |||||||||
| 800,000 | JW Aluminum Continuous Cast Company* 10.250%, 06/01/26 | 798,024 | |||||||||
| 1,180,000 | Kaiser Aluminum Corp.* 4.625%, 03/01/28 | 986,327 | |||||||||
| 130,000 | 4.500%, 06/01/31 | 96,160 | |||||||||
| 260,000 | LSF11 A5 HoldCo, LLC* 6.625%, 10/15/29 | 213,333 | |||||||||
| 1,367,000 | Mercer International, Inc. 5.125%, 02/01/29 | 1,073,683 | |||||||||
| 520,000 | 12.875%, 10/01/28* | 525,855 | |||||||||
| 1,015,000 | OCI, NV* 6.700%, 03/16/33 | 939,393 | |||||||||
| 785,000 | Owens-Brockway Glass Container, Inc.*^ 7.250%, 05/15/31 | 719,358 | |||||||||
| 505,000 | 6.625%, 05/13/27 | 481,194 | |||||||||
| 1,194,000 | Silgan Holdings, Inc. 4.125%, 02/01/28 | 1,064,988 | |||||||||
| 521,000 | Trinseo Materials Operating SCA / Trinseo Materials Finance, Inc.* 5.125%, 04/01/29 | 223,223 | |||||||||
13,733,539 | |||||||||||
Other (0.1%) | |||||||||||
| 475,000 | Gen Digital, Inc.* 7.125%, 09/30/30^ | 463,035 | |||||||||
| 475,000 | 6.750%, 09/30/27 | 463,182 | |||||||||
926,217 | |||||||||||
Real Estate (0.4%) | |||||||||||
| 834,000 | EPR Properties 3.750%, 08/15/29 | 659,110 | |||||||||
| 750,000 | Forestar Group, Inc.* 5.000%, 03/01/28 | 661,545 | |||||||||
| 551,000 | 3.850%, 05/15/26 | 494,490 | |||||||||
| PRINCIPAL AMOUNT | VALUE | ||||||||||
| 1,168,000 | MIWD Holdco II, LLC / MIWD Finance Corp.* 5.500%, 02/01/30 | $ | 927,824 | ||||||||
| 485,000 | Service Properties Trust 5.250%, 02/15/26 | 435,380 | |||||||||
3,178,349 | |||||||||||
Special Purpose Acquisition Companies (0.2%) | |||||||||||
| 1,045,000 | Fertitta Entertainment, LLC / Fertitta Entertainment Finance Company, Inc.* 6.750%, 01/15/30 | 831,507 | |||||||||
| 524,000 | 4.625%, 01/15/29 | 442,408 | |||||||||
1,273,915 | |||||||||||
Utilities (0.2%) | |||||||||||
| 379,000 | PPL Capital Funding, Inc.‡ 8.317%, 03/30/67 3 mo. LIBOR + 2.67% | 343,393 | |||||||||
| 525,000 | Vistra Corp.*‡ 7.000%, 11/01/67 5 year CMT + 5.74% | 480,270 | |||||||||
| 270,000 | 8.000%, 11/01/67 5 year CMT + 6.93% | 256,873 | |||||||||
1,080,536 | |||||||||||
| TOTAL CORPORATE BONDS(Cost $353,954,379) | 320,623,240 | ||||||||||
CONVERTIBLE BONDS (106.1%) | |||||||||||
Communication Services (9.7%) | |||||||||||
| 780,000 | Cable One, Inc.µ 0.000%, 03/15/26 | 638,578 | |||||||||
| 9,250,000 | Liberty Media Corp.* 3.750%, 03/15/28 | 10,193,777 | |||||||||
| 8,750,000 | 2.375%, 09/30/53 | 8,484,438 | |||||||||
| 9,750,000 | Liberty Media Corp.-Liberty Formula One 2.250%, 08/15/27 | 9,718,117 | |||||||||
| 5,750,000 | Match Group Financeco 3, Inc.*µ~ 2.000%, 01/15/30 | 4,672,853 | |||||||||
| 6,750,000 | Perficient, Inc.µ 0.125%, 11/15/26 | 5,403,308 | |||||||||
| 16,500,000 | Sea, Ltd. 0.250%, 09/15/26 | 13,120,470 | |||||||||
| 11,500,000 | Snap, Inc.µ 0.000%, 05/01/27 | 8,565,775 | |||||||||
| 6,000,000 | 0.750%, 08/01/26 | 5,296,920 | |||||||||
| 3,750,000 | Zillow Group, Inc.µ 1.375%, 09/01/26 | 3,939,075 | |||||||||
70,033,311 | |||||||||||
Consumer Discretionary (20.1%) | |||||||||||
| 12,250,000 | Airbnb, Inc.µ 0.000%, 03/15/26 | 10,613,400 | |||||||||
| 5,000,000 | Booking Holdings, Inc.µ 0.750%, 05/01/25 | 7,624,550 | |||||||||
See accompanying Notes to Schedule of Investments
CALAMOS CLOSED-END FAMILY OF FUNDS ANNUAL REPORT
132
Convertible and High Income Fund Schedule of Investments October 31, 2023
| PRINCIPAL AMOUNT | VALUE | ||||||||||
| 4,500,000 | Carnival Corp.*µ 5.750%, 12/01/27 | $ | 5,331,690 | ||||||||
| 7,500,000 | Chegg, Inc.µ 0.000%, 09/01/26 | 5,826,150 | |||||||||
| 15,570,000 | DISH Network Corp. 0.000%, 12/15/25 | 9,552,818 | |||||||||
| 1,286,000 | 2.375%, 03/15/24µ | 1,232,258 | |||||||||
| 12,500,000 | DraftKings Holdings, Inc.µ 0.000%, 03/15/28 | 9,278,125 | |||||||||
| 14,000,000 | Etsy, Inc.µ 0.125%, 09/01/27 | 11,063,360 | |||||||||
| 18,500,000 | Ford Motor Companyµ 0.000%, 03/15/26 | 16,886,985 | |||||||||
| 9,250,000 | Liberty Broadband Corp.* 3.125%, 03/31/53 | 9,176,463 | |||||||||
| 2,620,000 | Lucid Group, Inc.* 1.250%, 12/15/26 | 1,444,039 | |||||||||
| 11,000,000 | Marriott Vacations Worldwide Corp.*µ 3.250%, 12/15/27 | 9,326,570 | |||||||||
| 10,250,000 | Rivian Automotive, Inc.* 4.625%, 03/15/29 | 10,805,345 | |||||||||
| 6,250,000 | Shake Shack, Inc.µ 0.000%, 03/01/28 | 4,622,000 | |||||||||
| 16,250,000 | Vail Resorts, Inc.µ^ 0.000%, 01/01/26 | 14,227,525 | |||||||||
| 14,500,000 | Wayfair, Inc.µ 3.250%, 09/15/27 | 13,972,780 | |||||||||
| 4,500,000 | Wynn Macau, Ltd.* 4.500%, 03/07/29 | 4,590,540 | |||||||||
145,574,598 | |||||||||||
Consumer Staples (1.1%) | |||||||||||
| 3,067,000 | Enovis Corp.* 3.875%, 10/15/28 | 3,204,248 | |||||||||
| 5,000,000 | Post Holdings, Inc. 2.500%, 08/15/27 | 4,772,850 | |||||||||
7,977,098 | |||||||||||
Energy (3.0%) | |||||||||||
| 1,675,000 | EQT Corp.µ 1.750%, 05/01/26 | 4,869,895 | |||||||||
| 5,265,000 | Nabors Industries, Inc.*µ 1.750%, 06/15/29 | 3,945,170 | |||||||||
| 4,500,000 | Northern Oil & Gas, Inc. 3.625%, 04/15/29 | 5,314,815 | |||||||||
| 3,000,000 | Pioneer Natural Resources Companyµ 0.250%, 05/15/25 | 7,655,910 | |||||||||
| 10,545,000 | SunEdison, Inc.@ 0.250%, 01/15/49* | 105,450 | |||||||||
| 1,027,000 | 2.000%, 10/01/49 | 10,270 | |||||||||
21,901,510 | |||||||||||
Financials (1.3%) | |||||||||||
| 9,250,000 | Morgan Stanley Finance, LLC 1.000%, 11/23/27 | 9,377,650 | |||||||||
| PRINCIPAL AMOUNT | VALUE | ||||||||||
Health Care (22.7%) | |||||||||||
| 5,000,000 | Alnylam Pharmaceuticals, Inc.µ 1.000%, 09/15/27 | $ | 4,339,300 | ||||||||
| 6,000,000 | Alphatec Holdings, Inc.µ 0.750%, 08/01/26 | 5,125,860 | |||||||||
| 6,019,000 | BioMarin Pharmaceutical, Inc.µ 0.599%, 08/01/24 | 5,804,182 | |||||||||
| 10,250,000 | CONMED Corp.µ 2.250%, 06/15/27 | 9,595,537 | |||||||||
| 13,500,000 | CryoPort, Inc.*µ 0.750%, 12/01/26 | 10,683,225 | |||||||||
| 17,458,000 | Dexcom, Inc.µ 0.250%, 11/15/25 | 16,572,356 | |||||||||
| 8,750,000 | 0.375%, 05/15/28* | 7,718,025 | |||||||||
| 4,500,000 | Envista Holdings Corp.*µ 1.750%, 08/15/28 | 3,893,580 | |||||||||
| 7,500,000 | Exact Sciences Corp.µ 0.375%, 03/15/27 | 6,534,000 | |||||||||
| 7,750,000 | Halozyme Therapeutics, Inc.µ 1.000%, 08/15/28 | 6,818,682 | |||||||||
| 4,750,000 | Insmed, Inc.µ 0.750%, 06/01/28 | 4,616,905 | |||||||||
| 5,000,000 | Insulet Corp.µ 0.375%, 09/01/26 | 4,631,750 | |||||||||
| 9,750,000 | Integer Holdings Corp.*µ 2.125%, 02/15/28 | 10,732,605 | |||||||||
| 4,750,000 | Integra LifeSciences Holdings Corp.µ 0.500%, 08/15/25 | 4,285,023 | |||||||||
| 4,750,000 | Ionis Pharmaceuticals, Inc. 0.000%, 04/01/26 | 4,600,138 | |||||||||
| 10,905,000 | Jazz Investments I, Ltd. 2.000%, 06/15/26 | 11,071,083 | |||||||||
| 4,040,000 | Lantheus Holdings, Inc.*µ 2.625%, 12/15/27 | 4,482,461 | |||||||||
| 11,250,000 | NeoGenomics, Inc.µ 0.250%, 01/15/28 | 8,130,037 | |||||||||
| 9,500,000 | Omnicell, Inc.µ 0.250%, 09/15/25 | 8,445,215 | |||||||||
| 8,750,000 | Pacira BioSciences, Inc.µ 0.750%, 08/01/25 | 7,871,500 | |||||||||
| 4,000,000 | Sarepta Therapeutics, Inc.µ 1.250%, 09/15/27 | 3,406,200 | |||||||||
| 9,000,000 | Shockwave Medical, Inc.*µ 1.000%, 08/15/28 | 8,726,490 | |||||||||
| 7,250,000 | Tandem Diabetes Care, Inc.*µ 1.500%, 05/01/25 | 6,844,942 | |||||||||
164,929,096 | |||||||||||
Industrials (8.5%) | |||||||||||
| 4,500,000 | Advanced Energy Industries, Inc.*µ 2.500%, 09/15/28 | 4,159,350 | |||||||||
| 4,750,000 | Axon Enterprise, Inc.*µ 0.500%, 12/15/27 | 5,124,347 | |||||||||
See accompanying Notes to Schedule of Investments
www.calamos.com
133
Convertible and High Income Fund Schedule of Investments October 31, 2023
| PRINCIPAL AMOUNT | VALUE | ||||||||||
| 4,500,000 | Fluor Corp.*^ 1.125%, 08/15/29 | $ | 4,344,255 | ||||||||
| 7,750,000 | John Bean Technologies Corp.µ 0.250%, 05/15/26 | 6,974,302 | |||||||||
| 4,750,000 | Middleby Corp. 1.000%, 09/01/25 | 4,933,873 | |||||||||
| 3,250,000 | Parsons Corp. 0.250%, 08/15/25 | 4,263,480 | |||||||||
| 7,750,000 | Southwest Airlines Companyµ^~ 1.250%, 05/01/25 | 7,385,750 | |||||||||
| 4,500,000 | Tetra Tech, Inc.* 2.250%, 08/15/28 | 4,359,105 | |||||||||
| 21,750,000 | Uber Technologies, Inc.µ 0.000%, 12/15/25 | 19,883,850 | |||||||||
61,428,312 | |||||||||||
Information Technology (33.3%) | |||||||||||
| 9,000,000 | Akamai Technologies, Inc. 1.125%, 02/15/29* | 8,860,590 | |||||||||
| 4,750,000 | 0.375%, 09/01/27µ | 4,838,683 | |||||||||
| 10,000,000 | Bentley Systems, Inc. 0.125%, 01/15/26 | 9,544,900 | |||||||||
| 11,750,000 | BILL Holdings, Inc.µ 0.000%, 04/01/27 | 9,325,152 | |||||||||
| 3,500,000 | Camtek, Ltd.* 0.000%, 12/01/26 | 3,777,270 | |||||||||
| 6,250,000 | Confluent, Inc.µ 0.000%, 01/15/27 | 5,044,500 | |||||||||
| 8,250,000 | CyberArk Software, Ltd.µ 0.000%, 11/15/24 | 9,444,600 | |||||||||
| 6,875,000 | Datadog, Inc.µ 0.125%, 06/15/25 | 7,571,025 | |||||||||
| 6,750,000 | DigitalOcean Holdings, Inc.µ 0.000%, 12/01/26 | 5,079,105 | |||||||||
| 10,012,000 | Enphase Energy, Inc.µ 0.000%, 03/01/26 | 8,538,534 | |||||||||
| 6,250,000 | Five9, Inc.µ 0.500%, 06/01/25 | 5,719,437 | |||||||||
| 2,250,000 | MongoDB, Inc.µ 0.250%, 01/15/26 | 3,839,175 | |||||||||
| 6,500,000 | NCL Corp., Ltd.µ 1.125%, 02/15/27 | 5,041,010 | |||||||||
| 5,000,000 | 2.500%, 02/15/27 | 4,011,600 | |||||||||
| 3,250,000 | 5.375%, 08/01/25 | 3,449,810 | |||||||||
| 8,000,000 | Okta, Inc.µ 0.125%, 09/01/25 | 7,162,560 | |||||||||
| 4,250,000 | 0.375%, 06/15/26 | 3,644,928 | |||||||||
| 18,500,000 | ON Semiconductor Corp.*µ 0.500%, 03/01/29 | 16,264,090 | |||||||||
| 6,000,000 | Palo Alto Networks, Inc. 0.375%, 06/01/25 | 14,652,120 | |||||||||
| 2,250,000 | Q2 Holdings, Inc.µ 0.750%, 06/01/26 | 1,955,183 | |||||||||
| 4,500,000 | Rapid7, Inc.*µ 1.250%, 03/15/29 | 4,353,390 | |||||||||
| PRINCIPAL AMOUNT | VALUE | ||||||||||
| 12,250,000 | Repay Holdings Corp.*µ 0.000%, 02/01/26 | $ | 9,804,287 | ||||||||
| 4,500,000 | Seagate HDD Cayman* 3.500%, 06/01/28 | 4,668,030 | |||||||||
| 15,000,000 | Shift4 Payments, Inc.µ 0.000%, 12/15/25 | 13,660,500 | |||||||||
| 7,000,000 | SK Hynix, Inc. 1.750%, 04/11/30 | 8,469,720 | |||||||||
| 12,750,000 | Splunk, Inc.µ 1.125%, 06/15/27 | 12,052,447 | |||||||||
| 10,750,000 | Tyler Technologies, Inc.^ 0.250%, 03/15/26 | 10,222,175 | |||||||||
| 13,250,000 | Unity Software, Inc.µ 0.000%, 11/15/26 | 10,383,760 | |||||||||
| 7,000,000 | Wix.com, Ltd. 0.000%, 08/15/25 | 6,207,320 | |||||||||
| 9,500,000 | Wolfspeed, Inc. 1.875%, 12/01/29* | 5,674,540 | |||||||||
| 5,711,000 | 0.250%, 02/15/28 | 3,521,631 | |||||||||
| 4,500,000 | Workiva, Inc.*µ 1.250%, 08/15/28 | 4,087,440 | |||||||||
| 8,500,000 | Zscaler, Inc. 0.125%, 07/01/25 | 10,377,990 | |||||||||
241,247,502 | |||||||||||
Materials (2.4%) | |||||||||||
| 1,500,000 | ATI, Inc. 3.500%, 06/15/25 | 3,711,240 | |||||||||
| 3,750,000 | Ivanhoe Mines, Ltd.* 2.500%, 04/15/26 | 4,312,162 | |||||||||
| 5,407,000 | Lithium Americas Corp. 1.750%, 01/15/27 | 3,650,266 | |||||||||
| 6,858,000 | MP Materials Corp.*µ 0.250%, 04/01/26 | 5,650,718 | |||||||||
17,324,386 | |||||||||||
Other (0.0%) | |||||||||||
| 525,000 | Multiplan Corp.* 6.000%, 10/15/27 7.000% PIK rate | 349,136 | |||||||||
Real Estate (0.7%) | |||||||||||
| 6,500,000 | Pebblebrook Hotel Trustµ 1.750%, 12/15/26 | 5,168,995 | |||||||||
Utilities (3.3%) | |||||||||||
| 4,500,000 | CMS Energy Corp.* 3.375%, 05/01/28 | 4,260,780 | |||||||||
| 16,500,000 | PPL Capital Funding, Inc.* 2.875%, 03/15/28 | 15,131,820 | |||||||||
| 4,750,000 | Southern Company* 3.875%, 12/15/25 | 4,666,780 | |||||||||
24,059,380 | |||||||||||
| TOTAL CONVERTIBLE BONDS(Cost $883,668,612) | 769,370,974 | ||||||||||
See accompanying Notes to Schedule of Investments
CALAMOS CLOSED-END FAMILY OF FUNDS ANNUAL REPORT
134
Convertible and High Income Fund Schedule of Investments October 31, 2023
| PRINCIPAL AMOUNT | VALUE | ||||||||||
BANK LOANS (7.0%)¡ | |||||||||||
Airlines (0.2%) | |||||||||||
| 792,000 | American Airlines, Inc.‡ 10.427%, 04/20/28 3 mo. SOFR + 4.75% | $ | 804,375 | ||||||||
| 806,250 | Mileage Plus Holdings, LLC‡ 10.798%, 06/21/27 3 mo. SOFR + 5.25% | 832,219 | |||||||||
1,636,594 | |||||||||||
Communication Services (0.2%) | |||||||||||
| 126,698 | Clear Channel Outdoor Holdings, Inc.‡ 8.922%, 08/21/26 3 mo. SOFR + 3.50% | 122,000 | |||||||||
| 365,603 | DIRECTV Financing, LLC‡ 10.325%, 08/02/27 1 mo. SOFR + 5.00% | 356,399 | |||||||||
| 1,527,000 | Entercom Media Corp.‡ 8.145%, 11/18/24 3 mo. SOFR + 2.50% | 671,643 | |||||||||
| 525,000 | Telesat Canada‡ 8.434%, 12/07/26 3 mo. SOFR + 2.75% | 361,856 | |||||||||
1,511,898 | |||||||||||
Consumer Discretionary (1.3%) | |||||||||||
| 472,889 | American Axle and Manufacturing, Inc.‡ 9.007%, 12/31/29 3 mo. SOFR + 3.50% | 471,905 | |||||||||
| 315,111 | American Axle and Manufacturing, Inc.‡ 8.941%, 12/13/29 1 mo. SOFR + 3.50% | 314,456 | |||||||||
| 1,069,625 | Caesars Entertainment, Inc.‡ 8.674%, 02/06/30 1 mo. SOFR + 3.25% | 1,067,101 | |||||||||
| 1,047,375 | Carnival Corp.‡ 8.336%, 08/08/27 1 mo. SOFR + 3.00% | 1,030,355 | |||||||||
| 1,044,750 | Hanesbrands, Inc.‡ 9.074%, 03/08/30 1 mo. SOFR + 3.75% | 1,032,996 | |||||||||
| 596,912 | Life Time Fitness, Inc.‡ 10.130%, 01/15/26 3 mo. SOFR + 4.75% | 598,180 | |||||||||
| 1,196,932 | Petco Health and Wellness Company, Inc.‡ 8.902%, 03/03/28 3 mo. SOFR + 3.25% | 1,172,329 | |||||||||
| 2,581,898 | PetSmart, Inc.‡ 9.174%, 02/11/28 1 mo. SOFR + 3.75% | 2,554,737 | |||||||||
| 650,704 | TKC Holdings, Inc.‡ 10.939%, 05/15/28 1 mo. SOFR + 5.50% | 624,676 | |||||||||
| PRINCIPAL AMOUNT | VALUE | ||||||||||
| 265,000 | Windsor Holdings III, LLC‡ 9.815%, 08/01/30 1 mo. SOFR + 4.50% | $ | 264,551 | ||||||||
9,131,286 | |||||||||||
Consumer Staples (0.2%) | |||||||||||
| 1,050,000 | Star Parent, Inc.‡ 9.386%, 09/27/30 3 mo. LIBOR + 4.00% | 1,003,805 | |||||||||
| 550,000 | United Natural Foods, Inc.‡ 8.689%, 10/22/25 1 mo. SOFR + 3.25% | 549,236 | |||||||||
1,553,041 | |||||||||||
Energy (0.2%) | |||||||||||
| 525,000 | New Fortress Energy, Inc.‡ 10.390%, 10/27/28 3 mo. SOFR + 5.00% | 485,625 | |||||||||
| 1,329,625 | Par Petroleum, LLC‡ 9.772%, 02/28/30 3 mo. SOFR + 4.25% | 1,327,963 | |||||||||
1,813,588 | |||||||||||
Financials (1.3%) | |||||||||||
| 265,000 | Advisor Group, Inc.‡ 9.824%, 08/17/28 1 mo. SOFR + 4.50% | 264,123 | |||||||||
| 1,054,687 | Alliant Holdings Intermediate, LLC‡ 8.835%, 11/05/27 1 mo. SOFR + 3.50% | 1,052,330 | |||||||||
| 565,905 | Amynta Agency Borrower, Inc.‡ 10.325%, 02/28/28 1 mo. SOFR + 5.00% | 566,301 | |||||||||
| 206,857 | Amynta Agency Borrower, Inc.‡ 10.424%, 02/28/28 1 mo. SOFR + 5.00% | 207,001 | |||||||||
| 1,039,447 | AssuredPartners, Inc.‡ 8.824%, 02/12/27 1 mo. SOFR + 3.50% | 1,031,652 | |||||||||
| 788,025 | Avolon TLB Borrower 1 LLC‡ 7.839%, 06/22/28 1 mo. SOFR + 2.50% | 789,124 | |||||||||
| 918,664 | Castlelake Aviation, Ltd.! 0.000%, 10/22/26 | 918,090 | |||||||||
| 521,063 | Castlelake Aviation, Ltd.‡ 8.421%, 10/22/27 3 mo. SOFR + 2.75% | 520,458 | |||||||||
| 1,042,125 | Hub International, Ltd.‡ 9.365%, 11/10/29 3 mo. SOFR + 4.00% | 1,041,974 | |||||||||
| 1,849,524 | Jazz Financing Lux Sarl‡ 8.939%, 05/05/28 1 mo. SOFR + 3.50% | 1,851,059 | |||||||||
| 1,440,450 | VFH Parent, LLC‡ 8.427%, 01/13/29 1 mo. SOFR + 3.00% | 1,433,399 | |||||||||
9,675,511 | |||||||||||
See accompanying Notes to Schedule of Investments
www.calamos.com
135
Convertible and High Income Fund Schedule of Investments October 31, 2023
| PRINCIPAL AMOUNT | VALUE | ||||||||||
Health Care (0.9%) | |||||||||||
| 1,815,189 | Amneal Pharmaceuticals, LLC‡ 8.939%, 05/04/25 1 mo. SOFR + 3.50% | $ | 1,782,443 | ||||||||
| 569,215 | ICON Luxembourg Sarl‡ 7.902%, 07/03/28 3 mo. SOFR + 2.25% | 570,202 | |||||||||
| 1,009,592 | Mallinckrodt International Finance, SA‡ 12.703%, 09/30/27 1 mo. SOFR + 7.25% | 769,254 | |||||||||
| 1,152,941 | Padagis, LLC‡ 10.434%, 07/06/28 3 mo. SOFR + 4.75% | 1,027,080 | |||||||||
| 141,820 | PRA Health Sciences, Inc.‡ 7.902%, 07/03/28 3 mo. SOFR + 2.25% | 142,066 | |||||||||
| 2,585,863 | Team Health Holdings, Inc.‡ 10.633%, 03/02/27 3 mo. SOFR + 5.25% | 1,868,998 | |||||||||
| 7,373 | Team Health Holdings, Inc.‡ 10.574%, 03/02/27 1 mo. SOFR + 5.25% | 5,329 | |||||||||
6,165,372 | |||||||||||
Industrials (0.8%) | |||||||||||
| 508,300 | ACProducts, Inc.‡ 9.902%, 05/17/28 3 mo. SOFR + 4.25% | 405,651 | |||||||||
| 641,875 | Air Canada‡ 9.128%, 08/11/28 3 mo. SOFR + 3.50% | 642,036 | |||||||||
| 1,315,063 | ChampionX Corp.‡ 8.177%, 06/07/29 1 mo. SOFR + 2.75% | 1,321,020 | |||||||||
| 647,136 | Emrld Borrower, LP‡ 8.380%, 05/31/30 3 mo. SOFR + 3.00% | 646,528 | |||||||||
| 1,185,000 | Scientific Games International, Inc.‡ 8.435%, 04/14/29 1 mo. SOFR + 3.00% | 1,185,373 | |||||||||
| 545,875 | Summit Materials, LLC‡ 8.571%, 12/14/27 3 mo. SOFR + 3.00% | 548,861 | |||||||||
| 1,008,827 | United Airlines, Inc.‡ 9.189%, 04/21/28 1 mo. SOFR + 3.75% | 1,008,196 | |||||||||
5,757,665 | |||||||||||
Information Technology (0.7%) | |||||||||||
| 1,028,400 | Banff Merger Sub, Inc.‡ 9.189%, 10/02/25 1 mo. SOFR + 3.75% | 1,028,615 | |||||||||
| 864,199 | Camelot Finance SA‡ 8.439%, 10/30/26 1 mo. SOFR + 3.00% | 864,112 | |||||||||
| PRINCIPAL AMOUNT | VALUE | ||||||||||
| 715,000 | Central Parent Inc.! 0.000%, 07/06/29 | $ | 711,872 | ||||||||
| 267,975 | Central Parent, Inc.‡ 9.406%, 07/06/29 3 mo. SOFR + 4.00% | 266,803 | |||||||||
| 1,004,436 | Dun & Bradstreet Corp.‡ 8.176%, 02/06/26 1 mo. SOFR + 2.75% | 1,004,436 | |||||||||
| 955,289 | II-VI, Inc.‡ 8.189%, 07/02/29 1 mo. SOFR + 2.75% | 954,840 | |||||||||
4,830,678 | |||||||||||
Materials (0.8%) | |||||||||||
| 785,000 | Chemours Company‡ 8.824%, 08/18/28 1 mo. SOFR + 2.50% | 765,375 | |||||||||
| 1,047,375 | Ineos US Finance, LLC‡ 8.924%, 02/18/30 1 mo. SOFR + 3.50% | 1,026,920 | |||||||||
| 1,288,672 | Innophos, Inc.‡ 8.689%, 02/05/27 1 mo. SOFR + 3.25% | 1,277,396 | |||||||||
| 1,311,713 | LSF11 A5 Holdco, LLC‡ 9.674%, 10/15/28 1 mo. SOFR + 4.25% | 1,289,171 | |||||||||
| 507,405 | Trinseo Materials Operating SCA‡ 7.939%, 05/03/28 1 mo. SOFR + 2.50% | 405,259 | |||||||||
| 1,073,150 | W.R. Grace & Co.-Conn.‡ 9.402%, 09/22/28 3 mo. SOFR + 3.75% | 1,055,711 | |||||||||
5,819,832 | |||||||||||
Special Purpose Acquisition Companies (0.4%) | |||||||||||
| 523,375 | Clydesdale Acquisition Holdings, Inc.‡ 9.599%, 04/13/29 1 mo. SOFR + 4.18% | 507,566 | |||||||||
| 261,025 | Fertitta Entertainment, LLC‡ 9.324%, 01/27/29 1 mo. SOFR + 4.00% | 255,666 | |||||||||
| 1,118,700 | Oscar AcquisitionCo, LLC‡ 9.990%, 04/29/29 3 mo. SOFR + 4.50% | 1,091,549 | |||||||||
| 1,049,400 | Patagonia Holdco, LLC‡ 11.117%, 08/01/29 3 mo. SOFR + 5.75% | 910,355 | |||||||||
2,765,136 | |||||||||||
| TOTAL BANK LOANS(Cost $52,602,913) | 50,660,601 | ||||||||||
See accompanying Notes to Schedule of Investments
CALAMOS CLOSED-END FAMILY OF FUNDS ANNUAL REPORT
136
Convertible and High Income Fund Schedule of Investments October 31, 2023
| NUMBER OF SHARES | VALUE | ||||||||||
COMMON STOCKS (0.5%) | |||||||||||
Communication Services (0.0%) | |||||||||||
| 21,970 | Altice USA, Inc. - Class A | $ | 63,493 | ||||||||
| 7,383 | Cumulus Media, Inc. - Class A | 33,297 | |||||||||
96,790 | |||||||||||
Energy (0.5%) | |||||||||||
| 10,051 | Chaparral Energy, Inc. - Class A | 447,270 | |||||||||
| 3,106 | Chesapeake Energy Corp. | 267,365 | |||||||||
| 72,575 | Energy Transfer, LP | 954,361 | |||||||||
| 43,085 | Enterprise Products Partners, LP | 1,121,933 | |||||||||
| 7,238 | Ep Energy Corp. | 19,000 | |||||||||
| 9,267 | ONEOK, Inc. | 604,208 | |||||||||
3,414,137 | |||||||||||
Special Purpose Acquisition Company (0.0%) | |||||||||||
| 12,300 | Intelsat Emergence, SA | 292,125 | |||||||||
| TOTAL COMMON STOCKS(Cost $5,871,167) | 3,803,052 | ||||||||||
CONVERTIBLE PREFERRED STOCKS (4.8%) | |||||||||||
Energy (0.0%) | |||||||||||
| 29 | Gulfport Energy Corp. 10.000%, 12/01/23 15.000% PIK rate | 257,375 | |||||||||
Financials (1.9%) | |||||||||||
| 89,885 | Apollo Global Management, Inc. 6.750%, 07/31/26 | 4,324,367 | |||||||||
| 8,775 | Bank of America Corp.‡‡ 7.250% | 9,241,830 | |||||||||
13,566,197 | |||||||||||
Industrials (0.6%) | |||||||||||
| 81,495 | Chart Industries, Inc. 6.750%, 12/15/25 | 4,006,294 | |||||||||
Utilities (2.3%) | |||||||||||
| 154,145 | AES Corp. 6.875%, 02/15/24 | 9,291,861 | |||||||||
| 194,000 | NextEra Energy, Inc.^ 6.926%, 09/01/25 | 7,282,760 | |||||||||
16,574,621 | |||||||||||
| TOTAL CONVERTIBLE PREFERRED STOCKS(Cost $46,338,803) | 34,404,487 | ||||||||||
PREFERRED STOCKS (0.5%) | |||||||||||
Communication Services (0.1%) | |||||||||||
| 12,900 | United States Cellular Corp.µ 5.500%, 06/01/70 | 188,598 | |||||||||
| 12,370 | 5.500%, 03/01/70 | 183,818 | |||||||||
372,416 | |||||||||||
Consumer Discretionary (0.1%) | |||||||||||
| 6,662 | Guitar Center, Inc.& | 702,841 | |||||||||
| NUMBER OF SHARES | VALUE | ||||||||||
Energy (0.3%) | |||||||||||
| 32,380 | NuStar Energy, LP‡ 11.315%, 11/30/23 3 mo. LIBOR + 5.64% | $ | 812,738 | ||||||||
| 7,920 | NuStar Energy, LP‡ 12.438%, 11/30/23 3 mo. LIBOR + 6.77% | 201,723 | |||||||||
| 47,000 | NuStar Logistics, LP‡ 12.390%, 01/15/43 3 mo. LIBOR + 6.73% | 1,221,060 | |||||||||
2,235,521 | |||||||||||
| TOTAL PREFERRED STOCKS(Cost $3,419,819) | 3,310,778 | ||||||||||
RIGHTS (0.0%) # | |||||||||||
Communication Services (0.0%) | |||||||||||
| 2 | Intelsat Jackson Holdings, SA, (Expires 12/5/25) | — | |||||||||
| 2 | Intelsat Jackson Holdings, SA, (Expires 12/5/25) | — | |||||||||
| TOTAL RIGHTS(Cost $—) | — | ||||||||||
WARRANTS (0.0%) # | |||||||||||
Energy (0.0%) | |||||||||||
| 52,447 | Mcdermott International, Ltd.& 06/30/27, Strike $15.98 | 5 | |||||||||
| 47,202 | Mcdermott International, Ltd. 06/30/27, Strike $12.33 | 5 | |||||||||
| TOTAL WARRANTS(Cost $20,125) | 10 | ||||||||||
| NUMBER OF CONTRACTS/ NOTIONAL AMOUNT | VALUE | ||||||||||
PURCHASED OPTIONS (0.2%)# | |||||||||||
Information Technology (0.1%) | |||||||||||
| 320 | Palo Alto Networks, Inc. | ||||||||||
| 7,776,640 | Call, 01/19/24, Strike $250.00 | 502,400 | |||||||||
Consumer Discretionary (0.1%) | |||||||||||
| 625 | Amazon.com, Inc. | ||||||||||
| 8,318,125 | Call, 01/19/24, Strike $127.50 | 759,375 | |||||||||
| TOTAL PURCHASED OPTIONS(Cost $1,693,766) | 1,261,775 | ||||||||||
| TOTAL INVESTMENTS (163.4%)(Cost $1,348,351,607) | 1,184,187,933 | ||||||||||
| MANDATORY REDEEMABLE PREFERRED SHARES, AT LIQUIDATION VALUE (-20.0%) | (145,000,000 | ) | |||||||||
LIABILITIES, LESS OTHER ASSETS (-43.4%) | (314,367,165 | ) | |||||||||
NET ASSETS (100.0%) | $ | 724,820,768 | |||||||||
See accompanying Notes to Schedule of Investments
www.calamos.com
137
Convertible and High Income Fund Schedule of Investments October 31, 2023
NOTES TO SCHEDULE OF INVESTMENTS
* Securities issued and sold pursuant to a Rule 144A transaction are exempted from the registration requirement of the Securities Act of 1933, as amended. These securities may only be sold to qualified institutional buyers ("QIBs"), such as the Fund. Any resale of these securities must generally be effected through a sale that is registered under the Act or otherwise exempted from such registration requirements.
µ Security, or portion of security, is held in a segregated account as collateral for note payable aggregating a total value of $514,095,046.
^ Security, or portion of security, is on loan.
@ In default status and considered non-income producing.
& Illiquid security.
‡ Variable rate security. The rate shown is the rate in effect at October 31, 2023.
~ Security, or portion of security, is segregated as collateral (or collateral for potential future transactions) for written options. The aggregate value of such securities is $1,976,587.
¡ Bank loans generally are subject to mandatory and/or optional prepayment. As a result, the actual remaining maturity of bank loans may be substantially less than the stated maturities shown.
! This position represents an unsettled loan commitment at period end. Certain details associated with this purchase are not known prior to the settlement date, including coupon rate, which will be adjusted on settlement date.
‡‡ Perpetual maturity.
Note: The date on options represents the expiration date of the option contract. The option contract may be exercised at any date on or before the date shown.
The following table summarizes the Fund's investments and derivative financial instruments categorized in the fair value hierarchy as of October 31, 2023 (see Note 1):
LEVEL 1 | LEVEL 2 | LEVEL 3 | TOTAL | ||||||||||||||||
Assets: | |||||||||||||||||||
Corporate Bonds | $ | — | $ | 320,623,240 | $ | — | $ | 320,623,240 | |||||||||||
Convertible Bonds | — | 769,370,974 | — | 769,370,974 | |||||||||||||||
Bank Loans | — | 50,660,601 | — | 50,660,601 | |||||||||||||||
Asset Backed Securities | — | 753,016 | — | 753,016 | |||||||||||||||
Convertible Preferred Stocks | 34,147,112 | 257,375 | — | 34,404,487 | |||||||||||||||
Common Stocks | 3,044,657 | 758,395 | — | 3,803,052 | |||||||||||||||
Warrants | — | 10 | — | 10 | |||||||||||||||
Preferred Stocks | 2,419,339 | 891,439 | — | 3,310,778 | |||||||||||||||
Purchased Options | 1,261,775 | — | — | 1,261,775 | |||||||||||||||
Total | $ | 40,872,883 | $ | 1,143,315,050 | $ | — | $ | 1,184,187,933 | |||||||||||
See accompanying Notes to Schedule of Investments
CALAMOS CLOSED-END FAMILY OF FUNDS ANNUAL REPORT
138
Strategic Total Return Fund Schedule of Investments October 31, 2023
| PRINCIPAL AMOUNT | VALUE | ||||||||||
ASSET BACKED SECURITY (0.0%) | |||||||||||
Other (0.0%) | |||||||||||
955,000 | SVC ABS, LLC Series 2023-1A, Class C* 6.700%, 02/20/53 (Cost $878,626) | $ | 846,036 | ||||||||
CORPORATE BONDS (18.1%) | |||||||||||
Airlines (0.3%) | |||||||||||
199,333 | Air Canada Pass Through Trust Series 2015-2, Class B* 5.000%, 06/15/25 | 198,346 | |||||||||
1,070,769 | Alaska Airlines Pass Through Trust Series 2020-1, Class A* 4.800%, 02/15/29 | 1,003,653 | |||||||||
511,510 | Alaska Airlines Pass Through Trust Series 2020-1, Class B* 8.000%, 02/15/27 | 510,564 | |||||||||
1,299,480 | American Airlines Pass Through Trust Series 2021-1, Class B 3.950%, 01/11/32 | 1,108,314 | |||||||||
736,667 | American Airlines, Inc. / AAdvantage Loyalty IP, Ltd.* 5.500%, 04/20/26 | 716,629 | |||||||||
295,000 | 5.750%, 04/20/29 | 266,264 | |||||||||
1,200,476 | British Airways Pass Through Trust Series 2021-1, Class B* 3.900%, 03/15/33 | 1,043,093 | |||||||||
1,281,692 | JetBlue Pass Through Trust Series 2020-1, Class B 7.750%, 05/15/30 | 1,274,348 | |||||||||
835,000 | Spirit Loyalty Cayman, Ltd. / Spirit IP Cayman, Ltd.* 8.000%, 09/20/25 | 620,063 | |||||||||
6,741,274 | |||||||||||
Communication Services (2.0%) | |||||||||||
700,000 | Altice France Holding, SA* 10.500%, 05/15/27 | 385,924 | |||||||||
1,400,000 | Altice France, SA* 5.500%, 10/15/29 | 969,542 | |||||||||
1,415,000 | APi Group DE, Inc.* 4.750%, 10/15/29 | 1,220,183 | |||||||||
1,739,000 | Arrow Bidco, LLC* 9.500%, 03/15/24 | 1,762,268 | |||||||||
1,270,000 | Ashtead Capital, Inc.* 2.450%, 08/12/31 | 936,854 | |||||||||
1,479,000 | Audacy Capital Corp.* 6.750%, 03/31/29 | 24,034 | |||||||||
538,000 | 6.500%, 05/01/27 | 8,070 | |||||||||
1,070,000 | Cincinnati Bell Telephone Company, LLC 6.300%, 12/01/28 | 865,876 | |||||||||
1,190,000 | Clear Channel Outdoor Holdings, Inc.* 9.000%, 09/15/28 | 1,160,428 | |||||||||
| PRINCIPAL AMOUNT | VALUE | ||||||||||
1,815,000 | Consolidated Communications, Inc.*^ 6.500%, 10/01/28 | $ | 1,440,511 | ||||||||
1,940,000 | CSC Holdings, LLC* 5.500%, 04/15/27 | 1,621,685 | |||||||||
1,800,000 | 5.375%, 02/01/28 | 1,435,284 | |||||||||
1,800,000 | 4.625%, 12/01/30 | 914,310 | |||||||||
1,395,000 | 4.500%, 11/15/31 | 922,848 | |||||||||
1,250,000 | 5.750%, 01/15/30 | 658,937 | |||||||||
825,000 | Diamond Sports Group, LLC / Diamond Sports Finance Company*@ 6.625%, 08/15/27 | 10,461 | |||||||||
656,000 | 5.375%, 08/15/26 | 8,042 | |||||||||
2,933,000 | Directv Financing, LLC / Directv Financing Co-Obligor, Inc.* 5.875%, 08/15/27 | 2,570,481 | |||||||||
1,210,000 | Frontier California, Inc. 6.750%, 05/15/27 | 1,117,217 | |||||||||
749,000 | Frontier Communications Holdings, LLC* 5.000%, 05/01/28 | 650,050 | |||||||||
298,000 | 8.750%, 05/15/30 | 284,271 | |||||||||
1,333,000 | Frontier Florida, LLC@ 6.860%, 02/01/28 | 1,227,106 | |||||||||
1,785,000 | Frontier North, Inc.@ 6.730%, 02/15/28 | 1,655,891 | |||||||||
1,030,000 | Go Daddy Operating Company, LLC / GD Finance Company, Inc.* 3.500%, 03/01/29 | 870,546 | |||||||||
301,000 | 5.250%, 12/01/27 | 284,617 | |||||||||
450,000 | iHeartCommunications, Inc. 8.375%, 05/01/27^ | 276,192 | |||||||||
450,000 | 5.250%, 08/15/27* | 330,309 | |||||||||
900,000 | Intelsat Jackson Holdings, SA@& 9.750%, 07/15/25* | 1 | |||||||||
585,000 | 5.500%, 08/01/23 | 1 | |||||||||
1,480,000 | LCPR Senior Secured Financing DAC* 6.750%, 10/15/27 | 1,341,058 | |||||||||
875,638 | Ligado Networks, LLC* 15.500%, 11/01/23 PIK rate | 220,713 | |||||||||
900,000 | Lumen Technologies, Inc. 7.600%, 09/15/39 | 244,926 | |||||||||
600,000 | 4.000%, 02/15/27*^ | 410,238 | |||||||||
300,000 | 7.650%, 03/15/42 | 80,802 | |||||||||
596,000 | Match Group Holdings II, LLC* 3.625%, 10/01/31 | 461,459 | |||||||||
1,000,000 | Nexstar Media, Inc.* 5.625%, 07/15/27 | 900,480 | |||||||||
1,765,000 | Paramount Global 4.900%, 08/15/44 | 1,111,844 | |||||||||
286,000 | 6.375%, 03/30/62‡ 5 year CMT + 4.00% | 209,769 | |||||||||
419,000 | Qwest Corp. 7.250%, 09/15/25 | 402,366 | |||||||||
See accompanying Notes to Schedule of Investments
www.calamos.com
139
Strategic Total Return Fund Schedule of Investments October 31, 2023
| PRINCIPAL AMOUNT | VALUE | ||||||||||
235,000 | Rogers Communications, Inc.*‡ 5.250%, 03/15/82 5 year CMT + 3.59% | $ | 207,176 | ||||||||
591,000 | Scripps Escrow II, Inc.* 3.875%, 01/15/29 | 448,912 | |||||||||
295,000 | 5.375%, 01/15/31 | 183,310 | |||||||||
985,000 | Scripps Escrow, Inc.* 5.875%, 07/15/27 | 737,332 | |||||||||
1,500,000 | Sirius XM Radio, Inc.* 5.500%, 07/01/29 | 1,330,410 | |||||||||
1,185,000 | 4.000%, 07/15/28 | 1,008,222 | |||||||||
585,000 | 3.125%, 09/01/26 | 525,617 | |||||||||
298,000 | 3.875%, 09/01/31 | 224,462 | |||||||||
1,084,000 | Spanish Broadcasting System, Inc.* 9.750%, 03/01/26 | 675,538 | |||||||||
3,045,000 | Sprint, LLC 7.125%, 06/15/24 | 3,062,326 | |||||||||
1,350,000 | Stagwell Global, LLC* 5.625%, 08/15/29 | 1,116,936 | |||||||||
880,000 | Telecom Italia Capital, SA 6.000%, 09/30/34 | 724,838 | |||||||||
1,196,000 | Telesat Canada / Telesat, LLC* 4.875%, 06/01/27 | 716,117 | |||||||||
480,000 | Time Warner Cable, LLC 7.300%, 07/01/38 | 449,597 | |||||||||
1,356,000 | United States Cellular Corp.^ 6.700%, 12/15/33 | 1,291,387 | |||||||||
450,000 | Univision Communications, Inc.* 8.000%, 08/15/28 | 426,474 | |||||||||
600,000 | Viasat, Inc.* 5.625%, 04/15/27 | 524,964 | |||||||||
125,000 | Vodafone Group, PLC‡ 7.000%, 04/04/79 U.S. 5 yr Swap + 4.87% | 121,101 | |||||||||
42,770,313 | |||||||||||
Consumer Discretionary (3.7%) | |||||||||||
1,435,000 | Abercrombie & Fitch Management Company* 8.750%, 07/15/25 | 1,458,936 | |||||||||
1,200,000 | Adams Homes, Inc.* 9.250%, 10/15/28 | 1,177,920 | |||||||||
1,505,000 | Adient Global Holdings Company* 8.250%, 04/15/31 | 1,472,733 | |||||||||
943,000 | American Axle & Manufacturing, Inc. 6.875%, 07/01/28 | 840,458 | |||||||||
1,043,000 | Ashton Woods USA, LLC / Ashton Woods Finance Company* 4.625%, 08/01/29 | 847,698 | |||||||||
856,000 | 6.625%, 01/15/28 | 785,628 | |||||||||
1,487,000 | At Home Group, Inc.* 4.875%, 07/15/28 | 516,733 | |||||||||
1,577,000 | Bath & Body Works, Inc. 6.694%, 01/15/27 | 1,528,318 | |||||||||
1,475,000 | 6.875%, 11/01/35 | 1,303,738 | |||||||||
| PRINCIPAL AMOUNT | VALUE | ||||||||||
800,000 | Benteler International AG*^ 10.500%, 05/15/28 | $ | 808,904 | ||||||||
728,000 | Caesars Entertainment, Inc.*^ 4.625%, 10/15/29 | 599,355 | |||||||||
605,000 | 8.125%, 07/01/27 | 599,761 | |||||||||
1,275,000 | Carnival Corp.* 6.000%, 05/01/29 | 1,078,344 | |||||||||
601,000 | 4.000%, 08/01/28 | 523,609 | |||||||||
596,000 | 7.625%, 03/01/26^ | 579,854 | |||||||||
75,000 | 7.000%, 08/15/29 | 73,681 | |||||||||
1,385,000 | Carriage Services, Inc.* 4.250%, 05/15/29 | 1,134,218 | |||||||||
242,000 | Carvana Company* 14.000%, 06/01/31 | 182,129 | |||||||||
205,000 | 13.000%, 06/01/30 | 153,844 | |||||||||
136,000 | 12.000%, 12/01/28 | 101,855 | |||||||||
2,610,000 | CCO Holdings, LLC / CCO Holdings Capital Corp.* 5.125%, 05/01/27 | 2,404,854 | |||||||||
2,110,000 | 4.500%, 08/15/30 | 1,695,849 | |||||||||
1,370,000 | 6.375%, 09/01/29 | 1,259,578 | |||||||||
1,300,000 | 4.750%, 03/01/30 | 1,073,904 | |||||||||
1,198,000 | 4.250%, 02/01/31 | 933,410 | |||||||||
620,000 | 5.000%, 02/01/28 | 555,458 | |||||||||
596,000 | 4.750%, 02/01/32 | 465,887 | |||||||||
596,000 | CDI Escrow Issuer, Inc.* 5.750%, 04/01/30 | 534,099 | |||||||||
900,000 | Cedar Fair, LP 5.250%, 07/15/29 | 778,401 | |||||||||
600,000 | Churchill Downs, Inc.* 6.750%, 05/01/31 | 560,970 | |||||||||
985,000 | Dana, Inc. 4.250%, 09/01/30 | 783,774 | |||||||||
896,000 | 4.500%, 02/15/32 | 702,267 | |||||||||
1,495,000 | DISH DBS Corp. 5.250%, 12/01/26* | 1,209,410 | |||||||||
926,000 | 7.750%, 07/01/26 | 621,374 | |||||||||
739,000 | 7.375%, 07/01/28 | 416,648 | |||||||||
590,000 | 5.125%, 06/01/29 | 304,475 | |||||||||
1,200,000 | DISH Network Corp.* 11.750%, 11/15/27 | 1,189,620 | |||||||||
1,675,000 | Empire Resorts, Inc.* 7.750%, 11/01/26 | 1,371,708 | |||||||||
1,308,000 | Everi Holdings, Inc.* 5.000%, 07/15/29 | 1,100,237 | |||||||||
1,240,000 | Ford Motor Company^ 6.100%, 08/19/32 | 1,147,992 | |||||||||
1,885,000 | Ford Motor Credit Company, LLC 4.000%, 11/13/30 | 1,554,333 | |||||||||
1,555,000 | 7.200%, 06/10/30 | 1,553,243 | |||||||||
1,450,000 | 5.113%, 05/03/29 | 1,316,919 | |||||||||
1,100,000 | 7.350%, 11/04/27 | 1,114,344 | |||||||||
1,000,000 | 2.900%, 02/16/28 | 851,570 | |||||||||
525,000 | 7.350%, 03/06/30 | 528,224 | |||||||||
300,000 | 4.950%, 05/28/27 | 281,553 | |||||||||
See accompanying Notes to Schedule of Investments
CALAMOS CLOSED-END FAMILY OF FUNDS ANNUAL REPORT
140
Strategic Total Return Fund Schedule of Investments October 31, 2023
| PRINCIPAL AMOUNT | VALUE | ||||||||||
447,000 | Gap, Inc.* 3.875%, 10/01/31 | $ | 322,479 | ||||||||
600,000 | General Motors Company 5.200%, 04/01/45 | 444,750 | |||||||||
310,000 | General Motors Financial Company, Inc.‡ 5.700%, 11/01/35^ 5 year CMT + 5.00% | 262,294 | |||||||||
155,000 | 6.500%, 11/01/35 3 mo. LIBOR + 3.44% | 127,457 | |||||||||
2,050,000 | goeasy, Ltd.* 5.375%, 12/01/24 | 2,014,884 | |||||||||
1,111,000 | 4.375%, 05/01/26 | 1,007,066 | |||||||||
635,000 | Goodyear Tire & Rubber Company^ 5.250%, 07/15/31 | 517,919 | |||||||||
511,000 | Group 1 Automotive, Inc.* 4.000%, 08/15/28 | 441,668 | |||||||||
1,280,000 | Guitar Center, Inc.*^ 8.500%, 01/15/26 | 1,081,818 | |||||||||
915,000 | International Game Technology, PLC* 6.250%, 01/15/27 | 892,793 | |||||||||
358,991 | JetBlue Pass Through Trust Series 2019-2, Class B 8.000%, 11/15/27 | 361,396 | |||||||||
1,045,000 | Kohl's Corp. 5.550%, 07/17/45 | 604,177 | |||||||||
1,200,000 | LCM Investments Holdings II, LLC* 8.250%, 08/01/31 | 1,150,116 | |||||||||
1,175,000 | Liberty Interactive, LLC 8.250%, 02/01/30 | 309,554 | |||||||||
1,159,000 | Life Time, Inc.* 8.000%, 04/15/26 | 1,132,702 | |||||||||
600,000 | 5.750%, 01/15/26 | 581,916 | |||||||||
600,000 | Light & Wonder International, Inc.* 7.500%, 09/01/31 | 586,860 | |||||||||
450,000 | Lindblad Expeditions Holdings, Inc.* 9.000%, 05/15/28 | 441,135 | |||||||||
767,000 | Lindblad Expeditions, LLC* 6.750%, 02/15/27 | 697,418 | |||||||||
780,000 | M/I Homes, Inc. 3.950%, 02/15/30 | 624,148 | |||||||||
1,992,000 | Macy's Retail Holdings, LLC 6.700%, 07/15/34* | 1,535,972 | |||||||||
600,000 | 4.300%, 02/15/43 | 329,244 | |||||||||
1,375,000 | Mclaren Finance, PLC* 7.500%, 08/01/26 | 1,187,106 | |||||||||
1,518,000 | Midwest Gaming Borrower, LLC / Midwest Gaming Finance Corp.* 4.875%, 05/01/29 | 1,267,181 | |||||||||
725,000 | Newell Brands, Inc. 5.200%, 04/01/26 | 684,813 | |||||||||
600,000 | Nordstrom, Inc. 5.000%, 01/15/44 | 361,314 | |||||||||
551,000 | 4.250%, 08/01/31 | 403,949 | |||||||||
| PRINCIPAL AMOUNT | VALUE | ||||||||||
1,370,000 | PENN Entertainment, Inc.*^ 4.125%, 07/01/29 | $ | 1,065,394 | ||||||||
750,000 | PetSmart, Inc. / PetSmart Finance Corp.* 7.750%, 02/15/29 | 691,695 | |||||||||
375,000 | 4.750%, 02/15/28 | 332,111 | |||||||||
1,670,000 | Premier Entertainment Sub, LLC / Premier Entertainment Finance Corp.*^ 5.625%, 09/01/29 | 1,175,329 | |||||||||
2,933,000 | Rite Aid Corp.*@ 8.000%, 11/15/26 | 2,039,579 | |||||||||
600,000 | Royal Caribbean Cruises, Ltd.* 7.250%, 01/15/30 | 593,568 | |||||||||
1,670,000 | Simmons Foods, Inc. / Simmons Prepared Foods, Inc. / Simmons Pet Food, Inc. / Simmons Feed* 4.625%, 03/01/29 | 1,358,011 | |||||||||
2,400,000 | Six Flags Entertainment Corp.* 7.250%, 05/15/31 | 2,210,904 | |||||||||
1,348,000 | Sonic Automotive, Inc.*^ 4.625%, 11/15/29 | 1,124,124 | |||||||||
837,000 | Speedway Motorsports, LLC / Speedway Funding II, Inc.* 4.875%, 11/01/27 | 749,559 | |||||||||
2,430,000 | Station Casinos, LLC* 4.500%, 02/15/28 | 2,101,002 | |||||||||
707,000 | Taylor Morrison Communities, Inc.* 5.750%, 01/15/28 | 644,013 | |||||||||
300,000 | Viking Cruises, Ltd.* 9.125%, 07/15/31 | 295,140 | |||||||||
1,355,000 | Vista Outdoor, Inc.* 4.500%, 03/15/29 | 1,262,318 | |||||||||
600,000 | Windsor Holdings III, LLC* 8.500%, 06/15/30 | 589,020 | |||||||||
1,200,000 | ZF North America Capital, Inc.* 7.125%, 04/14/30 | 1,167,960 | |||||||||
400,000 | 6.875%, 04/14/28 | 388,860 | |||||||||
79,238,533 | |||||||||||
Consumer Staples (0.7%) | |||||||||||
1,335,000 | 1375209 B.C., Ltd.* 9.000%, 01/30/28 | 1,297,914 | |||||||||
1,210,000 | B&G Foods, Inc.* 8.000%, 09/15/28 | 1,181,250 | |||||||||
1,358,000 | Central Garden & Pet Company* 4.125%, 04/30/31 | 1,085,381 | |||||||||
1,349,000 | Edgewell Personal Care Company* 4.125%, 04/01/29 | 1,134,415 | |||||||||
1,641,000 | Energizer Holdings, Inc.* 4.375%, 03/31/29 | 1,351,101 | |||||||||
298,000 | 6.500%, 12/31/27 | 279,977 | |||||||||
1,770,000 | JBS USA LUX, SA / JBS USA Food Company / JBS USA Finance, Inc. 5.500%, 01/15/30 | 1,619,426 | |||||||||
740,000 | 5.125%, 02/01/28 | 695,001 | |||||||||
440,000 | 5.750%, 04/01/33 | 387,407 | |||||||||
See accompanying Notes to Schedule of Investments
www.calamos.com
141
Strategic Total Return Fund Schedule of Investments October 31, 2023
| PRINCIPAL AMOUNT | VALUE | ||||||||||
125,000 | Land O' Lakes, Inc.* 7.000%, 11/01/67 | $ | 94,125 | ||||||||
751,000 | New Albertsons, LP 7.750%, 06/15/26 | 759,359 | |||||||||
1,192,000 | Performance Food Group, Inc.* 4.250%, 08/01/29 | 1,011,472 | |||||||||
900,000 | Pilgrim's Pride Corp. 4.250%, 04/15/31 | 743,607 | |||||||||
505,000 | Post Holdings, Inc.* 5.750%, 03/01/27 | 482,169 | |||||||||
1,124,000 | Prestige Brands, Inc.* 3.750%, 04/01/31 | 896,030 | |||||||||
1,015,000 | United Natural Foods, Inc.* 6.750%, 10/15/28 | 794,308 | |||||||||
1,857,000 | Vector Group, Ltd.* 5.750%, 02/01/29 | 1,576,834 | |||||||||
600,000 | Williams Scotsman, Inc.* 7.375%, 10/01/31 | 592,458 | |||||||||
15,982,234 | |||||||||||
Energy (2.3%) | |||||||||||
1,198,000 | Antero Resources Corp.* 5.375%, 03/01/30 | 1,095,020 | |||||||||
1,187,000 | Apache Corp. 5.100%, 09/01/40 | 924,174 | |||||||||
900,000 | Buckeye Partners, LP 3.950%, 12/01/26 | 821,421 | |||||||||
600,000 | 5.850%, 11/15/43 | 424,956 | |||||||||
1,670,000 | Callon Petroleum Company*^ 7.500%, 06/15/30 | 1,618,865 | |||||||||
591,000 | Cheniere Energy, Inc. 4.625%, 10/15/28 | 540,292 | |||||||||
892,000 | Chesapeake Energy Corp.* 6.750%, 04/15/29 | 875,257 | |||||||||
1,688,000 | Civitas Resources, Inc.* 8.750%, 07/01/31 | 1,705,741 | |||||||||
900,000 | Continental Resources, Inc.* 2.875%, 04/01/32 | 666,711 | |||||||||
610,000 | 5.750%, 01/15/31 | 566,263 | |||||||||
921,000 | DT Midstream, Inc.* 4.125%, 06/15/29 | 793,128 | |||||||||
1,176,000 | Earthstone Energy Holdings, LLC* 8.000%, 04/15/27 | 1,193,840 | |||||||||
450,000 | 9.875%, 07/15/31 | 485,600 | |||||||||
1,036,000 | Enbridge, Inc.‡ 7.375%, 01/15/83 5 year CMT + 3.71% | 964,071 | |||||||||
395,000 | 5.750%, 07/15/80 5 year CMT + 5.31% | 329,438 | |||||||||
1,735,000 | Energy Transfer, LP‡ 8.656%, 11/01/66 3 mo. SOFR + 3.28% | 1,418,536 | |||||||||
1,015,000 | 6.500%, 11/01/35 5 year CMT + 5.69% | 922,381 | |||||||||
| PRINCIPAL AMOUNT | VALUE | ||||||||||
1,775,000 | EnLink Midstream Partners, LP 9.780%, 11/01/35‡ 3 mo. LIBOR + 4.11% | $ | 1,585,093 | ||||||||
1,285,000 | 4.850%, 07/15/26 | 1,215,006 | |||||||||
745,000 | Enlink Midstream, LLC* 6.500%, 09/01/30 | 716,273 | |||||||||
80,000 | Enterprise Products Operating, LLC‡ 5.250%, 08/16/77 3 mo. SOFR + 3.29% | 68,894 | |||||||||
75,000 | 8.619%, 08/16/77 3 mo. LIBOR + 2.99% | 73,505 | |||||||||
1,970,000 | EQM Midstream Partners, LP* 7.500%, 06/01/27 | 1,958,495 | |||||||||
885,000 | Genesis Energy, LP / Genesis Energy Finance Corp. 8.875%, 04/15/30 | 860,512 | |||||||||
543,000 | 6.250%, 05/15/26 | 518,380 | |||||||||
1,190,000 | Gulfport Energy Corp. 8.000%, 05/17/26* | 1,190,500 | |||||||||
1,000,000 | 6.375%, 05/15/25@& | 1 | |||||||||
305,622 | 8.000%, 05/17/26 | 305,750 | |||||||||
1,670,000 | Hilcorp Energy I, LP / Hilcorp Finance Company* 6.000%, 04/15/30 | 1,484,914 | |||||||||
894,000 | Howard Midstream Energy Partners, LLC* 6.750%, 01/15/27 | 850,212 | |||||||||
1,162,000 | Magnolia Oil & Gas Operating, LLC / Magnolia Oil & Gas Finance Corp.* 6.000%, 08/01/26 | 1,111,778 | |||||||||
600,000 | Moss Creek Resources Holdings, Inc.* 10.500%, 05/15/27 | 593,844 | |||||||||
540,000 | 7.500%, 01/15/26 | 516,920 | |||||||||
900,000 | Nabors Industries, Inc.* 7.375%, 05/15/27 | 842,796 | |||||||||
900,000 | Nabors Industries, Ltd.* 7.500%, 01/15/28 | 795,276 | |||||||||
1,191,000 | New Fortress Energy, Inc.* 6.750%, 09/15/25 | 1,108,392 | |||||||||
589,000 | 6.500%, 09/30/26 | 528,033 | |||||||||
600,000 | Oceaneering International, Inc.* 6.000%, 02/01/28 | 550,218 | |||||||||
1,270,000 | Parkland Corp.*~ 5.875%, 07/15/27 | 1,221,296 | |||||||||
633,000 | Patterson-UTI Energy, Inc. 5.150%, 11/15/29 | 565,497 | |||||||||
300,000 | Permian Resources Operating LLC* 7.000%, 01/15/32 | 293,550 | |||||||||
1,390,000 | Plains All American Pipeline, LP‡ 9.736%, 11/01/35 3 mo. LIBOR + 4.11% | 1,312,077 | |||||||||
1,670,000 | Rockcliff Energy II, LLC* 5.500%, 10/15/29 | 1,515,792 | |||||||||
600,000 | Southwestern Energy Company 5.375%, 02/01/29 | 555,858 | |||||||||
593,000 | 4.750%, 02/01/32 | 510,549 | |||||||||
See accompanying Notes to Schedule of Investments
CALAMOS CLOSED-END FAMILY OF FUNDS ANNUAL REPORT
142
Strategic Total Return Fund Schedule of Investments October 31, 2023
| PRINCIPAL AMOUNT | VALUE | ||||||||||
298,000 | Sunoco, LP / Sunoco Finance Corp. 4.500%, 04/30/30 | $ | 256,402 | ||||||||
1,716,650 | Transocean, Inc.* 8.750%, 02/15/30 | 1,715,260 | |||||||||
750,000 | Venture Global Calcasieu Pass, LLC* 6.250%, 01/15/30 | 708,015 | |||||||||
300,000 | 4.125%, 08/15/31 | 242,517 | |||||||||
300,000 | 3.875%, 08/15/29 | 251,295 | |||||||||
1,505,000 | Venture Global LNG, Inc.* 8.375%, 06/01/31 | 1,437,275 | |||||||||
900,000 | 8.125%, 06/01/28 | 874,458 | |||||||||
600,000 | 9.875%, 02/01/32 | 608,922 | |||||||||
300,000 | 9.500%, 02/01/29 | 304,509 | |||||||||
1,134,000 | Vital Energy, Inc. 9.500%, 01/15/25 | 1,140,146 | |||||||||
685,000 | 7.750%, 07/31/29* | 619,103 | |||||||||
150,000 | 9.750%, 10/15/30 | 147,113 | |||||||||
1,200,000 | VOC Escrow, Ltd.* 5.000%, 02/15/28 | 1,082,484 | |||||||||
1,505,000 | Weatherford International, Ltd.* 8.625%, 04/30/30 | 1,523,090 | |||||||||
49,105,694 | |||||||||||
Financials (3.5%) | |||||||||||
1,883,000 | Acrisure, LLC / Acrisure Finance, Inc.* 7.000%, 11/15/25 | 1,829,372 | |||||||||
1,789,000 | Aethon United BR, LP / Aethon United Finance Corp.* 8.250%, 02/15/26 | 1,778,999 | |||||||||
1,771,000 | AG Issuer, LLC* 6.250%, 03/01/28 | 1,641,150 | |||||||||
255,000 | Aircastle, Ltd.*‡ 5.250%, 11/01/67 5 year CMT + 4.41% | 202,225 | |||||||||
2,100,000 | Alliant Holdings Intermediate, LLC / Alliant Holdings Co-Issuer* 6.750%, 10/15/27 | 1,918,308 | |||||||||
140,000 | Allstate Corp.‡ 8.564%, 08/15/53 3 mo. LIBOR + 2.94% | 138,229 | |||||||||
2,632,000 | Ally Financial, Inc. 4.700%, 11/01/35 7 year CMT + 3.48%‡ | 1,661,756 | |||||||||
489,000 | 8.000%, 11/01/31 | 478,178 | |||||||||
250,000 | American International Group, Inc.‡ 5.750%, 04/01/48 3 mo. LIBOR + 2.87% | 227,983 | |||||||||
2,365,000 | AmWINS Group, Inc.* 4.875%, 06/30/29 | 2,030,211 | |||||||||
460,000 | Ares Finance Company III, LLC*‡ 4.125%, 06/30/51 5 year CMT + 3.24% | 346,509 | |||||||||
1,307,000 | Aviation Capital Group, LLC* 3.500%, 11/01/27 | 1,148,775 | |||||||||
| PRINCIPAL AMOUNT | VALUE | ||||||||||
490,000 | Avolon Holdings Funding, Ltd.* 5.500%, 01/15/26 | $ | 472,291 | ||||||||
350,000 | AXIS Specialty Finance, LLC‡ 4.900%, 01/15/40 5 year CMT + 3.19% | 281,134 | |||||||||
439,000 | Bank of America Corp.‡ 6.125%, 11/01/35^ 5 year CMT + 3.23% | 414,644 | |||||||||
145,000 | 5.125%, 11/01/35 3 mo. SOFR + 3.55% 3 mo. LIBOR + 3.03% 3 mo. LIBOR + 3.03% | 141,619 | |||||||||
135,000 | 6.250%, 09/29/49 3 mo. SOFR + 3.97% | 133,060 | |||||||||
135,000 | 6.100%, 12/29/49 3 mo. SOFR + 4.16% | 130,426 | |||||||||
145,000 | Bank of Montreal‡ 4.800%, 11/01/35 5 year CMT + 2.98% | 129,749 | |||||||||
763,000 | Bank of New York Mellon Corp.^‡ 4.700%, 11/01/35 5 year CMT + 4.36% | 722,668 | |||||||||
240,000 | Bank of Nova Scotia‡ 3.625%, 10/27/81 5 year CMT + 2.61% | 169,109 | |||||||||
285,000 | BP Capital Markets, PLC‡ 4.375%, 11/01/35 5 year CMT + 4.04% | 271,434 | |||||||||
280,000 | 4.875%, 11/01/35 5 year CMT + 4.40% | 243,816 | |||||||||
2,379,000 | BroadStreet Partners, Inc.* 5.875%, 04/15/29 | 2,075,868 | |||||||||
1,135,000 | Brookfield Property REIT, Inc. / BPR Cumulus, LLC / BPR Nimbus, LLC / GGSI Sellco, LLC* 4.500%, 04/01/27 | 947,180 | |||||||||
747,000 | 5.750%, 05/15/26 | 685,111 | |||||||||
1,200,000 | Burford Capital Global Financial, LLC* 6.875%, 04/15/30 | 1,086,408 | |||||||||
458,000 | Capital One Financial Corp.^‡ 3.950%, 11/01/35 5 year CMT + 3.16% | 320,660 | |||||||||
285,000 | Charles Schwab Corp.‡ 5.375%, 11/01/35^ 5 year CMT + 4.97% | 272,212 | |||||||||
282,000 | 4.000%, 11/01/35 5 year CMT + 3.17% | 207,934 | |||||||||
509,000 | Citigroup, Inc.‡ 3.875%, 11/01/35 5 year CMT + 3.42% | 427,356 | |||||||||
166,000 | 4.150%, 11/01/35 5 year CMT + 3.00% | 129,505 | |||||||||
150,000 | 7.625%, 11/01/35 5 year CMT + 3.21 | 144,753 | |||||||||
150,000 | 4.000%, 11/01/35 5 year CMT + 3.60% | 129,062 | |||||||||
See accompanying Notes to Schedule of Investments
www.calamos.com
143
Strategic Total Return Fund Schedule of Investments October 31, 2023
| PRINCIPAL AMOUNT | VALUE | ||||||||||
140,000 | 5.950%, 12/29/49 3 mo. USD LIBOR + 3.91% | $ | 132,601 | ||||||||
450,000 | Citizens Financial Group, Inc.‡ 4.000%, 11/01/35 5 year CMT + 3.22% | 305,816 | |||||||||
155,000 | 5.650%, 11/01/35 5 year CMT + 5.31% | 134,450 | |||||||||
145,000 | Corebridge Financial, Inc.‡ 6.875%, 12/15/52 | 134,546 | |||||||||
1,500,000 | Credit Acceptance Corp. 6.625%, 03/15/26^ | 1,429,740 | |||||||||
1,092,000 | 5.125%, 12/31/24* | 1,057,285 | |||||||||
1,205,000 | Cushman & Wakefield U.S. Borrower LLC* 8.875%, 09/01/31 | 1,144,870 | |||||||||
250,000 | Depository Trust & Clearing Corp.*‡ 3.375%, 11/01/67 5 year CMT + 2.61 | 186,558 | |||||||||
275,000 | Discover Financial Services‡ 5.500%, 11/01/35 3 mo. SOFR + 3.34% | 185,163 | |||||||||
245,000 | 6.125%, 11/01/35 5 year CMT + 5.78% | 226,721 | |||||||||
1,533,000 | Enact Holdings, Inc.* 6.500%, 08/15/25 | 1,509,867 | |||||||||
265,000 | Enstar Finance, LLC‡ 5.500%, 01/15/42 5 year CMT + 4.01% | 212,024 | |||||||||
605,000 | Fifth Third Bancorp‡ 4.500%, 11/01/35 5 year CMT + 4.22% | 515,030 | |||||||||
70,000 | First Citizens BancShares, Inc.‡ 9.643%, 11/01/23 3 mo. SOFR + 4.23% | 71,438 | |||||||||
1,718,000 | Global Net Lease, Inc. / Global Net Lease Operating Partnership, LP* 3.750%, 12/15/27 | 1,304,855 | |||||||||
500,000 | Goldman Sachs Group, Inc.‡ 4.400%, 11/01/35 5 year CMT + 2.85% | 418,100 | |||||||||
153,000 | 4.125%, 11/01/35 5 year CMT + 2.95% | 121,644 | |||||||||
149,000 | 7.500%, 11/01/35 5 year CMT + 3.16% | 146,008 | |||||||||
1,250,000 | GTCR W-2 Merger Sub, LLC* 7.500%, 01/15/31 | 1,233,987 | |||||||||
1,785,000 | HUB International, Ltd.* 5.625%, 12/01/29 | 1,540,937 | |||||||||
912,000 | 7.000%, 05/01/26 | 889,510 | |||||||||
350,000 | Huntington Bancshares, Inc.‡ 4.450%, 11/01/35 7 year CMT + 4.05% | 262,059 | |||||||||
210,000 | 5.625%, 11/01/35 10 year CMT + 4.95% | 163,962 | |||||||||
892,000 | Icahn Enterprises, LP / Icahn Enterprises Finance Corp. 4.375%, 02/01/29 | 692,138 | |||||||||
| PRINCIPAL AMOUNT | VALUE | ||||||||||
1,913,000 | ILFC E-Capital Trust II*‡ 7.459%, 12/21/65 3 mo. LIBOR + 1.80% | $ | 1,438,901 | ||||||||
2,470,000 | Iron Mountain, Inc.* 5.250%, 03/15/28 | 2,263,063 | |||||||||
300,000 | 7.000%, 02/15/29 | 291,375 | |||||||||
3,000,000 | Jefferies Finance, LLC / JFIN Co-Issuer Corp.* 5.000%, 08/15/28 | 2,406,450 | |||||||||
1,100,000 | JPMorgan Chase & Company‡ 3.650%, 11/01/35^ 5 year CMT + 2.85% | 955,746 | |||||||||
135,000 | 6.125%, 12/31/49 3 mo. SOFR + 3.59% | 134,244 | |||||||||
180,000 | KeyCorp‡ 5.000%, 12/29/49 3 mo. SOFR + 3.87% | 120,715 | |||||||||
2,306,000 | Ladder Capital Finance Holdings, LLLP / Ladder Capital Finance Corp.* 5.250%, 10/01/25 | 2,198,540 | |||||||||
596,000 | 4.750%, 06/15/29 | 481,079 | |||||||||
1,080,000 | LD Holdings Group, LLC* 6.125%, 04/01/28 | 605,178 | |||||||||
1,250,000 | Level 3 Financing, Inc.* 4.250%, 07/01/28 | 707,863 | |||||||||
1,007,000 | 3.400%, 03/01/27^ | 937,013 | |||||||||
600,000 | 4.625%, 09/15/27 | 404,946 | |||||||||
420,000 | Liberty Mutual Group, Inc.*‡ 4.125%, 12/15/51 5 year CMT + 3.32% | 334,706 | |||||||||
892,000 | LPL Holdings, Inc.* 4.000%, 03/15/29 | 767,450 | |||||||||
145,000 | M&T Bank Corp.‡ 6.450%, 12/29/49 3 mo. LIBOR + 3.61 | 136,420 | |||||||||
85,000 | 5.125%, 12/29/49 3 mo. LIBOR + 3.52 | 64,501 | |||||||||
80,000 | 5.000%, 11/01/35 5 year CMT + 3.17 | 63,975 | |||||||||
1,200,000 | Macquarie Airfinance Holdings, Ltd.* 8.125%, 03/30/29 | 1,183,572 | |||||||||
280,000 | Markel Corp.‡ 6.000%, 11/01/35 5 year CMT + 5.66% | 269,864 | |||||||||
2,137,000 | MetLife, Inc. 6.400%, 12/15/66 | 2,007,690 | |||||||||
225,000 | 3.850%, 11/01/35‡ 5 year CMT + 3.58% | 204,642 | |||||||||
1,615,000 | Nationstar Mortgage Holdings, Inc.* 5.500%, 08/15/28 | 1,431,116 | |||||||||
1,305,000 | Navient Corp. 5.000%, 03/15/27 | 1,150,984 | |||||||||
655,000 | 4.875%, 03/15/28 | 543,434 | |||||||||
1,370,000 | Necessity Retail REIT, Inc. / American Finance Operating Partner, LP* 4.500%, 09/30/28 | 1,027,020 | |||||||||
See accompanying Notes to Schedule of Investments
CALAMOS CLOSED-END FAMILY OF FUNDS ANNUAL REPORT
144
Strategic Total Return Fund Schedule of Investments October 31, 2023
| PRINCIPAL AMOUNT | VALUE | ||||||||||
230,000 | Northern Trust Corp.‡ 4.600%, 11/01/23 3 mo. LIBOR + 3.20 | $ | 202,163 | ||||||||
900,000 | OneMain Finance Corp. 9.000%, 01/15/29 | 879,993 | |||||||||
820,000 | 3.875%, 09/15/28 | 653,056 | |||||||||
599,000 | 7.125%, 03/15/26 | 582,995 | |||||||||
592,000 | Park Intermediate Holdings, LLC / PK Domestic Property, LLC / PK Finance Co-Issuer* 5.875%, 10/01/28 | 534,606 | |||||||||
442,000 | PartnerRe Finance B, LLC‡ 4.500%, 10/01/50 5 year CMT + 3.82% | 364,022 | |||||||||
1,871,000 | PHH Mortgage Corp.* 7.875%, 03/15/26 | 1,622,550 | |||||||||
315,000 | PNC Financial Services Group, Inc.‡ 3.400%, 11/01/35 5 year CMT + 2.60% | 227,175 | |||||||||
140,000 | 6.200%, 11/01/35 5 year CMT + 3.24% | 125,105 | |||||||||
140,000 | 6.000%, 11/01/35 5 year CMT + 3.00% | 117,901 | |||||||||
275,000 | Progressive Corp.‡ 8.210%, 11/01/35 3 mo. USD LIBOR + 2.54% | 271,095 | |||||||||
280,000 | QBE Insurance Group, Ltd.*^‡ 5.875%, 11/01/67 5 year CMT + 5.51% | 267,910 | |||||||||
1,355,000 | RHP Hotel Properties, LP / RHP Finance Corp.* 4.500%, 02/15/29 | 1,155,070 | |||||||||
560,000 | Rocket Mortgage, LLC / Rocket Mortgage Co-Issuer, Inc.* 3.875%, 03/01/31 | 433,440 | |||||||||
555,000 | 3.625%, 03/01/29 | 451,770 | |||||||||
275,000 | 2.875%, 10/15/26 | 240,174 | |||||||||
1,225,000 | StoneX Group, Inc.* 8.625%, 06/15/25 | 1,232,338 | |||||||||
295,000 | Truist Financial Corp.‡ 4.800%, 11/01/35 5 year CMT + 3.00% | 242,697 | |||||||||
285,000 | 4.950%, 11/01/35^ 5 year CMT + 4.61% | 258,900 | |||||||||
108,000 | 5.100%, 11/01/35 10 year CMT + 4.35 | 86,574 | |||||||||
320,000 | U.S. Bancorp‡ 5.300%, 11/01/35 3 mo. SOFR + 3.18% | 252,138 | |||||||||
1,383,000 | United Wholesale Mortgage, LLC* 5.500%, 04/15/29 | 1,158,594 | |||||||||
600,000 | 5.750%, 06/15/27 | 547,518 | |||||||||
600,000 | Uniti Group, LP / Uniti Group Finance, Inc. / CSL Capital, LLC* 10.500%, 02/15/28 | 578,538 | |||||||||
600,000 | 6.500%, 02/15/29 | 390,168 | |||||||||
| PRINCIPAL AMOUNT | VALUE | ||||||||||
1,340,000 | VZ Secured Financing, BV* 5.000%, 01/15/32 | $ | 1,021,174 | ||||||||
620,000 | Wells Fargo & Company‡ 3.900%, 11/01/35 5 year CMT + 3.45% | 538,985 | |||||||||
560,000 | 7.625%, 11/01/35 5 year CMT + 3.61 | 562,761 | |||||||||
1,255,000 | XHR, LP* 6.375%, 08/15/25 | 1,224,817 | |||||||||
75,311,717 | |||||||||||
Health Care (1.1%) | |||||||||||
2,370,000 | Bausch Health Companies, Inc.* 11.000%, 09/30/28 | 1,450,819 | |||||||||
469,000 | 14.000%, 10/15/30 | 258,367 | |||||||||
447,000 | 6.125%, 02/01/27 | 249,739 | |||||||||
2,392,000 | CHS/Community Health Systems, Inc.* 6.125%, 04/01/30 | 929,818 | |||||||||
1,325,000 | 8.000%, 03/15/26 | 1,213,170 | |||||||||
663,000 | 6.875%, 04/15/29 | 273,693 | |||||||||
149,000 | 5.250%, 05/15/30 | 105,933 | |||||||||
2,381,000 | DaVita, Inc.* 4.625%, 06/01/30 | 1,868,156 | |||||||||
1,395,000 | 3.750%, 02/15/31 | 1,004,316 | |||||||||
894,000 | Embecta Corp.* 5.000%, 02/15/30 | 710,623 | |||||||||
298,000 | 6.750%, 02/15/30 | 247,185 | |||||||||
600,000 | Encompass Health Corp. 4.750%, 02/01/30 | 520,848 | |||||||||
600,000 | 4.500%, 02/01/28 | 541,452 | |||||||||
1,369,000 | HCA, Inc. 7.500%, 11/06/33 | 1,405,333 | |||||||||
350,000 | Jazz Securities DAC* 4.375%, 01/15/29 | 304,441 | |||||||||
488,014 | Mallinckrodt International Finance, SA / Mallinckrodt CB, LLC*@ 10.000%, 06/15/29 | 34,688 | |||||||||
1,484,000 | Medline Borrower, LP* 5.250%, 10/01/29^ | 1,264,754 | |||||||||
1,480,000 | 3.875%, 04/01/29 | 1,250,230 | |||||||||
2,200,000 | Organon & Company / Organon Foreign Debt Co-Issuer, BV* 5.125%, 04/30/31 | 1,723,216 | |||||||||
500,000 | 4.125%, 04/30/28 | 432,715 | |||||||||
1,251,000 | Team Health Holdings, Inc.* 6.375%, 02/01/25 | 1,004,503 | |||||||||
2,710,000 | Tenet Healthcare Corp. 6.250%, 02/01/27 | 2,607,345 | |||||||||
1,575,000 | 6.875%, 11/15/31 | 1,455,001 | |||||||||
1,520,000 | Teva Pharmaceutical Finance Netherlands III, BV 5.125%, 05/09/29^ | 1,326,869 | |||||||||
1,100,000 | 4.750%, 05/09/27 | 998,613 | |||||||||
535,000 | 3.150%, 10/01/26 | 470,950 | |||||||||
23,652,777 | |||||||||||
See accompanying Notes to Schedule of Investments
www.calamos.com
145
Strategic Total Return Fund Schedule of Investments October 31, 2023
| PRINCIPAL AMOUNT | VALUE | ||||||||||
Industrials (2.4%) | |||||||||||
1,355,000 | ACCO Brands Corp.*^ 4.250%, 03/15/29 | $ | 1,125,422 | ||||||||
1,170,000 | AerCap Holdings, NV^‡ 5.875%, 10/10/79 5 year CMT + 4.54% | 1,100,525 | |||||||||
1,520,000 | Air Lease Corp.‡ 4.125%, 11/01/35 5 year CMT + 3.15% | 1,093,534 | |||||||||
320,000 | 4.650%, 11/01/35 5 year CMT + 4.08% | 273,328 | |||||||||
1,925,000 | Albertsons Companies, Inc. / Safeway, Inc. / New Albertsons, LP / Albertsons, LLC* 4.625%, 01/15/27 | 1,811,868 | |||||||||
900,000 | 5.875%, 02/15/28 | 863,451 | |||||||||
893,000 | 3.500%, 03/15/29 | 762,077 | |||||||||
1,370,000 | Allegiant Travel Company* 7.250%, 08/15/27 | 1,247,769 | |||||||||
295,000 | American Airlines Group, Inc.* 3.750%, 03/01/25 | 276,220 | |||||||||
670,000 | Arcosa, Inc.* 4.375%, 04/15/29 | 586,659 | |||||||||
3,100,000 | ARD Finance, SA* 6.500%, 06/30/27 7.250% PIK rate | 1,810,152 | |||||||||
937,000 | Beacon Roofing Supply, Inc.* 4.125%, 05/15/29 | 787,577 | |||||||||
592,000 | Bombardier, Inc.* 7.875%, 04/15/27 | 570,392 | |||||||||
1,191,000 | BWX Technologies, Inc.* 4.125%, 04/15/29 | 1,030,346 | |||||||||
1,220,000 | Cascades, Inc. / Cascades USA, Inc.* 5.375%, 01/15/28 | 1,108,712 | |||||||||
295,000 | Delta Air Lines, Inc. / SkyMiles IP, Ltd.* 4.750%, 10/20/28 | 277,279 | |||||||||
1,565,000 | Deluxe Corp.* 8.000%, 06/01/29 | 1,240,372 | |||||||||
894,000 | Eco Material Technologies, Inc.* 7.875%, 01/31/27 | 850,641 | |||||||||
600,000 | Emerald Debt Merger Sub, LLC* 6.625%, 12/15/30 | 571,596 | |||||||||
575,000 | EnerSys* 4.375%, 12/15/27 | 516,494 | |||||||||
733,000 | Graham Packaging Company, Inc.* 7.125%, 08/15/28 | 569,886 | |||||||||
750,000 | Graphic Packaging International, LLC* 4.750%, 07/15/27 | 700,868 | |||||||||
551,000 | 3.500%, 03/01/29 | 462,823 | |||||||||
1,303,000 | Great Lakes Dredge & Dock Corp.*^ 5.250%, 06/01/29 | 1,067,509 | |||||||||
2,775,000 | H&E Equipment Services, Inc.* 3.875%, 12/15/28 | 2,356,530 | |||||||||
| PRINCIPAL AMOUNT | VALUE | ||||||||||
1,792,000 | Hawaiian Brand Intellectual Property, Ltd. / HawaiianMiles Loyalty, Ltd.* 5.750%, 01/20/26 | $ | 1,325,722 | ||||||||
1,500,000 | Herc Holdings, Inc.* 5.500%, 07/15/27 | 1,413,015 | |||||||||
1,385,000 | IEA Energy Services, LLC* 6.625%, 08/15/29 | 1,323,090 | |||||||||
721,000 | JELD-WEN, Inc.* 4.625%, 12/15/25 | 684,914 | |||||||||
625,000 | 4.875%, 12/15/27 | 533,675 | |||||||||
1,940,000 | Ken Garff Automotive, LLC* 4.875%, 09/15/28 | 1,653,171 | |||||||||
1,200,000 | Knife River Holding Company* 7.750%, 05/01/31 | 1,197,396 | |||||||||
598,000 | MasTec, Inc.* 4.500%, 08/15/28 | 525,815 | |||||||||
722,000 | Moog, Inc.* 4.250%, 12/15/27 | 655,605 | |||||||||
1,472,000 | Newfold Digital Holdings Group, Inc.*^ 6.000%, 02/15/29 | 973,183 | |||||||||
1,140,000 | Novelis Corp.* 4.750%, 01/30/30 | 971,907 | |||||||||
450,000 | OI European Group, BV* 4.750%, 02/15/30 | 383,166 | |||||||||
1,375,000 | Pactiv Evergreen Group Issuer, Inc. / Pactiv Evergreen Group Issuer, LLC* 4.000%, 10/15/27 | 1,210,577 | |||||||||
1,783,000 | Patrick Industries, Inc.* 4.750%, 05/01/29 | 1,465,822 | |||||||||
600,000 | QVC, Inc. 5.450%, 08/15/34 | 255,552 | |||||||||
933,000 | Sealed Air Corp.* 6.125%, 02/01/28 | 888,515 | |||||||||
298,000 | 5.000%, 04/15/29 | 265,944 | |||||||||
650,000 | Sensata Technologies, BV* 4.000%, 04/15/29 | 553,397 | |||||||||
593,000 | Sensata Technologies, Inc.* 3.750%, 02/15/31 | 475,503 | |||||||||
891,000 | Sinclair Television Group, Inc.* 4.125%, 12/01/30 | 560,813 | |||||||||
600,000 | 5.500%, 03/01/30 | 326,346 | |||||||||
1,165,000 | Standard Industries, Inc.* 5.000%, 02/15/27 | 1,079,105 | |||||||||
100,000 | Stanley Black & Decker, Inc.‡ 4.000%, 03/15/60 5 year CMT + 2.66% | 82,005 | |||||||||
957,000 | Stericycle, Inc.* 3.875%, 01/15/29 | 817,718 | |||||||||
879,000 | STL Holding Company, LLC* 7.500%, 02/15/26 | 825,548 | |||||||||
1,539,000 | TransDigm, Inc. 6.250%, 03/15/26* | 1,506,096 | |||||||||
1,295,000 | 6.875%, 12/15/30* | 1,253,288 | |||||||||
900,000 | 6.750%, 08/15/28* | 875,916 | |||||||||
See accompanying Notes to Schedule of Investments
CALAMOS CLOSED-END FAMILY OF FUNDS ANNUAL REPORT
146
Strategic Total Return Fund Schedule of Investments October 31, 2023
| PRINCIPAL AMOUNT | VALUE | ||||||||||
875,000 | 7.500%, 03/15/27 | $ | 875,123 | ||||||||
1,188,000 | Tronox, Inc.* 4.625%, 03/15/29 | 933,887 | |||||||||
484,035 | United Airlines Pass Through Trust Series 2019-2, Class B 3.500%, 11/01/29 | 428,990 | |||||||||
1,191,000 | Vertiv Group Corp.* 4.125%, 11/15/28 | 1,042,304 | |||||||||
1,251,000 | Wabash National Corp.* 4.500%, 10/15/28 | 1,037,367 | |||||||||
1,050,000 | Waste Pro USA, Inc.* 5.500%, 02/15/26 | 968,677 | |||||||||
703,000 | Williams Scotsman, Inc.* 4.625%, 08/15/28 | 625,459 | |||||||||
53,056,641 | |||||||||||
Information Technology (0.8%) | |||||||||||
596,000 | Booz Allen Hamilton, Inc.* 4.000%, 07/01/29 | 526,417 | |||||||||
692,000 | Coherent Corp.*^ 5.000%, 12/15/29 | 588,366 | |||||||||
1,201,000 | CommScope Technologies, LLC* 6.000%, 06/15/25 | 725,476 | |||||||||
1,100,000 | CommScope, Inc.* 4.750%, 09/01/29 | 751,443 | |||||||||
733,000 | Dell International, LLC / EMC Corp. 6.020%, 06/15/26 | 733,828 | |||||||||
596,000 | Dun & Bradstreet Corp.*^ 5.000%, 12/15/29 | 513,538 | |||||||||
586,000 | Fair Isaac Corp.* 4.000%, 06/15/28 | 522,800 | |||||||||
1,315,000 | KBR, Inc.* 4.750%, 09/30/28 | 1,159,633 | |||||||||
1,300,000 | MPH Acquisition Holdings, LLC* 5.750%, 11/01/28^ | 970,775 | |||||||||
595,000 | 5.500%, 09/01/28 | 497,646 | |||||||||
600,000 | NCL Corp., Ltd.* 8.125%, 01/15/29 | 587,004 | |||||||||
589,000 | NCR Voyix Corp.* 5.125%, 04/15/29 | 507,170 | |||||||||
886,000 | ON Semiconductor Corp.* 3.875%, 09/01/28 | 761,499 | |||||||||
855,000 | Open Text Corp.* 3.875%, 02/15/28 | 744,765 | |||||||||
600,000 | 6.900%, 12/01/27 | 598,848 | |||||||||
447,000 | 3.875%, 12/01/29 | 366,974 | |||||||||
447,000 | Open Text Holdings, Inc.* 4.125%, 12/01/31 | 352,406 | |||||||||
1,335,000 | Playtika Holding Corp.* 4.250%, 03/15/29 | 1,077,799 | |||||||||
1,645,000 | TTM Technologies, Inc.* 4.000%, 03/01/29 | 1,353,374 | |||||||||
| PRINCIPAL AMOUNT | VALUE | ||||||||||
Twilio, Inc. | |||||||||||
830,000 | 3.625%, 03/15/29 | $ | 692,693 | ||||||||
298,000 | 3.875%, 03/15/31 | 238,528 | |||||||||
1,475,000 | Viavi Solutions, Inc.* 3.750%, 10/01/29 | 1,174,321 | |||||||||
1,355,000 | ZoomInfo Technologies, LLC / ZoomInfo Finance Corp.* 3.875%, 02/01/29 | 1,120,355 | |||||||||
16,565,658 | |||||||||||
Materials (0.7%) | |||||||||||
623,000 | ArcelorMittal, SA^ 7.000%, 10/15/39 | 592,548 | |||||||||
600,000 | ATI, Inc. 5.875%, 12/01/27 | 558,834 | |||||||||
295,000 | Carpenter Technology Corp. 7.625%, 03/15/30 | 293,079 | |||||||||
895,000 | Chemours Company* 4.625%, 11/15/29 | 692,623 | |||||||||
1,880,000 | Clearwater Paper Corp.* 4.750%, 08/15/28 | 1,661,375 | |||||||||
900,000 | Cleveland-Cliffs, Inc.* 6.750%, 04/15/30 | 836,190 | |||||||||
596,000 | Commercial Metals Company 4.125%, 01/15/30 | 504,431 | |||||||||
298,000 | 4.375%, 03/15/32 | 240,823 | |||||||||
1,375,000 | Constellium, SE*^ 3.750%, 04/15/29 | 1,132,354 | |||||||||
590,000 | HB Fuller Company 4.250%, 10/15/28 | 512,085 | |||||||||
600,000 | INEOS Finance, PLC* 6.750%, 05/15/28 | 561,060 | |||||||||
900,000 | JW Aluminum Continuous Cast Company* 10.250%, 06/01/26 | 897,777 | |||||||||
1,350,000 | Kaiser Aluminum Corp.* 4.625%, 03/01/28 | 1,128,424 | |||||||||
149,000 | 4.500%, 06/01/31 | 110,214 | |||||||||
297,000 | LSF11 A5 HoldCo, LLC* 6.625%, 10/15/29 | 243,691 | |||||||||
1,566,000 | Mercer International, Inc. 5.125%, 02/01/29 | 1,229,983 | |||||||||
600,000 | 12.875%, 10/01/28* | 606,756 | |||||||||
1,175,000 | OCI, NV* 6.700%, 03/16/33 | 1,087,474 | |||||||||
900,000 | Owens-Brockway Glass Container, Inc.* 7.250%, 05/15/31 | 824,742 | |||||||||
590,000 | 6.625%, 05/13/27 | 562,187 | |||||||||
1,328,000 | Silgan Holdings, Inc. 4.125%, 02/01/28 | 1,184,510 | |||||||||
589,000 | Trinseo Materials Operating SCA / Trinseo Materials Finance, Inc.* 5.125%, 04/01/29 | 252,357 | |||||||||
15,713,517 | |||||||||||
See accompanying Notes to Schedule of Investments
www.calamos.com
147
Strategic Total Return Fund Schedule of Investments October 31, 2023
| PRINCIPAL AMOUNT | VALUE | ||||||||||
Other (0.1%) | |||||||||||
625,000 | Gen Digital, Inc.* 7.125%, 09/30/30^ | $ | 609,256 | ||||||||
625,000 | 6.750%, 09/30/27 | 609,450 | |||||||||
1,218,706 | |||||||||||
Real Estate (0.2%) | |||||||||||
953,000 | EPR Properties 3.750%, 08/15/29 | 753,156 | |||||||||
862,000 | Forestar Group, Inc.* 5.000%, 03/01/28 | 760,336 | |||||||||
630,000 | 3.850%, 05/15/26 | 565,387 | |||||||||
1,341,000 | MIWD Holdco II, LLC / MIWD Finance Corp.* 5.500%, 02/01/30 | 1,065,250 | |||||||||
550,000 | Service Properties Trust 5.250%, 02/15/26 | 493,730 | |||||||||
3,637,859 | |||||||||||
Special Purpose Acquisition Companies (0.1%) | |||||||||||
1,195,000 | Fertitta Entertainment, LLC / Fertitta Entertainment Finance Company, Inc.* 6.750%, 01/15/30 | 950,861 | |||||||||
596,000 | 4.625%, 01/15/29 | 503,197 | |||||||||
1,454,058 | |||||||||||
Utilities (0.2%) | |||||||||||
340,000 | Algonquin Power & Utilities Corp.‡ 4.750%, 01/18/82 5 year CMT + 3.25% | 268,539 | |||||||||
85,000 | American Electric Power Company, Inc.‡ 3.875%, 02/15/62 5 year CMT + 2.68 | 67,232 | |||||||||
235,000 | CMS Energy Corp.‡ 4.750%, 06/01/50 5 year CMT + 4.12% | 196,281 | |||||||||
250,000 | Dominion Energy, Inc.‡ 4.650%, 11/01/35 5 year CMT + 2.99% | 227,520 | |||||||||
133,000 | 4.350%, 11/01/35 5 year CMT + 3.20% | 107,432 | |||||||||
330,000 | Duke Energy Corp.‡ 4.875%, 11/01/35 5 year CMT + 3.39% | 319,513 | |||||||||
132,000 | 3.250%, 01/15/82 5 year CMT + 2.32% | 95,412 | |||||||||
220,000 | Emera, Inc.‡ 6.750%, 06/15/76 3 mo. LIBOR + 5.44 | 206,978 | |||||||||
288,000 | National Rural Utilities Cooperative Finance Corp.‡ 7.125%, 09/15/53^ | 286,042 | |||||||||
150,000 | 5.250%, 04/20/46 3 mo. LIBOR + 3.63% | 141,438 | |||||||||
320,000 | NextEra Energy Capital Holdings, Inc.‡ 3.800%, 03/15/82 5 year CMT + 2.55% | 256,454 | |||||||||
| PRINCIPAL AMOUNT | VALUE | ||||||||||
591,000 | PPL Capital Funding, Inc.‡ 8.317%, 03/30/67 3 mo. LIBOR + 2.67% | $ | 535,475 | ||||||||
220,000 | Sempra‡ 4.875%, 11/01/35 5 year CMT + 4.55% | 205,878 | |||||||||
85,000 | 4.125%, 04/01/52 5 year CMT + 2.87% | 66,470 | |||||||||
362,000 | Southern Company‡ 4.000%, 01/15/51 5 year CMT + 3.73% | 330,814 | |||||||||
95,000 | 3.750%, 09/15/51 5 year CMT + 2.92% | 80,885 | |||||||||
625,000 | Vistra Corp.*‡ 7.000%, 11/01/67 5 year CMT + 5.74% | 571,750 | |||||||||
340,000 | 8.000%, 11/01/67 5 year CMT + 6.93% | 323,469 | |||||||||
80,000 | WEC Energy Group, Inc.‡ 7.739%, 05/15/67 3 mo. LIBOR + 2.11% | 69,493 | |||||||||
4,357,075 | |||||||||||
| TOTAL CORPORATE BONDS(Cost $435,991,147) | 388,806,056 | ||||||||||
CONVERTIBLE BONDS (23.0%) | |||||||||||
Communication Services (1.9%) | |||||||||||
903,000 | Cable One, Inc. 0.000%, 03/15/26 | 739,277 | |||||||||
7,025,000 | Liberty Media Corp.* 3.750%, 03/15/28 | 7,741,761 | |||||||||
5,970,000 | 2.375%, 09/30/53 | 5,788,810 | |||||||||
8,895,000 | Liberty Media Corp.-Liberty Formula One 2.250%, 08/15/27 | 8,865,913 | |||||||||
17,095,000 | Live Nation Entertainment, Inc. 2.000%, 02/15/25 | 17,204,750 | |||||||||
40,340,511 | |||||||||||
Consumer Discretionary (4.1%) | |||||||||||
16,415,000 | Airbnb, Inc. 0.000%, 03/15/26 | 14,221,956 | |||||||||
9,550,000 | Booking Holdings, Inc. 0.750%, 05/01/25 | 14,562,890 | |||||||||
13,435,000 | DISH Network Corp. 3.375%, 08/15/26 | 6,875,899 | |||||||||
7,098,000 | 0.000%, 12/15/25 | 4,354,907 | |||||||||
1,483,000 | 2.375%, 03/15/24 | 1,421,025 | |||||||||
14,650,000 | Ford Motor Company 0.000%, 03/15/26 | 13,372,667 | |||||||||
7,670,000 | Marriott Vacations Worldwide Corp. 0.000%, 01/15/26 | 6,611,770 | |||||||||
5,415,000 | Rivian Automotive, Inc.* 4.625%, 03/15/29 | 5,708,385 | |||||||||
1,400,000 | Royal Caribbean Cruises, Ltd. 6.000%, 08/15/25 | 2,560,068 | |||||||||
See accompanying Notes to Schedule of Investments
CALAMOS CLOSED-END FAMILY OF FUNDS ANNUAL REPORT
148
Strategic Total Return Fund Schedule of Investments October 31, 2023
| PRINCIPAL AMOUNT | VALUE | ||||||||||
400,000 | Tesla, Inc. 2.000%, 05/15/24 | $ | 3,896,100 | ||||||||
4,880,000 | Vail Resorts, Inc. 0.000%, 01/01/26 | 4,272,635 | |||||||||
11,140,000 | Wynn Macau, Ltd.* 4.500%, 03/07/29 | 11,364,137 | |||||||||
89,222,439 | |||||||||||
Energy (0.8%) | |||||||||||
1,365,000 | EQT Corp. 1.750%, 05/01/26 | 3,968,601 | |||||||||
7,245,000 | Nabors Industries, Inc.* 1.750%, 06/15/29 | 5,428,823 | |||||||||
6,615,000 | Northern Oil & Gas, Inc. 3.625%, 04/15/29 | 7,812,778 | |||||||||
17,210,202 | |||||||||||
Financials (0.9%) | |||||||||||
3,000,000 | Ares Capital Corp. 4.625%, 03/01/24 | 3,026,340 | |||||||||
4,500,000 | EUR | JPMorgan Chase Bank NA 0.000%, 06/10/24 | 4,792,401 | ||||||||
11,275,000 | Morgan Stanley Finance, LLC 1.000%, 11/23/27 | 11,430,595 | |||||||||
19,249,336 | |||||||||||
Health Care (2.3%) | |||||||||||
8,820,000 | Alnylam Pharmaceuticals, Inc. 1.000%, 09/15/27 | 7,654,525 | |||||||||
13,555,000 | Dexcom, Inc. 0.250%, 11/15/25 | 12,867,355 | |||||||||
2,718,000 | Envista Holdings Corp.* 1.750%, 08/15/28 | 2,351,722 | |||||||||
7,895,000 | Integer Holdings Corp.* 2.125%, 02/15/28 | 8,690,658 | |||||||||
7,755,000 | Jazz Investments I, Ltd. 2.000%, 06/15/26 | 7,873,109 | |||||||||
7,755,000 | Pacira BioSciences, Inc. 0.750%, 08/01/25 | 6,976,398 | |||||||||
2,863,000 | Shockwave Medical, Inc.* 1.000%, 08/15/28 | 2,775,993 | |||||||||
49,189,760 | |||||||||||
Industrials (3.6%) | |||||||||||
5,910,000 | Advanced Energy Industries, Inc.* 2.500%, 09/15/28 | 5,462,613 | |||||||||
4,215,000 | Axon Enterprise, Inc.* 0.500%, 12/15/27 | 4,547,184 | |||||||||
7,500,000 | Fluor Corp.* 1.125%, 08/15/29 | 7,240,425 | |||||||||
5,315,000 | Granite Construction, Inc.* 3.750%, 05/15/28 | 5,730,580 | |||||||||
13,520,000 | John Bean Technologies Corp. 0.250%, 05/15/26 | 12,166,783 | |||||||||
| PRINCIPAL AMOUNT | VALUE | ||||||||||
13,805,000 | Middleby Corp. 1.000%, 09/01/25 | $ | 14,339,392 | ||||||||
5,470,000 | Southwest Airlines Company^ 1.250%, 05/01/25 | 5,212,910 | |||||||||
8,835,000 | Tetra Tech, Inc.* 2.250%, 08/15/28 | 8,558,376 | |||||||||
14,800,000 | Uber Technologies, Inc. 0.000%, 12/15/25 | 13,530,160 | |||||||||
76,788,423 | |||||||||||
Information Technology (5.8%) | |||||||||||
10,410,000 | Akamai Technologies, Inc. 1.125%, 02/15/29* | 10,248,749 | |||||||||
4,230,000 | 0.375%, 09/01/27 | 4,308,974 | |||||||||
7,838,000 | BILL Holdings, Inc. 0.000%, 04/01/27 | 6,220,472 | |||||||||
3,535,000 | 0.000%, 12/01/25 | 3,359,876 | |||||||||
17,000,000 | CyberArk Software, Ltd. 0.000%, 11/15/24 | 19,461,600 | |||||||||
12,325,000 | Enphase Energy, Inc. 0.000%, 03/01/28^ | 9,144,287 | |||||||||
3,525,000 | 0.000%, 03/01/26 | 3,006,226 | |||||||||
6,905,000 | Microchip Technology, Inc.^ 0.125%, 11/15/24 | 6,953,404 | |||||||||
17,315,000 | ON Semiconductor Corp.* 0.500%, 03/01/29 | 15,222,309 | |||||||||
2,520,000 | Palo Alto Networks, Inc. 0.375%, 06/01/25 | 6,153,891 | |||||||||
5,970,000 | Rapid7, Inc.* 1.250%, 03/15/29 | 5,775,498 | |||||||||
9,420,000 | Seagate HDD Cayman* 3.500%, 06/01/28 | 9,771,743 | |||||||||
8,400,000 | SK Hynix, Inc. 1.750%, 04/11/30 | 10,163,664 | |||||||||
5,850,000 | Tyler Technologies, Inc. 0.250%, 03/15/26 | 5,562,765 | |||||||||
5,670,000 | Wolfspeed, Inc.* 1.875%, 12/01/29 | 3,386,804 | |||||||||
5,970,000 | Workiva, Inc.* 1.250%, 08/15/28 | 5,422,670 | |||||||||
124,162,932 | |||||||||||
Materials (0.3%) | |||||||||||
5,800,000 | Glencore Funding, LLC 0.000%, 03/27/25 | 6,083,678 | |||||||||
Other (0.0%) | |||||||||||
590,000 | Multiplan Corp.* 6.000%, 10/15/27 | 392,362 | |||||||||
Real Estate (1.4%) | |||||||||||
5,400,000 | EUR | ANLLIAN Capital, Ltd. 0.000%, 02/05/25 | 6,122,731 | ||||||||
15,115,000 | Pebblebrook Hotel Trust 1.750%, 12/15/26 | 12,019,902 | |||||||||
See accompanying Notes to Schedule of Investments
www.calamos.com
149
Strategic Total Return Fund Schedule of Investments October 31, 2023
| PRINCIPAL AMOUNT | VALUE | ||||||||||
12,285,000 | Welltower OP, LLC* 2.750%, 05/15/28 | $ | 12,620,749 | ||||||||
30,763,382 | |||||||||||
Utilities (1.9%) | |||||||||||
5,800,000 | Alliant Energy Corp.* 3.875%, 03/15/26 | 5,669,094 | |||||||||
16,655,000 | CMS Energy Corp.* 3.375%, 05/01/28 | 15,769,620 | |||||||||
20,355,000 | PPL Capital Funding, Inc.* 2.875%, 03/15/28 | 18,667,164 | |||||||||
40,105,878 | |||||||||||
TOTAL CONVERTIBLE BONDS (Cost $546,875,795) | 493,508,903 | ||||||||||
BANK LOANS (6.2%)¡ | |||||||||||
Airlines (0.1%) | |||||||||||
891,000 | American Airlines, Inc.‡ 10.427%, 04/20/28 3 mo. SOFR + 4.75% | 904,922 | |||||||||
915,000 | Mileage Plus Holdings, LLC‡ 10.798%, 06/21/27 3 mo. SOFR + 5.25% | 944,472 | |||||||||
1,849,394 | |||||||||||
Communication Services (0.7%) | |||||||||||
2,000,000 | APi Group DE, Inc.! 0.000%, 01/03/29 | 2,005,500 | |||||||||
3,282,857 | Charter Communications Operating LLC‡ 7.133%, 02/01/27 3 mo. SOFR + 1.75% | 3,278,556 | |||||||||
8,571 | Charter Communications Operating, LLC‡ 02/01/27 1 mo. SOFR + 1.75% | 8,560 | |||||||||
153,499 | Clear Channel Outdoor Holdings, Inc.‡ 9.145%, 08/21/26 1 mo. SOFR + 3.50% | 147,807 | |||||||||
421,239 | DIRECTV Financing, LLC‡ 10.325%, 08/02/27 1 mo. SOFR + 5.00% | 410,634 | |||||||||
1,755,000 | Entercom Media Corp.‡ 8.145%, 11/18/24 3 mo. SOFR + 2.50% | 771,928 | |||||||||
1,995,000 | Go Daddy Operating Company, LLC‡ 7.824%, 11/09/29 1 mo. SOFR + 2.50% | 1,999,080 | |||||||||
2,000,000 | Match Group, Inc.‡ 7.298%, 02/13/27 3 mo. SOFR + 1.75% | 1,994,160 | |||||||||
2,000,000 | Nexstar Broadcasting, Inc.‡ 7.939%, 09/18/26 1 mo. SOFR + 2.50% | 2,001,800 | |||||||||
600,000 | Telesat Canada‡ 8.434%, 12/07/26 3 mo. SOFR + 2.75% | 413,550 | |||||||||
| PRINCIPAL AMOUNT | VALUE | ||||||||||
2,000,000 | Virgin Media Bristol, LLC‡ 7.949%, 01/31/28 1 mo. SOFR + 2.50% | $ | 1,946,260 | ||||||||
14,977,835 | |||||||||||
Consumer Discretionary (1.1%) | |||||||||||
2,000,000 | Adient US LLC‡ 8.689%, 04/10/28 1 mo. SOFR + 3.25% | 2,001,870 | |||||||||
472,889 | American Axle and Manufacturing, Inc.‡ 9.007%, 12/13/29 3 mo. SOFR + 3.50% | 471,905 | |||||||||
315,111 | American Axle and Manufacturing, Inc.‡ 8.941%, 12/13/29 1 mo. SOFR + 3.50% | 314,456 | |||||||||
1,995,000 | Aramark Services, Inc.‡ 7.939%, 06/22/30 1 mo. SOFR + 2.50% | 1,995,000 | |||||||||
1,194,000 | Caesars Entertainment Corp.‡ 8.674%, 02/06/30 1 mo. SOFR + 3.25% | 1,191,182 | |||||||||
3,201,975 | Carnival Corp.‡ 8.336%, 08/08/27 1 mo. SOFR + 3.00% | 3,149,943 | |||||||||
1,194,000 | Hanesbrands, Inc.‡ 9.074%, 03/08/30 1 mo. SOFR + 3.75% | 1,180,568 | |||||||||
2,194,373 | KFC Holding Co.‡ 7.199%, 03/15/28 1 mo. SOFR + 1.75% | 2,195,514 | |||||||||
722,390 | Life Time Fitness, Inc.‡ 10.130%, 01/15/26 3 mo. SOFR + 4.75% | 723,925 | |||||||||
1,994,885 | Murphy USA, Inc.‡ 7.179%, 01/31/28 1 mo. SOFR + 1.75% | 2,002,994 | |||||||||
1,994,949 | PENN Entertainment, Inc.‡ 8.174%, 05/03/29 1 mo. SOFR + 2.75% | 1,994,680 | |||||||||
1,360,603 | Petco Health and Wellness Company, Inc.‡ 8.902%, 03/03/28 3 mo. SOFR + 3.25% | 1,332,636 | |||||||||
2,948,694 | PetSmart, Inc.‡ 9.174%, 02/11/28 1 mo. SOFR + 3.75% | 2,917,673 | |||||||||
1,994,770 | Station Casinos, LLC‡! 0.000%, 02/08/27 | 1,984,347 | |||||||||
747,819 | TKC Holdings, Inc.‡ 10.939%, 05/15/28 1 mo. SOFR + 5.50% | 717,906 | |||||||||
300,000 | Windsor Holdings III, LLC‡ 9.815%, 08/01/30 1 mo. SOFR + 4.50% | 299,492 | |||||||||
24,474,091 | |||||||||||
See accompanying Notes to Schedule of Investments
CALAMOS CLOSED-END FAMILY OF FUNDS ANNUAL REPORT
150
Strategic Total Return Fund Schedule of Investments October 31, 2023
| PRINCIPAL AMOUNT | VALUE | ||||||||||
Consumer Staples (0.1%) | |||||||||||
1,225,000 | Star Parent, Inc.‡ 9.386%, 09/27/30 3 mo. LIBOR + 4.00% | $ | 1,171,106 | ||||||||
565,000 | United Natural Foods, Inc.‡ 8.689%, 10/22/25 1 mo. SOFR + 3.25% | 564,215 | |||||||||
1,735,321 | |||||||||||
Energy (0.1%) | |||||||||||
575,000 | New Fortress Energy, Inc.‡ 0.000%, 10/23/30 | 531,875 | |||||||||
1,494,000 | Par Petroleum, LLC‡ 9.773%, 02/28/30 3 mo. SOFR + 4.25% | 1,492,132 | |||||||||
2,024,007 | |||||||||||
Financials (0.8%) | |||||||||||
300,000 | Advisor Group, Inc.‡ 9.824%, 08/17/28 1 mo. SOFR + 4.50% | 299,007 | |||||||||
1,218,860 | Alliant Holdings Intermediate, LLC‡ 8.835%, 11/05/27 1 mo. SOFR + 3.50% | 1,216,136 | |||||||||
663,850 | Amynta Agency Borrower, Inc.‡ 10.325%, 02/28/28 1 mo. SOFR + 5.00% | 664,315 | |||||||||
242,659 | Amynta Agency Borrower, Inc.‡ 10.424%, 02/28/28 1 mo. SOFR + 5.00% | 242,829 | |||||||||
1,173,090 | AssuredPartners, Inc.‡ 8.824%, 02/12/27 1 mo. SOFR + 3.50% | 1,164,292 | |||||||||
3,092,250 | Avolon TLB Borrower 1 LLC‡ 7.839%, 06/22/28 1 mo. SOFR + 2.50% | 3,096,564 | |||||||||
1,994,911 | Castlelake Aviation, Ltd. 8.421%, 10/22/26 3 mo. SOFR + 2.75% | 1,993,664 | |||||||||
1,048,473 | Castlelake Aviation, Ltd.! 8.421%, 10/22/26 3 mo. SOFR + 2.75% | 1,047,818 | |||||||||
595,500 | Castlelake Aviation, Ltd.‡ 8.421%, 10/22/27 3 mo. SOFR + 2.75% | 594,809 | |||||||||
335,000 | Delos Aircraft Leasing DAC‡ 7.402%, 10/31/27 3 mo. SOFR + 2.00% | 335,367 | |||||||||
281,410 | Delos Aircraft Leasing DAC! 7.402%, 10/31/27 3 mo. SOFR + 2.00% | 281,718 | |||||||||
1,215,813 | Hub International, Ltd.‡ 9.365%, 11/10/29 3 mo. SOFR + 4.00% | 1,215,636 | |||||||||
| PRINCIPAL AMOUNT | VALUE | ||||||||||
4,152,117 | Jazz Financing Lux Sarl‡ 8.939%, 05/05/28 1 mo. SOFR + 3.50% | $ | 4,155,563 | ||||||||
1,633,500 | VFH Parent, LLC‡ 8.427%, 01/13/29 1 mo. SOFR + 3.00% | 1,625,504 | |||||||||
17,933,222 | |||||||||||
Health Care (1.0%) | |||||||||||
2,074,262 | Amneal Pharmaceuticals, LLC‡ 8.939%, 05/04/25 1 mo. SOFR + 3.50% | 2,036,842 | |||||||||
1,457,361 | Avantor Funding, Inc.‡ 7.674%, 11/08/27 1 mo. SOFR + 2.25% | 1,458,578 | |||||||||
— | Bausch Health Companies, Inc.‡ 10.689%, 02/01/27 1 mo. SOFR + 5.25% | — | |||||||||
2,194,236 | DaVita, Inc.‡ 7.189%, 08/12/26 1 mo. SOFR + 1.75% | 2,171,756 | |||||||||
1,994,462 | Elanco Animal Health, Inc.‡ 7.165%, 08/01/27 1 mo. SOFR + 1.75% | 1,951,461 | |||||||||
1,601,168 | ICON Luxembourg Sarl! 7.902%, 07/03/28 3 mo. SOFR + 2.25% | 1,603,946 | |||||||||
647,990 | Icon Luxembourg Sarl‡ 7.902%, 07/03/28 3 mo. SOFR + 2.25% | 649,114 | |||||||||
2,000,000 | IQVIA, Inc.‡ 7.402%, 06/11/25 3 mo. SOFR + 1.75% | 2,006,880 | |||||||||
1,118,060 | Mallinckrodt International Finance, SA‡ 12.703%, 09/30/27 1 mo. SOFR + 7.25% | 851,901 | |||||||||
2,000,000 | Organon & Company‡ 8.451%, 06/02/28 1 mo. SOFR + 3.00% | 1,998,500 | |||||||||
1,261,176 | Padagis, LLC‡ 10.434%, 07/06/28 3 mo. SOFR + 4.75% | 1,123,500 | |||||||||
1,994,950 | Perrigo Investments, LLC‡ 7.674%, 04/20/29 1 mo. SOFR + 2.25% | 1,988,965 | |||||||||
398,932 | PRA Health Sciences, Inc.! 7.902%, 07/03/28 3 mo. SOFR + 2.25% | 399,624 | |||||||||
161,447 | PRA Health Sciences, Inc. 7.902%, 07/03/28 3 mo. SOFR + 2.25% | 161,727 | |||||||||
2,878,766 | Team Health Holdings, Inc.‡ 10.633%, 03/02/27 3 mo. SOFR + 5.25% | 2,080,700 | |||||||||
See accompanying Notes to Schedule of Investments
www.calamos.com
151
Strategic Total Return Fund Schedule of Investments October 31, 2023
| PRINCIPAL AMOUNT | VALUE | ||||||||||
8,209 | Team Health Holdings, Inc.‡ 10.574%, 03/02/27 1 mo. SOFR + 5.25% | $ | 5,933 | ||||||||
20,489,427 | |||||||||||
Industrials (1.1%) | |||||||||||
586,500 | ACProducts, Inc.‡ 9.902%, 05/17/28 3 mo. LIBOR + 4.25% | 468,059 | |||||||||
735,688 | Air Canada‡ 9.128%, 08/11/28 3 mo. SOFR + 3.50% | 735,872 | |||||||||
1,994,898 | Beacon Roofing Supply, Inc.‡ 7.689%, 05/19/28 1 mo. SOFR + 2.25% | 1,994,798 | |||||||||
2,131,043 | Berry Global, Inc.‡ 7.201%, 07/01/29 1 mo. SOFR + 1.75% | 2,115,337 | |||||||||
3,473,863 | ChampionX Corp.‡ 8.177%, 06/07/29 1 mo. SOFR + 2.75% | 3,489,599 | |||||||||
2,758,248 | Emrld Borrower, LP‡ 8.380%, 05/31/30 3 mo. SOFR + 3.00% | 2,755,655 | |||||||||
1,994,987 | H.B. Fuller Company‡ 7.574%, 02/15/30 1 mo. SOFR + 2.25% | 2,002,678 | |||||||||
1,994,898 | Jeld-Wen, Inc.‡ 7.689%, 07/28/28 1 mo. SOFR + 2.25% | 1,996,145 | |||||||||
3,377,449 | Scientific Games International, Inc.‡ 8.435%, 04/14/29 1 mo. SOFR + 3.00% | 3,378,513 | |||||||||
645,125 | Summit Materials, LLC‡ 8.571%, 12/14/27 3 mo. SOFR + 3.00% | 648,654 | |||||||||
1,994,988 | TransDigm, Inc.‡ 8.640%, 08/24/28 3 mo. SOFR + 3.25% | 1,994,988 | |||||||||
2,959,427 | United Airlines, Inc.‡ 9.189%, 04/21/28 1 mo. SOFR + 3.75% | 2,957,577 | |||||||||
24,537,875 | |||||||||||
Information Technology (0.6%) | |||||||||||
1,176,696 | Banff Merger Sub, Inc.‡ 9.189%, 10/02/25 1 mo. SOFR + 3.75% | 1,176,943 | |||||||||
835,000 | Central Parent, Inc.! 9.406%, 07/06/29 3 mo. SOFR + 4.00% | 831,347 | |||||||||
297,750 | Central Parent, Inc.‡ 9.406%, 07/06/29 3 mo. SOFR + 4.00% | 296,447 | |||||||||
| PRINCIPAL AMOUNT | VALUE | ||||||||||
1,164,020 | Dun & Bradstreet Corp.‡ 8.176%, 02/06/26 1 mo. SOFR + 2.75% | $ | 1,164,020 | ||||||||
3,091,528 | II-VI, Inc.‡ 8.189%, 07/02/29 1 mo. SOFR + 2.75% | 3,090,074 | |||||||||
1,952,924 | Open Text Corp.‡ 8.174%, 01/31/30 1 mo. SOFR + 2.75% | 1,953,607 | |||||||||
1,199,236 | SS&C Technologies, Inc.‡ 7.674%, 03/22/29 1 mo. SOFR + 2.25% | 1,199,236 | |||||||||
757,112 | SS&C Technologies, Inc.‡ 7.674%, 03/22/29 1 mo. SOFR + 2.25% | 757,112 | |||||||||
1,281,788 | TTM Technologies, Inc.‡ 8.065%, 05/30/30 1 mo. SOFR + 2.75% | 1,282,589 | |||||||||
11,751,375 | |||||||||||
Information Technology (0.0%) | |||||||||||
990,690 | Camelot U.S. Acquisition LLC‡ 8.439%, 10/30/26 1 mo. SOFR + 3.00% | 990,591 | |||||||||
Materials (0.5%) | |||||||||||
2,073,150 | Axalta Coating Systems U.S. Holdings, Inc.‡ 7.890%, 12/20/29 3 mo. SOFR + 2.50% | 2,078,467 | |||||||||
2,620,000 | Chemours Company‡ 8.824%, 08/18/28 1 mo. SOFR + 2.50% | 2,554,500 | |||||||||
1,197,000 | Ineos US Finance, LLC‡ 8.825%, 02/18/30 1 mo. SOFR + 3.50% | 1,173,623 | |||||||||
1,474,341 | Innophos, Inc.‡ 8.689%, 02/05/27 1 mo. SOFR + 3.25% | 1,461,441 | |||||||||
1,511,213 | LSF11 A5 Holdco, LLC‡ 9.674%, 10/15/28 1 mo. SOFR + 4.25% | 1,485,242 | |||||||||
596,947 | Trinseo Materials Operating SCA‡ 7.939%, 05/03/28 1 mo. SOFR + 2.50% | 476,775 | |||||||||
1,172,643 | W.R. Grace & Co.-Conn.‡ 9.402%, 09/22/28 3 mo. SOFR + 3.75% | 1,153,588 | |||||||||
10,383,636 | |||||||||||
Special Purpose Acquisition Companies (0.1%) | |||||||||||
587,563 | Clydesdale Acquisition Holdings, Inc.‡ 9.599%, 04/13/29 1 mo. SOFR + 4.18% | 569,815 | |||||||||
295,500 | Fertitta Entertainment, LLC‡ 9.324%, 01/27/29 1 mo. SOFR + 4.00% | 289,434 | |||||||||
See accompanying Notes to Schedule of Investments
CALAMOS CLOSED-END FAMILY OF FUNDS ANNUAL REPORT
152
Strategic Total Return Fund Schedule of Investments October 31, 2023
| PRINCIPAL AMOUNT | VALUE | ||||||||||
1,262,250 | Oscar AcquisitionCo, LLC‡ 9.990%, 04/29/29 3 mo. SOFR + 4.50% | $ | 1,231,615 | ||||||||
1,188,000 | Patagonia Holdco, LLC‡ 11.117%, 08/01/29 3 mo. SOFR + 5.75% | 1,030,590 | |||||||||
3,121,454 | |||||||||||
TOTAL BANK LOANS (Cost $136,777,345) | 134,268,228 | ||||||||||
U.S. GOVERNMENT AND AGENCY SECURITIES (3.1%) | |||||||||||
Other (3.1%) | |||||||||||
36,945,000 | United States Treasury Note^ 2.250%, 03/31/24 | 36,464,427 | |||||||||
30,400,000 | 2.500%, 05/31/24 | 29,886,406 | |||||||||
TOTAL U.S. GOVERNMENT AND (Cost $67,314,841) | 66,350,833 | ||||||||||
| NUMBER OF SHARES | VALUE | ||||||||||
CONVERTIBLE PREFERRED STOCKS (2.3%) | |||||||||||
Energy (0.0%) | |||||||||||
28 | Gulfport Energy Corp.# 10.000%, 12/01/23 15.000% PIK rate | 248,500 | |||||||||
Financials (0.9%) | |||||||||||
80,250 | AMG Capital Trust II 5.150%, 10/15/37 | 3,823,190 | |||||||||
300,410 | Apollo Global Management, Inc. 6.750%, 07/31/26 | 14,452,725 | |||||||||
18,275,915 | |||||||||||
Industrials (0.1%) | |||||||||||
46,187 | Chart Industries, Inc. 6.750%, 12/15/25 | 2,270,553 | |||||||||
Utilities (1.3%) | |||||||||||
246,010 | AES Corp. 6.875%, 02/15/24 | 14,829,483 | |||||||||
84,885 | CenterPoint Energy, Inc. (Warner Media, LLC, Charter Communications Time, Inc.)#§** 3.369%, 09/15/29 | 3,248,888 | |||||||||
262,050 | NextEra Energy, Inc.^ 6.926%, 09/01/25 | 9,837,357 | |||||||||
27,915,728 | |||||||||||
TOTAL CONVERTIBLE (Cost $63,477,722) | 48,710,696 | ||||||||||
| NUMBER OF SHARES | VALUE | ||||||||||
COMMON STOCKS (96.0%) | |||||||||||
Communication Services (10.2%) | |||||||||||
661,840 | Alphabet, Inc. - Class A#µ | $ | 82,121,107 | ||||||||
199,700 | Alphabet, Inc. - Class C^#µ | 25,022,410 | |||||||||
25,095 | Altice USA, Inc. - Class A# | 72,525 | |||||||||
264,885 | AT&T, Inc.^ | 4,079,229 | |||||||||
411,425 | Comcast Corp. - Class A | 16,987,738 | |||||||||
8,434 | Cumulus Media, Inc. - Class A | 38,037 | |||||||||
2 | Frontier Communications Parent, Inc.^# | 36 | |||||||||
146,450 | Meta Platforms, Inc. - Class A# | 44,120,992 | |||||||||
32,360 | Netflix, Inc.#µ | 13,322,288 | |||||||||
205,085 | EUR | Orange, SA | 2,412,218 | ||||||||
135,860 | T-Mobile U.S., Inc.# | 19,544,820 | |||||||||
149,335 | Walt Disney Company# | 12,184,243 | |||||||||
219,905,643 | |||||||||||
Consumer Discretionary (10.8%) | |||||||||||
688,315 | Amazon.com, Inc.^# | 91,607,843 | |||||||||
137,124 | Aptiv, PLC# | 11,957,213 | |||||||||
59,260 | Carnival Corp.# | 679,120 | |||||||||
243,463 | General Motors Company | 6,865,657 | |||||||||
52,240 | Home Depot, Inc. | 14,872,205 | |||||||||
294,980 | Las Vegas Sands Corp. | 13,999,751 | |||||||||
54,670 | Lowe's Companies, Inc. | 10,418,462 | |||||||||
62,500 | McDonald's Corp. | 16,385,625 | |||||||||
162,800 | NIKE, Inc. - Class B | 16,730,956 | |||||||||
107,325 | Starbucks Corp. | 9,899,658 | |||||||||
144,100 | Tesla, Inc.# | 28,941,044 | |||||||||
104,675 | TJX Cos., Inc. | 9,218,727 | |||||||||
231,576,261 | |||||||||||
Consumer Staples (6.8%) | |||||||||||
58,750 | Altria Group, Inc. | 2,359,987 | |||||||||
329,140 | Coca-Cola Company^ | 18,593,118 | |||||||||
31,575 | Costco Wholesale Corp. | 17,443,293 | |||||||||
47,280 | Estee Lauder Companies, Inc. - Class A | 6,092,974 | |||||||||
154,119 | Kenvue, Inc. | 2,866,613 | |||||||||
113,665 | Mondelez International, Inc. - Class A^ | 7,525,760 | |||||||||
149,110 | Monster Beverage Corp.#µ | 7,619,521 | |||||||||
90,260 | PepsiCo, Inc.^ | 14,737,653 | |||||||||
179,035 | Philip Morris International, Inc.^ | 15,962,761 | |||||||||
203,745 | Procter & Gamble Company | 30,567,862 | |||||||||
52,650 | Walgreens Boots Alliance, Inc.^ | 1,109,862 | |||||||||
130,790 | Walmart, Inc. | 21,372,394 | |||||||||
146,251,798 | |||||||||||
Energy (5.6%) | |||||||||||
475,000 | BP, PLC (ADR) | 17,375,500 | |||||||||
11,045 | Chaparral Energy, Inc. - Class A&# | 491,503 | |||||||||
www.calamos.com
153
Strategic Total Return Fund Schedule of Investments October 31, 2023
| NUMBER OF SHARES | VALUE | ||||||||||
3,550 | Chesapeake Energy Corp.^ | $ | 305,584 | ||||||||
128,625 | Chevron Corp.^ | 18,744,521 | |||||||||
64,470 | ConocoPhillips^ | 7,659,036 | |||||||||
82,935 | Energy Transfer, LP | 1,090,595 | |||||||||
49,155 | Enterprise Products Partners, LP | 1,279,996 | |||||||||
7,920 | EP Energy Corp.&# | 20,790 | |||||||||
317,920 | Exxon Mobil Corp. | 33,651,832 | |||||||||
56,105 | Hess Corp. | 8,101,562 | |||||||||
80,370 | Marathon Petroleum Corp.µ | 12,155,962 | |||||||||
10,578 | ONEOK, Inc.^ | 689,686 | |||||||||
24,975 | Pioneer Natural Resources Company | 5,969,025 | |||||||||
219,710 | Schlumberger, NV | 12,229,059 | |||||||||
119,764,651 | |||||||||||
Financials (12.1%) | |||||||||||
35,430 | Affiliated Managers Group, Inc. | 4,349,387 | |||||||||
59,230 | American Express Company^ | 8,649,357 | |||||||||
346,890 | American International Group, Inc.^ | 21,267,826 | |||||||||
29,983 | Assurant, Inc. | 4,464,469 | |||||||||
663,370 | Bank of America Corp.^~ | 17,473,166 | |||||||||
71,870 | Bank of New York Mellon Corp.^ | 3,054,475 | |||||||||
10,715 | BlackRock, Inc. | 6,560,580 | |||||||||
76,155 | Chubb, Ltd.µ | 16,344,386 | |||||||||
231,670 | Citigroup, Inc. | 9,148,648 | |||||||||
27,300 | Goldman Sachs Group, Inc.^ | 8,288,553 | |||||||||
212,020 | JPMorgan Chase & Company^ | 29,483,501 | |||||||||
120,287 | KKR & Company, Inc. | 6,663,900 | |||||||||
76,915 | Marsh & McLennan Cos., Inc. | 14,586,930 | |||||||||
72,315 | Mastercard, Inc. - Class A^ | 27,215,750 | |||||||||
221,340 | Morgan Stanley^ | 15,675,299 | |||||||||
15,345 | S&P Global, Inc. | 5,360,162 | |||||||||
157,631 | Starwood Property Trust, Inc.^ | 2,797,950 | |||||||||
178,525 | Visa, Inc. - Class A^ | 41,971,227 | |||||||||
411,130 | Wells Fargo & Company^ | 16,350,640 | |||||||||
259,706,206 | |||||||||||
Health Care (13.2%) | |||||||||||
82,820 | Abbott Laboratories~ | 7,830,631 | |||||||||
118,475 | AbbVie, Inc. | 16,726,300 | |||||||||
124,060 | Alcon, Inc. | 8,847,959 | |||||||||
267,298 | Boston Scientific Corp.^# | 13,682,985 | |||||||||
107,005 | Bristol-Myers Squibb Company^ | 5,513,968 | |||||||||
26,965 | Danaher Corp. | 5,177,819 | |||||||||
35,495 | Dexcom, Inc.# | 3,153,021 | |||||||||
23,435 | Elevance Health, Inc. | 10,547,859 | |||||||||
74,890 | Eli Lilly & Company^ | 41,483,818 | |||||||||
34,856 | GE Healthcare, Inc. | 2,320,364 | |||||||||
10,885 | Humana, Inc. | 5,700,366 | |||||||||
| NUMBER OF SHARES | VALUE | ||||||||||
200,940 | Johnson & Johnson | $ | 29,807,440 | ||||||||
35,440 | McKesson Corp. | 16,137,958 | |||||||||
204,155 | Medtronic, PLC | 14,405,177 | |||||||||
219,485 | Merck & Company, Inc. | 22,541,109 | |||||||||
314,685 | Pfizer, Inc. | 9,616,774 | |||||||||
20,295 | Stryker Corp. | 5,484,115 | |||||||||
30,260 | Thermo Fisher Scientific, Inc.~ | 13,458,740 | |||||||||
72,460 | UnitedHealth Group, Inc.^ | 38,806,677 | |||||||||
112,720 | Zimmer Biomet Holdings, Inc.^ | 11,769,095 | |||||||||
283,012,175 | |||||||||||
Industrials (5.8%) | |||||||||||
777,890 | CSX Corp. | 23,220,017 | |||||||||
104,568 | General Electric Company^ | 11,359,222 | |||||||||
104,790 | Honeywell International, Inc. | 19,203,815 | |||||||||
79,505 | JB Hunt Transport Services, Inc. | 13,664,524 | |||||||||
28,435 | Northrop Grumman Corp. | 13,405,112 | |||||||||
59,495 | Parker-Hannifin Corp. | 21,948,301 | |||||||||
230,220 | RTX Corp. | 18,737,606 | |||||||||
152,510 | Southwest Airlines Company | 3,390,297 | |||||||||
124,928,894 | |||||||||||
Information Technology (27.1%) | |||||||||||
56,335 | Accenture, PLC - Class A | 16,736,565 | |||||||||
21,770 | Adobe, Inc.^# | 11,582,946 | |||||||||
69,245 | Advanced Micro Devices, Inc.^# | 6,820,633 | |||||||||
1,026,970 | Apple, Inc.^~ | 175,375,667 | |||||||||
59,580 | Applied Materials, Inc. | 7,885,413 | |||||||||
35,949 | Broadcom, Inc. | 30,246,410 | |||||||||
247,515 | Cisco Systems, Inc.^ | 12,902,957 | |||||||||
58,910 | Fidelity National Information Services, Inc.^ | 2,893,070 | |||||||||
10,330 | Intuit, Inc. | 5,112,834 | |||||||||
16,960 | Lam Research Corp. | 9,976,211 | |||||||||
95,780 | Micron Technology, Inc.^ | 6,404,809 | |||||||||
574,150 | Microsoft Corp.^ | 194,125,856 | |||||||||
1,520,000 | Nokia Oyj (ADR)^ | 5,031,200 | |||||||||
161,290 | NVIDIA Corp.^†† | 65,774,062 | |||||||||
81,370 | Oracle Corp. | 8,413,658 | |||||||||
59,985 | Salesforce, Inc.# | 12,046,788 | |||||||||
21,845 | ServiceNow, Inc.# | 12,710,513 | |||||||||
584,039,592 | |||||||||||
Materials (2.6%) | |||||||||||
255,945 | Freeport-McMoRan, Inc. | 8,645,822 | |||||||||
63,970 | Linde, PLC | 24,446,775 | |||||||||
126,910 | PPG Industries, Inc. | 15,580,741 | |||||||||
36,605 | Vulcan Materials Company | 7,192,516 | |||||||||
55,865,854 | |||||||||||
CALAMOS CLOSED-END FAMILY OF FUNDS ANNUAL REPORT
154
Strategic Total Return Fund Schedule of Investments October 31, 2023
| NUMBER OF SHARES | VALUE | ||||||||||
Real Estate (0.7%) | |||||||||||
70,930 | American Tower Corp. | $ | 12,639,017 | ||||||||
119,195 | Invitation Homes, Inc. | 3,538,899 | |||||||||
16,177,916 | |||||||||||
Special Purpose Acquisition Company (0.0%) | |||||||||||
14,052 | Intelsat Emergence, SA&# | 333,735 | |||||||||
Utilities (1.1%) | |||||||||||
77,480 | CMS Energy Corp. | 4,210,263 | |||||||||
176,574 | DTE Energy Company | 17,018,202 | |||||||||
32,149 | NextEra Energy, Inc. | 1,874,287 | |||||||||
8,988 | Veralto Corp.# | 620,172 | |||||||||
23,722,924 | |||||||||||
TOTAL COMMON STOCKS (Cost $1,573,428,813) | 2,065,285,649 | ||||||||||
WARRANTS (0.0%)# | |||||||||||
Energy (0.0%) | |||||||||||
57,470 | Mcdermott International, Ltd.& 06/30/27, Strike $15.98 | 6 | |||||||||
51,723 | Mcdermott International, Ltd. 06/30/27, Strike $12.33 | 5 | |||||||||
16,676 | Tidewater, Inc. 11/14/42, Strike $0.01 | 2 | |||||||||
TOTAL WARRANTS (Cost $369,524) | 13 | ||||||||||
EXCHANGE-TRADED FUND (0.0%) | |||||||||||
Other (0.0%) | |||||||||||
11,975 | iShares Preferred & Income Securities ETF^ (Cost $395,301) | 342,245 | |||||||||
PREFERRED STOCKS (0.3%) | |||||||||||
Communication Services (0.1%) | |||||||||||
8,482 | AT&T, Inc.^ 4.750%, 02/18/25 | 146,739 | |||||||||
3,485 | AT&T, Inc. 5.350%, 11/01/66 | 73,011 | |||||||||
14,625 | Qwest Corp. 6.500%, 09/01/56 | 176,816 | |||||||||
9,521 | Telephone and Data Systems, Inc. 6.000%, 09/30/26 | 122,345 | |||||||||
24,420 | United States Cellular Corp. 5.500%, 03/01/70 | 362,881 | |||||||||
23,445 | United States Cellular Corp. 5.500%, 06/01/70 | 342,766 | |||||||||
1,224,558 | |||||||||||
| NUMBER OF SHARES | VALUE | ||||||||||
Consumer Discretionary (0.0%) | |||||||||||
2,835 | Ford Motor Company 6.200%, 06/01/59 | $ | 60,839 | ||||||||
2,764 | Ford Motor Company 6.500%, 08/15/62 | 57,823 | |||||||||
8,177 | Guitar Center, Inc.&# | 862,673 | |||||||||
605 | Qurate Retail, Inc.^ 8.000%, 03/15/31 | 14,399 | |||||||||
995,734 | |||||||||||
Energy (0.1%) | |||||||||||
12,420 | Energy Transfer, LP‡ 10.364%, 11/30/23 3 mo. LIBOR + 4.74% | 311,245 | |||||||||
43,730 | NuStar Energy, LP‡ 11.315%, 11/30/23 3 mo. LIBOR + 5.64% | 1,097,623 | |||||||||
9,119 | NuStar Energy, LP‡ 12.438%, 11/30/23 3 mo. LIBOR + 6.77% | 232,261 | |||||||||
55,760 | NuStar Logistics, LP‡ 12.390%, 01/15/43 3 mo. LIBOR + 6.73% | 1,448,645 | |||||||||
3,089,774 | |||||||||||
Financials (0.1%) | |||||||||||
3,400 | Affiliated Managers Group, Inc. 4.750%, 09/30/60 | 55,522 | |||||||||
6,000 | Allstate Corp. 7.375%, 07/15/28 | 154,620 | |||||||||
5,970 | Annaly Capital Management, Inc.‡ 10.637%, 3 mo. LIBOR + 4.99% | 144,713 | |||||||||
1,450 | Bank OZK 4.625%, 11/15/26 | 21,605 | |||||||||
1,350 | Capital One Financial Corp. 4.800%, 06/01/25 | 21,236 | |||||||||
10,725 | CNO Financial Group, Inc. 5.125%, 11/25/60 | 164,092 | |||||||||
1,732 | Cullen/Frost Bankers, Inc. 4.450%, 12/15/25 | 27,799 | |||||||||
3,401 | First Citizens BancShares, Inc. 5.625%, 01/04/27 | 65,503 | |||||||||
1,374 | Goldman Sachs Group, Inc.‡ 6.375%, 05/10/24 3 mo. SOFR + 3.81% | 34,570 | |||||||||
4,592 | KeyCorp‡ 6.200%, 12/15/27 5 year CMT + 3.13% | 76,732 | |||||||||
2,125 | Morgan Stanley^ 6.500%, 10/15/27 | 52,403 | |||||||||
7,932 | Prospect Capital Corp. 5.350%, 07/01/26 | 125,484 | |||||||||
11,100 | Reinsurance Group of America, Inc.‡ 7.125%, 10/15/52 5 year CMT + 3.46% | 283,050 | |||||||||
www.calamos.com
155
Strategic Total Return Fund Schedule of Investments October 31, 2023
| NUMBER OF SHARES | VALUE | ||||||||||
6,214 | Selective Insurance Group, Inc. 4.600%, 12/15/25 | $ | 98,181 | ||||||||
1,325,510 | |||||||||||
Industrials (0.0%) | |||||||||||
5,043 | WESCO International, Inc.‡ 10.625%, 06/22/25 5 year CMT + 10.33% | 134,446 | |||||||||
Real Estate (0.0%) | |||||||||||
8,773 | Brookfield Property Partners, LP 5.750%, 03/31/25 | 85,976 | |||||||||
5,000 | Brookfield Property Partners, LP 6.375%, 09/30/24 | 54,850 | |||||||||
3,625 | Global Net Lease, Inc. 6.875%, 11/26/24 | 57,166 | |||||||||
| 1,951 | Global Net Lease, Inc.‡‡ 7.500% | 33,167 | |||||||||
3,000 | Spirit Realty Capital, Inc. 6.000%, 11/30/23 | 66,570 | |||||||||
297,729 | |||||||||||
Utilities (0.0%) | |||||||||||
6,000 | Brookfield Renewable Partners, LP 5.250%, 03/31/25 | 96,540 | |||||||||
5,100 | DTE Energy Company 5.250%, 12/01/77 | 109,548 | |||||||||
206,088 | |||||||||||
TOTAL PREFERRED STOCKS (Cost $8,147,207) | 7,273,839 | ||||||||||
| PRINCIPAL AMOUNT | VALUE | ||||||||||
RIGHTS (0.0%)# | |||||||||||
Communication Services (0.0%) | |||||||||||
3 | Intelsat Jackson Holdings, SA, (Expires 12/5/25) | — | |||||||||
3 | Intelsat Jackson Holdings, SA, (Expires 12/5/25) | — | |||||||||
TOTAL RIGHTS (Cost $—) | — | ||||||||||
| NUMBER OF CONTRACTS/ NOTIONAL AMOUNT | VALUE | ||||||||||
PURCHASED OPTIONS (0.1%)# | |||||||||||
Other (0.1%) | |||||||||||
5,800 | iShares MSCI Emerging Markets ETF | ||||||||||
21,286,000 | Call, 12/15/23, Strike $41.00 | 20,300 | |||||||||
| NUMBER OF CONTRACTS/ NOTIONAL AMOUNT | VALUE | ||||||||||
1,500 | SPDR S&P 500 ETF Trust | ||||||||||
62,730,000 | Put, 12/15/23, Strike $420.00 | $ | 1,506,000 | ||||||||
| TOTAL PURCHASED OPTIONS(Cost $2,801,686) | 1,526,300 | ||||||||||
| TOTAL INVESTMENTS (149.1%)(Cost $2,836,458,007) | 3,206,918,798 | ||||||||||
| MANDATORY REDEEMABLE PREFERRED SHARES, AT LIQUIDATION VALUE (-15.0%) | (323,500,000 | ) | |||||||||
| LIABILITIES, LESS OTHER ASSETS (-34.1%) | (733,416,123 | ) | |||||||||
NET ASSETS (100.0%) | $ | 2,150,002,675 | |||||||||
NOTES TO SCHEDULE OF INVESTMENTS
* Securities issued and sold pursuant to a Rule 144A transaction are exempted from the registration requirement of the Securities Act of 1933, as amended. These securities may only be sold to qualified institutional buyers ("QIBs"), such as the Fund. Any resale of these securities must generally be effected through a sale that is registered under the Act or otherwise exempted from such registration requirements.
^ Security, or portion of security, is on loan.
@ In default status and considered non-income producing.
& Illiquid security.
‡ Variable rate security. The rate shown is the rate in effect at October 31, 2023.
~ Security, or portion of security, is segregated as collateral (or potential collateral for future transactions) for written options. The aggregate value of such securities is $3,850,922.
¡ Bank loans generally are subject to mandatory and/or optional prepayment. As a result, the actual remaining maturity of bank loans may be substantially less than the stated maturities shown.
! This position represents an unsettled loan commitment at period end. Certain details associated with this purchase are not known prior to the settlement date, including coupon rate, which will be adjusted on settlement date.
# Non-income producing security.
§ Securities exchangeable or convertible into securities of one or more entities that are different than the issuer. Each entity is identified in the parenthetical.
** Step coupon security. Coupon changes periodically based upon a predetermined schedule. The rate shown is the rate in effect at October 31, 2023.
µ Security, or portion of security, is held in a segregated account as collateral for note payable aggregating a total value of $131,937,238.
† Security or a portion of the security purchased on a delayed delivery or when-issued basis.
FOREIGN CURRENCY ABBREVIATION
EUR European Monetary Unit
Note: Value for securities denominated in foreign currencies is shown in U.S. dollars. The principal amount for such securities is shown in the respective foreign currency. The date on options represents the expiration date of the option contract. The option contract may be exercised at any date on or before the date shown.
CALAMOS CLOSED-END FAMILY OF FUNDS ANNUAL REPORT
156
Strategic Total Return Fund Schedule of Investments October 31, 2023
The following table summarizes the Fund's investments and derivative financial instruments categorized in the fair value hierarchy as of October 31, 2023 (see Note 1):
LEVEL 1 | LEVEL 2 | LEVEL 3 | TOTAL | ||||||||||||||||
Assets: | |||||||||||||||||||
Corporate Bonds | $ | — | $ | 388,806,056 | $ | — | $ | 388,806,056 | |||||||||||
Convertible Bonds | — | 493,508,903 | — | 493,508,903 | |||||||||||||||
Bank Loans | — | 134,268,228 | — | 133,268,228 | |||||||||||||||
U.S. Government and Agency Securities | — | 66,350,833 | — | 66,350,833 | |||||||||||||||
Convertible Preferred Stocks | 41,390,118 | 7,320,578 | — | 48,710,696 | |||||||||||||||
Common Stocks | 2,062,027,403 | 3,258,246 | — | 2,065,285,649 | |||||||||||||||
Warrants | — | 13 | — | 13 | |||||||||||||||
Exchange-Traded Funds | 342,245 | — | — | 342,245 | |||||||||||||||
Preferred Stocks | 6,068,400 | 1,205,439 | — | 7,273,839 | |||||||||||||||
Asset Backed Securities | — | 846,036 | — | 846,036 | |||||||||||||||
Purchased Options | 1,526,300 | — | — | 1,526,300 | |||||||||||||||
Total | $ | 2,111,354,466 | $ | 1,095,564,332 | $ | — | $ | 3,206,918,798 | |||||||||||
See accompanying Notes to Schedule of Investments
www.calamos.com
157
Dynamic Convertible and Income Fund Schedule of Investments October 31, 2023
| PRINCIPAL AMOUNT | VALUE | ||||||||||
ASSET BACKED SECURITY (0.0%) | |||||||||||
Other (0.0%) | |||||||||||
215,000 | SVC ABS, LLC Series 2023-1A, Class C* 6.700%, 02/20/53 (Cost $197,806) | $ | 190,469 | ||||||||
CORPORATE BONDS (17.7%) | |||||||||||
Airlines (0.3%) | |||||||||||
46,800 | Air Canada Pass Through Trust Series 2015-2, Class B* 5.000%, 06/15/25 | 46,568 | |||||||||
237,099 | Alaska Airlines Pass Through Trust Series 2020-1, Class A*µ 4.800%, 02/15/29 | 222,238 | |||||||||
112,023 | Alaska Airlines Pass Through Trust Series 2020-1, Class B* 8.000%, 02/15/27 | 111,816 | |||||||||
287,560 | American Airlines Pass Through Trust Series 2021-1, Class B 3.950%, 01/11/32 | 245,257 | |||||||||
163,333 | American Airlines, Inc. / AAdvantage Loyalty IP, Ltd.* 5.500%, 04/20/26 | 158,891 | |||||||||
65,000 | 5.750%, 04/20/29 | 58,668 | |||||||||
267,259 | British Airways Pass Through Trust Series 2021-1, Class B* 3.900%, 03/15/33 | 232,221 | |||||||||
273,487 | JetBlue Pass Through Trust Series 2020-1, Class B 7.750%, 05/15/30 | 271,920 | |||||||||
185,000 | Spirit Loyalty Cayman, Ltd. / Spirit IP Cayman, Ltd.* 8.000%, 09/20/25 | 137,379 | |||||||||
1,484,958 | |||||||||||
Communication Services (2.0%) | |||||||||||
200,000 | Altice France Holding, SA* 10.500%, 05/15/27 | 110,264 | |||||||||
300,000 | Altice France, SA* 5.500%, 10/15/29 | 207,759 | |||||||||
320,000 | APi Group DE, Inc.* 4.750%, 10/15/29 | 275,942 | |||||||||
395,000 | Arrow Bidco, LLC* 9.500%, 03/15/24 | 400,285 | |||||||||
280,000 | Ashtead Capital, Inc.* 2.450%, 08/12/31 | 206,550 | |||||||||
336,000 | Audacy Capital Corp.* 6.750%, 03/31/29 | 5,460 | |||||||||
131,000 | 6.500%, 05/01/27 | 1,965 | |||||||||
242,000 | Cincinnati Bell Telephone Company, LLC 6.300%, 12/01/28 | 195,834 | |||||||||
80,000 | Clear Channel Outdoor Holdings, Inc.* 9.000%, 09/15/28 | 78,012 | |||||||||
| PRINCIPAL AMOUNT | VALUE | ||||||||||
405,000 | Consolidated Communications, Inc.*^ 6.500%, 10/01/28 | $ | 321,436 | ||||||||
400,000 | CSC Holdings, LLC* 5.375%, 02/01/28 | 318,952 | |||||||||
400,000 | 4.625%, 12/01/30 | 203,180 | |||||||||
400,000 | 4.500%, 11/15/31 | 264,616 | |||||||||
370,000 | 5.500%, 04/15/27 | 309,290 | |||||||||
200,000 | 5.750%, 01/15/30 | 105,430 | |||||||||
210,000 | Diamond Sports Group, LLC / Diamond Sports Finance Company*@ 6.625%, 08/15/27 | 2,663 | |||||||||
146,000 | 5.375%, 08/15/26 | 1,790 | |||||||||
678,000 | Directv Financing, LLC / Directv Financing Co-Obligor, Inc.* 5.875%, 08/15/27 | 594,199 | |||||||||
275,000 | Frontier California, Inc. 6.750%, 05/15/27 | 253,913 | |||||||||
169,000 | Frontier Communications Holdings, LLC* 5.000%, 05/01/28 | 146,673 | |||||||||
65,000 | 8.750%, 05/15/30 | 62,005 | |||||||||
289,000 | Frontier Florida, LLC@ 6.860%, 02/01/28 | 266,042 | |||||||||
400,000 | Frontier North, Inc.@ 6.730%, 02/15/28 | 371,068 | |||||||||
235,000 | Go Daddy Operating Company, LLC / GD Finance Company, Inc.* 3.500%, 03/01/29 | 198,620 | |||||||||
69,000 | 5.250%, 12/01/27 | 65,244 | |||||||||
100,000 | iHeartCommunications, Inc. 8.375%, 05/01/27^ | 61,376 | |||||||||
100,000 | 5.250%, 08/15/27* | 73,402 | |||||||||
200,000 | Intelsat Jackson Holdings, SA@& 9.750%, 07/15/25* | — | |||||||||
135,000 | 0.000%, 08/01/23 | — | |||||||||
330,000 | LCPR Senior Secured Financing DAC* 6.750%, 10/15/27 | 299,020 | |||||||||
198,330 | Ligado Networks, LLC* 15.500%, 11/01/23 PIK rate | 49,991 | |||||||||
200,000 | Lumen Technologies, Inc. 7.600%, 09/15/39 | 54,428 | |||||||||
135,000 | 4.000%, 02/15/27*^ | 92,304 | |||||||||
67,000 | 7.650%, 03/15/42 | 18,046 | |||||||||
130,000 | Match Group Holdings II, LLC* 3.625%, 10/01/31 | 100,654 | |||||||||
220,000 | Nexstar Media, Inc.* 5.625%, 07/15/27 | 198,106 | |||||||||
390,000 | Paramount Global 4.900%, 08/15/44 | 245,677 | |||||||||
94,000 | Qwest Corp. 7.250%, 09/15/25 | 90,268 | |||||||||
136,000 | Scripps Escrow II, Inc.* 3.875%, 01/15/29 | 103,303 | |||||||||
68,000 | 5.375%, 01/15/31 | 42,254 | |||||||||
CALAMOS CLOSED-END FAMILY OF FUNDS ANNUAL REPORT
158
Dynamic Convertible and Income Fund Schedule of Investments October 31, 2023
| PRINCIPAL AMOUNT | VALUE | ||||||||||
225,000 | Scripps Escrow, Inc.* 5.875%, 07/15/27 | $ | 168,426 | ||||||||
345,000 | Sirius XM Radio, Inc.* 5.500%, 07/01/29 | 305,994 | |||||||||
268,000 | 4.000%, 07/15/28 | 228,020 | |||||||||
130,000 | 3.125%, 09/01/26 | 116,804 | |||||||||
65,000 | 3.875%, 09/01/31 | 48,960 | |||||||||
242,000 | Spanish Broadcasting System, Inc.* 9.750%, 03/01/26 | 150,812 | |||||||||
680,000 | Sprint, LLCµ 7.125%, 06/15/24 | 683,869 | |||||||||
300,000 | Stagwell Global, LLC* 5.625%, 08/15/29 | 248,208 | |||||||||
210,000 | Telecom Italia Capital, SA 6.000%, 09/30/34 | 172,973 | |||||||||
260,000 | Telesat Canada / Telesat, LLC* 4.875%, 06/01/27 | 155,678 | |||||||||
105,000 | Time Warner Cable, LLC 7.300%, 07/01/38 | 98,349 | |||||||||
300,000 | United States Cellular Corp. 6.700%, 12/15/33 | 285,705 | |||||||||
100,000 | Univision Communications, Inc.* 8.000%, 08/15/28 | 94,772 | |||||||||
135,000 | Viasat, Inc.* 5.625%, 04/15/27 | 118,117 | |||||||||
9,272,708 | |||||||||||
Consumer Discretionary (3.7%) | |||||||||||
320,000 | Abercrombie & Fitch Management Company* 8.750%, 07/15/25 | 325,338 | |||||||||
265,000 | Adams Homes, Inc.* 9.250%, 10/15/28 | 260,124 | |||||||||
330,000 | Adient Global Holdings Company* 8.250%, 04/15/31 | 322,925 | |||||||||
213,000 | American Axle & Manufacturing, Inc. 6.875%, 07/01/28 | 189,838 | |||||||||
228,000 | Ashton Woods USA, LLC / Ashton Woods Finance Company* 4.625%, 08/01/29 | 185,307 | |||||||||
204,000 | 6.625%, 01/15/28 | 187,229 | |||||||||
325,000 | At Home Group, Inc.* 4.875%, 07/15/28 | 112,938 | |||||||||
355,000 | Bath & Body Works, Inc. 6.694%, 01/15/27 | 344,041 | |||||||||
330,000 | 6.875%, 11/01/35^ | 291,684 | |||||||||
168,000 | Caesars Entertainment, Inc.*^ 4.625%, 10/15/29 | 138,313 | |||||||||
132,000 | 8.125%, 07/01/27 | 130,857 | |||||||||
280,000 | Carnival Corp.* 6.000%, 05/01/29 | 236,813 | |||||||||
134,000 | 4.000%, 08/01/28 | 116,745 | |||||||||
133,000 | 7.625%, 03/01/26 | 129,397 | |||||||||
16,000 | 7.000%, 08/15/29 | 15,719 | |||||||||
| PRINCIPAL AMOUNT | VALUE | ||||||||||
315,000 | Carriage Services, Inc.* 4.250%, 05/15/29 | $ | 257,963 | ||||||||
52,000 | Carvana Company* 14.000%, 06/01/31 | 39,135 | |||||||||
44,000 | 13.000%, 06/01/30 | 33,020 | |||||||||
29,000 | 12.000%, 12/01/28 | 21,719 | |||||||||
575,000 | CCO Holdings, LLC / CCO Holdings Capital Corp.* 5.125%, 05/01/27 | 529,805 | |||||||||
315,000 | 4.500%, 08/15/30 | 253,172 | |||||||||
300,000 | 6.375%, 09/01/29 | 275,820 | |||||||||
300,000 | 4.750%, 03/01/30 | 247,824 | |||||||||
266,000 | 4.250%, 02/01/31 | 207,251 | |||||||||
130,000 | 5.000%, 02/01/28 | 116,467 | |||||||||
130,000 | 4.750%, 02/01/32 | 101,620 | |||||||||
130,000 | CDI Escrow Issuer, Inc.* 5.750%, 04/01/30 | 116,498 | |||||||||
207,000 | Cedar Fair, LP^ 5.250%, 07/15/29 | 179,032 | |||||||||
132,000 | Churchill Downs, Inc.* 6.750%, 05/01/31 | 123,413 | |||||||||
220,000 | Dana, Inc. 4.250%, 09/01/30 | 175,056 | |||||||||
195,000 | 4.500%, 02/15/32 | 152,837 | |||||||||
325,000 | DISH DBS Corp. 5.250%, 12/01/26* | 262,915 | |||||||||
215,000 | 7.750%, 07/01/26 | 144,271 | |||||||||
168,000 | 7.375%, 07/01/28 | 94,718 | |||||||||
130,000 | 5.125%, 06/01/29 | 67,088 | |||||||||
265,000 | DISH Network Corp.* 11.750%, 11/15/27 | 262,708 | |||||||||
400,000 | Empire Resorts, Inc.* 7.750%, 11/01/26 | 327,572 | |||||||||
296,000 | Everi Holdings, Inc.* 5.000%, 07/15/29 | 248,983 | |||||||||
275,000 | Ford Motor Company^ 6.100%, 08/19/32 | 254,595 | |||||||||
425,000 | Ford Motor Credit Company, LLC 4.000%, 11/13/30 | 350,446 | |||||||||
350,000 | 5.113%, 05/03/29 | 317,877 | |||||||||
340,000 | 7.200%, 06/10/30 | 339,616 | |||||||||
240,000 | 7.350%, 11/04/27 | 243,130 | |||||||||
200,000 | 7.350%, 03/06/30 | 201,228 | |||||||||
98,000 | Gap, Inc.* 3.875%, 10/01/31 | 70,700 | |||||||||
135,000 | General Motors Company 5.200%, 04/01/45 | 100,069 | |||||||||
460,000 | goeasy, Ltd.* 5.375%, 12/01/24^ | 452,120 | |||||||||
241,000 | 4.375%, 05/01/26 | 218,454 | |||||||||
140,000 | Goodyear Tire & Rubber Company^ 5.250%, 07/15/31 | 114,187 | |||||||||
114,000 | Group 1 Automotive, Inc.* 4.000%, 08/15/28 | 98,532 | |||||||||
See accompanying Notes to Schedule of Investments
www.calamos.com
159
Dynamic Convertible and Income Fund Schedule of Investments October 31, 2023
| PRINCIPAL AMOUNT | VALUE | ||||||||||
283,000 | Guitar Center, Inc.*^ 8.500%, 01/15/26 | $ | 239,183 | ||||||||
145,000 | International Game Technology, PLC* 6.250%, 01/15/27 | 141,481 | |||||||||
78,592 | JetBlue Pass Through Trust Series 2019-2, Class B 8.000%, 11/15/27 | 79,118 | |||||||||
233,000 | Kohl's Corp. 5.550%, 07/17/45 | 134,711 | |||||||||
265,000 | LCM Investments Holdings II, LLC* 8.250%, 08/01/31 | 253,984 | |||||||||
265,000 | Liberty Interactive, LLC 8.250%, 02/01/30 | 69,814 | |||||||||
256,000 | Life Time, Inc.* 8.000%, 04/15/26 | 250,191 | |||||||||
135,000 | 5.750%, 01/15/26 | 130,931 | |||||||||
135,000 | Light & Wonder International, Inc.* 7.500%, 09/01/31 | 132,044 | |||||||||
100,000 | Lindblad Expeditions Holdings, Inc.* 9.000%, 05/15/28 | 98,030 | |||||||||
168,000 | Lindblad Expeditions, LLC* 6.750%, 02/15/27 | 152,759 | |||||||||
175,000 | M/I Homes, Inc. 3.950%, 02/15/30 | 140,033 | |||||||||
440,000 | Macy's Retail Holdings, LLC 6.700%, 07/15/34* | 339,271 | |||||||||
135,000 | 4.300%, 02/15/43 | 74,080 | |||||||||
310,000 | Mclaren Finance, PLC* 7.500%, 08/01/26 | 267,639 | |||||||||
332,000 | Midwest Gaming Borrower, LLC / Midwest Gaming Finance Corp.* 4.875%, 05/01/29 | 277,144 | |||||||||
160,000 | Newell Brands, Inc. 5.200%, 04/01/26 | 151,131 | |||||||||
130,000 | Nordstrom, Inc. 5.000%, 01/15/44 | 78,285 | |||||||||
123,000 | 4.250%, 08/01/31 | 90,174 | |||||||||
305,000 | PENN Entertainment, Inc.*^ 4.125%, 07/01/29 | 237,186 | |||||||||
250,000 | PetSmart, Inc. / PetSmart Finance Corp.* 4.750%, 02/15/28 | 221,408 | |||||||||
365,000 | Premier Entertainment Sub, LLC / Premier Entertainment Finance Corp.*^ 5.625%, 09/01/29 | 256,883 | |||||||||
659,000 | Rite Aid Corp.*@ 8.000%, 11/15/26 | 458,262 | |||||||||
132,000 | Royal Caribbean Cruises, Ltd.* 7.250%, 01/15/30 | 130,585 | |||||||||
370,000 | Simmons Foods, Inc. / Simmons Prepared Foods, Inc. / Simmons Pet Food, Inc. / Simmons Feed* 4.625%, 03/01/29 | 300,877 | |||||||||
530,000 | Six Flags Entertainment Corp.*^ 7.250%, 05/15/31 | 488,241 | |||||||||
| PRINCIPAL AMOUNT | VALUE | ||||||||||
303,000 | Sonic Automotive, Inc.*^ 4.625%, 11/15/29 | $ | 252,678 | ||||||||
193,000 | Speedway Motorsports, LLC / Speedway Funding II, Inc.* 4.875%, 11/01/27 | 172,837 | |||||||||
545,000 | Station Casinos, LLC* 4.500%, 02/15/28 | 471,212 | |||||||||
162,000 | Taylor Morrison Communities, Inc.* 5.750%, 01/15/28 | 147,567 | |||||||||
65,000 | Viking Cruises, Ltd.* 9.125%, 07/15/31 | 63,947 | |||||||||
300,000 | Vista Outdoor, Inc.* 4.500%, 03/15/29 | 279,480 | |||||||||
135,000 | Windsor Holdings III, LLC* 8.500%, 06/15/30 | 132,530 | |||||||||
265,000 | ZF North America Capital, Inc.* 7.125%, 04/14/30 | 257,925 | |||||||||
16,958,730 | |||||||||||
Consumer Staples (0.8%) | |||||||||||
303,000 | 1375209 B.C., Ltd.* 9.000%, 01/30/28 | 294,583 | |||||||||
255,000 | B&G Foods, Inc.* 8.000%, 09/15/28 | 248,941 | |||||||||
305,000 | Central Garden & Pet Company* 4.125%, 04/30/31 | 243,771 | |||||||||
304,000 | Edgewell Personal Care Company* 4.125%, 04/01/29 | 255,643 | |||||||||
370,000 | Energizer Holdings, Inc.* 4.375%, 03/31/29 | 304,636 | |||||||||
66,000 | 6.500%, 12/31/27 | 62,008 | |||||||||
390,000 | JBS USA LUX, SA / JBS USA Food Company / JBS USA Finance, Inc. 5.500%, 01/15/30^ | 356,823 | |||||||||
175,000 | 5.125%, 02/01/28µ | 164,358 | |||||||||
100,000 | 5.750%, 04/01/33 | 88,047 | |||||||||
177,000 | New Albertsons, LP 7.750%, 06/15/26 | 178,970 | |||||||||
261,000 | Performance Food Group, Inc.* 4.250%, 08/01/29 | 221,471 | |||||||||
210,000 | Pilgrim's Pride Corp. 4.250%, 04/15/31 | 173,508 | |||||||||
115,000 | Post Holdings, Inc.* 5.750%, 03/01/27 | 109,801 | |||||||||
252,000 | Prestige Brands, Inc.* 3.750%, 04/01/31 | 200,889 | |||||||||
240,000 | United Natural Foods, Inc.*^ 6.750%, 10/15/28 | 187,817 | |||||||||
413,000 | Vector Group, Ltd.* 5.750%, 02/01/29 | 350,691 | |||||||||
130,000 | Williams Scotsman, Inc.* 7.375%, 10/01/31 | 128,366 | |||||||||
3,570,323 | |||||||||||
CALAMOS CLOSED-END FAMILY OF FUNDS ANNUAL REPORT
160
Dynamic Convertible and Income Fund Schedule of Investments October 31, 2023
| PRINCIPAL AMOUNT | VALUE | ||||||||||
Energy (2.3%) | |||||||||||
267,000 | Antero Resources Corp.* 5.375%, 03/01/30 | $ | 244,049 | ||||||||
268,000 | Apache Corp. 5.100%, 09/01/40 | 208,659 | |||||||||
210,000 | Buckeye Partners, LP 3.950%, 12/01/26 | 191,665 | |||||||||
135,000 | 5.850%, 11/15/43 | 95,615 | |||||||||
365,000 | Callon Petroleum Company*^ 7.500%, 06/15/30 | 353,824 | |||||||||
129,000 | Cheniere Energy, Inc.µ 4.625%, 10/15/28 | 117,932 | |||||||||
198,000 | Chesapeake Energy Corp.* 6.750%, 04/15/29 | 194,284 | |||||||||
371,000 | Civitas Resources, Inc.* 8.750%, 07/01/31 | 374,899 | |||||||||
200,000 | Continental Resources, Inc.* 2.875%, 04/01/32 | 148,158 | |||||||||
135,000 | 5.750%, 01/15/31 | 125,320 | |||||||||
202,000 | DT Midstream, Inc.* 4.125%, 06/15/29 | 173,954 | |||||||||
256,000 | Earthstone Energy Holdings, LLC* 8.000%, 04/15/27 | 259,884 | |||||||||
100,000 | 9.875%, 07/15/31 | 107,911 | |||||||||
150,000 | Enbridge, Inc.^‡ 7.375%, 01/15/83 5 year CMT + 3.71% | 139,585 | |||||||||
390,000 | Energy Transfer, LP‡ 8.656%, 11/01/66^ 3 mo. SOFR + 3.28% | 318,864 | |||||||||
197,000 | 6.500%, 11/01/35 5 year CMT + 5.69% | 179,024 | |||||||||
340,000 | EnLink Midstream Partners, LP 9.780%, 11/01/35‡ 3 mo. USD LIBOR + 4.11% | 303,623 | |||||||||
285,000 | 4.850%, 07/15/26 | 269,476 | |||||||||
168,000 | Enlink Midstream, LLC* 6.500%, 09/01/30 | 161,522 | |||||||||
430,000 | EQM Midstream Partners, LP* 7.500%, 06/01/27 | 427,489 | |||||||||
196,000 | Genesis Energy, LP / Genesis Energy Finance Corp. 8.875%, 04/15/30 | 190,577 | |||||||||
109,000 | 6.250%, 05/15/26 | 104,058 | |||||||||
260,000 | Gulfport Energy Corp. 0.000%, 05/15/25@& | — | |||||||||
255,000 | 8.000%, 05/17/26* | 255,107 | |||||||||
79,461 | 8.000%, 05/17/26 | 79,494 | |||||||||
365,000 | Hilcorp Energy I, LP / Hilcorp Finance Company* 6.000%, 04/15/30 | 324,547 | |||||||||
196,000 | Howard Midstream Energy Partners, LLC* 6.750%, 01/15/27 | 186,400 | |||||||||
| PRINCIPAL AMOUNT | VALUE | ||||||||||
262,000 | Magnolia Oil & Gas Operating, LLC / Magnolia Oil & Gas Finance Corp.* 6.000%, 08/01/26 | $ | 250,676 | ||||||||
145,000 | Moss Creek Resources Holdings, Inc.* 10.500%, 05/15/27 | 143,512 | |||||||||
130,000 | 7.500%, 01/15/26 | 124,444 | |||||||||
200,000 | Nabors Industries, Inc.* 7.375%, 05/15/27 | 187,288 | |||||||||
200,000 | Nabors Industries, Ltd.* 7.500%, 01/15/28 | 176,728 | |||||||||
272,000 | New Fortress Energy, Inc.* 6.750%, 09/15/25 | 253,134 | |||||||||
135,000 | 6.500%, 09/30/26 | 121,026 | |||||||||
131,000 | Oceaneering International, Inc.* 6.000%, 02/01/28 | 120,131 | |||||||||
280,000 | Parkland Corp.* 5.875%, 07/15/27 | 269,262 | |||||||||
138,000 | Patterson-UTI Energy, Inc. 5.150%, 11/15/29 | 123,284 | |||||||||
66,000 | Permian Resources Operating LLC* 7.000%, 01/15/32 | 64,581 | |||||||||
270,000 | Plains All American Pipeline, LP‡ 9.736%, 11/01/35 3 mo. USD LIBOR + 4.11% | 254,864 | |||||||||
365,000 | Rockcliff Energy II, LLC* 5.500%, 10/15/29 | 331,296 | |||||||||
135,000 | Southwestern Energy Company 5.375%, 02/01/29 | 125,068 | |||||||||
130,000 | 4.750%, 02/01/32 | 111,925 | |||||||||
65,000 | Sunoco, LP / Sunoco Finance Corp. 4.500%, 04/30/30 | 55,927 | |||||||||
375,250 | Transocean, Inc.* 8.750%, 02/15/30 | 374,946 | |||||||||
165,000 | Venture Global Calcasieu Pass, LLC* 6.250%, 01/15/30 | 155,763 | |||||||||
65,000 | 4.125%, 08/15/31 | 52,545 | |||||||||
65,000 | 3.875%, 08/15/29 | 54,447 | |||||||||
330,000 | Venture Global LNG, Inc.* 8.375%, 06/01/31 | 315,150 | |||||||||
200,000 | 8.125%, 06/01/28 | 194,324 | |||||||||
135,000 | 9.875%, 02/01/32 | 137,007 | |||||||||
65,000 | 9.500%, 02/01/29 | 65,977 | |||||||||
249,000 | Vital Energy, Inc. 9.500%, 01/15/25 | 250,350 | |||||||||
165,000 | 7.750%, 07/31/29*^ | 149,127 | |||||||||
33,000 | 9.750%, 10/15/30 | 32,365 | |||||||||
275,000 | VOC Escrow, Ltd.* 5.000%, 02/15/28 | 248,069 | |||||||||
327,000 | Weatherford International, Ltd.* 8.625%, 04/30/30 | 330,931 | |||||||||
10,610,067 | |||||||||||
www.calamos.com
161
Dynamic Convertible and Income Fund Schedule of Investments October 31, 2023
| PRINCIPAL AMOUNT | VALUE | ||||||||||
Financials (2.8%) | |||||||||||
356,000 | Acrisure, LLC / Acrisure Finance, Inc.* 7.000%, 11/15/25 | $ | 345,861 | ||||||||
400,000 | Aethon United BR, LP / Aethon United Finance Corp.* 8.250%, 02/15/26 | 397,764 | |||||||||
390,000 | AG Issuer, LLC* 6.250%, 03/01/28 | 361,405 | |||||||||
460,000 | Alliant Holdings Intermediate, LLC / Alliant Holdings Co-Issuer* 6.750%, 10/15/27 | 420,201 | |||||||||
427,000 | Ally Financial, Inc. 4.700%, 11/01/35 7 year CMT + 3.48%‡ | 270,475 | |||||||||
110,000 | 8.000%, 11/01/31 | 107,566 | |||||||||
533,000 | AmWINS Group, Inc.* 4.875%, 06/30/29 | 457,549 | |||||||||
292,000 | Aviation Capital Group, LLC*µ 3.500%, 11/01/27 | 256,651 | |||||||||
110,000 | Avolon Holdings Funding, Ltd.*µ 5.500%, 01/15/26 | 106,025 | |||||||||
533,000 | BroadStreet Partners, Inc.* 5.875%, 04/15/29 | 465,085 | |||||||||
250,000 | Brookfield Property REIT, Inc. / BPR Cumulus, LLC / BPR Nimbus, LLC / GGSI Sellco, LLC* 4.500%, 04/01/27 | 208,630 | |||||||||
169,000 | 5.750%, 05/15/26 | 154,998 | |||||||||
200,000 | Burford Capital Global Financial, LLC* 6.875%, 04/15/30 | 181,068 | |||||||||
350,000 | Credit Acceptance Corp. 6.625%, 03/15/26^ | 333,606 | |||||||||
238,000 | 5.125%, 12/31/24* | 230,434 | |||||||||
265,000 | Cushman & Wakefield U.S. Borrower LLC*^ 8.875%, 09/01/31 | 251,777 | |||||||||
344,000 | Enact Holdings, Inc.*µ 6.500%, 08/15/25 | 338,809 | |||||||||
389,000 | Global Net Lease, Inc. / Global Net Lease Operating Partnership, LP* 3.750%, 12/15/27 | 295,453 | |||||||||
275,000 | GTCR W-2 Merger Sub, LLC* 7.500%, 01/15/31 | 271,477 | |||||||||
398,000 | HUB International, Ltd.* 5.625%, 12/01/29^ | 343,581 | |||||||||
202,000 | 7.000%, 05/01/26 | 197,019 | |||||||||
202,000 | Icahn Enterprises, LP / Icahn Enterprises Finance Corp. 4.375%, 02/01/29 | 156,740 | |||||||||
360,000 | ILFC E-Capital Trust II*‡ 7.459%, 12/21/65 3 mo. USD LIBOR + 1.80% | 270,781 | |||||||||
| PRINCIPAL AMOUNT | VALUE | ||||||||||
550,000 | Iron Mountain, Inc.* 5.250%, 03/15/28 | $ | 503,921 | ||||||||
66,000 | 7.000%, 02/15/29 | 64,103 | |||||||||
540,000 | Jefferies Finance, LLC / JFIN Co-Issuer Corp.* 5.000%, 08/15/28 | 433,161 | |||||||||
522,000 | Ladder Capital Finance Holdings, LLLP / Ladder Capital Finance Corp.* 5.250%, 10/01/25 | 497,675 | |||||||||
130,000 | 4.750%, 06/15/29 | 104,933 | |||||||||
245,000 | LD Holdings Group, LLC* 6.125%, 04/01/28 | 137,286 | |||||||||
280,000 | Level 3 Financing, Inc.* 4.250%, 07/01/28 | 158,561 | |||||||||
218,000 | 3.400%, 03/01/27^ | 202,849 | |||||||||
135,000 | 4.625%, 09/15/27 | 91,113 | |||||||||
200,000 | LPL Holdings, Inc.* 4.000%, 03/15/29 | 172,074 | |||||||||
265,000 | Macquarie Airfinance Holdings, Ltd.* 8.125%, 03/30/29 | 261,372 | |||||||||
417,000 | MetLife, Inc. 6.400%, 12/15/66 | 391,767 | |||||||||
365,000 | Nationstar Mortgage Holdings, Inc.* 5.500%, 08/15/28 | 323,441 | |||||||||
288,000 | Navient Corp. 5.000%, 03/15/27 | 254,010 | |||||||||
145,000 | 4.875%, 03/15/28 | 120,302 | |||||||||
300,000 | Necessity Retail REIT, Inc. / American Finance Operating Partner, LP* 4.500%, 09/30/28 | 224,895 | |||||||||
185,000 | OneMain Finance Corp. 9.000%, 01/15/29 | 180,887 | |||||||||
180,000 | 3.875%, 09/15/28 | 143,354 | |||||||||
127,000 | 7.125%, 03/15/26^ | 123,607 | |||||||||
132,000 | Park Intermediate Holdings, LLC / PK Domestic Property, LLC / PK Finance Co-Issuer*^ 5.875%, 10/01/28 | 119,203 | |||||||||
416,000 | PHH Mortgage Corp.* 7.875%, 03/15/26 | 360,759 | |||||||||
300,000 | RHP Hotel Properties, LP / RHP Finance Corp.* 4.500%, 02/15/29 | 255,735 | |||||||||
125,000 | Rocket Mortgage, LLC / Rocket Mortgage Co-Issuer, Inc.* 3.625%, 03/01/29^ | 101,750 | |||||||||
120,000 | 3.875%, 03/01/31 | 92,880 | |||||||||
65,000 | 2.875%, 10/15/26 | 56,768 | |||||||||
269,000 | StoneX Group, Inc.* 8.625%, 06/15/25 | 270,611 | |||||||||
310,000 | United Wholesale Mortgage, LLC* 5.500%, 04/15/29 | 259,699 | |||||||||
130,000 | 5.750%, 06/15/27 | 118,629 | |||||||||
CALAMOS CLOSED-END FAMILY OF FUNDS ANNUAL REPORT
162
Dynamic Convertible and Income Fund Schedule of Investments October 31, 2023
| PRINCIPAL AMOUNT | VALUE | ||||||||||
135,000 | Uniti Group, LP / Uniti Group Finance, Inc. / CSL Capital, LLC* 6.500%, 02/15/29^ | $ | 87,788 | ||||||||
132,000 | 10.500%, 02/15/28 | 127,278 | |||||||||
300,000 | VZ Secured Financing, BV* 5.000%, 01/15/32 | 228,621 | |||||||||
280,000 | XHR, LP*^ 6.375%, 08/15/25 | 273,266 | |||||||||
13,165,253 | |||||||||||
Health Care (1.2%) | |||||||||||
539,000 | Bausch Health Companies, Inc.* 11.000%, 09/30/28 | 329,954 | |||||||||
105,000 | 14.000%, 10/15/30 | 57,844 | |||||||||
98,000 | 6.125%, 02/01/27 | 54,753 | |||||||||
533,000 | CHS/Community Health Systems, Inc.* 6.125%, 04/01/30 | 207,188 | |||||||||
305,000 | 8.000%, 03/15/26 | 279,258 | |||||||||
146,000 | 6.875%, 04/15/29 | 60,270 | |||||||||
33,000 | 5.250%, 05/15/30 | 23,462 | |||||||||
531,000 | DaVita, Inc.* 4.625%, 06/01/30 | 416,628 | |||||||||
313,000 | 3.750%, 02/15/31 | 225,341 | |||||||||
195,000 | Embecta Corp.* 5.000%, 02/15/30 | 155,002 | |||||||||
67,000 | 6.750%, 02/15/30 | 55,575 | |||||||||
130,000 | Encompass Health Corp. 4.750%, 02/01/30 | 112,850 | |||||||||
130,000 | 4.500%, 02/01/28 | 117,315 | |||||||||
282,000 | HCA, Inc. 7.500%, 11/06/33 | 289,484 | |||||||||
200,000 | Jazz Securities DAC* 4.375%, 01/15/29 | 173,966 | |||||||||
116,075 | Mallinckrodt International Finance, SA / Mallinckrodt CB, LLC*@ 10.000%, 06/15/29 | 8,251 | |||||||||
336,000 | Medline Borrower, LP* 5.250%, 10/01/29^ | 286,359 | |||||||||
335,000 | 3.875%, 04/01/29 | 282,991 | |||||||||
490,000 | Organon & Company / Organon Foreign Debt Co-Issuer, BV* 5.125%, 04/30/31 | 383,807 | |||||||||
200,000 | 4.125%, 04/30/28 | 173,086 | |||||||||
302,000 | Team Health Holdings, Inc.* 6.375%, 02/01/25 | 242,494 | |||||||||
625,000 | Tenet Healthcare Corp. 6.250%, 02/01/27 | 601,325 | |||||||||
375,000 | 6.875%, 11/15/31 | 346,429 | |||||||||
335,000 | Teva Pharmaceutical Finance Netherlands III, BV 5.125%, 05/09/29^ | 292,435 | |||||||||
200,000 | 4.750%, 05/09/27 | 181,566 | |||||||||
130,000 | 3.150%, 10/01/26 | 114,436 | |||||||||
5,472,069 | |||||||||||
| PRINCIPAL AMOUNT | VALUE | ||||||||||
Industrials (2.6%) | |||||||||||
300,000 | ACCO Brands Corp.*^ 4.250%, 03/15/29 | $ | 249,171 | ||||||||
300,000 | AerCap Holdings, NV^‡ 5.875%, 10/10/79 5 year CMT + 4.54% | 282,186 | |||||||||
265,000 | Air Lease Corp.‡ 4.125%, 11/01/35 5 year CMT + 3.15% | 190,649 | |||||||||
440,000 | Albertsons Companies, Inc. / Safeway, Inc. / New Albertsons, LP / Albertsons, LLC* 4.625%, 01/15/27 | 414,141 | |||||||||
203,000 | 3.500%, 03/15/29 | 173,238 | |||||||||
195,000 | 5.875%, 02/15/28 | 187,081 | |||||||||
300,000 | Allegiant Travel Company* 7.250%, 08/15/27 | 273,234 | |||||||||
65,000 | American Airlines Group, Inc.* 3.750%, 03/01/25 | 60,862 | |||||||||
146,000 | Arcosa, Inc.* 4.375%, 04/15/29 | 127,839 | |||||||||
700,000 | ARD Finance, SA* 6.500%, 06/30/27 7.250% PIK Rate | 408,744 | |||||||||
206,000 | Beacon Roofing Supply, Inc.* 4.125%, 05/15/29 | 173,149 | |||||||||
135,000 | Bombardier, Inc.* 7.875%, 04/15/27 | 130,073 | |||||||||
261,000 | BWX Technologies, Inc.* 4.125%, 04/15/29 | 225,794 | |||||||||
273,000 | Cascades, Inc. / Cascades USA, Inc.* 5.375%, 01/15/28 | 248,097 | |||||||||
68,000 | Delta Air Lines, Inc. / SkyMiles IP, Ltd.*µ 4.750%, 10/20/28 | 63,915 | |||||||||
350,000 | Deluxe Corp.* 8.000%, 06/01/29 | 277,399 | |||||||||
195,000 | Eco Material Technologies, Inc.* 7.875%, 01/31/27 | 185,542 | |||||||||
132,000 | Emerald Debt Merger Sub, LLC* 6.625%, 12/15/30 | 125,751 | |||||||||
145,000 | EnerSys* 4.375%, 12/15/27 | 130,246 | |||||||||
161,000 | Graham Packaging Company, Inc.* 7.125%, 08/15/28 | 125,173 | |||||||||
175,000 | Graphic Packaging International, LLC* 4.750%, 07/15/27^ | 163,536 | |||||||||
125,000 | 3.500%, 03/01/29 | 104,996 | |||||||||
290,000 | Great Lakes Dredge & Dock Corp.*^ 5.250%, 06/01/29 | 237,588 | |||||||||
623,000 | H&E Equipment Services, Inc.* 3.875%, 12/15/28 | 529,052 | |||||||||
402,000 | Hawaiian Brand Intellectual Property, Ltd. / HawaiianMiles Loyalty, Ltd.* 5.750%, 01/20/26 | 297,400 | |||||||||
www.calamos.com
163
Dynamic Convertible and Income Fund Schedule of Investments October 31, 2023
| PRINCIPAL AMOUNT | VALUE | ||||||||||
350,000 | Herc Holdings, Inc.* 5.500%, 07/15/27 | $ | 329,703 | ||||||||
310,000 | IEA Energy Services, LLC* 6.625%, 08/15/29 | 296,143 | |||||||||
160,000 | JELD-WEN, Inc.* 4.625%, 12/15/25 | 151,992 | |||||||||
135,000 | 4.875%, 12/15/27^ | 115,274 | |||||||||
445,000 | Ken Garff Automotive, LLC* 4.875%, 09/15/28 | 379,207 | |||||||||
265,000 | Knife River Holding Company* 7.750%, 05/01/31 | 264,425 | |||||||||
134,000 | MasTec, Inc.*µ 4.500%, 08/15/28 | 117,825 | |||||||||
170,000 | Moog, Inc.* 4.250%, 12/15/27 | 154,367 | |||||||||
323,000 | Newfold Digital Holdings Group, Inc.*^ 6.000%, 02/15/29 | 213,545 | |||||||||
272,000 | Novelis Corp.* 4.750%, 01/30/30 | 231,894 | |||||||||
100,000 | OI European Group, BV* 4.750%, 02/15/30 | 85,148 | |||||||||
310,000 | Pactiv Evergreen Group Issuer, Inc. / Pactiv Evergreen Group Issuer, LLC* 4.000%, 10/15/27 | 272,930 | |||||||||
399,000 | Patrick Industries, Inc.* 4.750%, 05/01/29 | 328,022 | |||||||||
135,000 | QVC, Inc. 5.450%, 08/15/34 | 57,499 | |||||||||
206,000 | Sealed Air Corp.* 6.125%, 02/01/28 | 196,178 | |||||||||
65,000 | 5.000%, 04/15/29^ | 58,008 | |||||||||
247,000 | Sensata Technologies, Inc.* 3.750%, 02/15/31 | 198,059 | |||||||||
201,000 | Sinclair Television Group, Inc.* 4.125%, 12/01/30 | 126,513 | |||||||||
135,000 | 5.500%, 03/01/30 | 73,428 | |||||||||
270,000 | Standard Industries, Inc.* 5.000%, 02/15/27 | 250,093 | |||||||||
216,000 | Stericycle, Inc.* 3.875%, 01/15/29 | 184,563 | |||||||||
200,000 | STL Holding Company, LLC* 7.500%, 02/15/26 | 187,838 | |||||||||
366,000 | TransDigm, Inc. 6.250%, 03/15/26* | 358,175 | |||||||||
285,000 | 6.875%, 12/15/30* | 275,820 | |||||||||
205,000 | 7.500%, 03/15/27 | 205,029 | |||||||||
200,000 | 6.750%, 08/15/28* | 194,648 | |||||||||
266,000 | Tronox, Inc.*^ 4.625%, 03/15/29 | 209,103 | |||||||||
109,383 | United Airlines Pass Through Trust Series 2019-2, Class B 3.500%, 11/01/29 | 96,944 | |||||||||
265,000 | Vertiv Group Corp.* 4.125%, 11/15/28 | 231,915 | |||||||||
| PRINCIPAL AMOUNT | VALUE | ||||||||||
274,000 | Wabash National Corp.* 4.500%, 10/15/28 | $ | 227,209 | ||||||||
240,000 | Waste Pro USA, Inc.* 5.500%, 02/15/26 | 221,412 | |||||||||
157,000 | Williams Scotsman, Inc.* 4.625%, 08/15/28 | 139,683 | |||||||||
11,817,448 | |||||||||||
Information Technology (0.8%) | |||||||||||
131,000 | Booz Allen Hamilton, Inc.* 4.000%, 07/01/29 | 115,706 | |||||||||
153,000 | Coherent Corp.*^ 5.000%, 12/15/29 | 130,087 | |||||||||
315,000 | CommScope Technologies, LLC*^ 6.000%, 06/15/25 | 190,279 | |||||||||
245,000 | CommScope, Inc.* 4.750%, 09/01/29 | 167,367 | |||||||||
162,000 | Dell International, LLC / EMC Corp.µ 6.020%, 06/15/26 | 162,183 | |||||||||
130,000 | Dun & Bradstreet Corp.*^ 5.000%, 12/15/29 | 112,013 | |||||||||
138,000 | Fair Isaac Corp.* 4.000%, 06/15/28 | 123,117 | |||||||||
300,000 | KBR, Inc.* 4.750%, 09/30/28 | 264,555 | |||||||||
300,000 | MPH Acquisition Holdings, LLC* 5.750%, 11/01/28^ | 224,025 | |||||||||
130,000 | 5.500%, 09/01/28 | 108,729 | |||||||||
132,000 | NCL Corp., Ltd.* 8.125%, 01/15/29 | 129,141 | |||||||||
130,000 | NCR Voyix Corp.* 5.125%, 04/15/29 | 111,939 | |||||||||
198,000 | ON Semiconductor Corp.* 3.875%, 09/01/28 | 170,177 | |||||||||
204,000 | Open Text Corp.* 3.875%, 02/15/28 | 177,698 | |||||||||
135,000 | 6.900%, 12/01/27 | 134,741 | |||||||||
98,000 | 3.875%, 12/01/29 | 80,455 | |||||||||
98,000 | Open Text Holdings, Inc.*^ 4.125%, 12/01/31 | 77,261 | |||||||||
295,000 | Playtika Holding Corp.* 4.250%, 03/15/29 | 238,165 | |||||||||
370,000 | TTM Technologies, Inc.* 4.000%, 03/01/29 | 304,406 | |||||||||
185,000 | Twilio, Inc. 3.625%, 03/15/29 | 154,396 | |||||||||
66,000 | 3.875%, 03/15/31^ | 52,828 | |||||||||
325,000 | Viavi Solutions, Inc.* 3.750%, 10/01/29 | 258,749 | |||||||||
300,000 | ZoomInfo Technologies, LLC / ZoomInfo Finance Corp.*^ 3.875%, 02/01/29 | 248,049 | |||||||||
3,736,066 | |||||||||||
CALAMOS CLOSED-END FAMILY OF FUNDS ANNUAL REPORT
164
Dynamic Convertible and Income Fund Schedule of Investments October 31, 2023
| PRINCIPAL AMOUNT | VALUE | ||||||||||
Materials (0.7%) | |||||||||||
140,000 | ArcelorMittal, SA^ 7.000%, 10/15/39 | $ | 133,157 | ||||||||
147,000 | ATI, Inc.^ 5.875%, 12/01/27 | 136,914 | |||||||||
67,000 | Carpenter Technology Corp. 7.625%, 03/15/30 | 66,564 | |||||||||
195,000 | Chemours Company* 4.625%, 11/15/29 | 150,907 | |||||||||
420,000 | Clearwater Paper Corp.* 4.750%, 08/15/28 | 371,158 | |||||||||
199,000 | Cleveland-Cliffs, Inc.* 6.750%, 04/15/30 | 184,891 | |||||||||
130,000 | Commercial Metals Company 4.125%, 01/15/30 | 110,027 | |||||||||
65,000 | 4.375%, 03/15/32 | 52,528 | |||||||||
250,000 | Constellium, SE* 3.750%, 04/15/29 | 205,882 | |||||||||
136,000 | HB Fuller Company 4.250%, 10/15/28 | 118,040 | |||||||||
200,000 | INEOS Finance, PLC*^ 6.750%, 05/15/28 | 187,020 | |||||||||
215,000 | JW Aluminum Continuous Cast Company* 10.250%, 06/01/26 | 214,469 | |||||||||
300,000 | Kaiser Aluminum Corp.* 4.625%, 03/01/28 | 250,761 | |||||||||
33,000 | 4.500%, 06/01/31^ | 24,410 | |||||||||
63,000 | LSF11 A5 HoldCo, LLC* 6.625%, 10/15/29 | 51,692 | |||||||||
344,000 | Mercer International, Inc. 5.125%, 02/01/29 | 270,188 | |||||||||
133,000 | 12.875%, 10/01/28* | 134,498 | |||||||||
250,000 | OCI, NV* 6.700%, 03/16/33 | 231,377 | |||||||||
200,000 | Owens-Brockway Glass Container, Inc.* 7.250%, 05/15/31 | 183,276 | |||||||||
130,000 | 6.625%, 05/13/27^ | 123,872 | |||||||||
305,000 | Silgan Holdings, Inc. 4.125%, 02/01/28 | 272,045 | |||||||||
131,000 | Trinseo Materials Operating SCA / Trinseo Materials Finance, Inc.* 5.125%, 04/01/29 | 56,127 | |||||||||
3,529,803 | |||||||||||
Other (0.1%) | |||||||||||
140,000 | Gen Digital, Inc.* 7.125%, 09/30/30^ | 136,473 | |||||||||
140,000 | 6.750%, 09/30/27 | 136,517 | |||||||||
272,990 | |||||||||||
Real Estate (0.2%) | |||||||||||
210,000 | EPR Properties 3.750%, 08/15/29 | 165,963 | |||||||||
| PRINCIPAL AMOUNT | VALUE | ||||||||||
195,000 | Forestar Group, Inc.* 5.000%, 03/01/28 | $ | 172,002 | ||||||||
137,000 | 3.850%, 05/15/26 | 122,949 | |||||||||
301,000 | MIWD Holdco II, LLC / MIWD Finance Corp.* 5.500%, 02/01/30 | 239,106 | |||||||||
125,000 | Service Properties Trust 5.250%, 02/15/26 | 112,211 | |||||||||
812,231 | |||||||||||
Special Purpose Acquisition Companies (0.1%) | |||||||||||
260,000 | Fertitta Entertainment, LLC / Fertitta Entertainment Finance Company, Inc.* 6.750%, 01/15/30 | 206,882 | |||||||||
131,000 | 4.625%, 01/15/29 | 110,602 | |||||||||
317,484 | |||||||||||
Utilities (0.1%) | |||||||||||
97,000 | PPL Capital Funding, Inc.‡ 8.317%, 03/30/67 3 mo. USD LIBOR + 2.67% | 87,887 | |||||||||
125,000 | Vistra Corp.*‡ 7.000%, 11/01/67 5 year CMT + 5.74% | 114,350 | |||||||||
65,000 | 8.000%, 11/01/67 5 year CMT + 6.93% | 61,840 | |||||||||
264,077 | |||||||||||
| TOTAL CORPORATE BONDS(Cost $81,177,150) | 81,284,207 | ||||||||||
CONVERTIBLE BONDS (133.0%) | |||||||||||
Communication Services (10.2%) | |||||||||||
199,000 | Cable One, Inc.µ 0.000%, 03/15/26 | 162,919 | |||||||||
7,500,000 | Liberty Media Corp.* 3.750%, 03/15/28 | 8,265,225 | |||||||||
7,250,000 | 2.375%, 09/30/53 | 7,029,963 | |||||||||
7,750,000 | Liberty Media Corp.-Liberty Formula One 2.250%, 08/15/27 | 7,724,657 | |||||||||
4,500,000 | Match Group Financeco 3, Inc.*µ 2.000%, 01/15/30 | 3,657,015 | |||||||||
5,250,000 | Perficient, Inc.µ 0.125%, 11/15/26 | 4,202,573 | |||||||||
11,000,000 | Snap, Inc.µ 0.000%, 05/01/27 | 8,193,350 | |||||||||
5,000,000 | 0.750%, 08/01/26 | 4,414,100 | |||||||||
3,000,000 | Zillow Group, Inc. 1.375%, 09/01/26 | 3,151,260 | |||||||||
46,801,062 | |||||||||||
Consumer Discretionary (25.6%) | |||||||||||
9,750,000 | Airbnb, Inc.µ 0.000%, 03/15/26 | 8,447,400 | |||||||||
4,000,000 | Booking Holdings, Inc. 0.750%, 05/01/25 | 6,099,640 | |||||||||
www.calamos.com
165
Dynamic Convertible and Income Fund Schedule of Investments October 31, 2023
| PRINCIPAL AMOUNT | VALUE | ||||||||||
3,750,000 | Carnival Corp.*µ 5.750%, 12/01/27 | $ | 4,443,075 | ||||||||
6,000,000 | Chegg, Inc.µ 0.000%, 09/01/26 | 4,660,920 | |||||||||
11,400,000 | DISH Network Corp. 0.000%, 12/15/25 | 6,994,356 | |||||||||
343,000 | 2.375%, 03/15/24µ | 328,666 | |||||||||
11,750,000 | DraftKings Holdings, Inc.µ 0.000%, 03/15/28 | 8,721,437 | |||||||||
11,250,000 | Etsy, Inc.µ 0.125%, 09/01/27 | 8,890,200 | |||||||||
14,500,000 | Ford Motor Companyµ 0.000%, 03/15/26 | 13,235,745 | |||||||||
7,500,000 | Liberty Broadband Corp.* 3.125%, 03/31/53 | 7,440,375 | |||||||||
2,125,000 | Lucid Group, Inc.* 1.250%, 12/15/26 | 1,171,215 | |||||||||
9,000,000 | Marriott Vacations Worldwide Corp.*µ 3.250%, 12/15/27 | 7,630,830 | |||||||||
8,500,000 | Rivian Automotive, Inc.* 4.625%, 03/15/29 | 8,960,530 | |||||||||
5,000,000 | Shake Shack, Inc.µ 0.000%, 03/01/28 | 3,697,600 | |||||||||
13,250,000 | Vail Resorts, Inc.µ 0.000%, 01/01/26 | 11,600,905 | |||||||||
11,750,000 | Wayfair, Inc.µ 3.250%, 09/15/27 | 11,322,770 | |||||||||
3,750,000 | Wynn Macau, Ltd.* 4.500%, 03/07/29 | 3,825,450 | |||||||||
117,471,114 | |||||||||||
Consumer Staples (1.4%) | |||||||||||
2,525,000 | Enovis Corp.* 3.875%, 10/15/28 | 2,637,994 | |||||||||
4,000,000 | Post Holdings, Inc. 2.500%, 08/15/27 | 3,818,280 | |||||||||
6,456,274 | |||||||||||
Energy (3.9%) | |||||||||||
1,325,000 | EQT Corp. 1.750%, 05/01/26 | 3,852,305 | |||||||||
4,265,000 | Nabors Industries, Inc.*µ 1.750%, 06/15/29 | 3,195,850 | |||||||||
3,750,000 | Northern Oil & Gas, Inc. 3.625%, 04/15/29 | 4,429,012 | |||||||||
2,500,000 | Pioneer Natural Resources Company 0.250%, 05/15/25 | 6,379,925 | |||||||||
9,600,000 | SunEdison, Inc.*@ 0.000%, 01/15/49 | 96,000 | |||||||||
17,953,092 | |||||||||||
Financials (1.7%) | |||||||||||
7,500,000 | Morgan Stanley Finance, LLC 1.000%, 11/23/27 | 7,603,500 | |||||||||
| PRINCIPAL AMOUNT | VALUE | ||||||||||
Health Care (28.4%) | |||||||||||
4,000,000 | Alnylam Pharmaceuticals, Inc.µ 1.000%, 09/15/27 | $ | 3,471,440 | ||||||||
4,750,000 | Alphatec Holdings, Inc.µ 0.750%, 08/01/26 | 4,057,972 | |||||||||
4,752,000 | BioMarin Pharmaceutical, Inc.µ 0.599%, 08/01/24 | 4,582,401 | |||||||||
8,250,000 | CONMED Corp.µ 2.250%, 06/15/27 | 7,723,237 | |||||||||
10,500,000 | CryoPort, Inc.*µ 0.750%, 12/01/26 | 8,309,175 | |||||||||
13,817,000 | Dexcom, Inc.µ 0.250%, 11/15/25 | 13,116,064 | |||||||||
7,000,000 | 0.375%, 05/15/28* | 6,174,420 | |||||||||
3,750,000 | Envista Holdings Corp.*µ 1.750%, 08/15/28 | 3,244,650 | |||||||||
6,000,000 | Exact Sciences Corp.µ 0.375%, 03/15/27 | 5,227,200 | |||||||||
6,250,000 | Halozyme Therapeutics, Inc.µ 1.000%, 08/15/28 | 5,498,937 | |||||||||
3,750,000 | Insmed, Inc. 0.750%, 06/01/28 | 3,644,925 | |||||||||
3,750,000 | Insulet Corp.µ 0.375%, 09/01/26 | 3,473,813 | |||||||||
7,750,000 | Integer Holdings Corp.* 2.125%, 02/15/28 | 8,531,045 | |||||||||
3,750,000 | Integra LifeSciences Holdings Corp.µ 0.500%, 08/15/25 | 3,382,913 | |||||||||
3,750,000 | Ionis Pharmaceuticals, Inc. 0.000%, 04/01/26 | 3,631,688 | |||||||||
8,000,000 | Jazz Investments I, Ltd.µ^ 2.000%, 06/15/26 | 8,121,840 | |||||||||
3,189,000 | Lantheus Holdings, Inc.*µ 2.625%, 12/15/27 | 3,538,259 | |||||||||
9,000,000 | NeoGenomics, Inc.µ 0.250%, 01/15/28 | 6,504,030 | |||||||||
7,500,000 | Omnicell, Inc.µ 0.250%, 09/15/25 | 6,667,275 | |||||||||
7,000,000 | Pacira BioSciences, Inc.µ 0.750%, 08/01/25 | 6,297,200 | |||||||||
3,250,000 | Sarepta Therapeutics, Inc.µ 1.250%, 09/15/27 | 2,767,538 | |||||||||
7,250,000 | Shockwave Medical, Inc.*µ 1.000%, 08/15/28 | 7,029,672 | |||||||||
5,750,000 | Tandem Diabetes Care, Inc.*µ 1.500%, 05/01/25 | 5,428,747 | |||||||||
130,424,441 | |||||||||||
Industrials (10.6%) | |||||||||||
3,625,000 | Advanced Energy Industries, Inc.*µ 2.500%, 09/15/28 | 3,350,588 | |||||||||
3,750,000 | Axon Enterprise, Inc.* 0.500%, 12/15/27 | 4,045,537 | |||||||||
CALAMOS CLOSED-END FAMILY OF FUNDS ANNUAL REPORT
166
Dynamic Convertible and Income Fund Schedule of Investments October 31, 2023
| PRINCIPAL AMOUNT | VALUE | ||||||||||
3,625,000 | Fluor Corp.* 1.125%, 08/15/29 | $ | 3,499,539 | ||||||||
6,250,000 | John Bean Technologies Corp.µ 0.250%, 05/15/26 | 5,624,437 | |||||||||
3,750,000 | Middleby Corp. 1.000%, 09/01/25 | 3,895,163 | |||||||||
2,750,000 | Parsons Corp. 0.250%, 08/15/25 | 3,607,560 | |||||||||
6,250,000 | Southwest Airlines Companyµ 1.250%, 05/01/25 | 5,956,250 | |||||||||
3,500,000 | Tetra Tech, Inc.* 2.250%, 08/15/28 | 3,390,415 | |||||||||
17,000,000 | Uber Technologies, Inc.µ 0.000%, 12/15/25 | 15,541,400 | |||||||||
48,910,889 | |||||||||||
Information Technology (42.4%) | |||||||||||
7,250,000 | Akamai Technologies, Inc. 1.125%, 02/15/29* | 7,137,698 | |||||||||
3,750,000 | 0.375%, 09/01/27 | 3,820,013 | |||||||||
7,750,000 | Bentley Systems, Inc. 0.125%, 01/15/26 | 7,397,298 | |||||||||
6,500,000 | BILL Holdings, Inc.µ 0.000%, 12/01/25 | 6,177,990 | |||||||||
3,000,000 | Camtek, Ltd.* 0.000%, 12/01/26 | 3,237,660 | |||||||||
7,000,000 | Confluent, Inc.µ 0.000%, 01/15/27 | 5,649,840 | |||||||||
8,250,000 | CyberArk Software, Ltd. 0.000%, 11/15/24 | 9,444,600 | |||||||||
5,500,000 | Datadog, Inc. 0.125%, 06/15/25 | 6,056,820 | |||||||||
5,250,000 | DigitalOcean Holdings, Inc.µ 0.000%, 12/01/26 | 3,950,415 | |||||||||
7,927,000 | Enphase Energy, Inc.µ 0.000%, 03/01/26 | 6,760,383 | |||||||||
5,000,000 | Five9, Inc.µ 0.500%, 06/01/25 | 4,575,550 | |||||||||
1,750,000 | MongoDB, Inc. 0.250%, 01/15/26 | 2,986,025 | |||||||||
5,250,000 | NCL Corp., Ltd.µ 1.125%, 02/15/27 | 4,071,585 | |||||||||
4,000,000 | 2.500%, 02/15/27 | 3,209,280 | |||||||||
2,750,000 | 5.375%, 08/01/25 | 2,919,070 | |||||||||
6,500,000 | Okta, Inc.µ 0.125%, 09/01/25 | 5,819,580 | |||||||||
3,500,000 | 0.375%, 06/15/26 | 3,001,705 | |||||||||
15,000,000 | ON Semiconductor Corp.*µ 0.500%, 03/01/29 | 13,187,100 | |||||||||
4,750,000 | Palo Alto Networks, Inc. 0.375%, 06/01/25 | 11,599,595 | |||||||||
3,625,000 | Rapid7, Inc.*µ 1.250%, 03/15/29 | 3,506,898 | |||||||||
| PRINCIPAL AMOUNT | VALUE | ||||||||||
9,750,000 | Repay Holdings Corp.*µ 0.000%, 02/01/26 | $ | 7,803,412 | ||||||||
3,500,000 | Seagate HDD Cayman* 3.500%, 06/01/28 | 3,630,690 | |||||||||
12,000,000 | Shift4 Payments, Inc.µ 0.000%, 12/15/25 | 10,928,400 | |||||||||
5,800,000 | SK Hynix, Inc. 1.750%, 04/11/30 | 7,017,768 | |||||||||
9,750,000 | Splunk, Inc.µ 1.125%, 06/15/27 | 9,216,577 | |||||||||
8,500,000 | Tyler Technologies, Inc. 0.250%, 03/15/26 | 8,082,650 | |||||||||
12,500,000 | Unity Software, Inc.µ 0.000%, 11/15/26 | 9,796,000 | |||||||||
5,500,000 | Wix.com, Ltd. 0.000%, 08/15/25 | 4,877,180 | |||||||||
7,750,000 | Wolfspeed, Inc. 1.875%, 12/01/29* | 4,629,230 | |||||||||
4,469,000 | 0.250%, 02/15/28 | 2,755,764 | |||||||||
3,500,000 | Workiva, Inc.*µ 1.250%, 08/15/28 | 3,179,120 | |||||||||
7,000,000 | Zscaler, Inc. 0.125%, 07/01/25 | 8,546,580 | |||||||||
194,972,476 | |||||||||||
Materials (3.0%) | |||||||||||
1,250,000 | ATI, Inc. 3.500%, 06/15/25 | 3,092,700 | |||||||||
3,000,000 | Ivanhoe Mines, Ltd.* 2.500%, 04/15/26 | 3,449,730 | |||||||||
4,159,000 | Lithium Americas Corp. 1.750%, 01/15/27 | 2,807,741 | |||||||||
5,225,000 | MP Materials Corp.*µ 0.250%, 04/01/26 | 4,305,191 | |||||||||
13,655,362 | |||||||||||
Other (0.0%) | |||||||||||
135,000 | Multiplan Corp.* 6.000%, 10/15/27 | 89,778 | |||||||||
Real Estate (0.9%) | |||||||||||
5,250,000 | Pebblebrook Hotel Trustµ 1.750%, 12/15/26 | 4,174,957 | |||||||||
Utilities (4.9%) | |||||||||||
3,750,000 | CMS Energy Corp.* 3.375%, 05/01/28 | 3,550,650 | |||||||||
13,250,000 | PPL Capital Funding, Inc.* 2.875%, 03/15/28 | 12,151,310 | |||||||||
7,000,000 | Southern Company* 3.875%, 12/15/25 | 6,877,360 | |||||||||
22,579,320 | |||||||||||
| TOTAL CONVERTIBLE BONDS(Cost $695,212,591) | 611,092,265 | ||||||||||
www.calamos.com
167
Dynamic Convertible and Income Fund Schedule of Investments October 31, 2023
| PRINCIPAL AMOUNT | VALUE | ||||||||||
BANK LOANS (2.8%)¡ | |||||||||||
Airlines (0.1%) | |||||||||||
202,500 | American Airlines, Inc.‡ 10.427%, 04/20/28 3 mo. SOFR + 4.75% | $ | 205,664 | ||||||||
202,500 | Mileage Plus Holdings, LLC‡ 10.798%, 06/21/27 3 mo. SOFR + 5.25% | 209,023 | |||||||||
414,687 | |||||||||||
Communication Services (0.1%) | |||||||||||
34,111 | Clear Channel Outdoor Holdings, Inc.‡ 5.388%, 08/21/26 3 mo. SOFR + 3.50% | 32,846 | |||||||||
87,293 | DIRECTV Financing, LLC‡ 10.325%, 08/02/27 1 mo. SOFR + 5.00% | 85,095 | |||||||||
420,000 | Entercom Media Corp.‡ 8.145%, 11/18/24 3 mo. SOFR + 2.50% | 184,735 | |||||||||
140,000 | Telesat Canada‡ 8.434%, 12/07/26 3 mo. SOFR + 2.75% | 96,495 | |||||||||
399,171 | |||||||||||
Consumer Discretionary (0.5%) | |||||||||||
127,089 | American Axle and Manufacturing, Inc.‡ 9.007%, 12/13/29 3 mo. SOFR + 3.50% | 126,825 | |||||||||
84,686 | American Axle and Manufacturing, Inc.‡ 8.941%, 12/13/29 1 mo. SOFR + 3.50% | 84,510 | |||||||||
263,675 | Caesars Entertainment, Inc.‡ 8.674%, 02/06/30 1 mo. SOFR + 3.25% | 263,053 | |||||||||
264,338 | Carnival Corp.‡ 8.336%, 08/08/27 1 mo. SOFR + 3.00% | 260,042 | |||||||||
263,675 | Hanesbrands, Inc.‡ 9.074%, 03/08/30 1 mo. SOFR + 3.75% | 260,709 | |||||||||
153,526 | Life Time Fitness, Inc.‡ 10.130%, 01/15/26 3 mo. SOFR + 4.75% | 153,852 | |||||||||
310,732 | Petco Health and Wellness Company, Inc.‡ 8.902%, 03/03/28 3 mo. SOFR + 3.25% | 304,344 | |||||||||
552,349 | PetSmart, Inc.‡ 9.174%, 02/11/28 1 mo. SOFR + 3.75% | 546,538 | |||||||||
172,934 | TKC Holdings, Inc.‡ 10.939%, 05/15/28 1 mo. SOFR + 5.50% | 166,016 | |||||||||
| PRINCIPAL AMOUNT | VALUE | ||||||||||
65,000 | Windsor Holdings III, LLC‡ 9.815%, 08/01/30 1 mo. SOFR + 4.50% | $ | 64,890 | ||||||||
2,230,779 | |||||||||||
Consumer Staples (0.1%) | |||||||||||
275,000 | Star Parent, Inc.‡ 9.386%, 09/27/30 3 mo. LIBOR + 4.00% | 262,902 | |||||||||
125,000 | United Natural Foods, Inc.‡ 8.689%, 10/22/25 1 mo. SOFR + 3.25% | 124,826 | |||||||||
387,728 | |||||||||||
Energy (0.1%) | |||||||||||
125,000 | New Fortress Energy, Inc.‡ 0.000%, 10/23/30 | 115,625 | |||||||||
338,650 | Par Petroleum, LLC‡ 9.773%, 02/28/30 3 mo. SOFR + 4.25% | 338,227 | |||||||||
453,852 | |||||||||||
Financials (0.5%) | |||||||||||
65,000 | Advisor Group, Inc.‡ 9.824%, 08/17/28 1 mo. SOFR + 4.50% | 64,785 | |||||||||
263,672 | Alliant Holdings Intermediate, LLC‡ 8.835%, 11/05/27 1 mo. SOFR + 3.50% | 263,082 | |||||||||
148,731 | Amynta Agency Borrower, Inc.‡ 10.325%, 02/28/28 1 mo. SOFR + 5.00% | 148,836 | |||||||||
54,366 | Amynta Agency Borrower, Inc.‡ 10.424%, 02/28/28 1 mo. SOFR + 5.00% | 54,404 | |||||||||
272,236 | AssuredPartners, Inc.‡ 8.824%, 02/12/27 1 mo. SOFR + 3.50% | 270,194 | |||||||||
204,488 | Avolon TLB Borrower 1 LLC‡ 7.839%, 06/22/28 1 mo. SOFR + 2.50% | 204,773 | |||||||||
229,669 | Castlelake Aviation, Ltd.! 0.000%, 10/22/26 | 229,526 | |||||||||
133,988 | Castlelake Aviation, Ltd.‡ 8.421%, 10/22/27 3 mo. SOFR + 2.75% | 133,832 | |||||||||
267,975 | Hub International, Ltd.‡ 9.365%, 11/10/29 3 mo. SOFR + 4.00% | 267,936 | |||||||||
374,308 | Jazz Financing Lux Sarl‡ 8.939%, 05/05/28 1 mo. SOFR + 3.50% | 374,619 | |||||||||
361,350 | VFH Parent, LLC‡ 8.427%, 01/13/29 1 mo. SOFR + 3.00% | 359,581 | |||||||||
2,371,568 | |||||||||||
CALAMOS CLOSED-END FAMILY OF FUNDS ANNUAL REPORT
168
Dynamic Convertible and Income Fund Schedule of Investments October 31, 2023
| PRINCIPAL AMOUNT | VALUE | ||||||||||
Health Care (0.3%) | |||||||||||
463,106 | Amneal Pharmaceuticals, LLC‡ 8.939%, 05/04/25 1 mo. SOFR + 3.50% | $ | 454,751 | ||||||||
142,304 | Icon Luxembourg Sarl‡ 7.902%, 07/03/28 3 mo. SOFR + 2.25% | 142,551 | |||||||||
271,171 | Mallinckrodt International Finance, SA‡ 12.703%, 09/30/27 1 mo. SOFR + 7.25% | 206,618 | |||||||||
282,353 | Padagis, LLC‡ 10.434%, 07/06/28 3 mo. SOFR + 4.75% | 251,530 | |||||||||
35,455 | PRA Health Sciences, Inc.‡ 7.902%, 07/03/28 3 mo. SOFR + 2.25% | 35,516 | |||||||||
678,661 | Team Health Holdings, Inc.‡ 10.574%, 03/02/27 1 mo. SOFR + 5.25% | 490,519 | |||||||||
1,935 | Team Health Holdings, Inc.‡ 10.574%, 03/02/27 1 mo. SOFR + 5.25% | 1,399 | |||||||||
1,582,884 | |||||||||||
Industrials (0.3%) | |||||||||||
136,850 | ACProducts, Inc.‡ 9.902%, 05/17/28 3 mo. SOFR + 4.25% | 109,214 | |||||||||
167,875 | Air Canada‡ 9.128%, 08/11/28 3 mo. SOFR + 3.50% | 167,917 | |||||||||
342,413 | ChampionX Corp.‡ 8.177%, 06/07/29 1 mo. SOFR + 2.75% | 343,964 | |||||||||
177,780 | Emrld Borrower, LP‡ 8.380%, 05/31/30 3 mo. SOFR + 3.00% | 177,613 | |||||||||
256,750 | Scientific Games International, Inc.‡ 8.435%, 04/14/29 1 mo. SOFR + 3.00% | 256,831 | |||||||||
148,875 | Summit Materials, LLC‡ 8.571%, 12/14/27 3 mo. SOFR + 3.00% | 149,689 | |||||||||
263,847 | United Airlines, Inc.‡ 9.189%, 04/21/28 1 mo. SOFR + 3.75% | 263,682 | |||||||||
1,468,910 | |||||||||||
Information Technology (0.2%) | |||||||||||
259,559 | Banff Merger Sub, Inc.‡ 9.189%, 10/02/25 1 mo. SOFR + 3.75% | 259,613 | |||||||||
185,000 | Central Parent, Inc.! 0.000%, 07/06/29 | 184,191 | |||||||||
| PRINCIPAL AMOUNT | VALUE | ||||||||||
64,513 | Central Parent, Inc.‡ 9.406%, 07/06/29 3 mo. SOFR + 4.00% | $ | 64,230 | ||||||||
267,537 | Dun & Bradstreet Corp.‡ 8.176%, 02/06/26 1 mo. SOFR + 2.75% | 267,537 | |||||||||
246,821 | II-VI, Inc.‡ 8.189%, 07/02/29 1 mo. SOFR + 2.75% | 246,705 | |||||||||
1,022,276 | |||||||||||
Information Technology (0.1%) | |||||||||||
218,979 | Camelot U.S. Acquisition LLC‡ 8.439%, 10/30/26 1 mo. SOFR + 3.00% | 218,957 | |||||||||
Materials (0.3%) | |||||||||||
200,000 | Chemours Company‡ 8.824%, 08/18/28 1 mo. SOFR + 2.50% | 195,000 | |||||||||
274,313 | Ineos US Finance, LLC‡ 8.825%, 02/18/30 1 mo. SOFR + 3.50% | 268,955 | |||||||||
326,959 | Innophos, Inc.‡ 8.689%, 02/05/27 1 mo. SOFR + 3.25% | 324,098 | |||||||||
334,163 | LSF11 A5 Holdco, LLC‡ 9.674%, 10/15/28 1 mo. SOFR + 4.25% | 328,420 | |||||||||
134,313 | Trinseo Materials Operating SCA‡ 7.939%, 05/03/28 1 mo. SOFR + 2.50% | 107,274 | |||||||||
253,407 | W.R. Grace & Co.-Conn.‡ 9.402%, 09/22/28 3 mo. SOFR + 3.75% | 249,290 | |||||||||
1,473,037 | |||||||||||
Special Purpose Acquisition Companies (0.2%) | |||||||||||
138,250 | Clydesdale Acquisition Holdings, Inc.‡ 9.599%, 04/13/29 1 mo. SOFR + 4.18% | 134,074 | |||||||||
64,025 | Fertitta Entertainment, LLC‡ 9.324%, 01/27/29 1 mo. SOFR + 4.00% | 62,711 | |||||||||
282,150 | Oscar AcquisitionCo, LLC‡ 9.990%, 04/29/29 3 mo. SOFR + 4.50% | 275,302 | |||||||||
257,400 | Patagonia Holdco, LLC‡ 11.117%, 08/01/29 3 mo. SOFR + 5.75% | 223,294 | |||||||||
695,381 | |||||||||||
TOTAL BANK LOANS (Cost $13,239,136) | 12,719,230 | ||||||||||
www.calamos.com
169
Dynamic Convertible and Income Fund Schedule of Investments October 31, 2023
| NUMBER OF SHARES | VALUE | ||||||||||
CONVERTIBLE PREFERRED STOCKS (6.0%) | |||||||||||
Energy (0.0%) | |||||||||||
7 | Gulfport Energy Corp.# 10.000%, 12/01/23 15.000% PIK rate | $ | 62,125 | ||||||||
Financials (2.4%) | |||||||||||
72,795 | Apollo Global Management, Inc. 6.750%, 07/31/26 | 3,502,167 | |||||||||
7,055 | Bank of America Corp.‡‡~ 7.250% | 7,430,326 | |||||||||
10,932,493 | |||||||||||
Industrials (0.7%) | |||||||||||
65,985 | Chart Industries, Inc.~ 6.750%, 12/15/25 | 3,243,823 | |||||||||
Utilities (2.9%) | |||||||||||
123,415 | AES Corp.^~ 6.875%, 02/15/24 | 7,439,456 | |||||||||
156,300 | NextEra Energy, Inc.^~ 6.926%, 09/01/25 | 5,867,502 | |||||||||
13,306,958 | |||||||||||
TOTAL CONVERTIBLE (Cost $37,272,756) | 27,545,399 | ||||||||||
COMMON STOCKS (0.2%) | |||||||||||
Communication Services (0.0%) | |||||||||||
5,620 | Altice USA, Inc. - Class A# | 16,242 | |||||||||
1,888 | Cumulus Media, Inc. - Class Aµ | 8,515 | |||||||||
24,757 | |||||||||||
Energy (0.2%) | |||||||||||
2,577 | Chaparral Energy, Inc. - Class A&# | 114,676 | |||||||||
795 | Chesapeake Energy Corp.µ^ | 68,434 | |||||||||
18,535 | Energy Transfer, LP | 243,735 | |||||||||
11,035 | Enterprise Products Partners, LP | 287,351 | |||||||||
1,881 | EP Energy Corp.&# | 4,938 | |||||||||
2,374 | ONEOK, Inc.^ | 154,785 | |||||||||
873,919 | |||||||||||
Special Purpose Acquisition Company (0.0%) | |||||||||||
3,168 | Intelsat Emergence, SA&# | 75,240 | |||||||||
TOTAL COMMON STOCKS (Cost $1,504,090) | 973,916 | ||||||||||
PREFERRED STOCKS (0.2%) | |||||||||||
Communication Services (0.0%) | |||||||||||
3,265 | United States Cellular Corp.µ 5.500%, 06/01/70 | 47,734 | |||||||||
3,130 | 5.500%, 03/01/70 | 46,512 | |||||||||
94,246 | |||||||||||
| PRINCIPAL AMOUNT | VALUE | ||||||||||
Consumer Discretionary (0.1%) | |||||||||||
1,722 | Guitar Center, Inc.&# | $ | 181,671 | ||||||||
Energy (0.1%) | |||||||||||
8,160 | NuStar Energy, LP‡ 11.315%, 11/30/23 3 mo. USD LIBOR + 5.64% | 204,816 | |||||||||
2,000 | 12.438%, 11/30/23 3 mo. SOFR + 7.03% | 50,940 | |||||||||
12,000 | NuStar Logistics, LP‡~ 12.390%, 01/15/43 3 mo. SOFR + 6.98% | 311,760 | |||||||||
567,516 | |||||||||||
TOTAL PREFERRED STOCKS (Cost $840,192) | 843,433 | ||||||||||
WARRANTS (0.0%)# | |||||||||||
Energy (0.0%) | |||||||||||
13,522 | Mcdermott International, Ltd.& 06/30/27, Strike $15.98 | 2 | |||||||||
12,170 | Mcdermott International, Ltd. 06/30/27, Strike $12.33 | 1 | |||||||||
TOTAL WARRANTS (Cost $5,195) | 3 | ||||||||||
| NUMBER OF CONTRACTS/ NOTIONAL AMOUNT | VALUE | ||||||||||
PURCHASED OPTIONS (0.2%)# | |||||||||||
Consumer Discretionary (0.1%) | |||||||||||
505 | Amazon.com, Inc. | ||||||||||
6,721,045 | Call, 01/19/24, Strike $127.50 | 613,575 | |||||||||
Information Technology (0.1%) | |||||||||||
270 | Palo Alto Networks, Inc. | ||||||||||
6,561,540 | Call, 01/19/24, Strike $250.00 | 423,900 | |||||||||
TOTAL PURCHASED OPTIONS (Cost $1,397,940) | 1,037,475 | ||||||||||
TOTAL INVESTMENTS (160.1%) (Cost $830,846,856) | 735,686,397 | ||||||||||
| MANDATORY REDEEMABLE PREFERRED SHARES, AT LIQUIDATION VALUE (-20.0%) | (92,000,000 | ) | |||||||||
LIABILITIES, LESS OTHER ASSETS (-40.1%) | (184,321,371 | ) | |||||||||
NET ASSETS (100.0%) | $ | 459,365,026 | |||||||||
CALAMOS CLOSED-END FAMILY OF FUNDS ANNUAL REPORT
170
Dynamic Convertible and Income Fund Schedule of Investments October 31, 2023
NOTES TO SCHEDULE OF INVESTMENTS
* Securities issued and sold pursuant to a Rule 144A transaction are exempted from the registration requirement of the Securities Act of 1933, as amended. These securities may only be sold to qualified institutional buyers ("QIBs"), such as the Fund. Any resale of these securities must generally be effected through a sale that is registered under the Act or otherwise exempted from such registration requirements.
µ Security, or portion of security, is held in a segregated account as collateral for note payable aggregating a total value of $360,445,926.
^ Security, or portion of security, is on loan.
@ In default status and considered non-income producing.
& Illiquid security.
‡ Variable rate security. The rate shown is the rate in effect at October 31, 2023.
¡ Bank loans generally are subject to mandatory and/or optional prepayment. As a result, the actual remaining maturity of bank loans may be substantially less than the stated maturities shown.
! This position represents an unsettled loan commitment at period end. Certain details associated with this purchase are not known prior to the settlement date, including coupon rate, which will be adjusted on settlement date.
# Non-income producing security.
‡‡ Perpetual maturity.
~ Security, or portion of security, is segregated as collateral (or collateral for potential future transactions) for written options. The aggregate value of such securities is $5,338,906.
Note: The date on options represents the expiration date of the option contract. The option contract may be exercised at any date on or before the date shown.
The following table summarizes the Fund's investments and derivative financial instruments categorized in the fair value hierarchy as of October 31, 2023 (see Note 1):
LEVEL 1 | LEVEL 2 | LEVEL 3 | TOTAL | ||||||||||||||||
Assets: | |||||||||||||||||||
Asset Backed Securities | $ | — | $ | 190,469 | $ | — | $ | 190,469 | |||||||||||
Corporate Bonds | — | 81,284,207 | — | 81,284,207 | |||||||||||||||
Convertible Bonds | — | 611,092,265 | — | 611,092,265 | |||||||||||||||
Bank Loans | — | 12,719,230 | — | 12,719,230 | |||||||||||||||
Convertible Preferred Stocks | 27,483,274 | 62,125 | — | 27,545,399 | |||||||||||||||
Common Stocks | 779,062 | 194,854 | — | 973,916 | |||||||||||||||
Preferred Stocks | 614,028 | 229,405 | — | 843,433 | |||||||||||||||
Warrants | — | 3 | — | 3 | |||||||||||||||
Purchased Options | 1,037,475 | — | — | 1,037,475 | |||||||||||||||
Total | $ | 29,913,839 | $ | 705,772,558 | $ | — | $ | 735,686,397 | |||||||||||
See accompanying Notes to Schedule of Investments
www.calamos.com
171
Global Dynamic Income Fund Schedule of Investments October 31, 2023
| PRINCIPAL AMOUNT | VALUE | ||||||||||
ASSET BACKED SECURITY (0.0%) | |||||||||||
Other (0.0%) | |||||||||||
170,000 | SVC ABS, LLC Series 2023-1A, Class C*~ 6.700%, 02/20/53 (Cost $156,404) | $ | 150,603 | ||||||||
CORPORATE BONDS (17.0%) | |||||||||||
Airlines (0.3%) | |||||||||||
43,333 | Air Canada Pass Through Trust Series 2015-2, Class B* 5.000%, 06/15/25 | 43,119 | |||||||||
198,857 | Alaska Airlines Pass Through Trust Series 2020-1, Class A*µ 4.800%, 02/15/29 | 186,393 | |||||||||
96,284 | Alaska Airlines Pass Through Trust Series 2020-1, Class B* 8.000%, 02/15/27 | 96,106 | |||||||||
233,870 | American Airlines Pass Through Trust Series 2021-1, Class B 3.950%, 01/11/32 | 199,465 | |||||||||
140,833 | American Airlines, Inc. / AAdvantage Loyalty IP, Ltd.* 5.500%, 04/20/26 | 137,003 | |||||||||
219,065 | British Airways Pass Through Trust Series 2021-1, Class B* 3.900%, 03/15/33 | 190,345 | |||||||||
218,789 | JetBlue Pass Through Trust Series 2020-1, Class B 7.750%, 05/15/30 | 217,536 | |||||||||
145,000 | Spirit Loyalty Cayman, Ltd. / Spirit IP Cayman, Ltd.* 8.000%, 09/20/25 | 107,675 | |||||||||
1,177,642 | |||||||||||
Communication Services (1.8%) | |||||||||||
250,000 | Altice France, SA* 5.500%, 10/15/29 | 173,133 | |||||||||
260,000 | APi Group DE, Inc.* 4.750%, 10/15/29 | 224,203 | |||||||||
310,000 | Arrow Bidco, LLC* 9.500%, 03/15/24 | 314,148 | |||||||||
225,000 | Ashtead Capital, Inc.* 2.450%, 08/12/31 | 165,978 | |||||||||
273,000 | Audacy Capital Corp.* 6.750%, 03/31/29 | 4,436 | |||||||||
100,000 | 6.500%, 05/01/27 | 1,500 | |||||||||
195,000 | Cincinnati Bell Telephone Company, LLC 6.300%, 12/01/28 | 157,800 | |||||||||
205,000 | Clear Channel Outdoor Holdings, Inc.* 9.000%, 09/15/28 | 199,906 | |||||||||
330,000 | Consolidated Communications, Inc.*^ 6.500%, 10/01/28 | 261,911 | |||||||||
| PRINCIPAL AMOUNT | VALUE | ||||||||||
400,000 | CSC Holdings, LLC* 4.625%, 12/01/30 | $ | 203,180 | ||||||||
335,000 | 5.375%, 02/01/28 | 267,122 | |||||||||
300,000 | 5.750%, 01/15/30 | 158,145 | |||||||||
200,000 | 5.500%, 04/15/27 | 167,184 | |||||||||
200,000 | 4.500%, 11/15/31 | 132,308 | |||||||||
180,000 | Diamond Sports Group, LLC / Diamond Sports Finance Company*@ 6.625%, 08/15/27 | 2,282 | |||||||||
151,000 | 5.375%, 08/15/26 | 1,851 | |||||||||
557,000 | Directv Financing, LLC / Directv Financing Co-Obligor, Inc.* 5.875%, 08/15/27 | 488,155 | |||||||||
225,000 | Frontier California, Inc. 6.750%, 05/15/27 | 207,747 | |||||||||
140,000 | Frontier Communications Holdings, LLC* 5.000%, 05/01/28 | 121,505 | |||||||||
54,000 | 8.750%, 05/15/30 | 51,512 | |||||||||
242,000 | Frontier Florida, LLC@ 6.860%, 02/01/28 | 222,776 | |||||||||
330,000 | Frontier North, Inc.@ 6.730%, 02/15/28 | 306,131 | |||||||||
195,000 | Go Daddy Operating Company, LLC / GD Finance Company, Inc.* 3.500%, 03/01/29 | 164,812 | |||||||||
69,000 | 5.250%, 12/01/27 | 65,244 | |||||||||
80,000 | iHeartCommunications, Inc. 8.375%, 05/01/27^ | 49,101 | |||||||||
80,000 | 5.250%, 08/15/27* | 58,722 | |||||||||
170,000 | Intelsat Jackson Holdings, SA@& 9.750%, 07/15/25* | — | |||||||||
130,000 | 5.500%, 08/01/23 | — | |||||||||
265,000 | LCPR Senior Secured Financing DAC* 6.750%, 10/15/27 | 240,122 | |||||||||
167,354 | Ligado Networks, LLC* 15.500%, 11/01/23 15.500% PIK rate | 42,183 | |||||||||
160,000 | Lumen Technologies, Inc. 7.600%, 09/15/39 | 43,542 | |||||||||
100,000 | 4.000%, 02/15/27*^ | 68,373 | |||||||||
52,000 | 7.650%, 03/15/42 | 14,006 | |||||||||
109,000 | Match Group Holdings II, LLC* 3.625%, 10/01/31 | 84,394 | |||||||||
175,000 | Nexstar Media, Inc.* 5.625%, 07/15/27 | 157,584 | |||||||||
310,000 | Paramount Global 4.900%, 08/15/44 | 195,281 | |||||||||
73,000 | Qwest Corp. 7.250%, 09/15/25 | 70,102 | |||||||||
111,000 | Scripps Escrow II, Inc.* 3.875%, 01/15/29 | 84,313 | |||||||||
56,000 | 5.375%, 01/15/31 | 34,798 | |||||||||
210,000 | Scripps Escrow, Inc.* 5.875%, 07/15/27 | 157,198 | |||||||||
See accompanying Notes to Schedule of Investments
CALAMOS CLOSED-END FAMILY OF FUNDS ANNUAL REPORT
172
Global Dynamic Income Fund Schedule of Investments October 31, 2023
| PRINCIPAL AMOUNT | VALUE | ||||||||||
225,000 | Sirius XM Radio, Inc.* 5.500%, 07/01/29 | $ | 199,562 | ||||||||
217,000 | 4.000%, 07/15/28 | 184,628 | |||||||||
110,000 | 3.125%, 09/01/26 | 98,834 | |||||||||
54,000 | 3.875%, 09/01/31 | 40,674 | |||||||||
202,000 | Spanish Broadcasting System, Inc.* 9.750%, 03/01/26 | 125,884 | |||||||||
245,000 | Stagwell Global, LLC* 5.625%, 08/15/29 | 202,703 | |||||||||
215,000 | Telecom Italia Capital, SA 6.000%, 09/30/34 | 177,091 | |||||||||
219,000 | Telesat Canada / Telesat, LLC* 4.875%, 06/01/27 | 131,128 | |||||||||
85,000 | Time Warner Cable, LLC 7.300%, 07/01/38 | 79,616 | |||||||||
245,000 | United States Cellular Corp.^ 6.700%, 12/15/33 | 233,326 | |||||||||
80,000 | Univision Communications, Inc.* 8.000%, 08/15/28 | 75,818 | |||||||||
105,000 | Viasat, Inc.* 5.625%, 04/15/27 | 91,869 | |||||||||
7,003,821 | |||||||||||
Consumer Discretionary (3.6%) | |||||||||||
265,000 | Abercrombie & Fitch Management Company* 8.750%, 07/15/25 | 269,420 | |||||||||
210,000 | Adams Homes, Inc.* 9.250%, 10/15/28 | 206,136 | |||||||||
260,000 | Adient Global Holdings Company* 8.250%, 04/15/31 | 254,426 | |||||||||
175,000 | American Axle & Manufacturing, Inc. 6.875%, 07/01/28 | 155,970 | |||||||||
190,000 | Ashton Woods USA, LLC / Ashton Woods Finance Company* 4.625%, 08/01/29 | 154,422 | |||||||||
139,000 | 6.625%, 01/15/28 | 127,573 | |||||||||
267,000 | At Home Group, Inc.* 4.875%, 07/15/28 | 92,783 | |||||||||
292,000 | Bath & Body Works, Inc. 6.694%, 01/15/27 | 282,986 | |||||||||
270,000 | 6.875%, 11/01/35 | 238,650 | |||||||||
136,000 | Caesars Entertainment, Inc.* 4.625%, 10/15/29^ | 111,967 | |||||||||
112,000 | 8.125%, 07/01/27 | 111,030 | |||||||||
225,000 | Carnival Corp.* 6.000%, 05/01/29 | 190,296 | |||||||||
108,000 | 7.625%, 03/01/26 | 105,074 | |||||||||
105,000 | 4.000%, 08/01/28 | 91,479 | |||||||||
13,000 | 7.000%, 08/15/29 | 12,771 | |||||||||
260,000 | Carriage Services, Inc.* 4.250%, 05/15/29 | 212,922 | |||||||||
44,000 | Carvana Company* 14.000%, 06/01/31 | 33,114 | |||||||||
37,000 | 13.000%, 06/01/30 | 27,767 | |||||||||
25,000 | 12.000%, 12/01/28 | 18,723 | |||||||||
| PRINCIPAL AMOUNT | VALUE | ||||||||||
470,000 | CCO Holdings, LLC / CCO Holdings Capital Corp.* 5.125%, 05/01/27 | $ | 433,058 | ||||||||
250,000 | 6.375%, 09/01/29 | 229,850 | |||||||||
245,000 | 4.750%, 03/01/30 | 202,390 | |||||||||
215,000 | 4.250%, 02/01/31 | 167,515 | |||||||||
125,000 | 5.000%, 02/01/28 | 111,988 | |||||||||
125,000 | 4.500%, 08/15/30 | 100,465 | |||||||||
108,000 | 4.750%, 02/01/32 | 84,423 | |||||||||
108,000 | CDI Escrow Issuer, Inc.* 5.750%, 04/01/30 | 96,783 | |||||||||
137,000 | Cedar Fair, LP^ 5.250%, 07/15/29 | 118,490 | |||||||||
105,000 | Churchill Downs, Inc.* 6.750%, 05/01/31 | 98,170 | |||||||||
175,000 | Dana, Inc. 4.250%, 09/01/30 | 139,249 | |||||||||
164,000 | 4.500%, 02/15/32 | 128,540 | |||||||||
275,000 | DISH DBS Corp. 5.250%, 12/01/26* | 222,467 | |||||||||
209,000 | 7.750%, 07/01/26 | 140,245 | |||||||||
133,000 | 7.375%, 07/01/28 | 74,985 | |||||||||
110,000 | 5.125%, 06/01/29 | 56,767 | |||||||||
220,000 | DISH Network Corp.* 11.750%, 11/15/27 | 218,097 | |||||||||
200,000 | Empire Resorts, Inc.* 7.750%, 11/01/26 | 163,786 | |||||||||
238,000 | Everi Holdings, Inc.* 5.000%, 07/15/29 | 200,196 | |||||||||
220,000 | Ford Motor Company^ 6.100%, 08/19/32 | 203,676 | |||||||||
350,000 | Ford Motor Credit Company, LLC 4.000%, 11/13/30 | 288,603 | |||||||||
300,000 | 5.113%, 05/03/29 | 272,466 | |||||||||
275,000 | 7.200%, 06/10/30 | 274,689 | |||||||||
200,000 | 7.350%, 11/04/27 | 202,608 | |||||||||
200,000 | 7.350%, 03/06/30 | 201,228 | |||||||||
82,000 | Gap, Inc.* 3.875%, 10/01/31 | 59,157 | |||||||||
110,000 | General Motors Company 5.200%, 04/01/45 | 81,538 | |||||||||
350,000 | goeasy, Ltd.* 5.375%, 12/01/24 | 344,004 | |||||||||
208,000 | 4.375%, 05/01/26 | 188,542 | |||||||||
110,000 | Goodyear Tire & Rubber Company^ 5.250%, 07/15/31 | 89,718 | |||||||||
93,000 | Group 1 Automotive, Inc.* 4.000%, 08/15/28 | 80,382 | |||||||||
226,000 | Guitar Center, Inc.*^& 8.500%, 01/15/26 | 191,008 | |||||||||
145,000 | International Game Technology, PLC* 6.250%, 01/15/27 | 141,481 | |||||||||
63,273 | JetBlue Pass Through Trust Series 2019-2, Class B 8.000%, 11/15/27 | 63,697 | |||||||||
See accompanying Notes to Schedule of Investments
www.calamos.com
173
Global Dynamic Income Fund Schedule of Investments October 31, 2023
| PRINCIPAL AMOUNT | VALUE | ||||||||||
180,000 | Kohl's Corp. 5.550%, 07/17/45 | $ | 104,069 | ||||||||
210,000 | LCM Investments Holdings II, LLC* 8.250%, 08/01/31 | 201,270 | |||||||||
220,000 | Liberty Interactive, LLC 8.250%, 02/01/30 | 57,959 | |||||||||
204,000 | Life Time, Inc.* 8.000%, 04/15/26 | 199,371 | |||||||||
110,000 | 5.750%, 01/15/26 | 106,685 | |||||||||
105,000 | Light & Wonder International, Inc.* 7.500%, 09/01/31 | 102,701 | |||||||||
80,000 | Lindblad Expeditions Holdings, Inc.* 9.000%, 05/15/28 | 78,424 | |||||||||
139,000 | Lindblad Expeditions, LLC* 6.750%, 02/15/27 | 126,390 | |||||||||
140,000 | M/I Homes, Inc. 3.950%, 02/15/30 | 112,027 | |||||||||
366,000 | Macy's Retail Holdings, LLC 6.700%, 07/15/34* | 282,212 | |||||||||
110,000 | 4.300%, 02/15/43 | 60,361 | |||||||||
260,000 | Mclaren Finance, PLC* 7.500%, 08/01/26 | 224,471 | |||||||||
287,000 | Midwest Gaming Borrower, LLC / Midwest Gaming Finance Corp.* 4.875%, 05/01/29 | 239,579 | |||||||||
125,000 | Newell Brands, Inc. 5.200%, 04/01/26 | 118,071 | |||||||||
110,000 | Nordstrom, Inc. 5.000%, 01/15/44 | 66,241 | |||||||||
105,000 | 4.250%, 08/01/31 | 76,978 | |||||||||
250,000 | PENN Entertainment, Inc.*^ 4.125%, 07/01/29 | 194,415 | |||||||||
250,000 | PetSmart, Inc. / PetSmart Finance Corp.* 4.750%, 02/15/28 | 221,407 | |||||||||
305,000 | Premier Entertainment Sub, LLC / Premier Entertainment Finance Corp.*^ 5.625%, 09/01/29 | 214,656 | |||||||||
553,000 | Rite Aid Corp.*@ 8.000%, 11/15/26 | 384,551 | |||||||||
105,000 | Royal Caribbean Cruises, Ltd.* 7.250%, 01/15/30 | 103,874 | |||||||||
320,000 | Simmons Foods, Inc. / Simmons Prepared Foods, Inc. / Simmons Pet Food, Inc. / Simmons Feed* 4.625%, 03/01/29 | 260,218 | |||||||||
425,000 | Six Flags Entertainment Corp.* 7.250%, 05/15/31 | 391,514 | |||||||||
241,000 | Sonic Automotive, Inc.*^ 4.625%, 11/15/29 | 200,975 | |||||||||
131,000 | Speedway Motorsports, LLC / Speedway Funding II, Inc.* 4.875%, 11/01/27 | 117,314 | |||||||||
455,000 | Station Casinos, LLC* 4.500%, 02/15/28 | 393,398 | |||||||||
| PRINCIPAL AMOUNT | VALUE | ||||||||||
128,000 | Taylor Morrison Communities, Inc.* 5.750%, 01/15/28 | $ | 116,596 | ||||||||
55,000 | Viking Cruises, Ltd.* 9.125%, 07/15/31 | 54,109 | |||||||||
260,000 | Vista Outdoor, Inc.* 4.500%, 03/15/29 | 242,216 | |||||||||
105,000 | Windsor Holdings III, LLC* 8.500%, 06/15/30 | 103,079 | |||||||||
210,000 | ZF North America Capital, Inc.* 7.125%, 04/14/30 | 204,393 | |||||||||
13,727,294 | |||||||||||
Consumer Staples (0.7%) | |||||||||||
224,000 | 1375209 B.C., Ltd.* 9.000%, 01/30/28 | 217,777 | |||||||||
205,000 | B&G Foods, Inc.* 8.000%, 09/15/28 | 200,129 | |||||||||
251,000 | Central Garden & Pet Company* 4.125%, 04/30/31 | 200,612 | |||||||||
245,000 | Edgewell Personal Care Company* 4.125%, 04/01/29 | 206,028 | |||||||||
307,000 | Energizer Holdings, Inc.* 4.375%, 03/31/29 | 252,765 | |||||||||
54,000 | 6.500%, 12/31/27 | 50,734 | |||||||||
320,000 | JBS USA LUX, SA / JBS USA Food Company / JBS USA Finance, Inc. 5.500%, 01/15/30 | 292,778 | |||||||||
135,000 | 5.125%, 02/01/28µ | 126,791 | |||||||||
80,000 | 5.750%, 04/01/33 | 70,438 | |||||||||
174,000 | New Albertsons, LP 7.750%, 06/15/26 | 175,937 | |||||||||
217,000 | Performance Food Group, Inc.* 4.250%, 08/01/29 | 184,135 | |||||||||
165,000 | Pilgrim's Pride Corp. 4.250%, 04/15/31 | 136,328 | |||||||||
110,000 | Post Holdings, Inc.* 5.750%, 03/01/27 | 105,027 | |||||||||
209,000 | Prestige Brands, Inc.* 3.750%, 04/01/31 | 166,611 | |||||||||
195,000 | United Natural Foods, Inc.* 6.750%, 10/15/28 | 152,601 | |||||||||
342,000 | Vector Group, Ltd.* 5.750%, 02/01/29 | 290,402 | |||||||||
105,000 | Williams Scotsman, Inc.* 7.375%, 10/01/31 | 103,680 | |||||||||
2,932,773 | |||||||||||
Energy (2.2%) | |||||||||||
211,000 | Antero Resources Corp.* 5.375%, 03/01/30 | 192,863 | |||||||||
223,000 | Apache Corp. 5.100%, 09/01/40 | 173,623 | |||||||||
140,000 | Buckeye Partners, LP 3.950%, 12/01/26 | 127,777 | |||||||||
135,000 | 5.850%, 11/15/43 | 95,615 | |||||||||
See accompanying Notes to Schedule of Investments
CALAMOS CLOSED-END FAMILY OF FUNDS ANNUAL REPORT
174
Global Dynamic Income Fund Schedule of Investments October 31, 2023
| PRINCIPAL AMOUNT | VALUE | ||||||||||
305,000 | Callon Petroleum Company*^ 7.500%, 06/15/30 | $ | 295,661 | ||||||||
112,000 | Cheniere Energy, Inc. 4.625%, 10/15/28 | 102,390 | |||||||||
167,000 | Chesapeake Energy Corp.* 6.750%, 04/15/29 | 163,865 | |||||||||
297,000 | Civitas Resources, Inc.* 8.750%, 07/01/31 | 300,122 | |||||||||
165,000 | Continental Resources, Inc.* 2.875%, 04/01/32 | 122,230 | |||||||||
100,000 | 5.750%, 01/15/31 | 92,830 | |||||||||
169,000 | DT Midstream, Inc.* 4.125%, 06/15/29 | 145,536 | |||||||||
207,000 | Earthstone Energy Holdings, LLC* 8.000%, 04/15/27 | 210,140 | |||||||||
80,000 | 9.875%, 07/15/31 | 86,329 | |||||||||
120,000 | Enbridge, Inc.‡ 7.375%, 01/15/83 5 year CMT + 3.71% | 111,668 | |||||||||
320,000 | Energy Transfer, LP‡ 8.656%, 11/15/26 3 mo. USD SOFR + 3.28% | 261,632 | |||||||||
162,000 | 6.500%, 11/01/35 5 year CMT + 5.69% | 147,218 | |||||||||
240,000 | EnLink Midstream Partners, LP 9.780%, 12/01/23‡ 3 mo. LIBOR + 4.11% | 214,322 | |||||||||
224,000 | 4.850%, 07/15/26 | 211,799 | |||||||||
132,000 | Enlink Midstream, LLC* 6.500%, 09/01/30 | 126,910 | |||||||||
355,000 | EQM Midstream Partners, LP* 7.500%, 06/01/27 | 352,927 | |||||||||
138,000 | Genesis Energy, LP / Genesis Energy Finance Corp. 8.875%, 04/15/30 | 134,182 | |||||||||
88,000 | 6.250%, 05/15/26 | 84,010 | |||||||||
215,000 | Gulfport Energy Corp. 6.375%, 05/15/25@& | — | |||||||||
205,000 | 8.000%, 05/17/26* | 205,086 | |||||||||
65,708 | 8.000%, 05/17/26 | 65,736 | |||||||||
305,000 | Hilcorp Energy I, LP / Hilcorp Finance Company* 6.000%, 04/15/30 | 271,197 | |||||||||
163,000 | Howard Midstream Energy Partners, LLC* 6.750%, 01/15/27 | 155,016 | |||||||||
217,000 | Magnolia Oil & Gas Operating, LLC / Magnolia Oil & Gas Finance Corp.* 6.000%, 08/01/26 | 207,621 | |||||||||
135,000 | Moss Creek Resources Holdings, Inc.* 10.500%, 05/15/27 | 133,615 | |||||||||
90,000 | 7.500%, 01/15/26 | 86,153 | |||||||||
160,000 | Nabors Industries, Inc.* 7.375%, 05/15/27 | 149,830 | |||||||||
160,000 | Nabors Industries, Ltd.* 7.500%, 01/15/28 | 141,382 | |||||||||
| PRINCIPAL AMOUNT | VALUE | ||||||||||
221,000 | New Fortress Energy, Inc.* 6.750%, 09/15/25 | $ | 205,672 | ||||||||
113,000 | 6.500%, 09/30/26 | 101,303 | |||||||||
107,000 | Oceaneering International, Inc.* 6.000%, 02/01/28 | 98,122 | |||||||||
230,000 | Parkland Corp.* 5.875%, 07/15/27 | 221,180 | |||||||||
112,000 | Patterson-UTI Energy, Inc. 5.150%, 11/15/29 | 100,056 | |||||||||
52,000 | Permian Resources Operating LLC* 7.000%, 01/15/32 | 50,882 | |||||||||
270,000 | Plains All American Pipeline, LP‡ 9.736%, 12/01/23 3 mo. LIBOR + 4.11% | 254,864 | |||||||||
305,000 | Rockcliff Energy II, LLC* 5.500%, 10/15/29 | 276,836 | |||||||||
109,000 | Southwestern Energy Company 4.750%, 02/01/32 | 93,845 | |||||||||
105,000 | 5.375%, 02/01/29 | 97,275 | |||||||||
54,000 | Sunoco, LP / Sunoco Finance Corp. 4.500%, 04/30/30 | 46,462 | |||||||||
301,150 | Transocean, Inc.* 8.750%, 02/15/30 | 300,906 | |||||||||
130,000 | Venture Global Calcasieu Pass, LLC* 6.250%, 01/15/30 | 122,723 | |||||||||
55,000 | 4.125%, 08/15/31 | 44,462 | |||||||||
55,000 | 3.875%, 08/15/29 | 46,071 | |||||||||
265,000 | Venture Global LNG, Inc.* 8.375%, 06/01/31 | 253,075 | |||||||||
155,000 | 8.125%, 06/01/28 | 150,601 | |||||||||
105,000 | 9.875%, 02/01/32 | 106,561 | |||||||||
50,000 | 9.500%, 02/01/29 | 50,752 | |||||||||
203,000 | Vital Energy, Inc. 9.500%, 01/15/25 | 204,100 | |||||||||
100,000 | 7.750%, 07/31/29* | 90,380 | |||||||||
26,000 | 9.750%, 10/15/30 | 25,500 | |||||||||
190,000 | VOC Escrow, Ltd.* 5.000%, 02/15/28 | 171,393 | |||||||||
262,000 | Weatherford International, Ltd.* 8.625%, 04/30/30 | 265,149 | |||||||||
8,547,455 | |||||||||||
Financials (2.8%) | |||||||||||
292,000 | Acrisure, LLC / Acrisure Finance, Inc.* 7.000%, 11/15/25 | 283,684 | |||||||||
323,000 | Aethon United BR, LP / Aethon United Finance Corp.* 8.250%, 02/15/26 | 321,194 | |||||||||
342,000 | AG Issuer, LLC* 6.250%, 03/01/28 | 316,925 | |||||||||
370,000 | Alliant Holdings Intermediate, LLC / Alliant Holdings Co-Issuer* 6.750%, 10/15/27 | 337,988 | |||||||||
See accompanying Notes to Schedule of Investments
www.calamos.com
175
Global Dynamic Income Fund Schedule of Investments October 31, 2023
| PRINCIPAL AMOUNT | VALUE | ||||||||||
245,000 | Ally Financial, Inc. 4.700%, 05/15/26‡ 5 year CMT + 3.87% | $ | 160,090 | ||||||||
100,000 | 4.700%, 05/15/28‡ 7 year CMT + 3.48% | 58,511 | |||||||||
90,000 | 8.000%, 11/01/31 | 88,008 | |||||||||
439,000 | AmWINS Group, Inc.* 4.875%, 06/30/29 | 376,855 | |||||||||
248,000 | Aviation Capital Group, LLC*µ 3.500%, 11/01/27 | 217,977 | |||||||||
90,000 | Avolon Holdings Funding, Ltd.*µ 5.500%, 01/15/26 | 86,747 | |||||||||
434,000 | BroadStreet Partners, Inc.* 5.875%, 04/15/29 | 378,700 | |||||||||
200,000 | Brookfield Property REIT, Inc. / BPR Cumulus, LLC / BPR Nimbus, LLC / GGSI Sellco, LLC* 4.500%, 04/01/27 | 166,904 | |||||||||
134,000 | 5.750%, 05/15/26 | 122,898 | |||||||||
200,000 | Burford Capital Global Financial, LLC* 6.875%, 04/15/30 | 181,068 | |||||||||
237,000 | Credit Acceptance Corp. 5.125%, 12/31/24* | 229,466 | |||||||||
230,000 | 6.625%, 03/15/26^ | 219,227 | |||||||||
210,000 | Cushman & Wakefield U.S. Borrower LLC* 8.875%, 09/01/31 | 199,521 | |||||||||
283,000 | Enact Holdings, Inc.* 6.500%, 08/15/25 | 278,730 | |||||||||
321,000 | Global Net Lease, Inc. / Global Net Lease Operating Partnership, LP* 3.750%, 12/15/27 | 243,806 | |||||||||
225,000 | GTCR W-2 Merger Sub, LLC* 7.500%, 01/15/31 | 222,118 | |||||||||
324,000 | HUB International, Ltd.* 5.625%, 12/01/29 | 279,699 | |||||||||
161,000 | 7.000%, 05/01/26 | 157,030 | |||||||||
164,000 | Icahn Enterprises, LP / Icahn Enterprises Finance Corp. 4.375%, 02/01/29 | 127,254 | |||||||||
275,000 | ILFC E-Capital Trust II*‡ 7.459%, 12/21/65 3 mo. LIBOR + 1.80% | 206,847 | |||||||||
435,000 | Iron Mountain, Inc.* 5.250%, 03/15/28 | 398,556 | |||||||||
53,000 | 7.000%, 02/15/29 | 51,476 | |||||||||
600,000 | Jefferies Finance, LLC / JFIN Co-Issuer Corp.* 5.000%, 08/15/28 | 481,290 | |||||||||
387,000 | Ladder Capital Finance Holdings, LLLP / Ladder Capital Finance Corp.* 5.250%, 10/01/25 | 368,966 | |||||||||
109,000 | 4.750%, 06/15/29 | 87,983 | |||||||||
205,000 | LD Holdings Group, LLC* 6.125%, 04/01/28 | 114,872 | |||||||||
| PRINCIPAL AMOUNT | VALUE | ||||||||||
235,000 | Level 3 Financing, Inc.* 4.250%, 07/01/28 | $ | 133,078 | ||||||||
173,000 | 3.400%, 03/01/27^ | 160,976 | |||||||||
105,000 | 4.625%, 09/15/27 | 70,866 | |||||||||
162,000 | LPL Holdings, Inc.* 4.000%, 03/15/29 | 139,380 | |||||||||
210,000 | Macquarie Airfinance Holdings, Ltd.* 8.125%, 03/30/29 | 207,125 | |||||||||
344,000 | MetLife, Inc. 6.400%, 12/15/66 | 323,185 | |||||||||
300,000 | Nationstar Mortgage Holdings, Inc.* 5.500%, 08/15/28 | 265,842 | |||||||||
228,000 | Navient Corp. 5.000%, 03/15/27 | 201,091 | |||||||||
115,000 | 4.875%, 03/15/28 | 95,412 | |||||||||
250,000 | Necessity Retail REIT, Inc. / American Finance Operating Partner, LP* 4.500%, 09/30/28 | 187,412 | |||||||||
150,000 | OneMain Finance Corp. 3.875%, 09/15/28 | 119,461 | |||||||||
145,000 | 9.000%, 01/15/29 | 141,777 | |||||||||
108,000 | 7.125%, 03/15/26 | 105,114 | |||||||||
110,000 | Park Intermediate Holdings, LLC / PK Domestic Property, LLC / PK Finance Co-Issuer* 5.875%, 10/01/28 | 99,335 | |||||||||
341,000 | PHH Mortgage Corp.* 7.875%, 03/15/26 | 295,719 | |||||||||
260,000 | RHP Hotel Properties, LP / RHP Finance Corp.* 4.500%, 02/15/29 | 221,637 | |||||||||
100,000 | Rocket Mortgage, LLC / Rocket Mortgage Co-Issuer, Inc.* 3.875%, 03/01/31 | 77,400 | |||||||||
100,000 | 3.625%, 03/01/29 | 81,400 | |||||||||
50,000 | 2.875%, 10/15/26 | 43,668 | |||||||||
227,000 | StoneX Group, Inc.* 8.625%, 06/15/25 | 228,360 | |||||||||
258,000 | United Wholesale Mortgage, LLC* 5.500%, 04/15/29 | 216,137 | |||||||||
105,000 | 5.750%, 06/15/27 | 95,816 | |||||||||
110,000 | Uniti Group, LP / Uniti Group Finance, Inc. / CSL Capital, LLC* 6.500%, 02/15/29 | 71,531 | |||||||||
105,000 | 10.500%, 02/15/28 | 101,244 | |||||||||
250,000 | VZ Secured Financing, BV* 5.000%, 01/15/32 | 190,517 | |||||||||
237,000 | XHR, LP* 6.375%, 08/15/25 | 231,300 | |||||||||
10,869,173 | |||||||||||
Health Care (1.1%) | |||||||||||
398,000 | Bausch Health Companies, Inc.* 11.000%, 09/30/28 | 243,640 | |||||||||
81,000 | 6.125%, 02/01/27 | 45,255 | |||||||||
78,000 | 14.000%, 10/15/30 | 42,969 | |||||||||
See accompanying Notes to Schedule of Investments
CALAMOS CLOSED-END FAMILY OF FUNDS ANNUAL REPORT
176
Global Dynamic Income Fund Schedule of Investments October 31, 2023
| PRINCIPAL AMOUNT | VALUE | ||||||||||
435,000 | CHS/Community Health Systems, Inc.* 6.125%, 04/01/30 | $ | 169,093 | ||||||||
230,000 | 8.000%, 03/15/26 | 210,588 | |||||||||
127,000 | 6.875%, 04/15/29 | 52,427 | |||||||||
27,000 | 5.250%, 05/15/30 | 19,196 | |||||||||
433,000 | DaVita, Inc.* 4.625%, 06/01/30 | 339,736 | |||||||||
258,000 | 3.750%, 02/15/31 | 185,744 | |||||||||
162,000 | Embecta Corp.* 5.000%, 02/15/30 | 128,771 | |||||||||
52,000 | 6.750%, 02/15/30 | 43,133 | |||||||||
110,000 | Encompass Health Corp. 4.750%, 02/01/30 | 95,489 | |||||||||
110,000 | 4.500%, 02/01/28 | 99,266 | |||||||||
300,000 | HCA, Inc. 7.500%, 11/06/33 | 307,962 | |||||||||
200,000 | Jazz Securities DAC* 4.375%, 01/15/29 | 173,966 | |||||||||
119,819 | Mallinckrodt International Finance, SA / Mallinckrodt CB, LLC*@ 10.000%, 06/15/29 | 8,517 | |||||||||
270,000 | Medline Borrower, LP* 3.875%, 04/01/29 | 228,082 | |||||||||
267,000 | 5.250%, 10/01/29 | 227,553 | |||||||||
400,000 | Organon & Company / Organon Foreign Debt Co-Issuer, BV* 5.125%, 04/30/31 | 313,312 | |||||||||
305,000 | Team Health Holdings, Inc.* 6.375%, 02/01/25 | 244,903 | |||||||||
430,000 | Tenet Healthcare Corp. 6.250%, 02/01/27 | 413,712 | |||||||||
295,000 | 6.875%, 11/15/31 | 272,524 | |||||||||
270,000 | Teva Pharmaceutical Finance Netherlands III, BV 5.125%, 05/09/29 | 235,694 | |||||||||
200,000 | 4.750%, 05/09/27 | 181,566 | |||||||||
100,000 | 3.150%, 10/01/26 | 88,028 | |||||||||
4,371,126 | |||||||||||
Industrials (2.5%) | |||||||||||
260,000 | ACCO Brands Corp.* 4.250%, 03/15/29 | 215,948 | |||||||||
235,000 | AerCap Holdings, NV^‡ 5.875%, 10/10/79 5 year CMT + 4.54% | 221,046 | |||||||||
200,000 | Air Lease Corp.‡ 4.125%, 12/15/26 5 year CMT + 3.15% | 143,886 | |||||||||
365,000 | Albertsons Companies, Inc. / Safeway, Inc. / New Albertsons, LP / Albertsons, LLC* 4.625%, 01/15/27 | 343,549 | |||||||||
162,000 | 3.500%, 03/15/29 | 138,249 | |||||||||
155,000 | 5.875%, 02/15/28 | 148,705 | |||||||||
250,000 | Allegiant Travel Company* 7.250%, 08/15/27 | 227,695 | |||||||||
| PRINCIPAL AMOUNT | VALUE | ||||||||||
55,000 | American Airlines Group, Inc.* 3.750%, 03/01/25 | $ | 51,499 | ||||||||
127,000 | Arcosa, Inc.* 4.375%, 04/15/29 | 111,202 | |||||||||
475,000 | ARD Finance, SA* 6.500%, 06/30/27 7.250% PIK rate | 277,362 | |||||||||
178,000 | Beacon Roofing Supply, Inc.* 4.125%, 05/15/29 | 149,614 | |||||||||
105,000 | Bombardier, Inc.* 7.875%, 04/15/27 | 101,168 | |||||||||
226,000 | BWX Technologies, Inc.* 4.125%, 04/15/29 | 195,515 | |||||||||
215,000 | Cascades, Inc. / Cascades USA, Inc.* 5.375%, 01/15/28 | 195,388 | |||||||||
56,000 | Delta Air Lines, Inc. / SkyMiles IP, Ltd.*µ 4.750%, 10/20/28 | 52,636 | |||||||||
282,000 | Deluxe Corp.* 8.000%, 06/01/29 | 223,505 | |||||||||
163,000 | Eco Material Technologies, Inc.* 7.875%, 01/31/27 | 155,095 | |||||||||
105,000 | Emerald Debt Merger Sub, LLC* 6.625%, 12/15/30 | 100,029 | |||||||||
140,000 | EnerSys* 4.375%, 12/15/27 | 125,755 | |||||||||
135,000 | Graham Packaging Company, Inc.* 7.125%, 08/15/28 | 104,958 | |||||||||
102,000 | Graphic Packaging International, LLC* 3.500%, 03/01/29 | 85,677 | |||||||||
85,000 | 4.750%, 07/15/27 | 79,432 | |||||||||
236,000 | Great Lakes Dredge & Dock Corp.*^ 5.250%, 06/01/29 | 193,348 | |||||||||
516,000 | H&E Equipment Services, Inc.* 3.875%, 12/15/28 | 438,187 | |||||||||
324,000 | Hawaiian Brand Intellectual Property, Ltd. / HawaiianMiles Loyalty, Ltd.* 5.750%, 01/20/26 | 239,695 | |||||||||
270,000 | Herc Holdings, Inc.* 5.500%, 07/15/27 | 254,343 | |||||||||
255,000 | IEA Energy Services, LLC* 6.625%, 08/15/29 | 243,601 | |||||||||
154,000 | JELD-WEN, Inc.* 4.625%, 12/15/25 | 146,292 | |||||||||
110,000 | 4.875%, 12/15/27 | 93,927 | |||||||||
360,000 | Ken Garff Automotive, LLC* 4.875%, 09/15/28 | 306,774 | |||||||||
210,000 | Knife River Holding Company* 7.750%, 05/01/31 | 209,544 | |||||||||
110,000 | MasTec, Inc.* 4.500%, 08/15/28 | 96,722 | |||||||||
135,000 | Moog, Inc.* 4.250%, 12/15/27 | 122,585 | |||||||||
275,000 | Newfold Digital Holdings Group, Inc.*^ 6.000%, 02/15/29 | 181,811 | |||||||||
www.calamos.com
177
Global Dynamic Income Fund Schedule of Investments October 31, 2023
| PRINCIPAL AMOUNT | VALUE | ||||||||||
232,000 | Novelis Corp.* 4.750%, 01/30/30 | $ | 197,792 | ||||||||
80,000 | OI European Group, BV* 4.750%, 02/15/30 | 68,118 | |||||||||
255,000 | Pactiv Evergreen Group Issuer, Inc. / Pactiv Evergreen Group Issuer, LLC* 4.000%, 10/15/27 | 224,507 | |||||||||
327,000 | Patrick Industries, Inc.* 4.750%, 05/01/29 | 268,830 | |||||||||
110,000 | QVC, Inc. 5.450%, 08/15/34 | 46,851 | |||||||||
163,000 | Sealed Air Corp.* 6.125%, 02/01/28 | 155,228 | |||||||||
54,000 | 5.000%, 04/15/29 | 48,191 | |||||||||
210,000 | Sensata Technologies, Inc.* 3.750%, 02/15/31 | 168,391 | |||||||||
167,000 | Sinclair Television Group, Inc.* 4.125%, 12/01/30 | 105,113 | |||||||||
100,000 | 5.500%, 03/01/30 | 54,391 | |||||||||
225,000 | Standard Industries, Inc.* 5.000%, 02/15/27 | 208,411 | |||||||||
176,000 | Stericycle, Inc.* 3.875%, 01/15/29 | 150,385 | |||||||||
166,000 | STL Holding Company, LLC* 7.500%, 02/15/26 | 155,906 | |||||||||
225,000 | TransDigm, Inc. 6.875%, 12/15/30* | 217,753 | |||||||||
209,000 | 6.250%, 03/15/26* | 204,532 | |||||||||
205,000 | 7.500%, 03/15/27 | 205,029 | |||||||||
155,000 | 6.750%, 08/15/28* | 150,852 | |||||||||
215,000 | Tronox, Inc.* 4.625%, 03/15/29 | 169,011 | |||||||||
92,353 | United Airlines Pass Through Trust Series 2019-2, Class B 3.500%, 11/01/29 | 81,851 | |||||||||
217,000 | Vertiv Group Corp.* 4.125%, 11/15/28 | 189,908 | |||||||||
228,000 | Wabash National Corp.* 4.500%, 10/15/28 | 189,064 | |||||||||
170,000 | Waste Pro USA, Inc.* 5.500%, 02/15/26 | 156,833 | |||||||||
128,000 | Williams Scotsman, Inc.* 4.625%, 08/15/28 | 113,882 | |||||||||
9,505,571 | |||||||||||
Information Technology (0.8%) | |||||||||||
109,000 | Booz Allen Hamilton, Inc.* 4.000%, 07/01/29 | 96,274 | |||||||||
126,000 | Coherent Corp.*^ 5.000%, 12/15/29 | 107,130 | |||||||||
200,000 | CommScope Technologies, LLC* 6.000%, 06/15/25 | 120,812 | |||||||||
200,000 | CommScope, Inc.* 4.750%, 09/01/29 | 136,626 | |||||||||
| PRINCIPAL AMOUNT | VALUE | ||||||||||
110,000 | Dell International, LLC / EMC Corp. 6.020%, 06/15/26 | $ | 110,124 | ||||||||
108,000 | Dun & Bradstreet Corp.*^ 5.000%, 12/15/29 | 93,057 | |||||||||
93,000 | Fair Isaac Corp.* 4.000%, 06/15/28 | 82,970 | |||||||||
245,000 | KBR, Inc.* 4.750%, 09/30/28 | 216,053 | |||||||||
245,000 | MPH Acquisition Holdings, LLC* 5.750%, 11/01/28^ | 182,954 | |||||||||
110,000 | 5.500%, 09/01/28 | 92,002 | |||||||||
105,000 | NCL Corp., Ltd.* 8.125%, 01/15/29 | 102,726 | |||||||||
113,000 | NCR Voyix Corp.* 5.125%, 04/15/29 | 97,301 | |||||||||
167,000 | ON Semiconductor Corp.* 3.875%, 09/01/28 | 143,533 | |||||||||
139,000 | Open Text Corp.* 3.875%, 02/15/28 | 121,079 | |||||||||
110,000 | 6.900%, 12/01/27 | 109,789 | |||||||||
81,000 | 3.875%, 12/01/29 | 66,499 | |||||||||
81,000 | Open Text Holdings, Inc.* 4.125%, 12/01/31 | 63,859 | |||||||||
248,000 | Playtika Holding Corp.* 4.250%, 03/15/29 | 200,220 | |||||||||
315,000 | TTM Technologies, Inc.* 4.000%, 03/01/29 | 259,157 | |||||||||
150,000 | Twilio, Inc. 3.625%, 03/15/29 | 125,185 | |||||||||
57,000 | 3.875%, 03/15/31 | 45,624 | |||||||||
240,000 | Viavi Solutions, Inc.* 3.750%, 10/01/29 | 191,076 | |||||||||
260,000 | ZoomInfo Technologies, LLC / ZoomInfo Finance Corp.* 3.875%, 02/01/29 | 214,976 | |||||||||
2,979,026 | |||||||||||
Materials (0.7%) | |||||||||||
130,000 | ArcelorMittal, SA^ 7.000%, 10/15/39 | 123,646 | |||||||||
85,000 | ATI, Inc. 5.875%, 12/01/27 | 79,168 | |||||||||
55,000 | Carpenter Technology Corp. 7.625%, 03/15/30 | 54,642 | |||||||||
165,000 | Chemours Company* 4.625%, 11/15/29 | 127,690 | |||||||||
355,000 | Clearwater Paper Corp.* 4.750%, 08/15/28 | 313,717 | |||||||||
157,000 | Cleveland-Cliffs, Inc.* 6.750%, 04/15/30 | 145,869 | |||||||||
108,000 | Commercial Metals Company 4.125%, 01/15/30 | 91,407 | |||||||||
54,000 | 4.375%, 03/15/32 | 43,639 | |||||||||
250,000 | Constellium, SE* 3.750%, 04/15/29 | 205,882 | |||||||||
CALAMOS CLOSED-END FAMILY OF FUNDS ANNUAL REPORT
178
Global Dynamic Income Fund Schedule of Investments October 31, 2023
| PRINCIPAL AMOUNT | VALUE | ||||||||||
111,000 | HB Fuller Company 4.250%, 10/15/28 | $ | 96,341 | ||||||||
215,000 | JW Aluminum Continuous Cast Company* 10.250%, 06/01/26 | 214,469 | |||||||||
245,000 | Kaiser Aluminum Corp.* 4.625%, 03/01/28 | 204,788 | |||||||||
28,000 | 4.500%, 06/01/31 | 20,711 | |||||||||
58,000 | LSF11 A5 HoldCo, LLC* 6.625%, 10/15/29 | 47,590 | |||||||||
284,000 | Mercer International, Inc. 5.125%, 02/01/29 | 223,062 | |||||||||
107,000 | 12.875%, 10/01/28* | 108,205 | |||||||||
200,000 | OCI, NV* 6.700%, 03/16/33 | 185,102 | |||||||||
160,000 | Owens-Brockway Glass Container, Inc.* 7.250%, 05/15/31 | 146,621 | |||||||||
115,000 | 6.625%, 05/13/27 | 109,579 | |||||||||
200,000 | Silgan Holdings, Inc. 4.125%, 02/01/28 | 178,390 | |||||||||
113,000 | Trinseo Materials Operating SCA / Trinseo Materials Finance, Inc.* 5.125%, 04/01/29 | 48,415 | |||||||||
2,768,933 | |||||||||||
Other (0.1%) | |||||||||||
100,000 | Gen Digital, Inc.* 7.125%, 09/30/30^ | 97,481 | |||||||||
100,000 | 6.750%, 09/30/27 | 97,512 | |||||||||
194,993 | |||||||||||
Real Estate (0.2%) | |||||||||||
174,000 | EPR Properties 3.750%, 08/15/29 | 137,512 | |||||||||
187,000 | Forestar Group, Inc.* 5.000%, 03/01/28 | 164,945 | |||||||||
110,000 | 3.850%, 05/15/26 | 98,718 | |||||||||
248,000 | MIWD Holdco II, LLC / MIWD Finance Corp.* 5.500%, 02/01/30 | 197,004 | |||||||||
105,000 | Service Properties Trust 5.250%, 02/15/26 | 94,258 | |||||||||
692,437 | |||||||||||
Special Purpose Acquisition Companies (0.1%) | |||||||||||
220,000 | Fertitta Entertainment, LLC / Fertitta Entertainment Finance Company, Inc.* 6.750%, 01/15/30 | 175,054 | |||||||||
107,000 | 4.625%, 01/15/29 | 90,339 | |||||||||
265,393 | |||||||||||
Utilities (0.1%) | |||||||||||
79,000 | PPL Capital Funding, Inc.‡ 8.317%, 03/30/67 3 mo. LIBOR + 2.67% | 71,578 | |||||||||
| PRINCIPAL AMOUNT | VALUE | ||||||||||
105,000 | Vistra Corp.*‡ 7.000%, 12/15/26 5 year CMT + 5.74% | $ | 96,054 | ||||||||
50,000 | 8.000%, 10/15/26 5 year CMT + 6.93% | 47,569 | |||||||||
215,201 | |||||||||||
TOTAL CORPORATE BONDS (Cost $69,961,170) | 65,250,838 | ||||||||||
CONVERTIBLE BONDS (34.0%) | |||||||||||
Communication Services (2.4%) | |||||||||||
200,000 | EUR | America Movil, BV 0.000%, 03/02/24 | 219,067 | ||||||||
325,000 | Bharti Airtel, Ltd.* 1.500%, 02/17/25 | 487,406 | |||||||||
159,000 | Cable One, Inc.µ 0.000%, 03/15/26 | 130,172 | |||||||||
20,000,000 | JPY | CyberAgent, Inc.µ 0.000%, 02/19/25 | 130,591 | ||||||||
2,185,000 | Liberty Media Corp.-Liberty Formula One 2.250%, 08/15/27 | 2,177,855 | |||||||||
5,311,000 | Sea, Ltd. 2.375%, 12/01/25 | 5,030,048 | |||||||||
604,000 | 0.250%, 09/15/26 | 480,289 | |||||||||
538,000 | Snap, Inc. 0.125%, 03/01/28 | 369,170 | |||||||||
200,000 | Xiaomi Best Time International, Ltd. 0.000%, 12/17/27 | 173,216 | |||||||||
157,000 | Zillow Group, Inc. 1.375%, 09/01/26 | 164,916 | |||||||||
9,362,730 | |||||||||||
Consumer Discretionary (8.4%) | |||||||||||
203,000 | Airbnb, Inc.µ 0.000%, 03/15/26 | 175,879 | |||||||||
145,000 | Booking Holdings, Inc. 0.750%, 05/01/25 | 221,112 | |||||||||
353,000 | Burlington Stores, Inc.µ 2.250%, 04/15/25 | 341,252 | |||||||||
608,000 | DISH Network Corp. 0.000%, 12/15/25 | 373,032 | |||||||||
268,000 | 2.375%, 03/15/24µ | 256,800 | |||||||||
410,000 | DraftKings Holdings, Inc.µ 0.000%, 03/15/28 | 304,323 | |||||||||
229,000 | Etsy, Inc.µ 0.125%, 10/01/26 | 228,031 | |||||||||
161,000 | 0.125%, 09/01/27 | 127,229 | |||||||||
251,000 | Farfetch, Ltd. 3.750%, 05/01/27 | 122,599 | |||||||||
2,600,000 | AUD | Flight Centre Travel Group, Ltd. 2.500%, 11/17/27 | 1,808,006 | ||||||||
200,000 | AUD | 1.625%, 11/01/28 | 115,669 | ||||||||
11,210,000 | Ford Motor Company~µ 0.000%, 03/15/26 | 10,232,600 | |||||||||
www.calamos.com
179
Global Dynamic Income Fund Schedule of Investments October 31, 2023
| PRINCIPAL AMOUNT | VALUE | ||||||||||
2,740,000 | IMAX Corp.µ 0.500%, 04/01/26 | $ | 2,490,934 | ||||||||
161,000 | Liberty Broadband Corp.* 3.125%, 03/31/53 | 159,720 | |||||||||
214,000 | Lucid Group, Inc.* 1.250%, 12/15/26 | 117,948 | |||||||||
3,706,000 | MakeMyTrip, Ltd. 0.000%, 02/15/28 | 4,221,060 | |||||||||
725,000 | Marriott Vacations Worldwide Corp.µ 0.000%, 01/15/26 | 624,972 | |||||||||
400,000 | Meituan 0.000%, 04/27/28 | 333,968 | |||||||||
40,000,000 | JPY | Mercari, Inc. 0.000%, 07/14/28 | 202,289 | ||||||||
160,000 | NIO, Inc.* 4.625%, 10/15/30 | 143,128 | |||||||||
100,000 | GBP | Ocado Group, PLCµ 0.875%, 12/09/25 | 102,043 | ||||||||
100,000 | GBP | 0.750%, 01/18/27 | 86,090 | ||||||||
339,000 | PDD Holdings, Inc. 0.000%, 12/01/25 | 336,397 | |||||||||
158,000 | Rivian Automotive, Inc.* 4.625%, 03/15/29 | 166,561 | |||||||||
194,000 | Royal Caribbean Cruises, Ltd. 6.000%, 08/15/25 | 354,752 | |||||||||
100,000 | EUR | Shop Apotheke Europe, NVµ 0.000%, 01/21/28 | 92,499 | ||||||||
162,000 | Stride, Inc. 1.125%, 09/01/27 | 192,109 | |||||||||
17,000 | Tesla, Inc. 2.000%, 05/15/24 | 165,584 | |||||||||
318,000 | Wayfair, Inc. 0.625%, 10/01/25µ | 270,494 | |||||||||
302,000 | 3.500%, 11/15/28* | 350,891 | |||||||||
168,000 | 1.000%, 08/15/26µ | 126,838 | |||||||||
1,900,000 | GBP | WH Smith, PLCµ 1.625%, 05/07/26 | 2,001,055 | ||||||||
4,373,000 | Wynn Macau, Ltd.* 4.500%, 03/07/29 | 4,460,985 | |||||||||
5,000,000 | HKD | Zhongsheng Group Holdings, Ltd. 0.000%, 05/21/25 | 665,135 | ||||||||
31,971,984 | |||||||||||
Consumer Staples (1.6%) | |||||||||||
111,000 | Enovis Corp.* 3.875%, 10/15/28 | 115,967 | |||||||||
2,500,000 | EUR | Fomento Economico Mexicano SAB de CV 2.625%, 02/24/26 | 2,590,573 | ||||||||
20,000,000 | JPY | Nippn Corp. 0.000%, 06/20/25 | 145,010 | ||||||||
4,975,000 | CAD | Premium Brands Holdings Corp. 4.200%, 09/30/27 | 3,166,636 | ||||||||
6,018,186 | |||||||||||
| PRINCIPAL AMOUNT | VALUE | ||||||||||
Energy (2.1%) | |||||||||||
2,400,000 | EUR | Eni S.p.A 2.950%, 09/14/30 | $ | 2,596,019 | |||||||
1,650,000 | Nabors Industries, Inc.*µ 1.750%, 06/15/29 | 1,236,378 | |||||||||
306,000 | Northern Oil & Gas, Inc. 3.625%, 04/15/29 | 361,407 | |||||||||
100,000 | Pioneer Natural Resources Company 0.250%, 05/15/25 | 255,197 | |||||||||
3,200,000 | EUR | Saipem S.p.A 2.875%, 09/11/29 | 3,469,960 | ||||||||
2,261,000 | SunEdison, Inc.@ 0.250%, 01/15/49* | 22,610 | |||||||||
275,000 | 2.000%, 10/01/49 | 2,750 | |||||||||
7,944,321 | |||||||||||
Financials (1.6%) | |||||||||||
41,000,000 | HKD | Citigroup Global Markets Funding Luxembourg SCAµ 0.000%, 07/25/24 | 5,008,023 | ||||||||
192,000 | Coinbase Global, Inc.µ 0.500%, 06/01/26 | 145,703 | |||||||||
64,817 | EUR | Corestate Capital Holding, SA 8.000%, 12/31/26 | 34,714 | ||||||||
100,000 | GBP | Cornwall Jersey, Ltd. 0.750%, 04/16/26 | 77,213 | ||||||||
100,000 | EUR | JPMorgan Chase Bank NA 0.000%, 02/18/24 | 104,594 | ||||||||
200,000 | EUR | JPMorgan Chase Financial Company, LLC (Voya Financial, Inc.)§ 0.000%, 01/14/25 | 211,563 | ||||||||
200,000 | EUR | LEG Immobilien, SEµ 0.875%, 09/01/25 | 195,048 | ||||||||
314,000 | Morgan Stanley Finance, LLC 1.000%, 11/23/27 | 318,333 | |||||||||
200,000 | EUR | Oliver Capital Sarl 0.000%, 12/29/23 | 209,997 | ||||||||
6,305,188 | |||||||||||
Health Care (2.1%) | |||||||||||
164,000 | Alnylam Pharmaceuticals, Inc.µ 1.000%, 09/15/27 | 142,329 | |||||||||
1,768,000 | BioMarin Pharmaceutical, Inc.µ 0.599%, 08/01/24 | 1,704,900 | |||||||||
135,000 | Coherus Biosciences, Inc. 1.500%, 04/15/26 | 75,406 | |||||||||
172,000 | CONMED Corp.µ 2.250%, 06/15/27 | 161,018 | |||||||||
2,220,000 | Dexcom, Inc.µ 0.250%, 11/15/25 | 2,107,380 | |||||||||
156,000 | 0.375%, 05/15/28* | 137,601 | |||||||||
161,000 | Envista Holdings Corp.*µ 1.750%, 08/15/28 | 139,304 | |||||||||
100,000 | EUR | GN Store Nord ASµ 0.000%, 05/21/24 | 102,443 | ||||||||
CALAMOS CLOSED-END FAMILY OF FUNDS ANNUAL REPORT
180
Global Dynamic Income Fund Schedule of Investments October 31, 2023
| PRINCIPAL AMOUNT | VALUE | ||||||||||
205,000 | Haemonetics Corp.µ 0.000%, 03/01/26 | $ | 176,027 | ||||||||
206,000 | Halozyme Therapeutics, Inc.µ 0.250%, 03/01/27 | 168,504 | |||||||||
170,000 | 1.000%, 08/15/28 | 149,571 | |||||||||
73,000 | Innoviva, Inc.µ 2.500%, 08/15/25 | 71,382 | |||||||||
158,000 | Insmed, Inc. 0.750%, 06/01/28 | 153,573 | |||||||||
162,000 | Integer Holdings Corp.* 2.125%, 02/15/28 | 178,326 | |||||||||
167,000 | Integra LifeSciences Holdings Corp.µ 0.500%, 08/15/25 | 150,652 | |||||||||
163,000 | Ionis Pharmaceuticals, Inc. 0.000%, 04/01/26 | 157,857 | |||||||||
156,000 | Jazz Investments I, Ltd. 2.000%, 06/15/26 | 158,376 | |||||||||
101,000 | Lantheus Holdings, Inc.*µ 2.625%, 12/15/27 | 112,062 | |||||||||
30,000,000 | JPY | Menicon Company, Ltd.µ 0.000%, 01/29/25 | 197,061 | ||||||||
181,000 | NeoGenomics, Inc.µ 0.250%, 01/15/28 | 130,803 | |||||||||
165,000 | NuVasive, Inc.µ 0.375%, 03/15/25 | 151,747 | |||||||||
145,000 | Omnicell, Inc.µ 0.250%, 09/15/25 | 128,901 | |||||||||
135,000 | Pacira BioSciences, Inc.µ 0.750%, 08/01/25 | 121,446 | |||||||||
163,000 | Sarepta Therapeutics, Inc.µ 1.250%, 09/15/27 | 138,803 | |||||||||
1,010,000 | Shockwave Medical, Inc.*µ 1.000%, 08/15/28 | 979,306 | |||||||||
155,000 | Tandem Diabetes Care, Inc.*µ 1.500%, 05/01/25 | 146,340 | |||||||||
156,000 | TransMedics Group, Inc.*^ 1.500%, 06/01/28 | 120,744 | |||||||||
8,161,862 | |||||||||||
Industrials (3.0%) | |||||||||||
1,744,000 | Axon Enterprise, Inc.* 0.500%, 12/15/27 | 1,881,445 | |||||||||
40,000,000 | JPY | Daifuku Co., Ltd. 0.000%, 09/13/30 | 273,779 | ||||||||
100,000 | EUR | Duerr, AG 0.750%, 01/15/26 | 93,976 | ||||||||
196,000 | John Bean Technologies Corp.µ 0.250%, 05/15/26 | 176,382 | |||||||||
200,000 | L&F Company Ltd. 2.500%, 04/26/30 | 132,898 | |||||||||
161,000 | Middleby Corp. 1.000%, 09/01/25 | 167,232 | |||||||||
2,700,000 | EUR | Prysmian S.p.A 0.000%, 02/02/26 | 2,935,721 | ||||||||
| PRINCIPAL AMOUNT | VALUE | ||||||||||
2,200,000 | EUR | Rheinmetall AG 1.875%, 02/07/28 | $ | 2,479,897 | |||||||
100,000 | EUR | Rheinmetall, AG 2.250%, 02/07/30 | 114,030 | ||||||||
159,600 | EUR | Schneider Electric, SE 0.000%, 06/15/26 | 302,176 | ||||||||
176,000 | Southwest Airlines Company~ 1.250%, 05/01/25 | 167,728 | |||||||||
1,400,000 | EUR | SPIE, SA 2.000%, 01/17/28 | 1,431,982 | ||||||||
393,000 | Sunrun, Inc. 0.000%, 02/01/26 | 270,192 | |||||||||
1,232,000 | Tetra Tech, Inc.* 2.250%, 08/15/28 | 1,193,426 | |||||||||
11,620,864 | |||||||||||
Information Technology (8.4%) | |||||||||||
223,000 | Affirm Holdings, Inc.µ 0.000%, 11/15/26 | 160,734 | |||||||||
2,990,000 | Akamai Technologies, Inc. 1.125%, 02/15/29* | 2,943,685 | |||||||||
190,000 | 0.125%, 05/01/25 | 219,929 | |||||||||
1,100,000 | EUR | Amadeus IT Group, SA 1.500%, 04/09/25 | 1,282,443 | ||||||||
208,000 | BILL Holdings, Inc.µ 0.000%, 04/01/27 | 165,075 | |||||||||
94,000 | 0.000%, 12/01/25 | 89,343 | |||||||||
3,175,000 | Block, Inc.µ 0.125%, 03/01/25 | 2,930,334 | |||||||||
210,000 | Cloudflare, Inc.µ 0.000%, 08/15/26 | 176,488 | |||||||||
213,000 | Confluent, Inc.µ 0.000%, 01/15/27 | 171,917 | |||||||||
2,251,000 | CyberArk Software, Ltd. 0.000%, 11/15/24 | 2,576,945 | |||||||||
3,467,000 | Datadog, Inc. 0.125%, 06/15/25 | 3,817,999 | |||||||||
447,000 | DigitalOcean Holdings, Inc.µ 0.000%, 12/01/26 | 336,350 | |||||||||
207,000 | Dropbox, Inc. 0.000%, 03/01/28 | 192,017 | |||||||||
381,000 | CAD | Dye & Durham, Ltd.*µ 3.750%, 03/01/26 | 204,684 | ||||||||
411,000 | Fastly, Inc.µ 0.000%, 03/15/26 | 345,873 | |||||||||
357,000 | Five9, Inc.µ 0.500%, 06/01/25 | 326,694 | |||||||||
17,000,000 | HKD | Kingsoft Corp, Ltd. 0.625%, 04/29/25 | 2,248,469 | ||||||||
175,000 | LivePerson, Inc. 0.000%, 12/15/26 | 114,095 | |||||||||
451,000 | Microchip Technology, Inc. 0.125%, 11/15/24 | 454,162 | |||||||||
www.calamos.com
181
Global Dynamic Income Fund Schedule of Investments October 31, 2023
| PRINCIPAL AMOUNT | VALUE | ||||||||||
418,000 | MicroStrategy, Inc.µ 0.000%, 02/15/27 | $ | 303,129 | ||||||||
447,000 | NCL Corp., Ltd.µ 1.125%, 02/15/27 | 346,666 | |||||||||
200,000 | EUR | Nexi S.p.Aµ 1.750%, 04/24/27 | 187,423 | ||||||||
162,000 | Nice, Ltd. 0.000%, 09/15/25 | 144,483 | |||||||||
413,000 | Okta, Inc.µ 0.125%, 09/01/25 | 369,767 | |||||||||
319,000 | ON Semiconductor Corp. 0.500%, 03/01/29*µ | 280,446 | |||||||||
202,000 | 0.000%, 05/01/27 | 264,452 | |||||||||
148,000 | Palo Alto Networks, Inc. 0.375%, 06/01/25 | 361,419 | |||||||||
173,000 | Pegasystems, Inc.µ 0.750%, 03/01/25 | 159,094 | |||||||||
446,000 | Rapid7, Inc.*µ 1.250%, 03/15/29 | 431,469 | |||||||||
296,000 | Repay Holdings Corp.*µ 0.000%, 02/01/26 | 236,904 | |||||||||
320,000 | RingCentral, Inc.µ 0.000%, 03/15/26 | 266,598 | |||||||||
360,000,000 | JPY | Rohm Company, Ltd. 0.000%, 12/05/24 | 2,394,181 | ||||||||
40,000,000 | JPY | SCREEN Holdings Company, Ltd. 0.000%, 06/11/25 | 321,417 | ||||||||
320,000 | Seagate HDD Cayman* 3.500%, 06/01/28 | 331,949 | |||||||||
139,000 | Shift4 Payments, Inc.µ 0.000%, 12/15/25 | 126,587 | |||||||||
3,200,000 | SK Hynix, Inc. 1.750%, 04/11/30 | 3,871,872 | |||||||||
148,300 | EUR | SOITEC 0.000%, 10/01/25 | 278,095 | ||||||||
200,000 | Tyler Technologies, Inc. 0.250%, 03/15/26 | 190,180 | |||||||||
223,000 | Unity Software, Inc.µ 0.000%, 11/15/26 | 174,761 | |||||||||
200,000 | Win Semiconductors Corp. 0.000%, 01/14/26 | 166,256 | |||||||||
318,000 | Wix.com, Ltd. 0.000%, 08/15/25 | 281,990 | |||||||||
1,490,000 | Workiva, Inc. 1.250%, 08/15/28*µ | 1,353,397 | |||||||||
34,000 | 1.125%, 08/15/26 | 42,008 | |||||||||
265,000 | Xero Investments, Ltd. 0.000%, 12/02/25 | 231,231 | |||||||||
145,000 | Zscaler, Inc. 0.125%, 07/01/25 | 177,036 | |||||||||
32,050,046 | |||||||||||
| PRINCIPAL AMOUNT | VALUE | ||||||||||
Materials (2.2%) | |||||||||||
214,000 | Amyris, Inc.@ 1.500%, 11/15/26 | $ | 22,904 | ||||||||
3,600,000 | Glencore Funding, LLC 0.000%, 03/27/25 | 3,776,076 | |||||||||
2,700,000 | LG Chem, Ltd. 1.250%, 07/18/28 | 2,537,757 | |||||||||
2,154,000 | Lithium Americas Corp. 1.750%, 01/15/27 | 1,454,165 | |||||||||
20,000,000 | JPY | Nippon Steel Corp. 0.000%, 10/05/26 | 176,172 | ||||||||
400,000 | EUR | POSCO Holdings, Inc. 0.000%, 09/01/26 | 457,959 | ||||||||
8,425,033 | |||||||||||
Other (0.6%) | |||||||||||
3,440,000 | EUR | Edenred 0.000%, 09/06/24 | 2,186,576 | ||||||||
110,000 | Multiplan Corp.* 6.000%, 10/15/27 | 73,152 | |||||||||
2,259,728 | |||||||||||
Real Estate (1.0%) | |||||||||||
2,900,000 | EUR | ANLLIAN Capital, Ltd. 0.000%, 02/05/25 | 3,288,133 | ||||||||
330,000 | Redfin Corp.µ 0.000%, 10/15/25 | 266,779 | |||||||||
200,000 | Vingroup, JSC 3.000%, 04/20/26 | 185,186 | |||||||||
3,740,098 | |||||||||||
Utilities (0.6%) | |||||||||||
318,000 | American Water Capital Corp.*µ 3.625%, 06/15/26 | 306,161 | |||||||||
1,466,000 | CMS Energy Corp.* 3.375%, 05/01/28 | 1,388,067 | |||||||||
320,000 | PPL Capital Funding, Inc.* 2.875%, 03/15/28 | 293,466 | |||||||||
160,000 | Southern Company* 3.875%, 12/15/25 | 157,197 | |||||||||
2,144,891 | |||||||||||
TOTAL CONVERTIBLE BONDS (Cost $151,497,120) | 130,004,931 | ||||||||||
BANK LOANS (15.1%)¡ | |||||||||||
Airlines (0.1%) | |||||||||||
171,000 | American Airlines, Inc.‡ 10.427%, 04/20/28 3 mo. SOFR + 4.75% | 173,672 | |||||||||
165,000 | Mileage Plus Holdings, LLC‡ 10.798%, 06/21/27 3 mo. SOFR + 5.25% | 170,315 | |||||||||
343,987 | |||||||||||
CALAMOS CLOSED-END FAMILY OF FUNDS ANNUAL REPORT
182
Global Dynamic Income Fund Schedule of Investments October 31, 2023
| PRINCIPAL AMOUNT | VALUE | ||||||||||
Communication Services (2.2%) | |||||||||||
1,250,000 | APi Group DE, Inc.! 0.000%, 01/03/29 | $ | 1,253,437 | ||||||||
1,830,442 | Charter Communications Operating, LLC‡ 7.133%, 02/01/27 3 mo. SOFR + 1.75% | 1,828,044 | |||||||||
4,779 | Charter Communications Operating, LLC‡ 7.074%, 02/01/27 1 mo. SOFR + 1.75% | 4,773 | |||||||||
34,111 | Clear Channel Outdoor Holdings, Inc.‡ 9.145%, 08/21/26 3 mo. SOFR + 3.50% | 32,846 | |||||||||
67,107 | DIRECTV Financing, LLC‡ 10.325%, 08/02/27 1 mo. SOFR + 5.00% | 65,418 | |||||||||
320,000 | Entercom Media Corp.‡ 8.145%, 11/18/24 3 mo SOFR + 2.50% | 140,750 | |||||||||
1,246,875 | Go Daddy Operating Company, LLC‡ 7.824%, 11/09/29 1 mo. SOFR + 2.50% | 1,249,425 | |||||||||
1,250,000 | Match Group, Inc.‡ 7.298%, 02/13/27 3 mo. SOFR + 1.75% | 1,246,350 | |||||||||
1,250,000 | Nexstar Broadcasting, Inc.‡ 7.939%, 09/18/26 1 mo. SOFR + 2.50% | 1,251,125 | |||||||||
110,000 | Telesat Canada‡ 8.434%, 12/07/26 3 mo. SOFR + 2.75% | 75,818 | |||||||||
1,250,000 | Virgin Media Bristol, LLC‡ 7.949%, 01/31/28 1 mo. SOFR + 2.50% | 1,216,412 | |||||||||
8,364,398 | |||||||||||
Consumer Discretionary (2.8%) | |||||||||||
1,250,000 | Adient US LLC‡ 8.689%, 04/10/28 1 mo. SOFR + 3.25% | 1,251,169 | |||||||||
94,578 | American Axle and Manufacturing, Inc.‡ 9.007%, 12/13/29 3 mo. SOFR + 3.50% | 94,381 | |||||||||
63,022 | American Axle and Manufacturing, Inc.‡ 8.941%, 12/13/29 1 mo. SOFR + 3.50% | 62,891 | |||||||||
1,246,875 | Aramark Services, Inc.‡ 7.939%, 06/22/30 1 mo. SOFR + 2.50% | 1,246,875 | |||||||||
208,950 | Caesars Entertainment, Inc.‡ 8.674%, 02/06/30 1 mo. SOFR + 3.25% | 208,457 | |||||||||
1,461,338 | Carnival Corp.‡ 8.336%, 08/08/27 1 mo. SOFR + 3.00% | 1,437,591 | |||||||||
| PRINCIPAL AMOUNT | VALUE | ||||||||||
208,950 | Hanesbrands, Inc.‡ 9.074%, 03/08/30 1 mo. SOFR + 3.75% | $ | 206,599 | ||||||||
1,496,164 | KFC Holding Company‡ 7.199%, 03/15/28 1 mo. SOFR + 1.75% | 1,496,942 | |||||||||
122,430 | Life Time Fitness, Inc.‡ 10.130%, 01/15/26 3 mo. SOFR + 4.75% | 122,690 | |||||||||
1,246,803 | Murphy USA, Inc.‡ 7.179%, 01/31/28 1 mo. SOFR + 1.75% | 1,251,871 | |||||||||
1,246,843 | PENN Entertainment, Inc.‡ 8.174%, 05/03/29 1 mo. SOFR + 2.75% | 1,246,675 | |||||||||
265,661 | Petco Health and Wellness Company, Inc.‡ 8.902%, 03/03/28 3 mo. SOFR + 3.25% | 260,200 | |||||||||
381,090 | PetSmart, Inc.‡ 9.174%, 02/11/28 1 mo. SOFR + 3.75% | 377,081 | |||||||||
1,246,731 | Station Casinos, LLC‡! 0.000%, 02/08/27 | 1,240,217 | |||||||||
139,274 | TKC Holdings, Inc.‡ 10.939%, 05/15/28 1 mo. LIBOR + 5.50% | 133,703 | |||||||||
55,000 | Windsor Holdings III, LLC‡ 9.815%, 08/01/30 1 mo. SOFR + 4.50% | 54,907 | |||||||||
10,692,249 | |||||||||||
Consumer Staples (0.1%) | |||||||||||
215,000 | Star Parent, Inc.‡ 9.386%, 09/27/30 3 mo. LIBOR + 4.00% | 205,541 | |||||||||
110,000 | United Natural Foods, Inc.‡ 8.689%, 10/22/25 1 mo. SOFR + 3.25% | 109,847 | |||||||||
315,388 | |||||||||||
Energy (0.1%) | |||||||||||
100,000 | New Fortress Energy, Inc.‡ 0.000%, 10/23/30 | 92,500 | |||||||||
258,975 | Par Petroleum, LLC‡ 9.773%, 02/28/30 3 mo. SOFR + 4.25% | 258,651 | |||||||||
351,151 | |||||||||||
Financials (1.5%) | |||||||||||
208,947 | Alliant Holdings Intermediate, LLC‡ 8.835%, 11/05/27 1 mo. SOFR + 3.50% | 208,480 | |||||||||
119,711 | Amynta Agency Borrower, Inc.‡ 10.325%, 02/28/28 1 mo. SOFR + 5.00% | 119,795 | |||||||||
www.calamos.com
183
Global Dynamic Income Fund Schedule of Investments October 31, 2023
| PRINCIPAL AMOUNT | VALUE | ||||||||||
43,758 | Amynta Agency Borrower, Inc.‡ 10.424%, 02/28/28 1 mo. SOFR + 5.00% | $ | 43,789 | ||||||||
212,839 | AssuredPartners, Inc.‡ 8.824%, 02/12/27 1 mo. SOFR + 3.50% | 211,243 | |||||||||
1,660,838 | Avolon TLB Borrower 1 LLC‡ 7.839%, 06/22/28 1 mo. SOFR + 2.50% | 1,663,154 | |||||||||
1,246,819 | Castlelake Aviation, Ltd. 8.421%, 10/22/26 3 mo. SOFR + 2.75% | 1,246,040 | |||||||||
189,720 | Castlelake Aviation, Ltd.! 0.000%, 10/22/26 | 189,602 | |||||||||
109,175 | Castlelake Aviation, Ltd.‡ 8.421%, 10/22/27 3 mo. SOFR + 2.75% | 109,048 | |||||||||
208,425 | Hub International, Ltd.‡ 9.365%, 11/10/29 3 mo. SOFR + 4.00% | 208,395 | |||||||||
1,510,680 | Jazz Financing Lux Sarl‡ 8.939%, 05/05/28 1 mo. SOFR + 3.50% | 1,511,933 | |||||||||
55,000 | Osaic Holdings, Inc.‡ 9.824%, 08/17/28 1 mo. SOFR + 4.50% | 54,818 | |||||||||
292,050 | VFH Parent, LLC‡ 8.427%, 01/13/29 1 mo. SOFR + 3.00% | 290,620 | |||||||||
5,856,917 | |||||||||||
Health Care (2.6%) | |||||||||||
373,755 | Amneal Pharmaceuticals, LLC‡ 8.939%, 05/04/25 1 mo. SOFR + 3.50% | 367,013 | |||||||||
910,850 | Avantor Funding, Inc.‡ 7.674%, 11/08/27 1 mo. SOFR + 2.25% | 911,611 | |||||||||
1,496,070 | DaVita, Inc.‡ 7.189%, 08/12/26 1 mo. SOFR + 1.75% | 1,480,743 | |||||||||
1,246,538 | Elanco Animal Health, Inc.‡ 7.165%, 08/01/27 1 mo. SOFR + 1.75% | 1,219,663 | |||||||||
116,892 | Icon Luxembourg Sarl‡ 7.902%, 07/03/28 3 mo. SOFR + 2.25% | 117,095 | |||||||||
1,000,680 | Icon Luxembourg Sarl! 0.000%, 07/03/28 | 1,002,416 | |||||||||
1,250,000 | IQVIA, Inc.‡ 7.402%, 06/11/25 3 mo. SOFR + 1.75% | 1,254,300 | |||||||||
292,031 | Mallinckrodt International Finance, SA‡ 12.703%, 09/30/27 1 mo. SOFR + 7.25% | 222,511 | |||||||||
| PRINCIPAL AMOUNT | VALUE | ||||||||||
1,250,000 | Organon & Company‡ 8.451%, 06/02/28 1 mo. SOFR + 3.00% | $ | 1,249,063 | ||||||||
235,294 | Padagis, LLC‡ 10.434%, 07/06/28 3 mo. SOFR + 4.75% | 209,608 | |||||||||
1,246,843 | Perrigo Investments, LLC‡ 7.674%, 04/20/29 1 mo. SOFR + 2.25% | 1,243,103 | |||||||||
249,320 | PRA Health Sciences, Inc.! 0.000%, 07/03/28 | 249,753 | |||||||||
29,124 | PRA Health Sciences, Inc. 7.902%, 07/03/28 3 mo. SOFR + 2.25% | 29,174 | |||||||||
632,408 | Team Health Holdings, Inc.‡ 10.633%, 03/02/27 3 mo. SOFR + 5.25% | 457,089 | |||||||||
1,803 | Team Health Holdings, Inc.‡ 10.574%, 03/02/27 1 mo. SOFR + 5.25% | 1,303 | |||||||||
10,014,445 | |||||||||||
Industrials (3.2%) | |||||||||||
107,525 | ACProducts, Inc.‡ 9.902%, 05/17/28 3 mo. SOFR + 4.25% | 85,811 | |||||||||
138,250 | Air Canada‡ 9.128%, 08/11/28 3 mo. SOFR + 3.50% | 138,285 | |||||||||
1,246,811 | Beacon Roofing Supply, Inc.‡ 7.689%, 05/19/28 1 mo. SOFR + 2.25% | 1,246,749 | |||||||||
1,452,984 | Berry Global, Inc.‡ 7.201%, 07/01/29 1 mo. SOFR + 1.75% | 1,442,275 | |||||||||
1,522,938 | ChampionX Corp.‡ 8.177%, 06/07/29 1 mo. SOFR + 2.75% | 1,529,836 | |||||||||
1,384,297 | Emrld Borrower, LP‡ 8.380%, 05/31/30 3 mo. SOFR + 3.00% | 1,382,996 | |||||||||
1,246,867 | H.B. Fuller Company‡ 7.574%, 02/15/30 1 mo. SOFR + 2.25% | 1,251,674 | |||||||||
1,246,811 | Jeld-Wen, Inc.‡ 7.689%, 07/28/28 1 mo. SOFR + 2.25% | 1,247,590 | |||||||||
1,444,343 | Scientific Games International, Inc.‡ 8.435%, 04/14/29 1 mo. SOFR + 3.00% | 1,444,798 | |||||||||
124,063 | Summit Materials, LLC‡ 8.571%, 12/14/27 3 mo. SOFR + 3.00% | 124,741 | |||||||||
1,246,867 | TransDigm, Inc.‡ 8.640%, 08/24/28 3 mo. SOFR + 3.25% | 1,246,867 | |||||||||
CALAMOS CLOSED-END FAMILY OF FUNDS ANNUAL REPORT
184
Global Dynamic Income Fund Schedule of Investments October 31, 2023
| PRINCIPAL AMOUNT | VALUE | ||||||||||
1,218,608 | United Airlines, Inc.‡ 9.189%, 04/21/28 1 mo. SOFR + 3.75% | $ | 1,217,847 | ||||||||
12,359,469 | |||||||||||
Information Technology (1.0%) | |||||||||||
207,305 | Banff Merger Sub, Inc.‡ 9.189%, 10/02/25 1 mo. SOFR + 3.75% | 207,348 | |||||||||
155,000 | Central Parent, Inc.! 0.000%, 07/06/29 | 154,322 | |||||||||
49,625 | Central Parent, Inc.‡ 9.406%, 07/06/29 3 mo. SOFR + 4.00% | 49,408 | |||||||||
202,879 | Dun & Bradstreet Corp.‡ 8.176%, 02/06/26 1 mo. SOFR + 2.75% | 202,879 | |||||||||
1,220,577 | Open Text Corp.‡ 8.174%, 01/31/30 1 mo. SOFR + 2.75% | 1,221,004 | |||||||||
749,475 | SS&C Technologies, Inc.‡ 7.674%, 03/22/29 1 mo. SOFR + 2.25% | 749,475 | |||||||||
473,181 | SS&C Technologies, Inc.‡ 7.674%, 03/22/29 1 mo. SOFR + 2.25% | 473,181 | |||||||||
798,000 | TTM Technologies, Inc.‡ 8.065%, 05/30/30 1 mo. SOFR + 2.75% | 798,499 | |||||||||
3,856,116 | |||||||||||
Information Technology (0.4%) | |||||||||||
172,944 | Camelot Finance SA‡ 8.439%, 10/30/26 1 mo. SOFR + 3.00% | 172,927 | |||||||||
1,443,133 | II-VI, Inc.‡ 8.189%, 07/02/29 1 mo. SOFR + 2.75% | 1,442,455 | |||||||||
1,615,382 | |||||||||||
Materials (1.0%) | |||||||||||
1,413,510 | Axalta Coating Systems U.S. Holdings, Inc.‡ 7.890%, 12/20/29 3 mo SOFR + 2.50% | 1,417,136 | |||||||||
1,230,000 | Chemours Company‡ 8.824%, 08/18/28 1 mo. SOFR + 2.50% | 1,199,250 | |||||||||
214,463 | Ineos US Finance, LLC‡ 8.825%, 02/18/30 1 mo. SOFR + 3.50% | 210,274 | |||||||||
262,460 | Innophos, Inc.‡ 8.689%, 02/05/27 1 mo. SOFR + 3.25% | 260,164 | |||||||||
264,338 | LSF11 A5 Holdco, LLC‡ 9.674%, 10/15/28 1 mo. SOFR + 4.25% | 259,795 | |||||||||
| PRINCIPAL AMOUNT | VALUE | ||||||||||
114,415 | Trinseo Materials Operating SCA‡ 7.939%, 05/03/28 1 mo. SOFR + 2.50% | $ | 91,382 | ||||||||
203,711 | W.R. Grace & Co.-Conn.‡ 9.402%, 09/22/28 3 mo. SOFR + 3.75% | 200,400 | |||||||||
3,638,401 | |||||||||||
Special Purpose Acquisition Companies (0.1%) | |||||||||||
108,625 | Clydesdale Acquisition Holdings, Inc.‡ 9.599%, 04/13/29 1 mo. SOFR + 4.18% | 105,344 | |||||||||
54,175 | Fertitta Entertainment, LLC‡ 9.324%, 01/27/29 1 mo. SOFR + 4.00% | 53,063 | |||||||||
227,700 | Oscar AcquisitionCo, LLC‡ 9.990%, 04/29/29 3 mo. SOFR + 4.50% | 222,174 | |||||||||
198,000 | Patagonia Holdco, LLC‡ 11.117%, 08/01/29 3 mo. SOFR + 5.75% | 171,765 | |||||||||
552,346 | |||||||||||
TOTAL BANK LOANS (Cost $58,611,399) | 57,960,249 | ||||||||||
U.S. GOVERNMENT AND AGENCY SECURITY (0.1%) | |||||||||||
Other (0.1%) | |||||||||||
310,000 | United States Treasury Note^ 2.250%, 03/31/24 (Cost $309,682) | 305,968 | |||||||||
| NUMBER OF SHARES | VALUE | ||||||||||
CONVERTIBLE PREFERRED STOCKS (1.7%) | |||||||||||
Energy (0.0%) | |||||||||||
5 | Gulfport Energy Corp.# 10.000%, 12/01/23 15.000% PIK rate | 44,375 | |||||||||
Financials (1.3%) | |||||||||||
88,340 | Apollo Global Management, Inc. 6.750%, 07/31/26 | 4,250,038 | |||||||||
417 | Bank of America Corp.~‡‡ 7.250% | 439,184 | |||||||||
413 | Wells Fargo & Company - Class A~‡‡ 7.500% | 436,252 | |||||||||
5,125,474 | |||||||||||
Utilities (0.4%) | |||||||||||
35,211 | NextEra Energy, Inc.~ 6.926%, 09/01/25 | 1,321,821 | |||||||||
TOTAL CONVERTIBLE PREFERRED (Cost $7,738,450) | 6,491,670 | ||||||||||
www.calamos.com
185
Global Dynamic Income Fund Schedule of Investments October 31, 2023
| NUMBER OF SHARES | VALUE | ||||||||||
COMMON STOCKS (82.2%) | |||||||||||
Communication Services (4.9%) | |||||||||||
50,500 | Alphabet, Inc. - Class A~µ# | $ | 6,266,040 | ||||||||
4,575 | Altice USA, Inc. - Class A# | 13,222 | |||||||||
4,050 | Baidu, Inc. (ADR)µ# | 425,250 | |||||||||
1,735 | Cumulus Media, Inc. - Class Aµ | 7,825 | |||||||||
1 | Frontier Communications Parent, Inc.^# | 18 | |||||||||
4,600 | Meta Platforms, Inc. - Class Aµ# | 1,385,842 | |||||||||
19,000 | HKD | NetEase, Inc.µ | 406,629 | ||||||||
96,000 | EUR | Orange, SAµ | 1,129,156 | ||||||||
305 | EUR | Scout24, SE*µ | 18,763 | ||||||||
66,700 | HKD | Tencent Holdings, Ltd.µ | 2,468,482 | ||||||||
89,070 | Tencent Holdings, Ltd. (ADR)~^ | 3,296,481 | |||||||||
1,176,545 | GBP | Vodafone Group, PLCµ | 1,083,054 | ||||||||
26,395 | Walt Disney Company~# | 2,153,568 | |||||||||
18,654,330 | |||||||||||
Consumer Discretionary (9.6%) | |||||||||||
124,700 | HKD | Alibaba Group Holding, Ltd.µ# | 1,283,796 | ||||||||
8,175 | Alibaba Group Holding, Ltd. (ADR)~# | 674,765 | |||||||||
20,840 | PLN | Allegro.eu, SA*# | 149,491 | ||||||||
165,500 | MXN | Alsea, SAB de CV# | 549,311 | ||||||||
89,300 | Amazon.com, Inc.µ^# | 11,884,937 | |||||||||
980 | INR | Amber Enterprises India, Ltd.# | 34,479 | ||||||||
315,000 | SAR | Americana Restaurants International, PLC | 318,259 | ||||||||
51,097 | Aptiv, PLCµ# | 4,455,658 | |||||||||
3,900 | BRL | Arezzo Industria e Comercio, SA | 45,167 | ||||||||
252,400 | PHP | Bloomberry Resorts Corp.# | 40,525 | ||||||||
12,500 | CNY | BYD Company, Ltd. - Class A | 407,868 | ||||||||
20,700 | CNY | China Tourism Group Duty Free Corp., Ltd. - Class A | 267,727 | ||||||||
650 | Chipotle Mexican Grill, Inc.µ# | 1,262,430 | |||||||||
104,928 | BRL | Cyrela Brazil Realty, SA Empreendimentos e Participacoes | 374,405 | ||||||||
13,055 | INR | Dixon Technologies India, Ltd. | 801,286 | ||||||||
3,050 | KRW | Hotel Shilla Company, Ltd. | 141,126 | ||||||||
99,332 | INR | Indian Hotels Company, Ltd. | 458,096 | ||||||||
161,219 | HKD | JD.com, Inc. - Class Aµ | 2,049,603 | ||||||||
173,000 | HKD | Jiumaojiu International Holdings, Ltd.*µ | 188,244 | ||||||||
258,900 | INR | Kalyan Jewellers India, Ltd. | 899,649 | ||||||||
8,700 | KRW | Kia Corp. | 497,043 | ||||||||
123,000 | HKD | Li Ning Company, Ltd.~ | 376,922 | ||||||||
4,145 | EUR | LVMH Moet Hennessy Louis Vuitton, SEµ | 2,967,531 | ||||||||
32,200 | INR | Mahindra & Mahindra, Ltd. | 566,403 | ||||||||
1,385 | MakeMyTrip, Ltd.µ# | 53,641 | |||||||||
4,315,300 | IDR | Map Aktif Adiperkasa PT | 202,386 | ||||||||
11,470 | HKD | Meituan - Class B*µ# | 162,587 | ||||||||
1,295 | MercadoLibre, Inc.µ# | 1,606,758 | |||||||||
| NUMBER OF SHARES | VALUE | ||||||||||
2,733,200 | IDR | Mitra Adiperkasa Tbk PT | $ | 298,615 | |||||||
44,620 | NIO, Inc. (ADR)# | 325,726 | |||||||||
43,600 | HKD | Prada S.p.A.~ | 262,649 | ||||||||
17,872 | EUR | Prosus, NV~# | 499,801 | ||||||||
12,900 | HKD | Samsonite International, SA*~# | 39,953 | ||||||||
236,800 | HKD | Sands China, Ltd.~# | 637,477 | ||||||||
90,650 | INR | Tata Motors, Ltd. | 685,606 | ||||||||
2,100 | Tesla, Inc.µ# | 421,764 | |||||||||
1,600 | JPY | Toyota Boshoku Corp.~ | 27,825 | ||||||||
2,580 | INR | TVS Motor Company, Ltd. | 49,339 | ||||||||
25,200 | HKD | Wynn Macau, Ltd.~# | 22,317 | ||||||||
10,100 | HKD | Yum China Holdings, Inc.~ | 529,261 | ||||||||
284,600 | INR | Zomato, Ltd.# | 358,770 | ||||||||
36,879,196 | |||||||||||
Consumer Staples (4.2%) | |||||||||||
18,800 | CHF | Aryzta, AG# | 34,457 | ||||||||
77,500 | GBP | British American Tobacco, PLCµ | 2,315,111 | ||||||||
35,550 | Coca-Cola Companyµ^ | 2,008,219 | |||||||||
5,600 | Constellation Brands, Inc. - Class Aµ | 1,311,240 | |||||||||
5,100 | Costco Wholesale Corp.µ | 2,817,444 | |||||||||
4,480 | PLN | Dino Polska, SA*# | 424,504 | ||||||||
63,550 | MXN | Fomento Economico Mexicano, SAB de CV | 718,511 | ||||||||
110,000 | INR | ITC, Ltd. | 566,296 | ||||||||
1,500 | JPY | Kobe Bussan Company, Ltd.^ | 37,122 | ||||||||
2,600 | CNY | Kweichow Moutai Company, Ltd. - Class A | 598,789 | ||||||||
20,500 | CHF | Nestle, SAµ | 2,210,694 | ||||||||
95,528 | BRL | Raia Drogasil, SA | 488,843 | ||||||||
1,700 | JPY | Rohto Pharmaceutical Company, Ltd.~ | 39,663 | ||||||||
67,100 | JPY | Seven & i Holdings Company, Ltd.~ | 2,458,457 | ||||||||
106,000 | HKD | Smoore International Holdings, Ltd.* | 81,690 | ||||||||
1,300 | JPY | Yamazaki Baking Company, Ltd. | 27,488 | ||||||||
16,138,528 | |||||||||||
Energy (6.0%) | |||||||||||
4,835 | CAD | ARC Resources, Ltd.µ | 77,785 | ||||||||
100,600 | CAD | Canadian Natural Resources, Ltd.µ | 6,388,200 | ||||||||
2,577 | Chaparral Energy, Inc. - Class A&# | 114,676 | |||||||||
650 | Chesapeake Energy Corp.µ | 55,952 | |||||||||
17,600 | Chevron Corp.~µ | 2,564,848 | |||||||||
14,985 | Energy Transfer, LP | 197,053 | |||||||||
9,035 | Enterprise Products Partners, LP | 235,271 | |||||||||
1,826 | EP Energy Corp.&# | 4,793 | |||||||||
42,400 | Helmerich & Payne, Inc.~µ | 1,677,768 | |||||||||
1,954 | ONEOK, Inc.µ | 127,401 | |||||||||
136,900 | THB | PTT Exploration & Production, PCL | 625,242 | ||||||||
36,300 | INR | Reliance Industries, Ltd. | 998,649 | ||||||||
28,320 | EUR | Saipem S.p.A# | 43,155 | ||||||||
CALAMOS CLOSED-END FAMILY OF FUNDS ANNUAL REPORT
186
Global Dynamic Income Fund Schedule of Investments October 31, 2023
| NUMBER OF SHARES | VALUE | ||||||||||
98,974 | Schlumberger, NVµ | $ | 5,508,893 | ||||||||
82,300 | GBP | Shell, PLC | 2,652,268 | ||||||||
36,000 | EUR | Shell, PLC | 1,176,035 | ||||||||
21,730 | TechnipFMC, PLCµ | 467,630 | |||||||||
22,915,619 | |||||||||||
Financials (11.1%) | |||||||||||
373,000 | HKD | AIA Group, Ltd.~ | 3,239,058 | ||||||||
10,000 | Aon, PLC - Class Aµ | 3,094,000 | |||||||||
188,400 | BRL | B3, SA - Brasil Bolsa Balcao | 414,785 | ||||||||
73,150 | BRL | Banco BTG Pactual, SA | 429,462 | ||||||||
1,593,079 | IDR | Bank Central Asia, Tbk PT | 877,660 | ||||||||
7,703,700 | IDR | Bank Mandiri Persero, Tbk PT | 2,752,163 | ||||||||
189,000 | Bank of America Corp.~µ | 4,978,260 | |||||||||
3,924 | EUR | Bank of Ireland Group, PLCµ | 35,166 | ||||||||
11,400 | JPY | Concordia Financial Group, Ltd.~ | 52,969 | ||||||||
111,948 | AED | First Abu Dhabi Bank, PJSC | 386,517 | ||||||||
19,025 | KRW | Hana Financial Group, Inc. | 553,185 | ||||||||
316,556 | INR | HDFC Bank, Ltd. | 5,611,431 | ||||||||
51,300 | ICICI Bank, Ltd. (ADR)~ | 1,138,347 | |||||||||
133,716 | Itau Unibanco Holding, SA (ADR)^ | 710,032 | |||||||||
2,100 | JPY | Japan Exchange Group, Inc.~ | 41,527 | ||||||||
12,575 | JPMorgan Chase & Company~µ | 1,748,679 | |||||||||
156,300 | THB | Kasikornbank PCL | 571,788 | ||||||||
4,120,000 | GBP | Lloyds Banking Group, PLCµ | 2,005,199 | ||||||||
44,285 | Morgan Stanleyµ | 3,136,264 | |||||||||
77,000 | EUR | National Bank of Greece, SA# | 441,006 | ||||||||
260,000 | HKD | Ping An Insurance Group Company of China, Ltd. - Class H~ | 1,318,843 | ||||||||
24,653 | SAR | Saudi National Bank | 220,599 | ||||||||
9,445 | AUD | Steadfast Group, Ltd.µ | 32,479 | ||||||||
52,200 | UBS Group, AGµ# | 1,224,612 | |||||||||
13,100 | Visa, Inc. - Class Aµ | 3,079,810 | |||||||||
111,125 | Wells Fargo & Company~µ | 4,419,441 | |||||||||
42,513,282 | |||||||||||
Health Care (9.2%) | |||||||||||
8,400 | INR | Apollo Hospitals Enterprise, Ltd. | 488,616 | ||||||||
23,100 | GBP | AstraZeneca, PLCµ | 2,892,203 | ||||||||
14,977 | Danaher Corp.µ | 2,875,884 | |||||||||
4,738 | KRW | Dentium Company, Ltd. | 384,617 | ||||||||
15,250 | Eli Lilly & Companyµ | 8,447,433 | |||||||||
1,840 | GBP | Ergomed, PLC# | 29,972 | ||||||||
10,104 | GE Healthcare, Inc.~µ | 672,623 | |||||||||
23,815 | EUR | Gerresheimer, AGµ | 2,221,301 | ||||||||
4,860 | Humana, Inc.µ | 2,545,133 | |||||||||
8,520 | BRL | Hypera, SA | 51,187 | ||||||||
42,940 | KRW | Jeisys Medical, Inc. | 335,208 | ||||||||
105,800 | Novo Nordisk, A/S (ADR)~ | 10,217,106 | |||||||||
| NUMBER OF SHARES | VALUE | ||||||||||
5,900 | UnitedHealth Group, Inc.µ | $ | 3,159,804 | ||||||||
113,500 | HKD | Wuxi Biologics Cayman, Inc.*~# | 705,713 | ||||||||
137 | CHF | Ypsomed Holding, AG | 37,757 | ||||||||
35,064,557 | |||||||||||
Industrials (10.9%) | |||||||||||
21,800 | EUR | Airbus, SEµ | 2,922,860 | ||||||||
37,029 | EUR | Alstom, SA | 501,464 | ||||||||
8,420 | GBP | Ashtead Technology Holdings, PLC^ | 49,217 | ||||||||
1,900 | JPY | BayCurrent Consulting, Inc.~ | 47,703 | ||||||||
28,000 | CAD | Canadian Pacific Kansas City, Ltd. | 1,988,015 | ||||||||
12,780 | CNY | Contemporary Amperex Technology Company, Ltd. - Class A | 324,507 | ||||||||
1,115 | EUR | DO & CO, AGµ | 130,248 | ||||||||
850 | JPY | Ebara Corp.~ | 37,641 | ||||||||
30,312 | General Electric Company | 3,292,793 | |||||||||
45,110 | INR | Hindustan Aeronautics, Ltd. | 988,277 | ||||||||
32,400 | JPY | Hitachi, Ltd.~ | 2,053,725 | ||||||||
7,600 | JPY | INFRONEER Holdings, Inc. | 80,171 | ||||||||
64,000 | PHP | International Container Terminal Services, Inc. | 226,754 | ||||||||
900 | JPY | Japan Airport Terminal Company, Ltd.~ | 39,581 | ||||||||
2,400 | JPY | Japan Elevator Service Holdings Company, Ltd.~ | 31,805 | ||||||||
1,400 | JPY | Keisei Electric Railway Company, Ltd.~ | 52,737 | ||||||||
51,500 | JPY | Komatsu, Ltd.~ | 1,183,284 | ||||||||
900 | JPY | Kyudenko Corp.~ | 26,884 | ||||||||
26,412 | INR | Larsen & Toubro, Ltd. | 927,542 | ||||||||
2,900 | EUR | Leonardo S.p.A~ | 43,826 | ||||||||
342,715 | GBP | Melrose Industries, PLC | 1,951,341 | ||||||||
9,140 | SEK | Munters Group, AB* | 111,588 | ||||||||
35,300 | CNY | Ningbo Orient Wires & Cables Company, Ltd. - Class A | 203,239 | ||||||||
35,000 | Quanta Services, Inc.µ | 5,849,200 | |||||||||
1,618,000 | GBP | Rolls-Royce Holdings, PLCµ# | 4,258,937 | ||||||||
173,360 | BRL | Rumo, SA | 767,127 | ||||||||
167,200 | CNY | Sany Heavy Industry Company, Ltd. - Class A | 330,593 | ||||||||
25,600 | EUR | Schneider Electric, SEµ | 3,938,747 | ||||||||
54,502 | CNY | Shanghai International Airport Company, Ltd. - Class A# | 277,258 | ||||||||
17,550 | INR | Siemens, Ltd. | 704,298 | ||||||||
2,885 | JPY | Sojitz Corp.~ | 59,908 | ||||||||
1,464 | CAD | Stantec, Inc.µ | 89,577 | ||||||||
57,980 | INR | Titagarh Rail System, Ltd. | 530,361 | ||||||||
62,000 | Vertiv Holdings Companyµ | 2,434,740 | |||||||||
20,400 | EUR | Vinci, SAµ | 2,255,718 | ||||||||
18,250 | Waste Management, Inc.~µ | 2,999,023 | |||||||||
41,710,689 | |||||||||||
www.calamos.com
187
Global Dynamic Income Fund Schedule of Investments October 31, 2023
| NUMBER OF SHARES | VALUE | ||||||||||
Information Technology (22.3%) | |||||||||||
18,300 | Accenture, PLC - Class Aµ | $ | 5,436,747 | ||||||||
45,140 | TWD | Accton Technology Corp. | 699,411 | ||||||||
13,410 | TWD | Alchip Technologies, Ltd. | 1,099,840 | ||||||||
42,900 | Apple, Inc.~µ | 7,326,033 | |||||||||
13,720 | ASML Holding, NV (ADR)µ | 8,215,673 | |||||||||
589 | EUR | BE Semiconductor Industries, NV | 60,843 | ||||||||
41,000 | TWD | E Ink Holdings, Inc. | 213,328 | ||||||||
197 | Fabrinetµ# | 30,535 | |||||||||
47,200 | CNY | Foxconn Industrial Internet Company, Ltd. - Class A | 95,100 | ||||||||
1,170 | KRW | HPSP Company, Ltd. | 27,140 | ||||||||
735 | JPY | Ibiden Company, Ltd.~ | 31,338 | ||||||||
14,500 | CNY | Iflytek Company, Ltd. - Class A | 90,445 | ||||||||
28,901 | Infosys, Ltd. (ADR) | 474,554 | |||||||||
14,900 | JPY | Keyence Corp.~ | 5,768,065 | ||||||||
270,000 | HKD | Kingdee International Software Group Company, Ltd.~# | 358,254 | ||||||||
33,400 | KRW | Koh Young Technology, Inc. | 273,710 | ||||||||
80,795 | INR | KPIT Technologies, Ltd. | 1,189,223 | ||||||||
25,000 | TWD | MediaTek, Inc. | 652,484 | ||||||||
33,400 | Microsoft Corp.~µ^ | 11,292,874 | |||||||||
540,000 | EUR | Nokia Oyj | 1,798,568 | ||||||||
29,000 | NVIDIA Corp.µ^ | 11,826,200 | |||||||||
50,900 | Oracle Corp.µ | 5,263,060 | |||||||||
4,050 | GBP | Sage Group, PLCµ | 47,846 | ||||||||
29,340 | KRW | Samsung Electronics Company, Ltd. | 1,460,395 | ||||||||
800 | JPY | SCREEN Holdings Company, Ltd.~ | 37,194 | ||||||||
7,400 | JPY | SHIFT, Inc.^# | 1,342,653 | ||||||||
16,600 | KRW | SK Hynix, Inc. | 1,441,579 | ||||||||
880,000 | TWD | Taiwan Semiconductor Manufacturing Company, Ltd. | 14,372,605 | ||||||||
22,825 | Taiwan Semiconductor Manufacturing Company, Ltd. (ADR)~ | 1,970,026 | |||||||||
66,300 | BRL | TOTVS, SA | 332,831 | ||||||||
60,065 | Unity Software, Inc.µ# | 1,523,849 | |||||||||
93,700 | CNY | Venustech Group, Inc. - Class A | 334,886 | ||||||||
7,700 | CNY | Zhongji Innolight Company, Ltd. - Class A | 92,760 | ||||||||
85,180,049 | |||||||||||
Materials (2.2%) | |||||||||||
1,180 | CAD | ERO Copper Corp.µ# | 16,014 | ||||||||
219,750 | AED | Fertiglobe, PLC | 192,157 | ||||||||
75,095 | Freeport-McMoRan, Inc.µ^ | 2,536,709 | |||||||||
3,550 | Linde, PLCµ | 1,356,668 | |||||||||
521,200 | NOK | Norsk Hydro, ASA~ | 2,972,250 | ||||||||
16,900 | ZAR | Sasol, Ltd. | 213,611 | ||||||||
1,745 | EUR | SOL S.p.A^ | 50,218 | ||||||||
21,200 | Vale, SA (ADR) | 290,652 | |||||||||
| NUMBER OF SHARES | VALUE | ||||||||||
486,000 | HKD | Zijin Mining Group Company, Ltd. - Class H~ | $ | 751,799 | |||||||
8,380,078 | |||||||||||
Real Estate (0.7%) | |||||||||||
935,500 | PHP | Ayala Land, Inc. | 460,314 | ||||||||
492,515 | MXN | Corp. Inmobiliaria Vesta SAB de CV | 1,544,556 | ||||||||
88,900 | INR | DLF, Ltd. | 601,175 | ||||||||
3,710 | INR | Macrotech Developers, Ltd.* | 35,057 | ||||||||
8,900 | JPY | Mirarth Holdings, Inc.~ | 25,943 | ||||||||
245 | EUR | VGP, NV | 19,945 | ||||||||
2,686,990 | |||||||||||
Special Purpose Acquisition Company (0.0%)# | |||||||||||
2,835 | Intelsat Emergence, SA&# | 67,331 | |||||||||
Utilities (1.0%) | |||||||||||
45,801 | EUR | Engie,SA# | 726,931 | ||||||||
28,462 | NextEra Energy, Inc.µ | 1,659,334 | |||||||||
29,000 | EUR | RWE, AGµ | 1,109,697 | ||||||||
4,992 | Veralto Corp.µ# | 344,448 | |||||||||
3,840,410 | |||||||||||
TOTAL COMMON STOCKS (Cost $433,443,681) | 314,031,059 | ||||||||||
PREFERRED STOCKS (0.3%) | |||||||||||
Communication Services (0.0%) | |||||||||||
2,600 | United States Cellular Corp.µ 5.500%, 06/01/70 | 38,012 | |||||||||
2,500 | 5.500%, 03/01/70 | 37,150 | |||||||||
75,162 | |||||||||||
Consumer Discretionary (0.1%) | |||||||||||
1,597 | Guitar Center, Inc.&# | 168,484 | |||||||||
Energy (0.1%) | |||||||||||
6,520 | NuStar Energy, LP‡ 11.315%, 11/30/23 3 mo. LIBOR + 5.64% | 163,652 | |||||||||
1,600 | NuStar Energy, LP‡ 12.438%, 11/30/23 3 mo. LIBOR + 6.77% | 40,752 | |||||||||
8,335 | NuStar Logistics, LP‡ 12.390%, 01/15/43 3 mo. LIBOR + 6.73% | 216,543 | |||||||||
420,947 | |||||||||||
Industrials (0.2%) | |||||||||||
| 260,080 | BRL | Randon, SA Implementos e Participacoes | 562,795 | ||||||||
TOTAL PREFERRED STOCKS (Cost $1,351,193) | 1,227,388 | ||||||||||
WARRANTS (0.0%)# | |||||||||||
Energy (0.0%) | |||||||||||
13,401 | Mcdermott International, Ltd.& 06/30/27, Strike $15.98 | 1 | |||||||||
CALAMOS CLOSED-END FAMILY OF FUNDS ANNUAL REPORT
188
Global Dynamic Income Fund Schedule of Investments October 31, 2023
| NUMBER OF SHARES | VALUE | ||||||||||
12,061 | Mcdermott International, Ltd. 06/30/27, Strike $12.33 | $ | 1 | ||||||||
TOTAL WARRANTS (Cost $5,152) | 2 | ||||||||||
| NUMBER OF CONTRACTS/ NOTIONAL AMOUNT | VALUE | ||||||||||
PURCHASED OPTIONS (0.4%)# | |||||||||||
Communication Services (0.0%) | |||||||||||
105 | Baidu, Inc. | ||||||||||
1,102,500 | Call, 12/15/23, Strike $160.00 | 1,260 | |||||||||
Consumer Discretionary (0.0%) | |||||||||||
480 | Alibaba Group Holding, Ltd. | ||||||||||
3,961,920 | Call, 11/17/23, Strike $100.00 | 5,040 | |||||||||
2,250 | Arcos Dorados Holdings, Inc. | ||||||||||
2,029,500 | Call, 11/17/23, Strike $12.50 | 5,625 | |||||||||
580 | Li Auto, Inc. | ||||||||||
1,960,980 | Call, 12/15/23, Strike $45.00 | 15,950 | |||||||||
26,615 | |||||||||||
Health Care (0.0%) | |||||||||||
520 | Inmode, Ltd. | ||||||||||
993,200 | Call, 01/19/24, Strike $47.50 | 3,900 | |||||||||
Industrials (0.1%) | |||||||||||
870 | Parsons Corp. | ||||||||||
4,919,850 | Call, 01/19/24, Strike $60.00 | 145,725 | |||||||||
Information Technology (0.0%) | |||||||||||
33 | NVIDIA Corp. | ||||||||||
1,345,740 | Call, 01/19/24, Strike $425.00 | 103,950 | |||||||||
Materials (0.0%) | |||||||||||
1,675 | Cemex, Sab De CV | ||||||||||
999,975 | Call, 01/19/24, Strike $8.00 | 8,375 | |||||||||
Other (0.3%) | |||||||||||
1,320 | ICICI Bank, Ltd. | ||||||||||
2,929,080 | Call, 01/19/24, Strike $24.00 | 36,300 | |||||||||
2,460 | Invesco QQQ Trust Series 1 | ||||||||||
86,326,320 | Put, 11/17/23, Strike $330.00 | 350,550 | |||||||||
4,000 | iShares MSCI EAFE ETF | ||||||||||
26,764,000 | Put, 12/15/23, Strike $60.00 | 74,000 | |||||||||
1,950 | iShares MSCI Emerging Markets | ||||||||||
7,156,500 | Put, 11/17/23, Strike $37.00 | 136,500 | |||||||||
1,675 | iShares MSCI India ETF | ||||||||||
7,242,700 | Put, 12/15/23, Strike $44.00 | 184,250 | |||||||||
40 | iShares MSCI India Small-Cap ETF | ||||||||||
247,680 | Put, 02/16/24, Strike $62.00 | 9,000 | |||||||||
1,100 | iShares MSCI South Korea ETF | ||||||||||
6,043,400 | Call, 01/19/24, Strike $71.00 | 13,750 | |||||||||
390 | KE Holdings, Inc. | ||||||||||
573,690 | Call, 01/19/24, Strike $19.85 | 9,945 | |||||||||
| NUMBER OF CONTRACTS/ NOTIONAL AMOUNT | VALUE | ||||||||||
2,540 | KraneShares CSI China Internet ETF | ||||||||||
6,616,700 | Call, 11/17/23, Strike $30.00 | $ | 16,510 | ||||||||
764 | Petroleo Brasileiro, SA | ||||||||||
1,146,000 | Call, 01/19/24, Strike $14.00 | 100,084 | |||||||||
20 | S&P 500 Index | ||||||||||
8,387,600 | Put, 12/29/23, Strike $4,200.00 | 204,700 | |||||||||
700 | SPDR S&P 500 ETF Trust | ||||||||||
29,274,000 | Put, 12/15/23, Strike $360.00 | 49,350 | |||||||||
96 | EUR | TotalEnergies, SE | |||||||||
652,147 | Call, 12/15/23, Strike 55.05 | 89,622 | |||||||||
370 | Trip.com Group, Ltd. | ||||||||||
1,258,000 | Call, 01/19/24, Strike $44.00 | 9,250 | |||||||||
1,283,811 | |||||||||||
TOTAL PURCHASED OPTIONS (Cost $9,379,309) | 1,573,636 | ||||||||||
TOTAL INVESTMENTS (150.7%) (Cost $732,453,560) | 576,996,344 | ||||||||||
| MANDATORY REDEEMABLE PREFERRED SHARES, AT LIQUIDATION VALUE (-18.3%) | (70,000,000 | ) | |||||||||
LIABILITIES, LESS OTHER ASSETS (-32.4%) | (124,131,011 | ) | |||||||||
NET ASSETS (100.0%) | $ | 382,865,333 | |||||||||
WRITTEN OPTIONS (0.0%)# | |||||||||||
Consumer Discretionary (0.0%) | |||||||||||
6 | Chipotle Mexican Grill, Inc. | ||||||||||
1,165,320 | Call, 01/19/24, Strike $2,040.00 (Premium $22,420) | $ | (32,160 | ) | |||||||
Health Care (0.0%) | |||||||||||
48 | Humana, Inc. | ||||||||||
2,513,712 | Call, 01/19/24, Strike $530.00 (Premium $57,071) | (114,480 | ) | ||||||||
Other (0.0%) | |||||||||||
20 | S&P 500 Index | ||||||||||
8,387,600 | Put, 12/29/23, Strike $3,500.00 (Premium $34,139) | (14,200 | ) | ||||||||
TOTAL WRITTEN OPTIONS (Premium $113,630) | $ | (160,840 | ) | ||||||||
NOTES TO SCHEDULE OF INVESTMENTS
* Securities issued and sold pursuant to a Rule 144A transaction are exempted from the registration requirement of the Securities Act of 1933, as amended. These securities may only be sold to qualified institutional buyers ("QIBs"), such as the Fund. Any resale of these securities must generally be effected through a sale that is registered under the Act or otherwise exempted from such registration requirements.
~ Security, or portion of security, is segregated as collateral (or collateral for potential future transactions) for written options and securities sold short. The aggregate value of such securities is $35,825,862.
www.calamos.com
189
Global Dynamic Income Fund Schedule of Investments October 31, 2023
µ Security, or portion of security, is held in a segregated account as collateral for note payable aggregating a total value of $229,836,641.
^ Security, or portion of security, is on loan.
@ In default status and considered non-income producing.
& Illiquid security.
‡ Variable rate security. The rate shown is the rate in effect at October 31, 2023.
§ Securities exchangeable or convertible into securities of one or more entities that are different than the issuer. Each entity is identified in the parenthetical.
¡ Bank loans generally are subject to mandatory and/or optional prepayment. As a result, the actual remaining maturity of bank loans may be substantially less than the stated maturities shown.
! This position represents an unsettled loan commitment at period end. Certain details associated with this purchase are not known prior to the settlement date, including coupon rate, which will be adjusted on settlement date.
# Non-income producing security.
‡‡ Perpetual maturity.
FOREIGN CURRENCY ABBREVIATIONS
AED UAE Dirham
AUD Australian Dollar
BRL Brazilian Real
CAD Canadian Dollar
CHF Swiss Franc
CNY Chinese Yuan Renminbi
EUR European Monetary Unit
GBP British Pound Sterling
HKD Hong Kong Dollar
IDR Indonesian Rupiah
INR Indian Rupee
JPY Japanese Yen
KRW South Korean Won
MXN Mexican Peso
NOK Norwegian Krone
PHP Philippine Peso
PLN Polish Zloty
SAR Saudi Riyal
SEK Swedish Krona
THB Thai Baht
TWD New Taiwan Dollar
ZAR South African Rand
Note: Value for securities denominated in foreign currencies is shown in U.S. dollars. The principal amount for such securities is shown in the respective foreign currency. The date on options represents the expiration date of the option contract. The option contract may be exercised at any date on or before the date shown.
CURRENCY EXPOSURE
OCTOBER 31, 2023
VALUE | % OF TOTAL INVESTMENTS | ||||||||||
US Dollar | $ | 394,926,607 | 68.5 | % | |||||||
European Monetary Unit | 47,045,489 | 8.2 | % | ||||||||
Hong Kong Dollar | 22,804,904 | 3.9 | % | ||||||||
British Pound Sterling | 19,551,549 | 3.4 | % | ||||||||
Japanese Yen | 17,344,183 | 3.0 | % | ||||||||
New Taiwan Dollar | 17,037,668 | 3.0 | % | ||||||||
Indian Rupee | 16,494,553 | 2.9 | % | ||||||||
Canadian Dollar | 11,930,911 | 2.1 | % | ||||||||
South Korean Won | 5,114,003 | 0.9 | % | ||||||||
Indonesian Rupiah | 4,130,824 | 0.7 | % | ||||||||
Brazilian Real | 3,466,602 | 0.6 | % | ||||||||
Chinese Yuan Renminbi | 3,023,172 | 0.5 | % | ||||||||
Norwegian Krone | 2,972,250 | 0.5 | % | ||||||||
Mexican Peso | 2,812,378 | 0.5 | % | ||||||||
Swiss Franc | 2,282,908 | 0.4 | % | ||||||||
Australian Dollar | 1,956,154 | 0.3 | % | ||||||||
Thai Baht | 1,197,030 | 0.2 | % | ||||||||
Philippine Peso | 727,593 | 0.1 | % | ||||||||
UAE Dirham | 578,674 | 0.1 | % | ||||||||
Polish Zloty | 573,995 | 0.1 | % | ||||||||
Saudi Riyal | 538,858 | 0.1 | % | ||||||||
South African Rand | 213,611 | — | % | ||||||||
Swedish Krona | 111,588 | — | % | ||||||||
| Total Investments Net of Written Options | $ | 576,835,504 | 100.0 | % | |||||||
Currency exposure may vary over time.
CALAMOS CLOSED-END FAMILY OF FUNDS ANNUAL REPORT
190
Global Dynamic Income Fund Schedule of Investments October 31, 2023
The following table summarizes the Fund's investments and derivative financial instruments categorized in the fair value hierarchy as of October 31, 2023 (see Note 1):
LEVEL 1 | LEVEL 2 | LEVEL 3 | TOTAL | ||||||||||||||||
Assets: | |||||||||||||||||||
Asset Backed Securities | $ | — | $ | 150,603 | $ | — | $ | 150,603 | |||||||||||
Corporate Bonds | — | 65,250,838 | — | 65,250,838 | |||||||||||||||
Convertible Bonds | — | 130,004,931 | — | 130,004,931 | |||||||||||||||
Bank Loans | — | 57,960,249 | — | 57,960,249 | |||||||||||||||
Convertible Preferred Stocks | 6,447,295 | 44,375 | — | 6,491,670 | |||||||||||||||
Common Stocks | 191,952,411 | 122,078,648 | — | 314,031,059 | |||||||||||||||
Preferred Stocks | 1,020,892 | 206,496 | — | 1,227,388 | |||||||||||||||
Warrants | — | 2 | — | 2 | |||||||||||||||
U.S. Government and Agency Securities | — | 305,968 | — | 305,968 | |||||||||||||||
Purchased Options | 1,573,636 | — | — | 1,573,636 | |||||||||||||||
Total | $ | 200,994,234 | $ | 376,002,110 | $ | — | $ | 576,996,344 | |||||||||||
Liabilities: | |||||||||||||||||||
Written Options | $ | 160,840 | $ | — | $ | — | $ | 160,840 | |||||||||||
Total | $ | 160,840 | $ | — | $ | — | $ | 160,840 | |||||||||||
See accompanying Notes to Schedule of Investments
www.calamos.com
191
Global Total Return Fund Schedule of Investments October 31, 2023
| PRINCIPAL AMOUNT | VALUE | ||||||||||
CORPORATE BONDS (15.3%) | |||||||||||
Airlines (0.3%) | |||||||||||
8,667 | Air Canada Pass Through Trust Series 2015-2, Class B* 5.000%, 06/15/25 | $ | 8,624 | ||||||||
42,066 | Alaska Airlines Pass Through Trust Series 2020-1, Class A* 4.800%, 02/15/29 | 39,429 | |||||||||
21,757 | Alaska Airlines Pass Through Trust Series 2020-1, Class B* 8.000%, 02/15/27 | 21,716 | |||||||||
50,050 | American Airlines Pass Through Trust Series 2021-1, Class B 3.950%, 01/11/32 | 42,687 | |||||||||
27,500 | American Airlines, Inc. / AAdvantage Loyalty IP, Ltd.* 5.500%, 04/20/26 | 26,752 | |||||||||
11,000 | 5.750%, 04/20/29 | 9,928 | |||||||||
43,813 | British Airways Pass Through Trust Series 2021-1, Class B* 3.900%, 03/15/33 | 38,069 | |||||||||
48,045 | JetBlue Pass Through Trust Series 2020-1, Class B 7.750%, 05/15/30 | 47,770 | |||||||||
63,800 | Spirit Loyalty Cayman, Ltd. / Spirit IP Cayman, Ltd.* 8.000%, 09/20/25 | 47,246 | |||||||||
282,221 | |||||||||||
Communication Services (1.6%) | |||||||||||
55,000 | APi Group DE, Inc.* 4.750%, 10/15/29 | 47,428 | |||||||||
67,000 | Arrow Bidco, LLC* 9.500%, 03/15/24 | 67,897 | |||||||||
57,000 | Audacy Capital Corp.* 6.750%, 03/31/29 | 926 | |||||||||
27,000 | 6.500%, 05/01/27 | 405 | |||||||||
36,000 | Cincinnati Bell Telephone Company, LLC 6.300%, 12/01/28 | 29,132 | |||||||||
40,000 | Clear Channel Outdoor Holdings, Inc.* 9.000%, 09/15/28 | 39,006 | |||||||||
70,000 | Consolidated Communications, Inc.* 6.500%, 10/01/28 | 55,557 | |||||||||
200,000 | CSC Holdings, LLC* 5.500%, 04/15/27 | 167,184 | |||||||||
45,000 | Diamond Sports Group, LLC / Diamond Sports Finance Company*@ 6.625%, 08/15/27& | 571 | |||||||||
27,000 | 5.375%, 08/15/26 | 331 | |||||||||
131,000 | Directv Financing, LLC / Directv Financing Co-Obligor, Inc.* 5.875%, 08/15/27 | 114,808 | |||||||||
45,000 | Frontier California, Inc. 6.750%, 05/15/27 | 41,549 | |||||||||
| PRINCIPAL AMOUNT | VALUE | ||||||||||
28,000 | Frontier Communications Holdings, LLC* 5.000%, 05/01/28 | $ | 24,301 | ||||||||
11,000 | 8.750%, 05/15/30 | 10,493 | |||||||||
65,000 | Frontier Florida, LLC@ 6.860%, 02/01/28 | 59,836 | |||||||||
65,000 | Frontier North, Inc.@ 6.730%, 02/15/28 | 60,299 | |||||||||
40,000 | Go Daddy Operating Company, LLC / GD Finance Company, Inc.* 3.500%, 03/01/29 | 33,808 | |||||||||
13,000 | 5.250%, 12/01/27 | 12,292 | |||||||||
15,000 | iHeartCommunications, Inc. 8.375%, 05/01/27^ | 9,206 | |||||||||
15,000 | 5.250%, 08/15/27* | 11,010 | |||||||||
30,000 | Intelsat Jackson Holdings, SA& 9.750%, 07/15/25* | — | |||||||||
25,000 | 5.500%, 08/01/23 | — | |||||||||
37,759 | Ligado Networks, LLC* 15.500%, 11/01/23 PIK rate | 9,518 | |||||||||
35,000 | Lumen Technologies, Inc. 7.600%, 09/15/39 | 9,525 | |||||||||
20,000 | 4.000%, 02/15/27*^ | 13,675 | |||||||||
10,000 | 7.650%, 03/15/42 | 2,693 | |||||||||
22,000 | Match Group Holdings II, LLC* 3.625%, 10/01/31 | 17,034 | |||||||||
35,000 | Nexstar Media, Inc.* 5.625%, 07/15/27 | 31,517 | |||||||||
65,000 | Paramount Global 4.900%, 08/15/44 | 40,946 | |||||||||
14,000 | Qwest Corp. 7.250%, 09/15/25 | 13,444 | |||||||||
23,000 | Scripps Escrow II, Inc.* 3.875%, 01/15/29 | 17,470 | |||||||||
11,000 | 5.375%, 01/15/31 | 6,835 | |||||||||
40,000 | Scripps Escrow, Inc.*^ 5.875%, 07/15/27 | 29,942 | |||||||||
65,000 | Sirius XM Radio, Inc.* 5.500%, 07/01/29 | 57,651 | |||||||||
43,000 | 4.000%, 07/15/28 | 36,585 | |||||||||
20,000 | 3.125%, 09/01/26 | 17,970 | |||||||||
11,000 | 3.875%, 09/01/31 | 8,286 | |||||||||
41,000 | Spanish Broadcasting System, Inc.* 9.750%, 03/01/26 | 25,551 | |||||||||
110,000 | Sprint, LLC 7.125%, 06/15/24 | 110,626 | |||||||||
45,000 | Stagwell Global, LLC* 5.625%, 08/15/29 | 37,231 | |||||||||
35,000 | Telecom Italia Capital, SA 6.000%, 09/30/34 | 28,829 | |||||||||
42,000 | Telesat Canada / Telesat, LLC* 4.875%, 06/01/27 | 25,148 | |||||||||
15,000 | Time Warner Cable, LLC 7.300%, 07/01/38 | 14,050 | |||||||||
CALAMOS CLOSED-END FAMILY OF FUNDS ANNUAL REPORT
192
Global Total Return Fund Schedule of Investments October 31, 2023
| PRINCIPAL AMOUNT | VALUE | ||||||||||
54,000 | United States Cellular Corp. 6.700%, 12/15/33 | $ | 51,427 | ||||||||
45,000 | Univision Communications, Inc.* 8.000%, 08/15/28 | 42,647 | |||||||||
20,000 | Viasat, Inc.* 5.625%, 04/15/27 | 17,499 | |||||||||
1,452,138 | |||||||||||
Consumer Discretionary (3.0%) | |||||||||||
53,000 | Abercrombie & Fitch Management Company* 8.750%, 07/15/25 | 53,884 | |||||||||
40,000 | Adams Homes, Inc.* 9.250%, 10/15/28 | 39,264 | |||||||||
55,000 | Adient Global Holdings Company* 8.250%, 04/15/31 | 53,821 | |||||||||
36,000 | American Axle & Manufacturing, Inc. 6.875%, 07/01/28 | 32,085 | |||||||||
39,000 | Ashton Woods USA, LLC / Ashton Woods Finance Company* 6.625%, 01/15/28 | 35,794 | |||||||||
38,000 | 4.625%, 08/01/29 | 30,885 | |||||||||
53,000 | At Home Group, Inc.* 4.875%, 07/15/28 | 18,418 | |||||||||
57,000 | Bath & Body Works, Inc. 6.694%, 01/15/27 | 55,240 | |||||||||
55,000 | 6.875%, 11/01/35 | 48,614 | |||||||||
28,000 | Caesars Entertainment, Inc.* 4.625%, 10/15/29 | 23,052 | |||||||||
21,000 | 8.125%, 07/01/27 | 20,818 | |||||||||
45,000 | Carnival Corp.* 6.000%, 05/01/29 | 38,059 | |||||||||
22,000 | 4.000%, 08/01/28 | 19,167 | |||||||||
21,000 | 7.625%, 03/01/26^ | 20,431 | |||||||||
3,000 | 7.000%, 08/15/29 | 2,947 | |||||||||
50,000 | Carriage Services, Inc.*^ 4.250%, 05/15/29 | 40,947 | |||||||||
8,000 | Carvana Company* 14.000%, 06/01/31 | 6,021 | |||||||||
6,000 | 13.000%, 06/01/30 | 4,503 | |||||||||
4,000 | 12.000%, 12/01/28 | 2,996 | |||||||||
95,000 | CCO Holdings, LLC / CCO Holdings Capital Corp.* 5.125%, 05/01/27 | 87,533 | |||||||||
90,000 | 4.500%, 08/15/30 | 72,335 | |||||||||
50,000 | 6.375%, 09/01/29 | 45,970 | |||||||||
50,000 | 4.750%, 03/01/30 | 41,304 | |||||||||
46,000 | 4.250%, 02/01/31 | 35,841 | |||||||||
22,000 | 4.750%, 02/01/32 | 17,197 | |||||||||
20,000 | 5.000%, 02/01/28 | 17,918 | |||||||||
22,000 | CDI Escrow Issuer, Inc.* 5.750%, 04/01/30 | 19,715 | |||||||||
39,000 | Cedar Fair, LP^ 5.250%, 07/15/29 | 33,731 | |||||||||
23,000 | Churchill Downs, Inc.* 6.750%, 05/01/31 | 21,504 | |||||||||
| PRINCIPAL AMOUNT | VALUE | ||||||||||
40,000 | Dana, Inc. 4.250%, 09/01/30 | $ | 31,828 | ||||||||
32,000 | 4.500%, 02/15/32 | 25,081 | |||||||||
50,000 | DISH DBS Corp. 5.250%, 12/01/26* | 40,449 | |||||||||
41,000 | 7.750%, 07/01/26 | 27,512 | |||||||||
30,000 | 7.375%, 07/01/28 | 16,914 | |||||||||
20,000 | 5.125%, 06/01/29 | 10,321 | |||||||||
46,000 | DISH Network Corp.* 11.750%, 11/15/27 | 45,602 | |||||||||
47,000 | Everi Holdings, Inc.* 5.000%, 07/15/29 | 39,535 | |||||||||
175,000 | Ford Motor Company^ 6.100%, 08/19/32 | 162,015 | |||||||||
200,000 | Ford Motor Credit Company, LLC 2.900%, 02/16/28 | 170,314 | |||||||||
16,000 | Gap, Inc.* 3.875%, 10/01/31 | 11,543 | |||||||||
20,000 | General Motors Company 5.200%, 04/01/45 | 14,825 | |||||||||
75,000 | goeasy, Ltd.* 5.375%, 12/01/24^ | 73,715 | |||||||||
40,000 | 4.375%, 05/01/26 | 36,258 | |||||||||
20,000 | Goodyear Tire & Rubber Company^ 5.250%, 07/15/31 | 16,312 | |||||||||
19,000 | Group 1 Automotive, Inc.* 4.000%, 08/15/28 | 16,422 | |||||||||
45,000 | Guitar Center, Inc.*&^ 8.500%, 01/15/26 | 38,033 | |||||||||
12,655 | JetBlue Pass Through Trust Series 2019-2, Class B 8.000%, 11/15/27 | 12,739 | |||||||||
35,000 | Kohl's Corp. 5.550%, 07/17/45 | 20,236 | |||||||||
45,000 | LCM Investments Holdings II, LLC* 8.250%, 08/01/31 | 43,129 | |||||||||
45,000 | Liberty Interactive, LLC 8.250%, 02/01/30 | 11,855 | |||||||||
50,000 | Life Time, Inc.* 5.750%, 01/15/26 | 48,493 | |||||||||
43,000 | 8.000%, 04/15/26 | 42,024 | |||||||||
20,000 | Light & Wonder International, Inc.* 7.500%, 09/01/31 | 19,562 | |||||||||
15,000 | Lindblad Expeditions Holdings, Inc.* 9.000%, 05/15/28 | 14,705 | |||||||||
28,000 | Lindblad Expeditions, LLC* 6.750%, 02/15/27 | 25,460 | |||||||||
30,000 | M/I Homes, Inc. 3.950%, 02/15/30 | 24,006 | |||||||||
73,000 | Macy's Retail Holdings, LLC 6.700%, 07/15/34* | 56,288 | |||||||||
25,000 | 4.300%, 02/15/43 | 13,719 | |||||||||
www.calamos.com
193
Global Total Return Fund Schedule of Investments October 31, 2023
| PRINCIPAL AMOUNT | VALUE | ||||||||||
55,000 | Midwest Gaming Borrower, LLC / Midwest Gaming Finance Corp.* 4.875%, 05/01/29 | $ | 45,912 | ||||||||
25,000 | Newell Brands, Inc. 5.200%, 04/01/26 | 23,614 | |||||||||
23,000 | Nordstrom, Inc. 4.250%, 08/01/31 | 16,862 | |||||||||
20,000 | 5.000%, 01/15/44 | 12,044 | |||||||||
50,000 | PENN Entertainment, Inc.*^ 4.125%, 07/01/29 | 38,883 | |||||||||
60,000 | Premier Entertainment Sub, LLC / Premier Entertainment Finance Corp.*^ 5.625%, 09/01/29 | 42,227 | |||||||||
111,000 | Rite Aid Corp.*@ 8.000%, 11/15/26 | 77,188 | |||||||||
23,000 | Royal Caribbean Cruises, Ltd.* 7.250%, 01/15/30 | 22,753 | |||||||||
63,000 | Simmons Foods, Inc. / Simmons Prepared Foods, Inc. / Simmons Pet Food, Inc. / Simmons Feed* 4.625%, 03/01/29 | 51,230 | |||||||||
85,000 | Six Flags Entertainment Corp.*^ 7.250%, 05/15/31 | 78,303 | |||||||||
50,000 | Sonic Automotive, Inc.*^ 4.625%, 11/15/29 | 41,696 | |||||||||
36,000 | Speedway Motorsports, LLC / Speedway Funding II, Inc.* 4.875%, 11/01/27 | 32,239 | |||||||||
90,000 | Station Casinos, LLC* 4.500%, 02/15/28 | 77,815 | |||||||||
31,000 | Taylor Morrison Communities, Inc.* 5.750%, 01/15/28 | 28,238 | |||||||||
10,000 | Viking Cruises, Ltd.* 9.125%, 07/15/31 | 9,838 | |||||||||
50,000 | Vista Outdoor, Inc.*^ 4.500%, 03/15/29 | 46,580 | |||||||||
20,000 | Windsor Holdings III, LLC* 8.500%, 06/15/30 | 19,634 | |||||||||
2,713,945 | |||||||||||
Consumer Staples (0.7%) | |||||||||||
52,000 | 1375209 B.C., Ltd.* 9.000%, 01/30/28 | 50,555 | |||||||||
40,000 | B&G Foods, Inc.* 8.000%, 09/15/28 | 39,050 | |||||||||
51,000 | Central Garden & Pet Company* 4.125%, 04/30/31 | 40,762 | |||||||||
53,000 | Edgewell Personal Care Company* 4.125%, 04/01/29 | 44,569 | |||||||||
59,000 | Energizer Holdings, Inc.* 4.375%, 03/31/29 | 48,577 | |||||||||
10,000 | 6.500%, 12/31/27^ | 9,395 | |||||||||
65,000 | JBS USA LUX, SA / JBS USA Food Company / JBS USA Finance, Inc. 5.500%, 01/15/30 | 59,470 | |||||||||
| PRINCIPAL AMOUNT | VALUE | ||||||||||
25,000 | 5.125%, 02/01/28 | $ | 23,480 | ||||||||
15,000 | 5.750%, 04/01/33 | 13,207 | |||||||||
33,000 | New Albertsons, LP 7.750%, 06/15/26 | 33,367 | |||||||||
43,000 | Performance Food Group, Inc.* 4.250%, 08/01/29 | 36,488 | |||||||||
35,000 | Pilgrim's Pride Corp. 4.250%, 04/15/31 | 28,918 | |||||||||
21,000 | Post Holdings, Inc.* 5.750%, 03/01/27 | 20,051 | |||||||||
42,000 | Prestige Brands, Inc.* 3.750%, 04/01/31 | 33,481 | |||||||||
35,000 | United Natural Foods, Inc.*^ 6.750%, 10/15/28 | 27,390 | |||||||||
70,000 | Vector Group, Ltd.* 5.750%, 02/01/29 | 59,439 | |||||||||
20,000 | Williams Scotsman, Inc.* 7.375%, 10/01/31 | 19,749 | |||||||||
587,948 | |||||||||||
Energy (2.0%) | |||||||||||
44,000 | Antero Resources Corp.* 5.375%, 03/01/30 | 40,218 | |||||||||
45,000 | Apache Corp. 5.100%, 09/01/40 | 35,036 | |||||||||
40,000 | Buckeye Partners, LP 3.950%, 12/01/26 | 36,508 | |||||||||
25,000 | 5.850%, 11/15/43 | 17,706 | |||||||||
60,000 | Callon Petroleum Company* 7.500%, 06/15/30 | 58,163 | |||||||||
23,000 | Cheniere Energy, Inc. 4.625%, 10/15/28 | 21,027 | |||||||||
32,000 | Chesapeake Energy Corp.* 6.750%, 04/15/29 | 31,399 | |||||||||
58,000 | Civitas Resources, Inc.* 8.750%, 07/01/31 | 58,610 | |||||||||
35,000 | Continental Resources, Inc.* 2.875%, 04/01/32 | 25,928 | |||||||||
25,000 | 5.750%, 01/15/31 | 23,207 | |||||||||
32,000 | DT Midstream, Inc.* 4.125%, 06/15/29 | 27,557 | |||||||||
39,000 | Earthstone Energy Holdings, LLC* 8.000%, 04/15/27 | 39,592 | |||||||||
15,000 | 9.875%, 07/15/31 | 16,187 | |||||||||
25,000 | Enbridge, Inc.‡ 7.375%, 01/15/83 5 year CMT + 3.71% | 23,264 | |||||||||
65,000 | Energy Transfer, LP‡ 8.656%, 11/01/66 3 mo. USD Term SOFR + 3.28% | 53,144 | |||||||||
32,000 | 6.500%, 11/01/35 5 year CMT + 5.69% | 29,080 | |||||||||
CALAMOS CLOSED-END FAMILY OF FUNDS ANNUAL REPORT
194
Global Total Return Fund Schedule of Investments October 31, 2023
| PRINCIPAL AMOUNT | VALUE | ||||||||||
60,000 | EnLink Midstream Partners, LP 9.780%, 11/01/35‡ 3 mo. USD LIBOR + 4.11% | $ | 53,581 | ||||||||
50,000 | 4.850%, 07/15/26 | 47,276 | |||||||||
31,000 | Enlink Midstream, LLC* 6.500%, 09/01/30 | 29,805 | |||||||||
70,000 | EQM Midstream Partners, LP* 7.500%, 06/01/27 | 69,591 | |||||||||
31,000 | Genesis Energy, LP / Genesis Energy Finance Corp. 8.875%, 04/15/30 | 30,142 | |||||||||
18,000 | 6.250%, 05/15/26 | 17,184 | |||||||||
45,000 | Gulfport Energy Corp. 6.375%, 05/15/25& | — | |||||||||
40,000 | 8.000%, 05/17/26* | 40,017 | |||||||||
13,752 | 8.000%, 05/17/26 | 13,758 | |||||||||
60,000 | Hilcorp Energy I, LP / Hilcorp Finance Company* 6.000%, 04/15/30 | 53,350 | |||||||||
32,000 | Howard Midstream Energy Partners, LLC* 6.750%, 01/15/27 | 30,433 | |||||||||
44,000 | Magnolia Oil & Gas Operating, LLC / Magnolia Oil & Gas Finance Corp.* 6.000%, 08/01/26 | 42,098 | |||||||||
25,000 | Moss Creek Resources Holdings, Inc.* 10.500%, 05/15/27 | 24,743 | |||||||||
25,000 | 7.500%, 01/15/26 | 23,931 | |||||||||
35,000 | Nabors Industries, Inc.* 7.375%, 05/15/27 | 32,775 | |||||||||
35,000 | Nabors Industries, Ltd.* 7.500%, 01/15/28 | 30,927 | |||||||||
40,000 | New Fortress Energy, Inc.* 6.750%, 09/15/25 | 37,226 | |||||||||
22,000 | 6.500%, 09/30/26 | 19,723 | |||||||||
20,000 | Oceaneering International, Inc.* 6.000%, 02/01/28 | 18,341 | |||||||||
45,000 | Parkland Corp.* 5.875%, 07/15/27 | 43,274 | |||||||||
23,000 | Patterson-UTI Energy, Inc. 5.150%, 11/15/29 | 20,547 | |||||||||
12,000 | Permian Resources Operating LLC* 7.000%, 01/15/32 | 11,742 | |||||||||
50,000 | Plains All American Pipeline, LP‡ 9.736%, 11/01/35 3 mo. USD LIBOR + 4.11% | 47,197 | |||||||||
60,000 | Rockcliff Energy II, LLC* 5.500%, 10/15/29 | 54,460 | |||||||||
21,000 | Southwestern Energy Company 4.750%, 02/01/32 | 18,080 | |||||||||
20,000 | 5.375%, 02/01/29 | 18,529 | |||||||||
11,000 | Sunoco, LP / Sunoco Finance Corp. 4.500%, 04/30/30 | 9,464 | |||||||||
61,750 | Transocean, Inc.* 8.750%, 02/15/30 | 61,700 | |||||||||
| PRINCIPAL AMOUNT | VALUE | ||||||||||
30,000 | Venture Global Calcasieu Pass, LLC* 6.250%, 01/15/30 | $ | 28,321 | ||||||||
10,000 | 4.125%, 08/15/31 | 8,084 | |||||||||
10,000 | 3.875%, 08/15/29 | 8,376 | |||||||||
55,000 | Venture Global LNG, Inc.* 8.375%, 06/01/31 | 52,525 | |||||||||
35,000 | 8.125%, 06/01/28 | 34,007 | |||||||||
20,000 | 9.875%, 02/01/32 | 20,297 | |||||||||
10,000 | 9.500%, 02/01/29 | 10,150 | |||||||||
42,000 | Vital Energy, Inc. 9.500%, 01/15/25 | 42,228 | |||||||||
25,000 | 7.750%, 07/31/29*^ | 22,595 | |||||||||
5,000 | 9.750%, 10/15/30 | 4,904 | |||||||||
45,000 | VOC Escrow, Ltd.* 5.000%, 02/15/28 | 40,593 | |||||||||
50,000 | Weatherford International, Ltd.* 8.625%, 04/30/30 | 50,601 | |||||||||
1,759,201 | |||||||||||
Financials (2.3%) | |||||||||||
56,000 | Acrisure, LLC / Acrisure Finance, Inc.* 7.000%, 11/15/25 | 54,405 | |||||||||
67,000 | Aethon United BR, LP / Aethon United Finance Corp.* 8.250%, 02/15/26 | 66,625 | |||||||||
69,000 | AG Issuer, LLC* 6.250%, 03/01/28 | 63,941 | |||||||||
75,000 | Alliant Holdings Intermediate, LLC / Alliant Holdings Co-Issuer* 6.750%, 10/15/27 | 68,511 | |||||||||
49,000 | Ally Financial, Inc. 4.700%, 11/01/35‡‡‡ 5 year CMT + 3.87% | 32,018 | |||||||||
20,000 | 8.000%, 11/01/31 | 19,557 | |||||||||
20,000 | 4.700%, 11/01/35‡ 7 year CMT + 3.48% | 11,702 | |||||||||
86,000 | AmWINS Group, Inc.* 4.875%, 06/30/29 | 73,826 | |||||||||
48,000 | Aviation Capital Group, LLC* 3.500%, 11/01/27 | 42,189 | |||||||||
20,000 | Avolon Holdings Funding, Ltd.* 5.500%, 01/15/26 | 19,277 | |||||||||
88,000 | BroadStreet Partners, Inc.* 5.875%, 04/15/29 | 76,787 | |||||||||
40,000 | Brookfield Property REIT, Inc. / BPR Cumulus, LLC / BPR Nimbus, LLC / GGSI Sellco, LLC* 4.500%, 04/01/27 | 33,381 | |||||||||
26,000 | 5.750%, 05/15/26 | 23,846 | |||||||||
65,000 | Credit Acceptance Corp. 6.625%, 03/15/26 | 61,955 | |||||||||
52,000 | 5.125%, 12/31/24* | 50,347 | |||||||||
45,000 | Cushman & Wakefield U.S. Borrower LLC*^ 8.875%, 09/01/31 | 42,755 | |||||||||
www.calamos.com
195
Global Total Return Fund Schedule of Investments October 31, 2023
| PRINCIPAL AMOUNT | VALUE | ||||||||||
58,000 | Enact Holdings, Inc.* 6.500%, 08/15/25 | $ | 57,125 | ||||||||
64,000 | Global Net Lease, Inc. / Global Net Lease Operating Partnership, LP* 3.750%, 12/15/27 | 48,609 | |||||||||
66,000 | HUB International, Ltd.* 5.625%, 12/01/29 | 56,976 | |||||||||
34,000 | 7.000%, 05/01/26 | 33,162 | |||||||||
31,000 | Icahn Enterprises, LP / Icahn Enterprises Finance Corp. 4.375%, 02/01/29 | 24,054 | |||||||||
100,000 | ILFC E-Capital Trust II*‡ 7.459%, 12/21/65 3 mo. USD LIBOR + 1.80% | 75,217 | |||||||||
90,000 | Iron Mountain, Inc.* 5.250%, 03/15/28 | 82,460 | |||||||||
12,000 | 7.000%, 02/15/29 | 11,655 | |||||||||
88,000 | Ladder Capital Finance Holdings, LLLP / Ladder Capital Finance Corp.* 5.250%, 10/01/25 | 83,899 | |||||||||
22,000 | 4.750%, 06/15/29 | 17,758 | |||||||||
40,000 | LD Holdings Group, LLC* 6.125%, 04/01/28 | 22,414 | |||||||||
45,000 | Level 3 Financing, Inc.* 4.250%, 07/01/28 | 25,483 | |||||||||
37,000 | 3.400%, 03/01/27^ | 34,429 | |||||||||
20,000 | 4.625%, 09/15/27 | 13,498 | |||||||||
30,000 | LPL Holdings, Inc.* 4.000%, 03/15/29 | 25,811 | |||||||||
40,000 | Macquarie Airfinance Holdings, Ltd.* 8.125%, 03/30/29 | 39,452 | |||||||||
70,000 | MetLife, Inc. 6.400%, 12/15/66 | 65,764 | |||||||||
60,000 | Nationstar Mortgage Holdings, Inc.* 5.500%, 08/15/28 | 53,168 | |||||||||
50,000 | Navient Corp. 5.000%, 03/15/27 | 44,099 | |||||||||
20,000 | 4.875%, 03/15/28 | 16,593 | |||||||||
50,000 | Necessity Retail REIT, Inc. / American Finance Operating Partner, LP* 4.500%, 09/30/28 | 37,483 | |||||||||
30,000 | OneMain Finance Corp. 9.000%, 01/15/29^ | 29,333 | |||||||||
30,000 | 3.875%, 09/15/28 | 23,892 | |||||||||
22,000 | 7.125%, 03/15/26^ | 21,412 | |||||||||
23,000 | Park Intermediate Holdings, LLC / PK Domestic Property, LLC / PK Finance Co-Issuer* 5.875%, 10/01/28 | 20,770 | |||||||||
73,000 | PHH Mortgage Corp.* 7.875%, 03/15/26 | 63,306 | |||||||||
50,000 | RHP Hotel Properties, LP / RHP Finance Corp.* 4.500%, 02/15/29 | 42,623 | |||||||||
| PRINCIPAL AMOUNT | VALUE | ||||||||||
20,000 | Rocket Mortgage, LLC / Rocket Mortgage Co-Issuer, Inc.* 3.875%, 03/01/31 | $ | 15,480 | ||||||||
20,000 | 3.625%, 03/01/29 | 16,280 | |||||||||
10,000 | 2.875%, 10/15/26 | 8,734 | |||||||||
43,000 | StoneX Group, Inc.* 8.625%, 06/15/25 | 43,258 | |||||||||
52,000 | United Wholesale Mortgage, LLC* 5.500%, 04/15/29 | 43,563 | |||||||||
20,000 | 5.750%, 06/15/27 | 18,251 | |||||||||
25,000 | Uniti Group, LP / Uniti Group Finance, Inc. / CSL Capital, LLC* 6.500%, 02/15/29 | 16,257 | |||||||||
22,000 | 10.500%, 02/15/28 | 21,213 | |||||||||
47,000 | XHR, LP* 6.375%, 08/15/25 | 45,870 | |||||||||
2,040,473 | |||||||||||
Health Care (1.4%) | |||||||||||
95,000 | Bausch Health Companies, Inc.* 11.000%, 09/30/28 | 58,155 | |||||||||
16,000 | 14.000%, 10/15/30 | 8,814 | |||||||||
16,000 | 6.125%, 02/01/27 | 8,939 | |||||||||
88,000 | CHS/Community Health Systems, Inc.* 6.125%, 04/01/30 | 34,207 | |||||||||
60,000 | 8.000%, 03/15/26 | 54,936 | |||||||||
25,000 | 6.875%, 04/15/29 | 10,320 | |||||||||
5,000 | 5.250%, 05/15/30 | 3,555 | |||||||||
89,000 | DaVita, Inc.* 4.625%, 06/01/30 | 69,830 | |||||||||
52,000 | 3.750%, 02/15/31 | 37,437 | |||||||||
33,000 | Embecta Corp.* 5.000%, 02/15/30 | 26,231 | |||||||||
11,000 | 6.750%, 02/15/30 | 9,124 | |||||||||
20,000 | Encompass Health Corp. 4.750%, 02/01/30 | 17,362 | |||||||||
20,000 | 4.500%, 02/01/28 | 18,048 | |||||||||
52,000 | HCA, Inc. 7.500%, 11/06/33 | 53,380 | |||||||||
200,000 | Jazz Securities DAC* 4.375%, 01/15/29 | 173,966 | |||||||||
18,722 | Mallinckrodt International Finance, SA / Mallinckrodt CB, LLC*@ 10.000%, 06/15/29 | 1,331 | |||||||||
55,000 | Medline Borrower, LP* 3.875%, 04/01/29 | 46,461 | |||||||||
53,000 | 5.250%, 10/01/29^ | 45,170 | |||||||||
200,000 | Organon & Company / Organon Foreign Debt Co-Issuer, BV* 5.125%, 04/30/31 | 156,656 | |||||||||
62,000 | Team Health Holdings, Inc.* 6.375%, 02/01/25 | 49,784 | |||||||||
120,000 | Tenet Healthcare Corp. 6.250%, 02/01/27 | 115,455 | |||||||||
70,000 | 6.875%, 11/15/31 | 64,667 | |||||||||
CALAMOS CLOSED-END FAMILY OF FUNDS ANNUAL REPORT
196
Global Total Return Fund Schedule of Investments October 31, 2023
| PRINCIPAL AMOUNT | VALUE | ||||||||||
190,000 | Teva Pharmaceutical Finance Netherlands III, BV 3.150%, 10/01/26 | $ | 167,253 | ||||||||
1,231,081 | |||||||||||
Industrials (2.3%) | |||||||||||
50,000 | ACCO Brands Corp.* 4.250%, 03/15/29 | 41,529 | |||||||||
50,000 | Air Lease Corp.‡ 4.125%, 11/01/35 5 year CMT + 3.15% | 35,972 | |||||||||
75,000 | Albertsons Companies, Inc. / Safeway, Inc. / New Albertsons, LP / Albertsons, LLC* 4.625%, 01/15/27 | 70,592 | |||||||||
36,000 | 3.500%, 03/15/29 | 30,722 | |||||||||
30,000 | 5.875%, 02/15/28 | 28,782 | |||||||||
50,000 | Allegiant Travel Company* 7.250%, 08/15/27 | 45,539 | |||||||||
10,000 | American Airlines Group, Inc.* 3.750%, 03/01/25 | 9,363 | |||||||||
25,000 | Arcosa, Inc.* 4.375%, 04/15/29 | 21,890 | |||||||||
200,000 | ARD Finance, SA* 6.500%, 06/30/27 7.250% PIK rate | 116,784 | |||||||||
34,000 | Beacon Roofing Supply, Inc.* 4.125%, 05/15/29 | 28,578 | |||||||||
23,000 | Bombardier, Inc.* 7.875%, 04/15/27 | 22,161 | |||||||||
44,000 | BWX Technologies, Inc.* 4.125%, 04/15/29 | 38,065 | |||||||||
48,000 | Cascades, Inc. / Cascades USA, Inc.* 5.375%, 01/15/28 | 43,621 | |||||||||
11,000 | Delta Air Lines, Inc. / SkyMiles IP, Ltd.* 4.750%, 10/20/28 | 10,339 | |||||||||
58,000 | Deluxe Corp.* 8.000%, 06/01/29 | 45,969 | |||||||||
33,000 | Eco Material Technologies, Inc.* 7.875%, 01/31/27 | 31,400 | |||||||||
68,000 | Emerald Debt Merger Sub, LLC* 6.625%, 12/15/30 | 64,781 | |||||||||
25,000 | EnerSys* 4.375%, 12/15/27 | 22,456 | |||||||||
25,000 | Graham Packaging Company, Inc.* 7.125%, 08/15/28 | 19,437 | |||||||||
30,000 | Graphic Packaging International, LLC* 4.750%, 07/15/27^ | 28,035 | |||||||||
20,000 | 3.500%, 03/01/29 | 16,799 | |||||||||
51,000 | Great Lakes Dredge & Dock Corp.*^ 5.250%, 06/01/29 | 41,783 | |||||||||
101,000 | H&E Equipment Services, Inc.* 3.875%, 12/15/28 | 85,769 | |||||||||
| PRINCIPAL AMOUNT | VALUE | ||||||||||
69,000 | Hawaiian Brand Intellectual Property, Ltd. / HawaiianMiles Loyalty, Ltd.* 5.750%, 01/20/26 | $ | 51,046 | ||||||||
65,000 | Herc Holdings, Inc.* 5.500%, 07/15/27 | 61,231 | |||||||||
50,000 | IEA Energy Services, LLC* 6.625%, 08/15/29 | 47,765 | |||||||||
34,000 | JELD-WEN, Inc.* 4.625%, 12/15/25 | 32,298 | |||||||||
25,000 | 4.875%, 12/15/27 | 21,347 | |||||||||
70,000 | Ken Garff Automotive, LLC* 4.875%, 09/15/28 | 59,650 | |||||||||
45,000 | Knife River Holding Company* 7.750%, 05/01/31 | 44,902 | |||||||||
21,000 | MasTec, Inc.* 4.500%, 08/15/28 | 18,465 | |||||||||
33,000 | Moog, Inc.* 4.250%, 12/15/27 | 29,965 | |||||||||
55,000 | Newfold Digital Holdings Group, Inc.*^ 6.000%, 02/15/29 | 36,362 | |||||||||
52,000 | Novelis Corp.* 4.750%, 01/30/30 | 44,333 | |||||||||
15,000 | OI European Group, BV* 4.750%, 02/15/30 | 12,772 | |||||||||
50,000 | Pactiv Evergreen Group Issuer, Inc. / Pactiv Evergreen Group Issuer, LLC*^ 4.000%, 10/15/27 | 44,021 | |||||||||
67,000 | Patrick Industries, Inc.* 4.750%, 05/01/29 | 55,081 | |||||||||
20,000 | QVC, Inc. 5.450%, 08/15/34 | 8,518 | |||||||||
35,000 | Sealed Air Corp.* 6.125%, 02/01/28 | 33,331 | |||||||||
11,000 | 5.000%, 04/15/29^ | 9,817 | |||||||||
40,000 | Sensata Technologies, Inc.* 3.750%, 02/15/31 | 32,074 | |||||||||
33,000 | Sinclair Television Group, Inc.* 4.125%, 12/01/30 | 20,771 | |||||||||
20,000 | 5.500%, 03/01/30 | 10,878 | |||||||||
50,000 | Standard Industries, Inc.* 5.000%, 02/15/27 | 46,314 | |||||||||
35,000 | Stericycle, Inc.* 3.875%, 01/15/29 | 29,906 | |||||||||
35,000 | STL Holding Company, LLC* 7.500%, 02/15/26 | 32,872 | |||||||||
97,000 | TransDigm, Inc. 6.250%, 03/15/26* | 94,926 | |||||||||
45,000 | 6.875%, 12/15/30* | 43,551 | |||||||||
35,000 | 6.750%, 08/15/28* | 34,063 | |||||||||
32,000 | 7.500%, 03/15/27 | 32,004 | |||||||||
45,000 | Tronox, Inc.* 4.625%, 03/15/29 | 35,375 | |||||||||
www.calamos.com
197
Global Total Return Fund Schedule of Investments October 31, 2023
| PRINCIPAL AMOUNT | VALUE | ||||||||||
18,995 | United Airlines Pass Through Trust Series 2019-2, Class B 3.500%, 11/01/29 | $ | 16,835 | ||||||||
44,000 | Vertiv Group Corp.* 4.125%, 11/15/28 | 38,507 | |||||||||
46,000 | Wabash National Corp.* 4.500%, 10/15/28 | 38,145 | |||||||||
35,000 | Waste Pro USA, Inc.* 5.500%, 02/15/26 | 32,289 | |||||||||
27,000 | Williams Scotsman, Inc.* 4.625%, 08/15/28 | 24,022 | |||||||||
2,073,802 | |||||||||||
Information Technology (0.8%) | |||||||||||
21,000 | Booz Allen Hamilton, Inc.* 4.000%, 07/01/29 | 18,548 | |||||||||
80,000 | Clarivate Science Holdings Corp.* 3.875%, 07/01/28 | 69,002 | |||||||||
39,000 | Clear Channel Worldwide Holdings, Inc.*^ 5.125%, 08/15/27 | 34,680 | |||||||||
23,000 | Coherent Corp.*^ 5.000%, 12/15/29 | 19,555 | |||||||||
60,000 | CommScope Technologies, LLC* 6.000%, 06/15/25 | 36,244 | |||||||||
40,000 | CommScope, Inc.* 4.750%, 09/01/29 | 27,325 | |||||||||
29,000 | Dell International, LLC / EMC Corp. 6.020%, 06/15/26 | 29,033 | |||||||||
22,000 | Dun & Bradstreet Corp.*^ 5.000%, 12/15/29 | 18,956 | |||||||||
26,000 | Fair Isaac Corp.* 4.000%, 06/15/28 | 23,196 | |||||||||
50,000 | KBR, Inc.* 4.750%, 09/30/28 | 44,092 | |||||||||
50,000 | MPH Acquisition Holdings, LLC* 5.750%, 11/01/28^ | 37,337 | |||||||||
20,000 | 5.500%, 09/01/28 | 16,728 | |||||||||
20,000 | NCL Corp., Ltd.* 8.125%, 01/15/29 | 19,567 | |||||||||
22,000 | NCR Voyix Corp.* 5.125%, 04/15/29 | 18,944 | |||||||||
34,000 | ON Semiconductor Corp.* 3.875%, 09/01/28 | 29,222 | |||||||||
39,000 | Open Text Corp.* 3.875%, 02/15/28 | 33,972 | |||||||||
20,000 | 6.900%, 12/01/27 | 19,962 | |||||||||
16,000 | 3.875%, 12/01/29 | 13,136 | |||||||||
16,000 | Open Text Holdings, Inc.*^ 4.125%, 12/01/31 | 12,614 | |||||||||
47,000 | Playtika Holding Corp.* 4.250%, 03/15/29 | 37,945 | |||||||||
60,000 | TTM Technologies, Inc.* 4.000%, 03/01/29 | 49,363 | |||||||||
| PRINCIPAL AMOUNT | VALUE | ||||||||||
30,000 | Twilio, Inc. 3.625%, 03/15/29 | $ | 25,037 | ||||||||
11,000 | 3.875%, 03/15/31^ | 8,805 | |||||||||
55,000 | Viavi Solutions, Inc.* 3.750%, 10/01/29 | 43,788 | |||||||||
50,000 | ZoomInfo Technologies, LLC / ZoomInfo Finance Corp.* 3.875%, 02/01/29 | 41,341 | |||||||||
728,392 | |||||||||||
Materials (0.6%) | |||||||||||
25,000 | ArcelorMittal, SA^ 7.000%, 10/15/39 | 23,778 | |||||||||
27,000 | ATI, Inc. 5.875%, 12/01/27 | 25,148 | |||||||||
12,000 | Carpenter Technology Corp. 7.625%, 03/15/30 | 11,922 | |||||||||
35,000 | Chemours Company* 4.625%, 11/15/29 | 27,086 | |||||||||
65,000 | Clearwater Paper Corp.* 4.750%, 08/15/28 | 57,441 | |||||||||
34,000 | Cleveland-Cliffs, Inc.* 6.750%, 04/15/30 | 31,589 | |||||||||
22,000 | Commercial Metals Company 4.125%, 01/15/30 | 18,620 | |||||||||
11,000 | 4.375%, 03/15/32 | 8,889 | |||||||||
23,000 | HB Fuller Company 4.250%, 10/15/28 | 19,963 | |||||||||
40,000 | JW Aluminum Continuous Cast Company* 10.250%, 06/01/26 | 39,901 | |||||||||
50,000 | Kaiser Aluminum Corp.* 4.625%, 03/01/28 | 41,794 | |||||||||
5,000 | 4.500%, 06/01/31 | 3,698 | |||||||||
10,000 | LSF11 A5 HoldCo, LLC* 6.625%, 10/15/29 | 8,205 | |||||||||
58,000 | Mercer International, Inc. 5.125%, 02/01/29 | 45,555 | |||||||||
20,000 | 12.875%, 10/01/28* | 20,225 | |||||||||
35,000 | Owens-Brockway Glass Container, Inc.* 7.250%, 05/15/31 | 32,073 | |||||||||
25,000 | 6.625%, 05/13/27^ | 23,822 | |||||||||
56,000 | Silgan Holdings, Inc. 4.125%, 02/01/28 | 49,949 | |||||||||
21,000 | Trinseo Materials Operating SCA / Trinseo Materials Finance, Inc.* 5.125%, 04/01/29 | 8,998 | |||||||||
498,656 | |||||||||||
Other (0.1%) | |||||||||||
25,000 | Gen Digital, Inc.* 7.125%, 09/30/30^ | 24,370 | |||||||||
25,000 | 6.750%, 09/30/27 | 24,378 | |||||||||
48,748 | |||||||||||
CALAMOS CLOSED-END FAMILY OF FUNDS ANNUAL REPORT
198
Global Total Return Fund Schedule of Investments October 31, 2023
| PRINCIPAL AMOUNT | VALUE | ||||||||||
Real Estate (0.1%) | |||||||||||
34,000 | EPR Properties 3.750%, 08/15/29 | $ | 26,870 | ||||||||
38,000 | Forestar Group, Inc.* 5.000%, 03/01/28 | 33,518 | |||||||||
21,000 | 3.850%, 05/15/26 | 18,846 | |||||||||
50,000 | MIWD Holdco II, LLC / MIWD Finance Corp.* 5.500%, 02/01/30 | 39,719 | |||||||||
20,000 | Service Properties Trust 5.250%, 02/15/26 | 17,954 | |||||||||
136,907 | |||||||||||
Special Purpose Acquisition Companies (0.1%) | |||||||||||
45,000 | Fertitta Entertainment, LLC / Fertitta Entertainment Finance Company, Inc.* 6.750%, 01/15/30 | 35,806 | |||||||||
23,000 | 4.625%, 01/15/29 | 19,419 | |||||||||
50,000 | W.R. Grace Holding, LLC* 7.375%, 03/01/31 | 46,428 | |||||||||
101,653 | |||||||||||
Utilities (0.0%) | |||||||||||
16,000 | PPL Capital Funding, Inc.‡ 8.317%, 03/30/67 3 mo. USD LIBOR + 2.67% | 14,497 | |||||||||
20,000 | Vistra Corp.*‡ 7.000%, 11/01/67 5 year CMT + 5.74% | 18,296 | |||||||||
10,000 | 8.000%, 11/01/67 5 year CMT + 6.93% | 9,514 | |||||||||
42,307 | |||||||||||
TOTAL CORPORATE BONDS (Cost $14,388,895) | 13,697,472 | ||||||||||
CONVERTIBLE BONDS (32.2%) | |||||||||||
Communication Services (2.2%) | |||||||||||
| 34,000 | Cable One, Inc.µ 0.000%, 03/15/26 | 27,836 | |||||||||
580,000 | Liberty Media Corp.-Liberty Formula One 2.250%, 08/15/27 | 578,103 | |||||||||
1,484,000 | Sea, Ltd. 2.375%, 12/01/25 | 1,405,496 | |||||||||
2,011,435 | |||||||||||
Consumer Discretionary (8.5%) | |||||||||||
145,000 | Burlington Stores, Inc.µ 2.250%, 04/15/25 | 140,174 | |||||||||
63,000 | DISH Network Corp. 2.375%, 03/15/24µ | 60,367 | |||||||||
63,000 | 0.000%, 12/15/25 | 38,653 | |||||||||
800,000 | AUD | Flight Centre Travel Group, Ltd. 2.500%, 11/17/27 | 556,310 | ||||||||
| PRINCIPAL AMOUNT | VALUE | ||||||||||
3,160,000 | Ford Motor Company 0.000%, 03/15/26 | $ | 2,884,480 | ||||||||
730,000 | IMAX Corp. 0.500%, 04/01/26 | 663,643 | |||||||||
901,000 | MakeMyTrip, Ltd. 0.000%, 02/15/28 | 1,026,221 | |||||||||
685,000 | Marriott Vacations Worldwide Corp. 0.000%, 01/15/26 | 590,491 | |||||||||
500,000 | GBP | WH Smith, PLCµ 1.625%, 05/07/26 | 526,593 | ||||||||
1,134,000 | Wynn Macau, Ltd.* 4.500%, 03/07/29 | 1,156,816 | |||||||||
7,643,748 | |||||||||||
Consumer Staples (1.5%) | |||||||||||
700,000 | EUR | Fomento Economico Mexicano SAB de CV 2.625%, 02/24/26 | 725,361 | ||||||||
915,000 | CAD | Premium Brands Holdings Corp. 4.200%, 09/30/27 | 582,406 | ||||||||
1,307,767 | |||||||||||
Energy (2.3%) | |||||||||||
700,000 | EUR | Eni S.p.A 2.950%, 09/14/30 | 757,172 | ||||||||
400,000 | Nabors Industries, Inc.* 1.750%, 06/15/29 | 299,728 | |||||||||
900,000 | EUR | Saipem S.p.A 2.875%, 09/11/29 | 975,926 | ||||||||
2,032,826 | |||||||||||
Financials (1.6%) | |||||||||||
12,000,000 | HKD | Citigroup Global Markets Funding Luxembourg SCAµ 0.000%, 07/25/24 | 1,465,763 | ||||||||
Health Care (1.3%) | |||||||||||
437,000 | BioMarin Pharmaceutical, Inc. 0.599%, 08/01/24 | 421,404 | |||||||||
562,000 | Dexcom, Inc.µ 0.250%, 11/15/25 | 533,490 | |||||||||
204,000 | Shockwave Medical, Inc.* 1.000%, 08/15/28 | 197,800 | |||||||||
1,152,694 | |||||||||||
Industrials (3.1%) | |||||||||||
465,000 | Axon Enterprise, Inc.* 0.500%, 12/15/27 | 501,647 | |||||||||
700,000 | EUR | Prysmian S.p.A 0.000%, 02/02/26 | 761,113 | ||||||||
600,000 | EUR | Rheinmetall AG 1.875%, 02/07/28 | 676,335 | ||||||||
500,000 | EUR | SPIE, SA 2.000%, 01/17/28 | 511,422 | ||||||||
329,000 | Tetra Tech, Inc.* 2.250%, 08/15/28 | 318,699 | |||||||||
2,769,216 | |||||||||||
www.calamos.com
199
Global Total Return Fund Schedule of Investments October 31, 2023
| PRINCIPAL AMOUNT | VALUE | ||||||||||
Information Technology (7.5%) | |||||||||||
730,000 | Akamai Technologies, Inc.* 1.125%, 02/15/29 | $ | 718,692 | ||||||||
300,000 | EUR | Amadeus IT Group, SA 1.500%, 04/09/25 | 349,757 | ||||||||
835,000 | Block, Inc.µ 0.125%, 03/01/25 | 770,655 | |||||||||
580,000 | CyberArk Software, Ltd. 0.000%, 11/15/24 | 663,984 | |||||||||
881,000 | Datadog, Inc. 0.125%, 06/15/25 | 970,193 | |||||||||
7,000,000 | HKD | Kingsoft Corp, Ltd. 0.625%, 04/29/25 | 925,840 | ||||||||
120,000 | Rapid7, Inc.* 1.250%, 03/15/29 | 116,090 | |||||||||
100,000,000 | JPY | Rohm Company, Ltd. 0.000%, 12/05/24 | 665,050 | ||||||||
1,000,000 | SK Hynix, Inc. 1.750%, 04/11/30 | 1,209,960 | |||||||||
334,000 | Workiva, Inc.* 1.250%, 08/15/28 | 303,379 | |||||||||
6,693,600 | |||||||||||
Materials (2.1%) | |||||||||||
1,000,000 | Glencore Funding, LLC 0.000%, 03/27/25 | 1,048,910 | |||||||||
600,000 | LG Chem, Ltd. 1.250%, 07/18/28 | 563,946 | |||||||||
476,000 | Lithium Americas Corp. 1.750%, 01/15/27 | 321,348 | |||||||||
1,934,204 | |||||||||||
Other (0.7%) | |||||||||||
930,000 | EUR | Edenred 0.000%, 09/06/24 | 591,138 | ||||||||
20,000 | Multiplan Corp.* 6.000%, 10/15/27 | 13,301 | |||||||||
604,439 | |||||||||||
Real Estate (1.0%) | |||||||||||
800,000 | EUR | ANLLIAN Capital, Ltd. 0.000%, 02/05/25 | 907,071 | ||||||||
Utilities (0.4%) | |||||||||||
350,000 | CMS Energy Corp.* 3.375%, 05/01/28 | 331,394 | |||||||||
TOTAL CONVERTIBLE BONDS (Cost $33,755,880) | 28,854,157 | ||||||||||
BANK LOANS (10.8%)¡ | |||||||||||
Airlines (0.0%) | |||||||||||
33,750 | Mileage Plus Holdings, LLC‡ 10.798%, 06/21/27 3 mo. SOFR + 5.25% | 34,837 | |||||||||
| PRINCIPAL AMOUNT | VALUE | ||||||||||
Communication Services (1.8%) | |||||||||||
250,000 | APi Group DE, Inc.! 0.000%, 01/03/29 | $ | 250,687 | ||||||||
358,130 | Charter Communications Operating LLC‡ 7.133%, 02/01/27 3 mo. SOFR + 1.75% | 357,661 | |||||||||
935 | Charter Communications Operating, LLC‡ 7.074%, 02/01/27 1 mo. SOFR + 1.75% | 934 | |||||||||
43,000 | Entercom Media Corp.‡ 8.145%, 11/18/24 3 mo. SOFR + 2.50% | 18,913 | |||||||||
249,375 | Go Daddy Operating Company, LLC‡ 7.824%, 11/09/29 1 mo. SOFR + 2.50% | 249,885 | |||||||||
250,000 | Match Group, Inc.‡ 7.298%, 02/13/27 3 mo. SOFR + 1.75% | 249,270 | |||||||||
250,000 | Nexstar Broadcasting, Inc.‡ 7.939%, 09/18/26 1 mo. SOFR + 2.50% | 250,225 | |||||||||
250,000 | Virgin Media Bristol, LLC‡ 7.949%, 01/31/28 1 mo. SOFR + 2.50% | 243,283 | |||||||||
1,620,858 | |||||||||||
Consumer Discretionary (2.0%) | |||||||||||
250,000 | Adient US LLC‡ 8.689%, 04/10/28 1 mo. SOFR + 3.25% | 250,234 | |||||||||
249,375 | Aramark Services, Inc.‡ 7.939%, 06/22/30 1 mo. SOFR + 2.50% | 249,375 | |||||||||
249,375 | Carnival Corp.‡ 8.336%, 08/08/27 1 mo. SOFR + 3.00% | 245,323 | |||||||||
299,233 | KFC Holding Co.‡ 7.199%, 03/15/28 1 mo. SOFR + 1.75% | 299,388 | |||||||||
249,361 | Murphy USA, Inc.‡ 7.179%, 01/31/28 1 mo. SOFR + 1.75% | 250,374 | |||||||||
249,369 | PENN Entertainment, Inc.‡ 8.170%, 05/03/29 1 mo. SOFR + 2.75% | 249,335 | |||||||||
249,346 | Station Casinos, LLC! 0.000%, 02/08/27 | 248,043 | |||||||||
1,792,072 | |||||||||||
Financials (0.9%) | |||||||||||
10,000 | Advisor Group, Inc.‡ 9.824%, 08/17/28 1 mo. SOFR + 4.50% | 9,967 | |||||||||
299,250 | Avolon TLB Borrower 1 LLC‡ 7.839%, 06/22/28 1 mo. SOFR + 2.50% | 299,668 | |||||||||
CALAMOS CLOSED-END FAMILY OF FUNDS ANNUAL REPORT
200
Global Total Return Fund Schedule of Investments October 31, 2023
| PRINCIPAL AMOUNT | VALUE | ||||||||||
249,364 | Castlelake Aviation, Ltd.‡ 8.421%, 10/22/26 3 mo. SOFR + 2.75% | $ | 249,208 | ||||||||
249,292 | Jazz Financing Lux Sarl‡ 8.939%, 05/05/28 1 mo. SOFR + 3.50% | 249,499 | |||||||||
808,342 | |||||||||||
Health Care (1.9%) | |||||||||||
182,170 | Avantor Funding, Inc.‡ 7.674%, 11/08/27 1 mo. SOFR + 2.25% | 182,322 | |||||||||
299,214 | DaVita, Inc.‡ 7.189%, 08/12/26 1 mo. SOFR + 1.75% | 296,149 | |||||||||
249,308 | Elanco Animal Health, Inc.‡ 7.165%, 08/01/27 1 mo. SOFR + 1.75% | 243,933 | |||||||||
200,056 | ICON Luxembourg Sarl! 0.000%, 07/03/28 | 200,403 | |||||||||
250,000 | IQVIA, Inc.‡ 7.402%, 06/11/25 3 mo. SOFR + 1.75% | 250,860 | |||||||||
250,000 | Organon & Company‡ 8.451%, 06/02/28 1 mo. SOFR + 3.00% | 249,812 | |||||||||
249,369 | Perrigo Investments, LLC‡ 7.674%, 04/20/29 1 mo. SOFR + 2.25% | 248,621 | |||||||||
49,844 | PRA Health Sciences, Inc.! 0.000%, 07/03/28 | 49,930 | |||||||||
1,722,030 | |||||||||||
Industrials (2.5%) | |||||||||||
249,362 | Beacon Roofing Supply, Inc.‡ 7.689%, 05/19/28 1 mo. SOFR + 2.25% | 249,350 | |||||||||
290,597 | Berry Global, Inc.‡ 7.201%, 07/01/29 1 mo. SOFR + 1.75% | 288,455 | |||||||||
250,000 | ChampionX Corp.‡ 8.177%, 06/07/29 1 mo. SOFR + 2.75% | 251,133 | |||||||||
250,000 | Emrld Borrower, LP‡ 8.380%, 05/31/30 3 mo. SOFR + 3.00% | 249,765 | |||||||||
249,373 | H.B. Fuller Company‡ 7.574%, 02/15/30 1 mo. SOFR + 2.25% | 250,335 | |||||||||
249,362 | Jeld-Wen, Inc.‡ 7.689%, 07/28/28 1 mo. SOFR + 2.25% | 249,518 | |||||||||
249,369 | Scientific Games International, Inc.‡ 8.435%, 04/14/29 1 mo. SOFR + 3.00% | 249,447 | |||||||||
| PRINCIPAL AMOUNT | VALUE | ||||||||||
249,373 | TransDigm, Inc.‡ 8.640%, 08/24/28 3 mo. SOFR + 3.25% | $ | 249,373 | ||||||||
199,488 | United Airlines, Inc.‡ 9.189%, 04/21/28 1 mo. SOFR + 3.75% | 199,364 | |||||||||
2,236,740 | |||||||||||
Information Technology (1.1%) | |||||||||||
45,845 | Banff Merger Sub, Inc.‡ 9.189%, 10/02/25 1 mo. SOFR + 3.75% | 45,854 | |||||||||
249,318 | II-VI, Inc.‡ 8.189%, 07/02/29 1 mo. SOFR + 2.75% | 249,201 | |||||||||
244,115 | Open Text Corp.‡ 8.174%, 01/31/30 1 mo. SOFR + 2.75% | 244,201 | |||||||||
149,915 | SS&C Technologies, Inc.‡ 7.674%, 03/22/29 1 mo. SOFR + 2.25% | 149,915 | |||||||||
94,522 | SS&C Technologies, Inc.‡ 7.674%, 03/22/29 1 mo. SOFR + 2.25% | 94,522 | |||||||||
159,600 | TTM Technologies, Inc.‡ 8.065%, 05/30/30 1 mo. SOFR + 2.75% | 159,700 | |||||||||
943,393 | |||||||||||
Materials (0.6%) | |||||||||||
282,702 | Axalta Coating Systems U.S. Holdings, Inc.‡ 7.890%, 12/20/29 3 mo. SOFR + 2.50% | 283,427 | |||||||||
245,000 | Chemours Company‡ 8.824%, 08/18/28 1 mo. SOFR + 2.50% | 238,875 | |||||||||
522,302 | |||||||||||
TOTAL BANK LOANS (Cost $9,741,273) | 9,680,574 | ||||||||||
| NUMBER OF SHARES | VALUE | ||||||||||
WARRANTS (0.0%)# | |||||||||||
Energy (0.0%) | |||||||||||
2,607 | Mcdermott International, Ltd.& 06/30/27, Strike $15.98 | 1 | |||||||||
2,347 | Mcdermott International, Ltd. 06/30/27, Strike $12.33 | — | |||||||||
TOTAL WARRANTS (Cost $1,002) | 1 | ||||||||||
www.calamos.com
201
Global Total Return Fund Schedule of Investments October 31, 2023
| NUMBER OF SHARES | VALUE | ||||||||||
COMMON STOCKS (86.3%) | |||||||||||
Communication Services (5.4%) | |||||||||||
13,500 | Alphabet, Inc. - Class Aµ# | $ | 1,675,080 | ||||||||
925 | Altice USA, Inc. - Class A# | 2,673 | |||||||||
1,050 | Baidu, Inc. (ADR)µ# | 110,250 | |||||||||
310 | Cumulus Media, Inc. - Class Aµ | 1,398 | |||||||||
16,800 | EUR | Deutsche Telekom, AG | 364,622 | ||||||||
1,250 | Meta Platforms, Inc. - Class Aµ# | 376,587 | |||||||||
4,900 | HKD | NetEase, Inc. | 104,868 | ||||||||
168 | EUR | Scout24, SE*µ | 10,335 | ||||||||
27,000 | HKD | Tencent Holdings, Ltd. | 999,236 | ||||||||
15,060 | Tencent Holdings, Ltd. (ADR)^ | 557,371 | |||||||||
7,610 | Walt Disney Companyµ#~ | 620,900 | |||||||||
4,823,320 | |||||||||||
Consumer Discretionary (11.1%) | |||||||||||
37,500 | HKD | Alibaba Group Holding, Ltd.# | 386,065 | ||||||||
1,745 | Alibaba Group Holding, Ltd. (ADR)^# | 144,032 | |||||||||
5,360 | PLN | Allegro.eu, SA*# | 38,449 | ||||||||
45,850 | MXN | Alsea, SAB de CV# | 152,181 | ||||||||
25,200 | Amazon.com, Inc.^µ#~ | 3,353,868 | |||||||||
1,605 | INR | Amber Enterprises India, Ltd.# | 56,468 | ||||||||
83,000 | AED | Americana Restaurants International, PLC | 83,610 | ||||||||
9,604 | Aptiv, PLCµ# | 837,469 | |||||||||
975 | BRL | Arezzo Industria e Comercio, SA | 11,292 | ||||||||
138,100 | PHP | Bloomberry Resorts Corp.# | 22,173 | ||||||||
3,400 | CNY | BYD Company, Ltd. - Class A | 110,940 | ||||||||
5,700 | CNY | China Tourism Group Duty Free Corp., Ltd. - Class A | 73,722 | ||||||||
175 | Chipotle Mexican Grill, Inc.µ# | 339,885 | |||||||||
27,165 | BRL | Cyrela Brazil Realty, SA Empreendimentos e Participacoes | 96,930 | ||||||||
3,640 | INR | Dixon Technologies India, Ltd. | 223,415 | ||||||||
790 | KRW | Hotel Shilla Company, Ltd. | 36,554 | ||||||||
25,621 | INR | Indian Hotels Company, Ltd. | 118,158 | ||||||||
45,700 | HKD | JD.com, Inc. - Class A | 580,991 | ||||||||
48,000 | HKD | Jiumaojiu International Holdings, Ltd.* | 52,230 | ||||||||
73,300 | INR | Kalyan Jewellers India, Ltd. | 254,709 | ||||||||
3,025 | KRW | Kia Corp. | 172,823 | ||||||||
33,500 | HKD | Li Ning Company, Ltd.µ | 102,657 | ||||||||
1,110 | EUR | LVMH Moet Hennessy Louis Vuitton, SEµ | 794,683 | ||||||||
10,350 | INR | Mahindra & Mahindra, Ltd. | 182,058 | ||||||||
760 | MakeMyTrip, Ltd.µ# | 29,435 | |||||||||
1,355,400 | IDR | Map Aktif Adiperkasa PT | 63,568 | ||||||||
4,780 | HKD | Meituan - Class B*# | 67,757 | ||||||||
340 | MercadoLibre, Inc.µ# | 421,852 | |||||||||
70,800 | IDR | Mitra Adiperkasa Tbk PT | 7,735 | ||||||||
11,570 | NIO, Inc. (ADR)# | 84,461 | |||||||||
| NUMBER OF SHARES | VALUE | ||||||||||
11,200 | HKD | Prada S.p.A.µ | $ | 67,469 | |||||||
4,871 | EUR | Prosus, NVµ# | 136,220 | ||||||||
6,900 | HKD | Samsonite International, SA*µ# | 21,370 | ||||||||
64,000 | HKD | Sands China, Ltd.µ# | 172,291 | ||||||||
23,500 | INR | Tata Motors, Ltd. | 177,736 | ||||||||
900 | JPY | Toyota Boshoku Corp. | 15,652 | ||||||||
1,405 | INR | TVS Motor Company, Ltd. | 26,869 | ||||||||
14,000 | HKD | Wynn Macau, Ltd.µ# | 12,398 | ||||||||
3,250 | HKD | Yum China Holdings, Inc.µ | 170,307 | ||||||||
23,000 | HKD | Zhongsheng Group Holdings, Ltd.µ | 53,114 | ||||||||
126,020 | INR | Zomato, Ltd.# | 158,862 | ||||||||
9,912,458 | |||||||||||
Consumer Staples (4.9%) | |||||||||||
10,300 | CHF | Aryzta, AG# | 18,878 | ||||||||
20,850 | GBP | British American Tobacco, PLC | 622,840 | ||||||||
9,400 | Coca-Cola Company | 531,006 | |||||||||
1,500 | Constellation Brands, Inc. - Class Aµ | 351,225 | |||||||||
1,360 | Costco Wholesale Corp.µ | 751,318 | |||||||||
1,155 | PLN | Dino Polska, SA*# | 109,442 | ||||||||
17,130 | MXN | Fomento Economico Mexicano, SAB de CV | 193,676 | ||||||||
36,700 | INR | ITC, Ltd. | 188,937 | ||||||||
700 | JPY | Kobe Bussan Company, Ltd.^ | 17,324 | ||||||||
700 | CNY | Kweichow Moutai Company, Ltd. - Class A | 161,213 | ||||||||
5,900 | CHF | Nestle, SAµ | 636,248 | ||||||||
24,592 | BRL | Raia Drogasil, SA | 125,844 | ||||||||
1,000 | JPY | Rohto Pharmaceutical Company, Ltd. | 23,331 | ||||||||
18,000 | JPY | Seven & i Holdings Company, Ltd. | 659,497 | ||||||||
26,000 | HKD | Smoore International Holdings, Ltd.* | 20,037 | ||||||||
700 | JPY | Yamazaki Baking Company, Ltd. | 14,801 | ||||||||
4,425,617 | |||||||||||
Energy (6.1%) | |||||||||||
2,650 | CAD | ARC Resources, Ltd.^µ | 42,633 | ||||||||
73,850 | GBP | BP, PLC | 450,929 | ||||||||
21,400 | CAD | Canadian Natural Resources, Ltd.µ | 1,358,921 | ||||||||
479 | Chaparral Energy, Inc. - Class A&# | 21,316 | |||||||||
131 | Chesapeake Energy Corp.^ | 11,276 | |||||||||
8,810 | Chevron Corp.µ | 1,283,881 | |||||||||
3,045 | Energy Transfer, LP | 40,042 | |||||||||
1,815 | Enterprise Products Partners, LP | 47,263 | |||||||||
341 | EP Energy Corp.&# | 895 | |||||||||
11,400 | Helmerich & Payne, Inc.^µ | 451,098 | |||||||||
390 | ONEOK, Inc.µ | 25,428 | |||||||||
46,000 | THB | PTT Exploration & Production, PCL | 210,089 | ||||||||
8,910 | INR | Reliance Industries, Ltd. | 245,123 | ||||||||
15,560 | EUR | Saipem S.p.A# | 23,711 | ||||||||
CALAMOS CLOSED-END FAMILY OF FUNDS ANNUAL REPORT
202
Global Total Return Fund Schedule of Investments October 31, 2023
| NUMBER OF SHARES | VALUE | ||||||||||
31,700 | EUR | Shell, PLC | $ | 1,035,564 | |||||||
8,960 | TechnipFMC, PLCµ# | 192,819 | |||||||||
5,440,988 | |||||||||||
Financials (11.3%) | |||||||||||
116,000 | HKD | AIA Group, Ltd.µ | 1,007,321 | ||||||||
3,000 | Aon, PLC - Class Aµ | 928,200 | |||||||||
49,400 | BRL | B3, SA - Brasil Bolsa Balcao | 108,760 | ||||||||
19,180 | BRL | Banco BTG Pactual, SA | 112,605 | ||||||||
413,550 | IDR | Bank Central Asia, Tbk PT | 227,833 | ||||||||
2,048,740 | IDR | Bank Mandiri Persero, Tbk PT | 731,917 | ||||||||
53,325 | Bank of America Corp.µ~ | 1,404,580 | |||||||||
2,153 | EUR | Bank of Ireland Group, PLCµ | 19,295 | ||||||||
6,300 | JPY | Concordia Financial Group, Ltd. | 29,272 | ||||||||
29,304 | AED | First Abu Dhabi Bank, PJSC | 101,176 | ||||||||
5,095 | KRW | Hana Financial Group, Inc. | 148,146 | ||||||||
61,838 | INR | HDFC Bank, Ltd. | 1,096,171 | ||||||||
13,320 | ICICI Bank, Ltd. (ADR) | 295,571 | |||||||||
35,025 | Itau Unibanco Holding, SA (ADR)^ | 185,983 | |||||||||
1,200 | JPY | Japan Exchange Group, Inc. | 23,730 | ||||||||
3,425 | JPMorgan Chase & Company | 476,281 | |||||||||
42,800 | THB | Kasikornbank PCL | 156,574 | ||||||||
1,170,000 | GBP | Lloyds Banking Group, PLCµ | 569,438 | ||||||||
11,725 | Morgan Stanleyµ | 830,364 | |||||||||
19,100 | EUR | National Bank of Greece, SA# | 109,392 | ||||||||
48,500 | HKD | Ping An Insurance Group Company of China, Ltd. - Class Hµ | 246,015 | ||||||||
5,180 | AUD | Steadfast Group, Ltd.µ | 17,813 | ||||||||
13,950 | UBS Group, AG^# | 327,267 | |||||||||
2,406 | Visa, Inc. - Class Aµ | 565,651 | |||||||||
10,945 | Wells Fargo & Companyµ | 435,283 | |||||||||
10,154,638 | |||||||||||
Health Care (10.2%) | |||||||||||
2,100 | INR | Apollo Hospitals Enterprise, Ltd. | 122,154 | ||||||||
6,125 | GBP | AstraZeneca, PLCµ | 766,872 | ||||||||
3,900 | Danaher Corp.µ | 748,878 | |||||||||
1,250 | KRW | Dentium Company, Ltd. | 101,472 | ||||||||
3,900 | Eli Lilly & Companyµ | 2,160,327 | |||||||||
1,005 | GBP | Ergomed, PLC# | 16,370 | ||||||||
6,774 | EUR | Gerresheimer, AGµ | 631,833 | ||||||||
1,310 | Humana, Inc.µ | 686,034 | |||||||||
4,510 | BRL | Hypera, SA | 27,095 | ||||||||
11,130 | KRW | Jeisys Medical, Inc. | 86,885 | ||||||||
28,100 | Novo Nordisk, A/S (ADR) | 2,713,617 | |||||||||
1,605 | UnitedHealth Group, Inc.µ | 859,574 | |||||||||
29,000 | HKD | Wuxi Biologics Cayman, Inc.*# | 180,314 | ||||||||
75 | CHF | Ypsomed Holding, AG | 20,670 | ||||||||
9,122,095 | |||||||||||
| NUMBER OF SHARES | VALUE | ||||||||||
Industrials (11.6%) | |||||||||||
5,700 | EUR | Airbus, SEµ | $ | 764,234 | |||||||
4,620 | GBP | Ashtead Technology Holdings, PLC^ | 27,005 | ||||||||
1,000 | JPY | BayCurrent Consulting, Inc. | 25,107 | ||||||||
7,450 | CAD | Canadian Pacific Kansas City, Ltd. | 528,954 | ||||||||
2,340 | CNY | Contemporary Amperex Technology Company, Ltd. - Class A | 59,417 | ||||||||
615 | EUR | DO & CO, AGµ | 71,841 | ||||||||
450 | JPY | Ebara Corp.µ | 19,928 | ||||||||
12,120 | INR | Hindustan Aeronautics, Ltd. | 265,527 | ||||||||
8,600 | JPY | Hitachi, Ltd.µ | 545,125 | ||||||||
4,200 | JPY | INFRONEER Holdings, Inc. | 44,305 | ||||||||
18,000 | PHP | International Container Terminal Services, Inc. | 63,774 | ||||||||
500 | JPY | Japan Airport Terminal Company, Ltd.µ | 21,989 | ||||||||
1,300 | JPY | Japan Elevator Service Holdings Company, Ltd. | 17,228 | ||||||||
800 | JPY | Keisei Electric Railway Company, Ltd.µ | 30,136 | ||||||||
20,400 | JPY | Komatsu, Ltd. | 468,718 | ||||||||
500 | JPY | Kyudenko Corp. | 14,935 | ||||||||
6,854 | INR | Larsen & Toubro, Ltd. | 240,700 | ||||||||
1,590 | EUR | Leonardo S.p.Aµ | 24,029 | ||||||||
92,520 | GBP | Melrose Industries, PLC | 526,788 | ||||||||
5,020 | SEK | Munters Group, AB* | 61,288 | ||||||||
8,700 | CNY | Ningbo Orient Wires & Cables Company, Ltd. - Class A | 50,090 | ||||||||
9,050 | Quanta Services, Inc.µ | 1,512,436 | |||||||||
430,000 | GBP | Rolls-Royce Holdings, PLCµ# | 1,131,856 | ||||||||
45,010 | BRL | Rumo, SA | 199,171 | ||||||||
44,100 | CNY | Sany Heavy Industry Company, Ltd. - Class A | 87,196 | ||||||||
6,850 | EUR | Schneider Electric, SEµ | 1,053,922 | ||||||||
14,700 | CNY | Shanghai International Airport Company, Ltd. - Class A# | 74,781 | ||||||||
4,555 | INR | Siemens, Ltd. | 182,797 | ||||||||
1,590 | JPY | Sojitz Corp.µ | 33,017 | ||||||||
803 | CAD | Stantec, Inc.µ | 49,132 | ||||||||
16,450 | INR | Titagarh Rail System, Ltd. | 150,473 | ||||||||
16,500 | Vertiv Holdings Companyµ | 647,955 | |||||||||
5,400 | EUR | Vinci, SAµ | 597,102 | ||||||||
4,950 | Waste Management, Inc.µ | 813,433 | |||||||||
10,404,389 | |||||||||||
Information Technology (22.8%) | |||||||||||
2,000 | Accenture, PLC - Class Aµ | 594,180 | |||||||||
13,270 | TWD | Accton Technology Corp. | 205,609 | ||||||||
5,200 | JPY | Advantest Corp. | 133,945 | ||||||||
3,755 | TWD | Alchip Technologies, Ltd. | 307,971 | ||||||||
11,495 | Apple, Inc.µ | 1,963,001 | |||||||||
www.calamos.com
203
Global Total Return Fund Schedule of Investments October 31, 2023
| NUMBER OF SHARES | VALUE | ||||||||||
3,710 | ASML Holding, NV (ADR)µ | $ | 2,221,585 | ||||||||
322 | EUR | BE Semiconductor Industries, NV | 33,262 | ||||||||
10,000 | TWD | E Ink Holdings, Inc. | 52,031 | ||||||||
108 | Fabrinetµ# | 16,740 | |||||||||
12,700 | CNY | Foxconn Industrial Internet Company, Ltd. - Class A | 25,588 | ||||||||
640 | KRW | HPSP Company, Ltd. | 14,846 | ||||||||
395 | JPY | Ibiden Company, Ltd.µ | 16,841 | ||||||||
4,100 | CNY | Iflytek Company, Ltd. - Class A | 25,574 | ||||||||
3,000 | JPY | Keyence Corp.µ | 1,161,355 | ||||||||
73,000 | HKD | Kingdee International Software Group Company, Ltd.µ# | 96,861 | ||||||||
8,900 | KRW | Koh Young Technology, Inc. | 72,935 | ||||||||
24,220 | INR | KPIT Technologies, Ltd. | 356,495 | ||||||||
5,000 | TWD | MediaTek, Inc. | 130,497 | ||||||||
8,780 | Microsoft Corp.^µ | 2,968,606 | |||||||||
7,500 | NVIDIA Corp.µ†† | 3,058,500 | |||||||||
13,200 | Oracle Corp.µ | 1,364,880 | |||||||||
2,000 | GBP | Sage Group, PLCµ | 23,628 | ||||||||
5,480 | KRW | Samsung Electronics Company, Ltd. | 272,766 | ||||||||
400 | JPY | SCREEN Holdings Company, Ltd.µ | 18,597 | ||||||||
2,700 | JPY | SHIFT, Inc.^# | 489,887 | ||||||||
3,010 | KRW | SK Hynix, Inc. | 261,395 | ||||||||
203,000 | TWD | Taiwan Semiconductor Manufacturing Company, Ltd. | 3,315,499 | ||||||||
6,890 | Taiwan Semiconductor Manufacturing Company, Ltd. (ADR) | 594,676 | |||||||||
16,300 | BRL | TOTVS, SA | 81,827 | ||||||||
16,000 | TWD | Unimicron Technology Corp. | 71,359 | ||||||||
15,520 | Unity Software, Inc.µ# | 393,742 | |||||||||
24,000 | CNY | Venustech Group, Inc. - Class A | 85,777 | ||||||||
1,900 | CNY | Zhongji Innolight Company, Ltd. - Class A | 22,889 | ||||||||
20,453,344 | |||||||||||
Materials (1.5%) | |||||||||||
640 | CAD | ERO Copper Corp.µ# | 8,686 | ||||||||
55,150 | AED | Fertiglobe, PLC | 48,225 | ||||||||
15,350 | Freeport-McMoRan, Inc. | 518,523 | |||||||||
950 | Linde, PLC | 363,052 | |||||||||
5,575 | ZAR | Sasol, Ltd. | 70,466 | ||||||||
955 | EUR | SOL S.p.A^ | 27,483 | ||||||||
5,250 | Vale, SA (ADR) | 71,977 | |||||||||
158,000 | HKD | Zijin Mining Group Company, Ltd. - Class Hµ | 244,412 | ||||||||
1,352,824 | |||||||||||
Real Estate (0.8%) | |||||||||||
179,500 | PHP | Ayala Land, Inc. | 88,323 | ||||||||
135,770 | MXN | Corp. Inmobiliaria Vesta SAB de CV | 425,783 | ||||||||
| NUMBER OF SHARES | VALUE | ||||||||||
22,080 | INR | DLF, Ltd. | $ | 149,313 | |||||||
6,070 | INR | Macrotech Developers, Ltd.* | 57,358 | ||||||||
4,900 | JPY | Mirarth Holdings, Inc. | 14,284 | ||||||||
135 | EUR | VGP, NV | 10,990 | ||||||||
746,051 | |||||||||||
Special Purpose Acquisition Company (0.0%) | |||||||||||
518 | Intelsat Emergence, SA&# | 12,302 | |||||||||
Utilities (0.6%) | |||||||||||
6,836 | NextEra Energy, Inc.µ | 398,539 | |||||||||
1,300 | Veralto Corp.# | 89,700 | |||||||||
488,239 | |||||||||||
TOTAL COMMON STOCKS (Cost $92,865,808) | 77,336,265 | ||||||||||
PREFERRED STOCKS (0.4%) | |||||||||||
Communication Services (0.0%) | |||||||||||
530 | United States Cellular Corp.µ 5.500%, 06/01/70 | 7,749 | |||||||||
505 | 5.500%, 03/01/70 | 7,504 | |||||||||
15,253 | |||||||||||
Consumer Discretionary (0.1%) | |||||||||||
305 | Guitar Center, Inc.&# | 32,177 | |||||||||
Energy (0.1%) | |||||||||||
1,325 | NuStar Energy, LP‡ 11.315% 3 mo. USD LIBOR + 5.64% | 33,257 | |||||||||
325 | NuStar Energy, LP‡ 12.438% 3 mo. USD LIBOR + 6.77% | 8,278 | |||||||||
2,270 | NuStar Logistics, LP‡ 12.390%, 01/15/43 3 mo. USD Term SOFR + 7.00% | 58,975 | |||||||||
100,510 | |||||||||||
Industrials (0.2%) | |||||||||||
| 72,370 | BRL | Randon, SA Implementos e Participacoes‡ | 156,604 | ||||||||
TOTAL PREFERRED STOCKS (Cost $332,524) | 304,544 | ||||||||||
EXCHANGE-TRADED FUNDS (1.3%) | |||||||||||
Other (1.3%) | |||||||||||
45,865 | Invesco Senior Loan ETF^ | 953,992 | |||||||||
6,150 | iShares MSCI Saudi Arabia ETF^ | 233,024 | |||||||||
TOTAL EXCHANGE-TRADED FUNDS (Cost $1,322,412) | 1,187,016 | ||||||||||
CONVERTIBLE PREFERRED STOCKS (1.5%) | |||||||||||
Energy (0.0%) | |||||||||||
1 | Gulfport Energy Corp.&# 10.000%,15.000% PIK rate | 8,875 | |||||||||
CALAMOS CLOSED-END FAMILY OF FUNDS ANNUAL REPORT
204
Global Total Return Fund Schedule of Investments October 31, 2023
| NUMBER OF SHARES | VALUE | ||||||||||
Financials (1.1%) | |||||||||||
21,400 | Apollo Global Management, Inc. 6.750%, 07/31/26 | $ | 1,029,554 | ||||||||
Utilities (0.4%) | |||||||||||
8,700 | NextEra Energy, Inc.^ 6.926%, 09/01/25 | 326,598 | |||||||||
TOTAL CONVERTIBLE (Cost $1,532,459) | 1,365,027 | ||||||||||
| NUMBER OF CONTRACTS/ NOTIONAL AMOUNT | VALUE | ||||||||||
PURCHASED OPTIONS (0.4%)# | |||||||||||
Communication Services (0.0%) | |||||||||||
28 | Baidu, Inc. | ||||||||||
294,000 | Call, 12/15/23, Strike $160.00 | 336 | |||||||||
Consumer Discretionary (0.0%) | |||||||||||
120 | Alibaba Group Holding, Ltd. | ||||||||||
990,480 | Call, 11/17/23, Strike $100.00 | 1,260 | |||||||||
585 | Arcos Dorados Holdings, Inc. | ||||||||||
527,670 | Call, 11/17/23, Strike $12.50 | 1,463 | |||||||||
150 | Li Auto, Inc. | ||||||||||
507,150 | Call, 12/15/23, Strike $45.00 | 4,125 | |||||||||
6,848 | |||||||||||
Health Care (0.0%) | |||||||||||
135 | Inmode, Ltd. | ||||||||||
257,850 | Call, 01/19/24, Strike $47.50 | 1,013 | |||||||||
Industrials (0.1%) | |||||||||||
230 | Parsons Corp. | ||||||||||
1,300,650 | Call, 01/19/24, Strike $60.00 | 38,525 | |||||||||
Information Technology (0.0%) | |||||||||||
8 | NVIDIA Corp. | ||||||||||
326,240 | Call, 01/19/24, Strike $425.00 | 25,200 | |||||||||
Materials (0.0%) | |||||||||||
435 | Cemex, Sab De CV | ||||||||||
259,695 | Call, 01/19/24, Strike $8.00 | 2,175 | |||||||||
Other (0.3%) | |||||||||||
345 | ICICI Bank, Ltd. | ||||||||||
765,555 | Call, 01/19/24, Strike $24.00 | 9,487 | |||||||||
595 | Invesco QQQ Trust Series 1 | ||||||||||
20,879,740 | Put, 11/17/23, Strike $330.00 | 84,787 | |||||||||
700 | iShares MSCI EAFE ETF | ||||||||||
4,683,700 | Put, 12/15/23, Strike $60.00 | 12,950 | |||||||||
500 | iShares MSCI Emerging Markets | ||||||||||
1,835,000 | Put, 11/17/23, Strike $37.00 | 35,000 | |||||||||
432 | iShares MSCI India ETF | ||||||||||
1,867,968 | Put, 12/15/23, Strike $44.00 | 47,520 | |||||||||
| NUMBER OF CONTRACTS/ NOTIONAL AMOUNT | VALUE | ||||||||||
23 | iShares MSCI India Small-Cap ETF | ||||||||||
142,416 | Put, 02/16/24, Strike $62.00 | $ | 5,175 | ||||||||
285 | iShares MSCI South Korea ETF | ||||||||||
1,565,790 | Call, 01/19/24, Strike $71.00 | 3,563 | |||||||||
100 | KE Holdings, Inc. | ||||||||||
147,100 | Call, 01/19/24, Strike $19.85 | 2,550 | |||||||||
660 | KraneShares CSI China Internet ETF | ||||||||||
1,719,300 | Call, 11/17/23, Strike $30.00 | 4,290 | |||||||||
198 | Petroleo Brasileiro, SA | ||||||||||
297,000 | Call, 01/19/24, Strike $14.00 | 25,938 | |||||||||
220 | SPDR S&P 500 ETF Trust | ||||||||||
9,200,400 | Put, 12/15/23, Strike $360.00 | 15,510 | |||||||||
144 | Trip.com Group, Ltd. | ||||||||||
489,600 | Call, 01/19/24, Strike $44.00 | 3,600 | |||||||||
250,370 | |||||||||||
TOTAL PURCHASED OPTIONS (Cost $2,312,140) | 324,467 | ||||||||||
TOTAL INVESTMENTS (148.2%) (Cost $156,252,393) | 132,749,523 | ||||||||||
| MANDATORY REDEEMABLE PREFERRED SHARES, AT LIQUIDATION VALUE (-19.0%) | (17,000,000 | ) | |||||||||
LIABILITIES, LESS OTHER ASSETS (-29.2%) | (26,170,328 | ) | |||||||||
NET ASSETS (100.0%) | $ | 89,579,195 | |||||||||
WRITTEN OPTIONS (0.0%)# | |||||||||||
Consumer Discretionary (0.0%) | |||||||||||
1 | Chipotle Mexican Grill, Inc. | ||||||||||
194,220 | Call, 01/19/24, Strike $2,040.00 | $ | (5,360 | ) | |||||||
Health Care (0.0%) | |||||||||||
13 | Humana, Inc. | ||||||||||
680,797 | Call, 01/19/24, Strike $530.00 | (31,005 | ) | ||||||||
TOTAL WRITTEN OPTIONS (Premium $19,191) | $ | (36,365 | ) | ||||||||
www.calamos.com
205
Global Total Return Fund Schedule of Investments October 31, 2023
NOTES TO SCHEDULE OF INVESTMENTS
* Securities issued and sold pursuant to a Rule 144A transaction are exempted from the registration requirement of the Securities Act of 1933, as amended. These securities may only be sold to qualified institutional buyers ("QIBs"), such as the Fund. Any resale of these securities must generally be effected through a sale that is registered under the Act or otherwise exempted from such registration requirements.
@ In default status and considered non-income producing.
& Illiquid security.
^ Security, or portion of security, is on loan.
‡ Variable rate security. The rate shown is the rate in effect at October 31, 2023.
‡‡ Perpetual maturity.
µ Security, or portion of security, is held in a segregated account as collateral for note payable aggregating a total value of $48,340,630.
¡ Bank loans generally are subject to mandatory and/or optional prepayment. As a result, the actual remaining maturity of bank loans may be substantially less than the stated maturities shown.
! This position represents an unsettled loan commitment at period end. Certain details associated with this purchase are not known prior to the settlement date, including coupon rate, which will be adjusted on settlement date.
# Non-income producing security.
~ Security, or portion of security, is segregated as collateral (or collateral for potential future transactions) for written options. The aggregate value of such securities is $1,023,063.
†† Security or a portion of the security purchased on a delayed delivery or when-issued basis.
FOREIGN CURRENCY ABBREVIATIONS
AED UAE Dirham
AUD Australian Dollar
BRL Brazilian Real
CAD Canadian Dollar
CHF Swiss Franc
CNY Chinese Yuan Renminbi
EUR European Monetary Unit
GBP British Pound Sterling
HKD Hong Kong Dollar
IDR Indonesian Rupiah
INR Indian Rupee
JPY Japanese Yen
KRW South Korean Won
MXN Mexican Peso
PHP Philippine Peso
PLN Polish Zloty
SEK Swedish Krona
THB Thai Baht
TWD New Taiwan Dollar
ZAR South African Rand
Note: Value for securities denominated in foreign currencies is shown in U.S. dollars. The principal amount for such securities is shown in the respective foreign currency. The date on options represents the expiration date of the option contract. The option contract may be exercised at any date on or before the date shown.
CURRENCY EXPOSURE
OCTOBER 31, 2023
VALUE | % OF TOTAL INVESTMENTS | ||||||||||
US Dollar | $ | 86,727,297 | 65.3 | % | |||||||
European Monetary Unit | 11,963,813 | 9.0 | % | ||||||||
Hong Kong Dollar | 6,977,316 | 5.3 | % | ||||||||
British Pound Sterling | 4,662,319 | 3.5 | % | ||||||||
Japanese Yen | 4,504,054 | 3.4 | % | ||||||||
Indian Rupee | 4,253,323 | 3.2 | % | ||||||||
New Taiwan Dollar | 4,082,966 | 3.1 | % | ||||||||
Canadian Dollar | 2,570,732 | 1.9 | % | ||||||||
South Korean Won | 1,167,822 | 0.9 | % | ||||||||
Indonesian Rupiah | 1,031,053 | 0.8 | % | ||||||||
Brazilian Real | 920,128 | 0.7 | % | ||||||||
Chinese Yuan Renminbi | 777,187 | 0.6 | % | ||||||||
Mexican Peso | 771,640 | 0.6 | % | ||||||||
Swiss Franc | 675,796 | 0.5 | % | ||||||||
Australian Dollar | 574,123 | 0.4 | % | ||||||||
Thai Baht | 366,663 | 0.3 | % | ||||||||
UAE Dirham | 233,011 | 0.2 | % | ||||||||
Philippine Peso | 174,270 | 0.1 | % | ||||||||
Polish Zloty | 147,891 | 0.1 | % | ||||||||
South African Rand | 70,466 | 0.1 | % | ||||||||
Swedish Krona | 61,288 | — | % | ||||||||
| Total Investments Net of Written Options | $ | 132,713,158 | 100.0 | % | |||||||
Currency exposure may vary over time.
CALAMOS CLOSED-END FAMILY OF FUNDS ANNUAL REPORT
206
Global Total Return Fund Schedule of Investments October 31, 2023
The following table summarizes the Fund's investments and derivative financial instruments categorized in the fair value hierarchy as of October 31, 2023 (see Note 1):
LEVEL 1 | LEVEL 2 | LEVEL 3 | TOTAL | ||||||||||||||||
Assets: | |||||||||||||||||||
Corporate Bonds | $ | — | $ | 13,697,472 | $ | — | $ | 13,697,472 | |||||||||||
Convertible Bonds | — | 28,854,157 | — | 28,854,157 | |||||||||||||||
Bank Loans | — | 9,680,574 | — | 9,680,574 | |||||||||||||||
Warrants | — | 1 | — | 1 | |||||||||||||||
Common Stocks | 46,365,455 | 30,970,810 | — | 77,336,265 | |||||||||||||||
Preferred Stocks | 264,618 | 39,926 | — | 304,544 | |||||||||||||||
Exchange-Traded Funds | 1,187,016 | — | — | 1,187,016 | |||||||||||||||
Convertible Preferred Stocks | 1,356,152 | 8,875 | — | 1,365,027 | |||||||||||||||
Purchased Options | 324,467 | — | — | 324,467 | |||||||||||||||
Total | $ | 49,497,708 | $ | 83,251,815 | $ | — | $ | 132,749,523 | |||||||||||
Liabilities: | |||||||||||||||||||
Written Options | $ | 36,365 | $ | — | $ | — | $ | 36,365 | |||||||||||
Total | $ | 36,365 | $ | — | $ | — | $ | 36,365 | |||||||||||
See accompanying Notes to Schedule of Investments
www.calamos.com
207
Long/Short Equity & Dynamic Income Trust Schedule of Investments October 31, 2023
| PRINCIPAL AMOUNT | VALUE | ||||||||||
ASSET BACKED SECURITY (0.0%) | |||||||||||
Other (0.0%) | |||||||||||
145,000 | SVC ABS, LLC Series 2023-1A, Class C*~ 6.700%, 02/20/53 (Cost $133,404) | $ | 128,456 | ||||||||
CORPORATE BONDS (33.6%) | |||||||||||
Airlines (0.3%) | |||||||||||
34,668 | Air Canada Pass Through Trust Series 2015-2, Class B*~ 5.000%, 06/15/25 | 34,496 | |||||||||
172,088 | Alaska Airlines Pass Through Trust Series 2020-1, Class A*µ 4.800%, 02/15/29 | 161,301 | |||||||||
80,546 | Alaska Airlines Pass Through Trust Series 2020-1, Class B*~ 8.000%, 02/15/27 | 80,397 | |||||||||
203,840 | American Airlines Pass Through Trust Series 2021-1, Class Bµ 3.950%, 01/11/32 | 173,853 | |||||||||
120,000 | American Airlines, Inc. / AAdvantage Loyalty IP, Ltd.*~ 5.500%, 04/20/26 | 116,736 | |||||||||
188,396 | British Airways Pass Through Trust Series 2021-1, Class B*~ 3.900%, 03/15/33 | 163,697 | |||||||||
187,745 | JetBlue Pass Through Trust Series 2020-1, Class B~ 7.750%, 05/15/30 | 186,669 | |||||||||
130,000 | Spirit Loyalty Cayman, Ltd. / Spirit IP Cayman, Ltd.*~ 8.000%, 09/20/25 | 96,537 | |||||||||
1,013,686 | |||||||||||
Communication Services (2.3%) | |||||||||||
200,000 | Altice France Holding, SA* 10.500%, 05/15/27 | 110,264 | |||||||||
225,000 | Altice France, SA*~ 5.500%, 10/15/29 | 155,819 | |||||||||
225,000 | APi Group DE, Inc.*µ 4.750%, 10/15/29 | 194,022 | |||||||||
290,000 | Arrow Bidco, LLC* 9.500%, 03/15/24 | 293,880 | |||||||||
200,000 | Ashtead Capital, Inc.*µ 2.450%, 08/12/31 | 147,536 | |||||||||
Audacy Capital Corp.* | |||||||||||
231,000 | 6.750%, 03/31/29 | 3,754 | |||||||||
91,000 | 6.500%, 05/01/27 | 1,365 | |||||||||
162,000 | Cincinnati Bell Telephone Company, LLC~ 6.300%, 12/01/28 | 131,095 | |||||||||
180,000 | Clear Channel Outdoor Holdings, Inc.*µ 9.000%, 09/15/28 | 175,527 | |||||||||
285,000 | Consolidated Communications, Inc.*µ^ 6.500%, 10/01/28 | 226,196 | |||||||||
| PRINCIPAL AMOUNT | VALUE | ||||||||||
CSC Holdings, LLC* | |||||||||||
285,000 | 5.375%, 02/01/28µ | $ | 227,253 | ||||||||
240,000 | 5.500%, 04/15/27µ | 200,621 | |||||||||
215,000 | 4.500%, 11/15/31~ | 142,231 | |||||||||
200,000 | 5.750%, 01/15/30~ | 105,430 | |||||||||
200,000 | 4.625%, 12/01/30~ | 101,590 | |||||||||
| Diamond Sports Group, LLC / Diamond Sports Finance Company*@ | |||||||||||
150,000 | 6.625%, 08/15/27 | 1,902 | |||||||||
115,000 | 5.375%, 08/15/26 | 1,410 | |||||||||
474,000 | Directv Financing, LLC / Directv Financing Co-Obligor, Inc.*~ 5.875%, 08/15/27 | 415,414 | |||||||||
195,000 | Frontier California, Inc.µ 6.750%, 05/15/27 | 180,047 | |||||||||
Frontier Communications Holdings, LLC*µ | |||||||||||
123,000 | 5.000%, 05/01/28 | 106,750 | |||||||||
48,000 | 8.750%, 05/15/30 | 45,789 | |||||||||
202,000 | Frontier Florida, LLCµ@ 6.860%, 02/01/28 | 185,953 | |||||||||
280,000 | Frontier North, Inc.µ@ 6.730%, 02/15/28 | 259,748 | |||||||||
165,000 | Go Daddy Operating Company, LLC / GD Finance Company, Inc.*~ 3.500%, 03/01/29 | 139,456 | |||||||||
iHeartCommunications, Inc. | |||||||||||
70,000 | 8.375%, 05/01/27^ | 42,963 | |||||||||
70,000 | 5.250%, 08/15/27* | 51,381 | |||||||||
145,000 | Intelsat Jackson Holdings, SA*@ 0.000%, 07/15/25 | — | |||||||||
230,000 | LCPR Senior Secured Financing DAC*µ 6.750%, 10/15/27 | 208,408 | |||||||||
| 151,589 | Ligado Networks, LLC* 15.500%, 11/01/23 PIK rate | 38,210 | |||||||||
Lumen Technologies, Inc. | |||||||||||
135,000 | 7.600%, 09/15/39 | 36,739 | |||||||||
90,000 | 4.000%, 02/15/27* | 61,536 | |||||||||
45,000 | 7.650%, 03/15/42 | 12,120 | |||||||||
95,000 | Match Group Holdings II, LLC*~ 3.625%, 10/01/31 | 73,555 | |||||||||
160,000 | Nexstar Media, Inc.*µ 5.625%, 07/15/27 | 144,077 | |||||||||
Paramount Global | |||||||||||
711,000 | 6.375%, 03/30/62~‡ 5 year CMT + 4.00% | 521,490 | |||||||||
270,000 | 4.900%, 08/15/44 | 170,084 | |||||||||
63,000 | Qwest Corp.µ 7.250%, 09/15/25 | 60,499 | |||||||||
595,000 | Rogers Communications, Inc.*~‡ 5.250%, 03/15/82 5 year CMT + 3.59% | 524,552 | |||||||||
Scripps Escrow II, Inc.* | |||||||||||
95,000 | 3.875%, 01/15/29~ | 72,160 | |||||||||
48,000 | 5.375%, 01/15/31 | 29,827 | |||||||||
CALAMOS CLOSED-END FAMILY OF FUNDS ANNUAL REPORT
208
Long/Short Equity & Dynamic Income Trust Schedule of Investments October 31, 2023
| PRINCIPAL AMOUNT | VALUE | ||||||||||
195,000 | Scripps Escrow, Inc.*µ 5.875%, 07/15/27 | $ | 145,969 | ||||||||
Sirius XM Radio, Inc.* | |||||||||||
195,000 | 5.500%, 07/01/29µ | 172,953 | |||||||||
185,000 | 4.000%, 07/15/28~ | 157,402 | |||||||||
90,000 | 3.125%, 09/01/26~ | 80,864 | |||||||||
48,000 | 3.875%, 09/01/31~ | 36,155 | |||||||||
175,000 | Spanish Broadcasting System, Inc.* 9.750%, 03/01/26 | 109,058 | |||||||||
165,000 | Sprint, LLCµ 7.125%, 06/15/24 | 165,939 | |||||||||
210,000 | Stagwell Global, LLC*µ 5.625%, 08/15/29 | 173,746 | |||||||||
190,000 | Telesat Canada / Telesat, LLC* 4.875%, 06/01/27 | 113,764 | |||||||||
70,000 | Time Warner Cable, LLC 7.300%, 07/01/38 | 65,566 | |||||||||
230,000 | United States Cellular Corp.~ 6.700%, 12/15/33 | 219,041 | |||||||||
70,000 | Univision Communications, Inc.*µ 8.000%, 08/15/28 | 66,340 | |||||||||
90,000 | Viasat, Inc.*µ 5.625%, 04/15/27 | 78,745 | |||||||||
395,000 | Vodafone Group, PLC~‡ 7.000%, 04/04/79 U.S. 5 yr Swap + 4.87% | 382,680 | |||||||||
7,568,875 | |||||||||||
Consumer Discretionary (4.1%) | |||||||||||
228,000 | Abercrombie & Fitch Management Company*~ 8.750%, 07/15/25 | 231,803 | |||||||||
185,000 | Adams Homes, Inc.*µ 9.250%, 10/15/28 | 181,596 | |||||||||
230,000 | Adient Global Holdings Company*µ 8.250%, 04/15/31 | 225,069 | |||||||||
156,000 | American Axle & Manufacturing, Inc.µ 6.875%, 07/01/28 | 139,037 | |||||||||
| Ashton Woods USA, LLC / Ashton Woods Finance Company*µ | |||||||||||
167,000 | 4.625%, 08/01/29 | 135,729 | |||||||||
149,000 | 6.625%, 01/15/28 | 136,751 | |||||||||
217,000 | At Home Group, Inc.* 4.875%, 07/15/28 | 75,408 | |||||||||
Bath & Body Works, Inc.µ | |||||||||||
254,000 | 6.694%, 01/15/27 | 246,159 | |||||||||
235,000 | 6.875%, 11/01/35 | 207,714 | |||||||||
200,000 | Benteler International AG*~ 10.500%, 05/15/28 | 202,226 | |||||||||
Caesars Entertainment, Inc.* | |||||||||||
118,000 | 4.625%, 10/15/29µ | 97,148 | |||||||||
93,000 | 8.125%, 07/01/27~ | 92,195 | |||||||||
| PRINCIPAL AMOUNT | VALUE | ||||||||||
Carnival Corp.* | |||||||||||
185,000 | 6.000%, 05/01/29µ | $ | 156,466 | ||||||||
92,000 | 7.625%, 03/01/26 | 89,508 | |||||||||
89,000 | 4.000%, 08/01/28 | 77,539 | |||||||||
12,000 | 7.000%, 08/15/29~ | 11,789 | |||||||||
230,000 | Carriage Services, Inc.*µ 4.250%, 05/15/29 | 188,354 | |||||||||
Carvana Company* | |||||||||||
39,000 | 14.000%, 06/01/31 | 29,351 | |||||||||
33,000 | 13.000%, 06/01/30 | 24,765 | |||||||||
22,000 | 12.000%, 12/01/28 | 16,476 | |||||||||
| CCO Holdings, LLC / CCO Holdings Capital Corp.*µ | |||||||||||
750,000 | 4.750%, 03/01/30 | 619,560 | |||||||||
250,000 | 4.500%, 08/15/30 | 200,930 | |||||||||
220,000 | 6.375%, 09/01/29 | 202,268 | |||||||||
186,000 | 4.250%, 02/01/31 | 144,920 | |||||||||
96,000 | 4.750%, 02/01/32 | 75,042 | |||||||||
96,000 | CDI Escrow Issuer, Inc.*µ 5.750%, 04/01/30 | 86,029 | |||||||||
115,000 | Cedar Fair, LP^ 5.250%, 07/15/29 | 99,462 | |||||||||
92,000 | Churchill Downs, Inc.*µ 6.750%, 05/01/31 | 86,015 | |||||||||
Dana, Inc.µ | |||||||||||
155,000 | 4.250%, 09/01/30 | 123,335 | |||||||||
140,000 | 4.500%, 02/15/32 | 109,729 | |||||||||
DISH DBS Corp. | |||||||||||
230,000 | 5.250%, 12/01/26*µ | 186,063 | |||||||||
180,000 | 7.750%, 07/01/26 | 120,785 | |||||||||
120,000 | 7.375%, 07/01/28~ | 67,656 | |||||||||
95,000 | 5.125%, 06/01/29 | 49,026 | |||||||||
186,000 | DISH Network Corp.*µ 11.750%, 11/15/27 | 184,391 | |||||||||
200,000 | Empire Resorts, Inc.*µ 7.750%, 11/01/26 | 163,786 | |||||||||
204,000 | Everi Holdings, Inc.*µ 5.000%, 07/15/29 | 171,597 | |||||||||
190,000 | Ford Motor Company~^ 6.100%, 08/19/32 | 175,902 | |||||||||
Ford Motor Credit Company, LLC | |||||||||||
300,000 | 4.000%, 11/13/30~ | 247,374 | |||||||||
270,000 | 5.113%, 05/03/29µ | 245,219 | |||||||||
235,000 | 7.200%, 06/10/30~ | 234,734 | |||||||||
200,000 | 7.350%, 03/06/30~ | 201,228 | |||||||||
200,000 | 7.350%, 11/04/27 | 202,608 | |||||||||
71,000 | Gap, Inc.*µ 3.875%, 10/01/31 | 51,222 | |||||||||
90,000 | General Motors Companyµ 5.200%, 04/01/45 | 66,713 | |||||||||
General Motors Financial Company, Inc.‡ | |||||||||||
| 765,000 | 5.700%, 09/30/30~^ 5 year CMT + 5.00% | 647,274 | |||||||||
395,000 | 6.500%, 09/30/28µ 3 mo. USD LIBOR + 3.44% | 324,808 | |||||||||
www.calamos.com
209
Long/Short Equity & Dynamic Income Trust Schedule of Investments October 31, 2023
| PRINCIPAL AMOUNT | VALUE | ||||||||||
goeasy, Ltd.* | |||||||||||
325,000 | 5.375%, 12/01/24~ | $ | 319,433 | ||||||||
177,000 | 4.375%, 05/01/26 | 160,442 | |||||||||
100,000 | Goodyear Tire & Rubber Company^ 5.250%, 07/15/31 | 81,562 | |||||||||
79,000 | Group 1 Automotive, Inc.*~ 4.000%, 08/15/28 | 68,281 | |||||||||
193,000 | Guitar Center, Inc.*^ 8.500%, 01/15/26 | 163,118 | |||||||||
53,949 | JetBlue Pass Through Trust Series 2019-2, Class B 8.000%, 11/15/27 | 54,310 | |||||||||
160,000 | Kohl's Corp. 5.550%, 07/17/45 | 92,506 | |||||||||
185,000 | LCM Investments Holdings II, LLC*µ 8.250%, 08/01/31 | 177,310 | |||||||||
190,000 | Liberty Interactive, LLC~ 8.250%, 02/01/30 | 50,056 | |||||||||
Life Time, Inc.* | |||||||||||
179,000 | 8.000%, 04/15/26~ | 174,938 | |||||||||
100,000 | 5.750%, 01/15/26µ | 96,986 | |||||||||
90,000 | Light & Wonder International, Inc.*µ 7.500%, 09/01/31 | 88,029 | |||||||||
70,000 | Lindblad Expeditions Holdings, Inc.*µ 9.000%, 05/15/28 | 68,621 | |||||||||
123,000 | Lindblad Expeditions, LLC*µ 6.750%, 02/15/27 | 111,841 | |||||||||
125,000 | M/I Homes, Inc. 3.950%, 02/15/30 | 100,024 | |||||||||
Macy's Retail Holdings, LLC | |||||||||||
320,000 | 6.700%, 07/15/34*~ | 246,742 | |||||||||
90,000 | 4.300%, 02/15/43 | 49,387 | |||||||||
225,000 | Mclaren Finance, PLC*µ 7.500%, 08/01/26 | 194,254 | |||||||||
242,000 | Midwest Gaming Borrower, LLC / Midwest Gaming Finance Corp.*µ 4.875%, 05/01/29 | 202,014 | |||||||||
110,000 | Newell Brands, Inc.µ 5.200%, 04/01/26 | 103,903 | |||||||||
Nordstrom, Inc. | |||||||||||
90,000 | 5.000%, 01/15/44~ | 54,197 | |||||||||
86,000 | 4.250%, 08/01/31 | 63,048 | |||||||||
215,000 | PENN Entertainment, Inc.*^ 4.125%, 07/01/29 | 167,197 | |||||||||
250,000 | PetSmart, Inc. / PetSmart Finance Corp.*µ 4.750%, 02/15/28 | 221,408 | |||||||||
265,000 | Premier Entertainment Sub, LLC / Premier Entertainment Finance Corp.*~ 5.625%, 09/01/29 | 186,504 | |||||||||
473,000 | Rite Aid Corp.*~@ 8.000%, 11/15/26 | 328,919 | |||||||||
92,000 | Royal Caribbean Cruises, Ltd.*µ 7.250%, 01/15/30 | 91,014 | |||||||||
| PRINCIPAL AMOUNT | VALUE | ||||||||||
270,000 | Simmons Foods, Inc. / Simmons Prepared Foods, Inc. / Simmons Pet Food, Inc. / Simmons Feed*µ 4.625%, 03/01/29 | $ | 219,559 | ||||||||
365,000 | Six Flags Entertainment Corp.*~ 7.250%, 05/15/31 | 336,242 | |||||||||
212,000 | Sonic Automotive, Inc.*~^ 4.625%, 11/15/29 | 176,791 | |||||||||
147,000 | Speedway Motorsports, LLC / Speedway Funding II, Inc.*µ 4.875%, 11/01/27 | 131,643 | |||||||||
450,000 | Station Casinos, LLC*µ 4.500%, 02/15/28 | 389,074 | |||||||||
212,000 | Taylor Morrison Communities, Inc.*µ 5.750%, 01/15/28 | 193,113 | |||||||||
45,000 | Viking Cruises, Ltd.*µ 9.125%, 07/15/31 | 44,271 | |||||||||
220,000 | Vista Outdoor, Inc.*µ 4.500%, 03/15/29 | 204,952 | |||||||||
90,000 | Windsor Holdings III, LLC*µ 8.500%, 06/15/30 | 88,353 | |||||||||
175,000 | ZF North America Capital, Inc.*~ 7.125%, 04/14/30 | 170,328 | |||||||||
13,323,129 | |||||||||||
Consumer Staples (0.8%) | |||||||||||
179,000 | 1375209 B.C., Ltd.*~ 9.000%, 01/30/28 | 174,027 | |||||||||
180,000 | B&G Foods, Inc.*µ 8.000%, 09/15/28 | 175,723 | |||||||||
218,000 | Central Garden & Pet Company*µ 4.125%, 04/30/31 | 174,237 | |||||||||
213,000 | Edgewell Personal Care Company* 4.125%, 04/01/29 | 179,118 | |||||||||
Energizer Holdings, Inc.*µ | |||||||||||
263,000 | 4.375%, 03/31/29 | 216,539 | |||||||||
48,000 | 6.500%, 12/31/27 | 45,097 | |||||||||
| JBS USA LUX, SA / JBS USA Food Company / JBS USA Finance, Inc.µ | |||||||||||
280,000 | 5.500%, 01/15/30 | 256,180 | |||||||||
120,000 | 5.125%, 02/01/28 | 112,703 | |||||||||
70,000 | 5.750%, 04/01/33 | 61,633 | |||||||||
395,000 | Land O' Lakes, Inc.*µ 7.000%, 09/18/28 | 297,435 | |||||||||
191,000 | Performance Food Group, Inc.*µ 4.250%, 08/01/29 | 162,073 | |||||||||
140,000 | Pilgrim's Pride Corp. 4.250%, 04/15/31 | 115,672 | |||||||||
182,000 | Prestige Brands, Inc.*µ 3.750%, 04/01/31 | 145,087 | |||||||||
155,000 | United Natural Foods, Inc.* 6.750%, 10/15/28 | 121,298 | |||||||||
CALAMOS CLOSED-END FAMILY OF FUNDS ANNUAL REPORT
210
Long/Short Equity & Dynamic Income Trust Schedule of Investments October 31, 2023
| PRINCIPAL AMOUNT | VALUE | ||||||||||
293,000 | Vector Group, Ltd.*~ 5.750%, 02/01/29 | $ | 248,795 | ||||||||
90,000 | Williams Scotsman, Inc.*µ 7.375%, 10/01/31 | 88,869 | |||||||||
2,574,486 | |||||||||||
Energy (3.3%) | |||||||||||
190,000 | Antero Resources Corp.*~ 5.375%, 03/01/30 | 173,668 | |||||||||
192,000 | Apache Corp.~ 5.100%, 09/01/40 | 149,487 | |||||||||
Buckeye Partners, LPµ | |||||||||||
205,000 | 3.950%, 12/01/26 | 187,101 | |||||||||
135,000 | 5.850%, 11/15/43 | 95,615 | |||||||||
270,000 | Callon Petroleum Company*~ 7.500%, 06/15/30 | 261,733 | |||||||||
96,000 | Cheniere Energy, Inc.µ 4.625%, 10/15/28 | 87,763 | |||||||||
139,000 | Chesapeake Energy Corp.*~ 6.750%, 04/15/29 | 136,391 | |||||||||
256,000 | Civitas Resources, Inc.*µ 8.750%, 07/01/31 | 258,691 | |||||||||
Continental Resources, Inc.*µ | |||||||||||
135,000 | 2.875%, 04/01/32 | 100,007 | |||||||||
95,000 | 5.750%, 01/15/31 | 88,188 | |||||||||
150,000 | DT Midstream, Inc.*~ 4.125%, 06/15/29 | 129,174 | |||||||||
Earthstone Energy Holdings, LLC*µ | |||||||||||
181,000 | 8.000%, 04/15/27 | 183,746 | |||||||||
70,000 | 9.875%, 07/15/31 | 75,538 | |||||||||
Enbridge, Inc.µ | |||||||||||
945,000 | 7.375%, 01/15/83 5 year CMT + 3.71% | 879,389 | |||||||||
920,000 | 5.750%, 07/15/80‡ 5 year CMT + 5.31% | 767,298 | |||||||||
Energy Transfer, LP‡ | |||||||||||
560,000 | 6.500%, 11/15/26~ 5 year CMT + 5.69% | 508,900 | |||||||||
125,000 | 8.656%, 11/01/66µ 3 mo. SOFR + 3.28% | 102,200 | |||||||||
EnLink Midstream Partners, LPµ | |||||||||||
835,000 | 9.780%, 12/01/23‡ 3 mo. SOFR + 4.37% | 745,663 | |||||||||
205,000 | 4.850%, 07/15/26 | 193,834 | |||||||||
113,000 | Enlink Midstream, LLC* 6.500%, 09/01/30 | 108,643 | |||||||||
Enterprise Products Operating, LLCµ‡ | |||||||||||
205,000 | 5.250%, 08/16/77 3 mo. SOFR + 3.29% | 176,542 | |||||||||
| 185,000 | 8.619%, 08/16/77 3 mo. SOFR + 3.25% | 181,313 | |||||||||
310,000 | EQM Midstream Partners, LP*~ 7.500%, 06/01/27 | 308,190 | |||||||||
| PRINCIPAL AMOUNT | VALUE | ||||||||||
196,000 | Genesis Energy, LP / Genesis Energy Finance Corp.µ 8.875%, 04/15/30 | $ | 190,577 | ||||||||
255,000 | Gulfport Energy Corp.*µ 8.000%, 05/17/26 | 255,107 | |||||||||
265,000 | Hilcorp Energy I, LP / Hilcorp Finance Company*µ 6.000%, 04/15/30 | 235,630 | |||||||||
144,000 | Howard Midstream Energy Partners, LLC*µ 6.750%, 01/15/27 | 136,947 | |||||||||
186,000 | Magnolia Oil & Gas Operating, LLC / Magnolia Oil & Gas Finance Corp.*µ 6.000%, 08/01/26 | 177,961 | |||||||||
Moss Creek Resources Holdings, Inc.*µ | |||||||||||
75,000 | 7.500%, 01/15/26 | 71,794 | |||||||||
70,000 | 10.500%, 05/15/27 | 69,282 | |||||||||
135,000 | Nabors Industries, Inc.*µ 7.375%, 05/15/27 | 126,419 | |||||||||
135,000 | Nabors Industries, Ltd.*µ 7.500%, 01/15/28 | 119,291 | |||||||||
New Fortress Energy, Inc.*µ | |||||||||||
180,000 | 6.750%, 09/15/25 | 167,515 | |||||||||
96,000 | 6.500%, 09/30/26 | 86,063 | |||||||||
91,000 | Oceaneering International, Inc.* 6.000%, 02/01/28 | 83,450 | |||||||||
200,000 | Parkland Corp.*~ 5.875%, 07/15/27 | 192,330 | |||||||||
99,000 | Patterson-UTI Energy, Inc.µ 5.150%, 11/15/29 | 88,443 | |||||||||
46,000 | Permian Resources Operating LLC*µ 7.000%, 01/15/32 | 45,011 | |||||||||
750,000 | Plains All American Pipeline, LPµ‡ 9.736%, 12/01/23 3 mo. SOFR + 4.37% | 707,955 | |||||||||
265,000 | Rockcliff Energy II, LLC*µ 5.500%, 10/15/29 | 240,530 | |||||||||
Southwestern Energy Company~ | |||||||||||
98,000 | 4.750%, 02/01/32 | 84,374 | |||||||||
90,000 | 5.375%, 02/01/29 | 83,379 | |||||||||
48,000 | Sunoco, LP / Sunoco Finance Corp.~ 4.500%, 04/30/30 | 41,300 | |||||||||
261,250 | Transocean, Inc.*µ 8.750%, 02/15/30 | 261,038 | |||||||||
Venture Global Calcasieu Pass, LLC* | |||||||||||
115,000 | 6.250%, 01/15/30 | 108,562 | |||||||||
45,000 | 4.125%, 08/15/31~ | 36,377 | |||||||||
45,000 | 3.875%, 08/15/29~ | 37,694 | |||||||||
Venture Global LNG, Inc.*µ | |||||||||||
230,000 | 8.375%, 06/01/31 | 219,650 | |||||||||
140,000 | 8.125%, 06/01/28 | 136,027 | |||||||||
90,000 | 9.875%, 02/01/32 | 91,338 | |||||||||
45,000 | 9.500%, 02/01/29 | 45,676 | |||||||||
www.calamos.com
211
Long/Short Equity & Dynamic Income Trust Schedule of Investments October 31, 2023
| PRINCIPAL AMOUNT | VALUE | ||||||||||
Vital Energy, Inc.µ | |||||||||||
174,000 | 9.500%, 01/15/25 | $ | 174,943 | ||||||||
115,000 | 7.750%, 07/31/29* | 103,937 | |||||||||
23,000 | 9.750%, 10/15/30 | 22,557 | |||||||||
280,000 | VOC Escrow, Ltd.*µ 5.000%, 02/15/28 | 252,580 | |||||||||
235,000 | Weatherford International, Ltd.*µ 8.625%, 04/30/30 | 237,825 | |||||||||
10,830,636 | |||||||||||
Financials (14.2%) | |||||||||||
251,000 | Acrisure, LLC / Acrisure Finance, Inc.*µ 7.000%, 11/15/25 | 243,852 | |||||||||
286,000 | Aethon United BR, LP / Aethon United Finance Corp.*µ 8.250%, 02/15/26 | 284,401 | |||||||||
293,000 | AG Issuer, LLC*µ 6.250%, 03/01/28 | 271,517 | |||||||||
| 605,000 | Aircastle, Ltd.*~‡ 5.250%, 06/15/26 5 year CMT + 4.41% | 479,789 | |||||||||
315,000 | Alliant Holdings Intermediate, LLC / Alliant Holdings Co-Issuer*µ 6.750%, 10/15/27 | 287,746 | |||||||||
360,000 | Allstate Corp.µ‡ 8.564%, 08/15/53 3 mo. SOFR + 3.20% | 355,446 | |||||||||
Ally Financial, Inc.~ | |||||||||||
| 1,236,000 | 4.700%, 05/15/26‡ 5 year CMT + 3.87% | 807,639 | |||||||||
935,000 | 4.700%, 05/15/28 7 year CMT + 3.48% | 547,078 | |||||||||
| 685,000 | American International Group, Inc.µ‡ 5.750%, 04/01/48 3 mo. USD LIBOR + 2.87% | 624,672 | |||||||||
379,000 | AmWINS Group, Inc.*µ 4.875%, 06/30/29 | 325,349 | |||||||||
1,160,000 | Ares Finance Company III, LLC*µ‡ 4.125%, 06/30/51 5 year CMT + 3.24% | 873,805 | |||||||||
208,000 | Aviation Capital Group, LLC*µ 3.500%, 11/01/27 | 182,820 | |||||||||
75,000 | Avolon Holdings Funding, Ltd.*µ 5.500%, 01/15/26 | 72,290 | |||||||||
835,000 | AXIS Specialty Finance, LLCµ‡ 4.900%, 01/15/40 5 year CMT + 3.19% | 670,705 | |||||||||
Bank of America Corp.µ‡ | |||||||||||
1,091,000 | 6.125%, 04/27/27 5 year CMT + 3.23% | 1,030,471 | |||||||||
340,000 | 5.125%, 06/20/24 3 mo. SOFR + 3.55% | 332,071 | |||||||||
330,000 | 6.250%, 09/05/24 3 mo. SOFR + 3.97% | 325,258 | |||||||||
330,000 | 6.100%, 03/17/25 3 mo. SOFR + 4.16% | 318,820 | |||||||||
| PRINCIPAL AMOUNT | VALUE | ||||||||||
405,000 | Bank of Montrealµ‡ 4.800%, 08/25/24 5 year CMT + 2.98% | $ | 362,402 | ||||||||
1,560,000 | Bank of New York Mellon Corp.µ‡ 4.700%, 09/20/25 5 year CMT + 4.36% | 1,477,538 | |||||||||
670,000 | Bank of Nova Scotiaµ‡ 3.625%, 10/27/81 5 year CMT + 2.61% | 472,095 | |||||||||
BP Capital Markets, PLCµ‡ | |||||||||||
680,000 | 4.875%, 03/22/30 5 year CMT + 4.40% | 592,124 | |||||||||
675,000 | 4.375%, 06/22/25 5 year CMT + 4.04% | 642,870 | |||||||||
375,000 | BroadStreet Partners, Inc.*µ 5.875%, 04/15/29 | 327,217 | |||||||||
| Brookfield Property REIT, Inc. / BPR Cumulus, LLC / BPR Nimbus, LLC / GGSI Sellco, LLC*µ | |||||||||||
170,000 | 4.500%, 04/01/27 | 141,868 | |||||||||
116,000 | 5.750%, 05/15/26 | 106,389 | |||||||||
200,000 | Burford Capital Global Financial, LLC* 6.875%, 04/15/30 | 181,068 | |||||||||
1,098,000 | Capital One Financial Corp.~^‡ 3.950%, 09/01/26 5 year CMT + 3.16% | 768,743 | |||||||||
Charles Schwab Corp.‡ | |||||||||||
675,000 | 5.375%, 06/01/25µ 5 year CMT + 4.97% | 644,713 | |||||||||
433,000 | 4.000%, 12/01/30~ 10 year CMT + 3.08% | 296,181 | |||||||||
320,000 | 4.000%, 06/01/26µ 5 year CMT + 3.17% | 254,538 | |||||||||
Citigroup, Inc.‡ | |||||||||||
1,141,000 | 3.875%, 02/18/26~ 5 year CMT + 3.42% | 957,984 | |||||||||
445,000 | 4.000%, 12/10/25~ 5 year CMT + 3.60% | 382,882 | |||||||||
395,000 | 4.150%, 11/15/26~ 5 year CMT + 3.00% | 308,159 | |||||||||
350,000 | 7.625%, 11/15/28~ 5 year CMT + 3.21% | 337,757 | |||||||||
335,000 | 5.950%, 05/15/25µ 3 mo. SOFR + 4.17% | 317,295 | |||||||||
Citizens Financial Group, Inc.‡ | |||||||||||
1,115,000 | 4.000%, 10/06/26~ 5 year CMT + 3.22% | 757,743 | |||||||||
365,000 | 5.650%, 10/06/25µ 5 year CMT + 5.31% | 316,608 | |||||||||
365,000 | Corebridge Financial, Inc.µ‡ 6.875%, 12/15/52 5 year CMT + 3.85% | 338,683 | |||||||||
Credit Acceptance Corp. | |||||||||||
285,000 | 6.625%, 03/15/26~ | 271,651 | |||||||||
161,000 | 5.125%, 12/31/24*µ | 155,882 | |||||||||
CALAMOS CLOSED-END FAMILY OF FUNDS ANNUAL REPORT
212
Long/Short Equity & Dynamic Income Trust Schedule of Investments October 31, 2023
| PRINCIPAL AMOUNT | VALUE | ||||||||||
180,000 | Cushman & Wakefield U.S. Borrower LLC* 8.875%, 09/01/31 | $ | 171,018 | ||||||||
500,000 | Depository Trust & Clearing Corp.*µ‡ 3.375%, 06/20/26 5 year CMT + 2.61% | 373,115 | |||||||||
Discover Financial Services~‡ | |||||||||||
660,000 | 6.125%, 06/23/25 5 year CMT + 5.78% | 610,757 | |||||||||
650,000 | 5.500%, 10/30/27 3 mo. SOFR + 3.34% | 437,658 | |||||||||
241,000 | Enact Holdings, Inc.*µ 6.500%, 08/15/25 | 237,363 | |||||||||
635,000 | Enstar Finance, LLCµ‡ 5.500%, 01/15/42 5 year CMT + 4.01% | 508,057 | |||||||||
1,500,000 | Fifth Third Bancorp~‡ 4.500%, 09/30/25 5 year CMT + 4.22% | 1,276,935 | |||||||||
160,000 | First Citizens BancShares, Inc.‡ 9.643%, 01/04/27 3 mo. SOFR + 4.23% | 163,286 | |||||||||
275,000 | Global Net Lease, Inc. / Global Net Lease Operating Partnership, LP*~ 3.750%, 12/15/27 | 208,868 | |||||||||
Goldman Sachs Group, Inc.‡ | |||||||||||
1,180,000 | 4.400%, 02/10/25µ 5 year CMT + 2.85% | 986,716 | |||||||||
442,000 | 4.125%, 11/10/26~ 5 year CMT + 2.95% | 351,417 | |||||||||
351,000 | 7.500%, 02/10/29~ 5 year CMT + 3.16% | 343,952 | |||||||||
200,000 | GTCR W-2 Merger Sub, LLC* 7.500%, 01/15/31 | 197,438 | |||||||||
HUB International, Ltd.*µ | |||||||||||
276,000 | 5.625%, 12/01/29 | 238,263 | |||||||||
139,000 | 7.000%, 05/01/26 | 135,572 | |||||||||
Huntington Bancshares, Inc.‡ | |||||||||||
940,000 | 4.450%, 10/15/27~ 7 year CMT + 4.05% | 703,816 | |||||||||
505,000 | 5.625%, 07/15/30µ 10 year CMT + 4.95% | 394,289 | |||||||||
144,000 | Icahn Enterprises, LP / Icahn Enterprises Finance Corp.~ 4.375%, 02/01/29 | 111,735 | |||||||||
510,000 | ILFC E-Capital Trust II*~‡ 7.459%, 12/21/65 3 mo. SOFR + 2.06% | 383,607 | |||||||||
Iron Mountain, Inc.* | |||||||||||
380,000 | 5.250%, 03/15/28µ | 348,164 | |||||||||
45,000 | 7.000%, 02/15/29 | 43,706 | |||||||||
525,000 | Jefferies Finance, LLC / JFIN Co-Issuer Corp.*µ 5.000%, 08/15/28 | 421,129 | |||||||||
| PRINCIPAL AMOUNT | VALUE | ||||||||||
JPMorgan Chase & Companyµ‡ | |||||||||||
2,840,000 | 3.650%, 06/01/26 5 year CMT + 2.85% | $ | 2,467,562 | ||||||||
330,000 | 6.125%, 04/30/24 3 mo. SOFR + 3.59% | 328,152 | |||||||||
430,000 | KeyCorp~‡ 5.000%, 09/15/26 3 mo. SOFR + 3.87% | 288,375 | |||||||||
| Ladder Capital Finance Holdings, LLLP / Ladder Capital Finance Corp.* | |||||||||||
379,000 | 5.250%, 10/01/25µ | 361,339 | |||||||||
95,000 | 4.750%, 06/15/29~ | 76,682 | |||||||||
175,000 | LD Holdings Group, LLC* 6.125%, 04/01/28 | 98,061 | |||||||||
Level 3 Financing, Inc.* | |||||||||||
200,000 | 4.250%, 07/01/28~ | 113,258 | |||||||||
153,000 | 3.400%, 03/01/27^ | 142,366 | |||||||||
90,000 | 4.625%, 09/15/27 | 60,742 | |||||||||
1,085,000 | Liberty Mutual Group, Inc.*µ‡ 4.125%, 12/15/51 5 year CMT + 3.32% | 864,658 | |||||||||
139,000 | LPL Holdings, Inc.*µ 4.000%, 03/15/29 | 119,591 | |||||||||
M&T Bank Corp.µ‡ | |||||||||||
355,000 | 6.450%, 02/15/24 3 mo. SOFR + 3.87% | 333,995 | |||||||||
200,000 | 5.125%, 11/01/26 3 mo. USD LIBOR + 3.52% | 151,766 | |||||||||
200,000 | 5.000%, 08/01/24 5 year CMT + 3.17% | 159,938 | |||||||||
185,000 | Macquarie Airfinance Holdings, Ltd.*µ 8.125%, 03/30/29 | 182,467 | |||||||||
670,000 | Markel Corp.µ‡ 6.000%, 06/01/25 5 year CMT + 5.66% | 645,746 | |||||||||
MetLife, Inc.µ | |||||||||||
792,000 | 6.400%, 12/15/66 | 744,076 | |||||||||
605,000 | 3.850%, 09/15/25‡ 5 year CMT + 3.58% | 550,260 | |||||||||
255,000 | Nationstar Mortgage Holdings, Inc.*µ 5.500%, 08/15/28 | 225,966 | |||||||||
Navient Corp.µ | |||||||||||
197,000 | 5.000%, 03/15/27 | 173,750 | |||||||||
100,000 | 4.875%, 03/15/28 | 82,967 | |||||||||
220,000 | Necessity Retail REIT, Inc. / American Finance Operating Partner, LP*~ 4.500%, 09/30/28 | 164,923 | |||||||||
545,000 | Northern Trust Corp.µ‡ 4.600%, 10/01/26 3 mo. SOFR + 3.46% | 479,039 | |||||||||
OneMain Finance Corp. | |||||||||||
130,000 | 9.000%, 01/15/29~ | 127,110 | |||||||||
130,000 | 3.875%, 09/15/28~ | 103,533 | |||||||||
95,000 | 7.125%, 03/15/26µ | 92,462 | |||||||||
www.calamos.com
213
Long/Short Equity & Dynamic Income Trust Schedule of Investments October 31, 2023
| PRINCIPAL AMOUNT | VALUE | ||||||||||
98,000 | Park Intermediate Holdings, LLC / PK Domestic Property, LLC / PK Finance Co-Issuer*µ 5.875%, 10/01/28 | $ | 88,499 | ||||||||
1,148,000 | PartnerRe Finance B, LLCµ‡ 4.500%, 10/01/50 5 year CMT + 3.82% | 945,470 | |||||||||
295,000 | PHH Mortgage Corp.*µ 7.875%, 03/15/26 | 255,827 | |||||||||
PNC Financial Services Group, Inc.µ‡ | |||||||||||
735,000 | 3.400%, 09/15/26 5 year CMT + 2.60% | 530,075 | |||||||||
375,000 | 6.000%, 05/15/27 5 year CMT + 3.00% | 315,806 | |||||||||
360,000 | 6.200%, 09/15/27 5 year CMT + 3.24% | 321,700 | |||||||||
650,000 | Progressive Corp.µ‡ 8.210%, 12/01/23 3 mo. USD LIBOR + 2.54% | 640,770 | |||||||||
785,000 | QBE Insurance Group, Ltd.*µ‡ 5.875%, 05/12/25 5 year CMT + 5.51% | 751,104 | |||||||||
220,000 | RHP Hotel Properties, LP / RHP Finance Corp.*µ 4.500%, 02/15/29 | 187,539 | |||||||||
| Rocket Mortgage, LLC / Rocket Mortgage Co-Issuer, Inc.*~ | |||||||||||
85,000 | 3.875%, 03/01/31 | 65,790 | |||||||||
85,000 | 3.625%, 03/01/29 | 69,190 | |||||||||
45,000 | 2.875%, 10/15/26 | 39,301 | |||||||||
199,000 | StoneX Group, Inc.*µ 8.625%, 06/15/25 | 200,192 | |||||||||
Truist Financial Corp.µ‡ | |||||||||||
700,000 | 4.800%, 09/01/24 5 year CMT + 3.00% | 575,890 | |||||||||
685,000 | 4.950%, 09/01/25 5 year CMT + 4.61% | 622,268 | |||||||||
256,000 | 5.100%, 03/01/30 10 year CMT + 4.35% | 205,212 | |||||||||
765,000 | U.S. Bancorpµ‡ 5.300%, 04/15/27 3 mo. SOFR + 3.18% | 602,766 | |||||||||
United Wholesale Mortgage, LLC*~ | |||||||||||
221,000 | 5.500%, 04/15/29 | 185,141 | |||||||||
90,000 | 5.750%, 06/15/27 | 82,128 | |||||||||
| Uniti Group, LP / Uniti Group Finance, Inc. / CSL Capital, LLC* | |||||||||||
93,000 | 10.500%, 02/15/28µ | 89,673 | |||||||||
90,000 | 6.500%, 02/15/29~ | 58,525 | |||||||||
210,000 | VZ Secured Financing, BV*µ 5.000%, 01/15/32 | 160,035 | |||||||||
Wells Fargo & Company~‡ | |||||||||||
1,480,000 | 3.900%, 03/15/26 5 year CMT + 3.45% | 1,286,608 | |||||||||
| PRINCIPAL AMOUNT | VALUE | ||||||||||
1,340,000 | 7.625%, 09/15/28 5 year CMT + 3.61% | $ | 1,346,606 | ||||||||
208,000 | XHR, LP*µ 6.375%, 08/15/25 | 202,998 | |||||||||
46,060,877 | |||||||||||
Health Care (1.0%) | |||||||||||
Bausch Health Companies, Inc.* | |||||||||||
318,000 | 11.000%, 09/30/28 | 194,667 | |||||||||
72,000 | 6.125%, 02/01/27 | 40,226 | |||||||||
62,000 | 14.000%, 10/15/30 | 34,155 | |||||||||
CHS/Community Health Systems, Inc.* | |||||||||||
377,000 | 6.125%, 04/01/30~ | 146,547 | |||||||||
210,000 | 8.000%, 03/15/26µ | 192,276 | |||||||||
108,000 | 6.875%, 04/15/29~ | 44,583 | |||||||||
24,000 | 5.250%, 05/15/30µ | 17,063 | |||||||||
DaVita, Inc.*µ | |||||||||||
372,000 | 4.625%, 06/01/30 | 291,875 | |||||||||
222,000 | 3.750%, 02/15/31 | 159,827 | |||||||||
Embecta Corp.*µ | |||||||||||
144,000 | 5.000%, 02/15/30 | 114,463 | |||||||||
48,000 | 6.750%, 02/15/30 | 39,815 | |||||||||
Encompass Health Corp.µ | |||||||||||
100,000 | 4.750%, 02/01/30 | 86,808 | |||||||||
100,000 | 4.500%, 02/01/28 | 90,242 | |||||||||
200,000 | Jazz Securities DAC*~ 4.375%, 01/15/29 | 173,966 | |||||||||
Medline Borrower, LP*µ | |||||||||||
233,000 | 5.250%, 10/01/29 | 198,577 | |||||||||
230,000 | 3.875%, 04/01/29 | 194,293 | |||||||||
| Organon & Company / Organon Foreign Debt Co-Issuer, BV* | |||||||||||
350,000 | 5.125%, 04/30/31µ | 274,148 | |||||||||
200,000 | 4.125%, 04/30/28~ | 173,086 | |||||||||
470,000 | Tenet Healthcare Corp.µ 6.875%, 11/15/31 | 434,191 | |||||||||
| Teva Pharmaceutical Finance Netherlands III, BV | |||||||||||
230,000 | 5.125%, 05/09/29^ | 200,776 | |||||||||
200,000 | 4.750%, 05/09/27~ | 181,566 | |||||||||
115,000 | 3.150%, 10/01/26 | 101,232 | |||||||||
3,384,382 | |||||||||||
Industrials (3.2%) | |||||||||||
220,000 | ACCO Brands Corp.*µ 4.250%, 03/15/29 | 182,725 | |||||||||
800,000 | AerCap Holdings, NV~‡ 5.875%, 10/10/79 5 year CMT + 4.54% | 752,496 | |||||||||
Air Lease Corp.~ | |||||||||||
885,000 | 4.125%, 12/15/26 5 year CMT + 3.15% | 636,695 | |||||||||
810,000 | 4.650%, 06/15/26‡ 5 year CMT + 4.08% | 691,861 | |||||||||
CALAMOS CLOSED-END FAMILY OF FUNDS ANNUAL REPORT
214
Long/Short Equity & Dynamic Income Trust Schedule of Investments October 31, 2023
| PRINCIPAL AMOUNT | VALUE | ||||||||||
| Albertsons Companies, Inc. / Safeway, Inc. / New Albertsons, LP / Albertsons, LLC* | |||||||||||
315,000 | 4.625%, 01/15/27µ | $ | 296,487 | ||||||||
145,000 | 5.875%, 02/15/28 | 139,112 | |||||||||
139,000 | 3.500%, 03/15/29~ | 118,621 | |||||||||
220,000 | Allegiant Travel Company*~ 7.250%, 08/15/27 | 200,372 | |||||||||
50,000 | American Airlines Group, Inc.*µ 3.750%, 03/01/25 | 46,817 | |||||||||
108,000 | Arcosa, Inc.* 4.375%, 04/15/29 | 94,566 | |||||||||
740,000 | ARD Finance, SA*~ 6.500%, 06/30/27 7.250% PIK rate | 432,101 | |||||||||
151,000 | Beacon Roofing Supply, Inc.*µ 4.125%, 05/15/29 | 126,920 | |||||||||
90,000 | Bombardier, Inc.*µ 7.875%, 04/15/27 | 86,715 | |||||||||
191,000 | BWX Technologies, Inc.*~ 4.125%, 04/15/29 | 165,236 | |||||||||
185,000 | Cascades, Inc. / Cascades USA, Inc.* 5.375%, 01/15/28 | 168,124 | |||||||||
48,000 | Delta Air Lines, Inc. / SkyMiles IP, Ltd.*µ 4.750%, 10/20/28 | 45,117 | |||||||||
245,000 | Deluxe Corp.*µ 8.000%, 06/01/29 | 194,180 | |||||||||
143,000 | Eco Material Technologies, Inc.*µ 7.875%, 01/31/27 | 136,064 | |||||||||
92,000 | Emerald Debt Merger Sub, LLC* 6.625%, 12/15/30 | 87,645 | |||||||||
85,000 | EnerSys*µ 4.375%, 12/15/27 | 76,351 | |||||||||
118,000 | Graham Packaging Company, Inc.*µ 7.125%, 08/15/28 | 91,741 | |||||||||
88,000 | Graphic Packaging International, LLC* 3.500%, 03/01/29 | 73,917 | |||||||||
203,000 | Great Lakes Dredge & Dock Corp.* 5.250%, 06/01/29 | 166,312 | |||||||||
443,000 | H&E Equipment Services, Inc.*µ 3.875%, 12/15/28 | 376,196 | |||||||||
281,000 | Hawaiian Brand Intellectual Property, Ltd. / HawaiianMiles Loyalty, Ltd.*µ 5.750%, 01/20/26 | 207,884 | |||||||||
290,000 | Herc Holdings, Inc.*µ 5.500%, 07/15/27 | 273,183 | |||||||||
220,000 | IEA Energy Services, LLC*µ 6.625%, 08/15/29 | 210,166 | |||||||||
JELD-WEN, Inc.* | |||||||||||
110,000 | 4.625%, 12/15/25µ | 104,494 | |||||||||
95,000 | 4.875%, 12/15/27 | 81,119 | |||||||||
305,000 | Ken Garff Automotive, LLC*µ 4.875%, 09/15/28 | 259,906 | |||||||||
| PRINCIPAL AMOUNT | VALUE | ||||||||||
185,000 | Knife River Holding Company*~ 7.750%, 05/01/31 | $ | 184,598 | ||||||||
96,000 | MasTec, Inc.*µ 4.500%, 08/15/28 | 84,412 | |||||||||
107,000 | Moog, Inc.*µ 4.250%, 12/15/27 | 97,160 | |||||||||
230,000 | Newfold Digital Holdings Group, Inc.*~ 6.000%, 02/15/29 | 152,060 | |||||||||
172,000 | Novelis Corp.*µ 4.750%, 01/30/30 | 146,639 | |||||||||
70,000 | OI European Group, BV* 4.750%, 02/15/30 | 59,604 | |||||||||
225,000 | Pactiv Evergreen Group Issuer, Inc. / Pactiv Evergreen Group Issuer, LLC*µ 4.000%, 10/15/27 | 198,094 | |||||||||
285,000 | Patrick Industries, Inc.*µ 4.750%, 05/01/29 | 234,301 | |||||||||
95,000 | QVC, Inc. 5.450%, 08/15/34 | 40,462 | |||||||||
Sealed Air Corp.* | |||||||||||
144,000 | 6.125%, 02/01/28 | 137,134 | |||||||||
48,000 | 5.000%, 04/15/29 | 42,837 | |||||||||
98,000 | Sensata Technologies, Inc.* 3.750%, 02/15/31 | 78,582 | |||||||||
Sinclair Television Group, Inc.* | |||||||||||
141,000 | 4.125%, 12/01/30~ | 88,748 | |||||||||
100,000 | 5.500%, 03/01/30 | 54,391 | |||||||||
195,000 | Standard Industries, Inc.*µ 5.000%, 02/15/27 | 180,623 | |||||||||
315,000 | Stanley Black & Decker, Inc.µ‡ 4.000%, 03/15/60 5 year CMT + 2.66% | 258,316 | |||||||||
150,000 | Stericycle, Inc.*~ 3.875%, 01/15/29 | 128,169 | |||||||||
145,000 | STL Holding Company, LLC*µ 7.500%, 02/15/26 | 136,183 | |||||||||
TransDigm, Inc.µ | |||||||||||
243,000 | 6.250%, 03/15/26* | 237,805 | |||||||||
195,000 | 6.875%, 12/15/30* | 188,719 | |||||||||
140,000 | 6.750%, 08/15/28* | 136,254 | |||||||||
135,000 | 7.500%, 03/15/27 | 135,019 | |||||||||
186,000 | Tronox, Inc.*µ 4.625%, 03/15/29 | 146,215 | |||||||||
77,943 | United Airlines Pass Through Trust Series 2019-2, Class Bµ 3.500%, 11/01/29 | 69,080 | |||||||||
187,000 | Vertiv Group Corp.*µ 4.125%, 11/15/28 | 163,653 | |||||||||
201,000 | Wabash National Corp.*µ 4.500%, 10/15/28 | 166,675 | |||||||||
150,000 | Waste Pro USA, Inc.*µ 5.500%, 02/15/26 | 138,382 | |||||||||
107,000 | Williams Scotsman, Inc.*µ 4.625%, 08/15/28 | 95,198 | |||||||||
10,302,436 | |||||||||||
www.calamos.com
215
Long/Short Equity & Dynamic Income Trust Schedule of Investments October 31, 2023
| PRINCIPAL AMOUNT | VALUE | ||||||||||
Information Technology (0.8%) | |||||||||||
96,000 | Booz Allen Hamilton, Inc.*µ 4.000%, 07/01/29 | $ | 84,792 | ||||||||
112,000 | Coherent Corp.*~^ 5.000%, 12/15/29 | 95,227 | |||||||||
299,000 | CommScope Technologies, LLC*~ 6.000%, 06/15/25 | 180,614 | |||||||||
175,000 | CommScope, Inc.*~ 4.750%, 09/01/29 | 119,548 | |||||||||
96,000 | Dun & Bradstreet Corp.* 5.000%, 12/15/29 | 82,717 | |||||||||
56,000 | Fair Isaac Corp.*µ 4.000%, 06/15/28 | 49,960 | |||||||||
210,000 | KBR, Inc.*~ 4.750%, 09/30/28 | 185,188 | |||||||||
MPH Acquisition Holdings, LLC* | |||||||||||
210,000 | 5.750%, 11/01/28~ | 156,817 | |||||||||
95,000 | 5.500%, 09/01/28µ | 79,456 | |||||||||
93,000 | NCL Corp., Ltd.*µ 8.125%, 01/15/29 | 90,986 | |||||||||
96,000 | NCR Voyix Corp.*µ 5.125%, 04/15/29 | 82,663 | |||||||||
143,000 | ON Semiconductor Corp.*~ 3.875%, 09/01/28 | 122,906 | |||||||||
Open Text Corp.*~ | |||||||||||
129,000 | 3.875%, 02/15/28 | 112,368 | |||||||||
90,000 | 6.900%, 12/01/27 | 89,827 | |||||||||
72,000 | 3.875%, 12/01/29 | 59,110 | |||||||||
72,000 | Open Text Holdings, Inc.*~ 4.125%, 12/01/31 | 56,763 | |||||||||
206,000 | Playtika Holding Corp.*µ 4.250%, 03/15/29 | 166,312 | |||||||||
265,000 | TTM Technologies, Inc.*~ 4.000%, 03/01/29 | 218,021 | |||||||||
Twilio, Inc.~ | |||||||||||
130,000 | 3.625%, 03/15/29 | 108,494 | |||||||||
47,000 | 3.875%, 03/15/31 | 37,620 | |||||||||
205,000 | Viavi Solutions, Inc.* 3.750%, 10/01/29 | 163,211 | |||||||||
220,000 | ZoomInfo Technologies, LLC / ZoomInfo Finance Corp.*~ 3.875%, 02/01/29 | 181,903 | |||||||||
2,524,503 | |||||||||||
Materials (0.7%) | |||||||||||
150,000 | ArcelorMittal, SAµ 7.000%, 10/15/39 | 142,668 | |||||||||
90,000 | ATI, Inc.µ 5.875%, 12/01/27 | 83,825 | |||||||||
46,000 | Carpenter Technology Corp.µ 7.625%, 03/15/30 | 45,701 | |||||||||
145,000 | Chemours Company*µ 4.625%, 11/15/29 | 112,213 | |||||||||
| PRINCIPAL AMOUNT | VALUE | ||||||||||
300,000 | Clearwater Paper Corp.*~ 4.750%, 08/15/28 | $ | 265,113 | ||||||||
139,000 | Cleveland-Cliffs, Inc.* 6.750%, 04/15/30 | 129,145 | |||||||||
Commercial Metals Company~ | |||||||||||
96,000 | 4.125%, 01/15/30 | 81,251 | |||||||||
48,000 | 4.375%, 03/15/32 | 38,790 | |||||||||
250,000 | Constellium, SE*µ^ 3.750%, 04/15/29 | 205,882 | |||||||||
96,000 | HB Fuller Company 4.250%, 10/15/28 | 83,322 | |||||||||
200,000 | INEOS Finance, PLC* 6.750%, 05/15/28 | 187,020 | |||||||||
Kaiser Aluminum Corp.*µ | |||||||||||
210,000 | 4.625%, 03/01/28 | 175,533 | |||||||||
24,000 | 4.500%, 06/01/31 | 17,753 | |||||||||
53,000 | LSF11 A5 HoldCo, LLC*µ 6.625%, 10/15/29 | 43,487 | |||||||||
Mercer International, Inc.µ | |||||||||||
244,000 | 5.125%, 02/01/29 | 191,645 | |||||||||
90,000 | 12.875%, 10/01/28* | 91,013 | |||||||||
200,000 | OCI, NV*µ 6.700%, 03/16/33 | 185,102 | |||||||||
Owens-Brockway Glass Container, Inc.* | |||||||||||
135,000 | 7.250%, 05/15/31~ | 123,711 | |||||||||
100,000 | 6.625%, 05/13/27µ | 95,286 | |||||||||
80,000 | Silgan Holdings, Inc.~ 4.125%, 02/01/28 | 71,356 | |||||||||
96,000 | Trinseo Materials Operating SCA / Trinseo Materials Finance, Inc.* 5.125%, 04/01/29 | 41,131 | |||||||||
2,410,947 | |||||||||||
Other (0.1%) | |||||||||||
Gen Digital, Inc.* | |||||||||||
90,000 | 7.125%, 09/30/30^ | 87,733 | |||||||||
90,000 | 6.750%, 09/30/27µ | 87,761 | |||||||||
175,494 | |||||||||||
Real Estate (0.2%) | |||||||||||
152,000 | EPR Propertiesµ 3.750%, 08/15/29 | 120,126 | |||||||||
Forestar Group, Inc.* | |||||||||||
139,000 | 5.000%, 03/01/28µ | 122,606 | |||||||||
97,000 | 3.850%, 05/15/26 | 87,052 | |||||||||
211,000 | MIWD Holdco II, LLC / MIWD Finance Corp.*µ 5.500%, 02/01/30 | 167,612 | |||||||||
95,000 | Service Properties Trustµ 5.250%, 02/15/26 | 85,280 | |||||||||
582,676 | |||||||||||
CALAMOS CLOSED-END FAMILY OF FUNDS ANNUAL REPORT
216
Long/Short Equity & Dynamic Income Trust Schedule of Investments October 31, 2023
| PRINCIPAL AMOUNT | VALUE | ||||||||||
Special Purpose Acquisition Companies (0.1%) | |||||||||||
| Fertitta Entertainment, LLC / Fertitta Entertainment Finance Company, Inc.*µ | |||||||||||
185,000 | 6.750%, 01/15/30 | $ | 147,204 | ||||||||
96,000 | 4.625%, 01/15/29 | 81,052 | |||||||||
228,256 | |||||||||||
Utilities (2.5%) | |||||||||||
910,000 | Algonquin Power & Utilities Corp.~‡ 4.750%, 01/18/82 5 year CMT + 3.25% | 718,736 | |||||||||
200,000 | American Electric Power Company, Inc.‡ 3.875%, 02/15/62 5 year CMT + 2.68% | 158,192 | |||||||||
590,000 | CMS Energy Corp.µ‡ 4.750%, 06/01/50 5 year CMT + 4.12% | 492,792 | |||||||||
Dominion Energy, Inc.‡ | |||||||||||
580,000 | 4.650%, 12/15/24µ 5 year CMT + 2.99% | 527,846 | |||||||||
367,000 | 4.350%, 01/15/27~ 5 year CMT + 3.20% | 296,448 | |||||||||
Duke Energy Corp.µ‡ | |||||||||||
800,000 | 4.875%, 09/16/24 5 year CMT + 3.39% | 774,576 | |||||||||
368,000 | 3.250%, 01/15/82 5 year CMT + 2.32% | 265,998 | |||||||||
510,000 | Emera, Inc.~‡ 6.750%, 06/15/76 3 mo. USD LIBOR + 5.44% | 479,813 | |||||||||
| National Rural Utilities Cooperative Finance Corp.µ‡ | |||||||||||
712,000 | 7.125%, 09/15/53 5 year CMT + 3.53% | 707,159 | |||||||||
385,000 | 5.250%, 04/20/46 3 mo. USD LIBOR + 3.63% | 363,024 | |||||||||
770,000 | NextEra Energy Capital Holdings, Inc.µ‡ 3.800%, 03/15/82 5 year CMT + 2.55% | 617,093 | |||||||||
434,000 | PPL Capital Funding, Inc.µ‡ 8.317%, 03/30/67 3 mo. SOFR + 2.93% | 393,226 | |||||||||
Sempra‡ | |||||||||||
560,000 | 4.875%, 10/15/25~ 5 year CMT + 4.55% | 524,054 | |||||||||
240,000 | 4.125%, 04/01/52µ 5 year CMT + 2.87% | 187,680 | |||||||||
Southern Companyµ‡ | |||||||||||
873,000 | 4.000%, 01/15/51 5 year CMT + 3.73% | 797,791 | |||||||||
280,000 | 3.750%, 09/15/51 5 year CMT + 2.92% | 238,398 | |||||||||
| PRINCIPAL AMOUNT | VALUE | ||||||||||
Vistra Corp.*µ‡ | |||||||||||
305,000 | 7.000%, 12/15/26 5 year CMT + 5.74% | $ | 279,014 | ||||||||
185,000 | 8.000%, 10/15/26 5 year CMT + 6.93% | 176,005 | |||||||||
205,000 | WEC Energy Group, Inc.µ‡ 7.739%, 05/15/67 3 mo. SOFR + 2.37% | 178,075 | |||||||||
8,175,920 | |||||||||||
TOTAL CORPORATE BONDS (Cost $126,123,832) | 109,156,303 | ||||||||||
CONVERTIBLE BONDS (0.2%) | |||||||||||
Communication Services (0.1%) | |||||||||||
138,000 | Cable One, Inc.µ 0.000%, 03/15/26 | 112,979 | |||||||||
Consumer Discretionary (0.1%) | |||||||||||
DISH Network Corp. | |||||||||||
211,000 | 2.375%, 03/15/24µ | 202,182 | |||||||||
272,000 | 0.000%, 12/15/25 | 166,883 | |||||||||
369,065 | |||||||||||
Other (0.0%) | |||||||||||
95,000 | Multiplan Corp.* 6.000%, 10/15/27 | 63,177 | |||||||||
TOTAL CONVERTIBLE BONDS (Cost $586,810) | 545,221 | ||||||||||
BANK LOANS (2.8%)¡ | |||||||||||
Airlines (0.1%) | |||||||||||
148,500 | American Airlines, Inc.‡ 10.427%, 04/20/28 3 mo. SOFR + 4.75% | 150,821 | |||||||||
138,750 | Mileage Plus Holdings, LLC‡ 10.798%, 06/21/27 3 mo. SOFR + 5.25% | 143,219 | |||||||||
294,040 | |||||||||||
Communication Services (0.1%) | |||||||||||
48,730 | Clear Channel Outdoor Holdings, Inc.‡! 0.000%, 08/21/26 | 46,923 | |||||||||
56,733 | DIRECTV Financing, LLC‡ 10.325%, 08/02/27 1 mo. SOFR + 5.00% | 55,305 | |||||||||
284,000 | Entercom Media Corp.‡ 8.145%, 11/18/24 3 mo. SOFR + 2.50% | 124,916 | |||||||||
90,000 | Telesat Canada‡ 8.434%, 12/07/26 3 mo. SOFR + 2.75% | 62,032 | |||||||||
289,176 | |||||||||||
www.calamos.com
217
Long/Short Equity & Dynamic Income Trust Schedule of Investments October 31, 2023
| PRINCIPAL AMOUNT | VALUE | ||||||||||
Consumer Discretionary (0.5%) | |||||||||||
88,667 | American Axle and Manufacturing, Inc.‡ 9.006%, 12/13/29 3 mo. SOFR + 3.50% | $ | 88,482 | ||||||||
59,083 | American Axle and Manufacturing, Inc.‡ 8.941%, 12/13/29 1 mo. SOFR + 3.50% | 58,960 | |||||||||
179,100 | Caesars Entertainment Corp.‡ 8.674%, 02/06/30 1 mo. SOFR + 3.25% | 178,677 | |||||||||
184,538 | Carnival Corp.‡ 8.336%, 08/08/27 1 mo. SOFR + 3.00% | 181,539 | |||||||||
189,050 | Hanesbrands, Inc.‡ 9.074%, 03/08/30 1 mo. SOFR + 3.75% | 186,923 | |||||||||
109,382 | Life Time Fitness, Inc.‡ 10.130%, 01/15/26 3 mo. SOFR + 4.75% | 109,615 | |||||||||
224,050 | Petco Health and Wellness Company, Inc.‡ 8.902%, 03/03/28 3 mo. SOFR + 3.25% | 219,445 | |||||||||
312,641 | PetSmart, Inc.‡ 9.174%, 02/11/28 1 mo. SOFR + 3.75% | 309,352 | |||||||||
124,629 | TKC Holdings, Inc.‡ 10.939%, 05/15/28 1 mo. SOFR + 5.50% | 119,643 | |||||||||
45,000 | Windsor Holdings III, LLC‡ 9.815%, 08/01/30 1 mo. SOFR + 4.50% | 44,924 | |||||||||
1,497,560 | |||||||||||
Consumer Staples (0.1%) | |||||||||||
185,000 | Star Parent, Inc.‡ 9.386%, 09/27/30 3 mo. LIBOR + 4.00% | 176,861 | |||||||||
100,000 | United Natural Foods, Inc.‡! 8.689%, 10/22/25 1 mo. SOFR + 3.25% | 99,861 | |||||||||
276,722 | |||||||||||
Energy (0.1%) | |||||||||||
100,000 | New Fortress Energy, Inc.! 0.000%, 10/23/30 | 92,500 | |||||||||
239,025 | Par Petroleum, LLC‡ 9.773%, 02/28/30 3 mo. SOFR + 4.25% | 238,726 | |||||||||
331,226 | |||||||||||
Financials (0.5%) | |||||||||||
45,000 | Advisor Group, Inc.‡ 9.824%, 08/17/28 1 mo. SOFR + 4.50% | 44,851 | |||||||||
| PRINCIPAL AMOUNT | VALUE | ||||||||||
184,073 | Alliant Holdings Intermediate, LLC‡ 8.835%, 11/05/27 1 mo. SOFR + 3.50% | $ | 183,661 | ||||||||
97,945 | Amynta Agency Borrower, Inc.‡ 10.325%, 02/28/28 1 mo. SOFR + 5.00% | 98,014 | |||||||||
35,802 | Amynta Agency Borrower, Inc.‡ 10.424%, 02/28/28 1 mo. SOFR + 5.00% | 35,827 | |||||||||
173,241 | AssuredPartners, Inc.‡ 8.824%, 02/12/27 1 mo. SOFR + 3.50% | 171,942 | |||||||||
139,650 | Avolon TLB Borrower 1 LLC‡ 7.839%, 06/22/28 1 mo. SOFR + 2.50% | 139,845 | |||||||||
154,771 | Castlelake Aviation, Ltd.! 0.000%, 10/22/26 | 154,674 | |||||||||
99,250 | Castlelake Aviation, Ltd.‡ 8.421%, 10/22/27 3 mo. SOFR + 2.75% | 99,135 | |||||||||
183,613 | Hub International, Ltd.‡ 9.365%, 11/10/29 3 mo. SOFR + 4.00% | 183,586 | |||||||||
198,163 | Jazz Financing Lux Sarl‡ 8.939%, 05/05/28 1 mo. SOFR + 3.50% | 198,328 | |||||||||
257,400 | VFH Parent, LLC‡ 8.427%, 01/13/29 1 mo. SOFR + 3.00% | 256,140 | |||||||||
1,566,003 | |||||||||||
Health Care (0.4%) | |||||||||||
322,823 | Amneal Pharmaceuticals, LLC‡ 8.939%, 05/04/25 1 mo. SOFR + 3.50% | 316,999 | |||||||||
104,187 | Icon Luxembourg Sarl‡ 7.902%, 07/03/28 3 mo. SOFR + 2.25% | 104,368 | |||||||||
249,936 | Mallinckrodt International Finance, SA‡ 12.703%, 09/30/27 1 mo. SOFR + 7.25% | 190,438 | |||||||||
207,059 | Padagis, LLC‡ 10.434%, 07/06/28 3 mo. SOFR + 4.75% | 184,455 | |||||||||
25,958 | PRA Health Sciences, Inc.‡ 7.902%, 07/03/28 3 mo. SOFR + 2.25% | 26,003 | |||||||||
811,319 | Team Health Holdings, Inc.‡ 10.633%, 03/02/27 3 mo. SOFR + 5.25% | 586,401 | |||||||||
2,313 | Team Health Holdings, Inc.‡ 10.574%, 03/02/27 1 mo. SOFR + 5.25% | 1,672 | |||||||||
1,410,336 | |||||||||||
CALAMOS CLOSED-END FAMILY OF FUNDS ANNUAL REPORT
218
Long/Short Equity & Dynamic Income Trust Schedule of Investments October 31, 2023
| PRINCIPAL AMOUNT | VALUE | ||||||||||
Industrials (0.3%) | |||||||||||
97,750 | ACProducts, Inc.‡ 9.902%, 05/17/28 3 mo. SOFR + 4.25% | $ | 78,010 | ||||||||
118,500 | Air Canada‡ 9.128%, 08/11/28 3 mo. SOFR + 3.50% | 118,530 | |||||||||
233,238 | ChampionX Corp.‡ 8.177%, 06/07/29 1 mo. SOFR + 2.75% | 234,294 | |||||||||
121,864 | Emrld Borrower, LP‡ 8.380%, 05/31/30 3 mo. SOFR + 3.00% | 121,750 | |||||||||
197,500 | Scientific Games International, Inc.‡ 8.435%, 04/14/29 1 mo. SOFR + 3.00% | 197,562 | |||||||||
194,005 | United Airlines, Inc.‡ 9.189%, 04/21/28 1 mo. SOFR + 3.75% | 193,884 | |||||||||
944,030 | |||||||||||
Information Technology (0.2%) | |||||||||||
176,785 | Banff Merger Sub, Inc.‡ 9.189%, 10/02/25 1 mo. SOFR + 3.75% | 176,822 | |||||||||
125,000 | Central Parent, Inc.! 0.000%, 07/06/29 | 124,453 | |||||||||
44,663 | Central Parent, Inc.‡ 9.406%, 07/06/29 3 mo. SOFR + 4.00% | 44,467 | |||||||||
173,741 | Dun & Bradstreet Corp.‡ 8.176%, 02/06/26 1 mo. SOFR + 2.75% | 173,741 | |||||||||
178,260 | II-VI, Inc.‡ 8.189%, 07/02/29 1 mo. SOFR + 2.75% | 178,176 | |||||||||
697,659 | |||||||||||
Information Technology (0.1%) | |||||||||||
209,772 | Camelot Finance SA‡ 8.439%, 10/30/26 1 mo. SOFR + 3.00% | 209,751 | |||||||||
Materials (0.3%) | |||||||||||
135,000 | Chemours Company‡ 8.824%, 08/18/28 1 mo. SOFR + 2.50% | 131,625 | |||||||||
184,538 | Ineos US Finance, LLC‡ 8.825%, 02/18/30 1 mo. SOFR + 3.50% | 180,933 | |||||||||
224,542 | Innophos, Inc.‡ 8.689%, 02/05/27 1 mo. SOFR + 3.25% | 222,578 | |||||||||
234,413 | LSF11 A5 Holdco, LLC‡ 9.674%, 10/15/28 1 mo. SOFR + 4.25% | 230,384 | |||||||||
| PRINCIPAL AMOUNT | VALUE | ||||||||||
89,542 | Trinseo Materials Operating SCA‡ 7.939%, 05/03/28 1 mo. SOFR + 2.50% | $ | 71,516 | ||||||||
188,787 | W.R. Grace & Co.-Conn.‡ 9.402%, 09/22/28 3 mo. LIBOR + 3.75% | 185,719 | |||||||||
1,022,755 | |||||||||||
Special Purpose Acquisition Companies (0.1%) | |||||||||||
98,750 | Clydesdale Acquisition Holdings, Inc.‡ 9.599%, 04/13/29 1 mo. SOFR + 4.18% | 95,767 | |||||||||
44,325 | Fertitta Entertainment, LLC‡ 9.324%, 01/27/29 1 mo. SOFR + 4.00% | 43,415 | |||||||||
198,000 | Oscar AcquisitionCo, LLC‡ 9.990%, 04/29/29 3 mo. SOFR + 4.50% | 193,195 | |||||||||
178,200 | Patagonia Holdco, LLC‡ 11.117%, 08/01/29 3 mo. SOFR + 5.75% | 154,588 | |||||||||
486,965 | |||||||||||
TOTAL BANK LOANS (Cost $9,488,009) | 9,026,223 | ||||||||||
| NUMBER OF SHARES | VALUE | ||||||||||
PREFERRED STOCKS (2.9%) | |||||||||||
Communication Services (0.6%) | |||||||||||
21,155 | AT&T, Inc.µ 4.750%, 02/18/25 | 365,981 | |||||||||
9,450 | AT&T, Inc.µ 5.350%, 11/01/66 | 197,978 | |||||||||
36,510 | Qwest Corp.µ 6.500%, 09/01/56 | 441,406 | |||||||||
22,306 | Telephone and Data Systems, Inc.µ 6.000%, 09/30/26 | 286,632 | |||||||||
26,898 | United States Cellular Corp.µ 5.500%, 03/01/70 | 399,704 | |||||||||
22,660 | United States Cellular Corp.µ 5.500%, 06/01/70 | 331,289 | |||||||||
2,022,990 | |||||||||||
Consumer Discretionary (0.2%) | |||||||||||
7,685 | Ford Motor Companyµ 6.200%, 06/01/59 | 164,920 | |||||||||
7,236 | Ford Motor Companyµ 6.500%, 08/15/62 | 151,377 | |||||||||
3,615 | Guitar Center, Inc.&# | 381,383 | |||||||||
1,670 | Qurate Retail, Inc.µ 8.000%, 03/15/31 | 39,746 | |||||||||
737,426 | |||||||||||
www.calamos.com
219
Long/Short Equity & Dynamic Income Trust Schedule of Investments October 31, 2023
| NUMBER OF SHARES | VALUE | ||||||||||
Energy (0.6%) | |||||||||||
31,635 | Energy Transfer, LP~‡ 10.364%, 11/30/23 3 mo. USD LIBOR + 4.74% | $ | 792,773 | ||||||||
22,515 | NuStar Energy, LP~‡ 11.315%, 11/30/23 3 mo. SOFR + 5.90% | 565,126 | |||||||||
17,500 | NuStar Logistics, LP~‡ 12.390%, 01/15/43 3 mo. SOFR + 7.00% | 454,650 | |||||||||
1,812,549 | |||||||||||
Financials (1.0%) | |||||||||||
8,975 | Affiliated Managers Group, Inc.µ 4.750%, 09/30/60 | 146,562 | |||||||||
14,000 | Allstate Corp.µ 7.375%, 07/15/28 | 360,780 | |||||||||
15,560 | Annaly Capital Management, Inc.µ‡ 10.637%, 11/30/23 3 mo. USD LIBOR + 4.99% | 377,174 | |||||||||
3,850 | Bank OZKµ 4.625%, 11/15/26 | 57,365 | |||||||||
3,675 | Capital One Financial Corp.µ 4.800%, 06/01/25 | 57,808 | |||||||||
27,375 | CNO Financial Group, Inc.µ 5.125%, 11/25/60 | 418,838 | |||||||||
4,608 | Cullen/Frost Bankers, Inc.µ 4.450%, 12/15/25 | 73,958 | |||||||||
8,134 | First Citizens BancShares, Inc.µ^ 5.625%, 01/04/27 | 156,661 | |||||||||
3,288 | Goldman Sachs Group, Inc.µ‡ 6.375%, 05/10/24 3 mo. SOFR + 3.81% | 82,726 | |||||||||
8,383 | KeyCorpµ‡ 6.200%, 12/15/27 5 year CMT + 3.13% | 140,080 | |||||||||
5,400 | Morgan Stanleyµ 6.500%, 10/15/27 | 133,164 | |||||||||
20,881 | Prospect Capital Corp.~^ 5.350%, 07/01/26 | 330,337 | |||||||||
28,900 | Reinsurance Group of America, Inc.µ‡ 7.125%, 10/15/52 5 year CMT + 3.46% | 736,950 | |||||||||
16,896 | Selective Insurance Group, Inc.µ 4.600%, 12/15/25 | 266,957 | |||||||||
3,339,360 | |||||||||||
Industrials (0.1%) | |||||||||||
12,312 | WESCO International, Inc.µ‡ 10.625%, 06/22/25 5 year CMT + 10.33% | 328,238 | |||||||||
Real Estate (0.2%) | |||||||||||
23,352 | Brookfield Property Partners, LPµ 5.750%, 03/31/25 | 228,849 | |||||||||
| NUMBER OF SHARES | VALUE | ||||||||||
12,800 | Brookfield Property Partners, LPµ 6.375%, 09/30/24 | $ | 140,416 | ||||||||
6,245 | Global Net Lease, Inc.µ 6.875%, 11/26/24 | 98,484 | |||||||||
| 5,466 | Global Net Lease, Inc.µ‡‡ 7.500% | 92,922 | |||||||||
8,025 | Spirit Realty Capital, Inc.µ 6.000%, 11/30/23 | 178,075 | |||||||||
738,746 | |||||||||||
Utilities (0.2%) | |||||||||||
14,975 | Brookfield Renewable Partners, LP~ 5.250%, 03/31/25 | 240,948 | |||||||||
13,450 | DTE Energy Companyµ 5.250%, 12/01/77 | 288,906 | |||||||||
529,854 | |||||||||||
TOTAL PREFERRED STOCKS (Cost $11,606,386) | 9,509,163 | ||||||||||
COMMON STOCKS (86.1%) | |||||||||||
Communication Services (4.7%) | |||||||||||
122,500 | Alphabet, Inc. - Class Aµ# | 15,199,800 | |||||||||
3,935 | Altice USA, Inc. - Class A# | 11,372 | |||||||||
1,322 | Cumulus Media, Inc. - Class Aµ# | 5,963 | |||||||||
15,217,135 | |||||||||||
Consumer Discretionary (11.9%) | |||||||||||
134,000 | Amazon.com, Inc.µ# | 17,834,060 | |||||||||
131,500 | Caesars Entertainment, Inc.µ# | 5,245,535 | |||||||||
77,500 | Hyatt Hotels Corp. - Class Aµ | 7,939,100 | |||||||||
40,500 | Marriott International, Inc. - Class Aµ | 7,636,680 | |||||||||
38,655,375 | |||||||||||
Consumer Staples (2.5%) | |||||||||||
122,500 | Sysco Corp.µ | 8,145,025 | |||||||||
Energy (0.1%) | |||||||||||
560 | Chesapeake Energy Corp.µ^ | 48,205 | |||||||||
12,950 | Energy Transfer, LP~ | 170,292 | |||||||||
3,970 | Enterprise Products Partners, LP | 103,379 | |||||||||
321,876 | |||||||||||
Financials (9.8%) | |||||||||||
483,500 | Huntington Bancshares, Inc.µ | 4,665,775 | |||||||||
127,000 | Morgan Stanleyµ | 8,994,140 | |||||||||
51,000 | Visa, Inc. - Class Aµ | 11,990,100 | |||||||||
153,500 | Wells Fargo & Companyµ | 6,104,695 | |||||||||
31,754,710 | |||||||||||
Health Care (13.7%) | |||||||||||
68,000 | Danaher Corp.µ | 13,057,360 | |||||||||
132,000 | Medtronic, PLCµ | 9,313,920 | |||||||||
109,000 | Merck & Company, Inc.µ | 11,194,300 | |||||||||
104,500 | Zimmer Biomet Holdings, Inc.µ | 10,910,845 | |||||||||
44,476,425 | |||||||||||
CALAMOS CLOSED-END FAMILY OF FUNDS ANNUAL REPORT
220
Long/Short Equity & Dynamic Income Trust Schedule of Investments October 31, 2023
| NUMBER OF SHARES | VALUE | ||||||||||
Industrials (27.4%) | |||||||||||
228,500 | Air Lease Corp.µ | $ | 7,912,955 | ||||||||
559,000 | American Airlines Group, Inc.µ^# | 6,232,850 | |||||||||
375,000 | CSX Corp.µ | 11,193,750 | |||||||||
50,000 | Honeywell International, Inc.µ | 9,163,000 | |||||||||
89,500 | L3Harris Technologies, Inc.µ | 16,057,195 | |||||||||
46,500 | Paycom Software, Inc.µ | 11,391,105 | |||||||||
62,500 | RTX Corp.µ | 5,086,875 | |||||||||
30,500 | Union Pacific Corp.µ | 6,332,105 | |||||||||
449,000 | United Airlines Holdings, Inc.µ# | 15,719,490 | |||||||||
89,089,325 | |||||||||||
Information Technology (14.7%) | |||||||||||
75,500 | Advanced Micro Devices, Inc.µ# | 7,436,750 | |||||||||
17,800 | Analog Devices, Inc.µ | 2,800,474 | |||||||||
132,000 | Intel Corp.µ | 4,818,000 | |||||||||
45,300 | Microsoft Corp.µ | 15,316,383 | |||||||||
89,500 | Oracle Corp.µ | 9,254,300 | |||||||||
94,500 | Taiwan Semiconductor Manufacturing Company, Ltd. (ADR)~ | 8,156,295 | |||||||||
47,782,202 | |||||||||||
Materials (1.1%) | |||||||||||
8,900 | Linde, PLCµ | 3,401,224 | |||||||||
Special Purpose Acquisition Company (0.0%) | |||||||||||
1,380 | Intelsat Emergence, SA~&# | 32,775 | |||||||||
Utilities (0.3%) | |||||||||||
| 9,999 | Veralto Corp. | 689,931 | |||||||||
TOTAL COMMON STOCKS (Cost $315,189,109) | 279,566,003 | ||||||||||
EXCHANGE-TRADED FUND (4.4%) | |||||||||||
Other (4.4%) | |||||||||||
172,000 | iShares 20+ Year Treasury Bond ETF (Cost $15,395,455) | 14,375,760 | |||||||||
| NUMBER OF CONTRACTS/ NOTIONAL AMOUNT | VALUE | ||||||||||
PURCHASED OPTIONS (1.0%)# | |||||||||||
Communication Services (0.4%) | |||||||||||
810 | Alphabet, Inc. | ||||||||||
10,050,480 | Put, 11/03/23, Strike $138.00 | 1,138,050 | |||||||||
Consumer Discretionary (0.0%) | |||||||||||
790 | Amazon.com, Inc. | ||||||||||
10,514,110 | Put, 11/03/23, Strike $118.00 | 1,975 | |||||||||
Financials (0.1%) | |||||||||||
1,800 | PayPal Holdings, Inc. | ||||||||||
9,324,000 | Call, 11/03/23, Strike $55.00 | 199,800 | |||||||||
| NUMBER OF CONTRACTS/ NOTIONAL AMOUNT | VALUE | ||||||||||
Health Care (0.0%) | |||||||||||
1,090 | Merck & Company, Inc. | ||||||||||
11,194,300 | Put, 11/03/23, Strike $103.00 | $ | 107,365 | ||||||||
Industrials (0.0%) | |||||||||||
5,840 | Delta Air Lines, Inc. | ||||||||||
18,250,000 | Call, 11/17/23, Strike $37.00 | 14,600 | |||||||||
625 | RTX Corp. | ||||||||||
5,086,875 | Put, 11/17/23, Strike $75.00 | 10,313 | |||||||||
24,913 | |||||||||||
Information Technology (0.1%) | |||||||||||
Advanced Micro Devices, Inc. | |||||||||||
755 |
| ||||||||||
7,436,750 | Put, 11/10/23, Strike $95.00 | 214,797 | |||||||||
305 |
| ||||||||||
3,004,250 | Call, 11/17/23, Strike $115.00 | 18,910 | |||||||||
220 | Apple, Inc. | ||||||||||
3,756,940 | Call, 11/17/23, Strike $170.00 | 116,600 | |||||||||
285 | Microsoft Corp. | ||||||||||
9,636,135 | Put, 11/03/23, Strike $327.50 | 18,810 | |||||||||
60 | ServiceNow, Inc. | ||||||||||
3,491,100 | Put, 11/10/23, Strike $510.00 | 2,250 | |||||||||
510 | Visa, Inc. | ||||||||||
11,990,100 | Put, 11/03/23, Strike $235.00 | 86,700 | |||||||||
458,067 | |||||||||||
Other (0.4%) | |||||||||||
5,160 | iShares 20+ Year Treasury Bond | ||||||||||
43,127,280 | ETF | ||||||||||
Call, 11/03/23, Strike $85.00 | 144,480 | ||||||||||
1,500 | SPDR S&P 500 ETF Trust | ||||||||||
62,730,000 | Put, 11/01/23, Strike $416.00 | 177,000 | |||||||||
3,120 | SPDR S&P Regional Banking | ||||||||||
12,377,040 | ETF | ||||||||||
Put, 11/17/23, Strike $41.00 | 583,440 | ||||||||||
5,150 | U.S. Global Jets ETF | ||||||||||
7,683,800 | Call, 12/01/23, Strike $15.00 | 270,375 | |||||||||
1,175,295 | |||||||||||
TOTAL PURCHASED OPTIONS (Cost $4,058,192) | 3,105,465 | ||||||||||
TOTAL INVESTMENTS (131.0%) (Cost $482,581,197) | 425,412,594 | ||||||||||
LIABILITIES, LESS OTHER ASSETS (-31.0%) | (100,635,526 | ) | |||||||||
NET ASSETS (100.0%) | $ | 324,777,068 | |||||||||
www.calamos.com
221
Long/Short Equity & Dynamic Income Trust Schedule of Investments October 31, 2023
| NUMBER OF SHARES | VALUE | ||||||||||
COMMON STOCKS SOLD SHORT (-12.8%)# | |||||||||||
Consumer Discretionary (-1.5%) | |||||||||||
(24,000 | ) | Tesla, Inc. | $ | (4,820,160 | ) | ||||||
Consumer Staples (-2.7%) | |||||||||||
(54,000 | ) | Walmart, Inc. | (8,824,140 | ) | |||||||
Financials (-1.5%) | |||||||||||
(182,000 | ) | Bank of America Corp. | (4,793,880 | ) | |||||||
Information Technology (-6.3%) | |||||||||||
(44,000 | ) | Apple, Inc. | (7,513,880 | ) | |||||||
(14,300 | ) | Lam Research Corp. | (8,411,546 | ) | |||||||
(23,000 | ) | Salesforce, Inc. | (4,619,090 | ) | |||||||
(20,544,516 | ) | ||||||||||
Real Estate (-0.5%) | |||||||||||
(13,000 | ) | Digital Realty Trust, Inc. | (1,616,680 | ) | |||||||
Utilities (-0.3%) | |||||||||||
| (9,999 | ) | Veralto Corp. | (689,931 | ) | |||||||
| TOTAL COMMON STOCKS SOLD SHORT(Proceeds $39,558,658) | (41,289,307 | ) | |||||||||
EXCHANGE-TRADED FUNDS SOLD SHORT (-63.8%)# | |||||||||||
Other (-63.8%) | |||||||||||
(127,500 | ) | Industrial Select Sector SPDR Fund | (12,540,900 | ) | |||||||
(438,200 | ) | SPDR S&P 500 ETF Trust | (183,255,240 | ) | |||||||
(82,000 | ) | VanEck Semiconductor ETF | (11,393,900 | ) | |||||||
| TOTAL EXCHANGE-TRADED FUNDS SOLD SHORT(Proceeds $211,326,463) | (207,190,040 | ) | |||||||||
| TOTAL SECURITIES SOLD SHORT(Proceeds $250,885,121) | (248,479,347 | ) | |||||||||
| NUMBER OF CONTRACTS/ NOTIONAL AMOUNT | VALUE | ||||||||||
WRITTEN OPTIONS (-1.2%)# | |||||||||||
Communication Services (-0.2%) | |||||||||||
Alphabet, Inc. | |||||||||||
1,215 |
| ||||||||||
15,075,720 | Put, 12/15/23, Strike $110.00 | (101,453 | ) | ||||||||
810 |
| ||||||||||
10,050,480 | Put, 11/17/23, Strike $130.00 | (524,475 | ) | ||||||||
(625,928 | ) | ||||||||||
Consumer Discretionary (-0.1%) | |||||||||||
Amazon.com, Inc. | |||||||||||
1,580 |
| ||||||||||
21,028,220 | Put, 12/15/23, Strike $105.00 | (58,460 | ) | ||||||||
395 |
| ||||||||||
5,257,055 | Call, 12/15/23, Strike $135.00 | (213,300 | ) | ||||||||
| NUMBER OF CONTRACTS/ NOTIONAL AMOUNT | VALUE | ||||||||||
240 | Tesla, Inc. | ||||||||||
4,820,160 | Put, 12/15/23, Strike $190.00 | $ | (218,400 | ) | |||||||
(490,160 | ) | ||||||||||
Financials (-0.1%) | |||||||||||
1,820 | Bank of America Corp. | ||||||||||
4,793,880 | Put, 12/15/23, Strike $24.00 | (66,430 | ) | ||||||||
600 | PayPal Holdings, Inc. | ||||||||||
3,108,000 | Put, 11/17/23, Strike $52.00 | (171,000 | ) | ||||||||
(237,430 | ) | ||||||||||
Health Care (0.0%) | |||||||||||
1,090 | Merck & Company, Inc. | ||||||||||
11,194,300 | Put, 12/15/23, Strike $95.00 | (82,840 | ) | ||||||||
Industrials (-0.2%) | |||||||||||
2,920 | Delta Air Lines, Inc. | ||||||||||
9,125,000 | Call, 11/17/23, Strike $35.00 | (21,900 | ) | ||||||||
625 | RTX Corp. | ||||||||||
5,086,875 | Call, 11/17/23, Strike $80.00 | (145,937 | ) | ||||||||
2,540 | United Airlines Holdings, Inc. | ||||||||||
8,892,540 | Put, 11/17/23, Strike $36.00 | (424,180 | ) | ||||||||
(592,017 | ) | ||||||||||
Information Technology (-0.2%) | |||||||||||
Advanced Micro Devices, Inc. | |||||||||||
755 |
| ||||||||||
7,436,750 | Put, 11/10/23, Strike $85.00 | (44,167 | ) | ||||||||
755 |
| ||||||||||
7,436,750 | Put, 12/15/23, Strike $85.00 | (151,755 | ) | ||||||||
445 | Analog Devices, Inc. | ||||||||||
7,001,185 | Put, 12/15/23, Strike $140.00 | (74,538 | ) | ||||||||
440 | Apple, Inc. | ||||||||||
7,513,880 | Put, 12/15/23, Strike $150.00 | (47,960 | ) | ||||||||
143 | Lam Research Corp. | ||||||||||
8,411,546 | Put, 12/15/23, Strike $520.00 | (114,400 | ) | ||||||||
Microsoft Corp. | |||||||||||
285 |
| ||||||||||
9,636,135 | Put, 11/03/23, Strike $317.50 | (4,417 | ) | ||||||||
215 |
| ||||||||||
7,269,365 | Put, 12/15/23, Strike $300.00 | (44,398 | ) | ||||||||
120 | ServiceNow, Inc. | ||||||||||
6,982,200 | Put, 12/15/23, Strike $440.00 | (20,100 | ) | ||||||||
Visa, Inc. | |||||||||||
510 |
| ||||||||||
11,990,100 | Call, 12/15/23, Strike $250.00 | (63,750 | ) | ||||||||
510 |
| ||||||||||
11,990,100 | Put, 12/15/23, Strike $205.00 | (37,230 | ) | ||||||||
(602,715 | ) | ||||||||||
Other (-0.4%) | |||||||||||
1,590 | Industrial Select Sector SPDR | ||||||||||
15,639,240 | Put, 11/17/23, Strike $96.00 | (118,455 | ) | ||||||||
1,720 | iShares 20+ Year Treasury Bond | ||||||||||
14,375,760 | ETF | ||||||||||
Call, 11/03/23, Strike $83.00 | (183,180 | ) | |||||||||
CALAMOS CLOSED-END FAMILY OF FUNDS ANNUAL REPORT
222
Long/Short Equity & Dynamic Income Trust Schedule of Investments October 31, 2023
| NUMBER OF CONTRACTS/ NOTIONAL AMOUNT | VALUE | ||||||||||
1,090 | SPDR S&P 500 ETF Trust | ||||||||||
45,583,800 | Put, 01/19/24, Strike $360.00 | $ | (185,300 | ) | |||||||
3,250 |
| ||||||||||
135,915,000 | Put, 12/15/23, Strike $370.00 | (339,625 | ) | ||||||||
1,085 |
| ||||||||||
45,374,700 | Put, 12/15/23, Strike $380.00 | (176,313 | ) | ||||||||
3,120 | SPDR S&P Regional Banking | ||||||||||
12,377,040 | ETF | ||||||||||
Put, 12/15/23, Strike $35.00 | (166,920 | ) | |||||||||
5,150 | U.S. Global Jets ETF | ||||||||||
7,683,800 | Put, 12/01/23, Strike $14.50 | (164,800 | ) | ||||||||
(1,334,593 | ) | ||||||||||
| TOTAL WRITTEN OPTIONS(Premium $4,521,827) | $ | (3,965,683 | ) | ||||||||
NOTES TO SCHEDULE OF INVESTMENTS
* Securities issued and sold pursuant to a Rule 144A transaction are exempted from the registration requirement of the Securities Act of 1933, as amended. These securities may only be sold to qualified institutional buyers ("QIBs"), such as the Fund. Any resale of these securities must generally be effected through a sale that is registered under the Act or otherwise exempted from such registration requirements.
~ Security, or portion of security, is segregated as collateral (or potential collateral for future transactions) for written options. The aggregate value of such securities is $142,118,090.
µ Security, or portion of security, is held in a segregated account as collateral for note payable aggregating a total value of $223,090,846.
^ Security, or portion of security, is on loan.
@ In default status and considered non-income producing.
‡ Variable rate security. The rate shown is the rate in effect at October 31, 2023.
¡ Bank loans generally are subject to mandatory and/or optional prepayment. As a result, the actual remaining maturity of bank loans may be substantially less than the stated maturities shown.
! This position represents an unsettled loan commitment at period end. Certain details associated with this purchase are not known prior to the settlement date, including coupon rate, which will be adjusted on settlement date.
& Illiquid security.
# Non-income producing security.
Note: The date on options represents the expiration date of the option contract. The option contract may be exercised at any date on or before the date shown.
www.calamos.com
223
Long/Short Equity & Dynamic Income Trust Schedule of Investments October 31, 2023
The following table summarizes the Fund's investments and derivative financial instruments categorized in the fair value hierarchy as of October 31, 2023 (see Note 1):
|
LEVEL 1 |
LEVEL 2 |
LEVEL 3 |
TOTAL |
||||||||||||||||
|
Assets: |
|||||||||||||||||||
|
Asset Backed Security |
$ |
— |
$ |
128,456 |
$ |
— |
$ |
128,456 |
|||||||||||
|
Corporate Bonds |
— |
109,156,303 |
— |
109,156,303 |
|||||||||||||||
|
Convertible Bonds |
— |
545,221 |
— |
545,221 |
|||||||||||||||
|
Bank Loans |
— |
9,026,223 |
— |
9,026,223 |
|||||||||||||||
|
Preferred Stocks |
8,796,491 |
712,672 |
— |
9,509,163 |
|||||||||||||||
|
Common Stocks |
279,533,228 |
32,775 |
— |
279,566,003 |
|||||||||||||||
|
Exchange-traded Fund |
14,375,760 |
— |
— |
14,375,760 |
|||||||||||||||
|
Purchased Options |
3,105,465 |
— |
— |
3,105,465 |
|||||||||||||||
|
Total |
$ |
305,810,944 |
$ |
119,601,650 |
$ |
— |
$ |
425,412,594 |
|||||||||||
|
Liabilities: |
|||||||||||||||||||
|
Common Stocks Sold Short |
$ |
41,289,307 |
$ |
— |
$ |
— |
$ |
41,289,307 |
|||||||||||
|
Exchange-traded Funds Sold Short |
207,190,040 |
— |
— |
207,190,040 |
|||||||||||||||
|
Written Options |
3,965,683 |
— |
— |
3,965,683 |
|||||||||||||||
|
Total |
$ |
252,445,030 |
$ |
— |
$ |
— |
$ |
252,445,030 |
|||||||||||
See accompanying Notes to Schedule of Investments
CALAMOS CLOSED-END FAMILY OF FUNDS ANNUAL REPORT
224
Statements of Assets and Liabilities October 31, 2023
| CONVERTIBLE OPPORTUNITIES AND INCOME FUND |
CONVERTIBLE AND HIGH INCOME FUND |
STRATEGIC TOTAL RETURN FUND |
DYNAMIC CONVERTIBLE AND INCOME FUND |
||||||||||||||||
|
ASSETS |
|||||||||||||||||||
|
Investments in securities, at cost |
$ |
1,238,324,701 |
$ |
1,348,351,607 |
$ |
2,836,458,007 |
$ |
830,846,856 |
|||||||||||
|
Investment in securities, at value* |
$ |
1,089,475,997 |
$ |
1,184,187,933 |
$ |
3,206,918,798 |
$ |
735,686,397 |
|||||||||||
|
Cash with custodian |
22,328,440 |
16,876,329 |
74,721,221 |
20,400,682 |
|||||||||||||||
|
Restricted cash for short positions |
— |
— |
— |
604 |
|||||||||||||||
|
Receivables: |
|||||||||||||||||||
|
Accrued interest and dividends |
7,481,303 |
8,101,669 |
10,915,526 |
3,250,729 |
|||||||||||||||
|
Investments sold |
4,717,442 |
5,106,857 |
236,126 |
3,986,257 |
|||||||||||||||
|
Fund shares sold |
— |
— |
2,059 |
— |
|||||||||||||||
|
Prepaid expenses |
393,676 |
429,542 |
1,034,029 |
268,970 |
|||||||||||||||
|
Other assets |
165,660 |
142,968 |
202,387 |
— |
|||||||||||||||
|
Total assets |
1,124,562,518 |
1,214,845,298 |
3,294,030,146 |
763,593,639 |
|||||||||||||||
|
LIABILITIES |
|||||||||||||||||||
| Mandatory Redeemable Preferred Shares ($25 liquidation value per share applicable to shares authorized, issued, and outstanding, in 000's) (Note 8) |
|||||||||||||||||||
|
Series B (1,330, 1,460, 3,220, and 850 shares, respectively)(1) |
33,205,511 |
36,451,062 |
80,392,339 |
21,221,528 |
|||||||||||||||
|
Series C (1,340, 1,480, 3,240, and 860 shares, respectively)(2) |
33,357,390 |
36,843,129 |
80,654,883 |
21,408,729 |
|||||||||||||||
|
Series D (1,320, 1,400, 2,480, and 1,120 shares, respectively)(3) |
32,827,710 |
34,818,380 |
61,674,468 |
27,849,643 |
|||||||||||||||
|
Series E (1,330, 1,460, and 850 shares, respectively)(4) |
33,013,463 |
36,241,944 |
— |
21,094,365 |
|||||||||||||||
|
Series F (4,000 shares)(5) |
— |
— |
99,445,648 |
— |
|||||||||||||||
|
Payables: |
|||||||||||||||||||
|
Notes payable (Note 7) |
314,400,000 |
340,400,000 |
800,500,000 |
210,000,000 |
|||||||||||||||
|
Distributions payable to Mandatory Redeemable Preferred Shareholders |
389,026 |
425,551 |
1,033,662 |
263,048 |
|||||||||||||||
|
Investments purchased |
1,982,912 |
2,118,961 |
12,915,058 |
530,243 |
|||||||||||||||
|
Affiliates: |
|||||||||||||||||||
|
Investment advisory fees |
779,971 |
842,543 |
2,833,464 |
665,373 |
|||||||||||||||
|
Deferred compensation to trustees |
165,660 |
142,968 |
202,387 |
— |
|||||||||||||||
|
Trustees' fees and officer compensation |
13,450 |
14,300 |
29,759 |
10,298 |
|||||||||||||||
|
Other accounts payable and accrued liabilities |
1,645,696 |
1,725,692 |
4,345,803 |
1,185,386 |
|||||||||||||||
|
Total liabilities |
451,780,789 |
490,024,530 |
1,144,027,471 |
304,228,613 |
|||||||||||||||
|
NET ASSETS |
$ |
672,781,729 |
$ |
724,820,768 |
$ |
2,150,002,675 |
$ |
459,365,026 |
|||||||||||
|
COMPOSITION OF NET ASSETS |
|||||||||||||||||||
|
Common stock, no par value, unlimited shares authorized |
$ |
836,528,404 |
$ |
907,116,571 |
$ |
1,889,816,626 |
$ |
563,099,438 |
|||||||||||
|
Accumulated distributable earnings (loss) |
(163,746,675 |
) |
(182,295,803 |
) |
260,186,049 |
(103,734,412 |
) |
||||||||||||
|
NET ASSETS |
$ |
672,781,729 |
$ |
724,820,768 |
$ |
2,150,002,675 |
$ |
459,365,026 |
|||||||||||
|
Net asset value per common shares |
$ |
8.99 |
$ |
9.49 |
$ |
13.41 |
$ |
17.24 |
|||||||||||
|
Shares Outstanding |
74,818,167 |
76,379,270 |
160,335,126 |
26,644,318 |
|||||||||||||||
| * Includes securities on loan |
$ |
52,896,802 |
$ |
48,054,136 |
$ |
721,069,295 |
$ |
14,996,944 |
|||||||||||
| (1) Net of deferred offering costs (Series B) |
$ |
44,489 |
$ |
48,938 |
$ |
107,661 |
$ |
28,472 |
|||||||||||
| (2) Net of deferred offering costs (Series C) |
$ |
142,610 |
$ |
156,871 |
$ |
345,117 |
$ |
91,271 |
|||||||||||
| (3) Net of deferred offering costs (Series D) |
$ |
172,290 |
$ |
181,620 |
$ |
325,532 |
$ |
150,357 |
|||||||||||
| (4) Net of deferred offering costs (Series E) |
$ |
236,537 |
$ |
258,056 |
$ |
— |
$ |
155,635 |
|||||||||||
| (5) Net of deferred offering costs (Series F) |
$ |
— |
$ |
— |
$ |
554,352 |
$ |
— |
|||||||||||
See accompanying Notes to Financial Statements
www.calamos.com
225
Statements of Assets and Liabilities October 31, 2023
| GLOBAL DYNAMIC INCOME FUND |
GLOBAL TOTAL RETURN FUND |
LONG/SHORT EQUITY & DYNAMIC INCOME TRUST |
|||||||||||||
|
ASSETS |
|||||||||||||||
|
Investments in securities, at cost |
$ |
732,453,560 |
$ |
156,252,393 |
$ |
482,581,197 |
|||||||||
|
Investment in securities, at value* |
$ |
576,996,344 |
$ |
132,749,523 |
$ |
425,412,594 |
|||||||||
|
Cash with custodian |
9,081,592 |
4,431,591 |
4,585,708 |
||||||||||||
|
Restricted cash for short positions |
— |
45 |
262,618,136 |
||||||||||||
|
Restricted foreign currency for short positions (cost $703,788) |
— |
— |
703,788 |
||||||||||||
|
Foreign currency (cost $195 and $120, respectively) |
195 |
120 |
— |
||||||||||||
|
Receivables: |
|||||||||||||||
|
Accrued interest and dividends |
2,369,408 |
503,365 |
2,040,698 |
||||||||||||
|
Investments sold |
557,775 |
146,805 |
21,554,047 |
||||||||||||
|
Fund shares sold |
— |
— |
— |
||||||||||||
|
Prepaid expenses |
223,037 |
57,680 |
4,970 |
||||||||||||
|
Other assets |
76,901 |
48,868 |
638,923 |
||||||||||||
|
Total assets |
589,305,252 |
137,937,997 |
717,558,864 |
||||||||||||
|
LIABILITIES |
|||||||||||||||
|
Due to custodian bank - Foreign currency (cost $44,754) |
— |
— |
41,267 |
||||||||||||
|
Securities sold short, at value (proceeds $250,885,121) |
— |
— |
248,479,347 |
||||||||||||
|
Options written, at value (premium $113,630, $19,191 and $4,521,827) |
160,840 |
36,365 |
3,965,683 |
||||||||||||
| Mandatory Redeemable Preferred Shares ($25 liquidation value per share applicable to shares authorized, issued, and outstanding, in 000's) (Note 8) |
|||||||||||||||
|
Series B (860 and 160 shares, respectively)(1) |
21,471,082 |
3,994,661 |
— |
||||||||||||
|
Series C (880 and 160 shares, respectively)(2) |
21,907,305 |
3,982,887 |
— |
||||||||||||
|
Series D (200 and 200 shares, respectively)(3) |
4,970,656 |
4,960,160 |
— |
||||||||||||
|
Series E (860 and 160 shares, respectively)(4) |
21,329,538 |
3,956,887 |
— |
||||||||||||
|
Payables: |
|||||||||||||||
|
Notes payable (Note 7) |
130,550,000 |
30,100,000 |
120,000,000 |
||||||||||||
|
Distributions payable to Mandatory Redeemable Preferred Shareholders |
219,648 |
48,991 |
— |
||||||||||||
|
Investments purchased |
4,230,343 |
771,814 |
19,072,275 |
||||||||||||
|
Affiliates: |
|||||||||||||||
|
Investment advisory fees |
505,875 |
118,594 |
515,974 |
||||||||||||
|
Deferred compensation to trustees |
76,901 |
48,868 |
— |
||||||||||||
|
Trustees' fees and officer compensation |
8,533 |
4,526 |
3,931 |
||||||||||||
|
Other accounts payable and accrued liabilities |
1,009,198 |
335,049 |
703,319 |
||||||||||||
|
Total liabilities |
206,439,919 |
48,358,802 |
392,781,796 |
||||||||||||
|
NET ASSETS |
$ |
382,865,333 |
$ |
89,579,195 |
$ |
324,777,068 |
|||||||||
|
COMPOSITION OF NET ASSETS |
|||||||||||||||
|
Common stock, no par value, unlimited shares authorized |
$ |
546,739,904 |
$ |
114,926,525 |
$ |
392,628,225 |
|||||||||
|
Accumulated distributable earnings (loss) |
(163,874,571 |
)(a) |
(25,347,330 |
)(a) |
(67,851,157 |
) |
|||||||||
|
NET ASSETS |
$ |
382,865,333 |
$ |
89,579,195 |
$ |
324,777,068 |
|||||||||
|
Net asset value per common shares |
$ |
5.99 |
$ |
9.12 |
$ |
16.54 |
|||||||||
|
Shares Outstanding |
|
9,825,838 |
19,632,194 |
||||||||||||
| * Includes securities on loan |
$ |
14,010,203 |
$ |
5,677,422 |
$ |
2,056,746 |
|||||||||
| (1) Net of deferred offering costs (Series B) |
$ |
28,918 |
$ |
5,339 |
$ |
— |
|||||||||
| (2) Net of deferred offering costs (Series C) |
$ |
92,695 |
$ |
17,113 |
$ |
— |
|||||||||
| (3) Net of deferred offering costs (Series D) |
$ |
29,344 |
$ |
39,840 |
$ |
— |
|||||||||
| (4) Net of deferred offering costs (Series E) |
$ |
170,462 |
$ |
43,113 |
$ |
— |
|||||||||
(a) Net of deferred foreign capital gains tax of $(179,504) and $(57,806), respectively.
See accompanying Notes to Financial Statements
CALAMOS CLOSED-END FAMILY OF FUNDS ANNUAL REPORT
226
Statement of Operations Year Ended October 31, 2023
| CONVERTIBLE OPPORTUNITIES AND INCOME FUND |
CONVERTIBLE AND HIGH INCOME FUND |
STRATEGIC TOTAL RETURN FUND |
DYNAMIC CONVERTIBLE AND INCOME FUND |
||||||||||||||||
|
INVESTMENT INCOME |
|||||||||||||||||||
|
Interest |
$ |
32,571,025 |
$ |
34,841,660 |
$ |
46,478,954 |
$ |
13,900,424 |
|||||||||||
|
(Amortization)/accretion of investment securities |
(12,272,837 |
) |
(13,595,273 |
) |
(10,175,008 |
) |
(10,398,714 |
) |
|||||||||||
|
Net interest |
20,298,188 |
21,246,387 |
36,303,946 |
3,501,710 |
|||||||||||||||
|
Dividends |
4,984,357 |
5,439,560 |
41,706,635 |
4,006,587 |
|||||||||||||||
|
Dividend taxes withheld |
— |
— |
(44,224 |
) |
— |
||||||||||||||
|
Other income |
— |
— |
— |
599 |
|||||||||||||||
|
Total investment income |
25,282,545 |
26,685,947 |
77,966,357 |
7,508,896 |
|||||||||||||||
|
EXPENSES |
|||||||||||||||||||
|
Investment advisory fees |
9,659,681 |
10,430,568 |
33,713,037 |
8,297,349 |
|||||||||||||||
|
Interest expense on Notes Payable (Note 7) |
17,913,239 |
19,311,374 |
44,286,581 |
12,014,572 |
|||||||||||||||
| Interest expense and amortization of offering costs on Mandatory Redeemable Preferred Shares (Notes 1 and 8) |
4,712,359 |
5,145,591 |
12,370,581 |
3,215,743 |
|||||||||||||||
|
Legal fees |
98,550 |
104,678 |
229,641 |
74,993 |
|||||||||||||||
|
Accounting fees |
82,304 |
86,449 |
183,587 |
67,871 |
|||||||||||||||
|
Printing and mailing fees |
76,784 |
82,407 |
123,212 |
64,773 |
|||||||||||||||
|
Fund administration fees |
76,676 |
82,810 |
213,313 |
52,777 |
|||||||||||||||
|
Trustees' fees and officer compensation |
71,744 |
76,143 |
168,420 |
54,553 |
|||||||||||||||
|
Audit fees |
68,562 |
72,379 |
158,003 |
53,731 |
|||||||||||||||
|
Transfer agent fees |
45,630 |
38,776 |
37,316 |
37,845 |
|||||||||||||||
|
Registration fees |
19,384 |
19,797 |
41,572 |
6,827 |
|||||||||||||||
|
Custodian fees |
11,121 |
11,808 |
33,568 |
8,737 |
|||||||||||||||
|
Other |
154,200 |
159,214 |
357,561 |
116,928 |
|||||||||||||||
|
Total expenses |
32,990,234 |
35,621,994 |
91,916,392 |
24,066,699 |
|||||||||||||||
|
NET INVESTMENT INCOME (LOSS) |
(7,707,689 |
) |
(8,936,047 |
) |
(13,950,035 |
) |
(16,557,803 |
) |
|||||||||||
|
REALIZED AND UNREALIZED GAIN (LOSS) |
|||||||||||||||||||
|
Net realized gain (loss) from: |
|||||||||||||||||||
|
Investments, excluding purchased options |
81,636,385 |
89,802,082 |
206,126,813 |
76,249,673 |
|||||||||||||||
|
Purchased options |
4,530,051 |
5,083,823 |
(8,915,236 |
) |
4,233,343 |
||||||||||||||
|
Foreign currency transactions |
— |
— |
23,501 |
— |
|||||||||||||||
|
Written options |
783,713 |
888,208 |
(837,898 |
) |
731,578 |
||||||||||||||
|
Change in net unrealized appreciation/(depreciation) on: |
|||||||||||||||||||
|
Investments, excluding purchased options |
(86,774,549 |
) |
(93,870,650 |
) |
(16,444,435 |
) |
(79,581,357 |
) |
|||||||||||
|
Purchased options |
(1,517,263 |
) |
(1,693,762 |
) |
3,624,293 |
(1,418,183 |
) |
||||||||||||
|
Foreign currency translations |
— |
— |
12,801 |
— |
|||||||||||||||
|
Written options |
(780,886 |
) |
(885,005 |
) |
— |
(728,855 |
) |
||||||||||||
|
NET GAIN (LOSS) |
(2,122,549 |
) |
(675,304 |
) |
183,589,839 |
(513,801 |
) |
||||||||||||
|
NET INCREASE (DECREASE) IN NET ASSETS RESULTING FROM OPERATIONS |
$ |
(9,830,238 |
) |
$ |
(9,611,351 |
) |
$ |
169,639,804 |
$ |
(17,071,604 |
) |
||||||||
See accompanying Notes to Financial Statements
www.calamos.com
227
Statement of Operations Year Ended October 31, 2023
| GLOBAL DYNAMIC INCOME FUND |
GLOBAL TOTAL RETURN FUND |
LONG/SHORT EQUITY & DYNAMIC INCOME TRUST |
|||||||||||||
|
INVESTMENT INCOME |
|||||||||||||||
|
Interest |
$ |
8,476,941 |
$ |
1,726,703 |
$ |
8,655,125 |
|||||||||
|
(Amortization)/accretion of investment securities |
(4,422,034 |
) |
(1,123,438 |
) |
(131,739 |
) |
|||||||||
|
Net interest |
4,054,907 |
603,265 |
8,523,386 |
||||||||||||
|
Dividends |
6,737,275 |
1,588,018 |
5,522,378 |
||||||||||||
|
Foreign taxes withheld |
(435,364 |
) |
(91,032 |
) |
(17,515 |
) |
|||||||||
|
Other income |
— |
— |
6,494,633 |
||||||||||||
|
Total investment income |
10,356,818 |
2,100,251 |
20,522,882 |
||||||||||||
|
EXPENSES |
|||||||||||||||
|
Investment advisory fees |
5,954,647 |
1,406,678 |
6,357,265 |
||||||||||||
|
Interest expense on Notes Payable (Note 7) |
6,079,066 |
1,370,703 |
6,617,687 |
||||||||||||
|
Interest expense and amortization of offering costs on Mandatory Redeemable Preferred Shares (Notes 1 and 8) |
2,652,451 |
640,688 |
— |
||||||||||||
|
Legal fees |
59,800 |
31,747 |
66,601 |
||||||||||||
|
Accounting fees |
66,882 |
32,898 |
52,856 |
||||||||||||
|
Printing and mailing fees |
62,727 |
48,912 |
45,934 |
||||||||||||
|
Fund administration fees |
37,636 |
9,390 |
30,347 |
||||||||||||
|
Trustees' fees and officer compensation |
43,511 |
22,987 |
35,213 |
||||||||||||
|
Audit fees |
47,348 |
29,092 |
33,386 |
||||||||||||
|
Transfer agent fees |
39,338 |
40,664 |
20,392 |
||||||||||||
|
Registration fees |
16,708 |
2,570 |
5,134 |
||||||||||||
|
Custodian fees |
105,925 |
57,124 |
58,161 |
||||||||||||
|
Dividend or interest expense on short positions |
— |
— |
2,288,755 |
||||||||||||
|
Other |
159,579 |
114,498 |
218,574 |
||||||||||||
|
Total expenses |
15,325,618 |
3,807,951 |
15,830,305 |
||||||||||||
|
NET INVESTMENT INCOME (LOSS) |
(4,968,800 |
) |
(1,707,700 |
) |
4,692,577 |
||||||||||
|
REALIZED AND UNREALIZED GAIN (LOSS) |
|||||||||||||||
|
Net realized gain (loss) from: |
|||||||||||||||
|
Investments, excluding purchased options |
28,418,162 |
(a) |
8,961,734 |
(a) |
27,166,540 |
||||||||||
|
Purchased options |
(7,052,032 |
) |
(1,579,943 |
) |
(28,874,230 |
) |
|||||||||
|
Foreign currency transactions |
(47,686 |
) |
(23,166 |
) |
(19,627 |
) |
|||||||||
|
Written options |
314,714 |
65,552 |
30,981,651 |
||||||||||||
|
Short positions |
— |
— |
(7,976,140 |
) |
|||||||||||
|
Payments by affiliates |
— |
— |
1,223,984 |
||||||||||||
|
Change in net unrealized appreciation/(depreciation) on: |
|||||||||||||||
|
Investments, excluding purchased options |
15,126,965 |
(b) |
(245,241 |
)(b) |
(19,360,709 |
) |
|||||||||
|
Purchased options |
(1,686,301 |
) |
(659,208 |
) |
(298,348 |
) |
|||||||||
|
Foreign currency translations |
24,854 |
7,668 |
5,651 |
||||||||||||
|
Written options |
(47,210 |
) |
(17,174 |
) |
(1,920,104 |
) |
|||||||||
|
Short positions |
— |
— |
5,390,485 |
||||||||||||
|
NET GAIN (LOSS) |
35,051,466 |
6,510,222 |
6,319,153 |
||||||||||||
|
NET INCREASE (DECREASE) IN NET ASSETS RESULTING FROM OPERATIONS |
$ |
30,082,666 |
$ |
4,802,522 |
$ |
11,011,730 |
|||||||||
(a) Net of foreign capital gains tax of $107,512 and $59,698, respectively.
(b) Net of change of $23,089 and $7,740, respectively in deferred capital gains tax.
See accompanying Notes to Financial Statements
CALAMOS CLOSED-END FAMILY OF FUNDS ANNUAL REPORT
228
Statements of Changes in Net Assets
| CONVERTIBLE OPPORTUNITIES AND INCOME FUND |
CONVERTIBLE AND HIGH INCOME FUND |
STRATEGIC TOTAL RETURN FUND |
|||||||||||||||||||||||||
| YEAR ENDED OCTOBER 31, 2023 |
YEAR ENDED OCTOBER 31, 2022 |
YEAR ENDED OCTOBER 31, 2023 |
YEAR ENDED OCTOBER 31, 2022 |
YEAR ENDED OCTOBER 31, 2023 |
YEAR ENDED OCTOBER 31, 2022 |
||||||||||||||||||||||
|
OPERATIONS |
|||||||||||||||||||||||||||
|
Net investment income (loss) |
$ |
(7,707,689 |
) |
$ |
714,868 |
$ |
(8,936,047 |
) |
$ |
(152,563 |
) |
$ |
(13,950,035 |
) |
$ |
7,926,485 |
|||||||||||
|
Net realized gain (loss) |
86,950,149 |
66,657,732 |
95,774,113 |
77,337,509 |
196,397,180 |
159,464,046 |
|||||||||||||||||||||
|
Change in unrealized appreciation/(depreciation) |
(89,072,698 |
) |
(365,468,554 |
) |
(96,449,417 |
) |
(402,754,316 |
) |
(12,807,341 |
) |
(770,361,601 |
) |
|||||||||||||||
| Net increase (decrease) in net assets applicable to common shareholders resulting from operations |
(9,830,238 |
) |
(298,095,954 |
) |
(9,611,351 |
) |
(325,569,370 |
) |
169,639,804 |
(602,971,070 |
) |
||||||||||||||||
|
DISTRIBUTIONS TO COMMON SHAREHOLDERS |
|||||||||||||||||||||||||||
|
Distributions |
(84,820,549 |
) |
(82,919,043 |
) |
(91,178,228 |
) |
(89,290,028 |
) |
(196,582,807 |
) |
(194,318,141 |
) |
|||||||||||||||
|
Return of capital |
— |
— |
— |
— |
— |
— |
|||||||||||||||||||||
| Net decrease in net assets from distributions to common shareholders |
(84,820,549 |
) |
(82,919,043 |
) |
(91,178,228 |
) |
(89,290,028 |
) |
(196,582,807 |
) |
(194,318,141 |
) |
|||||||||||||||
|
CAPITAL STOCK TRANSACTIONS |
|||||||||||||||||||||||||||
|
Proceeds from shares sold |
— |
23,834,861 |
— |
20,078,685 |
9,878,699 |
18,449,081 |
|||||||||||||||||||||
|
Reinvestment of distributions resulting in the issuance of stock |
7,716,841 |
5,369,761 |
7,782,199 |
5,450,490 |
10,409,380 |
7,034,486 |
|||||||||||||||||||||
| Net increase (decrease) in net assets from capital stock transactions |
7,716,841 |
29,204,622 |
7,782,199 |
25,529,175 |
20,288,079 |
25,483,567 |
|||||||||||||||||||||
|
TOTAL INCREASE (DECREASE) IN NET ASSETS |
(86,933,946 |
) |
(351,810,375 |
) |
(93,007,380 |
) |
(389,330,223 |
) |
(6,654,924 |
) |
(771,805,644 |
) |
|||||||||||||||
|
NET ASSETS |
|||||||||||||||||||||||||||
|
Beginning of year |
$ |
759,715,675 |
$ |
1,111,526,050 |
$ |
817,828,148 |
$ |
1,207,158,371 |
$ |
2,156,657,599 |
$ |
2,928,463,243 |
|||||||||||||||
|
End of year |
$ |
672,781,729 |
$ |
759,715,675 |
$ |
724,820,768 |
$ |
817,828,148 |
$ |
2,150,002,675 |
$ |
2,156,657,599 |
|||||||||||||||
See accompanying Notes to Financial Statements
www.calamos.com
229
Statements of Changes in Net Assets
| DYNAMIC CONVERTIBLE AND INCOME FUND |
GLOBAL DYNAMIC INCOME FUND |
GLOBAL TOTAL RETURN FUND |
|||||||||||||||||||||||||
| YEAR ENDED OCTOBER 31, 2023 |
YEAR ENDED OCTOBER 31, 2022 |
YEAR ENDED OCTOBER 31, 2023 |
YEAR ENDED OCTOBER 31, 2022 |
YEAR ENDED OCTOBER 31, 2023 |
YEAR ENDED OCTOBER 31, 2022 |
||||||||||||||||||||||
|
OPERATIONS |
|||||||||||||||||||||||||||
|
Net investment income (loss) |
$ |
(16,557,803 |
) |
$ |
(10,855,830 |
) |
$ |
(4,968,800 |
) |
$ |
(4,164,070 |
) |
$ |
(1,707,700 |
) |
$ |
(1,108,124 |
) |
|||||||||
|
Net realized gain (loss) |
81,214,594 |
54,790,568 |
21,633,158 |
6,978,765 |
7,424,177 |
2,755,305 |
|||||||||||||||||||||
|
Change in unrealized appreciation/(depreciation) |
(81,728,395 |
) |
(276,717,230 |
) |
13,418,308 |
(200,302,549 |
) |
(913,955 |
) |
(50,104,310 |
) |
||||||||||||||||
| Net increase (decrease) in net assets applicable to common shareholders resulting from operations |
(17,071,604 |
) |
(232,782,492 |
) |
30,082,666 |
(197,487,854 |
) |
4,802,522 |
(48,457,129 |
) |
|||||||||||||||||
|
DISTRIBUTIONS TO COMMON SHAREHOLDERS |
|||||||||||||||||||||||||||
|
Distributions |
(61,802,066 |
) |
(59,155,624 |
) |
(19,096,474 |
) |
(5,811,293 |
) |
(6,618,494 |
) |
(3,224,478 |
) |
|||||||||||||||
|
Return of capital |
— |
— |
(19,222,158 |
) |
(44,585,621 |
) |
(2,813,588 |
) |
(8,056,439 |
) |
|||||||||||||||||
| Net decrease in net assets from distributions to common shareholders |
(61,802,066 |
) |
(59,155,624 |
) |
(38,318,632 |
) |
(50,396,914 |
) |
(9,432,082 |
) |
(11,280,917 |
) |
|||||||||||||||
|
CAPITAL STOCK TRANSACTIONS |
|||||||||||||||||||||||||||
|
Proceeds from shares sold |
4,371,538 |
26,554,130 |
— |
27,890,538 |
— |
4,935,247 |
|||||||||||||||||||||
|
Reinvestment of distributions resulting in the issuance of stock |
7,254,396 |
3,442,578 |
— |
2,057,634 |
23,134 |
291,634 |
|||||||||||||||||||||
| Net increase (decrease) in net assets from capital stock transactions |
11,625,934 |
29,996,708 |
— |
29,948,172 |
23,134 |
5,226,881 |
|||||||||||||||||||||
|
TOTAL INCREASE (DECREASE) IN NET ASSETS |
(67,247,736 |
) |
(261,941,408 |
) |
(8,235,966 |
) |
(217,936,596 |
) |
(4,606,426 |
) |
(54,511,165 |
) |
|||||||||||||||
|
NET ASSETS |
|||||||||||||||||||||||||||
|
Beginning of year |
$ |
526,612,762 |
$ |
788,554,170 |
$ |
391,101,299 |
$ |
609,037,895 |
$ |
94,185,621 |
$ |
148,696,786 |
|||||||||||||||
|
End of year |
$ |
459,365,026 |
$ |
526,612,762 |
$ |
382,865,333 |
$ |
391,101,299 |
$ |
89,579,195 |
$ |
94,185,621 |
|||||||||||||||
See accompanying Notes to Financial Statements
CALAMOS CLOSED-END FAMILY OF FUNDS ANNUAL REPORT
230
Statements of Changes in Net Assets
| LONG/SHORT EQUITY & DYNAMIC INCOME TRUST |
|||||||||||
| YEAR ENDED OCTOBER 31, 2023 |
YEAR ENDED OCTOBER 31, 2022 |
||||||||||
|
OPERATIONS |
|||||||||||
|
Net investment income (loss) |
$ |
4,692,577 |
$ |
3,480,515 |
|||||||
|
Net realized gain (loss) |
22,502,178 |
22,185,941 |
|||||||||
|
Change in unrealized appreciation/(depreciation) |
(16,183,025 |
) |
(68,419,673 |
) |
|||||||
|
Net increase (decrease) in net assets applicable to common shareholders resulting from operations |
11,011,730 |
(42,753,217 |
) |
||||||||
|
DISTRIBUTIONS TO COMMON SHAREHOLDERS |
|||||||||||
|
Distributions |
(32,982,086 |
) |
(32,982,086 |
) |
|||||||
|
Return of capital |
— |
— |
|||||||||
|
Net decrease in net assets from distributions to common shareholders |
(32,982,086 |
) |
(32,982,086 |
) |
|||||||
|
TOTAL INCREASE (DECREASE) IN NET ASSETS |
(21,970,356 |
) |
(75,735,303 |
) |
|||||||
|
NET ASSETS |
|||||||||||
|
Beginning of year |
$ |
346,747,424 |
$ |
422,482,727 |
|||||||
|
End of year |
$ |
324,777,068 |
$ |
346,747,424 |
|||||||
See accompanying Notes to Financial Statements
www.calamos.com
231
Statement of Cash Flows
| CONVERTIBLE OPPORTUNITIES AND INCOME FUND |
|||||||
| YEAR ENDED OCTOBER 31, 2023 |
|||||||
|
CASH FLOWS FROM OPERATING ACTIVITIES: |
|||||||
|
Net increase/(decrease) in net assets from operations |
$ |
(9,830,238 |
) |
||||
|
Adjustments to reconcile net increase/(decrease) in net assets from operations to net cash provided by (used in) operating activities: |
|||||||
|
Purchase of investment securities, including purchased options |
(557,191,398 |
) |
|||||
|
Proceeds paid on closing written options |
(1,673 |
) |
|||||
|
Proceeds from disposition of investment securities, including purchased options |
641,936,019 |
||||||
|
Amortization and accretion of fixed-income securities |
12,272,837 |
||||||
|
Amortization of offering costs on Mandatory Redeemable Preferred Shares |
262,490 |
||||||
|
Net realized gains/losses from investments, excluding purchased options |
(81,636,385 |
) |
|||||
|
Net realized gains/losses from purchased options |
(4,530,051 |
) |
|||||
|
Net realized gains/losses from written options |
(783,713 |
) |
|||||
|
Change in unrealized appreciation or depreciation on investments, excluding purchased options |
86,774,549 |
||||||
|
Change in unrealized appreciation or depreciation on purchased options |
1,517,263 |
||||||
|
Change in unrealized appreciation or depreciation on written options |
780,886 |
||||||
|
Net change in assets and liabilities: |
|||||||
|
(Increase)/decrease in assets: |
|||||||
|
Accrued interest and dividends receivable |
(810,215 |
) |
|||||
|
Prepaid expenses |
1,630 |
||||||
|
Other assets |
(2,782 |
) |
|||||
|
Increase/(decrease) in liabilities: |
|||||||
|
Payables to affiliates |
(31,817 |
) |
|||||
|
Other accounts payable and accrued liabilities |
954,004 |
||||||
|
Net cash provided by/(used in) operating activities |
$ |
89,681,406 |
|||||
|
CASH FLOWS FROM FINANCING ACTIVITIES: |
|||||||
|
Distributions to shareholders |
(77,103,708 |
) |
|||||
|
Redemption of Distributions to Mandatory Redeemable Preferred Shareholders |
(132 |
) |
|||||
|
Offering costs on Mandatory Redeemable Preferred Shares |
(45,421 |
) |
|||||
|
Repayment of Note payable |
(25,000,000 |
) |
|||||
|
Net cash provided by/(used in) financing activities |
$ |
(102,149,261 |
) |
||||
|
Net increase/(decrease) in cash |
$ |
(12,467,855 |
) |
||||
|
Cash and restricted cash at beginning of year |
$ |
34,796,295 |
|||||
|
Cash at end of year |
$ |
22,328,440 |
|||||
|
Supplemental disclosure |
|||||||
|
Cash paid for interest expense on Notes Payable |
$ |
16,870,798 |
|||||
|
Cash paid for interest expense on Mandatory Redeemable Preferred Shares |
$ |
4,712,491 |
|||||
|
Non-cash financing activities not included herein consists of reinvestment of dividends and distributions |
$ |
7,716,841 |
|||||
|
The following table provides a reconciliation of cash and restricted cash reported within the Statement of Assets and Liabilities that sum to the total of the same such amounts shown in the Statements of Cash Flows. |
|||||||
|
Cash with custodian |
22,328,440 |
||||||
|
Total cash and restricted cash at period end |
$ |
22,328,440 |
|||||
See accompanying Notes to Financial Statements
CALAMOS CLOSED-END FAMILY OF FUNDS ANNUAL REPORT
232
Statement of Cash Flows
|
CONVERTIBLE AND |
|||||||
|
YEAR ENDED |
|||||||
|
CASH FLOWS FROM OPERATING ACTIVITIES: |
|||||||
|
Net increase/(decrease) in net assets from operations |
$ |
(9,611,351 |
) |
||||
|
Adjustments to reconcile net increase/(decrease) in net assets from operations to net cash provided by (used in) operating activities: |
|||||||
|
Purchase of investment securities, including purchased options |
(611,396,938 |
) |
|||||
|
Proceeds paid on closing written options |
(1,896 |
) |
|||||
|
Proceeds from disposition of investment securities, including purchased options |
714,361,944 |
||||||
|
Amortization and accretion of fixed-income securities |
13,595,273 |
||||||
|
Amortization of offering costs on Mandatory Redeemable Preferred Shares |
281,090 |
||||||
|
Net realized gains/losses from investments, excluding purchased options |
(89,802,082 |
) |
|||||
|
Net realized gains/losses from purchased options |
(5,083,823 |
) |
|||||
|
Net realized gains/losses from written options |
(888,208 |
) |
|||||
|
Change in unrealized appreciation or depreciation on investments, excluding purchased options |
93,870,650 |
||||||
|
Change in unrealized appreciation or depreciation on purchased options |
1,693,762 |
||||||
|
Change in unrealized appreciation or depreciation on written options |
885,005 |
||||||
|
Net change in assets and liabilities: |
|||||||
|
(Increase)/decrease in assets: |
|||||||
|
Accrued interest and dividends receivable |
(834,053 |
) |
|||||
|
Prepaid expenses |
1,873 |
||||||
|
Other assets |
(2,401 |
) |
|||||
|
Increase/(decrease) in liabilities: |
|||||||
|
Payables to affiliates |
(32,626 |
) |
|||||
|
Other accounts payable and accrued liabilities |
1,007,405 |
||||||
|
Net cash provided by/(used in) operating activities |
$ |
108,043,624 |
|||||
|
CASH FLOWS FROM FINANCING ACTIVITIES: |
|||||||
|
Distributions to shareholders |
(83,396,029 |
) |
|||||
|
Increase in Distributions to Mandatory Redeemable Preferred Shareholders |
2 |
||||||
|
Offering costs on Mandatory Redeemable Preferred Shares |
(45,711 |
) |
|||||
|
Repayment of Note payable |
(25,000,000 |
) |
|||||
|
Net cash provided by/(used in) financing activities |
$ |
(108,441,738 |
) |
||||
|
Net increase/(decrease) in cash |
$ |
(398,114 |
) |
||||
|
Cash and restricted cash at beginning of year |
$ |
17,274,443 |
|||||
|
Cash at end of year |
$ |
16,876,329 |
|||||
|
Supplemental disclosure |
|||||||
|
Cash paid for interest expense on Notes Payable |
$ |
18,192,848 |
|||||
|
Cash paid for interest expense on Mandatory Redeemable Preferred Shares |
$ |
5,145,589 |
|||||
|
Non-cash financing activities not included herein consists of reinvestment of dividends and distributions |
$ |
7,782,199 |
|||||
|
The following table provides a reconciliation of cash and restricted cash reported within the Statement of Assets and Liabilities that sum to the total of the same such amounts shown in the Statements of Cash Flows. |
|||||||
|
Cash with custodian |
16,876,329 |
||||||
|
Total cash and restricted cash at period end |
$ |
16,876,329 |
|||||
See accompanying Notes to Financial Statements
www.calamos.com
233
Statement of Cash Flows
|
STRATEGIC TOTAL |
|||||||
|
YEAR ENDED |
|||||||
|
CASH FLOWS FROM OPERATING ACTIVITIES: |
|||||||
|
Net increase/(decrease) in net assets from operations |
$ |
169,639,804 |
|||||
|
Adjustments to reconcile net increase/(decrease) in net assets from operations to net cash provided by (used in) operating activities: |
|||||||
|
Purchase of investment securities, including purchased options |
(975,863,025 |
) |
|||||
|
Proceeds paid on closing written options |
(1,830,536 |
) |
|||||
|
Proceeds from disposition of investment securities, including purchased options |
1,076,397,187 |
||||||
|
Premiums received from written options |
992,638 |
||||||
|
Amortization and accretion of fixed-income securities |
10,175,008 |
||||||
|
Amortization of offering costs on Mandatory Redeemable Preferred Shares |
537,324 |
||||||
|
Net realized gains/losses from investments, excluding purchased options |
(206,126,813 |
) |
|||||
|
Net realized gains/losses from purchased options |
8,915,236 |
||||||
|
Net realized gains/losses from written options |
837,898 |
||||||
|
Change in unrealized appreciation or depreciation on investments, excluding purchased options |
16,444,435 |
||||||
|
Change in unrealized appreciation or depreciation on purchased options |
(3,624,293 |
) |
|||||
|
Net change in assets and liabilities: |
|||||||
|
(Increase)/decrease in assets: |
|||||||
|
Accrued interest and dividends receivable |
(746,679 |
) |
|||||
|
Prepaid expenses |
3,302 |
||||||
|
Other assets |
(3,398 |
) |
|||||
|
Increase/(decrease) in liabilities: |
|||||||
|
Payables to affiliates |
185,151 |
||||||
|
Other accounts payable and accrued liabilities |
2,428,671 |
||||||
|
Net cash provided by/(used in) operating activities |
$ |
98,361,910 |
|||||
|
CASH FLOWS FROM FINANCING ACTIVITIES: |
|||||||
|
Proceeds from shares sold |
9,878,699 |
||||||
|
Distributions to shareholders |
(186,173,427 |
) |
|||||
|
Redemption of Distributions to Mandatory Redeemable Preferred Shareholders |
(143 |
) |
|||||
|
Offering costs on Mandatory Redeemable Preferred Shares |
(49,567 |
) |
|||||
|
Net cash provided by/(used in) financing activities |
$ |
(176,344,438 |
) |
||||
|
Net increase/(decrease) in cash |
$ |
(77,982,528 |
) |
||||
|
Cash and restricted cash at beginning of year |
$ |
152,703,749 |
|||||
|
Cash at end of year |
$ |
74,721,221 |
|||||
|
Supplemental disclosure |
|||||||
|
Cash paid for interest expense on Notes Payable |
$ |
41,664,081 |
|||||
|
Cash paid for interest expense on Mandatory Redeemable Preferred Shares |
$ |
12,370,724 |
|||||
|
Non-cash financing activities not included herein consists of reinvestment of dividends and distributions |
$ |
10,409,380 |
|||||
|
The following table provides a reconciliation of cash and restricted cash reported within the Statement of Assets and Liabilities that sum to the total of the same such amounts shown in the Statements of Cash Flows. |
|||||||
|
Cash with custodian |
74,721,221 |
||||||
|
Total cash and restricted cash at period end |
$ |
74,721,221 |
|||||
See accompanying Notes to Financial Statements
CALAMOS CLOSED-END FAMILY OF FUNDS ANNUAL REPORT
234
Statement of Cash Flows
|
DYNAMIC CONVERTIBLE |
|||||||
|
YEAR ENDED |
|||||||
|
CASH FLOWS FROM OPERATING ACTIVITIES: |
|||||||
|
Net increase/(decrease) in net assets from operations |
$ |
(17,071,604 |
) |
||||
|
Adjustments to reconcile net increase/(decrease) in net assets from operations to net cash provided by (used in) operating activities: |
|||||||
|
Purchase of investment securities, including purchased options |
(476,683,374 |
) |
|||||
|
Proceeds paid on closing written options |
(1,478 |
) |
|||||
|
Proceeds from disposition of investment securities, including purchased options |
537,286,549 |
||||||
|
Amortization and accretion of fixed-income securities |
10,398,714 |
||||||
|
Amortization of offering costs on Mandatory Redeemable Preferred Shares |
198,745 |
||||||
|
Net realized gains/losses from investments, excluding purchased options |
(76,249,673 |
) |
|||||
|
Net realized gains/losses from purchased options |
(4,233,343 |
) |
|||||
|
Net realized gains/losses from written options |
(731,578 |
) |
|||||
|
Change in unrealized appreciation or depreciation on investments, excluding purchased options |
79,581,357 |
||||||
|
Change in unrealized appreciation or depreciation on purchased options |
1,418,183 |
||||||
|
Change in unrealized appreciation or depreciation on written options |
728,855 |
||||||
|
Net change in assets and liabilities: |
|||||||
|
(Increase)/decrease in assets: |
|||||||
|
Accrued interest and dividends receivable |
(688,212 |
) |
|||||
|
Prepaid expenses |
956 |
||||||
|
Increase/(decrease) in liabilities: |
|||||||
|
Payables to affiliates |
(36,130 |
) |
|||||
|
Other accounts payable and accrued liabilities |
599,144 |
||||||
|
Net cash provided by/(used in) operating activities |
$ |
54,517,111 |
|||||
|
CASH FLOWS FROM FINANCING ACTIVITIES: |
|||||||
|
Proceeds from shares sold |
4,371,538 |
||||||
|
Distributions to shareholders |
(54,547,670 |
) |
|||||
|
Redemption of Distributions to Mandatory Redeemable Preferred Shareholders |
(102 |
) |
|||||
|
Offering costs on Mandatory Redeemable Preferred Shares |
(44,369 |
) |
|||||
|
Repayment of Note payable |
(20,000,000 |
) |
|||||
|
Net cash provided by/(used in) financing activities |
$ |
(70,220,603 |
) |
||||
|
Net increase/(decrease) in cash |
$ |
(15,703,492 |
) |
||||
|
Cash and restricted cash at beginning of year |
$ |
36,104,778 |
|||||
|
Cash at end of year |
$ |
20,401,286 |
|||||
|
Supplemental disclosure |
|||||||
|
Cash paid for interest expense on Notes Payable |
$ |
11,357,892 |
|||||
|
Cash paid for interest expense on Mandatory Redeemable Preferred Shares |
$ |
3,215,845 |
|||||
|
Non-cash financing activities not included herein consists of reinvestment of dividends and distributions |
$ |
7,254,396 |
|||||
|
The following table provides a reconciliation of cash and restricted cash reported within the Statement of Assets and Liabilities that sum to the total of the same such amounts shown in the Statements of Cash Flows. |
|||||||
|
Cash with custodian |
20,400,682 |
||||||
|
Restricted cash for short positions |
604 |
||||||
|
Total cash and restricted cash at period end |
$ |
20,401,286 |
|||||
See accompanying Notes to Financial Statements
www.calamos.com
235
Statement of Cash Flows
|
GLOBAL DYNAMIC |
|||||||
|
YEAR ENDED |
|||||||
|
CASH FLOWS FROM OPERATING ACTIVITIES: |
|||||||
|
Net increase/(decrease) in net assets from operations |
$ |
30,082,666 |
|||||
|
Adjustments to reconcile net increase/(decrease) in net assets from operations to net cash provided by (used in) operating activities: |
|||||||
|
Purchase of investment securities, including purchased options |
(683,211,905 |
) |
|||||
|
Purchases of securities to cover securities sold short |
(130,881 |
) |
|||||
|
Proceeds paid on closing written options |
(284,042 |
) |
|||||
|
Proceeds from disposition of investment securities, including purchased options |
701,051,168 |
||||||
|
Proceeds from securities sold short |
130,723 |
||||||
|
Premiums received from written options |
712,386 |
||||||
|
Amortization and accretion of fixed-income securities |
4,422,034 |
||||||
|
Amortization of offering costs on Mandatory Redeemable Preferred Shares |
160,816 |
||||||
|
Net realized gains/losses from investments, excluding purchased options |
(28,525,674 |
) |
|||||
|
Net realized gains/losses from capital gains tax |
107,512 |
||||||
|
Net realized gains/losses from purchased options |
7,052,032 |
||||||
|
Net realized gains/losses from written options |
(314,714 |
) |
|||||
|
Change in unrealized appreciation or depreciation on investments, excluding purchased options |
(15,126,965 |
) |
|||||
|
Change in unrealized appreciation or depreciation on capital gains tax |
23,089 |
||||||
|
Change in unrealized appreciation or depreciation on purchased options |
1,686,301 |
||||||
|
Change in unrealized appreciation or depreciation on written options |
47,210 |
||||||
|
Net change in assets and liabilities: |
|||||||
|
(Increase)/decrease in assets: |
|||||||
|
Accrued interest and dividends receivable |
25,215 |
||||||
|
Prepaid expenses |
1,695 |
||||||
|
Other assets |
(1,291 |
) |
|||||
|
Increase/(decrease) in liabilities: |
|||||||
|
Payables to affiliates |
37,968 |
||||||
|
Other accounts payable and accrued liabilities |
289,468 |
||||||
|
Net cash provided by/(used in) operating activities |
$ |
18,234,811 |
|||||
|
CASH FLOWS FROM FINANCING ACTIVITIES: |
|||||||
|
Distributions to shareholders |
(38,318,632 |
) |
|||||
|
Increase in Distributions to Mandatory Redeemable Preferred Shareholders |
137 |
||||||
|
Offering costs on Mandatory Redeemable Preferred Shares |
(44,399 |
) |
|||||
|
Net increase/(decrease) in due to custodian bank |
(13 |
) |
|||||
|
Repayment of Note Payable |
(30,000,000 |
) |
|||||
|
Proceeds from Note payable |
51,000,000 |
||||||
|
Net cash provided by/(used in) financing activities |
$ |
(17,362,907 |
) |
||||
|
Net increase/(decrease) in cash and foreign currency |
$ |
871,904 |
|||||
|
Cash and foreign currency and restricted cash at beginning of year |
$ |
8,209,883 |
|||||
|
Cash and foreign currency at end of year |
$ |
9,081,787 |
|||||
|
Supplemental disclosure |
|||||||
|
Cash paid for interest expense on Notes Payable |
$ |
5,682,989 |
|||||
|
Cash paid for interest expense on Mandatory Redeemable Preferred Shares |
$ |
2,652,314 |
|||||
|
The following table provides a reconciliation of cash and restricted cash reported within the Statement of Assets and Liabilities that sum to the total of the same such amounts shown in the Statements of Cash Flows. |
|||||||
|
Cash with custodian |
9,081,592 |
||||||
|
Foreign currency |
195 |
||||||
|
Total cash and restricted cash at period end |
$ |
9,081,787 |
|||||
See accompanying Notes to Financial Statements
CALAMOS CLOSED-END FAMILY OF FUNDS ANNUAL REPORT
236
Statement of Cash Flows
|
GLOBAL TOTAL |
|||||||
|
YEAR ENDED |
|||||||
|
CASH FLOWS FROM OPERATING ACTIVITIES: |
|||||||
|
Net increase/(decrease) in net assets from operations |
$ |
4,802,522 |
|||||
|
Adjustments to reconcile net increase/(decrease) in net assets from operations to net cash provided by (used in) operating activities: |
|||||||
|
Purchase of investment securities, including purchased options |
(167,191,933 |
) |
|||||
|
Proceeds paid on closing written options |
(58,654 |
) |
|||||
|
Proceeds from disposition of investment securities, including purchased options |
172,265,032 |
||||||
|
Premiums received from written options |
143,397 |
||||||
|
Amortization and accretion of fixed-income securities |
1,123,438 |
||||||
|
Amortization of offering costs on Mandatory Redeemable Preferred Shares |
81,275 |
||||||
|
Net realized gains/losses from investments, excluding purchased options |
(9,021,432 |
) |
|||||
|
Net realized gains/losses from capital gains tax |
59,698 |
||||||
|
Net realized gains/losses from purchased options |
1,579,943 |
||||||
|
Net realized gains/losses from written options |
(65,552 |
) |
|||||
|
Change in unrealized appreciation or depreciation on investments, excluding purchased options |
245,241 |
||||||
|
Change in unrealized appreciation or depreciation on capital gains tax |
7,740 |
||||||
|
Change in unrealized appreciation or depreciation on purchased options |
659,208 |
||||||
|
Change in unrealized appreciation or depreciation on written options |
17,174 |
||||||
|
Net change in assets and liabilities: |
|||||||
|
(Increase)/decrease in assets: |
|||||||
|
Accrued interest and dividends receivable |
(1,889 |
) |
|||||
|
Prepaid expenses |
1,724 |
||||||
|
Other assets |
(820 |
) |
|||||
|
Increase/(decrease) in liabilities: |
|||||||
|
Payables to affiliates |
8,400 |
||||||
|
Other accounts payable and accrued liabilities |
73,211 |
||||||
|
Net cash provided by/(used in) operating activities |
$ |
4,727,723 |
|||||
|
CASH FLOWS FROM FINANCING ACTIVITIES: |
|||||||
|
Distributions to shareholders |
(9,408,948 |
) |
|||||
|
Increase in Distributions to Mandatory Redeemable Preferred Shareholders |
114 |
||||||
|
Offering costs on Mandatory Redeemable Preferred Shares |
(44,279 |
) |
|||||
|
Repayment of Note Payable |
(9,500,000 |
) |
|||||
|
Proceeds from Note payable |
13,600,000 |
||||||
|
Net cash provided by/(used in) financing activities |
$ |
(5,353,113 |
) |
||||
|
Net increase/(decrease) in cash and foreign currency |
$ |
(625,390 |
) |
||||
|
Cash and foreign currency and restricted cash at beginning of year |
$ |
5,057,146 |
|||||
|
Cash, foreign currency and restricted cash at end of year |
$ |
4,431,756 |
|||||
|
Supplemental disclosure |
|||||||
|
Cash paid for interest expense on Notes Payable |
$ |
1,284,562 |
|||||
|
Cash paid for interest expense on Mandatory Redeemable Preferred Shares |
$ |
640,574 |
|||||
|
Non-cash financing activities not included herein consists of reinvestment of dividends and distributions |
$ |
23,134 |
|||||
|
The following table provides a reconciliation of cash and restricted cash reported within the Statement of Assets and Liabilities that sum to the total of the same such amounts shown in the Statements of Cash Flows. |
|||||||
|
Cash with custodian |
4,431,591 |
||||||
|
Foreign currency |
120 |
||||||
|
Restricted cash for short positions |
45 |
||||||
|
Total cash and restricted cash at period end |
$ |
4,431,756 |
|||||
See accompanying Notes to Financial Statements
www.calamos.com
237
Statement of Cash Flows
| LONG/SHORT EQUITY & DYNAMIC INCOME TRUST |
|||||||
| YEAR ENDED OCTOBER 31, 2023 |
|||||||
|
CASH FLOWS FROM OPERATING ACTIVITIES: |
|||||||
|
Net increase/(decrease) in net assets from operations |
$ |
11,011,730 |
|||||
|
Adjustments to reconcile net increase/(decrease) in net assets from operations to net cash provided by (used in) operating activities: |
|||||||
|
Purchase of investment securities, including purchased options |
(1,121,004,667 |
) |
|||||
|
Purchases of securities to cover securities sold short |
(654,948,353 |
) |
|||||
|
Proceeds paid on closing written options |
(26,278,114 |
) |
|||||
|
Proceeds from disposition of investment securities, including purchased options |
1,100,548,328 |
||||||
|
Proceeds from securities sold short |
754,167,490 |
||||||
|
Premiums received from written options |
62,421,798 |
||||||
|
Amortization and accretion of fixed-income securities |
131,739 |
||||||
|
Net realized gains/losses from investments, excluding purchased options |
(27,166,540 |
) |
|||||
|
Net realized gains/losses from purchased options |
28,874,230 |
||||||
|
Net realized gain/losses from short positions |
7,976,140 |
||||||
|
Net realized gains/losses from written options |
(30,981,651 |
) |
|||||
|
Increase from payment by affiliates |
(1,223,984 |
) |
|||||
|
Change in unrealized appreciation or depreciation on investments, excluding purchased options |
19,360,709 |
||||||
|
Change in unrealized appreciation or depreciation on purchased options |
298,348 |
||||||
|
Change in unrealized appreciation or depreciation on short positions |
(5,390,485 |
) |
|||||
|
Change in unrealized appreciation or depreciation on written options |
1,920,104 |
||||||
|
Net change in assets and liabilities: |
|||||||
|
(Increase)/decrease in assets: |
|||||||
|
Accrued interest and dividends receivable |
(31,435 |
) |
|||||
|
Prepaid expenses |
(751 |
) |
|||||
|
Other assets |
(396,731 |
) |
|||||
|
Increase/(decrease) in liabilities: |
|||||||
|
Payables to affiliates |
(4,098 |
) |
|||||
|
Other accounts payable and accrued liabilities |
265,611 |
||||||
|
Net cash provided by/(used in) operating activities |
$ |
119,549,418 |
|||||
|
CASH FLOWS FROM FINANCING ACTIVITIES: |
|||||||
|
Distributions to shareholders |
(32,982,086 |
) |
|||||
|
Net increase/(decrease) in due to custodian bank |
(1,722,387 |
) |
|||||
|
Net cash provided by/(used in) financing activities |
$ |
(34,704,473 |
) |
||||
|
Net increase/(decrease) in cash |
$ |
84,844,945 |
|||||
|
Cash and restricted cash at beginning of year |
$ |
183,062,687 |
|||||
|
Cash at end of year |
$ |
267,907,632 |
|||||
|
Supplemental disclosure |
|||||||
|
Cash paid for interest expense on Notes Payable |
$ |
6,293,310 |
|||||
|
The following table provides a reconciliation of cash and restricted cash reported within the Statement of Assets and Liabilities that sum to the total of the same such amounts shown in the Statements of Cash Flows. |
|||||||
|
Cash with custodian |
4,585,708 |
||||||
|
Restricted cash for short positions |
262,618,136 |
||||||
|
Restricted foreign cash for short positions |
703,788 |
||||||
|
Total cash and restricted cash at period end |
$ |
267,907,632 |
|||||
See accompanying Notes to Financial Statements
CALAMOS CLOSED-END FAMILY OF FUNDS ANNUAL REPORT
238
Notes to Financial Statements
Note 1 – Organization and Significant Accounting Policies
Organization. Calamos Convertible Opportunities and Income Fund ("CHI"), Calamos Convertible and High Income Fund ("CHY"), Calamos Strategic Total Return Fund ("CSQ"), Calamos Dynamic Convertible and Income Fund ("CCD"), Calamos Global Dynamic Income Fund ("CHW"), Calamos Global Total Return Fund ("CGO"), and Calamos Long/Short Equity & Dynamic Income Trust ("CPZ") (each a "Fund", and collectively, the "Funds") were each organized as Delaware statutory trusts and are each registered under the Investment Company Act of 1940, as amended (the "1940 Act") as a diversified, closed-end management investment company.
Significant Accounting Policies. The financial statements have been prepared in conformity with accounting principles generally accepted in the United States of America (U.S. GAAP), and the Funds are each considered an investment company under U.S. GAAP and follow the accounting and reporting guidance applicable to investment companies. The Funds adhere to the accounting and reporting requirements set forth by the Financial Accounting Standards Board in Accounting Standards Codification (ASC) Topic 946: Financial Services—Investment Companies. Under U.S. GAAP, management is required to make certain estimates and assumptions at the date of the financial statements and actual results may differ from those estimates. Subsequent events, if any, through the date that the financial statements were issued, have been evaluated in the preparation of the financial statements. The following summarizes the significant accounting policies of the Funds:
Fund Valuation. Each Board of Trustees ("Board" or "Trustees"), including a majority of the Trustees who are not "interested persons" of each Fund, have designated Calamos Advisors LLC ("Calamos Advisors", or the "Advisor") to perform fair valuation determinations related to all Funds' investments under the oversight of the Board. As "valuation designee" Calamos Advisors has adopted policies and procedures to guide the determination of the net asset value ("NAV") on any day on which each Fund's NAV is determined. The valuation of each Fund's investments is in accordance with these procedures.
Funds' securities that are traded on U.S. securities exchanges, except option securities, are valued at the official closing price, which is the last current reported sales price on its principal exchange at the time the Fund determines its NAV. Securities traded in the over-the-counter market and quoted on The NASDAQ Stock Market are valued at the NASDAQ Official Closing Price, as determined by NASDAQ, or lacking a NASDAQ Official Closing Price, the last current reported sale price on NASDAQ at the time the Fund determines its NAV. When a last sale or closing price is not available, equity securities, other than option securities, that are traded on a U.S. securities exchange and other equity securities traded in the over-the-counter market are valued at the mean between the most recent bid and asked quotations on its principal exchange in accordance with guidelines adopted by the Board. Each option security traded on a U.S. securities exchange is valued at the mid-point of the consolidated bid/ask quote for the option security, also in accordance with guidelines adopted by the Board of Trustees. Each over-the-counter option that is not traded through the Options Clearing Corporation is valued either by an independent pricing agent approved by the Board or based on a quotation provided by the counterparty to such option under the ultimate supervision of the Board.
Fixed income securities, bank loans, certain convertible preferred securities, and non-exchange traded derivatives are normally valued by independent pricing services or by dealers or brokers who make markets in such securities. Valuations of such fixed income securities, bank loans, certain convertible preferred securities, and non-exchange traded derivatives consider yield or price of equivalent securities of comparable quality, coupon rate, maturity, type of issue, trading characteristics and other market data and do not rely exclusively upon exchange or over-the-counter prices.
Trading on European and Far Eastern exchanges and over-the-counter markets is typically completed at various times before the close of business on each day on which the New York Stock Exchange ("NYSE") is open. Each security trading on these exchanges or in over-the-counter markets may be valued utilizing a systematic fair valuation model provided by an independent pricing service approved by the Board of Trustees. The valuation of each security that meets certain criteria in relation to the valuation model is systematically adjusted to reflect the impact of movement in the U.S. market after the foreign markets close. Securities that do not meet the criteria, or that are principally traded in other foreign markets, are valued as of the last reported sale price at the time each Fund determines its NAV, or when reliable market prices or quotations are not readily available, at the mean between the most recent bid and asked quotations as of the close of the appropriate exchange or other designated time. Trading of foreign securities may not take place on every NYSE business day. In addition, trading may take place in various foreign markets on Saturdays or on other days when the NYSE is not open and on which each Fund's NAV is not calculated.
If the Advisor's pricing committee determines that the valuation of a security in accordance with the methods described above is not reflective of a fair value for such security, the security is valued at a fair value by the pricing committee.
www.calamos.com
239
Notes to Financial Statements
The Funds also may use fair value pricing, pursuant to policies and procedures adopted by Calamos Advisors, if trading in the security is halted or if the value of a security it holds is materially affected by events occurring before a Fund's pricing time but after the close of the primary market or exchange on which the security is listed. Those procedures may utilize valuations furnished by pricing services approved by Calamos Advisors, which may be based on market transactions for comparable securities and various relationships between securities that are generally recognized by institutional traders, a computerized matrix system, or appraisals derived from information concerning the securities or similar securities received from recognized dealers in those securities.
When fair value pricing of securities is employed, the prices of securities used by each Fund to calculate its NAV may differ from market quotations or official closing prices. There can be no assurance that each Fund could purchase or sell a portfolio security at the price used to calculate each Fund's NAV.
Various inputs are used to determine the value of each Fund's investments. These inputs are categorized into three broad levels as follows:
• Level 1 – Prices are determined using inputs from unadjusted quoted prices from active markets (including securities actively traded on a securities exchange) for identical assets.
• Level 2 – Prices are determined using significant observable market inputs other than unadjusted quoted prices, including quoted prices of similar securities, fair value adjustments to quoted foreign securities, interest rates, credit risk, prepayment speeds, and other relevant data.
• Level 3 – Prices reflect unobservable market inputs (including each Fund's own judgments about assumptions market participants would use in determining fair value) when observable inputs are unavailable.
Debt securities are valued based upon evaluated prices received from an independent pricing service or from a dealer or broker who makes markets in such securities. Pricing services utilize various observable market data and as such, debt securities are generally categorized as Level 2. The levels are not necessarily an indication of the risk or liquidity of each Fund's investments. The summary of the inputs used in valuing each Fund's holdings are available after each Fund's Schedule of Investments.
Investment Transactions. Investment transactions are recorded on a trade date basis as of October 31, 2023. Net realized gains and losses from investment transactions are reported on an identified cost basis. Interest income is recognized using the accrual method and includes accretion of original issue and market discount and amortization of premium. Dividend income is recognized on the ex-dividend date, except that certain dividends from foreign securities are recorded as soon as the information becomes available after the ex-dividend date.
Foreign Currency Translation. Values of investments and other assets and liabilities denominated in foreign currencies are translated into U.S. dollars using a rate quoted by a major bank or dealer in the particular currency market, as reported by a recognized quotation dissemination service.
The Funds do not isolate that portion of the results of operations resulting from changes in foreign exchange rates on investments from the fluctuations arising from changes in market prices of securities held. Such fluctuations are included with the net realized and unrealized gain or loss from investments.
Reported net realized foreign currency gains or losses arise from disposition of foreign currency, the difference in the foreign exchange rates between the trade and settlement dates on securities transactions, and the difference between the amounts of dividends, interest and foreign withholding taxes recorded on the ex-date or accrual date and the U.S. dollar equivalent of the amounts actually received or paid. Net unrealized foreign exchange gains and losses arise from changes (due to the changes in the exchange rate) in the value of foreign currency and other assets and liabilities denominated in foreign currencies held at period end.
Allocation of Expenses Among Funds. Expenses directly attributable to each respective Fund are charged to the Fund; certain other common expenses of Calamos Advisors Trust, Calamos Investment Trust, Calamos Convertible Opportunities and Income Fund, Calamos Convertible and High Income Fund, Calamos Strategic Total Return Fund, Calamos Global Total Return Fund, Calamos Global Dynamic Income Fund, Calamos Dynamic Convertible and Income Fund, Calamos Long/Short Equity & Dynamic Income Trust, Calamos Antetokounmpo Sustainable Equities Trust, and Calamos ETF Trust are allocated proportionately among each Fund to which the expenses relate in relation to the net assets of each Fund or on another reasonable basis.
CALAMOS CLOSED-END FAMILY OF FUNDS ANNUAL REPORT
240
Notes to Financial Statements
Income Taxes. No provision has been made for U.S. income taxes because each Fund's policy is to continue to qualify as a regulated investment company under the Internal Revenue Code of 1986, as amended, and distribute to shareholders substantially all of the respective Fund's taxable income and net realized gains.
Dividends and distributions paid to common shareholders are recorded on the ex-dividend date. The amount of dividends and distributions from net investment income and net realized capital gains is determined in accordance with federal income tax regulations, which may differ from U.S. generally accepted accounting principles. To the extent these "book and tax" differences are permanent in nature, such amounts are reclassified within the capital accounts based on their federal tax-basis treatment. These differences are primarily due to differing treatments for foreign currency transactions, contingent payment debt instruments and methods of amortizing and accreting for fixed income securities. The financial statements are not adjusted for temporary differences.
Distributions to holders of Mandatory Redeemable Preferred Shares ("MRPS") as described in Note 8 are accrued on a daily basis and are treated as an operating expense due to the fixed term of the obligation. The distributions are shown on the Statement of Operations as Interest expense and amortization of offering costs on MRPS. For tax purposes, the distributions made to the holders of the MRPS are treated as dividends.
The Funds recognized no liability for uncertain tax positions. A reconciliation is not provided as the beginning and ending amounts of unrecognized benefits are zero, with no interim additions, reductions or settlements. Tax years 2020 – 2022 remain subject to examination by the U.S. and the State of Illinois tax jurisdictions.
Indemnifications. Under the Funds' organizational documents, each Fund is obligated to indemnify its officers and trustees against certain liabilities incurred by them by reason of having been an officer or trustee of the Fund. In addition, in the normal course of business, a Fund may enter into contracts that provide general indemnifications to other parties. A Fund's maximum exposure under these arrangements is unknown as this would involve future claims that may be made against a Fund that have not yet occurred. Currently, the Funds' management expects the risk of material loss in connection to a potential claim to be remote.
Note 2 – Investment Adviser and Transactions With Affiliates Or Certain Other Parties
Pursuant to an investment advisory agreement with Calamos Advisors, each Fund pays an annual fee, payable monthly based on the average weekly managed assets of the Fund, as shown below:
|
FUND |
ANNUAL RATE |
||||||
|
Convertible Opportunities and Income Fund |
0.80 |
% |
|||||
|
Convertible and High Income Fund |
0.80 |
% |
|||||
|
Strategic Total Return Fund |
1.00 |
% |
|||||
|
Dynamic Convertible and Income Fund |
1.00 |
% |
|||||
|
Global Dynamic Income Fund |
1.00 |
% |
|||||
|
Global Total Return Fund |
1.00 |
% |
|||||
|
Long/Short Equity & Dynamic Income Trust |
1.35 |
% |
|||||
Each Fund reimburses Calamos Advisors for a portion of compensation paid to each Trust's Chief Compliance Officer. This compensation is reported as part of the "Trustees' fees and officer compensation" expense on the Funds' Statements of Operations.
The Funds have adopted a deferred compensation plan (the "Plan"). Under the Plan, a trustee who is not an "interested person" (as defined in the 1940 Act) and has elected to participate in the Plan (a "participating trustee") may defer receipt of all or a portion of his compensation from the Trust. The deferred compensation payable to the participating trustee is credited to the trustee's deferral account as of the business day such compensation would have been paid to the participating trustee. The value of amounts deferred for a participating trustee is determined by reference to the change in value of Class I shares of one or more funds of the Calamos Investment Trust designated by the participant. The value of the account increases with contributions to the account or with increases in the value of the measuring shares, and the value of the account decreases with withdrawals from the account or with declines in the value of the measuring shares.
www.calamos.com
241
Notes to Financial Statements
At October 31, 2023, the Funds had deferred compensation balances, which are included in "Other assets" on the Statements of Assets and Liabilities, as follows:
|
FUND |
AMOUNT |
||||||
|
Convertible Opportunities and Income Fund |
$ |
165,660 |
|||||
|
Convertible and High Income Fund |
142,968 |
||||||
|
Strategic Total Return Fund |
202,387 |
||||||
|
Dynamic Convertible and Income Fund |
0 |
||||||
|
Global Dynamic Income Fund |
76,901 |
||||||
|
Global Total Return Fund |
48,868 |
||||||
|
Long/Short Equity & Dynamic Income Trust |
0 |
||||||
Each Fund's obligation to make payments under the Plan is a general obligation of the Fund and is included in "Payable for deferred compensation to trustees" on the Statements of Assets and Liabilities at October 31, 2023.
Calamos Long/Short Equity & Dynamic Income Trust recorded payment by affiliates in the amount of $1,223,984 for losses incurred on the disposal of investments that resulted due to the identification of an error during the year ended October 31, 2023. This amount is reported on the Fund's Statements of Operations and Financial Highlights under "Payments by affiliates" and " Net increase from payment by affiliates," respectively.
Note 3 – Investments
The cost of purchases and proceeds from sales of long-term investments, excluding investments sold short, for the year ended October 31, 2023 are shown in the table below. Furthermore, the cost of purchases to cover short sales and the proceeds of short sales were $654,892,857 and $754,111,384 for Long/Short Equity & Dynamic Income Fund, respectively.
|
COST OF PURCHASES |
PROCEEDS FROM SALES |
||||||||||||||||||
|
FUND |
U.S. GOV'T SECURITIES |
OTHER |
U.S. GOV'T SECURITIES |
OTHER |
|||||||||||||||
|
Convertible Opportunities and Income Fund |
$ |
— |
$ |
452,391,704 |
$ |
33,104,297 |
$ |
494,221,432 |
|||||||||||
|
Convertible and High Income Fund |
— |
498,717,850 |
23,541,074 |
554,842,979 |
|||||||||||||||
|
Strategic Total Return Fund |
— |
929,503,053 |
— |
1,019,380,866 |
|||||||||||||||
|
Dynamic Convertible and Income Fund |
— |
347,176,957 |
29,915,723 |
370,184,066 |
|||||||||||||||
|
Global Dynamic Income Fund |
— |
660,744,824 |
15,772,099 |
661,581,692 |
|||||||||||||||
|
Global Total Return Fund |
— |
160,752,534 |
2,750,623 |
163,225,971 |
|||||||||||||||
|
Long/Short Equity & Dynamic Income Trust |
— |
944,956,681 |
— |
986,888,558 |
|||||||||||||||
The cost basis of investments for federal income tax purposes at October 31, 2023 was as follows:
|
FUND |
COST BASIS OF INVESTMENTS |
GROSS UNREALIZED APPRECIATION |
GROSS UNREALIZED DEPRECIATION |
NET UNREALIZED APPRECIATION (DEPRECIATION) |
|||||||||||||||
|
Convertible Opportunities and Income Fund |
$ |
1,255,349,334 |
$ |
23,571,961 |
$ |
(189,445,298 |
) |
$ |
(165,873,337 |
) |
|||||||||
|
Convertible and High Income Fund |
1,366,790,450 |
24,744,423 |
(207,346,940 |
) |
(182,602,517 |
) |
|||||||||||||
|
Strategic Total Return Fund |
2,942,500,470 |
578,112,011 |
(313,693,683 |
) |
264,418,328 |
||||||||||||||
|
Dynamic Convertible and Income Fund |
844,408,560 |
18,897,966 |
(127,620,129 |
) |
(108,722,163 |
) |
|||||||||||||
|
Global Dynamic Income Fund |
740,299,828 |
9,762,185 |
(173,226,509 |
) |
(163,464,324 |
) |
|||||||||||||
|
Global Total Return Fund |
157,905,304 |
3,609,165 |
(28,801,311 |
) |
(25,192,146 |
) |
|||||||||||||
|
Long/Short Equity & Dynamic Income Trust |
241,462,274 |
10,585,950 |
(79,080,660 |
) |
(68,494,710 |
) |
|||||||||||||
CALAMOS CLOSED-END FAMILY OF FUNDS ANNUAL REPORT
242
Notes to Financial Statements
Note 4 – Income Taxes
For the fiscal year ended October 31, 2023, the Funds recorded the following permanent reclassifications to reflect tax character. The results of operations and net assets were not affected by these reclassifications.
|
FUND |
PAID-IN CAPITAL |
UNDISTRIBUTED/ (OVERDISTRIBUTED) NET INVESTMENT INCOME/(LOSS) |
ACCUMULATED NET REALIZED GAIN/(LOSS) ON INVESTMENTS |
||||||||||||
|
Convertible Opportunities and Income Fund |
$ |
(535,414 |
) |
$ |
18,534,527 |
$ |
(17,999,113 |
) |
|||||||
|
Convertible and High Income Fund |
(510 |
) |
20,022,699 |
(20,022,189 |
) |
||||||||||
|
Strategic Total Return Fund |
(649,022 |
) |
110,657,898 |
(110,008,876 |
) |
||||||||||
|
Dynamic Convertible and Income Fund |
(470,337 |
) |
17,164,912 |
(16,694,575 |
) |
||||||||||
|
Global Dynamic Income Fund |
(19,614,481 |
) |
30,458,638 |
(10,844,157 |
) |
||||||||||
|
Global Total Return Fund |
(2,907,532 |
) |
6,254,259 |
(3,346,727 |
) |
||||||||||
|
Long/Short Equity & Dynamic Income Trust |
(32 |
) |
(119,743 |
) |
119,775 |
||||||||||
Each Fund intends to make monthly distributions from its income available for distribution, which consists of each Fund's dividends and interest income after payment of Fund expenses, and net realized gains on investments. At least annually, each Fund intends to distribute all or substantially all of its net realized capital gains, if any. Distributions are recorded on the ex-dividend date. Each Fund distinguishes between distributions on a tax basis and a financial reporting basis. Accounting principles generally accepted in the United States of America require that only distributions in excess of tax basis earnings and profits be reported in the financial statements as a return of capital. Permanent differences between book and tax accounting relating to distributions are reclassified to paid-in-capital. For tax purposes, distributions from short-term capital gains are considered to be from ordinary income. Distributions in any year may include a return of capital component.
Distributions were characterized for federal income tax purposes as follows:
| YEAR OR PERIOD ENDED OCTOBER 31, 2023 |
YEAR ENDED OCTOBER 31, 2022 |
||||||||||||||||||||||||||
|
FUND |
ORDINARY INCOME |
LONG-TERM CAPITAL GAIN |
RETURN OF CAPITAL |
ORDINARY INCOME |
LONG-TERM CAPITAL GAIN |
RETURN OF CAPITAL |
|||||||||||||||||||||
|
Convertible Opportunities and Income Fund |
$ |
30,821,886 |
$ |
58,448,531 |
— |
$ |
24,489,812 |
$ |
63,422,635 |
— |
|||||||||||||||||
|
Convertible and High Income Fund |
32,248,272 |
63,794,457 |
— |
22,215,664 |
72,535,445 |
— |
|||||||||||||||||||||
|
Strategic Total Return Fund |
17,803,791 |
190,612,272 |
— |
35,001,817 |
171,625,596 |
— |
|||||||||||||||||||||
|
Dynamic Convertible and Income Fund |
16,264,044 |
48,555,021 |
— |
5,018,611 |
57,501,392 |
— |
|||||||||||||||||||||
|
Global Dynamic Income Fund |
21,588,110 |
— |
19,222,158 |
69,596,978 |
28,228,527 |
44,585,621 |
|||||||||||||||||||||
|
Global Total Return Fund |
5,888,148 |
1,289,760 |
2,813,588 |
15,027,531 |
4,934,556 |
8,056,439 |
|||||||||||||||||||||
|
Long/Short Equity & Dynamic Income Trust |
32,183,213 |
798,873 |
— |
21,219,129 |
11,762,957 |
— |
|||||||||||||||||||||
As of October 31, 2023, the components of accumulated earnings/(loss) on a tax basis were as follows:
| CONVERTIBLE OPPORTUNITIES AND INCOME FUND |
CONVERTIBLE AND HIGH INCOME FUND |
STRATEGIC TOTAL RETURN FUND |
DYNAMIC CONVERTIBLE AND INCOME FUND |
||||||||||||||||
|
Undistributed ordinary income |
$ |
— |
$ |
— |
$ |
— |
$ |
— |
|||||||||||
|
Undistributed capital gains |
2,231,502 |
442,758 |
4,141,607 |
4,987,751 |
|||||||||||||||
|
Total undistributed earnings |
2,231,502 |
442,758 |
4,141,607 |
4,987,751 |
|||||||||||||||
|
Accumulated capital and other losses |
— |
— |
(8,231,699 |
) |
— |
||||||||||||||
|
Net unrealized gains/(losses) |
(165,873,337 |
) |
(182,602,517 |
) |
264,399,772 |
(108,722,163 |
) |
||||||||||||
|
Total accumulated earnings/(losses) |
(163,641,835 |
) |
(182,159,759 |
) |
260,309,680 |
(103,734,412 |
) |
||||||||||||
|
Other |
(104,840 |
) |
(136,044 |
) |
(123,631 |
) |
— |
||||||||||||
|
Paid-in-capital |
836,528,404 |
907,116,571 |
1,889,816,626 |
563,099,438 |
|||||||||||||||
|
Net assets applicable to common shareholders |
$ |
672,781,729 |
$ |
724,820,768 |
$ |
2,150,002,675 |
$ |
459,365,026 |
|||||||||||
www.calamos.com
243
Notes to Financial Statements
| GLOBAL DYNAMIC INCOME FUND |
GLOBAL TOTAL RETURN FUND |
LONG/SHORT EQUITY & DYNAMIC INCOME TRUST |
|||||||||||||
|
Undistributed ordinary income |
$ |
— |
$ |
— |
$ |
4,767,671 |
|||||||||
|
Undistributed capital gains |
— |
— |
— |
||||||||||||
|
Total undistributed earnings |
— |
— |
4,767,671 |
||||||||||||
|
Accumulated capital and other losses |
— |
— |
— |
||||||||||||
|
Net unrealized gains/(losses) |
(163,667,896 |
) |
(25,255,338 |
) |
(68,500,156 |
) |
|||||||||
|
Total accumulated earnings/(losses) |
(163,667,896 |
) |
(25,255,338 |
) |
(63,732,485 |
) |
|||||||||
|
Other |
(206,675 |
) |
(91,992 |
) |
(4,118,672 |
) |
|||||||||
|
Paid-in-capital |
546,739,904 |
114,926,525 |
392,628,225 |
||||||||||||
|
Net assets applicable to common shareholders |
$ |
382,865,333 |
$ |
89,579,195 |
$ |
324,777,068 |
|||||||||
Note 5 – Short Sales
Calamos Global Dynamic Income Fund, and Calamos Long/Short Equity & Dynamic Income Trust may sell securities short. Securities sold short represent obligations to deliver the securities at a future date. Each Fund may sell a security it does not own in anticipation of a decline in the value of that security before the delivery date. When a Fund sells a security short, it must borrow the security sold short and deliver it to the broker-dealer through which it made the short sale. Dividends paid on securities sold short are disclosed as an expense on the Statements of Operations. A gain, limited to the price at which a Fund sold the security short, or a loss, unlimited in size, will be realized upon the termination of a short sale.
To secure its obligation to deliver to the broker-dealer the securities sold short, a Fund must segregate an amount of cash or liquid securities with its custodian equal to any excess of the current market value of the securities sold short over any cash or liquid securities deposited as collateral with the broker in connection with the short sale (not including the proceeds of the short sale). As a result of that requirement, a Fund will not gain any leverage merely by selling short, except to the extent that it earns interest or other income or gains on the segregated cash or liquid securities while also being subject to the possibility of gain or loss from the securities sold short. Other Income on the Statement of Operations consists of income from interest on short sales of $6,494,633 during the year ended October 31, 2023.
Note 6 – Derivative Instruments
Foreign Currency Risk. Each Fund may engage in portfolio hedging with respect to changes in currency exchange rates by entering into forward foreign currency contracts to purchase or sell currencies. A forward foreign currency contract is a commitment to purchase or sell a foreign currency at a future date at a negotiated forward rate. Risks associated with such contracts include, among other things, movement in the value of the foreign currency relative to the U.S. dollar and the ability of the counterparty to perform.
To mitigate the counterparty risk, a Fund may enter into an International Swaps and Derivatives Association, Inc. Master Agreement ("ISDA Master Agreement") or similar agreement with its derivative contract counterparties. An ISDA Master Agreement is a bilateral agreement between a Fund and a counterparty that governs over-the-counter derivatives and foreign exchange contracts and typically contains, among other things, collateral posting terms and netting provisions in the event of a default and/or termination event. Under an ISDA Master Agreement, a Fund may, under certain circumstances, offset with the counterparty certain derivative financial instrument's payables and/or receivables with collateral held and/or posted and create one single net payment. The provisions of the ISDA Master Agreement typically permit a single net payment in the event of default (close-out netting) including the bankruptcy or insolvency of the counterparty. Generally, collateral is exchanged between a Fund and the counterparty and the amount of collateral due from a Fund or to a counterparty has to exceed a minimum transfer amount threshold before a transfer has to be made. To the extent amounts due to the Fund from its counterparties are not fully collateralized, contractually or otherwise, the Fund bears the risk of loss from counterparty nonperformance. When a Fund is required to post collateral under the terms of a derivatives transaction and master netting agreement, a Fund's custodian holds the collateral in a segregated account, subject to the terms of a tri-party agreement among a Fund, the custodian and the counterparty. The master netting agreement and tri-party agreement provide, in relevant part, that the counterparty may have rights to the amounts in the segregated account in the event that a Fund defaults in its obligation with respect to the derivative instrument that is subject to the collateral requirement. When a counterparty is required to post collateral under the terms of a derivatives transaction and master netting agreement, the counterparty delivers such amount to a Fund's custodian. The master netting agreement provides, in relevant part, that the Fund may have rights to such collateral in the event that the counterparty defaults in its obligation with respect to the
CALAMOS CLOSED-END FAMILY OF FUNDS ANNUAL REPORT
244
Notes to Financial Statements
derivative instrument that is subject to the collateral requirement. Generally before a default, neither a Fund nor the counterparty may resell, rehypothecate, or repledge any collateral that it receives.
For financial reporting purposes, the Funds do not offset derivative assets and derivative liabilities that are subject to netting arrangements in the Statement of Assets and Liabilities. Each Fund's net counterparty exposure, if any, is reflected in the Schedules of Investments. The net unrealized gain, if any, represents the credit risk to the Fund on a forward foreign currency contract. The contracts are valued daily at forward foreign exchange rates. The Fund realizes a gain or loss when a position is closed or upon settlement of the contracts. There were no open forward foreign currency contracts for any of the Funds at October 31, 2023.
Equity Risk. Each Fund may engage in option transactions and in doing so achieves similar objectives to what it would achieve through the sale or purchase of individual securities. A call option, upon payment of a premium, gives the purchaser of the option the right to buy, and the seller of the option the obligation to sell, the underlying security, index or other instrument at the exercise price. A put option gives the purchaser of the option, upon payment of a premium, the right to sell, and the seller the obligation to buy, the underlying security, index, or other instrument at the exercise price.
To seek to offset some of the risk of a potential decline in value of certain long positions, each Fund may also purchase put options on individual securities, broad-based securities indexes or certain exchange-traded funds ("ETFs"). Each Fund may also seek to generate income from option premiums by writing (selling) options on a portion of the equity securities (including securities that are convertible into equity securities) in a Fund's portfolio, on broad-based securities indexes, or certain ETFs.
When a Fund purchases an option, it pays a premium and an amount equal to that premium is recorded as an asset. When a Fund writes an option, it receives a premium and an amount equal to that premium is recorded as a liability. The asset or liability is adjusted daily to reflect the current market value of the option. If an option expires unexercised, a Fund realizes a gain or loss to the extent of the premium received or paid. If an option is exercised, the premium received or paid is recorded as an adjustment to the proceeds from the sale or the cost basis of the purchase. The difference between the premium and the amount received or paid on a closing purchase or sale transaction is also treated as a realized gain or loss. The cost of securities acquired through the exercise of call options is increased by premiums paid. The proceeds from securities sold through the exercise of put options are decreased by the premiums paid. Gain or loss on written options and purchased options is presented separately on the Statements of Operations as net realized gain or loss on written options and net realized gain or loss on purchased options, respectively.
Options written by each Fund do not typically give rise to counterparty credit risk since options written obligate each Fund and not the counterparty to perform. Exchange traded purchased options have minimal counterparty credit risk to each Fund since the exchange's clearinghouse, as counterparty to such instruments, guarantees against a possible default. As of October 31, 2023, the Funds had outstanding purchased options and/or written options as listed on the Schedules of Investments.
Interest Rate Risk. Each Fund may engage in interest rate swaps primarily to hedge the interest rate risk on the Fund's borrowings (see Note 7—Notes Payable). An interest rate swap is a contract that involves the exchange of one type of interest rate for another type of interest rate. If interest rates rise, resulting in a diminution in the value of the Fund's portfolio, the Fund would receive payments under the swap that would offset, in whole or in part, such diminution in value; if interest rates fall, the Fund would likely lose money on the swap transaction. Unrealized gains are reported as an asset, and unrealized losses are reported as a liability on the Statements of Assets and Liabilities. The change in value of swaps, including accruals of periodic amounts of interest to be paid or received on swaps, is reported as change in net unrealized appreciation/depreciation on interest rate swaps in the Statements of Operations. A realized gain or loss is recorded in net realized gain (loss) on interest rate swaps in the Statements of Operations upon payment or receipt of a periodic payment or termination of the swap agreements. Swap agreements are stated at fair value. Notional principal amounts are used to express the extent of involvement in these transactions, but the amounts potentially subject to credit risk are much smaller. In connection with these contracts, securities may be identified as collateral in accordance with the terms of the respective swap contracts in the event of default or bankruptcy of each Fund. Please see the disclosure regarding ISDA Master Agreements under Foreign Currency Risk within this note.
Premiums paid to or by a Fund are accrued daily and included in realized gain (loss) when paid on swaps in the accompanying Statements of Operations. The contracts are marked-to-market daily based upon third party vendor valuations and changes in value are recorded as unrealized appreciation (depreciation). Gains or losses are realized upon early termination of the contract. Risks may exceed amounts recognized in the Statements of Assets and Liabilities. These risks include changes in the returns of the underlying instruments, failure of the counterparties to perform under the contracts' terms, counterparty's creditworthiness, and the possible lack of liquidity with respect to the contracts.
www.calamos.com
245
Notes to Financial Statements
As of October 31, 2023, the Funds had no outstanding interest rate swap agreements.
As of October 31, 2023, the Funds had outstanding derivative contracts which are reflected on the Statement of Assets and Liabilities as follows:
| ASSET DERIVATIVES |
LIABILITY DERIVATIVES |
||||||||||
| CONVERTIBLE OPPORTUNITIES AND INCOME FUND |
|||||||||||
|
Gross amounts at fair value: |
|||||||||||
|
Purchased Options(1) |
$ |
1,175,700 |
$ |
— |
|||||||
|
$ |
1,175,700 |
$ |
— |
||||||||
| CONVERTIBLE AND HIGH INCOME FUND |
|||||||||||
|
Gross amounts at fair value: |
|||||||||||
|
Purchased Options(1) |
$ |
1,261,775 |
$ |
— |
|||||||
|
$ |
1,261,775 |
$ |
— |
||||||||
| ASSET DERIVATIVES |
LIABILITY DERIVATIVES |
||||||||||
|
STRATEGIC TOTAL RETURN FUND |
|||||||||||
|
Gross amounts at fair value: |
|||||||||||
|
Purchased Options(1) |
$ |
1,526,300 |
$ |
— |
|||||||
|
$ |
1,526,300 |
$ |
— |
||||||||
| DYNAMIC CONVERTIBLE AND INCOME FUND |
|||||||||||
|
Gross amounts at fair value: |
|||||||||||
|
Purchased Options(1) |
$ |
1,037,475 |
$ |
— |
|||||||
|
$ |
1,037,475 |
$ |
— |
||||||||
|
GLOBAL DYNAMIC INCOME FUND |
|||||||||||
|
Gross amounts at fair value: |
|||||||||||
|
Purchased Options(1) |
$ |
1,573,636 |
$ |
— |
|||||||
|
Written Options(2) |
— |
160,840 |
|||||||||
|
$ |
1,573,636 |
$ |
160,840 |
||||||||
|
GLOBAL TOTAL RETURN FUND |
|||||||||||
|
Gross amounts at fair value: |
|||||||||||
|
Purchased Options(1) |
$ |
324,467 |
$ |
— |
|||||||
|
Written Options(2) |
— |
35,365 |
|||||||||
|
$ |
324,467 |
$ |
35,365 |
||||||||
| LONG/SHORT EQUITY & DYNAMIC INCOME TRUST |
|||||||||||
|
Gross amounts at fair value: |
|||||||||||
|
Purchased Options(1) |
$ |
3,105,465 |
$ |
— |
|||||||
|
Written Options(2) |
— |
3,965,683 |
|||||||||
|
$ |
3,105,465 |
$ |
3,965,683 |
||||||||
CALAMOS CLOSED-END FAMILY OF FUNDS ANNUAL REPORT
246
Notes to Financial Statements
For the year ended October 31, 2023, the volume of derivative activity for the Funds are reflected below:*
|
FUND |
PURCHASED OPTIONS(1) |
WRITTEN OPTIONS(2) |
|||||||||
|
Convertible Opportunities and Income Fund |
1,753 |
— |
|||||||||
|
Convertible and High Income Fund |
1,881 |
— |
|||||||||
|
Strategic Total Return Fund |
67,203 |
11,360 |
|||||||||
|
Dynamic Convertible and Income Fund |
1,534 |
— |
|||||||||
|
Global Dynamic Income Fund |
38,769 |
5,648 |
|||||||||
|
Global Total Return Fund |
9,801 |
1,244 |
|||||||||
|
Long/Short Equity & Dynamic Income Trust |
394,136 |
413,960 |
|||||||||
* Activity during the period is measured by opened number of contracts for options purchased or written.
(1) Generally, the Statement of Assets and Liabilities location for Purchased Options is "Investments in securities, at value".
(2) Generally, the Statement of Assets and Liabilities location for Written Options is "Options written, at value".
Note 7 – Notes Payable
The Funds have each entered into an Amended and Restated Liquidity Agreement (the "SSB Agreement") with State Street Bank and Trust Company ("SSB") that allows each Fund to borrow up to a certain limit as shown in the table below, as well as engage in securities lending and securities repurchase transactions.
|
FUND |
BORROWING LIMIT (IN MILLIONS) |
||||||
|
Convertible Opportunities and Income Fund |
$ |
430.0 |
|||||
|
Convertible and High Income Fund |
480.0 |
||||||
|
Strategic Total Return Fund |
1,130.0 |
||||||
|
Dynamic Convertible and Income Fund |
370.0 |
||||||
|
Global Dynamic Income Fund |
265.0 |
||||||
|
Global Total Return Fund |
55.0 |
||||||
|
Long/Short Equity & Dynamic Income Trust |
150.0 |
||||||
Advances under the SSB Agreement are secured by assets of the Funds that are held with the Funds' custodian in a separate account (the "pledged collateral"). Interest on the SSB Agreement was charged on the drawn amount at the rate of OBFR plus 0.80% from November 1, 2022 through June 30, 2023. The rate from July 1, 2023 through October 31, 2023 was OBFR plus 0.52%. A commitment fee of 0.10% is payable on any undrawn balance. For the year ended October 31, 2023, the Funds borrowed according to the table below:
|
FUND |
AVERAGE BORROWINGS (IN MILLIONS) |
AVERAGE INTEREST RATE |
TOTAL OUTSTANDING BORROWINGS (IN MILLIONS) |
INTEREST RATE APPLICABLE TO BORROWINGS |
|||||||||||||||
|
Convertible Opportunities and Income Fund |
$ |
323.6 |
5.35 |
% |
$ |
314.4 |
5.65 |
% |
|||||||||||
|
Convertible and High Income Fund |
349.6 |
5.34 |
% |
340.4 |
5.64 |
% |
|||||||||||||
|
Strategic Total Return Fund |
800.5 |
5.36 |
% |
800.5 |
5.64 |
% |
|||||||||||||
|
Dynamic Convertible and Income Fund |
217.4 |
5.32 |
% |
210.0 |
5.62 |
% |
|||||||||||||
|
Global Dynamic Income Fund |
109.0 |
5.36 |
% |
130.6 |
5.64 |
% |
|||||||||||||
|
Global Total Return Fund |
25.0 |
5.31 |
% |
30.1 |
5.60 |
% |
|||||||||||||
|
Long/Short Equity & Dynamic Income Trust |
120.0 |
5.41 |
% |
120.0 |
5.69 |
% |
|||||||||||||
www.calamos.com
247
Notes to Financial Statements
Under the terms of the SSB Agreement, all securities lent through SSB must be secured continuously by collateral received in cash. Cash collateral received by SSB on behalf of the Fund is deposited by SSB in a custodial account of the Fund and then applied to repay borrowings under the SSB, such that the cash advanced to the Fund remains unchanged. Upon termination of a securities loan, SSB will advance to the Fund the cash collateral required to be returned by the Fund, or secure the appropriate amount through one or more securities lending transactions as the Fund's agent, and deposit the amount to a custodial account of the Fund and then subsequently return such amount to the securities borrower against return of the securities on loan. Again, the net cash to the Fund is unaltered. Only the composition of the advance is changed, and regardless of the composition of advances as between cash collateral for securities lending transactions or borrowings from SSB, they are not reflected separately in the Statement of Assets and Liabilities but as a component of the Notes Payable. The Fund has the right to recall securities which have been lent at any time. The securities lending arrangement with SSB involves characteristics common in arm's length relationships in which one party may benefit at the expense of the other party. As of October 31, 2023, the Funds had securities on loan under the SSB Agreement which are reflected in the Investment in securities, at value on the Statement of Assets and Liabilities and are shown in the table below. The borrowings are categorized as Level 2 within the fair value hierarchy.
The composition of the securities on loan was as follows:
|
FUND |
SECURITIES ON LOAN (IN MIILIONS) |
FIXED INCOME SECURITIES (IN MILLIONS) |
EQUITY SECURITIES (IN MILLIONS) |
||||||||||||
|
Convertible Opportunities and Income Fund |
$ |
52.9 |
$ |
40.8 |
$ |
12.1 |
|||||||||
|
Convertible and High Income Fund |
48.1 |
40.1 |
8.0 |
||||||||||||
|
Strategic Total Return Fund |
721.1 |
80.8 |
640.3 |
||||||||||||
|
Dynamic Convertible and Income Fund |
15.0 |
9.2 |
5.8 |
||||||||||||
|
Global Dynamic Income Fund |
14.0 |
3.4 |
10.6 |
||||||||||||
|
Global Total Return Fund |
5.7 |
1.2 |
4.5 |
||||||||||||
|
Long/Short Equity & Dynamic Income Trust |
2.1 |
1.4 |
0.7 |
||||||||||||
Note 8 – Mandatory Redeemable Preferred Shares
All Funds except Long/Short Equity & Dynamic Income Trust have MRPS issued and outstanding, each divided into four series with different mandatory redemption dates and dividend rates. On September 6, 2022 CHI had $33,250,000, CHY had $36,500,000, CSQ had $80,500,000, CCD had $21,250,000, CGO had $4,000,000, and CHW had $21,500,000 of Series A MRPS redeemed at $25.01 per share, respectively. The tables below summarizes the key terms of each series of the MRPS at October 31, 2023.
The MRPS are divided into four series with different mandatory redemption dates and dividend rates. The tables below summarizes the key terms of each Fund's series of the MRPS at October 31, 2023.
CONVERTIBLE OPPORTUNITIES AND INCOME FUND
|
SERIES |
ISSUE DATE |
TERM REDEMPTION DATE |
DIVIDEND RATE |
SHARES (000'S) |
LIQUIDATION PREFERENCE PER SHARE |
AGGREGATE LIQUIDATION PREFERENCE |
|||||||||||||||||||||
|
Series B |
9/6/17 |
9/6/24 |
4.00 |
% |
1,330 |
$ |
25 |
$ |
33,250,000 |
||||||||||||||||||
|
Series C |
9/6/17 |
9/6/27 |
4.24 |
% |
1,340 |
$ |
25 |
$ |
33,500,000 |
||||||||||||||||||
|
Series D |
8/24/21 |
8/24/26 |
2.45 |
% |
1,320 |
$ |
25 |
$ |
33,000,000 |
||||||||||||||||||
|
Series E |
3/8/22 |
5/24/27 |
2.68 |
% |
1,330 |
$ |
25 |
$ |
33,250,000 |
||||||||||||||||||
|
Total |
$ |
133,000,000 |
|||||||||||||||||||||||||
CALAMOS CLOSED-END FAMILY OF FUNDS ANNUAL REPORT
248
Notes to Financial Statements
CONVERTIBLE AND HIGH INCOME FUND
|
SERIES |
ISSUE DATE |
TERM REDEMPTION DATE |
DIVIDEND RATE |
SHARES (000'S) |
LIQUIDATION PREFERENCE PER SHARE |
AGGREGATE LIQUIDATION PREFERENCE |
|||||||||||||||||||||
|
Series B |
9/6/17 |
9/6/24 |
4.00 |
% |
1,460 |
$ |
25 |
$ |
36,500,000 |
||||||||||||||||||
|
Series C |
9/6/17 |
9/6/27 |
4.24 |
% |
1,480 |
$ |
25 |
$ |
37,000,000 |
||||||||||||||||||
|
Series D |
8/24/21 |
8/24/26 |
2.45 |
% |
1,400 |
$ |
25 |
$ |
35,000,000 |
||||||||||||||||||
|
Series E |
3/8/22 |
5/24/27 |
2.68 |
% |
1,460 |
$ |
25 |
$ |
36,500,000 |
||||||||||||||||||
|
Total |
$ |
145,000,000 |
|||||||||||||||||||||||||
STRATEGIC TOTAL RETURN FUND
|
SERIES |
ISSUE DATE |
TERM REDEMPTION DATE |
DIVIDEND RATE |
SHARES (000'S) |
LIQUIDATION PREFERENCE PER SHARE |
AGGREGATE LIQUIDATION PREFERENCE |
|||||||||||||||||||||
|
Series B |
9/6/17 |
9/6/24 |
4.00 |
% |
3,220 |
$ |
25 |
$ |
80,500,000 |
||||||||||||||||||
|
Series C |
9/6/17 |
9/6/27 |
4.24 |
% |
3,240 |
$ |
25 |
$ |
81,000,000 |
||||||||||||||||||
|
Series D |
8/24/21 |
8/24/26 |
2.45 |
% |
2,480 |
$ |
25 |
$ |
62,000,000 |
||||||||||||||||||
|
Series F |
5/24/22 |
5/24/27 |
3.66 |
% |
4,000 |
$ |
25 |
$ |
100,000,000 |
||||||||||||||||||
|
Total |
$ |
323,500,000 |
|||||||||||||||||||||||||
DYNAMIC CONVERTIBLE AND INCOME FUND
|
SERIES |
ISSUE DATE |
TERM REDEMPTION DATE |
DIVIDEND RATE |
SHARES (000'S) |
LIQUIDATION PREFERENCE PER SHARE |
AGGREGATE LIQUIDATION PREFERENCE |
|||||||||||||||||||||
|
Series B |
9/6/17 |
9/6/24 |
4.00 |
% |
850 |
$ |
25 |
$ |
21,250,000 |
||||||||||||||||||
|
Series C |
9/6/17 |
9/6/27 |
4.24 |
% |
860 |
$ |
25 |
$ |
21,500,000 |
||||||||||||||||||
|
Series D |
8/24/21 |
8/24/26 |
2.45 |
% |
1,120 |
$ |
25 |
$ |
28,000,000 |
||||||||||||||||||
|
Series E |
3/8/22 |
5/24/27 |
2.68 |
% |
850 |
$ |
25 |
$ |
21,250,000 |
||||||||||||||||||
|
Total |
$ |
92,000,000 |
|||||||||||||||||||||||||
GLOBAL DYNAMIC INCOME FUND
|
SERIES |
ISSUE DATE |
TERM REDEMPTION DATE |
DIVIDEND RATE |
SHARES (000'S) |
LIQUIDATION PREFERENCE PER SHARE |
AGGREGATE LIQUIDATION PREFERENCE |
|||||||||||||||||||||
|
Series B |
9/6/17 |
9/6/24 |
4.00 |
% |
860 |
$ |
25 |
$ |
21,500,000 |
||||||||||||||||||
|
Series C |
9/6/17 |
9/6/27 |
4.24 |
% |
880 |
$ |
25 |
$ |
22,000,000 |
||||||||||||||||||
|
Series D |
8/24/21 |
8/24/26 |
2.45 |
% |
200 |
$ |
25 |
$ |
5,000,000 |
||||||||||||||||||
|
Series E |
3/8/22 |
5/24/27 |
2.68 |
% |
860 |
$ |
25 |
$ |
21,500,000 |
||||||||||||||||||
|
Total |
$ |
70,000,000 |
|||||||||||||||||||||||||
GLOBAL TOTAL RETURN FUND
|
SERIES |
ISSUE DATE |
TERM REDEMPTION DATE |
DIVIDEND RATE |
SHARES (000'S) |
LIQUIDATION PREFERENCE PER SHARE |
AGGREGATE LIQUIDATION PREFERENCE |
|||||||||||||||||||||
|
Series B |
9/6/17 |
9/6/24 |
4.00 |
% |
160 |
$ |
25 |
$ |
4,000,000 |
||||||||||||||||||
|
Series C |
9/6/17 |
9/6/27 |
4.24 |
% |
160 |
$ |
25 |
$ |
4,000,000 |
||||||||||||||||||
|
Series D |
8/24/21 |
8/24/26 |
2.45 |
% |
200 |
$ |
25 |
$ |
5,000,000 |
||||||||||||||||||
|
Series E |
3/8/22 |
5/24/27 |
2.68 |
% |
160 |
$ |
25 |
$ |
4,000,000 |
||||||||||||||||||
|
Total |
$ |
17,000,000 |
|||||||||||||||||||||||||
www.calamos.com
249
Notes to Financial Statements
The MRPS are not listed on any exchange or automated quotation system. The MRPS are considered debt of the issuer; therefore, the liquidation preference, which approximates fair value of the MRPS, is recorded as a liability in each Fund's Statement of Assets and Liabilities net of deferred offering costs. The MRPS are categorized as Level 2 within the fair value hierarchy.
During the year ended October 31, 2023, all MRPS were rated `AA-' by Kroll Bond Rating Agency LLC ("KBRA"). If the ratings of the MRPS are downgraded, each Fund's dividend expense may increase, as described below.
Holders of MRPS are entitled to receive monthly cumulative cash dividends payable on the first business day of each month. The MRPS currently are rated "AA-" by KBRA. If on the first day of a monthly dividend period the MRPS of any class are rated lower than "A" by KBRA, the dividend rate for such period shall be increased by 0.5%, 2.0% or 4.0% according to an agreed upon schedule. The MRPS' dividend rate is also subject to increase during periods when a Fund has not made timely payments to MRPS holders and/or the MRPS do not have a current credit rating, subject to various terms and conditions. Dividends accrued and paid to the shareholders of MRPS are included in "Interest expense and amortization of offering costs on Mandatory Redeemable Preferred Shares" with each Fund's Statement of Operations.
With regard to the Series B and C MRPS, so long as any MRPS are outstanding, a Fund will not declare, pay or set apart for payment any dividend or other distribution (other than non-cash distributions) with respect to Fund shares ranking junior to or on parity with the MRPS, unless (1) the Fund has satisfied the MRPS Overcollateralization Test (as defined below) on at least one "valuation date" in the preceding 65 calendar days, (2) immediately after such transaction the Fund would satisfy the MRPS Asset Coverage Test (as defined below), (3) full cumulative dividends on the MRPS due on or prior to the date of the transaction have been declared and paid to the holders of MRPS and (4) the Fund has redeemed the full number of MRPS required to be redeemed by any provision for mandatory redemption or deposited sufficient monies with the Fund's paying agent for that purpose, subject to certain grace periods and exceptions.
MRPS Asset Coverage Test: Asset coverage with respect to all outstanding senior securities and preferred shares, including the MRPS, determined in accordance with Section 18(h) of the 1940 Act, on the basis of values calculated as of a time within 48 hours (not including Sundays or holidays) next preceding the time of determination, must be greater than or equal to 225%.
MRPS Overcollateralization Test: So long as Fitch or any other NSRSO, such as KBRA, is then rating any class of the outstanding MRPS pursuant to the request of the Fund, satisfaction of only those overcollateralization ratios applicable to closed-end fund issuers with the same rating(s) as the Fund's MRPS' then-current rating(s) issued by Fitch or such other NSRSO, such as KBRA, by application of the applicable rating agency guidelines.
In accordance with that certain Statement of Preferences governing the Series D, E and F MRPS, for so long as any MRPS are outstanding, a Fund will not declare, pay or set apart for payment any dividend or other distribution (other than a dividend or distribution paid in shares of, or options, warrants or rights to subscribe for or purchase, Common Shares or other shares of beneficial interest, if any, ranking junior to the MRPS as to dividends or upon liquidation (collectively "non-cash distributions") with respect to Common Shares or any other shares of the Series or Fund ranking junior to or on a parity with the MRPS as to dividends or upon liquidation, or call for redemption, redeem, purchase or otherwise acquire for consideration any Common Shares or any other such junior shares (except by conversion into or exchange for shares of the Fund ranking junior to the MRPS as to dividends and upon liquidation) or any such parity shares (except by conversion into or exchange for shares of the Fund ranking junior to or on a parity with the MRPS as to dividends and upon liquidation), unless (1) immediately after such transaction the Fund would satisfy the MRPS Asset Coverage Test, (2) full cumulative dividends on the MRPS due on or prior to the date of the transaction have been declared and paid to the Holders of MRPS, and (3) the Fund has redeemed the full number of MRPS required to be redeemed by any provision for mandatory redemption contained in Section 3(a) or deposited sufficient monies with the Paying Agent for that purpose (without regard to the provisions of the Special Proviso); provided that the Fund may make any distributions reasonably necessary for the Fund to continue to qualify as a "regulated investment company" under Subchapter M of the Internal Revenue Code and to avoid excise tax under Section 4982 of the Internal Revenue Code ("Tax Required Payments"). For the avoidance of doubt, any such Tax Required Payments would only be paid to holders of Common Shares after full cumulative dividends due on or prior to the date of the applicable distribution and any mandatory redemptions occurring on or prior to the date of the applicable distribution have been paid to the holders of MRPS.
CALAMOS CLOSED-END FAMILY OF FUNDS ANNUAL REPORT
250
Notes to Financial Statements
Except as otherwise required pursuant to the Funds' governing documents or applicable law, the holders of the MRPS have one vote per share and vote together with the holders of common stock of the Funds as a single class except on matters affecting only the holders of MRPS or the holders of common stock. Pursuant to the 1940 Act, holders of the MRPS have the right to elect at least two trustees of a Fund, voting separately as a class. Except during any time when a Fund has failed to make a dividend or redemption payment in respect of MRPS outstanding, the holders of MRPS have agreed to vote in accordance with the recommendation of the Board on any matter submitted to them for their vote or to the vote of shareholders of a Fund generally.
Note 9 – Common Shares
Each Fund has unlimited common shares of beneficial interest authorized at October 31, 2023. Transactions in common shares for each fund at October 31, 2023 were as follows:
|
CONVERTIBLE OPPORTUNITIES AND INCOME FUND |
YEAR ENDED OCTOBER 31, 2023 |
YEAR ENDED OCTOBER 31, 2022 |
|||||||||
|
Beginning shares |
74,081,296 |
71,749,316 |
|||||||||
|
Shares sold |
— |
1,870,556 |
|||||||||
|
Shares issued through reinvestment of distributions |
736,871 |
461,424 |
|||||||||
|
Ending shares |
74,818,167 |
74,081,296 |
|||||||||
|
CONVERTIBLE AND HIGH INCOME FUND |
YEAR ENDED OCTOBER 31, 2023 |
YEAR ENDED OCTOBER 31, 2022 |
|||||||||
|
Beginning shares |
75,661,499 |
73,692,072 |
|||||||||
|
Shares sold |
— |
1,531,959 |
|||||||||
|
Shares issued through reinvestment of distributions |
717,771 |
437,468 |
|||||||||
|
Ending shares |
76,379,270 |
75,661,499 |
|||||||||
|
STRATEGIC TOTAL RETURN FUND |
YEAR ENDED OCTOBER 31, 2023 |
YEAR ENDED OCTOBER 31, 2022 |
|||||||||
|
Beginning shares |
158,887,622 |
157,310,716 |
|||||||||
|
Shares sold |
702,814 |
1,115,111 |
|||||||||
|
Shares issued through reinvestment of distributions |
744,690 |
461,795 |
|||||||||
|
Ending shares |
160,335,126 |
158,887,622 |
|||||||||
|
DYNAMIC CONVERTIBLE AND INCOME FUND |
YEAR ENDED OCTOBER 31, 2023 |
YEAR ENDED OCTOBER 31, 2022 |
|||||||||
|
Beginning shares |
26,080,838 |
24,848,140 |
|||||||||
|
Shares sold |
206,742 |
1,077,219 |
|||||||||
|
Shares issued through reinvestment of distributions |
356,738 |
155,479 |
|||||||||
|
Ending shares |
26,644,318 |
26,080,838 |
|||||||||
|
GLOBAL DYNAMIC INCOME FUND |
YEAR ENDED OCTOBER 31, 2023 |
YEAR ENDED OCTOBER 31, 2022 |
|||||||||
|
Beginning shares |
63,864,387 |
60,033,831 |
|||||||||
|
Shares sold |
— |
3,564,049 |
|||||||||
|
Shares issued through reinvestment of distributions |
— |
266,507 |
|||||||||
|
Ending shares |
63,864,387 |
63,864,387 |
|||||||||
|
GLOBAL TOTAL RETURN FUND |
YEAR ENDED OCTOBER 31, 2023 |
YEAR ENDED OCTOBER 31, 2022 |
|||||||||
|
Beginning shares |
9,823,566 |
9,396,571 |
|||||||||
|
Shares sold |
— |
403,010 |
|||||||||
|
Shares issued through reinvestment of distributions |
2,272 |
23,985 |
|||||||||
|
Ending shares |
9,825,838 |
9,823,566 |
|||||||||
www.calamos.com
251
Notes to Financial Statements
|
LONG/SHORT EQUITY & DYNAMIC INCOME TRUST |
YEAR ENDED OCTOBER 31, 2023 |
YEAR ENDED OCTOBER 31, 2022 |
|||||||||
|
Beginning shares |
19,632,194 |
19,632,194 |
|||||||||
|
Shares sold |
— |
— |
|||||||||
|
Shares issued through reinvestment of distributions |
— |
— |
|||||||||
|
Ending shares |
19,632,194 |
19,632,194 |
|||||||||
Notice is hereby given in accordance with Section 23(c) of the 1940 Act that each Fund may from time to time purchase its shares of common stock in the open market.
The Funds also may offer and sell common shares from time to time at an offering price equal to or in excess of the net asset value per share of each Fund's common shares at the time such common shares are initially sold. For the year ended October 31, 2023, the Funds sold shares according to the table below:
|
FUND |
AMOUNT IN EXCESS OF NET ASSET VALUE |
AVERAGE SALES PRICE |
|||||||||
|
Convertible Opportunities and Income Fund |
$ |
— |
$ |
— |
|||||||
|
Convertible and High Income Fund |
— |
— |
|||||||||
|
Strategic Total Return Fund |
0.0007 |
14.1107 |
|||||||||
|
Dynamic Convertible and Income Fund |
0.0078 |
21.4314 |
|||||||||
|
Global Dynamic Income Fund |
— |
— |
|||||||||
|
Global Total Return Fund |
— |
— |
|||||||||
|
Long/Short Equity & Dynamic Income Trust |
— |
— |
|||||||||
CALAMOS CLOSED-END FAMILY OF FUNDS ANNUAL REPORT
252
This page intentionally left blank.
Calamos Convertible Opportunities and Income Fund Financial Highlights
Selected data for a share outstanding throughout each year were as follows:
|
YEAR ENDED OCTOBER 31, |
|||||||||||
|
2023 |
2022 |
||||||||||
|
PER SHARE OPERATING PERFORMANCE |
|||||||||||
|
Net asset value, beginning of year |
$ |
10.26 |
$ |
15.49 |
|||||||
|
Income from investment operations: |
|||||||||||
|
Net investment income (loss)* |
(0.10 |
) |
0.01 |
||||||||
|
Net realized and unrealized gain (loss) |
(0.03 |
) |
(4.11 |
) |
|||||||
|
Total from investment operations |
(0.13 |
) |
(4.10 |
) |
|||||||
|
Less distributions to common shareholders from: |
|||||||||||
|
Net investment income |
(0.15 |
) |
(0.27 |
) |
|||||||
|
Net realized gains |
(0.99 |
) |
(0.87 |
) |
|||||||
|
Return of capital |
— |
— |
|||||||||
|
Total distributions |
(1.14 |
) |
(1.14 |
) |
|||||||
|
Premiums from shares sold in at the market offerings |
— |
0.01 |
|||||||||
|
Net asset value, end of year |
$ |
8.99 |
$ |
10.26 |
|||||||
|
Market value, end of year |
$ |
9.99 |
$ |
10.78 |
|||||||
|
TOTAL RETURN APPLICABLE TO COMMON SHAREHOLDERS |
|||||||||||
|
Total investment return based on:(b) |
|||||||||||
|
Net asset value |
(2.27 |
%) |
(27.32 |
%) |
|||||||
|
Market value |
3.27 |
% |
(25.10 |
%) |
|||||||
|
RATIOS TO AVERAGE NET ASSETS APPLICABLE TO COMMON SHAREHOLDERS |
|||||||||||
|
Net expenses(c) |
4.40 |
% |
2.44 |
% |
|||||||
|
Net investment income (loss) |
(1.03 |
%) |
0.08 |
% |
|||||||
|
SUPPLEMENTAL DATA |
|||||||||||
|
Net assets applicable to common shareholders, end of year (000) |
$ |
672,782 |
$ |
759,716 |
|||||||
|
Portfolio turnover rate |
39 |
% |
39 |
% |
|||||||
|
Average commission rate paid |
$ |
0.0188 |
$ |
0.0215 |
|||||||
|
Mandatory Redeemable Preferred Shares, at redemption value ($25 per share liquidation preference) (000's omitted) |
$ |
133,000 |
$ |
133,000 |
|||||||
|
Notes Payable (000's omitted) |
$ |
314,400 |
$ |
339,400 |
|||||||
|
Asset coverage per $1,000 of loan outstanding(d) |
$ |
3,563 |
$ |
3,630 |
|||||||
|
Asset coverage per $25 liquidation value per share of Mandatory Redeemable Preferred Shares(e) |
$ |
211 |
$ |
232 |
|||||||
* Net investment income (loss) calculated based on average shares method.
(a) Amount is less than $0.005 per common share.
(b) Total investment return is calculated assuming a purchase of common stock on the opening of the first day and a sale on the closing of the last day of the period reported. Dividends and distributions are assumed, for purposes of this calculation, to be reinvested at prices obtained under the Fund's dividend reinvestment plan. Total return is not annualized for periods less than one year. Brokerage commissions are not reflected. NAV per share is determined by dividing the value of the Fund's portfolio securities, cash and other assets, less all liabilities, by the total number of common shares outstanding. The common share market price is the price the market is willing to pay for shares of the Fund at a given time. Common share market price is influenced by a range of factors, including supply and demand and market conditions.
(c) Ratio of net expenses, excluding interest expense on Notes Payable and interest expense and amortization of offering costs on Mandatory Redeemable Preferred Shares, to average net assets was 1.38%, 1.34%, 1.23%, 1.26%, 1.29%, 1.28%, 1.24%, 1.24%, 1.50%, and 1.18%, respectively.
(d) Calculated by subtracting the Fund's total liabilities (not including Notes payable and Mandatory Redeemable Preferred Shares) from the Fund's total assets and dividing this by the amount of Notes payable outstanding, and by multiplying the result by 1,000.
(e) Calculated by subtracting the Fund's total liabilities (not including Notes payable and Mandatory Redeemable Preferred Shares) from the Fund's total assets and dividing this by the amount of Mandatory Redeemable Preferred Shares outstanding, and by multiplying the result by 25.
CALAMOS CLOSED-END FAMILY OF FUNDS ANNUAL REPORT
254
Calamos Convertible Opportunities and Income Fund Financial Highlights
|
YEAR ENDED OCTOBER 31, |
|||||||||||||||||||||||||||||||||||
|
2021 |
2020 |
2019 |
2018 |
2017 |
2016 |
2015 |
2014 |
||||||||||||||||||||||||||||
|
PER SHARE OPERATING PERFORMANCE |
|||||||||||||||||||||||||||||||||||
|
Net asset value, beginning of year |
$ |
12.54 |
$ |
10.64 |
$ |
10.46 |
$ |
11.35 |
$ |
10.73 |
$ |
11.68 |
$ |
13.45 |
$ |
13.20 |
|||||||||||||||||||
|
Income from investment operations: |
|||||||||||||||||||||||||||||||||||
|
Net investment income (loss)* |
(0.26 |
) |
0.49 |
0.50 |
0.57 |
0.57 |
0.60 |
0.62 |
0.72 |
||||||||||||||||||||||||||
|
Net realized and unrealized gain (loss) |
4.31 |
2.37 |
0.64 |
(0.33 |
) |
1.19 |
(0.41 |
) |
(1.25 |
) |
0.67 |
||||||||||||||||||||||||
|
Total from investment operations |
4.05 |
2.86 |
1.14 |
0.24 |
1.76 |
0.19 |
(0.63 |
) |
1.39 |
||||||||||||||||||||||||||
|
Less distributions to common shareholders from: |
|||||||||||||||||||||||||||||||||||
|
Net investment income |
(0.31 |
) |
(0.44 |
) |
(0.48 |
) |
(1.13 |
) |
(0.67 |
) |
(0.59 |
) |
(0.81 |
) |
(0.95 |
) |
|||||||||||||||||||
|
Net realized gains |
(0.79 |
) |
(0.52 |
) |
(0.31 |
) |
— |
(0.08 |
) |
— |
(0.02 |
) |
(0.19 |
) |
|||||||||||||||||||||
|
Return of capital |
— |
— |
(0.17 |
) |
— |
(0.39 |
) |
(0.55 |
) |
(0.31 |
) |
— |
|||||||||||||||||||||||
|
Total distributions |
(1.10 |
) |
(0.96 |
) |
(0.96 |
) |
(1.13 |
) |
(1.14 |
) |
(1.14 |
) |
(1.14 |
) |
(1.14 |
) |
|||||||||||||||||||
|
Premiums from shares sold in at the market offerings |
— |
(a) |
— |
— |
0.00 |
(a) |
0.00 |
(a) |
— |
0.00 |
(a) |
0.00 |
(a) |
||||||||||||||||||||||
|
Net asset value, end of year |
$ |
15.49 |
$ |
12.54 |
$ |
10.64 |
$ |
10.46 |
$ |
11.35 |
$ |
10.73 |
$ |
11.68 |
$ |
13.45 |
|||||||||||||||||||
|
Market value, end of year |
$ |
15.81 |
$ |
10.89 |
$ |
10.67 |
$ |
9.91 |
$ |
11.59 |
$ |
9.89 |
$ |
10.41 |
$ |
13.69 |
|||||||||||||||||||
|
TOTAL RETURN APPLICABLE TO COMMON SHAREHOLDERS |
|||||||||||||||||||||||||||||||||||
|
Total investment return based on:(b) |
|||||||||||||||||||||||||||||||||||
|
Net asset value |
33.21 |
% |
29.38 |
% |
11.75 |
% |
1.81 |
% |
17.48 |
% |
3.19 |
% |
(4.69 |
%) |
10.90 |
% |
|||||||||||||||||||
|
Market value |
56.56 |
% |
12.04 |
% |
18.29 |
% |
(5.54 |
%) |
30.15 |
% |
6.72 |
% |
(16.54 |
%) |
13.83 |
% |
|||||||||||||||||||
|
RATIOS TO AVERAGE NET ASSETS APPLICABLE TO COMMON SHAREHOLDERS |
|||||||||||||||||||||||||||||||||||
|
Net expenses(c) |
1.83 |
% |
2.20 |
% |
2.88 |
% |
2.52 |
% |
1.88 |
% |
1.74 |
% |
1.84 |
% |
1.47 |
% |
|||||||||||||||||||
|
Net investment income (loss) |
(1.76 |
%) |
4.36 |
% |
4.77 |
% |
5.11 |
% |
5.17 |
% |
5.61 |
% |
4.90 |
% |
5.38 |
% |
|||||||||||||||||||
|
SUPPLEMENTAL DATA |
|||||||||||||||||||||||||||||||||||
|
Net assets applicable to common shareholders, end of year (000) |
$ |
1,111,526 |
$ |
889,577 |
$ |
754,310 |
$ |
741,306 |
$ |
797,968 |
$ |
750,773 |
$ |
817,491 |
$ |
931,703 |
|||||||||||||||||||
|
Portfolio turnover rate |
46 |
% |
76 |
% |
51 |
% |
58 |
% |
90 |
% |
34 |
% |
36 |
% |
40 |
% |
|||||||||||||||||||
|
Average commission rate paid |
$ |
0.0215 |
$ |
0.0213 |
$ |
0.0188 |
$ |
0.0270 |
$ |
0.0282 |
$ |
0.0220 |
$ |
0.0303 |
$ |
0.0294 |
|||||||||||||||||||
|
Mandatory Redeemable Preferred Shares, at redemption value ($25 per share liquidation preference) (000's omitted) |
$ |
133,000 |
$ |
100,000 |
$ |
100,000 |
$ |
100,000 |
$ |
100,000 |
$ |
— |
$ |
— |
$ |
— |
|||||||||||||||||||
|
Notes Payable (000's omitted) |
$ |
399,400 |
$ |
288,400 |
$ |
277,400 |
$ |
288,000 |
$ |
275,000 |
$ |
306,000 |
$ |
353,000 |
$ |
360,000 |
|||||||||||||||||||
|
Asset coverage per $1,000 of loan outstanding(d) |
$ |
4,116 |
$ |
4,431 |
$ |
4,080 |
$ |
3,921 |
$ |
4,265 |
$ |
3,454 |
$ |
3,316 |
$ |
3,588 |
|||||||||||||||||||
|
Asset coverage per $25 liquidation value per share of Mandatory Redeemable Preferred Shares(e) |
$ |
309 |
$ |
319 |
$ |
283 |
$ |
282 |
$ |
293 |
$ |
— |
$ |
— |
$ |
— |
|||||||||||||||||||
www.calamos.com
255
Calamos Convertible and High Income Fund Financial Highlights
Selected data for a share outstanding throughout each year were as follows:
|
YEAR ENDED OCTOBER 31, |
|||||||||||
|
2023 |
2022 |
||||||||||
|
PER SHARE OPERATING PERFORMANCE |
|||||||||||
|
Net asset value, beginning of year |
$ |
10.81 |
$ |
16.38 |
|||||||
|
Income from investment operations: |
|||||||||||
|
Net investment income (loss)* |
(0.12 |
) |
0.00 |
||||||||
|
Net realized and unrealized gain (loss) |
0.00 |
(4.38 |
) |
||||||||
|
Total from investment operations |
(0.12 |
) |
(4.38 |
) |
|||||||
|
Less distributions to common shareholders from: |
|||||||||||
|
Net investment income |
(0.15 |
) |
(0.27 |
) |
|||||||
|
Net realized gains |
(1.05 |
) |
(0.93 |
) |
|||||||
|
Return of capital |
— |
— |
|||||||||
|
Total distributions |
(1.20 |
) |
(1.20 |
) |
|||||||
|
Capital charge resulting from issuance of common and preferred shares and related offering costs |
— |
— |
|||||||||
|
Premiums from shares sold in at the market offerings |
— |
0.01 |
|||||||||
|
Net asset value, end of year |
$ |
9.49 |
$ |
10.81 |
|||||||
|
Market value, end of year |
$ |
10.87 |
$ |
11.00 |
|||||||
|
TOTAL RETURN APPLICABLE TO COMMON SHAREHOLDERS |
|||||||||||
|
Total investment return based on:(b) |
|||||||||||
|
Net asset value |
(1.99 |
%) |
(27.50 |
%) |
|||||||
|
Market value |
10.32 |
% |
(27.25 |
%) |
|||||||
|
RATIOS TO AVERAGE NET ASSETS APPLICABLE TO COMMON SHAREHOLDERS |
|||||||||||
|
Net expenses(c) |
4.41 |
% |
2.45 |
% |
|||||||
|
Net investment income (loss) |
(1.11 |
%) |
(0.02 |
%) |
|||||||
|
SUPPLEMENTAL DATA |
|||||||||||
|
Net assets applicable to common shareholders, end of year (000) |
$ |
724,821 |
$ |
817,828 |
|||||||
|
Portfolio turnover rate |
40 |
% |
36 |
% |
|||||||
|
Average commission rate paid |
$ |
0.0188 |
$ |
0.0205 |
|||||||
|
Mandatory Redeemable Preferred Shares, at redemption value ($25 per share liquidation preference) (000's omitted) |
$ |
145,000 |
$ |
145,000 |
|||||||
|
Notes Payable (000's omitted) |
$ |
340,400 |
$ |
365,400 |
|||||||
|
Asset coverage per $1,000 of loan outstanding(d) |
$ |
3,556 |
$ |
3,635 |
|||||||
|
Asset coverage per $25 liquidation value per share of Mandatory Redeemable Preferred Shares(e) |
$ |
209 |
$ |
229 |
|||||||
* Net investment income (loss) calculated based on average shares method.
(a) Amount is less than $0.005 per common share.
(b) Total investment return is calculated assuming a purchase of common stock on the opening of the first day and a sale on the closing of the last day of the period reported. Dividends and distributions are assumed, for purposes of this calculation, to be reinvested at prices obtained under the Fund's dividend reinvestment plan. Total return is not annualized for periods less than one year. Brokerage commissions are not reflected. NAV per share is determined by dividing the value of the Fund's portfolio securities, cash and other assets, less all liabilities, by the total number of common shares outstanding. The common share market price is the price the market is willing to pay for shares of the Fund at a given time. Common share market price is influenced by a range of factors, including supply and demand and market conditions.
(c) Ratio of net expenses, excluding interest expense on Notes Payable and interest expense and amortization of offering costs on Mandatory Redeemable Preferred Shares, to average net assets was 1.38%, 1.34%, 1.23%, 1.27%, 1.30%, 1.28%, 1.24%, 1.25%, 1.21%, and 1.18%, respectively.
(d) Calculated by subtracting the Fund's total liabilities (not including Notes payable and Mandatory Redeemable Preferred Shares) from the Fund's total assets and dividing this by the amount of Notes payable outstanding, and by multiplying the result by 1,000.
(e) Calculated by subtracting the Fund's total liabilities (not including Notes payable and Mandatory Redeemable Preferred Shares) from the Fund's total assets and dividing this by the amount of Mandatory Redeemable Preferred Shares outstanding, and by multiplying the result by 25.
CALAMOS CLOSED-END FAMILY OF FUNDS ANNUAL REPORT
256
Calamos Convertible and High Income Fund Financial Highlights
|
YEAR ENDED OCTOBER 31, |
|||||||||||||||||||||||||||||||||||
|
2021 |
2020 |
2019 |
2018 |
2017 |
2016 |
2015 |
2014 |
||||||||||||||||||||||||||||
|
PER SHARE OPERATING PERFORMANCE |
|||||||||||||||||||||||||||||||||||
|
Net asset value, beginning of year |
$ |
13.22 |
$ |
11.18 |
$ |
11.02 |
$ |
11.96 |
$ |
11.33 |
$ |
12.39 |
$ |
14.24 |
$ |
13.89 |
|||||||||||||||||||
|
Income from investment operations: |
|||||||||||||||||||||||||||||||||||
|
Net investment income (loss)* |
(0.30 |
) |
0.53 |
0.54 |
0.60 |
0.61 |
0.65 |
0.73 |
0.79 |
||||||||||||||||||||||||||
|
Net realized and unrealized gain (loss) |
4.61 |
2.53 |
0.64 |
(0.35 |
) |
1.22 |
(0.51 |
) |
(1.38 |
) |
0.69 |
||||||||||||||||||||||||
|
Total from investment operations |
4.31 |
3.06 |
1.18 |
0.25 |
1.83 |
0.14 |
(0.65 |
) |
1.48 |
||||||||||||||||||||||||||
|
Less distributions to common shareholders from: |
|||||||||||||||||||||||||||||||||||
|
Net investment income |
(0.29 |
) |
(0.46 |
) |
(0.51 |
) |
(1.19 |
) |
(0.70 |
) |
(0.69 |
) |
(0.98 |
) |
(1.13 |
) |
|||||||||||||||||||
|
Net realized gains |
(0.86 |
) |
(0.56 |
) |
(0.34 |
) |
— |
— |
— |
— |
— |
||||||||||||||||||||||||
|
Return of capital |
— |
— |
(0.17 |
) |
— |
(0.50 |
) |
(0.51 |
) |
(0.22 |
) |
— |
|||||||||||||||||||||||
|
Total distributions |
(1.15 |
) |
(1.02 |
) |
(1.02 |
) |
(1.19 |
) |
(1.20 |
) |
(1.20 |
) |
(1.20 |
) |
(1.13 |
) |
|||||||||||||||||||
|
Capital charge resulting from issuance of common and preferred shares and related offering costs |
— |
— |
— |
0.00 |
(a) |
— |
0.00 |
(a) |
— |
— |
|||||||||||||||||||||||||
|
Premiums from shares sold in at the market offerings |
0.00 |
(a) |
— |
— |
0.00 |
(a) |
— |
— |
— |
— |
|||||||||||||||||||||||||
|
Net asset value, end of year |
$ |
16.38 |
$ |
13.22 |
$ |
11.18 |
$ |
11.02 |
$ |
11.96 |
$ |
11.33 |
$ |
12.39 |
$ |
14.24 |
|||||||||||||||||||
|
Market value, end of year |
$ |
16.61 |
$ |
11.50 |
$ |
11.10 |
$ |
10.86 |
$ |
11.96 |
$ |
10.47 |
$ |
11.61 |
$ |
14.47 |
|||||||||||||||||||
|
TOTAL RETURN APPLICABLE TO COMMON SHAREHOLDERS |
|||||||||||||||||||||||||||||||||||
|
Total investment return based on:(b) |
|||||||||||||||||||||||||||||||||||
|
Net asset value |
33.56 |
% |
29.87 |
% |
11.46 |
% |
1.75 |
% |
17.28 |
% |
2.55 |
% |
(4.65 |
%) |
11.22 |
% |
|||||||||||||||||||
|
Market value |
55.69 |
% |
13.79 |
% |
12.29 |
% |
0.28 |
% |
26.91 |
% |
1.13 |
% |
(12.08 |
%) |
22.16 |
% |
|||||||||||||||||||
|
RATIOS TO AVERAGE NET ASSETS APPLICABLE TO COMMON SHAREHOLDERS |
|||||||||||||||||||||||||||||||||||
|
Net expenses(c) |
1.84 |
% |
2.22 |
% |
2.91 |
% |
2.54 |
% |
1.89 |
% |
1.78 |
% |
1.57 |
% |
1.47 |
% |
|||||||||||||||||||
|
Net investment income (loss) |
(1.88 |
%) |
4.45 |
% |
4.85 |
% |
5.13 |
% |
5.25 |
% |
5.73 |
% |
5.38 |
% |
5.57 |
% |
|||||||||||||||||||
|
SUPPLEMENTAL DATA |
|||||||||||||||||||||||||||||||||||
|
Net assets applicable to common shareholders, end of year (000) |
$ |
1,207,158 |
$ |
968,077 |
$ |
818,412 |
$ |
806,342 |
$ |
868,817 |
$ |
822,183 |
$ |
898,695 |
$ |
1,029,902 |
|||||||||||||||||||
|
Portfolio turnover rate |
44 |
% |
76 |
% |
47 |
% |
58 |
% |
89 |
% |
34 |
% |
37 |
% |
35 |
% |
|||||||||||||||||||
|
Average commission rate paid |
$ |
0.0216 |
$ |
0.0225 |
$ |
0.0187 |
$ |
0.0260 |
$ |
0.0282 |
$ |
0.0221 |
$ |
0.0286 |
$ |
0.0292 |
|||||||||||||||||||
|
Mandatory Redeemable Preferred Shares, at redemption value ($25 per share liquidation preference) (000's omitted) |
$ |
145,000 |
$ |
110,000 |
$ |
110,000 |
$ |
110,000 |
$ |
110,000 |
$ |
— |
$ |
— |
$ |
— |
|||||||||||||||||||
|
Notes Payable (000's omitted) |
$ |
435,400 |
$ |
318,400 |
$ |
303,900 |
$ |
315,500 |
$ |
302,500 |
$ |
337,000 |
$ |
398,000 |
$ |
400,000 |
|||||||||||||||||||
|
Asset coverage per $1,000 of loan outstanding(d) |
$ |
4,106 |
$ |
4,386 |
$ |
4,055 |
$ |
3,904 |
$ |
4,236 |
$ |
3,440 |
$ |
3,258 |
$ |
3,575 |
|||||||||||||||||||
|
Asset coverage per $25 liquidation value per share of Mandatory Redeemable Preferred Shares(e) |
$ |
308 |
$ |
317 |
$ |
280 |
$ |
280 |
$ |
291 |
$ |
— |
$ |
— |
$ |
— |
|||||||||||||||||||
www.calamos.com
257
Calamos Strategic Total Return Fund Financial Highlights
Selected data for a share outstanding throughout each year were as follows:
|
YEAR ENDED OCTOBER 31, |
|||||||||||
|
2023 |
2022 |
||||||||||
|
PER SHARE OPERATING PERFORMANCE |
|||||||||||
|
Net asset value, beginning of year |
$ |
13.57 |
$ |
18.62 |
|||||||
|
Income from investment operations: |
|||||||||||
|
Net investment income (loss)* |
(0.09 |
) |
0.05 |
||||||||
|
Net realized and unrealized gain (loss) |
1.16 |
(3.87 |
) |
||||||||
|
Total from investment operations |
1.07 |
(3.82 |
) |
||||||||
|
Less distributions to common shareholders from: |
|||||||||||
|
Net investment income |
(0.63 |
) |
(0.26 |
) |
|||||||
|
Net realized gains |
(0.60 |
) |
(0.97 |
) |
|||||||
|
Return of capital |
— |
— |
|||||||||
|
Total distributions |
(1.23 |
) |
(1.23 |
) |
|||||||
|
Premiums from shares sold in at the market offerings(a) |
0.0007 |
0.0010 |
|||||||||
|
Net asset value, end of year |
$ |
13.41 |
$ |
13.57 |
|||||||
|
Market value, end of year |
$ |
12.83 |
$ |
13.76 |
|||||||
|
TOTAL RETURN APPLICABLE TO COMMON SHAREHOLDERS |
|||||||||||
|
Total investment return based on:(b) |
|||||||||||
|
Net asset value |
7.89 |
% |
(21.11 |
%) |
|||||||
|
Market value |
1.80 |
% |
(21.52 |
%) |
|||||||
|
RATIOS TO AVERAGE NET ASSETS APPLICABLE TO COMMON SHAREHOLDERS |
|||||||||||
|
Net expenses(c) |
4.09 |
% |
2.50 |
% |
|||||||
|
Net investment income (loss) |
(0.62 |
%) |
0.31 |
% |
|||||||
|
SUPPLEMENTAL DATA |
|||||||||||
|
Net assets applicable to common shareholders, end of year (000) |
$ |
2,150,003 |
$ |
2,156,658 |
|||||||
|
Portfolio turnover rate |
29 |
% |
24 |
% |
|||||||
|
Average commission rate paid |
$ |
0.0194 |
$ |
0.0189 |
|||||||
|
Mandatory Redeemable Preferred Shares, at redemption value ($25 per share liquidation preference) (000's omitted) |
$ |
323,500 |
$ |
323,500 |
|||||||
|
Notes Payable (000's omitted) |
$ |
800,500 |
$ |
800,500 |
|||||||
|
Asset coverage per $1,000 of loan outstanding(d) |
$ |
4,090 |
$ |
4,098 |
|||||||
|
Asset coverage per $25 liquidation value per share of Mandatory Redeemable Preferred Shares(e) |
$ |
253 |
$ |
254 |
|||||||
* Net investment income (loss) calculated based on average shares method.
(a) Amount is less than $0.005 per common share.
(b) Total investment return is calculated assuming a purchase of common stock on the opening of the first day and a sale on the closing of the last day of the period reported. Dividends and distributions are assumed, for purposes of this calculation, to be reinvested at prices obtained under the Fund's dividend reinvestment plan. Total return is not annualized for periods less than one year. Brokerage commissions are not reflected. NAV per share is determined by dividing the value of the Fund's portfolio securities, cash and other assets, less all liabilities, by the total number of common shares outstanding. The common share market price is the price the market is willing to pay for shares of the Fund at a given time. Common share market price is influenced by a range of factors, including supply and demand and market conditions.
(c) Ratio of net expenses, excluding interest expense on Notes Payable and interest expense and amortization of offering costs on Mandatory Redeemable Preferred Shares, to average net assets was 1.57%, 1.53%, 1.44%, 1.54%, 1.55%, 1.53%, 1.47%, 1.49%, 1.47% and 1.44%, respectively.
(d) Calculated by subtracting the Fund's total liabilities (not including Notes payable and Mandatory Redeemable Preferred Shares) from the Fund's total assets and dividing this by the amount of Notes payable outstanding, and by multiplying the result by 1,000.
(e) Calculated by subtracting the Fund's total liabilities (not including Notes payable and Mandatory Redeemable Preferred Shares) from the Fund's total assets and dividing this by the amount of Mandatory Redeemable Preferred Shares outstanding, and by multiplying the result by 25.
CALAMOS CLOSED-END FAMILY OF FUNDS ANNUAL REPORT
258
Calamos Strategic Total Return Fund Financial Highlights
|
YEAR ENDED OCTOBER 31, |
|||||||||||||||||||||||||||||||||||
|
2021 |
2020 |
2019 |
2018 |
2017 |
2016 |
2015 |
2014 |
||||||||||||||||||||||||||||
|
PER SHARE OPERATING PERFORMANCE |
|||||||||||||||||||||||||||||||||||
|
Net asset value, beginning of year |
$ |
13.30 |
$ |
12.93 |
$ |
12.25 |
$ |
12.76 |
$ |
11.13 |
$ |
11.67 |
$ |
12.51 |
$ |
11.86 |
|||||||||||||||||||
|
Income from investment operations: |
|||||||||||||||||||||||||||||||||||
|
Net investment income (loss)* |
0.10 |
0.21 |
0.18 |
0.16 |
0.26 |
0.30 |
0.38 |
0.42 |
|||||||||||||||||||||||||||
|
Net realized and unrealized gain (loss) |
6.42 |
1.24 |
1.49 |
0.32 |
2.36 |
0.15 |
(0.23 |
) |
1.16 |
||||||||||||||||||||||||||
|
Total from investment operations |
6.52 |
1.45 |
1.67 |
0.48 |
2.62 |
0.45 |
0.15 |
1.58 |
|||||||||||||||||||||||||||
|
Less distributions to common shareholders from: |
|||||||||||||||||||||||||||||||||||
|
Net investment income |
(0.29 |
) |
(0.54 |
) |
(0.16 |
) |
(0.48 |
) |
(0.85 |
) |
(0.46 |
) |
(0.66 |
) |
(0.55 |
) |
|||||||||||||||||||
|
Net realized gains |
(0.91 |
) |
(0.54 |
) |
(0.83 |
) |
(0.51 |
) |
(0.14 |
) |
(0.16 |
) |
— |
(0.16 |
) |
||||||||||||||||||||
|
Return of capital |
— |
— |
— |
— |
— |
(0.37 |
) |
(0.33 |
) |
(0.22 |
) |
||||||||||||||||||||||||
|
Total distributions |
(1.20 |
) |
(1.08 |
) |
(0.99 |
) |
(0.99 |
) |
(0.99 |
) |
(0.99 |
) |
(0.99 |
) |
(0.93 |
) |
|||||||||||||||||||
|
Premiums from shares sold in at the market offerings(a) |
0.0026 |
— |
— |
— |
— |
— |
— |
— |
|||||||||||||||||||||||||||
|
Net asset value, end of year |
$ |
18.62 |
$ |
13.30 |
$ |
12.93 |
$ |
12.25 |
$ |
12.76 |
$ |
11.13 |
$ |
11.67 |
$ |
12.51 |
|||||||||||||||||||
|
Market value, end of year |
$ |
18.98 |
$ |
12.80 |
$ |
13.02 |
$ |
11.75 |
$ |
12.33 |
$ |
9.95 |
$ |
10.20 |
$ |
11.82 |
|||||||||||||||||||
|
TOTAL RETURN APPLICABLE TO COMMON SHAREHOLDERS |
|||||||||||||||||||||||||||||||||||
|
Total investment return based on:(b) |
|||||||||||||||||||||||||||||||||||
|
Net asset value |
50.32 |
% |
12.33 |
% |
14.46 |
% |
3.81 |
% |
25.11 |
% |
5.48 |
% |
1.98 |
% |
14.46 |
% |
|||||||||||||||||||
|
Market value |
59.21 |
% |
7.36 |
% |
20.16 |
% |
3.05 |
% |
35.23 |
% |
7.89 |
% |
(5.66 |
%) |
21.46 |
% |
|||||||||||||||||||
|
RATIOS TO AVERAGE NET ASSETS APPLICABLE TO COMMON SHAREHOLDERS |
|||||||||||||||||||||||||||||||||||
|
Net expenses(c) |
2.03 |
% |
2.45 |
% |
3.05 |
% |
2.74 |
% |
2.09 |
% |
1.97 |
% |
1.81 |
% |
1.72 |
% |
|||||||||||||||||||
|
Net investment income (loss) |
0.60 |
% |
1.64 |
% |
1.42 |
% |
1.25 |
% |
2.17 |
% |
2.73 |
% |
3.11 |
% |
3.39 |
% |
|||||||||||||||||||
|
SUPPLEMENTAL DATA |
|||||||||||||||||||||||||||||||||||
|
Net assets applicable to common shareholders, end of year (000) |
$ |
2,928,463 |
$ |
2,061,019 |
$ |
2,000,709 |
$ |
1,893,000 |
$ |
1,971,910 |
$ |
1,719,456 |
$ |
1,803,026 |
$ |
1,932,218 |
|||||||||||||||||||
|
Portfolio turnover rate |
27 |
% |
36 |
% |
26 |
% |
27 |
% |
65 |
% |
31 |
% |
23 |
% |
20 |
% |
|||||||||||||||||||
|
Average commission rate paid |
$ |
0.0206 |
$ |
0.0212 |
$ |
0.0270 |
$ |
0.0217 |
$ |
0.0240 |
$ |
0.0307 |
$ |
0.0336 |
$ |
0.0210 |
|||||||||||||||||||
|
Mandatory Redeemable Preferred Shares, at redemption value ($25 per share liquidation preference) (000's omitted) |
$ |
304,000 |
$ |
242,000 |
$ |
242,000 |
$ |
242,000 |
$ |
242,000 |
$ |
— |
$ |
— |
$ |
— |
|||||||||||||||||||
|
Notes Payable (000's omitted) |
$ |
880,000 |
$ |
703,000 |
$ |
668,000 |
$ |
713,000 |
$ |
543,000 |
$ |
682,000 |
$ |
716,000 |
$ |
725,000 |
|||||||||||||||||||
|
Asset coverage per $1,000 of loan outstanding(d) |
$ |
4,673 |
$ |
4,276 |
$ |
4,357 |
$ |
3,995 |
$ |
5,077 |
$ |
3,521 |
$ |
3,518 |
$ |
3,665 |
|||||||||||||||||||
|
Asset coverage per $25 liquidation value per share of Mandatory Redeemable Preferred Shares(e) |
$ |
338 |
$ |
311 |
$ |
301 |
$ |
294 |
$ |
285 |
$ |
— |
$ |
— |
$ |
— |
|||||||||||||||||||
www.calamos.com
259
Calamos Dynamic Convertible and Income Fund Financial Highlights
Selected data for a share outstanding throughout each year were as follows:
|
YEAR ENDED OCTOBER 31, |
|||||||||||
|
2023 |
2022 |
||||||||||
|
PER SHARE OPERATING PERFORMANCE |
|||||||||||
|
Net asset value, beginning of year |
$ |
20.19 |
$ |
31.73 |
|||||||
|
Income from investment operations: |
|||||||||||
|
Net investment income (loss)* |
(0.63 |
) |
(0.43 |
) |
|||||||
|
Net realized and unrealized gain (loss) |
0.01 |
(8.81 |
) |
||||||||
|
Total from investment operations |
(0.62 |
) |
(9.24 |
) |
|||||||
|
Less distributions to common shareholders from: |
|||||||||||
|
Net investment income |
(0.03 |
) |
(0.24 |
) |
|||||||
|
Net realized gains |
(2.31 |
) |
(2.10 |
) |
|||||||
|
Return of capital |
— |
— |
|||||||||
|
Total distributions |
(2.34 |
) |
(2.34 |
) |
|||||||
|
Capital charge resulting from issuance of common and preferred shares and related offering costs |
— |
— |
|||||||||
|
Premiums from shares sold in at the market offerings |
0.0078 |
(b) |
0.0384 |
||||||||
|
Net asset value, end of year |
$ |
17.24 |
$ |
20.19 |
|||||||
|
Market value, end of year |
$ |
17.07 |
$ |
21.89 |
|||||||
|
TOTAL RETURN APPLICABLE TO COMMON SHAREHOLDERS |
|||||||||||
|
Total investment return based on:(c)(d) |
|||||||||||
|
Net asset value |
(4.26 |
%) |
(29.91 |
%) |
|||||||
|
Market value |
(12.56 |
%) |
(26.08 |
%) |
|||||||
|
RATIOS TO AVERAGE NET ASSETS APPLICABLE TO COMMON SHAREHOLDERS |
|||||||||||
|
Net expenses(d) |
4.63 |
% |
2.75 |
% |
|||||||
|
Net investment income (loss) |
(3.19 |
%) |
(1.73 |
%) |
|||||||
|
SUPPLEMENTAL DATA |
|||||||||||
|
Net assets applicable to common shareholders, end of year (000) |
$ |
459,365 |
$ |
526,613 |
|||||||
|
Portfolio turnover rate |
44 |
% |
42 |
% |
|||||||
|
Average commission rate paid |
$ |
0.0185 |
$ |
0.0563 |
|||||||
|
Mandatory Redeemable Preferred Shares, at redemption value ($25 per share liquidation preference) (000's omitted) |
$ |
92,000 |
$ |
92,000 |
|||||||
|
Notes Payable (000's omitted) |
$ |
210,000 |
$ |
230,000 |
|||||||
|
Asset coverage per $1,000 of loan outstanding(f) |
$ |
3,626 |
$ |
3,690 |
|||||||
|
Asset coverage per $25 liquidation value per share of Mandatory Redeemable Preferred Shares(g) |
$ |
207 |
$ |
231 |
|||||||
• Commencement of operations.
* Net investment income (loss) calculated based on average shares method.
(a) Net of sales load of $1.125 on initial shares issued and beginning net asset value of $23.875.
(b) Amount is less than $0.01
(c) Total investment return is calculated assuming a purchase of common stock on the opening of the first day and a sale on the closing of the last day of the period reported. Dividends and distributions are assumed, for purposes of this calculation, to be reinvested at prices obtained under the Fund's dividend reinvestment plan. Total return is not annualized for periods less than one year. Brokerage commissions are not reflected. NAV per share is determined by dividing the value of the Fund's portfolio securities, cash and other assets, less all liabilities, by the total number of common shares outstanding. The common share market price is the price the market is willing to pay for shares of the Fund at a given time. Common share market price is influenced by a range of factors, including supply and demand and market conditions.
(d) Ratio of net expenses, excluding interest expense on Notes Payable and interest expense and amortization of offering costs on Mandatory Redeemable Preferred Shares, to average net assets was 1.70%, 1.65%, 1.51%, 1.56%, 1.61%, 1.57%, 1.51%, 1.52% and 1.56%, respectively.
(e) Annualized.
(f) Calculated by subtracting the Fund's total liabilities (not including Notes payable and Mandatory Redeemable Preferred Shares) from the Fund's total assets and dividing this by the amount of Notes payable outstanding, and by multiplying the result by 1,000.
(g) Calculated by subtracting the Fund's total liabilities (not including Notes payable and Mandatory Redeemable Preferred Shares) from the Fund's total assets and dividing this by the amount of Mandatory Redeemable Preferred Shares outstanding, and by multiplying the result by 25.
CALAMOS CLOSED-END FAMILY OF FUNDS ANNUAL REPORT
260
Calamos Dynamic Convertible and Income Fund Financial Highlights
|
YEAR ENDED OCTOBER 31, |
MARCH 27, 2015• THROUGH OCTOBER 31, |
||||||||||||||||||||||||||||||
|
2021 |
2020 |
2019 |
2018 |
2017 |
2016 |
2015 |
|||||||||||||||||||||||||
|
PER SHARE OPERATING PERFORMANCE |
|||||||||||||||||||||||||||||||
|
Net asset value, beginning of year |
$ |
25.00 |
$ |
19.93 |
$ |
19.55 |
$ |
21.03 |
$ |
19.56 |
$ |
21.63 |
$ |
23.88 |
(a) |
||||||||||||||||
|
Income from investment operations: |
|||||||||||||||||||||||||||||||
|
Net investment income (loss)* |
(1.21 |
) |
0.70 |
0.73 |
0.85 |
0.86 |
0.89 |
0.48 |
|||||||||||||||||||||||
|
Net realized and unrealized gain (loss) |
10.20 |
6.37 |
1.65 |
(0.33 |
) |
2.61 |
(0.96 |
) |
(1.84 |
) |
|||||||||||||||||||||
|
Total from investment operations |
8.99 |
7.07 |
2.38 |
0.52 |
3.47 |
(0.07 |
) |
(1.36 |
) |
||||||||||||||||||||||
|
Less distributions to common shareholders from: |
|||||||||||||||||||||||||||||||
|
Net investment income |
(0.25 |
) |
(0.70 |
) |
(0.50 |
) |
(2.00 |
) |
(0.91 |
) |
(0.99 |
) |
(0.84 |
) |
|||||||||||||||||
|
Net realized gains |
(2.01 |
) |
(1.30 |
) |
(0.80 |
) |
— |
— |
(0.00 |
)(b) |
— |
||||||||||||||||||||
|
Return of capital |
— |
— |
(0.70 |
) |
— |
(1.09 |
) |
(1.01 |
) |
— |
|||||||||||||||||||||
|
Total distributions |
(2.26 |
) |
(2.00 |
) |
(2.00 |
) |
(2.00 |
) |
(2.00 |
) |
(2.00 |
) |
(0.84 |
) |
|||||||||||||||||
|
Capital charge resulting from issuance of common and preferred shares and related offering costs |
— |
— |
— |
— |
— |
— |
(0.05 |
) |
|||||||||||||||||||||||
|
Premiums from shares sold in at the market offerings |
0.0078 |
— |
— |
— |
— |
— |
— |
||||||||||||||||||||||||
|
Net asset value, end of year |
$ |
31.73 |
$ |
25.00 |
$ |
19.93 |
$ |
19.55 |
$ |
21.03 |
$ |
19.56 |
$ |
21.63 |
|||||||||||||||||
|
Market value, end of year |
$ |
32.62 |
$ |
22.35 |
$ |
20.65 |
$ |
18.94 |
$ |
20.49 |
$ |
17.83 |
$ |
19.28 |
|||||||||||||||||
|
TOTAL RETURN APPLICABLE TO COMMON SHAREHOLDERS |
|||||||||||||||||||||||||||||||
|
Total investment return based on:(c)(d) |
|||||||||||||||||||||||||||||||
|
Net asset value |
36.76 |
% |
38.59 |
% |
13.05 |
% |
2.40 |
% |
19.19 |
% |
1.03 |
% |
(5.78 |
%) |
|||||||||||||||||
|
Market value |
57.27 |
% |
19.58 |
% |
20.85 |
% |
1.82 |
% |
27.40 |
% |
3.32 |
% |
(19.79 |
%) |
|||||||||||||||||
|
RATIOS TO AVERAGE NET ASSETS APPLICABLE TO COMMON SHAREHOLDERS |
|||||||||||||||||||||||||||||||
|
Net expenses(d) |
2.10 |
% |
2.50 |
% |
3.22 |
% |
2.82 |
% |
2.17 |
% |
2.02 |
% |
1.91 |
%(e) |
|||||||||||||||||
|
Net investment income (loss) |
(3.97 |
%) |
3.22 |
% |
3.70 |
% |
4.06 |
% |
4.26 |
% |
4.48 |
% |
3.65 |
%(e) |
|||||||||||||||||
|
SUPPLEMENTAL DATA |
|||||||||||||||||||||||||||||||
|
Net assets applicable to common shareholders, end of year (000) |
$ |
788,554 |
$ |
612,024 |
$ |
487,709 |
$ |
477,256 |
$ |
512,737 |
$ |
477,070 |
$ |
527,472 |
|||||||||||||||||
|
Portfolio turnover rate |
48 |
% |
85 |
% |
50 |
% |
67 |
% |
78 |
% |
40 |
% |
23 |
% |
|||||||||||||||||
|
Average commission rate paid |
$ |
0.0217 |
$ |
0.0243 |
$ |
0.0182 |
$ |
0.0249 |
$ |
0.0212 |
$ |
0.0233 |
$ |
0.0198 |
|||||||||||||||||
|
Mandatory Redeemable Preferred Shares, at redemption value ($25 per share liquidation preference) (000's omitted) |
$ |
92,000 |
$ |
64,000 |
$ |
64,000 |
$ |
64,000 |
$ |
64,000 |
$ |
— |
$ |
— |
|||||||||||||||||
|
Notes Payable (000's omitted) |
$ |
270,000 |
$ |
204,600 |
$ |
180,600 |
$ |
187,500 |
$ |
169,000 |
$ |
195,000 |
$ |
220,000 |
|||||||||||||||||
|
Asset coverage per $1,000 of loan outstanding(f) |
$ |
4,261 |
$ |
4,304 |
$ |
4,055 |
$ |
3,887 |
$ |
4,413 |
$ |
3,447 |
$ |
3,398 |
|||||||||||||||||
|
Asset coverage per $25 liquidation value per share of Mandatory Redeemable Preferred Shares(g) |
$ |
313 |
$ |
344 |
$ |
286 |
$ |
285 |
$ |
291 |
$ |
— |
$ |
— |
|||||||||||||||||
www.calamos.com
261
Calamos Global Dynamic Income Fund Financial Highlights
Selected data for a share outstanding throughout each year were as follows:
|
YEAR ENDED OCTOBER 31, |
|||||||||||
|
2023 |
2022 |
||||||||||
|
PER SHARE OPERATING PERFORMANCE |
|||||||||||
|
Net asset value, beginning of year |
$ |
|
$ |
|
|||||||
|
Income from investment operations: |
|||||||||||
|
Net investment income (loss)* |
(0.08 |
) |
(0.07 |
) |
|||||||
|
Net realized and unrealized gain (loss) |
0.55 |
(3.15 |
) |
||||||||
|
Total from investment operations |
0.47 |
(3.22 |
) |
||||||||
|
Less distributions to common shareholders from: |
|||||||||||
|
Net investment income |
(0.10 |
) |
(0.01 |
) |
|||||||
|
Net realized gains |
(0.20 |
) |
(0.09 |
) |
|||||||
|
Return of capital |
(0.30 |
) |
(0.72 |
) |
|||||||
|
Total distributions |
( |
) |
( |
) |
|||||||
|
Premiums from shares sold in at the market offerings |
— |
0.0191 |
|||||||||
|
Net asset value, end of year |
$ |
|
$ |
|
|||||||
|
Market value, end of year |
$ |
|
$ |
|
|||||||
|
TOTAL RETURN APPLICABLE TO COMMON SHAREHOLDERS |
|||||||||||
|
Total investment return based on:(a) |
|||||||||||
|
Net asset value |
8.29 |
% |
(32.89 |
%) |
|||||||
|
Market value |
2.40 |
% |
(39.64 |
%) |
|||||||
|
RATIOS TO AVERAGE NET ASSETS APPLICABLE TO COMMON SHAREHOLDERS |
|||||||||||
|
Net expenses(b) |
3.68 |
% |
2.73 |
% |
|||||||
|
Net investment income (loss) |
(1.19 |
%) |
(0.85 |
%) |
|||||||
|
SUPPLEMENTAL DATA |
|||||||||||
|
Net assets applicable to common shareholders, end of year (000) |
$ |
382,865 |
$ |
391,101 |
|||||||
|
Portfolio turnover rate |
114 |
% |
134 |
% |
|||||||
|
Average commission rate paid |
$ |
0.0036 |
$ |
0.0117 |
|||||||
|
Mandatory Redeemable Preferred Shares, at redemption value ($25 per share liquidation preference) (000's omitted) |
$ |
70,000 |
$ |
70,000 |
|||||||
|
Notes Payable (000's omitted) |
$ |
130,550 |
$ |
109,550 |
|||||||
|
Asset coverage per $1,000 of loan outstanding(c) |
$ |
4,469 |
$ |
5,209 |
|||||||
|
Asset coverage per $25 liquidation value per share of Mandatory Redeemable Preferred Shares(d) |
$ |
208 |
$ |
204 |
|||||||
* Net investment income (loss) calculated based on average shares method.
(a) Total investment return is calculated assuming a purchase of common stock on the opening of the first day and a sale on the closing of the last day of the period reported. Dividends and distributions are assumed, for purposes of this calculation, to be reinvested at prices obtained under the Fund's dividend reinvestment plan. Total return is not annualized for periods less than one year. Brokerage commissions are not reflected. NAV per share is determined by dividing the value of the Fund's portfolio securities, cash and other assets, less all liabilities, by the total number of common shares outstanding. The common share market price is the price the market is willing to pay for shares of the Fund at a given time. Common share market price is influenced by a range of factors, including supply and demand and market conditions.
(b) Ratio of net expenses, excluding interest expense on Notes Payable and interest expense and amortization of offering costs on Mandatory Redeemable Preferred Shares, to average net assets was 1.58%, 1.66%, 1.55%, 1.61%, 1.65%, 1.60%, 1.53%, 1.54%, 1.53% and 1.48%, respectively.
(c) Calculated by subtracting the Fund's total liabilities (not including Notes payable and Mandatory Redeemable Preferred Shares) from the Fund's total assets and dividing this by the amount of Notes payable outstanding, and by multiplying the result by 1,000.
(d) Calculated by subtracting the Fund's total liabilities (not including Notes payable and Mandatory Redeemable Preferred Shares) from the Fund's total assets and dividing this by the amount of Mandatory Redeemable Preferred Shares outstanding, and by multiplying the result by 25.
CALAMOS CLOSED-END FAMILY OF FUNDS ANNUAL REPORT
262
Calamos Global Dynamic Income Fund Financial Highlights
|
YEAR ENDED OCTOBER 31, |
|||||||||||||||||||||||||||||||||||
|
2021 |
2020 |
2019 |
2018 |
2017 |
2016 |
2015 |
2014 |
||||||||||||||||||||||||||||
|
PER SHARE OPERATING PERFORMANCE |
|||||||||||||||||||||||||||||||||||
|
Net asset value, beginning of year |
$ |
|
$ |
|
$ |
|
$ |
|
$ |
|
$ |
|
$ |
|
$ |
|
|||||||||||||||||||
|
Income from investment operations: |
|||||||||||||||||||||||||||||||||||
|
Net investment income (loss)* |
0.03 |
0.15 |
0.17 |
0.18 |
0.22 |
0.28 |
0.28 |
0.40 |
|||||||||||||||||||||||||||
|
Net realized and unrealized gain (loss) |
2.92 |
0.82 |
0.59 |
(0.57 |
) |
1.67 |
(0.20 |
) |
(0.38 |
) |
0.21 |
||||||||||||||||||||||||
|
Total from investment operations |
2.95 |
0.97 |
0.76 |
(0.39 |
) |
1.89 |
0.08 |
(0.10 |
) |
0.61 |
|||||||||||||||||||||||||
|
Less distributions to common shareholders from: |
|||||||||||||||||||||||||||||||||||
|
Net investment income |
(0.15 |
) |
(0.32 |
) |
(0.28 |
) |
(0.84 |
) |
(0.76 |
) |
(0.46 |
) |
(0.72 |
) |
(0.70 |
) |
|||||||||||||||||||
|
Net realized gains |
(0.69 |
) |
(0.52 |
) |
(0.14 |
) |
— |
(0.08 |
) |
— |
— |
— |
|||||||||||||||||||||||
|
Return of capital |
— |
— |
(0.42 |
) |
— |
— |
(0.38 |
) |
(0.12 |
) |
(0.10 |
) |
|||||||||||||||||||||||
|
Total distributions |
( |
) |
( |
) |
( |
) |
( |
) |
( |
) |
( |
) |
( |
) |
( |
) |
|||||||||||||||||||
|
Premiums from shares sold in at the market offerings |
0.0026 |
— |
— |
— |
— |
— |
— |
— |
|||||||||||||||||||||||||||
|
Net asset value, end of year |
$ |
|
$ |
|
$ |
|
$ |
|
$ |
|
$ |
|
$ |
|
$ |
|
|||||||||||||||||||
|
Market value, end of year |
$ |
|
$ |
|
$ |
|
$ |
|
$ |
|
$ |
|
$ |
|
$ |
|
|||||||||||||||||||
|
TOTAL RETURN APPLICABLE TO COMMON SHAREHOLDERS |
|||||||||||||||||||||||||||||||||||
|
Total investment return based on:(a) |
|||||||||||||||||||||||||||||||||||
|
Net asset value |
37.46 |
% |
14.00 |
% |
10.29 |
% |
(4.85 |
%) |
25.23 |
% |
2.98 |
% |
(0.15 |
%) |
7.02 |
% |
|||||||||||||||||||
|
Market value |
45.01 |
% |
7.60 |
% |
19.34 |
% |
(8.71 |
%) |
41.48 |
% |
4.95 |
% |
(5.92 |
%) |
10.93 |
% |
|||||||||||||||||||
|
RATIOS TO AVERAGE NET ASSETS APPLICABLE TO COMMON SHAREHOLDERS |
|||||||||||||||||||||||||||||||||||
|
Net expenses(b) |
2.27 |
% |
2.70 |
% |
3.41 |
% |
2.97 |
% |
2.23 |
% |
2.06 |
% |
1.89 |
% |
1.79 |
% |
|||||||||||||||||||
|
Net investment income (loss) |
0.26 |
% |
1.91 |
% |
2.12 |
% |
1.95 |
% |
2.58 |
% |
3.42 |
% |
2.97 |
% |
3.92 |
% |
|||||||||||||||||||
|
SUPPLEMENTAL DATA |
|||||||||||||||||||||||||||||||||||
|
Net assets applicable to common shareholders, end of year (000) |
$ |
609,038 |
$ |
476,533 |
$ |
468,186 |
$ |
471,953 |
$ |
543,275 |
$ |
481,513 |
$ |
526,508 |
$ |
581,624 |
|||||||||||||||||||
|
Portfolio turnover rate |
117 |
% |
128 |
% |
78 |
% |
93 |
% |
99 |
% |
29 |
% |
45 |
% |
32 |
% |
|||||||||||||||||||
|
Average commission rate paid |
$ |
0.0173 |
$ |
0.0210 |
$ |
0.0279 |
$ |
0.0199 |
$ |
0.0295 |
$ |
0.0289 |
$ |
0.0244 |
$ |
0.0269 |
|||||||||||||||||||
|
Mandatory Redeemable Preferred Shares, at redemption value ($25 per share liquidation preference) (000's omitted) |
$ |
70,000 |
$ |
65,000 |
$ |
65,000 |
$ |
65,000 |
$ |
65,000 |
$ |
— |
$ |
— |
$ |
— |
|||||||||||||||||||
|
Notes Payable (000's omitted) |
$ |
206,500 |
$ |
153,250 |
$ |
174,500 |
$ |
204,000 |
$ |
160,000 |
$ |
196,000 |
$ |
224,400 |
$ |
230,000 |
|||||||||||||||||||
|
Asset coverage per $1,000 of loan outstanding(c) |
$ |
4,288 |
$ |
4,534 |
$ |
4,056 |
$ |
3,632 |
$ |
4,802 |
$ |
3,457 |
$ |
3,346 |
$ |
3,529 |
|||||||||||||||||||
|
Asset coverage per $25 liquidation value per share of Mandatory Redeemable Preferred Shares(d) |
$ |
316 |
$ |
267 |
$ |
272 |
$ |
285 |
$ |
295 |
$ |
— |
$ |
— |
$ |
— |
|||||||||||||||||||
www.calamos.com
263
Calamos Global Total Return Fund Financial Highlights
Selected data for a share outstanding throughout each year were as follows:
|
YEAR ENDED OCTOBER 31, |
|||||||||||
|
2023 |
2022 |
||||||||||
|
PER SHARE OPERATING PERFORMANCE |
|||||||||||
|
Net asset value, beginning of year |
$ |
9.59 |
$ |
15.82 |
|||||||
|
Income from investment operations: |
|||||||||||
|
Net investment income (loss)* |
(0.17 |
) |
(0.12 |
) |
|||||||
|
Net realized and unrealized gain (loss) |
0.66 |
(4.96 |
) |
||||||||
|
Total from investment operations |
0.49 |
(5.08 |
) |
||||||||
|
Less distributions to common shareholders from: |
|||||||||||
|
Net investment income |
(0.17 |
) |
(0.08 |
) |
|||||||
|
Net realized gains |
(0.50 |
) |
(0.26 |
) |
|||||||
|
Return of capital |
(0.29 |
) |
(0.84 |
) |
|||||||
|
Total distributions |
(0.96 |
) |
(1.18 |
) |
|||||||
|
Premiums from shares sold in at the market offerings |
— |
0.0279 |
|||||||||
|
Net asset value, end of year |
$ |
9.12 |
$ |
9.59 |
|||||||
|
Market value, end of year |
$ |
8.15 |
$ |
9.12 |
|||||||
|
TOTAL RETURN APPLICABLE TO COMMON SHAREHOLDERS |
|||||||||||
|
Total investment return based on:(a) |
|||||||||||
|
Net asset value |
5.26 |
% |
(33.22 |
%) |
|||||||
|
Market value |
(0.98 |
%) |
(36.65 |
%) |
|||||||
|
RATIOS TO AVERAGE NET ASSETS APPLICABLE TO COMMON SHAREHOLDERS |
|||||||||||
|
Net expenses(b) |
3.86 |
% |
2.86 |
% |
|||||||
|
Net investment income (loss) |
(1.73 |
%) |
(0.93 |
%) |
|||||||
|
SUPPLEMENTAL DATA |
|||||||||||
|
Net assets applicable to common shareholders, end of year (000) |
$ |
89,579 |
$ |
94,186 |
|||||||
|
Portfolio turnover rate |
120 |
% |
118 |
% |
|||||||
|
Average commission rate paid |
$ |
0.0038 |
$ |
0.0123 |
|||||||
|
Mandatory Redeemable Preferred Shares, at redemption value ($25 per share liquidation preference) (000's omitted) |
$ |
17,000 |
$ |
17,000 |
|||||||
|
Notes Payable (000's omitted) |
$ |
30,100 |
$ |
26,000 |
|||||||
|
Asset coverage per $1,000 of loan outstanding(c) |
$ |
4,541 |
$ |
5,276 |
|||||||
|
Asset coverage per $25 liquidation value per share of Mandatory Redeemable Preferred Shares(d) |
$ |
201 |
$ |
202 |
|||||||
* Net investment income (loss) calculated based on average shares method.
(a) Total investment return is calculated assuming a purchase of common stock on the opening of the first day and a sale on the closing of the last day of the period reported. Dividends and distributions are assumed, for purposes of this calculation, to be reinvested at prices obtained under the Fund's dividend reinvestment plan. Total return is not annualized for periods less than one year. Brokerage commissions are not reflected. NAV per share is determined by dividing the value of the Fund's portfolio securities, cash and other assets, less all liabilities, by the total number of common shares outstanding. The common share market price is the price the market is willing to pay for shares of the Fund at a given time. Common share market price is influenced by a range of factors, including supply and demand and market conditions.
(b) Ratio of net expenses, excluding interest expense on Notes payable and interest expense and amortization of offering costs on Mandatory Redeemable Preferred Shares, to average net assets was 1.82%, 1.83%, 1.69%, 1.75%, 1.75% , 1.69%,1.62%, 1.62%, 1.63%, and 1.59%, respectively.
(c) Calculated by subtracting the Fund's total liabilities (not including Notes payable and Mandatory Redeemable Preferred Shares) from the Fund's total assets and dividing this by the amount of Notes payable outstanding, and by multiplying the result by 1,000.
(d) Calculated by subtracting the Fund's total liabilities (not including Notes payable and Mandatory Redeemable Preferred Shares) from the Fund's total assets and dividing this by the amount of Mandatory Redeemable Preferred Shares outstanding, and by multiplying the result by 25.
CALAMOS CLOSED-END FAMILY OF FUNDS ANNUAL REPORT
264
Calamos Global Total Return Fund Financial Highlights
|
YEAR ENDED OCTOBER 31, |
|||||||||||||||||||||||||||||||||||
|
2021 |
2020 |
2019 |
2018 |
2017 |
2016 |
2015 |
2014 |
||||||||||||||||||||||||||||
|
PER SHARE OPERATING PERFORMANCE |
|||||||||||||||||||||||||||||||||||
|
Net asset value, beginning of year |
$ |
11.99 |
$ |
11.60 |
$ |
11.65 |
$ |
13.40 |
$ |
12.19 |
$ |
13.29 |
$ |
14.21 |
$ |
14.56 |
|||||||||||||||||||
|
Income from investment operations: |
|||||||||||||||||||||||||||||||||||
|
Net investment income (loss)* |
(0.06 |
) |
0.17 |
0.17 |
0.18 |
0.23 |
0.21 |
0.22 |
0.26 |
||||||||||||||||||||||||||
|
Net realized and unrealized gain (loss) |
5.05 |
1.40 |
0.98 |
(0.73 |
) |
2.18 |
(0.11 |
) |
0.06 |
0.59 |
|||||||||||||||||||||||||
|
Total from investment operations |
4.99 |
1.57 |
1.15 |
(0.55 |
) |
2.41 |
0.10 |
0.28 |
0.85 |
||||||||||||||||||||||||||
|
Less distributions to common shareholders from: |
|||||||||||||||||||||||||||||||||||
|
Net investment income |
(0.24 |
) |
(0.31 |
) |
(0.41 |
) |
(0.97 |
) |
(1.09 |
) |
(0.99 |
) |
(0.85 |
) |
(0.85 |
) |
|||||||||||||||||||
|
Net realized gains |
(0.96 |
) |
(0.89 |
) |
(0.24 |
) |
(0.23 |
) |
(0.11 |
) |
(0.20 |
) |
— |
(0.19 |
) |
||||||||||||||||||||
|
Return of capital |
— |
— |
(0.55 |
) |
— |
— |
(0.01 |
) |
(0.35 |
) |
(0.16 |
) |
|||||||||||||||||||||||
|
Total distributions |
(1.20 |
) |
(1.20 |
) |
(1.20 |
) |
(1.20 |
) |
(1.20 |
) |
(1.20 |
) |
(1.20 |
) |
(1.20 |
) |
|||||||||||||||||||
|
Premiums from shares sold in at the market offerings |
0.0362 |
0.0176 |
— |
0.0236 |
— |
— |
— |
— |
|||||||||||||||||||||||||||
|
Net asset value, end of year |
$ |
15.82 |
$ |
11.99 |
$ |
11.60 |
$ |
11.65 |
$ |
13.40 |
$ |
12.19 |
$ |
13.29 |
$ |
14.21 |
|||||||||||||||||||
|
Market value, end of year |
$ |
15.86 |
$ |
11.63 |
$ |
12.12 |
$ |
11.50 |
$ |
13.98 |
$ |
10.96 |
$ |
11.96 |
$ |
13.57 |
|||||||||||||||||||
|
TOTAL RETURN APPLICABLE TO COMMON SHAREHOLDERS |
|||||||||||||||||||||||||||||||||||
|
Total investment return based on:(a) |
|||||||||||||||||||||||||||||||||||
|
Net asset value |
42.86 |
% |
15.08 |
% |
10.35 |
% |
(5.06 |
%) |
21.44 |
% |
2.22 |
% |
2.39 |
% |
6.19 |
% |
|||||||||||||||||||
|
Market value |
47.65 |
% |
6.83 |
% |
16.80 |
% |
(10.17 |
%) |
40.91 |
% |
2.13 |
% |
(3.51 |
%) |
5.54 |
% |
|||||||||||||||||||
|
RATIOS TO AVERAGE NET ASSETS APPLICABLE TO COMMON SHAREHOLDERS |
|||||||||||||||||||||||||||||||||||
|
Net expenses(b) |
2.30 |
% |
2.75 |
% |
3.42 |
% |
2.98 |
% |
2.34 |
% |
2.11 |
% |
2.00 |
% |
1.92 |
% |
|||||||||||||||||||
|
Net investment income (loss) |
(0.37 |
%) |
1.50 |
% |
1.48 |
% |
1.39 |
% |
1.87 |
% |
1.73 |
% |
1.56 |
% |
1.78 |
% |
|||||||||||||||||||
|
SUPPLEMENTAL DATA |
|||||||||||||||||||||||||||||||||||
|
Net assets applicable to common shareholders, end of year (000) |
$ |
148,697 |
$ |
106,882 |
$ |
100,526 |
$ |
100,722 |
$ |
113,638 |
$ |
103,158 |
$ |
112,474 |
$ |
120,277 |
|||||||||||||||||||
|
Portfolio turnover rate |
120 |
% |
153 |
% |
81 |
% |
119 |
% |
134 |
% |
114 |
% |
76 |
% |
95 |
% |
|||||||||||||||||||
|
Average commission rate paid |
$ |
0.0179 |
$ |
0.0214 |
$ |
0.0317 |
$ |
0.0203 |
$ |
0.0272 |
$ |
0.0279 |
$ |
0.0279 |
$ |
0.0253 |
|||||||||||||||||||
|
Mandatory Redeemable Preferred Shares, at redemption value ($25 per share liquidation preference) (000's omitted) |
$ |
17,000 |
$ |
12,000 |
$ |
12,000 |
$ |
12,000 |
$ |
12,000 |
$ |
— |
$ |
— |
$ |
— |
|||||||||||||||||||
|
Notes Payable (000's omitted) |
$ |
50,500 |
$ |
37,000 |
$ |
38,300 |
$ |
43,000 |
$ |
36,000 |
$ |
42,000 |
$ |
44,000 |
$ |
49,000 |
|||||||||||||||||||
|
Asset coverage per $1,000 of loan outstanding(c) |
$ |
4,281 |
$ |
4,213 |
$ |
3,938 |
$ |
3,621 |
$ |
4,490 |
$ |
3,456 |
$ |
3,556 |
$ |
3,455 |
|||||||||||||||||||
|
Asset coverage per $25 liquidation value per share of Mandatory Redeemable Preferred Shares(d) |
$ |
318 |
$ |
325 |
$ |
314 |
$ |
324 |
$ |
337 |
$ |
— |
$ |
— |
$ |
— |
|||||||||||||||||||
www.calamos.com
265
Calamos Long/Short Equity and Dynamic Income Trust Financial Highlights
Selected data for a share outstanding throughout each period were as follows:
|
YEAR ENDED OCTOBER 31, |
NOVEMBER 29, 2019• THROUGH OCTOBER 31, |
||||||||||||||||||
|
2023 |
2022 |
2021 |
2020 |
||||||||||||||||
|
PER SHARE OPERATING PERFORMANCE |
|||||||||||||||||||
|
Net asset value, beginning of period |
$ |
17.66 |
$ |
21.52 |
$ |
17.44 |
$ |
20.00 |
|||||||||||
|
Income from investment operations: |
|||||||||||||||||||
|
Net investment income (loss)* |
0.24 |
0.18 |
0.22 |
0.31 |
|||||||||||||||
|
Net realized and unrealized gain (loss) |
0.32 |
(2.36 |
) |
5.42 |
(1.84 |
) |
|||||||||||||
|
Total from investment operations |
0.56 |
(2.18 |
) |
5.64 |
(1.53 |
) |
|||||||||||||
|
Less distributions to common shareholders from: |
|||||||||||||||||||
|
Net investment income |
(0.34 |
) |
(0.40 |
) |
(0.55 |
) |
(0.40 |
) |
|||||||||||
|
Net realized gains |
(1.34 |
) |
(1.28 |
) |
(1.01 |
) |
(0.63 |
) |
|||||||||||
|
Total distributions |
(1.68 |
) |
(1.68 |
) |
(1.56 |
) |
(1.03 |
) |
|||||||||||
|
Premiums from shares sold in at the market offerings |
— |
— |
— |
— |
|||||||||||||||
|
Net asset value, end of period |
$ |
16.54 |
$ |
17.66 |
$ |
21.52 |
$ |
17.44 |
|||||||||||
|
Market value, end of period |
$ |
13.73 |
$ |
15.75 |
$ |
20.68 |
$ |
14.13 |
|||||||||||
|
TOTAL RETURN APPLICABLE TO COMMON SHAREHOLDERS |
|||||||||||||||||||
|
Total investment return based on:(a) |
|||||||||||||||||||
|
Net asset value(b) |
4.32 |
% |
(10.05 |
%) |
33.57 |
% |
(6.72 |
%) |
|||||||||||
|
Market value |
(2.85 |
%) |
(16.56 |
%) |
58.49 |
% |
(24.42 |
%) |
|||||||||||
|
RATIOS TO AVERAGE NET ASSETS APPLICABLE TO COMMON SHAREHOLDERS |
|||||||||||||||||||
|
Net expenses(c) |
4.52 |
% |
3.21 |
% |
2.45 |
% |
2.12 |
%(d) |
|||||||||||
|
Net investment income (loss) |
1.34 |
% |
0.89 |
% |
1.03 |
% |
1.82 |
%(d) |
|||||||||||
|
SUPPLEMENTAL DATA |
|||||||||||||||||||
|
Net assets applicable to common shareholders, end of year (000) |
$ |
324,777 |
$ |
346,747 |
$ |
422,483 |
$ |
342,473 |
|||||||||||
|
Portfolio turnover rate |
210 |
% |
222 |
% |
213 |
% |
155 |
% |
|||||||||||
|
Average commission rate paid |
$ |
0.0136 |
$ |
0.0126 |
$ |
0.0109 |
$ |
0.0113 |
|||||||||||
|
Notes Payable (000's omitted) |
$ |
120,000 |
$ |
120,000 |
$ |
120,000 |
$ |
69,200 |
|||||||||||
|
Asset coverage per $1,000 of loan outstanding(e) |
$ |
3,706 |
$ |
3,890 |
$ |
4,521 |
$ |
5,949 |
|||||||||||
• Commencement of operations.
* Net investment income (loss) calculated based on average shares method.
(a) Total investment return is calculated assuming a purchase of common stock on the opening of the first day and a sale on the closing of the last day of the period reported. Dividends and distributions are assumed, for purposes of this calculation, to be reinvested at prices obtained under the Fund's dividend reinvestment plan. Total return is not annualized for periods less than one year. Brokerage commissions are not reflected. NAV per share is determined by dividing the value of the Fund's portfolio securities, cash and other assets, less all liabilities, by the total number of common shares outstanding. The common share market price is the price the market is willing to pay for shares of the Fund at a given time. Common share market price is influenced by a range of factors, including supply and demand and market conditions.
(b) Includes payment by affiliates, which impacted the total return. Excluding such payment the total return would be 3.97% (see Note 2).
(c) Ratio of net expenses, excluding interest expense on Notes Payable and dividend expense on short positions, to average net assets was 1.98%, 1.92%, 1.75% and 1.62%, respectively.
(d) Annualized.
(e) Calculated by subtracting the Fund's total liabilities (not including Notes payable) from the Fund's total assets and dividing this by the amount of Notes payable outstanding, and by multiplying the result by 1,000.
CALAMOS CLOSED-END FAMILY OF FUNDS ANNUAL REPORT
266
Report of Independent Registered Public Accounting Firm
To the Shareholders and the Board of Trustees of Calamos Convertible Opportunities and Income Fund, Calamos Convertible and High Income Fund, Calamos Strategic Total Return Fund, Calamos Dynamic Convertible and Income Fund, Calamos Global Dynamic Income Fund, Calamos Global Total Return Fund, and Calamos Long/Short Equity & Dynamic Income Trust
Opinion on the Financial Statements and Financial Highlights
We have audited the accompanying statements of assets and liabilities of Calamos Convertible Opportunities and Income Fund, Calamos Convertible and High Income Fund, Calamos Strategic Total Return Fund, Calamos Dynamic Convertible and Income Fund, Calamos Global Dynamic Income Fund, Calamos Global Total Return Fund, and Calamos Long/Short Equity & Dynamic Income Trust (the "Funds"), including the schedules of investments, as of October 31, 2023, the related statements of operations and cash flows for the year then ended, the statements of changes in net assets for each of the two years in the period then ended, the financial highlights for the periods indicated in the table below, and the related notes. In our opinion, the financial statements and financial highlights present fairly, in all material respects, the financial position of the Funds as of October 31, 2023, and the results of their operations and their cash flows for the year then ended, the changes in their net assets for each of the two years in the period then ended, and the financial highlights for the periods indicated in the table below in conformity with accounting principles generally accepted in the United States of America.
| Fund | Financial Highlights | ||||||
Calamos Convertible Opportunities and Income Fund, Calamos Convertible and High Income Fund, Calamos Strategic Total Return Fund, Calamos Global Dynamic Income Fund, Calamos Global Total Return Fund | For each of the ten years in the year then ended | ||||||
Calamos Dynamic Convertible and Income Fund | For each of the eight years in the year then ended and for the period March 27, 2015 (commencement of operations) through October 31, 2015 | ||||||
Calamos Long/Short Equity & Dynamic Income Trust | For each of the three years in the year then ended and for the period from November 29, 2019 (commencement of operations) through October 31, 2020 | ||||||
Basis for Opinion
These financial statements and financial highlights are the responsibility of the Funds' management. Our responsibility is to express an opinion on the Funds' financial statements and financial highlights based on our audits. We are a public accounting firm registered with the Public Company Accounting Oversight Board (United States) (PCAOB) and are required to be independent with respect to the Funds in accordance with the U.S. federal securities laws and the applicable rules and regulations of the Securities and Exchange Commission and the PCAOB.
We conducted our audits in accordance with the standards of the PCAOB. Those standards require that we plan and perform the audit to obtain reasonable assurance about whether the financial statements and financial highlights are free of material misstatement, whether due to error or fraud. The Funds are not required to have, nor were we engaged to perform, an audit of their internal control over financial reporting. As part of our audits we are required to obtain an understanding of internal control over financial reporting but not for the purpose of expressing an opinion on the effectiveness of the Funds' internal control over financial reporting. Accordingly, we express no such opinion.
Our audits included performing procedures to assess the risks of material misstatement of the financial statements and financial highlights, whether due to error or fraud, and performing procedures that respond to those risks. Such procedures included examining, on a test basis, evidence regarding the amounts and disclosures in the financial statements and financial highlights. Our audits also included evaluating the accounting principles used and significant estimates made by management, as well as evaluating the overall presentation of the financial statements and financial highlights. Our procedures included confirmation of securities owned as of October 31, 2023, by correspondence with custodians or counterparties; when replies were not received, we performed other auditing procedures. We believe that our audits provide a reasonable basis for our opinion.
Chicago, Illinois
December 20, 2023
We have served as the auditor of one or more Calamos Advisors LLC investment companies since 2003.
www.calamos.com
267
Trustee Approval of Management Agreement (Unaudited)
The Boards of Trustees ("Board" or the "Trustees") of Calamos Convertible Opportunities and Income Fund (CHI), Calamos Convertible and High Income Fund (CHY), Calamos Strategic Total Return Fund (CSQ), Calamos Dynamic Convertible and Income Fund (CCD), Calamos Global Dynamic Income Fund (CHW), Calamos Global Total Return Fund (CGO), and Calamos Long/Short Equity & Dynamic Income Trust (CPZ) (each a "Fund" and together, the "Funds") oversees the management of the Funds and, as required by law, determines annually whether to continue each Fund's management agreement with Calamos Advisors LLC ("Adviser") pursuant to which the Adviser serves as the investment manager and administrator for each Fund. The "Independent Trustees," who comprise more than 80% of the Board, have never been affiliated with the Adviser.
In connection with their most recent consideration regarding the continuation of the management agreements, the Trustees received and reviewed a substantial amount of information provided by the Adviser in response to detailed requests of the Independent Trustees and their independent legal counsel. In the course of their consideration of each agreement, the Independent Trustees were advised by their counsel, and in addition to meeting with management of the Adviser, they met separately in executive session with their counsel.
At a meeting held on June 21, 2023, based on their evaluation of the information referred to above and other information provided in this and previous meetings, the Trustees determined that the overall arrangements between each Fund and the Adviser were fair in light of the nature, quality and extent of the services provided by the Adviser and its affiliates, the fees charged for those services and other matters that the Trustees considered relevant in the exercise of their business judgment. At that meeting, the Trustees, including all of the Independent Trustees, approved the continuation of the management agreement with respect to each Fund except Calamos Dynamic Convertible and Income Fund through July 31, 2024 and through September 30, 2024 with respect to Calamos Dynamic Convertible and Income Fund subject to possible earlier termination as provided in the agreement.
In connection with its consideration of the management agreements, the Board considered, among other things: (i) the nature, quality and extent of the Adviser's services, (ii) the investment performance of each Fund as well as performance information for comparable funds and other, comparable clients of the Adviser, (iii) the fees and other expenses paid by each Fund as well as expense information for comparable funds and for other, comparable clients of the Adviser, (iv) the profitability of the Adviser and its affiliates from their relationship with each Fund, (v) whether economies of scale may be realized as each Fund grows and whether potential economies may be shared, in some measure, with Fund investors and (vi) other benefits to the Adviser from its relationship with each Fund. In the Board's deliberations, no single factor was responsible for the Board's decision to approve continuation of the management agreements, and each Trustee may have afforded different weight to the various factors.
Nature, Quality and Extent of Services. The Board's consideration of the nature, quality and extent of the Adviser's services to the Funds took into account the knowledge gained from the Board's meetings with the Adviser throughout the years. In addition, the Board considered: the Adviser's long-term history of managing each Fund; the consistency of investment approach; the background and experience of the Adviser's investment personnel responsible for managing each Fund; and the Adviser's performance as administrator of the Funds, including, among other things, in the areas of brokerage selection, trade execution, compliance and shareholder communications. The Board also reviewed the Adviser's resources and key personnel involved in providing investment management services to the Funds. The Board noted the personal investments that the Adviser's key investment personnel have made in each Fund, which further aligns the interests of the Adviser and its personnel with those of each Fund's shareholders. In addition, the Board considered compliance reports about the Adviser from the Funds' Chief Compliance Officer.
The Board also considered the information provided by the Adviser regarding each Fund's performance and the steps the Adviser is taking to improve performance. In particular, the Board noted the additional personnel added to the Adviser's investment team, which includes portfolio managers, research analysts, research associates and risk management personnel. The Board also noted the Adviser's significant investment into its infrastructure and investment processes.
Investment Performance of the Funds. The Board considered each Fund's investment performance over various time periods, including how the Fund performed compared to the average performance of a group of comparable funds (the Fund's "Category") selected by an independent third-party service provider. The performance periods considered by the Board ended on March 31, 2023. Where available, the Board considered one-, three-, five- and ten-year performance. Further detail considered by the Board regarding the investment performance of each Fund is set forth below.
CALAMOS CLOSED-END FAMILY OF FUNDS ANNUAL REPORT
268
Trustee Approval of Management Agreement (Unaudited)
For Calamos Convertible Opportunities and Income Fund ("CHI"), the Board considered that CHI outperformed its Category average for the three-, five- and ten-year periods and underperformed for the year-to-date and one-year period.
For Calamos Convertible and High Income Fund ("CHY"), the Board considered that CHY outperformed its Category average for the three-, five- and ten-year periods and underperformed for the remaining periods.
For Calamos Strategic Total Return Fund ("CSQ"), the Board considered that CSQ outperformed its Category average for the year-to-date and three-, five- and ten-year periods and underperformed for the one-year period.
For Calamos Dynamic Convertible and Income Fund ("CCD"), the Board considered that CCD outperformed its Category average for the three- and five—year periods and underperformed for the remaining periods.
For Calamos Global Dynamic Income Fund ("CHW"), the Board considered that, while CHW underperformed its Category average for all periods, it ranked in the 1st quartile when compared to its Category for the year-to-date period and outperformed its benchmark for the year-to-date and three-year periods.
For Calamos Global Total Return Fund ("CGO"), the Board considered that CGO outperformed its Category average for the year-to-date and five-year periods and underperformed for the remaining periods. The Board also considered that CGO ranked in the 38th percentile of its Category for the three-year period and in the 33rd percentile of its Category for the ten-year period.
For Calamos Long/Short Equity & Dynamic Income Trust ("CPZ"), the Board considered that CPZ outperformed its Category average for the one-year period and underperformed its Category average for the year-to-date and three-year periods.
Costs of Services Provided and Profits Realized by the Adviser. Using information provided by an independent third-party service provider, the Board evaluated each Fund's actual management fee rate compared to the median management fee rate for other closed-end funds similar in size, character and investment strategy (the Fund's "Expense Group"), and the Fund's total expense ratio compared to the median total expense ratio of the Fund's Expense Group.
The Board also reviewed the Adviser's management fee rates for its institutional separate accounts, other advisory accounts and sub-advisory accounts with comparable investment strategies. The Board took into account that although, generally, the rates of fees paid by institutional clients or for sub-advisory services were lower than the rates of fees paid by each Fund, the differences reflected the Adviser's greater level of responsibilities and significantly broader scope of services regarding each Fund, the more extensive regulatory obligations and risks associated with managing each Fund, and other financial considerations with respect to creation and sponsorship of each Fund. The Board considered factors that led to more expenses for registered funds including but not limited to: (i) capital expenditures to establish a fund, (ii) length of time to reach critical mass, and the related expenses, (iii) higher servicing costs of intermediaries and shareholders, (iv) higher redemption rates of assets under management, (v) entrepreneurial risk assumed by the Adviser and (vi) greater exposure to "make whole" errors.
The Board also considered the Adviser's costs in serving as each Fund's investment adviser and manager, including but not limited to costs associated with technology, infrastructure and compliance necessary to manage each Fund. The Board reviewed the Adviser's methodology for allocating costs among the Adviser's lines of business. The Board also considered information regarding the structure of the Adviser's compensation program for portfolio managers, analysts and certain other employees, and the relationship of such compensation to the attraction and retention of quality personnel. Finally, the Board reviewed information on the profitability of the Adviser in serving as the Funds' investment manager and of the Adviser and its affiliates in all of their relationships with the Funds, as well as an explanation of the methodology utilized in allocating various expenses among the Funds and the Adviser's other business units. Data was provided to the Board with respect to profitability, both on a pre- and post-marketing cost basis. The Board reviewed the financial statements of the Adviser's parent company and discussed its corporate structure. Further detail considered by the Board regarding the management fee rate and total expense ratio of each Fund is set forth below.
For CHI, the Board considered that although CHI's management fee rate is higher than the median of the its Expense Group, its total expense ratio is equal to the median of its Expense Group. The Board reviewed CHI's expenses in light of its performance record.
For CHY, the Board considered that although CHY's management fee rate is higher than the median of its Expense Group, its total expense ratio is lower than the median of its Expense Group. The Board reviewed CHY's expenses in light of its performance record.
www.calamos.com
269
Trustee Approval of Management Agreement (Unaudited)
For CSQ, the Board considered that the CSQ's total expense ratio and management fee rate are higher than the respective Expense Group medians. The Board reviewed CSQ's expenses in light of its performance record.
For CCD, the Board considered that the CCD's total expense ratio and management fee rate are higher than the respective Expense Group medians. The Board reviewed CCD's expenses in light of its performance record.
For CHW, the Board considered that the CHW's total expense ratio and management fee rate are higher than the respective Expense Group medians. The Board noted that CHW's management fee rate was within one basis point of the Expense Group median. The Board also noted the small number of peer funds in its Category and the exclusion of funds that, like the CHW, use leverage.
For CGO, the Board considered that CGO's total expense ratio and management fee rate are higher than the respective Expense Group medians. The Board also noted the small number of peer funds in its Category and the exclusion of funds that, like CGO, use leverage.
For CPZ, the Board considered that CPZ's total expense ratio and management fee rate are higher than the respective Expense Group medians. The Board reviewed CPZ's expenses in light of its performance record.
Economies of Scale. The Board considered whether each Fund's management fee shares with shareholders potential economies of scale that may be achieved by the Adviser. The Board also considered the benefits accruing to shareholders from the Adviser's investments into its infrastructure and investment processes.
Other Benefits Derived from the Relationship with the Funds. The Board also considered other benefits that accrue to the Adviser and its affiliates from their relationship with the Funds. The Board concluded that while the Adviser may potentially benefit from its relationship with the Funds in ways other than the fees payable by the Funds, the Funds also may benefit from their relationship with the Adviser in ways other than the services to be provided by the Adviser and its affiliates pursuant to their agreement with the Funds and the fees payable by each Fund.
The Board also considered the Adviser's use of a portion of the commissions paid by the Funds on their portfolio brokerage transactions to obtain research products and services benefiting the Funds and/or other clients of the Adviser and concluded, based on reports from the Funds' Chief Compliance Officer, that the Adviser's use of "soft" commission dollars to obtain research products and services was consistent with regulatory requirements.
After full consideration of the above factors as well as other factors that were instructive in their consideration, the Trustees, including all of the Independent Trustees, concluded that the continuation of the management agreement for each Fund with the Adviser was in the best interest of each Fund and each Fund's shareholders.
CALAMOS CLOSED-END FAMILY OF FUNDS ANNUAL REPORT
270
Trustees and Officers (Unaudited)
The management of each Fund, including general supervision of the duties performed for the Fund under the investment management agreement between the Fund and Calamos Advisors, is the responsibility of its board of trustees. Each trustee elected will hold office for the lifetime of the Trust or until such trustee's earlier resignation, death or removal; however, each trustee who is not an interested person of the Funds shall retire as a trustee at the end of the calendar year in which the trustee attains the age of 75 years. Each Fund's Statement of Additional Information contains additional information about the Trustees and Officers and is available without charge, upon request, at www.calamos.com or by calling 800.582.6959.
The following table sets forth each trustee's name, year of birth, position(s) with the Funds, number of portfolios in the Calamos Fund Complex overseen, principal occupation(s) during the past five years and other directorships held, and date first elected or appointed. Each Trustee oversees each Fund.
| NAME AND YEAR OF BIRTH | POSITION(S) AND LENGTH OF TIME WITH THE FUNDS^ | PORTFOLIOS IN FUND COMPLEX^^ OVERSEEN | PRINCIPAL OCCUPATION(S) DURING THE PAST 5 YEARS AND OTHER DIRECTORSHIPS | EXPERIENCE, QUALIFICATIONS, ATTRIBUTES, SKILLS FOR BOARD MEMBERSHIP | |||||||||||||||
Trustees who are interested persons of the Funds: | |||||||||||||||||||
John P. Calamos, Sr. (1940)* | Chairman, Trustee and President (since 2002) | 31 | Founder, Chairman and Global Chief Investment Officer, Calamos Asset Management, Inc. ("CAM"), Calamos Investments LLC ("CILLC"), Calamos Advisors LLC and its predecessor ("Calamos Advisors") and Calamos Wealth Management LLC ("CWM"); Director, CAM; Global Chief Investment Officer, Calamos Antetokounmpo Asset Management LLC ("CGAM"); and previously Chief Executive Officer, Calamos Financial Services LLC and its predecessor ("CFS"), CAM, CILLC, Calamos Advisors, and CWM | Served for multiple years as a trustee of the Funds; more than 25 years of experience in the financial services industry; experience serving on boards of other entities, including other investment companies; and earned a Masters of Business Administration degree | |||||||||||||||
Trustees who are not interested persons of the Funds: | |||||||||||||||||||
John E. Neal (1950) | Trustee (since 2002); Lead Independent Trustee (since 2019) | 32 | ^^^ | Retired; private investor; Director, Equity Residential Trust (publicly-owned REIT); Director, Creation Investments (private international microfinance company); Director, Centrust Bank (Northbrook, Illinois community bank); formerly, Director, Neuro-ID (private company providing prescriptive analytics for the risk industry) (until 2021); formerly, Partner, Linden LLC (health care private equity) (until 2018) | Served for multiple years as a trustee of the Funds; more than 25 years of experience in the financial services industry; experience serving on boards of other entities, including other investment companies; and earned a Masters of Business Administration degree | ||||||||||||||
William R. Rybak (1951) | Trustee (since 2002) | 31 | Private investor; Chairman (since 2016) and Director (since 2010), Christian Brothers Investment Services Inc.; Trustee, JNL Series Trust and JNL Investors Series Trust (since 2007), JNL Variable Fund LLC (2007-2020), Jackson Variable Series Trust (2018-2020) and JNL Strategic Income Fund LLC (2007-2018), (open-end mutual funds)**; Trustee, Lewis University (since 2012); formerly Director, Private Bancorp (2003-2017); Executive Vice President and Chief Financial Officer, Van Kampen Investments, Inc. and subsidiaries (investment manager) (until 2000) | Served for multiple years as a trustee of the Funds; more than 25 years of experience in the financial services industry; experience serving on boards of other entities, including other investment companies; and earned a Masters of Business Administration degree | |||||||||||||||
www.calamos.com
271
Trustees and Officers (Unaudited)
| NAME AND YEAR OF BIRTH | POSITION(S) AND LENGTH OF TIME WITH THE FUNDS^ | PORTFOLIOS IN FUND COMPLEX^^ OVERSEEN | PRINCIPAL OCCUPATION(S) DURING THE PAST 5 YEARS AND OTHER DIRECTORSHIPS | EXPERIENCE, QUALIFICATIONS, ATTRIBUTES, SKILLS FOR BOARD MEMBERSHIP | |||||||||||||||
Virginia G. Breen (1964) | Trustee (since 2015) | 31 | Private Investor; Trustee, UBS NY Fund Cluster (open-end funds) (since 2023)***; Director, Paylocity Holding Corporation (since 2018); Trustee, Neuberger Berman Private Equity Registered Funds (registered private equity funds) (since 2015)****; Director, UBS A&Q Fund Complex (closed-end funds) (since 2008)*****; Trustee, Jones Lang LaSalle Income Property Trust, Inc. (REIT) (2004-2023); Director, Tech and Energy Transition Corporation (blank check company) (2021-2023) | Served for multiple years as a trustee of the Funds; more than 25 years of experience in the financial services industry; experience serving on boards of other entities, including other investment companies; and earned a Masters of Business Administration degree | |||||||||||||||
Lloyd A. Wennlund (1957) | Trustee (since 2018) | 31 | Trustee and Chairman, Datum One Series Trust (since 2020); Expert Affiliate, Bates Group, LLC (financial services consulting and expert testimony firm) (since 2018); Executive Vice President, The Northern Trust Company (1989-2017); President and Business Unit Head of Northern Funds and Northern Institutional Funds (1994-2017); Director, Northern Trust Investments (1998-2017); Governor (2004-2017) and Executive Committee member (2011-2017), Investment Company Institute Board of Governors; Member, Securities Industry Financial Markets Association (SIFMA) Advisory Council, Private Client Services Committee and Private Client Steering Group (2006-2017); Board Member, Chicago Advisory Board of the Salvation Army (2011-2019) | More than 25 years of experience in the financial services industry; experience serving on boards of other entities, including other investment companies | |||||||||||||||
Karen L. Stuckey (1953) | Trustee (since 2019) | 31 | Member of Desert Mountain Community Foundation Advisory Board (non-profit organization) (2015-2021); Partner (1990-2012) of PricewaterhouseCoopers LLP (professional services firm) (held various positions from 1975-1990); Member of Executive, Nominating, and Audit Committees and Chair of Finance Committee (1992-2006); Emeritus Trustee (since 2007) of Lehigh University; member, Women's Investment Management Forum (professional organization) (since inception); formerly, Trustee, Denver Board of OppenheimerFunds (open-end mutual funds) (2012-2019) | More than 25 years of experience in the financial services industry; experience serving on boards of other entities, including other investment companies | |||||||||||||||
CALAMOS CLOSED-END FAMILY OF FUNDS ANNUAL REPORT
272
Trustees and Officers (Unaudited)
| NAME AND YEAR OF BIRTH | POSITION(S) AND LENGTH OF TIME WITH THE FUNDS^ | PORTFOLIOS IN FUND COMPLEX^^ OVERSEEN | PRINCIPAL OCCUPATION(S) DURING THE PAST 5 YEARS AND OTHER DIRECTORSHIPS | EXPERIENCE, QUALIFICATIONS, ATTRIBUTES, SKILLS FOR BOARD MEMBERSHIP | |||||||||||||||
Christopher M. Toub (1959) | Trustee (since 2019) | 31 | Private investor; formerly Director of Equities, AllianceBernstein LP (until 2012) | More than 25 years of experience in the financial services industry; and earned a Masters of Business Administration degree | |||||||||||||||
^ The Board of Trustees is divided into three classes, Class I, Class II, and Class III, with each being elected to serve until the third succeeding annual shareholders' meeting subsequent to such election or thereafter in each case when their respective successors are duly elected or appointed, except two board members are elected by the holders of Preferred Shares, when applicable, to serve until the next annual shareholders' meeting subsequent to such election or thereafter in each case when its respective successors are duly elected or appointed. The year first elected or appointed represents the year in which the board member was first elected or appointed to one of the Calamos Closed-End Funds.
^^ The Fund Complex consists of Calamos Investment Trust, Calamos Advisors Trust, Calamos Convertible Opportunities and Income Fund, Calamos Convertible and High Income Fund, Calamos Strategic Total Return Fund, Calamos Global Total Return Fund, Calamos Global Dynamic Income Fund, Calamos Dynamic Convertible and Income Fund, Calamos Long/Short Equity & Dynamic Income Trust, Calamos ETF Trust, Calamos Antetokounmpo Sustainable Equities Trust, and Calamos Aksia Alternative Credit and Income Fund.
^^^ Mr. Neal is the only Trustee of the Trust who oversees Calamos Aksia Alternative Credit and Income Fund.
* Mr. Calamos, Sr. is an "interested person" of the Trust as defined in the 1940 Act because he is an officer of the Trust and an affiliate of Calamos Advisors and CFS.
** Overseeing 131 portfolios in fund complex.
*** Overseeing thirty-eight portfolios in fund complex.
**** Overseeing twenty-one portfolios in fund complex.
***** Overseeing three portfolios in fund complex.
The address of each trustee is 2020 Calamos Court, Naperville, Illinois 60563.
www.calamos.com
273
Trustees and Officers (Unaudited)
Officers. The preceding table gives information about John P. Calamos, Sr., who is Chairman, Trustee and President of the Trust. The following table sets forth each other officer's name, year of birth, position with the Trust and date first appointed to that position, and principal occupation(s) during the past five years. Each officer serves until his or her successor is chosen and qualified or until his or her resignation or removal by the board of trustees.
NAME AND YEAR OF BIRTH | POSITION(S) WITH FUNDS^ | PRINCIPAL OCCUPATION(S) | |||||||||
Robert Behan (1964) | Vice President (since 2013) | Executive Vice President, Chief Distribution Officer (since 2021), CAM, CILLC, Calamos Advisors, and CFS; Vice President (since 2022), CGAM; prior thereto President, CAM, CILLC, Calamos Advisors, and CFS (2015-2021), Head of Global Distribution (2013-February 2021); Executive Vice President (2013-2015); Senior Vice President (2009-2013), Head of US Intermediary Distribution (2010-2013) | |||||||||
Thomas E. Herman (1961) | Vice President (since 2016) and Chief Financial Officer (2016-2017 and since 2019) | Executive Vice President (since 2021) and Chief Financial Officer, CAM, CILLC, Calamos Advisors, and CWM (since 2016); Chief Financial Officer (since 2022), CGAM; prior thereto, Chief Financial Officer and Treasurer, Harris Associates (2010-2016) | |||||||||
Erik D. Ojala (1975) | Vice President and Secretary (since 2023) | Senior Vice President, General Counsel and Secretary, CAM, CILLC, Calamos Advisors, CWM (since 2023); Chief Legal Officer, CGAM (since 2023); General Counsel and Secretary, CFS (since 2023); prior thereto, Executive Vice President and General Counsel (2017-2023), Secretary (2010-2023) and Chief Compliance Officer (2022-2023), Harbor Capital Advisors, Inc.; Director and Secretary (2019-2023) and Chief Compliance Officer (2022-2023), Harbor Trust Company, Inc.; Director, Executive Vice President (2017-2023) and Chief Compliance Officer (2017-2021, 2022-2023), Harbor Funds Distributors, Inc.; Director (2017-2023), Assistant Secretary (2014-2023) and Chief Compliance Officer (2022-2023), Harbor Services Group, Inc.; and Chief Compliance Officer, Harbor ETF Trust (2021-2023); Chief Compliance Officer of Harbor Funds (2017-2023) | |||||||||
John S. Koudounis (1966) | Vice President (since 2016) | President (since February 2021) and Chief Executive Officer, CAM, CILLC, Calamos Advisors, CWM, and CFS (since 2016); Director, CAM (since 2016); Chairman and Chief Executive Officer (since 2022), CGAM; prior thereto President and Chief Executive Officer (2010-2016), Mizuho Securities USA Inc. | |||||||||
Mark J. Mickey (1951) | Chief Compliance Officer (since 2005) | Chief Compliance Officer, Calamos Funds (since 2005) | |||||||||
Stephen Atkins (1965) | Treasurer (since 2020) | Senior Vice President, Head of Fund Administration (since 2020), Calamos Advisors; prior thereto Consultant, Fund Accounting and Administration, Vx Capital Partners (2019-2020); Chief Financial Officer and Treasurer of SEC Registered Funds, and Senior Vice President, Head of European Special Purpose Vehicles Accounting and Administration, Avenue Capital Group (2010-2018) | |||||||||
Daniel Dufresne (1974) | Vice President (since 2021) | Executive Vice President and Chief Operating Officer, CAM, CILLC, Calamos Advisors, and CWM (since 2021); President (since 2022), CGAM; prior thereto Citadel (1999-2020); Partner (2008-2020); Managing Director, Global Treasurer (2008-2020); Global Head of Operations (2011-2020); Global Head of Counterparty Strategy (2018-2020); Senior Advisor to the COO (2020); CEO, Citadel Clearing LLC (2015-2020) | |||||||||
^ Officers serve indefinite terms until their successor has been duly elected and qualified, their death or resignation or removal. The year first elected or appointed represents the year in which the Officer was first elected or appointed to one of the Calamos Closed-End Funds.
The address of each officer is 2020 Calamos Court, Naperville, Illinois 60563.
Results of 2023 Annual Meeting
The Funds held their joint annual meeting of shareholders on June 20, 2023. The purposes of the annual meeting were (i) for each Fund other than Calamos Long/Short Equity & Dynamic Income Trust ("CPZ"), to elect two trustees, to be elected by the holders of common shares and the holders of preferred shares, voting together as a single class, each such trustee to serve until the annual meeting of shareholders in 2026, or until his successor is elected and qualified; (ii) for each Fund other than CPZ, to elect one trustee, to be elected by the holders of preferred shares, voting as a single class, such trustee to serve until the annual meeting of shareholders in 2026, or until his successor is elected and qualified; (iii) to elect three trustees of CPZ, to be elected by the holders of common shares, voting as a single class, each such trustee to serve until the annual meeting of shareholders in 2026, or until his successor is elected and qualified; and (iv) to conduct any other lawful business of the Fund.
For each Fund other than CPZ, Messrs. John P. Calamos, Sr. and Christopher M. Toub were nominated for reelection as trustees by the holders of the common shares and preferred shares, voting as a single class, for a three-year term until the 2026 annual
CALAMOS CLOSED-END FAMILY OF FUNDS ANNUAL REPORT
274
Trustees and Officers (Unaudited)
meeting or until his successor is duly elected and qualified. For each Fund other than CPZ, Mr. William R. Rybak was nominated for reelection as trustee by the holders of the preferred shares, voting as a single class, for a three-year term until the 2026 annual meeting or until his or her successor is duly elected and qualified. For CPZ, Messrs. John P. Calamos, Sr., Christopher M. Toub, and William R. Rybak were nominated for reelection as trustees by the holders of the common shares, voting together as a single class, for a three-year term until the 2026 annual meeting or until his successor is duly elected and qualified. Each nominee was elected as trustee by a majority of the outstanding shares entitled to vote as follows:
Calamos Convertible Opportunities and Income Fund (CHI)
| TRUSTEE | NUMBER OF SHARES FOR | NUMBER OF SHARES WITHHELD | BROKER NON-VOTES AND ABSTENTIONS | ||||||||||||
John P. Calamos | 58,098,580 | 775,470 | — | ||||||||||||
William R. Rybak | 5,320,000 | — | — | ||||||||||||
Christopher M. Toub | 58,081,366 | 792,684 | — | ||||||||||||
Calamos Convertible and High Income Fund (CHY)
| TRUSTEE | NUMBER OF SHARES FOR | NUMBER OF SHARES WITHHELD | BROKER NON-VOTES AND ABSTENTIONS | ||||||||||||
John P. Calamos | 59,817,557.547 | 1,543,338 | — | ||||||||||||
William R. Rybak | 5,800,000 | — | — | ||||||||||||
Christopher M. Toub | 59,774,184 | 1,586,712 | — | ||||||||||||
Calamos Strategic Total Return Fund (CSQ)
| TRUSTEE | NUMBER OF SHARES FOR | NUMBER OF SHARES WITHHELD | BROKER NON-VOTES AND ABSTENTIONS | ||||||||||||
John P. Calamos | 141,562,472 | 2,210,958 | — | ||||||||||||
William R. Rybak | 10,496,000 | — | — | ||||||||||||
Christopher M. Toub | 141,679,437 | 2,093,993 | — | ||||||||||||
Calamos Global Total Return Fund (CGO)
| TRUSTEE | NUMBER OF SHARES FOR | NUMBER OF SHARES WITHHELD | BROKER NON-VOTES AND ABSTENTIONS | ||||||||||||
John P. Calamos | 7,463,401 | 170,273 | — | ||||||||||||
William R. Rybak | 680,000 | — | — | ||||||||||||
Christopher M. Toub | 7,458,02 | 175,647 | — | ||||||||||||
Calamos Global Dynamic Income Fund (CHW)
| TRUSTEE | NUMBER OF SHARES FOR | NUMBER OF SHARES WITHHELD | BROKER NON-VOTES AND ABSTENTIONS | ||||||||||||
John P. Calamos | 52,712,214 | 1,213,326 | — | ||||||||||||
William R. Rybak | 2,800,000 | — | — | ||||||||||||
Christopher M. Toub | 52,799,333 | 1,126,207 | — | ||||||||||||
Calamos Dynamic Convertible and Income Fund (CCD)
| TRUSTEE | NUMBER OF SHARES FOR | NUMBER OF SHARES AGAINST/WITHHELD | BROKER NON-VOTES AND ABSTENTIONS | ||||||||||||
John P. Calamos | 23,426,065 | 478,290 | — | ||||||||||||
William R. Rybak | 3,680,000 | — | — | ||||||||||||
Christopher M. Toub | 23,443,249 | 461,106 | — | ||||||||||||
www.calamos.com
275
Trustees and Officers (Unaudited)
Calamos Long/Short Equity & Dynamic Income Trust (CPZ)
| TRUSTEE | NUMBER OF SHARES FOR | NUMBER OF SHARES WITHHELD | BROKER NON-VOTES AND ABSTENTIONS | ||||||||||||
John P. Calamos | 15,440,284 | 397,950 | — | ||||||||||||
William R. Rybak | 15,369,893 | 468,341 | — | ||||||||||||
Christopher M. Toub | 15,411,077 | 427,157 | — | ||||||||||||
Mr. Wennlund and Mses. Stuckey and Breen's terms of office as trustees continued after the meeting.
CALAMOS CLOSED-END FAMILY OF FUNDS ANNUAL REPORT
276
Tax Information (Unaudited)
We are providing this information as required by the Internal Revenue Code (Code). The amounts shown may differ from those elsewhere in this report due to differences between tax and financial reporting requirements. In February 2024, shareholders will receive Form 1099-DIV which will include their share of qualified dividends and capital gains distributed during the calendar year 2023. Shareholders are advised to check with their tax advisors for information on the treatment of these amounts on their individual income tax returns.
Under Section 852(b)(3)(C) of the Code, the Funds hereby designate the following amounts as capital gain dividends for the fiscal period ended October 31, 2023:
FUND | CAPITAL GAINS DIVIDENDS | ||||||
Convertible Opportunities and Income Fund | $ | 58,448,531 | |||||
Convertible and High Income Fund | 63,794,457 | ||||||
Strategic Total Return Fund | 190,612,272 | ||||||
Dynamic Convertible and Income Fund | 48,555,021 | ||||||
Global Dynamic Income Fund | — | ||||||
Global Total Return Fund | 1,289,760 | ||||||
Long/Short Equity & Dynamic Income Trust | 798,873 | ||||||
Under Section 854(b)(2) of the Code, the Funds hereby designate the following amounts, or the maximum amount allowable under the Code, as qualified dividends for the fiscal period ended October 31, 2023:
FUND | QUALIFIED DIVIDENDS | ||||||
Convertible Opportunities and Income Fund | $ | 4,422,235 | |||||
Convertible and High Income Fund | 4,824,963 | ||||||
Strategic Total Return Fund | 17,803,791 | ||||||
Dynamic Convertible and Income Fund | 3,662,627 | ||||||
Global Dynamic Income Fund | 5,365,043 | ||||||
Global Total Return Fund | 1,259,698 | ||||||
Long/Short Equity & Dynamic Income Trust | 4,986,186 | ||||||
Under Section 854(b)(2) of the Code, the Funds hereby designate the following percentage amounts of the ordinary income dividends as income qualifying for the dividends received deduction for the period ended October 31, 2023:
FUND | DIVIDENDS RECEIVED DEDUCTION | ||||||
Convertible Opportunities and Income Fund | 14.32 | % | |||||
Convertible and High Income Fund | 14.93 | ||||||
Strategic Total Return Fund | 100.00 | ||||||
Dynamic Convertible and Income Fund | 22.51 | ||||||
Global Dynamic Income Fund | 9.36 | ||||||
Global Total Return Fund | 9.99 | ||||||
Long/Short Equity & Dynamic Income Trust | 11.64 | ||||||
www.calamos.com
277
About Closed-End Funds
What is a Closed-End Fund?
A closed-end fund is a publicly traded investment company that raises its initial investment capital through the issuance of a fixed number of shares to investors in a public offering. Shares of a closed-end fund are listed on a stock exchange or traded in the over-the-counter market. Like all investment companies, a closed-end fund is professionally managed and offers investors a unique investment solution based on its investment objective approved by the fund's Board of Trustees.
Potential Advantages of Closed-End Fund Investing
• Defined Asset Pool Allows Efficient Portfolio Management—Although closed-end fund shares trade actively on a securities exchange, this doesn't affect the closed-end fund manager because there are no new investors buying into or selling out of the fund's portfolio.
• More Flexibility in the Timing and Price of Trades—Investors can purchase and sell shares of closed-end funds throughout the trading day, just like the shares of other publicly traded securities.
• Lower Expense Ratios—The expense ratios of closed-end funds are oftentimes less than those of mutual funds. Over time, a lower expense ratio could enhance investment performance.
• Closed-End Structure Makes Sense for Less-Liquid Asset Classes—A closed-end structure makes sense for investors considering less-liquid asset classes, such as high-yield bonds or micro-cap stocks.
• Ability to Put Leverage to Work—Closed-end funds may issue senior securities (such as preferred shares or debentures) or borrow money to "leverage" their investment positions.
• No Minimum Investment Requirements
OPEN-END MUTUAL FUNDS VERSUS CLOSED-END FUNDS
OPEN-END FUND | CLOSED-END FUND | ||||||
Issues new shares on an ongoing basis | Generally issues a fixed number of shares | ||||||
Issues common equity shares | Can issue common equity shares and senior securities such as preferred shares and bonds | ||||||
Sold at NAV plus any sales charge | Price determined by the marketplace | ||||||
Sold through the fund's distributor | Traded in the secondary market | ||||||
Fund redeems shares at NAV calculated at the close of business day | Fund does not redeem shares | ||||||
You can purchase or sell common shares of closed-end funds daily. Like any other stock, market price will fluctuate with the market. Upon sale, your shares may have a market price that is above or below net asset value and may be worth more or less than your original investment. Shares of closed-end funds frequently trade at a discount, which is a market price that is below their net asset value.
Leverage creates risks which may adversely affect return, including the likelihood of greater volatility of net asset value and market price of common shares and fluctuations in the variable rates of the leverage financing.
Each open-end or closed-end fund should be evaluated individually. Before investing carefully consider the fund's investment objectives, risks, charges and expenses.
CALAMOS CLOSED-END FAMILY OF FUNDS ANNUAL REPORT
278
Level Rate Distribution Policy
Using a Level Rate Distribution Policy to Promote Dependable Income and Total Return
Calamos Global Total Return Fund and Calamos Global Dynamic Income Fund have implemented a level rate distribution policy. The goal of the level rate distribution policy is to provide investors a predictable, though not assured, level of cash flow, which can either serve as a stable income stream or, through reinvestment, may contribute significantly to long-term total return.
We understand the importance that investors place on the stability of dividends and their ability to contribute to long-term total return, which is why we have instituted a level rate distribution policy for Calamos Global Total Return Fund and Calamos Global Dynamic Income Fund. Under the policy, monthly distributions paid may include net investment income, net realized short-term capital gains, and, if necessary, return of capital. In addition, a limited number of distributions per calendar year may include net realized long-term capital gains. Please refer to each Fund's financial statements for specific information about distributions made during the last fiscal year.
There is no guarantee that the Funds will realize capital gains in any given year. Distributions are subject to recharacterization for tax purposes after the end of the fiscal year. All shareholders with taxable accounts will receive written notification regarding the components and tax treatment for distributions via Form 1099-DIV. For purposes of maintaining the level rate distribution policy, the Funds may realize short-term capital gains on securities that, if sold at a later date, would have resulted in long-term capital gains. Maintenance of a level rate distribution policy may increase transaction and tax costs associated with the Funds.
Distributions from the Funds are generally subject to Federal income taxes.
Managed Distribution Policy
Using a Managed Distribution Policy to Promote Dependable Income and Total Return
Calamos Convertible Opportunities and Income Fund, Calamos Convertible and High Income Fund, Calamos Strategic Total Return Fund, Calamos Dynamic Convertible and Income Fund, and Calamos Long/Short Equity & Dynamic Income Trust have implemented a managed distribution policy. The goal of the managed distribution policy is to provide investors a predictable, though not assured, level of cash flow, which can serve either as a stable income stream or, through reinvestment, may contribute significantly to long-term total return.
We understand the importance that investors place on the stability of dividends and their ability to contribute to long-term total return, which is why we have instituted a managed distribution policy for Calamos Convertible Opportunities and Income Fund, Calamos Convertible and High Income Fund, Calamos Strategic Total Return Fund, Calamos Dynamic Convertible and Income Fund and Calamos Long/Short Equity & Dynamic Income Trust. Under the policy, monthly distributions paid may include net investment income, net realized short-term capital gains, net realized long-term capital gains and, if necessary, return of capital. Please refer to each Fund's financial statements for specific information about distributions made during the last fiscal year.
Distributions of capital decrease a Fund's total assets and total assets per share and, therefore, could have the effect of increasing a Fund's expense ratio. In general, the policy of fixing a Fund's distributions at a targeted rate does not affect a Fund's investment strategy. However, in order to make these distributions, on occasion the Funds may have to sell portfolio securities at a less than opportune time.
There is no guarantee that the Funds will realize capital gains in any given year. Distributions are subject to re-characterization for tax purposes after the end of the fiscal year. All shareholders with taxable accounts will receive written notification regarding the components and tax treatment for distributions via Form 1099-DIV.
Distributions from the Funds are generally subject to Federal income taxes.
www.calamos.com
279
Automatic Dividend Reinvestment Plan
Maximizing Investment with an Automatic Dividend Reinvestment Plan
The Automatic Dividend Reinvestment Plan offers a simple, cost-efficient and convenient way to reinvest your dividends and capital gains distributions in additional shares of each Fund, allowing you to increase your investment in the Fund.
Potential Benefits
• Compounded Growth: By automatically reinvesting with the Plan, you gain the potential to allow your dividends and capital gains to compound over time.
• Potential for Lower Commission Costs: Additional shares are purchased in large blocks, with brokerage commissions shared among all plan participants. There is no cost to enroll in the Plan.
• Convenience: After enrollment, the Plan is automatic and includes detailed statements for participants. Participants can terminate their enrollment at any time.
Pursuant to the Plan, unless a shareholder is ineligible or elects otherwise, all dividend and capital gains on common shares distributions are automatically reinvested by Computershare, as agent for shareholders in administering the Plan ("Plan Agent"), in additional common shares of the Fund. Shareholders who elect not to participate in the Plan will receive all dividends and distributions payable in cash paid by check mailed directly to the shareholder of record (or, if the shares are held in street or other nominee name, then to such nominee) by Plan Agent, as dividend paying agent. Shareholders may elect not to participate in the Plan and to receive all dividends and distributions in cash by sending written instructions to the Plan Agent, as dividend paying agent, at: Dividend Reinvestment Department, P.O. Box 43078, Providence RI 02940-3078. Participation in the Plan is completely voluntary and may be terminated or resumed at any time without penalty by giving notice in writing to the Plan Agent; such termination will be effective with respect to a particular dividend or distribution if notice is received prior to the record date for the applicable distribution.
The shares are acquired by the Plan Agent for the participant's account either (i) through receipt of additional common shares from the Fund ("newly issued shares") or (ii) by purchase of outstanding common shares on the open market ("open-market purchases") on the NASDAQ or elsewhere. If, on the payment date, the net asset value per share of the common shares is equal to or less than the market price per common share plus estimated brokerage commissions (a "market premium"), the Plan Agent will receive newly issued shares from the Fund for each participant's account. The number of newly issued common shares to be credited to the participant's account will be determined by dividing the dollar amount of the dividend or distribution by the greater of (i) the net asset value per common share on the payment date, or (ii) 95% of the market price per common share on the payment date.
If, on the payment date, the net asset value per common share exceeds the market price plus estimated brokerage commissions (a "market discount"), the Plan Agent has a limited period of time to invest the dividend or distribution amount in shares acquired in open-market purchases. If, before the Plan Agent has completed its open-market purchases, the market price plus estimated brokerage commissions exceeds the net asset value of the common shares as of the payment date, the purchase price paid by Plan Agent may exceed the net asset value of the common shares, resulting in the acquisition of fewer common shares than if such dividend or distribution had been paid in common shares issued by the Fund. The weighted average price (including brokerage commissions) of all common shares purchased by the Plan Agent as Plan Agent will be the price per common share allocable to each participant. If the Plan Agent is unable to invest the full dividend amount in open-market purchases during the purchase period or if the market discount shifts to a market premium during the purchase period, the Plan Agent will cease making open-market purchases and will invest the uninvested portion of the dividend or distribution amount in newly issued shares at the net asset value per common share at the close of business on the last purchase date.
The automatic reinvestment of dividends and distributions will not relieve participants of any federal, state or local income tax that may be payable (or required to be withheld) on such dividends even though no cash is received by participants.
CALAMOS CLOSED-END FAMILY OF FUNDS ANNUAL REPORT
280
Automatic Dividend Reinvestment Plan
There are no brokerage charges with respect to shares issued directly by the Fund as a result of dividends or distributions payable either in shares or in cash. However, each participant will pay a pro rata share of brokerage commissions incurred with respect to the Plan Agent's open-market purchases in connection with the reinvestment of dividends or distributions. If a participant elects to have the Plan Agent sell part or all of his or her common shares and remit the proceeds, such participant will be charged his or her pro rata share of brokerage commissions on the shares sold, plus a $15 transaction fee. There is no direct service charge to participants in the Plan; however, the Fund reserves the right to amend the Plan to include a service charge payable by the participants.
A participant may request the sale of all of the common shares held by the Plan Agent in his or her Plan account in order to terminate participation in the Plan. If such participant elects in advance of such termination to have the Plan Agent sell part or all of his shares, the Plan Agent is authorized to deduct from the proceeds a $15.00 fee plus the brokerage commissions incurred for the transaction. A participant may re-enroll in the Plan in limited circumstances.
The terms and conditions of the Plan may be amended by the Plan Agent or the Fund at any time upon notice as required by the Plan.
This discussion of the Plan is only summary, and is qualified in its entirety by the Terms and Conditions of the Dividend Reinvestment Plan filed as part of the Fund's registration statement.
For additional information about the Plan, please contact the Plan Agent, Computershare, at 866.226.8016. If you wish to participate in the Plan and your shares are held in your own name, simply call the Plan Agent. If your shares are not held in your name, please contact your brokerage firm, bank, or other nominee to request that they participate in the Plan on your behalf. If your brokerage firm, bank, or other nominee is unable to participate on your behalf, you may request that your shares be re-registered in your own name.
We're pleased to provide our shareholders with the additional benefit of the Fund's Dividend Reinvestment Plan and hope that it may serve your financial plan.
Additional Fund Information: Delaware Statutory Trust Act – Control Share Acquisitions
Each Fund is organized as a Delaware statutory trust and thus is subject to the control share acquisition statute contained in Subchapter III of the Delaware Statutory Trust Act (the DSTA Control Share Statute). The DSTA Control Share Statute applies to any closed-end investment company organized as a Delaware statutory trust and listed on a national securities exchange, such as the Fund. The DSTA Control Share Statute became automatically applicable to the Funds on August 1, 2022.
The DSTA Control Share Statute defines "control beneficial interests" (referred to as "control shares" herein) by reference to a series of voting power thresholds and provides that a holder of control shares acquired in a control share acquisition has no voting rights under the Delaware Statutory Trust Act (DSTA) or each Fund's Governing Documents (as used herein, "Governing Documents" means each Fund's Agreement and Declaration of Trust and By-Laws, together with any amendments or supplements thereto, including any Statement of Preferences establishing a series of preferred shares, as applicable) with respect to the control shares acquired in the control share acquisition, except to the extent approved by a Fund's shareholders by the affirmative vote of two—thirds of all the votes entitled to be cast on the matter, excluding all interested shares (generally, shares held by the acquiring person and their associates and shares held by Fund insiders).
The DSTA Control Share Statute provides for a series of voting power thresholds above which shares are considered control shares. Whether one of these thresholds of voting power is met is determined by
www.calamos.com
281
Additional Fund Information: Delaware Statutory Trust Act – Control Share Acquisitions
aggregating the holdings of the acquiring person as well as those of his, her or its "associates." These thresholds are:
• 10% or more, but less than 15% of all voting power;
• 15% or more, but less than 20% of all voting power;
• 20% or more, but less than 25% of all voting power;
• 25% or more, but less than 30% of all voting power;
• 30% or more, but less than a majority of all voting power; or
• a majority or more of all voting power.
Under the DSTA Control Share Statute, once a threshold is reached, an acquirer has no voting rights with respect to shares in excess of that threshold (i.e., the "control shares") until approved by a vote of shareholders, as described above, or otherwise exempted by the Funds' Board of Trustees. The DSTA Control Share Statute contains a statutory process for an acquiring person to request a shareholder meeting for the purpose of considering the voting rights to be accorded control shares. An acquiring person must repeat this process at each threshold level.
Under the DSTA Control Share Statute, an acquiring person's "associates" are broadly defined to include, among others, relatives of the acquiring person, anyone in a control relationship with the acquiring person, any investment fund or other collective investment vehicle that has the same investment adviser as the acquiring person, any investment adviser of an acquiring person that is an investment fund or other collective investment vehicle and any other person acting or intending to act jointly or in concert with the acquiring person.
Voting power under the DSTA Control Share Statute is the power (whether such power is direct or indirect or through any contract, arrangement, understanding, relationship or otherwise) to directly or indirectly exercise or direct the exercise of the voting power of shares of a Fund in the election of each Fund's Trustees (either generally or with respect to any subset, series or class of trustees, including any Trustees elected solely by a particular series or class of shares, such as the preferred shares). Thus, a Fund's preferred shares, as applicable, acquired in excess of the above thresholds would be considered control shares with respect to the preferred share class vote for two Trustees.
Any control shares of the Fund acquired before August 1, 2022 are not subject to the DSTA Control Share Statute; however, any further acquisitions on or after August 1, 2022 are considered control shares subject to the DSTA Control Share Statute.
The DSTA Control Share Statute requires shareholders to disclose to a Fund any control share acquisition within 10 days of such acquisition, and also permits the Fund to require a shareholder or an associate of such person to disclose the number of shares owned or with respect to which such person or an associate thereof can directly or indirectly exercise voting power. Further, the DSTA Control Share Statute requires a shareholder or an associate of such person to provide to the Fund within 10 days of receiving a request therefor from the Fund any information that the Fund's Trustees reasonably believe is necessary or desirable to determine whether a control share acquisition has occurred.
The DSTA Control Share Statute permits the Funds' Board of Trustees, through a provision in each Fund's Governing Documents or by Board action alone, to eliminate the application of the DSTA Control Share Statute to the acquisition of control shares in the Fund specifically, generally, or generally by types, as to specifically identified or unidentified existing or future beneficial owners or their affiliates or associates or as to any series or classes of shares. The DSTA Control Share Statute does not provide that the Fund can generally "opt out" of the application of the DSTA Control Share Statute; rather, specific acquisitions or classes of acquisitions may be exempted by the Board of Trustees, either in advance or retroactively, but other aspects of the DSTA Control Share Statute, which are summarized above, would continue to apply.
CALAMOS CLOSED-END FAMILY OF FUNDS ANNUAL REPORT
282
Additional Fund Information: Delaware Statutory Trust Act – Control Share Acquisitions
The DSTA Control Share Statute further provides that the Board of Trustees is under no obligation to grant any such exemptions.
The foregoing is only a summary of the material terms of the DSTA Control Share Statute. Shareholders should consult their own counsel with respect to the application of the DSTA Control Share Statute to any particular circumstance.
www.calamos.com
283
MANAGING YOUR CALAMOS FUNDS INVESTMENTS
Calamos Investments offers several convenient means to monitor, manage and feel confident about your Calamos investment choice.
PERSONAL ASSISTANCE: 800.582.6959
Dial this toll-free number to speak with a knowledgeable Client Services Representative who can help answer questions or address issues concerning your Calamos Fund.
ONLINE ACCOUNT MANAGEMENT:
www.calamos.com
Manage your personal account of Calamos Funds online at www.calamos.com. On your account access page, you can view account history and download data.
YOUR FINANCIAL ADVISOR
We encourage you to talk to your financial advisor to determine how the Calamos Funds can benefit your investment portfolio based on your financial goals, risk tolerance, time horizon and income needs.
A description of the Calamos Proxy Voting Policies and Procedures and the Funds' proxy voting record for the 12-month period ended June 30 are available free of charge upon request by calling 800.582.6959, by visiting the Calamos Web site at www.calamos.com, or by writing Calamos at: Calamos Investments, Attn: Client Services, 2020 Calamos Court, Naperville, IL 60563. The Funds' proxy voting record is also available free of charge by visiting the SEC Web site at www.sec.gov.
The Funds file a complete list of their portfolio holdings with the SEC for the first and third quarters each fiscal year as an exhibit to its reports on Form N-PORT. The Forms N-PORT are available free of charge, upon request, by calling or writing Calamos Investments at the phone number or address provided above or by visiting the SEC Web site at www.sec.gov.
The Fund's report to the SEC on Form N-CSR contains certifications by the fund's principal executive officer and principal financial officer as required by Rule 30a-2(a) under the 1940 Act, relating to, among other things, the quality of the Fund's disclosure controls and procedures and internal control over financial reporting.
FOR 24-HOUR AUTOMATED SHAREHOLDER ASSISTANCE: 866.226.8016
TO OBTAIN INFORMATION ABOUT YOUR INVESTMENTS: 800.582.6959
VISIT OUR WEB SITE: www.calamos.com
INVESTMENT ADVISER:
Calamos Advisors LLC
2020 Calamos Court
Naperville, IL 60563-2787
CUSTODIAN AND FUND ACCOUNTING AGENT:
State Street Bank and Trust Company
Boston, MA
TRANSFER AGENT:
Computershare
P.O. Box 43078
Providence RI 02940-3078
866.226.8016
INDEPENDENT REGISTERED PUBLIC ACCOUNTING FIRM:
Deloitte & Touche LLP
Chicago, IL
LEGAL COUNSEL:
Ropes & Gray LLP
Chicago, IL

Visit our Web site for timely fund performance, detailed fund profiles, fund news and insightful market commentary.
2020 Calamos Court
Naperville, IL 60563-2787
800.582.6959
www.calamos.com
© 2023 Calamos Investments LLC. All Rights Reserved. Calamos® and Calamos Investments® are registered trademarks of Calamos Investments LLC.
CEFANR 822293 2023