Table of Contents
SCHEDULE 14A INFORMATION
Proxy Statement Pursuant to Section 14(a) of the
Securities Exchange Act of 1934
| ☑ Filed by the Registrant | ☐ Filed by a party other than the Registrant |
| Check the appropriate box: | ||
|
☐ |
Preliminary Proxy Statement | |
|
☐ |
CONFIDENTIAL, FOR USE OF THE COMMISSION ONLY (AS PERMITTED BY RULE 14a-6(e)(2)) | |
|
☑ |
Definitive Proxy Statement | |
|
☐ |
Definitive Additional Materials | |
|
☐ |
Soliciting Material Pursuant to §240.14a-12 | |
Vulcan Materials Company
(Name of Registrant as Specified in Its Charter)
(Name of Person(s) Filing Proxy Statement, if other than the Registrant)
| Payment of filing fee (Check the appropriate box): | ||
| ☑ | No fee required. | |
| ☐ | Fee computed on table below per Exchange Act Rules 14a-6(I)(1) and 0-11. | |
| (1) Title of each class of securities to which transaction applies:
| ||
| (2) Aggregate number of securities to which transaction applies:
| ||
| (3) Per unit price or other underlying value of transaction computed pursuant to Exchange Act Rule 0-11 (set forth the amount on which the filing fee is calculated and state how it was determined):
| ||
| (4) Proposed maximum aggregate value of transaction:
| ||
| (5) Total fee paid:
| ||
| ☐ | Fee paid previously with preliminary materials: | |
| ☐ | Check box if any part of the fee is offset as provided by Exchange Act Rule 240.0-11 and identify the filing for which the offsetting fee was paid previously. Identify the previous filing by registration statement number, or the Form or Schedule and the date of its filing. | |
| (1) Amount Previously Paid:
| ||
| (2) Form, Schedule or Registration Statement No.:
| ||
| (3) Filing Party:
| ||
| (4) Date Filed:
| ||
Table of Contents
Vulcan Materials Company
Notice of 2020 annual meeting of Shareholders and Proxy Statement

Table of Contents
|
ONE VULCAN, LOCALLY LED |
||||
Dear fellow shareholders,

| * | EBITDA, Adjusted EBITDA, adjusted earnings from continuing operations and return on invested capital are non-GAAP financial measures. We provide a reconciliation of EBITDA, Adjusted EBITDA, adjusted earnings from continuing operations and return on invested capital to the most directly comparable GAAP financial measures in Annex A to this proxy statement. |
Table of Contents
|
ONE VULCAN, LOCALLY LED |
||||

Table of Contents
| Notice of Annual Meeting |
|
NOTICE IS HEREBY GIVEN that the 2020 Annual Meeting of Shareholders of Vulcan Materials Company will be held virtually via the internet, on Friday, May 8, 2020, at 9:00 a.m., Central Daylight Time.
|
|
|
|
| ||
| Date & time: Friday May 8, 2020 9:00 a.m., Central Daylight Time |
Access*: The Annual Meeting can be accessed virtually at: www.virtualshareholdermeeting.com/VMC2020.
|
Record Date: March 11, 2020 | ||


|
How to Vote
|
||||||||
 Online
 |
 By Phone
 |
 By Mail
|
||||||
| Vote online at www.proxyvote.com. |
Vote by phone by calling the number located on your |
If you received a printed version of these proxy |
||||||
|
Only shareholders of record as of the close of business on March 11, 2020, are entitled to receive notice of, to attend and to vote at the Annual Meeting. Whether or not you plan to attend, we urge you to review these materials carefully and to vote online or by telephone, or, if you have received a paper copy of the proxy card, you may instead choose to vote by mailing your proxy card.
|
||||||||
Voting Matters
| PROPOSAL |
BOARD VOTE RECOMMENDATION |
PAGE (for more detail) | ||
| FOR each director nominee |
5 | |||
|
Proposal 2: Advisory Vote on Compensation of our Named Executive Officers |
FOR | 12 | ||
|
Proposal 3: Ratification of Appointment of Independent Registered Public |
FOR | 13 |
|
* In light of the coronavirus (COVID-19) outbreak, for the safety of all of our people, including our shareholders, and taking into account recent federal, state and local guidance that has been issued, we have determined that the Annual Meeting will be held in a virtual meeting format only, via the internet, with no physical in-person meeting. We are permitted to hold the meeting in this format given recent legislation in the State of New Jersey—the state in which the company is incorporated—that was enacted for the current state of emergency. If you plan to participate in the virtual meeting, please see “Annual Meeting and Voting Information” beginning on page 60 of this proxy statement. Shareholders will be able to attend, vote and submit questions (both before, and for a portion of, the meeting) from any location via the internet. We intend to resume holding in-person annual meetings of shareholders under normal circumstances.
To participate in the Annual Meeting (e.g., submit questions and/or vote), you will need the control number provided on your proxy card, voting instruction card or Notice of Internet Availability of Proxy Materials. If you are not a shareholder or do not have a control number, you may still access the Annual Meeting as a guest, but you will not be able to participate.
|
Table of Contents

Table of Contents
|
BUSINESS HIGHLIGHTS
We achieved a number of significant milestones during the course of 2019, in large part due to the continuing dedication of our employees, the leadership of our executive officers and our Board of Directors, and the culture of our company, which binds us all together.
Highlights of 2019 included:
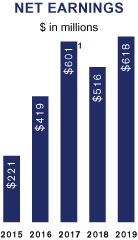
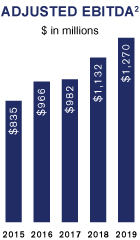
• Achieving double-digit growth in revenues and earnings, with total revenues of $4.9 billion, net earnings of $618 million and Adjusted EBITDA2 of $1.27 billion, an increase of 12%, 20% and 12%, respectively, over the prior year;
• Maintaining excellent liquidity, reinvesting in our core operations, maintaining our investment grade credit rating, pursuing profitable growth opportunities and returning $167 million to shareholders through dividends and share repurchases;
• Accomplishing our third consecutive year of world-class safety performance, with a combined Mine Safety and Health Administration (MSHA) Reportable and Occupational Safety and Health Administration (OSHA) Recordable Injury Rate of 0.97 in 2019, and an MSHA citation rate of 0.70 compared to the industry average of 2.12;
• Continuing our efforts to strengthen our workplace diversity and inclusion by joining CEO Action for Diversity & Inclusion™—a nationwide effort to drive inclusiveness—and establishing a partnership in support of HBCUs by providing scholarships and internships for students that may lead to full-time employment upon graduation; and
• Reducing greenhouse gas emissions as a percentage of revenue and of production tons, and maintaining a citation-free environmental inspection rate of over 98%.
12% compounded annual improvement in aggregates gross profit per ton since second quarter 2013. |
||||
|
(1) 2017 net earnings include discrete income tax benefits of $297.0 million, including benefits arising from the enactment of the Tax Cuts and Jobs Act.
(2) Adjusted EBITDA is a non-GAAP financial measure. We provide a reconciliation of Adjusted EBITDA to the most directly comparable GAAP financial measure in Annex A to this proxy statement. |
|
2 |
2020 PROXY STATEMENT |
|
||||||||
Table of Contents
PROXY SUMMARY
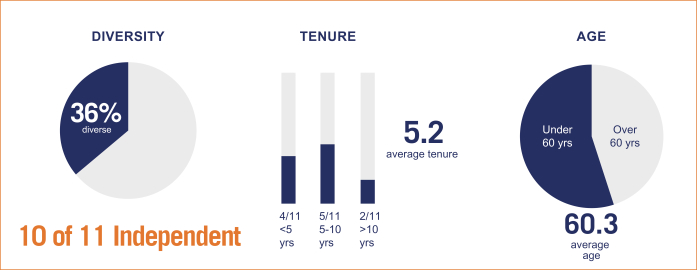
BOARD COMPOSITION
GOVERNANCE HIGHLIGHTS
SHAREHOLDER ENGAGEMENT
We continued our corporate governance outreach efforts in 2019 and reached out to shareholders representing approximately 60% of our outstanding shares in order to foster and deepen relationships with the governance teams of our largest shareholders. Our discussions centered on the company’s ESG efforts, including sustainability, carbon reduction, diversity and inclusion, culture, executive compensation and corporate governance matters. We update the Board on our conversations with shareholders, and our directors take into account shareholder feedback when making decisions regarding the company’s policies and practices. We value the views of our shareholders and believe these dialogues are critically important to ensuring that we remain aligned with their interests.
ADOPTION OF PROXY ACCESS
In early 2020, following discussions with certain of our shareholders, our Board adopted a proxy access bylaw provision, which permits a shareholder, or a group of up to 20 shareholders, owning 3% or more of our outstanding common stock continuously for at least three years, to nominate and include in our annual meeting proxy materials director nominees constituting up to the greater of (a) two individuals and (b) 20% of the total number of directors serving on the board of directors (rounded down to the nearest whole number), subject to certain limitations and provided that the requirements set forth in our bylaws are satisfied.
CORPORATE GOVERNANCE PRACTICES
We are committed to strong corporate governance policies and practices and believe that this commitment is a critical element in achieving long-term shareholder value. The following list summarizes certain highlights of our governance policies and practices:
|
|
2020 PROXY STATEMENT |
|
3 |
| ||||||||
Table of Contents
PROXY SUMMARY
COMPENSATION HIGHLIGHTS
We encourage you to read the more detailed description of our compensation program in “Compensation Discussion and Analysis” beginning on page 27 before voting on Proposal 2: Advisory Vote on Compensation of Our Named Executive Officers.
At our 2019 Annual Meeting of Shareholders, over 98% of votes cast were in favor of the compensation of our named executive officers (NEOs).
|
4 |
2020 PROXY STATEMENT |
|
||||||||
Table of Contents

Table of Contents
PROPOSALS REQUIRING YOUR VOTE


|
6 |
2020 PROXY STATEMENT |
|
||||||||
Table of Contents
PROPOSALS REQUIRING YOUR VOTE


|
|
2020 PROXY STATEMENT |
|
7 |
| ||||||||
Table of Contents
PROPOSALS REQUIRING YOUR VOTE


|
8 |
2020 PROXY STATEMENT |
|
||||||||
Table of Contents
PROPOSALS REQUIRING YOUR VOTE


|
|
2020 PROXY STATEMENT |
|
9 |
| ||||||||
Table of Contents
PROPOSALS REQUIRING YOUR VOTE


|
10 |
2020 PROXY STATEMENT |
|
||||||||
Table of Contents
PROPOSALS REQUIRING YOUR VOTE


|
|
2020 PROXY STATEMENT |
|
11 |
| ||||||||
Table of Contents
Table of Contents
PROPOSALS REQUIRING YOUR VOTE
|
|
2020 PROXY STATEMENT |
|
13 |
| ||||||||
Table of Contents
Table of Contents
Table of Contents
Table of Contents
CORPORATE GOVERNANCE
| NON-MANAGEMENT EXECUTIVE SESSIONS | ||
| MEETINGS AND ATTENDANCE | ||
| COMMITTEES OF THE BOARD OF DIRECTORS | ||
Our Board of Directors has established six standing committees as follows:
| DIRECTOR |
AUDIT COMMITTEE |
COMPENSATION COMMITTEE |
EXECUTIVE COMMITTEE |
FINANCE COMMITTEE |
GOVERNANCE COMMITTEE |
SAFETY, HEALTH AND ENVIRONMENTAL AFFAIRS COMMITTEE | ||||||
| Melissa H. Anderson |
• |
• | ||||||||||
| Thomas A. Fanning |
• |
Chair |
• |
|||||||||
| O. B. Grayson Hall, Jr. |
• |
Chair |
• |
|||||||||
| J. Thomas Hill |
Chair |
|||||||||||
| Cynthia L. Hostetler |
• |
• |
||||||||||
| Richard T. O’Brien |
Chair |
• |
• | |||||||||
| James T. Prokopanko |
• |
• |
||||||||||
| Kathleen L. Quirk |
• |
• |
||||||||||
| David P. Steiner |
• |
• |
Chair |
|||||||||
| Lee J. Styslinger, III |
• |
• |
Chair | |||||||||
| George Willis |
• |
• | ||||||||||
| Number of meetings held in 2019 |
7 |
3 |
0 |
3 |
3 |
2 | ||||||
|
|
2020 PROXY STATEMENT |
|
17 |
| ||||||||
Table of Contents
CORPORATE GOVERNANCE
|
18 |
2020 PROXY STATEMENT |
|
||||||||
Table of Contents
CORPORATE GOVERNANCE
|
|
2020 PROXY STATEMENT |
|
19 |
| ||||||||
Table of Contents
Table of Contents
Table of Contents
Table of Contents
Independent Registered Public Accounting Firm
| FEES PAID TO INDEPENDENT REGISTERED PUBLIC ACCOUNTING FIRM | ||
Aggregate fees billed to us for the fiscal years ended December 31, 2019 and 2018, by Deloitte & Touche LLP and its affiliates (all of which are subsidiaries of Deloitte, LLP, the United States member firm of Deloitte Touche Tohmatsu Limited) were as follows:
PRE-APPROVAL OF SERVICES PERFORMED BY INDEPENDENT REGISTERED
| PUBLIC ACCOUNTING FIRM | ||
|
|
2020 PROXY STATEMENT |
|
23 |
| ||||||||
Table of Contents
Security Ownership of Certain Beneficial Owners and Management
| SECURITY OWNERSHIP OF CERTAIN BENEFICIAL OWNERS | ||
The following is information regarding persons known to us to have beneficial ownership of more than 5% of the outstanding common stock of our company, which is our only outstanding class of voting securities, as of the dates indicated in the footnotes below.
| NAME AND ADDRESS OF BENEFICIAL OWNER |
AMOUNT AND NATURE OF (# OF SHARES) |
PERCENT OF CLASS |
||||||
|
The Vanguard Group, Inc. 100 Vanguard Blvd Malvern, PA 19355
|
|
14,842,330
|
(1)
|
|
11.2
|
%
| ||
|
State Farm Mutual Automobile Insurance Company and Affiliates One State Farm Plaza Bloomington, IL 61710
|
|
11,210,438
|
(2)
|
|
8.5
|
%
| ||
|
BlackRock, Inc. 55 East 52nd Street New York, NY 10055
|
|
8,838,604
|
(3)
|
|
6.7
|
%
| ||
| (1) | Based on information contained in a Schedule 13G/A, filed with the SEC on February 12, 2020. The Vanguard Group (Vanguard) reports sole power to vote (or direct the vote of) 204,292 shares and sole power to dispose (or direct the disposition of) 14,615,680 shares. Vanguard also reports shared power to vote (or direct the vote of) 34,361 shares and shared power to dispose (or direct the disposition of) 226,650 shares. Vanguard reports an aggregate amount of 14,842,330 shares beneficially owned. |
| (2) | Based on information contained in a Schedule 13G, filed with the SEC on January 28, 2020, by State Farm Mutual Automobile Insurance Company and various affiliated entities (State Farm). State Farm reports sole power to vote (or direct the vote of) and dispose (or direct the disposition of) 11,153,100 shares and the shared power to vote (or direct the vote of) and dispose (or direct the disposition of) 57,338 shares. State Farm reports an aggregate amount of 11,210,438 beneficially owned shares. Each entity listed in the Schedule 13G expressly disclaims beneficial ownership as to all shares as to which such entity has no right to receive the proceeds of the sale of the security and disclaims that it is part of a group. |
| (3) | Based on information contained in a Schedule 13G/A, filed with the SEC on February 6, 2020. BlackRock, Inc. (BlackRock) reports sole power to vote (or direct the vote of) 7,665,315 shares and sole power to dispose (or direct the disposition of) 8,838,604 shares. BlackRock reports an aggregate amount of 8,838,604 shares beneficially owned. Various persons have the right to receive, or the power to direct the receipt of, dividends and the proceeds from the sale of the company’s common stock. No one person’s interest in the company’s common stock is more than five percent of the total outstanding common shares. |
|
24 |
2020 PROXY STATEMENT |
|
||||||||
Table of Contents
SECURITY OWNERSHIP OF CERTAIN BENEFICIAL OWNERS AND MANAGEMENT
| SECURITY OWNERSHIP OF MANAGEMENT | ||
The following table sets forth information, unless otherwise indicated, as of March 1, 2020, regarding beneficial ownership of our company’s common stock, our only outstanding class of equity securities, by each of our directors, each of our NEOs identified in the Summary Compensation Table on page 45 of this proxy statement, and our directors and executive officers as a group. We believe that, for each of the individuals set forth in the table below, such individual’s financial interest is aligned with the interests of our other shareholders because the value of such individual’s total holdings will increase or decrease in line with the price of our common stock.
| NAME OF BENEFICIAL OWNER |
AMOUNT AND NATURE OF BENEFICIAL OWNERSHIP (# OF SHARES) | |||||||||||||||
|
NON-EMPLOYEE DIRECTORS(1) |
SHARES OWNED DIRECTLY OR INDIRECTLY |
PHANTOM SHARES HELD PURSUANT TO PLANS |
TOTAL | PERCENT OF CLASS |
||||||||||||
|
Melissa H. Anderson |
|
0 |
|
|
0 |
|
|
0 |
|
|
* |
| ||||
| Thomas A. Fanning |
|
0 |
|
|
11,646 |
|
|
11,646 |
|
|
* |
| ||||
| O. B. Grayson Hall, Jr. |
|
0 |
|
|
13,346 |
|
|
13,346 |
|
|
* |
| ||||
| Cynthia L. Hostetler |
|
0 |
|
|
6,686 |
|
|
6,686 |
|
|
* |
| ||||
| Richard T. O’Brien |
|
0 |
|
|
19,375 |
|
|
19,375 |
|
|
* |
| ||||
| James T. Prokopanko |
|
0 |
|
|
17,223 |
|
|
17,223 |
|
|
* |
| ||||
| Kathleen L. Quirk |
|
0 |
|
|
4,610 |
|
|
4,610 |
|
|
* |
| ||||
| David P. Steiner |
|
0 |
|
|
6,357 |
|
|
6,357 |
|
|
* |
| ||||
| Lee J. Styslinger, III |
|
4,002 |
|
|
18,504 |
|
|
22,506 |
|
|
* |
| ||||
| George Willis(2) |
|
0 |
|
|
0 |
|
|
0 |
|
|
* |
| ||||
| CEO AND OTHER NEOS(3) |
SHARES OWNED DIRECTLY OR INDIRECTLY |
EXERCISABLE OPTIONS/ SOSARS |
DEFERRED LTI PAYMENTS |
TOTAL | PERCENT OF CLASS |
|||||||||||||||
| Tom Hill |
|
128,677 |
(4) |
|
138,034 |
|
|
46,690 |
|
|
313,401 |
|
|
* |
| |||||
| Suzanne Wood |
|
473 |
(5) |
|
2,534 |
|
|
0 |
|
|
3,007 |
|
|
* |
| |||||
| Tom Baker |
|
20,410 |
(6) |
|
10,234 |
|
|
0 |
|
|
30,644 |
|
|
* |
| |||||
| Stan Bass |
|
44,066 |
(7) |
|
28,767 |
|
|
40,487 |
|
|
113,320 |
|
|
* |
| |||||
| David Clement |
|
11,077 |
(8) |
|
14,781 |
|
|
4,813 |
|
|
30,671 |
|
|
* |
| |||||
| Michael Mills |
|
21,102 |
(9) |
|
37,000 |
|
|
0 |
|
|
58,102 |
|
|
* |
| |||||
| All Directors and Executive Officers as a group |
|
694,667
|
|
|
0.52
|
%
| ||||||||||||||
| * | Less than 1% of issued and outstanding shares of our company’s common stock. |
| (1) | Beneficial ownership for our non-employee directors includes all shares held of record or in street name and, if noted, by trusts or family members. The amounts also include non-forfeitable phantom shares settled in stock accrued under the Directors’ Deferred Compensation Plan and Deferred Stock Units (DSUs) awarded under the 2006 Plan and the 2016 Plan. |
| (2) | Beneficial ownership for Mr. Willis is shown as of March 11, 2020, the date on which he joined the Board. |
| (3) | Beneficial ownership for the executive officers includes shares held of record or in street name and, if noted, by trusts or family members. The amounts also include shares that may be acquired upon the exercise of options which are presently exercisable or that will become exercisable on or before April 30, 2020, shares credited to the executives’ accounts under our 401(k) Plan and any long-term incentive (LTI) payments from DSUs, Performance Share Units (PSUs) and Restricted Stock Units (RSUs) that may have been deferred into the Executive Deferred Compensation Plan. |
| (4) | Includes 24,786 shares held in 401(k) plan and excess benefit plan. |
| (5) | Includes 473 shares held in 401(k) plan and excess benefit plan. |
| (6) | Includes 1,920 shares held in 401(k) plan and excess benefit plan and 14,375 shares held indirectly in trusts. |
| (7) | Includes 15,804 shares held in 401(k) plan and excess benefit plan. |
| (8) | Includes 3,684 shares held in 401(k) plan and excess benefit plan. |
| (9) | Includes 13 shares held in 401(k) plan and excess benefit plan. |
|
|
2020 PROXY STATEMENT |
|
25 |
| ||||||||
Table of Contents
The table below sets forth information regarding the number of shares of our common stock authorized for issuance under our equity compensation plans as of December 31, 2019.
|
EQUITY COMPENSATION PLAN INFORMATION
|
||||||||||||
| PLAN CATEGORY
|
NUMBER
OF (A)
|
WEIGHTED-
|
NUMBER OF (C)
|
|||||||||
| Equity compensation plans approved by security holders(1): |
||||||||||||
| 2000 Florida Rock Industries Amended & Restated Stock Plan(2) |
||||||||||||
| Stock-Only Stock Appreciation Rights |
|
5,145 |
|
|
$43.05 |
|
||||||
| Total 2000 Florida Rock Industries Amended & Restated Stock Plan |
|
5,145 |
|
|
0(2) |
| ||||||
| 2006 Omnibus Long-Term Incentive Plan(3) |
||||||||||||
| Stock-Only Stock Appreciation Rights |
|
719,120 |
|
|
$64.13 |
|
||||||
| Performance Share Units |
|
131,234 |
|
|||||||||
| Restricted Stock Units |
|
43,917 |
|
|||||||||
| Deferred Stock Units for Non-employee Directors |
|
46,015 |
|
|||||||||
| Total 2006 Omnibus Long-Term Incentive Plan |
|
940,286 |
|
|
0(3) |
| ||||||
| 2016 Omnibus Long-Term Incentive Plan |
||||||||||||
| Stock-Only Stock Appreciation Rights |
|
220,334 |
|
|
$119.10 |
|
||||||
| Performance Share Units |
|
348,966 |
|
|||||||||
| Restricted Stock Units |
|
168,013 |
|
|||||||||
| Deferred Stock Units for Non-employee Directors |
|
35,372 |
|
|||||||||
| Total 2016 Omnibus Long-Term Incentive Plan |
|
772,685 |
|
|
6,753,536 |
| ||||||
| Equity compensation plans not approved by security holders |
|
NONE |
|
|
NONE |
| ||||||
| Total of All Plans |
|
1,718,116 |
|
|
6,753,536 |
| ||||||
| (1) | All of our company’s equity compensation plans have been approved by the shareholders of our company or, in the case of the 2000 Florida Rock Industries Amended & Restated Stock Plan, by the shareholders of Florida Rock Industries, Inc. prior to our acquisition of that company. Column (A) sets forth the number of shares of common stock issuable upon the exercise of options, warrants or rights outstanding under the 2000 Florida Rock Industries Amended & Restated Stock Plan, the 2006 Plan and the 2016 Plan. The weighted-average exercise price of outstanding stock options is shown in Column (B). The remaining number of shares that may be issued under the equity compensation plans are shown in Column (C). |
| (2) | This plan was approved by the shareholders of Florida Rock Industries, Inc. Shares available have been adjusted for the merger transaction. Units were only available for granting of awards until September 30, 2010. Future grants will not be made under this plan. The plan will be used only for the administration and payment of grants that are outstanding. |
| (3) | Future grants will not be made under this plan. The plan will be used only for the administration and payment of grants that were outstanding when the 2016 Plan was approved. |
|
26 |
2020 PROXY STATEMENT |
|
||||||||
Table of Contents
Compensation Discussion and Analysis
| TABLE OF CONTENTS |
||||
|
|
27 |
| ||
|
|
29 |
| ||
|
|
34 |
| ||
|
|
40 |
| ||
|
|
42 |
| ||
|
|
43 |
| ||
The Compensation Discussion and Analysis describes the company’s executive compensation philosophy and programs for our named executive officers (NEOs). The company’s NEOs for 2019 were:
| NAME |
PRINCIPAL POSITION | |
| J. Thomas Hill |
Chairman, President and Chief Executive Officer | |
| Suzanne H. Wood |
Senior Vice President and Chief Financial Officer | |
| Thompson S. Baker, II |
Chief Operating Officer | |
| Stanley G. Bass |
Chief Growth Officer | |
| David P. Clement(1) |
Senior Vice President | |
| Michael R. Mills(2) |
Former Chief Administrative Officer and Secretary | |
| (1) | Although Mr. Clement was an executive officer for only a portion of 2019, he is a named executive officer based on his total compensation for 2019. As he was not a member of the company’s senior leadership team, his compensation was not subject to direct review by the Compensation Committee in 2019. As a result, where there is discussion herein regarding decisions made by the Compensation Committee with respect to the compensation of each of our NEOs, such decisions with respect to Mr. Clement were made by our CEO, using similar principles and practices, pursuant to the authority delegated to him by the Compensation Committee. |
| (2) | Mr. Mills served as our Chief Administrative Officer and Secretary until his retirement effective as of September 15, 2019. |
| OUR MISSION | ||
|
|
|
|
Our mission is to provide quality products and service; to foster the safety, skills and development of our people; to protect the environment; and to create superior, sustainable value for our shareholders. |

|
|
2020 PROXY STATEMENT |
|
27 |
| ||||||||
Table of Contents
COMPENSATION DISCUSSION AND ANALYSIS
| 2019 PERFORMANCE | ||
FINANCIAL PERFORMANCE
The company again delivered strong top and bottom line growth in 2019, together with world-class safety results—a testament to the operating strength of our business and the talent of our people. For the year, we generated double-digit growth in revenues and earnings compared to the prior year, driven by our core aggregates business. Aggregates margins expanded and unit profitability improved again in 2019, and we are confident in our ability to deliver strong results in the future. Our balance sheet is sound, allowing us the flexibility to grow in all parts of our business cycle.

|
|
|
| (1) | 2017 net earnings include discrete income tax benefits of $297.0 million, including benefits arising from the enactment of the Tax Cuts and Jobs Act. |
| (2) | Adjusted EBITDA is a non-GAAP financial measure. We provide a reconciliation of Adjusted EBITDA to the most directly comparable GAAP financial measure in Annex A to this proxy statement. |


|
We believe that safety culture is a leading indicator of a well-run company, and we are committed to continuous improvement on our world-class performance. |
|
28 |
2020 PROXY STATEMENT |
|
||||||||
Table of Contents
COMPENSATION DISCUSSION AND ANALYSIS
Executive Compensation Philosophy
| COMPENSATION PRINCIPLES | ||
The dedication and performance of our employees, including our NEOs, enable us to accomplish our corporate goals. The compensation program for our NEOs is intended to motivate them to achieve Vulcan’s strategic objectives and operational plans while adhering to our high ethical business standards and creating shareholder value.
Vulcan’s executive compensation program is centered on a pay-for-performance philosophy, which aligns executive compensation with shareholder value and ultimately impacts our compensation program design.
|
OUR THREE COMPENSATION PRINCIPLES | ||
| Link a significant portion of compensation to performance. We believe that compensation levels should reflect performance—both Vulcan’s performance and the NEO’s performance. This is accomplished by:
• Motivating, recognizing and rewarding individual excellence
• Paying short-term cash incentives based upon company financial performance and individual performance
• Linking long-term incentives to company stock performance through the use of
Performance Share Units (PSUs), Restricted Stock Units (RSUs) and Stock Only
|
Maintain competitive compensation levels. We strive to offer programs and levels of compensation that are competitive with those offered by industrial companies of similar size, value and complexity in order to attract, retain and reward our NEOs.
Align management’s interests with those of shareholders. Our program encourages NEOs to remain with us and to increase long-term shareholder value by granting long-term equity-based awards each year and tying short-term cash incentives to the achievement of economic profit targets closely aligned with the creation of shareholder value. | |
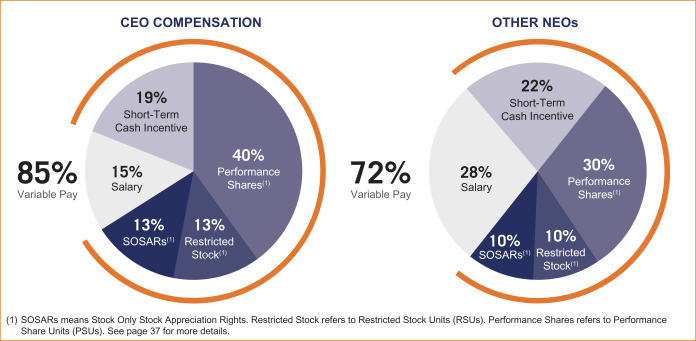
Our NEOs are primarily rewarded through performance-based cash and equity incentive awards, with only a small portion of their overall compensation awarded in the form of base salary. This serves to both encourage and recognize strong company performance and stock price growth, further driving shareholder value.
Long-term equity incentives are awarded through a combination of PSUs, RSUs and SOSARs in order to tie executive compensation more closely to company performance. The diagrams below depict each element of target compensation expressed as a percentage of total target direct compensation for our Chief Executive Officer and other NEOs, expressed as an average, for 2019.

|
|
2020 PROXY STATEMENT |
|
29 |
| ||||||||
Table of Contents
COMPENSATION DISCUSSION AND ANALYSIS
| KEY PAY ELEMENTS | ||
The following chart summarizes the key pay elements for our NEOs. Each element is described in detail beginning on page 34 in the Section “Elements of Compensation.”

|
| * | EBITDA Economic Profit (EBITDA EP) is a non-GAAP financial measure. See Annex A for a reconciliation of non-GAAP financial measures to our results reported under GAAP. |
| SHAREHOLDER ENGAGEMENT AND SAY ON PAY RESULTS | ||
At our 2019 Annual Meeting of Shareholders, over 98% of the votes cast were in favor of the advisory vote to approve the compensation of our NEOs (“Say on Pay” vote). We believe the results of the 2019 Say on Pay vote demonstrate continued strong shareholder support for our current compensation program. Furthermore, during our shareholder engagement discussions over the course of 2019, shareholders were generally supportive of our executive compensation program and the accompanying disclosures.
We recognize, however, that we must always strive for continuous improvement. To that end, acting on some of the advice and guidance that we received in the course of our shareholder outreach efforts, we added our annual average growth rate of Aggregates Cash Gross Profit per ton as a second metric for determining payouts for PSUs granted in 2019.
|
|

|
|
Based on input from our shareholders, we added an additional metric for determining payouts of PSUs granted in 2019 to further align our compensation program with company performance. |
|
30 |
2020 PROXY STATEMENT |
|
||||||||
Table of Contents
COMPENSATION DISCUSSION AND ANALYSIS
| COMPENSATION PRACTICES | ||
Our compensation program incorporates best practices that we believe drive performance, while mitigating risk and aligning the interests of our executives to those of our shareholders. The table below highlights key features of our compensation practices.
|
|
| |
| • Tie pay to performance by ensuring that a significant portion of NEO compensation is variable and performance-based
• Apply a market based approach for determining target compensation
• Utilize PSUs as a substantial portion of long-term incentive awards
• Apply “Double-Trigger” change of control requirement for long-term incentive awards
• Require substantial share ownership under our stock ownership guidelines
• Subject cash and equity-based incentive compensation to a clawback policy
• Consider feedback provided by our shareholders related to executive compensation matters
|
• Provide employment contracts for our executives
• Permit repricing of stock options or SOSARs without shareholder approval
• Allow pledging by our directors and officers of Vulcan shares as collateral for loans or any other purpose
• Permit transactions by our directors and officers intended to hedge or offset the market value of Vulcan stock owned by them
• Provide excessive change of control benefits. Neither our Change of Control Agreements nor our Change of Control Plan provide for:
• “Single-trigger” termination right;
• Inclusion of long-term incentive value in the calculation of cash severance; or
• Excise tax gross-ups
| |
 WHAT WE DO
 WHAT WE DON’T DO
| THE ROLE OF INDIVIDUAL PERFORMANCE | ||
Each NEO’s base salary and annual bonus is determined through thoughtful consideration of individual performance, company performance, competitive market pay and individual responsibilities and experience.
CEO EVALUATION
With respect to our CEO, the independent members of our Board use a formal process for evaluating his performance. Each Board member provides a written evaluation in the areas of leadership, strategic planning, financial performance, safety performance, customer relations, personnel management, communications, board relations and overall performance. In its performance deliberations, the Compensation Committee has access to this input from the full Board and independently assesses the CEO’s performance.
OTHER NEOS EVALUATION
For our NEOs other than our CEO and Mr. Clement, the Compensation Committee reviews performance reports, as prepared by our CEO. Individual performance is based primarily on the extent to which each NEO achieves a series of set goals throughout the period. As described above, decisions regarding Mr. Clement’s compensation were determined by our CEO. Unless otherwise noted below, in setting Mr. Clement’s compensation, our CEO engaged in processes and set compensation parameters similar to those used by the Compensation Committee in setting compensation for our other NEOs.

|
Our compensation program is intended to motivate our NEOs to achieve Vulcan’s strategic goals and operational plans while adhering to our high ethical business standards and creating shareholder value.
|
|
|
2020 PROXY STATEMENT |
|
31 |
| ||||||||
Table of Contents
COMPENSATION DISCUSSION AND ANALYSIS
The following are notable individual accomplishments of each NEO in 2019:
|
Tom Hill CHAIRMAN, PRESIDENT AND CHIEF EXECUTIVE OFFICER |
| Suzanne Wood SENIOR VICE PRESIDENT AND CHIEF FINANCIAL OFFICER |
| Tom Baker CHIEF OPERATING OFFICER |
|
32 |
2020 PROXY STATEMENT |
|
||||||||
Table of Contents
COMPENSATION DISCUSSION AND ANALYSIS
| Stan Bass CHIEF GROWTH OFFICER |
| David Clement SENIOR VICE PRESIDENT |
| Michael Mills FORMER CHIEF ADMINISTRATIVE OFFICER AND SECRETARY |
|
|
2020 PROXY STATEMENT |
|
33 |
| ||||||||
Table of Contents
COMPENSATION DISCUSSION AND ANALYSIS
The elements of our executive compensation program, all of which are discussed in greater detail below, include:
| BASE SALARY | ||
We review the base salaries of the NEOs annually, and also at the time of any promotion or change in responsibilities. The following table sets forth the annual base salary of each of our NEOs as of December 31, 2019, as well as each NEO’s year-over-year percentage increase in base salary:
| NAME |
POSITION | 2018 SALARY | 2019 SALARY | YEAR-OVER- YEAR INCREASE | |||||||||||||
|
Tom Hill
|
Chairman, President and Chief Executive Officer
|
|
$1,100,000
|
|
|
$1,130,000
|
|
|
2.7
|
%
| |||||||
|
Suzanne Wood
|
Senior Vice President and Chief Financial Officer
|
|
$ 650,000
|
|
|
$ 676,000
|
|
|
4.0
|
%
| |||||||
|
Tom Baker(1)
|
Chief Operating Officer
|
|
$ 608,000
|
|
|
$ 664,000
|
|
|
9.2
|
%
| |||||||
|
Stan Bass
|
Chief Growth Officer
|
|
$ 608,000
|
|
|
$ 633,000
|
|
|
4.1
|
%
| |||||||
|
David Clement(2)
|
Senior Vice President
|
|
$ 362,000
|
|
|
$ 400,000
|
|
|
10.5
|
%
| |||||||
|
Michael Mills
|
Former Chief Administrative Officer and Secretary
|
|
$ 608,000
|
|
|
$ 650,000
|
|
|
6.9
|
%
| |||||||
| (1) | Mr. Baker was promoted from Senior Vice President to Chief Operating Officer effective May 1, 2019. |
| (2) | Mr. Clement was promoted from President, Central Division to Senior Vice President effective May 1, 2019. |
|
|
To further our goal of aligning the executives’ interests with those of our shareholders, we generally reward superior performance through our short-term cash incentive program and long-term equity-based incentives rather than through base salary. |
|
34 |
2020 PROXY STATEMENT |
|
||||||||
Table of Contents
COMPENSATION DISCUSSION AND ANALYSIS
| SHORT-TERM PERFORMANCE-BASED INCENTIVE | ||
The table below shows the target bonus, the maximum bonus payable under the EIP, and the actual cash bonus paid to each NEO based on 2019 company and individual performance.
| NAME
|
BASE SALARY
|
“TARGET BONUS”
|
TARGET BONUS
|
MAXIMUM BONUS(1)
|
CASH BONUS PAID BASED
|
|||||||||||||||
|
Tom Hill |
|
$1,130,000 |
|
|
130% |
|
|
$1,469,000 |
|
|
$3,672,500 |
|
|
$2,384,000 |
| |||||
|
Suzanne Wood |
|
$ 676,000 |
|
|
85% |
|
|
$ 574,600 |
|
|
$1,436,500 |
|
|
$ 932,600 |
| |||||
|
Tom Baker |
|
$ 664,000 |
|
|
80% |
|
|
$ 531,200 |
|
|
$1,328,000 |
|
|
$ 862,100 |
| |||||
|
Stan Bass |
|
$ 633,000 |
|
|
80% |
|
|
$ 506,400 |
|
|
$1,266,000 |
|
|
$ 821,900 |
| |||||
|
David Clement |
|
$ 400,000 |
|
|
70% |
|
|
$ 280,000 |
|
|
N/A |
(2) |
|
$ 486,000 |
| |||||
|
Michael Mills(3) |
|
$ 650,000 |
|
|
80% |
|
|
$ 520,000 |
|
|
$1,300,000 |
|
|
$ 844,000 |
| |||||
| (1) | Under the EIP, bonus payments may be up to 4 times each NEO’s target amount (but not to exceed $7 million). However, the amounts in this column equal 2.5 times the NEO’s target bonus, which is the maximum allowed by the Compensation Committee. |
| (2) | Mr. Clement’s bonus is payable under the MIP, which does not provide for a maximum bonus amount. |
| (3) | Mr. Mills received a bonus based on 2019 performance pursuant to the Letter Agreement, dated as of September 3, 2019, setting forth the terms of his retirement from the company effective as of September 15, 2019. |
| * | Cash earnings, EBITDA, Adjusted EBITDA, EBITDA EP and Adjusted EBITDA EP are non-GAAP financial measures. See Annex A for a reconciliation of non-GAAP financial measures to our results reported under GAAP. |
|
|
2020 PROXY STATEMENT |
|
35 |
| ||||||||
Table of Contents
COMPENSATION DISCUSSION AND ANALYSIS
| LONG-TERM EQUITY INCENTIVES | ||
|
36 |
2020 PROXY STATEMENT |
|
||||||||
Table of Contents
COMPENSATION DISCUSSION AND ANALYSIS
Performance Share Units (PSUs)
PSUs, which comprised 60% of each NEO’s target LTI award in 2019, provide an opportunity for our executives to earn Vulcan stock if performance goals established by the Compensation Committee are met over a three-year performance period. For PSUs granted in 2019, performance will be measured 50% based on the company’s total shareholder return (TSR) percentile rank relative to the TSR of the S&P 500, and 50% based on the company’s growth rate of Aggregates Cash Gross Profit per ton, each averaged over the three-year period ending December 31, 2021.
The Compensation Committee chose the S&P 500 as the comparison group for relative TSR performance because it is a broad and stable index group that represents investors’ alternative capital investment opportunities. Vulcan is also a member of the S&P 500. In response to feedback we received from our shareholders, beginning with PSUs granted in 2019, the Compensation Committee added our annual average growth rate of Aggregates Cash Gross Profit per ton as an additional metric for determining payouts. The Compensation Committee believes this additional metric adds balance to our PSU program by including an internal financial measure in combination with our historical use of relative TSR. The Committee views our Aggregates Cash Gross Profit per ton as an important measure of our long-term financial performance that further aligns our compensation program with company performance.
The following table shows the payout percentage of 2019 PSUs that will vest over the three-year period based on potential levels of performance:
PERFORMANCE SHARE UNIT PAYMENT TABLE(1)
| THREE-YEAR AVERAGE TSR PERCENTILE RANK RELATIVE TO S&P 500 INDEX |
% OF PSUs PAYABLE(2) |
ANNUAL AVERAGE GROWTH RATE AGGREGATES CASH GROSS PROFIT(3) PER TON |
% OF PSUs PAYABLE(2) |
|||||||||||
| 75th or greater (Maximum) |
100 |
|
|
|
9.5% or greater (Maximum) |
100 | ||||||||
| 50th (Target) |
50 |
|
|
|
4.5% (Target) | 50 | ||||||||
| 25th (Threshold) |
12.5 |
|
|
|
0.5% (Threshold) | 12.5 | ||||||||
| Less than 25th |
0 |
|
|
|
Less than 0.5% | 0 | ||||||||
| (1) | If the company’s three-year average TSR relative to the S&P 500 Index is at the 50th percentile, one half of the full award is paid. If the company’s three-year average annual growth rate of Aggregates Cash Gross Profit per ton is 4.5%, the remaining one half of the full award is paid. The payout is adjusted incrementally for performance above and below target and can range from 0% to 200%. |
| (2) | Payouts are interpolated for returns between threshold and target, and target and maximum. |
| (3) | Aggregates Cash Gross Profit is a non-GAAP financial measure. See Annex A for a description of how this amount is calculated from our audited financial statements. |
Stock-Only Stock Appreciation Rights (SOSARs)
SOSARs, which comprised 20% of each NEO’s target LTI award in 2019, provide value to the executives only if the market value of our common stock appreciates over time. SOSARs entitle the recipient to receive, at the time of exercise, shares of Vulcan stock with a market value equal to the excess of the market price of Vulcan stock on the date the SOSARs are exercised, over the exercise price (the closing price of Vulcan stock on the date of grant) multiplied by the number of SOSARs exercised. SOSARs have a ten-year term and vest at a rate of one-third annually over the first three years of the term.
Restricted Stock Units (RSUs)
RSUs, which comprised 20% of each NEO’s target LTI award in 2019, provide value through long-term stock price performance, thus aligning the interests of our executives with those of our shareholders. RSUs vest on the third anniversary of the grant date and are then paid in the form of Vulcan common stock.
|
|
2020 PROXY STATEMENT |
|
37 |
| ||||||||
Table of Contents
COMPENSATION DISCUSSION AND ANALYSIS
PAYMENTS OF PRIOR GRANTS
In February 2019, our NEOs received payment for PSUs that were granted in 2015, which vested on December 31, 2018, based on our results relative to the established performance criteria. These PSUs were paid out at 149% of the original grant amount. The PSU payment percentage of 149% was based on TSR performance of our common stock relative to the TSR performance of the companies that comprise the S&P 500 Index during the four-year performance period.
PAYMENT CALCULATION FOR PSUs GRANTED IN 2015 AND PAID FEBRUARY 8, 2019
| NAME |
UNITS GRANTED |
PERCENTAGE |
UNITS |
|||||||||
|
Tom Hill
|
|
30,900
|
|
|
149
|
%
|
|
46,041
|
| |||
|
Suzanne Wood(1)
|
|
0
|
|
|
—
|
|
|
0
|
| |||
|
Tom Baker(2)
|
|
0
|
|
|
—
|
|
|
0
|
| |||
|
Stan Bass
|
|
6,200
|
|
|
149
|
%
|
|
9,238
|
| |||
|
David Clement
|
|
3,300
|
|
|
149
|
%
|
|
4,917
|
| |||
|
Michael Mills
|
|
7,100
|
|
|
149
|
%
|
|
10,579
|
| |||
| (1) | Ms. Wood joined Vulcan in 2018 and therefore did not receive PSUs in 2015. |
| (2) | Mr. Baker rejoined Vulcan in 2017 and therefore did not receive PSUs in 2015. |
| BENEFITS AND PERQUISITES | ||
|
38 |
2020 PROXY STATEMENT |
|
||||||||
Table of Contents
COMPENSATION DISCUSSION AND ANALYSIS
| CHANGE OF CONTROL ARRANGEMENTS | ||
| RETIREMENT BENEFITS | ||
Retirement benefits are an important component of our executive compensation program. We offer employees, including our NEOs, a program that provides the opportunity to accumulate income for retirement. We periodically review our benefits program against our peer group with the goal of ensuring that our program remains competitive. The key components of our retirement program are as follows:
|
BENEFIT
|
BACKGROUND
| |
|
Retirement Plan*
|
The Salaried Pension Plan (Pension Plan) covers all salaried employees of our company hired prior to July 15, 2007. As of December 31, 2013, benefits under the Pension Plan were frozen. The plan was amended to freeze service accruals effective December 31, 2013, and pay accruals effective December 31, 2015.
| |
|
Supplemental Plan*
|
The Vulcan Nonqualified Retirement Plan (Nonqualified Plan) provides for benefits that are curtailed under the Pension Plan and the 401(k) Plan due to Internal Revenue Service pay and benefit limitations for qualified plans. This plan is designed to provide retirement income benefits, as a percentage of pay, that are similar for all employees regardless of compensation levels. The Nonqualified Plan eliminates the effect of tax limitations on the payment of retirement benefits, except to the extent that it is an unfunded plan and a general obligation of our company. As of December 31, 2013, pension plan benefits under the Nonqualified Plan were frozen. The plan was amended to freeze service accruals effective December 31, 2013, and pay accruals effective December 31, 2015. Supplemental 401(k) benefits continue to accrue under this plan.
| |
|
401(k) Plan
|
This plan has two components: (1) an employee contribution feature with company matching and (2) an annual employer contribution.
|
| * | A discussion of all retirement benefits provided to the NEOs is set forth under the heading “Retirement Benefits” beginning on page 50. |
|
|
2020 PROXY STATEMENT |
|
39 |
| ||||||||
Table of Contents
COMPENSATION DISCUSSION AND ANALYSIS
Compensation Decision Approach
|
|
COMPOSED ENTIRELY OF INDEPENDENT DIRECTORS |
The Compensation Committee administers our executive compensation program in accordance with our Compensation Committee Charter. The current charter is available at www.vulcanmaterials.com. On our website, select “Investor Relations,” then “Corporate Governance.” From there, you can visit our “Committees” page, which lists the composition of our board committees as well as their respective charters.
In accordance with our Compensation Committee Charter, the Compensation Committee:
| • | Annually reviews and approves corporate goals and objectives relevant to the CEO’s compensation |
| • | Reviews the CEO’s performance and independent compensation consultant’s recommendations and, accordingly, determines the CEO’s compensation |
| • | Presents the CEO’s overall compensation package to the entire Board of Directors for ratification |
| • | Reviews and sets base salary and short- and long-term incentives for other NEOs |
| • | Monitors market practices and reviews and approves any modifications to the company’s executive compensation program |
| • | Interprets and administers the Executive Incentive Plan, Management Incentive Plan, 2006 Omnibus Long-Term Incentive Plan and 2016 Omnibus Long-Term Incentive Plan |
|
|
MERIDIAN COMPENSATION PARTNERS, LLC (MERIDIAN) |
Meridian is engaged by and reports to the Compensation Committee, and occasionally meets with management to discuss compensation initiatives and issues. Meridian does not provide any other services to the company. The Compensation Committee determined that Meridian’s work as the Compensation Committee’s compensation consultant did not present any conflicts of interest in 2019.
In 2019, Meridian:
| • | Provided the Compensation Committee with observations and recommendations on compensation and benefits for our CEO and other NEOs |
| • | Advised and assisted the Compensation Committee in a review of our peer group for 2019 compensation decisions |
| • | Conducted a benchmarking market study and analysis of executive compensation practices to ensure that our compensation program is reasonable and competitive |
| • | Had representatives attend three meetings of the Compensation Committee in 2019 |
|
|
| • | Management supports the Compensation Committee by providing information and analyses, and occasionally meets with our independent compensation consultant to discuss compensation initiatives and competitive practices |
| • | The CEO is responsible for recommending annual performance goals for each of the other NEOs and for conducting annual performance evaluations against such pre-established goals |
| • | Based on performance and competitive benchmarking reports, the CEO makes recommendations to the Compensation Committee for the compensation of the other NEOs |
|
40 |
2020 PROXY STATEMENT |
|
||||||||
Table of Contents
COMPENSATION DISCUSSION AND ANALYSIS
| BENCHMARKING COMPENSATION AND PEER GROUP DEVELOPMENT | ||
On an annual basis, the Compensation Committee reviews a benchmarking analysis of total compensation for our CEO and other NEOs relative to market data. Our compensation consultant develops market data appropriate for a company of our size using a combination of peer group data and market surveys. The market data, in combination with consideration of each NEO’s experience, responsibilities and performance, assist the Compensation Committee in making informed, market-based decisions regarding our executive pay program.
The Compensation Committee generally targets each element of compensation for our NEOs at the 50th percentile of the market as determined by the benchmarking analysis, subject to individual variation based on the Compensation Committee’s assessment of each executive’s performance, experience and responsibilities as well as internal equity considerations.
PEER GROUP
The Compensation Committee considered several factors in selecting our peer group, including industry (with a focus on construction, materials and mining), revenue size, market capitalization and operating margins. At the end of 2019, our revenues approximated the median of the peer group and our market capitalization was above the 75th percentile. Our peer group for 2019 consisted of the following 27 companies:
|
|
2020 PROXY STATEMENT |
|
41 |
| ||||||||
Table of Contents
Table of Contents
Table of Contents
The Compensation Committee has reviewed and discussed the Compensation Discussion and Analysis as set forth above with management and, based on such review and discussions, recommended to the Board of Directors that the Compensation Discussion and Analysis be included in this proxy statement.
Dated: February 13, 2020
COMPENSATION COMMITTEE
Thomas A. Fanning, Chair
Melissa H. Anderson
James T. Prokopanko
Lee J. Styslinger, III
|
44 |
2020 PROXY STATEMENT |
|
||||||||
Table of Contents
| SUMMARY COMPENSATION TABLE | ||
The following table sets forth, for the three most recently completed fiscal years, information concerning the compensation of our NEOs for the fiscal year ended December 31, 2019:
| NAME AND PRINCIPAL POSITION |
YEAR | SALARY ($) |
BONUS ($) |
STOCK AWARDS(1) ($) |
OPTION AWARDS(1) ($) |
NON-EQUITY COMPENSATION(2) ($) |
CHANGE
IN ($) |
ALL OTHER COMPENSATION(4) ($) |
TOTAL ($) |
|||||||||||||||||||||||||||
| J. Thomas Hill |
||||||||||||||||||||||||||||||||||||
| Chairman, |
2019 | 1,125,000 | — | 3,974,040 | 1,015,290 | 2,384,000 | 713,340 | 344,516 | 9,556,186 | |||||||||||||||||||||||||||
| President and Chief |
2018 | 1,086,667 | — | 3,187,840 | 1,189,184 | 2,021,300 | (121,005 | ) | 317,423 | 7,681,409 | ||||||||||||||||||||||||||
| Executive Officer |
2017 | 1,008,334 | — | 2,808,011 | 1,027,939 | 1,722,000 | 342,036 | 290,918 | 7,199,238 | |||||||||||||||||||||||||||
| Suzanne H. Wood(5) |
||||||||||||||||||||||||||||||||||||
| Senior Vice President |
2019 | 671,667 | — | 1,159,095 | 295,640 | 932,600 | — | 79,037 | 3,138,039 | |||||||||||||||||||||||||||
| and Chief Financial |
2018 | 216,667 | — | 410,200 | — | 270,700 | — | 108,008 | 1,005,575 | |||||||||||||||||||||||||||
| Officer |
|
|
|
|
|
|
|
|
|
|
|
|
|
|
|
|
|
|
|
|
|
|
|
|
|
|
| |||||||||
| Thompson S. Baker(6) |
2019 | 654,667 | — | 982,471 | 252,850 | 862,100 | — | 118,498 | 2,870,586 | |||||||||||||||||||||||||||
| Chief Operating Officer |
2018 | 598,333 | — | 773,520 | 288,552 | 715,000 | — | 85,202 | 2,460,607 | |||||||||||||||||||||||||||
|
|
2017 | 444,384 | — | 646,195 | 236,555 | 577,400 | — | 25,950 | 1,930,484 | |||||||||||||||||||||||||||
| Stanley G. Bass |
2019 | 628,833 | — | 883,120 | 229,510 | 821,900 | 445,056 | 146,103 | 3,154,522 | |||||||||||||||||||||||||||
| Chief Growth |
2018 | 605,000 | — | 773,520 | 288,552 | 965,000 | (107,065 | ) | 137,435 | 2,662,442 | ||||||||||||||||||||||||||
| Officer |
2017 | 583,335 | — | 810,681 | 296,769 | 692,900 | 190,271 | 137,490 | 2,711,446 | |||||||||||||||||||||||||||
| David P. Clement(7) |
2019 | 393,667 | — | 364,287 | 97,250 | 486,000 | 371,859 | 66,483 | 1,779,546 | |||||||||||||||||||||||||||
| Senior Vice President |
||||||||||||||||||||||||||||||||||||
| Michael R. Mills |
||||||||||||||||||||||||||||||||||||
| Former Chief |
2019 | 453,417 | — | 1,501,544 | 344,232 | 844,000 | 481,237 | 326,787 | 3,951,217 | |||||||||||||||||||||||||||
| Administrative Officer |
2018 | 605,000 | — | 773,520 | 288,552 | 715,000 | (109,142 | ) | 129,342 | 2,402,272 | ||||||||||||||||||||||||||
| and Secretary |
2017 | 583,335 | — | 810,681 | 296,769 | 692,900 | 212,111 | 124,842 | 2,720,638 | |||||||||||||||||||||||||||
| (1) | Pursuant to the rules of the SEC, we have provided a grant date fair value for Stock Awards and Option Awards in accordance with the provisions of FASB ASC Topic 718. For Option Awards (including SOSARs), the fair value is estimated as of the date of grant using the Black-Scholes option pricing model, which requires the use of certain assumptions, including the risk-free interest rate, dividend yield, volatility and expected term. The risk-free interest rate is based on the yield at the date of grant of a U.S. Treasury security with a maturity period equal to or approximating the option’s expected term. The dividend yield assumption is based on our historical dividend payouts adjusted for current expectations of future dividend payouts. The volatility assumption is based on the historical volatility, and expectations regarding future volatility, of our common stock over a period equal to the option’s expected term. The expected term of options granted is based on historical experience and expectations about future exercises and represents the period of time that options granted are expected to be outstanding. For Performance Share Units, the fair value is estimated on the date of grant using a Monte Carlo simulation model. For the highest performance level, the maximum number of shares payable and the estimated grant date value are 54,000 shares ($5,961,060) for Mr. Hill; 15,800 shares ($1,744,162) for Ms. Wood; 13,400 shares ($1,479,226) for Mr. Baker; 12,000 shares ($1,324,680) for Mr. Bass; 5,000 shares ($551,950) for Mr. Clement; and 13,000 shares ($2,370,060) for Mr. Mills. Mr. Mills’ expenses reflect the fair values calculated based on the modification date associated with the Letter Agreement, dated as of September 3, 2019, setting forth the terms of his retirement from the company effective as of September 15, 2019. We do not believe that the fair values estimated on the grant date, either by the Black-Scholes model or any other model, are necessarily indicative of the values that might eventually be realized by an executive. |
| (2) | The Executive Incentive Plan (EIP), and with respect to Mr. Clement, Management Incentive Plan (MIP), payments were made on March 12, 2020, for the previous year’s performance. See discussion of the EIP under heading “Compensation Discussion and Analysis” above. |
| (3) | Includes only the amount of change in pension value because our company does not provide any above market earnings on deferred compensation balances. The year over year change in pension value was attributable to two primary factors, which were: (i) aging (one year closer to retirement) and (ii) change in actuarial assumptions (change in interest rate from 4.02% to 2.82%, and mortality table to Pri-2012 Private retirement plan Mortality White Collar Table, adjusted to 2006 base rates, with generational improvements projected using Scale MP-2019). |
| NAME |
AGING (one year closer ($) |
CHANGE IN ASSUMPTIONS ($) |
TOTAL CHANGE |
|||||||||
| Tom Hill |
|
216,045 |
|
|
497,295 |
|
|
713,340 |
| |||
| Suzanne Wood(a) |
|
— |
|
|
— |
|
|
— |
| |||
| Tom Baker(a) |
|
— |
|
|
— |
|
|
— |
| |||
| Stan Bass |
|
107,173 |
|
|
337,883 |
|
|
445,056 |
| |||
| David Clement |
|
84,393 |
|
|
287,466 |
|
|
371,859 |
| |||
| Michael Mills |
|
121,331 |
|
|
359,906 |
|
|
481,237 |
| |||
| (a) | Ms. Wood and Mr. Baker were hired after 2007 and are not eligible to participate in the company’s defined benefit plan. |
|
|
2020 PROXY STATEMENT |
|
45 |
| ||||||||
Table of Contents
EXECUTIVE COMPENSATION
| (4) | Includes qualified defined contribution plan contributions, company-paid life insurance premiums, personal use of company automobile, commuting expenses and personal use of company aircraft, as set forth in the following table. |
| FOOTNOTE 4 Breakout detail of all other compensation shown in table below: |
| NAME |
NON-QUALIFIED PLAN CONTRIBUTIONS ($) |
QUALIFIED 401(K) CONTRIBUTIONS ($) |
COMPANY PAID LIFE INSURANCE PREMIUMS ($) |
PERSONAL USE OF COMPANY AUTOMOBILE ($) |
RELOCATION EXPENSES ($) |
TAXABLE HEALTH CARE |
PERSONAL USE OF COMPANY AIRCRAFT ($) |
TAXABLE LIFE INSURANCE ($) |
RETIREMENT ($) |
TOTAL ($) |
||||||||||||||||||||||||||||||
| Tom Hill |
|
247,838 |
|
|
25,050 |
|
|
1,326 |
|
|
6,215 |
|
|
0 |
|
|
0 |
|
|
64,087 |
|
|
0 |
|
|
0 |
|
|
344,516 |
| ||||||||||
| Suzanne Wood |
|
36,362 |
|
|
23,300 |
|
|
1,326 |
|
|
0 |
|
|
1,285 |
|
|
300 |
|
|
16,464 |
|
|
0 |
|
|
0 |
|
|
79,037 |
| ||||||||||
| Tom Baker |
|
92,122 |
|
|
25,050 |
|
|
1,326 |
|
|
0 |
|
|
0 |
|
|
0 |
|
|
0 |
|
|
0 |
|
|
0 |
|
|
118,498 |
| ||||||||||
| Stan Bass |
|
109,392 |
|
|
25,050 |
|
|
1,326 |
|
|
5,290 |
|
|
0 |
|
|
0 |
|
|
5,045 |
|
|
0 |
|
|
0 |
|
|
146,103 |
| ||||||||||
| David Clement |
|
39,265 |
|
|
25,050 |
|
|
1,326 |
|
|
0 |
|
|
0 |
|
|
0 |
|
|
842 |
|
|
0 |
|
|
0 |
|
|
66,483 |
| ||||||||||
| Michael Mills |
|
87,032 |
|
|
25,050 |
|
|
884 |
|
|
4,756 |
|
|
0 |
|
|
7,337 |
|
|
0 |
|
|
12,145 |
|
|
189,583 |
(a) |
|
326,787 |
| ||||||||||
| (a) | This amount reflects payments made pursuant to the Letter Agreement, dated as of September 3, 2019, setting forth the terms of Mr. Mills’ retirement from the company effective as of September 15, 2019. |
| (5) | Ms. Wood joined Vulcan on September 1, 2018. |
| (6) | Mr. Baker was rehired by Vulcan on March 10, 2017. |
| (7) | Mr. Clement was not a named executive officer for the fiscal years ended December 31, 2018 and December 31, 2017. |
| GRANTS OF PLAN-BASED AWARDS | ||
The following table sets forth the grants of plan-based awards in 2019 to our NEOs:
|
ESTIMATED FUTURE |
ESTIMATED FUTURE |
ALL OTHER STOCK AWARDS: NUMBER OF SHARES OF STOCK OR UNITS (#) |
ALL
OTHER (#) |
EXERCISE OR BASE PRICE OF OPTION AWARDS(1) ($/SH) |
GRANT DATE FAIR VALUE OF STOCK AND OPTION AWARDS(2) ($) |
|||||||||||||||||||||||||||||||||||||||||||||||||||
| NAME |
GRANT DATE |
THRESHOLD ($) |
TARGET ($) |
MAXIMUM ($) |
THRESHOLD (#) |
TARGET (#) |
MAXIMUM (#) |
|||||||||||||||||||||||||||||||||||||||||||||||||
| Tom Hill |
|
2/19/2019 |
|
|
0 |
|
|
1,469,000 |
|
|
3,672,500 |
|
|
0 |
|
|
27,000 |
|
|
54,000 |
|
|
9,000 |
|
|
26,100 |
|
|
113.16 |
|
|
4,989,330 |
||||||||||||||||||||||||
| Suzanne Wood |
|
2/19/2019 |
|
|
0 |
|
|
574,600 |
|
|
1,436,500 |
|
|
0 |
|
|
7,900 |
|
|
15,800 |
|
|
2,600 |
|
|
7,600 |
|
|
113.16 |
|
|
1,454,735 |
| |||||||||||||||||||||||
| Tom Baker |
|
2/19/2019 |
|
|
0 |
|
|
531,200 |
|
|
1,328,000 |
|
|
0 |
|
|
6,700 |
|
|
13,400 |
|
|
2,200 |
|
|
6,500 |
|
|
113.16 |
|
|
1,235,321 |
||||||||||||||||||||||||
| Stan Bass |
|
2/19/2019 |
|
|
0 |
|
|
506,400 |
|
|
1,266,000 |
|
|
0 |
|
|
6,000 |
|
|
12,000 |
|
|
2,000 |
|
|
5,900 |
|
|
113.16 |
|
|
1,112,630 |
||||||||||||||||||||||||
| David Clement |
|
2/19/2019 |
|
|
0 |
|
|
280,000 |
|
|
N/A |
|
|
0 |
|
|
2,500 |
|
|
5,000 |
|
|
800 |
|
|
2,500 |
|
|
113.16 |
|
|
461,537 |
||||||||||||||||||||||||
| Michael Mills |
|
2/19/2019 |
|
|
0 |
|
|
520,000 |
|
|
1,300,000 |
|
|
0 |
|
|
6,500 |
|
|
13,000 |
|
|
2,200 |
|
|
6,300 |
|
|
113.16 |
|
|
1,845,776 |
||||||||||||||||||||||||
| (1) | Exercise price was determined using the closing price of our common stock on the grant date as required under the 2016 Plan. |
| (2) | Amount represents the grant date fair values calculated in accordance with FASB ASC Topic 718. The grant date fair value of $110.39 for the PSUs granted on February 19, 2019, was calculated using a Monte Carlo simulation model. The grant date fair value of $110.39 for the RSUs granted February 19, 2019, reflects the base price of the award adjusted for dividends foregone during the vesting period. The grant date fair value of $38.90 for the SOSARs granted on February 19, 2019, was calculated using a Black-Scholes option pricing model. Fair value was calculated on the number of units granted. The amounts shown for Mr. Mills reflect the fair values calculated based on the modification date associated with the Letter Agreement, dated as of September 3, 2019, setting forth the terms of his retirement from the company effective as of September 15, 2019. |
|
46 |
2020 PROXY STATEMENT |
|
||||||||
Table of Contents
EXECUTIVE COMPENSATION
| OUTSTANDING EQUITY AWARDS AT FISCAL YEAR-END | ||
Certain information concerning unexercised options and stock awards that have not vested for each of the NEOs outstanding as of December 31, 2019, is set forth in the table below:
| OPTION AWARDS | STOCK AWARDS | |||||||||||||||||||||||||||||||||||||||||||
| NAME |
GRANT DATE |
NUMBER
OF (#) EXERCISABLE |
NUMBER
OF (#) UNEXERCISABLE |
EQUITY INCENTIVE PLAN AWARDS: NUMBER OF SECURITIES UNDERLYING UNEXER- CISED UNEARNED OPTIONS (#) |
OPTION ($) |
OPTION EXPIRATION DATE |
NUMBER (#) |
MARKET VALUE OF SHARES OR UNITS OF STOCK THAT HAVE NOT VESTED(12) ($) |
EQUITY (#) |
EQUITY ($) |
||||||||||||||||||||||||||||||||||
| Tom Hill |
|
3/1/2011 |
|
|
4,900 |
|
|
0 |
|
|
43.63 |
|
|
3/1/2021 |
|
|||||||||||||||||||||||||||||
|
|
2/7/2013 |
|
|
7,000 |
|
|
0 |
|
|
55.41 |
|
|
2/7/2023 |
|
||||||||||||||||||||||||||||||
|
|
2/13/2014 |
|
|
12,500 |
|
|
0 |
|
|
66.00 |
|
|
2/13/2024 |
|
||||||||||||||||||||||||||||||
|
|
2/12/2015 |
|
|
30,800 |
|
|
0 |
|
|
79.41 |
|
|
2/12/2025 |
|
||||||||||||||||||||||||||||||
|
|
2/12/2016 |
|
|
24,075(1) |
|
|
8,025 |
|
|
92.02 |
|
|
2/12/2026 |
|
|
42,279(6) |
|
|
6,087,753 |
| ||||||||||||||||||||||||
|
|
2/10/2017 |
|
|
15,934(2) |
|
|
7,966 |
|
|
122.60 |
|
|
2/10/2027 |
|
|
21,725(7) |
|
|
3,128,183 |
| ||||||||||||||||||||||||
|
|
2/23/2018 |
|
|
9,067(4) |
|
|
18,133 |
|
|
121.69 |
|
|
2/23/2028 |
|
|
27,200(8) |
|
|
3,916,528 |
| ||||||||||||||||||||||||
|
|
2/19/2019 |
|
|
0(5) |
|
|
26,100 |
|
|
113.16 |
|
|
2/19/2029 |
|
|
9,000(11) |
|
|
1,295,910 |
|
|
27,000(9) |
|
|
3,887,730 |
| ||||||||||||||||||
| Suzanne Wood |
|
9/4/2018 |
|
|
0 |
|
|
0 |
|
|
0 |
|
|
n/a |
|
|
3,500(10) |
|
|
503,965 |
|
|||||||||||||||||||||||
|
|
2/19/2019 |
|
|
0 |
|
|
7,600 |
|
|
113.16 |
|
|
2/19/2029 |
|
|
2,600(11) |
|
|
374,374 |
|
|
7,900(9) |
|
|
1,137,521 |
| ||||||||||||||||||
| Tom Baker |
|
3/13/2017 |
|
|
3,667(3) |
|
|
1,833 |
|
|
119.59 |
|
|
3/13/2027 |
|
|
5,000(7) |
|
|
719,950 |
| |||||||||||||||||||||||
|
|
2/23/2018 |
|
|
2,200(4) |
|
|
4,400 |
|
|
121.69 |
|
|
2/23/2028 |
|
|
6,600(8) |
|
|
950,334 |
| ||||||||||||||||||||||||
|
|
2/19/2019 |
|
|
0(5) |
|
|
6,500 |
|
|
113.16 |
|
|
2/19/2029 |
|
|
2,200(11) |
|
|
316,778 |
|
|
6,700(9) |
|
|
964,733 |
| ||||||||||||||||||
| Stan Bass |
|
2/12/2015 |
|
|
6,200 |
|
|
0 |
|
|
79.41 |
|
|
2/12/2025 |
|
|||||||||||||||||||||||||||||
|
|
2/12/2016 |
|
|
6,975(1) |
|
|
2,325 |
|
|
92.02 |
|
|
2/12/2026 |
|
|
12,211(6) |
|
|
1,758,262 |
| ||||||||||||||||||||||||
|
|
2/10/2017 |
|
|
4,600(2) |
|
|
2,300 |
|
|
122.60 |
|
|
2/10/2027 |
|
|
6,272(7) |
|
|
903,105 |
| ||||||||||||||||||||||||
|
|
2/23/2018 |
|
|
2,200(4) |
|
|
4,400 |
|
|
121.69 |
|
|
2/23/2028 |
|
|
6,600(8) |
|
|
950,334 |
| ||||||||||||||||||||||||
|
|
2/19/2019 |
|
|
0(5) |
|
|
5,900 |
|
|
113.16 |
|
|
2/19/2029 |
|
|
2,000(11) |
|
|
287,980 |
|
|
6,000(9) |
|
|
863,940 |
| ||||||||||||||||||
| David Clement |
|
2/07/2013 |
|
|
1,080 |
|
|
0 |
|
|
55.41 |
|
|
2/7/2023 |
|
|||||||||||||||||||||||||||||
|
|
2/13/2014 |
|
|
3,600 |
|
|
0 |
|
|
66.00 |
|
|
2/13/2024 |
|
||||||||||||||||||||||||||||||
|
|
2/12/2015 |
|
|
3,300 |
|
|
0 |
|
|
79.41 |
|
|
2/12/2025 |
|
||||||||||||||||||||||||||||||
|
|
2/12/2016 |
|
|
2,100(1) |
|
|
700 |
|
|
92.02 |
|
|
2/12/2026 |
|
|
3,676(6) |
|
|
529,307 |
| ||||||||||||||||||||||||
|
|
2/10/2017 |
|
|
1,267(2) |
|
|
633 |
|
|
122.60 |
|
|
2/10/2027 |
|
|
1,727(7) |
|
|
248,671 |
| ||||||||||||||||||||||||
|
|
2/23/2018 |
|
|
634(4) |
|
|
1,266 |
|
|
121.69 |
|
|
2/23/2028 |
|
|
1,900(8) |
|
|
273,581 |
| ||||||||||||||||||||||||
|
|
2/19/2019 |
|
|
0(5) |
|
|
2,500 |
|
|
113.16 |
|
|
2/19/2029 |
|
|
800(11) |
|
|
115,192 |
|
|
2,500(9) |
|
|
359,975 |
| ||||||||||||||||||
| Michael Mills |
|
2/13/2014 |
|
|
7,200 |
|
|
0 |
|
|
66.00 |
|
|
2/13/2024 |
|
|||||||||||||||||||||||||||||
|
|
2/12/2015 |
|
|
7,100 |
|
|
0 |
|
|
79.41 |
|
|
2/12/2025 |
|
||||||||||||||||||||||||||||||
|
|
2/12/2016 |
|
|
6,975(1) |
|
|
2,325 |
|
|
92.02 |
|
|
2/12/2026 |
|
|
12,211(6) |
|
|
1,758,262 |
| ||||||||||||||||||||||||
|
|
2/10/2017 |
|
|
4,600(2) |
|
|
2,300 |
|
|
122.60 |
|
|
2/10/2027 |
|
|
6,272(7) |
|
|
903,105 |
| ||||||||||||||||||||||||
|
|
2/23/2018 |
|
|
2,200(4) |
|
|
4,400 |
|
|
121.69 |
|
|
2/23/2028 |
|
|
6,600(8) |
|
|
950,334 |
| ||||||||||||||||||||||||
|
|
2/19/2019 |
|
|
0(5) |
|
|
6,300 |
|
|
113.16 |
|
|
2/19/2029 |
|
|
2,110(11) |
|
|
303,819 |
|
|
6,500(9) |
|
|
935,935 |
| ||||||||||||||||||
|
|
2020 PROXY STATEMENT |
|
47 |
| ||||||||
Table of Contents
EXECUTIVE COMPENSATION
Options in footnote 1 vest at a rate of 25% per year in years 1 – 4.
| (1) | Options (SOSARs) with vesting dates 2/12/2017, 2/12/2018, 2/12/2019, and 2/12/2020. |
Options in footnote 2, 3, 4, and 5 vest at a rate of 33.3% per year in years 1 – 3.
| (2) | Options (SOSARs) with vesting dates 2/10/2018, 2/10/2019, 2/10/2020. |
| (3) | Options (SOSARs) with vesting dates 3/13/2018, 3/13/2019, 3/13/2020. |
| (4) | Options (SOSARs) with vesting dates 2/23/2019, 2/23/2020, 2/23/2021. |
| (5) | Options (SOSARs) with vesting dates 2/19/2020, 2/19/2021, 2/19/2022. |
PSUs in footnote 6 cliff vest 100% after a four-year performance period.
| (6) | PSUs with vesting date of 12/31/2019. |
PSUs in footnote 7, 8, and 9 cliff vest 100% after a three-year performance period.
| (7) | PSUs with vesting date of 12/31/2019. |
| (8) | PSUs with vesting date of 12/31/2020. |
| (9) | PSUs with vesting date of 12/31/2021. |
| (10) | RSUs cliff vest 100% after a three-year period, with a vesting date of 9/4/2021. |
| (11) | RSUs cliff vest 100% after a three-year period, with a vesting date of 2/19/2022. |
| (12) | Based on closing price of our common stock on the NYSE on 12/31/2019, $143.99. |
| (13) | Vested PSUs adjusted for company performance through 12/31/2019. Unvested PSUs reported at target. |
| DEFERRED COMPENSATION PLAN | ||
Our Executive Deferred Compensation Plan was established in 1998 to allow executives to defer a portion of their current year’s compensation in a tax-efficient manner. We believe that providing a tax deferral plan gives our executives flexibility in tax and financial planning and provides an additional benefit at little cost to our shareholders. Our company does not make any contributions to the plan on behalf of the participants, and the only costs to the company related to the plan are administrative costs and any contributions that may be necessary to true-up account balances based on the results of the participants’ deemed investment elections. The plan allows executives with annual compensation (base salary and target annual short-term incentive) of $200,000 or more to defer receipt of up to 50% of their base salary, up to 90% of their annual cash incentive and up to 100% (net of FICA and any applicable local taxes) of their long-term incentive awards, which are not excluded from deferral eligibility by the Code (or regulations thereunder), until a date selected by the participant. The amounts deferred are deemed invested as designated by participants in our company’s common stock (a “phantom stock” account) or in dollar-denominated accounts that mirror the gains or losses of the various investment options available under our company’s 401(k) plan. The plan does not offer any guaranteed return to participants.
The plan is funded by a “rabbi trust” arrangement owned by our company, which holds assets that correspond to the deemed investments of the plan participants and pays benefits at the times elected by the participants. Participants have an unsecured contractual commitment from our company for payment when the amounts accrue. Upon the death or disability of a participant or upon a change of control, all deferred amounts and all earnings related thereto will be paid to the participant or participant’s beneficiaries in a single lump sum cash payment.
Effective for deferrals made after January 1, 2007, the plan permits executives to defer payouts of PSUs and RSUs into the plan, which would, absent such deferral, be distributed to the executives and immediately taxable. The PSU and RSU deferrals generally will be credited to the plan participant accounts in the form of phantom stock, which may not be reallocated to an alternative investment option while in the plan, and an equal number of shares of our common stock will be deposited by our company into the rabbi trust.
|
48 |
2020 PROXY STATEMENT |
|
||||||||
Table of Contents
EXECUTIVE COMPENSATION
The following table shows the contributions, earnings, distributions and year-end account values for the NEOs under the plan for the fiscal year ended December 31, 2019:
|
NONQUALIFIED DEFERRED COMPENSATION PLAN
|
||||||||||||||||||||
| NAME
|
EXECUTIVE
|
REGISTRANT
|
AGGREGATE
|
AGGREGATE
|
AGGREGATE
|
|||||||||||||||
| Tom Hill |
|
0 |
|
|
0 |
|
|
442,317 |
|
0 |
|
|
1,445,020 |
| ||||||
| Suzanne Wood |
|
0 |
|
|
0 |
|
|
0 |
|
|
0 |
|
|
0 |
| |||||
| Tom Baker |
|
0 |
|
|
0 |
|
|
0 |
|
|
0 |
|
|
0 |
| |||||
| Stan Bass |
|
2,833,231 |
|
|
0 |
|
|
1,081,588 |
|
|
(1,077,285 |
) |
|
4,804,867 |
| |||||
| David Clement |
|
485,668 |
|
|
0 |
|
|
274,579 |
|
|
0 |
|
|
907,704 |
| |||||
| Michael Mills |
|
0 |
|
|
0 |
|
|
0 |
|
|
0 |
|
|
0 |
| |||||
| (1) | Includes both the executive contributions and the earnings on those contributions. Cash-based salary and cash annual bonus amounts contributed by the executives are included in the amounts reported in the Summary Compensation Table in the year of deferral. PSU and RSU deferrals are included as compensation in the year of the grant. Above-market earnings are not reported as our company does not provide for such earnings on deferred compensation. |
| OPTION EXERCISES AND STOCK VESTED | ||
Certain information concerning each exercise of stock options and each vesting of stock during the fiscal year ended December 31, 2019, for each of the NEOs on an aggregate basis is set forth in the table below:
| NAME
|
OPTION AWARDS |
STOCK AWARDS |
||||||||||||||||||
|
NUMBER OF SHARES
|
VALUE REALIZED ON
|
NUMBER OF SHARES
|
VALUE REALIZED
|
|||||||||||||||||
| Tom Hill |
|
15,485 |
|
|
1,099,114 |
|
|
46,041 |
|
|
4,689,736 |
| ||||||||
| Suzanne Wood |
|
0 |
|
|
0 |
|
|
0 |
|
|
0 |
| ||||||||
| Tom Baker |
|
0 |
|
|
0 |
|
|
0 |
|
|
0 |
| ||||||||
| Stan Bass |
|
28,900 |
|
|
2,663,375 |
|
|
23,238 |
|
|
2,435,623 |
| ||||||||
| David Clement |
|
7,320 |
|
|
512,365 |
|
|
4,917 |
|
|
500,846 |
| ||||||||
| Michael Mills |
|
16,100 |
|
|
1,467,469 |
|
|
10,669 |
|
|
1,090,304 |
| ||||||||
| (1) | Calculated by multiplying the difference between the fair market value of our common stock on the date of exercise and the option exercise price by the number of options exercised. |
| (2) | Represents the payment of PSUs and RSUs. |
| (3) | For PSUs, calculated by multiplying the number of units vested by the closing price of our common stock on February 7, 2019 as approved by the Compensation Committee. For RSUs, calculated by multiplying the number of units vested by the closing price of our common stock on the vest date. |
|
|
2020 PROXY STATEMENT |
|
49 |
| ||||||||
Table of Contents
EXECUTIVE COMPENSATION
| RETIREMENT BENEFITS | ||
Generally, most full-time salaried employees of our company that were hired prior to July 15, 2007, including Messrs. Hill, Bass, Clement and Mills, participate in our company’s pension plans. Our NEOs are also eligible for nonqualified retirement benefits, as described below. Retirement benefits become payable as early as the date on which participants both attain age 55 and complete one year of service.
The following table provides, for each NEO, the number of years of credited service and the present value of accumulated benefits as of December 31, 2019, under each plan in which the NEO participates. The narrative that follows this table provides a description of the material features of each plan.
|
RETIREMENT BENEFITS
|
||||||||||||||
| NAME
|
PLAN NAME
|
NUMBER OF YEARS OF (#)
|
PRESENT VALUE OF ($)
|
PAYMENTS DURING
|
||||||||||
|
Tom Hill |
Pension Plan | 23 3/12 | 1,409,079 | 0 | ||||||||||
| Nonqualified Plan
|
|
23 3/12
|
|
|
4,678,512
|
|
|
0
|
| |||||
|
Suzanne Wood |
Pension Plan | n/a | n/a | 0 | ||||||||||
| Nonqualified Plan
|
|
n/a
|
|
|
n/a
|
|
|
0
|
| |||||
|
Tom Baker |
Pension Plan | n/a | n/a | 0 | ||||||||||
| Nonqualified Plan
|
|
n/a
|
|
|
n/a
|
|
|
0
|
| |||||
|
Stan Bass |
Pension Plan | 17 7/12 | 1,018,928 | 0 | ||||||||||
| Nonqualified Plan
|
|
17 7/12
|
|
|
2,077,991
|
|
|
0
|
| |||||
|
David Clement |
Pension Plan | 21 9/12 | 1,258,872 | 0 | ||||||||||
| Nonqualified Plan
|
|
21 9/12
|
|
|
1,212,336
|
|
|
0
|
| |||||
|
Michael Mills |
Pension Plan | 22 9/12 | 1,327,564 | 0 | ||||||||||
| Nonqualified Plan
|
|
22 9/12
|
|
|
2,171,847
|
|
|
0
|
| |||||
| (1) | The present values of accumulated benefits are based on benefits payable at age 62, the earliest age under the plans at which benefits are not reduced, or current age if the participant is older than age 62. The following FASB ASC Topic 715 “Compensation—Retirement Benefits” assumptions as of December 31, 2019, were used to determine the present values: |
| (i) | discount rate of 2.82%; |
| (ii) | mortality based on the Pri-2012, White Collar Tables, and generational scale MP-2019; |
| (iii) | present values for lump sums are based on projected segmented interest rates and the prescribed 2019 IRS Mortality Table; |
| (iv) | Nonqualified Plan benefits assumed to be paid as a 10 Year Certain Annuity; and |
| (v) | for the Salaried Pension Plan, 40% of the benefit accrued before December 31, 2001, is assumed to be paid as a lump sum, with the remainder of the accrued benefit assumed to be paid as a single life annuity. |
|
50 |
2020 PROXY STATEMENT |
|
||||||||
Table of Contents
Table of Contents
EXECUTIVE COMPENSATION
TERMINATION PAY AND BENEFITS PROGRAMS
The following chart describes the treatment of different compensation and benefit elements in connection with the aforementioned employment termination events for NEOs:
| PROGRAM |
RETIREMENT/ RETIREMENT ELIGIBLE |
INVOLUNTARY TERMINATION NOT FOR CAUSE |
RESIGNATION | DEATH OR DISABILITY |
INVOLUNTARY TERMINATION FOR CAUSE | |||||
|
Retirement: • Pension Plan • Nonqualified Plan |
Participant may commence benefit payment |
Participant is considered Terminated Vested(1) |
Participant is considered Terminated Vested(1) |
In death, spouse may commence survivor benefit on or after the date that the Participant would have attained age 55
|
Participant may commence benefit payment or will be Terminated Vested(1) depending on age | |||||
|
Executive Deferred Compensation Plan |
Payment made in accordance with deferral election |
Payout made the year following the year of termination in a lump sum |
Payout made the year following the year of termination in a lump sum |
Payout made the year following the year of death or termination in a lump sum
|
Payout made the year following the year of termination in a lump sum | |||||
|
EIP |
Eligible to receive prorated payment
|
No payment |
No payment |
Eligible to receive prorated payment |
No payment | |||||
|
Stock Options/ SOSARs |
Full term to exercise vested options; if 62 or older, non-vested options continue to vest; for early retirement prior to age 62, a pro-rata share of options become non-forfeitable and continue to vest; noncompetition agreement may be required
|
Non-vested options forfeited; 30 days to exercise vested options |
Non-vested options forfeited; 30 days to exercise vested options |
Vesting accelerated; in death, estate has one year to exercise; in disability, have full remaining term to exercise |
Forfeit all, vested and non-vested | |||||
|
PSUs |
If age 62 or older, award becomes non-forfeitable; if age 55 – 61, a pro-rata share of the award becomes non-forfeitable; noncompetition agreement may be required
|
Non-vested units are forfeited |
Non-vested units are forfeited |
Award non-forfeitable; in death, vesting is accelerated |
Forfeit all, vested but not released and non-vested | |||||
|
RSUs |
If age 62 or older, vesting is accelerated; if age 55-61, pro-rata vesting; noncompetition agreement may be required
|
Non-vested units are forfeited |
Non-vested units are forfeited |
Vesting is accelerated |
Forfeit all, vested but not released and non-vested | |||||
|
401(k) Plan |
May take distribution or defer until age 72 |
May take distribution or defer until age 72 |
May take distribution or defer until age 72 |
Beneficiary may take distribution or defer until age 72
|
May take distribution or defer until age 72 | |||||
|
Nonqualified Plan (Defined Contribution) |
May take distribution or defer until age 72 |
May take distribution or defer until age 72 |
May take distribution or defer until age 72 |
Account distributed by March 1 of the following year
|
May take distribution or defer until age 72 | |||||
|
Severance Benefits |
None |
None |
None |
None
|
None | |||||
|
Health Benefits |
May continue to age 65 if eligibility rules are met |
Coverage ceases; eligible for coverage extension under COBRA |
Coverage ceases; eligible for coverage extension under COBRA |
3 months spousal extension, then COBRA; if eligibility rules are met may continue up to age 65
|
Coverage ceases; eligible for coverage extension under COBRA | |||||
| (1) | “Terminated Vested” means the participant is no longer employed with our company but continues to have a vested interest in the applicable plan. |
|
52 |
2020 PROXY STATEMENT |
|
||||||||
Table of Contents
EXECUTIVE COMPENSATION
The table below reflects an estimate of the severance payments that would be made to our NEOs if they were terminated as of December 31, 2019, in connection with a COC:
| NAME |
SEVERANCE MULTIPLE |
2019 BASE SALARY |
GREATER OF ($) |
TOTAL CASH SEVERANCE PAYMENTS ($) |
PRO-RATA ($) |
CASH SEVERANCE AMOUNT(1) ($) |
||||||||||||||||||
|
Tom Hill |
3 | 1,130,000 | 2,183,100 | 9,939,300 | 2,183,100 | 12,122,400 | ||||||||||||||||||
|
Suzanne Wood |
3 | 676,000 | 574,600 | 3,751,800 | 574,600 | 4,326,400 | ||||||||||||||||||
|
Tom Baker |
3 | 664,000 | 646,200 | 3,930,600 | 646,200 | 4,576,800 | ||||||||||||||||||
|
Stan Bass |
3 | 633,000 | 849,967 | 4,448,900 | 849,967 | 5,298,867 | ||||||||||||||||||
|
David Clement |
2.5 | 400,000 | 323,200 | 1,808,000 | 323,200 | 2,131,200 | ||||||||||||||||||
| (1) | These amounts represent cash severance payments to be paid to the NEOs under the COC Agreements and for Mr. Clement, the COC Plan, in the event of a COC and do not include the value of other COC benefits. |
|
|
2020 PROXY STATEMENT |
|
53 |
| ||||||||
Table of Contents
EXECUTIVE COMPENSATION
CHANGE OF CONTROL PAY AND BENEFITS PROGRAMS
The following table describes treatment of payments under the compensation and benefit programs upon a COC, and upon an employment termination (voluntary or involuntary) upon a COC:
| PLAN OR PROGRAM |
COC |
COC WITH TERMINATION (OTHER THAN CAUSE) | ||
| Retirement: • Pension Plan • Nonqualified Plan |
No payment to NEOs solely upon the COC | No payment to NEOs solely upon the COC | ||
| Executive Deferred Compensation Plan |
Accelerate all deferred amounts and pay lump sum within 10 business days | Accelerate all deferred amounts and pay lump sum within 10 business days | ||
| EIP |
The amount paid will be equal to the greater of (i) the average bonus during the three preceding years or (ii) the target bonus; or the bonus determined under the Plan for the year in which the COC occurs | The amount paid will be equal to the greater of (i) the average bonus during the three preceding years or (ii) the target bonus or the bonus determined under the Plan for the year in which the COC occurs | ||
|
SOSARs(1) |
No accelerated vesting unless awards are not assumed, substituted or continued by the surviving company, otherwise continued vesting; remaining term to exercise | If awards are assumed, substituted or continued by the surviving company, immediately deemed fully vested and exercisable; remaining term to exercise | ||
|
PSUs(1) |
No accelerated vesting unless awards are not assumed, substituted or continued by the surviving company, otherwise continued vesting; pay within 21/2 months of vesting | If awards are assumed, substituted or continued by the surviving company, vesting is accelerated; pay within 21/2 months after end of the year in which the COC occurs | ||
|
RSUs(1) |
No accelerated vesting unless awards are not assumed, substituted or continued by the surviving company, otherwise continued vesting; pay within 90 days of vesting | If awards are assumed, substituted or continued by the surviving company, all immediately deemed vested; pay within 90 days following the COC | ||
| 401(k) Plan |
No payment to the NEOs solely upon the COC | Service ceases except to the extent that additional service is provided under the terms of the COC Agreements; participant is eligible for a distribution | ||
| Nonqualified Plan (Defined Contribution) |
No payment to the NEOs solely upon the COC | Participant is eligible for a distribution | ||
| Severance Benefits |
No payment to the NEOs solely upon the COC | Under the COC Agreements, payment is 3 times the NEO’s annual base salary and short-term bonus(2) | ||
| Health Benefits |
No payment to the NEOs solely upon the COC | 3 year coverage extension provided under the terms of the COC Agreements (2) | ||
| (1) | The vesting and payment benefits shown in this table relate to awards of SOSARs, PSUs and RSUs granted under the 2016 Plan, which contains a “double-trigger” change of control requirement. Awards granted under the 2006 Plan would immediately vest, SOSARs would have the remaining term to exercise, PSUs would be paid within 21/2 months after the end of the year in which the COC occurs and RSUs would be paid within 90 days following the COC. |
| (2) | The terms of the COC Plan, to which Mr. Clement is subject, provide for payment of 2.5 times the sum of the base salary and short-term bonus and a 30-month health benefit coverage extension. |
|
54 |
2020 PROXY STATEMENT |
|
||||||||
Table of Contents
EXECUTIVE COMPENSATION
RETIREMENT AND PENSION BENEFITS
RETIREMENT BENEFITS AND DEFINED CONTRIBUTION TABLE
| NAME |
|
RETIREMENT (MONTHLY PAYMENTS) ($) |
RESIGNATION OR INVOLUNTARY (MONTHLY PAYMENTS) ($) |
DEATH (MONTHLY ($) |
COC (VALUE OF ENHANCED BENEFITS)(1) ($) |
|||||||||||||
| Tom Hill |
Pension Plan | 6,498 | Terminated Vested | (2) | 4,224 | 0 | ||||||||||||
| Nonqualified Plan | 30,712 | Terminated Vested | (2) | 19,963 | 0 | |||||||||||||
| Defined Contribution | 0 | None | 0 | 894,537 | ||||||||||||||
| Suzanne Wood |
Pension Plan | n/a | n/a | (3) | n/a | n/a | ||||||||||||
| Nonqualified Plan | n/a | n/a | (3) | n/a | n/a | |||||||||||||
| Defined Contribution | 0 | None | 0 | 337,662 | ||||||||||||||
| Tom Baker |
Pension Plan | n/a | n/a | (3) | n/a | n/a | ||||||||||||
| Nonqualified Plan | n/a | n/a | (3) | n/a | n/a | |||||||||||||
| Defined Contribution | 0 | None | 0 | 353,754 | ||||||||||||||
| Stan Bass |
Pension Plan | 4,177 | Terminated Vested | (2) | 2,715 | 0 | ||||||||||||
| Nonqualified Plan | 12,210 | Terminated Vested | (2) | 7,936 | 0 | |||||||||||||
| Defined Contribution | 0 | None | 0 | 400,401 | ||||||||||||||
| David Clement |
Pension Plan | 5,291 | Terminated Vested | (2) | 3,439 | n/a | ||||||||||||
| Nonqualified Plan | 7,306 | Terminated Vested | (2) | 4,749 | n/a | |||||||||||||
| Defined Contribution | 0 | None | 0 | 162,720 | ||||||||||||||
| (1) | Value of defined contribution enhancement is payable in a lump sum in the event of a COC. The defined contribution amounts represent 3 years of company matching contributions for each executive except 2.5 years for Mr. Clement. |
| (2) | Eligible for reduced payments as early as age 55 and unreduced payments at age 62. |
| (3) | Participation in the Pension Plan, including the Nonqualified Plan, was frozen in 2007. Therefore, Ms. Wood and Mr. Baker are not eligible to participate in that Plan. |
|
|
2020 PROXY STATEMENT |
|
55 |
| ||||||||
Table of Contents
EXECUTIVE COMPENSATION
PERFORMANCE SHARE UNITS (PSUs)
The chart below shows the number of PSUs for which vesting would be accelerated under certain events. Unvested PSUs were adjusted to the maximum allowed under the agreements because the performance was unknown at December 31, 2019.
| RETIREMENT | COC (WITH OR WITHOUT TERMINATION) | |||||||||||||||||||
| NAME |
NUMBER OF PERFORMANCE SHARE UNITS WITH ACCELERATED VESTING |
TOTAL NUMBER OF PERFORMANCE SHARE UNITS FOLLOWING ACCELERATED VESTING |
|
NUMBER OF PERFORMANCE SHARE UNITS WITH ACCELERATED VESTING |
TOTAL NUMBER OF PERFORMANCE SHARE UNITS FOLLOWING ACCELERATED VESTING |
|||||||||||||||
| Tom Hill |
|
54,267 |
|
|
118,271 |
|
|
108,400 |
|
|
172,404 |
| ||||||||
| Suzanne Wood |
|
5,267 |
|
|
5,267 |
|
|
15,800 |
|
|
15,800 |
| ||||||||
| Tom Baker |
|
13,267 |
|
|
18,267 |
|
|
26,600 |
|
|
31,600 |
| ||||||||
| Stan Bass |
|
12,800 |
|
|
31,283 |
|
|
25,200 |
|
|
43,683 |
| ||||||||
| David Clement |
|
4,200 |
|
|
9,603 |
|
|
8,800 |
|
|
14,203 |
| ||||||||
STOCK ONLY STOCK APPRECIATION RIGHTS (SOSARs)
The chart below shows the number of SOSARs for which vesting would be accelerated under certain events:
| RETIREMENT | COC (WITH OR WITHOUT TERMINATION) | |||||||||||||||||||
| NAME |
NUMBER OF SOSARS WITH ACCELERATED VESTING |
TOTAL NUMBER OF SOSARS FOLLOWING |
|
NUMBER OF SOSARS WITH ACCELERATED VESTING |
TOTAL NUMBER OF SOSARS FOLLOWING |
|||||||||||||||
| Tom Hill |
|
33,759 |
|
|
138,035 |
|
|
60,224 |
|
|
164,500 |
| ||||||||
| Suzanne Wood |
|
2,533 |
|
|
2,533 |
|
|
7,600 |
|
|
7,600 |
| ||||||||
| Tom Baker |
|
6,200 |
|
|
12,067 |
|
|
12,733 |
|
|
18,600 |
| ||||||||
| Stan Bass |
|
8,792 |
|
|
28,767 |
|
|
14,925 |
|
|
34,900 |
| ||||||||
| David Clement |
|
2,799 |
|
|
14,780 |
|
|
5,099 |
|
|
17,080 |
| ||||||||
RESTRICTED STOCK UNITS (RSUs)
The chart below shows the number of RSUs for which vesting would be accelerated under certain events:
|
|
RETIREMENT |
|
COC (WITH OR WITHOUT TERMINATION) | |||||||||||||||||
| NAME |
NUMBER OF RESTRICTED STOCK UNITS WITH ACCELERATED VESTING |
TOTAL NUMBER OF RESTRICTED STOCK UNITS FOLLOWING ACCELERATED VESTING |
|
NUMBER OF RESTRICTED STOCK UNITS WITH ACCELERATED VESTING |
TOTAL NUMBER OF RESTRICTED STOCK UNITS FOLLOWING ACCELERATED VESTING |
|||||||||||||||
| Tom Hill |
|
0 |
|
|
0 |
|
|
9,000 |
|
|
9,000 |
| ||||||||
| Suzanne Wood |
|
1,167 |
|
|
1,167 |
|
|
6,100 |
|
|
6,100 |
| ||||||||
| Tom Baker |
|
0 |
|
|
0 |
|
|
2,200 |
|
|
2,200 |
| ||||||||
| Stan Bass |
|
0 |
|
|
0 |
|
|
2,000 |
|
|
2,000 |
| ||||||||
| David Clement |
|
0 |
|
|
0 |
|
|
800 |
|
|
800 |
| ||||||||
EXECUTIVE DEFERRED COMPENSATION PLAN
The aggregate balances reported in the Nonqualified Deferred Compensation Plan Table would be payable to the NEOs as described in the “Termination Pay and Benefits Programs” and “Change of Control Pay and Benefits Programs” charts above. There is no enhancement or acceleration of payments under this plan associated with termination or COC events, other than the lump sum payment opportunity described in the above charts. The lump sums that would be payable are those that are reported in the Nonqualified Deferred Compensation Plan Table.
|
56 |
2020 PROXY STATEMENT |
|
||||||||
Table of Contents
Table of Contents
Table of Contents
DIRECTOR COMPENSATION
| DIRECTOR SUMMARY COMPENSATION TABLE | ||
The table below summarizes the compensation paid by our company to non-employee directors for the fiscal year ended December 31, 2019:
| NAME |
FEES EARNED OR PAID IN CASH ($) |
STOCK AWARDS(2) ($) |
OPTION AWARDS ($) |
NON-EQUITY PLAN ($) |
CHANGE IN ($) |
ALL OTHER COMPEN- SATION(3) ($) |
TOTAL ($) |
|||||||||||||||||||||
| Melissa H. Anderson(1) |
|
55,000 |
|
|
0 |
|
|
0 |
|
|
0 |
|
|
0 |
|
|
0 |
|
|
55,000 |
| |||||||
| Thomas A. Fanning |
|
130,000 |
|
|
150,215 |
|
|
0 |
|
|
0 |
|
|
0 |
|
|
7,883 |
|
|
288,098 |
| |||||||
| O. B. Grayson Hall, Jr. |
|
145,000 |
|
|
150,215 |
|
|
0 |
|
|
0 |
|
|
0 |
|
|
10,531 |
|
|
305,746 |
| |||||||
| Cynthia L. Hostetler |
|
110,000 |
|
|
150,215 |
|
|
0 |
|
|
0 |
|
|
0 |
|
|
7,883 |
|
|
268,098 |
| |||||||
| Richard T. O’Brien |
|
130,000 |
|
|
150,215 |
|
|
0 |
|
|
0 |
|
|
0 |
|
|
23,528 |
|
|
303,743 |
| |||||||
| James T. Prokopanko |
|
110,000 |
|
|
150,215 |
|
|
0 |
|
|
0 |
|
|
0 |
|
|
20,875 |
|
|
281,090 |
| |||||||
| Kathleen L. Quirk |
|
110,000 |
|
|
150,215 |
|
|
0 |
|
|
0 |
|
|
0 |
|
|
2,566 |
|
|
262,781 |
| |||||||
| David P. Steiner |
|
125,000 |
|
|
150,215 |
|
|
0 |
|
|
0 |
|
|
0 |
|
|
4,030 |
|
|
279,245 |
| |||||||
| Lee J. Styslinger, III |
|
120,000 |
|
|
150,215 |
|
|
0 |
|
|
0 |
|
|
0 |
|
|
12,654 |
|
|
282,869 |
| |||||||
| George Willis(1) |
|
0 |
|
|
0 |
|
|
0 |
|
|
0 |
|
|
0 |
|
|
0 |
|
|
0 |
| |||||||
| D. Michael Wilson(1) |
|
55,000 |
|
|
0 |
|
|
0 |
|
|
0 |
|
|
0 |
|
|
0 |
|
|
55,000 |
| |||||||
| (1) | Mr. Wilson joined the Board on July 12, 2019 and resigned from the Board effective February 26, 2020. Ms. Anderson joined the Board on October 11, 2019. Mr. Willis joined the Board on March 11, 2020. |
| (2) | This column represents the accounting expense for the awards granted in 2019; therefore, the values shown are not representative of the amounts that may eventually be realized by a director. Pursuant to SEC rules, we have provided a grant date fair value for stock awards in accordance with the provisions of FASB ASC Topic 718. For DSUs, the fair value is estimated on the date of grant based on the closing market price of our stock ($128.94) on the grant date (May 10, 2019). At December 31, 2019, the aggregate number of DSUs accumulated on account for all years of service, including dividend equivalent units, were: |
AGGREGATE ACCUMULATED DSUs
| NAME |
UNITS | |||
| Melissa H. Anderson |
|
0 |
| |
| Thomas A. Fanning |
|
6,686 |
| |
| O. B. Grayson Hall, Jr. |
|
8,833 |
| |
| Cynthia L. Hostetler |
|
6,686 |
| |
| Richard T. O’Brien |
|
19,375 |
| |
| James T. Prokopanko |
|
17,223 |
| |
| Kathleen L. Quirk |
|
2,373 |
| |
| David P. Steiner |
|
3,560 |
| |
| Lee J. Styslinger, III |
|
10,555 |
| |
| George Willis |
|
0 |
| |
| D. Michael Wilson |
|
0 |
| |
| (3) | None of our directors received perquisites or other personal benefits in excess of $10,000. The amounts set forth in this column represent the accounting expense for the dividend equivalents earned in 2019 by our directors for DSUs which earn dividend equivalents. |
|
|
2020 PROXY STATEMENT |
|
59 |
| ||||||||
Table of Contents
Table of Contents
ANNUAL MEETING AND VOTING INFORMATION
|
|
2020 PROXY STATEMENT |
|
61 |
| ||||||||
Table of Contents
ANNUAL MEETING AND VOTING INFORMATION
|
62 |
2020 PROXY STATEMENT |
|
||||||||
Table of Contents
ANNUAL MEETING AND VOTING INFORMATION
|
|
2020 PROXY STATEMENT |
|
63 |
| ||||||||
Table of Contents
ANNUAL MEETING AND VOTING INFORMATION
|
64 |
2020 PROXY STATEMENT |
|
||||||||
Table of Contents
Table of Contents

Table of Contents
Annex A: Reconciliation of Non-GAAP Financial Measures
Generally Accepted Accounting Principles (GAAP) does not define “Earnings Before Interest, Taxes, Depreciation and Amortization” (EBITDA), and it should not be considered as an alternative to earnings measures defined by GAAP. We use this metric to assess the operating performance of our business and as a basis of strategic planning and forecasting as we believe that it closely correlates to long-term shareholder value. We do not use this metric as a measure to allocate resources. We adjust EBITDA for certain items to provide a more consistent comparison of earnings performance from period to period. Reconciliation of this metric to its nearest GAAP measure is presented below:
| EBITDA AND ADJUSTED EBITDA | ||
EBITDA is an acronym for Earnings Before Interest, Taxes, Depreciation and Amortization and excludes discontinued operations.
| IN MILLIONS |
2019 | 2018 | 2017 | 2016 | 2015 | |||||||||||||||
| Net earnings |
$ | 617.7 | $ | 515.8 | $ | 601.2 | $ | 419.5 | $ | 221.2 | ||||||||||
| Income tax expense (benefit) |
135.2 | 105.4 | (232.1 | ) | 124.9 | 94.9 | ||||||||||||||
| Interest expense, net of interest income |
129.0 | 137.4 | 291.1 | 133.3 | 220.3 | |||||||||||||||
| (Earnings) loss on discontinued operations, net of tax |
4.8 | 2.0 | (7.8 | ) | 2.9 | 11.7 | ||||||||||||||
| Depreciation, depletion, accretion and amortization |
374.6 | 346.2 | 306.0 | 284.9 | 274.8 | |||||||||||||||
| EBITDA |
$ | 1,261.3 | $ | 1,107.0 | $ | 958.4 | $ | 965.5 | $ | 822.9 | ||||||||||
| Gain on sale of real estate and businesses |
(13.4 | ) | (2.9 | ) | (10.5 | ) | (16.2 | ) | (6.3 | ) | ||||||||||
| Property donation |
10.8 | 0.0 | 4.3 | 0.0 | 0.0 | |||||||||||||||
| Business interruption claims recovery, net of incentives |
0 | (2.3 | ) | 0.0 | (11.0 | ) | 0.0 | |||||||||||||
| Charges associated with divested operations |
3.0 | 18.5 | 18.1 | 16.9 | 7.1 | |||||||||||||||
| Business development, net of termination fee(1) |
1.7 | 5.2 | 3.1 | 0.0 | 1.0 | |||||||||||||||
| One-time bonuses to non-incentive employees |
0 | 0.0 | 6.7 | 0.0 | 0.0 | |||||||||||||||
| Asset impairment |
0 | 0.0 | 0.0 | 10.5 | 5.2 | |||||||||||||||
| Restructuring charges |
6.5 | 6.2 | 1.9 | 0.3 | 5.0 | |||||||||||||||
| Adjusted EBITDA |
$ | 1,270.0 | $ | 1,131.7 | $ | 981.9 | $ | 966.0 | $ | 834.9 | ||||||||||
| (1) | Includes only non-routine business development charges. |
Unlike many of our competitors, we do not exclude share-based compensation from our Adjusted EBITDA earnings metric, as we view it as a recurring operating expense. Refer to our statements of cash flows for the expense incurred related to our share-based compensation plans.
| AGGREGATES CASH GROSS PROFIT | ||
Aggregates Cash Gross Profit adds back noncash charges for depreciation, depletion, accretion and amortization to aggregates gross profit.
|
|
2020 PROXY STATEMENT |
|
67 |
| ||||||||
Table of Contents
ANNEX A: RECONCILIATION OF NON-GAAP FINANCIAL MEASURES
ADJUSTED DILUTED EARNINGS PER SHARE FROM CONTINUING
|
OPERATIONS (ADJUSTED DILUTED EPS) CALCULATION |
||
Similar to our presentation of Adjusted EBITDA, we present Adjusted Diluted EPS to provide a more consistent comparison of earnings performance from period to period.
| 2019 | 2018 | |||||||
| Diluted EPS from continuing operations |
$ | 4.67 | $ | 3.87 | ||||
| Items included in Adjusted EBITDA above |
0.03 | 0.14 | ||||||
| Debt refinancing costs |
0.00 | 0.04 | ||||||
| Adjusted Diluted EPS from continuing operations |
$ | 4.70 | $ | 4.05 | ||||
| EBITDA EP CALCULATION | ||
EBITDA EP is EP Adjusted EBITDA less capital charge (average operating capital employed x pretax cost of capital).
| IN MILLIONS |
2019 | |||
| Adjusted EBITDA |
$ | 1,270.0 | ||
| Performance adjustments |
9.5 | |||
| EP Adjusted EBITDA |
$ | 1,279.5 | ||
| Average operating capital employed |
5,048.6 | |||
| Pretax cost of capital |
11.8 | % | ||
| Capital charge |
595.7 | |||
| EBITDA EP |
$ | 683.8 | ||
| CASH EARNINGS | ||
Cash earnings are earnings from continuing operations plus depreciation, depletion, accretion and amortization, as reported on our Statement of Comprehensive Income and Statement of Cash Flows, respectively.
| IN MILLIONS |
2019 | |||
| Earnings froms continuing operations |
$ | 622.5 | ||
| Depreciation, depletion, accretion and amortization |
374.6 | |||
| Cash earnings |
997.1 | |||
| RETURN ON INVESTED CAPITAL | ||
We define Return on Invested Capital (ROIC) as Adjusted EBITDA for the trailing-twelve months divided by average invested capital (as illustrated below) during the trailing 5-quarters. Our calculation of ROIC is considered a non-GAAP financial measure because we calculate ROIC using the non-GAAP metric EBITDA. We believe that our ROIC metric is meaningful because it helps investors assess how effectively we are deploying our assets. Although ROIC is a standard financial metric, numerous methods exist for calculating a company’s ROIC. As a result, the method we use to calculate our ROIC may differ from the methods used by other companies.
| IN MILLIONS |
TTM Q4 2019 |
TTM Q2 2013 |
||||||
| Adjusted EBITDA |
$ | 1,270.0 | $ | 403.8 | ||||
| Total tangible and intangible fixed assets plus net working capital |
$ | 9,139.7 | $ | 7,403.2 | ||||
| Return on Invested Capital |
13.90 | % | 5.45 | % | ||||
|
68 |
2020 PROXY STATEMENT |
|
||||||||
Table of Contents
VOTE BY INTERNET Before The Meeting - Go to www.proxyvote.com Use the Internet to transmit your voting instructions and for electronic delivery of information. Vote by 11:59 p.m. Eastern Time on May 7, 2020 for shares held directly and by 11:59 p.m. Eastern Time on May 5, 2020 for shares held in a Plan. Have your proxy card in hand when you access the web site and follow the instructions to obtain your records and to create an electronic voting instruction form. During The Meeting - Go to www.virtualshareholdermeeting.com/vmc2020 You may attend the meeting via the Internet and vote during the meeting. Have the information that is printed in the box marked by the arrow available and follow the instructions. VOTE BY PHONE - 1-800-690-6903 Use any touch-tone telephone to transmit your voting instructions. Vote by 11:59 p.m. Eastern Time on May 7, 2020 for shares held directly and by 11:59 p.m. Eastern Time on May 5, 2020 for shares held in a Plan. Have your proxy card in hand when you call and then follow the instructions. VOTE BY MAIL Mark, sign and date your proxy card and return it in the postage-paid envelope we have provided or return it to Vote Processing, c/o Broadridge, 51 Mercedes Way, Edgewood, NY 11717. VULCAN MATERIALS COMPANY 1200 URBAN CENTER DRIVE BIRMINGHAM, AL 35242 D06723-P33035 VULCAN MATERIALS COMPANY The Board of Directors recommends you vote FOR proposals 2 and 3. The Board of Directors recommends you vote FOR the director nominees listed in proposal 1. For Against Abstain 1. Election of Directors ! ! ! 2. Approval, on an advisory basis, of the compensation of our named executive officers. For Against Abstain Nominees: ! ! ! ! ! ! 1a. Melissa H. Anderson 3. Ratification of the appointment of Deloitte & Touche LLP as our independent registered public accounting firm for 2020. ! ! ! 1b. O. B. Grayson Hall, Jr. NOTE: Such other business as may properly come before the meeting or any adjournment thereof. ! ! ! 1c. James T. Prokopanko ! ! ! 1d. George Willis Please sign exactly as your name(s) appear(s) hereon. When signing as attorney, executor, administrator, or other fiduciary, please give full title as such. Joint owners should each sign personally. All holders must sign. If a corporation or partnership, please sign in full corporate or partnership name by authorized officer.
Important Notice Regarding the Availability of Proxy Materials for the Annual Meeting: The Notice and Proxy Statement and Annual Report are available at www.proxyvote.com. D06724-P33035 VULCAN MATERIALS COMPANY Annual Meeting of Shareholders May 8, 2020 This proxy is solicited by the Board of Directors The undersigned hereby appoints Cynthia L. Hostetler, David P. Steiner and Lee J. Styslinger, III and each of them, with power to act without the others and with power of substitution, as proxies and attorneys-in-fact, and hereby authorizes them to represent and vote, as provided on the reverse side, all the shares of Vulcan Materials Company common stock which the undersigned is entitled to vote, and, in their discretion, to vote upon such other business as may properly come before the 2020 Annual Meeting of Shareholders of the Company to be held on Friday, May 8, 2020, at 9:00 a.m., local time, via live webcast at www.virtualshareholdermeeting.com/vmc2020 or any adjournment or postponement thereof, with all powers which the undersigned would possess if present at the Annual Meeting. Shares represented by this proxy will be voted as directed by the undersigned. If this proxy is signed and no such directions are indicated, the proxies have authority to vote "FOR" election of all director nominees, "FOR" approval, on an advisory basis, of the compensation of our named executive officers, and "FOR" ratification of the appointment of Deloitte & Touche LLP as our independent registered public accounting firm for 2020. Continued and to be signed on reverse side