Table of Contents
SCHEDULE 14A INFORMATION
Proxy Statement Pursuant to Section 14(a) of the
Securities Exchange Act of 1934
| ☑ Filed by the Registrant | ☐ Filed by a party other than the Registrant |
| Check the appropriate box: | ||
|
☐ |
Preliminary Proxy Statement | |
|
☐ |
CONFIDENTIAL, FOR USE OF THE COMMISSION ONLY (AS PERMITTED BY RULE 14a-6(e)(2)) | |
|
☑ |
Definitive Proxy Statement | |
|
☐ |
Definitive Additional Materials | |
|
☐ |
Soliciting Material Pursuant to §240.14a-12 | |
Vulcan Materials Company
(Name of Registrant as Specified in Its Charter)
(Name of Person(s) Filing Proxy Statement, if other than the Registrant)
| Payment of filing fee (Check the appropriate box): | ||
| ☑ | No fee required. | |
| ☐ | Fee computed on table below per Exchange Act Rules 14a-6(I)(1) and 0-11. | |
| (1) Title of each class of securities to which transaction applies:
| ||
| (2) Aggregate number of securities to which transaction applies:
| ||
| (3) Per unit price or other underlying value of transaction computed pursuant to Exchange Act Rule 0-11 (set forth the amount on which the filing fee is calculated and state how it was determined):
| ||
| (4) Proposed maximum aggregate value of transaction:
| ||
| (5) Total fee paid:
| ||
| ☐ | Fee paid previously with preliminary materials: | |
| ☐ | Check box if any part of the fee is offset as provided by Exchange Act Rule 240.0-11 and identify the filing for which the offsetting fee was paid previously. Identify the previous filing by registration statement number, or the Form or Schedule and the date of its filing. | |
| (1) Amount Previously Paid:
| ||
| (2) Form, Schedule or Registration Statement No.:
| ||
| (3) Filing Party:
| ||
| (4) Date Filed:
| ||
Table of Contents
one vulcan, locally led PROXY STATEMENT AND NOTICE 2018 ANNUAL MEETING OF SHAREHOLDERS
Table of Contents

Dear Fellow Shareholder,
I would like to extend a personal invitation for you to join us at our Annual Meeting of Shareholders on Friday, May 11, 2018, at 9:00 a.m., local time, at the corporate headquarters of Vulcan Materials Company, 1200 Urban Center Drive, Birmingham, Alabama 35242. During the Annual Meeting, we will discuss each item of business described in the Notice of Annual Meeting and this proxy statement.
On or about March 26, 2018, we began mailing to many of our shareholders a Notice of Internet Availability of Proxy Materials containing instructions on how to access our proxy materials, including our 2017 Annual Report to Shareholders, via the Internet. Shareholders who did not receive the Notice of Internet Availability of Proxy Materials will receive a paper copy of the Notice of Annual Meeting, proxy statement, proxy card and 2017 Annual Report to Shareholders, which we also began mailing on or about March 26, 2018. The Notice of Internet Availability of Proxy Materials also contains instructions on how to receive a paper copy of the proxy materials. Copies of our Notice of Annual Meeting, proxy statement, proxy card and 2017 Annual Report to Shareholders are available at www.proxyvote.com.
Your vote is important. Whether you own one share or many, your prompt vote is greatly appreciated. It is important that your shares of common stock be represented at the Annual Meeting so that a quorum may be established. Even if you plan to attend the Annual Meeting in person, please read the proxy materials carefully and then vote your proxy as soon as possible. You may vote over the Internet, by telephone, or by mailing a completed proxy card. Additional information is provided in the proxy materials. If you attend the Annual Meeting, you may revoke your proxy and vote your shares in person.
Thank you for your ongoing support and continued interest in Vulcan, and I look forward to welcoming you to our Annual Meeting.
March 26, 2018
Sincerely yours,

J. THOMAS HILL
Chairman, President and Chief Executive Officer
Table of Contents
NOTICE OF ANNUAL MEETING
Meeting Date: Friday, May 11, 2018
Meeting Time: 9:00 a.m., local time
NOTICE IS HEREBY GIVEN that the 2018 Annual Meeting of Shareholders of Vulcan Materials Company will be held at the corporate headquarters of Vulcan Materials Company, 1200 Urban Center Drive, Birmingham, Alabama 35242, on Friday, May 11, 2018, at 9:00 a.m., local time, for the following purposes:
| • | To elect five nominees as directors; |
| • | To approve, on an advisory basis, the compensation of our named executive officers; |
| • | To ratify the appointment of Deloitte & Touche LLP as our independent registered public accounting firm for 2018; and |
| • | To conduct such other business as may properly come before the Annual Meeting or any adjournments or postponements thereof. |
Only shareholders of record as of the close of business on March 14, 2018 are entitled to receive notice of, to attend and to vote at the Annual Meeting. Whether or not you plan to attend, we urge you to review these materials carefully and to vote by Internet or telephone, or, if you have received a paper copy of the proxy card, you may instead choose to vote by mailing your proxy card.
March 26, 2018
By Order of the Board of Directors,

JERRY F. PERKINS JR.
General Counsel and Secretary
Table of Contents
Table of Contents
This summary highlights information contained elsewhere in this proxy statement and in our corporate governance documents on our website at www.vulcanmaterials.com. This summary does not contain all of the information that you should consider, and you should read this entire proxy statement before voting. Please note that the information contained on our website is not incorporated by reference in, nor considered to be a part of, this proxy statement.
VOTING YOUR SHARES
Your vote is important. You may vote if you were a shareholder at the close of business on March 14, 2018, the record date for the Annual Meeting. You may vote in person at the Annual Meeting or submit a proxy over the Internet or by telephone. If you have received a paper copy of the proxy card (or if you request a paper copy of the materials), you may instead choose to submit a proxy by mail.
|
|
VIA THE INTERNET www.proxyvote.com |

|
BY MAIL Complete, sign, date and return your proxy card in the envelope provided | |||
|
|
BY TELEPHONE Call the number located on your proxy card |

|
IN PERSON Attend the Annual Meeting and vote by ballot |


If you submit your proxy by telephone or over the Internet, you do not need to return your proxy card by mail.
PROPOSALS
| Proposal For Your Vote | Board Voting Recommendation |
Vote Required | Page | |||
| PROPOSAL 1: Election of Directors | FOR each nominee | Majority of Votes Cast | 7 | |||
| PROPOSAL 2: Advisory Vote on Compensation of Our Named Executive Officers (Say on Pay) | FOR | Majority of Votes Cast | 15 | |||
| PROPOSAL 3: Ratification of Appointment of Independent Registered Public Accounting Firm | FOR | Majority of Votes Cast | 16 | |||
| 2
|
PROXY SUMMARY | Vulcan 2018 Proxy Statement | ||||||||
Table of Contents
2017 BUSINESS HIGHLIGHTS
We achieved a number of significant milestones during the course of the year, in large part due to the continuing dedication of our employees, the leadership of our executive officers and our Board of Directors, and the culture of our company, which binds us all together. Highlights of 2017 include:
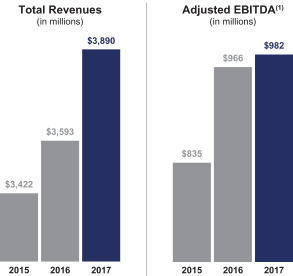
| • | Achieved record total revenues of $3.89 billion, net earnings of $601 million and Adjusted EBITDA1 of $982 million, a $297.6 million improvement in total revenues, a $181.7 million improvement in net earnings and a $16 million improvement in Adjusted EBITDA over the prior year, despite a challenging operating environment largely due to hurricanes and other severe weather events; |
| • | Strengthened our balance sheet by reducing our weighted-average interest rate below five percent and extended our weighted-average debt life to sixteen years, which better matches the long-lived assets in which we invest; |
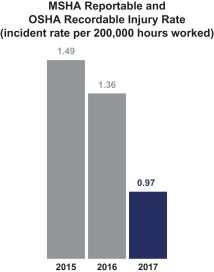
| • | Reduced our MSHA Reportable and OSHA Recordable Injury Rate from 1.36 in 2016 to 0.97 in 2017, representing world-class performance and the safest year in our company’s history; |
| • | Further improved our long-term profitability through: |
| • | the strategic acquisition of 25 aggregates facilities and 18 asphalt and ready-mix concrete facilities for $842 million, and |
| • | the investment of $168 million in internal growth projects to secure new aggregates reserves, develop new production sites and enhance distribution capabilities; and |
| • | Strengthened company-wide understanding of “The Vulcan Way”, the embodiment of the company’s culture, as evidenced by increased organizational engagement and appreciation of Vulcan’s mission and values. Vulcan ranked in the top decile of surveyed organizations in McKinsey & Company’s Organizational Health Index. |
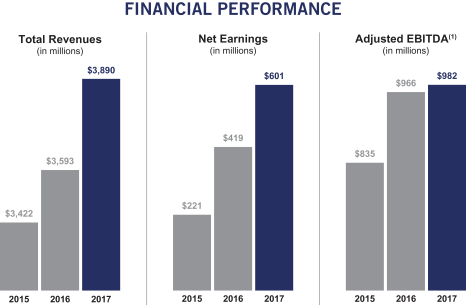
| (1) | Adjusted EBITDA is a non-GAAP financial measure. We provide a reconciliation of Adjusted EBITDA to the most directly comparable GAAP financial measures in Annex A of this proxy statement. |
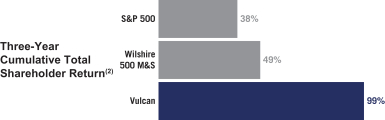
| (2) | For the period beginning January 1, 2015 and ending December 31, 2017, assuming quarterly reinvestment of dividends. |
| Vulcan 2018 Proxy Statement | PROXY SUMMARY | 3
| ||||||||
Table of Contents
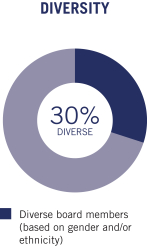
9 of 10 Independent
BOARD COMPOSITION
The Board seeks a mix of directors with qualities that, together, create a high-functioning, diverse Board. All of our directors, other than Tom Hill, our Chairman, President and CEO, are independent. Each of our directors has proven leadership, sound judgment and a commitment to the success of our company. In recent years, we have had a number of members retire from the Board and have sought as replacements diverse and experienced leaders with appropriate skills to oversee the management of our company.
|
|
|

2017 GOVERNANCE HIGHLIGHTS
Shareholder Engagement
In 2017, we initiated an enhanced corporate governance outreach program and held dialogues with shareholders representing more than 50% of our outstanding shares in order to foster and deepen relationships with the governance teams of our largest shareholders. Our discussions included executive compensation and other governance matters such as board composition, diversity and sustainability.
Corporate Governance Practices
We are committed to strong corporate governance policies and practices and believe that this commitment is a critical element in achieving long-term shareholder value. The following table summarizes certain highlights of our governance policies and practices:
| • Majority voting for uncontested director elections
|
• Independent lead director with defined duties
| |||
| • 9 of 10 directors are independent
|
• Clawback policy
| |||
| • Annual board and committee evaluations and self-assessments
|
• Risk oversight by full board and committees with annual enterprise risk management review
| |||
| • Comprehensive new director orientation
|
• Mandatory director retirement age
| |||
| • Limited membership on other public company boards
|
• Policies prohibiting hedging and pledging of our shares
| |||
| • Active shareholder engagement on governance matters
|
• Board participation in executive succession planning
| |||
| • Executive sessions of independent directors at every regular board meeting
|
• Board review of safety and environmental performance at every regular board meeting
| |||
| • No shareholder rights plan
|
• Diverse board in terms of gender, ethnicity, experience, skills and tenure |
| 4
|
PROXY SUMMARY | Vulcan 2018 Proxy Statement | ||||||||
Table of Contents
2017 COMPENSATION HIGHLIGHTS
At our 2017 Annual Meeting of Shareholders, over 97% of votes cast were in favor of the compensation of our named executive officers (NEOs). We believe that the results of the 2017 Say on Pay vote demonstrate continued strong shareholder support for our current compensation program. Furthermore, during our shareholder outreach, shareholders were generally supportive of our executive compensation programs and the accompanying disclosures.
In order to align our executives’ interests with those of our shareholders, a substantial portion of our NEOs’ compensation is at-risk and will vary above or below target levels depending on company performance. As shown in the table below, in 2017, 83% of the compensation of our Chief Executive Officer (CEO) and an average of 76% of the compensation of our other NEOs was at risk and subject to performance factors.
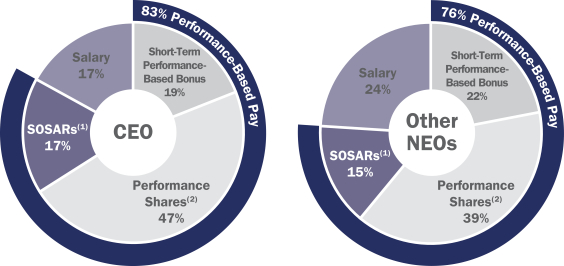
| (1) | SOSARs means Stock-Only Stock Appreciation Rights calculated based on grant date fair value. See page 44 for more information. |
| (2) | Performance Shares refers to Performance Share Units (PSUs) calculated based on grant date fair value. See page 43 for more information. |
We encourage you to read the more detailed description of our compensation program in “Compensation Discussion and Analysis” beginning on page 29 before voting on Proposal 2: Advisory Vote on Compensation of Our Named Executive Officers.
| Vulcan 2018 Proxy Statement | PROXY SUMMARY | 5
| ||||||||
Table of Contents
2017 COMPENSATION DECISIONS
Set forth below is the 2017 compensation for our NEOs. The table is not a substitute for, and should be read together with, the Summary Compensation Table on page 48, which presents 2017 NEO compensation in accordance with disclosure rules of the Securities and Exchange Commission (SEC) and includes additional compensation elements and other important information.
| Name and Principal Position |
Base ($) |
Short-Term ($) |
Performance ($) |
Stock-Only ($) |
Total ($) |
|||||||||||||||
| Tom Hill Chairman, President and Chief Executive Officer |
1,008,334 | 1,722,000 | 2,808,011 | 1,027,939 | 6,566,284 | |||||||||||||||
| John McPherson Executive Vice President, Chief Financial and Strategy Officer |
800,000 | 1,298,300 | 1,844,593 | 675,257 | 4,618,150 | |||||||||||||||
| Stan Bass Chief Growth Officer |
583,335 | 692,900 | 810,681 | 296,769 | 2,383,685 | |||||||||||||||
| Michael Mills Chief Administrative Officer |
583,335 | 692,900 | 810,681 | 296,769 | 2,383,685 | |||||||||||||||
| Tom Baker Senior Vice President |
444,384 | 577,400 | 646,195 | 236,555 | 1,904,534 | |||||||||||||||
| (1) | Dollar value of 2017 Performance Share Units (PSUs) at “target.” Actual pay delivered or realized for PSUs will be determined in the first quarter of 2020 and may range from zero to 200% of the target shares. PSUs vest at the end of a three-year period to the extent that the company has met the required performance goals. See footnote (1) to the Summary Compensation Table on page 48 for an explanation of determination of value for PSUs. |
| (2) | Dollar value of 2017 Stock-Only Stock Appreciation Rights (SOSARs). SOSARs vest over three years beginning on the first anniversary of the grant date. See footnote (1) to the Summary Compensation Table on page 48 for an explanation of the determination of value for SOSARs. |
| 6
|
PROXY SUMMARY | Vulcan 2018 Proxy Statement | ||||||||
Table of Contents
PROPOSAL 1. ELECTION OF DIRECTORS
Our constituent documents provide that our Board shall be divided into three classes, with the term of office of one class expiring each year and the number of directors in each class being as nearly equal as possible. At the Annual Meeting, one individual will be elected to serve as a member of our Board for a one-year term expiring in 2019, and four individuals will be elected for three-year terms expiring in 2021, or until their successors have been duly elected and qualified. Our Board, upon the recommendation of the Governance Committee, has nominated Thomas A. Fanning, J. Thomas Hill, Cynthia L. Hostetler and Richard T. O’Brien as directors to serve three-year terms expiring in 2021, and in order to make the number of directors in each class as nearly equal as possible, has nominated Kathleen L. Quirk as a director to serve a one-year term expiring in 2019. Ms. Quirk was elected to the Board in October 2017 to fill a vacancy and, in accordance with New Jersey law and our Corporate Governance Guidelines, must stand for election at the Annual Meeting to continue her service. Each of the nominees has consented to be named in this proxy statement and to serve if elected, and our Board has no reason to believe that any of the persons nominated will be unable to serve as a director. The Board believes that each of the five nominees is highly qualified and has experience, skills, backgrounds and attributes that qualify each of them to serve as a director of Vulcan.
In accordance with the bylaws of our company, our Board of Directors is required to be composed of not fewer than nine nor more than 13 directors. The number of directors may be set by a resolution adopted by a majority of our Board of Directors, and our charter provides that any vacancies on the Board, including vacancies resulting from an increase in the number of directors, shall be filled by the affirmative vote of a majority of the remaining directors.
BOARD COMPOSITION AND DIRECTOR QUALIFICATIONS
Directors are responsible for reviewing and approving corporate strategy and overseeing the management of our company to assure that the long-term interests of the shareholders are being served. The Board believes that it needs a diverse skill set among its members to be able to respond to the needs of management and the company. The Governance Committee and full Board review annually the overall composition of the Board in order to ensure that Board members have the appropriate mix of skills and experience to best serve the company and its shareholders. The Governance Committee and the Board use a director skills matrix in conducting this review.
The Governance Committee is also responsible for evaluating each director’s individual performance and contributions to the Board, as well as each director’s qualifications, skills, independence and competence, prior to recommending an existing director to the Board for re-nomination. The Board does not have specific diversity quotas, but considers race, ethnicity, gender, age, education and professional experiences in evaluating candidates for the Board.
We believe our current directors bring a balance of relevant skills to the boardroom as well as an effective mix of diversity and experience. The following graphic depicts a summary of skills, experiences and attributes represented by the ten directors on our Board:
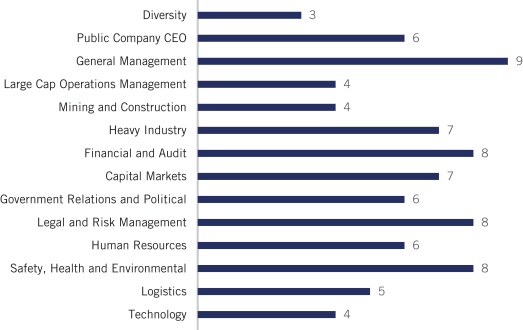
Diversity 3 Public Company CEO 6 General Management 9 Large Cap Operations Management 4 Mining and Construction 4 Heavy Industry 7 Financial and Audit 8 Capital Markets 7 Government Relations and Political 6 Legal and Risk Management 8 Human Resources 6 Safety, Health and Environmental 8 Logistics 5 Technology 4
| Vulcan 2018 Proxy Statement | PROPOSAL 1. ELECTION OF DIRECTORS | 7
| ||||||||
Table of Contents
Nominee for Election to the Board of Directors: One-Year Term Expiring in 2019
|
KATHLEEN L. QUIRK
Director since 2017
Age: 54
Committees: Audit; Finance |
CAREER HIGHLIGHTS:
Executive Vice President, Chief Financial Officer and Treasurer of Freeport-McMoRan Inc., Phoenix, Arizona (a leading international mining company and the world’s largest publicly traded copper producer) since 2007.
SKILLS AND QUALIFICATIONS:
• Prior to being named its Executive Vice President in 2007, Chief Financial Officer in 2003 and Treasurer in 2000, Ms. Quirk served in a variety of capacities with Freeport-McMoRan, including as its Vice President, Finance and Business Development.
• She received her bachelor’s degree in accounting from Louisiana State University. |
• Ms. Quirk’s strong finance and accounting background, including her status as an “audit committee financial expert,” makes her well qualified to serve as a member of our Audit and Finance committees. She also brings to our Board extensive experience in working with debt and equity markets along with a deep knowledge of tax, investor relations, corporate development and treasury management.
• With over 30 years’ experience in the mining industry, Ms. Quirk has a keen understanding of the operational, governmental and regulatory issues facing our industry. |

| 8
|
PROPOSAL 1. ELECTION OF DIRECTORS | Vulcan 2018 Proxy Statement | ||||||||
Table of Contents
Nominees for Election to the Board of Directors: Three-Year Terms Expiring in 2021
|
THOMAS A. FANNING
Director since 2015
Age: 61
Committees: Audit; Compensation
Other Public Company Directorships: Southern Company |
CAREER HIGHLIGHTS:
Chairman of the Board, President and Chief Executive Officer of Southern Company, Atlanta, Georgia (one of the largest energy companies in the U.S. and a leading U.S. producer of energy) since 2010.
SKILLS AND QUALIFICATIONS:
• Mr. Fanning is Chairman, President and Chief Executive Officer of Southern Company. He has worked for Southern Company for more than 35 years and has held 15 different positions in eight different business units, including numerous officer positions with a variety of Southern Company subsidiaries in the areas of finance, strategy, international business development and technology.
• Mr. Fanning previously was Chief Financial Officer of Southern Company, where he was responsible for the accounting, finance, tax, investor relations, treasury and risk management functions. |
• As Chairman of both the Electricity Subsector Coordinating Council (ESCC) and Strategic Infrastructure Coordinating Council (SICC), Mr. Fanning plays a leading role in national efforts to prevent and respond to cyber and physical terrorism for the U.S. electric system.
• He has an undergraduate and master’s degree from the Georgia Institute of Technology and has completed several executive education programs.
• As CEO of a large public utility, Mr. Fanning provides our Board with valuable business, leadership, and management skills. His prior service as CFO of Southern Company and Chairman of the Federal Reserve Bank of Atlanta makes him well qualified to serve on our Audit Committee. Additionally, he brings to our Board a deep understanding of key issues facing an industrial company, including governmental and regulatory issues, and safety, health and environmental matters. |

|
J. THOMAS HILL
Director since 2014
Age: 59
Committees: Executive |
CAREER HIGHLIGHTS:
Chairman of the Board of the company since January 2016 and President and Chief Executive Officer since July 2014.
SKILLS AND QUALIFICATIONS:
• Mr. Hill is Chairman, President and Chief Executive Officer of the company. He has been with the company for 28 years, serving in a variety of operations and general management assignments of increasing responsibility. Prior to being named Chairman, President and Chief Executive Officer, he served as Executive Vice President and Chief Operating Officer from January 2014 until July 2014, and Senior Vice President—South Region from December 2011 to December 2013. He also served as President of the company’s former Florida Rock Division and its Southwest Division. |
• Mr. Hill has served in leadership positions in a number of industry trade groups, including the Texas Concrete and Aggregates Association, the Florida Concrete and Products Association, and the National Stone, Sand and Gravel Association. In addition, he serves on the boards of the U.S. Chamber of Commerce, the United Way of Central Alabama, the Birmingham Business Alliance, and the Economic Development Partnership of Alabama.
• He is a graduate of the University of Pittsburgh and the Wharton School of Business, Executive Management Program.
• Mr. Hill has over 30 years’ experience in the aggregates industry, including extensive experience with the company in operations and management over a wide variety of geographic regions. |

| Vulcan 2018 Proxy Statement | PROPOSAL 1. ELECTION OF DIRECTORS | 9
| ||||||||
Table of Contents
Nominees for Election to the Board of Directors: Three-Year Terms Expiring in 2021
|
CYNTHIA L. HOSTETLER
Director since 2014
Age: 55
Committees: Audit; Executive; Finance |
CAREER HIGHLIGHTS:
Director of TriLinc Global Impact Fund, LLC, Los Angeles, California (international investment fund) since 2013. Trustee of Invesco Ltd., Atlanta, Georgia (international mutual funds) since 2017. Trustee of Aberdeen International Funds, New York, New York (international mutual funds) from 2013 to 2017. Director of Artio Global Funds, New York, New York (international mutual funds) from 2010 until 2013. Director of Edgen Group Inc., Baton Rouge, Louisiana (energy infrastructure) from 2012 to 2014.
SKILLS AND QUALIFICATIONS:
• Ms. Hostetler is the former head of Private Equity and Vice President of Investment Funds at the Overseas Private Investment Corporation, and a former president of a regional bank and bank holding company. |
• Ms. Hostetler began her career as a corporate lawyer with Simpson Thatcher & Bartlett in New York.
• Ms. Hostetler earned her bachelor’s degree from Southern Methodist University and holds a Juris Doctorate from the University of Virginia School of Law.
• Ms. Hostetler brings to our Board significant financial, investment and audit committee experience, and has developed risk assessment skills through her bank, private equity and mutual fund leadership. She is an experienced public and investment company board member, having served on a number of public and private company boards, with committee chair positions that include audit, nominating and governance and investment management. |

| 10
|
PROPOSAL 1. ELECTION OF DIRECTORS | Vulcan 2018 Proxy Statement | ||||||||
Table of Contents
Nominees for Election to the Board of Directors: Three-Year Terms Expiring in 2021
|
RICHARD T. O’BRIEN
Director since 2008
Age: 64
Committees: Audit; Executive; Safety, Health and Environmental Affairs
Other Public Company Directorships: Xcel Energy Inc. |
CAREER HIGHLIGHTS:
Independent consultant since October 2015. Former President and Chief Executive Officer of Boart Longyear Limited, Salt Lake City, Utah (an international provider of drilling services, drilling equipment and performance tooling for mining and drilling companies) from 2013 to 2015. Chief Executive Officer of Newmont Mining Corporation, Greenwood Village, Colorado (an international gold production company) from 2007 until February 2013.
SKILLS AND QUALIFICATIONS:
• Mr. O’Brien became a director of Ma’aden (a Saudi Arabian mining company) in December 2017 and is a member of its executive committee. Mr. O’Brien previously served as a director of Newmont Mining Corporation (2007—2013) and Inergy L.P. (2006—2012). |
• His work includes extensive experience with New York Stock Exchange (NYSE)-listed companies in finance and accounting, operations and strategic business planning.
• Mr. O’Brien earned his bachelor’s degree in economics from the University of Chicago and holds a Juris Doctorate from the Lewis and Clark Law School.
• Having served as CFO of four different public companies and as an “audit committee financial expert,” Mr. O’Brien provides the Board with considerable experience and acumen in financial reporting and accounting matters.
• As a result of his tenure as CEO and CFO of Newmont Mining, Mr. O’Brien brings to the Board significant experience and knowledge of the mining and mineral extraction industry. This gives him insight into the risks facing the company and provides him with the tools to effectively assist in overseeing those risks. |


THE BOARD OF DIRECTORS UNANIMOUSLY RECOMMENDS THAT YOU VOTE “FOR” EACH OF THE NOMINEES NAMED ABOVE.
| Vulcan 2018 Proxy Statement | PROPOSAL 1. ELECTION OF DIRECTORS | 11
| ||||||||
Table of Contents
Directors Continuing in Office: Terms Expiring in 2019
|
DAVID P. STEINER
Director since 2017
Age: 58
Committees: Governance; Safety, Health and Environmental Affairs
Other Public Company Directorships: FedEx Corporation |
CAREER HIGHLIGHTS:
Retired; Former President and Chief Executive Officer of Waste Management, Inc., Houston, Texas (a leading provider of integrated waste management services in North America) from March 2004 to November 2016.
SKILLS AND QUALIFICATIONS:
• Mr. Steiner served as Chief Executive Officer of Waste Management, Inc. from March 2004 to November 2016. Prior to being named CEO, he served in a variety of capacities with Waste Management, Inc., including as Executive Vice President and Chief Financial Officer from 2003 to 2004, and as Senior Vice President, General Counsel and Corporate Secretary from 2001 to 2003.
• He serves on the Board of Directors of FedEx Corporation, and formerly served on the boards of TE Connectivity Ltd. (previously known as Tyco Electronics, Ltd.) and Waste Management, Inc. |
• Mr. Steiner earned his bachelor’s degree in accounting from Louisiana State University and holds a Juris Doctorate from the University of California, Los Angeles, School of Law.
• Mr. Steiner brings to our Board valuable insight into business, leadership and management issues facing large industrial companies. His experience as CEO of Waste Management, Inc. and as chair of the nominating and governance committee of FedEx Corporation makes him well qualified to serve on our Governance and Safety, Health and Environmental Affairs Committees.
• Additionally, he brings to our Board a keen understanding of issues involving trucking and logistics management, a key component of our business. | ||||||
|
LEE J. STYSLINGER, III
Director since 2013
Age: 57
Committees: Finance; Governance
Other Public Company Directorships: Regions Financial Corporation Workday, Inc. |
CAREER HIGHLIGHTS:
Chairman and Chief Executive Officer of Altec, Inc., Birmingham, Alabama (a holding company for businesses that design, manufacture and market equipment for the electric and telecommunications industries globally) since 1997 (CEO) and 2011 (Chairman).
SKILLS AND QUALIFICATIONS:
• Mr. Styslinger serves as Chairman and CEO of Altec and has over 20 years’ experience leading companies engaged in the heavy equipment industry.
• He serves on the boards of many educational, civic and leadership organizations, including the Harvard Business School, the National Association of Manufacturers and the Northwestern University College of Arts and Sciences. He was appointed to the President’s Export Council, advising the President of the United States on international trade policy from 2006 to 2008. |
• He received his Bachelor of Arts from Northwestern University and a Master of Business Administration from Harvard University.
• Mr. Styslinger brings to our Board a wealth of management and business experience running a large company in today’s global market. Additionally, his expertise in the heavy equipment industry greatly benefits Vulcan, which is a major purchaser of heavy machinery and equipment. |


| 12
|
PROPOSAL 1. ELECTION OF DIRECTORS | Vulcan 2018 Proxy Statement | ||||||||
Table of Contents
Directors Continuing in Office: Terms Expiring in 2020
|
O. B. GRAYSON HALL, JR.
Director since 2014
Age: 60
Committees: Executive; Finance; Governance
Other Public Company Directorships: Regions Financial Corporation |
CAREER HIGHLIGHTS:
Chairman and Chief Executive Officer of Regions Financial Corporation, Birmingham, Alabama (one of the nation’s largest full-service providers of consumer and commercial banking, wealth management, mortgage and insurance products and services) and Regions Bank since 2013; Chairman, President and Chief Executive Officer (2013—2017), President and Chief Executive Officer (2010—2013) and Vice Chairman (2008—2010).
SKILLS AND QUALIFICATIONS:
• Mr. Hall is Chairman and Chief Executive Officer of Regions Financial Corporation. Since joining Regions in 1980, he has served in roles of increasing responsibility, including operations, technology and commercial banking.
• Mr. Hall serves on the Board of Directors of Regions Financial Corporation. In addition, he is a Class A Director of the Federal Reserve Bank of Atlanta. |
• He is active in many civic and leadership organizations, including the Economic Development Partnership of Alabama and the Birmingham Business Alliance.
• He graduated from the University of the South with a bachelor’s degree in economics. He also received a Master of Business Administration from the University of Alabama and is a graduate of the Stonier Graduate School of Banking, University of Pennsylvania.
• Mr. Hall brings extensive management and business experience to our Board as well as a deep understanding of complex issues facing public companies. As Chief Executive Officer of Regions, he provides our Board with valuable experience in banking, finance, capital markets and cybersecurity risk. |

|
JAMES T. PROKOPANKO
Director since 2009
Age: 64
Committees: Compensation; Executive; Governance
Other Public Company Directorships: Regions Financial Corporation Xcel Energy Inc. |
CAREER HIGHLIGHTS:
Retired; Senior Advisor of The Mosaic Company, Plymouth, Minnesota (a leading producer and marketer of concentrated phosphate and potash crop nutrients for the global agriculture industry) from August 2015 to January 2016; President and Chief Executive Officer from January 2007 until August 2015.
SKILLS AND QUALIFICATIONS:
• Mr. Prokopanko served as Senior Advisor of The Mosaic Company from August 2015 to January 2016. He joined Mosaic in 2006 and served as President and Chief Executive Officer from January 2007 to August 2015, and as Executive Vice President and Chief Operating Officer from July 2006 to January 2007. Prior to that, he was with Cargill, Inc., where he served in a wide range of leadership positions, including as Corporate Vice President of Cargill Procurement, a leader of Cargill’s Ag Producer Services Platform, and Vice President of the North America crops inputs business. |
• Mr. Prokopanko has a bachelor’s degree in computer science from the University of Manitoba and a Master of Business Administration from the University of Western Ontario.
• His experience serving as the principal interface between management and the board at a NYSE company facilitates his service as lead director of our company as well as our Board’s performance of its oversight function. His executive management experience provides our Board with valuable insight into business, leadership and management issues. Additionally, he brings to our Board considerable knowledge of issues facing a company engaged in mineral extraction. |

| Vulcan 2018 Proxy Statement | PROPOSAL 1. ELECTION OF DIRECTORS | 13
| ||||||||
Table of Contents
Directors Continuing in Office: Terms Expiring in 2020
|
KATHLEEN WILSON-THOMPSON
Director since 2009
Age: 60
Committees: Compensation; Executive; Safety, Health and Environmental Affairs |
CAREER HIGHLIGHTS:
Executive Vice President and Global Chief Human Resources Officer of Walgreens Boots Alliance, Inc., Deerfield, Illinois (a drugstore chain), since January 2015. Senior Vice President and Chief Human Resources Officer of Walgreen Co. from January 2010 to December 2014. Senior Vice President, Global Human Resources of The Kellogg Company, Battle Creek, Michigan (a retail food manufacturer and distributor), from July 2005 to January 2010.
SKILLS AND QUALIFICATIONS:
• Ms. Wilson-Thompson is responsible for strategy and delivery of all human resources-related activities globally for Walgreens Boots Alliance, Inc., the global leader in pharmacy-led health and well-being retail with over 13,200 stores in 11 countries. |
• Ms. Wilson-Thompson earned a bachelor’s degree in literature from the University of Michigan and a Juris Doctorate and a master of law from Wayne State University.
• She serves on the NAACP Foundation. She was also named to Black Enterprise’s 2018 “Top 300 Most Powerful Executives in Corporate America” and one of their “50 Most Powerful Women in America” from 2015 to 2017.
• As a result of her senior leadership positions in human resources at both Walgreens and Kellogg, Ms. Wilson-Thompson brings to our Board valuable experience in compensation and benefits, human resources and organization issues that face a labor-intensive industry. |

| 14
|
PROPOSAL 1. ELECTION OF DIRECTORS | Vulcan 2018 Proxy Statement | ||||||||
Table of Contents
PROPOSAL 2. ADVISORY VOTE ON COMPENSATION OF OUR NAMED EXECUTIVE OFFICERS (SAY ON PAY)
In accordance with Section 14A of the Securities Exchange Act of 1934, as amended (the “Exchange Act”), we are asking shareholders to approve, on an advisory basis, the compensation paid to our named executive officers (NEOs) as disclosed in the Section entitled “Compensation Discussion and Analysis,” and the compensation tables and narrative discussion contained in this proxy statement. While this vote is advisory and not binding on our company, it provides information to our Compensation Committee regarding investor sentiment about our executive compensation philosophy, policies and practices, which the Compensation Committee will consider when determining executive compensation in the future.
At our 2017 Annual Meeting of Shareholders, our shareholders once again indicated a preference that the advisory vote on the compensation for our NEOs occur on an annual basis. Subsequently, our Board determined to continue its policy for annual “Say on Pay” advisory votes. It is expected that the next shareholder vote on the frequency of “Say on Pay” advisory votes will occur at our 2023 Annual Meeting of Shareholders.
At our 2017 Annual Meeting of Shareholders, our shareholders also voted over 97% in favor of our “Say on Pay” proposal. We believe this demonstrated strong support for our compensation program and policies. In 2017, we continued to analyze and make changes to our compensation program, considering new compensation trends and best practices. We also participated in dialogues regarding our executive compensation program with most of our largest shareholders through our enhanced corporate governance shareholder engagement program. Please read the “Compensation Discussion and Analysis” Section on pages 29 to 46 for an in-depth look at our compensation program and how it was applied to the performance of our NEOs in 2017.
Based on the foregoing, the Board recommends a vote FOR the following resolution:
“RESOLVED, that the shareholders approve, on an advisory basis, the compensation of the named executive officers, as disclosed pursuant to Item 402 of Regulation S-K, including the Compensation Discussion and Analysis, compensation tables and narrative discussion contained in this proxy statement.”
As an advisory vote, this proposal is not binding on our company. However, our Board and Compensation Committee will consider the outcome of the advisory vote when making future compensation decisions.
| Vulcan 2018 Proxy Statement | PROPOSAL 2. ADVISORY VOTE ON COMPENSATION OF OUR NAMED EXECUTIVE OFFICERS (SAY ON PAY) | 15
| ||||||||
THE BOARD OF DIRECTORS UNANIMOUSLY RECOMMENDS THAT YOU VOTE “FOR” THE COMPENSATION OF OUR NAMED EXECUTIVE OFFICERS AS CONTAINED IN THIS PROXY STATEMENT.
Table of Contents
PROPOSAL 3. RATIFICATION OF APPOINTMENT OF INDEPENDENT REGISTERED PUBLIC ACCOUNTING FIRM
The Audit Committee, which is composed solely of independent directors, has appointed Deloitte & Touche LLP as the independent registered public accounting firm for our company and its subsidiaries for the fiscal year ending December 31, 2018. The function of the independent registered public accounting firm is to audit our accounts and records; to report on the consolidated balance sheet and the related statements of consolidated comprehensive income, consolidated shareholders’ equity and consolidated statements of cash flows of our company and its subsidiaries; to audit our internal controls over financial reporting; and to perform such other appropriate accounting services as may be required and approved by the Audit Committee. Although shareholder ratification is not required, our Board is seeking shareholder ratification as a matter of good corporate governance. Even if the appointment of Deloitte & Touche LLP is ratified by a majority of the votes cast at the meeting, the Audit Committee may, in its discretion, direct the appointment of another independent registered public accounting firm at any time during the year if it believes such appointment is in the best interests of the company and the shareholders. If a majority of the votes cast at the meeting fails to ratify the selection of Deloitte & Touche LLP as our independent registered public accounting firm, the Audit Committee will consider the selection of another independent registered public accounting firm for future years.
The firm of Deloitte & Touche LLP, or its predecessors, has audited our financial statements since 1956. A representative of that firm is expected to be present at the meeting, will be given an opportunity to make a statement and will be available to respond to appropriate questions.

| 16
|
PROPOSAL 3. RATIFICATION OF APPOINTMENT OF INDEPENDENT REGISTERED PUBLIC ACCOUNTING FIRM | Vulcan 2018 Proxy Statement | ||||||||
THE BOARD OF DIRECTORS UNANIMOUSLY RECOMMENDS THAT YOU VOTE “FOR” THE RATIFICATION OF THE APPOINTMENT OF DELOITTE & TOUCHE LLP AS OUR INDEPENDENT REGISTERED PUBLIC ACCOUNTING FIRM FOR 2018.
Table of Contents
Table of Contents
| 18
|
CORPORATE GOVERNANCE | Vulcan 2018 Proxy Statement | ||||||||
Table of Contents
| Vulcan 2018 Proxy Statement | CORPORATE GOVERNANCE | 19
| ||||||||
Table of Contents
COMMITTEES OF THE BOARD OF DIRECTORS
Our Board of Directors has established six standing committees as follows:
| Director | Audit Committee |
Compensation Committee |
Executive Committee |
Finance Committee |
Governance Committee |
Safety, Health and Environmental Affairs Committee | ||||||
| Thomas A. Fanning |
• | • | ||||||||||
| O. B. Grayson Hall, Jr. |
• | • | Chair | |||||||||
| J. Thomas Hill |
Chair | |||||||||||
| Cynthia L. Hostetler |
• | • | Chair | |||||||||
| Richard T. O’Brien |
Chair | • | • | |||||||||
| James T. Prokopanko |
Chair | • | • | |||||||||
| Kathleen L. Quirk |
• | • | ||||||||||
| David P. Steiner |
• | • | ||||||||||
| Lee J. Styslinger, III |
• | • | ||||||||||
| Kathleen Wilson-Thompson |
• | • | Chair | |||||||||
| Number of meetings held in 2017 | 7 | 6 | 0 | 4 | 5 | 2 |
| 20
|
CORPORATE GOVERNANCE | Vulcan 2018 Proxy Statement | ||||||||
Table of Contents
| Vulcan 2018 Proxy Statement | CORPORATE GOVERNANCE | 21
| ||||||||
Table of Contents
| 22
|
CORPORATE GOVERNANCE | Vulcan 2018 Proxy Statement | ||||||||
Table of Contents
| Vulcan 2018 Proxy Statement | CORPORATE GOVERNANCE | 23
| ||||||||
Table of Contents
Table of Contents
ACCOUNTING FIRM
FEES PAID TO INDEPENDENT REGISTERED PUBLIC ACCOUNTING FIRM
Aggregate fees billed to us for the fiscal years ended December 31, 2017 and 2016, by Deloitte & Touche LLP, and its affiliates (all of which are subsidiaries of Deloitte, LLP, the United States member firm of Deloitte Touche Tohmatsu Limited) were as follows:
PRE-APPROVAL OF SERVICES PERFORMED BY INDEPENDENT REGISTERED PUBLIC ACCOUNTING FIRM
| Vulcan 2018 Proxy Statement | INDEPENDENT REGISTERED PUBLIC ACCOUNTING FIRM | 25
| ||||||||
Table of Contents
SECURITY OWNERSHIP OF CERTAIN BENEFICIAL OWNERS AND MANAGEMENT
SECURITY OWNERSHIP OF CERTAIN BENEFICIAL OWNERS
The following is information regarding persons known to us to have beneficial ownership of more than 5% of the outstanding common stock of our company, which is our only outstanding class of voting securities, as of the dates indicated in the footnotes below.
| Name and Address of Beneficial Owner |
Amount and Nature of (# of shares) |
Percent of Class |
||||||
| The Vanguard Group, Inc. 100 Vanguard Blvd Malvern, PA 19355 |
13,687,934(1) | 10.3% | ||||||
| State Farm Mutual Automobile Insurance Company and Affiliates One State Farm Plaza Bloomington, IL 61710 |
12,745,368(2) | 9.6% | ||||||
| BlackRock, Inc. 55 East 52nd Street New York, NY 10055 |
10,394,204(3) | 7.9% | ||||||
| T. Rowe Price Associates, Inc. 100 E. Pratt Street Baltimore, MD 21202 |
9,035,712(4) | 6.8% | ||||||
| (1) | Based on information contained in a Schedule 13G/A, filed with the SEC on February 9, 2018. The Vanguard Group (Vanguard) reports sole power to vote (or direct the vote of) 187,416 shares and sole power to dispose (or direct the disposition of) 13,480,155 shares. Vanguard also reports shared power to vote (or direct the vote of) 24,918 shares and shared power to dispose (or direct the disposition of) 207,779 shares. Vanguard reports an aggregate amount of 13,687,934 shares beneficially owned. |
| (2) | Based on information contained in a Schedule 13G, filed with the SEC on February 8, 2018, by State Farm Mutual Automobile Insurance Company and various affiliated entities (State Farm). State Farm reports sole power to vote (or direct the vote of) and dispose (or direct the disposition of) 12,680,600 shares and the shared power to vote (or direct the vote of) and dispose (or direct the disposition of) 64,768 shares. State Farm reports an aggregate amount of 12,745,368 beneficially owned shares. Each entity listed in the Schedule 13G expressly disclaims beneficial ownership as to all shares as to which such entity has no right to receive the proceeds of the sale of the security and disclaims that it is part of a group. |
| (3) | Based on information contained in a Schedule 13G/A, filed with the SEC on February 8, 2018. BlackRock, Inc. (BlackRock) reports sole power to vote (or direct the vote of) 8,955,243 shares and sole power to dispose (or direct the disposition of) 10,394,204 shares. BlackRock reports an aggregate amount of 10,394,204 shares beneficially owned. Various persons have the right to receive, or the power to direct, the receipt of dividends and the proceeds from the sale of the company’s common stock. No one person’s interest in the company’s common stock is more than five percent of the total outstanding common shares. |
| (4) | Based on information contained in a Schedule 13G/A filed with the SEC on February 14, 2018. T. Rowe Price Associates, Inc. (Price Associates) reports sole power to vote (or direct the vote of) 3,764,311 shares and sole power to dispose (or direct the disposition of) 9,026,862 shares. Price Associates reports an aggregate amount of 9,035,712 beneficially owned shares. These securities are owned by various individuals and institutional investors for which Price Associates serves as an investment adviser with power to direct investments and/or sole power to vote the securities. Price Associates declares that the filing of the Schedule 13G/A shall not be construed as an admission that Price Associates is the beneficial owner of the securities referred to, which beneficial ownership is expressly denied. |
| 26
|
SECURITY OWNERSHIP OF CERTAIN BENEFICIAL OWNERS AND MANAGEMENT | Vulcan 2018 Proxy Statement | ||||||||
Table of Contents
SECURITY OWNERSHIP OF MANAGEMENT
The following table sets forth information, unless otherwise indicated, as of March 1, 2018, regarding beneficial ownership of our company’s common stock, our only outstanding class of equity securities, by each of our directors, each of our NEOs identified in the Summary Compensation Table on page 48 of this proxy statement, and our directors and executive officers as a group. We believe that, for each of the individuals set forth in the table below, such individual’s financial interest is aligned with the interests of our other shareholders because the value of such individual’s total holdings will increase or decrease in line with the price of our common stock.
| Name of Beneficial Owner | Amount and Nature of Beneficial Ownership (# of shares) | |||||||||||||||
| Non-employee Directors(1) | Shares Owned Directly or Indirectly |
Phantom Shares Held Pursuant to Plans |
Total | Percent of Class |
||||||||||||
| Thomas A. Fanning |
0 | 5,002 | 5,002 | * | ||||||||||||
| O. B. Grayson Hall, Jr. |
0 | 8,053 | 8,053 | * | ||||||||||||
| Cynthia L. Hostetler |
0 | 2,482 | 2,482 | * | ||||||||||||
| Richard T. O’Brien |
0 | 14,929 | 14,929 | * | ||||||||||||
| James T. Prokopanko |
0 | 12,818 | 12,818 | * | ||||||||||||
| Kathleen L. Quirk(2) |
0 | 435 | 435 | * | ||||||||||||
| David P. Steiner(3) |
0 | 1,599 | 1,599 | * | ||||||||||||
| Lee J. Styslinger, III |
4,002 | 11,804 | 15,806 | * | ||||||||||||
| Kathleen Wilson-Thompson |
0 | 12,818 | 12,818 | * | ||||||||||||
| CEO and other NEOs(4) |
Shares Owned Directly or Indirectly |
Exercisable Options/ SOSARs |
Deferred LTI Payments |
Total | Percent of Class |
|||||||||||||||
| Tom Hill |
75,895 | (5) | 87,002 | 5,679 | 168,576 | * | ||||||||||||||
| John McPherson |
61,322 | (6) | 427,884 | 0 | 489,206 | * | ||||||||||||||
| Stan Bass |
35,637 | (7) | 50,130 | 10,798 | 96,565 | * | ||||||||||||||
| Michael Mills |
49,943 | (8) | 35,575 | 0 | 85,518 | * | ||||||||||||||
| Tom Baker |
15,002 | (9) | 1,834 | 0 | 16,836 | * | ||||||||||||||
| All Directors and Executive Officers as a group (19 persons) | 1,081,754 | 0.81% | ||||||||||||||||||
| * | Less than 1% of issued and outstanding shares of our company’s common stock. |
| (1) | Beneficial ownership for our non-employee directors includes all shares held of record or in street name and, if noted, by trusts or family members. The amounts also include non-forfeitable phantom shares settled in stock accrued under the Directors’ Deferred Compensation Plan and Deferred Stock Units (DSUs) awarded under the 2006 Plan and the 2016 Plan. |
| (2) | Ms. Quirk was elected to the Board in October 2017. |
| (3) | Mr. Steiner was elected to the Board in February 2017. |
| (4) | Beneficial ownership for the executive officers includes shares held of record or in street name. The amounts also include shares that may be acquired upon the exercise of options which are presently exercisable or that will become exercisable on or before April 30, 2018, shares credited to the executives’ accounts under our 401(k) Plan and any long-term incentive (LTI) payments from DSUs, Performance Share Units (PSUs) and Restricted Stock Units (RSUs) that may have been deferred into the Executive Deferred Compensation Plan. |
| (5) | Includes 19,047 shares held in 401(k) plan and excess benefit plan. |
| (6) | Includes 8,712 shares held in 401(k) plan and excess benefit plan. |
| (7) | Includes 13,698 shares held in 401(k) plan and excess benefit plan. |
| (8) | Includes 9,051 shares held in 401(k) plan and excess benefit plan. |
| (9) | Includes 267 shares held in 401(k) plan and excess benefit plan. |
| Vulcan 2018 Proxy Statement | SECURITY OWNERSHIP OF CERTAIN BENEFICIAL OWNERS AND MANAGEMENT | 27
| ||||||||
Table of Contents
The table below sets forth information regarding the number of shares of our common stock authorized for issuance under our equity compensation plans as of December 31, 2017.
| EQUITY COMPENSATION PLAN INFORMATION | ||||||||||||
| Plan Category | Number
of (a) |
Weighted- Average exercise price of outstanding options, warrants and rights (b) |
Number of securities remaining available for future issuance under equity compensation plans (excluding securities reflected in column (a)) (c) |
|||||||||
| Equity compensation plans approved by security holders(1): |
||||||||||||
| 2000 Florida Rock Industries Amended & Restated Stock Plan(2) | ||||||||||||
| Stock-Only Stock Appreciation Rights |
27,320 | $ | 45.52 | |||||||||
| Total 2000 Florida Rock Industries Amended & Restated Stock Plan |
27,320 | 0(2) | ||||||||||
| 2006 Omnibus Long-Term Incentive Plan(3) |
||||||||||||
| Stock-Only Stock Appreciation Rights |
2,135,967 | $ | 50.47 | |||||||||
| Performance Share Units |
653,568 | |||||||||||
| Restricted Stock Units |
67,682 | |||||||||||
| Deferred Stock Units for Non-employee Directors |
104,352 | |||||||||||
| Total 2006 Omnibus Long-Term Incentive Plan |
2,961,569 | 2,359,256(3) | ||||||||||
| 2016 Omnibus Long-Term Incentive Plan |
||||||||||||
| Stock-Only Stock Appreciation Rights |
79,200 | $122.39 | ||||||||||
| Performance Share Units |
121,310 | |||||||||||
| Restricted Stock Units |
41,620 | |||||||||||
| Deferred Stock Units for Non-employee Directors |
22,280 | |||||||||||
| Total 2016 Omnibus Long-Term Incentive Plan |
264,410 | 7,586,360 | ||||||||||
| Equity compensation plans not approved by security holders |
NONE | NONE | ||||||||||
| Total of All Plans |
3,253,299 | 9,945,616 | ||||||||||
| 28
|
EQUITY COMPENSATION PLANS | Vulcan 2018 Proxy Statement | ||||||||
Table of Contents
COMPENSATION DISCUSSION AND ANALYSIS
| Table of Contents | ||||
| 29 | ||||
| 29 | ||||
| 34 | ||||
| 37 | ||||
| 41 | ||||
| 46 | ||||
| 46 |
The Compensation Discussion and Analysis describes the company’s executive compensation philosophy and programs for our named executive officers (NEOs). The company’s NEOs for 2017 were:
| Name
|
Principal Position | |
| J. Thomas Hill | Chairman, President and Chief Executive Officer | |
| John R. McPherson | Executive Vice President and Chief Financial and Strategy Officer | |
| Stanley G. Bass | Chief Growth Officer | |
| Michael R. Mills | Chief Administrative Officer | |
| Thompson S. Baker, II | Senior Vice President |
| Vulcan 2018 Proxy Statement | COMPENSATION DISCUSSION AND ANALYSIS | 29
| ||||||||
Table of Contents
2017 PERFORMANCE
FINANCIAL PERFORMANCE
Vulcan faced a challenging operating environment in 2017 largely due to record rainfall and flooding in California during the first quarter and Hurricanes Harvey and Irma and Tropical Storm Nate, which severely impacted our business from Texas, across the Southeast and up to North Carolina, during the second half of the year.
Despite these challenges, we achieved record revenues and net earnings in 2017 and remained diligent in executing our strategic plan and opportunistically expanding our company in high-growth markets.
We also further strengthened our balance sheet in 2017 by reducing our weighted-average interest rate below five percent and extending our weighted-average debt life to sixteen years, which better matches the long-lived assets in which we invest.
| (1) | Adjusted EBITDA is a non-GAAP financial measure. We provide a reconciliation of Adjusted EBITDA to the most directly comparable GAAP financial measures in Annex A to this proxy statement. |
| (2) | For the period beginning January 1, 2015 and ending December 31, 2017, assuming quarterly reinvestment of dividends. |
| 30
|
COMPENSATION DISCUSSION AND ANALYSIS | Vulcan 2018 Proxy Statement | ||||||||
Table of Contents
SAFETY PERFORMANCE
Our collective safety performance in 2017 was the best in our company’s 60-year history. Injury rates were reduced by one-third from the previous year, to a world-class level of 0.97 injury incidents per 200,000 hours worked, and our MSHA citation rate was 0.72 compared to an industry average of 2.13. Our safety performance is indicative of our culture and represents an engaged workforce that believes in employee ownership of safety and operational performance. We believe that the more engaged our managers are with their teams and the more engaged our employees are with each other, the safer and more effective our operations will become.
|

|
GROWTH AND ACQUISITION PERFORMANCE
We remain active in the pursuit of acquisitions and other value-creating growth investments. We believe this is one of the highest and best uses for the deployment of our capital. During 2017, we closed acquisitions totaling approximately $842 million. These acquisitions strategically enhanced our existing positions in Arizona, California, Florida, Georgia, Illinois, New Mexico, South Carolina, Tennessee and Virginia. In addition, we also invested $168 million in internal growth projects to secure new aggregates reserves, develop new production sites, enhance distribution capabilities and support the targeted growth of our asphalt and concrete operations. We believe this strategic, disciplined growth will improve our capacity to serve the needs of our customers and improve our core profitability.

| (1) | Aggregates facilities include both aggregates quarries and sales yards. |
| Vulcan 2018 Proxy Statement | COMPENSATION DISCUSSION AND ANALYSIS | 31
| ||||||||
Table of Contents
CONTINUOUS IMPROVEMENT PERFORMANCE
We remain focused on continuous improvements and making Vulcan an even better company. In 2017, we leveraged collaboration and performance improvement across the company’s operating divisions through our One Vulcan, locally led initiatives. These initiatives involve the following five strategic areas:
| • | Commercial Excellence |
| • | Operations Excellence |
| • | Market Strategy |
| • | Financial Excellence, and |
| • | People and Values. |
By combining company-wide performance improvement with strong local market leadership and autonomy, we believe we can achieve better sales and service, improved operations, faster growth, increased profitability and higher returns on capital.
COMPENSATION MIX
To ensure management’s interests are aligned with those of shareholders and the performance of our company, a substantial portion of our NEOs’ compensation is at-risk and will vary above or below target levels depending on company performance. Additionally, in order to align our executives’ interests with those of our shareholders, we have historically paid a majority of NEO compensation through long-term performance-based equity awards. In recent years, the Compensation Committee has awarded PSUs and SOSARs in order to tie executive compensation closely to company performance, including stock price growth. Of cash compensation paid, roughly half has historically been performance-based. The diagrams below show the percentage of our NEOs’ 2017 target compensation that was performance-based and at-risk in addition to the percentage each element of compensation comprises of our NEOs’ total compensation.
| (1) | SOSARs means Stock-Only Stock Appreciation Rights calculated based on grant date fair value. See page 44 for more information. |
| (2) | Performance Shares refers to Performance Share Units (PSUs) calculated based on grant date fair value. See page 43 for more information. |
SHAREHOLDER ENGAGEMENT AND SAY ON PAY RESULTS
At our 2017 Annual Meeting of Shareholders, over 97% of the votes cast were in favor of the advisory vote to approve compensation of our NEOs (“Say on Pay” vote). We believe the results of the 2017 Say on Pay vote demonstrate continued strong shareholder support for our current compensation program. Furthermore, during our shareholder engagement, shareholders were generally supportive of our executive compensation programs and accompanying disclosures.
We believe that the results of the Say on Pay vote and feedback from our shareholder outreach efforts, demonstrate our shareholders’ overall satisfaction and support of Vulcan’s executive compensation and governance practices.
| 32
|
COMPENSATION DISCUSSION AND ANALYSIS | Vulcan 2018 Proxy Statement | ||||||||
Table of Contents
EXECUTIVE COMPENSATION PRACTICES
The table below highlights certain of our executive compensation practices, including practices we have implemented that drive performance as well as those not implemented because we do not believe they would serve our shareholders’ interests.
| WHAT WE DO |
| • Pay for performance. Tie pay to performance by ensuring that a significant portion of NEO compensation is performance-based and at-risk.
|
| • Median compensation targets. All compensation elements of our executives are generally targeted at the market median (50th percentile), subject to individual variation based on the Compensation Committee’s assessment of each executive’s performance, experience and responsibilities as well as internal equity considerations.
|
| • PSUs are a substantial portion of LTI. PSU grants, tied to our relative performance against the S&P 500, comprised approximately 73% of the total value of annual long-term incentive grants made to our NEOs in 2017. SOSARs comprised the remaining 27%.
|
| • “Double-Trigger” change of control requirement for long-term incentive awards. Our 2016 Plan provides that long-term incentive awards will not vest upon a change of control of Vulcan unless: (i) awards are not assumed, substituted or continued by the surviving company, or (ii) if such awards are assumed, substituted or continued by the surviving company, only upon a participant’s qualifying termination of employment.
|
| • Robust share ownership guidelines with an equity retention requirement. We have stock ownership guidelines of 7 times base salary for the CEO and 4 to 5 times base salary for our other NEOs and an equity retention requirement of 50% of net shares paid as incentive compensation until ownership guidelines are met.
|
| • Clawback Policy. We have a compensation recovery (clawback) policy that requires officers to forfeit certain cash-based incentive compensation and/or equity-based incentive compensation if the company restates its financial statements due to the officer’s misconduct.
|
| • No pledging of shares. Our directors and officers are not permitted to pledge Vulcan shares as collateral for loans or any other purpose.
|
| • No hedging. We prohibit directors and officers from engaging in short sales of Vulcan stock or similar transactions intended to hedge or offset the market value of Vulcan stock owned by them.
|
| • Independent compensation consultant. The Compensation Committee uses an independent compensation consultant that provides no other services to the company. |
| WHAT WE DON’T DO |
| • Employment contracts. None of our NEOs have employment contracts that guarantee continued employment.
|
| • Dividends on unvested PSUs. Our PSUs require 3 or 4 years to vest and dividends are neither paid nor accrued during such vesting period.
|
| • Repricing. Stock options and SOSAR exercise prices are set equal to the grant date market price and may not be repriced.
|
| • Excessive Change of Control Agreements. Neither our Change of Control Agreements nor our Change of Control Plan provide for: |
| • “Single-trigger” termination right; |
| • Inclusion of long-term incentive value in the calculation of cash severance; or |
| • Excise tax gross-ups. |
| Vulcan 2018 Proxy Statement | COMPENSATION DISCUSSION AND ANALYSIS | 33
| ||||||||
Table of Contents
Executive Compensation Program in Detail
COMPENSATION PHILOSOPHY
The dedication and performance of our employees, including our NEOs, enable us to accomplish our corporate goals. The compensation program for our NEOs is intended to motivate them to achieve Vulcan’s strategic goals and operational plans while adhering to our high ethical business standards.
Vulcan’s executive compensation program is centered on a pay-for-performance philosophy, which aligns executive compensation with shareholder value and ultimately impacts our compensation program design.
| OUR THREE COMPENSATION PRINCIPLES | ||
| Link a significant portion of compensation to performance.
We believe that compensation levels should reflect performance—both the performance of Vulcan and the performance of the recipient. This is accomplished by:
• Motivating, recognizing and rewarding individual excellence
• Paying short-term cash bonuses based upon company financial performance and individual performance
• Linking long-term compensation to our company’s stock performance through the use of PSUs and SOSARs
|
Maintain competitive compensation levels.
We strive to offer programs and levels of compensation that are competitive with those offered by industrial companies of similar size, value and complexity in order to attract, retain and reward our NEOs.
Align management’s interests with those of shareholders.
Our programs encourage NEOs to remain with us and to increase long-term shareholder value by granting long-term equity-based awards each year and tying short-term cash bonuses to the achievement of economic profit targets closely aligned with the creation of shareholder value. | |
BENCHMARKING COMPENSATION AND PEER GROUP DEVELOPMENT
On an annual basis, the Compensation Committee reviews a benchmarking analysis of total compensation for our CEO and other NEOs relative to market data. Our compensation consultant develops market data appropriate for a company of our size using a combination of peer group data and market surveys.
General
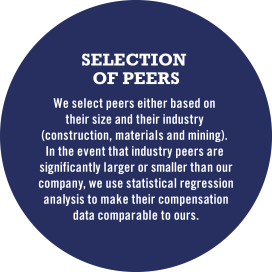
Compensation data from our peer group companies is adjusted to eliminate distortions that may result from companies in the peer group being of differing sizes. Adjustments are made through the use of statistical regression analysis of total revenues for companies in the peer group, which is a common practice and used extensively in the compensation consulting industry. This technique considers the relationship between actual compensation and revenue levels for the peer group companies and enables us to estimate compensation levels appropriate for an organization of our size.
| 34
|
COMPENSATION DISCUSSION AND ANALYSIS | Vulcan 2018 Proxy Statement | ||||||||
Table of Contents
Peer Group
Our peer group for 2017 compensation decisions was comprised of 28 companies from the following industries: Construction Materials, Building Products, Construction Equipment, Engineering and Construction, Forest Products, Coal Mining, Metals Mining and Metals Producers/Manufacturers. Our peer group (whose median market capitalization at year end was approximately $14.0 billion as compared to our market capitalization at year end of approximately $17.0 billion) consisted of the following companies:
| Vulcan 2018 Proxy Statement | COMPENSATION DISCUSSION AND ANALYSIS | 35
| ||||||||
Table of Contents
KEY PAY ELEMENTS
The following chart summarizes the key pay elements for our NEOs. Each element is described in detail beginning on page 41 in the Section “Elements of Compensation.”
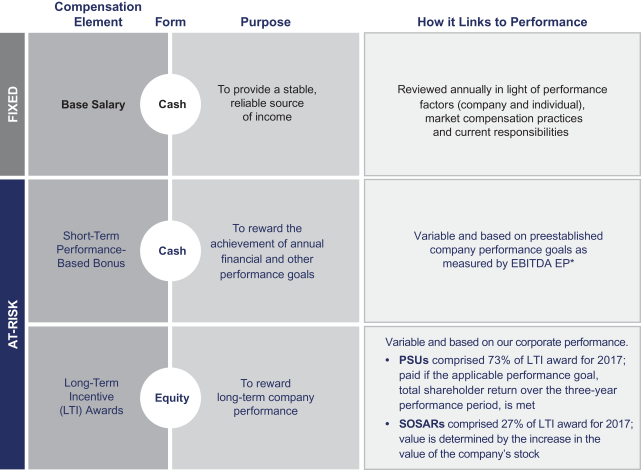
| * | EBITDA EP is a non-GAAP financial measure. See Annex A for a reconciliation of non-GAAP financial measures to our results reported under GAAP. |
| 36
|
COMPENSATION DISCUSSION AND ANALYSIS | Vulcan 2018 Proxy Statement | ||||||||
Table of Contents
|
COMPENSATION COMMITTEE
|
Composed entirely
of |
| • Annually reviews and approves corporate goals and objectives relevant to CEO’s compensation
|
| • Reviews CEO’s performance and independent compensation consultant’s recommendations and, accordingly, determines CEO’s compensation
|
| • Presents CEO’s overall compensation package to the entire Board of Directors for ratification
|
| • Determines and sets base salary and short- and long-term incentives for other NEOs
|
| • Administers Executive Incentive Plan (EIP), 2006 Omnibus Long-Term Incentive Plan (2006 Plan) and 2016 Omnibus Long-Term Incentive Plan (2016 Plan)
|
| COMPENSATION COMMITTEE CHARTER
The Compensation Committee administers our executive compensation program in accordance with our Compensation Committee Charter. The current charter is available at www.vulcanmaterials.com. On our website, select “Investor Relations,” then “Corporate Governance.” From there, you can visit our “Committees” page, which lists the composition of our board committees as well as their respective charters. |
|
FORMER INDEPENDENT COMPENSATION CONSULTANT |
Compensation Strategies, Inc. |
| CSI was engaged by the Compensation Committee as its independent compensation consultant through July 2017.
In 2017, CSI:
|
| • Provided the Compensation Committee with observations and recommendations on compensation and benefits for our CEO and other NEOs
|
| • Provided its recommendations with respect to Board compensation, as well as its advice on regulatory compliance and development of new programs
|
| • Had representatives attend two meetings of the Compensation Committee in 2017 |
| ABOUT CSI
CSI was engaged by the Compensation Committee and did not provide any other services to the company. The Compensation Committee determined that CSI’s work as the Compensation Committee’s compensation consultant did not present any conflicts of interest. |
| Vulcan 2018 Proxy Statement | COMPENSATION DISCUSSION AND ANALYSIS | 37
| ||||||||
Table of Contents
|
NEW INDEPENDENT
COMPENSATION |
Meridian
Compensation Partners, LLC
|
| In July 2017, following a request for proposal process, the Compensation Committee decided to retain Meridian as its new independent compensation consultant.
In 2017, Meridian:
|
| • Provided the Compensation Committee with observations and recommendations on compensation and benefits for our CEO and other NEOs
|
| • Performed interviews with the Chair of the Compensation Committee and members of our management team to assist in the transition between independent compensation consultants and to gain a more in-depth understanding of our current programs and processes
• Advised and assisted the Compensation Committee in the implementation of a new peer group for 2018 compensation decisions
• Conducted a benchmarking market study and analysis of executive compensation practices to ensure that our compensation programs are reasonable and competitive
|
| • Had representatives attend two meetings of the Compensation Committee in 2017
|
| ABOUT MERIDIAN
Meridian is engaged by and reports to the Compensation Committee, and occasionally meets with management to discuss compensation initiatives and issues. Meridian does not provide any other services to the company. The Compensation Committee determined that Meridian’s work as the Compensation Committee’s compensation consultant did not present any conflicts of interest. |
|
MANAGEMENT
|
| • Supports the Compensation Committee by providing information and analyses, and occasionally meets with our independent compensation consultant to discuss compensation initiatives and competitive practices
|
| • The CEO is responsible for establishing annual performance goals for each of the other NEOs
|
| • The CEO is responsible for conducting an annual performance evaluation of each of the other NEOs against pre-established goals
|
| • Based on performance and competitive benchmarking reports, the CEO makes recommendations to the Compensation Committee for the compensation of the other NEOs |
| 38
|
COMPENSATION DISCUSSION AND ANALYSIS | Vulcan 2018 Proxy Statement | ||||||||
Table of Contents
THE ROLE OF INDIVIDUAL PERFORMANCE
Each NEO’s base salary and annual bonus is determined through thoughtful consideration of individual performance, company performance, competitive market pay as well as individual responsibilities and experience.
CEO Evaluation
With respect to our CEO, the independent members of our Board use a formal process for evaluating his performance. Each Board member provides a written evaluation in the areas of leadership, strategic planning, financial performance, safety performance, customer relations, personnel management, communications, board relations and overall performance. In its performance deliberations, the Compensation Committee has access to the input from the full Board and independently assesses the CEO’s performance.
Other NEOs Evaluation
For our NEOs other than our CEO, the Compensation Committee reviews performance reports, as prepared by our CEO. Individual performance is based primarily on the extent to which each NEO achieves a series of set goals throughout the period.
The following are notable individual accomplishments of each NEO in 2017.
| TOM HILL
Chairman, President and Chief Executive Officer |
Mr. Hill’s accomplishments during the year included:
• Leading the organization to the safest year in Vulcan’s history, reducing our injury incident rate by 29%, through employee engagement and safety initiatives
• Providing proactive capital stewardship, resulting in financing of approximately $1 billion of acquisitions and other growth initiatives, and reinvesting in core maintenance capital while reducing the company’s cost of capital
• Enhancing the organization’s effectiveness through the implementation of “One Vulcan” process improvements in our operations, sales and support functions
• Strengthening company-wide understanding of “The Vulcan Way” as the embodiment of the company’s culture, as evidenced by increased organizational engagement and appreciation of Vulcan’s mission and values; Vulcan ranked in the top decile of surveyed organizations in McKinsey & Company’s Organizational Health Index | |||||
| JOHN MCPHERSON
Executive Vice President and Chief Financial and |
Mr. McPherson’s accomplishments during the year included:
• Continuing to build underlying company financial strength: pushing out debt maturities, reducing cost of debt and returning the company to full investment-grade status
• Strengthening the organization’s ability to deliver against intermediate-term growth expectations, including driving continuous improvement in our logistics and procurement sourcing efforts
• Aligning and strengthening enterprise leadership capabilities in our support functions through strategic organizational design initiatives
• Driving and supporting continued improvements in our performance management and business planning processes |
| Vulcan 2018 Proxy Statement | COMPENSATION DISCUSSION AND ANALYSIS | 39
| ||||||||
Table of Contents
| STAN BASS
Chief Growth Officer |
Mr. Bass’ accomplishments during the year included:
• Leading our growth strategy through the acquisition of eight construction materials businesses for $842 million; also led strategic internal growth projects, including greenfield initiatives and reserve development activities that totaled $168 million
• Leading the development and implementation of company-wide land management strategies and enhancing revenue through alternative sources including rental income, recycled materials, landfills, mitigation properties and water recharge pits
• Guiding the implementation of strategic commercial excellence initiatives to further enhance our competitive market advantages and sales capabilities throughout the company
• Partnering with local leadership teams to develop market-specific growth strategies aligned with our overall organizational “aggregates centric” focus | |||||
| MICHAEL MILLS
Chief Administrative Officer |
Mr. Mills’ accomplishments during the year included: • Driving a “high performance, high value” culture and accompanying habits through initiatives focused on enhancing safety, diversity and inclusion and performance management
• Developing improved enterprise-wide, strategic talent management processes
• Enhancing the company’s compensation and benefits planning and delivery practices
• Continuing to lead the international strategy for the organization, including managing our Mexican-related investments, mentoring international leadership and pursuing additional opportunities for business development | |||||
| TOM BAKER
Senior Vice President |
Mr. Baker’s accomplishments during the year included:
• Leading successful sales and operations efforts in four of our operating divisions while engaging local management teams in the development and implementation of strategic action plans
• Leveraging experience and industry knowledge to support organizational priorities, specifically in the areas of acquisitions, divestitures and other business development projects
• Providing executive support for safety initiatives in the divisions for which he is responsible, resulting in a 46% decrease in injury incident rates from 2016 to 2017 and surpassing the established safety targets
• Further strengthening organizational talent capabilities through the mentorship of high potential leaders |
| 40
|
COMPENSATION DISCUSSION AND ANALYSIS | Vulcan 2018 Proxy Statement | ||||||||
Table of Contents
Our elements of compensation, all of which are discussed in greater detail below, include:
BASE SALARY
The base salary element of our compensation program is designed to be competitive with compensation paid to similarly-situated, competent and skilled executives.
The Compensation Committee uses the information and procedures described below to set base salaries tied to individual performance, contribution to business results and market compensation comparisons. The Compensation Committee determines if base salary adjustments are appropriate for our NEOs after considering all of the following factors:
| • | NEO’s performance relative to the pre-established goals and objectives in his areas of responsibility |
| • | NEO’s overall managerial effectiveness with respect to leadership planning, personnel development, communications, regulatory compliance and similar matters |
| • | Competitive pay levels for similarly-situated executives set forth in compensation surveys and our peer group |
| • | Changes in NEO’s responsibilities |
| • | Marketplace trends in salary increases |
| • | NEO’s level of expertise and potential for future contributions to the company, retention risks, and fairness in view of our overall salary increases |
| • | Economic environment and its impact on the company |
We review the base salaries of the NEOs annually, and also at the time of any promotion or change in responsibilities. The following table sets forth the annual base salary of each NEO at December 31, 2017:
| NAME | POSITION | 2017 SALARY | ||||
| Tom Hill |
Chairman, President and Chief Executive Officer | $ | 1,020,000 | |||
| John McPherson |
Executive Vice President and Chief Financial and Strategy Officer | $ | 804,000 | |||
| Stan Bass |
Chief Growth Officer | $ | 590,000 | |||
| Michael Mills |
Chief Administrative Officer | $ | 590,000 | |||
| Tom Baker |
Senior Vice President |
$ | 550,000 | |||
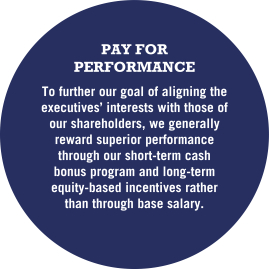
| Vulcan 2018 Proxy Statement | COMPENSATION DISCUSSION AND ANALYSIS | 41
| ||||||||
Table of Contents
SHORT-TERM PERFORMANCE-BASED BONUS
Our short-term cash bonus incentive program is designed to motivate our executives, including the NEOs, and reward them with cash payments for achieving quantifiable, pre-established business results. We pay short-term incentives to our NEOs under the shareholder-approved Executive Incentive Plan (EIP).
Determining Bonus Payable
We use EBITDA Economic Profit (EBITDA EP*), which incorporates Return on Capital Employed (ROCE), as our short-term incentive metric. We believe this metric provides an incentive for management to carefully consider deployment of capital as the company increases capital expenditures during the current construction up cycle.
EBITDA EP measures the extent to which Adjusted EBITDA exceeds an operating capital charge. Adjusted EBITDA EP is based on Adjusted EBITDA, but includes other performance adjustments, such as business acquisition performance versus planned performance. The operating capital charge is based on our company’s average assets and liabilities associated with Adjusted EBITDA EP multiplied by the estimated pretax cost of capital. We believe that changes in EBITDA EP positively correlate with changes in shareholder value better than other commonly used financial performance measures.
The 2017 EBITDA EP target of $384.6 million was based on performance during the preceding three years, weighted most heavily on the most recent fiscal year, less certain gains on sales of property or assets. The Compensation Committee determined to pay cash bonuses for 2017 financial performance (as reflected in the table below) based on EBITDA EP of $463.5 million, which was $78.9 million above the target.
The Compensation Committee also considers the company’s safety performance when determining bonuses payable to our NEOs. The company’s actual safety performance is measured against pre-established goals set by the Compensation Committee and can result in an increase in each NEO’s bonus payable by up to 20 bonus points or a decrease of up to 25 bonus points. A bonus point is equal to 1% of the NEO’s performance bonus multiple. For 2017, the company achieved a world-class safety record with a total incident injury rate of 0.97 for every 200,000 employee hours worked. World-class performance is generally recognized as an injury rate of less than 1.0 per 200,000 employee hours worked. As a result, each NEO received an increase of 15 bonus points to his performance bonus multiple used to calculate his bonus for 2017.
| * | EBITDA EP is a non-GAAP measure. See Annex A for a reconciliation of non-GAAP financial measures to our results reported under GAAP. |
Target and Actual Bonus
The table below shows for each NEO the target bonus, the maximum bonus payable under the EIP, and the actual cash bonus paid to each NEO based on 2017 financial performance. The maximum bonuses payable, referenced in the table below, are established under the shareholder-approved EIP. The EIP permits the payment of bonuses based on financial performance of up to 4 times a NEO’s target bonus, but not to exceed $7 million. In 2017, the Compensation Committee took action to limit the maximum cash bonuses for 2017 financial performance to 2.5 times each NEO’s target bonus as set in February 2017.
| Name | Base Salary | “Target Bonus” as a Percentage of Base Salary |
Target Bonus Amount |
Maximum Bonus(1) |
Cash Bonus Paid Based on 2017 Performance |
|||||||||||||||
| Tom Hill |
$ | 1,020,000 | 115% | $ | 1,173,000 | $ | 2,932,500 | $ | 1,722,000 | |||||||||||
| John McPherson |
$ | 804,000 | 110% | $ | 884,400 | $ | 2,211,000 | $ | 1,298,000 | |||||||||||
| Stan Bass |
$ | 590,000 | 80% | $ | 472,000 | $ | 1,180,000 | $ | 692,900 | |||||||||||
| Michael Mills |
$ | 590,000 | 80% | $ | 472,000 | $ | 1,180,000 | $ | 692,900 | |||||||||||
| Tom Baker |
$ | 550,000 | 70% | $ | 385,000 | $ | 962,500 | $ | 577,400 | |||||||||||
| (1) | The amounts in this column equal 2.5 times the target bonus, which is the maximum bonus allowed by the Compensation Committee. |
Meeting the Minimum Performance Threshold under the Executive Incentive Plan (EIP)
In order for the NEOs to be eligible to receive a cash bonus, the company must attain a minimum performance threshold for the year, as established by the Compensation Committee. The minimum performance threshold is used only to determine a NEO’s eligibility for a bonus payment under the EIP. If the minimum performance threshold is met, the actual amount of bonus payable is calculated in accordance with the process described in “Determining Bonus Payable.” For 2017, the minimum threshold was either: (1) cash earnings in the amount of $300 million; or (2) EBITDA in the amount of $500 million. Company performance exceeded each of these established minimum thresholds.
If the Compensation Committee determines that either of the minimum performance thresholds are met, our NEOs may receive a bonus under the EIP, subject to the Compensation Committee’s discretion to adjust the bonus downward. The Compensation Committee cannot exercise upward discretion.
| 42
|
COMPENSATION DISCUSSION AND ANALYSIS | Vulcan 2018 Proxy Statement | ||||||||
Table of Contents
| Vulcan 2018 Proxy Statement | COMPENSATION DISCUSSION AND ANALYSIS | 43
| ||||||||
Table of Contents
The following table shows the payout percentage of 2017 PSUs that will vest over the three-year period based on levels of performance achieved.
| PERFORMANCE SHARE UNIT PAYMENT TABLE(1) | ||||||
| Grant Value |
Three-Year Average TSR Percentile Rank Relative to S&P 500 Index |
% of PSUs Payable(2) |
||||
| Value of awards made to similarly-situated executives at the 50th percentile, based upon a market analysis |
75th or more | 200 | ||||
| 50th | 100 | |||||
| 25th or less | 0 | |||||
| (1) | If the company’s three-year average TSR relative to the S&P 500 Index is at the 50th percentile, the full award is paid. The payout is adjusted incrementally for performance above and below the 50th percentile and can range from 0% to 200%. |
| (2) | Payouts interpolated for returns between 25th and 50th percentile and 50th and 75th percentile. |
Stock-Only Stock Appreciation Rights (SOSARs)
SOSARs entitle the recipient to receive, at the time of exercise, shares of Vulcan stock with a market value equal to the difference between the exercise price (the closing price of Vulcan stock on the date of grant) and the market price of Vulcan stock on the date the SOSARs are exercised. SOSARs have a ten-year term and vest at a rate of one-third annually over the first three years of their term.
Payments of Prior Grants
In February 2017, our NEOs received payment for PSUs that were granted in 2013 which vested on December 31, 2016 because the applicable performance criteria were satisfied. These PSUs were paid out at 150.1% of the amount of the original grant made in 2013. The PSU payment percentage of 150.1% was based on TSR performance of our common stock relative to the TSR performance of the companies that comprise the S&P 500 Index during the four-year performance period.
| PAYMENT CALCULATION FOR PSUs GRANTED IN 2013 PAID FEBRUARY 16, 2017 |
||||||||||||
| Name | Units Granted in 2013 |
Percentage Payable |
Units Payable |
|||||||||
| Tom Hill |
7,000 | 150.1% | 10,507 | |||||||||
| John McPherson |
8,100 | 150.1% | 12,159 | |||||||||
| Stan Bass |
7,000 | 150.1% | 10,507 | |||||||||
| Michael Mills |
7,000 | 150.1% | 10,507 | |||||||||
| Tom Baker(1) |
* | * | * | |||||||||
| (1) | Mr. Baker rejoined Vulcan in 2017 and therefore did not receive PSUs in 2013. |
Additionally, In December 2017, Messrs. Hill, McPherson and Mills each received payment for 20,000 Restricted Stock Units (RSUs) that were granted in 2013, as part of our succession planning and retention efforts. These RSUs cliff vested on December 20, 2017.
| 44
|
COMPENSATION DISCUSSION AND ANALYSIS | Vulcan 2018 Proxy Statement | ||||||||
Table of Contents
RETIREMENT BENEFITS
Our company provides the following retirement benefits to our NEOs:
| Benefit | Background | |
| Retirement Plan* | This pension plan covers all salaried employees of our company hired prior to July 15, 2007. As of December 31, 2013, benefits under the Retirement Plan were frozen. The plan was amended to freeze service accruals effective December 31, 2013 and pay accruals effective December 31, 2015. | |
| Supplemental Plan* | The Unfunded Supplemental Benefit Plan provides for benefits that are curtailed under the Retirement Plan and the 401(k) Plan due to Internal Revenue Service pay and benefit limitations for qualified plans. This Plan is designed to provide retirement income benefits, as a percentage of pay, which are similar for all employees regardless of compensation levels. The Unfunded Supplemental Benefit Plan eliminates the effect of tax limitations on the payment of retirement benefits, except to the extent that it is an unfunded plan and a general obligation of our company. As of December 31, 2013, pension plan benefits under the Supplemental Retirement Plan were frozen. The plan was amended to freeze service accruals effective December 31, 2013 and pay accruals effective December 31, 2015. Supplemental 401(k) benefits continue to accrue under this plan. | |
| 401(k) Plan | This plan has two components: (1) an employee contribution feature with company matching and (2) a profit-sharing feature. | |
| *A discussion of all retirement benefits provided to the NEOs is set forth under the heading “Retirement and Pension Benefits” beginning on page 52. | ||
| Vulcan 2018 Proxy Statement | COMPENSATION DISCUSSION AND ANALYSIS | 45
| ||||||||
Table of Contents
In order to align the interests of the NEOs with our shareholders’ interests and to promote a long-term focus for these officers, our company has executive stock ownership guidelines for the officers of our company. The guidelines are based on management’s and the compensation consultant’s assessment of market practice. The stock ownership requirements are higher for the CEO than for the other NEOs. The table below shows the guidelines for the NEOs, expressed as a multiple of base salary:
Risk, Accounting and Tax Considerations
Our compensation programs are balanced, focused and give considerable weight to the long-term performance of our company. Under this structure, the highest amount of compensation can only be achieved through consistent superior performance over sustained periods of time. Goals and objectives reflect a balanced mix of quantitative and qualitative performance measures to avoid excessive weight on a single performance measure. Likewise, the elements of compensation are balanced among current cash payments and long-term equity-based incentive awards. The Compensation Committee retains the discretion to adjust compensation for quality of performance and adherence to our company’s values.
Based on the foregoing features of our compensation programs, the Compensation Committee has concluded that risks arising from compensation policies and practices for employees of the company and its affiliates are not reasonably likely to have a material adverse effect on the company as a whole.
In administering the compensation program for NEOs, the Compensation Committee considers the applicability of Section 162(m) of the Code, the consequences under financial accounting standards, the tax consequences in our analysis of total compensation and the mix of compensation elements, base salary, bonus and long-term incentives. Section 162(m) prohibits public companies from taking a tax deduction for compensation that is paid to any one of certain employees in excess of $1,000,000. For tax years prior to January 1, 2018, Section 162(m) allowed us to deduct certain qualified performance-based compensation under Section 162(m). We therefore intended that bonus payments under the EIP and grants of long-term incentives under our 2016 Plan would qualify as qualified performance-based compensation. For taxable years beginning January 1, 2018, the qualified performance-based compensation deduction is no longer available, except in limited situations that are eligible for transition relief. Going forward, we will therefore not be eligible to take a deduction under Section 162(m) for qualified performance-based compensation except in limited grandfathered situations, for which we may not qualify. The Compensation Committee maintains (and has maintained) the discretion to modify compensation that was initially intended to be exempt from Section 162(m), to the extent permitted by applicable law and the relevant governing documents, if it determines that such modifications are consistent with Vulcan’s business needs.
| 46
|
COMPENSATION DISCUSSION AND ANALYSIS | Vulcan 2018 Proxy Statement | ||||||||
Table of Contents
The Compensation Committee has reviewed and discussed the Compensation Discussion and Analysis as set forth above with management and, based on such review and discussions, recommended to the Board of Directors that the Compensation Discussion and Analysis be included in this proxy statement.
Dated: February 8, 2018
COMPENSATION COMMITTEE
James T. Prokopanko, Chair
Thomas A. Fanning
Kathleen Wilson-Thompson
| Vulcan 2018 Proxy Statement | COMPENSATION COMMITTEE REPORT | 47
| ||||||||
Table of Contents
The following table sets forth, for the three most recently completed fiscal years, information concerning the compensation of our NEOs employed as of December 31, 2017:
| Name and Principal Position |
Year | Salary ($) |
Bonus ($) |
Stock ($) |
Option Awards(1) ($) |
Non-Equity Compen- sation(2) |
Change in Pension Value And Nonquali- fied Deferred Compen- sation Earnings(3) ($) |
All Other Compen- sation(4) ($) |
Total ($) |
|||||||||||||||||||||||||||
| J. Thomas Hill Chairman, President & Chief Executive Officer |
|
2017 2016 2015 |
|
|
1,008,334 941,670 891,668 |
|
|
0 0 0 |
|
|
2,808,011 2,826,194 2,312,865 |
|
|
1,027,939 937,320 775,236 |
|
|
1,722,000 2,264,000 1,923,000 |
|
|
342,036 289,682 2,195,294 |
|
|
290,918 272,587 163,523 |
|
|
7,199,238 7,531,453 8,261,586 |
| |||||||||
| John R. McPherson EVP and Chief Financial and Strategy Officer |
|
2017 2016 2015 |
|
|
800,000 773,334 733,338 |
|
|
0 0 0 |
|
|
1,844,593 2,124,034 1,901,190 |
|
|
675,257 706,640 639,318 |
|
|
1,298,300 1,778,000 1,581,000 |
|
|
0 0 0 |
|
|
289,430 288,256 286,473 |
|
|
4,907,580 5,670,264 5,141,319 |
| |||||||||
| Stanley G. Bass Chief Growth Officer |
|
2017 2016 2015 |
|
|
583,335 554,258 562,800 |
(5) (5) |
|
0 0 0 |
|
|
810,681 816,261 1,511,970 |
|
|
296,769 271,560 156,054 |
|
|
692,900 892,000 665,000 |
|
|
190,271 157,618 501,706 |
|
|
137,490 408,898 98,711 |
|
|
2,711,446 3,100,595 3,496,241 |
| |||||||||
| Michael R. Mills Chief Administrative Officer |
|
2017 2016 2015 |
|
|
583,335 530,508 429,508 |
|
|
0 0 0 |
|
|
810,681 816,261 531,435 |
|
|
296,769 271,560 178,707 |
|
|
692,900 898,000 601,000 |
|
|
212,111 178,516 522,763 |
|
|
124,842 110,257 78,028 |
|
|
2,720,638 2,805,102 2,341,441 |
| |||||||||
| Thompson S. Baker(6) Senior Vice President |
2017 | |
444,384 |
|
0 | |
646,195 |
|
|
236,555 |
|
|
577,400 |
|
|
0 |
|
|
25,950 |
|
|
1,930,484 |
| |||||||||||||
| (1) | Pursuant to the rules of the SEC, we have provided a grant date fair value for Stock Awards and Option Awards in accordance with the provisions of FASB ASC Topic 718. For Option Awards (including SOSARs), the fair value is estimated as of the date of grant using the Black-Scholes option pricing model, which requires the use of certain assumptions, including the risk-free interest rate, dividend yield, volatility and expected term. The risk-free interest rate is based on the yield at the date of grant of a U.S. Treasury security with a maturity period equal to or approximating the option’s expected term. The dividend yield assumption is based on our historical dividend payouts adjusted for current expectations of future dividend payouts. The volatility assumption is based on the historical volatility, and expectations regarding future volatility, of our common stock over a period equal to the option’s expected term. The expected term of options granted is based on historical experience and expectations about future exercises and represents the period of time that options granted are expected to be outstanding. For Performance Share Awards, the fair value is estimated on the date of grant using a Monte Carlo simulation model. For the highest performance level the maximum number of shares payable and the estimated grant date value are 47,800 shares ($5,616,022) for Mr. Hill; 31,400 shares ($3,689,186) for Mr. McPherson; 13,800 shares ($1,621,362) for Mr. Bass; 13,800 shares ($1,621,362) for Mr. Mills; and 11,000 shares ($1,292,390) for Mr. Baker. We do not believe that the fair values estimated on the grant date, either by the Black-Scholes model or any other model, are necessarily indicative of the values that might eventually be realized by an executive. |
| (2) | The Executive Incentive Plan (EIP) payments were made on March 14, 2018 for the previous year’s performance. See discussion of the EIP under heading “Compensation Discussion and Analysis” above. |
| (3) | Includes only the amount of change in pension value because our company does not provide any above market earnings on deferred compensation balances. The year over year change in pension value was attributable to two primary factors, which were: (i) aging (one year closer to retirement) and (ii) change in actuarial assumptions (change in interest rate from 3.66% to 3.35%, and mortality table to RP-2014 Health Employee & Annuitant Mortality White Collar Table, adjusted to 2006 base rates, with generational improvements projected using Scale MP-2017). |
| FOOTNOTE 3 Breakout detail of change in pension value shown in table below: |
| Name | Aging (one year ($) |
Change in Assumptions ($) |
Total Change |
|||||||||
| Tom Hill |
191,063 | 150,973 | 342,036 | |||||||||
| John McPherson(a) |
0 | 0 | 0 | |||||||||
| Stan Bass |
94,470 | 95,801 | 190,271 | |||||||||
| Michael Mills |
107,032 | 105,079 | 212,111 | |||||||||
| Tom Baker(a) |
0 | 0 | 0 | |||||||||
| (a) | Messrs. McPherson and Baker were hired after 2007 and are not eligible to participate in the company’s defined benefit plan. |
| 48
|
EXECUTIVE COMPENSATION | Vulcan 2018 Proxy Statement | ||||||||
Table of Contents
| (4) | Includes qualified defined contribution plan contributions, company-paid life insurance premiums, personal use of company automobile, commuting expenses, and personal use of company aircraft, as set forth in the following table. |
| FOOTNOTE 4 Breakout detail of all other compensation shown in table below: |
| Name | Non-Qualified SERP Contributions ($) |
Qualified 401(k) Contributions ($) |
Company Paid Life Insurance Premiums ($) |
Personal Use of Company Automobile ($) |
Commuting Expenses ($) |
Personal Use of Company Aircraft ($) |
Total ($) |
|||||||||||||||||||||
| Tom Hill |
258,130 | 24,150 | 1,440 | 316 | 0 | 6,882 | 290,918 | |||||||||||||||||||||
| John McPherson |
201,160 | 24,150 | 1,440 | 4,934 | 57,746 | 0 | 289,430 | |||||||||||||||||||||
| Stan Bass |
100,948 | 24,150 | 1,440 | 4,594 | 6,358 | 0 | 137,490 | |||||||||||||||||||||
| Michael Mills |
98,675 | 24,150 | 1,440 | 577 | 0 | 0 | 124,842 | |||||||||||||||||||||
| Tom Baker |
10,463 | 14,287 | 1,200 | 0 | 0 | 0 | 25,950 | |||||||||||||||||||||
| (5) | Includes a regional supplement in the amount of $20,750 for 2016 and $114,000 for 2015. |
| (6) | Mr. Baker was rehired by Vulcan on March 10, 2017. |
The following table sets forth the grants of plan-based awards in 2017 to our NEOs:
| ESTIMATED FUTURE PAYOUTS UNDER NON-EQUITY INCENTIVE PLAN AWARDS |
ESTIMATED FUTURE PAYOUTS UNDER EQUITY INCENTIVE PLAN AWARDS (# OF SHARES) |
All Other Stock Awards: Number of Shares of Stock or Units (#) |
All Other (#) |
Exercise or Base Price of Option Awards(1) ($/Sh) |
Grant Date Fair Value of Stock and Option Awards(2) ($) |
|||||||||||||||||||||||||||||||||||||||||||
| Name |
Grant Date |
Threshold
|
Target ($) |
Maximum |
Threshold |
Target |
Maximum |
|||||||||||||||||||||||||||||||||||||||||
| Tom Hill |
2/10/2017 | 0 | 1,173,000 | 2,932,500 | 0 | 23,900 | 47,800 | 0 | 23,900 | 122.60 | 3,835,950 | |||||||||||||||||||||||||||||||||||||
| John McPherson |
2/10/2017 | 0 | 884,400 | 2,211,000 | 0 | 15,700 | 31,400 | 0 | 15,700 | 122.60 | 2,519,850 | |||||||||||||||||||||||||||||||||||||
| Stan Bass |
2/10/2017 | 0 | 472,000 | 1,180,000 | 0 | 6,900 | 13,800 | 0 | 6,900 | 122.60 | 1,107,450 | |||||||||||||||||||||||||||||||||||||
| Michael Mills |
2/10/2017 | 0 | 472,000 | 1,180,000 | 0 | 6,900 | 13,800 | 0 | 6,900 | 122.60 | 1,107,450 | |||||||||||||||||||||||||||||||||||||
| Tom Baker(3) |
3/13/2017 | 0 | 385,000 | 962,500 | 0 | 5,500 | 11,000 | 0 | 5,500 | 119.59 | 882,750 | |||||||||||||||||||||||||||||||||||||
| (1) | Exercise price was determined using the closing price of our common stock on the grant date as required under the 2016 Plan. |
| (2) | Amount represents the grant date fair values calculated in accordance with FASB ASC Topic 718. The grant date fair value of $117.49 for the PSUs granted on February 10, 2017 and March 13, 2017 was calculated using a Monte Carlo simulation model. The grant date fair value of $43.01 for the SOSARs granted on February 10, 2017 and March 13, 2017 was calculated using a Black-Scholes option pricing model. Fair value was calculated on the number of units granted. |
| (3) | Mr. Baker was rehired by Vulcan on March 10, 2017. |
| Vulcan 2018 Proxy Statement | EXECUTIVE COMPENSATION | 49
| ||||||||
Table of Contents
OUTSTANDING EQUITY AWARDS AT FISCAL YEAR-END
Certain information concerning unexercised options and stock awards that have not vested for each of the NEOs outstanding as of December 31, 2017, is set forth in the table below:
| OPTION AWARDS | STOCK AWARDS | |||||||||||||||||||||||||||||||||||||||||||
| Name | Grant Date |
Number
of (#) Exercisable |
Number
of (#) Unexercisable |
Equity Incentive Plan Awards: Number of Securities Underlying Unexer- cised Unearned Options (#) |
Option ($) |
Option Expiration Date |
Number of (#) |
Market Value of Shares or Units of Stock That Have Not Vested(12) ($) |
Equity Incentive Plan Awards: Number of Unearned Shares, Units or Other Rights That Have Not Vested(13) (#) |
Equity Rights That ($) |
||||||||||||||||||||||||||||||||||
| Tom Hill |
2/7/2008 | 2,880 | 0 | 70.69 | 2/7/2018 | |||||||||||||||||||||||||||||||||||||||
| 2/12/2009 | 9,285 | 0 | 47.47 | 2/12/2019 | ||||||||||||||||||||||||||||||||||||||||
| 2/11/2010 | 6,200 | 0 | 43.05 | 2/11/2020 | ||||||||||||||||||||||||||||||||||||||||
| 3/1/2011 | 4,900 | 0 | 43.63 | 3/1/2021 | ||||||||||||||||||||||||||||||||||||||||
| 2/9/2012 | 0(1) | 0 | 0 | n/a | ||||||||||||||||||||||||||||||||||||||||
| 2/7/2013 | 7,000 | 0 | 55.41 | 2/7/2023 | ||||||||||||||||||||||||||||||||||||||||
| 2/13/2014 | 9,375(2) | 3,125 | 66.00 | 2/13/2024 | 20,000(7) | 2,567,400 | ||||||||||||||||||||||||||||||||||||||
| 2/12/2015 | 15,400(3) | 15,400 | 79.41 | 2/12/2025 | 30,900(8) | 3,966,633 | ||||||||||||||||||||||||||||||||||||||
| 2/12/2016 | 8,025(4) | 24,075 | 92.02 | 2/12/2026 | 32,200(9) | 4,133,514 | ||||||||||||||||||||||||||||||||||||||
| 2/10/2017 | 0(5) | 23,900 | 122.60 | 2/10/2027 | 23,900(10) | 3,068,043 | ||||||||||||||||||||||||||||||||||||||
| John McPherson |
11/9/2011 | 355,600 | 0 | 29.05 | 11/9/2021 | |||||||||||||||||||||||||||||||||||||||
| 11/9/2011 | 15,300 | 0 | 29.05 | 11/9/2021 | ||||||||||||||||||||||||||||||||||||||||
| 2/9/2012 | 0(1) | 0 | 0 | n/a | ||||||||||||||||||||||||||||||||||||||||
| 2/7/2013 | 8,100 | 0 | 55.41 | 2/7/2023 | ||||||||||||||||||||||||||||||||||||||||
| 2/13/2014 | 9,375(2) | 3,125 | 66.00 | 2/13/2024 | 20,000(7) | 2,567,400 | ||||||||||||||||||||||||||||||||||||||
| 2/12/2015 | 12,700(3) | 12,700 | 79.41 | 2/12/2025 | 25,400(8) | 3,260,598 | ||||||||||||||||||||||||||||||||||||||
| 2/12/2016 | 6,050(4) | 18,150 | 92.02 | 2/12/2026 | 24,200(9) | 3,106,554 | ||||||||||||||||||||||||||||||||||||||
| 2/10/2017 | 0(5) | 15,700 | 122.60 | 2/10/2027 | 15,700(10) | 2,015,409 | ||||||||||||||||||||||||||||||||||||||
| Stan Bass |
2/12/2009 | 9,630 | 0 | 47.47 | 2/12/2019 | |||||||||||||||||||||||||||||||||||||||
| 2/11/2010 | 9,300 | 0 | 43.05 | 2/11/2020 | ||||||||||||||||||||||||||||||||||||||||
| 3/1/2011 | 5,600 | 0 | 43.63 | 3/1/2021 | ||||||||||||||||||||||||||||||||||||||||
| 2/9/2012 | 0(1) | 0 | 0 | n/a | ||||||||||||||||||||||||||||||||||||||||
| 2/7/2013 | 7,000 | 0 | 55.41 | 2/7/2023 | ||||||||||||||||||||||||||||||||||||||||
| 2/13/2014 | 5,250(2) | 1,750 | 66.00 | 2/13/2024 | 11,200(7) | 1,437,744 | ||||||||||||||||||||||||||||||||||||||
| 2/12/2015 | 3,100(3) | 3,100 | 79.41 | 2/12/2025 | 14,000(11) | 1,797,180 | 6,200(8) | 795,894 | ||||||||||||||||||||||||||||||||||||
| 2/12/2016 | 2,325(4) | 6,975 | 92.02 | 2/12/2026 | 9,300(9) | 1,193,841 | ||||||||||||||||||||||||||||||||||||||
| 2/10/2017 | 0(5) | 6,900 | 122.60 | 2/10/2027 | 6,900(10) | 885,753 | ||||||||||||||||||||||||||||||||||||||
|
Michael Mills |
2/12/2009 | 20,970 | 0 | 47.47 | 2/12/2019 | |||||||||||||||||||||||||||||||||||||||
| 2/11/2010 | 3,500 | 0 | 43.05 | 2/11/2020 | ||||||||||||||||||||||||||||||||||||||||
| 3/1/2011 | 5,600 | 0 | 43.63 | 3/1/2021 | ||||||||||||||||||||||||||||||||||||||||
| 2/9/2012 | 0(1) | 0 | 0 | n/a | ||||||||||||||||||||||||||||||||||||||||
| 2/7/2013 | 7,000 | 0 | 55.41 | 2/7/2023 | ||||||||||||||||||||||||||||||||||||||||
| 2/13/2014 | 5,400(2) | 1,800 | 66.00 | 2/13/2024 | 11,520(7) | 1,478,822 | ||||||||||||||||||||||||||||||||||||||
| 2/12/2015 | 3,550(3) | 3,550 | 79.41 | 2/12/2025 | 7,100(8) | 911,427 | ||||||||||||||||||||||||||||||||||||||
| 2/12/2016 | 2,325(4) | 6,975 | 92.02 | 2/12/2026 | 9,300(9) | 1,193,841 | ||||||||||||||||||||||||||||||||||||||
| 2/10/2017 | 0(5) | 6,900 | 122.60 | 2/10/2027 | 6,900(10) | 885,753 | ||||||||||||||||||||||||||||||||||||||
| Tom Baker |
3/13/2017 | 0(6) | 5,500 | 119.59 | 3/13/2027 | 5,500(10) | 706,035 | |||||||||||||||||||||||||||||||||||||
| 50
|
EXECUTIVE COMPENSATION | Vulcan 2018 Proxy Statement | ||||||||
Table of Contents
Options in footnotes 2, 3, and 4 vest at a rate of 25% per year in years 1 – 4.
| (1) | No Options (SOSARs) were granted in 2012. |
| (2) | Options (SOSARs) with vesting dates 2/13/2015, 2/13/2016, 2/13/2017, and 2/13/2018. |
| (3) | Options (SOSARs) with vesting dates 2/12/2016, 2/12/2017, 2/12/2018, and 2/12/2019. |
| (4) | Options (SOSARs) with vesting dates 2/12/2017, 2/12/2018, 2/12/2019, and 2/12/2020. |
Options in footnote 5 and 6 vest at a rate of 33.3% per year in years 1 – 3.
| (5) | Options (SOSARs) with vesting dates 2/10/2018, 2/10/2019, 2/10/2020 |
| (6) | Options (SOSARs) with vesting dates 3/13/2018, 3/13/2019, 3/13/2020 |
PSUs in footnotes 7, 8, and 9 cliff vest 100% after a four-year performance period.
| (7) | PSUs with vesting date of 12/31/2017. |
| (8) | PSUs with vesting date of 12/31/2018. |
| (9) | PSUs with vesting date of 12/31/2019. |
PSUs in footnote 10 cliff vest 100% after a three-year performance period.
| (10) | PSUs with vesting date of 12/31/2019. |
| (11) | RSUs cliff vest 100% after a four-year period, with a vesting date of 2/12/2019. |
| (12) | Based on closing price of our common stock on the NYSE on 12/29/2017, $128.37. |
| (13) | Vested PSUs adjusted for company performance through 12/31/2017. Unvested PSUs reported at target. |
Deferred Compensation Plan
Our Executive Deferred Compensation Plan was established in 1998 to allow executives to defer a portion of their current year’s compensation in a tax-efficient manner. We believe that providing a tax deferral plan gives our executives flexibility in tax and financial planning and provides an additional benefit at little cost to our shareholders. Our company does not make any contributions to the plan on behalf of the participants. Because our company purchases assets that mirror, to the extent possible, participants’ deemed investment elections under the plan, the only costs to our company related to the plan are administrative costs and any contributions that may be necessary to true-up account balances with deemed investment results. The plan allows executives with annual compensation (base salary and target annual short-term bonus) of $200,000 or more to defer receipt of up to 50% of base salary, up to 100% of annual cash bonus and up to 100% (net of FICA and any applicable local taxes) of long-term incentive awards, which are not excluded from deferral eligibility by the Code (or regulations thereunder), until a date selected by the participant. The amounts deferred are deemed invested as designated by participants in our company’s common stock (a “phantom stock” account) or in dollar-denominated accounts that mirror the gains or losses of the various investment options available under our company’s 401(k) plan. The plan does not offer any guaranteed return to participants.
The plan is funded by a “rabbi trust” arrangement owned by our company, which holds assets that correspond to the deemed investments of the plan participants and pays benefits at the times elected by the participants. Participants have an unsecured contractual commitment from our company for payment when the amounts accrue. Upon the death or disability of a participant or upon a change of control of our company, all deferred amounts and all earnings related thereto will be paid to the participant or participant’s beneficiaries in a single lump sum cash payment.
Effective for deferrals made after January 1, 2007, the plan permits executives to defer payouts of PSUs and DSUs into the plan, which would, absent such deferral, be distributed to the executives and immediately taxable. The PSU and DSU deferrals generally will be credited to the plan participant accounts in the form of phantom stock and an equal number of shares of our common stock will be deposited by our company into the rabbi trust. Deferrals of long-term incentive compensation payments are also invested in phantom stock of our company and may not be reallocated to an alternative investment option while in the plan.
| Vulcan 2018 Proxy Statement | EXECUTIVE COMPENSATION | 51
| ||||||||
Table of Contents
The following table shows the contributions, earnings, distributions and year-end account values for the NEOs under the plan for the fiscal year ended December 31, 2017:
| NONQUALIFIED DEFERRED COMPENSATION PLAN | ||||||||||||||||||||
| Name | Executive Contributions in Last Fiscal Year ($) |
Registrant Contributions in Last Fiscal Year ($) |
Aggregate Earnings in Last Fiscal Year ($) |
Aggregate Withdrawals/ Distributions ($) |
Aggregate Balance at Last Fiscal Year End(1) ($) |
|||||||||||||||
| Tom Hill |
0 | 0 | 71,847 | 0 | 1,239,229 | |||||||||||||||
| John McPherson |
0 | 0 | 0 | 0 | 0 | |||||||||||||||
| Stan Bass |
535,200 | 0 | 33,110 | 0 | 568,310 | |||||||||||||||
| Michael Mills |
0 | 0 | 0 | 0 | 0 | |||||||||||||||
| Tom Baker |
0 | 0 | 0 | 0 | 0 | |||||||||||||||
| (1) | Includes both the executive contributions and the earnings on those contributions. Cash-based salary and cash annual bonus amounts contributed by the executives are included in the amounts reported in the Summary Compensation Table in the year of deferral. PSU and DSU deferrals are included as compensation in the year of the grant. Above-market earnings are not reported as our company does not provide for such earnings on deferred compensation. |
OPTION EXERCISES AND STOCK VESTED
Certain information concerning each exercise of stock options and each vesting of stock during the fiscal year ended December 31, 2017, for each of the NEOs on an aggregate basis is set forth in the table below:
| Name |
OPTION AWARDS | STOCK AWARDS | ||||||||||||||||||
| Number of Shares Acquired on Exercise (#) |
Value Realized on Exercise(1) ($) |
Number of Shares Acquired on Vesting(2) (#) |
Value Realized on Vesting(3) ($) |
|||||||||||||||||
| Tom Hill |
0 | 0 | 30,507 | 3,645,694 | ||||||||||||||||
| John McPherson |
0 | 0 | 32,159 | 3,844,760 | ||||||||||||||||
| Stan Bass |
14,700 | 1,084,295 | 10,507 | 1,266,094 | ||||||||||||||||
| Michael Mills |
4,425 | 224,923 | 30,507 | 3,645,694 | ||||||||||||||||
| Tom Baker |
0 | 0 | 0 | 0 | ||||||||||||||||
| (1) | Calculated by multiplying the difference between the fair market value of our common stock on the date of exercise and the option exercise price by the number of options exercised. |
| (2) | Represents the payment of Performance Share Units (PSUs) and Restricted Stock Units (RSUs). PSUs and RSUs were paid 100% in stock. |
| (3) | Calculated by multiplying the number of units vested by the closing price of our common stock for PSUs on the date approved by our Compensation Committee (February 10, 2017) and RSUs on the vesting date (December 20, 2017). |
RETIREMENT AND PENSION BENEFITS
Generally, most full-time salaried employees of our company that were hired prior to July 15, 2007, including Messrs. Hill, Bass and Mills, participate in our company’s pension plans. Our NEOs are also eligible for supplemental retirement programs, as described on the following page. Retirement benefits become payable as early as the date on which participants both attain age 55 and complete one year of service.
| 52
|
EXECUTIVE COMPENSATION | Vulcan 2018 Proxy Statement | ||||||||
Table of Contents
The following table provides for each NEO the number of years of credited service and the present value of accumulated benefits as of December 31, 2017, under each plan in which the NEO participates. The narrative that follows this table provides a description of the material features of each plan.
| PENSION BENEFITS | ||||||||||||||
| Name | Plan Name |
Number of Years (#) |
Present Value of ($) |
Payments During Last Fiscal Year ($) |
||||||||||
| Tom Hill |
Retirement Income Plan | 23 3/12 | 1,247,215 | 0 | ||||||||||
| Supplemental Benefit Plan | 23 3/12 | 4,248,041 | 0 | |||||||||||
| John McPherson |
Retirement Income Plan | n/a | n/a | 0 | ||||||||||
| Supplemental Benefit Plan | n/a | n/a | 0 | |||||||||||
| Stan Bass |
Retirement Income Plan | 17 7/12 | 891,436 | 0 | ||||||||||
| Supplemental Benefit Plan | 17 7/12 | 1,867,492 | 0 | |||||||||||
| Michael Mills |
Retirement Income Plan | 22 9/12 | 1,166,255 | 0 | ||||||||||
| Supplemental Benefit Plan | 22 9/12 | 1,961,061 | 0 | |||||||||||
| Tom Baker |
Retirement Income Plan | n/a | n/a | 0 | ||||||||||
| Supplemental Benefit Plan | n/a | n/a | 0 | |||||||||||
| (1) | The present value of accumulated benefits are based on benefits payable at age 62, the earliest age under the plans at which benefits are not reduced, or current age if the participant is older than age 62. The following FASB ASC Topic 715 “Compensation—Retirement Benefits” assumptions as of December 31, 2017, were used to determine the present values: |
| (i) | discount rate of 3.35%; |
| (ii) | mortality based on the RP-2014 Healthy Employee & Annuitant Mortality White Collar Table, and generational improvements projected using Scale MP-2017; |
| (iii) | present values for lump sums are based on projected segmented interest rates and the prescribed 2017 IRS Mortality Table; |
| (iv) | Supplemental Benefit Plan benefits assumed to be paid as a 10 Year Term Certain Annuity; and |
| (v) | for the Retirement Income Plan, 40% of the benefit accrued before December 31, 2000, is assumed to be paid as a lump sum, with the remainder of the accrued benefit assumed to be paid as a single life annuity. |
| Vulcan 2018 Proxy Statement | EXECUTIVE COMPENSATION | 53
| ||||||||
Table of Contents
| 54
|
EXECUTIVE COMPENSATION | Vulcan 2018 Proxy Statement | ||||||||
Table of Contents
The table below reflects an estimate of the severance payments that would be made to our NEOs if they were terminated as of December 31, 2017, in connection with a COC:
| Name | Severance Multiple |
2017 Base Salary |
Greater of ($)
|
Total Cash Severance Payments ($) |
Pro-rata ($) |
Cash Severance Amount(1) ($) |
||||||||||||||||||
| Tom Hill |
3 | 1,020,000 | 1,925,667 | 8,837,000 | 1,925,667 | 10,762,667 | ||||||||||||||||||
| John McPherson |
3 | 804,000 | 1,556,333 | 7,081,000 | 1,556,333 | 8,637,333 | ||||||||||||||||||
| Stan Bass |
3 | 590,000 | 708,000 | 3,894,000 | 708,000 | 4,602,000 | ||||||||||||||||||
| Michael Mills |
3 | 590,000 | 690,667 | 3,842,000 | 690,667 | 4,532,667 | ||||||||||||||||||
| Tom Baker |
2.5 | 550,000 | 320,800 | 2,177,000 | 320,800 | 2,497,800 | ||||||||||||||||||
| (1) | These amounts represent cash severance payments to be paid to the NEOs under the COC Agreements (and, in the case of Mr. Baker, under the COC Plan) in the event of a COC and do not include the value of other COC benefits. |
Termination Pay and Benefits Programs
The following chart describes the treatment of different pay and benefit elements in connection with these employment termination events for NEOs:
| Program | Retirement/ Retirement Eligible |
Involuntary Termination Not For Cause |
Resignation | Death Or Disability | Involuntary Termination For Cause | |||||
| Pension: • Retirement Plan • Supplemental Plan |
Participant may commence benefit payment | Participant is considered Terminated Vested(1) | Participant is considered Terminated Vested(1) | In death, spouse may commence survivor benefit on or after the date that the Participant would have attained age 55 | Participant may commence benefit payment or will be Terminated Vested(1) depending on age | |||||
| Executive Deferred Compensation |
Payment made in accordance with deferral election | Payout made the year following the year of termination in a lump sum | Payout made the year following the year of termination in a lump sum | Payment commences the year after death or disability in the form elected | Payout made the year following the year of termination in a lump sum | |||||
| EIP |
Eligible to receive prorated payment | No payment | No payment | Eligible to receive prorated payment | No payment | |||||
| Stock Options/ SOSARs |
Full term to exercise vested options; if 62 or older, non-vested options continue to vest; noncompetition agreement may be required for exercising vested options | Non-vested options forfeited; 30 days to exercise vested options | Non-vested options forfeited; 30 days to exercise vested options |
Vesting accelerated. Under death, estate has one year to exercise. Under disability, have full remaining term to exercise. | Forfeit all, vested and non-vested | |||||
| PSUs |
If age 62 or older, vesting is accelerated, otherwise pro-rata vesting | Non-vested units are forfeited | Non-vested units are forfeited | Vesting is accelerated | Forfeit all, vested and non-vested | |||||
| (1) | “Terminated Vested” means the participant is no longer employed with our company but continues to have a vested interest in the applicable plan. |
| Vulcan 2018 Proxy Statement | EXECUTIVE COMPENSATION | 55
| ||||||||
Table of Contents
| Program | Retirement/ Retirement Eligible |
Involuntary Termination Not For Cause |
Resignation | Death or Disability | Involuntary Termination For Cause | |||||
| RSUs |
Non-vested units are forfeited | Non-vested units are forfeited | Non-vested units are forfeited |
Vesting is accelerated | Non-vested units are forfeited | |||||
| 401(k) Plan |
May take payment or defer until age 70 1⁄2 | May take payment or defer until age 70 1⁄2 | May take payment or defer until age 70 1⁄2 | Beneficiary may take payment or defer until age 70 1⁄2 | May take payment or defer until age 70 1⁄2 | |||||
| Supplemental Plan (Defined Contribution) |
May take payment or defer until age 70 1⁄2 | May take payment or defer until age 70 1⁄2 | May take payment or defer until age 70 1⁄2 | Account distributed by March 1 of the following year | May take payment or defer until age 70 1⁄2 | |||||
| Severance Benefits | None | None | None | None | None | |||||
| Health Benefits |
May continue to age 65 if eligibility rules are met | Coverage ceases; eligible for coverage extension under COBRA | Coverage ceases; eligible for coverage extension under COBRA | 3 months spousal extension, then COBRA; if eligibility rules are met may continue up to age 65 | Coverage ceases; eligible for coverage extension under COBRA | |||||
COC-Related Events
| • | For purposes of our COC Agreements, the COC Plan and equity awards under the 2016 Plan, a COC is defined as: (i) the acquisition by a person or group of 30% or more of the then outstanding common stock or voting securities of our company; or (ii) a change in the majority of members of the Board of Directors; or (iii) consummation of a reorganization, merger or consolidation or sale or other disposition of all or substantially all of our company’s assets unless our company’s shareholders before such business combination or sale own more than 50% of the outstanding common stock following the business combination or sale; or (iv) approval by the shareholders of the company of a complete liquidation or dissolution of the company. |
Further, under our COC Agreements, the COC Plan and the 2016 Plan, benefits are not triggered unless there has been a COC and an “Involuntary COC Termination or Voluntary COC Termination for Good Reason,” where employment is terminated within two years of a COC, other than for cause, or the employee voluntarily terminates for Good Reason. “Good Reason” would generally be considered to have occurred if there were a reduction in certain types of compensation, a relocation under certain circumstances or a diminution in duties and responsibilities.
| • | A COC occurs under certain of our company’s award agreements executed in connection with the grant of equity awards under the 2006 Plan upon: |
| (i) | acquisition by any person or group of more than 50% of the total fair market value or voting power of our common stock. A transfer or issuance of our stock is counted only if the stock remains outstanding after the transaction. An increase in stock ownership as a result of the company’s acquisition of its own stock in exchange for property is counted for purposes of the change in ownership standard; or |
| (ii) | (a) acquisition by a person or group during a 12-month period of stock possessing 30% of the total voting power of our stock, or |
| (b) replacement of a majority of our Board of Directors during any 12-month period by directors not endorsed by a majority of the members of our Board prior to the date of the appointment or election; or |
| (iii) | acquisition by a person or group during a 12-month period of assets from our company having a total gross fair market value of 40% of the total gross fair market value of our assets immediately prior to such acquisition. An exception exists for a transfer of our assets to a shareholder controlled entity, including transfer to a person owning 50% or more of the total value or voting power of our shares. |
| 56
|
EXECUTIVE COMPENSATION | Vulcan 2018 Proxy Statement | ||||||||
Table of Contents
COC Pay and Benefits Programs
The following table describes treatment of payments under pay and benefit programs upon a COC, and upon an employment termination (voluntary or involuntary) upon a COC:
| Plan or Program | COC | COC with Termination (other than cause) | ||
| Pension: • Retirement Plan • Supplemental Plan |
No payment to NEOs solely upon the COC | No payment to NEOs solely upon the COC | ||
| Executive Deferred Compensation Plan | Accelerate all deferred amounts and pay lump sum within 10 business days | Accelerate all deferred amounts and pay lump sum within 10 business days | ||
| EIP | The amount paid will be equal to the greater of (i) the average bonus during the three preceding years, (ii) the target bonus, or (iii) the bonus determined under the Plan for the year in which the COC occurs | The amount paid will be equal to the greater of (i) the average bonus during the three preceding years, (ii) the target bonus, or (iii) the bonus determined under the Plan for the year in which the COC occurs | ||
| SOSARs(1) | No accelerated vesting unless awards are not assumed, substituted or continued by the surviving company otherwise continued vesting; remaining term to exercise | If awards are assumed, substituted or continued by the surviving company, immediately deemed fully vested and exercisable; remaining term to exercise | ||
| PSUs(1) | No accelerated vesting unless awards are not assumed, substituted or continued by the surviving company otherwise continued vesting; pay within 2 1⁄2 months of vesting | If awards are assumed, substituted or continued by the surviving company, vesting is accelerated; pay within 2 1⁄2 months after end of the year in which the COC occurs | ||
| RSUs(1) | No accelerated vesting unless awards are not assumed, substituted or continued by the surviving company otherwise continued vesting; pay within 90 days of vesting | If awards are assumed, substituted or continued by the surviving company, all immediately deemed non-forfeitable; pay within 90 days following the COC | ||
| 401(k) Plan | No payment to the NEOs solely upon the COC | Service ceases except to the extent that additional service is provided under the terms of the COC Agreements; participant is entitled to distribution | ||
| Supplemental Plan (Defined Contribution) |
No payment to the NEOs solely upon the COC | Participant is entitled to distribution | ||
| Severance Benefits | No payment to the NEOs solely upon the COC | For NEOs with COC Agreements, payment is 3 times the NEO’s annual base salary and short-term bonus. For NEOs under the COC Plan, payment is 2.5 times the NEO’s annual base salary and short-term bonus. | ||
| Health Benefits | No payment to the NEOs solely upon the COC | 3 year coverage extension provided under the terms of the COC Agreements and 2.5 year coverage extension provided under the terms of the COC Plan |
| (1) | The vesting and payment benefits shown in this table relate to awards of SOSARs, PSUs and RSUs granted under the 2016 Plan, which contains a “double-trigger” change of control requirement. Awards granted under the 2006 Plan would immediately vest, SOSARs would have the remaining term to exercise, PSUs would be paid within 2 1⁄2 months after end of the year in which the COC occurs and RSUs would be paid within 90 days following the COC. |
Potential Payments
This section describes and estimates payments that would have become payable to the NEOs upon a termination or COC as of December 31, 2017.
Pension Benefits
The monthly amounts that would have become payable to our NEOs if the termination event occurred as of December 31, 2017, under the Retirement Plan, the Supplemental Plan and the Defined Contribution Plan are itemized in the chart below. The amounts shown in the chart are monthly benefit amounts (other than with respect to the accrued benefits payable upon a COC, which would be paid in a lump sum) whereas the pension values shown in the Summary Compensation and Pension Benefits Tables are present values of all the monthly values anticipated to be paid over the lifetimes of our NEOs and their spouses in the event of their death while actively employed. These plans are described in the notes following the Pension
| Vulcan 2018 Proxy Statement | EXECUTIVE COMPENSATION | 57
| ||||||||
Table of Contents
Benefits Table. Messrs. Hill, Bass, and Mills were retirement eligible on December 31, 2017. The benefits below were determined using the same assumptions used to compute benefit values in the Pension Benefit Table with three exceptions. First, the benefit payments were assumed to commence as soon as possible following December 31, 2017, instead of at normal retirement. Second, approximate early retirement reductions were applied. Finally, the benefits were not adjusted to reflect optional forms of payment. All benefits are the amounts that would be paid monthly over the NEO’s life, except for the value of COC-enhanced benefits which would be paid in a lump sum.
Pension Benefits and Defined Contribution Table
| Name | Retirement (Monthly Payments) ($) |
Resignation or Involuntary (monthly payments) ($) |
Death (monthly ($) |
COC (Value
of Enhanced Benefits)(1) ($) |
||||||||||||
| Tom Hill |
Retirement Plan | 7,118 | Terminated Vested(2) | 6,328 | 0 | |||||||||||
| Supplemental Plan | 33,639 | Terminated Vested(2) | 29,905 | 0 | ||||||||||||
| Defined Contribution | 0 | None | 0 | 795,330 | ||||||||||||
| John McPherson |
Retirement Plan | n/a | n/a(3) | n/a | n/a | |||||||||||
| Supplemental Plan | n/a | n/a(3) | n/a | n/a | ||||||||||||
| Defined Contribution | 0 | None | 0 | 637,290 | ||||||||||||
| Stan Bass |
Retirement Plan | 5,403 | Terminated Vested(2) | 4,776 | 0 | |||||||||||
| Supplemental Plan | 15,795 | Terminated Vested(2) | 13,963 | 0 | ||||||||||||
| Defined Contribution | 0 | None | 0 | 350,460 | ||||||||||||
| Michael Mills |
Retirement Plan | 6,908 | Terminated Vested(2) | 6,065 | 0 | |||||||||||
| Supplemental Plan | 16,093 | Terminated Vested(2) | 14,130 | 0 | ||||||||||||
| Defined Contribution | 0 | None | 0 | 345,780 | ||||||||||||
| Tom Baker |
Retirement Plan | n/a | n/a(3) | n/a | n/a | |||||||||||
| Supplemental Plan | n/a | n/a(3) | n/a | n/a | ||||||||||||
| Defined Contribution | 0 | None | 0 | 195,930 | ||||||||||||
| (1) | Value of defined contribution enhancement is payable in a lump sum in the event of a COC. The defined contribution amounts represent either 2.5 or 3 years, depending on the NEO, of company matching contributions for each executive. |
| (2) | Eligible for reduced payments as early as age 55 and unreduced payments at age 62. |
| (3) | Participation in the Retirement Plan, including the Supplemental Plan, was frozen in 2007. Therefore, Messrs. McPherson and Baker are not eligible to participate in that Plan. |
Performance Share Units (PSUs)
The chart below shows the number of PSUs for which vesting would be accelerated under certain events. Unvested PSUs were adjusted to the maximum allowed under the agreements because the performance was unknown at December 31, 2017.
| RETIREMENT | COC (WITH OR WITHOUT TERMINATION) |
|||||||||||||||||||
| Name | Number of Performance Share Units with Accelerated Vesting |
Total Number of Performance Share Units Following Accelerated Vesting |
Number of Performance Share Units with Accelerated Vesting |
Total Number of Performance Share Units Following Accelerated Vesting |
||||||||||||||||
| Tom Hill |
94,283 | 114,283 | 173,600 | 193,600 | ||||||||||||||||
| John McPherson |
0 | 20,000 | 130,600 | 150,600 | ||||||||||||||||
| Stan Bass |
23,200 | 34,400 | 44,800 | 56,000 | ||||||||||||||||
| Michael Mills |
24,550 | 36,070 | 46,600 | 58,120 | ||||||||||||||||
| Tom Baker |
3,667 | 3,667 | 11,000 | 11,000 | ||||||||||||||||
| 58
|
EXECUTIVE COMPENSATION | Vulcan 2018 Proxy Statement | ||||||||
Table of Contents
Stock Only Stock Appreciation Rights (SOSARs)
The chart below shows the number of SOSARs for which vesting would be accelerated under certain events:
| RETIREMENT | COC (WITH OR WITHOUT TERMINATION) | |||||||||||||||||||
| Name | Number of SOSARs with Accelerated Vesting |
Total Number of SOSARs Following |
Number of SOSARs with Accelerated Vesting |
Total Number of SOSARs Following |
||||||||||||||||
| Tom Hill |
26,817 | 89,882 | 66,500 | 129,565 | ||||||||||||||||
| John McPherson |
0 | 407,125 | 49,675 | 456,800 | ||||||||||||||||
| Stan Bass |
7,925 | 50,130 | 18,725 | 60,930 | ||||||||||||||||
| Michael Mills |
8,200 | 56,545 | 19,225 | 67,570 | ||||||||||||||||
| Tom Baker |
1,833 | 1,833 | 5,500 | 5,500 | ||||||||||||||||
Restricted Stock Units (RSUs)
The chart below shows the number of RSUs for which vesting would be accelerated under certain events.
| RETIREMENT | COC (WITH OR WITHOUT TERMINATION) | |||||||||||||||||||
| Name | Number of Restricted Stock Units with Accelerated Vesting |
Total Number of Restricted Stock Units Following Accelerated Vesting |
Number of Restricted Stock Units with Accelerated Vesting |
Total Number of Restricted Stock Units Following Accelerated Vesting |
||||||||||||||||
| Tom Hill |
0 | 0 | 0 | 0 | ||||||||||||||||
| John McPherson |
0 | 0 | 0 | 0 | ||||||||||||||||
| Stan Bass |
0 | 0 | 14,000 | 14,000 | ||||||||||||||||
| Michael Mills |
0 | 0 | 0 | 0 | ||||||||||||||||
| Tom Baker |
0 | 0 | 0 | 0 | ||||||||||||||||
Executive Deferred Compensation Plan
The aggregate balances reported in the Nonqualified Deferred Compensation Plan Table would be payable to the NEOs as described in the ”Termination Pay and Benefits Programs” and “COC Pay and Benefits Program” charts above. There is no enhancement or acceleration of payments under this plan associated with termination or COC events, other than the lump sum payment opportunity described in the above charts. The lump sums that would be payable are those that are reported in the Nonqualified Deferred Compensation Plan Table.
Health Benefits
Because Messrs. Hill, Bass, and Mills meet the age and service eligibility requirement for health care benefits provided to early retirees, there is no incremental payment associated with a termination or COC event. Messrs. McPherson and Baker did not meet such eligibility requirement; therefore, their incremental cost for health benefits would be approximately $76,774 and $62,946, respectively.
| Vulcan 2018 Proxy Statement | EXECUTIVE COMPENSATION | 59
| ||||||||
Table of Contents
As required by Section 953(b) of the Dodd-Frank Wall Street Reform and Consumer Protection Act, and Item 402(u) of Regulation S-K, we are providing the following information about the relationship of the median of the annual total compensation of our employees and the annual total compensation of Tom Hill, our Chairman, President and CEO (our “CEO”). The pay ratio included in this information is a reasonable estimate calculated in a manner consistent with Item 402(u) of Regulation S-K.
For 2017, our last completed fiscal year:
| • | The median of the annual total compensation of all employees of our company (other than our CEO), was $76,906; and |
| • | The annual total compensation of our CEO was $7,216,195. |
Based on this information, for 2017, the ratio of the annual total compensation of our CEO, to the median of the annual total compensation of all employees (other than our CEO) was 94 to 1.
To identify our median employee and to determine the annual total compensation of the median employee and our CEO, we used the following methodology and material assumptions, adjustments, and estimates:
| 1. | We determined that, as of November 1, 2017, our employee population consisted of 8,202 individuals working at our parent company and consolidated subsidiaries, with 95.1% of these individuals located in the United States and 4.9% located in Mexico. |
| 2. | As permitted under SEC rules, we adjusted the employee population to exclude approximately 398 non-U.S. employees (or less than 5% of our employee population) all of whom are located in Mexico. After excluding the foregoing non-U.S. employees, our adjusted employee population on November 1, 2017 was 7,804. |
| 3. | To identify the “median employee” from our adjusted employee population, we reviewed the amount of compensation reported to the Internal Revenue Service on Form W-2, box 1 for 2017 (as reflected in our payroll records) for each of our employees. |
| 4. | In accordance with SEC rules, we determined the median employee’s 2017 total annual compensation by taking the sum of the following items: |
| a. | $60,150, which represents the amount of the median employee’s compensation for fiscal 2017 that would have been reported in the Summary Compensation Table in accordance with the requirements of Item 402(c)(2)(x) of Regulation S-K if the employee had been a Named Executive Officer for fiscal 2017. |
| b. | $16,756, which represents the estimated aggregate value of the employee’s compensation under Company sponsored non-discriminatory benefit plans. |
| 5. | In accordance with SEC rules, we determined our CEO’s 2017 total annual compensation by taking the sum of the following items: |
| a. | $7,199,238, which represents the amount reported for our CEO in the “Total” column (column (j)) of our 2017 Summary Compensation Table included on page 48 of this proxy statement. |
| b. | $16,957, which represents the estimated aggregate value of our CEO’s compensation under Company sponsored non-discriminatory benefit plans. |
| 60
|
EXECUTIVE COMPENSATION | Vulcan 2018 Proxy Statement | ||||||||
Table of Contents
Table of Contents
DIRECTOR SUMMARY COMPENSATION TABLE
The table below summarizes the compensation paid by our company to non-employee directors for the fiscal year ended December 31, 2017:
| Name | Fees Earned or Paid in Cash ($) |
Stock Awards(5) ($) |
Option Awards ($) |
Non-Equity Plan ($) |
Change in ($) |
All Other Compen- sation(6) ($) |
Total ($) |
|||||||||||||||||||||
| Elaine L. Chao(1) |
0 | 0 | 0 | 0 | 0 | 3,051 | 3,051 | |||||||||||||||||||||
| Thomas A. Fanning |
110,000 | 149,222 | 0 | 0 | 0 | 3,631 | 262,853 | |||||||||||||||||||||
| O. B. Grayson Hall, Jr. |
120,000 | 149,222 | 0 | 0 | 0 | 5,727 | 274,949 | |||||||||||||||||||||
| Cynthia L. Hostetler |
120,000 | 149,222 | 0 | 0 | 0 | 3,631 | 272,853 | |||||||||||||||||||||
| Douglas J. McGregor(2) |
55,000 | 0 | 0 | 0 | 0 | 19,334 | 74,334 | |||||||||||||||||||||
| Richard T. O’Brien |
130,000 | 149,222 | 0 | 0 | 0 | 16,016 | 295,238 | |||||||||||||||||||||
| James T. Prokopanko |
150,000 | 149,222 | 0 | 0 | 0 | 13,916 | 313,138 | |||||||||||||||||||||
| Kathleen L. Quirk(3) |
55,000 | 0 | 0 | 0 | 0 | 0 | 55,000 | |||||||||||||||||||||
| David P. Steiner(4) |
110,000 | 149,222 | 0 | 0 | 0 | 581 | 259,803 | |||||||||||||||||||||
| Lee J. Styslinger, III |
110,000 | 149,222 | 0 | 0 | 0 | 7,408 | 266,630 | |||||||||||||||||||||
| Vincent J. Trosino(2) |
55,000 | 0 | 0 | 0 | 0 | 19,334 | 74,334 | |||||||||||||||||||||
| Kathleen Wilson-Thompson |
120,000 | 149,222 | 0 | 0 | 0 | 13,916 | 283,138 | |||||||||||||||||||||
| (1) | Ms. Chao resigned from the Board effective as of January 31, 2017, upon her confirmation as Secretary of the United States Department of Transportation. |
| (2) | The terms of Messrs. McGregor and Trosino expired at the 2017 Annual Meeting. |
| (3) | Ms. Quirk joined the Board on October 13, 2017. |
| (4) | Mr. Steiner joined the Board on February 10, 2017. |
| (5) | This column represents the accounting expense for the awards granted in 2017; therefore, the values shown are not representative of the amounts that may eventually be realized by a director. Pursuant to SEC rules, we have provided a grant date fair value for stock awards in accordance with the provisions of FASB ASC Topic 718. For DSUs, the fair value is estimated on the date of grant based on the closing market price of our stock ($128.64) on the grant date (June 15, 2017). At December 31, 2017, the aggregate number of DSUs accumulated on account for all years of service, including dividend equivalent units, were: |
AGGREGATE ACCUMULATED DSUs
| Name | Units | |||
| Elaine L. Chao |
3,066 | |||
| Thomas A. Fanning |
4,231 | |||
| O. B. Grayson Hall, Jr. |
6,337 | |||
| Cynthia L. Hostetler |
4,231 | |||
| Douglas J. McGregor |
19,432 | |||
| Richard T. O’Brien |
16,678 | |||
| James T. Prokopanko |
14,567 | |||
| Kathleen L. Quirk |
0 | |||
| David P. Steiner |
1,165 | |||
| Lee J. Styslinger, III |
8,027 | |||
| Vincent J. Trosino |
19,432 | |||
| Kathleen Wilson-Thompson |
14,567 | |||
| (6) | None of our directors received perquisites or other personal benefits in excess of $10,000. The amounts set forth in this column represent the accounting expense for the dividend equivalents earned in 2017 by our directors for deferred stock and DSUs which earn dividend equivalents. |
| 62
|
DIRECTOR COMPENSATION | Vulcan 2018 Proxy Statement | ||||||||
Table of Contents
Table of Contents
| 64
|
ANNUAL MEETING AND VOTING INFORMATION | Vulcan 2018 Proxy Statement | ||||||||
Table of Contents
| Vulcan 2018 Proxy Statement | ANNUAL MEETING AND VOTING INFORMATION | 65
| ||||||||
Table of Contents
| 66
|
ANNUAL MEETING AND VOTING INFORMATION | Vulcan 2018 Proxy Statement | ||||||||
Table of Contents
Table of Contents
| 68
|
GENERAL INFORMATION | Vulcan 2018 Proxy Statement | ||||||||
Table of Contents
ANNEX A: RECONCILIATION OF NON-GAAP FINANCIAL MEASURES
Generally Accepted Accounting Principles (GAAP) does not define “Earnings Before Interest, Taxes, Depreciation and Amortization” (EBITDA), and it should not be considered as an alternative to earnings measures defined by GAAP. We use this metric to assess the operating performance of our business and as a basis of strategic planning and forecasting as we believe that it closely correlates to long-term shareholder value. We do not use this metric as a measure to allocate resources. We adjust EBITDA for certain items to provide a more consistent comparison of earnings performance from period to period. Reconciliation of this metric to its nearest GAAP measure is presented below:
EBITDA AND ADJUSTED EBITDA
EBITDA is an acronym for Earnings Before Interest, Taxes, Depreciation and Amortization and excludes discontinued operations.
| IN MILLIONS | 2017 | 2016 | 2015 | |||||||||
| Net earnings |
$601.2 | $419.5 | $221.2 | |||||||||
| Income tax expense (benefit) |
(232.1) | 124.9 | 94.9 | |||||||||
| Interest expense, net of interest income |
291.1 | 133.3 | 220.3 | |||||||||
| (Earnings) loss on discontinued operations, net of tax |
(7.8) | 2.9 | 11.7 | |||||||||
| Depreciation, depletion, accretion and amortization |
306.0 | 284.9 | 274.8 | |||||||||
| EBITDA |
$958.4 | $965.5 | $822.9 | |||||||||
| Gain on sale of real estate and businesses(1) |
(10.5) | (16.2) | (6.3) | |||||||||
| Property donation |
4.3 | 0.0 | 0.0 | |||||||||
| Business interruption claims recovery, net of incentives |
0.0 | (11.0) | 0.0 | |||||||||
| Charges associated with divested operations |
18.1 | 16.9 | 7.1 | |||||||||
| Business development, net of termination fee(2) |
3.1 | 0.0 | 1.0 | |||||||||
| One-time bonuses to non-incentive employees |
6.7 | 0.0 | 0.0 | |||||||||
| Asset impairment |
0.0 | 10.5 | 5.2 | |||||||||
| Restructuring charges |
1.9 | 0.3 | 5.0 | |||||||||
| Adjusted EBITDA |
$981.9 | $966.0 | $834.9 | |||||||||
| (1) | The 2016 amount includes a $4.3 million gain (reflected within other operating Income, net) for plant relocation reimbursement. |
| (2) | Includes only non-routine business development charges. |
Unlike many of our competitors, we do not exclude share-based compensation from our Adjusted EBITDA earnings metric, as we view it as a recurring operating expense. Refer to our statements of cash flows for the expense incurred related to our share-based compensation plans.
EBITDA EP CALCULATION
EBITDA EP is EP Adjusted EBITDA less capital charge (average operating capital employed x pretax cost of capital).
| IN MILLIONS | 2017 | |||
| Adjusted EBITDA |
$981.9 | |||
| Performance adjustments |
8.9 | |||
| EP Adjusted EBITDA |
$990.8 | |||
| Average operating capital employed |
3,990.1 | |||
| Pretax cost of capital |
13.2% | |||
| Capital charge |
(527.3) | |||
| EBITDA EP |
$463.5 | |||
| Vulcan 2018 Proxy Statement | ANNEX A: RECONCILIATION OF NON-GAAP FINANCIAL MEASURES | 69
| ||||||||
Table of Contents

vulcanmaterials.com
Table of Contents
| VOTE BY INTERNET - www.proxyvote.com | ||
| VULCAN MATERIALS COMPANY |
Use the Internet to transmit your voting instructions and for electronic delivery of information. Vote by 11:59 p.m. Eastern Time the day before the cut-off date or meeting date. Have your proxy card in hand when you access the web site and follow the instructions to obtain your records and to create an electronic voting instruction form.
| |
| 1200 URBAN CENTER DRIVE BIRMINGHAM, AL 35242 |
ELECTRONIC DELIVERY OF FUTURE PROXY MATERIALS | |
| If you would like to reduce the costs incurred by our company in mailing proxy materials, you can consent to receiving all future proxy statements, proxy cards and annual reports electronically via e-mail or the Internet. To sign up for electronic delivery, please follow the instructions above to vote using the Internet and, when prompted, indicate that you agree to receive or access proxy materials electronically in future years. | ||
|
VOTE BY PHONE - 1-800-690-6903 | ||
| Use any touch-tone telephone to transmit your voting instructions up until 11:59 p.m. Eastern Time the day before the cut-off date or meeting date. Have your proxy card in hand when you call and then follow the instructions. | ||
|
VOTE BY MAIL | ||
| Mark, sign and date your proxy card and return it in the postage-paid envelope we have provided or return it to Vote Processing, c/o Broadridge, 51 Mercedes Way, Edgewood, NY 11717. |
| TO VOTE, MARK BLOCKS BELOW IN BLUE OR BLACK INK AS FOLLOWS: | ||||||||||||||||||||||||||
| E40789-P04073 KEEP THIS PORTION FOR YOUR RECORDS — — — — — — — — — — — — — — — — — — — — — — — — — — — — — — — — — — — — — — — — — — — — | ||||||||||||||||||||||||||
| DETACH AND RETURN THIS PORTION ONLY | ||||||||||||||||||||||||||
| THIS PROXY CARD IS VALID ONLY WHEN SIGNED AND DATED.
| ||||||||||||||||||||||||||
|
VULCAN MATERIALS COMPANY |
||||||||||||||||||||||||||
|
The Board of Directors recommends you vote FOR the director nominees listed in proposal 1. |
The Board of Directors recommends you vote FOR proposals 2 and 3. |
|||||||||||||||||||||||||
| For | Against | Abstain | ||||||||||||||||||||||||
| 1.
|
Election of Directors
Nominees: |
For |
Against |
Abstain |
2. Approval, on an advisory basis, of the compensation of our named executive officers. |
☐
|
☐ |
☐ |
||||||||||||||||||
| 1a. Thomas A. Fanning | ☐ | ☐ | ☐ | |||||||||||||||||||||||
|
1b. J. Thomas Hill
1c. Cynthia L. Hostetler
1d. Richard T. O’Brien
1e. Kathleen L. Quirk |
☐
☐
☐
☐ |
☐
☐
☐
☐ |
☐
☐
☐
☐ |
3. Ratification of the appointment of Deloitte & Touche LLP as our independent registered public accounting firm for 2018.
|
☐ | ☐ | ☐ | |||||||||||||||||||
| NOTE: Such other business as may properly come before the meeting or any adjournment thereof. | ||||||||||||||||||||||||||
|
Please sign exactly as your name(s) appear(s) hereon. When signing as attorney, executor, administrator, or other fiduciary, please give full title as such. Joint owners should each sign personally. All holders must sign. If a corporation or partnership, please sign in full corporate or partnership name by authorized officer.
|
||||||||||||||||||||||||||
| Signature [PLEASE SIGN WITHIN BOX] | Date | Signature (Joint Owners) | Date | |||||||||||||||||||||||
Table of Contents
Important Notice Regarding the Availability of Proxy Materials for the Annual Meeting:
The Notice and Proxy Statement and Annual Report are available at www.proxyvote.com.
| — — — — — — — — — — — — — — — — — — — — — — — — — — — — — — — — — — — — — — — — — — — — | ||||
|
E40790-P04073
| ||||
|
VULCAN MATERIALS COMPANY | ||||
| Annual Meeting of Shareholders May 11, 2018 This proxy is solicited by the Board of Directors
| ||||
| The undersigned hereby appoints O.B. Grayson Hall, Jr., James T. Prokopanko and Kathleen Wilson-Thompson, and each of them, with power to act without the others and with power of substitution, as proxies and attorneys-in-fact, and hereby authorizes them to represent and vote, as provided on the reverse side, all the shares of Vulcan Materials Company common stock which the undersigned is entitled to vote, and, in their discretion, to vote upon such other business as may properly come before the 2018 Annual Meeting of Shareholders of the Company to be held on Friday, May 11, 2018, at 9:00 a.m., local time, at the corporate headquarters of Vulcan Materials Company, 1200 Urban Center Drive, Birmingham, Alabama 35242, or at any adjournment or postponement thereof, with all powers which the undersigned would possess if present at the Annual Meeting.
Shares represented by this proxy will be voted as directed by the undersigned. If this proxy is signed and no such directions are indicated, the proxies have authority to vote “FOR” election of all director nominees, “FOR” approval, on an advisory basis, of the compensation of our named executive officers, and “FOR” ratification of the appointment of Deloitte & Touche LLP as our independent registered public accounting firm for 2018. |
||||
|
Continued and to be signed on reverse side
| ||||