UNITED STATES
SECURITIES
AND EXCHANGE COMMISSION
WASHINGTON,
DC 20549
FORM
8-K
CURRENT
REPORT
Pursuant
to Section 13 or 15(d) of the Securities Exchange Act of 1934
Date
of Report (Date of earliest event reported): May
16, 2012
GT
ADVANCED TECHNOLOGIES INC.
(EXACT NAME OF REGISTRANT AS
SPECIFIED IN ITS CHARTER)
Delaware |
001-34133 |
03-0606749 | ||
(State or other jurisdiction
|
(Commission File Number) | (IRS Employer Identification No.) |
20 Trafalgar Square |
(603) 883-5200 (Registrant’s Telephone Number, Including Area Code) |
243 Daniel Webster Highway Merrimack, New Hampshire 03054 (Former Name or Former Address, if Changed Since Last Report) |
Check the
appropriate box below if the Form 8-K filing is intended to
simultaneously satisfy the filing obligation of the registrant under any
of the following provisions:
⃞
Written
communications pursuant to Rule 425 under the Securities Act (17 CFR
230.425)
⃞
Soliciting
material pursuant to Rule 14a-12 under the Exchange Act (17 CFR
240.14a-12)
⃞
Pre-commencement
communications pursuant to Rule 14d-2(b) under the Exchange Act (17 CFR
240.14d-2(b))
⃞
Pre-commencement
communications pursuant to Rule 13e-4(c) under the Exchange Act (17 CFR
240.13e-4(c))
Item 2.02 Results of Operations and Financial Condition.
On May 16, 2012, GT Advanced Technologies Inc. (the “Company”) issued a press release announcing financial results for the fourth quarter and fiscal year-ended March 31, 2012. The full text of the press release issued in connection with the announcement is furnished as Exhibit 99.1 to this Current Report on Form 8-K. The information in Exhibit 99.1 is being provided pursuant to Item 2.02 of Form 8-K and is incorporated herein by reference. A copy of the Company’s Investor Financial Summary for the fourth fiscal quarter and fiscal year-ended March 31, 2012 is attached hereto as Exhibit 99.2 (the “Investor Financial Summary”) and is incorporated herein by reference.
Item 7.01 Regulation FD Disclosure.
The Company hereby furnishes the information set forth in the press release issued on May 16, 2012 and the Investor Financial Summary for the fourth fiscal quarter and fiscal year-ended March 31, 2012, copies of which are attached hereto as Exhibit 99.1 and Exhibit 99.2, respectively, and each is incorporated herein by reference.
The information, including Exhibit 99.1 and Exhibit 99.2, furnished in this report is not deemed “filed” for purposes of Section 18 of the Securities Exchange Act of 1934, as amended, or otherwise subject to the liabilities of that section. Registration statements or other documents filed with the Securities and Exchange Commission shall not incorporate this information by reference, except as otherwise expressly stated in such filing.
Item 9.01 Financial Statements and Exhibits.
(d) Exhibits
Exhibit No. |
Description |
|
99.1 | Press release issued May 16, 2012 | |
99.2 |
Fourth Quarter and Fiscal Year End 2012 GT Advanced Technologies Inc. Investor Financial Summary. |
SIGNATURES
Pursuant to the requirements of the Securities Exchange Act of 1934, the registrant has duly caused this report to be signed on its behalf by the undersigned hereunto duly authorized.
GT ADVANCED TECHNOLOGIES INC. |
|||
|
|||
Date: May 16, 2012 |
/s/ Hoil Kim |
||
By: |
Hoil Kim |
||
Its: |
Vice President, Chief Administrative Officer, |
||
General Counsel and Secretary |
EXHIBIT INDEX
Exhibit No. |
Description |
|
99.1 |
Press release issued May 16, 2012 |
|
99.2 |
Fourth Quarter and Fiscal Year End 2012 GT Advanced Technologies Inc. Investor Financial Summary |
Exhibit 99.1
GT Advanced Technologies Inc. Announces Fourth Quarter and Fiscal Year 2012 Results
Strong Sapphire Performance Drives Record-level Quarterly and Annual Revenue and EPS on GAAP and Non-GAAP Basis
NASHUA, N.H.--(BUSINESS WIRE)--May 16, 2012--GT Advanced Technologies Inc. (NASDAQ: GTAT) today reported results for its fourth quarter and fiscal year 2012, which ended March 31, 2012. The company has indicated that it is now also reporting non-GAAP financial measures in its results. An explanation of the non-GAAP measures presented and the reconciliation to the most comparable GAAP measure are included in the appendix to this earnings release.
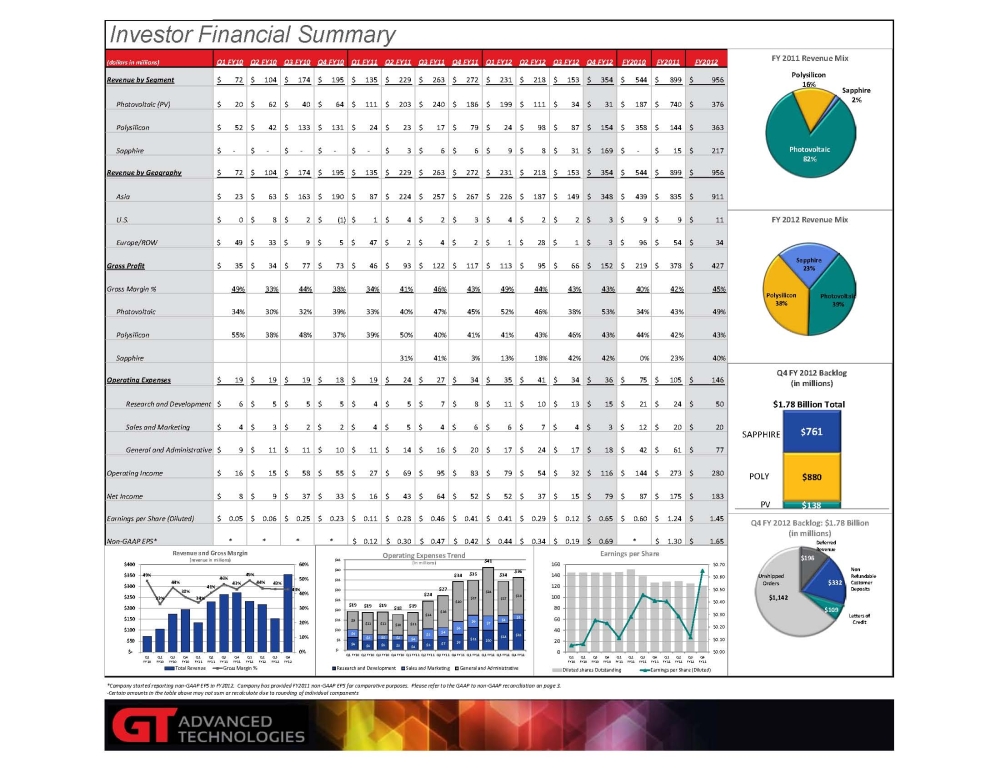
Revenue for the fourth quarter of fiscal 2012 totaled $353.9 million, compared to $153.0 million in the third quarter of fiscal 2012 and $271.6 million in the fourth quarter of fiscal 2011. Revenue by business segment for the fourth quarter of fiscal 2012 was $153.9 million in polysilicon, $31.4 million in photovoltaic (PV), and $168.6 million in the sapphire segment, which was primarily ASF™ equipment revenue.
Revenue for fiscal 2012 was $955.7 million compared to $899.0 million of revenue for fiscal 2011. Revenue by business segment for fiscal 2012 was $363.3 million in polysilicon, $375.5 million in photovoltaic (PV), and $216.9 million in the sapphire segment, which was primarily ASF™ equipment revenue.
Gross profit for the fourth quarter of fiscal 2012 totaled $152.3 million, or 43.0 percent of revenue, compared to $66.0 million, or 43.1 percent of revenue in the third quarter of fiscal 2012 and $116.9 million, or 43.0 percent of revenue for the fourth quarter of fiscal 2011.
Gross profit for fiscal 2012 was $426.8 million or 44.7 percent of revenue, compared to $378.0 million or 42.0 percent of revenue for fiscal 2011.
Operating margin for the fourth quarter of fiscal 2012 was 32.8 percent of revenue, compared to 20.7 percent of revenue in the third quarter of fiscal 2012 and 30.5 percent of revenue in the fourth quarter of fiscal 2011.
Operating margin for fiscal 2012 was 29.3 percent of revenue, compared to 30.4 percent of revenue for fiscal 2011.
In the fourth quarter of fiscal 2012, the company had net income of $79.1 million, compared to $15.3 million in the third quarter of fiscal 2012 and $51.9 million for the fourth quarter of fiscal 2011.
Non-GAAP net income was $83.9 in the fourth quarter of fiscal 2012, compared to $24.2 million in the third quarter of fiscal 2012 and $53.9 million for the fourth quarter of fiscal 2011.
For fiscal 2012, net income was $183.4 million compared to $174.8 million for fiscal 2011. Non-GAAP net income was $207.5 million in fiscal 2012 and $182.7 million in fiscal 2011.
Earnings per share on a fully-diluted basis was $0.65 in the fourth quarter of fiscal 2012, compared to $0.12 for the third quarter of fiscal 2012 and $0.41 for the fourth quarter of fiscal 2011.
Non-GAAP earnings per share on a fully-diluted basis was $0.69 in the fourth quarter of fiscal 2012, compared to $0.19 for the third quarter of fiscal 2012 and $0.42 for the fourth quarter of fiscal 2011.
Earnings per share on a fully-diluted basis was $1.45 for the fiscal 2012, compared to $1.24 for fiscal 2011.
Non-GAAP earnings per share on a fully-diluted basis was $1.65 for the fiscal 2012 compared to $1.30 for fiscal 2011.
At the end of the fourth quarter of fiscal 2012, cash and cash equivalents was $350.9 million and the company had $75 million of debt. Cash, cash equivalents and restricted cash at the end of the third quarter of fiscal 2012 was $303.1 million, which included $96.2 million of restricted cash and zero debt.
As of March 31, 2012, the company’s backlog was $1.8 billion. This included approximately $879.7 million in the polysilicon segment, $138.7 million in the PV segment and $760.9 million in the sapphire segment. Included in the total backlog was approximately $196.2 million of deferred revenue.
New orders for the fourth quarter were $34.6 million and include $4.2 million of polysilicon orders, $6.9 million of PV orders and $23.5 million in sapphire orders. The company had $71.1 million of negative adjustments to backlog primarily from its solar-related businesses.
Management Commentary
“We are pleased with our performance in the March quarter, which was a record quarter spurred by strong sapphire equipment revenue and which capped a record year for GT at both the top and bottom lines,” said Tom Gutierrez, president and chief executive officer. “Our fiscal 2012 results demonstrate the resilience of our flexible operating model, and our ability to deliver growth, profits, stability and predictability even through challenging times.
“The sapphire business results highlight our success in diversifying the company, a key strategic priority. In less than a year, our sapphire team has successfully shipped, installed, and commissioned a significant number of ASF units for seven of our ASF customers. Three of those customers—Fuyuan, HTOT and OCI—ranked among the company’s top five revenue customers in the fourth quarter. In fiscal 2012 nearly 25 percent of our revenue and more than 50 percent of our annual net bookings came from outside the solar industry.
“While our PV equipment business continues to reflect the effects of a worldwide segment slowdown, our polysilicon business set revenue and bookings records in fiscal 2012. Meanwhile, in each of our businesses we continued to invest in next generation technologies and products to enable our customers to increase their efficiencies and lower their costs while solidifying GT’s market share leadership in the years ahead.
“Our fiscal year ending backlog of approximately $1.8 billion remains well above the normalized level required to sustain our business. We believe that our backlog provides a solid foundation for our business through the balance of calendar 12 and well into CY13.”
New Fiscal Reporting Cycle
On April 16, 2012, the company’s Board of Directors approved a change to the company’s fiscal year-end to December 31 from the Saturday closest to March 31st. As a result, the company will report a nine-month transitional period consisting of the period from April 1, 2012 to December 31, 2012, and 2013 fiscal year will begin on January 1, 2013 and end on December 31, 2013.
Business Outlook
As a result of the change in the fiscal year end date, the company will be providing annual guidance for calendar year 2012, to include March quarter actuals and guidance for the nine-month transition period ending December 31, 2012.
The company will provide details on its calendar 2012 guidance, and commentary on calendar 2013, during its live webcasted conference call tomorrow morning pre-market opening. See details below.
Investor Financial Summary Document
A comprehensive summary of the company’s financial performance can be found on the Investor Relations section of its website in the “Featured Documents” section and the “Q4 FY12 Earnings Call” webcast page. To access: http://investor.gtsolar.com.
Conference Call, Webcast
Tomorrow morning, Thursday, May 17, 2012, at 8:00am ET the company will host a live conference call to discuss quarterly results and the company’s longer-term outlook with Tom Gutierrez, president and chief executive officer and Richard Gaynor, chief financial officer.
The call will be webcast live and can be accessed by logging on to the "Investors" section of GT Advanced Technologies’ website, http://investor.gtat.com/. No password is required to access the webcast. A slide presentation will accompany the call.
The live call can also be accessed by dialing 800 561.2731 for callers in the United States and Canada and 617 614.3528 for international callers. The telephone passcode is GTAT.
A replay of the call will be available through August 15, 2012. To access the replay, please go to http://investor.gtat.com/ and select the webcast replay link on the ‘Events and Presentations’ page. Or, please dial 888 286.8010 for callers in the United States and Canada, or 617 801.6888 for international callers. The telephone replay passcode is 42439473.
About GT Advanced Technologies Inc.
GT Advanced Technologies Inc. is a global provider of polysilicon production technology and sapphire and silicon crystalline growth systems and materials for the solar, LED and other specialty markets. The company's products and services allow its customers to optimize their manufacturing environments and lower their cost of ownership. For additional information about GT Advanced Technologies, please visit www.gtat.com.
GT Advanced Technologies Inc. | |||||||||||||
Condensed Consolidated Balance Sheets | |||||||||||||
(in thousands, except per share data) | |||||||||||||
(Unaudited) | |||||||||||||
March 31, | April 2, | ||||||||||||
2012 | 2011 | ||||||||||||
Assets | |||||||||||||
Current assets: | |||||||||||||
Cash and cash equivalents | $ | 350,903 | $ | 362,749 | |||||||||
Restricted cash | - | - | |||||||||||
Accounts receivable, net | 65,676 | 87,134 | |||||||||||
Inventories | 193,295 | 127,572 | |||||||||||
Deferred costs | 91,740 | 125,805 | |||||||||||
Vendor advances | 85,396 | 20,044 | |||||||||||
Deferred income taxes | 13,857 | 62,539 | |||||||||||
Refundable income taxes | 1,516 | 21,780 | |||||||||||
Prepaid expenses and other current assets | 12,117 | 17,114 | |||||||||||
Total current assets | 814,500 | 824,737 | |||||||||||
Property, plant and equipment, net | 99,982 | 54,441 | |||||||||||
Other assets | 20,306 | 9,930 | |||||||||||
Intangible assets, net | 86,357 | 22,705 | |||||||||||
Deferred cost | 9,293 | 129,301 | |||||||||||
Goodwill | 102,152 | 85,178 | |||||||||||
Total assets | $ | 1,132,590 | $ | 1,126,292 | |||||||||
Liabilities and stockholders’ equity | |||||||||||||
Current liabilities: | |||||||||||||
Current portion of long-term debt | $ | 3,750 | $ | 18,750 | |||||||||
Accounts payable | 34,323 | 63,401 | |||||||||||
Accrued expenses | 37,074 | 39,987 | |||||||||||
Contingent consideration | 16,071 | 4,837 | |||||||||||
Customer deposits | 334,098 | 144,429 | |||||||||||
Deferred revenue | 165,149 | 247,495 | |||||||||||
Accrued income taxes | 37,620 | 23,014 | |||||||||||
Total current liabilities | 628,085 | 541,913 | |||||||||||
Long-term debt | 71,250 | 101,563 | |||||||||||
Deferred income taxes | 38,918 | 59,080 | |||||||||||
Deferred revenue | 31,010 | 198,022 | |||||||||||
Contingent consideration | 6,402 | 6,391 | |||||||||||
Other non-current liabilities | 547 | 817 | |||||||||||
Accrued income taxes | 24,824 | 16,566 | |||||||||||
Total liabilities | 801,036 | 924,352 | |||||||||||
Commitments and contingencies | |||||||||||||
Stockholders’ equity: | |||||||||||||
Preferred stock, 10,000 shares authorized, none issued and outstanding | - | - | |||||||||||
Common stock, $0.01 par value; 500,000 shares authorized, 118,331 and 125,683 shares issued and outstanding as of March 31, 2012 and April 2, 2011, respectively | 1,183 | 1,257 | |||||||||||
Additional paid-in capital | 131,563 | 123,338 | |||||||||||
Accumulated other comprehensive loss | (187 | ) | (2,852 | ) | |||||||||
Retained earnings | 198,995 | 80,197 | |||||||||||
Total stockholders' equity | 331,554 | 201,940 | |||||||||||
Total liabilities and stockholders' equity | $ | 1,132,590 | $ | 1,126,292 | |||||||||
GT Advanced Technologies Inc. | |||||||||||||||||||||||
Condensed Consolidated Statements of Operations | |||||||||||||||||||||||
(In thousands, except per share data) | |||||||||||||||||||||||
(Unaudited) | |||||||||||||||||||||||
Three Months Ended | Fiscal Year Ended | ||||||||||||||||||||||
March 31, | April 2, | March 31, | April 2, | ||||||||||||||||||||
2012 | 2011 | 2012 | 2011 | ||||||||||||||||||||
Revenue | $ | 353,890 | $ | 271,627 | $ | 955,705 | $ | 898,984 | |||||||||||||||
Cost of revenue | 201,562 | 154,763 | 528,905 | 520,989 | |||||||||||||||||||
Gross profit | 152,328 | 116,864 | 426,800 | 377,995 | |||||||||||||||||||
Operating expenses: | |||||||||||||||||||||||
Research and development | 15,248 | 7,977 | 49,872 | 23,753 | |||||||||||||||||||
Selling and marketing | 2,707 | 6,274 | 19,763 | 19,792 | |||||||||||||||||||
General and administrative | 15,697 | 18,903 | 68,575 | 56,648 | |||||||||||||||||||
Amortization of intangible assets | 2,546 | 978 | 8,198 | 4,500 | |||||||||||||||||||
Total operating expenses | 36,198 | 34,132 | 146,408 | 104,693 | |||||||||||||||||||
Income from operations | 116,130 | 82,732 | 280,392 | 273,302 | |||||||||||||||||||
Other income (expense): | |||||||||||||||||||||||
Interest income | 17 | 113 | 468 | 603 | |||||||||||||||||||
Interest expense | (799 | ) | (1,947 | ) | (12,980 | ) | (2,923 | ) | |||||||||||||||
Other, net | (52 | ) | (292 | ) | 2,058 | (384 | ) | ||||||||||||||||
Income before income taxes | 115,296 | 80,606 | 269,938 | 270,598 | |||||||||||||||||||
Provision for income taxes | 36,223 | 28,712 | 86,541 | 95,843 | |||||||||||||||||||
Net income | $ | 79,073 | $ | 51,894 | $ | 183,397 | $ | 174,755 | |||||||||||||||
Net income per share: | |||||||||||||||||||||||
Basic | $ | 0.66 | $ | 0.41 | $ | 1.48 | $ | 1.26 | |||||||||||||||
Diluted | $ | 0.65 | $ | 0.41 | $ | 1.45 | $ | 1.24 | |||||||||||||||
Weighted-average number of shares used in per share calculations: | |||||||||||||||||||||||
Basic | 119,407 | 125,319 | 123,924 | 138,673 | |||||||||||||||||||
Diluted | 120,738 | 127,881 | 126,051 | 140,902 | |||||||||||||||||||
Reconciliation of Non-GAAP Financial Measures
In accordance with the requirements of Regulation G issued by the Securities and Exchange Commission, we are presenting the most directly comparable GAAP financial measures and reconciling the non-GAAP financial metrics to the comparable GAAP measures.
GT Advanced Technologies Inc. | |||||||||||||||||||||||||||||||
Reconciliation of GAAP to non-GAAP results | |||||||||||||||||||||||||||||||
(In thousands, except per share data) | |||||||||||||||||||||||||||||||
(Unaudited) | |||||||||||||||||||||||||||||||
Three Months Ended | Fiscal Year Ended | ||||||||||||||||||||||||||||||
March 31, | December 31, | April 2, | March 31, | April 2, | |||||||||||||||||||||||||||
2012 | 2011 | 2011 | 2012 | 2011 | |||||||||||||||||||||||||||
Non-GAAP Net Income | |||||||||||||||||||||||||||||||
Net income | $ | 79,073 | $ | 15,340 | $ | 51,894 | $ | 183,397 | $ | 174,755 | |||||||||||||||||||||
Non-GAAP adjustments: | |||||||||||||||||||||||||||||||
Amortization of acquired intangible assets | 2,546 | 2,822 | 978 | 8,198 | 4,500 | ||||||||||||||||||||||||||
Stock-based compensation | 4,171 | 3,660 | 2,562 | 14,727 | 8,224 | ||||||||||||||||||||||||||
Third party acquisition related expenses | 223 | 240 | 114 | 3,683 | 899 | ||||||||||||||||||||||||||
Non-cash portion of interest expense | 177 | 6,360 | 525 | 9,594 | 1,087 | ||||||||||||||||||||||||||
Income tax effect of non-GAAP adjustments (1) | (2,327 | ) | (4,251 | ) | (2,201 | ) | (12,074 | ) | (6,794 | ) | |||||||||||||||||||||
Non-GAAP Net Income | $ | 83,863 | $ | 24,171 | $ | 53,872 | $ | 207,525 | $ | 182,671 | |||||||||||||||||||||
Non-GAAP earnings per diluted share ("Non-GAAP EPS") | $ | 0.69 | $ | 0.19 | $ | 0.42 | $ | 1.65 | $ | 1.30 | |||||||||||||||||||||
Diluted weighted average shares outstanding | 120,738 | 124,946 | 127,881 | 126,051 | 140,902 |
(1) The Company utilized the with and without method to determine the income tax effect on non-GAAP adjustments.
Use of Non-GAAP Financial Measures
In addition to providing financial measurements based on generally accepted accounting principles in the United States of America (GAAP), GT Advanced Technologies is providing additional financial metrics that are not prepared in accordance with GAAP (non-GAAP). We believe that the inclusion of these non-GAAP financial measures helps investors to gain a meaningful understanding of our past performance and future prospects, consistent with how management measures and forecasts company performance, especially when comparing such results to previous periods or forecasts. Our management uses these non-GAAP measures, in addition to GAAP financial measures, as the basis for measuring our core operating performance and comparing our performance to prior periods and to the performance of our competitors. Management also uses these measures in its financial and operational decision-making.
We define "non-GAAP net income" as GAAP net income excluding share-based compensation expense, amortization of acquired intangible assets, acquisition and acquisition related expenses, and the non-cash portion of interest expense. We consider non-GAAP net income to be an important indicator of our operational strength and performance of our business because it eliminates the effects of events that are not part of the Company's core operations.
We define "non-GAAP earnings per share on a fully-diluted basis" as our non-GAAP net income divided by our weighted average shares outstanding on a fully-diluted basis.
Forward-Looking Statements
Some of the information in this press release relate to future expectations, plans and prospects for our business and industry that constitute “forward-looking statements” for the purposes of the safe-harbor provisions of the Private Securities Litigation Reform Act of 1995, including but not limited to, all statements under the caption “Business Outlook,” the company’s estimates for future periods (including for calendar year 2012) with respect to revenue, gross margin, annual tax rate, earnings per share, adjusted non-GAAP fully diluted earnings per share, weighted average diluted shares outstanding, research and development spending and other financial information relating to our operations, our future success in diversifying the business of the company, such diversification being a key strategic priority, our future investment in next generation technologies and products, that such next generation technologies and products will enable our customers to increase their efficiencies, and lower their costs while solidifying GT’s market share leadership in the years ahead, our fiscal year ending March 31, 2012 backlog of approximately $1.8 billion remains well above the normalized level required to sustain our business in the future, our backlog provides a solid foundation for our business through the balance of calendar 12 and well into CY13. These forward-looking statements are not a guarantee of performance and are subject to a number of uncertainties and other factors, many of which are outside the company’s control, which could cause actual events to differ materially from those expressed or implied by the statements. These factors may include the possibility that the company is unable to recognize revenue on contracts in its order backlog. Although the company’s backlog is based on signed purchase orders or other written contractual commitments in effect as of the end of our fiscal year ended March 31, 2012, we cannot guarantee that our bookings or order backlog will result in actual revenue in the originally anticipated period or at all, which could reduce our revenue, profitability and liquidity. Other factors that may cause actual events to differ materially from those expressed or implied by our forward-looking statements include the impact of general economic conditions and the tightening credit market for having an adverse impact on demand for our products, the possibility that changes in government incentives may reduce demand for solar products, which would, in turn, reduce demand for our equipment, technological changes could render existing products or technologies obsolete, the company may be unable to protect its intellectual property rights, competition from other manufacturers may increase, exchange rate fluctuations and conditions in the credit markets and economy may reduce demand for the company’s products and various other risks as outlined in GT Advanced Technologies Inc.’s filings with the Securities and Exchange Commission, including the statements under the heading “Risk Factors” in the company’s quarterly report on Form 10-Q for the fiscal 2012 third quarter filed on February 7, 2012. Statements in this press release should be evaluated in light of these important factors. The statements in this press release represent GT Advanced Technologies Inc.’s expectations and beliefs as of the date of this press release. GT Advanced Technologies Inc. anticipates that subsequent events and developments may cause these expectations and beliefs to change. GT Advanced Technologies Inc. is under no obligation to, and expressly disclaims any such obligation to, update or alter its forward-looking statements, whether as a result of new information, future events, or otherwise.
CONTACT:
GT Advanced Technologies Inc.
Media
Jeff
Nestel-Patt, 603-204-2883
jeff.nestelpatt@gtat.com
or
Investors/Analysts
Ryan
Blair, 603-681-3869
ryan.blair@gtat.com
Exhibit 99.2
Investor Financial Summary (dollars in millions)Q1 FY10Q2 FY10Q3 FY10Q4 FY10Q1 FY11Q2 FY11Q3 FY11Q4 FY11Q1 FY12Q2 FY12Q3 FY12Q4 FY12FY2010FY2011FY2012Revenue by Segment72$ 104$ 174$ 195$ 135$ 229$ 263$ 272$ 231$ 218$ 153$ 354$ 544$ 899$ 956$ Photovoltaic (PV)20$ 62$ 40$ 64$ 111$ 203$ 240$ 186$ 199$ 111$ 34$ 31$ 187$ 740$ 376$ Polysilicon52$ 42$ 133$ 131$ 24$ 23$ 17$ 79$ 24$ 98$ 87$ 154$ 358$ 144$ 363$ Sapphire -$ -$ -$ -$ -$ 3$ 6$ 6$ 9$ 8$ 31$ 169$ -$ 15$ 217$ Revenue by Geography72$ 104$ 174$ 195$ 135$ 229$ 263$ 272$ 231$ 218$ 153$ 354$ 544$ 899$ 956$ Asia23$ 63$ 163$ 190$ 87$ 224$ 257$ 267$ 226$ 187$ 149$ 348$ 439$ 835$ 911$ U.S.0$ 8$ 2$ (1)$ 1$ 4$ 2$ 3$ 4$ 2$ 2$ 3$ 9$ 9$ 11$ Europe/ROW49$ 33$ 9$ 5$ 47$ 2$ 4$ 2$ 1$ 28$ 1$ 3$ 96$ 54$ 34$ Gross Profit35$ 34$ 77$ 73$ 46$ 93$ 122$ 117$ 113$ 95$ 66$ 152$ 219$ 378$ 427$ Gross Margin %49%33%44%38%34%41%46%43%49%44%43%43%40%42%45%Photovoltaic34%30%32%39%33%40%47%45%52%46%38%53%34%43%49%Polysilicon55 %38%48%37%39%50%40%41%41%43%46%43%44%42%43%Sapphire31%41%3%13%18%42%42%0%23%40%Operating Expenses19$ 19$ 19$ 18$ 19$ 24$ 27$ 34$ 35$ 41$ 34$ 36$ 75$ 105$ 146$ Research and Development6$ 5$ 5$ 5$ 4$ 5$ 7$ 8$ 11$ 10$ 13$ 15$ 21$ 24$ 50$ Sales and Marketing4$ 3$ 2$ 2$ 4$ 5$ 4$ 6$ 6$ 7$ 4$ 3$ 12$ 20$ 20$ General and Administrative9$ 11$ 11$ 10$ 11$ 14$ 16$ 20$ 17$ 24$ 17$ 18$ 42$ 61$ 77$ Operating Income16$ 15$ 58$ 55$ 27$ 69$ 95$ 83$ 79$ 54$ 32$ 116$ 144$ 273$ 280$ Net Income8$ 9$ 37$ 33$ 16$ 43$ 64$ 52$ 52$ 37$ 15$ 79$ 87$ 175$ 183$ Earnings per Share (Diluted)0.05$ 0.06$ 0.25$ 0.23$ 0.11$ 0.28$ 0.46$ 0.41$ 0.41$ 0.29$ 0.12$ 0.65$ 0.60$ 1.24$ 1.45$ Non-GAAP EPS*****0.12$ 0.30$ 0.47$ 0.42$ 0.44$ 0.34$ 0.19$ 0.69$ *1.30$ 1.65$ 15.937*Company started reporting non-GAAP EPS in FY2012. Company has provided FY2011 non-GAAP EPS for comparative purposes. Please refer to the GAAP to non-GAAP reconciliation on page 3.-Certain amounts in the table above may not sum or recalculate due to rounding of individual componentsFY 2012 Revenue Mix Sapphire 23% Polysilicon 38% Photovoltaic 39% 49% 33% 44% 38% 34% 41% 46% 43% 49% 44% 43% 43% 0% 10% 20% 30% 40% 50% 60% $- $50 $100 $150 $200 $250 $300 $350 $400 Q1 FY10 Q2 FY10 Q3 FY10 Q4 FY10 Q1 FY11 Q2 FY11 Q3 FY11 Q4 FY11 Q1 FY12 Q2 FY12 Q3 FY12 Q4 FY12 Revenue and Gross Margin (revenue in millions) Total Revenue Gross Margin % FY 2011 Revenue Mix Polysilicon 16% Photovoltaic 82% Sapphire 2% $0.00 $0.10 $0.20 $0.30 $0.40 $0.50 $0.60 $0.70 0 20 40 60 80 100 120 140 160 Q1 FY10 Q2 FY10 Q3 FY10 Q4 FY10 Q1 FY11 Q2 FY11 Q3 FY11 Q4 FY11 Q1 FY12 Q2 FY12 Q3 FY12 Q4 FY12 Earnings per Share Diluted shares Outstanding Earnings per Share (Diluted) $6 $5 $5 $5 $4 $5 $7 $8 $11 $10 $13 $15 $4 $3 $2 $2 $4 $5 $4 $6 $6 $7 $4 $3 $9 $11 $11 $10 $11 $14 $16 $20 $17 $24 $17 $18 $19 $19 $19 $18 $19 $24 $27 $34 $35 $41 $34 $36 $- $5 $10 $15 $20 $25 $30 $35 $40 $45 Q1 FY10 Q2 FY10 Q3 FY10 Q4 FY10 Q1 FY11 Q2 FY11 Q3 FY11 Q4 FY11 Q1 FY12 Q2 FY12 Q3 FY12 Q4 FY12 Operating Expenses Trend (in millions) Research and Development Sales and Marketing General and Administrative $138 $880 $761 Q4 FY 2012 Backlog (in millions) PV POLY SAPPHIRE $1.78 Billion Total $196 $332 $109 $1,142 Q4 FY 2012 Backlog: $1.78 Billion (in millions) Deferred Revenue Letters of Credit Non Refundable Customer Deposits Unshipped Orders
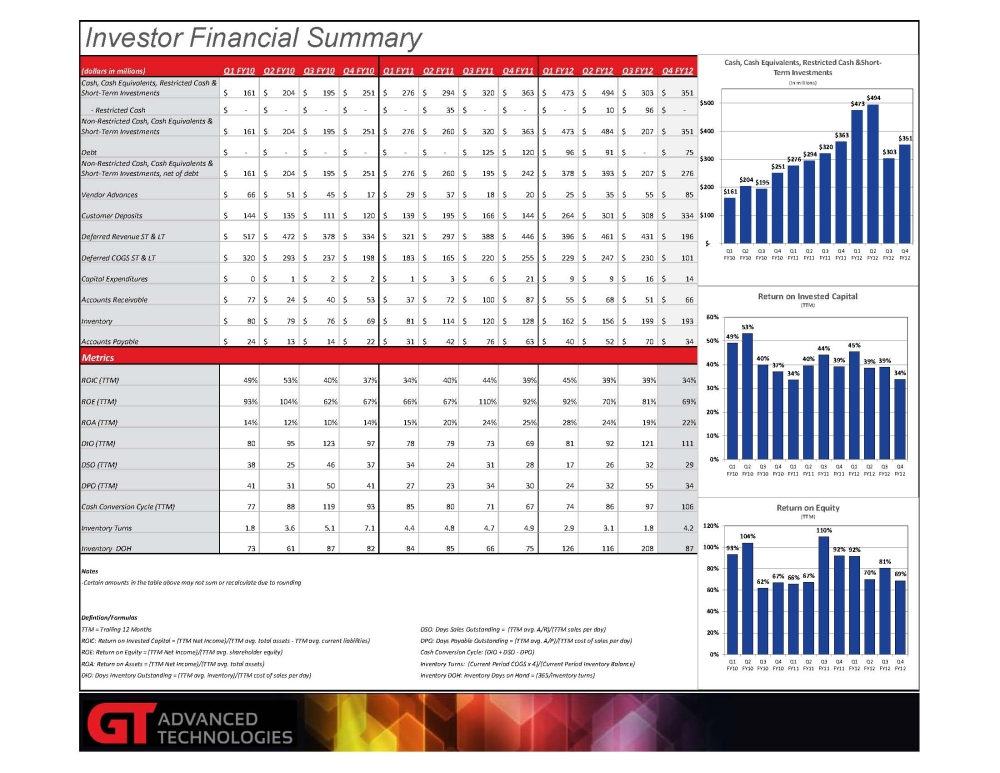
Investor Financial Summary(dollars in millions)Q1 FY10Q2 FY10Q3 FY10Q4 FY10Q1 FY11Q2 FY11Q3 FY11Q4 FY11Q1 FY12Q2 FY12Q3 FY12Q4 FY12Cash, Cash Equivalents, Restricted Cash & Short-Term Investments161$ 204$ 195$ 251$ 276$ 294$ 320$ 363$ 473$ 494$ 303$ 351$ 1,254 - Restricted Cash-$ -$ -$ -$ -$ 35$ -$ -$ -$ 10$ 96$ -$ 35 Non-Restricted Cash, Cash Equivalents & Short-Term Investments161$ 204$ 195$ 251$ 276$ 260$ 320$ 363$ 473$ 484$ 207$ 351$ 1,219 Debt-$ -$ -$ -$ -$ -$ 125$ 120$ 96$ 91$ -$ 75$ 245 Non-Restricted Cash, Cash Equivalents & Short-Term Investments, net of debt161$ 204$ 195$ 251$ 276$ 260$ 195$ 242$ 378$ 393$ 207$ 276$ Vendor Advances66$ 51$ 45$ 17$ 29$ 37$ 18$ 20$ 25$ 35$ 55$ 85$ 104 Customer Deposits144$ 135$ 111$ 120$ 139$ 195$ 166$ 144$ 264$ 301$ 308$ 334$ 645 Deferred Revenue ST & LT517$ 472$ 378$ 334$ 321$ 297$ 388$ 446$ 396$ 461$ 431$ 196$ 1,452 Deferred COGS ST & LT320$ 293$ 237$ 198$ 183$ 165$ 220$ 255$ 229$ 247$ 230$ 101$ 823 Capital Expenditures0$ 1$ 2$ 2$ 1$ 3$ 6$ 21$ 9$ 9$ 16$ 14$ 31 Accounts Receivable77$ 24$ 40$ 53$ 37$ 72$ 100$ 87$ 55$ 68$ 51$ 66$ 296 Inventory80$ 79$ 76$ 69$ 81$ 114$ 120$ 128$ 162$ 156$ 199$ 193$ 442 Accounts Payable24$ 13$ 14$ 22$ 31$ 42$ 76$ 63$ 40$ 52$ 70$ 34$ 213 MetricsROIC (TTM)49%53%40%37%34%40%44%39%45%39%39%34%2 ROE (TTM)93%104%62%67%66%67%110%92%92%70%81%69%3 ROA (TTM)14%12%10%14%15%20%24%25%28%24%19%22%DIO (TTM)80 95 123 97 78 79 73 69 81 92 121 111 DSO (TTM)38 25 46 37 34 24 31 28 17 26 32 29 DPO (TTM)41 31 50 41 27 23 34 30 24 32 55 34 Cash Conversion Cycle (TTM)77 88 119 93 85 80 71 67 74 86 97 106 Inventory Turns1.8 3.6 5.1 7.1 4.4 4.8 4.7 4.9 2.9 3.1 1.8 4.2 Inventory DOH73 61 87 82 84 85 66 75 126 116 208 87 Notes-Certain amounts in the table above may not sum or recalculate due to roundingDefintion/FormulasTTM = Trailing 12 MonthsDSO: Days Sales Outstanding = (TTM avg. A/R)/(TTM sales per day)ROIC: Return on Invested Capital = (TTM Net Income)/(TTM avg. total assets - TTM avg. current liabilities)DPO: Days Payable Outstanding = (TTM avg. A/P)/(TTM cost of sales per day)ROE: Return on Equity = (TTM Net Income)/(TTM avg. shareholder equity)Cash Conversion Cycle: (DIO + DSO - DPO)ROA: Return on Assets = (TTM Net Income)/(TTM avg. total assets)Inventory Turns: (Current Period COGS x 4)/(Current Period Inventory Balance)DIO: Days Inventory Outstanding = (TTM avg. inventory)/(TTM cost of sales per day)Inventory DOH: Inventory Days on Hand = (365/inventory turns) $161 $204 $195 $251 $276 $294 $320 $363 $473 $494 $303 $351 $- $100 $200 $300 $400 $500 Q1 FY10 Q2 FY10 Q3 FY10 Q4 FY10 Q1 FY11 Q2 FY11 Q3 FY11 Q4 FY11 Q1 FY12 Q2 FY12 Q3 FY12 Q4 FY12 Cash, Cash Equivalents, Restricted Cash &Short-Term Investments (in millions) 49% 53% 40% 37% 34% 40% 44% 39% 45% 39% 39% 34% 0% 10% 20% 30% 40% 50% 60% Q1 FY10 Q2 FY10 Q3 FY10 Q4 FY10 Q1 FY11 Q2 FY11 Q3 FY11 Q4 FY11 Q1 FY12 Q2 FY12 Q3 FY12 Q4 FY12 Return on Invested Capital (TTM) 93% 104% 62% 67% 66% 67% 110% 92% 92% 70% 81% 69% 0% 20% 40% 60% 80% 100% 120% Q1 FY10 Q2 FY10 Q3 FY10 Q4 FY10 Q1 FY11 Q2 FY11 Q3 FY11 Q4 FY11 Q1 FY12 Q2 FY12 Q3 FY12 Q4 FY12 Return on Equity (TTM)
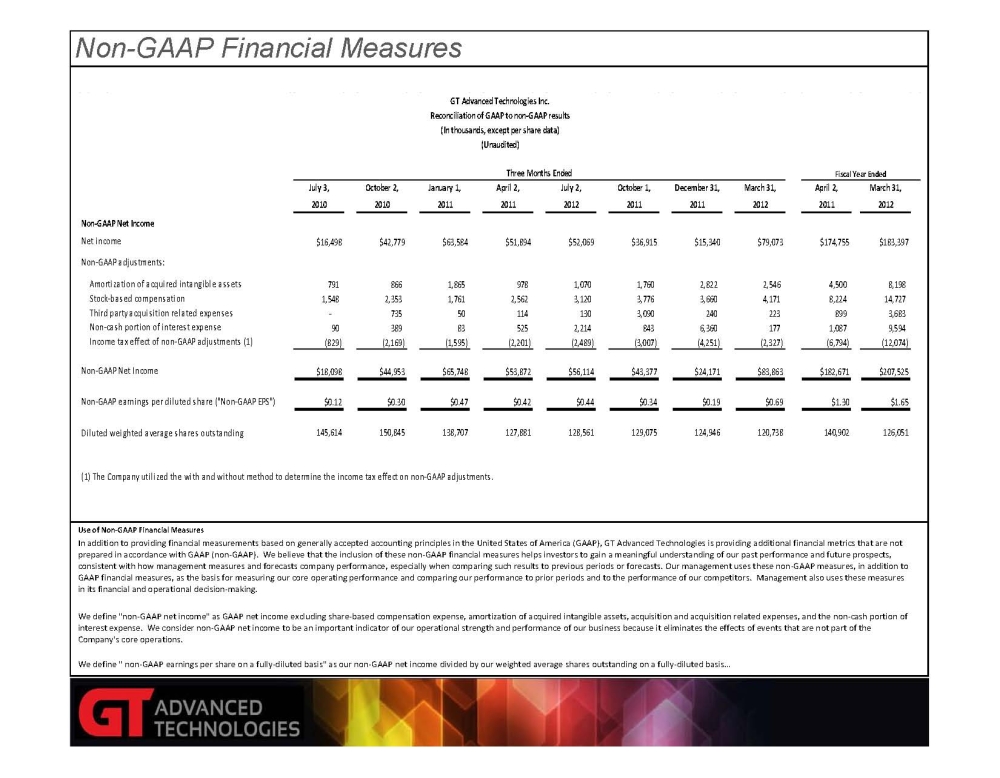
Non-GAAP Financial MeasuresUse of Non-GAAP Financial Measures In addition to providing financial measurements based on generally accepted accounting principles in the United States of America (GAAP), GT Advanced Technologies is providing additional financial metrics that are not prepared in accordance with GAAP (non-GAAP). We believe that the inclusion of these non-GAAP financial measures helps investors to gain a meaningful understanding of our past performance and future prospects, consistent with how management measures and forecasts company performance, especially when comparing such results to previous periods or forecasts. Our management uses these non-GAAP measures, in addition to GAAP financial measures, as the basis for measuring our core operating performance and comparing our performance to prior periods and to the performance of our competitors. Management also uses these measures in its financial and operational decision-making. We define "non-GAAP net income" as GAAP net income excluding share-based compensation expense, amortization of acquired intangible assets, acquisition and acquisition related expenses, and the non-cash portion of interest expense. We consider non-GAAP net income to be an important indicator of our operational strength and performance of our business because it eliminates the effects of events that are not part of the Company's core operations. We define " non-GAAP earnings per share on a fully-diluted basis" as our non-GAAP net income divided by our weighted average shares outstanding on a fully-diluted basis... July 3,October 2,January 1,April 2,July 2,October 1,December 31,March 31,April 2,March 31,2010201020112011201220112011201220112012Non-GAAP Net IncomeNet income$16,498$42,779$63,584$51,894$52,069$36,915$15,340$79,073$174,755$183,397Non-GAAP adjustments:Amortization of acquired intangible assets791 866 1,865 978 1,070 1,760 2,822 2,546 4,500 8,198 Stock-based compensation1,548 2,353 1,761 2,562 3,120 3,776 3,660 4,171 8,224 14,727 Third party acquisition related expenses- 735 50 114 130 3,090 240 223 899 3,683 Non-cash portion of interest expense90 389 83 525 2,214 843 6,360 177 1,087 9,594 Income tax effect of non-GAAP adjustments (1)(829) (2,169) (1,595) (2,201) (2,489) (3,007) (4,251) (2,327) (6,794) (12,074) Non-GAAP Net Income$18,098$44,953$65,748$53,872$56,114$43,377$24,171$83,863$182,671$207,525Non-GAAP earnings per diluted share ("Non-GAAP EPS")$0.12$0.30$0.47$0.42$0.44$0.34$0.19$0.69$1.30$1.65Diluted weighted average shares outstanding145,614150,845138,707127,881128,561129,075124,946120,738140,902126,051(1) The Company utilized the with and without method to determine the income tax effect on non-GAAP adjustments.GT Advanced Technologies Inc.Reconciliation of GAAP to non-GAAP results(In thousands, except per share data)(Unaudited)Three Months EndedFiscal Year Ended
)])L=5\'>+/&?BC5]8^-EW\#O"_
MPW\(P^#O'/C+QIKUE9?#KQ!>:YX_P#%
M/@WQ^I3Q?H]Q_P`$_P#]FS3_`.W)!9V6GQ7MYJ.D:YINIC4[:RTS2[:SU2*]
M34;.#3;".UNHDLX%3]@_B1^T-IWPW\<:?\/YOAE\4/%FMZ_X2\4^(_",WA'3
M?"5UI_C#6?"6BZMXAU#P!HLNL>,=$N[?Q;<:3I+265[K]EHG@3[;J6BZ5?>-
M;'4]4M[4^??#/]LKPU\2;CX00S_![XU?#V'XV7WC+1?"%W\0M$\$6,$'B3P-
M-\1)-6\/ZR/#?CWQ1-#-=Z'\,M?\5:+K>EQ:OX2U/0-2\)O%XB35/$VG:6VO
MU/#.#INC%TY)J4)
D0?\$\OV6H--C\/6\'V2'0H[.&^6"+1X[3=;1Z;'&MHL+&-8E!R/UQ^
M,7QJT?X+6/A[5]?\)^,-=T37/%_A+P=?:QX7L]$O;3PK=^-O%.@>"_#^J>(8
M-1US2M3DTJY\2>)M(TYT\.:?XAUE//DNETB2SM;NX@\JT#]LWX;:_JGBC1H/
M#/CZ#4?!GQR\._`#Q*D&CZ3XAL]&\8>*[G0[70]0UK6?!NN>)=#\.:)=2^)-
M#BGM_%.I:'XLTR[U.RT[5_"VGZE=VMG/O'"X>/-RT[#/VBO!ES\0OA]'XAD\'MK^K:-H>LZ]X9UKPU;>*K#3I@;+Q9X5_MJRLV
MUWPAK]A<6=]HNO6'GV=QNNM/N'M=:TS5]+T[K_B;\3?!WP?\$Z]\0O'M]J&G
M>%?#5F+_`%B\TOP_XA\47MO:F>"V,T>B^%]+UG6;F..6XC:XDM["6*SMA-?7
MDEO8VUSOR>'KK0QH_AF_/C.
MXND\-:O]KT_P8-?O])>".+5K>QEN($DS?BUX;\2_%KX=^,_AS>:%XL\*V'CC
MPYJ/A75-=\+>(OAV/$=KI&LV\MCJR:;+XET[Q+HD4USIUQ=6237>AWKVZW4T
M]KY%TL$\?D'B#X#>-_$EU\1KO4/&GQL,GQ.^%&B_"/Q&(=8_9O1!HNAMXJ,.
ML6`D^$L[6GB*[;QQXKFO;@O-HKR:S*EOH-M%8:2MB`?4'B>ZAOM0^%5[;,SV
M]YXON[J!F1XV:&?X8?$&6)FCD59(V*,I*.JNI^5E!!%XYK@/BA\3/"WP@\$ZY\0_&
MAUJ/PMX;M)]1UV[T'PYKOBFZTO2[.UN;_4-7O-.\.Z?J5_;Z3IEA9W=[J6IR
MVZ65G;P,9IED>&.3:_M35^VAR#T!U'3SQ[D72@D>H50>N!TKRSXS?#J'XX?#
MW7OAIXHM=5T[P[XD@-EK*Z9!\,M4=-GMKRWN=/NK#XC^%?'>@-`)9K34K>
M1-&2\@U/3K"[AND:V13VG+RPYVN9\O1_)>7>_0[KPU\2?"'C/6/%'A_P]?7U
MWJ7@\>'GUM;K0M>TJU$7B>TGO]&N-+U#5M-L;'7[.XAM+N&6_P!"N-1LK/4+
M2]TJ[N(-4L;VSM_HW5_CSX)^`/P*^&/B3QDGB*^D\177A'P1X7\/>$O#.M^+
M?%'BCQ/KT-SYTG6;33;;
M5_#WB&TT?6K6>YBLKK3=2XJGQR]3JBDHI)W5M&?=\$AE@AD.
#_@DY_P`F3^%CW_X7
MI^VD,]\#]M3]H+`^@R<#MDXZFOZ'W^XW^ZW\C7\\'_!)S_DR?PK_`-EU_;3_
M`/6U/V@:NG\4BI\$O0_2&BO"_VA/V@?!_[-W@5/'OC/2?$NN:?/?:AI]KI
MOA6/0/[1FN-)\)>)_'6I22W?BOQ!X5\-:;9VGA?P;XAO7O-:\0Z7!+<6UKIE
MF]YJ^I:;IM[PNL?MG_`O2].MKX>(+MC%KVFZ'XGBU#3KO01X)672?'&L^)-5
M\17.N0V%@^E^!;;X9?$2R\8SZ->ZK)H'B'PAK'A;58;'7[2XLHNJ52$79O56
MTL^ORL