UNITED STATES
SECURITIES AND EXCHANGE COMMISSION
Washington, D.C. 20549
FORM
For the fiscal year ended
OR
For the transition period from to
Commission file number:
(Exact name of registrant as specified in its charter)
(State or other jurisdiction of incorporation or organization) | (I.R.S. Employer Identification No.) |
(Address of principal executive offices) | (Zip Code) |
(
(Registrant’s telephone number, including area code)
Securities registered pursuant to Section 12(b) of the Act:
Title of Each Class |
| Trading Symbol |
| Name of Each Exchange on Which Registered |
Securities registered pursuant to Section 12(g) of the Act:
None
Indicate by check mark if the registrant is a well-known seasoned issuer, as defined in Rule 405 of the Securities Act. Yes ☐
Indicate by check mark if the registrant is not required to file reports pursuant to Section 13 or Section 15(d) of the Act. Yes ☐
Indicate by check mark whether the registrant (1) has filed all reports required to be filed by Section 13 or 15(d) of the Securities Exchange Act of 1934 during the preceding 12 months (or for such shorter period that the registrant was required to file such reports), and (2) has been subject to such filing requirements for the past 90 days.
Indicate by check mark whether the registrant has submitted electronically every Interactive Data File required to be submitted pursuant to Rule 405 of Regulation S-T (§232.405 of this chapter) during the preceding 12 months (or for such shorter period that the registrant was required to submit such files).
Indicate by check mark whether the registrant is a large accelerated filer, an accelerated filer, a non-accelerated filer, a smaller reporting company or an emerging growth company. See the definitions of “large accelerated filer,” “accelerated filer,” “smaller reporting company,” and “emerging growth company” in Rule 12b-2 of the Exchange Act. (Check one):
Large accelerated filer | ☐ | Accelerated filer | ☐ |
☒ | Smaller reporting company | ||
|
| Emerging growth company |
If an emerging growth company, indicate by check mark if the registrant has elected not to use the extended transition period for complying with any new or revised financial accounting standards provided pursuant to Section 13(a) of the Exchange Act. ☐
Indicate by check mark whether the registrant has filed a report on and attestation to its management’s assessment of the effectiveness of its internal control over financial reporting under Section 404(b) of the Sarbanes-Oxley Act (15 U.S.C. 7262(b)) by the registered public accounting firm that prepared or issued its audit report.
If securities are registered pursuant to Section 12(b) of the Act, indicate by check mark whether the financial statements of the registrant included in the filing reflect the correction of an error to previously issued financial statements.
Indicate by check mark whether any of those error corrections are restatements that required a recovery analysis of incentive-based compensation received by any of the registrant’s executive officers during the relevant recovery period pursuant to § 240.10D-1(b).
Indicate by check mark whether the registrant is a shell company (as defined in Rule 12b-2 of the Exchange Act). Yes
The aggregate market value of common equity held by non-affiliates of the registrant was approximately $
As of January 31, 2024, the number of outstanding shares of the registrant’s common stock, par value $0.01 per share, was
DOCUMENTS INCORPORATED BY REFERENCE
Part III of this Annual Report on Form 10-K incorporates certain information by reference from the registrant’s proxy statement for the 2024 annual meeting of stockholders to be filed no later than 120 days after the end of the registrant’s fiscal year ended December 31, 2023.
GEVO, INC.
FORM 10-K—ANNUAL REPORT
FOR THE FISCAL YEAR ENDED DECEMBER 31, 2023
TABLE OF CONTENTS
Forward-Looking Statements
This Annual Report on Form 10-K (this “Report”) contains forward-looking statements within the meaning of Section 21 E of the Securities Exchange Act of 1934, as amended (the “Exchange Act”). When used in this Report, the words “expect,” “believe,” “anticipate,” “estimate,” “intend,” “plan” and similar expressions are intended to identify forward-looking statements. These statements relate to future events or our future financial or operational performance and involve known and unknown risks, uncertainties and other factors that could cause our actual results, levels of activity, performance or achievements to differ materially from those expressed or implied by these forward-looking statements. These statements reflect our current views with respect to future events and are based on assumptions and subject to risks and uncertainties. These forward-looking statements include, among other things, statements about: our financial condition, our results of operation and liquidity, our ability to finance, develop, and construct our Net-Zero Projects (as defined below), as well as other growth projects, our ability to produce our products, our expectations regarding the demand for our products and our ability to meet such demand, our ability to meet production, financial and operational guidance, our ability to generate revenue from our executed contracts, our strategy to pursue low-carbon or “net-zero” carbon renewable fuels for sale into California and elsewhere, our ability to replace our fossil-based energy sources with renewable energy sources at our Net-Zero Projects and elsewhere, our expectations regarding the location and start-up date for our initial Net-Zero Project, our expectations regarding our ability to produce renewable liquid hydrocarbons, our expectations regarding our ability to produce protein and other products for use in the food chain, our ability and plans to construct greenfield commercial hydrocarbon facilities to produce sustainable aviation fuel (“SAF”) and other products, our ability to raise additional funds to finance our business and the sources of those funds, our ability to perform under our existing offtake agreements and other sales agreements we may enter into in the future, our ability to successfully operate our renewable natural gas (“RNG”), also known as biogas, facilities in Iowa, our ability to produce renewable hydrocarbon products at a commercial level and at a profit, the availability of, and market prices for, government economic incentives to the renewable energy market, achievement of advances in our technology platform, the availability of suitable and cost-competitive feedstocks, our ability to gain market acceptance for our products, our expectations regarding the demand for carbon credits, the expected cost-competitiveness and relative performance attributes of our products, our strategy to pursue alcohol-to-SAF development and production, additional competition and changes in economic conditions and the future price and volatility of petroleum and products derived from petroleum. Important factors could cause actual results to differ materially from those indicated or implied by forward-looking statements such as those contained in documents we have filed with the United States (“U.S.”) Securities and Exchange Commission (the “SEC”), including this Report in Item 7. “Management’s Discussion and Analysis of Financial Condition and Results of Operations,” Item 1A. “Risk Factors” and subsequent reports on Form 10-Q. All forward-looking statements in this Report are qualified entirely by the cautionary statements included in this Report and such other filings. These risks and uncertainties or other important factors could cause actual results to differ materially from results expressed or implied by forward-looking statements contained in this Report. These forward-looking statements speak only as of the date of this Report. We undertake no intention or obligation to update or revise any forward-looking statements, whether as a result of new information, future events or otherwise, and readers should not rely on the forward-looking statements as representing the Company’s views as of any date subsequent to the date of the filing of this Report.
Unless the context requires otherwise, in this Report the terms “Gevo,” “we,” “us,” “our” and “Company” refer to Gevo, Inc. and its wholly owned, direct and indirect subsidiaries.
3
Risk Factors Summary
Our business is subject to a number of risks and uncertainties, many of which are beyond our control, including those described in Part I, Item 1A. Risk Factors of this annual report. These risks include, but are not limited to, the following:
● | We have a history of net losses, and we may not achieve or maintain profitability. |
● | We will require substantial additional financing to achieve our goals, and a failure to obtain this capital when needed or on acceptable terms could force us to delay, limit, reduce or terminate our development and commercialization efforts. |
● | Our business is capital-intensive in nature, and we rely on external financing to fund our growth strategy, including the development and construction of our Net-Zero Projects and other similar growth projects. Limitations on access to external financing could adversely affect our operating results. |
● | Our proposed growth projects may not be completed or, if completed, may not achieve profitability or perform as expected. Our project development activities may consume a significant portion of our management’s focus, and if not successful, reduce our profitability. |
● | We may be unable to successfully perform under current or future offtake and sales agreements to provide our products, which could harm our commercial prospects. |
● | Our offtake agreements, including our take-or-pay agreements, are subject to significant conditions precedent and, as a result, the revenues that we expect from such contracts may never be realized. |
● | Fluctuations in the price of corn and other feedstocks may affect our cost structure. |
● | Fluctuations in petroleum prices and customer demand patterns may reduce demand for renewable fuels. |
● | Any decline in the value of carbon credits associated with our products could have a material adverse effect on our results of operations cash flow and financial condition. |
● | We may not be successful in the commercialization of alcohol-to-SAF projects utilizing Axens technology. |
● | The technological and logistical challenges associated with producing, marketing, selling and distributing renewable hydrocarbon products are complex, and we may not be able to resolve such complexities in a timely or cost-effective manner, or at all. |
● | Our actual costs may be greater than expected in developing our growth projects, causing us to realize significantly lower profits or greater losses on our projects. |
● | We may be unable to produce renewable hydrocarbon products in accordance with customer specifications. |
● | Our experience may not be sufficient to operate commercial-scale facilities and we may encounter substantial difficulties operating commercial plants or expanding our business. |
● | Even if we are successful in producing our products on a commercial scale, we may not be successful in negotiating additional fuel offtake agreements or pricing terms to support the growth of our business. |
● | If we engage in acquisitions, we will incur a variety of costs and may potentially face numerous risks that could adversely affect our business and operations. |
● | If we engage in joint ventures, we will incur a variety of costs and may potentially face numerous risks that could adversely affect our business and operations. |
● | If we lose key personnel, including key management personnel, or are unable to attract and retain additional personnel, it could delay our product development programs and harm our research and development efforts, make it more difficult to pursue partnerships or develop our own products or otherwise have a material adverse effect on our business. |
● | We may face substantial competition from companies with greater resources and financial strength, which could adversely affect our performance and growth. |
● | Business interruptions may have an adverse impact on our business and our financial results. |
● | Our business and operations would suffer in the event of IT system failures or a cyber-attack. |
● | We may engage in hedging transactions, which could adversely impact our business. |
● | Ethical, legal and social concerns about genetically engineered products and processes, and similar concerns about feedstocks grown on land that could be used for food production, could limit or prevent the use of our products, processes and technologies and limit our revenues. |
● | As our products have not previously been used as a commercial fuel in significant amounts, their use exposes us to product liability risks. |
4
● | We may not be able to use some or all of our net operating loss carry-forwards tax deductions to offset future taxable income. |
● | Competitiveness of our products for fuel use (including RNG) depends in part on government economic incentives for renewable energy projects or other related policies that could change. |
● | In order to benefit from RINs and LCFS credits, our RNG projects are required to be registered and are subject to regulatory audit. |
● | Our RNG project has, and any future digester project may not be able to achieve the operating results we expect from these projects. |
● | Our ability to compete may be adversely affected if we are unsuccessful in defending against any claims by competitors or others that we are infringing upon their intellectual property rights. |
● | Our ability to compete may be adversely affected if we do not adequately protect our proprietary technologies or if we lose some of our intellectual property rights through costly litigation or proceedings. |
● | We may not be able to enforce our intellectual property rights throughout the world. |
● | Confidentiality agreements with employees and others may not adequately prevent disclosures of trade secrets and other proprietary information. |
● | We have received funding from U.S. government agencies, which could negatively affect our IP rights. |
● | The U.S. renewable fuels industry is highly dependent upon certain federal and state legislation and regulation and any changes in legislation or regulation could have a material adverse effect on our results of operations, cash flows and financial condition. |
● | Reductions or changes to existing regulations and policies may present technical, regulatory and economic barriers, which may significantly reduce demand for renewable fuels or our ability to supply our products. |
● | Negative attitudes toward renewable energy projects from the U.S. government, other lawmakers and regulators, and activists could adversely affect our business, financial condition and results of operations. |
● | Any claims relating to improper handling, storage or disposal of hazardous materials or noncompliance with applicable laws and regulations could be time consuming and costly and could adversely affect our business and results of operations. |
● | Our international activities may increase our exposure to potential liability under anti-corruption, trade protection, tax and other laws and regulations. |
● | The market price of our common stock may be adversely affected by the future issuance and sale of additional shares of our common stock or by our announcement that such issuances and sales may occur. |
● | Future issuances of our common stock or instruments convertible or exercisable into our common stock may materially and adversely affect the price of our common stock and cause dilution to our existing stockholders. |
● | Raising capital at a subsidiary, or project, level would result in lower revenues attributable back to us. |
● | Our inability to comply with applicable Nasdaq listing requirements could result in delisting of our common stock. |
● | Our stock price may be volatile, and your investment in our securities could suffer a decline in value. |
● | The estimates and assumptions on which our financial projections are based may prove to be inaccurate. |
● | Raising additional capital may cause dilution to our existing stockholders, restrict our operations or require us to relinquish rights to our technologies. |
● | We do not anticipate paying cash dividends, and accordingly, stockholders must rely on stock appreciation for any return on their investment. |
● | If securities or industry analysts do not publish research or reports about our business, or publish negative reports about our business, our stock price and trading volume could decline. The trading market for our common stock may be influenced by the research and reports that securities or industry analysts publish about us or our business. |
● | We are subject to anti-takeover provisions in our certificate of incorporation, our bylaws and under Delaware law that could delay or prevent an acquisition of the Company, even if the acquisition would be beneficial to our stockholders. |
● | Our certificate of incorporation provides that, unless we consent in writing to the selection of an alternative forum, the Court of Chancery of the State of Delaware will be the sole and exclusive forum for substantially all disputes between us and our stockholders, which could limit our stockholders’ ability to obtain a favorable judicial forum for disputes with us or our directors, officers or employees. |
5
PART I
Items 1 and 2.Business and Properties.
Company Overview
Gevo, Inc. (Nasdaq: GEVO), a Delaware corporation founded in 2005, is a growth-oriented, carbon abatement company with the mission of solving greenhouse gas emissions for those sectors of the transportation industry that are not amenable to electrification or hydrogen. We believe that the market size for hydrocarbon fuels will continue to remain significant in the long-term even with the rapid adoption of electric vehicles and hydrogen technologies.
We are focused on transforming renewable energy into energy-dense liquid hydrocarbons that can be used as renewable fuels, such as SAF, with the potential to achieve a “net-zero” greenhouse gas (“GHG”) footprint. We believe that this addresses the global need of reducing GHG emissions with “drop in” sustainable alternatives to petroleum fuels. We use the Argonne National Laboratory’s Greenhouse gases, Regulated Emissions, and Energy use in Transportation model (the “GREET Model”) to measure, predict and verify GHG emissions across the life cycle of our products. Our “net-zero” concept means the production of drop-in hydrocarbon fuels and chemicals by using sustainably grown feedstocks (e.g., low till, no-till and dry corn cultivation, or other carbohydrate sources); renewable, substantially decarbonized energy sources; and process technologies to lower GHG emissions, resulting in an expected net-zero carbon footprint from the full life cycle of the fuel measured from the capture of renewable carbon through the burning of the fuel.
Our primary market focus, given current demand and growing customer interest, is hydrocarbon fuels, and SAF in particular. We believe that SAF from carbohydrates to alcohol is the most economically viable approach for carbon abatement. We also have commercial opportunities for other renewable hydrocarbon products, such as RNG; hydrocarbons for gasoline blendstocks and diesel fuel; ingredients for the chemical industry, such as ethylene and butenes; plastics and materials; and other chemicals. Global fuel consumption by commercial airlines continues to remain strong, with global fuel consumption at more than 100 billion gallons per year (“BGPW”) and growing.
6
We believe that there is a growing and significant market demand for SAF production generally based on a number of factors, including:
● | Air transportation is considered to be a hard to decarbonize segment by governments, airlines, and others. De-fossilized jet fuel, meaning jet fuel but with a low GHG emission footprint, is expected to be important to achieve the decarbonization of the industry. The International Air Transport Association’s (“IATA”) 77th Annual General Meeting approved a resolution for the global air transport industry to achieve net-zero carbon emissions by the year 2050. Most recently, IATA presented roadmaps to achieve its 2050 Fly Net Zero commitment, which include SAF providing 62 percent of the carbon mitigation needed in 2050. IATA has 317 airline members, including Alaska Airlines, American Airlines, Delta Air Lines, FedEx Express, United Airlines and UPS Airlines, who have committed to spending significant amounts to mitigate the balance of emissions from their global businesses going forward. |
● | The U.S. Federal government continues to advance its Sustainable Aviation Fuel Grand Challenge (the “Challenge”) to meet the demand for SAF by working with stakeholders to reduce costs, enhance sustainability, and expand production and use of SAF which achieves a minimum of a 50% reduction in life cycle GHGs compared to conventional fuel. The Challenge includes the goal of supplying at least 3 billion gallons of SAF per year by 2030 and, by 2050, sufficient SAF to meet 100% of aviation fuel demand, which is currently projected to be around 35 billion gallons per year. |
● | Newly enacted state-based incentives for SAF in 2023, including per gallon tax credits in Illinois, Minnesota, and Washington, demonstrate growing public policy support at all levels of government for scaling SAF production and increasing SAF use in the United States. |
● | The oneworld® alliance committed to a target of 10% SAF use across the alliance by 2030 and plans to reach net-zero emissions by 2050. |
We believe that we possess the ability to convert various carbohydrate feedstocks through a fermentation process into alcohols and then transform the alcohols into renewable fuels and materials, through a combination of licensing of technology and engineering from third parties, and our own proprietary technology, know-how, and engineering. While we expect our major capital deployments to focus on the production of SAF, we recognize there are opportunities to operate in several different renewable fuels and materials markets and we will pursue those opportunities when appropriate based on customer interest, access to capital, and expected investment returns.
Our SAF production process uses carbohydrates as a feedstock. Carbohydrates are plant matter that result from photosynthesis. Photosynthesis is the natural process by which carbon dioxide is captured from the air by plants, which are very efficient at capturing carbon dioxide from the atmosphere. The carbon in carbohydrates is renewable because its source is carbon dioxide from the atmosphere. The carbohydrates are fermented to produce alcohol intermediate products (e.g., ethanol or isobutanol). The alcohol-based intermediates are then chemically processed to make renewable hydrocarbons. To achieve net-zero carbon intensity (“CI”) across the whole life cycle of the products, we believe:
● | carbohydrates from sustainably grown feedstocks (e.g., low till, no-till, and dry corn cultivation) or other carbohydrate sources with a low CI score should be used in production; |
● | the energy (electricity and heat sources) used in production must be de-fossilized; and |
● | the products cannot contain fossil-based carbon. |
We believe sustainably grown industrial field corn (i.e., corn that is grown with precision agricultural techniques and low-till or no till cultivation to conserve nutrients, prevent water runoff, and erosion) is the best feedstock to commercialize our SAF with initially because:
● | it produces a significant amount of protein and vegetable oil for nutritional products on a per acre basis while also producing an abundance of low CI carbohydrates that can be captured and used as a feedstock for fuels and chemicals; |
● | the protein and oil that are produced can be easily separated and sold as co-products into the food chain markets. The protein and oil revenue serves to offset the cost of the corn feedstock; |
7
● | we believe that the carbon footprint of growing corn can be negative, according to calculations completed with the GREET Model, when a full suite of climate-smart agricultural practices is employed on appropriate acres of cropland; |
● | we believe that corn can achieve lower CI scores when grown with climate-smart agricultural techniques than waste raw materials or wood; and |
● | we believe that residual carbohydrates from corn are the lowest cost carbohydrates available as a renewable raw material, and the production is proven and scalable. |
We believe that utilizing sustainable agriculture practices to help solve GHG problems is a breakthrough that addresses the problem of GHGs without compromising sustainability or food supply. We also believe that it will be possible to create an incentive structure that rewards farmers to lower the CI score of their agricultural products and create a cycle of continuous improvement to their overall sustainability footprint.
Building Out Production Capacity to Meet Demand
We believe that we will be able to develop the marketplace, customers and production capacity to achieve at least 1 billion gallons of sales in the next decade. Two approaches will be required to achieve this objective. The first approach, the development of greenfield sites (i.e., the development of a project on an undeveloped site), allows us to optimize production and the integration of technology. The second approach, leveraging installed alcohol production capacity, has the advantage that the fermentation capacity already exists via existing ethanol plants. Those existing ethanol plants would need to be decarbonized and hydrocarbon production capacity would need to be installed.
Our concept of “Net-Zero Projects” is a series of planned facilities to produce energy dense liquid hydrocarbons using renewable energy and our proprietary technology. The concept of a Net-Zero Project is to convert renewable energy (such as, photosynthetic, wind, renewable natural gas, and biogas) from a variety of sources into energy dense liquid hydrocarbons that when burned in traditional engines, have the potential to achieve net-zero GHG emissions across the life-cycle of the liquid fuel based on the GREET Model, the pre-eminent science-based life-cycle analysis model. The GREET Model takes into account emissions and impacts cradle-to-cradle for renewable resource-based fuels including inputs and generation of raw materials, agriculture practices, chemicals used in production processes of both feedstocks and products, energy sources used in production and transportation and the end use of the products, which for fuel products is usually burning to release energy.
Using sustainably grown corn or low CI corn as an input at a Net-Zero Project would comprise the following steps: (i) process the corn kernels to produce protein, oil and carbohydrate; (ii) ferment the carbohydrate into an alcohol; and (iii) convert the alcohol to SAF and other renewable hydrocarbon products. The combination of renewable carbon obtained from the carbohydrates, plus the reduction/elimination of fossil-based energy creates the advantage in driving the CI score to achieve net-zero. In addition to those practices, there is potential to sequester renewable carbon in the soil during corn production, and from capturing the CO2 from the production process, which should cause the CI scores to become negative across the whole life cycle of the product as measured by the GREET Model.
Greenfield Projects
Our initial greenfield Net-Zero Project, Net-Zero 1 (“NZ1”), is expected to be located in Lake Preston, South Dakota, and is designed to produce approximately 65 million gallons per year (“MGPY”) of total hydrocarbon volumes, including 60 MGPY of SAF. The plant is expected to be powered by wind-based electricity. The liquid hydrocarbons, when burned, are expected to have a net-zero GHG footprint. Along with the hydrocarbons, NZ1 is expected to produce approximately 695,000 tons per year of high-value protein products for use in the food chain and more than 34 million pounds per year of corn oil. Our products will be produced in three steps: the first step is milling the corn to produce the carbohydrates needed for the production of SAF while simultaneously enabling the production of protein and oil; the second step produces alcohols using carbohydrate-based fermentation; and the third step is the conversion of the alcohols into hydrocarbons.
8
We completed the value engineering on our NZ1 project and are proceeding with detailed engineering, modularization design, and capital costs updates. We are currently refining project cost estimates with engineering, procurement, and construction (“EPC”) partners to identify cost saving opportunities, and currently expect to finance the construction of NZ1 at the subsidiary level using a combination of Company equity and third-party capital, to include non-recourse debt. The Company expects to have invested a cumulative total of $236 to $286 million of cash equity in the project at financial close. Cash distributions from future NZ1 earnings would be proportionate to Gevo’s ownership in NZ1 under this expected financing structure. The use of project debt and third party equity allows us to conserve capital for use on other growth projects. We expect to apply similar development and financing strategies to future Net-Zero Projects to enable growth of SAF production to meet demand for SAF.
We have substantially completed the engineering design of NZ1. We have substantially completed value engineering and we are now focusing on detail engineering with our EPC partners, to reduce and contractually finalize a negotiated lump-sum, fixed price agreement whereby the EPC partners will build and deliver the plant. This detail engineering work is focused specifically on increasing the modularization of component parts on the NZ1 plant design, which means that we expect that the process equipment would be built into modules at a factory, then the modules would be assembled onsite at NZ1, with the goal of minimizing specialized field work typical in plant construction of this type. This approach is expected to lower the risk and cost of, and access to, skilled labor at the site and reduce the supply chain constrictions for some of our long-lead equipment. Increasing the modularization of the plant design is also expected to reduce our spend in advance of securing third-party equity and debt financing for NZ1 and increase the certainty of construction schedule for those counterparties.
In order to achieve full construction financing for NZ1, we need to secure third-party equity and debt. Upon receiving an invitation from the U.S. Department of Energy (“DOE”), we submitted a Part II Application for a DOE loan guarantee for a direct lending from Federal Financing Bank. In August 2023, Gevo was invited to enter the due diligence and term sheet negotiation phases with DOE. Given the current interest rate environment and general macroeconomic conditions, a DOE-guaranteed loan is our most attractive debt option and is expected to offer the lowest cost of debt for the project. We expect that obtaining a DOE-guaranteed loan will have the benefit of reducing the overall amount of equity required to finance NZ1 and should result in higher project equity returns for investors which should increase the likelihood of Gevo successfully financing NZ1. The DOE loan application process is expected to be complete in 2024. We expect that our NZ1 plant start-up date will occur twenty-four to thirty months after the financing of NZ1 closes, the timing of which is uncertain. In parallel with the DOE-guaranteed loan process, we continue to explore debt financing for NZ1 without the benefit of the DOE-guaranteed loan. We are also working to secure CCS access at the site.
We are evaluating and performing early site development work at several sites in the U.S. for other greenfield sites. These sites include several greenfield locations that are particularly advantageous in terms of potential economics, opportunities to decarbonize, and time to market. In addition, we are pursuing potential Net-Zero Projects with several existing ethanol plant sites. Existing ethanol plants need to be decarbonized with renewable energy or de-fossilized energy and/or carbon sequestration. Gevo has developed a preferred list of potential partners and sites with decarbonization in mind and is engaged in preliminary feasibility and development discussions with several of these potential partners. We plan to give priority to existing industrial plant sites that have attractive potential economics and high predictability of timeline for decarbonization.
Leveraging Existing Alcohol Production Capacity
Based upon what we have learned as we develop and engineer NZ1, we believe that it should be possible, practical and financially attractive to convert existing ethanol plants to allow for the production of SAF and other renewable hydrocarbon products. In order to accomplish this conversion, three critical things are required: (i) the energy for the converted plant needs to be de-fossilized to achieve the CI scores required for the market; (ii) a hydrocarbon production plant needs to be built; and (iii) the plant needs to have access to carbon capture and sequestration (“CCS”).
We believe that there are several existing ethanol plants that could be attractive for an alcohol-to-jet (“ATJ”) plant that would be largely copied from our NZ1 Project.
9
Renewable Natural Gas
Our RNG and biogas projects generate incremental profit and create a long-term option to potentially supply RNG to our Net-Zero Projects as part of our long-term strategy to decarbonize SAF and other hydrocarbon fuels.
We finished the development and construction of our first RNG facilities in northwest Iowa in 2022. RNG has value in markets such as California as well as in our hydrocarbon production process by helping us achieve carbon negative GHG emissions on our renewable hydrocarbon products. The end products resulting from such a decarbonization process have lower CI scores and increased market value, in addition to having a more positive impact on the environment. Our initial RNG project, Gevo NW Iowa RNG, LLC (“Gevo RNG”), was developed to generate RNG captured from dairy cow manure which is supplied by three dairies located in Northwest Iowa. Animal manure is digested anaerobically to produce RNG. We financed the construction of the Gevo RNG project in April 2021 with the $68,155,000 of Solid Waste Facility Revenue Bonds (Gevo NW Iowa RNG, LLC Renewable Natural Gas Project), Series 2021 (Green Bonds) (the “2021 Bonds”) issued by the Iowa Finance Authority in a public offering for the benefit of Gevo RNG.
The Gevo RNG project started up and began producing and injecting initial volumes of biogas in 2022, during the project’s testing and ramp-up period. The project achieved stable production levels and surpassed our annual production target of 310,000 MMBtu for 2023. In addition, we completed an expansion to the Gevo RNG project to increase its annual design capacity from 355,000 million British thermal units (“MMBtu”) to 400,000 MMBtu.
Gevo was granted registration approval by the U.S. Environmental Protection Agency (“EPA”) in 2022, allowing us to participate in its Renewable Fuel Standard Program (“RFS Program”) to receive renewable identification numbers (“RINs”). During the first quarter of 2023, we received approval for a temporary pathway under California’s Low Carbon Fuel Standard (“LCFS”) program. We realized substantial sales for our environmental attributes of both LCFS credits and RINs in 2023.
We believe the trust and reputation we have attained in the RNG industry, in combination with our understanding of the various and complex environmental attributes, gives us a competitive advantage. We intend to leverage our relationships to identify and execute new project opportunities. Typically, new development opportunities come from our existing relationships with dairy owners who value our reputation in the industry.
We exercise financial discipline in pursuing projects by targeting attractive risk-adjusted project returns, whether selling RNG into the markets or using it to lower CI scores at our Net-Zero Projects. We will monitor biogas supply availability across our portfolio and seek to maximize our production by expanding operations when economically feasible.
Competitive Advantages
We believe that our vertically integrated set of technologies and business systems (including our extensive portfolio of several hundred patents and patent applications, trade-secrets, and proprietary production technologies) creates competitive advantage through (i) access to multiple opportunities to drive the CI score of our products down, (ii) opportunities to address needs in the chemicals, food, feed, plastics and materials markets, (iii) to drive production costs very low to maximize margins, (iv) deploy production technology that is readily scalable and robust from an operating point of view, (v) through Verity Tracking, and (vi) modular design of production facilities which can help to facilitate rapid deployment of production assets. The vertical business systems enable Gevo to capture value from selling protein and vegetable oil, capturing biogenic carbon, and generating carbon value at state and federal levels.
10
Carbohydrates as Feedstocks
Carbohydrate feedstocks exceed all other potential renewable carbon feedstock sources by several orders of magnitude on a worldwide basis. In the Midwest region of the U.S. corn is an ideal feedstock for multiple reasons. On a per acre basis, field corn (not food corn) is one of the most productive crops to produce protein and oil, as well as carbohydrates. The non-carbohydrate co-products from the field corn kernel represent the majority of the nutritional value of the kernel and could be delivered into the food chain. By selling the protein, oil and animal feed into the food chain markets, it would offset a portion of the cost of acquiring the corn. We believe about 50% of the cost of corn can be offset by manufacturing valuable products for the food chain. The remaining carbohydrates are used as a feedstock for fermentation.
We believe that in the U.S., carbohydrates produced from corn are the most sustainable and lowest cost renewable carbon source that can be used as feedstock for alcohol to hydrocarbon processes to produce hydrocarbon fuels. In the future, we expect to evaluate the commercial use of carbohydrates from sources other than corn (e.g., of sugar cane, molasses or other cellulosic sugars derived from wood, agricultural residues and waste) as the cost to acquire those carbohydrates becomes competitive, and the sustainability profile (and related CI scores) become acceptable. We expect our future feedstocks to be chosen on the collective basis of (i) cost, (ii) carbon and/or sustainability footprint with associated value, (iii) positive contribution to food chain where possible, and (iv) availability of the feedstock at a practical scale.
Proprietary Carbohydrate Conversion Technologies
Three technologies are required to convert carbohydrates to SAF and other renewable hydrocarbons: (i) the fermentation process to convert carbohydrates to alcohols; (ii) the chemical processing technology to make the hydrocarbon fuel products; and (iii) the technology and know-how to mitigate the fossil based GHG emissions from the integrated fermentation and fuel production plants.
We have two ways of producing alcohols via fermentation from carbohydrates: (i) ethanol, which has two carbons, and (ii) isobutanol, which has four carbons. Ethanol can be a building block for SAF, diesel fuel, naptha and chemical products. Isobutanol can be a building block for gasoline hydrocarbons, SAF and chemical products. Ethanol technology is well known and readily available. Isobutanol technology is relatively new and has yet to be scaled to the size of current ethanol production, but it offers long-term potential in enabling lower CI scores and allowing for the production of chemical products, and high value gasoline hydrocarbons.
We believe that we possess proprietary know-how to integrate alcohol production and chemical processing to make SAF and other renewable hydrocarbons that should lower the CI score of our renewable hydrocarbon products, and have filed patents on the overall process.
Alcohols can be converted to hydrocarbon products with catalytic chemical processing techniques analogous to those used in the petrochemical industry. We have been working with Axens North America, Inc. (“Axens”) to use their technology on this process since they have already scaled it up and they have licensed to many commercial production facilities. Axens brings technologies with over 60 related patents, engineering packages, proprietary catalysts and certain proprietary equipment required to convert alcohols into SAF and they will provide certain process guarantees to us.
Integration of the production systems with various renewable or de-fossilized energy sources will be essential. Our Net-Zero plant concept depends upon a variety of decarbonization methods to ensure the operability of the plant while also reducing and eliminating the need for fossil-based energy. We have partnered with companies such as Zero6 Energy, formerly Juhl Energy, to develop the technology suite for this decarbonization.
We own and operate a development scale plant in Luverne, Minnesota (the “Luverne Facility”). This development scale plant enables us to solve the practical issues involved with scale up of new technologies and testing of new unit operations. Gevo may use the Luverne Facility in the future to prove out processes, process concepts, unit operations and for other purposes in order to optimize feedstocks and the processes used for producing hydrocarbons from alcohols. Currently, the activities at the Luverne Facility are minimized to care and maintenance, as the Company has shifted focus to the Net-Zero Projects.
11
Verity
It is critical that we can prove the CI of our products, ensuring that these values are accurate and auditable. The mission of Verity (“Verity”), including Verity Tracking and Verity Carbon Solutions, is to document CI and other sustainability attributes and apply Distributed Ledger Technology, commonly referred to as blockchain, to create a record of the products throughout the entire business system. Verity starts by calculating carbon intensity of feedstocks from data collected at the farm and field level. We plan to track these feedstocks through production at our plants where we intend to use a mix of renewable electricity, biogas, renewable hydrogen and other potentially decarbonized energy sources in production. The CI data would then be combined to deliver a comprehensive CI reduction in a finished renewable fuel. The resulting CI reduction value has potential to be quantified as a digital asset and monetized in voluntary or compliance carbon markets, and providing compliance needs for tax incentives while preventing double-counting. We believe that in the future, regenerative agricultural practices have the potential to sequester large quantities of soil organic carbon while improving soil health.
There is increasing regulatory and stakeholder pressure on global corporations to lower emissions. These trends are driving demand for carbon credits, giving rise to two sets of markets, the regulated compliance carbon market and the unregulated voluntary carbon market, both of which could grow meaningfully in the coming decades. The total value of major compliance carbon markets is expected to be greater than $800 billion in 2023, according to Bloomberg. Verity intends to document and account for carbon capture in conjunction with scientifically supported measurement techniques. The potential for Verity is broad and could be applicable to tracking the CI of various items beyond Gevo’s internal businesses, including, but not limited to, renewable fuels, food, feed and industrial products through their respective business systems and value chains. Our robust scientific measurement, reporting, and verification plan and approach is expected to provide a high-quality credit that should meet regulated compliance and unregulated carbon markets.
In March 2023, we entered into a joint development framework agreement with Southwest Iowa Renewable Energy; in August 2023, we entered into a joint development framework agreement with a second ethanol producer in the Midwest that has over 100 million gallons of capacity; and in October 2023 we entered into an agreement with a third ethanol producer in the Southwest. These agreements include commercial terms and profit-sharing frameworks. As we grow Verity as an externally facing business, we are working to sign up additional ethanol and biofuel customers. Each of these agreements will focus on implementing Verity technology and developing the market for carbon credits to help farmers and biofuel producers quantify the CI reductions for their products.
During the second quarter of 2023, we launched the Verity Tracking platform (the “Platform”) with farmers in the Lake Preston, South Dakota area who participated in our 2022 grower program. In its initial release, the Platform allows the users to measure, report, verify, and view the CI scores at both the farm average and field-by-field levels. The Platform provides insights into the contributors and removers behind the CI, helping users to understand the factors that drive differences in CI performance between fields. Users can also compare their scores with the U.S. national average calculated by the GREET model.
12
Our Facilities and Projects
Development Scale Facility
As described above, we currently own a development scale plant, the Luverne Facility. The Luverne Facility was originally constructed in 1998 and is located on approximately 55 acres of land containing approximately 50,000 square feet of building space. In 2022, the activities at our Luverne Facility were transitioned to care and maintenance, market development, and customer education, as we shifted focus to our Net-Zero Projects. The workforce adjustment allowed us to retain key personnel and redeploy some resources to our NZ1 and RNG projects to provide valuable knowledge and experience for the future strategic growth of the Company. The Luverne Facility is well equipped and positioned as a development site as it provides a unique opportunity to showcase our decarbonization and business systems and raise awareness for future partnerships, investors, and local communities, even though operations at the site have been minimized. Future operations, if any, will be tailored to support a focus on advancing our technology, testing, optimizing alternative feedstocks and yeast strains, and unit operations as well as partnership development for fuels and specialty chemicals with integrated solutions for GHG reductions. We continue to evaluate incentive opportunities recently introduced by the Inflation Reduction Act, which may positively impact the future economics of our operation at Luverne.
RNG Facilities
We developed Gevo’s initial RNG project, Gevo RNG, in Northwest Iowa to generate RNG captured from dairy cow manure which is supplied by three dairies located in Northwest Iowa. Gevo RNG has a designed capacity of 400,000 MMBtu of RNG per year. The RNG is sold into the California market under dispensing agreements BP Canada Energy Marketing Corp. and BP Products North America Inc. (collectively, “BP”) have in place with Clean Energy Fuels Corp., the largest fueling infrastructure in the U.S. for RNG. We commenced construction of the Gevo RNG project in April 2021, and in the third quarter of 2022, the Gevo RNG project ramped up production of biogas, raw biogas upgrading to RNG and the injection of RNG into an interconnected natural gas pipeline.
We have four leases for land and three fuel supply agreements related to the Gevo RNG project. Under these contracts, we lease land from dairy farmers on which we have built a gas upgrading unit, three anaerobic digesters, related equipment and pipelines. These leases expire at various dates between 2031 and 2050.
Development Properties
In July 2022, we purchased approximately 240 acres of land for NZ1 in Lake Preston, South Dakota, followed by a groundbreaking ceremony in Lake Preston in September 2022. Refer to the section entitled “Greenfield Projects” above for additional information about NZ1.
Headquarters
Our corporate headquarters and research and development laboratories are located in Englewood, Colorado and are leased. Our lease terminates in January 2029 and the leased space is approximately 19,241 square feet.
Competition
We face competitors in each market that we focus on, some of which are limited to individual markets, and some of which will compete with us across all of our target markets. Many of our competitors have greater financial resources, more comprehensive product lines, broader market presence, longer standing relationships with customers, longer operating histories, greater production capabilities, stronger brand recognition and greater marketing resources than we do which could make it difficult for us to compete.
13
Our renewable hydrocarbons, including SAF, compete with the incumbent petroleum-based fuels industry, as well as renewable fuels companies. The incumbent petroleum-based fuels industry makes the vast majority of the world’s gasoline, jet and diesel fuels and blendstocks. The petroleum-based fuels industry is mature and includes a substantial base of infrastructure for the production and distribution of petroleum-derived products, however, the industry faces challenges from its dependence on petroleum. High and volatile oil prices should provide an opportunity for renewable producers relying on biobased feedstocks like corn, which in recent years have had lower price volatility than oil, to compete.
Renewable fuels companies may provide substantial competition in the hydrocarbon fuels markets. These renewable fuel competitors are numerous and include both large established companies and numerous startups. Government tax incentives for renewable fuel producers and regulations such as the Inflation Reduction Act Clean Fuel Production Credit, RFS Program, California LCFS program, and programs emerging in other states such as Illinois help provide opportunities for renewable fuels producers to compete. We believe that we have the advantage of being able to target conversion of alcohols into specific high-value molecules such as SAF, other renewable hydrocarbons and various chemical products.
Intellectual Property and Technologies
We seek protection for our intellectual property under patent, copyright, trademark and trade secret laws.
Since the Company was founded, we have submitted hundreds of patent applications in the U.S. and in various foreign jurisdictions. These patent applications are for our technologies and specific methods and products that support our business. We continue to file new patent applications, for which terms extend up to 20 years from the filing date in the U.S. and for various terms in international jurisdictions. We expect to continue to develop and build our intellectual property portfolio to address unmet technology and market needs going forward.
We have filed and prosecuted, and intend to continue to file and prosecute, patent applications and maintain trade secrets, as is consistent with our business plan, in an ongoing effort to protect our intellectual property.
We have a strong proprietary technology position. Our technology pathway converts carbohydrates to alcohols via a fermentation process. The alcohols are then converted to hydrocarbon fuels using a catalytic chemical process. By using renewable energy across the production process, in combination with sustainable feedstocks, like low carbon non-food corn, the GHG emissions can be substantially reduced or eliminated as measured across the whole of the life cycle. The processes used to convert carbohydrates to drop in hydrocarbons using isobutanol as the intermediate alcohol is protected by a global patent portfolio with more than 300 patents, as well as proprietary processes and know-how. Certain production technology to convert ethanol to hydrocarbons has been exclusively licensed to Gevo in the U.S. by Axens, and incorporates more than 60 patents, as well as proprietary production technology and know-how. Additionally, we have multiple patents and patent applications covering the ethanol to hydrocarbons routes.
We have a proprietary fermentation yeast biocatalyst that has been designed to consume carbohydrates and produce isobutanol as a product. Our technology team developed our proprietary biocatalyst to efficiently convert fermentable sugars of all types into isobutanol by engineering isobutanol pathways into the biocatalyst. The advantage of this biocatalyst is that it (i) works in large scale fermentation systems, and (ii) can operate in complex biological mixtures such as corn mash or molasses and produce a suitable clean isobutanol product. The technology is designed to use carbohydrate feedstocks, similar to ethanol technology. For example, carbohydrates from non-food corn, sugar cane, molasses or cellulosic sugars each could be used depending upon cost and availability. While we believe that the majority of the development work on a commercially viable isobutanol producing yeast is complete, we expect to continue to make additional improvements targeted to improve its performance.
14
Government Regulation - Environmental Compliance
Regulation by governmental authorities in the U.S. and other countries is a significant factor in the development, manufacture and marketing of second-generation renewable fuels. In particular, renewable fuels are subject to rigorous testing and premarket approval requirements by the EPA’s Office of Transportation and Air Quality and regulatory authorities in other countries. In the U.S., various federal and, in some cases, state statutes and regulations also govern or impact the manufacturing, safety, storage and use of renewable fuels. The process of seeking required approvals and the continuing need for compliance with applicable statutes and regulations requires the expenditure of substantial resources.
We are subject to various federal, state and local environmental laws and regulations, including those relating to the discharge of materials into the air, water and ground, the generation, storage, handling, use, transportation and disposal of hazardous materials and the health and safety of our employees. These laws and regulations require us to obtain environmental permits and comply with numerous environmental restrictions as we construct and operate isobutanol assets. They may require expensive pollution control equipment or operational changes to limit actual or potential impacts to the environment. A violation of these laws, regulations or permit conditions can result in substantial fines, natural resource damage, criminal sanctions, permit revocations or facility shutdowns.
There is a risk of liability for the investigation and cleanup of environmental contamination at each of the properties that we own or operate and at off-site locations where we arrange for the disposal of hazardous substances. If these substances are or have been disposed of or released at sites that undergo investigation or remediation by regulatory agencies, we may be responsible under the Comprehensive Environmental Response, Compensation and Liability Act or other environmental laws for all or part of the costs of investigation and remediation. We may also be subject to related claims by private parties alleging property damage and personal injury due to exposure to hazardous or other materials at or from the properties. Some of these matters may require us to expend significant amounts for investigation and cleanup or other costs. We are not aware of any material environmental liabilities relating to contamination at or from our facilities or at off-site locations where we have transported or arranged for the disposal of hazardous substances.
In addition, new laws, new interpretations of existing laws, increased governmental enforcement of environmental laws or other developments could require us to make significant additional expenditures. Continued government and public emphasis on environmental issues can be expected to result in increased future investments in environmental controls at our facilities which cannot be estimated at this time. Present and future environmental laws and regulations applicable to our operations, more vigorous enforcement policies and discovery of currently unknown conditions could all require us to make substantial expenditures. For example, our air emissions are subject to the Clean Air Act, the Clean Air Act Amendments of 1990 and similar state and local laws and associated regulations. Under the Clean Air Act, the EPA has promulgated National Emissions Standards for Hazardous Air Pollutants (“NESHAP”), which could apply to facilities that we own or operate if the emissions of hazardous air pollutants exceed certain thresholds. If a facility we operate is authorized to emit hazardous air pollutants above the threshold level, then we might still be required to come into compliance with another NESHAP at some future time. New or expanded facilities might be required to comply with both standards upon startup if they exceed the hazardous air pollutant threshold. In addition to the costs for achieving and maintaining compliance with these laws, more stringent standards may also limit our operating flexibility.
As a condition to granting the permits necessary for operating our facilities, regulators could make demands that increase our construction and operations costs, which might force us to obtain additional financing. For example, unanticipated water discharge limits could sharply increase construction costs for our projects. Permit conditions could also restrict or limit the extent of our operations. We cannot guarantee that we will be able to obtain or comply with the terms of all necessary permits to complete the retrofit of an ethanol plant. Failure to obtain and comply with all applicable permits and licenses could halt our construction and could subject us to future claims.
Our products benefit from the RFS Program in that our RNG is currently eligible for Renewable Identification Numbers (“RINS”) that have value based on the current RFS Program. The RFS Program could change, impacting our products, positively or negatively.
15
Various systems are being put in place around the world to measure CI and the reduction of GHGs, with the intent of creating a system to monetize the value of the reduction of carbon. In order to benefit from such systems, companies need to have their products qualified through a regulatory process. There is no guarantee that any benefit could be gained. In 2019, we submitted a design pathway application to the California Air Resources Board to gain approval for low-carbon intensity ethanol utilizing beef manure biogas as a process input under the LCFS, and we may also seek approval under similar programs in the future.
People and Culture
Higher Purpose
Our employees strive to make environmental and social impacts in the world. Our employees are also guided by our code of business conduct and ethics, which helps them to uphold and strengthen our standards of integrity and innovation while continuously improving our environment, health, safety and sustainability. Our world and business may change, but our core values are a constant in everything we do.
Employees
As of December 31, 2023, we had 103 employees in North America. We also retain consultants, independent contractors, and temporary and part-time workers. None of our facilities in the U.S. are covered by collective bargaining agreements. The Gevo team is made up of scientists, research and development experts, software developers, data engineers, operations, administrative and business development professionals, skilled trades and energy technicians.
| Total | |
Employment |
|
|
Full-time |
| 101 |
Part-time |
| 2 |
Total |
| 103 |
Department |
|
|
Project Development | 31 | |
Research and Development |
| 16 |
Production |
| 13 |
General, administrative and business development |
| 43 |
Total |
| 103 |
Location |
|
|
Colorado |
| 44 |
Texas |
| 11 |
Iowa |
| 11 |
Minnesota |
| 9 |
New Mexico |
| 7 |
South Dakota |
| 5 |
Illinois | 5 | |
Other States |
| 8 |
Foreign |
| 3 |
Total |
| 103 |
16
Human Rights
Gevo honors human rights and respects the individual dignity of all people globally. Our commitment to human rights requires that we understand and carry out our responsibilities consistent with our values and practices. We strive to ensure that human rights are upheld for our employees and all workers in our supply chain. Our commitment to human rights is defined in the code of business conduct and ethics, our supplier code of conduct, our dealer code of conduct and related policies and practices, which establish clear guidelines for our employees, suppliers and dealers while helping to inform our business decisions. We do not tolerate human rights abuses, such as forced labor, unlawful child labor or human trafficking. We are proud to contribute to the places where we work and support the residents of these places.
Code of Business Conduct and Ethics
We are committed to conducting business in accordance with the highest ethical standards. This means how we conduct ourselves is more than just a matter of policy and law, it is a reflection of our core values. Our code of business conduct and ethics provides specific guidance to all of our employees, outlining how they can and must uphold and strengthen the integrity that defines us. We maintain a global compliance hotline to allow for concerns to be brought forward.
Health and Safety
We strive to achieve safety excellence through increased focus on leading indicators, risk reduction, health and safety management systems, and prevention to protect the public health and environmental quality in our communities, as well as the health and safety of our employees, customers and neighbors. We strive to comply with all health and safety laws and regulations that apply to our business. We provide site safety orientation for all employees and guests as well as periodic refresher training for employees at a level appropriate for their role. We have received no violations and are proud that we have never had a fatality at a Gevo facility. During 2023, we had one reportable injury, no lost time incidents, and a total recordable injury rate of 0.93.
We are serious about maintaining the well-being of our employees and families, paying 100% of the premiums for health, dental and vision insurance for whole families. Despite the significant increases in premium costs, we continue to pay the premiums for disability and life insurance to assist in maintaining living standards when issues arise. We continue to be agile in addressing employee needs in the quickly evolving environment while being transparent across the workforce.
Diversity and Inclusion
In order to ensure that each of our employees can bring their full selves to work, we strive to foster a diverse, equitable, and inclusive workplace where all voices are heard and included. We continue to champion policies, practices and behaviors that amplify innovation on behalf of people, community and the planet. Diversity, equity and inclusion (“DEI”) are critical to our success as an organization. Incorporating DEI into our business practices enhances innovation and enables our best talent to thrive in an environment where diverse perspectives are celebrated. This requires deliberate intention and action on the part of every employee and leader. We will continue to push forward on the path to a more diverse, equitable and inclusive culture and have committed to interview and consider at least one qualified woman and person of color for every open role, vice president and higher, including at the senior executive level and the Board of Directors.
We are proud of the vibrant tapestry of people represented within our team, including individuals of African descent, Latinx heritage, and Asian backgrounds, as well as individuals of diverse sexual orientations and gender identities.
Building a diverse and inclusive workforce is a top priority at Gevo. While we acknowledge that we have further progress to make, we are proud of the significant strides we have taken in recent years. In 2023, our non-management workforce saw a surge in female representation (35%) and increased representation across several minority groups including Hispanic/Latino (10%) and Black/African American (3%). At the leadership level, female representation increased to 33%, and we are actively developing programs to cultivate talent from diverse backgrounds for future leadership roles.
17
December 31, | |||||
Women | 2022 | 2023 | |||
Non-Management | 32 | % | 35 | % | |
Women Leaders | 22 | % | 33 | % | |
Total | 28 | % | 34 | % |
December 31, | |||||
Diversity | 2022 | 2023 | |||
Non-Management | |||||
Asian | 2 | % | 5 | % | |
Black or African American | 4 | % | 3 | % | |
Hispanic or Latino | 9 | % | 10 | % | |
Two or More Races | 2 | % | 3 | % | |
Diversity | 17 | % | 21 | % | |
Management | |||||
Asian | 3 | % | 3 | % | |
Black or African American | 8 | % | 5 | % | |
Hispanic or Latino | 6 | % | 3 | % | |
Two or More Races | 6 | % | 5 | % | |
Diversity | 22 | % | 15 | % |
We recognize that our diversity journey is ongoing, and we haven't yet reached our full potential. The decline in the overall diversity percentage of our leaders (from 22% in 2022 to 15% in 2023) reflects a decrease from the prior year of 7%. This shift underscores the importance of maintaining momentum in expanding representation across all backgrounds. We are transparent about our data and committed to using it to guide our progress. We will continue to hold ourselves accountable and report regularly on our diversity and inclusion efforts.
Board composition fosters diverse perspectives and strengthens the Board’s ability to understand and address the needs of a broad stakeholder base. With 33% female representation among independent directors, the Board demonstrates a dedication to gender equality and harnesses the talents of a wider pool of leadership. The inclusion of 17% Hispanic independent board directors reflects the Company's commitment to diversity in its leadership and aligns with the demographics of its customers and communities
Attraction, Retention and Engagement
We are currently operating in an extremely challenging talent market. Market hiring surges, increased attrition and shifting work expectations have significantly impacted the attraction and retention of talent, creating a hyper-competitive marketplace. We understand that our long-term success will require a differentiated, targeted approach to talent attraction and retention. In response to these challenges, we took a number of actions in 2023 in an effort to enhance our ability to attract and retain diverse talent:
● | We continued the annual talent review process to advance our internal talent placements, as well as plan for succession and growth. Further, we extended our leadership development program to more managers, of which 78% of the participants identify as a woman and/or of Asian, African or Hispanic heritage. |
● | We provide a 401(K) matching program to support employees, with a matching contribution of up to 4% of their deferral in the Company’s stock. |
● | Our employees are enthusiastic about enriching their communities. We continued to support a program to recognize their dedication and began matching community service efforts with up to 16 hours of paid time off. |
18
We are committed to providing employment opportunities for people in our local communities. We partner with local technical colleges and universities to offer scholarships, tuition reimbursement and internships to students in the Energy programs and partner with them in showcasing non-traditional careers to achieve gender equity. Our continued support of this scholarship program has awarded four scholarships to date.
Our employees are highly engaged with our mission. We promote discussion and alignment through monthly town hall sessions with all employees, led by our CEO, Patrick Gruber, as well as fostering open-door conversations with all members of management.
Further, we found that our employees could be effective while working outside the Gevo offices. Gevo’s management philosophy is to lead with trust in our employees and support a culture which enables employees to do their best work. And, as a company focused on reducing the world’s carbon footprint, we hold that value for our employees as well and encourage them to reduce their personal carbon footprint and work from their homes, as their respective positions allow. This policy has allowed us to attract talent we might not otherwise have if we had restricted hiring to certain geographies.
Available Information
Our Annual Reports on Form 10-K, Quarterly Reports on Form 10‑Q, Current Reports on Form 8-K and any amendments to those reports (including related exhibits and supplemental schedules) filed or furnished pursuant to Section 13(a) or 15(d) of the Securities Exchange Act of 1934, as amended, are made available, free of charge, through our website, as soon as reasonably practicable after such reports have been filed with, or furnished to, the SEC. Our website address is www.gevo.com. Information on our website is not incorporated by reference into, and does not constitute a part of, this report.
19
Item 1A.Risk Factors
You should carefully consider the risk factors described below before you decide to invest in our securities. The risks described below are not the only ones facing us. Our business is also subject to the risks that affect many other companies, such as competition, technological obsolescence, labor relations, general economic conditions, geopolitical changes and international operations. Additional risks and uncertainties not presently known to us or that we currently believe are immaterial may also impair our business operations and our liquidity. The risks described below could cause our actual results to differ materially from those contained in the forward-looking statements we have made in this Report, the information incorporated herein by reference and those forward-looking statements we may make from time to time.
Risk Related to our Business and Strategy
We have a history of net losses, and we may not achieve or maintain profitability.
We incurred net losses of $66.2 million and $98.0 million during the years ended December 31, 2023 and 2022, respectively. As of December 31, 2023, we had an accumulated deficit of $721.6 million. We expect to incur losses and negative cash flows from operating activities for the foreseeable future. We currently derive revenue primarily from the sale of RNG and related environmental attributes produced at Gevo RNG.
Furthermore, we expect to spend significant amounts on the further development and commercial implementation of our strategic plans and technology.
We also expect to spend significant amounts on (i) developing and financing our Net-Zero projects and other similar growth projects, (ii) marketing, general and administrative expenses associated with our planned growth, and (iii) management of operations as a public company. As a result, we expect to continue to incur new losses for the foreseeable future. We do not expect to achieve profitability during the foreseeable future and may never achieve it. If we fail to achieve profitability, or if the time required to achieve profitability is longer than we anticipate, we may not be able to continue our business operations. Even if we do achieve profitability, we may not be able to sustain or increase profitability on a quarterly or annual basis.
We will require substantial additional financings to achieve our goals, and a failure to obtain this capital when needed or on acceptable terms could force us to delay, limit, reduce or terminate our development and commercialization efforts.
We operate in a capital-intensive industry and will continue to need substantial amounts of capital to execute on our business plans. We believe that we will continue to expend substantial resources for the foreseeable future on further growth of our business, including developing, constructing, financing and acquiring facilities necessary for the production of our products on a commercial scale. These expenditures may, among other things, include costs associated with our Net-Zero Projects, research and development, developing biogas processing projects and wind projects, obtaining government and regulatory approvals, and negotiating offtake agreements for our products. In addition, other unanticipated costs may arise.
To date, we have funded our operations primarily through equity offerings and issuances of debt. Based on our current plans and expectations, we will require additional funding at the corporate and/or project level to achieve our goals. We currently expect to finance the construction of NZ1 and any other Net Zero Projects at the subsidiary level using third party capital. In addition, our plans and expectations may change as a result of factors currently unknown to us, and we may need additional funds sooner than expected and may seek to raise additional funds through public or private debt or equity financings. We may also choose to seek additional capital sooner than required due to favorable market conditions or strategic considerations.
Our future capital requirements will depend on many factors, including:
● | the timing of and costs involved in financing and constructing our Net-Zero Projects, including NZ1; |
● | the timing of and costs involved in obtaining permits and compliance with applicable regulations; |
● | the timing and costs associated with any future capital projects or expansions; |
20
● | the costs involved in maintaining the Luverne Facility; |
● | our ability to gain market acceptance for our products; |
● | our ability to negotiate financeable offtake agreements for the products we produce, and the timing and terms of those agreements, including terms related to sales price; |
● | our ability to negotiate sales of our products and the timing and terms of those sales, including terms related to sales price; |
● | our ability to establish and maintain strategic partnerships, licensing or other arrangements and the timing and terms of those arrangements; and |
● | the cost of preparing, filing, prosecuting, maintaining, defending and enforcing patent, trademark and other intellectual property claims, including litigation costs and the outcome of such litigation. |
Additional funds may not be available when we need them, on terms that are acceptable to us, or at all. If needed funds are not available to us on a timely basis, we may be required to delay, limit, reduce or terminate:
● | our Net-Zero Projects, including NZ1; |
● | our plans to enter into agreements with strategic partners; |
● | our development of future capital projects or expansions; |
● | our efforts to prepare, file, prosecute, maintain and enforce patent, trademark and other intellectual property rights and defend against claims by others that we may be violating their intellectual property rights; and/or |
● | our activities in negotiating and performing under offtake agreements that may be necessary for the commercialization of our products. |
Our business is capital-intensive in nature and we rely on external financing to fund our growth strategy, including the development and construction of our Net-Zero Projects and other similar growth projects. Limitations on access to external financing could adversely affect our operating results.
We are in a capital-intensive business and we rely heavily on external financing for the costs of development and construction of our growth projects, such as NZ1, and other projected capital expenditures. Completion of our growth projects will require significant capital expenditures and construction costs. The recovery of the capital investment in our growth projects will generally occur over a long period of time. As a result, we must obtain funds from external sources to help develop and construct our existing project pipeline, to help finance the acquisition of system components, to help identify and develop new projects, to help fund research and development expenses and to help pay the general and administrative costs of operating our business. We may not be able to obtain the needed funds on terms acceptable to us, or at all. If we are unable to raise additional funds when needed, we could be required to delay development and construction of projects, reduce the scope of, abandon or sell some or all of our growth projects or default on our contractual commitments in the future, any of which would have a material adverse effect on our business, financial condition and operating results.
Our proposed growth projects may not be completed or, if completed, may not perform as expected or achieve profitability. Our project development activities may consume a significant portion of our management’s focus, and if not successful, reduce our profitability.
We plan to grow our business by building multiple production facilities, including greenfield and brownfield projects. Development projects may require us to spend significant sums for engineering, permitting, legal, financial advisory and other expenses before we determine whether a development project is feasible, economically attractive or capable of being financed.
Our development projects are typically planned to be large and complex, and we may not be able to complete them. There can be no assurance that we will be able to negotiate the required agreements, overcome any local opposition, or obtain the necessary licenses, permits and financing. Failure to achieve any of these elements may prevent the development and construction of a project. If that were to occur, we could lose all of our investment in development expenditures and may be required to write off project development assets.
21
We may be unable to successfully perform under current or future offtake agreements to provide our products, which could harm our commercial prospects.
We have entered into several offtake agreements pursuant to which we agreed to sell our products. Under certain of these offtake agreements, the purchasers agreed to pay for and receive, or cause to be received by a third party, or pay for even if not taken, the renewable hydrocarbon products under contract (a “take-or-pay” arrangement). The timing and volume commitment of certain of these agreements are conditioned upon, and subject to, our ability to complete the construction of a new or expanded production facility (the “Facility”). However, in order to commence construction of and complete the Facility, we must secure third-party financing. We cannot assure you that we will be able to obtain adequate financing on favorable terms, or at all. Furthermore, we have not demonstrated that we can meet the production levels and specifications contemplated in certain of our current offtake agreements, or future offtake agreements. If our production is slower than we expect, we experience production delays, if demand decreases or if we encounter difficulties in successfully completing the Facility or producing our renewable hydrocarbon products to specification, our counterparties may terminate our existing offtake agreements and potential customers may be less willing to negotiate definitive offtake agreements with us, which would adversely impact our performance and results of operations.
In addition, from time to time, we may enter into letters of intent, memoranda of understanding and other largely non-binding agreements or understandings with potential customers or partners in order to develop our business and the markets that we serve. We can make no assurance that legally binding, definitive agreements reflecting the terms of such non-binding agreements will be completed with such customers or partners, or at all.
Our offtake agreements, including our take-or-pay purchase agreements, are subject to significant conditions precedent and, as a result, the revenues that we expect from such contracts may never be realized.
Our ability to realize revenue under our offtake agreements, including our take-or-pay purchase agreements, is not guaranteed and is subject to significant conditions precedent. In order to actually realize revenue under such contracts, we are required to, among other things, complete the Facility or acquire, construct or retrofit a production facility at another suitable location, which is, in turn, dependent on our ability to secure adequate financing. If we are unable to raise sufficient capital on acceptable terms, or at all, the revenues under such contracts may never be achieved. Our ability to obtain adequate financing will depend on, among other things, the status of our product development, market conditions for our products, our financial condition and general conditions in the capital, financial and debt markets at the time such financing is sought. In addition, any further equity or debt financings could result in the dilution of ownership interests of our then-current stockholders. Furthermore, even if we are able to satisfy all conditions precedent to our take-or-pay contracts, including completion of the Facility or acquiring, constructing or retrofitting a production facility at another suitable location and securing adequate funding, we still may never realize the full amount of revenue that we expect or project to earn from such contracts. In any event, our failure to realize the expected revenue under our offtake agreements would have a material adverse effect on our business, financial condition, results of operation and liquidity.
Fluctuations in the price of corn and other feedstocks may affect our cost structure.
Our approach to the renewable fuels and chemicals markets is dependent on the price of corn and other feedstocks that will be used to produce our products. A decrease in the availability of plant feedstocks or an increase in price may have a material adverse effect on our financial condition and operating results. At certain levels, prices may make these products uneconomical to use and produce and we may be unable to pass the full amount of feedstock cost increases on to our customers, which would make it unprofitable for us to operate in these markets. In addition, passing along increased pricing to our customers could result in fewer or reduced orders or customer loss altogether. No assurance can be given that we will be able to purchase corn and other feedstocks at or near prices which would provide us with positive margins.
The price and availability of corn and other plant feedstocks may be influenced by general economic, market and regulatory factors. These factors include weather conditions, pests, global or regional growing conditions, including plant disease, farming decisions, government policies and subsidies with respect to agriculture and international trade, increasing input costs, prices for alternative crops, global political or economic issues and conflicts and shifts in global
22
demand and supply. For example, corn prices may increase significantly in response to drought conditions in the midwestern region of the U.S. and any resulting decrease in the supply of corn could lead to the restriction of corn supplies, which in turn could cause further increases in the price of corn. The significance and relative impact of these factors on the price of plant feedstocks is difficult to predict.
Fluctuations in petroleum prices and customer demand patterns may reduce demand for renewable fuels.
Our renewable fuels may be considered an alternative to petroleum-based fuels. Therefore, if the price of oil falls, any revenues that we generate from renewable fuel products could decline and we may be unable to produce products that are a commercially viable alternative to petroleum-based fuels. In such cases, we may not be able to offer our customers an attractive price for our fuels, market adoption of our fuels could be slowed or limited and/or we may be forced to reduce the prices at which we sell our fuels in order to try to attract new customers or prevent the loss of demand from existing customers. Additionally, demand for liquid transportation fuels, including renewable fuels, may decrease due to economic conditions or other factors outside of our control, which could have a material adverse impact on our business and results of operations.
Any decline in the value of carbon credits associated with our products could have a material adverse effect on our results of operations, cash flow and financial condition.
The sale of our products is often dependent on the value of carbon credits under the RFS Program, LCFS and other similar regulatory regimes. The value of these credits fluctuates based on market forces outside of our control. There is a risk that the supply of low-carbon alternative fuels outstrips demand, resulting in the value of carbon credits declining. Any decline in the value of carbon credits associated with our products could have a material adverse effect on our results of operations, cash flow and financial condition.
We may not be successful in the commercialization of alcohol-to-SAF projects utilizing Axens technology.
Our future success on alcohol-to-SAF projects depends on, among other things, our ability to produce commercial quantities of SAF from ethanol using Axens technology. We may encounter challenges in scaling up the Axens technology and/or the technology may not work as expected, or at all on a commercial scale. In addition, the cost to construct commercial alcohol-to-SAF facilities or the production costs associated with the operation of such facilities may be higher than we project. If we encounter such difficulties in scaling or constructing alcohol-to-SAF projects, it could significantly affect our profitability and have a material adverse impact on our business and results of operations.
The technological and logistical challenges associated with producing, marketing, selling and distributing renewable hydrocarbon products are complex, and we may not be able to resolve any difficulties that arise in a timely or cost-effective manner, or at all.
We have limited experience operating, and have never built, a commercial renewable hydrocarbon facility. We believe that we understand the engineering and process characteristics necessary to successfully build the additional facilities that we are contemplating and to scale up to larger facilities. Our assumptions, however, may prove to be incorrect. Accordingly, we cannot be certain that we will be able to consistently produce renewable hydrocarbon products in an economical manner in commercial quantities. In addition, we expect to incur significant capital expenditures to build out our Net-Zero projects and produce renewable hydrocarbon products. If we fail to build or scale up the facilities required to produce our renewable hydrocarbon products or are unable to consistently produce renewable hydrocarbon products economically on a commercial scale or in commercial volumes, our commercialization of renewable hydrocarbon products and our business, financial condition and results of operations will be materially adversely affected.
Our actual costs may be greater than expected in developing our growth projects, causing us to realize significantly lower profits or greater losses on our projects.
We generally must estimate the costs of completing a specific project to prior to the construction of the project. The actual cost of labor and materials and other important costs may vary from the costs we originally estimated. These
23
variations may cause the gross profit of a project to materially differ from what we originally estimated. Cost overruns on our growth projects could occur due to changes in a variety of factors such as:
● | failure to properly estimate costs of engineering, materials, equipment, labor or financing; |
● | unanticipated technical problems with the structures, materials or services; |
● | unanticipated project modifications; |
● | changes in the costs of equipment, materials, labor or contractors; |
● | our suppliers’ or contractors’ failure to perform; |
● | changes in laws and regulations; and |
● | delays caused by weather conditions. |
As projects grow in size and complexity, multiple factors may contribute to reduced profit or greater losses, and depending on the size of the particular project, variations from the estimated project costs could have a material adverse effect on our business. For example, if project costs exceed our estimates, it could cause us to realize significantly lower profits or greater losses on our projects.
We may be unable to produce renewable hydrocarbon products in accordance with customer specifications.
We may be unable to produce renewable hydrocarbon products to meet customer specifications, including those defined in ASTM D7862 “Standard Specification for Butanol for Blending with Gasoline for Use as Automotive Spark-Ignition Engine Fuel,” ASTM D7566 “Standard Specifications for Aviation Turbine Fuel Containing Synthesized Hydrocarbons” or specifications to carbon intensity standards. We may need to add additional processing steps or incur capital expenditures in order to meet customer specifications which could add significant costs to our production process. If we fail to meet specific product or volume specifications contained in an offtake agreement, the customer may have the right to seek an alternate supply of renewable hydrocarbon products and/or terminate the agreement completely, and we could be required to pay shortfall fees or otherwise be subject to damages. A failure to successfully meet the specifications of our potential customers could decrease demand, hinder market adoption of our products, and harm our reputation, thus having a material adverse impact on our business and results of operations.
Our experience may not be sufficient to operate commercial-scale facilities and we may encounter substantial difficulties operating commercial plants or expanding our business.
We have limited experience operating commercial-scale RNG and renewable hydrocarbon facilities concurrently. Accordingly, we may encounter significant difficulties operating at a commercial scale once we expand our production capabilities, including at our Gevo RNG and Net-Zero Projects. The skills and knowledge gained in operating our current facilities may not be sufficient to support the for successful operation of a large-scale production facility or the Facility, and we may be required to expend significant time and money to develop our capabilities in large-scale facility operation. We may also need to hire new employees or contract with third parties to help manage our operations, and our performance will suffer if we are unable to hire qualified parties or if they perform poorly. Any production delays or volume or other issues resulting from our inability to operate at a commercial scale could result in additional capital expenditures and investment, reduced sales volumes, loss of customers, harm to our reputation and could have a material adverse impact on our financial condition and results of operations.
In addition, integrating new facilities with our existing operations may prove difficult. Rapid growth, resulting from our operation of, or other involvement with, renewable hydrocarbon facilities or otherwise, may impose a significant burden on our administrative and operational resources. To effectively manage our growth and execute our expansion plans, we will need to expand our administrative and operational resources substantially and attract, train, manage and retain qualified management, technicians and other personnel. We may be unable to do so. Failure to meet the operational challenges of developing and managing increased production, or failure to otherwise manage our growth, may have a material adverse effect on our business, financial condition and results of operations.
24
Even if we are successful in producing our products on a commercial scale, we may not be successful in negotiating additional fuel offtake agreements or pricing terms to support the growth of our business.
We expect that many of our customers will be large companies with extensive experience operating in the fuels or chemicals markets. We lack significant commercial operating experience and may face difficulties in developing marketing expertise in these fields. Our business model relies upon our ability to successfully negotiate, structure and fulfill long-term offtake agreements for our products. Certain agreements with existing and potential customers may initially only provide for the purchase of limited quantities from us. Our ability to increase our sales will depend in large part upon our ability to retain existing customers and expand these existing customer relationships into long-term offtake agreements. Maintaining and expanding our existing relationships and establishing new ones can require substantial investment without any assurance from customers that they will place significant orders. In addition, many of our potential customers may be more experienced in these matters than we are, and we may fail to successfully negotiate these agreements in a timely manner or on favorable terms which, in turn, may force us to slow our production, dedicate additional resources to increasing our storage capacity and/or dedicate resources to sales in spot markets. Furthermore, should we become more dependent on spot market sales, our profitability will become increasingly vulnerable to short-term fluctuations in the price and demand for petroleum-based fuels and competing substitutes.
If we engage in acquisitions, we will incur a variety of costs and may potentially face numerous risks that could adversely affect our business and operations.
If appropriate opportunities become available, we may acquire businesses, assets, technologies or products to enhance our business in the future. In connection with any future acquisitions, we could, subject to certain limitations in the agreements governing our indebtedness at such time:
● | issue additional equity securities which would dilute our current stockholders; |
● | incur substantial debt to fund the acquisitions; or |
● | assume significant known or unknown liabilities. |
Acquisitions involve numerous risks, including problems integrating the purchased operations, technologies or products, unanticipated costs and other liabilities, diversion of management’s attention from our core business, adverse effects on existing business relationships with current and/or prospective partners, customers and/or suppliers, risks associated with entering markets in which we have no or limited prior experience and potential loss of key employees. Other than our acquisition of the Luverne Facility, we have not engaged in acquisitions in the past, and do not have experience in managing the integration process. Therefore, we may not be able to successfully integrate any businesses, assets, products, technologies or personnel that we might acquire in the future without a significant expenditure of operating, financial and management resources, if at all. The integration process could divert management time from focusing on operating our business, result in a decline in employee morale and cause retention issues to arise from changes in compensation, reporting relationships, future prospects or the direction of the business. In addition, we may acquire companies that have insufficient internal financial controls, which could impair our ability to integrate the acquired company and adversely impact our financial reporting. If we fail in our integration efforts with respect to acquisitions and are unable to efficiently operate as a combined organization, our business, financial condition and results of operations may be materially adversely affected.
If we engage in joint ventures, we will incur a variety of costs and may potentially face numerous risks that could adversely affect our business and operations.
If appropriate opportunities become available, we may enter into joint ventures with various parties. Realizing the anticipated benefits of joint ventures involves a number of potential challenges. The failure to meet these challenges could seriously harm our financial condition and results of operations. In addition, these arrangements typically involve restrictions on actions that the joint venture may take without the approval of the other parties, which could limit our ability to manage the joint venture in a manner that serves our best interests. Finally, joint ventures are complex and time
25
consuming and we may encounter unexpected difficulties or incur unexpected costs related to such arrangements, including:
● | difficulties negotiating joint venture agreements with favorable terms and establishing relevant performance metrics; |
● | the inability to meet applicable performance targets; |
● | difficulties obtaining the permits and approvals required to produce and sell products in different geographic areas; |
● | complexities associated with managing the potential geographic separation of facilities; |
● | diversion of management attention from ongoing business concerns to matters related to the joint ventures; |
● | difficulties maintaining effective relationships with personnel from different corporate cultures; and |
● | the inability to generate sufficient revenue to offset retrofit costs. |
If we lose key personnel, including key management personnel, or are unable to attract and retain additional personnel, it could delay our product development programs and harm our research and development efforts, make it more difficult to pursue partnerships or develop our own products or otherwise have a material adverse effect on our business.
Our business is complex and we intend to target a variety of markets. Therefore, it is critical that our management team and employee workforce are knowledgeable in the areas in which we operate. The departure, illness or absence of any key members of our management, including our named executive officers, or the failure to attract or retain other key employees who possess the requisite expertise for the conduct of our business, could prevent us from developing and commercializing our products for our target markets and entering into partnerships or licensing arrangements to execute our business strategy, as could the loss of any key scientific staff, or the failure to attract or retain other key scientific employees. We may not be able to attract or retain qualified employees in the future due to the intense competition for qualified personnel among biotechnology and other technology-based businesses, particularly in the advanced renewable fuels area, or due to the limited availability of personnel with the qualifications or experience necessary for our renewable chemicals and advanced renewable fuels business. If we are not able to attract and retain the necessary personnel to accomplish our business objectives, we may experience staffing constraints that will adversely affect our ability to meet the demands of our partners and customers in a timely fashion or to support our internal research and development programs. In particular, our product and process development programs are dependent on our ability to attract and retain highly skilled scientists. Competition for experienced scientists and other technical personnel from numerous companies and academic and other research institutions may limit our ability to do so on acceptable terms. All of our employees are at-will employees, meaning that either the employee or we may terminate their employment at any time.
Our planned activities will require additional expertise in specific industries and areas applicable to the products and processes developed through our technology platform or acquired through strategic or other transactions, especially in the end markets that we seek to penetrate. These activities will require the addition of new personnel, and the development of additional expertise by existing personnel. The inability to attract personnel with appropriate skills or to develop the necessary expertise could impair our ability to grow our business.
We may face substantial competition from companies with greater resources and financial strength, which could adversely affect our performance and growth.
We may face substantial competition in the markets for renewable hydrocarbon products. Our competitors include companies in the incumbent petroleum-based industry as well as those in the nascent renewable fuels industry. The incumbent petroleum-based industry benefits from a large established infrastructure, production capability and business relationships. The incumbents’ greater resources and financial strength provide significant competitive advantages that we may not be able to overcome in a timely manner. Academic and government institutions may also develop technologies which will compete with us.
Our ability to compete successfully will depend on our ability to develop proprietary products that reach the market in a timely manner and are technologically superior to and/or are less expensive than other products on the market. Many of our competitors have substantially greater production, financial, research and development, personnel
26
and marketing resources than we do. In addition, certain of our competitors may also benefit from local government subsidies and other incentives that are not available to us. As a result, our competitors may be able to develop competing and/or superior technologies and processes, and compete more aggressively and sustain that competition over a longer period of time than we could. Our technologies and products may be rendered obsolete or uneconomical by technological advances or entirely different approaches developed by one or more of our competitors. As more companies develop new intellectual property in our markets, the possibility of a competitor acquiring patent or other rights that may limit our products or potential products increases, which could lead to litigation. Furthermore, to secure purchase agreements from certain customers, we may be required to enter into exclusive supply contracts, which could limit our ability to further expand our sales to new customers. Likewise, major potential customers may be locked into long-term, exclusive agreements with our competitors, which could inhibit our ability to compete for their business.
In addition, various governments have recently announced a number of spending programs focused on the development of clean technologies, including alternatives to petroleum-based fuels and the reduction of carbon emissions. Such spending programs could lead to increased funding for our competitors or a rapid increase in the number of competitors within those markets.
Our limited resources relative to many of our competitors may cause us to fail to anticipate or respond adequately to new developments and other competitive pressures. This failure could reduce our competitiveness and market share, adversely affect our results of operations and financial position and prevent us from obtaining or maintaining profitability.
Business interruptions may have an adverse impact on our business and our financial results.
We are vulnerable to natural disasters and other events that could disrupt our operations, such as riots, civil disturbances, war, terrorist acts, pandemics and other public health crises, weather conditions, electricity rationing, floods, infections in our laboratory or production facilities or those of our contract manufacturers and other events beyond our control. We do not have a detailed disaster recovery plan. In addition, we may not carry sufficient business interruption insurance to compensate us for losses that may occur. Any losses or damages we incur could have a material adverse effect on our cash flows and success as an overall business.
Our business and operations would suffer in the event of IT system failures or a cyber-attack.
Our business is dependent on proprietary technologies, processes and information that we have developed, much of which is stored on our computer systems. We also have entered into agreements with third parties for hardware, software, telecommunications and other information technology (“IT”) services in connection with our operations. Our operations depend, in part, on how well we and our vendors protect networks, equipment, IT systems and software against damage from a number of threats, including, but not limited to, cable cuts, damage to physical plants, natural disasters, intentional damage and destruction, fire, power loss, hacking, computer viruses, vandalism, theft, malware, ransomware and phishing attacks. Any of these and other events could result in IT system failures, delays, a material disruption of our business or increases in capital expenses. Our operations also depend on the timely maintenance, upgrade and replacement of networks, equipment and IT systems and software, as well as preemptive expenses to mitigate the risks of failures.
Furthermore, the importance of such information technology systems and networks and systems has increased due to many of our employees working remotely. Additionally, if one of our service providers were to fail and we were unable to find a suitable replacement in a timely manner, we could be unable to properly administer our outsourced functions.
As cyber threats continue to evolve, we may be required to expend significant additional resources to continue to modify or enhance our protective measures or to investigate and remediate any information security vulnerabilities. While we have implemented security resources to protect our data security and information technology systems, such measures may not prevent such events. Significant disruption to our IT system or breaches of data security could have a material adverse effect on our business, financial condition and results of operations.
27
We may engage in hedging transactions, which could adversely impact our business.
In the future, we may engage in hedging transactions to offset some of the effects of volatility in commodity prices. Hedging activities may cause us to suffer losses, such as if we purchase a position in a declining market or sell a position in a rising market. Furthermore, hedging would expose us to the risk that we may have under- or over-estimated our need for a specific commodity or that the other party to a hedging contract may default on its obligation. If there are significant swings in commodity prices, or if we purchase more corn for future delivery than we can process, we may have to pay to terminate a futures contract, resell unneeded corn inventory at a loss or produce our products at a loss, all of which would have a material adverse effect on our financial performance. We may vary the hedging strategies we undertake, which could leave us more vulnerable to increases in commodity prices or decreases in the prices of our products. Future losses from hedging activities and changes in hedging strategy could have a material adverse effect on our operations.
Ethical, legal and social concerns about genetically engineered products and processes, and similar concerns about feedstocks grown on land that could be used for food production, could limit or prevent the use of our products, processes and technologies and limit our revenues.
Some of our processes involve the use of genetically engineered organisms or genetic engineering technologies. Additionally, our feedstocks may be grown on land that could be used for food production, which subjects our feedstock sources to “food versus fuel” concerns. If we are not able to overcome the ethical, legal and social concerns relating to genetic engineering or food versus fuel, our products and processes may not be accepted widely enough for our business to be profitable, or at all. Any of the risks discussed below could result in increased expenses, delays or other impediments to our programs or the public acceptance and commercialization of products and processes dependent on our technologies or inventions.
Our ability to develop and commercialize one or more of our technologies, products or processes could be limited by the following factors:
● | public attitudes about the safety and environmental hazards of, and ethical concerns over, genetic research and genetically engineered products and processes, which could influence public acceptance of our technologies, products and processes; |
● | public attitudes regarding and potential changes to laws governing ownership of genetic material, which could harm our intellectual property rights with respect to our genetic material and discourage others from supporting, developing or commercializing our products, processes and technologies; |
● | public attitudes and ethical concerns surrounding production of feedstocks on land which could be used to grow food, which could influence public acceptance of our technologies, products and processes; |
● | governmental reaction to negative publicity concerning genetically engineered organisms, which could result in greater government regulation of genetic research and derivative products; and |
● | governmental reaction to negative publicity concerning feedstocks produced on land which could be used to grow food, which could result in greater government regulation of feedstock sources. |
The subjects of genetically engineered organisms and food versus fuel have received negative publicity, which has aroused public debate. Any negative publicity (even if relating to the actions or products of a competitor or partner) could have a negative impact on our business and/or perceptions of our products. This could result in lower revenue and profits. This adverse publicity could also lead to greater regulation and trade restrictions on imports of genetically engineered products or feedstocks grown on land suitable for food production. Additionally, the use of social media platforms and similar devices, provide an opportunity for the immediate and far-reaching dissemination of information, including inaccurate information. Information concerning us or our products may be posted on such platforms at any time, and such information may be adverse to our interests or may be inaccurate, each of which may harm our performance, prospects, or business. The harm may be immediate without affording us an opportunity for redress or correction.
The biocatalysts that we develop have significantly enhanced characteristics compared to those found in naturally occurring enzymes or microbes. While we produce our biocatalysts only for use in a controlled industrial environment, the release of such biocatalysts into uncontrolled environments could have unintended consequences. Any
28
adverse effect resulting from such a release could have a material adverse effect on our business and financial condition, and we may be exposed to liability for any resulting harm.
As our products have not previously been used as a commercial fuel in significant amounts, their use subjects us to product liability risks.
SAF has not been used as a commercial fuel in large quantities or for a long period of time. Research regarding SAF and its distribution infrastructure is ongoing. Although SAF has been tested on some engines, there is a risk that SAF may damage engines or otherwise fail to perform as expected. If SAF degrades the performance or reduces the life-cycle of engines, or cause them to fail to meet emissions standards, market acceptance could be slowed or stopped, and we could be subject to product liability claims. A significant product liability lawsuit could substantially impair our production efforts and could have a material adverse effect on our business, reputation, financial condition and results of operations.
We may not be able to use some or all of our net operating loss carry-forwards to offset future income.
We have net operating loss carryforwards due to prior period losses generated before January 1, 2023, which if not utilized will begin to expire at various times over the next 20 years. If we are unable to generate sufficient taxable income to utilize our net operating loss carryforwards, these carryforwards could expire unused and be unavailable to offset future income tax liabilities.
In addition, under Section 382 of the Internal Revenue Code of 1986, as amended (the “Code”), a corporation that undergoes an “ownership change” (generally defined as a greater than 50% change (by value) in its equity ownership over a three-year period) is subject to limitation on its ability to utilize its pre-change net operating loss carry-forwards, or net operating losses, to offset future taxable income. We undertook a detailed study of our net operating loss carryforwards through December 31, 2023 to determine whether such amounts are likely to be limited by Section 382 of the Code. As a result of this analysis, we currently believe any Section 382 of the Code limitations will significantly impact our ability to offset income with available net operating loss carryforwards. We have experienced more than one ownership change in prior years, and the issuance of shares in connection with our initial public offering itself triggered an ownership change. In addition, future changes in our stock ownership, which may be outside of our control, may trigger an ownership change, as may future equity offerings or acquisitions that have equity as a component of the purchase price.
Competitiveness of our products for fuel use (including RNG) depends in part on government economic incentives for renewable energy projects or other related policies that could change.
We depend, in part, on international, federal, state and local government incentives, including but not limited to RINs, LCFS credits in California, Clean Fuel Program credits in Oregon, Renewable Energy Credits (“RECs”), rebates, tax credits and other incentives to end users, distributors, system integrators and manufacturers of renewable energy projects, that promote the use of renewable energy. These government economic incentives could be reduced or eliminated altogether, or the categories of renewable energy qualifying for such government economic incentives could be changed. These renewable energy program incentives are subject to regulatory oversight and could be administratively or legislatively changed in a manner that could have a material adverse effect on our operations. Reductions in, changes to, or eliminations or expirations of governmental incentives could result in decreased demand for, and lower revenues from, our projects and products. Further, our ability to generate revenue from the various government economic incentives depends on our strict compliance with the applicable federal and state programs, which are complex and can involve a significant degree of judgment. If the agencies that administer and enforce these programs disagree with our judgments, otherwise determine that we are not in compliance, conduct reviews of our activities or make changes to the programs, then our ability to generate revenue from the economic incentives could be temporarily restricted pending completion of reviews or as a penalty, permanently limited or lost entirely, and we could also be subject to fines or other sanctions.
In addition, we may be required to register our projects or qualify our products with the federal government, various states or other countries. Delays in obtaining registration or qualification of our projects or products could delay future revenues and could adversely affect our cash flows. Further, we typically make a large investment in our projects
29
prior to receiving registration and/or qualification. Failure of our projects or products to qualify for government economic incentives could have a material adverse effect on our business.
In order to benefit from RINs and LCFS credits, our RNG projects are required to be registered and are subject to regulatory audit.
We are required to register an RNG project with the EPA and relevant state regulatory agencies. Further, we qualify our RINs through a voluntary Quality Assurance Plan. By registering our RNG project with the EPA’s voluntary Quality Assurance Plan, we are subject to quarterly third-party audits and semi-annual on-site visits of our projects to validate generated RINs and overall compliance with the RFS program. We are also subject to a separate third party’s annual attestation review. The Quality Assurance Plan provides a process for RIN owners to follow, for an affirmative defense to civil liability, if used or transferred Quality Assurance Plan verified RINs were invalidly generated. A project’s failure to comply could result in remedial action by the EPA, including penalties, fines, retirement of RINs, or termination of the project’s registration, any of which could adversely affect our business, financial condition and results of operations.
Our RNG project has, and any future digester project may not be able to achieve the operating results we expect from these projects.
Our RNG project is dependent on the LCFS credits and RINs produced at the dairy farms that make up part of our RNG project. In the event that CARB reduces the CI score that it applies to waste conversion projects, such as dairy digesters, the number of LCFS credits for RNG generated at our RNG project will decline. Additionally, revenue from LCFS credits also depends on the price per LCFS credit, which is driven by various market forces, including the supply of and demand for LCFS credits, which in turn depends on the demand for traditional transportation fuel and the supply of renewable fuel from other renewable energy sources, and mandated CI targets, which determine the number of LCFS credits required to offset LCFS deficits, and which increase over time. A significant decline in the value of LCFS credits could require us to incur an impairment charge on our RNG project and could adversely affect our business, financial condition and results of operations.
Risks Related to Intellectual Property
Our ability to compete may be adversely affected if we are unsuccessful in defending against any claims by competitors or others that we are infringing upon their intellectual property rights.
The various bioindustrial markets in which we operate or plan to operate are subject to frequent and extensive litigation regarding patents and other intellectual property rights. In addition, many companies in intellectual property-dependent industries, including the renewable energy industry, have employed intellectual property litigation as a means to gain an advantage over their competitors. As a result, we may be required to defend against claims of intellectual property infringement that may be asserted by our competitors against us and, if the outcome of any such litigation is adverse to us, it may affect our financial condition and our ability to compete effectively.
Litigation, interferences, opposition proceedings or other intellectual property proceedings inside and outside of the U.S. may divert management time from focusing on business operations, could cause us to spend significant amounts of money and may have no guarantee of success. Any future intellectual property litigation could also force us to do one or more of the following:
● | stop selling, incorporating, manufacturing or using our products that use the subject intellectual property; |
● | obtain from a third party asserting its intellectual property rights, a license to sell or use the relevant technology, which license may not be available on reasonable terms, or at all; |
● | redesign those products or processes that use any allegedly infringing or misappropriated technology, which may result in significant cost or delay to us, or which redesign could be technically infeasible; |
● | pay attorneys’ fees and expenses; or |
● | pay damages, including the possibility of treble damages in a patent case if a court finds us to have willfully infringed certain intellectual property rights. |
30
We are aware of a significant number of patents and patent applications relating to aspects of our technologies filed by, and issued to, third parties. We cannot assure you that we will ultimately prevail if any of this third-party intellectual property is asserted against us.
Our ability to compete may be adversely affected if we do not adequately protect our proprietary technologies or if we lose some of our intellectual property rights through costly litigation or proceedings.
Our success will depend in part on our ability to obtain patents and maintain adequate protection of our intellectual property covering our technologies and products and potential products in the U.S. and other countries. We have adopted a strategy of seeking patent protection in the U.S. and in certain foreign countries with respect to certain of the technologies used in or relating to our products and processes. We own rights to hundreds of issued patents and filed patent applications in the U.S. and in various foreign jurisdictions. When and if issued, patents would expire at the end of their term and any patent would only provide us commercial advantage for a limited period of time, if at all. Our patent applications are directed to our enabling technologies and to our methods and products which support our business in the advanced renewable fuels and renewable chemicals markets. We intend to continue to apply for patents relating to our technologies, methods and products as we deem appropriate.
Only some of the patent applications that we have filed in the U.S. or in any foreign jurisdictions, and only certain of the patent applications filed by third parties in which we own rights, have been issued. A filed patent application does not guarantee a patent will issue and a patent issuing does not guarantee its validity, nor does it give us the right to practice the patented technology or commercialize the patented product. Third parties may have or obtain rights to “blocking patents” that could be used to prevent us from commercializing our products or practicing our technology. The scope and validity of patents and success in prosecuting patent applications involve complex legal and factual questions and, therefore, issuance, coverage and validity cannot be predicted with any certainty. Patents issuing from our filed applications may be challenged, invalidated or circumvented. Moreover, third parties could practice our inventions in secret and in territories where we do not have patent protection. Such third parties may then try to sell or import products made using our inventions in and into the U.S. or other territories and we may be unable to prove that such products were made using our inventions. Additional uncertainty may result from implementation of the Leahy-Smith America Invents Act, enacted in September 2011, as well as other potential patent reform legislation passed by the U.S. Congress and from legal precedent handed down by the Federal Circuit Court and the U.S. Supreme Court, as they determine legal issues concerning the scope, validity and construction of patent claims. Because patent applications in the U.S. and many foreign jurisdictions are typically not published until 18 months after filing, or in some cases not at all, and because publication of discoveries in the scientific literature often lags behind the actual discoveries, there is additional uncertainty as to the validity of any patents that may issue and the potential for “blocking patents” coming into force at some future date. Accordingly, we cannot ensure that any of our currently filed or future patent applications will result in issued patents, or even if issued, predict the scope of the claims that may issue in our and other companies’ patents. Any proceedings challenging our patents may result in the claims being amended or canceled. If the claims are amended or canceled, the scope of our patent claims may be narrowed, which may reduce the scope of protection afforded by our patent portfolio. Given that the degree of future protection for our proprietary rights is uncertain, we cannot ensure that (i) we were the first to make the inventions covered by each of our filed applications, (ii) we were the first to file patent applications for these inventions, (iii) the proprietary technologies we develop will be patentable, (iv) any patents issued will be broad enough in scope to provide commercial advantage and prevent circumvention, and (v) competitors and other parties do not have or will not obtain patent protection that will block our development and commercialization activities.
These concerns apply equally to patents we have licensed, which may likewise be challenged, invalidated or circumvented, and the licensed technologies may be obstructed from commercialization by competitors’ “blocking patents.” In addition, we generally do not control the patent prosecution and maintenance of subject matter that we license from others. Generally, the licensors are primarily or wholly responsible for the patent prosecution and maintenance activities pertaining to the patent applications and patents we license, while we may only be afforded opportunities to comment on such activities. Accordingly, we are unable to exercise the same degree of control over licensed intellectual property as we exercise over our own intellectual property and we face the risk that our licensors will not prosecute or maintain it as effectively as we would like.
31
In addition, unauthorized parties may attempt to copy or otherwise obtain and use our products or technology. Monitoring unauthorized use of our intellectual property is difficult, particularly where, as here, the end products reaching the market generally do not reveal the processes used in their manufacture, and particularly in certain foreign countries where the local laws may not protect our proprietary rights as fully as in the U.S., so we cannot be certain that the steps we have taken in obtaining intellectual property and other proprietary rights will prevent unauthorized use of our technology. If competitors are able to use our technology without our authorization, our ability to compete effectively could be adversely affected and our business could be harmed. Moreover, competitors and other parties such as universities may independently develop and obtain patents for technologies that are similar to or superior to our technologies. If that happens, the potential competitive advantages provided by our intellectual property may be adversely affected. We may then need to license these competing technologies, and we may not be able to obtain licenses on reasonable terms, if at all, which could cause material harm to our business. Accordingly, litigation may be necessary for us to assert claims of infringement, enforce patents we own or license, protect trade secrets or determine the enforceability, scope and validity of the intellectual property rights of others.
Our commercial success also depends in part on not infringing patents and proprietary rights of third parties, and not breaching any licenses or other agreements that we have entered into with regard to our technologies, products and business. We cannot be certain that patents have not or will not be issued to third parties that could block our ability to obtain patents or to operate our business as we would like, or at all. There may be patents in some countries that, if valid, may block our ability to commercialize products in those countries if we are unsuccessful in circumventing or acquiring rights to these patents. There may also be claims in patent applications filed in some countries that, if granted and valid, may also block our ability to commercialize products or processes in these countries if we are unable to circumvent or license them.
As is commonplace in the biotechnology industries, some of our directors, employees and consultants are or have been employed at, or associated with, companies and universities that compete with us or have or will develop similar technologies and related intellectual property. While employed at these companies, these employees, directors and consultants may have been exposed to or involved in research and technology similar to the areas of research and technology in which we are engaged. Though we have not received such a complaint, we may be subject to allegations that we, our directors, employees or consultants have inadvertently or otherwise used, misappropriated or disclosed alleged trade secrets or confidential or proprietary information of those companies. Litigation may be necessary to defend against such allegations and the outcome of any such litigation would be uncertain.
Under some of our research agreements, our partners share joint rights in certain intellectual property we develop. Such provisions may limit our ability to gain commercial benefit from some of the intellectual property we develop and may lead to costly or time-consuming disputes with parties with whom we have commercial relationships over rights to certain innovations.
If any other party has filed patent applications or obtained patents that claim inventions also claimed by us, we may have to participate in interference, derivation or other proceedings declared by the USPTO to determine priority of invention and, thus, the right to the patents for these inventions in the U.S. These proceedings could result in substantial cost to us even if the outcome is favorable. Even if successful, such a proceeding may result in the loss of certain claims. Even successful outcomes of such proceedings could result in significant legal fees and other expenses, diversion of management time and efforts and disruption in our business. Uncertainties resulting from initiation and continuation of any patent or related litigation could harm our ability to compete and have an adverse impact on our financial condition.
We may not be able to enforce our intellectual property rights throughout the world.
The laws of some foreign countries do not protect intellectual property rights to the same extent as federal and state laws in the U.S. Many companies have encountered significant problems in protecting and enforcing intellectual property rights in certain foreign jurisdictions, and, particularly with any future international partners, we may face new and increased risks and challenges in protecting and enforcing our intellectual property rights abroad. The legal systems of certain countries, particularly certain developing countries, do not favor the enforcement of patents and other intellectual property protection, particularly those relating to bioindustrial technologies. This could make it difficult for us to stop the infringement of our patents or misappropriation of our other intellectual property rights. Proceedings to enforce our patents and other proprietary rights in foreign jurisdictions could result in substantial costs and divert our
32
efforts and attention from other aspects of our business. Accordingly, our efforts to enforce our intellectual property rights in such countries may be inadequate to obtain a significant commercial advantage from the intellectual property that we develop.
Confidentiality agreements with employees and others may not adequately prevent disclosures of trade secrets and other proprietary information.
We rely in part on trade secret protection to protect our confidential and proprietary information and processes. However, trade secrets are difficult to protect. We have taken measures to protect our trade secrets and proprietary information, but these measures may not be effective. We require new employees and consultants to execute confidentiality agreements upon the commencement of an employment or consulting arrangement with us. These agreements generally require that all confidential information developed by the individual or made known to the individual by us during the course of the individual’s relationship with us be kept confidential and not disclosed to third parties. These agreements also generally provide that know-how and inventions conceived by the individual in the course of rendering services to us shall be our exclusive property. Nevertheless, these agreements may not be enforceable, our proprietary information may still be disclosed, third parties could reverse engineer our biocatalysts and others may independently develop substantially equivalent proprietary information and techniques or otherwise gain access to our trade secrets. Costly and time-consuming litigation could be necessary to enforce and determine the scope of our proprietary rights, and failure to obtain or maintain trade secret protection could adversely affect our competitive business position. In addition, an unauthorized breach in our information technology systems may expose our trade secrets and other proprietary information to unauthorized parties. Any exposure of our trade secrets or other proprietary information could harm our competitive position and have an adverse impact on our financial condition.
We have received funding from U.S. government agencies, which could negatively affect our intellectual property rights.
Some of our research has been funded by grants from U.S. government agencies. When new technologies are developed with U.S. government funding, the government obtains certain rights in any resulting patents and technical data, generally including, at a minimum, a nonexclusive license authorizing the government to use the invention or technical data for noncommercial purposes. U.S. government funding must be disclosed in any resulting patent applications, and our rights in such inventions will normally be subject to government license rights, periodic progress reporting, foreign manufacturing restrictions and march-in rights. March-in rights refer to the right of the U.S. government, under certain limited circumstances, to require us to grant a license to technology developed under a government grant to a responsible applicant or, if we refuse, to grant such a license itself. March-in rights can be triggered if the government determines that we have failed to work sufficiently towards achieving practical application of a technology or if action is necessary to alleviate health or safety needs, to meet requirements of federal regulations or to give preference to U.S. industry. If we breach the terms of our grants, the government may gain rights to the intellectual property developed in our related research. The government’s rights in our intellectual property may lessen its commercial value, which could adversely affect our performance.
Risks Related to Legal and Regulatory
The U.S. renewable fuels industry is highly dependent upon certain federal and state legislation and regulation and any changes in legislation or regulation could have a material adverse effect on our results of operations, cash flows and financial condition.
The EPA has implemented the RFS Program pursuant to the Energy Policy Act of 2005 (the “Energy Policy Act”) and the Energy Independence and Security Act of 2007. The RFS Program sets annual quotas for the quantity of renewable fuels that must be blended into motor fuels consumed in the U.S. The domestic market for renewable fuels is significantly impacted by federal mandates under the RFS Program for volumes of renewable fuels required to be blended with gasoline. Future demand for renewable fuels will be largely dependent upon incentives to blend renewable fuels into motor fuels, including the price of renewable fuels relative to the price of gasoline, the relative octane value of the renewable fuel, constraints in the ability of vehicles to use higher renewable fuel blends, the RFS Program and other applicable environmental requirements. Any significant increase in production capacity above the RFS Program
33
minimum requirements may have an adverse impact on renewable fuel prices. Any change in government policies regarding the RFS Program could have a material adverse effect on our business and the results of our operations.
Waivers of the RFS minimum levels of renewable fuels included in motor fuels or of the requirements by obligated parties to comply with the regulations could have a material adverse effect on our results of operations. Under the Energy Policy Act, the U.S. Department of Energy, in consultation with the Secretary of Agriculture and the Secretary of Energy, may waive the renewable fuels mandate with respect to one or more states if the Administrator of the EPA determines that implementing the requirements would severely harm the economy or the environment of a state, a region or the nation, or that there is inadequate supply to meet the requirement. Additionally, the EPA has exercised the authority to waive the requirements of the RFS minimum levels for certain small refiners. Any waiver of the RFS minimum levels with respect to one or more states would reduce demand for renewable fuels and could cause our results of operations to decline and our financial condition to suffer. Further activity by the EPA to waive the requirements for small refiners could cause softening of pricing in the industry and cause our results of operations to similarly decline.
A critical state program is California’s LCFS program, which is designed to reduce GHG emissions associated with transportation fuels used in California by ensuring that the fuel sold in California meets declining targets for such emissions. The regulation quantifies life-cycle GHG emissions by assigning a CI score to each transportation fuel based on that fuel’s life-cycle assessment. Each petroleum fuel provider, generally the fuel’s producer or importer (the “Regulated Party”), is required to ensure that the overall CI score for its fuel pool meets the annual CI target for a given year. A Regulated Party’s fuel pool can include gasoline, diesel and their blend stocks and substitutes. This obligation is tracked through credits and deficits. Fuels with a CI score lower than the annual standard earn a credit, and fuels that are higher than the standard result in a deficit. Several other states also have or are considering adopting this model. Oregon’s Clean Fuels Program, enacted in 2009 and implemented in 2016, operates using a credit system similar to the California LCFS program. Any changes to California’s LCFS program or failure of other states to implement similar programs could have a material adverse effect on our business and the results of our operations.
Reductions or changes to existing regulations and policies may present technical, regulatory and economic barriers, which may significantly reduce demand for renewable fuels or our ability to supply our products.
The market for renewable fuels is heavily influenced by foreign, federal, state and local government laws, regulations and policies. Changes in these laws, regulations and policies or how these laws, regulations and policies are implemented and enforced could cause the demand for renewable fuels to decline and deter investment in the research and development of renewable fuels.
Concerns associated with renewable fuels, including land usage, national security interests and food crop usage, continue to receive legislative, industry and public attention. This attention could result in future legislation, regulation and/or administrative action that could adversely affect our business. Any inability to address these requirements and any regulatory or policy changes could have a material adverse effect on our business, financial condition and results of operations.
Additionally, our renewable hydrocarbon plants may emit GHG. Any changes in state or federal emissions regulations, including the passage of cap-and-trade legislation or a carbon tax, could limit our production of renewable hydrocarbon products and increase our operating costs, which could have a material adverse effect on our business, financial condition and results of operations. The results of U.S. elections could lead to changes in federal or state laws and regulations that could have a material adverse effect on our business, prospects, financial condition and results of operations.
Negative attitudes toward renewable energy projects from the U.S. government, other lawmakers and regulators, and activists could adversely affect our business, financial condition and results of operations.
Parties with an interest in other energy sources, including lawmakers, regulators, policymakers, environmental and advocacy organizations or other activists may invest significant time and money in efforts to delay, repeal or otherwise negatively influence regulations and programs that promote renewable energy. Many of these parties have substantially greater resources and influence than we have. Further, changes in U.S. federal, state or local political, social or economic conditions, including a lack of legislative focus on these programs and regulations, could result in their
34
modification, delayed adoption or repeal. Any failure to adopt, delay in implementing, expiration, repeal or modification of these programs and regulations, or the adoption of any programs or regulations that encourage the use of other energy sources over renewable energy, could adversely affect our business, financial condition and results of operations.
Any claims relating to improper handling, storage or disposal of hazardous materials or noncompliance with applicable laws and regulations could be time consuming and costly and could adversely affect our business and results of operations.
Our research and development processes involve the use of hazardous materials, including chemical, radioactive and biological materials. Our operations also produce hazardous waste. We cannot eliminate entirely the risk of accidental contamination or discharge and any resultant injury from these materials. Federal, state and local laws and regulations govern the use, manufacture, storage, handling and disposal of, and human exposure to, these materials. We may be sued for any injury or contamination that results from our use or the use by third parties of these materials, and our liability may exceed our total assets. Although we believe that our activities conform in all material respects with environmental laws, there can be no assurance that violations of environmental, health and safety laws will not occur in the future as a result of human error, accident, equipment failure or other causes. Compliance with applicable environmental laws and regulations may be expensive, and the failure to comply with past, present or future laws could result in the imposition of fines, third-party property damage, product liability and personal injury claims, investigation and remediation costs, the suspension of production or a cessation of operations, and our liability may exceed our total assets. Liability under environmental laws can be joint and several and without regard to comparative fault. Environmental laws could become more stringent over time, imposing greater compliance costs and increasing risks and penalties associated with violations, which could impair our research, development or production efforts and harm our business.
Our international activities may increase our exposure to potential liability under anti-corruption, trade protection, tax and other laws and regulations.
In the course of our relationships with international partners, we may become subject to certain foreign tax, environmental and health and safety regulations that did not previously apply to us or our products. Such regulations may be unclear, not consistently applied and subject to sudden change. Implementation of compliance policies could result in additional operating costs, and our failure to comply with such laws, even inadvertently, could result in significant fines and/or penalties.
Additionally, the Foreign Corrupt Practices Act and other anti-corruption laws and regulations (“Anti-Corruption Laws”) prohibit corrupt payments by our employees, vendors or agents. Even with implementation of policies, training and internal controls designed to reduce the risk of corrupt payments, our employees, vendors or agents may violate our policies. Our international partnerships may significantly increase our exposure to potential liability. Our failure to comply with Anti-Corruption Laws could result in significant fines and penalties, criminal sanctions against us, our officers or our employees, prohibitions on the conduct of our business, and damage to our reputation.
Risks Related to Owning Our Securities
We may not be able to comply with all applicable listing requirements or standards of The Nasdaq Capital Market and Nasdaq could delist our common stock.
Our common stock is listed on The Nasdaq Capital Market, and in order to maintain that listing, we must satisfy applicable Nasdaq continued listing requirements. The inability to comply with applicable listing requirements or standards of The Nasdaq Stock Market LLC (“Nasdaq”) could result in the delisting of our common stock, which could have a material adverse effect on our financial condition and could cause the value of our common stock to decline. Delisting of our common stock could also adversely affect our ability to raise additional financing, could significantly affect the ability of our investors to trade our securities and could negatively affect the value and liquidity of our common stock. Delisting could also have other negative results, including the potential loss of confidence by employees and fewer business development opportunities.
35
On February 29, 2024, we received notice from Nasdaq that the Company is not in compliance with Nasdaq Listing Rule 5550(a)(2) (the “Minimum Bid Price Requirement”), as the minimum bid price of our common stock had been below $1.00 per share for the previous 30 consecutive business days. The notice has no immediate effect on the listing or trading of our common stock.
We have 180 calendar days, or until August 27, 2024, to regain compliance with the Minimum Bid Price Requirement. To regain compliance, the minimum bid price of our common stock must meet or exceed $1.00 per share for a minimum of ten consecutive business days during this 180-calendar day grace period. In the event we do not regain compliance with the Minimum Bid Price Requirement by August 27, 2024, we may be eligible for an additional 180-calendar day compliance period. If we do not qualify for the second compliance period or fail to regain compliance during the second 180-day period, then Nasdaq will notify us of its determination to delist our common stock, at which point we will have an opportunity to appeal the delisting determination to a hearings panel.
We intend to actively monitor the bid price of our common stock and may, if appropriate, consider implementing available options to regain compliance with the Minimum Bid Price Requirement. There can be no assurance that we will regain compliance with the Minimum Bid Price Requirement or maintain compliance with any of the other Nasdaq continued listing requirements.
The market price of our common stock may be adversely affected by the future issuance and sale of additional shares of our common stock or by our announcement that such issuances and sales may occur.
We cannot predict the size of future issuances or sales of shares of our common stock in connection with future acquisitions or capital raising activities, or the effect, if any, that such issuances or sales may have on the market price of our common stock. The issuance and sale of substantial amounts of shares of our common stock, or the announcement that such issuances and sales may occur, could adversely affect the market price of our common stock.
Future issuances of our common stock or instruments convertible or exercisable into our common stock may materially and adversely affect the price of our common stock and cause dilution to our existing stockholders.
Historically, we have raised capital by issuing common stock and warrants in public offerings because no other reasonable sources of capital were available. These public offerings of common stock and warrants have materially and adversely affected the prevailing market prices of our common stock and caused significant dilution to our stockholders. We have also historically raised capital or refinanced outstanding debt through the issuance of convertible notes.
We may need to raise capital through these public offerings of common stock, warrants and convertible debt in the future.
We may obtain additional funds through public or private debt or equity financings, subject to certain limitations in the agreements governing our indebtedness. If we issue additional shares of common stock or instruments convertible into common stock, it may materially and adversely affect the price of our common stock.
Raising capital at a subsidiary, or project, level would result in lower revenues attributable back to us.
We operate in a capital-intensive business and in order to construct our facilities, we need to raise large amounts of capital. In order to finance the construction of NZ1 and any other Net-Zero Projects, we currently expect to raise capital at the subsidiary level using third party capital. By raising capital at a project level, any equity in that project that is sold to a third party would result in lower ownership of that project by us. Thus, we would only be entitled to the revenues and expenses that are proportionate to our level of ownership in the project. If we are required to sell a large portion of the equity in our projects to third parties, it may have a material adverse effect on our business, financial condition and operating results.
36
Our stock price may be volatile, and your investment in our securities could suffer a decline in value.
The market price of shares of our common stock has experienced significant price and volume fluctuations. We cannot predict whether the price of our common stock will rise or fall. A variety of factors may have a significant effect on our stock price, including:
● | actual or anticipated fluctuations in our liquidity, financial condition and operating results; |
● | the position of our cash and cash equivalents; |
● | the capital costs required to construct our Net-Zero Projects; |
● | our ability to obtain certain regulatory permits or approvals for our production facilities, including our Net-Zero Projects; |
● | actual or anticipated changes in our growth rate relative to our competitors; |
● | actual or anticipated fluctuations in our competitors’ operating results or changes in their growth rate; |
● | announcements of technological innovations by us, our partners or our competitors; |
● | announcements by us, our partners or our competitors of significant acquisitions, strategic partnerships, joint ventures or capital commitments; |
● | the entry into, modification or termination of licensing arrangements, marketing arrangements, and/or research, development, commercialization, supply, off-take or distribution arrangements; |
● | our ability to consistently produce commercial quantities of our products; |
● | additions or losses of customers or partners; |
● | our ability to obtain certain regulatory approvals for the use of our products in various fuels and chemicals markets; |
● | commodity prices, including oil, ethanol and corn prices; |
● | additions or departures of key management or scientific personnel; |
● | competition from existing products or new products that may emerge; |
● | issuance of new or updated research reports by securities or industry analysts; |
● | fluctuations in the valuation of companies perceived by investors to be comparable to us; |
● | litigation involving us, our general industry or both; |
● | disputes or other developments related to proprietary rights, including patents, litigation matters and our ability to obtain patent protection for our technologies; |
● | announcements or expectations of additional financing efforts or the pursuit of strategic alternatives; |
● | changes in existing laws, regulations and policies applicable to our business and products, and the adoption of or failure to adopt carbon emissions regulation; |
● | sales of our common stock or equity-linked securities, such as warrants, by us or our stockholders; |
● | share price and volume fluctuations attributable to inconsistent trading volume levels of our shares; |
● | general market conditions in our industry; and |
● | general economic and market conditions. |
Furthermore, the stock markets have experienced extreme price and volume fluctuations that have affected and continue to affect the market prices of equity securities of many companies. These fluctuations often have been unrelated or disproportionate to the operating performance of those companies. These broad market and industry fluctuations, as well as general economic, political and market conditions such as recessions, interest rate changes or international currency fluctuations, may negatively impact the market price of shares of our common stock, regardless of our operating performance, and cause the value of your investment to decline.
Additionally, in the past, companies that have experienced volatility in the market price of their stock have been subject to securities class action litigation or other derivative shareholder lawsuits. We may be the target of this type of litigation in the future. Securities litigation against us could result in substantial costs and divert our management’s attention from other business concerns, which could seriously harm our business regardless of the outcome.
The price of our common stock could also be affected by possible sales of common stock by investors who view our warrants as a more attractive means of equity participation in us and by hedging or engaging in arbitrage
37
activity involving our common stock. The hedging or arbitrage could, in turn, affect the trading prices of our warrants, if any trading market becomes established, or any common stock that holders receive upon exercise of such warrants.
Sales of a substantial number of shares of our common stock or securities linked to our common stock, such as our warrants (should an established market for such securities then exist), in the public market could occur at any time. These sales, or the perception in the market that such sales may occur, could reduce the market price of our common stock.
In addition, certain holders of our outstanding common stock have rights, subject to certain conditions, to require us to file registration statements covering their shares and to include their shares in registration statements that we may file for ourselves or other stockholders.
The estimates and assumptions on which our financial projections are based may prove to be inaccurate.
Our financial projections, including any projected investment returns on projects, sales or earnings guidance or outlook that we may provide from time to time, are dependent on estimates and assumptions related to, among other things, industry growth, product and plant development, estimated capital expenses for growth development projects, market share projections, product pricing and sale, customer interest in our products, availability of government incentives, tax rates, accruals for estimated liabilities, and our ability to raise sufficient funds or generate sufficient cash flow to continue operations and/or expand our production capabilities. Our financial projections are based on historical experience and on various other estimates and assumptions that we believe to be reasonable under the circumstances and at the time they are made, and our actual results may differ materially from our financial projections.
Raising additional capital may cause dilution to our existing stockholders, restrict our operations or require us to relinquish rights to our technologies.
We may seek additional capital through a combination of public and private equity offerings, debt financings, strategic partnerships and licensing arrangements. To the extent that we raise additional capital through the sale or issuance of equity, warrants or convertible debt securities, the ownership interest of our existing shareholders will be diluted, and the terms of such securities may include liquidation or other preferences that adversely affect your rights as a stockholder. If we raise capital through debt financing, it may involve agreements that include covenants further limiting or restricting our ability to take certain actions, such as incurring additional debt, making capital expenditures or declaring dividends. If we raise additional funds through strategic partnerships or licensing agreements with third parties, we may have to relinquish valuable rights to our technologies or grant licenses on terms that are not favorable to us. If we are unable to raise additional funds when needed, we may be required to delay, limit, reduce or terminate our development and commercialization efforts.
We do not anticipate paying cash dividends, and accordingly, stockholders must rely on stock appreciation for any return on their investment.
We have never paid cash dividends on our common stock and we do not expect to pay cash dividends on our common stock at any time in the foreseeable future. The future payment of dividends directly depends upon our future earnings, capital requirements, financial requirements and other factors that our board of directors will consider. As a result, only appreciation of the price of our common stock, which may never occur, will provide a return to stockholders. Investors seeking cash dividends should not invest in our common stock.
If securities or industry analysts do not publish research or reports about our business, or publish negative reports about our business, our stock price and trading volume could decline. The trading market for our common stock will be influenced by the research and reports that securities or industry analysts publish about us or our business.
We do not have any control over securities or industry analysts. If one or more of the analysts who cover us downgrade our common stock or change their opinion of our common stock, our common stock price would likely decline which in turn would likely cause a decline in the value of our warrants. If one or more of these analysts cease coverage of us or fail to regularly publish reports on us, we could lose visibility in the financial markets, which could cause our common stock price and the price of our warrants to decline or the trading volume of our common stock to decline.
38
We are subject to anti-takeover provisions in our certificate of incorporation, our bylaws and under Delaware law that could delay or prevent an acquisition of the Company, even if the acquisition would be beneficial to our stockholders.
Provisions in our certificate of incorporation and our bylaws may delay or prevent an acquisition of the Company. Among other things, our certificate of incorporation and bylaws provide for a board of directors that is divided into three classes with staggered three-year terms, provide that all stockholder action must be effected at a duly called meeting of the stockholders and not by a consent in writing, and further provide that only our board of directors may call a special meeting of the stockholders. These provisions may also frustrate or prevent any attempts by our stockholders to replace or remove our current management by making it more difficult for stockholders to replace members of our board of directors, who are responsible for appointing the members of our management team. Furthermore, because we are incorporated in Delaware, we are governed by the provisions of Section 203 of the Delaware General Corporation Law (the “DGCL”), which prohibits, with some exceptions, stockholders owning in excess of 15% of our outstanding voting stock from merging or combining with us. Finally, our charter documents establish advance notice requirements for nominations for election to our board of directors and for proposing matters that can be acted upon at stockholder meetings. Although we believe these provisions together provide an opportunity to receive higher bids by requiring potential acquirers to negotiate with our board of directors, they would apply even if an offer to acquire the Company may be considered beneficial by some stockholders.
Our certificate of incorporation provides that, unless we consent in writing to the selection of an alternative forum, the Court of Chancery of the State of Delaware will be the sole and exclusive forum for substantially all disputes between us and our stockholders, which could limit our stockholders’ ability to obtain a favorable judicial forum for disputes with us or our directors, officers or employees.
Our certificate of incorporation provides that the Court of Chancery of the State of Delaware shall, unless we consent in writing to the selection of an alternative forum, be the sole and exclusive forum for (i) any derivative action or proceeding brought on behalf of the Company, (ii) any action asserting a claim of breach of a fiduciary duty owed by any director, officer or other employee of the Company to the Company or its stockholders, (iii) any action asserting a claim arising pursuant to any provision of the Delaware General Corporation Law, or (iv) any action asserting a claim governed by the internal affairs doctrine, in each case subject to said Court of Chancery having personal jurisdiction over the indispensable parties named as defendants therein.
The exclusive forum provision may limit a stockholder’s ability to bring a claim in a judicial forum that it finds favorable for disputes with us or our directors, officers, employees or agents, which may discourage such lawsuits against us and our directors, officers, employees and agents. Stockholders who do bring a claim in the Court of Chancery could face additional litigation costs in pursuing any such claim, particularly if they do not reside in or near the State of Delaware. The Court of Chancery may also reach different judgments or results than would other courts, including courts where a stockholder considering an action may be located or would otherwise choose to bring the action, and such judgments or results may be more favorable to us than to our stockholders. Alternatively, if a court were to find the choice of forum provision contained in our certificate of incorporation to be inapplicable or unenforceable in an action, we may incur additional costs associated with resolving such action in other jurisdictions, which could adversely affect our business and financial condition. Notwithstanding the foregoing, the exclusive forum provision shall not preclude or contract the scope of exclusive federal or concurrent jurisdiction for actions brought under the Exchange Act or the Securities Act, or the respective rules and regulations promulgated thereunder.
Any person or entity purchasing or otherwise acquiring any interest in any of our securities shall be deemed to have notice of and consented to these provisions. This exclusive forum provision may limit a stockholder’s ability to bring a claim in a judicial forum of its choosing for disputes with us or our directors, officers or other employees, which may discourage lawsuits against us and our directors, officers and other employees.
If a court were to find the exclusive forum provision contained in our certificate of incorporation to be inapplicable or unenforceable in an action, we may incur additional costs associated with resolving such action in other jurisdictions, which could harm our business, results of operations and financial condition. Even if we are successful in defending against these claims, litigation could result in substantial costs and be a distraction to management and other employees.
39
Item 1B.Unresolved Staff Comments
None.
Item 1C. | Cybersecurity |
We have an information security program designed to identify, protect, detect and respond to and manage reasonably foreseeable cybersecurity risks and threats. To protect our information systems from cybersecurity threats, we use various security tools that help prevent, identify, escalate, investigate, resolve and recover from identified vulnerabilities and security incidents in a timely manner. These include, but are not limited to, internal reporting, monitoring and detection tools.
We regularly assess risks from cybersecurity and technology threats and monitor our information systems for potential vulnerabilities. We use a widely-adopted risk quantification model to identify, measure and prioritize cybersecurity and technology risks and develop related security controls and safeguards. We conduct regular reviews and tests of our information security program and also leverage other exercises (e.g., penetration and vulnerability testing) to evaluate the effectiveness of our information security program and improve our security measures and planning. The results of these reviews and exercises are reported to the Audit Committee.
While we have not, as of the date of this Form 10-K, experienced a cybersecurity threat or incident that resulted in a material adverse impact to our business or operations, there can be no guarantee that we will not experience such an incident in the future. Such incidents, whether or not successful, could result in our incurring significant costs related to, for example, rebuilding our internal systems, implementing additional threat protection measures, defending against litigation, responding to regulatory inquiries or actions, paying damages, providing customers with incentives to maintain a business relationship with us, or taking other remedial steps with respect to third parties, as well as incurring significant reputational harm. In addition, these threats are constantly evolving, thereby increasing the difficulty of successfully defending against them or implementing adequate preventative measures.
Our Chief People Officer oversees our information security program. Team members who support our information security program have relevant educational and industry experience. The team provides regular reports to senior management on various cybersecurity threats, assessments and findings.
The Board oversees our enterprise risk assessment, where we assess key risks within the company, including security and technology risks and cybersecurity threats. The Audit Committee oversees our cybersecurity risk and receives regular reports from our Chief People Officer on various cybersecurity matters, including risk assessments, mitigation strategies, areas of emerging risks, incidents and industry trends, and other areas of importance.
Item 3. | Legal Proceedings |
From time to time, we have been and may again become involved in legal proceedings arising in the ordinary course of our business. We are not presently a party to any litigation that we believe to be material and we are not aware of any pending or threatened litigation against us that we believe could have a material adverse effect on our business, operating results, financial condition or cash flows.
Item 4. | Mine Safety Disclosures |
Not Applicable.
40
PART II
Item 5. | Market for Registrant’s Common Equity, Related Stockholder Matters and Issuer Purchases of Equity Securities |
Market Information
The Company’s common stock is listed and traded on The Nasdaq Capital Market under the symbol “GEVO”.
Holders of Record
As of January 31, 2024, there were approximately 69 holders of record of our common stock. We believe that the number of beneficial owners is substantially greater than the number of record holders because a large portion of our common stock is held of record through brokerage firms in “street name.”
Dividends
No cash dividends have been paid on our common stock to date, nor do we anticipate paying dividends in the foreseeable future. Any future determination to declare cash dividends on our common stock will be made at the discretion of our Board of Directors, subject to compliance and limitations under our debt arrangements in effect at such time.
Recent Sales of Unregistered Securities; Use of Proceeds from Registered Securities
None.
Purchases of Equity Securities by the Issuer
On May 30, 2023, the Board authorized a stock repurchase program, under which the Company may repurchase up to $25 million of its common stock. The primary goal of the repurchase program is to allow the Company to opportunistically repurchase shares, while maintaining its ability to fund development projects. Under the stock repurchase program, the Company may repurchase shares from time to time in the open market or through privately negotiated transactions. The timing, volume and nature of stock repurchases, if any, will be in the Company’s sole discretion and will be dependent on market conditions, applicable securities laws, and other factors. The stock repurchase program may be suspended or discontinued at any time and does not have an expiration date.
The Company did not repurchase any shares of common stock under the stock repurchase program during the three months or fiscal year ended December 31, 2023.
Performance Graph
The following information is not deemed to be “soliciting material” or to be “filed” with the SEC or subject to Regulation 14A or 14C under the Exchange Act or to the liabilities of Section 18 of the Exchange Act, and will not be deemed to be incorporated by reference into any filing of the Company under the Securities Act of 1933, as amended (the “Securities Act”), or the Exchange Act, except to the extent the Company specifically incorporates it by reference into such a filing.
41
The following line graph compares the cumulative total shareowner return on our common stock against the cumulative total return of the S&P Smallcap 600 Index and the NASDAQ Clean Edge Green Energy Index for the each of the five years ended December 31, 2023. The graph assumes a $100 investment in our common stock and each index at December 31, 2018.
COMPARISON OF 5 YEAR CUMULATIVE TOTAL RETURN
Among Gevo, Inc., The S&P Smallcap 600 Index
and the NASDAQ Clean Edge Green Energy Index
| December 31, |
| December 31, |
| December 31, |
| December 31, |
| December 31, |
| December 31, | |||||||
| 2018 |
| 2019 |
| 2020 |
| 2021 |
| 2022 |
| 2023 | |||||||
Gevo, Inc. | $ | 100.00 | $ | 117.86 | $ | 216.84 | $ | 218.37 | $ | 96.94 | $ | 59.18 | ||||||
S&P Smallcap 600 |
| 100.00 |
| 122.78 |
| 136.64 |
| 173.29 |
| 145.39 |
| 168.73 | ||||||
NASDAQ Clean Edge Green Energy |
| 100.00 |
| 142.67 |
| 406.35 |
| 395.62 |
| 276.35 |
| 248.97 |
The information in the graph will not be considered solicitation material, nor will it be filed with the SEC or incorporated by reference into any future filing under the Securities Act or the Exchange Act, unless we specifically incorporate it by reference into our filing.
Item 6. | [Reserved] |
42
Item 7. | Management’s Discussion and Analysis of Financial Condition and Results of Operations |
The following discussion and analysis of our financial condition and results of operations should be read in conjunction with our audited financial statements and related notes appearing elsewhere in this Annual Report on Form 10-K (this “Annual Report”). Some of the information contained in this discussion and analysis and set forth elsewhere in this Annual Report, including information with respect to our plans and strategy for our business, includes forward-looking statements that involve risks and uncertainties. You should review the section titled “Risk Factors” in Part I, Item 1A of this Annual Report for a discussion of important factors that could cause actual results to differ materially from the results described in or implied by the forward-looking statements contained in the following discussion and analysis.
Company Overview
We are a growth-oriented, carbon abatement company with the mission of solving greenhouse gas emissions for those sectors of the transportation industry that are not amenable to electrification or hydrogen. We believe that the market size for hydrocarbon fuels will continue to remain significant in the long-term even with the rapid adoption of electric vehicles and hydrogen technologies.
We are focused on transforming renewable energy into energy-dense liquid hydrocarbons that can be used as renewable fuels, such as sustainable aviation fuel (“SAF”), with the potential to achieve a “net-zero” greenhouse gas (“GHG”) footprint. We believe that this addresses the global need of reducing GHG emissions with “drop in” sustainable alternatives to petroleum fuels. We use the Argonne National Laboratory’s Greenhouse gases, Regulated Emissions, and Energy use in Transportation model (the “GREET Model”) to measure, predict and verify GHG emissions across the life cycle of our products. The “net-zero” concept means Gevo expects that by using sustainably grown feedstock (e.g., low till, no-till and dry corn cultivation), renewable and substantially decarbonized energy sources, drop-in hydrocarbon fuels can be produced that have a net-zero, full life cycle footprint measured from the capture of renewable carbon through the burning of the fuel.
Our primary market focus, given current demand and growing customer interest, is hydrocarbon fuels, and SAF in particular. We believe that SAF from carbohydrates to alcohol is the most economically viable approach for carbon abatement. We also have commercial opportunities for other renewable hydrocarbon products, such as RNG; hydrocarbons for gasoline blendstocks and diesel fuel; ingredients for the chemical industry, such as ethylene and butenes; plastics and materials; and other chemicals. Global fuel consumption by commercial airlines continues to remain strong, with global fuel consumption of more than 100 MGPY and growing.
Project Updates
Net-Zero Projects. Our concept of “Net-Zero Projects” is a series of planned facilities to produce energy dense liquid hydrocarbons using renewable energy and our proprietary technology. Our initial Net-Zero Project, Net-Zero 1 (“NZ1”), is expected to be located in Lake Preston, South Dakota, and is being currently designed to produce approximately 65 million gallons per year (“MGPY”) of total hydrocarbon volumes, including 60 MGPY of SAF, which would fulfill part of our approximately 350 MGPY of SAF and hydrocarbon supply agreements. The liquid hydrocarbons, when burned, are expected to have a “net-zero” GHG footprint. Along with the hydrocarbons, NZ1 is expected to produce approximately 695,000 tons per year of high-value protein products for use in the food chain and more than 34 million pounds per year of corn oil. Our products will be produced in three steps: the first step is milling the corn to produce the carbohydrates needed for the production of SAF while simultaneously enabling the production of protein and oil; the second step produces alcohols using carbohydrate-based fermentation; and the third step is the conversion of the alcohols into hydrocarbons.
43
We work with several technology, design and equipment partners, most notably Fluid Quip Technologies (FQT), Axens, and Praj. FQT and Axens provide area operation designs which have been incorporated into Gevo’s proprietary overall design of low CI carbohydrate-to-hydrocarbon plants, such as NZ1 plant. Praj is working with us on the proprietary design and construction of prefabricated process modules for our plants. Our partners are working with us on proprietary process designs that have the potential to lower capital and operating cost in the future. The advantage of utilizing Fluid Quip and Axens area operation and related process designs which are well proven in other applications, we believe we have chosen technology which is substantially de-risked.
We completed the value engineering on our NZ1 project and are proceeding with detailed engineering, modularization design, and capital costs updates. We are currently refining project cost estimates with engineering, procurement, and construction (“EPC”) partners to identify cost saving opportunities, and currently expect to finance the construction of NZ1 at the subsidiary level using a combination of Company equity and third-party capital, to include non-recourse debt. The Company expects to have invested a cumulative total of $236 to $286 million of cash equity in the project at financial close. Cash distributions from future NZ1 earnings would be proportionate to Gevo’s ownership in NZ1 under this expected financing structure. The use of project debt and third party equity allows us to conserve capital for use on other growth projects. We expect to apply similar development and financing strategies to future Net-Zero Projects to enable growth of SAF production to meet demand for SAF.
We have substantially completed the engineering design of NZ1. We have substantially completed value engineering and we are now focusing on detail engineering with an EPC partner, to reduce and contractually finalize a negotiated lump-sum, fixed price agreement whereby the EPC will build and deliver the plant. This detail engineering work is focused specifically on increasing the modularization of component parts on the NZ1 plant design, which means that we expect that the process equipment would be built into modules at a factory, then the modules would be assembled onsite at NZ1, with the goal of minimizing specialized field work typical in plant construction of this type. This approach is expected to lower the risk and cost of, and access to, skilled labor at the site and reduce the supply chain constrictions for some of our long-lead equipment. Increasing the modularization of the plant design is also expected to reduce our spend in advance of securing third-party equity and debt financing for NZ1 and increase the certainty of construction schedule for those counterparties.
In order to achieve full construction financing for NZ1, we need to secure third-party equity and debt. Upon receiving an invitation from the U.S. Department of Energy (“DOE”), we submitted a Part II Application for a DOE loan guarantee for a direct lending from Federal Financing Bank. In August 2023, Gevo was invited to enter the due diligence and underwriting phases with DOE. Given the current interest rate environment and general macroeconomic conditions, a DOE-guaranteed loan is our most attractive debt option and is expected to offer the lowest cost of debt for the project. We expect that obtaining a DOE-guaranteed loan will have the benefit of reducing the overall amount of equity required to finance NZ1 and should result in higher project equity returns for investors which should increase the likelihood of Gevo successfully financing NZ1. The DOE loan application process is targeted to be complete in 2024. We expect that our NZ1 plant start-up date will occur twenty-four to thirty months after the NZ1 financing closes, the timing of which is uncertain. In parallel with the DOE-guaranteed loan process, we continue to explore debt financing for NZ1 without the benefit of the DOE-guaranteed loan. We are also working to secure access to carbon capture and sequestration at the site.
We are evaluating and performing early site development work at several sites in the U.S. for other greenfield sites. These sites include several greenfield locations that are particularly advantageous in terms of potential economics, opportunities to decarbonize, and time to market. In addition, we are pursuing potential Net-Zero Projects with several existing ethanol plant sites. Existing ethanol plants need to be decarbonized with renewable energy or de-fossilized energy and/or carbon sequestration. Gevo has developed a preferred list of potential partners and sites with decarbonization in mind and is engaged in preliminary feasibility and development discussions with several of these potential partners. We plan to give priority to existing industrial plant sites that have attractive potential economics and high predictability of timeline for decarbonization.
Renewable Natural Gas Project. The Gevo RNG project started up and began producing and injecting initial volumes of biogas in 2022, during the project’s testing and ramp-up period. The project achieved stable production levels and surpassed our annual production target of 310,000 MMBtu for 2023. In addition, we completed an expansion to the Gevo RNG project to increase its annual design capacity from 355,000 MMBtu to 400,000 MMBtu.
44
Gevo’s revenue from the RNG project in Northwest Iowa (the “RNG Project”) stems from sales of RNG and from the environmental attributes associated with its RNG sales, including the attributes available from California’s Low Carbon Fuel Standard (“LCFS”) program and the U.S. Environmental Protection Agency (“EPA”) Renewable Fuels Standard (“RFS”) program to receive renewable identification numbers (“RINs”). Gevo was granted registration approval by the EPA in 2022, allowing us to participate in its Renewable Fuel Standard Program (“RFS Program”) to receive renewable identification numbers (“RINs”).
During the first quarter of 2023, we received approval for a temporary pathway under California’s Low Carbon Fuel Standard (“LCFS”) program. We continue to realize substantial sales for our environmental attributes of both LCFS credits and RINs in 2023.
Verity. It is critical that we can prove the CI of our products, ensuring that these values are accurate and auditable. The mission of Verity (“Verity”), including Verity Tracking and Verity Carbon Solutions, is to document CI and other sustainability attributes and apply Distributed Ledger Technology, commonly referred to as blockchain, to create a record of the products throughout the entire business system. Verity starts by calculating carbon intensity of feedstocks from data collected at the farm and field level. We plan to track these feedstocks through production at our plants where we intend to use a mix of renewable electricity, biogas, renewable hydrogen and other potentially decarbonized energy sources in production. The CI data would then be combined to deliver a comprehensive CI reduction in a finished renewable fuel. The resulting CI reduction value has potential to be quantified as a digital asset and monetized in voluntary or compliance carbon markets, and providing compliance needs for tax incentives while preventing double-counting. We believe that in the future, regenerative agricultural practices have the potential to sequester large quantities of soil organic carbon while improving soil health.
There is increasing regulatory and stakeholder pressure on global corporations to lower emissions. These trends are driving demand for carbon credits, giving rise to two sets of markets, the regulated compliance carbon market and the unregulated voluntary carbon market, both of which could grow meaningfully in the coming decades. The total value of major compliance carbon markets is expected to be greater than $800 billion in 2023, according to Bloomberg. Verity intends to document and account for carbon capture in conjunction with scientifically supported measurement techniques. The potential for Verity is broad and could be applicable to tracking the CI of various items beyond Gevo’s internal businesses, including, but not limited to, renewable fuels, food, feed and industrial products through their respective business systems and value chains. Our robust scientific measurement, reporting, and verification plan and approach is expected to provide a high-quality credit that should meet regulated compliance and unregulated carbon markets.
In March 2023, we entered into a joint development framework agreement with Southwest Iowa Renewable Energy; in August 2023, we entered into a joint development framework agreement with a second ethanol producer in the Midwest that has over 100 million gallons of capacity; and in October 2023, we entered into an agreement with a third ethanol producer in the Southwest. These agreements include commercial terms and profit-sharing frameworks. As we grow Verity as an externally facing business, we are working to sign up additional ethanol and biofuel customers. Each of these agreements will focus on implementing Verity technology and developing the market for carbon credits to help farmers and biofuel producers quantify the CI reductions for their products.
During the second quarter of 2023, we launched the Verity Tracking platform (the “Platform”) with farmers in the Lake Preston, South Dakota area who participated in our 2022 grower program. In its initial release, the Platform allows the users to measure, report, verify, and view the CI scores at both the farm average and field-by-field levels. The Platform provides insights into the contributors and removers behind the CI, helping users to understand the factors that drive differences in CI performance between fields. Users can also compare their scores with the U.S. national average calculated by the GREET model.
Key Verity project highlights include:
● | Verity Carbon Solution began development in 2020 as a necessary and value-added services for our SAF production; |
● | 3 ethanol producer customers contracted, and growing; |
● | 2% of the total US ethanol market or more than 300 million gallons per year; |
45
● | 100% farmer retention in the grower program comprising 65,000 acres and growing; |
● | Total value pool of all major global compliance carbon markets in 2023 was $800 billion; |
● | Capital light, fee-based, industry agnostic business |
Luverne Facility. In 2022, the activities at our Luverne Facility were transitioned to care and maintenance, market development, and customer education, as we shifted focus to our Net Zero Projects. The workforce adjustment which resulted allowed us to retain key personnel and redeploy some resources to our NZ1 and RNG projects to provide valuable knowledge and experience for the future strategic growth of the Company. The Luverne Facility is well equipped and positioned as a development site as it provides a unique opportunity to showcase our decarbonization and business systems and raise awareness for future partnerships, investors, and local communities, even though operations at the site have been minimized. Future operations, if any, will be tailored to support a focus on advancing our technology, testing, optimizing alternative feedstocks and yeast strains, and unit operations as well as partnership development for fuels and specialty chemicals with integrated solutions for GHG reductions. We continue to evaluate incentive opportunities recently introduced by the Inflation Reduction Act, which may positively impact the future economics of our operation at Luverne.
U.S. Department of Agriculture. In September 2023, we executed a Notice of Grant and Agreement Award with the U.S. Department of Agriculture (“USDA”) for a Partnerships for Climate-Smart Commodities grant of up to $30.0 million for Gevo’s Climate-Smart Farm-to-Flight Program, with project activity beginning for the 2023 crop year. The project expects to create critical structural climate-smart market incentives for low CI corn as well as to accelerate the production of SAF to reduce the sector’s dependency on fossil-based fuels. In addition, this program will help provide support and incentive payments for farmers to produce, measure, report and verify low CI corn using climate smart agricultural practices, as well as accelerate development of the low-CI corn supply chain for low-carbon ethanol and SAF.
LG Chem Agreement. In April 2023, we entered into a joint development agreement with LG Chem, Ltd. (“LG Chem”) a leading global chemical company to develop bio-propylene for renewable chemicals using our Ethanol-to-Olefins (“ETO”) technology. Gevo’s proprietary ETO technology can target carbon neutral or carbon negative drop-in replacements for traditional petroleum-based building blocks called olefins, including bio-propylene, which can be used for renewable chemicals or fuels including sustainable aviation fuel. These plant-based, renewable olefins would be derived from atmospheric CO2 captured through photosynthesis and are expected to deliver the same performance in final products on the market today. Under the terms of the agreement, we will provide the core enabling technology it has developed for renewable olefins to be produced from low-carbon ethanol and together the parties will collaborate to accelerate the pilot research, technical scale-up, and commercialization of bio-propylene. LG Chem is expected to bear all scale-up costs for chemicals and make certain payments to Gevo. We received $1.1 million, net of foreign taxes of $0.2 million, in the second quarter of 2023 under the agreement, and we expect to receive an additional $1.2 million over the next two years to help defray costs associated with the joint development efforts. In addition, LG Chem agreed to make certain payments to us upon commencement of commercialization as follows:
● | $5.0 million upon commencement of commercialization, to be paid ratably over a period of five years. |
● | 1% royalty on Net Sales for the first production facility beginning six years from commercial operation. |
● | 1% royalty on Net Sales for all subsequent production facilities upon commencement of operations. |
Nasdaq Listing Rules Compliance
On February 29, 2024, we received notice from Nasdaq that we were not in compliance with Nasdaq Listing Rule 5550(a)(2) (the “Minimum Bid Price Requirement”), as the minimum bid price of our common stock had been below $1.00 per share for the previous 30 consecutive business days. We have 180 calendar days, or until August 27, 2024, to regain compliance with the Minimum Bid Price Requirement. To regain compliance, the minimum bid price of our common stock must meet or exceed $1.00 per share for a minimum of ten consecutive business days during the compliance grace period. In the event we do not regain compliance with the Minimum Bid Price Requirement by August 27, 2024, we may be eligible for an additional 180-calendar day compliance period. Our failure to regain compliance during the compliance period could result in delisting.
46
Key Operating Metrics
Total operating revenues reflect both sales of RNG and sales of related environmental attributes. As a result, our revenues are primarily affected by unit production of RNG, production of environmental attributes, and the prices at which we monetize such production. The following table summarizes the key operating metrics described above, which metrics we use to measure performance:
Year Ended December 31, | ||||||||||||
(in thousands, unless otherwise indicated) |
| 2023 |
| 2022 |
| Change |
| Change % |
| |||
Revenues |
|
|
|
|
|
|
|
|
| |||
Natural gas commodity | $ | 659 | $ | 640 | $ | 19 | 3 | % | ||||
Natural gas environmental attributes - RINs |
| 9,888 |
| 214 |
| 9,674 | 4,521 | % | ||||
Natural gas environmental attributes - LCFS |
| 4,910 |
| — |
| 4,910 | 100 | % | ||||
Total revenues | $ | 15,457 | $ | 854 | $ | 14,603 | ||||||
Production expenses (1) | $ | 11,481 | $ | 2,626 | $ | 8,855 | 337 | % | ||||
RNG metrics |
|
|
|
|
|
|
| |||||
RNG production volumes (MMBtu) |
| 314 |
| 125 |
| 189 | 151 | % | ||||
Plus: prior period RNG volumes dispensed in current period |
| 116 |
| — |
| 116 | 100 | % | ||||
Less: RNG production volumes not dispensed |
| (34) |
| (116) |
| 82 | (71) | % | ||||
Total RNG volumes available for RIN and LCFS generation (2) |
| 396 |
| 9 |
| 387 | 4,300 | % | ||||
RIN metrics |
|
|
|
|
|
|
| |||||
RIN generation (3) |
| 4,639 |
| 101 |
| 4,538 | 4,493 | % | ||||
Plus: Prior period RINs |
| — |
| — |
| — | — | % | ||||
Total RINs available for sale |
| 4,639 |
| 101 |
| 4,538 | 4,493 | % | ||||
Less: RINs sold |
| (4,639) |
| (101) |
| (4,538) | 4,493 | % | ||||
RIN inventory |
| — |
| — |
| — | ||||||
RNG volumes not dispensed for RINs (MMBtu) (4) |
| 34 |
| 116 |
| (82) | (71) | % | ||||
Average realized RIN price (5) | $ | 2.13 | $ | 2.13 | $ | — | — | % | ||||
LCFS metrics |
|
|
|
|
|
|
| |||||
LCFS generation (6) | 76 | — | 76 | 100 | % | |||||||
Less: LCFS sold | (76) | — | (76) | 100 | % | |||||||
LCFS inventory | — | — | — | |||||||||
RNG volumes not dispensed for LCFS (MMBtu) |
| 34 |
| 116 |
| (82) | (71) | % | ||||
Average realized LCFS price (5) | $ | 64.79 | $ | — | $ | 64.79 | 100 | % |
(1) | The higher per unit cost reflects lower production volumes during the commissioning and ramp-up phase, which was substantially completed by the end of Q3 2023. |
(2) | Represents gas production which has not been dispensed to generate RINs and LCFS. |
(3) | RINs are generally generated in the month following the gas being dispensed. |
(4) | One MMBtu of RNG has approximately the same energy content as 11.727 gallons of ethanol, and thus may generate 11.727 RINs under the RFS Program. |
(5) | Realized prices for environmental attributes are net of third-party commissions and thus do not correspond directly to index prices. |
(6) | LCFS credits are generally generated in the calendar quarter following the gas being dispensed. |
47
Results of Operations
The following discussion of our financial condition and results of operations should be read in conjunction with our Consolidated Financial Statements and the notes to those Consolidated Financial Statements appearing in this Annual Report. This discussion contains forward-looking statements that involve significant risks and uncertainties. As a result of many factors, such as those set forth under “Risk Factors” in Part I, Item 1A of this Annual Report, our actual results may differ materially from those anticipated in these forward-looking statements.
This section of this Report discusses year-to-year comparisons between 2023 and 2022. The complete Management’s Discussion and Analysis of Financial Condition and Results of Operations for year-to-year comparisons between 2022 and 2021 and other discussions of 2021 items can be found within Part II, Item 7, of our Annual Report on Form 10-K for the year ended December 31, 2022, filed with the SEC on March 9, 2023, which is available free of charge on the SEC’s website at www.sec.gov and our corporate website at www.gevo.com.
Comparison of the Years Ended December 31, 2023 and 2022
(in thousands)
| Year Ended December 31, |
|
|
|
| |||||||
| 2023 |
| 2022 |
| Change ($) |
| Change (%) |
| ||||
Total operating revenues | $ | 17,200 | $ | 1,175 | $ | 16,025 | 1,364 | % | ||||
Operating expenses: |
|
|
|
|
|
| ||||||
Cost of production |
| 11,991 |
| 8,698 |
| 3,293 | 38 | % | ||||
Depreciation and amortization | 19,007 | 7,887 | 11,120 | 141 | % | |||||||
Research and development expense |
| 6,637 |
| 7,427 |
| (790) | (11) | % | ||||
General and administrative expense |
| 42,628 |
| 39,941 |
| 2,687 | 7 | % | ||||
Project development costs |
| 14,732 |
| 10,061 |
| 4,671 | 46 | % | ||||
Facility idling costs |
| 4,040 |
| 4,599 |
| (559) | (12) | % | ||||
Impairment loss |
| — |
| 24,749 |
| (24,749) | (100) | % | ||||
Loss on disposal of assets |
| — |
| 499 |
| (499) | (100) | % | ||||
Total operating expenses |
| 99,035 |
| 103,861 |
| (4,826) | (5) | % | ||||
Loss from operations |
| (81,835) |
| (102,686) |
| 20,851 | (20) | % | ||||
Other income (expense) |
|
|
|
|
|
| ||||||
Interest expense |
| (2,161) |
| (1,167) |
| (994) | 85 | % | ||||
Interest and investment income |
| 19,090 |
| 3,481 |
| 15,609 | 448 | % | ||||
Other income (expense), net |
| (1,309) |
| 2,365 |
| (3,674) | (155) | % | ||||
Total other income, net |
| 15,620 |
| 4,679 |
| 10,941 | 234 | % | ||||
Net loss | $ | (66,215) | $ | (98,007) | $ | 31,792 | (32) | % |
Operating revenue. During the year ended December 31, 2023, revenue increased $16.0 million compared to the year ended December 31, 2022, primarily due to sales of RNG and environmental attributes from our RNG project. Sales under our RNG project commenced in the third quarter of 2022. During the year ended December 31, 2023, we sold 313,572 MMBtu of RNG from our RNG project, resulting in biogas commodity sales of $0.7 million and environmental attribute sales of $14.8 million, see Key Operating Metrics above. Additionally, we recognized $1.3 million of licensing and development revenue from the agreement with LG Chem as well as $0.4 million from the sale of isooctane during the year ended December 31, 2023.
Cost of production. Cost of production increased $3.3 million during the year ended December 31, 2023, compared to the year ended December 31, 2022, primarily due to the production and sales from our RNG project, which significantly increased in 2023, after the ramp-up phase, as well as lower costs at the idling Luverne Facility in 2023.
Depreciation and amortization. Depreciation and amortization increased $11.1 million during the year ended December 31, 2023, compared to the year ended December 31, 2022, primarily due to a full three quarters of additional depreciation expense in 2023 for RNG assets placed into service in Q3 2022 and accelerated depreciation on Agri-Energy segment assets due to shorter lives stemming from the impairment assessment during the third quarter of 2022. See Note 4 to the Consolidated Financial Statements for additional information.
48
Research and development expense. Research and development expense decreased $0.8 million during the year ended December 31, 2023, compared to the year ended December 31, 2022, primarily due to a reduction of consulting expenses, partially offset by an increase in personnel related costs due to additional headcount added during the year ended December 31, 2023.
General and administrative expense. General and administrative expense increased $2.7 million during the year ended December 31, 2023, compared to the year ended December 31, 2022, primarily due to increases in personnel costs related to the hiring of highly qualified and skilled professionals, professional consulting fees, and stock-based compensation. On a periodic basis, we assess our Corporate cost allocation estimates. During the year ended December 31, 2023, we performed an assessment which resulted in the implementation of Corporate cost allocations across all segments to reflect the use of centralized administrative functions as well as the allocation of personnel costs related to our project development efforts. If we had applied the most recent cost allocation estimate to the year ended December 31, 2023, it would have resulted in a decrease in General and administrative expense of approximately $28.4 million, with a corresponding increase primarily to Project development costs, representing the nature of the Company’s expenditures related to those growth projects: namely our view that substantial portions of these expenditures may be reimbursed to us upon financial close of NZ1, and their growth-oriented non-recurring and discretionary nature. The allocations did not impact the Company’s operating loss or net loss for the year ended December 31, 2023.
Project development costs. Project development costs are related to our future Net-Zero Projects and Verity which consist primarily of employee expenses, preliminary engineering costs, and technical consulting costs. Project development costs increased $4.7 million during the year ended December 31, 2023, compared to the year ended December 31, 2022, primarily due to increases in personnel costs and consulting fees.
Facility idling costs. Facility idling costs are related to care and maintenance of our Luverne Facility. Facility idling costs decreased by $0.6 million for the year ended December 31, 2023, compared to the year ended December 31, 2022, primarily due to one-time charges recorded during 2022 related to removing flammable and other hazardous items from the site, writing off certain patents, and reduction in the workforce.
Impairment loss. No impairment loss was recorded during the year ended December 31, 2023. During the year ended December 31, 2022, the Company recorded a $24.7 million impairment loss on long-lived assets, which reduced the carrying value of certain property, plant, and equipment, and a leased right of use asset, at the Agri-Energy segment to its fair value. The impairments recorded relate to the determination to suspend production at the Luverne Facility and shift the plant into an idled, care and maintenance status during the third quarter of 2022. The impact of the one-time impairment charge of $24.7 million was $0.11 of basic and diluted impairment loss per share for the year ended December 31, 2022. See Note 4 to the Consolidated Financial Statements for additional information.
Loss on disposal of assets. The Company did not record a loss on disposal of assets for the year ended December 31, 2023. As a result of suspending the production of ethanol at the Luverne Facility, we wrote-off $0.5 million of costs during the year ended December 31, 2022, related to ancillary equipment and spare parts that are no longer expected to be utilized at the Luverne Facility. The equipment and spare parts had been planned to be used in ethanol production.
Loss from operations. The Company’s loss from operations decreased by $20.9 million during the year ended December 31, 2023, compared to the year ended December 31, 2022, primarily due to increased revenue from RNG operations and LG Chem licensing in 2023, as well as the prior year impairment loss, partially offset by the increase in costs for our Net-Zero, Verity, and USDA Climate-Smart Grant projects.
Interest expense. Interest expense increased by $1.0 million during the year ended December 31, 2023, compared to the year ended December 31, 2022, primarily due to the interest on the 2021 Bonds, which was capitalized into construction in process during the construction phase of our RNG Project in the prior periods.
Interest and investment income. Interest and investment income increased $15.6 million during the year ended December 31, 2023, compared to the year ended December 31, 2022, primarily due to an increase in interest earned on our cash equivalent investments as a result of higher interest rates.
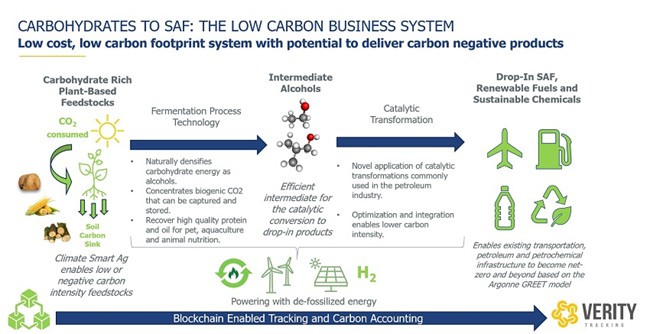
49
Other income. Other income decreased $3.7 million during the year ended December 31, 2023, compared to the year ended December 31, 2022, primarily due to the receipt of $0.4 million from the USDA's Biofuel Producer Program in 2023 compared to $2.9 million in 2022. In addition, our termination of the expediting procurement agreement with a local utility resulted in a one-time charge of $1.6 million in 2023.
Sources of Our Revenues
Our current and historic revenues are primarily derived from: (i) the sale of RNG commodities and the related environmental attributes; (ii) licensing and development sales; (iii) hydrocarbon sales consisting primarily of the sale of isooctane derived from our isobutanol and SAF; and (iv) the sale of isobutanol and related products.
Principal Components of Our Cost Structure
Cost of Production. Our cost of production consists primarily of costs directly associated with the production of RNG and other renewable hydrocarbon products, including isobutanol, SAF, and isooctane. Such costs include direct materials, direct labor, other operating costs and certain plant overhead costs. Direct materials include feedstock, denaturant and process chemicals. Direct labor includes compensation (including stock-based compensation) of personnel directly involved in production operations. Other operating costs include utilities and natural gas and wind power usage.
Research and Development. Our research and development expense consists of costs incurred to identify, develop and test our technologies for the production of renewable hydrocarbon products and the development of downstream applications thereof. Research and development expense includes personnel costs (including stock-based compensation), consultants and related contract research, facility costs, supplies, license fees paid to third parties for use of their intellectual property and patent rights and other overhead expenses incurred to support our research and development programs.
General and Administrative. General and administrative expense consists of personnel costs (including stock-based compensation), consulting and service provider expenses (including patent counsel-related costs), legal fees, marketing costs, insurance costs, occupancy-related costs, travel and relocation expenses and hiring expenses. Our corporate personnel, consisting of subject matter experts, including chemists, engineers, and sustainability experts, dedicate the majority of their time and efforts for the development of our growth projects. Costs incurred have not yet been allocated to the specific growth projects on the face of our financial statements.
Project Development Costs. Project development costs consist of consulting, preliminary engineering costs, personnel expenses (including stock-based compensation) and research and development expenses to support the business activities of our Net-Zero Projects.
Depreciation and Amortization. Depreciation and amortization relates to property, plant and equipment associated with the production of RNG and other renewable hydrocarbon products, including isobutanol, SAF, and isooctane, as well as that used in product development.
Liquidity and Capital Resources
As of December 31, 2023, we had cash and cash equivalents of $298.3 million and current restricted cash of $77.3 million, totaling $375.6 million in cash, cash equivalents, and restricted cash. As of December 31, 2023, we had net working capital of $295.0 million, with $91.4 million of current liabilities. Our cash equivalents primarily consist of investments in U.S. government money market funds. We expect to use our cash, cash equivalents, and restricted cash for the following purposes: (i) identification, development, engineering, licensing, acquisition and construction of production facilities and the Company’s other Net-Zero Projects; (ii) potential investment in RNG projects; (iii) potential development of the Luverne Facility; (iv) operating activities at the Company’s corporate headquarters in Colorado, including research and development work; (v) exploration of strategic alternatives and additional financing, including project financing; and (vi) future debt service obligations. We believe as a result of our cash and cash equivalents balances, and the performance of our current and expected operations, we will be able to meet our obligations and other potential cash requirements during the next 12 months from the date of this report.
50
Since our inception in 2005, we have devoted most of our cash resources to the development and commercialization of routes to efficiently produce fuels and chemicals from carbohydrates, such as renewable feedstock, using alcohols (isobutanol and ethanol) as intermediates. We have incurred losses since inception, have a significant accumulated deficit, and expect to incur losses for the foreseeable future. Historically we have financed our operations primarily with proceeds from the issuance of equity, warrants, debt securities, and borrowings under debt facilities. Our current sources of cash include sales of RNG, environmental attributes, and licensing fees. We may also fund future operations through additional private and/or public offerings of equity or debt securities. In addition, we may seek additional capital, on acceptable terms, through arrangements with strategic partners or from other sources. Notwithstanding, there can be no assurance that we will be able to raise additional funds or achieve or sustain profitability or positive cash flows from operations.
Our transition to profitability is dependent upon, among other things, the successful development and commercialization of our product candidates, the development, licensing, acquisition and construction of commercial level production facilities to support our offtake agreements, the achievement of a level of revenues adequate to support the Company’s cost structure, and the ability to raise capital to finance the development, licensing, acquisition, and construction of additional productions facilities.
The following table sets forth the major sources and uses of cash for each of the periods set forth below (in thousands):
Year Ended December 31, | ||||||
| 2023 |
| 2022 | |||
Net cash used in operating activities |
| $ | (53,719) |
| $ | (44,311) |
Net cash provided by investing activities | $ | 114,129 | $ | 85,092 | ||
Net cash (used in) provided by financing activities | $ | (189) | $ | 138,562 |
Operating Activities
Our primary uses of cash from operating activities are personnel-related expenses, and research and development-related expenses, including costs incurred under development agreements, costs of licensing of technology, legal-related costs, expenses for the development and commercialization of routes to efficiently produce fuels and chemicals from renewable feedstock carbohydrates using alcohols (isobutanol and ethanol) as an intermediate.
During the year ended December 31, 2023, net cash used in operating activities was $53.7 million compared to $44.3 million for the year ended December 31, 2022. Non-cash charges primarily consisted of depreciation and amortization of $19.0 million, stock-based compensation expense of $17.1 million, which reflects higher amortization expense for the stock awards issued in the prior period with higher market value, see Note 16 to the Consolidated Financial Statements for additional information, and non-cash expense of $0.1 million related to the amortization of marketable securities premiums. The net cash outflow from changes in operating assets and liabilities increased $23.9 million, primarily due to an increase in cash outflows of $23.0 million related to prepaid expenses and other current assets, deposits and other assets, $2.6 million related to increases in accounts receivable as well as $0.9 million related to accounts payable and accrued liabilities. These were partially offset by $2.7 million of decreased costs associated with the sale of environmental attribute inventory.
Investing Activities
During the year ended December 31, 2023, we had $114.1 million in cash provided by investing activities, of which $168.6 million related to proceeds from sales and maturities of marketable securities, partially offset by $54.5 million of investments in our capital projects, including $28.2 million in NZ1, $6.4 million in the RNG Project, and $19.9 million in other projects.
51
We completed the value engineering on our NZ1 project and are proceeding with detailed engineering, modularization design, and capital costs updates. We are currently refining project cost estimates with engineering, procurement, and construction (“EPC”) partners to identify cost saving opportunities, and currently expect to finance the construction of NZ1 at the subsidiary level using a combination of Company equity and third-party capital, to include non-recourse debt. The Company expects to have invested a cumulative total of $236 to $286 million of cash equity in the project at financial close. Cash distributions from future NZ1 earnings would be proportionate to Gevo’s ownership in NZ1 under this expected financing structure. The use of project debt and third party equity allows us to conserve capital for use on other growth projects. We expect to apply similar development and financing strategies to future Net-Zero Projects to enable growth of SAF production to meet demand for SAF.
In 2022, we allocated approximately $25.0 million to develop our next Net-Zero Project, of which we have spent approximately $15.0 million. Gevo is in the process of identifying and performing early site development work for additional Net-Zero production locations. These potential sites include greenfield and brownfield (i.e., at an existing ethanol plant) locations that are advantageous in terms of potential economics, opportunities to decarbonize, and time to market.
During the year ended December 31, 2022, we had $85.1 million in cash provided by investing activities, of which $299.6 million related to proceeds from sales and maturities of marketable securities, partially offset by the reinvestment of $130.4 million in marketable securities, and $84.1 million of investments in our capital projects, including $34.7 million in the RNG Project, $43.3 million in NZ1 and $2.0 million in other Net-Zero Projects, as well as $4.1 million in other isobutanol related projects.
Financing Activities
During the year ended December 31, 2023, we had $0.2 million of net cash used in financing activities, due to payments for equipment loans and finance lease liabilities.
We currently expect to finance the construction of NZ1 at the subsidiary level using a combination of our own, third-party, and debt capital. The Company expects to retain an equity interest in the project and may invest equity in the project using the proceeds from the reimbursement of the Company’s NZ1 development expenditures. Cash distributions from future NZ1 earnings would be proportionate to Gevo’s ownership in NZ1 under this expected financing structure which would allow us to conserve and redeploy our capital on other growth projects, including our Net-Zero 2 project (“NZ2”). We expect to apply similar development and financing strategies to NZ2 and future Net-Zero Projects to enable growth of SAF production to meet demand for SAF.
During the year ended December 31, 2022, we had $138.6 million of net cash provided by financing activities, primarily due to $139.0 million of net proceeds from the issuance of common stock and common stock warrants in a registered direct offering in June 2022, offset by $0.4 million of payments primarily for net settlement of common stock under stock plans and certain equipment loans.
Critical Accounting Estimates
Our Consolidated Financial Statements are based on the application of U.S. GAAP, which requires us to make estimates and assumptions about future events that affect the amounts reported in our Consolidated Financial Statements and the accompanying notes. Future events and their effects cannot be determined with certainty; therefore, the determination of estimates requires the exercise of judgment. We believe our judgments related to these accounting estimates are appropriate. However, if different assumptions or conditions were to prevail, the results could be materially different from the amounts recorded. We have determined that we have no critical accounting estimates material to our consolidated financial position, results of operations or cash flow related to our consolidated financial statements included in this Report.
Recent Accounting Pronouncements
See Note 2, Summary of Significant Accounting Policies, in Item 8. “Financial Statements and Supplemental Data,” of this Report, for a discussion of recent accounting pronouncements.
52
Item 7A.Quantitative and Qualitative Disclosures about Market Risk
We are exposed to market risks related to environmental attribute pricing, commodity pricing, interest rate, credit risk with our contract counterparties, and equity price risks. We currently have no foreign exchange risk and do not use derivative financial instruments as part of an overall strategy to manage market risk; however, we may consider such arrangements in the future as we evaluate our business and financial strategy.
Environmental Attribute and Commodity Pricing Risk
We attempt to negotiate the best prices for our environmental attributes and to competitively price our products to reflect the fluctuations in market prices. Reductions in the market prices of environmental attributes may have a material adverse effect on our revenues and profits as they directly reduce our revenues. We have prepared a sensitivity analysis to estimate our exposure to market risk with respect to RIN and LCFS prices. Our analysis, which may differ from actual results, based on our actual 2023 RINs and LCFS sold of approximately $2.08 and $64.79 respectively. The estimated annual impact of a hypothetical 10% decrease in the average realized price per RIN and per LCFS credit would have a negative effect on our operating profit of approximately $1.0 million and $0.5 million, respectively.
The price of RNG changes in relation to the market prices of wholesale gas. Pricing for wholesale gas is volatile and we expect this volatility to continue in the future. Further, volatility of wholesale gas also creates volatility in the prices of environmental attributes. We have prepared a sensitivity analysis to estimate our exposure to market risk with respect to the market price of wholesale gas. Our analysis. which may differ from actual results, was based on our actual 2023 gas production sold pursuant to contracts that do not provide for a fixed or floor price of approximately $2.10/MMBtu. The estimated annual impact of a hypothetical 10% decrease in the market price of wholesale gas would not have a material impact on our financial condition or results of operations.
Interest Rate Risk
We are exposed to market risk related to changes in interest rates. Our primary exposure to market risk is interest rate sensitivity, which is affected by changes in the general level of U.S. interest rates, particularly because our investments, including cash equivalents, are invested in U.S. treasury or government money market funds. Our analysis. which may differ from actual results, was based on our actual 2023 effective interest rate earned on our cash and cash equivalents. The estimated annual impact of a hypothetical 0.25% decrease in market interest rates would have a negative impact on our interest income of approximately $2.8 million.
We are exposed to further market risk related to changes in interest rates through our 2021 Bonds, see Footnote 15 to the Consolidated Financial Statements for additional information. Our analysis, which may differ from actual results, was based on the anticipated future interest rate that is expected to be entered into under the 2021 Bond remarketing under a Trust Indenture dated April 1, 2021 (the “Indenture”) between the Authority and Citibank, N.A. as trustee (the “Trustee”), which is expected to occur no later than April 1, 2024. We anticipate an increase in our interest rates to 4.5%, with a resulting negative impact on our annual interest expense of $2.0 million.
Credit Risk
We are subject to credit risk due to the concentration of our RNG receivables with a limited number of significant customers. This concentration increases our exposure to credit risk on our receivables, since the financial insolvency of these customers could have a significant impact on our results of operations.
Equity Price Risk
We have in the past, and may in the future, seek to acquire additional funding by sale of common stock and other equity. The price of our common stock has been volatile in the past and may also be volatile in the future. As a result, there is a risk that we may not be able to sell our common stock at an acceptable price should the need for new equity funding arise.
53
Item 8. | Financial Statements and Supplementary Data |
Index to Gevo, Inc. Consolidated Financial Statements
Page | |
Report of Independent Registered Public Accounting Firm (PCAOB ID Number | 55 |
57 | |
58 | |
59 | |
60 | |
61 | |
63 |
54
REPORT OF INDEPENDENT REGISTERED PUBLIC ACCOUNTING FIRM
Board of Directors and Stockholders
Gevo, Inc.
Opinion on the financial statements
We have audited the accompanying consolidated balance sheets of Gevo, Inc. (a Delaware corporation) and subsidiaries (the “Company”) as of December 31, 2023 and 2022, the related consolidated statements of operations, comprehensive income (loss), changes in stockholders’ equity, and cash flows for each of the two years in the period ended December 31, 2023, and the related notes (collectively referred to as the “financial statements”). In our opinion, the financial statements present fairly, in all material respects, the financial position of the Company as of December 31, 2023 and 2022, and the results of its operations and its cash flows for each of the two years in the period ended December 31, 2023, in conformity with accounting principles generally accepted in the United States of America.
Basis for opinion
These financial statements are the responsibility of the Company’s management. Our responsibility is to express an opinion on the Company’s financial statements based on our audits. We are a public accounting firm registered with the Public Company Accounting Oversight Board (United States) (“PCAOB”) and are required to be independent with respect to the Company in accordance with the U.S. federal securities laws and the applicable rules and regulations of the Securities and Exchange Commission and the PCAOB.
We conducted our audits in accordance with the standards of the PCAOB. Those standards require that we plan and perform the audit to obtain reasonable assurance about whether the financial statements are free of material misstatement, whether due to error or fraud. The Company is not required to have, nor were we engaged to perform, an audit of its internal control over financial reporting. As part of our audits we are required to obtain an understanding of internal control over financial reporting but not for the purpose of expressing an opinion on the effectiveness of the Company’s internal control over financial reporting. Accordingly, we express no such opinion.
Our audits included performing procedures to assess the risks of material misstatement of the financial statements, whether due to error or fraud, and performing procedures that respond to those risks. Such procedures included examining, on a test basis, evidence regarding the amounts and disclosures in the financial statements. Our audits also included evaluating the accounting principles used and significant estimates made by management, as well as evaluating the overall presentation of the financial statements. We believe that our audits provide a reasonable basis for our opinion.
Critical audit matter
The critical audit matter communicated below is a matter arising from the current period audit of the financial statements that was communicated or required to be communicated to the audit committee and that: (1) relates to accounts or disclosures that are material to the financial statements and (2) involved our especially challenging, subjective, or complex judgments. The communication of critical audit matters does not alter in any way our opinion on the financial statements, taken as a whole, and we are not, by communicating the critical audit matter below, providing a separate opinion on the critical audit matter or on the accounts or disclosures to which it relates.
Consolidation – Variable interest model
As described in Notes 2 and 22 to the consolidated financial statements, the Company enters into agreements with special purpose entities (“SPEs”), some of which are variable interest entities (“VIEs”). The Company consolidates a VIE if it is deemed to be the primary beneficiary. The Company determines it is the primary beneficiary if it has the power to direct the activities that most significantly impact the VIEs’ economic performance and has the obligation to absorb losses or has the right to receive benefits of the VIE that could potentially be significant to the VIE. During September 2022 and February 2023, the Company entered into agreements with Zero6 Energy Development, Inc. (“ZEDI”) to develop and construct facilities to provide carbon neutral power to their Net Zero 1 project via the two Project LLCs: Kingsbury County Wind Fuel, LLC and Dakota Renewable Hydrogen, LLC, respectively. In December
55
2023 the agreements with ZEDI related to the two Project LLCs were amended to remove certain kickout rights that previously existed. Each Project LLC is a VIE, and the Company holds an implicit variable interest in each Project LLC. As of December 2023, the Company has concluded that the removal of the kickout rights from the agreements has resulted in a loss of control and that, therefore, the Company is no longer the primary beneficiary of the Project LLCs. We identified the Company’s assessment of the primary beneficiary of the Project LLCs as a critical audit matter.
The principal considerations for our determination that performing procedures relating to the deconsolidation of the Project LLCs as VIEs is a critical audit matter are that (i) there is significant judgment by management when determining whether the Company is the primary beneficiary of the VIEs based on the purpose and design of the project LLCs and other legal rights of the parties, including the determination of which party has power to direct the activities that most significantly affect the economic performance of the VIE, as well as the substance of the arrangements, the right to receive potentially significant benefits, indicators if the parties in the arrangements were acting in the role of agents or de facto agents, and (ii) a high degree of auditor judgment, subjectivity and effort in performing procedures and evaluating audit evidence related to the purpose of each Project LLCs rights and obligations of the variable interest holders, mechanisms for the resolution of disputes among variable interest holders, and other agreements with the legal entity and its variable interest holders.
Our audit procedures related to the assessment of the primary beneficiary of the Project LLCs included the following, among others.
● | discussing with management the purpose and design of each VIE |
● | reading the operating agreements and other related legal documents to understand the rights of each party, including the ability to remove the entity that has the power to direct the activities of the VIE |
● | evaluating management’s analysis of significant activities of each VIE such as capital decisions, financing decisions and operating decisions, and which party, if any, has the power to direct such activities. In our evaluation, we considered the purpose and design of the Project LLCs and other legal rights of the parties, including the significance of the decision-making rights of each party in assessing which party has power to direct the activities that most significantly affect the economic performance of the VIE, as well as the substance of the arrangements. We also considered whether there were indicators that parties to the arrangements were acting in the role of agents or de facto agents. |
/s/
We have served as the Company’s auditor since 2015.
March 7, 2024
56
GEVO, INC.
CONSOLIDATED BALANCE SHEETS
(In thousands, except share and per share amounts)
| Note | December 31, 2023 |
| December 31, 2022 | ||||
Assets |
|
|
|
|
| |||
Current assets |
|
|
|
|
| |||
Cash and cash equivalents |
|
| $ | | $ | | ||
Marketable securities |
| 6 |
| — |
| | ||
Restricted cash |
| 7 |
| |
| | ||
Trade accounts receivable, net |
|
|
| |
| | ||
Inventories |
| 10 |
| |
| | ||
Prepaid expenses and other current assets |
| 8 |
| |
| | ||
Total current assets |
|
|
| |
| | ||
Property, plant and equipment, net |
| 11, 23 |
| |
| | ||
Restricted cash |
| 7 |
| — |
| | ||
Operating right-of-use assets |
| 9 |
| |
| | ||
Finance right-of-use assets |
| 9 |
| |
| | ||
Intangible assets, net |
| 12 |
| |
| | ||
Deposits and other assets |
| 13 |
| |
| | ||
Total assets |
| $ | | $ | | |||
Liabilities |
|
|
|
|
|
| ||
Current liabilities |
|
|
|
|
|
| ||
Accounts payable and accrued liabilities |
| 14, 23 | $ | | $ | | ||
Operating lease liabilities |
| 9 |
| |
| | ||
Finance lease liabilities |
| 9 |
| |
| | ||
Loans payable |
| 15 |
| |
| | ||
2021 Bonds payable, net | 15 | | | |||||
Total current liabilities |
|
|
| |
| | ||
2021 Bonds payable, net |
| 15 |
| — |
| | ||
Loans payable |
| 15 |
| |
| | ||
Operating lease liabilities |
| 9 |
| |
| | ||
Finance lease liabilities |
| 9 |
| |
| | ||
Other liabilities |
|
|
| — |
| | ||
Total liabilities |
|
|
| |
| | ||
Commitments and Contingencies |
| 19 |
|
|
|
| ||
Stockholders' Equity |
|
|
|
|
|
| ||
Common stock, $ |
|
|
| |
| | ||
Additional paid-in capital |
|
|
| |
| | ||
Accumulated other comprehensive loss |
|
|
| — |
| ( | ||
Accumulated deficit |
|
|
| ( |
| ( | ||
Total stockholders' equity |
|
|
| |
| | ||
Total liabilities and stockholders' equity |
|
| $ | | $ | |
See the accompanying Notes to the Consolidated Financial Statements.
57
GEVO, INC.
CONSOLIDATED STATEMENTS OF OPERATIONS
(In thousands, except share and per share amounts)
|
| Year Ended December 31, | ||||||
| Note |
| 2023 |
| 2022 | |||
Total operating revenues |
| 3, 23 | $ | | $ | | ||
Operating expenses: |
|
|
|
|
|
| ||
Cost of production |
| 16 |
| |
| | ||
Depreciation and amortization |
| 11, 12 |
| |
| | ||
Research and development expense |
| 16 |
| |
| | ||
General and administrative expense | | | ||||||
Project development costs |
| 16 |
| |
| | ||
Facility idling costs |
|
| |
| | |||
Impairment loss |
| 4 |
| |
| | ||
Loss on disposal of assets |
| 11, 12 |
| — |
| | ||
Total operating expenses |
| 16 |
| |
| | ||
Loss from operations |
|
| ( |
| ( | |||
Other income (expense) |
|
|
|
|
|
| ||
Interest expense |
|
|
| ( |
| ( | ||
Interest and investment income |
| 6, 7, 20 |
| |
| | ||
Other income (expense), net |
|
|
| ( |
| | ||
Total other income, net |
|
|
| |
| | ||
Net loss |
|
| $ | ( | $ | ( | ||
Net loss per share - basic and diluted |
| 5 | ( | ( | ||||
Weighted-average number of common shares outstanding - basic and diluted |
| 5 |
| |
| |
See the accompanying Notes to the Consolidated Financial Statements.
58
GEVO, INC.
CONSOLIDATED STATEMENTS OF COMPREHENSIVE INCOME (LOSS)
(in thousands)
Year Ended December 31, | ||||||||
| Note |
| 2023 |
| 2022 | |||
Net loss |
|
| $ | ( | $ | ( | ||
Other comprehensive income (loss): |
|
| ||||||
Unrealized gain (loss) on available-for-sale securities | 6 |
| |
| ( | |||
Comprehensive loss |
| $ | ( | $ | ( |
See the accompanying Notes to the Consolidated Financial Statements.
59
GEVO, INC.
CONSOLIDATED STATEMENTS OF STOCKHOLDERS’ EQUITY
(In thousands, except share amounts)
Common Stock | Accumulated Other | Accumulated | Stockholders’ | ||||||||||||||||
| Note |
| Shares |
| Amount |
| Paid-In Capital |
| Comprehensive Loss |
| Deficit |
| Equity | ||||||
Balance, December 31, 2021 |
|
|
| |
| $ | |
| $ | |
| $ | ( |
| $ | ( |
| $ | |
Issuance of common stock and common stock warrants, net of issuance costs |
| 21 |
| |
| |
| |
| — |
| — |
| | |||||
Issuance of common stock upon exercise of warrants |
| 21 |
| |
| — |
| |
| — |
| — |
| | |||||
Non-cash stock-based compensation |
| 16 |
| — |
| — |
| |
| — |
| — |
| | |||||
Stock-based awards and related share issuances, net |
| 21 |
| |
| |
| |
| — |
| — |
| | |||||
Other comprehensive loss |
|
|
| — |
| — |
| — |
| ( |
| — |
| ( | |||||
Net loss |
|
|
| — |
| — |
| — |
| — |
| ( |
| ( | |||||
Balance, December 31, 2022 |
|
|
| | $ | | $ | | $ | ( | $ | ( | $ | | |||||
Non-cash stock-based compensation |
| 16 |
| — |
| — |
| |
| — |
| — |
| | |||||
Stock-based awards and related share issuances, net |
| 21 |
| |
| |
| ( |
| — |
| — |
| — | |||||
Other comprehensive income |
|
|
| — |
| — |
| — |
| |
| — |
| | |||||
Net loss |
|
|
| — |
| — |
| — |
| — |
| ( |
| ( | |||||
Balance, December 31, 2023 |
|
|
| | $ | | $ | | $ | — | $ | ( | $ | |
See the accompanying Notes to the Consolidated Financial Statements.
60
GEVO, INC.
CONSOLIDATED STATEMENTS OF CASH FLOWS
(In thousands)
Year Ended December 31, | ||||||||
| Note | 2023 |
| 2022 | ||||
Operating Activities |
|
|
|
|
| |||
Net loss |
|
| $ | ( | $ | ( | ||
Adjustments to reconcile net loss to net cash used in operating activities: |
|
|
|
|
|
| ||
Impairment loss |
| 4 |
| |
| | ||
Loss on disposal of assets |
| 23 |
| — |
| | ||
Stock-based compensation |
| 16 |
| |
| | ||
Depreciation and amortization |
| 11, 12 |
| |
| | ||
Amortization of marketable securities (discount) premium |
| 6 |
| ( |
| | ||
Other noncash expense (income) |
|
|
| |
| | ||
Changes in operating assets and liabilities: |
|
|
| |||||
Accounts receivable |
|
|
| ( |
| | ||
Inventories |
| 10 |
| |
| ( | ||
Prepaid expenses and other current assets, deposits and other assets |
| 8, 13 |
| ( |
| ( | ||
Accounts payable, accrued expenses and non-current liabilities |
| 14 |
| |
| | ||
Net cash used in operating activities |
|
|
| ( |
| ( | ||
Investing Activities |
|
|
|
|
|
| ||
Acquisitions of property, plant and equipment |
| 11, 23 |
| ( |
| ( | ||
Acquisition of patent portfolio |
| 12 |
| — |
| ( | ||
Proceeds from maturity of marketable securities |
| 6 |
| |
| | ||
Purchase of marketable securities |
| 6 |
| — |
| ( | ||
Proceeds from sale of property, plant and equipment | 11 | | — | |||||
Net cash provided by investing activities |
|
|
| |
| | ||
Financing Activities |
|
|
|
|
|
| ||
Debt and equity offering costs |
| 21 |
| — |
| ( | ||
Proceeds from issuance of common stock and common stock warrants |
| 21 |
| — |
| | ||
Proceeds from exercise of warrants |
| 21 |
| — |
| | ||
Net settlement of common stock under stock plans |
| 16 |
| — |
| ( | ||
Payment of loans payable |
| 15 |
| ( |
| ( | ||
Payment of finance lease liabilities |
| 9 |
| ( |
| ( | ||
Net cash (used in) provided by financing activities |
|
|
| ( |
| | ||
Net increase in cash and cash equivalents |
|
|
| |
| | ||
Cash, cash equivalents and restricted cash at beginning of period |
|
|
| |
| | ||
Cash, cash equivalents and restricted cash at end of period |
|
| $ | | $ | |
See the accompanying Notes to the Consolidated Financial Statements.
61
GEVO, INC.
CONSOLIDATED STATEMENTS OF CASH FLOWS—(Continued)
(In thousands)
Year Ended December 31, | ||||||
Schedule of cash, cash equivalents and restricted cash | 2023 |
| 2022 | |||
Cash and cash equivalents | $ | | $ | | ||
Restricted cash (current) |
| |
| | ||
Restricted cash (non-current) |
| — |
| | ||
Total cash, cash equivalents and restricted cash | $ | | $ | |
Year Ended December 31, | ||||||
Supplemental disclosures of cash and non-cash investing and financing transactions | 2023 |
| 2022 | |||
Cash paid for interest, net of amounts capitalized | $ | | $ | | ||
Non-cash purchase of property, plant and equipment |
| |
| | ||
Right-of-use asset purchased with operating lease |
| |
| — |
See the accompanying Notes to the Consolidated Financial Statements.
62
1. Nature of Business, Financial Condition and Basis of Presentation
Nature of business. Gevo, Inc. (Nasdaq: GEVO) (“Gevo”, “we”, “us”, “our”, or the “Company,” which, unless otherwise indicated, refers to Gevo, Inc. and its subsidiaries), a Delaware corporation founded in 2005, is a growth-oriented, carbon abatement company with the mission of solving greenhouse gas (“GHG”) emissions for those sectors of the transportation industry that are not amenable to electrification or hydrogen.
The Company is focused on transforming renewable energy into energy-dense liquid drop-in hydrocarbons that can be used as renewable fuels, such as sustainable aviation fuel (“SAF”) and other fuels and chemicals, with the potential to achieve a “net-zero” GHG, or even carbon negative footprint measured by the Argonne National Laboratory’s GREET (Greenhouse gases, Regulated Emissions, and Energy use in Transportation) model (the “GREET Model”) to measure, predict and verify GHG emissions across the life-cycle. Our “net-zero” concept means production of drop-in hydrocarbon fuels by using sustainably grown feedstocks (e.g., low till, no-till and dry corn cultivation), renewable and substantially decarbonized energy sources, resulting in a net-zero carbon footprint from the full life cycle of the fuel measured from the capture of renewable carbon through the burning of the fuel.
Gevo’s primary market focus, given current demand and growing customer interest, is SAF. The Company believes that SAF from carbohydrates to alcohol is the most economically viable approach for carbon abatement. The Company also has commercial opportunities for other renewable hydrocarbon products, such as (i) renewable natural gas, also known as biogas (“RNG”), (ii) hydrocarbons for gasoline blendstocks and diesel fuel, and (iii) plastics, materials and other chemicals. We are engaged in technology, process and intellectual property development targeted to large scale deployment of net-zero hydrocarbon fuels and chemicals. We are developing the marketplace and customers for SAF and other related products. We also are engaged as a developer and enabler/licensor for large scale commercial production, and we expect to be a co-investor on certain projects. Gevo’s business model is that of a developer of projects, a licensor, process technology developer, and operator of certain assets in the future.
Net-Zero Projects
In early 2021, we announced our proprietary “Net-Zero Projects” that we developed and engineered as a series of planned facilities to produce energy dense liquid hydrocarbons using renewable energy and our proprietary technology. Our Net-Zero Projects will convert renewable energy (e.g., photosynthetic, wind, RNG) from a variety of sources into energy dense liquid hydrocarbons that, when burned in traditional engines, has the potential to achieve net-zero GHG emissions across the whole lifecycle of the liquid fuel: from the way carbon is captured from the atmosphere, processed to make liquid fuel products, and burned as a fuel for planes, cars, trucks, and ships. Gevo has engineered, developed, and owns our Net-Zero plant designs, and the overall Gevo Net-Zero process (i.e., the process to enable carbon-negative olefins, and hydrocarbon fuels with an anticipated net-zero or better carbon footprint measured across the lifecycle of the whole processes). The proprietary Gevo Net-Zero processes and plant designs are based upon the conversion of carbohydrates to alcohols, then the conversion of the alcohols to olefins (i.e., building blocks for chemicals, plastics, and fuels), and then the conversion of the olefins into fuels, all optimized and integrated to achieve a net-zero carbon footprint. In the fermentation section of our plant design, we work with Fluid Quip Technologies, LLC and PRAJ Industries Limited (“PRAJ”), as well as other suppliers of unit operations, and using Axens North America, Inc. (“Axens”) as the unit operation technology supplier for producing olefins and fuels. Gevo has developed and owns the overall proprietary plant designs, engineering details, integration technologies, and has filed patents on several process improvements.
In November 2021, Gevo entered into an agreement to exclusively utilize Axens’ technology for isobutanol conversion into hydrocarbons. In February of 2022, Gevo and Axens entered into a second exclusive agreement to specifically cover the process steps for ethanol to finished jet fuel.
63
Our initial Net-Zero Project, Net-Zero 1 (“NZ1”), is expected to be located in Lake Preston, South Dakota, and is being currently designed to produce approximately
We also are developing other commercial production projects for SAF at other locations in the United States where we expect to use our Net-Zero plant designs based on work done for NZ1 at Lake Preston. Gevo expects to play the role of project developer, plant design and technology licensor, and investor, based on traditional developer business models where the developer gets a partial ownership stake for developing the project. We may also co-invest in projects to increase our equity ownership in those projects.
Renewable Natural Gas Project
Gevo’s RNG facilities in Northwest Iowa (“NW Iowa RNG”) are owned by Gevo NW Iowa RNG, LLC, and produces RNG captured from dairy cow manure supplied by
Luverne Facility
Gevo’s development plant in Luverne, Minnesota (the “Luverne Facility”), recorded in the Agri-Energy segment, was originally constructed in 1998 and is located on approximately
Financial Condition. The Company has incurred consolidated net losses since inception and had a significant accumulated deficit as of December 31, 2023. The Company’s cash and cash equivalents totaled $
2. Summary of Significant Accounting Policies
Principles of Consolidation. The Consolidated Financial Statements of Gevo include the accounts of its wholly owned subsidiaries. All intercompany balances and transactions have been eliminated in consolidation.
Basis of Presentation. The Consolidated Financial Statements of the Company (which include the accounts of its wholly-owned subsidiaries Gevo Asset, LLC, Gevo RNG Holdco, LLC, Gevo NW Iowa RNG, LLC, Gevo Net-Zero HoldCo, LLC, Gevo Net-Zero 1, LLC, Gevo Net-Zero Operations, LLC, Gevo Net-Zero Asset Management, LLC, and Agri-Energy, LLC) have been prepared pursuant to the rules and regulations of the U.S. Securities and Exchange Commission (the “SEC”) and accounting principles generally accepted in the U.S. (“U.S. GAAP”) for complete financial statements. These statements reflect all normal and recurring adjustments which, in the opinion of management, are necessary to present fairly the financial position, results of operations and cash flows of the Company at December 31, 2023.
64
Reclassifications. The Company reclassified certain prior period amounts to conform to the current period presentation. The reclassifications included the categorization of depreciation and amortization on the Consolidated Statements of Operations and had no impact on total revenues, total operating expenses, net loss or stockholders’ equity for any period.
Use of Estimates. The preparation of consolidated financial statements in conformity with U.S. GAAP requires management to make estimates and assumptions that affect the reported amounts of assets and liabilities and disclosure of contingent assets and liabilities at the date of the financial statements and the reported amounts of revenues and expenses during the reporting period. Actual results could differ materially from those estimates.
Concentrations of Credit Risk and Major Customers. The Company’s financial instruments that are exposed to concentrations of credit risk consist of cash and cash equivalents in excess of the federally insured limits. The Company’s cash and cash equivalents are deposited with high credit-quality financial institutions and are primarily in demand deposit accounts and money market funds. As of December 31, 2023, and 2022,
Cash, Cash Equivalents and Restricted Cash. The Company maintains its cash and cash equivalents in highly liquid interest-bearing money market accounts or non-interest-bearing demand accounts. The Company considers all highly liquid investments purchased with a maturity of three months or less at the date of acquisition to be cash equivalents. Restricted cash is classified as current or non-current based on the terms of the underlying agreements and represents cash held as deposits and cash collateral for financial letters of credit.
Marketable Securities. The Company’s marketable securities consist of marketable debt securities and have been classified and accounted for as available-for-sale. Management determines the appropriate classification of its investments at the time of purchase and reevaluates the classifications at each balance sheet date. The Company classifies its marketable securities as either short-term or long-term based on each instrument’s underlying contractual maturity date. Marketable securities with maturities of 12 months or less are classified as short-term and marketable securities with maturities greater than 12 months are classified as long-term. The Company’s marketable securities are carried at fair value, with unrealized gains and losses, net of taxes, reported as a component of accumulated other comprehensive loss in shareholders’ equity, with the exception of unrealized losses believed to be other-than-temporary, which are reported in earnings in the current period.
Trade Accounts Receivable, net. The Company records receivables for products shipped but for which payment has not yet been received. In evaluating its allowance for doubtful accounts for accounts receivable, the Company performs ongoing reviews of its outstanding receivables to determine if any amounts are uncollectible and adjusts the allowance for doubtful accounts accordingly.
Inventories. Inventory is recorded at net realizable value. Isobutanol and ethanol inventory cost consists of the applicable share of raw material, direct labor and manufacturing overhead. Work in process inventory includes unfinished SAF, isooctane and isooctene inventory. Spare Parts inventory consists of the parts required to maintain and operate the Company’s Luverne Facility and is recorded at cost. For each reporting period, the Company reviews the value of inventories on hand to estimate the recoverability through future sales. The Company reduces its inventories with adjustments for lower of cost or net realizable value, with cost determined by the average cost method.
65
Environmental Attribute Inventory. The Company generates D3 Renewable Identification Numbers (“RINs”) and Low Carbon Fuel Standard (“LCFS”) credits (collectively, “environmental attributes”) through the production of RNG used for transportation purposes as prescribed under the Renewable Fuels Standard program (“RFS”). Environmental attribute inventory is included as a component of “Inventories” on the Consolidated Balance Sheets. The Company considers environmental attributes to be a distinguishable product that is generated as an integral component of the production process of RNG as the environmental attributes that are generated can be separated from the underlying commodity and may be sold independently from the RNG produced. As such, the Company considers environmental attributes to be a co-product of the production of RNG and accordingly allocates the costs of production based on the relative sales value of all revenue items for the NW Iowa RNG operations. The value of the environmental attributes is reviewed for potential write-downs based on the net realizable value methodology. Revenue is recognized on these environmental attributes when there is an agreement in place to monetize the credits at an agreed upon price with a customer based upon defined third party market prices and a transfer of control has occurred.
Property, Plant and Equipment. Property, plant and equipment are recorded at cost less accumulated depreciation and amortization. Leasehold improvements are amortized over the term of the lease agreement or the service lives of the improvements, whichever is shorter. Assets under construction are depreciated when they are placed into service. Maintenance and repairs are charged to expense as incurred and expenditures for major improvements are capitalized.
Construction in Progress. Construction in progress represents expenditures necessary to bring an asset, project, new facilities or equipment to the condition and location necessary for its intended use and are capitalized and recorded at cost. Once completed and ready for its intended use, the asset is transferred to property, plant and equipment to be depreciated or amortized.
Depreciation and Amortization. Capitalized costs are depreciated or amortized using the straight-line method at rates sufficient to depreciate such costs over the shorter of estimated productive lives of such assets or the useful life of the individual assets. The estimates of productive lives may change, possibly in the near term, resulting in changes to depreciation and amortization rates in future reporting periods.
Impairment of Long-Lived Assets. The Company evaluates the recoverability of the recorded amount of long-lived assets, including property, plant and equipment, licenses, patents, operating lease right-of-use assets, and finance lease right-of-use assets when events or changes in circumstances indicate that their carrying amount may not be recoverable. The carrying amount of a long-lived asset is considered to be impaired if it exceeds the sum of the undiscounted cash flows expected to result from the use and eventual disposition of the assets. If the Company determines that an asset is impaired, it measures the impairment to be recognized as the amount by which the recorded amount of the asset exceeds its fair value. A summary of impairment losses on tangible and intangible assets for the years ended December 31, 2023, and 2022, is included in Note 4, Asset Impairment.
Leases, Right-of-Use Assets and Related Liabilities. The Company enters into various arrangements which constitute a lease as defined by Accounting Standards Codification (“ASC”) 842, Leases, as part of its ongoing business activities and operations. Leases represent a contract or part of a contract that conveys the right to control the use of identified property, plant or equipment (an identified asset) for a period of time in exchange for consideration. Such contracts result in both (a) right-of-use assets, which represent the Company’s right to use an underlying asset for the term of the contract; and (b) a corresponding lease liability which represents the Company’s obligation to make the lease payments arising from the contract. The Company has elected not to recognize a right-of-use asset and lease liability for any lease with an original lease term of 12 months or less. Lease expense for such leases is recognized on a straight-line basis over the lease term.
66
A lease is classified as a finance lease when one or more of the following criteria are met: (i) the lease transfers ownership of the asset by the end of the lease term, (ii) the lease contains an option to purchase the asset that is reasonably certain to be exercised, (iii) the lease term is for a major part of the remaining useful life of the asset, (iv) the present value of the lease payments equals or exceeds substantially all of the fair value of the asset, or (v) the asset is of such a specialized nature that it is expected to have no alternative use to the lessor at the end of the lease term. If a lease does not meet any of these criteria, the lease is classified as an operating lease.
Lease liabilities are initially measured at the lease commencement date based on the present value of lease payments over the lease term, discounted using an estimate of the Company’s incremental borrowing rate for a collateralized loan with the same term and payment as the lease. Right-of-use assets are measured based on the amount of the lease liability adjusted for any lease payments made to the lessor at or before the lease commencement date less any lease incentives received. All right-of-use assets are evaluated for impairment in accordance with accounting standards applicable to long-lived assets.
Renewal options are included in the calculation of our right-of-use assets and lease liabilities when the Company determines that the option is reasonably certain of exercise based on an analysis of the relevant facts and circumstances. Certain of the Company’s leases require variable lease payments that do not depend on an index or rate and such payments are excluded from the calculation of the right-of-use asset and lease liability and are recognized as variable lease cost when incurred.
Lease cost for operating leases consists of the fixed lease payments recognized on a straight-line basis over the lease term plus variable lease payments as incurred. Lease cost for finance leases consists of amortization of the right-of-use assets on a straight-line basis over the lease term, interest expense on the lease liability and variable lease payments as incurred.
The Company has elected the practical expedient to account for the lease and non-lease components as a single lease component for its corporate office lease asset class.
Intangible assets. Intangible assets consist of patents. Costs related to patents, including legal fees, are capitalized and amortized over the estimated useful lives using the straight-line method. Amortization expense is recorded in “Depreciation and amortization” in the Operating expenses section of the Consolidated Statements of Operations. For patents purchased in an asset acquisition, the useful life is determined by valuation estimates of remaining economic life. The patents are included in “Intangible assets, net” on the Consolidated Balance Sheets. The Company periodically evaluates the amortization period and carrying value of its patents to determine whether any events or circumstances warrant revised estimated useful life or reduction in value.
Borrowing Costs. The borrowing costs that are directly attributable to the acquisition and construction of an asset that needs a substantially long period of time for its intended use to begin are capitalized and recorded as part of the cost of the asset when expenditures for the asset and borrowing costs have been incurred, and the activities relating to the acquisition and construction that are necessary to prepare the asset for its intended use have commenced. The capitalization of borrowing costs ceases when the asset under acquisition or construction becomes ready for its intended use and the borrowing costs incurred thereafter are recognized in profit or loss for the current period. The capitalization of borrowing costs is suspended during periods in which the acquisition or construction of an asset is interrupted abnormally and the interruption lasts for more than three months, until the acquisition or construction is resumed.
Debt Issuance Costs and Debt Discounts/Premiums. Debt issuance costs are costs with third parties incurred in connection with the Company’s debt financings that have been capitalized and are being amortized over the stated maturity period or estimated life of the related debt using the effective interest method. Debt issuance costs are presented as a direct reduction of the carrying amount of the related debt. Debt discounts, including fees paid to lenders, and debt premiums are amortized over the life of the related debt using the effective interest method. Debt discounts and premiums are presented as a reduction and increase, respectively, in the carrying amount of the related debt. Amortization of debt issuance costs, discounts and premiums is included in interest expense.
67
Warrants. Warrants are classified as a component of permanent equity when they are freestanding financial instruments that are legally detachable and separately exercisable from the shares of common stock with which they were issued, are immediately exercisable, do not embody an obligation for the Company to repurchase its shares, permit the holders to receive a fixed number of shares of common stock upon exercise and do not provide any guarantee of value or return.
Variable Interest Entities. The Company enters into agreements with special purpose entities (“SPEs”), some of which are variable interest entities (“VIEs”), in the ordinary course of business. A legal entity is considered a VIE if it has either a total equity investment that is insufficient to finance its operations without additional subordinated financial support or whose equity holders lack the characteristics of a controlling financial interest. The Company’s variable interests arise from contractual or other monetary interests in the entity. The typical condition for a controlling financial interest ownership is holding a majority of the voting interests of an entity; however, a controlling financial interest may also exist in entities, such as VIEs, through arrangements that do not involve controlling voting interests.
The Company consolidates a VIE if it is deemed to be the primary beneficiary. The Company determines it is the primary beneficiary if it has the power to direct the activities that most significantly impact the VIEs’ economic performance and has the obligation to absorb losses or has the right to receive benefits of the VIE that could potentially be significant to the VIE. The Company evaluates its relationships with its VIEs on an ongoing basis to determine whether it is the primary beneficiary. See Footnote 22 below for further information.
Revenue Recognition. The Company recognizes revenue in accordance with ASC 606, Revenue from Contracts with Customers (“ASC 606”). Revenue from the Company’s point in time product sales is recognized when products are transferred, or services are invoiced and control transferred. The Company has presented the disclosures required by ASC 606, see Note 3, Revenues from contracts with customers and other revenues.
Cost of Production. Cost of production includes costs incurred in operations for the production of RNG and isobutanol, as well as costs for direct materials, direct labor and certain plant overhead costs, and plant utilities including natural gas and wind power. Direct materials consist of dextrose for initial production of isobutanol, corn feedstock, manure feedstock, denaturant, and process chemicals. Direct labor includes compensation of personnel directly involved in production operations. Plant overhead costs primarily consist of plant utilities. The Company purchases natural gas and wind power to power steam generation in the production process and to dry the distillers grains, a by-product of ethanol and related products production.
Research and Development. Research and development costs are expensed as incurred. The Company’s research and development costs consist of expenses incurred to identify, develop, and test its technologies for the production of isobutanol and the development of downstream applications thereof. Research and development expense includes personnel costs (including stock-based compensation), consultants and related contract research, facility costs, supplies, license fees and milestone payments paid to third parties for use of their intellectual property and patent rights and other direct and allocated expenses incurred to support the Company’s overall research and development programs.
General and Administrative. General and administrative expenses are expensed as incurred. The Company’s general and administrative costs consist of personnel costs (including stock-based compensation), consulting and service provider expenses (including patent counsel-related costs), legal fees, marketing costs, insurance costs, occupancy-related costs, travel and relocation expenses and hiring expenses. Our corporate personnel, consisting of subject matter experts, including chemists, engineers, and sustainability experts, dedicate the majority of their time and efforts for the development of our projects. Costs incurred have not yet been allocated to the specific projects on the face of our financial statements.
Project Development Costs. Project development costs consist of consulting, preliminary engineering costs, and personnel costs, including stock-based compensation.
68
Stock-Based Compensation. The Company’s stock-based compensation expense includes expenses associated with share-based awards granted to employees and board members. Our stock-based compensation is classified as either an equity award or a liability award in accordance with U.S. GAAP. The fair value of an equity-classified award is determined at the grant date and is amortized on a straight-line basis over the requisite service period. The fair value of a liability-classified award is determined on a quarterly basis through the final vesting date and is amortized based on the current fair value of the award and the percentage of vesting period incurred to date.
The grant date fair value for stock option awards is estimated using the Black-Scholes option pricing model and the grant date fair value for restricted stock awards is based upon the closing price of the Company’s common stock on the date of grant. The Company recognizes compensation costs for share-based payment awards granted to employees net of actual forfeitures and recognizes stock-based compensation expense for only those awards expected to vest on a straight-line basis over the requisite service period of the award, which is currently the vesting term of up to
.The Company accounts for stock-based employee compensation plans under the fair value recognition and measurement provisions in accordance with applicable accounting standards, which require all stock-based payments to employees, including grants of stock options and restricted stock awards, to be measured based on the grant date fair value of the awards, with the resulting expense generally recognized on a straight-line basis over the period during which the employee is required to perform service in exchange for the award.
Stock-based compensation expenses related to restricted stock awards and stock options are recorded net of actual forfeitures in our Consolidated Statements of Operations.
Liability awards are subject to variable accounting treatment, such that they are remeasured at fair value each reporting period through the Consolidated Statements of Operations. Any impact of forfeitures is based on actual forfeitures, although not affecting the fair value measurement of the awards, and are reflected at that time as well.
Income Taxes. In preparing the Consolidated Financial Statements, the Company estimates the actual amount of taxes currently payable or receivable as well as deferred tax assets and liabilities attributable to temporary differences between the financial statement carrying amounts of existing assets and liabilities and their respective tax bases. Deferred tax assets and liabilities are measured using currently enacted tax rates in effect in the years in which those temporary differences are expected to reverse. Deferred tax assets are be reduced by a valuation allowance if, based on the weight of available evidence, it is more likely than not that some portion or all of the deferred tax assets will not be realized. Changes in deferred tax assets and liabilities generally have a direct impact on earnings in the period of the changes. Where applicable tax laws and regulations are either unclear or subject to varying interpretations, it is possible that changes in these estimates could occur that materially affect the amounts of deferred income tax assets and liabilities recorded in the Consolidated Financial Statements.
Each period, we evaluate the likelihood of whether or not some portion or all of each deferred tax asset will be realized and provide a valuation allowance for those deferred tax assets for which it is more likely than not that the related benefits will not be realized. When evaluating our valuation allowance, we consider historic and future expected levels of taxable income, the pattern and timing of reversals of taxable temporary timing differences that give rise to deferred tax liabilities, and tax planning initiatives. Levels of future taxable income are affected by, among other things, production costs, interest rates, and federal and local legislation. If we determine that all or a portion of the deferred tax assets will not be realized, a valuation allowance will be recorded with a charge to income tax expense. Conversely, if we determine that we will ultimately be able to realize all or a portion of the related benefits for which a valuation allowance has been provided, all or a portion of the related valuation allowance will be reduced with a credit to income tax expense.
69
In addition, the calculation of income tax expense involves significant management estimation and judgment involving a number of assumptions. In determining these amounts, management interprets tax legislation in each of the jurisdictions in which we operate and makes estimates of the expected timing of the reversal of future tax assets and liabilities. We also make assumptions about future earnings, tax planning strategies and the extent to which potential future tax benefits will be used. We are also subject to assessments by various taxation authorities which may interpret tax legislation differently, which could affect the final amount or the timing of tax payments.
The Company may from time to time be assessed interest or penalties by major tax jurisdictions, although there have been no such assessments historically with any material impact to its financial results. The Company would recognize interest and penalties related to unrecognized tax benefits within the income tax expense line in the accompanying Consolidated Statements of Operations. Accrued interest and penalties would be included within the related tax liability line in the Consolidated Balance Sheets.
Prior Period Financial Statement Immaterial Adjustment. The Company has entered into agreements with Zero6 Energy Development, Inc. (“ZEDI”), a national clean energy expert that provides expertise in capital management, development, engineering, and asset management, to develop and construct facilities to provide carbon neutral power to NZ1 via the two limited liability companies: Kingsbury Country Wind Fuel, LLC (“KCWF”) and Dakota Renewable Hydrogen, LLC (“DRH”) (collectively, the “Project LLCs”), respectively, to induce the design and construction of the power generation, transmission and distribution facilities that will serve NZ1. The Project LLCs formed to govern the projects are VIEs. In determining whether the Company was the primary beneficiary of the VIEs, the Company considered both qualitative and quantitative factors regarding the nature, size and form of the involvement with the VIE, such as the role in establishing the VIEs and the ongoing rights and responsibilities; the economic interests deemed to be variable interests in the VIEs; the design of the VIEs, including the capitalization structure, subordination of interests, and payment priority. During the third quarter of 2023, the Company identified that the governance structure and operating procedures of the Project LLCs resulted in the Company having the power to control certain significant activities of the Project LLCs, as defined by Accounting Standards Codification 810 (“ASC 810”), Consolidations. Therefore, the Company is the primary beneficiary of the VIEs, and per ASC 810, must consolidate the VIEs. Prior to the third quarter of 2023, the Company did not consolidate the Project LLCs. The Company assessed the materiality of this correction on the previously issued interim and annual financial statements in accordance with SEC Staff Accounting Bulletin No. 99. The Company concluded that the changes were not material to any of the previously issued consolidated financial statements. The Company’s primary involvement with the VIEs is to fund the deposits in order to induce the contractor to design and construct the power generation, transmission and distribution facilities that will serve NZ1. These amounts funded will be either fully reimbursed upon completion of the project or used as an investment into the Project LLC. Gevo has contractual priority liens against the equipment and constructed facilities under the contracts. In December 2023 the agreements with ZEDI related to the two Project LLCs were amended to remove certain kickout rights that previously existed. As of December 2023, we have concluded that the removal of the kickout rights from the agreements has resulted in a loss of control and that, therefore, the Company is no longer the primary beneficiary of the Project LLCs, and accordingly no longer consolidates the Project LLCs. See Footnote 22.
A summary of the impact of the adjustment on the Consolidated Balance Sheets for each of the periods ended December 31, 2022, March 31, 2023, and June 30, 2023, respectively, is as follows: an increase to property, plant, and equipment of $
70
Additionally, the following immaterial adjustments were made to the consolidated statements of cash flows associated with the above changes for each of the periods ended September 30, 2022, December 31, 2022, March 31, 2023, and June 30, 2023, respectively, as follows: a decrease in the net cash used in operating activities of $
Recently Issued, Not Yet Adopted Accounting Pronouncements
Segment Reporting. In November 2023, the FASB issued ASU 2023-07, Segment Reporting (Topic 280): Improvements to Reportable Segment Disclosures (“ASU 2023-07”). ASU 2023-07 would enhance disclosures for significant segment expenses for all public entities required to report segment information in accordance with ASC 280. ASC 280 requires a public entity to report for each reportable segment a measure of segment profit or loss that its chief operating decision maker (“CODM”) uses to assess segment performance and to make decisions about resource allocations. The amendments in ASU 2023-07 improve financial reporting by requiring disclosure of incremental segment information on an annual and interim basis for all public entities to enable investors to develop more useful financial analyses. Currently, Topic 280 requires that a public entity disclose certain information about its reportable segments. For example, a public entity is required to report a measure of segment profit or loss that the CODM uses to assess segment performance and make decisions about allocating resources. ASC 280 also requires other specified segment items and amounts such as depreciation, amortization and depletion expense to be disclosed under certain circumstances. The amendments in ASU 2023-07 do not change or remove those disclosure requirements. The amendments in ASU 2023-07 also do not change how a public entity identifies its operating segments, aggregates those operating segments, or applies the quantitative thresholds to determine its reportable segments. The amendments in ASU 2023-07 are effective for fiscal years beginning after December 15, 2023, and interim periods within fiscal years beginning after December 15, 2024. Early adoption is permitted. A public entity should apply the amendments in ASU 2023-07 retrospectively to all prior periods presented in the financial statements. The Company is currently evaluating the impact that ASU 2023-07 may have on its financial statements and related disclosures when adopted.
Income Taxes. In December 2023, the FASB issued ASU 2023-09, "Income Taxes (Topic 740): Improvements to Income Tax Disclosures". ASU 2023-09 is intended to enhance the transparency and decision usefulness of income tax disclosures. The amendments in ASU 2023-09 address investor requests for enhanced income tax information primarily through changes to the rate reconciliation and income taxes paid information. Early adoption is permitted. A public entity should apply the amendments in ASU 2023-09 prospectively to all annual periods beginning after December 15, 2024. The Company is currently evaluating the impact of this standard on our consolidated financial statements and related disclosures.
3. Revenues from Contracts with Customers and Other Revenue
RNG Revenue
The Company’s revenues are primarily comprised of the sale of RNG and related environmental attributes produced at the NW Iowa RNG facility under long-term contracts with customers. Revenue is recognized at a point in time when the Company transfers the product to its customer. The customer obtains control of the product upon RNG delivery into gas pipeline system, whereas the title and control for the environmental attributes are transferred to the customer subsequent to the issuance of such attributes by the relevant regulatory agency. The Company generally has a single performance obligation in our arrangements with customers. The Company’s performance obligation related to the sales of RNG and related environmental attributes are satisfied at a point in time upon delivery to the customer. Revenue is measured as the amount of consideration the Company expects to receive in exchange for transferring its products. There is no variable consideration present in the Company’s performance obligations. Consideration for each transaction is based upon quoted market prices at the time of delivery. All material contracts have payment terms of between one to three months and there are no return or refund rights.
71
Licensing and Development Revenue
The Company’s licensing and development revenue is related to a joint development agreement with LG Chem, Ltd. ("LG Chem") to develop bio-propylene for renewable chemicals using Gevo’s Ethanol-to-Olefins ("ETO") technology. As the contractually promised intellectual properties (“IP”) are not individually distinct, the Company combined each individual IP noted in the contract into a bundle of IP (“IP Rights”) that is distinct and accounted for all of the IP Rights promised in the contract as a single performance obligation. The IP Rights granted were “functional IP rights” that have significant standalone functionality. The Company’s subsequent activities do not substantively change that functionality and do not significantly affect the utility of the IP to which the licensee has rights. The Company has no further obligation with respect to the grant of IP Rights, including no expressed or implied obligation to maintain or upgrade the technology, or provide future support or services. Licensees legally obtain control of the IP Rights upon execution of the contract. As such, the earnings process is complete and revenue is recognized upon the execution of the contract, when collectability is probable and all other revenue recognition criteria have been met.
Other Hydrocarbon Revenue
The Company recorded limited revenues from its development-scale plant, the Luverne Facility, during the year ended December 31, 2023, and 2022. These revenues were promotional in nature and from customer contracts for ethanol sales and related products and hydrocarbon revenues, which included isooctene, isooctane, and SAF. These products were sold mostly on a free-on-board shipping point basis (recognized at a point in time), were independent transactions, did not provide post-sale support or promises to deliver future goods, and were single performance obligations.
The following tables display the Company’s revenue by major source based on product type (in thousands):
| Year Ended December 31, | |||||
Major Goods/Service Line | 2023 |
| 2022 | |||
Renewable natural gas commodity |
| |
| | ||
Environmental attribute revenue | | | ||||
Licensing and development revenue |
| |
| | ||
Other hydrocarbon revenue - ethanol, isooctane, IBA | | | ||||
Total operating revenue | $ | | $ | |
Contract Assets and Trade Receivables. As of December 31, 2023, and 2022, there were
4. Asset Impairment
There were
impairment losses recorded during the year ended December 31, 2023.72
During the year ended December 31, 2022, the Company recorded a $
5. Net Loss per Share
Basic net loss per share is calculated based on the weighted average number of common shares outstanding for the period. Diluted net loss per share is calculated based on the assumption that stock options and other dilutive securities outstanding, which have an exercise price less than the average market price of the Company’s common shares during the period, would have been exercised on the later of the beginning of the period or the date granted, and that the funds obtained from the exercise were used to purchase common shares at the average market price during the period. None of the Company’s stock options or other dilutive securities are considered to be dilutive in periods with net losses.
The effect of the Company’s dilutive securities is calculated using the treasury stock method and only those instruments that result in a reduction in net income per common share are included in the calculation. Diluted net loss per share excluded common stock equivalents because the effect of their inclusion would be anti-dilutive or would decrease the reported net loss per share. Therefore
Basic and diluted net loss per share is calculated as follows (net loss in thousands):
| Year Ended December 31, | |||||
2023 |
| 2022 | ||||
Net loss | ( | ( | ||||
Basic weighted-average shares outstanding |
| |
| | ||
Net loss per share - basic and diluted | ( | ( |
6. Marketable Securities
The Company’s investments in marketable securities are stated at fair value and are available for sale. During the year ended December 31, 2023, all remaining investments in marketable securities matured with
| December 31, 2022 | ||||||||||
| Amortized |
| Gross |
| |||||||
Cost | Unrealized | ||||||||||
Maturity | Basis | Losses | Fair Value | ||||||||
Marketable securities (current) |
|
|
|
|
|
|
|
| |||
U.S. Treasury notes |
| Within one year | $ | | $ | ( | $ | | |||
U.S. Government-sponsored enterprise securities |
| Within one year |
| |
| ( |
| | |||
Total marketable securities (current) | $ | | $ | ( | $ | |
73
The cost of securities sold is based upon the specific identification method. Interest income from marketable securities totaled $
7. Restricted Cash
As of December 31, 2023, current restricted cash of $
The Company entered into an irrevocable direct pay letter of credit (the “Bond Letter of Credit”) with Citibank N.A (“Citibank”) in April 2021 to support the 2021 Bonds (as defined below) for the development and construction of NW Iowa RNG. See Note 14, Debt, for additional information on the 2021 Bonds. The Bond Letter of Credit has a
In September 2022, the Company entered into a Pledge and Assignment agreement with Citibank to provide credit support in the form of a letter of credit (the “Power Letter of Credit”) from Citibank to a local electric utility company in order to induce the utility company to design and construct the power transmission and distribution facilities that will serve NZ1. The Company deposited $
The Company is entitled to receive interest income on the restricted cash, and recorded interest income of $
8. Prepaid and Other Current Assets
The following table sets forth the components of the Company’s prepaid and other current assets (in thousands) as of:
| December 31, | |||||
2023 |
| 2022 | ||||
Prepaid insurance | $ | | $ | | ||
Interest receivable |
| |
| | ||
Prepaid feedstock |
| |
| | ||
Other current assets |
| |
| | ||
Total prepaid expenses and other current assets | $ | | $ | |
9. Leases, Right-of-Use Assets and Related Liabilities
The Company is party to an operating lease contract for the Company’s office and research facility in Englewood, Colorado, which expires in January 2029. The lease contains an option to extend the lease which management does not reasonably expect to exercise, so it is not included in the length of the term. The Company also has one production line piece of equipment with an operating lease that expires in 2024.
74
The Company has
The following tables present the (i) other quantitative information and (ii) future minimum payments under non-cancelable financing and operating leases as they relate to the Company’s leases (in thousands), except for weighted averages:
Years Ended December 31, |
| ||||||
2023 |
| 2022 |
| ||||
Other Information |
|
|
| ||||
Cash paid for amounts included in the measurement of lease liabilities: |
|
|
| ||||
Operating cash flows from finance leases | $ | | $ | | |||
Operating cash flows from operating leases |
| |
| | |||
Finance cash flows from finance leases |
| |
| | |||
Right-of-use asset obtained in exchange for new operating lease liabilities |
| |
| | |||
Weighted-average remaining lease term, finance lease (months) |
|
| |||||
Weighted-average remaining lease term, operating leases (months) |
|
| |||||
Weighted-average discount rate - finance leases (1) |
| | % |
| | % | |
Weighted-average discount rate - operating leases (1) |
| | % |
| | % |
(1) | Our leases do not provide an implicit interest rate, and we calculate the lease liability at lease commencement as the present value of unpaid lease payments using our estimated incremental borrowing rate. The incremental borrowing rate represents the rate of interest that we would have to pay to borrow an amount equal to the lease payments on a collateralized basis over a similar term and is determined using a portfolio approach based on information available at the commencement date of the lease. |
Year Ending December 31, |
| Operating Leases |
| Finance Leases | ||
2024 | $ | | $ | | ||
2025 |
| |
| | ||
2026 |
| |
| | ||
2027 |
| |
| | ||
2028 |
| |
| | ||
2029 and thereafter |
| — |
| | ||
Total |
| |
| | ||
Less: amounts representing present value discounts |
| |
| | ||
Total lease liabilities |
| |
| | ||
Less: current portion |
| |
| | ||
Non-current portion | $ | | $ | |
75
10. Inventories
The following table sets forth the components of the Company’s inventory balances (in thousands) as of:
| December 31, | |||||
2023 |
| 2022 | ||||
Raw materials |
| $ | | $ | | |
Finished goods |
| |||||
SAF, Isooctane, Isooctene and other |
| |
| | ||
Work in process |
|
| ||||
Environmental attributes | | | ||||
Jet fuel |
| |
| | ||
Spare parts |
| |
| | ||
Total inventories | $ | | $ | |
During the years ended December 31, 2023, and 2022, the Company recorded net realizable value adjustments of $
11. Property, Plant and Equipment
The following table sets forth the Company’s property, plant and equipment by classification (in thousands):
|
| Useful Life | December 31, | |||||
(in years) |
| 2023 |
| 2022 | ||||
Land | $ | | $ | | ||||
Plant facilities and infrastructure |
|
| |
| | |||
Machinery and equipment |
|
| |
| | |||
Furniture and office equipment |
|
| |
| | |||
Software |
|
| |
| | |||
Construction in progress |
|
| |
| | |||
Total property, plant and equipment |
|
| |
| | |||
Less: accumulated depreciation and amortization |
|
| ( |
| ( | |||
Property, plant and equipment, net | $ | | $ | |
The Company recorded depreciation expenses of $
At December 31, 2023, and 2022, construction in progress included accruals of $
Construction in progress includes $
Borrowing costs. Borrowing costs directly attributable to acquisition and construction of an asset are capitalized until it is completed and ready for its intended use, and thereafter are recognized in profit or loss for the current period. The Company did
76
12. Intangible Assets
Identifiable intangible assets consist of patents, which management evaluates to determine whether they (i) support current products, (ii) support planned research and development, or (iii) prevent others from competing with Gevo’s products.
The following tables set forth the Company’s intangible assets by classification (in thousands) as of:
| December 31, 2023 | ||||||||||
|
| Identifiable |
| Weighted- | |||||||
Gross Carrying | Accumulated | Intangible | Average Useful Life | ||||||||
Amount |
| Amortization |
| Assets, net |
| (Years) | |||||
Patents | $ | | $ | ( | $ | |
| ||||
Defensive assets |
| |
| ( |
| |
| ||||
Intangible assets | $ | | $ | ( | $ | |
|
| December 31, 2022 | ||||||||||
|
| Identifiable |
| Weighted- | |||||||
Gross Carrying | Accumulated | Intangible | Average Useful Life | ||||||||
Amount | Amortization | Assets, Net | (Years) | ||||||||
Patents | $ | | $ | ( | $ | |
| ||||
Defensive assets |
| |
| ( |
| |
| ||||
Intangible assets | $ | | $ | ( | $ | |
|
The Company recorded amortization expense of $
The following table details the estimated amortization of identifiable intangible assets as of December 31, 2023 (in thousands):
Year Ending December 31, |
| Patents |
| Defensive Assets |
| Total | |||
2024 | $ | | $ | | $ | | |||
2025 |
| |
| |
| | |||
2026 |
| |
| |
| | |||
2027 |
| |
| |
| | |||
2028 |
| |
| |
| | |||
2029 and thereafter |
| |
| |
| | |||
Total intangible assets | $ | | $ | | $ | |
13. Deposits and Other Assets
The following table sets forth the components of the Company’s deposits and other assets (in thousands) as of:
| Year Ended December 31, | |||||
| 2023 |
| 2022 | |||
Deposits (1) | $ | | $ | | ||
Prepaid feedstock (2) |
| |
| | ||
Equity interest (3) |
| |
| | ||
Exclusivity fees (4) |
| |
| | ||
Deposits receivable (5) |
| |
| | ||
Other assets, net (6) |
| |
| | ||
Total deposits and other assets | $ | | $ | |
77
(1) | Deposits for services and products. |
(2) | Prepaid feedstock fees, non-current, for the production of RNG. |
(3) | The Company directly holds a |
(4) | Axens North America, Inc. (“Axens”) will provide certain alcohol-to-SAF technologies and services exclusively provided to the Company which may be offset against future license fees subject to the delivery of a process design package. |
(5) | Deposits provided to a developer of certain wind-farm projects and power utility contractor to induce to design and construct the power generation, transmission and distribution facilities that will serve NZ1, $ |
(6) | Payments which were allocated to the non-lease fuel supply, primarily related to sand separation systems, to support NW Iowa RNG fuel supply agreements prior to commencement of operations, being amortized over the life of the project. |
14. Accounts Payable and Accrued Liabilities
The following table sets forth the components of the Company’s accounts payable and accrued liabilities in the Consolidated Balance Sheets (in thousands):
| Year Ended December 31, | |||||
| 2023 |
| 2022 | |||
Accounts payable | $ | | $ | | ||
Accrued liabilities |
| |
| | ||
Accrued payroll and related benefits |
| |
| | ||
Accrued sales and use tax |
| |
| | ||
Total accounts payable and accrued liabilities | $ | | $ | |
15. Debt
2021 Bond Issuance
On April 15, 2021, on behalf of Gevo NW Iowa RNG, LLC, the Iowa Finance Authority (the “Authority”) issued $
78
The 2021 Bonds were issued at a premium of $
Loans Payable
In April 2020, the Company and Agri-Energy each entered into a loan agreement with Live Oak Banking Company, pursuant to which the Company and Agri-Energy obtained loans from the SBA PPP totaling $
In April 2021, the balance of $
The summary of the Company’s long-term debt is as follows (in thousands) as of:
|
|
| Year Ended December 31, | |||||||
Interest Rate | Maturity Date |
| 2023 |
| 2022 | |||||
2021 Bonds, net |
|
| April 2042 | $ | | $ | | |||
SBA Loans |
|
| April 2025 |
| |
| | |||
Equipment |
|
| December 2023 to December 2024 |
| |
| | |||
Total debt |
|
|
| |
| | ||||
Less: current portion |
|
|
| ( |
| ( | ||||
Non-current portion |
|
| $ | | $ | |
Future payments for the Company’s long-term debt are as follows (in thousands):
Year Ending December 31, |
| Total Debt | |
2024 | $ | | |
2025 |
| | |
Total debt | $ | |
16. Stock-Based Compensation
Equity incentive plans. In February 2011, the Company’s stockholders approved the Gevo, Inc. 2010 Stock Incentive Plan (as amended and restated to date, the “2010 Plan”) and the Employee Stock Purchase Plan.
The 2010 Plan provides for the grant of non-qualified stock options, incentive stock options, stock appreciation rights, restricted stock awards, restricted stock units and other equity awards to employees and directors of the Company. In May 2023, upon approval of the shareholders at the 2023 Annual Meeting of Stockholders, the 2010 Plan was amended and restated, which increased the number of shares of common stock reserved for issuance under the 2010 Plan to
Stock-based compensation expense. The Company records stock-based compensation expense during the requisite service period for share-based payment awards granted to employees and non-employees.
79
The following table sets forth the Company’s stock-based compensation expense for the periods indicated (in thousands):
| Year Ended December 31, | |||||
2023 |
| 2022 | ||||
Equity Classified Awards |
|
|
|
| ||
Cost of production | $ | | $ | ( | ||
General and administrative |
| |
| | ||
Other |
| |
| | ||
Total equity classified awards |
| |
| | ||
Total stock-based compensation | $ | | $ | |
Stock option award activity. Stock option activity under the Company’s stock incentive plans and changes during the year ended December 31, 2023, were as follows:
|
|
| Weighted- |
| |||||||
Average | |||||||||||
Weighted- | Remaining | ||||||||||
Average | Contractual | Aggregate | |||||||||
Number of | Exercise | Term | Intrinsic | ||||||||
Options |
| Price (1) |
| (years) |
| Value | |||||
Options outstanding at December 31, 2022 |
| | $ | |
| $ | |||||
Granted |
| | $ | |
|
|
| $ | — | ||
Canceled or forfeited |
| ( | $ | |
|
|
| $ | — | ||
Exercised |
| | $ | |
|
|
| $ | — | ||
Options outstanding at December 31, 2023 |
| | $ | |
| $ | |||||
Options vested and expected to vest at December 31, 2023 |
| | $ | |
| $ |
(1) | Exercise price of options outstanding range from $ |
During the year ended December 31, 2023,
The following table sets forth the weighted average Black-Scholes option pricing model assumptions (no dividends were expected) and resulting grant date fair value for the stock options granted during the years ended December 31, 2023, and 2022:
Year Ended December 31, | |||||||
| 2023 |
| 2022 |
| |||
Risk-free interest rate |
| | % | | % | ||
Expected volatility factor |
| | % | | % | ||
Expected option life (years) |
|
| |||||
Weighted-average fair value | $ | | $ | |
There is a maximum contractual term of
for the share options. The Company settles stock option exercises with newly issued common shares. No tax benefits were realized by the Company in connection with these exercises as the Company maintains net operating loss carryforwards and has established a valuation allowance against the entire tax benefit.Restricted Stock. The Company periodically grants restricted stock awards to employees and directors. The vesting period for restricted stock awards granted may be based upon a service period or based upon the attainment of performance objectives. The Company recognizes stock-based compensation over the vesting period, generally
to , for awards that vest based upon a service period.80
Non-vested restricted stock awards at December 31, 2023, and changes during the year ended December 31, 2023, were as follows:
|
| Weighted- | |||
Average | |||||
Number of | Grant-Date | ||||
Shares | Fair Value | ||||
Outstanding at December 31, 2022 |
| | $ | | |
Granted |
| | $ | | |
Vested and issued |
| ( | $ | | |
Canceled or forfeited |
| ( | $ | | |
Non-vested at December 31, 2023 |
| | $ | |
The total fair value of restricted stock that vested during the years ended December 31, 2023, and 2022, was $
17. Income Taxes
As of December 31, 2023, the Company has a federal and state net operating loss carryover of approximately $
We periodically evaluate our net operating loss carryforwards and whether certain changes in ownership have occurred that would limit our ability to utilize a portion of our net operating loss carryforwards pursuant to Internal Revenue Code Section 382. An ownership change may occur, for example, as a result of trading in our stock by significant investors as well as issuance of new equity. As a result of ownership changes in prior years, a portion of our net operating losses have been limited.
The following table sets forth the tax effects of temporary differences that give rise to significant portions of the Company’s net deferred tax assets (in thousands):
December 31, | ||||||
| 2023 |
| 2022 | |||
Deferred tax assets, net: |
|
|
|
| ||
Net operating loss carryforwards | $ | | $ | | ||
Operating lease assets |
| ( |
| ( | ||
Operating lease liabilities |
| |
| | ||
Depreciation |
| |
| | ||
Stock compensation |
| |
| | ||
Business interest expense |
| |
| | ||
Capitalized research cost |
| |
| | ||
Other temporary differences |
| |
| | ||
Deferred tax assets |
| |
| | ||
Valuation allowance |
| ( |
| ( | ||
Net deferred tax assets | $ | | $ | |
81
Beginning in 2022, the Tax Cuts and Jobs Act of 2017 eliminated the option to deduct research and development expenditures in the current year and requires taxpayers to amortize them over five years pursuant to Internal Revenue Code Section 174. The mandatory capitalization requirement increases the deferred tax asset for Capitalized Research Costs by $
ASC 740, Income Taxes, provides for the recognition of deferred tax assets if realization of such assets is more likely than not to occur. Based on management’s review of both the positive and negative evidence, which includes our historical operating performance, reported cumulative net losses since inception and difficulty in accurately forecasting results, we have concluded that it is not more likely than not that we will be able to realize all of our U.S. deferred tax assets. Therefore, we have provided a full valuation allowance against deferred tax assets at December 31, 2023 and 2022, respectively.
The following table sets forth reconciling items from income tax computed at the statutory federal rate:
Year Ended December 31, | |||||
| 2023 |
| 2022 | ||
Federal income tax at statutory rate |
| | % | | % |
State income taxes, net of federal benefits |
| | % | | % |
Officers compensation limit |
| ( | % | ( | % |
Stock based compensation | ( | % | | % | |
Other permanent | ( | % | ( | % | |
Valuation allowance |
| ( | % | ( | % |
Effective tax rate |
| | % | | % |
Accounting literature regarding liabilities for unrecognized tax benefits provides guidance for the recognition and measurement in financial statements of uncertain tax positions taken or expected to be taken in a tax return. The Company’s evaluation was performed for the tax periods from inception to December 31, 2023. The Company is subject to examination by major tax jurisdictions for the years ended December 31, 2018 to 2022.
The Company recognizes uncertain tax positions net, against any operating losses or applicable research credits as they arise. Currently, there are
18. Employee Benefit Plan
The Company sponsors the Gevo, Inc. 401(k) Plan (the “401(k) Plan”) under Section 401(k) of the Internal Revenue Code. Subject to certain eligibility requirements, the 401(k) Plan covers substantially all employees beginning the month after employment. Employee contributions are deposited by the Company into the 401(k) Plan and may not exceed the maximum statutory contribution amount. Beginning January 1, 2023, the 401(k) Plan was amended to include matching contributions to the 401(k) Plan, with the Company matching
19. Commitments and Contingencies
Legal Matters. From time to time, the Company has been and may again become involved in legal proceedings arising in the ordinary course of its business. The Company is not presently a party to any litigation and is not aware of any pending or threatened litigation against the Company that it believes could have a material adverse effect on its business, operating results, financial condition or cash flows.
82
State Tax Audit. During the year ended 2023, the Company was notified of a pending sales and use tax audit by the South Dakota Department of Revenue for the period covering January 2021 through December 2023. Although the final resolution of the Company’s sales and use tax audit is uncertain, based on current information, in the opinion of the Company’s management, the ultimate disposition of these matters will not have a material adverse effect on the Consolidated Balance Sheets, Statements of Operations, or Liquidity.
Indemnifications. In the ordinary course of its business, the Company makes certain indemnities under which it may be required to make payments in relation to certain transactions. As of December 31, 2023, and 2022, the Company did not have any liabilities associated with indemnities.
In addition, the Company indemnifies its officers and directors for certain events or occurrences, subject to certain limitations. The duration of these indemnifications, commitments, and guarantees varies and, in certain cases, is indefinite. The maximum amount of potential future indemnification is unlimited; however, the Company has a director and officer insurance policy that may enable it to recover a portion of any future amounts paid. The Company accrues losses for any known contingent liability, including those that may arise from indemnification provisions, when future payment is probable.
Environmental Liabilities. The Company’s operations are subject to environmental laws and regulations adopted by various governmental authorities in the jurisdictions in which it operates. These laws require the Company to investigate and remediate the effects of the release or disposal of materials at its locations. Accordingly, the Company has adopted policies, practices and procedures in the areas of pollution control, occupational health and the production, handling, storage and use of hazardous materials to prevent material environmental or other damage, and to limit the financial liability which could result from such events. Environmental liabilities are recorded when the Company’s liability is probable, and the costs can be reasonably estimated.
Fuel Supply Commitment. The Company has
Zero6 Commitments. In September 2022, the Company entered into a development agreement with Zero6 to construct and operate a wind project for the provision of electric energy for NZ1. Pursuant to the agreement, the Company has committed to pay Zero6 total development charges of $
Additionally, the Company’s investment in Zero6, see Note 13 above, is pledged separately as collateral for
83
The estimated commitments as of December 31, 2023, and thereafter are shown below (in thousands):
December 31, | |||||||||||||||||||||
2029 and | |||||||||||||||||||||
| 2024 |
| 2025 |
| 2026 |
| 2027 |
| 2028 |
| thereafter |
| Total | ||||||||
Fuel Supply Payments | $ | | $ | | $ | | $ | | $ | | $ | | $ | | |||||||
Zero6 Commitment |
| |
| |
| |
| |
| |
| |
| | |||||||
Renewable Energy Credits |
| |
| |
| |
| |
| |
| |
| | |||||||
Electricity Above Use (Est.) |
| |
| |
| |
| |
| |
| |
| | |||||||
Total | $ | | $ | | $ | | $ | | $ | | $ | | $ | |
20. Fair Value Measurements
Accounting standards define fair value, outline a framework for measuring fair value, and detail the required disclosures about fair value measurements. Under these standards, fair value is defined as the price that would be received to sell an asset or paid to transfer a liability in an orderly transaction between market participants at the measurement date in the principal or most advantageous market. Standards establish a hierarchy in determining the fair market value of an asset or liability. The fair value hierarchy has three levels of inputs, both observable and unobservable. Standards require the utilization of the highest possible level of input to determine fair value.
Level 1 – inputs include quoted market prices in an active market for identical assets or liabilities.
Level 2 – inputs are market data, other than Level 1, that are observable either directly or indirectly. Level 2 inputs include quoted market prices for similar assets or liabilities, quoted market prices in an inactive market, and other observable information that can be corroborated by market data.
Level 3 – inputs are unobservable and corroborated by little or no market data.
The carrying value and fair value, by fair value hierarchy, of the Company’s financial instruments at December 31, 2023, and 2022, are as follows (in thousands):
| Fair Value Measurements at December 31, 2023 | |||||||||||
Quoted | ||||||||||||
Prices in | ||||||||||||
Active | Significant | |||||||||||
Markets for | Other | Significant | ||||||||||
Fair Value at | Identical | Observable | Unobservable | |||||||||
December 31, | Assets | Inputs | Inputs | |||||||||
| 2023 |
| (Level 1) |
| (Level 2) |
| (Level 3) | |||||
Cash and cash equivalents (1) | $ | | $ | | $ | | $ | |
Fair Value Measurements at December 31, 2022 | ||||||||||||
Quoted | ||||||||||||
Prices in | ||||||||||||
Active | Significant | |||||||||||
Markets for | Other | Significant | ||||||||||
Fair Value at | Identical | Observable | Unobservable | |||||||||
December 31, | Assets | Inputs | Inputs | |||||||||
| 2022 |
| (Level 1) |
| (Level 2) |
| (Level 3) | |||||
Cash and cash equivalents (1) | $ | | $ | | $ | | $ | | ||||
Marketable securities |
| $ | | $ | | $ | | $ | |
(1) | Cash and cash equivalents includes $ |
84
The Company had no transfers of assets or liabilities between fair value hierarchy levels during the years ended December 31, 2023, and 2022.
For the 2021 Bonds, the fair values are estimated using the Black-Derman-Toy interest rate lattice framework. The effective maturity of the 2021 Bonds was assumed to be April 1, 2024 (
| Carrying |
| Estimated | |||
Value | Fair Value | |||||
2021 Bonds | $ | | $ | |
21. Shareholders’ Equity
Share Issuances
In February 2018, the Company commenced an at-the-market offering program, which allows it to sell and issue shares of its common stock from time to time. In 2021, the at-the-market offering program was amended to provide a total capacity of $
Subsequently, in January 2024 the Company filed an updated Form S-3, which included a base prospectus which covers the offer, issuance and sale of up to an aggregate of $
In June 2022, the Company completed a registered direct offering (“the June 2022 Offering”) of an aggregate of
The net proceeds to the Company from the June 2022 Offering were $
Warrants
In addition to the Series 2022-A Warrants, the Company has warrants outstanding that were issued in conjunction with a registered direct offering in August 2020 (the “Series 2020-A Warrants”). The Company evaluated the Series 2022-A Warrants and Series 2020-A Warrants for liability or equity classification and determined that equity treatment was appropriate because both the Series 2022-A Warrants and Series 2020-A Warrants do not meet the definition of liability instruments.
85
The Series 2022-A Warrants and Series 2020-A Warrants are classified as a component of equity because they are freestanding financial instruments that are legally detachable and separately exercisable from the shares of common stock with which they were issued, are immediately exercisable and will expire
While the Company believes that its valuation methods are appropriate and consistent with other market participants, it recognizes that the use of different methodologies or assumptions to determine the fair value of certain financial instruments could result in a different estimate of fair value at the reporting date.
On February 17, 2022, the remaining Series K warrants expired with
The following table sets forth information pertaining to shares issued upon the exercise of warrants:
|
|
|
| Shares |
| Shares | |||||||
|
|
|
| Issued upon |
| Underlying | |||||||
|
| Shares |
| Warrant |
| Warrants | |||||||
| Exercise |
| Underlying |
| Exercises as |
| Outstanding | ||||||
Price as of |
| Warrants on |
| of |
| as of | |||||||
Issuance | Expiration | December 31, | Issuance |
| December 31, |
| December 31, | ||||||
| Date |
| Date |
| 2023 |
| Date |
| 2023 |
| 2023 | ||
Series 2020-A Warrants (1) |
| 7/6/2020 |
| 7/6/2025 | $ | |
| |
| |
| ||
Series 2022-A Warrants (1) |
| 6/8/2022 |
| 6/7/2027 | $ | |
| |
| |
| ||
Total Warrants |
| |
| |
|
(1) | Equity-classified warrants. |
| Common Stock |
| |||
Issued | Proceeds | ||||
Series 2020-A Warrants | $ |
Share Repurchase Program
On May 30, 2023, the Board authorized a stock repurchase program, under which the Company may repurchase up to $
The Company did
86
22. Variable Interest Entities
The Company has entered into agreements with various SPEs to facilitate the development and construction of facilities to provide carbon neutral power to NZ1. These SPEs are structured as a limited liability companies.
Nonconsolidated VIEs
During September 2022 and February 2023, the Company entered into agreements with Zero6 Energy Development, Inc. (“ZEDI”), a national clean energy expert that provides expertise in capital management, development, engineering, and asset management, to develop and construct facilities to provide carbon neutral power to NZ1 via the two Project LLCs: Kingsbury County Wind Fuel, LLC (“KCWF”) and Dakota Renewable Hydrogen, LLC (“DRH”), respectively. In December 2023 the agreements with ZEDI related to the two Project LLCs were amended to remove certain kickout rights that previously existed.
Each Project LLC is currently funded via advances for certain long lead equipment items from Gevo. The Company has made certain refundable project advances indirectly to the Project LLCs via ZEDI, to induce ZEDI to design and construct the power generation, transmission and distribution facilities that will serve NZ1.
Each Project LLC is a VIE, and the Company holds an implicit variable interest in each Project LLC. As of December 2023, we have concluded that the removal of the kickout rights from the agreements has resulted in a loss of control and that, therefore, the Company is no longer the primary beneficiary of the Project LLCs. The Project LLCs are a VIE because their equity is insufficient to maintain its on-going collateral requirements without additional financial support from the Company.
There was
23. Segments
Operating segments are defined as components of an entity for which discrete financial information is available that is regularly reviewed by the Chief Operating Decision Maker (“CODM”) in deciding how to allocate resources to an individual segment and in assessing performance. The Company’s Chief Executive Officer is the CODM. The CODM reviews financial information presented on a consolidated basis for purposes of making operating decisions, allocating resources, and evaluating financial performance. As such, management has determined that the Company has organized its operations and activities into
Gevo segment. The Gevo segment is responsible for all research and development activities related to the future production of SAF, commercial opportunities for other renewable hydrocarbon products, such as hydrocarbons for gasoline blendstocks and diesel fuel; ingredients for the chemical industry, such as ethylene and butenes; plastics and materials; and other chemicals. The Gevo segment also develops, maintains and protects its intellectual property portfolio, provides corporate oversight services, and is responsible for development and construction of our Net-Zero Projects and Verity.
Agri-Energy segment. The Agri-Energy segment is currently responsible for the operation of the Company’s Luverne Facility, and the development and optimization of the production of isobutanol, ethanol and related products.
87
Renewable Natural Gas segment. The Renewable Natural Gas segment produces-pipeline quality methane gas captured from dairy cow manure.
Year Ended December 31, 2023 | ||||||||||||
|
|
| Renewable |
| ||||||||
Gevo | Agri-Energy | Natural Gas | Consolidated | |||||||||
Revenues | $ | | $ | — | $ | | $ | | ||||
Depreciation and amortization | $ | ( | $ | ( | $ | ( | $ | ( | ||||
Loss from operations | $ | ( | $ | ( | $ | ( | $ | ( | ||||
Interest income | $ | | $ | — | $ | — | $ | | ||||
Interest expense | $ | ( | $ | ( | $ | ( | $ | ( | ||||
Acquisitions of property, plant, and equipment | $ | | $ | | $ | | $ | |
Year Ended December 31, 2022 | ||||||||||||
Renewable | ||||||||||||
| Gevo |
| Agri-Energy |
| Natural Gas |
| Consolidated | |||||
Revenues | $ | | $ | | $ | | $ | | ||||
Depreciation and amortization | $ | ( | $ | ( | $ | ( | $ | ( | ||||
Loss from operations | $ | ( | $ | ( | $ | ( | $ | ( | ||||
Interest income | $ | | $ | — | $ | — | $ | | ||||
Interest expense | $ | ( | $ | | $ | ( | $ | ( | ||||
Acquisitions of property, plant, and equipment | $ | | $ | | $ | | $ | |
December 31, 2023 | ||||||||||||
Renewable | ||||||||||||
| Gevo |
| Agri-Energy |
| Natural Gas |
| Consolidated | |||||
Total assets | $ | | $ | | $ | | $ | |
December 31, 2022 | ||||||||||||
Renewable | ||||||||||||
| Gevo |
| Agri-Energy |
| Natural Gas |
| Consolidated | |||||
Total assets | $ | | $ | | $ | | $ | |
24. Subsequent Events.
On February 29, 2024, the Company received notice from Nasdaq that the Company was not in compliance with Nasdaq Listing Rule 5550(a)(2) (the “Minimum Bid Price Requirement”), as the minimum bid price of its common stock had been below $1.00 per share for the previous 30 consecutive business days. The Company has 180 calendar days, or until August 27, 2024, to regain compliance with the Minimum Bid Price Requirement. To regain compliance, the minimum bid price of our common stock must meet or exceed $1.00 per share for a minimum of ten consecutive business days during the compliance grace period. In the event the Company does not regain compliance with the Minimum Bid Price Requirement by August 27, 2024, the Company may be eligible for an additional 180-calendar day compliance period.
88
Item 9. | Changes in and Disagreements with Accountants on Accounting and Financial Disclosure |
None.
Item 9A.Controls and Procedures
Evaluation of Disclosure Controls and Procedures
We maintain disclosure controls and procedures, as such term is defined in Rules 13a-15(e) and 15d-15(e) under the Exchange Act, that are designed to provide reasonable assurance that information required to be disclosed by us in the reports that we file or submit under the Exchange Act is recorded, processed, summarized and reported within the time periods specified in the SEC rules and regulations, and that such information is accumulated and communicated to our management, including our Chief Executive Officer and Principal Financial Officer, as appropriate, to allow timely decisions regarding required financial disclosures. In designing and evaluating the disclosure controls and procedures, management recognizes that any controls and procedures, no matter how well designed and operated, can provide only reasonable assurance of achieving the desired control objectives, and management is required to apply its judgment in evaluating the cost-benefit relationship of possible controls and procedures.
Based on their evaluation, our Chief Executive Officer and our Chief Financial Officer concluded that our disclosure controls and procedures were effective as of December 31, 2023.
Remediation of Material Weakness
A material weakness is a deficiency, or a combination of deficiencies, in internal control over financial reporting, such that there is a reasonable possibility that a material misstatement of the annual or interim financial statements will not be prevented or detected on a timely basis. In connection with the preparation of the Company’s consolidated financial statements for the three and nine months ended September 30, 2023, management identified a material weakness related to the ineffective design of internal controls to identify and evaluate the existence of, and accounting for, variable interest entities (“VIEs”). This material weakness resulted in the failure to timely identify two potential VIEs requiring consolidation at the time the Company entered into the agreements. This material weakness resulted in a prior period adjustment to our consolidated financial statements as of and for the period ended September 30, 2023.
In order to remediate the material weakness, management implemented the following procedures during the year ended December 31, 2023:
● | The design and operating effectiveness of the Company’s internal controls covering contract reviews and analysis were evaluated and new processes and procedures were introduced to ensure new and historical agreements are properly reviewed for the existence of potential VIEs. |
● | A comprehensive review of contracts the Company is party to was performed to ensure proper VIE accounting conclusions were reached. |
● | Management engaged expert, third-party advisory services to assist in supporting management’s analysis and processes, as well as further strengthen the precision of management’s review controls for the assessment of potential VIEs. |
During the fourth quarter of fiscal 2023, the Company completed its testing of the implemented controls. Based on the foregoing remediation activities and testing of controls, management concluded that the material weakness has been fully remediated as of December 31, 2023.
89
Management’s Report on Internal Control over Financial Reporting
Our management is responsible for establishing and maintaining adequate internal control over financial reporting, as defined in Rules 13a-15(f) and 15d-15(f) of the Exchange Act. Our internal control over financial reporting is a process designed to provide reasonable assurance regarding the reliability of financial reporting and the preparation of financial statements for external purposes in accordance with generally accepted accounting principles. Our internal control over financial reporting includes those policies and procedures that (i) pertain to the maintenance of records that, in reasonable detail, accurately and fairly reflect the transactions and dispositions of our assets; (ii) provide reasonable assurance that transactions are recorded to permit preparation of financial statements in accordance with generally accepted accounting principles, and that receipts and expenditures of the Company are made only in accordance with authorizations of our management and directors; and (iii) provide reasonable assurance regarding prevention or timely detection of unauthorized acquisition, use or disposition of our assets that could have a material effect on our financial statements.
Because of its inherent limitations, internal control over financial reporting may not prevent or detect misstatements. Projections of any evaluation of effectiveness to future periods are subject to the risk that controls may become inadequate because of changes in conditions, or that the degree of compliance with the policies or procedures may deteriorate.
Under the supervision and with the participation of our management, including our Chief Executive Officer and our Chief Financial Officer, we conducted an evaluation of the effectiveness of our internal control over financial reporting based on the framework set forth in Internal Control—Integrated Framework (2013 framework) issued by the Committee of Sponsoring Organizations of the Treadway Commission. Based upon the results of the evaluation, our management concluded that our internal control over financial reporting was effective as of December 31, 2023.
Changes in Internal Control Over Financial Reporting
Except for additional control improvements implemented, stemming from the remediation of the material weakness discussed above, there were no changes in our internal control over financial reporting during the quarter ended December 31, 2023 that have materially affected, or are reasonably likely to materially affect, our internal control over financial reporting.
Item 9B.Other Information
During our last fiscal quarter, the below directors and/or officers, as defined in Rule 16a-1(f),
Name and Title | Action | Date | Duration of Plan | Total Number of Shares of Common Stock to be Purchased or Sold |
Up to | ||||
Up to |
No other directors or officers, as defined in Rule 16a-1(f), adopted, modified and/or terminated a “Rule 10b5-1 trading arrangement,” or a “non-Rule 10b5-1 trading arrangement,” each as defined in Item 408 of Regulation S-K, during our last fiscal quarter.
90
Item 9C. Disclosure Regarding Foreign Jurisdictions that Prevent Inspections
None.
PART III
Item 10. | Directors, Executive Officers and Corporate Governance |
The information required by this item is incorporated by reference to our definitive proxy statement for the 2024 annual meeting of stockholders to be filed with the SEC within 120 days after our fiscal year ended December 31, 2023.
We have a written code of business conduct and ethics in place that applies to all of our directors, officers and employees, including our principal executive officer, principal financial officer, and principal accounting officer. A copy of our code of ethics is available on our website: https://investors.gevo.com/corporate/corporate-governance/. We are required to disclose certain changes to, or waivers from, that code for our senior financial officers. We intend to use our website as a method of disseminating any change to, or waiver from, our code of ethics as permitted by applicable SEC rules.
Item 11. | Executive Compensation |
The information required by this item is incorporated by reference to our definitive proxy statement for the 2024 annual meeting of stockholders to be filed with the SEC within 120 days after our fiscal year ended December 31, 2023.
Item 12. | Security Ownership of Certain Beneficial Owners and Management and Related Stockholder Matters |
The information required by this item is incorporated by reference to our definitive proxy statement for the 2024 annual meeting of stockholders to be filed with the SEC within 120 days after our fiscal year ended December 31, 2023.
Item 13. | Certain Relationships and Related Transactions, and Director Independence |
The information required by this item is incorporated by reference to our definitive proxy statement for the 2024 annual meeting of stockholders to be filed with the SEC within 120 days after our fiscal year ended December 31, 2023.
Item 14. | Principal Accountant Fees and Services |
The information required by this item is incorporated by reference to our definitive proxy statement for the 2024 annual meeting of stockholders to be filed with the SEC within 120 days after our fiscal year ended December 31, 2023.
91
PART IV
Item 15. | Exhibits, Financial Statement Schedules |
(a)(1) Financial Statements
The following Consolidated Financial Statements are included:
| Page | |
55 | ||
57 | ||
58 | ||
59 | ||
60 | ||
61 | ||
63 |
(a)(2) Financial Statement Schedules
All financial statement schedules have been omitted because they are not applicable or are not required, or because the information required to be set forth therein is included in the Consolidated Financial Statements or notes thereto.
(a)(3) Exhibits
| Incorporated by Reference |
| ||||||||||
---|---|---|---|---|---|---|---|---|---|---|---|---|
Exhibit |
| Description |
| Form |
| File No. |
| Filing Date |
| Exhibit |
| Filed |
|
|
|
|
|
|
| ||||||
3.1 | Amended and Restated Certificate of Incorporation of Gevo, Inc. | 10-K | 001-35073 | February 24, 2022 | 3.1 | |||||||
|
|
|
|
|
|
| ||||||
3.2 | 8-K | 001-35073 | November 24, 2021 | 3.1 |
| |||||||
|
|
|
|
|
|
| ||||||
4.1 | S-1 | 333-168792 | January 19, 2011 | 4.1 |
| |||||||
|
|
|
|
|
|
| ||||||
4.2 | 8-K | 001-35073 | July 8, 2020 | 4.1 |
| |||||||
4.3 | 8-K | 001-35073 | June 8 2022 | 4.1 | ||||||||
|
|
|
|
|
|
| ||||||
4.4 | 10-K | 001-35073 | February 24, 2022 | 4.3 | ||||||||
|
|
|
|
|
|
| ||||||
10.1# | 8-K | 001-35073 | May 25, 2023 | 10.1 |
| |||||||
|
|
|
|
|
|
| ||||||
10.2# | Form of Restricted Stock Unit Agreement under the Amended and Restated 2010 Stock Incentive Plan. | S-1 | 333-168792 | January 19, 2011 | 10.15 |
| ||||||
|
|
|
|
|
|
| ||||||
10.3# | Form of Restricted Shares Award Agreement under the Amended and Restated 2010 Stock Incentive Plan. | 10-Q | 001-35073 | August 8, 2018 | 10.7 |
| ||||||
|
|
|
|
|
|
| ||||||
10.4# | Form of Stock Option Award Agreement under the Amended and Restated 2010 Stock Incentive Plan. | 10-Q | 001-35073 | August 8, 2018 | 10.6 |
| ||||||
|
|
|
|
|
|
|
92
| Incorporated by Reference |
| ||||||||||
---|---|---|---|---|---|---|---|---|---|---|---|---|
Exhibit |
| Description |
| Form |
| File No. |
| Filing Date |
| Exhibit |
| Filed |
10.5# | 10-Q | 001-35073 | August 8, 2018 | 10.8 | ||||||||
10.6# | S-8 | 333-172771 | March 11, 2011 | 4.7 | ||||||||
10.7# | 10-Q | 001-35073 | November 2, 2011 | 10.1 | ||||||||
10.8# | Form of Indemnification Agreement between Gevo, Inc. and its directors and officers. | S-1 | 333-168792 | January 19, 2011 | 10.33 | |||||||
10.9# | Employment Agreement, dated June 4, 2010, by and between Gevo, Inc. and Patrick Gruber. | S-1 | 333-168792 | November 4, 2010 | 10.14 | |||||||
10.10# | Amendment Agreement, dated December 21, 2011, by and between Gevo, Inc. and Patrick Gruber. | 8-K | 001-35073 | December 27, 2011 | 10.1 | |||||||
10.11# | Second Amendment Agreement, dated February 16, 2015, by and between Gevo, Inc. and Patrick Gruber. | 8-K | 001-35073 | February 17, 2015 | 10.1 | |||||||
10.12# | Employment Agreement, dated June 4, 2010, by and between Gevo, Inc. and Christopher Ryan. | S-1 | 333-168792 | November 4, 2010 | 10.16 | |||||||
10.13# | Offer Letter, dated November 9, 2019, by and between Gevo, Inc. and L. Lynn Smull. | 8-K | 001-35073 | November 15, 2019 | 10.1 | |||||||
10.14# | Offer Letter, dated February 16, 2021, by and between Gevo Inc. and Paul Bloom. | 10-Q | 001-35073 | May 14, 2021 | 10.6 | |||||||
10.15† | S-3 | 333-276515 | January 16, 2024 | 1.2 |
| |||||||
|
|
|
|
|
|
| ||||||
10.16+ | 8-K | 001-35073 | August 18, 2020 | 10.1 |
| |||||||
10.17+ | 8-K | 001-35073 | August 9, 2021 | 10.1 | ||||||||
10.18+ | 8-K | 001-35073 | August 9, 2021 | 10.2 | ||||||||
93
| Incorporated by Reference |
| ||||||||||
---|---|---|---|---|---|---|---|---|---|---|---|---|
Exhibit |
| Description |
| Form |
| File No. |
| Filing Date |
| Exhibit |
| Filed |
10.19+ | 8-K | 001-35073 | August 9, 2021 | 10.3 | ||||||||
10.20+ | 8-K | 001-35073 | August 9, 2021 | 10.4 | ||||||||
10.21+†† | 8-K | 001-35073 | September 23, 2021 | 10.1 | ||||||||
10.22 | 8-K | 001-35073 | April 15, 2021 | 10.1 | ||||||||
10.23++ | 8-K | 001-35073 | April 15, 2021 | 10.2 | ||||||||
10.24+ | Fuel Supply Agreement, dated March 16, 2022, by and between Gevo, Inc. and Delta Air Lines, Inc. | 8-K | 001-35073 | March 22, 2022 | 10.1 | |||||||
10.25+ | Fuel Supply Agreement, dated March 18, 2022, by and between Gevo, Inc. and British Airways plc. | 8-K | 001-35073 | March 21, 2022 | 10.1 | |||||||
10.26+ | Fuel Supply Agreement, dated July 18, 2022, by and between Gevo, Inc. and American Airlines, Inc. | 8-K | 001-35073 | July 22, 2022 | 10.1 | |||||||
10.27++ | 10-Q | 001-35073 | August 8, 2022 | 10.2 | ||||||||
10.28# | 8-K | 001-35073 | December 2, 2022 | 10.1 | ||||||||
10.29+ | 10-Q | 001-35073 | August 10, 2023 | 10.1 | ||||||||
10.30+ | 10-Q | 001-35073 | March 15, 2023 | 10.1 | ||||||||
94
| Incorporated by Reference |
| ||||||||||
---|---|---|---|---|---|---|---|---|---|---|---|---|
Exhibit |
| Description |
| Form |
| File No. |
| Filing Date |
| Exhibit |
| Filed |
10.31+ | Side Agreement, dated May 5, 2023, by and between Axens North America, Inc. and Gevo, Inc. | 10-Q | 001-35073 | August 10, 2023 | 10.2 | |||||||
10.32+ | 10-Q | 001-35073 | August 10, 2023 | 10.3 | ||||||||
10.33+ | 8-K | 001-35073 | December 13, 2023 | 10.1 | ||||||||
10.34 | X | |||||||||||
10.35 | X | |||||||||||
10.36 | X | |||||||||||
10.37+ | X | |||||||||||
21.1 | X | |||||||||||
23.1 | X | |||||||||||
31.1 | Section 302 Certification of the Principal Executive Officer. | X | ||||||||||
31.2 | Section 302 Certification of the Principal Financial Officer. | X | ||||||||||
32.1 * | Section 906 Certifications of the Principal Executive Officer and the Principal Financial Officer. | * | ||||||||||
97 | X | |||||||||||
101.INS | Inline XBRL Instance Document (the Instance Document does not appear in the Interactive Data File because its XBRL tags are embedded within the Inline XBRL document) | X | ||||||||||
95
| Incorporated by Reference |
| ||||||||||
---|---|---|---|---|---|---|---|---|---|---|---|---|
Exhibit |
| Description |
| Form |
| File No. |
| Filing Date |
| Exhibit |
| Filed |
101.SCH | Inline XBRL Taxonomy Extension Schema | X | ||||||||||
101.CAL | Inline XBRL Taxonomy Extension Calculation Linkbase | X | ||||||||||
101.DEF | Inline XBRL Taxonomy Extension Definition Linkbase | X | ||||||||||
01.LAB | Inline XBRL Taxonomy Extension Label Linkbase | X | ||||||||||
101.PRE | Inline XBRL Taxonomy Extension Presentation Linkbase | X | ||||||||||
104 | Cover Page Interactive Data File (embedded within the Inline XBRL and contained in Exhibit 101) |
† | Certain portions have been omitted pursuant to a confidential treatment request. Omitted information has been filed separately with the SEC. |
+ | Certain portions of the exhibit have been omitted pursuant to Rule 601(b)(10) of Regulation S-K. The omitted information is (i) not material and (ii) would likely cause competitive harm to the Company if publicly disclosed. |
++ | Confidential portions of the exhibit have been redacted from the filed version of the exhibit and are marked with a *** |
†† | Schedules have been omitted pursuant to Item 601(a)(5) of Regulation S-K. The Company hereby undertakes to supplementally furnish copies of any omitted schedules to the Securities and Exchange Commission upon request. |
# | Indicates a management contract or compensatory plan or arrangement. |
* | Furnished herewith |
(b) Exhibits
See Item 15(a)(3) above.
(c) Financial Statement Schedules
See Item 15(a)(2) above.
Item 16. | Form 10-K Summary |
None.
96
SIGNATURES
Pursuant to the requirements of Section 13 or 15(d) of the Securities Exchange Act of 1934, the registrant has duly caused this Report to be signed on its behalf by the undersigned, thereunto duly authorized.
Gevo, Inc. | ||
(REGISTRANT) | ||
By: | /s/ Alisher Nurmat | |
Alisher Nurmat, CPA | ||
Date: March 7, 2024 |
Pursuant to the requirements of the Securities Exchange Act of 1934, this Report has been signed below by the following persons on behalf of the registrant and in the capacities and on the dates indicated:
Signatures |
| Title |
| Date |
/s/ PATRICK R. GRUBER | Chief Executive Officer (Principal Executive Officer) and Director | March 7, 2024 | ||
Patrick R. Gruber, Ph.D. | ||||
/s/ L. LYNN SMULL | Chief Financial Officer (Principal Financial Officer) | March 7, 2024 | ||
L. Lynn Smull | ||||
/s/ ALISHER NURMAT | Vice President of Accounting and Treasurer (Principal Accounting Officer) | March 7, 2024 | ||
Alisher Nurmat, CPA | ||||
/s/ WILLIAM H. BAUM | Chairperson of the Board of Directors | March 7, 2024 | ||
William H. Baum | ||||
/s/ GARY W. MIZE | Director | March 7, 2024 | ||
Gary W. Mize | ||||
/s/ ANDREW J. MARSH | Director | March 7, 2024 | ||
Andrew J. Marsh | ||||
/s/ JAIME GUILLEN | Director | March 7, 2024 | ||
Jaime Guillen | ||||
/s/ CAROL J. BATTERSHELL | Director | March 7, 2024 | ||
Carol J. Battershell | ||||
/s/ ANGELO AMORELLI | Director | March 7, 2024 | ||
Angelo Amorelli | ||||
/s/ MARY KATHRYN ELLET | Director | March 7, 2024 | ||
Mary Kathryn Ellet |
97