EXHIBIT 13.0

|
Quaint Oak Bancorp, Inc.
|
PRESIDENT’S LETTER TO SHAREHOLDERS
To our Valued Shareholders:
Although 2020 has been a tumultuous year in many respects, it has been a year of significant growth and achievement for Quaint Oak on numerous fronts.
First, I would draw attention to our 95th Anniversary year occurring this coming July, the original Charter having been granted in 1926. We look forward to many more significant anniversaries, celebrating both growth and success.
Secondly, as the pandemic reaches one year of affecting our Country, we mark one year of successfully working remotely in support of our Team Members, our Customers and our Community. The year has witnessed growth in our assets by 60% year over
year ending December 31, 2020. Our annual net income was 31% higher than the previous year of 2019. Significant participation in the first round of the Small Business Administration Paycheck Protection Program (SBA PPP) contributed to our asset
growth. Lending by our Bank and subsidiary Mortgage Company, however, were the contributing factors in our income growth. The deferred income related to our SBA PPP Round One loans has not affected the 2020 income stream. We are also currently
participating in the SBA PPP Round Two Program in continued support of our communities. Additionally, we have participated in the Federal Reserve Bank’s Main Street Loan Program (FRB MSLP) closing over $59 million in these loans during 2020.
Our focus on expansion came in two forms during the year. First, the opening of our Greater Philadelphia Regional Office in the Northern Liberties
neighborhood occurred on February 26, 2020. This event was followed shortly thereafter by the National pandemic shutdown. Despite an understandably slow start, however, the office deposits now stand at approximately $37 million as of March 19,
2021. Our second expansion came with acquiring a majority ownership position in Oakmont Capital Holdings, LLC, a multi-state equipment finance company with operating offices in West Chester, Pennsylvania and Albany, Minnesota. These locations
along with outlets in eight states, support national loan originations. This partnership, we anticipate, will support both cross marketing and expansion opportunities for several of our subsidiary companies.
Following the low rate environment the pandemic introduced, we focused on our liability management. This setting provided the opportunity to
substantially reduce our historic dependency on high cost retail CDs and replace them with both substantially lower cost wholesale CDs and no cost commercial checking accounts. Our focus additionally is toward retaining the commercial customers
that the SBA PPP Rounds One and Two along with the FRB MSLP have provided. Diversity in assets and diversity in non-interest income have been a substantial and long-standing part of our culture. We will endeavor to expand our subsidiary
companies going forward by continuing to enhance those programs.
During the year ended December 31, 2020, the Company repurchased an additional 28,891 shares. To date, we have repurchased well over 40% of the original
shares issued in our initial public offering. We are extremely pleased to have continued to pay dividends without reduction throughout the pandemic period while at the same time increasing stockholder equity by $2.8 million during the calendar
year ended December 31, 2020.
As always, in conjunction with having maintained a strong repurchase plan, our current and continued business strategy includes long-term profitability
and payment of dividends reflecting our strong commitment to shareholder value.
In closing, my best wishes to all as we continue to navigate this challenging time. Be well.

Robert T. Strong
President and Chief Executive Officer
|
Quaint Oak Family of Companies
Quaint Oak Bancorp, Inc.
Quaint Oak Bank
Quaint Oak Abstract, LLC I Quaint Oak Mortgage, LLC I Quaint Oak Real Estate, LLC I Quaint Oak Insurance Agency, LLC
Oakmont Capital Holdings, LLC
Serving the Delaware Valley, Lehigh Valley, and Greater Philadelphia Markets
|
|
Quaint Oak Bancorp, Inc.
|
TABLE OF CONTENTS
|
Page
|
|
|
Selected Consolidated Financial and Other Data
|
1
|
|
Management’s Discussion and Analysis of Financial Condition and Results of Operations
|
2
|
| Reports of Independent Registered Public Accounting Firm |
19 |
|
Consolidated Balance Sheets
|
21
|
|
Consolidated Statements of Income
|
22
|
|
Consolidated Statements of Comprehensive Income
|
23
|
|
Consolidated Statements of Stockholders’ Equity
|
24
|
|
Consolidated Statements of Cash Flows
|
25
|
|
Notes to Consolidated Financial Statements
|
26
|
|
General Information
|
69
|
|
Locations
|
70
|
|
Quaint Oak Bancorp, Inc.
|
SELECTED CONSOLIDATED FINANCIAL AND OTHER DATA
Set forth below is selected financial and other data of Quaint Oak Bancorp, Inc. You should read the financial statements and related notes contained in this Annual Report which provide more detailed
information.
|
At or For the Years Ended December 31,
|
||||||||
|
2020
|
2019
|
|||||||
|
(Dollars in Thousands)
|
||||||||
|
Selected Financial and Other Data:
|
||||||||
|
Total assets
|
$
|
484,075
|
$
|
302,540
|
||||
|
Cash and cash equivalents
|
33,913
|
14,555
|
||||||
|
Investment in interest-earning time deposits
|
9,463
|
10,172
|
||||||
|
Investment securities available for sale at fair value
|
10,725
|
7,623
|
||||||
|
Loans held for sale
|
53,191
|
8,928
|
||||||
|
Loans receivable, net
|
359,122
|
246,692
|
||||||
|
Federal Home Loan Bank stock, at cost
|
1,665
|
1,580
|
||||||
|
Premises and equipment, net
|
2,341
|
2,226
|
||||||
|
Deposits
|
354,845
|
227,458
|
||||||
|
Federal Home Loan Bank borrowings
|
38,193
|
36,271
|
||||||
|
Subordinated debt
|
7,899
|
7,865
|
||||||
|
Stockholders’ Equity
|
28,728
|
25,907
|
||||||
|
Selected Operating Data:
|
||||||||
|
Total interest income
|
$
|
16,323
|
$
|
14,111
|
||||
|
Total interest expense
|
5,488
|
5,426
|
||||||
|
Net interest income
|
10,835
|
8,685
|
||||||
|
Provision for loan losses
|
830
|
303
|
||||||
|
Net interest income after provision for loan losses
|
10,005
|
8,382
|
||||||
|
Total non-interest income
|
6,655
|
4,953
|
||||||
|
Total non-interest expense
|
12,123
|
9,908
|
||||||
|
Income before income taxes
|
4,537
|
3,427
|
||||||
|
Income taxes
|
1,292
|
950
|
||||||
|
Net income
|
$
|
3,245
|
$
|
2,477
|
||||
|
Selected Operating Ratios(1):
|
||||||||
|
Average yield on interest-earning assets
|
4.41
|
%
|
5.17
|
%
|
||||
|
Average rate on interest-bearing liabilities
|
1.74
|
2.25
|
||||||
|
Average interest rate spread(2)
|
2.67
|
2.91
|
||||||
|
Net interest margin(2)
|
2.93
|
3.17
|
||||||
|
Average interest-earning assets to average interest-bearing liabilities
|
117.39
|
113.58
|
||||||
|
Net interest income after provision for loan losses to non-interest expense
|
82.52
|
84.60
|
||||||
|
Total non-interest expense to average assets
|
3.15
|
3.46
|
||||||
|
Efficiency ratio(3)
|
69.32
|
72.65
|
||||||
|
Return on average assets
|
0.84
|
0.87
|
||||||
|
Return on average equity
|
12.16
|
10.03
|
||||||
|
Average equity to average assets
|
6.94
|
8.63
|
||||||
|
Asset Quality Ratios(4):
|
||||||||
|
Non-performing loans as a percent of loans receivable, net(5)
|
0.18
|
%
|
0.15
|
%
|
||||
|
Non-performing assets as a percent of total assets(5)
|
0.19
|
0.72
|
||||||
|
Non-performing assets and troubled debt restructurings as a percent of total assets
|
0.22
|
0.77
|
||||||
|
Allowance for loan losses as a percent of non-performing loans
|
475.83
|
616.30
|
||||||
|
Allowance for loan losses as a percent of total loans receivable
|
0.85
|
0.90
|
||||||
|
Net charge-offs to average loans receivable
|
0.00
|
0.02
|
||||||
|
Capital Ratios(4):
|
||||||||
|
Tier 1 leverage ratio
|
8.56
|
%
|
10.35
|
%
|
||||
|
Common Tier 1 capital ratio
|
13.31
|
13.42
|
||||||
|
Tier 1 risk-based capital ratio
|
13.31
|
13.42
|
||||||
|
Total risk-based capital ratio
|
14.52
|
14.41
|
||||||
___________________
| (1) |
With the exception of end of period ratios, all ratios are based on average daily balances during the indicated periods.
|
| (2) |
Average interest rate spread represents the difference between the average yield on interest-earning assets and the average rate paid on interest-bearing liabilities, and net interest margin represents net
interest income as a percentage of average interest-earning assets.
|
| (3) |
The efficiency ratio represents the ratio of non-interest expense divided by the sum of net interest income and non-interest income.
|
| (4) |
Asset quality ratios and capital ratios are end of period ratios, except for net charge-offs to average loans receivable.
|
| (5) |
Non-performing assets consist of non-performing loans and other real estate owned at December 31, 2020 and 2019. Non-performing loans consist of non-accruing loans plus accruing loans 90 days or more past
due.
|
1
|
Quaint Oak Bancorp, Inc.
|
|
Management’s Discussion and Analysis of Financial Condition and Results of Operations
|
General
Quaint Oak Bancorp, Inc. (the “Company”) was formed in connection with Quaint Oak Bank’s (the “Bank”) conversion to a stock savings bank completed
on July 3, 2007. The Company’s results of operations are dependent primarily on the results of Quaint Oak Bank, a wholly owned subsidiary of the Company, along with the Bank’s wholly owned subsidiaries. At December 31, 2020, the Bank
has five wholly-owned subsidiaries, Quaint Oak Mortgage, LLC, Quaint Oak Real Estate, LLC, Quaint Oak Abstract, LLC, QOB Properties, LLC, and Quaint Oak Insurance Agency, LLC, each a Pennsylvania limited liability company. The mortgage
company offers mortgage banking services in the Lehigh Valley, Delaware Valley and Philadelphia County region of Pennsylvania. The real estate and abstract companies offer real estate sales and title abstract services, respectively,
primarily in the Lehigh Valley region of Pennsylvania. These companies began operation in July 2009. In February 2019, Quaint Oak Mortgage opened a mortgage banking office in Philadelphia, Pennsylvania. QOB Properties, LLC began
operations in July 2012 and holds Bank properties acquired through a foreclosure proceeding or acceptance of a deed in lieu of foreclosure. Quaint Oak Insurance Agency, LLC, located in Chalfont, Pennsylvania, began operations in August
2016 and provides a broad range of personal and commercial insurance coverage solutions. In February 2020, Quaint Oak Bank opened a full-service retail banking office in Philadelphia, Pennsylvania. As of January 4, 2021, the Bank holds a
majority equity position in Oakmont Capital Holdings, LLC, a multi-state equipment finance company based in West Chester, Pennsylvania with a second significant facility located in Albany, Minnesota.
Quaint Oak Bank’s profitability depends, to a large extent, on net interest income, which is the difference between the income earned on its loan
and investment portfolios and the cost of funds, consisting of the interest paid on deposits and borrowings. Results of operations are also affected by provisions for loan losses, fee income and other non-interest income and non-interest
expense. Non-interest expense principally consists of compensation, directors’ fees and expenses, office occupancy and equipment expense, data processing expense, professional fees, advertising expense, FDIC deposit insurance assessment,
and other expenses.
Quaint Oak Bank’s business consists primarily of originating residential, multi-family and commercial real estate loans secured by property,
commercial business loans, and to a lesser extent other consumer loans in its market area. At December 31, 2020, commercial business loans and commercial real estate loans comprise the largest percentage of Quaint Oak Bank’s loan
portfolio, before net items, at 42.3% and 36.1%, respectively. At December 31, 2020, commercial business loans include $93.3 million of SBA PPP loans. Quaint Oak Bank’s loans are primarily funded by certificates of deposit and money
market accounts. At December 31, 2020, certificates of deposit amounted to 41.2% of total assets compared to 61.0% of total assets at December 31, 2019. At December 31, 2020, money market accounts amounted to 20.6% of total assets
compared to 8.4% of total assets at December 31, 2019. In conjunction with the expansion of our commercial lending activities, we began offering a business checking account, along with a consumer checking account product in December
2014. At December 31, 2020, non-interest bearing checking accounts amounted to 15.3% of total deposits compared to 6.9% of total deposits at December 31, 2019. Management anticipates that certificates of deposit, money market accounts
and business checking will be the primary sources of funding for Quaint Oak Bank’s assets.
Our results of operations are significantly affected by general economic and competitive conditions, particularly with respect to changes in
interest rates, government policies and actions of regulatory authorities as well as other factors beyond our control. Future changes in applicable law, regulations or government policies may materially affect our financial condition and
results of operations.
Forward-Looking Statements Are Subject to Change
This Annual Report contains certain forward-looking statements (as defined in the Securities Exchange Act of 1934
and the regulations thereunder). Forward-looking statements are not historical facts but instead represent only the beliefs, expectations or opinions of the Company and its management regarding future events, many of which, by their
nature, are inherently uncertain. Forward-looking statements may be identified by the use of such words as: “believe”, “expect”, “anticipate”, “intend”, “plan”, “estimate”, or words of similar meaning, or future or conditional terms
such as “will”, “would”, “should”, “could”, “may”, “likely”, “probably”, or “possibly.” Forward-looking statements include, but are not limited to, financial projections and estimates and their underlying assumptions; statements
regarding plans, objectives and expectations with respect to future operations, products and services; and statements regarding future performance. Such statements are subject to certain risks, uncertainties and assumptions, many of
which are difficult to predict and generally are beyond the control of and its management, that could cause actual results to differ materially from those expressed in, or implied or projected by, forward-looking statements. The
following factors, among others, could cause actual results to differ materially from the anticipated results or other expectations expressed in the forward-looking statements: (1) economic and competitive conditions which could affect
the volume of loan originations, deposit flows and real estate values; (2) the levels of non-interest income and expense and the amount of loan losses; (3) competitive pressure among depository institutions increasing significantly; (4)
changes in the interest rate environment causing reduced interest margins; (5) general economic conditions, either nationally or in the markets in which the Company is or will be doing business, being less favorable than expected;(6)
political and social unrest, including acts of war or terrorism; (7) the impact of the current outbreak of the novel
coronavirus (COVID-19) or (8) legislation or changes in regulatory requirements adversely affecting the business in which the Company is or will be engaged. The Company undertakes no obligation to update these forward-looking
statements to reflect events or circumstances that occur after the date on which such statements were made.
2
|
Quaint Oak Bancorp, Inc.
|
|
Management’s Discussion and Analysis of Financial Condition and Results of Operations
|
COVID-19
On March 11, 2020, the World Health Organization declared COVID-19 a pandemic. The effects of COVID-19 did not have a material impact on the financial
results of the Company as of December 31, 2020. Due to orders issued by the governor of Pennsylvania and for the health of our customers and employees, the Bank closed lobbies to all three branch offices but remained fully operational. Other
immediate responses to the pandemic included some of the following actions by the Company:
• Moved more than 92% of its employees to remote work-from-home status.
• Waived fees on deposit accounts and cash management services.
In response to the COVID-19 crisis, the Coronavirus Aid, Relief, and Economic Security (“CARES”) Act was passed by Congress and signed into law on March
27, 2020. The CARES Act provides an estimated $2.2 trillion of economy-wide financial stimulus to combat the pandemic and stimulate the economy in the form of financial aid to individuals, businesses, nonprofits, states, and municipalities
through loans, grants, tax changes, and other types of relief.
The following describes some of our responses to COVID-19 relative to the CARES Act, and other effects of the pandemic on our business.
Paycheck Protection Program. The CARES Act authorized the
Small Business Administration (“SBA”) to temporarily guarantee loans under a new 7(a) loan program called the Paycheck Protection Program (“PPP”). As a qualified SBA lender, we were automatically authorized to originate PPP loans and chose to
participate. For the year ended December 31, 2020, the Bank funded 854 SBA PPP loans totaling approximately $95.1 million to customers located primarily in our market area. Through March 22, 2021, the Bank has processed 161 PPP loans totaling
approximately $11.7 million for forgiveness under the SBA forgiveness program.
On December 27, 2020, the Economic Aid to Hard-Hit Small Businesses, Nonprofits, and Venues Act (the “Economic Aid Act”) became law. The Economic Aid
Act extends the authority to make SBA PPP loans through March 31, 2021. In addition to modifying certain existing PPP requirements, the Economic Aid Act adds a second temporary program to the SBA’s 7(a) Loan Program which allows certain
eligible borrowers to receive a second draw PPP loan.
On January 6, 2021, the U.S. Small Business Administration and the Department of Treasury released interim final rules related to the expansion and
extension of the original Paycheck Protection Program (PPP) and the authorization of a second round of PPP loans pursuant to the $900 billion COVID-19 relief package (the Consolidated Appropriations Act, 2021 (the “Act”)) enacted on December
27, 2020. Through March 22, 2021, the Bank has funded 515 PPP loans totaling approximately $68.9 million under this second round of PPP lending to customers located primarily in our market area.
3
|
Quaint Oak Bancorp, Inc.
|
Management’s Discussion and Analysis of Financial Condition and Results of Operations
Paycheck Protection
Program Liquidity Facility. The CARES Act also allocated a limited amount of funds to the Federal Reserve Board (FRB) with a broad mandate to provide liquidity to eligible businesses, states or
municipalities in light of COVID-19. On April 9, 2020, the U.S. Department of the Treasury announced several new or expanded lending programs to provide relief for businesses and governments. One of these programs was the Paycheck
Protection Program Liquidity Facility (PPPLF). Under the PPPLF, all depository institutions that originate PPP loans are eligible to borrow on a non-recourse basis from their regional Federal Reserve Bank using SBA PPP loans as collateral.
The principal amount of loans will be equal to the PPP loans pledged as collateral. There are no fees associated with these loans and the interest rate is 35 basis points. The maturity date of PPPLF loans will be the same as the maturity
date of the PPP loans pledged as collateral. The PPPLF loan maturity date will be accelerated if the underlying PPP loan goes into default and the lender sells the PPP loan to the SBA under the SBA guarantee. The PPPLF loan maturity date
also will be accelerated for any loan forgiveness reimbursement received by the lender from the SBA.
In April 2020, the Bank received approval to borrow from the FRB under the PPPLF program to assist in funding PPP loans. Through December 31, 2020,
the Bank used the FRB program to fund $52.1 million of PPP loans. Through March 22, 2021, the Bank has paid off approximately $8.5 million of PPP loans pledged as collateral under PPPLF program. Through March 22, 2021 the Bank has not used
the PPPLF program to fund any round two PPP loans.
Loan Modifications/Troubled Debt Restructurings. Under the CARES Act, loans less than 30 days past due as of December 31, 2019 will be considered current for COVID-19 modifications. A financial institution can then suspend the requirements under GAAP for loan modifications
related to COVID-19 that would otherwise be categorized as a troubled debt restructuring (“TDR”), and suspend any determination of a loan modified as a result of COVID-19 as being a TDR, including the requirement to determine impairment for
accounting purposes. Financial institutions wishing to utilize this authority must make a policy election, which applies to any COVID-19 modification made between March 1, 2020 and the earlier of either January 1, 2022 or the 60th day after
the end of the COVID-19 national emergency. Quaint Oak Bank has made that election. Similarly, the Financial Accounting Standards Board has confirmed that short-term modifications made on a good-faith basis in response to COVID-19 to loan
customers who were current prior to any relief will not be considered TDRs.
Prior to the enactment of the CARES Act, the banking regulatory agencies provided guidance as to how certain short-term
modifications would not be considered TDRs, and have subsequently confirmed that such guidance could be applicable for loans that do not qualify for favorable accounting treatment under Section 4013 of the CARES Act.
The Bank addresses loan
payment modification requests on a case-by-case basis considering the effects of the COVID-19 pandemic, related economic slow-down and stay-at-home orders on our customer and their current and projected cash flows through the term of the
loan. Through December 31, 2020, the Bank modified 231 loans with principal balances totaling $90.6 million representing approximately 25.8% of our December 31, 2020 loan balances. A majority of deferrals are two-month payment deferrals of
principal and interest, with payments after deferral increased to collect amounts deferred. In some cases, certain loans were granted additional deferrals.
4
|
Quaint Oak Bancorp, Inc.
|
Management’s Discussion and Analysis of Financial Condition and Results of Operations
Details with respect to total loan payment modifications made through December 31, 2020 are as follows:
|
Number of
Covid-19
Deferments
|
Balance
(in thousands)
|
Percent of
Total Loans at
December 31,
2020
|
||||||||||
|
One-to-four family residential owner occupied
|
5
|
$
|
2,070
|
27.5
|
%
|
|||||||
|
One-to-four family residential non-owner occupied
|
50
|
8,566
|
22.0
|
|||||||||
|
Multi-family residential
|
12
|
9,042
|
37.6
|
|||||||||
|
Commercial real estate
|
97
|
55,274
|
41.9
|
|||||||||
|
Construction
|
1
|
702
|
14.7
|
|||||||||
|
Home equity
|
4
|
254
|
6.7
|
|||||||||
|
Commercial business
|
62
|
14,685
|
9.5
|
|||||||||
|
Total
|
231
|
$
|
90,593
|
25.8
|
%
|
|||||||
Of the 231 loans granted loan payment deferrals through December 31, 2020, 13 loans are still on deferral as of March 15, 2021.
Details with respect to loan payment deferrals still on deferral as of March 15, 2021 are as follows:
|
As of March 15, 2021
|
||||||||||||
|
Number of
Covid-19
Deferments
|
Balance
(in thousands)
|
Percent of
Total Loans at
December 31,
2020
|
||||||||||
|
One-to-four family residential owner occupied
|
1
|
$
|
415
|
5.5
|
%
|
|||||||
|
Commercial real estate
|
8
|
10,287
|
7.8
|
|||||||||
|
Commercial business
|
4
|
6,561
|
4.2
|
|||||||||
|
Total
|
13
|
$
|
17,263
|
4.9
|
%
|
|||||||
It is too early to determine if current active modified loans will perform in accordance with their
modified terms.
Critical Accounting Policies
In reviewing and understanding financial information for the Company, you are encouraged to read and understand the significant accounting policies
used in preparing our financial statements. These policies are described in Note 2 of the notes to our financial statements. The accounting and financial reporting policies of the Company conform to accounting principles generally accepted
in the United States of America and to general practices within the banking industry. Accordingly, the consolidated financial statements require certain estimates, judgments, and assumptions, which are believed to be reasonable, based upon
the information available. These estimates and assumptions affect the reported amounts of assets and liabilities at the date of the financial statements and the reported amounts of income and expenses during the periods presented. The
following accounting policies comprise those that management believes are the most critical to aid in fully understanding and evaluating our reported financial results. These policies require numerous estimates or economic assumptions that
may prove inaccurate or may be subject to variations which may significantly affect our reported results and financial condition for the period or in future periods.
Allowance for Loan Losses. The allowance for loan losses represents management’s estimate of losses inherent in the loan portfolio as of the balance sheet date and is
recorded as a reduction to loans receivable. The allowance for loan losses is increased by the provision for loan losses, and decreased by charge-offs, net of recoveries. Loans deemed to be uncollectible are charged against the
allowance for loan losses, and subsequent recoveries, if any, are credited to the allowance. All, or part, of the principal balance of loans receivable are charged off to the allowance as soon as it is determined that the repayment of
all, or part, of the principal balance is highly unlikely. Because all identified losses are immediately charged off, no portion of the allowance for loan losses is restricted to any individual loan or groups of loans, and the entire
allowance is available to absorb any and all loan losses.
5
|
Quaint Oak Bancorp, Inc.
|
Management’s Discussion and Analysis of Financial Condition and Results of Operations
The allowance for loan losses is maintained at a level considered adequate to provide for losses that can be reasonably anticipated. Management
performs a quarterly evaluation of the adequacy of the allowance. The allowance is based on the Company’s past loan loss experience, known and inherent risks in the portfolio, adverse situations that may affect the borrower’s ability to
repay, the estimated value of any underlying collateral, composition of the loan portfolio, current economic conditions and other relevant factors. This evaluation is inherently subjective as it requires material estimates that may be
susceptible to significant revision as more information becomes available.
The allowance consists of specific, general and unallocated components. The specific component relates to loans that are identified as impaired. For
loans that are identified as impaired, an allowance is established when the discounted cash flows (or collateral value or observable market price) of the impaired loan is lower than the carrying value of that loan. The general component
covers pools of loans by loan class. These pools of loans are evaluated for loss exposure based upon historical loss rates for each of these categories of loans, adjusted for qualitative factors. These significant factors may include changes
in lending policies and procedures, changes in existing general economic and business conditions affecting our primary lending areas, credit quality trends, collateral value, loan volumes and concentrations, seasoning of the loan portfolio,
recent loss experience in particular segments of the portfolio, duration of the current business cycle and bank regulatory examination results. The applied loss factors are reevaluated quarterly to ensure their relevance in the current
economic environment. Residential mortgage lending generally entails a lower risk of default than other types of lending. Consumer loans and commercial real estate loans generally involve more risk of collectability because of the type and
nature of the collateral and, in certain cases, the absence of collateral. It is the Company’s policy to establish a specific reserve for loss on any delinquent loan when it determines that a loss is probable. An unallocated component is
maintained to cover uncertainties that could affect management’s estimate of probable losses. The unallocated component of the allowance reflects the margin of imprecision inherent in the underlying assumptions used in the methodologies for
estimating specific and general losses in the portfolio.
A loan is considered impaired when, based on current information and events, it is probable that the Company will be unable to collect the scheduled
payments of principal or interest when due according to the contractual terms of the loan agreement. Factors considered by management in determining impairment include payment status, collateral value and the probability of collecting
scheduled principal and interest payments when due. Loans that experience insignificant payment delays and payment shortfalls generally are not considered impaired. Management determines the significance of payment delays and payment
shortfalls on a case-by-case basis, taking into consideration all of the circumstances surrounding the loan and the borrower, including the length of the delay, the reasons for the delay, the borrower’s prior payment record and the amount of
the shortfall in relation to the principal and interest owed. Impairment is measured on a loan by loan basis by either the present value of expected future cash flows discounted at the loan’s effective interest rate or the fair value of the
collateral if the loan is collateral dependent. An allowance for loan losses is established for an impaired loan if its carrying value exceeds its estimated fair value. The estimated fair values of substantially all of the Company’s impaired
loans are measured based on the estimated fair value of the loan’s collateral.
A loan is considered a troubled debt restructuring (“TDR”) if the Company, for economic or legal reasons related to a debtor’s financial difficulties,
grants a concession to the debtor that it would not otherwise consider. Concessions granted under a TDR typically involve a temporary or permanent reduction in payments or interest rate or an extension of a loan’s stated maturity date at less
than a current market rate of interest. Loans identified as TDRs are designated as impaired.
For loans secured by real estate, estimated fair values are determined primarily through third-party appraisals. When a real estate secured loan
becomes impaired, a decision is made regarding whether an updated certified appraisal of the real estate is necessary. This decision is based on various considerations, including the age of the most recent appraisal, the loan-to-value ratio
based on the original appraisal and the condition of the property. Appraised values are discounted to arrive at the estimated selling price of the collateral, which is considered to be the estimated fair value. The discounts also include
estimated costs to sell the property.
6
|
Quaint Oak Bancorp, Inc.
|
Management’s Discussion and Analysis of Financial Condition and Results of Operations
The allowance calculation methodology includes further segregation of loan classes into risk rating categories. The borrower’s overall
financial condition, repayment sources, guarantors and value of collateral, if appropriate, are evaluated annually for all loans (except one-to-four family residential owner-occupied loans) where the total
amount outstanding to any borrower or group of borrowers exceeds $500,000, or when credit deficiencies arise, such as delinquent loan payments. Credit quality risk ratings include
regulatory classifications of special mention, substandard, doubtful and loss. Loans criticized special mention have potential weaknesses that deserve management’s close attention. If uncorrected, the potential weaknesses may result in
deterioration of the repayment prospects. Loans classified substandard have a well-defined weakness or weaknesses that jeopardize the liquidation of the debt. They include loans that are inadequately protected by the current sound net
worth and paying capacity of the obligor or of the collateral pledged, if any. Loans classified doubtful have all the weaknesses inherent in loans classified substandard with the added characteristic that collection or liquidation in
full, on the basis of current conditions and facts, is highly improbable. Loans classified as a loss are considered uncollectible and are charged to the allowance for loan losses. Loans not classified are rated pass. In addition,
Federal regulatory agencies, as an integral part of their examination process, periodically review the Company’s allowance for loan losses and may require the Company to recognize additions to the allowance based on their judgments
about information available to them at the time of their examination, which may not be currently available to management. Based on management’s comprehensive analysis of the loan portfolio, management believes the current level of the
allowance for loan losses is adequate.
Other-Than-Temporary Impairment of Securities. Securities are evaluated on at least a quarterly basis, and more frequently when market conditions warrant such an evaluation, to determine whether a decline in their value is other-than-temporary. To determine
whether a loss in value is other-than-temporary, management utilizes criteria such as the reasons underlying the decline, the magnitude and duration of the decline and whether or not management intends to sell or expects that it is more
likely than not that it will be required to sell the security prior to an anticipated recovery of the fair value. The term “other-than-temporary” is not intended to indicate that the decline is permanent, but indicates that the prospects
for a near-term recovery of value are not necessarily favorable, or that there is a lack of evidence to support a realizable value equal to or greater than the carrying value of the investment. Once a decline in value for a debt security
is determined to be other-than-temporary, the other-than-temporary impairment is separated into (a) the amount of the total other-than-temporary impairment related to a decrease in cash flows expected to be collected from the debt
security (the credit loss) and (b) the amount of the total other-than-temporary impairment related to all other factors. The amount of the total other-than-temporary impairment related to the credit loss is recognized in earnings. The
amount of the total other-than-temporary impairment related to all other factors is recognized in other comprehensive income, except for equity securities, where the full amount of the other-than-temporary impairment is recognized in
earnings.
Income Taxes. Deferred income tax assets and liabilities are determined
using the liability (or balance sheet) method. Under this method, the net deferred tax asset or liability is determined based on the tax effects of the temporary differences between the book and tax bases of the various assets and
liabilities and net operating loss carryforwards and gives current recognition to changes in tax rates and laws. The realization of our deferred tax assets principally depends upon our achieving projected future taxable income. We may
change our judgments regarding future profitability due to future market conditions and other factors. We may adjust our deferred tax asset balances if our judgments change.
Comparison of Financial Condition at December 31, 2020 and December 31, 2019
General. The Company’s total assets at December 31, 2020 were $484.1 million,
an increase of $181.5 million, or 60.0%, from $302.5 million at December 31, 2019. This growth in total assets was primarily due to a $112.4 million, or 45.6%, increase, in loans receivable, net, and a $44.3 million, or 495.8%, increase
in loans held for sale. The largest increases within the loan portfolio occurred in commercial business loans which increased $108.6 million, or 237.5%, and commercial real estate loans which increased $12.5 million, or 10.5%. The
increase in commercial business loans was due primarily to the $95.1 million of SBA PPP loans generated during the year ended December 31, 2020. These increases were partially offset by a $7.7 million, or 61.9%, decrease in construction
loans.
7
|
Quaint Oak Bancorp, Inc.
|
Management’s Discussion and Analysis of Financial Condition and Results of Operations
Cash and Cash Equivalents. Cash and cash equivalents increased $19.4
million, or 133.0%, from $14.6 million at December 31, 2019 to $33.9 million at December 31, 2020 with the expectation that excess liquidity will be used to fund loans.
Investment Securities Available for Sale. Investment securities available for
sale increased $3.1 million, or 40.7%, from $7.6 million at December 31, 2019 to $10.7 million at December 31, 2020 due primarily to the purchase of three securities totaling $4.0 million. These purchases were offset by principal
repayments of $1.0 million on these securities during the year ended December 31, 2020.
Loans Held for Sale. Loans held for sale increased $44.3 million, or 495.8%,
from $8.9 million at December 31, 2019 to $53.2 million at December 31, 2020 as the Bank’s mortgage banking subsidiary, Quaint Oak Mortgage, LLC, originated $207.1 million of one-to-four family residential loans during the year ended
December 31, 2020 and sold $162.8 million of these loans in the secondary market during this same period. The Bank did not originate or sell any equipment loans held for sale during the same period.
Loans Receivable, Net. Loans receivable, net, increased $112.4 million, or
45.6% funded primarily from deposits, FHLB borrowings, borrowings under the Federal Reserve’s Paycheck Protection Program Liquidity Facility, and excess liquidity. Increases within the portfolio consisted of commercial business loans
which increased $108.6 million, or 237.5%, commercial real estate loans which increased a $12.5 million, or 10.5%, multi-family residential loans which increased $1.8 million, or 8.1%, one-to-four family residential owner occupied loans
which increased $1.2 million, or 19.5%, and home equity loans which increased $62,000, or 1.7%. These increases were partially offset by a $7.7 million, or 61.9%, decrease in construction loans, a $1.0 million, or 2.5% decrease in
one-to-four family residential non-owner occupied loans, and other consumer loans which decreased $5,000, or 22.7%. The Company continues its strategy of diversifying its loan portfolio with higher yielding and shorter-term loan products
and selling substantially all of its newly originated one-to-four family owner-occupied loans into the secondary market.
Federal Home Loan Bank Stock. Federal Home Loan Bank stock increased
$85,000, or 5.4%, from $1.6 million at December 31, 2019 to $1.7 million at December 31, 2020 as the Bank increased its level of FHLB borrowings.
Bank-Owned Life Insurance. The Company purchased $3.5 million in bank-owned
life insurance (BOLI) as a mechanism for funding various employee benefit costs. The Company is the beneficiary of these policies that insure the lives of certain officers of its subsidiaries. The cash surrender value of the insurance policies amounted to $4.1 million and $4.0 million at December 31, 2020 and 2019, respectively.
Premises and Equipment, Net. Premises and equipment, net, increased
$115,000, or 5.2%, to $2.3 million at December 31, 2020 from $2.2 million at December 31, 2019. The increase was due primarily to expenditures related to our second regional office in Philadelphia which opened in February 2020, the
renovation of our 1710 Union Boulevard, Allentown, Pennsylvania location and computer system upgrades.
Goodwill and Other Intangible, Net. Goodwill and other intangible assets,
net of accumulated amortization, is related to the acquisition by Quaint Oak Insurance Agency of the renewal rights to a book of business on August 1, 2016 at a total cost of $1.0 million. Based on a valuation, $515,000 of the purchase
price was determined to be goodwill and $485,000 was determined to be related to the renewal rights to the book of business and deemed to be an other intangible asset. This other intangible asset is being amortized over a ten year period
based upon the annual retention rate of the book of business. The balance of other intangible asset at December 31, 2020 was $271,000, net of accumulated amortization of $214,000.
Other Real Estate Owned, Net. At December 31, 2020, other real estate owned
(OREO) amounted to $286,000, consisting of one property that was collateral for a non-performing construction loan. OREO amounted to $1.8 million at December 31, 2019 consisting of four properties that were collateral for a
non-performing construction loan. During the year ended December 31, 2020, the Company made $270,000 of capital improvements to the properties, sold three properties totaling $1.7 million and realized a net loss of $92,000, and wrote-down
one property totaling $105,000. Non-performing assets amounted to $929,000, or 0.19% of total assets at December 31, 2020 compared to $2.2 million, or 0.72% of total assets at December 31, 2019.
8
|
Quaint Oak Bancorp, Inc.
|
Management’s Discussion and Analysis of Financial Condition and Results of Operations
Prepaid Expenses and Other Assets. Prepaid expenses and other assets increased
$2.7 million, or 96.7%, to $5.5 million at December 31, 2020 from $2.8 million at December 31, 2019, due primarily to a $1.6 million increase in receivables due from wholesalers on the sale of mortgage loans, a $540,000 increase in the net
deferred tax asset, and a $513,000 net increase in the right-of-use asset driven by the capitalization of the Company’s 117-12 Spring Garden Street, Philadelphia, Pennsylvania lease in accordance with the Financial Accounting Standards
Board accounting standard ASU 2016-02, Leases (Topic 842).
Deposits. Total deposits increased $127.4 million, or 56.0%, to $354.8 million
at December 31, 2020 from $227.5 million at December 31, 2019. This increase in deposits was primarily attributable to increases of $74.1 million, or 290.7%, in money market accounts, $38.4 million, or 243.6% in non-interest bearing
checking accounts, $15.0 million, or 8.1%, in certificates of deposit, and $3,000, or 60.0% in passbook accounts, partially offset by a decrease of $152,000, or 8.8%, in savings accounts.
Borrowings. Aggregate FHLB borrowings increased $1.9 million, or 5.3%, to $38.2
million at December 31, 2020 from $36.3 million at December 31, 2019. Short-term FHLB advances were $10.0 million at December 31, 2019 and December 31, 2020. During the year ended December 31, 2020, the Company borrowed $20.0 million of
short-term FHLB advances, used excess liquidity to pay off $16.0 million, and termed-out $4.0 million of advances at varying maturities. Long-term FHLB borrowings increased $1.9 million, or 7.3%, from $26.3 million at December 31, 2019 to
$28.2 million at December 31, 2020, as a result of the pay-off of a $1.0 million term loan that matured in September 2020, a $1.0 million term loan that matured in December 2020 and termed-out $4.0 million of advances at varying maturities.
Federal Reserve Bank (FRB) long-term borrowings increased to $48.1 million from none at December 31, 2019 as the Company utilized FRB borrowings to fund PPP loans under the FRB’s Paycheck Protection Program Liquidity Facility (PPPLF). Under
the PPPLF the Company pledged certain PPP loans as collateral and borrowed from the FRB at a rate of 0.35% that is fixed for two years.
Subordinated Debt. On December 27, 2018, the Company issued $8.0 million in
subordinated notes. These notes have a maturity date of December 31, 2028, and bear interest at a fixed rate of 6.50%. The Company may, at its option, at any time on an interest payment date on or after December 31, 2023, redeem the notes,
in whole or in part, at par plus accrued interest to the date of redemption. The balance of subordinated debt, net of unamortized debt issuance costs, was $7.9 million at December 31, 2020 and 2019.
Accrued Expenses and Other Liabilities. Accrued expenses and other liabilities
increased $1.5 million, or 76.2%, to $3.4 million at December 31, 2020 from $1.9 million at December 31, 2019, due primarily to a $532,000, or 40.8%, increase in lease liability driven by the capitalization of the Company’s 117-12 Spring
Garden Street, Philadelphia, Pennsylvania lease in accordance with the Financial Accounting Standards Board accounting standard ASU 2016-02, Leases (Topic 842). Also contributing to the increase in accrued expenses and other liabilities is
a $740,000 increase in the net tax liability. The remainder of the increase is attributable to an increase in other expense accruals.
Stockholders’ Equity. Total stockholders’ equity increased $2.8 million, or
10.9%, to $28.7 million at December 31, 2020 from $25.9 million at December 31, 2019. Contributing to the increase was net income for the year ended December 31, 2020 of $3.2 million, common stock earned by participants in the employee
stock ownership plan of $173,000, amortization of stock awards and options under our stock compensation plans of $173,000, the reissuance of treasury stock under the Bank’s 401(k) Plan of $97,000, other comprehensive income, net of $98,000,
and the reissuance of treasury stock for exercised stock options of $101,000. These increases were partially offset by dividends paid of $717,000 and by the purchase of treasury stock of $349,000.
9
|
Quaint Oak Bancorp, Inc.
|
Management’s Discussion and Analysis of Financial Condition and Results of Operations
Comparison of Operating Results for the Years Ended December 31, 2020 and 2019
General. Net income amounted to $3.2 million for the year ended December 31,
2020 compared to $2.5 million for the year ended December 31, 2019, an increase of $768,000, or 31.0%. The increase was primarily the result of an increase in net interest
income of $2.2 million and an increase in non-interest income of $1.7 million, partially offset by an increase in non-interest expense of $2.2 million, an increase in the provision for loan losses of $527,000 and an increase in the
provision for income taxes of $342,000.
Net Interest Income. Net interest income increased $2.1 million, or 24.8%, to
$10.8 million for the year ended December 31, 2020 from $8.7 million for the year ended December 31, 2019. The increase in net interest income was driven by a $2.2 million, or 15.7% increase in interest income, partially offset by a
$62,000, or 1.1%, increase in interest expense.
Interest Income. Interest income increased $2.2 million, or 15.7%, to $16.3
million for the year ended December 31, 2020 from $14.1 million for the year ended December 31, 2019. The increase in interest income was primarily due to a $93.9 million increase in average loans receivable, net, including loans held for
sale, which increased from an average balance of $238.2 million for the year ended December 31, 2019 to an average balance of $332.1 million for the year ended December 31, 2020, and had the effect of increasing interest income $5.2
million. The increase in interest income was also due to a $1.1 million increase in average investment securities available for sale, which increased from an average balance of $8.3 million for the year ended December 31, 2019 to an average
balance of $9.4 million for the year ended December 31, 2020, and had the effect of increasing interest income $29,000. The increase in interest income was also due to a $1.1 million increase in average cash and cash equivalents due from
banks, interest bearing, which increased from an average balance of $16.3 million for the year ended December 31, 2019 to an average balance of $17.4 million for the year ended December 31, 2020, and had the effect of increasing interest
income $24,000. Also contributing to this increase was a four basis point increase in the yield on average investment securities available for sale, which increased from 2.74% for the year ended December 31, 2019 to 2.78% for the year
ended December 31, 2020, and had the effect of increasing interest income $4,000. The increase in interest income was also due to a $123,000 increase in investment in interest-earning time deposits which increased from an average balance
of $9.6 million for the year ended December 31, 2019 to an average balance of $9.8 million for the year ended December 31, 2020, which had the effect of increasing interest income $3,000. Offsetting this increase was an 82 basis point
decrease in the yield on average loans receivable, net, including loans held for sale, which decreased from 5.53% for the year ended December 31, 2019 to 4.71% for the year ended December 31, 2020, which had the effect of decreasing
interest income $2.7 million. This loan yield decline is a result of lower yielding PPP loans booked in the second and third quarters of 2020 and the impact of the Federal Reserve’s 150 basis point rate cuts in March 2020. The increase in
interest income was also partially offset by a 183 basis point decrease in the yield on average cash and cash equivalents due from banks, interest bearing, which decreased from 2.24% for the year ended December 31, 2019 to 0.42% for the
year ended December 31, 2020, which had the effect of decreasing interest income $317,000. Also offsetting the increase in interest income was a 29 basis point decrease in the yield on investment in interest-earning time deposits which
decreased from 2.79% for the year ended December 31, 2019 to 2.50% for the year ended December 31, 2020, which had the effect of decreasing interest income $28,000.
10
|
Quaint Oak Bancorp, Inc.
|
Management’s Discussion and Analysis of Financial Condition and Results of Operations
Interest
Expense. Interest expense increased $62,000, or 1.1%, to $5.5 million for the year ended December 31, 2020 from $5.4 million for the year ended December 31, 2019. The increase in interest expense was
primarily attributable to an $18.4 million increase in average certificate of deposit accounts which increased from an average balance of $177.0 million for the year ended December 31, 2019 to an average balance of $195.4 million for the
year ended December 31, 2020, and had the effect of increasing interest expense $422,000. Also contributing to the increase in interest expense was an increase in the average money market accounts which increased from an average balance of
$27.5 million for the year ended December 31, 2019 to an average balance of $47.3 million for the year ended December 31, 2020, and had the effect of increasing interest expense by $158,000. The increase in interest expense was also due to
a $5.4 million increase in average FHLB borrowings which increased from an average balance of $26.9 million for the year ended December 31, 2019 to an average balance of $32.3 million for the year ended December 31, 2020, and had the effect
of increasing interest expense $114,000. Also contributing to the increase in interest expense was an increase in average Federal Reserve Bank borrowings of $30.5 million for the year ended December 31,
2020 which had the effect of increasing interest expense by $108,000. Partially offsetting this increase was a 35 basis point decrease in rate on average certificate of deposit accounts, which decreased from 2.30% for the year ended
December 31, 2019 to 1.95% for the year ended December 31, 2020, and had the effect of decreasing interest expense by $666,000. Also partially offsetting this increase was a 31 basis point decrease in rate on average FHLB borrowings, which
decreased from 2.31% for the year ended December 31, 2019 to 2.00% for the year ended December 31, 2020, and had the effect of decreasing interest expense by $90,000. The average interest rate spread decreased from 2.91% for the year ended
December 31, 2019 to 2.67% for the year ended December 31, 2020 while the net interest margin decreased from 3.17% for the year ended December 31, 2019 to 2.93% for the year ended December 31, 2020. The Company also experienced strong
growth in non-interest bearing deposits, which increased 243.6% at December 31, 2020, compared to December 31, 2019. Interest expense on deposits continues to be actively managed to lower costs.
11
|
Quaint Oak Bancorp, Inc.
|
Management’s Discussion and Analysis of Financial Condition and Results of Operations
Average Balances, Net Interest Income, Yields
Earned and Rates Paid. The following table shows for the periods indicated the total dollar amount of interest from average interest-earning assets and the resulting yields, as well as the interest
expense on average interest-bearing liabilities, expressed both in dollars and rates, and the net interest margin. All average balances are based on daily balances.
|
Year Ended December 31,
|
||||||||||||||||||||||||
|
2020
|
2019
|
|||||||||||||||||||||||
|
Average
Balance
|
Interest
|
Average
Yield/
Rate
|
Average
Balance
|
Interest
|
Average
Yield/
Rate
|
|||||||||||||||||||
|
(Dollars in thousands)
|
||||||||||||||||||||||||
|
Interest-earning assets:
|
||||||||||||||||||||||||
|
Due from banks, interest-bearing
|
$
|
17,373
|
$
|
72
|
0.42
|
%
|
$
|
16,315
|
$
|
366
|
2.24
|
%
|
||||||||||||
|
Investment in interest-earning time deposits
|
9,760
|
244
|
2.50
|
9,635
|
269
|
2.79
|
||||||||||||||||||
|
Investment securities available for sale
|
9,383
|
261
|
2.78
|
8,321
|
228
|
2.74
|
||||||||||||||||||
|
Loans receivable, net (1) (2)
|
332,146
|
15,657
|
4.71
|
238,238
|
13,167
|
5.53
|
||||||||||||||||||
|
Investment in FHLB stock
|
1,438
|
89
|
6.19
|
1,206
|
81
|
5.16
|
||||||||||||||||||
|
Total interest-earning assets
|
370,100
|
16,323
|
4.41
|
%
|
273,715
|
14,111
|
5.16
|
%
|
||||||||||||||||
|
Non-interest-earning assets
|
14,386
|
12,348
|
||||||||||||||||||||||
|
Total assets
|
$
|
384,486
|
$
|
286,063
|
||||||||||||||||||||
|
Interest-bearing liabilities:
|
||||||||||||||||||||||||
|
Passbook accounts
|
$
|
6
|
$
|
*
|
*
|
%
|
$
|
53
|
$
|
*
|
*
|
%
|
||||||||||||
|
Savings accounts
|
1,826
|
4
|
0.22
|
1,629
|
3
|
0.18
|
||||||||||||||||||
|
Money market accounts
|
47,351
|
392
|
0.83
|
27,550
|
221
|
0.80
|
||||||||||||||||||
|
Certificate of deposit accounts
|
195,401
|
3,820
|
1.95
|
177,000
|
4,063
|
2.30
|
||||||||||||||||||
|
Total deposits
|
244,584
|
4,216
|
1.72
|
206,232
|
4,287
|
2.08
|
||||||||||||||||||
|
FHLB short-term borrowings
|
3,292
|
37
|
1.12
|
5,585
|
141
|
2.52
|
||||||||||||||||||
|
FHLB long-term borrowings
|
28,979
|
607
|
2.09
|
21,327
|
479
|
2.25
|
||||||||||||||||||
|
FRB long-term borrowings
|
30,534
|
108
|
0.35
|
-
|
-
|
-
|
||||||||||||||||||
|
Subordinated debt
|
7,881
|
520
|
6.60
|
7,845
|
519
|
6.62
|
||||||||||||||||||
|
Total interest-bearing liabilities
|
315,270
|
5,488
|
1.74
|
%
|
240,989
|
5,426
|
2.25
|
%
|
||||||||||||||||
|
Non-interest-bearing liabilities
|
42,530
|
20,385
|
||||||||||||||||||||||
|
Total liabilities
|
357,800
|
261,374
|
||||||||||||||||||||||
|
Stockholders’ Equity
|
26,686
|
24,689
|
||||||||||||||||||||||
|
Total liabilities and Stockholders’ Equity
|
$
|
384,486
|
$
|
286,063
|
||||||||||||||||||||
|
Net interest-earning assets
|
$
|
54,830
|
$
|
32,726
|
||||||||||||||||||||
|
Net interest income; average interest rate spread
|
$
|
10,835
|
2.67
|
%
|
$
|
8,685
|
2.91
|
%
|
||||||||||||||||
|
Net interest margin (3)
|
2.93
|
%
|
3.17
|
%
|
||||||||||||||||||||
|
Average interest-earning assets to average interest-bearing liabilities
|
117.39
|
%
|
113.58
|
%
|
||||||||||||||||||||
___________________
|
*
|
Not meaningful |
| (1) |
Includes loans held for sale. |
|
(2)
|
Includes non-accrual loans during the respective periods. Calculated net of deferred fees and discounts, loans in process and allowance for loan losses. |
|
(3)
|
Equals net interest income divided by average interest-earning assets. |
12
|
Quaint Oak Bancorp, Inc.
|
Management’s Discussion and Analysis of Financial Condition and Results of Operations
Rate/Volume Analysis. The following table shows the
extent to which changes in interest rates and changes in volume of interest-earning assets and interest-bearing liabilities affected our interest income and expense during the periods indicated. For each category of interest-earning
assets and interest-bearing liabilities, information is provided on changes attributable to (1) changes in rate, which is the change in rate multiplied by prior year volume, (2) changes in volume, which is the change in volume multiplied
by prior year rate, and (3) changes in rate/volume, which is the change in rate multiplied by the change in volume.
|
2020 vs. 2019
|
2019 vs. 2018
|
|||||||||||||||||||||||||||||||
|
Increase (Decrease) Due to
|
Total Increase
(Decrease)
|
Increase (Decrease) Due to
|
Total Increase
(Decrease)
|
|||||||||||||||||||||||||||||
|
Rate
|
Volume
|
Rate/
Volume
|
Rate
|
Volume
|
Rate/
Volume
|
|||||||||||||||||||||||||||
|
(In Thousands)
|
||||||||||||||||||||||||||||||||
|
Interest income:
|
||||||||||||||||||||||||||||||||
|
Due from banks, interest-bearing
|
$
|
(298
|
)
|
$
|
24
|
$
|
(20
|
)
|
$
|
(294
|
)
|
$
|
64
|
$
|
21
|
$
|
5
|
$
|
90
|
|||||||||||||
|
Investment in interest-earning time deposits
|
(28
|
)
|
3
|
--
|
(25
|
)
|
46
|
88
|
44
|
178
|
||||||||||||||||||||||
|
Investment securities available for sale
|
4
|
29
|
--
|
33
|
51
|
20
|
7
|
78
|
||||||||||||||||||||||||
|
Loans receivable, net (1) (2)
|
(1,937
|
)
|
5,190
|
(763
|
)
|
2,490
|
338
|
1,262
|
37
|
1,637
|
||||||||||||||||||||||
|
Investment in FHLB stock
|
(7
|
)
|
16
|
(1
|
)
|
8
|
3
|
--
|
--
|
3
|
||||||||||||||||||||||
|
Total interest-earning assets
|
(2,266
|
)
|
5,262
|
(784
|
)
|
2,212
|
502
|
1,391
|
93
|
1,986
|
||||||||||||||||||||||
|
Interest expense:
|
||||||||||||||||||||||||||||||||
|
Passbook accounts
|
--
|
--
|
--
|
--
|
--
|
--
|
--
|
--
|
||||||||||||||||||||||||
|
Savings accounts
|
--
|
--
|
--
|
--
|
--
|
(1
|
)
|
--
|
(1
|
)
|
||||||||||||||||||||||
|
Money market accounts
|
8
|
158
|
6
|
172
|
1
|
(19
|
)
|
--
|
(18
|
)
|
||||||||||||||||||||||
|
Certificate of deposit accounts
|
(603
|
)
|
423
|
(63
|
)
|
(243
|
) |
576
|
391
|
75
|
1,042
|
|||||||||||||||||||||
|
Total deposits
|
(595
|
)
|
581
|
(57
|
)
|
(71
|
) |
577
|
371
|
75
|
1,023
|
|||||||||||||||||||||
|
FHLB short-term borrowings
|
(78
|
)
|
(58
|
)
|
32
|
(104
|
)
|
49
|
(84
|
)
|
(21
|
)
|
(56
|
)
|
||||||||||||||||||
|
FHLB long-term borrowings
|
(32
|
)
|
172
|
(12
|
)
|
128
|
35
|
84
|
8
|
127
|
||||||||||||||||||||||
|
FRB long-term borrowings
|
--
|
--
|
108
|
108
|
||||||||||||||||||||||||||||
|
Subordinated debt
|
(1
|
)
|
2
|
--
|
1
|
--
|
521
|
(9
|
)
|
512
|
||||||||||||||||||||||
|
Total interest-bearing liabilities
|
(706
|
)
|
697
|
71
|
62
|
661
|
892
|
53
|
1,606
|
|||||||||||||||||||||||
|
Increase (decrease) in net interest
income
|
$
|
(1,560
|
)
|
$
|
4,565
|
$
|
(855
|
)
|
$
|
2,150
|
$
|
(159
|
)
|
$
|
499
|
$
|
40
|
$
|
380
|
|||||||||||||
_______________________
| (1) |
Includes loans held for sale.
|
| (2) |
Includes non-accrual loans during the respective periods. Calculated net of deferred fees and discounts, loans in process and allowance for loan losses.
|
Provision for Loan Losses. The Company increased its provision for loan
losses by $527,000, or 173.9%, from $303,000 for the year ended December 31, 2019 to $830,000 for the year ended December 31, 2020, based on an evaluation of the allowance relative to such factors as volume of the loan portfolio,
concentrations of credit risk, prevailing economic conditions, prior loan loss experience and amount of non-performing loans at December 31, 2019.
Non-performing loans amounted to $643,000 or 0.18% of net loans receivable at December 31, 2020, consisting of five loans, two loans of which are on
non-accrual status and three loans are 90 days or more past due and accruing interest. Comparably, non-performing loans amounted to $362,000 or 0.15% of net loans receivable at December 31, 2019, consisting of two loans, one loan of which
was on nonaccrual status and one loan was 90 days or more past due and accruing interest. The non-performing loans at December 31, 2020 include one commercial real estate loan, one one-to-four family owner occupied residential loan, and
three 1-4 family non-owner occupied residential loans, and all are generally well-collateralized or adequately reserved for. The allowance for loan losses as a percent of total loans receivable was 0.85% at December 31, 2020 and 0.90% at
December 31, 2019. Excluding PPP loans, which are 100% guaranteed by the SBA, the allowance for loan losses to total loans was 1.14% at December 31, 2020.
At December 31, 2020, other real estate owned (OREO) amounted to $286,000, consisting of one property that was collateral for a non-performing
construction loan. OREO amounted to $1.8 million at December 31, 2019 consisting of four properties that were collateral for a non-performing construction loan. During the year ended December 31, 2020, the Company made $270,000 of capital
improvements to the properties, sold three properties totaling $1.7 million and realized a net loss of $92,000, and wrote-down one property totaling $105,000. Non-performing assets amounted to $929,000, or 0.19% of total assets at December
31, 2020 compared to $2.2 million, or 0.72% of total assets at December 31, 2019.
13
|
Quaint Oak Bancorp, Inc.
|
Management’s Discussion and Analysis of Financial Condition and Results of Operations
Non-Interest Income. Non-interest income increased $1.7 million, or 34.4%,
from $5.0 million for the year ended December 31, 2019 to $6.7 million for the year ended December 31, 2020. The increase was primarily attributable to a $1.3 million, or 43.3%, increase in net gain on loans held for sale, a $427,000, or
37.1%, increase in mortgage banking and title abstract fees, a $71,000, or 16.9% increase in insurance commissions, a $41,000, or 60.3%, increase in other fees and service charges, and a $24,000, or 10.9%, decrease in loss on sales and
write-downs of other real estate owned. These increases were partially offset by a $150,000, or 56.6%, decrease in gain on the sales of SBA loans, and a $21,000, or 11.7%, decrease in real estate sales commissions, net, earned by Quaint
Oak Real Estate, a wholly owned subsidiary of Quaint Oak Bank.
Non-Interest Expense. Non-interest expense increased $2.2 million, or 22.4%,
from $9.9 million for the year ended December 31, 2019 to $12.1 million for the year ended December 31, 2020. Salaries and employee benefits expense accounted for $1.5 million of the change as this expense increased 21.3%, from $6.9
million for the year ended December 31, 2019 to $8.4 million for the year ended December 31, 2020 due to expanding and improving the level of staff at the Bank and its subsidiary companies, primarily in the area of lending operations.
Other expense accounted for $127,000 of the change as this expense increased 15.1%, from $841,000 for the year ended December 31, 2019 to $968,000 for the year ended December 31, 2020 due primarily to the increase in subscription costs
related to installing a new real estate closing platform at Quaint Oak Abstract, LLC. Data processing costs accounted for $209,000 of the change as this expense increased 41.1%, from $508,000 for the year ended December 31, 2019 to
$717,000 for the year ended December 31, 2020, due primarily to recurring costs associated with the Bank’s checking and other transaction account products. Occupancy and equipment expense accounted for $221,000 of the change as this
expense increased 31.9%, from $692,000 for the year ended December 31, 2019 to $913,000 for the year ended December 31, 2020. Professional fees accounted for $125,000 of the change as this expense increased 30.0%, from $416,000 for the
year ended December 31, 2019 to $541,000 for the year ended December 31, 2020, due primarily to increased audit and compliance costs. FDIC deposit insurance assessment increased $106,000, from $15,000 for the year ended December 31, 2019
to $121,000 at December 31, 2020. Other real estate owned expense accounted for $20,000 of the change as this expense increased 90.9%, from $22,000 for the year ended December 31, 2019 to $42,000 for the year ended December 31, 2020.
Directors’ fees and expenses accounted for $9,000 of the change as this expense increased 4.0%, from $223,000 for the year ended December 2019 to $232,000 for the year ended December 31, 2020. Partially offsetting these increases were
decreases in advertising expense which declined $82,000, or 42.1%, from $195,000 for the year ended December 31, 2019 to $113,000 for the year ended December 31, 2020.
Provision for Income Tax. The provision for income tax increased $342,000,
or 36.0%, from $950,000 for the year ended December 31, 2019 to $1.3 million for the year ended December 31, 2020 due primarily to an increase in pre-tax income for the year ended December 31, 2020.
Operating Segments
The Company’s operations consist of two reportable operating segments: Banking and Mortgage Banking. Our Banking Segment generates revenues primarily
from its lending, deposit gathering and fee business activities. Our Mortgage Banking Segment originates residential mortgage loans which are sold into the secondary market along with the loans’ servicing rights. Detailed segment
information appears in Note 19 in the Notes to Consolidated Financial Statements.
Our Banking Segment reported a pre-tax segment profit (“PTSP”) for the year ended December 31, 2020 of $2.0 million, a $231,000, or 13.0%, increase
from the year ended December 31, 2019. This increase in PTSP was due to a $2.3 million increase in net interest income and a $242,000 increase in non-interest income, partially offset by a $1.8 million increase in non-interest expense, and
a $527,000 increase in the provision for loan losses. The increase in non-interest expense was due primarily to a $1.2 million, or 21.0%, increase in salaries and employee benefits expense, a $129,000, or 16.5%, increase in other expense,
and a $106,000 increase in FDIC deposit insurance assessment, partially offset by a $48,000, or 34.3%, decrease in advertising expense. The increase in non-interest income was primarily due to a $274,000, or 42.2%, increase in mortgage
banking and title abstract fees. The increase in net interest income was primarily attributable to an increase in interest income, driven by higher average loan balances and yields, partially offset by a higher cost of funds.
14
|
Quaint Oak Bancorp, Inc.
|
Management’s Discussion and Analysis of Financial Condition and Results of Operations
Our Mortgage Banking Segment reported a PTSP for the year ended December 31, 2020 of $2.5 million, an $879,000, or 53.4%, increase from the year
ended December 31, 2019. The increase in PTSP was primarily due to a $1.5 million increase in non-interest income which was driven by increases in net gain on the sale of loans and processing fees. This increase was partially offset by a
$386,000 increase in non-interest expense and a $195,000 decrease in net interest income.
Exposure to Changes in Interest Rates
The Company’s ability to maintain net interest income depends upon its ability to earn a higher yield on assets than the rates it pays on deposits
and borrowings. The Company’s interest-earning assets consist primarily of loans collateralized by real estate which have longer maturities than our liabilities, consisting primarily of certificates of deposit, money market accounts and to
a lesser extent borrowings. Consequently, the Company’s ability to maintain a positive spread between the interest earned on assets and the interest paid on deposits and borrowings can be adversely affected when market rates of interest
rise. At December 31, 2020 and 2019, certificates of deposit amounted to $199.4 million and $184.5 million, respectively, or 41.2% and 61.0%, respectively, of total assets at such dates.
Gap Analysis. The
matching of assets and liabilities may be analyzed by examining the extent to which such assets and liabilities are “interest rate sensitive” and by monitoring a bank’s interest rate sensitivity “gap.” An asset and liability is said to
be interest rate sensitive within a specific time period if it will mature or reprice within that time period. The interest rate sensitivity gap is defined as the difference between the amount of interest-earning assets maturing or
repricing within a specific time period and the amount of interest-bearing liabilities maturing or repricing within that same time period. A gap is considered positive when the amount of interest rate sensitive assets exceeds the
amount of interest rate sensitive liabilities. A gap is considered negative when the amount of interest rate sensitive liabilities exceeds the amount of interest rate sensitive assets. During a period of rising interest rates, a
negative gap would tend to adversely affect net interest income while a positive gap would tend to result in an increase in net interest income. Conversely, during a period of falling interest rates, a negative gap would tend to result
in an increase in net interest income while a positive gap would tend to affect adversely net interest income. Our current interest rate risk management policy provides that our one-year interest rate gap as a percentage of total
assets should not exceed positive or negative 20%. This policy was adopted by our management and Board of Directors based upon their judgment that it established an appropriate benchmark for the level of interest-rate risk, expressed
in terms of the one-year gap, for the Company. If our one-year gap position approaches or exceeds the 20% policy limit, management will obtain simulation results in order to determine what steps might appropriately be taken, in order
to maintain our one-year gap in accordance with the policy. Alternatively, depending on the then-current economic scenario, we could determine to make an exception to our policy or we could determine to revise our policy. Our one-year
cumulative gap was a positive 2.9% at December 31, 2020, compared to a negative 7.9% at December 31, 2019.
The following table sets forth the amounts of our interest-earning assets and interest-bearing liabilities outstanding at December 31, 2020, which we
expect, based upon certain assumptions, to reprice or mature in each of the future time periods shown. Except as stated below, the amount of assets and liabilities shown which reprice or mature during a particular period were determined in
accordance with the earlier of term to repricing or the contractual maturity of the asset or liability. The table sets forth an approximation of the projected repricing of assets and liabilities at December 31, 2020, on the basis of
contractual maturities, anticipated prepayments, and scheduled rate adjustments within a three-month period and subsequent selected time intervals. The loan amounts in the table reflect principal balances expected to be redeployed and/or
repriced as a result of contractual amortization and anticipated prepayments of adjustable-rate loans and fixed-rate loans, and as a result of contractual rate adjustments on adjustable-rate loans. The Company’s annual historical
prepayment rates are applied to loans. Money market, savings and passbook accounts are assumed to have annual rates of withdrawal, or “decay rates,” of 40%, 40%, and 20%, respectively.
15
|
Quaint Oak Bancorp, Inc.
|
Management’s Discussion and Analysis of Financial Condition and Results of Operations
|
3 Months
or Less
|
More than
3 Months
to 1 Year
|
More than
1 Year
to 3 Years
|
More than
3 Years
to 5 Years
|
More than
5 Years
|
Total
Amount
|
|||||||||||||||||||
|
(Dollars In Thousands)
|
||||||||||||||||||||||||
|
Interest-earning assets (1):
|
||||||||||||||||||||||||
|
Due from banks, interest-bearing
|
$
|
33,708
|
$
|
--
|
$
|
--
|
$
|
--
|
$
|
--
|
$
|
33,708
|
||||||||||||
|
Investment in interest-earning time deposits
|
1,499
|
2,507
|
4,457
|
1,000
|
--
|
9,463
|
||||||||||||||||||
|
Investment securities available for sale
|
4,737
|
28
|
167
|
170
|
5,623
|
10,725
|
||||||||||||||||||
|
Loans held for sale
|
53,191
|
--
|
--
|
--
|
--
|
53,191
|
||||||||||||||||||
|
Loans receivable (2)
|
28,757
|
46,322
|
143,251
|
90,014
|
56,898
|
365,242
|
||||||||||||||||||
|
Investment in Federal Home Loan Bank stock
|
--
|
--
|
--
|
--
|
1,665
|
1,665
|
||||||||||||||||||
|
Total interest-earning assets
|
$
|
121,892
|
$
|
48,857
|
$
|
147,875
|
$
|
91,184
|
$
|
64,186
|
$
|
473,994
|
||||||||||||
|
Interest-bearing liabilities:
|
||||||||||||||||||||||||
|
Passbook accounts
|
$
|
1
|
$
|
1
|
$
|
5
|
$
|
1
|
$
|
--
|
$
|
8
|
||||||||||||
|
Savings accounts
|
314
|
314
|
628
|
157
|
157
|
1,570
|
||||||||||||||||||
|
Money market accounts
|
19,928
|
19,928
|
39,855
|
9,964
|
9,963
|
99,638
|
||||||||||||||||||
|
Certificate accounts
|
39,826
|
61,345
|
74,822
|
23,434
|
--
|
199,427
|
||||||||||||||||||
|
FHLB borrowings
|
10,000
|
5,000
|
14,171
|
9,022
|
--
|
38,193
|
||||||||||||||||||
|
FRB borrowings
|
--
|
--
|
48,134
|
--
|
--
|
48,134
|
||||||||||||||||||
|
Subordinated debt
|
--
|
--
|
--
|
--
|
7,899
|
7,899
|
||||||||||||||||||
|
Total interest-bearing liabilities
|
$
|
70,069
|
$
|
86,588
|
$
|
177,615
|
$
|
42,578
|
$
|
18,019
|
$
|
394,869
|
||||||||||||
|
Interest-earning assets less interest-bearing liabilities
|
$
|
51,823
|
$
|
(37,731
|
)
|
$
|
(29,740
|
)
|
$
|
46,606
|
$
|
46,167
|
||||||||||||
|
Cumulative interest-rate sensitivity gap (3)
|
$
|
51,823
|
$
|
14,092
|
$
|
(15,648
|
)
|
$
|
32,958
|
$
|
79,125
|
|||||||||||||
|
Cumulative interest-rate gap as a percentage of total assets
at December 31, 2020
|
10.7
|
%
|
2.9
|
%
|
(3.2
|
)%
|
6.8
|
%
|
16.3
|
%
|
||||||||||||||
|
Cumulative interest-earning assets as a percentage of cumulative interest-bearing liabilities
at December 31, 2020
|
174.0
|
%
|
109.0
|
%
|
95.3
|
%
|
108.7
|
%
|
120.0
|
%
|
||||||||||||||
_____________________
|
(1)
|
Interest-earning assets are included in the period in which the balances are expected to be redeployed and/or repriced as a result of anticipated prepayments, scheduled rate
adjustments and contractual maturities.
|
| (2) |
For purposes of the gap analysis, loans receivable includes non-performing loans gross of the allowance for loan losses and deferred loan fees.
|
| (3) |
Interest-rate sensitivity gap represents the difference between net interest-earning assets and interest-bearing liabilities.
|
Qualitative Analysis. Our ability to maintain a positive “spread” between the interest earned on assets and the interest paid on deposits and borrowings is affected by
changes in interest rates. The Company’s fixed-rate loans generally are profitable if interest rates are stable or declining since these loans have yields that exceed its cost of funds. If interest rates increase, however, the Company
would have to pay more on its deposits and new borrowings, which would adversely affect its interest rate spread. In order to counter the potential effects of dramatic increases in market rates of interest, the Company intends to
continue to originate more variable rate loans and increase core deposits. The Company also intends to place a greater emphasis on shorter-term home equity loans and commercial business loans.
Liquidity and Capital Resources
The Company’s primary sources of funds are deposits, amortization and prepayment of loans and to a lesser extent, loan sales and other funds provided
from operations. While scheduled principal and interest payments on loans are a relatively predictable source of funds, deposit flows and loan prepayments are greatly influenced by general interest rates, economic conditions and
competition. The Company sets the interest rates on its deposits to maintain a desired level of total deposits. In addition, the Company invests excess funds in short-term interest-earning assets that provide additional liquidity. At
December 31, 2020, the Company’s cash and cash equivalents amounted to $33.9 million. At such date, the Company also had $4.0 million invested in interest-earning time deposits maturing in one year or less.
16
|
Quaint Oak Bancorp, Inc.
|
Management’s Discussion and Analysis of Financial Condition and Results of Operations
The Company uses its liquidity to fund existing and future loan commitments, to fund deposit outflows, to invest in other interest-earning assets,
and to meet operating expenses. At December 31, 2020, Quaint Oak Bank had outstanding commitments to originate loans of $17.6 million, commitments under unused lines of credit of $22.4 million, and $1.6 million under standby letters of
credit.
At December 31, 2020, certificates of deposit scheduled to mature in one year or less totaled $101.2 million. Based on prior experience,
management believes that a significant portion of such deposits will remain with us, although there can be no assurance that this will be the case.
In addition to cash flow from loan payments and prepayments and deposits, the Company has significant borrowing capacity available to
fund liquidity needs. If the Company requires funds beyond its ability to generate them internally, borrowing agreements exist with the Federal Home Loan Bank of Pittsburgh (FHLB), which provide an additional source of funds. As of
December 31, 2020, we had $38.2 million of borrowings from the FHLB and had $159.7 million in borrowing capacity. Under terms of the collateral agreement with the FHLB of Pittsburgh, we pledge residential mortgage loans as well as
Quaint Oak Bank’s FHLB stock as collateral for such advances. In addition, as of December 31, 2020 Quaint Oak Bank had $613,000 in borrowing capacity with the Federal Reserve Bank of Philadelphia. There were no borrowings under this
facility at December 31, 2020. The Bank also has borrowing capacity with the FRB under the PPPLF program in the amount of the outstanding pledged PPP loans that totaled $93.3 million at December
31, 2020. Quaint Oak Bank’s outstanding advances with the FRB under the PPPLF program were $48.1 million as of December 31, 2020.
Our stockholders’ equity amounted to $28.7 million at December 31, 2020, an increase of $2.8 million, or 10.9% from $25.9 million at December 31,
2019. Contributing to the increase was net income for the year ended December 31, 2020 of $3.2 million, amortization of stock awards and options under our stock compensation plans of $173,000, common stock earned by participants in the
employee stock ownership plan of $173,000, the reissuance of treasury stock for exercised stock options of $101,000, other comprehensive income, net of $98,000, and the reissuance of treasury stock under the Bank’s 401(k) Plan of $97,000.
These increases were partially offset by dividends paid of $717,000, and the purchase of treasury stock of $349,000. For further discussion of the stock compensation plans, see Note 14 in the Notes to Consolidated Financial Statements
contained elsewhere herein.
Quaint Oak Bank is required to maintain regulatory capital sufficient to meet tier 1 leverage, common equity tier 1 capital, tier 1 risk-based and
total risk-based capital ratios of at least 4.00%, 4.50%, 6.00%, and 8.00%, respectively. At December 31, 2020, Quaint Oak Bank exceeded each of its capital requirements with ratios of 8.56%, 13.31%, 13.31% and 14.52%, respectively. As a
small savings and loan holding company, the Company is not currently subject to any regulatory capital requirements. For further discussion of the Bank’s regulatory capital requirements, see Note 18 in the Notes to Consolidated Financial
Statements contained elsewhere herein.
Off-Balance Sheet Arrangements
In the normal course of operations, we engage in a variety of financial transactions that, in accordance with generally accepted accounting
principles are not recorded in our financial statements. These transactions involve, to varying degrees, elements of credit, interest rate, and liquidity risk. Such transactions are used primarily to manage customers’ requests for
funding and take the form of loan commitments and lines of credit. Our exposure to credit loss from non-performance by the other party to the above-mentioned financial instruments is represented by the contractual amount of those
instruments. We use the same credit policies in making commitments and conditional obligations as we do for on-balance sheet instruments. In general, we do not require collateral or other security to support financial instruments with
off–balance sheet credit risk.
Commitments. At December 31, 2020, we had unfunded commitments under lines
of credit of $22.4 million, $17.6 million of commitments to originate loans, and $1.6 million under standby letters of credit. We had no commitments to advance additional amounts pursuant to outstanding lines of credit or undisbursed
construction loans.
17
|
Quaint Oak Bancorp, Inc.
|
Management’s Discussion and Analysis of Financial Condition and Results of Operations
Contractual Cash Obligations
The following table summarizes our contractual cash obligations at December 31, 2020. The balances in the table do not reflect interest due on
these obligations.
|
Payments Due By Period
|
||||||||||||||||||||
|
Total
|
To
1 Year
|
1-3
Years
|
4-5
Years
|
After 5
Years
|
||||||||||||||||
|
(In Thousands)
|
||||||||||||||||||||
|
Operating leases
|
$
|
1,220
|
$
|
236
|
$
|
357
|
$
|
173
|
$
|
454
|
||||||||||
|
Certificates of deposit
|
199,427
|
101,170
|
91,453
|
6,804
|
--
|
|||||||||||||||
|
FHLB borrowings
|
38,193
|
15,000
|
14,171
|
9,022
|
--
|
|||||||||||||||
|
FRB borrowings
|
48,134
|
--
|
48,134
|
--
|
--
|
|||||||||||||||
|
Total contractual obligations
|
$
|
286,974
|
$
|
116,406
|
$
|
154,115
|
$
|
15,999
|
$
|
454
|
||||||||||
Impact of Inflation and Changing Prices
The consolidated financial statements and related financial data presented herein have been prepared in accordance with accounting principles
generally accepted in the United States of America which generally require the measurement of financial position and operating results in terms of historical dollars, without considering changes in relative purchasing power over time due
to inflation. Unlike most industrial companies, virtually all of the Company’s assets and liabilities are monetary in nature. As a result, interest rates generally have a more significant impact on the Company’s performance than does the
effect of inflation. Interest rates do not necessarily move in the same direction or in the same magnitude as the prices of goods and services, since such prices are affected by inflation to a larger extent than interest rates.
18
|
Quaint Oak Bancorp, Inc.
|

REPORT OF INDEPENDENT REGISTERED PUBLIC ACCOUNTING FIRM
To the Stockholders and the Board of Directors of Quaint Oak Bancorp, Inc.
Opinion on the Financial Statements
We have audited the accompanying consolidated balance sheets of Quaint Oak Bancorp, Inc. and subsidiary (the “Company”) as of December 31, 2020 and 2019; the related consolidated statements of income,
comprehensive income, stockholders’ equity, and cash flows for the years then ended; and the related notes to the consolidated financial statements (collectively, the financial statements). In our opinion, the financial statements
present fairly, in all material respects, the financial position of the Company as of December 31, 2020 and 2019, and the results of its operations and its cash flows for the years then ended, in conformity with accounting principles
generally accepted in the United States of America.
Basis for Opinion
These financial statements are the responsibility of the Company’s management. Our responsibility is to express an opinion on the Company’s financial statements based on our audits. We are a public
accounting firm registered with the Public Company Accounting Oversight Board (United States) (PCAOB) and are required to be independent, with respect to the Company, in accordance with U.S. federal securities laws and the applicable
rules and regulations of the Securities and Exchange Commission and the PCAOB.
We conducted our audits in accordance with the standards of the PCAOB. Those standards require that we plan and perform the audit to obtain reasonable assurance about whether the financial statements are
free of material misstatement, whether due to error or fraud. The Company is not required to have, nor were we engaged to perform, an audit of its internal control over financial reporting. As part of our audits, we are required to
obtain an understanding of internal control over financial reporting but not for the purpose of expressing an opinion on the effectiveness of the Company’s internal control over financial reporting. Accordingly, we express no such
opinion.
Our audits included performing procedures to assess the risks of material misstatement of the financial statements, whether due to error or fraud, and performing procedures that respond to those risks.
Such procedures included examining, on a test basis, evidence regarding the amounts and disclosures in the financial statements. Our audits also included evaluating the accounting principles used and significant estimates made by
management, as well as evaluating the overall presentation of the financial statements. We believe that our audits provide a reasonable basis for our opinion.
Critical Audit Matters
The critical audit matter communicated below is a matter arising from the current period audit of the financial statements that were communicated or required to be communicated to the audit committee and
that: (1) relate to accounts or disclosures that are material to the financial statements; and (2) involved our especially challenging, subjective, or complex judgments. The communication of critical audit matters does not alter, in any
way, our opinion on the financial statements, taken as a whole, and we are not, by communicating the critical audit matters below, providing separate opinions on the critical audit matters or on the accounts or disclosures to which they
relate.
Allowance for Loan Losses (ALL) – Qualitative Factors
Description of the Matter
The Company’s loan portfolio totaled $365.2 million as of December 31, 2020, and the associated ALL was $3.1 million. As discussed in Notes 2 and 7 to the consolidated financial
statements, determining the amount of the ALL requires significant judgment about the collectability of loans, which includes an assessment of quantitative factors, such as historical loss experience within each risk category of loans
and testing of certain commercial loans for impairment. Management applies additional qualitative adjustments to reflect the inherent losses that exist in the loan portfolio at the balance sheet date that are not reflected in the
historical loss experience. Qualitative adjustments are made based upon changes in trends in delinquencies and non-accruals, trends in volume and terms of loans, credit concentrations, risk rating, collateral values, experience, ability
and depth of lending staff and management, national and local economic trends and conditions, COVID-19 pandemic, quality of loan review system, and lending policies.

19
Allowance for Loan Losses (ALL) – Qualitative Factors (Continued)
We identified these qualitative adjustments within the ALL as critical audit matters because they involve a high degree of subjectivity. In turn, auditing management’s judgments regarding the qualitative
factors applied in the ALL calculation involved a high degree of subjectivity.
Furthermore, concern about the spread of COVID-19 has caused and is likely to continue to cause business shutdowns, limitations on commercial activity and financial transactions, labor
shortages, supply chain interruptions, increased unemployment and commercial property vacancy rates, reduced profitability and ability for property owners to make mortgage payments, and overall economic and financial market instability,
all of which may cause borrowers to be unable to make scheduled loan payments. If the effects of COVID-19 result in widespread and sustained loan repayment shortfalls, significant loan delinquencies, foreclosures, declines in collateral
values, and credit losses could result in, and significantly impact, the overall adequacy of the ALL. The extent of COVID-19’s effects on business, operations, or the global economy as a whole is highly uncertain and cannot be
predicted, including the scope and duration of the pandemic, which increases the degree of subjectivity involved in estimating the related qualitative factors within the ALL.
How We Addressed the Matter in Our Audit
We gained an understanding of the Company’s process for establishing the ALL, including the qualitative adjustments made to the ALL. We evaluated the design and tested the operating effectiveness of
controls over the Company’s ALL process, which included, among others, management’s review and approval controls designed to assess the need and level of qualitative adjustments to the ALL, as well as the reliability of the data
utilized to support management’s assessment.
To test the qualitative adjustments, we evaluated the appropriateness of management’s methodology and assessed whether all relevant risks were reflected in the ALL and the need to consider qualitative
adjustments, including the potential effect of COVID-19 on the adjustments.
Regarding the measurement of the qualitative adjustments, we evaluated the completeness, accuracy, and relevance of the data and inputs utilized in management’s estimate. For example,
we compared the inputs and data to the Company’s historical loan performance data, third-party macroeconomic data, and peer bank data and considered the existence of new or contrary information. Furthermore, we analyzed the changes in
the components of the qualitative reserves relative to changes in external market factors, the Company’s loan portfolio, and asset quality trends, which included the evaluation of management’s ability to capture and assess relevant data
from both external sources and internal reports on loan customers affected by the COVID-19 pandemic and the supporting documentation for substantiating revisions to qualitative factors.
We also utilized internal credit review specialists with knowledge to evaluate the appropriateness of management’s risk-rating processes, to ensure that the risk ratings applied to the commercial loan
portfolio were reasonable.
We have served as the Company’s auditor since 2013.

Cranberry Township, Pennsylvania
March 26, 2021
20
|
Quaint Oak Bancorp, Inc.
|
Consolidated Balance Sheets
| At December 31, |
At December 31, |
||||||||
| 2020 |
2019 | ||||||||
| (In thousands, except share data) |
|||||||||
| Assets |
|||||||||
|
Due from banks, non-interest-bearing
|
$
|
205
|
$
|
541
|
|||||
|
Due from banks, interest-bearing
|
33,708
|
14,014
|
|||||||
|
Cash and cash equivalents
|
33,913
|
14,555
|
|||||||
|
Investment in interest-earning time deposits
|
9,463
|
10,172
|
|||||||
|
Investment securities available for sale
|
10,725
|
7,623
|
|||||||
|
Loans held for sale
|
53,191
|
8,928
|
|||||||
|
Loans receivable, net of allowance for loan losses (2020 $3,061; 2019 $2,231)
|
359,122
|
246,692
|
|||||||
|
Accrued interest receivable
|
3,054
|
1,349
|
|||||||
|
Investment in Federal Home Loan Bank stock, at cost
|
1,665
|
1,580
|
|||||||
|
Bank-owned life insurance
|
4,054
|
3,974
|
|||||||
|
Premises and equipment, net
|
2,341
|
2,226
|
|||||||
|
Goodwill
|
515
|
515
|
|||||||
|
Other intangible, net of accumulated amortization
|
271
|
319
|
|||||||
|
Other real estate owned, net
|
286
|
1,824
|
|||||||
|
Prepaid expenses and other assets
|
5,475
|
2,783
|
|||||||
|
Total Assets
|
$
|
484,075
|
$
|
302,540
|
|||||
|
Liabilities and Stockholders’ Equity
|
|||||||||
|
Liabilities
|
|||||||||
|
Deposits:
|
|||||||||
|
Non-interest bearing
|
$
|
54,202
|
$
|
15,775
|
|||||
|
Interest-bearing
|
300,643
|
211,683
|
|||||||
|
Total deposits
|
354,845
|
227,458
|
|||||||
|
Federal Home Loan Bank short-term borrowings
|
10,000
|
10,000
|
|||||||
|
Federal Home Loan Bank long-term borrowings
|
28,193
|
26,271
|
|||||||
|
Federal Reserve Bank long-term borrowings
|
48,134
|
--
|
|||||||
|
Subordinated debt
|
7,899
|
7,865
|
|||||||
|
Accrued interest payable
|
362
|
314
|
|||||||
|
Advances from borrowers for taxes and insurance
|
2,486
|
2,780
|
|||||||
|
Accrued expenses and other liabilities
|
3,428
|
1,945
|
|||||||
|
Total Liabilities
|
455,347
|
276,633
|
|||||||
|
Stockholders’ Equity
|
|||||||||
|
Preferred stock – $0.01 par value, 1,000,000 shares
authorized; one issued or outstanding
|
--
|
--
|
|||||||
|
Common stock – $0.01 par value; 9,000,000 shares
|
|||||||||
|
authorized; 2,777,250 issued; 1,986,528 and 1,984,857
outstanding at December 31, 2020 and 2019, respectively
|
28
|
28
|
|||||||
|
Additional paid-in capital
|
15,282
|
14,990
|
|||||||
|
Treasury stock, at cost: 790,722 and 792,393 shares at
December 31, 2020 and 2019, respectively
|
(5,114
|
)
|
(4,950
|
)
|
|||||
|
Unallocated common stock held by:
|
|||||||||
|
Employee Stock Ownership Plan (ESOP)
|
(51
|
)
|
(118
|
)
|
|||||
|
Accumulated other comprehensive income
|
118
|
20
|
|||||||
|
Retained earnings
|
18,465
|
15,937
|
|||||||
|
Total Stockholders’ Equity
|
28,728
|
25,907
|
|||||||
|
Total Liabilities and Stockholders’ Equity
|
$
|
484,075
|
$
|
302,540
|
|||||
See accompanying notes to consolidated financial statements.
21
|
Quaint Oak Bancorp, Inc.
|
Consolidated Statements of Income
|
Years Ended December 31,
|
||||||||
|
2020
|
2019
|
|||||||
|
(In thousands, except share
|
||||||||
|
and per share data)
|
||||||||
|
Interest Income
|
||||||||
|
Interest on loans, including fees
|
$
|
15,657
|
$
|
13,167
|
||||
|
Interest and dividends on investment securities, interest-bearing deposits with others, and Federal Home Loan Bank stock
|
666
|
944
|
||||||
|
Total Interest Income
|
16,323
|
14,111
|
||||||
|
Interest Expense
|
||||||||
|
Interest on deposits
|
4,216
|
4,287
|
||||||
|
Interest on Federal Home Loan Bank short-term borrowings
|
37
|
141
|
||||||
|
Interest on Federal Home Loan Bank long-term borrowings
|
607
|
479
|
||||||
|
Interest on Federal Reserve Bank long-term borrowings
|
108
|
--
|
||||||
|
Interest on subordinated debt
|
520
|
519
|
||||||
|
Total Interest Expense
|
5,488
|
5,426
|
||||||
| Net Interest Income |
10,835 |
8,685 | ||||||
| Provision for Loan Losses |
830 |
303 | ||||||
| Net Interest Income after Provision for Loan Losses |
10,005 | 8,382 | ||||||
|
Non-Interest Income
|
||||||||
|
Mortgage banking and title abstract fees
|
1,579
|
1,152
|
||||||
|
Real estate sales commissions, net
|
159
|
180
|
||||||
|
Insurance commissions
|
490
|
419
|
||||||
|
Other fees and services charges
|
109
|
68
|
||||||
|
Income from bank-owned life insurance
|
80
|
80
|
||||||
|
Net gain on loans held for sale
|
4,320
|
3,014
|
||||||
|
Gain on the sale of SBA loans
|
115
|
265
|
||||||
|
Loss on sale of investment securities available for sale
|
--
|
(4
|
)
|
|||||
|
Loss on sales and write-downs of other real estate owned
|
(197
|
)
|
(221
|
)
|
||||
|
Total Non-Interest Income, net
|
6,655
|
4,953
|
||||||
|
Non-Interest Expense
|
||||||||
|
Salaries and employee benefits
|
8,427
|
6,947
|
||||||
|
Directors’ fees and expenses
|
232
|
223
|
||||||
|
Occupancy and equipment
|
913
|
692
|
||||||
|
Data processing
|
717
|
508
|
||||||
|
Professional fees
|
541
|
416
|
||||||
|
FDIC deposit insurance assessment
|
121
|
15
|
||||||
|
Other real estate owned expenses
|
42
|
22
|
||||||
|
Advertising
|
113
|
195
|
||||||
|
Amortization of other intangible
|
49
|
49
|
||||||
|
Other
|
968
|
841
|
||||||
|
Total Non-Interest Expense
|
12,123
|
9,908
|
||||||
|
Income before Income Taxes
|
4,537
|
3,427
|
||||||
|
Income Taxes
|
1,292
|
950
|
||||||
|
Net Income
|
$
|
3,245
|
$
|
2,477
|
|
Earnings per share – basic
|
$
|
1.64
|
$
|
1.27
|
||||
|
Average shares outstanding - basic
|
1,975,836
|
1,956,612
|
||||||
|
Earnings per share - diluted
|
$
|
1.61
|
$
|
1.24
|
||||
|
Average shares outstanding - diluted
|
2,012,399
|
2,005,438
|
See accompanying notes to consolidated financial statements.
22
|
Quaint Oak Bancorp, Inc.
|
Consolidated Statements of Comprehensive Income
|
Years Ended December 31,
|
||||||||
|
2020
|
2019
|
|||||||
|
(In Thousands)
|
||||||||
|
Net Income
|
$
|
3,245
|
$
|
2,477
|
||||
|
Other Comprehensive Income:
|
||||||||
|
Unrealized gains on investment securities available for sale
|
125
|
22
|
||||||
|
Income tax effect
|
(27
|
)
|
(3
|
)
|
||||
|
Reclassification adjustment for losses on sale of investment securities included in net income
|
--
|
4
|
||||||
|
Income tax effect
|
--
|
(1
|
)
|
|||||
|
Net other comprehensive income
|
98
|
22
|
||||||
|
Total Comprehensive Income
|
$
|
3,343
|
$
|
2,499
|
||||
See accompanying notes to consolidated financial statements.
23
|
Quaint Oak Bancorp, Inc.
|
Statements of Stockholders’ Equity
|
(In thousands, except share and per share data)
|
Common Stock
|
|||||||||||||||||||||||||||||||
|
Number of
Shares
Outstanding
|
Amount
|
Additional
Paid-in
Capital
|
Treasury Stock
|
Unallocated
Common
Stock Held
by Benefit
Plans
|
Accumulated
Other
Comprehensive Income (Loss)
|
Retained
Earnings
|
Total
Stockholders’
Equity
|
|||||||||||||||||||||||||
|
BALANCE – DECEMBER 31, 2018
|
1,975,947
|
$
|
28
|
$
|
14,683
|
$
|
(4,824
|
)
|
$
|
(185
|
)
|
$
|
(2
|
)
|
$
|
14,136
|
$
|
23,836
|
||||||||||||||
|
Common stock allocated by ESOP (14,428 shares)
|
119
|
67
|
186
|
|||||||||||||||||||||||||||||
|
Treasury stock purchased
|
(27,297
|
)
|
(339
|
)
|
(339
|
)
|
||||||||||||||||||||||||||
|
Reissuance of treasury stock under 401(k) Plan
|
2,986
|
20
|
18
|
38
|
||||||||||||||||||||||||||||
|
Reissuance of treasury stock under stock incentive plan
|
9,721
|
(57
|
)
|
57
|
--
|
|||||||||||||||||||||||||||
|
Reissuance of treasury stock for exercised stock
options
|
23,500
|
52
|
138
|
190
|
||||||||||||||||||||||||||||
|
Stock based compensation expense
|
173
|
173
|
||||||||||||||||||||||||||||||
|
Cash dividends declared ($0.34 per share)
|
(676
|
)
|
(676
|
)
|
||||||||||||||||||||||||||||
|
Net income
|
2,477
|
2,477
|
||||||||||||||||||||||||||||||
|
Other comprehensive income, net
|
22
|
22
|
||||||||||||||||||||||||||||||
|
BALANCE – DECEMBER 31, 2019
|
1,984,857
|
$
|
28
|
$
|
14,990
|
$
|
(4,950
|
)
|
$
|
(118
|
)
|
$
|
20
|
$
|
15,937
|
$
|
25,907
|
|||||||||||||||
|
Common stock allocated by ESOP (14,428 shares)
|
106
|
67
|
173
|
|||||||||||||||||||||||||||||
|
Treasury stock purchased
|
(28,891
|
)
|
(349
|
)
|
(349
|
)
|
||||||||||||||||||||||||||
| |
||||||||||||||||||||||||||||||||
|
Reissuance of treasury stock under 401(k) Plan
|
8,641
|
44
|
53
|
97
|
||||||||||||||||||||||||||||
|
Reissuance of treasury stock under stock incentive plan
|
9,421
|
(57
|
)
|
57
|
--
|
|||||||||||||||||||||||||||
|
Reissuance of treasury stock for exercised stock
options
|
12,500
|
26
|
75
|
101
|
||||||||||||||||||||||||||||
|
Stock based compensation expense
|
173
|
173
|
||||||||||||||||||||||||||||||
|
Cash dividends declared ($0.34 per share)
|
(717
|
)
|
(717
|
)
|
||||||||||||||||||||||||||||
|
Net income
|
3,245
|
3,245
|
||||||||||||||||||||||||||||||
|
Other comprehensive income, net
|
98
|
98
|
||||||||||||||||||||||||||||||
|
BALANCE – DECEMBER 31, 2019
|
1,986,528
|
$
|
28
|
$
|
15,282
|
$
|
(5,114
|
)
|
$
|
(51
|
)
|
$
|
118
|
$
|
18,465
|
$
|
28,728
|
See accompanying notes to consolidated financial statements.
24
|
Quaint Oak Bancorp, Inc.
|
|
Consolidated Statements of Cash Flows
|
||||||||
|
Years Ended December 31,
|
||||||||
|
2020
|
2019
|
|||||||
|
(In Thousands)
|
||||||||
|
Cash Flows from Operating Activities
|
||||||||
|
Net income
|
$
|
3,245
|
$
|
2,477
|
||||
|
Adjustments to reconcile net income to net cash used in operating activities:
|
||||||||
|
Provision for loan losses
|
830
|
303
|
||||||
|
Depreciation expense
|
249
|
200
|
||||||
|
Amortization of operating right-of-use assets
|
145
|
95
|
||||||
|
Amortization of subordinated debt issuance costs
|
34
|
34
|
||||||
|
Amortization of other intangible
|
49
|
49
|
||||||
|
Net amortization of securities premiums
|
11
|
28
|
||||||
|
Accretion of deferred loan fees and costs, net
|
(1,370
|
)
|
(435
|
)
|
||||
|
Deferred income taxes
|
(566
|
)
|
(41
|
)
|
||||
|
Stock-based compensation expense
|
346
|
359
|
||||||
|
Net realized loss on sale of foreclosed real estate
|
92
|
-
|
||||||
|
Loss on sale of investment securities available for sale
|
-
|
4
|
||||||
|
Net gain on loans held for sale
|
(4,319
|
)
|
(3,014
|
)
|
||||
|
Loans held for sale-originations
|
(207,062
|
)
|
(135,310
|
)
|
||||
|
Loans held for sale-proceeds
|
167,118
|
134,499
|
||||||
|
Gain on the sale of SBA loans
|
(115
|
)
|
(265
|
)
|
||||
|
Write-downs of other real estate owned
|
105
|
221
|
||||||
|
Increase in the cash surrender value of bank-owned life insurance
|
(80
|
)
|
(80
|
)
|
||||
|
Changes in assets and liabilities which provided (used) cash:
|
||||||||
|
Accrued interest receivable
|
(1,705
|
)
|
(196
|
)
|
||||
|
Prepaid expenses and other assets
|
(1,640
|
)
|
(395
|
)
|
||||
|
Accrued interest payable
|
48
|
93
|
||||||
|
Accrued expenses and other liabilities
|
824
|
(478
|
)
|
|||||
|
Net Cash Used in Operating Activities
|
(43,761
|
)
|
(1,852
|
)
|
||||
|
Cash Flows from Investing Activities
|
||||||||
|
Purchase of interest-earning time deposits
|
(1,317
|
)
|
(6,849
|
)
|
||||
|
Redemption of interest-earning time deposits
|
2,026
|
1,603
|
||||||
|
Purchase of investment securities available for sale
|
(4,008
|
)
|
(3,319
|
)
|
||||
|
Principal repayments on investment securities available for sale
|
1,020
|
1,341
|
||||||
|
Proceeds from the sales of investment securities available for sale
|
--
|
1,030
|
||||||
|
Net increase in loans receivable
|
(111,775
|
)
|
(29,397
|
)
|
||||
|
Purchase of Federal Home Loan Bank stock
|
(808
|
)
|
(614
|
)
|
||||
|
Redemption of Federal Home Loan Bank stock
|
723
|
120
|
||||||
|
Proceeds from the sale of foreclosed real estate
|
1,611
|
--
|
||||||
|
Capitalized expenditures on other real estate owned
|
(270
|
)
|
(395
|
)
|
||||
|
Purchase of premises and equipment
|
(364
|
)
|
(368
|
)
|
||||
|
Net Cash Used in Investing Activities
|
(113,162
|
)
|
(36,848
|
)
|
||||
|
Cash Flows from Financing Activities
|
||||||||
|
Net increase (decrease) in demand deposits, money markets, and savings accounts
|
112,411
|
(2,689
|
)
|
|||||
|
Net increase in certificate accounts
|
14,976
|
18,236
|
||||||
|
(Decrease) increase in advances from borrowers for taxes and insurance
|
(294
|
)
|
212
|
|||||
|
Proceeds from Federal Home Loan Bank short-term borrowings
|
20,000
|
13,000
|
||||||
|
Repayment of Federal Home Loan Bank short-term borrowings
|
(20,000
|
)
|
(12,000
|
)
|
||||
|
Proceeds from Federal Home Loan Bank long-term borrowings
|
3,922
|
14,271
|
||||||
|
Repayment of Federal Home Loan Bank long-term borrowings
|
(2,000
|
)
|
(3,000
|
)
|
||||
|
Proceeds from Federal Reserve Bank long-term borrowings
|
52,144
|
--
|
||||||
|
Repayment of Federal Reserve Bank long-term borrowings
|
(4,010
|
)
|
--
|
|||||
|
Dividends paid
|
(717
|
)
|
(676
|
)
|
||||
|
Purchase of treasury stock
|
(349
|
)
|
(339
|
)
|
||||
|
Proceeds from the reissuance of treasury stock
|
97
|
38
|
||||||
|
Proceeds from the exercise of stock options
|
101
|
190
|
||||||
|
Net Cash Provided by Financing Activities
|
176,281
|
27,243
|
||||||
|
Net Increase (Decrease) in Cash and Cash Equivalents
|
19,358
|
(11,457
|
)
|
|||||
|
Cash and Cash Equivalents – Beginning of Year
|
14,555
|
26,012
|
||||||
|
Cash and Cash Equivalents – End of Year
|
$
|
33,913
|
$
|
14,555
|
||||
|
Supplementary Disclosure of Cash Flow and Non-Cash Information:
|
||||||||
|
Cash payments for interest
|
$
|
5,441
|
$
|
5,333
|
||||
|
Cash payments for income taxes
|
$
|
1,124
|
$
|
1,034
|
||||
|
Initial recognition of operating lease right-of use assets
|
$
|
658
|
$
|
1,386
|
||||
|
Initial recognition of operating lease obligations
|
$
|
658
|
$
|
1,386
|
||||
See accompanying notes to consolidated financial statements.
25
|
Quaint Oak Bancorp, Inc.
|
Notes to Consolidated Financial Statements
Note 1 - Nature of Operations
The consolidated financial statements include the accounts of Quaint Oak Bancorp, Inc., a Pennsylvania chartered
corporation (the “Company” or “Quaint Oak Bancorp”) and its wholly owned subsidiary, Quaint Oak Bank, a Pennsylvania chartered stock savings bank (the “Bank”), along with its wholly owned subsidiaries. At December 31, 2020, the Bank
has five wholly-owned subsidiaries, Quaint Oak Mortgage, LLC, Quaint Oak Real Estate, LLC, Quaint Oak Abstract, LLC, QOB Properties, LLC, and Quaint Oak Insurance Agency, LLC, each a Pennsylvania limited liability company. The mortgage
company offers mortgage banking in the Lehigh Valley, Delaware Valley and Philadelphia County regions of Pennsylvania. The real estate and abstract companies offer real estate sales and title abstract services, respectively, primarily
in the Lehigh Valley region of Pennsylvania. These companies began operation in July 2009. In February, 2019, Quaint Oak Mortgage opened a mortgage banking office in Philadelphia, Pennsylvania. QOB Properties, LLC began operations in
July 2012 and holds Bank properties acquired through a foreclosure proceeding or acceptance of a deed in lieu of foreclosure. Quaint Oak Insurance Agency, LLC began operations in August 2016 and provides a broad range of personal and
commercial insurance coverage solutions. All significant intercompany balances and transactions have been eliminated.
The Bank is subject to regulation by the Pennsylvania Department of Banking and Securities and the Federal Deposit
Insurance Corporation. Pursuant to the Bank’s election under Section 10(l) of the Home Owners’ Loan Act, the Company is a savings and loan holding company regulated by the Board of Governors of the Federal Reserve System. The market
area served by the Bank is principally Bucks, Montgomery and Philadelphia Counties in Pennsylvania and the Lehigh Valley area in Pennsylvania. The Bank has two banking locations: the main office location in Southampton, Pennsylvania
and a regional banking office in the Lehigh Valley area of Pennsylvania. The principal deposit products offered by the Bank are certificates of deposit, money market accounts, non-interest bearing checking accounts for businesses and
consumers, and savings accounts. In February 2019, Quaint Oak Bank opened a retail banking office in Philadelphia, Pennsylvania. The principal loan products offered by the Bank are fixed and adjustable rate residential and commercial
mortgages, construction loans, commercial business loans, home equity loans, and lines of credit.
Note 2 - Summary of Significant Accounting Policies
Use of Estimates
The preparation of the financial statements in conformity with accounting principles generally accepted
in the United States of America requires management to make estimates and assumptions that affect the reported amounts of assets and liabilities and disclosure of contingent assets and liabilities at the date of the financial statements
and the reported amounts of income and expenses during the reporting period. Actual results could differ from those estimates. The Company’s most significant estimates are the determination of the allowance for loan losses and
valuation of deferred tax assets.
Significant Group Concentrations of Credit Risk
The Bank has a significant concentration of loans in Philadelphia County, Pennsylvania. The
concentration of credit by type of loan is set forth in Note 7. Although the Bank has a diversified loan portfolio, its debtors’ ability to honor their contracts is influenced by the region’s economy. During the year ended December 31,
2020, one investor purchased a total of 36% of all loans sold by the Bank from its mortgage loans held for sale, and the sales to this investor accounted for approximately 34% of the gain on loans sold during the year.
Cash and Cash Equivalents
For purposes of reporting cash flows, cash and cash equivalents include non-interest earning and
interest-earning demand deposits and money market accounts with various financial institutions, all of which mature within ninety days of acquisition.
26
|
Quaint Oak Bancorp, Inc.
|
Notes to Consolidated Financial Statements (Continued)
Note 2 - Summary of Significant Accounting Policies (Continued)
Investment Securities
Management determines the appropriate classification of debt securities at the time of purchase and
reevaluates such designation as of each balance sheet date.
Securities classified as available for sale are those securities that the Company intends to hold for an
indefinite period of time but not necessarily to maturity. Any decision to sell a security classified as available for sale would be based on various factors, including significant movement in interest rates, changes in maturity mix of the
Company’s assets and liabilities, liquidity needs, regulatory capital requirements, and other similar factors. Securities available for sale are carried at fair value. Unrealized gains and losses are reported in other comprehensive
income, net of related deferred tax effects. Realized gains and losses, determined on the basis of the cost of the specific securities sold, are included in earnings. Premiums and discounts are recognized in interest income using the
interest method over the terms of the securities.
Securities classified as held to maturity are those debt securities the Company has both the intent and
ability to hold to maturity regardless of the changes in market conditions, liquidity needs, or changes in general economic conditions. These securities are carried at cost adjusted for amortization of premium and accretion of discount,
which are recognized in interest income using the interest method over the terms of the securities.
The Company follows the accounting guidance related to recognition and presentation of other-than-temporary
impairment. This accounting guidance specifies that (a) if a company does not have the intent to sell a debt security prior to recovery and (b) it is more likely than not that it will not have to sell the debt security prior to recovery,
the security would not be considered other-than-temporarily impaired unless there is a credit loss. When an entity does not intend to sell the security, and it is more likely than not the entity will not have to sell the security before
recovery of its cost basis, it will recognize the credit component of an other-than-temporary impairment of a debt security in earnings and the remaining portion in other comprehensive income. For held-to-maturity debt securities, the
amount of an other-than-temporary impairment recorded in other comprehensive income for the noncredit portion of a previous other-than-temporary impairment should be amortized prospectively over the remaining life of the security on the
basis of the timing of future estimated cash flows of the security. The Company recognized no other-than-temporary impairment charges during the years ended December 31, 2020 and 2019.
Federal Home Loan Bank Stock
Federal law requires a member institution of the Federal Home Loan Bank (FHLB) system to hold restricted stock of its district
Federal Home Loan Bank according to a predetermined formula. FHLB stock is carried at cost and evaluated for impairment. When evaluating FHLB stock for impairment, its value is determined based on the ultimate recoverability of the par
value of the stock. We evaluate our holdings of FHLB stock for impairment each reporting period. No impairment charges were recognized on FHLB stock during the years ended December 31, 2020 and 2019.
Loans Receivable
Loans receivable that management has the intent and ability to hold for the foreseeable future or until maturity or payoff are
stated at their outstanding unpaid principal balances, net of an allowance for loan losses and any deferred fees. Interest income is accrued on the unpaid principal balance. Loan origination fees and costs are deferred and recognized as
an adjustment of the yield (interest income) of the related loans. The Bank is generally amortizing these amounts over the contractual life of the loan.
27
|
Quaint Oak Bancorp, Inc.
|
Notes to Consolidated Financial Statements (Continued)
Note 2 - Summary of Significant Accounting Policies (Continued)
Loans Receivable (Continued)
The loans receivable portfolio is segmented into residential loans, commercial real estate loans,
construction loans, commercial business, and consumer loans. The residential loan segment has two classes: one-to-four family residential owner occupied loans and one-to-four family residential non-owner occupied loans. The commercial
real estate loan segment consists of the following classes: multi-family (five or more) residential, commercial real estate and commercial lines of credit. Construction loans are generally granted for the purpose of building a single
residential home. Commercial business loans are loans to businesses primarily for purchase of business essential equipment. Business essential equipment is equipment necessary for a business to support or assist with the day-to-day
operation or profitability of the business. The consumer loan segment consists of the following classes: home equity loans and other consumer loans. Included in the home equity class are home equity loans and home equity lines of
credit. Included in the other consumer are loans secured by saving accounts.
The accrual of interest is generally discontinued when principal or interest has become 90 days past
due unless the loan is in the process of collection and is either guaranteed or well secured. When a loan is placed on nonaccrual status, unpaid interest credited to income in the current year is reversed and unpaid interest accrued in
prior years is charged against the allowance for loan losses. Interest received on nonaccrual loans generally is either applied against principal or reported as interest income, according to management’s judgment as to the
collectability of principal. Generally, loans are restored to accrual status when the obligation is brought current, has performed in accordance with the contractual terms for a reasonable period of time and the ultimate collectability
of the total contractual principal and interest is no longer in doubt.
Allowance for Loan Losses
The allowance for loan losses represents management’s estimate of losses inherent in the loan portfolio as of the balance
sheet date and is recorded as a reduction to loans. The allowance for loan losses is increased by the provision for loan losses, and decreased by charge-offs, net of recoveries. Loans deemed to be uncollectible are charged against the
allowance for loan losses, and subsequent recoveries, if any, are credited to the allowance. All, or part, of the principal balance of loans receivable are charged off to the allowance as soon as it is determined that the repayment of
all, or part, of the principal balance is highly unlikely. Because all identified losses are immediately charged off, no portion of the allowance for loan losses is restricted to any individual loan or groups of loans, and the entire
allowance is available to absorb any and all loan losses.
The allowance for loan losses is maintained at a level considered adequate to provide for losses that can be reasonably
anticipated. Management performs a quarterly evaluation of the adequacy of the allowance. The allowance is based on the Company’s past loan loss experience, known and inherent risks in the portfolio, adverse situations that may affect
the borrower’s ability to repay, the estimated value of any underlying collateral, composition of the loan portfolio, current economic conditions and other relevant factors. This evaluation is inherently subjective as it requires
material estimates that may be susceptible to significant revision as more information becomes available.
The allowance consists of specific, general and unallocated components. The specific component relates to loans that are
identified as impaired. For loans that are identified as impaired, an allowance is established when the discounted cash flows (or collateral value or observable market price) of the impaired loan is lower than the carrying value of that
loan. The general component covers pools of loans by loan class. These pools of loans are evaluated for loss exposure based upon historical loss rates for each of these categories of loans, adjusted for qualitative factors. These
significant factors may include changes in lending policies and procedures, changes in existing general economic and business conditions affecting our primary lending areas, credit quality trends, collateral value, loan volumes and
concentrations, seasoning of the loan portfolio, recent loss experience in particular segments of the portfolio, duration of the current business cycle and bank regulatory examination results. The applied loss factors are re-evaluated
quarterly to ensure their relevance in the current economic environment. Residential mortgage lending generally entails a lower risk of default than other types of lending. Consumer loans and commercial real estate loans generally
involve more risk of collectability because of the type and nature of the collateral and, in certain cases, the absence of collateral. It is the Company’s policy to establish a specific reserve for loss on any delinquent loan when it
determines that a loss is probable. An unallocated component is maintained to cover uncertainties that could affect management’s estimate of probable losses. The unallocated component of the allowance reflects the margin of imprecision
inherent in the underlying assumptions used in the methodologies for estimating specific and general losses in the portfolio.
28
|
Quaint Oak Bancorp, Inc.
|
Notes to Consolidated Financial Statements (Continued)
Note 2 - Summary of Significant Accounting Policies (Continued)
Allowance for Loan Losses (Continued)
A loan is considered impaired when, based on current information and events, it is probable that the Company will be
unable to collect the scheduled payments of principal or interest when due according to the contractual terms of the loan agreement. Factors considered by management in determining impairment include payment status, collateral value
and the probability of collecting scheduled principal and interest payments when due. Loans that experience insignificant payment delays and payment shortfalls generally are not considered impaired. Management determines the
significance of payment delays and payment shortfalls on a case-by-case basis, taking into consideration all of the circumstances surrounding the loan and the borrower, including the length of the delay, the reasons for the delay,
the borrower’s prior payment record and the amount of the shortfall in relation to the principal and interest owed. Impairment is measured on a loan by loan basis by either the present value of expected future cash flows discounted
at the loan’s effective interest rate or the fair value of the collateral if the loan is collateral dependent. An allowance for loan losses is established for an impaired loan if its carrying value exceeds its estimated fair value.
The estimated fair values of substantially all of the Company’s impaired loans are measured based on the estimated fair value of the loan’s collateral.
A loan is considered a troubled debt restructuring (“TDR”) if the Company, for economic or legal reasons related to a
debtor’s financial difficulties, grants a concession to the debtor that it would not otherwise consider. Concessions granted under a TDR typically involve a temporary or permanent reduction in payments or interest rate or an
extension of a loan’s stated maturity date at less than a current market rate of interest. Loans identified as TDRs are designated as impaired.
For loans secured by real estate, estimated fair values are determined primarily through third-party appraisals. When a
real estate secured loan becomes impaired, a decision is made regarding whether an updated certified appraisal of the real estate is necessary. This decision is based on various considerations, including the age of the most recent
appraisal, the loan-to-value ratio based on the original appraisal and the condition of the property. Appraised values are discounted to arrive at the estimated selling price of the collateral, which is considered to be the
estimated fair value. The discounts also include estimated costs to sell the property.
The allowance calculation methodology includes further segregation of loan classes into risk rating
categories. The borrower’s overall financial condition, repayment sources, guarantors and value of collateral, if appropriate, are evaluated annually for all loans (except one-to-four family residential owner-occupied loans) where
the total amount outstanding to any borrower or group of borrowers exceeds $500,000, or when credit deficiencies arise, such as delinquent loan payments. Credit quality risk ratings include regulatory classifications of special
mention, substandard, doubtful and loss. Loans criticized as special mention have potential weaknesses that deserve management’s close attention. If uncorrected, the potential weaknesses may result in deterioration of the
repayment prospects. Loans classified substandard have a well-defined weakness or weaknesses that jeopardize the liquidation of the debt. They include loans that are inadequately protected by
the current sound net worth and paying capacity of the obligor or of the collateral pledged, if any. Loans classified doubtful have all the weaknesses inherent in loans classified substandard with the added characteristic that
collection or liquidation in full, on the basis of current conditions and facts, is highly improbable. Loans classified as a loss are considered uncollectible and are charged to the allowance for loan losses. Loans not classified
are rated pass. In addition, Federal regulatory agencies, as an integral part of their examination process, periodically review the Company’s allowance for loan losses and may require the Company to recognize additions to the
allowance based on their judgments about information available to them at the time of their examination, which may not be currently available to management. Based on management’s comprehensive analysis of the loan portfolio,
management believes the current level of the allowance for loan losses is adequate.
29
|
Quaint Oak Bancorp, Inc.
|
Notes to Consolidated Financial Statements (Continued)
Note 2 - Summary of Significant Accounting Policies (Continued)
Loans Held for Sale
Loans originated by the Bank’s mortgage banking subsidiary, Quaint Oak Mortgage, LLC, are intended for sale in the secondary
market and are carried at the lower of cost or fair value (LOCOM). Gains and losses on loan sales (sales proceeds minus carrying value) are recorded in noninterest income, and direct loan origination costs, commissions and fees are deferred
at origination of the loan and are recognized in noninterest income upon sale of the loan. To a lesser extent, the Bank originates commercial business loans for the purchase of business essential equipment for sale primarily to other
financial institutions.
Bank Owned Life Insurance (“BOLl”)
The Company purchases bank owned life insurance as a mechanism for funding various employee benefit costs. The Company is the
beneficiary of these policies that insure the lives of certain officers of its subsidiaries. The Company has recognized the cash surrender value under the insurance policies as an asset in the Consolidated Balance Sheets. Changes in the
cash surrender value are recorded in non-interest income in the Consolidated Statements of Income.
Premises and Equipment
Land is carried at cost. Premises and equipment are stated at cost less accumulated depreciation.
Depreciation is computed on the straight-line method over the expected useful lives of the related assets that range from three to thirty-nine years. The costs of maintenance and repairs are expensed as incurred. Costs of major additions
and improvements are capitalized.
Intangible Assets
Intangible assets on the consolidated balance sheets represent the acquisition by Quaint
Oak Insurance Agency of the renewal rights to a book of business on August 1, 2016 at a total cost of $1.0 million. Based on a valuation, $515,000 of the purchase price was determined to be goodwill and $485,000 was determined to be related
to the renewal rights to the book of business and deemed an other intangible asset. The renewal rights are being amortized over a ten year period based upon the annual retention rate of the book of business.
The Company will complete a goodwill and other intangible asset analysis at least on an
annual basis or more often if events and circumstances indicate that there may be impairment.
30
|
Quaint Oak Bancorp, Inc.
|
Notes to Consolidated Financial Statements (Continued)
Note 2 - Summary of Significant Accounting Policies (Continued)
Other Real Estate Owned
Other real estate owned or foreclosed assets are comprised of property acquired through a foreclosure
proceeding or acceptance of a deed in lieu of foreclosure and loans classified as in-substance foreclosures. A loan is classified as in-substance foreclosure when the Bank has taken possession of the collateral regardless of whether
formal foreclosure proceedings take place. Other real estate properties are initially recorded at fair value, net of estimated selling costs at the date of foreclosure, establishing a new cost basis. After foreclosure, valuations are
periodically performed by management and the real estate is carried at the lower of cost or fair value less estimated costs to sell. Net revenue and expenses from operations and additions to the valuation allowance are included in
other expenses.
The Company had one property in other real estate owned (OREO) totaling $286,000 at December 31, 2020.
The Company had four properties in OREO totaling $1.8 million at December 31, 2019.
Mortgage Servicing Rights
Included in other assets are mortgage servicing rights recognized as separate assets when mortgage loans are sold and the
servicing rights are retained. These capitalized mortgage servicing rights are amortized into non-interest income in proportion to, and over the period of, the estimated future net servicing period of the underlying mortgage loans.
Mortgage servicing rights totaled $136,000 and $128,000 at December 31, 2020 and 2019, respectively. During the year ended December 31, 2020 and 2019, approximately $17,000 and $13,000 in amortization was recognized, respectively.
Advertising Costs
The Company expenses all advertising costs as incurred. Advertising costs are included in non-interest
expense on the Consolidated Statements of Income.
Transfers of Financial Assets
Transfers of financial assets are accounted for as sales, when control over the assets has been
surrendered. Control over transferred assets is deemed to be surrendered when (1) the assets have been isolated from the Company, (2) the transferee obtains the right (free of conditions that constrain it from taking advantage of that
right) to pledge or exchange the transferred assets, and (3) the Company does not maintain effective control over the transferred assets through an agreement to repurchase them before their maturity or the ability to unilaterally cause
the holder to return specific assets.
Income Taxes
Deferred income taxes are provided on the liability method whereby deferred tax assets are recognized
for deductible temporary differences and deferred tax liabilities are recognized for taxable temporary differences. Temporary differences are the differences between the reported amounts of assets and liabilities and their tax basis.
Deferred tax assets are reduced by a valuation allowance when, in the opinion of management, it is more likely than not that some portion of the deferred tax assets will not be realized. Deferred tax assets and liabilities are adjusted
for the effects of changes in tax laws and rates on the date of enactment.
31
|
Quaint Oak Bancorp, Inc.
|
Notes to Consolidated Financial Statements (Continued)
Note 2 - Summary of Significant Accounting Policies (Continued)
Income Taxes (Continued)
The Company follows guidance related to accounting for uncertainty in income taxes, which sets out a
consistent framework to determine the appropriate level of tax reserves to maintain for uncertain tax positions. A tax position is recognized as a benefit only if it is more likely than not that the tax position would be sustained in a tax
examination, with a tax examination presumed to occur. The amount recognized is the largest amount of tax benefit that has more than 50 percent likelihood of being realized upon examination. For tax positions not meeting the more likely
than not test, no tax benefit is recorded. The Company had no material uncertain tax positions or accrued interest and penalties as of December 31, 2020 and 2019. The Company’s policy is to account for interest as a component of interest
expense and penalties as components of other expense. The Company is no longer subject to examination by taxing authorities for the years before January 1, 2017.
Comprehensive Income (Loss)
Accounting principles generally accepted in the United States of America require that
recognized revenue, expenses, gains and losses be included in net income. Although certain changes in assets and liabilities, such as unrealized gains and losses on available for sale securities, are reported as a separate component of the
stockholders’ equity section of the balance sheet, such items, along with net income, are components of comprehensive income (loss).
Treasury Stock and Unallocated Common Stock
The acquisition of treasury stock by the Company, including unallocated stock held by certain benefit
plans, is recorded under the cost method. At the date of subsequent reissue, treasury stock is reduced by the cost of such stock based on an average cost method with any excess proceeds credited to additional paid-in capital.
Share-Based Compensation
Stock compensation accounting guidance requires that the compensation cost relating to share-based payment
transactions be recognized in financial statements. That cost is measured based on the grant date fair value of the equity or liability instruments issued. The stock compensation accounting guidance covers a wide range of share-based
compensation arrangements including stock option and restricted share plans.
The stock compensation accounting guidance requires that compensation cost for all stock awards be
calculated and recognized over the employees’ service period, generally defined as the vesting period. For awards with graded-vesting, compensation cost is recognized on a straight-line basis over the requisite service period for the
entire award. A Black-Scholes model is used to estimate the fair value of stock options, while the closing price of the Company’s common stock on the grant date is used for restricted stock awards.
At December 31, 2020, the Company has outstanding equity awards under three share-based plans: the 2008
Stock Option Plan, the 2013 Stock Incentive Plan and the 2018 Stock Incentive Plan. Awards under these plans were made in May 2013 and 2018. These plans are more fully described in Note 14.
The Company also has an employee stock ownership plan (“ESOP”). This plan is more fully described in Note
14. As ESOP shares are committed to be released and allocated among participants, the Company recognizes compensation expense equal to the average market price of the shares over the period earned.
32
|
Quaint Oak Bancorp, Inc.
|
Notes to Consolidated Financial Statements (Continued)
Note 2 - Summary of Significant Accounting Policies (Continued)
Earnings Per Share
Amounts reported in earnings per share reflect earnings available to common stockholders for the period divided by the
weighted average number of shares of common stock outstanding during the period, exclusive of unearned ESOP shares, unvested restricted stock (RRP) shares and treasury shares. Stock options and unvested restricted stock are regarded
as potential common stock and are considered in the diluted earnings per share calculations to the extent they would have a dilutive effect if converted to common stock, computed using the “treasury stock” method.
Revenue from Contracts with Customers
The Company records revenue from contracts with customers in accordance with Accounting Standards Codification Topic 606,
“Revenue from Contracts with Customers” (“Topic 606”). Under Topic 606, the Company must identify the contract with a customer, identify the performance obligations in the contract, determine
the transaction price, allocate the transaction price to the performance obligations in the contract, and recognize revenue when (or as) the Company satisfies a performance obligation. In certain circumstances, noninterest income is
reported net of associated expenses.
The Company’s primary sources of revenue are derived from interest and dividends earned on loans and investment
securities, mortgage banking revenue, including gains on the sale of mortgage loans, income from bank-owned life insurance, and other financial instruments that are not within the scope of Topic 606. The main types of non-interest
income within the scope of the standard are as follows:
Service Charges on Deposits: The Bank has contracts with its
commercial checking deposit customers where fees are charged if the account balance falls below predetermined levels defined as compensating balances. These agreements can be cancelled at any time by either the Bank or the deposit
customer. Revenue from these transactions is recognized on a monthly basis as the Bank has an unconditional right to the fee consideration. The Bank also has transaction fees related to specific transactions or activities resulting
from customer request or activity that include overdraft fees, wire fees, and other transaction fees. All of these fees are attributable to specific performance obligations of the Bank where the revenue is recognized at a defined
point in time, completion of the requested service/transaction.
Abstract Title Fees: The Bank provides abstract title services
through its wholly owned subsidiary, Quaint Oak Abstract, LLC. Fees for these services are recognized as revenue immediately after the completion of the real estate settlement.
Real Estate Sales Commissions, Net: The Bank provides real
estate sales services through its wholly owned subsidiary, Quaint Oak Real Estate, LLC. Commission income is earned for these services and recognized as revenue immediately after the completion of the real estate settlement.
Insurance Commissions: Insurance
income generally consist of commissions from the sale of insurance policies and performance-based commissions from insurance companies. The Bank recognizes commission income from the sale of insurance policies when its wholly owned
subsidiary, Quaint Oak Insurance Agency, LLC, acts as an agent between the insurance carrier and policyholder, arranging for the insurance carrier to provide policies to policyholders, and acts on behalf of the insurance carrier by
providing customer service to the policyholder during the policy period. Commission income is recognized over time, using the output method of time elapsed, which corresponds with the underlying insurance policy period, for which
the Bank is obligated to perform under contract with the insurance carrier. Commission income is variable, as it is comprised of a certain percentage of the underlying policy premium. The Bank
estimates the variable consideration based upon the “most likely amount” method, and does not expect or anticipate a significant reversal of revenue in future periods, based upon historical experience. Payment is due from the
insurance carrier for commission income once the insurance policy has been sold. The Bank has elected to apply a practical expedient related to capitalizable costs, which are the commissions paid to insurance producers, and will
expense these commissions paid to insurance producers as incurred, as these costs are related to the commission income and would have been amortized within one year or less if they had been capitalized, the same period over which
the commission income was earned. Performance-based commissions from insurance companies are recognized at a point in time, when received, and no contingencies remain.
33
|
Quaint Oak Bancorp, Inc.
|
Notes to Consolidated Financial Statements (Continued)
Note 2 - Summary of Significant Accounting Policies (Continued)
Off-Balance Sheet Financial InstrumentsIn the ordinary course of business, the Bank has entered into off-balance sheet financial
instruments consisting of commitments to extend credit. Such financial instruments are recorded in the consolidated balance sheet when they are funded.
Reclassifications
Certain items in the 2019 consolidated financial statements have been reclassified to conform to the presentation in
the 2020 consolidated financial statements. Such reclassifications did not have a material impact on the overall consolidated financial statements.
Recently Adopted Accounting Pronouncements
In February 2016, the Financial Accounting Standards Board (FASB) issued ASU 2016-02, Leases (Topic
842). The standard requires lessees to recognize the assets and liabilities that arise from leases on the balance sheet. A lessee should recognize in the statement of financial position a liability to make lease payments (the
lease liability) and a right-of-use asset representing its right to use the underlying asset for the lease term. A short-term lease is defined as one in which (a) the lease term is 12 months or less, and (b) there is not an
option to purchase the underlying asset that the lessee is reasonably certain to exercise. For short-term leases, lessees may elect to recognize lease payments over the lease term on a straight-line basis. This Update is
effective for nonpublic business entities for fiscal years beginning after December 15, 2021, including interim periods within fiscal years beginning after December 31, 2022. The amendments should be applied at the beginning of
the earliest period presented using a modified retrospective approach, with earlier application permitted as of the beginning of an interim or annual reporting period.The Company is
currently assessing the practical expedients it may elect at adoption but does not anticipate the amendments will have a significant impact on the financial statements. Based on the Company’s preliminary analysis of its current
portfolio, the impact to the Company’s balance sheet is estimated to result in less than a 1 percent increase in assets and liabilities. The Company also anticipates additional disclosures to be provided at adoption.
Recent Accounting Pronouncements Not Yet Adopted
In June 2016, the FASB issued ASU 2016-13, Financial Instruments - Credit Losses: Measurement of Credit Losses on Financial Instruments, which
changes the impairment model for most financial assets. This Update is intended to improve financial reporting by requiring timelier recording of credit losses on loans and other financial instruments held by financial
institutions and other organizations. The underlying premise of the Update is that financial assets measured at amortized cost should be presented at the net amount expected to be collected, through an allowance for credit
losses that is deducted from the amortized cost basis. The allowance for credit losses should reflect management’s current estimate of credit losses that are expected to occur over the
remaining life of a financial asset. The income statement will be effected for the measurement of credit losses for newly recognized financial assets, as well as the expected increases or decreases of expected credit losses
that have taken place during the period. ASU 2016-13 is effective for annual and interim periods beginning after December 15, 2019, and early adoption is permitted for annual and interim periods beginning after December 15,
2018. With certain exceptions, transition to the new requirements will be through a cumulative effect adjustment to opening retained earnings as of the beginning of the first reporting period in which the guidance is adopted.
34
|
Quaint Oak Bancorp, Inc.
|
Notes to Consolidated Financial Statements (Continued)
Note 2 - Summary of Significant Accounting Policies (Continued)
Recent Accounting Pronouncements Not Yet Adopted (Continued)
In November 2019, the FASB issued ASU 2019-10, Financial Instruments – Credit
Losses (Topic 326), Derivatives and Hedging (Topic 815), and Leases (Topic 842). This Update defers the effective date of ASU 2016-13 for SEC filers that are eligible to be smaller reporting companies, non-SEC filers, and
all other companies to fiscal years beginning after December 15, 2022, including interim periods within those fiscal years. We expect to recognize a one-time cumulative effect adjustment to the allowance for loan losses as of the
beginning of the first reporting period in which the new standard is effective, but cannot yet determine the magnitude of any such one-time adjustment or the overall impact of the new guidance on the consolidated financial
statements.
In January 2017, the FASB issued ASU 2017-04, Simplifying the Test for Goodwill Impairment. To simplify the subsequent measurement of goodwill, the
FASB eliminated Step 2 from the goodwill impairment test. In computing the implied fair value of goodwill under Step 2, an entity had to perform procedures to determine the fair value at the impairment testing date of its
assets and liabilities (including unrecognized assets and liabilities) following the procedure that would be required in determining the fair value of assets acquired and liabilities assumed in a business combination. Instead,
under the amendments in this Update, an entity should perform its annual, or interim, goodwill impairment test by comparing the fair value of a reporting unit with its carrying amount. An entity should recognize an impairment
charge for the amount by which the carrying amount exceeds the reporting unit’s fair value; however, the loss recognized should not exceed the total amount of goodwill allocated to that reporting unit. A public business entity
that is a U.S. Securities and Exchange Commission (“SEC”) filer should adopt the amendments in this Update for its annual or any interim goodwill impairment tests in fiscal years beginning after December 15, 2019. In November 2019, the FASB issued ASU 2019-10, Financial Instruments – Credit Losses (Topic 326), Derivatives and Hedging
(Topic 815), and Leases (Topic 842), which deferred the effective date for ASC 350, Intangibles – Goodwill and Other, for smaller
reporting companies to fiscal years beginning after December 15, 2022, and interim periods within those fiscal years. This update is not expected to have a significant impact on the Company’s financial statements.
In May 2019, the FASB issued ASU 2019-05, Financial Instruments – Credit Losses,
Topic 326, which allows entities to irrevocably elect the fair value option for certain financial assets previously measured at amortized cost upon adoption of the new credit losses standard. To be eligible for the
transition election, the existing financial asset must otherwise be both within the scope of the new credit losses standard and eligible for the applying the fair value option in ASC 825-10.3. The election must be applied on an
instrument-by-instrument basis and is not available for either available-for-sale or held-to-maturity debt securities. For entities that elect the fair value option, the difference between the carrying amount and the fair value of
the financial asset would be recognized through a cumulative-effect adjustment to opening retained earnings as of the date an entity adopted ASU 2016-13. Changes in fair value of that financial asset would subsequently be reported
in current earnings. For entities that have not yet adopted ASU 2016-13, the effective dates and transition requirements are the same as those in ASU 2016-13. For entities that have adopted ASU 2016-13, ASU 2019-05 is effective
for fiscal years beginning after December 15, 2019, including interim periods within those fiscal years. Early adoption is permitted once ASU 2016-13 has been adopted. In November, 2019, the FASB issued ASU 2019-10, Financial Instruments – Credit Losses (Topic 326), Derivatives and Hedging (Topic 815), and Leases (Topic 842), which deferred the effective date for ASC 944,
Financial Services – Insurance, for public business entities that are SEC filers, except for smaller reporting companies, to fiscal years beginning after December 15, 2021, and interim periods within those fiscal years
and for all other entities, including smaller reporting companies, to fiscal years beginning after December 15, 2023, and interim periods within fiscal years beginning after December 15, 2024. This Update is not expected to have
a significant impact on the Company’s financial statements.
35
|
Quaint Oak Bancorp, Inc.
|
Notes to Consolidated Financial Statements (Continued)
Note 2 - Summary of Significant Accounting Policies (Continued)
Recent Accounting Pronouncements Not Yet Adopted (Continued)
In December 2019, the FASB issued ASU 2019-12, Income Taxes (Topic 740),
to simplify the accounting for income taxes, change the accounting for certain tax transactions, and make minor improvements to the codification. This Update provides a policy election to not allocate consolidated income taxes
when a member of a consolidated tax return is not subject to income tax and provides guidance to evaluate whether a step-up in tax basis of goodwill relates to a business combination in which book goodwill was recognized or a
separate transaction. The Update also changes current guidance for making an intraperiod allocation, if there is a loss in continuing operations and gains outside of continuing operations; determining when a deferred tax
liability is recognized after an investor in a foreign entity transitions to or from the equity method of accounting; accounting for tax law changes and year-to-date losses in interim periods; and determining how to apply the
income tax guidance to franchise taxes that are partially based on income. For public business entities, the amendments in this Update are effective for fiscal years and interim periods within those fiscal years, beginning
after December 15, 2020. For all other entities, the amendments are effective for fiscal years beginning after December 15, 2021, and interim periods within fiscal years beginning after December 15, 2022. This Update is not
expected to have a significant impact on the Company’s financial statements.
In March 2020, the FASB issued ASU 2020-03, Codification Improvements to
Financial Instruments. This ASU was issued to improve and clarify various financial instruments topics, including the current expected credit losses (CECL) standard issued in 2016. The ASU includes seven issues that
describe the areas of improvement and the related amendments to GAAP; they are intended to make the standards easier to understand and apply and to eliminate inconsistencies, and they are narrow in scope and are not expected
to significantly change practice for most entities. Among its provisions, the ASU clarifies that all entities, other than public business entities that elected the fair value option, are required to provide certain fair value
disclosures under ASC 825, Financial Instruments, in both interim and annual financial statements. It also clarifies that the contractual term of a net investment in a lease under Topic 842 should be the contractual term used
to measure expected credit losses under Topic 326. Amendments related to ASU 2019-04 are effective for fiscal years beginning after December 15, 2019, including interim periods within those fiscal years. Early adoption is not
permitted before an entity’s adoption of ASU 2016-01. Amendments related to ASU 2016-13 for entities that have not yet adopted that guidance are effective upon adoption of the amendments in ASU 2016-13. Early adoption is not
permitted before an entity’s adoption of ASU 2016-13. Amendments related to ASU 2016-13 for entities that have adopted that guidance are effective for fiscal years beginning after December 15, 2019, including interim periods
within those years. Other amendments are effective upon issuance of this ASU. This Update is not expected to have a significant impact on the Company’s financial statements.
36
|
Quaint Oak Bancorp, Inc.
|
Notes to Consolidated Financial Statements (Continued)
Note 2 - Summary of Significant Accounting Policies (Continued)
Recent Accounting Pronouncements Not Yet Adopted (Continued)
In March 2020, the FASB issued ASU 2020-04, Reference Rate Reform (Topic
848): Facilitation of the Effects of Reference Rate Reform on Financial Reporting, March 2020, to provide temporary optional expedients and exceptions to the U.S. GAAP guidance on contract modifications and hedge
accounting to ease the financial reporting burdens of the expected market transition from LIBOR and other interbank offered rates to alternative reference rates, such as Secured Overnight Financing Rate. Entities can elect
not to apply certain modification accounting requirements to contracts affected by what the guidance calls reference rate reform, if certain criteria are met. An entity that makes this election would not have to re-measure
the contracts at the modification date or reassess a previous accounting determination. Also, entities can elect various optional expedients that would allow them to continue applying hedge accounting for hedging
relationships affected by reference rate reform, if certain criteria are met, and can make a one-time election to sell and/or reclassify held-to-maturity debt securities that reference an interest rate affected by reference
rate reform. The amendments in this ASU are effective for all entities upon issuance through December 31, 2022. The Company is currently evaluating the impact the adoption of the standard will have on the Company’s financial
position or results of operations.
In October 2020, the FASB issued ASU 2020-08, Codification Improvements to
Subtopic 310-20, Receivables – Nonrefundable Fees and Other Costs, which clarifies that, for each reporting period, an entity should reevaluate whether a callable debt security is within the scope of ASC
310-20-35-33. For public business entities, ASU 2020-08 is effective for fiscal years, and interim periods within those fiscal years, beginning after December 15, 2020. Early application is not permitted. For all other
entities, ASU 2020-08 is effective for fiscal years beginning after December 15, 2021, and interim periods within fiscal years beginning after December 15, 2022. The Company is currently evaluating the impact the adoption of
the standard will have on the Company’s financial position or results of operations.
In January 2021, the FASB issued ASU 2021-01, Reference Rate Reform (Topic
848), which provides optional temporary guidance for entities transitioning away from the London Interbank Offered Rate (LIBOR) and other interbank offered rates (IBORs) to new references rates so that derivatives
affected by the discounting transition are explicitly eligible for certain optional expedients and exceptions within Topic 848. ASU 2021-01 clarifies that the derivatives affected by the discounting transition are explicitly
eligible for certain optional expedients and exceptions in Topic 848. ASU 2021-01 is effective immediately for all entities. Entities may elect to apply the amendments on a full retrospective basis as of any date from the
beginning of an interim period that includes or is subsequent to March 12, 2020, or on a prospective basis to new modifications from any date within an interim period that includes or is subsequent to the date of the
issuance of a final update, up to the date that financial statements are available to be issued. The amendments in this update do not apply to contract modifications made, as well as new hedging relationships entered into,
after December 31, 2022, and to existing hedging relationships evaluated for effectiveness for periods after December 31, 2022, except for certain hedging relationships existing as of December 31, 2022, that apply certain
optional expedients in which the accounting effects are recorded through the end of the hedging relationship. The Company is currently evaluating the impact the adoption of the standard will have on the Company’s financial
position or results of operations.
Note 3 – Earnings Per Share
Earnings per share (“EPS”) consists of two separate components, basic EPS and diluted EPS. Basic EPS is computed based on the
weighted average number of shares of common stock outstanding for each period presented. Diluted EPS is calculated based on the weighted average number of shares of common stock outstanding plus dilutive common stock
equivalents (“CSEs”). CSEs consist of shares that are assumed to have been purchased with the proceeds from the exercise of stock options, as well as unvested restricted stock (RRP) shares. Common stock equivalents which
are considered antidilutive are not included for the purposes of this calculation. For the years ended December 31, 2020 and 2019, all unvested restricted stock program awards and outstanding stock options representing
shares were dilutive.
37
|
Quaint Oak Bancorp, Inc.
|
The following table sets forth the composition of the weighted average shares (denominator) used in the basic and dilutive earnings per share computations.
|
For the Year Ended December 31,
|
||||||||
|
2020
|
2019
|
|||||||
|
Net Income
|
$
|
3,245,000
|
$
|
2,477,000
|
||||
|
Weighted average shares outstanding – basic
|
1,975,836
|
1,956,612
|
||||||
|
Effect of dilutive common stock equivalents
|
36,563
|
48,826
|
||||||
|
Adjusted weighted average shares outstanding – diluted
|
2,012,399
|
2,005,438
|
||||||
|
Basic earnings per share
|
$
|
1.64
|
$
|
1.27
|
||||
|
Diluted earnings per share
|
$
|
1.61
|
$
|
1.24
|
||||
Note 4 – Accumulated Other Comprehensive Income (Loss)
The following table presents the changes in accumulated other comprehensive income (loss) by component, net of tax, for the years ended December 31, 2020 and 2019 (in thousands):
|
Unrealized Losses on
Investment Securities
Available for Sale (1)
|
||||||||
|
2020
|
2019
|
|||||||
|
Balance beginning of the year
|
$
|
20
|
$
|
(2
|
)
|
|||
|
Other comprehensive income before reclassifications
|
98
|
19
|
||||||
|
Amount reclassified from accumulated other comprehensive income (loss)
|
--
|
3
|
||||||
|
Total other comprehensive income
|
98
|
22
|
||||||
|
Balance end of the year
|
$
|
118
|
$
|
20
|
||||
_______________________
|
(1)
|
All amounts are net of tax. Amounts in parentheses indicate debits.
|
The following table presents significant amounts reclassified out of each component of accumulated other comprehensive income for the years ended December 31, 2020 and 2019 (in thousands):
| Amount Reclassified from Accumulated |
|||||||
| Details About Other Comprehensive Income |
Other Comprehensive Income (Loss)(1) |
Affected Line Item in the Statement of Income |
|||||
| For the Year Ended December 31, |
|||||||
|
2020
|
2019
|
||||||
|
Unrealized losses on investment securities available for sale
|
$--
|
$(4)
|
Loss on sales of investment securities
|
||||
|
--
|
1
|
Income taxes
|
|||||
|
$--
|
$(3)
|
||||||
_______________________
| (1) |
Amounts in parentheses indicate debits.
|
38
|
Quaint Oak Bancorp, Inc.
|
Notes to Consolidated Financial Statements (Continued)
Note 5 – Investment in Interest-Earning Time Deposits
The investment in interest-earning time deposits as of December 31, 2020 and 2019, by contractual maturity, is shown below (in thousands):
|
2020
|
2019
|
|||||||
|
Due in one year or less
|
$
|
4,006
|
$
|
2,026
|
||||
|
Due after one year through five years
|
5,457
|
8,146
|
||||||
|
Total
|
$
|
9,463
|
$
|
10,172
|
||||
Note 6 – Investment Securities Available for Sale
The amortized cost, gross unrealized gains and losses, and fair value of investment securities available for sale at December 31, 2020 and 2019 are summarized below (in thousands):
|
December 31, 2020
|
||||||||||||||||
|
Amortized
Cost
|
Gross
Unrealized
Gains
|
Gross
Unrealized
(Losses)
|
Fair Value
|
|||||||||||||
|
Available for Sale:
|
||||||||||||||||
|
Mortgage-backed securities:
|
||||||||||||||||
|
Government National Mortgage Association securities
|
$
|
4,887
|
$
|
27
|
$
|
(1
|
)
|
$
|
4,913
|
|||||||
|
Federal National Mortgage Association securities
|
183
|
6
|
--
|
189
|
||||||||||||
|
Total mortgage-backed securities
|
5,070
|
33
|
(1
|
)
|
5,102
|
|||||||||||
|
Debt securities:
|
||||||||||||||||
|
Corporate notes
|
5,506
|
117
|
--
|
5,623
|
||||||||||||
|
Total available-for-sale-securities
|
$
|
10,576
|
$
|
150
|
$
|
(1
|
)
|
$
|
10,725
|
|||||||
|
December 31, 2019
|
||||||||||||||||
|
Amortized
Cost
|
Gross
Unrealized
Gains
|
Gross
Unrealized
(Losses)
|
Fair Value
|
|||||||||||||
|
Available for Sale:
|
||||||||||||||||
|
Mortgage-backed securities:
|
||||||||||||||||
|
Government National Mortgage Association securities
|
$
|
5,841
|
$
|
13
|
$
|
(1
|
)
|
$
|
5,853
|
|||||||
|
Federal National Mortgage Association securities
|
258
|
2
|
--
|
260
|
||||||||||||
|
Total mortgage-backed securities
|
6,099
|
15
|
(1
|
)
|
6,113
|
|||||||||||
|
Debt securities:
|
||||||||||||||||
|
Corporate notes
|
1,500
|
10
|
--
|
1,510
|
||||||||||||
|
Total available-for-sale-securities
|
$
|
7,599
|
$
|
25
|
$
|
(1
|
)
|
$
|
7,623
|
|||||||
The amortized cost and fair value of mortgage-backed and debt securities at December 31, 2020, by contractual maturity, are shown below. Expected maturities will differ from contractual
maturities because borrowers may have the right to call or prepay obligations with or without call or prepayment penalties (in thousands):
|
Available for Sale
|
||||||||
|
Amortized Cost
|
Fair Value
|
|||||||
|
Due after five through ten years
|
$
|
5,506
|
$
|
5,102
|
||||
|
Due after ten years
|
5,070
|
5,623
|
||||||
|
Total
|
$
|
10,576
|
$
|
10,725
|
||||
39
|
Quaint Oak Bancorp, Inc.
|
Notes to Consolidated Financial Statements (Continued)
Note 6 – Investment Securities Available for Sale (Continued)
The following tables show the Company’s gross unrealized losses and fair value, aggregated by investment category and length of time that the individual securities have been in a continuous
unrealized loss position at December 31, 2020 and 2019 (in thousands):
|
|
December 31, 2020
|
|||||||||||||||||||||||||||
|
Less than Twelve Months
|
Twelve Months or Greater
|
Total
|
||||||||||||||||||||||||||
| |
Number of Securities |
Fair Value
|
Gross
Unrealized Losses |
Fair Value
|
Gross
Unrealized Losses |
Fair Value
|
Gross
Unrealized Losses |
|||||||||||||||||||||
|
Government National Mortgage Association securities
|
1
|
$
|
681
|
$
|
(1
|
)
|
$
|
--
|
$
|
--
|
$
|
681
|
$
|
(1
|
)
|
|||||||||||||
|
|
December 31, 2019
|
|||||||||||||||||||||||||||
|
Less than Twelve Months
|
Twelve Months or Greater
|
Total
|
||||||||||||||||||||||||||
| |
Number of
Securities
|
Fair Value
|
Gross
Unrealized Losses |
Fair Value
|
Gross
Unrealized Losses |
Fair Value
|
Gross
Unrealized Losses |
|||||||||||||||||||||
|
Government National Mortgage Association securities
|
4
|
$
|
2,295
|
$
|
(1
|
)
|
$
|
--
|
$
|
--
|
$
|
2,295
|
$
|
(1
|
)
|
|||||||||||||
At December 31, 2020, there was one security in an unrealized loss position that at such date had an aggregate depreciation of 0.13% from the Company’s amortized cost basis. Management
believes that the estimated fair value of the securities disclosed above is primarily dependent on the movement of market interest rates. Management evaluated the length of time and the extent to which the fair value
has been less than cost and the financial condition and near term prospects of the issuer, including any specific events which may influence the operations of the issuer. The Company has the ability and intent to hold
the securities until the anticipated recovery of fair value occurs. Management does not believe any individual unrealized loss as of December 31, 2020 represents an other-than-temporary impairment. There were no
impairment charges recognized during the year ended December 31, 2020 or 2019.
40
|
Quaint Oak Bancorp, Inc.
|
Notes to Consolidated Financial Statements (Continued)
Note 7 - Loans Receivable, Net and Allowance for Loan Losses
The composition of net loans receivable is as follows (in thousands):
|
December 31,
2020
|
December 31,
2019
|
|||||||
|
Real estate loans:
|
||||||||
|
One-to-four family residential:
|
||||||||
|
Owner occupied
|
$
|
7,528
|
$
|
6,298
|
||||
|
Non-owner occupied
|
38,884
|
39,897
|
||||||
|
Total one-to-four family residential
|
46,412
|
46,195
|
||||||
|
Multi-family (five or more) residential
|
24,043
|
22,233
|
||||||
|
Commercial real estate
|
131,820
|
119,323
|
||||||
|
Construction
|
4,775
|
12,523
|
||||||
|
Home equity
|
3,788
|
3,726
|
||||||
|
Total real estate loans
|
210,838
|
204,000
|
||||||
|
Commercial business
|
154,387
|
45,745
|
||||||
|
Other consumer
|
17
|
22
|
||||||
|
Total Loans
|
365,242
|
249,767
|
||||||
|
Deferred loan fees and costs
|
(3,059
|
)
|
(844
|
)
|
||||
|
Allowance for loan losses
|
(3,061
|
)
|
(2,231
|
)
|
||||
|
Net Loans
|
$
|
359,122
|
$
|
246,692
|
||||
The following tables present the classes of the loan portfolio
summarized by the aggregate pass rating and the classified ratings of special mention, substandard and doubtful within the Company’s internal risk rating system as of December 31, 2020 and 2019 (in thousands):
|
December 31, 2020
|
||||||||||||||||||||
|
Pass
|
Special
Mention
|
Substandard
|
Doubtful
|
Total
|
||||||||||||||||
|
One-to-four family residential owner occupied
|
$
|
6,942
|
$
|
415
|
$
|
171
|
$
|
--
|
$
|
7,528
|
||||||||||
|
One-to-four family residential non-owner occupied
|
38,567
|
--
|
317
|
--
|
38,884
|
|||||||||||||||
|
Multi-family residential
|
24,043
|
--
|
--
|
--
|
24,043
|
|||||||||||||||
|
Commercial real estate
|
129,236
|
2,292
|
292
|
--
|
131,820
|
|||||||||||||||
|
Construction
|
4,775
|
--
|
--
|
--
|
4,775
|
|||||||||||||||
|
Home equity
|
3,788
|
--
|
--
|
--
|
3,788
|
|||||||||||||||
|
Commercial business
|
154,387
|
--
|
--
|
--
|
154,387
|
|||||||||||||||
|
Other consumer
|
17
|
--
|
--
|
--
|
17
|
|||||||||||||||
|
Total
|
$
|
361,755
|
$
|
2,707
|
$
|
780
|
$
|
--
|
$
|
365,242
|
||||||||||
41
|
Quaint Oak Bancorp, Inc.
|
Notes to Consolidated Financial Statements (Continued)
Note 7 - Loans Receivable, Net and Allowance for Loan Losses (Continued)
|
December 31, 2019
|
||||||||||||||||||||
|
Pass
|
Special Mention
|
Substandard
|
Doubtful
|
Total
|
||||||||||||||||
|
One-to-four family residential owner occupied
|
$
|
6,126
|
$
|
--
|
$
|
172
|
$
|
--
|
$
|
6,298
|
||||||||||
|
One-to-four family residential non-owner occupied
|
39,579
|
--
|
318
|
--
|
39,897
|
|||||||||||||||
|
Multi-family residential
|
22,233
|
--
|
--
|
--
|
22,233
|
|||||||||||||||
|
Commercial real estate
|
118,233
|
798
|
292
|
--
|
119,323
|
|||||||||||||||
|
Construction
|
12,523
|
--
|
--
|
--
|
12,523
|
|||||||||||||||
|
Home equity
|
3,726
|
--
|
--
|
--
|
3,726
|
|||||||||||||||
|
Commercial business
|
45,745
|
--
|
--
|
--
|
45,745
|
|||||||||||||||
|
Other consumer
|
22
|
--
|
--
|
--
|
22
|
|||||||||||||||
|
Total
|
$
|
248,187
|
$
|
798
|
$
|
782
|
$
|
--
|
$
|
249,767
|
||||||||||
The following table presents impaired loans by class, segregated by those for which a specific allowance was required and those for which a specific allowance was not necessary as of December 31, 2020 as well as the
average recorded investment and related interest income for the year then ended (in thousands):
|
December 31, 2020
|
||||||||||||||||||||
|
Recorded
Investment
|
Unpaid
Principal
Balance
|
Related
Allowance
|
Average
Recorded
Investment
|
Interest
Income
Recognized
|
||||||||||||||||
|
With no related allowance recorded:
|
||||||||||||||||||||
|
One-to-four family residential owner occupied
|
$
|
171
|
$
|
178
|
$
|
--
|
$
|
171
|
$
|
1
|
||||||||||
|
One-to-four family residential non-owner occupied
|
19
|
19
|
--
|
19
|
3
|
|||||||||||||||
|
Multi-family residential
|
--
|
--
|
--
|
--
|
--
|
|||||||||||||||
|
Commercial real estate
|
131
|
131
|
--
|
131
|
1
|
|||||||||||||||
|
Construction
|
--
|
--
|
--
|
--
|
--
|
|||||||||||||||
|
Home equity
|
--
|
--
|
--
|
--
|
--
|
|||||||||||||||
|
Commercial business
|
--
|
--
|
--
|
--
|
--
|
|||||||||||||||
|
Other consumer
|
--
|
--
|
--
|
--
|
--
|
|||||||||||||||
|
With an allowance recorded:
|
||||||||||||||||||||
|
One-to-four family residential owner occupied
|
$
|
--
|
$
|
--
|
$
|
--
|
$
|
--
|
$
|
--
|
||||||||||
|
One-to-four family residential non-owner occupied
|
--
|
--
|
--
|
--
|
--
|
|||||||||||||||
|
Multi-family residential
|
--
|
--
|
--
|
--
|
--
|
|||||||||||||||
|
Commercial real estate
|
--
|
--
|
--
|
--
|
--
|
|||||||||||||||
|
Construction
|
--
|
--
|
--
|
--
|
--
|
|||||||||||||||
|
Home equity
|
--
|
--
|
--
|
--
|
--
|
|||||||||||||||
|
Commercial business
|
--
|
--
|
--
|
--
|
--
|
|||||||||||||||
|
Other consumer
|
--
|
--
|
--
|
--
|
--
|
|||||||||||||||
|
Total:
|
||||||||||||||||||||
|
One-to-four family residential owner occupied
|
$
|
171
|
178
|
$
|
--
|
$
|
171
|
$
|
1
|
|||||||||||
|
One-to-four family residential non-owner occupied
|
19
|
19
|
--
|
19
|
3
|
|||||||||||||||
|
Multi-family residential
|
--
|
--
|
--
|
--
|
--
|
|||||||||||||||
|
Commercial real estate
|
131
|
131
|
--
|
131
|
1
|
|||||||||||||||
|
Construction
|
--
|
--
|
--
|
--
|
--
|
|||||||||||||||
|
Home equity
|
--
|
--
|
--
|
--
|
--
|
|||||||||||||||
|
Commercial business
|
--
|
--
|
--
|
--
|
--
|
|||||||||||||||
|
Other consumer
|
--
|
--
|
--
|
--
|
--
|
|||||||||||||||
|
Total
|
$
|
321
|
$
|
328
|
$
|
--
|
$
|
321
|
$
|
5
|
||||||||||
42
|
Quaint Oak Bancorp, Inc.
|
Notes to Consolidated Financial Statements (Continued)
Note 7 - Loans Receivable, Net and Allowance for Loan Losses (Continued)
The following table presents impaired loans by class, segregated by those for which a specific allowance was required and those for which a specific allowance was not necessary as of December 31, 2019 as well as the
average recorded investment and related interest income for the year then ended (in thousands):
|
December 31, 2019
|
||||||||||||||||||||
|
Recorded
Investment
|
Unpaid
Principal
Balance
|
Related
Allowance |
Average
Recorded
Investment
|
Interest
Income
Recognized
|
||||||||||||||||
|
With no related allowance recorded:
|
||||||||||||||||||||
|
One-to-four family residential owner occupied
|
$
|
172
|
$
|
178
|
$
|
--
|
$
|
178
|
$
|
--
|
||||||||||
|
One-to-four family residential non-owner occupied
|
19
|
19
|
--
|
225
|
13
|
|||||||||||||||
|
Multi-family residential
|
--
|
--
|
--
|
--
|
--
|
|||||||||||||||
|
Commercial real estate
|
--
|
--
|
--
|
--
|
--
|
|||||||||||||||
|
Construction
|
--
|
--
|
--
|
--
|
--
|
|||||||||||||||
|
Home equity
|
--
|
--
|
--
|
--
|
--
|
|||||||||||||||
|
Commercial business
|
--
|
--
|
--
|
--
|
--
|
|||||||||||||||
|
Other consumer
|
--
|
--
|
--
|
--
|
--
|
|||||||||||||||
|
With an allowance recorded:
|
||||||||||||||||||||
|
One-to-four family residential owner occupied
|
$
|
--
|
$
|
--
|
$
|
--
|
$
|
--
|
$
|
--
|
||||||||||
|
One-to-four family residential non-owner occupied
|
--
|
--
|
--
|
--
|
--
|
|||||||||||||||
|
Multi-family residential
|
--
|
--
|
--
|
--
|
--
|
|||||||||||||||
|
Commercial real estate
|
132
|
132
|
4
|
133
|
12
|
|||||||||||||||
|
Construction
|
--
|
--
|
--
|
--
|
--
|
|||||||||||||||
|
Home equity
|
--
|
--
|
--
|
--
|
--
|
|||||||||||||||
|
Commercial business
|
--
|
--
|
--
|
--
|
--
|
|||||||||||||||
|
Other consumer
|
--
|
--
|
--
|
--
|
--
|
|||||||||||||||
|
Total:
|
||||||||||||||||||||
|
One-to-four family residential owner occupied
|
$
|
172
|
178
|
$
|
--
|
$
|
178
|
$
|
--
|
|||||||||||
|
One-to-four family residential non-owner occupied
|
19
|
19
|
--
|
225
|
13
|
|||||||||||||||
|
Multi-family residential
|
--
|
--
|
--
|
--
|
--
|
|||||||||||||||
|
Commercial real estate
|
132
|
132
|
4
|
133
|
12
|
|||||||||||||||
|
Construction
|
--
|
--
|
--
|
--
|
--
|
|||||||||||||||
|
Home equity
|
--
|
--
|
--
|
--
|
--
|
|||||||||||||||
|
Commercial business
|
--
|
--
|
--
|
--
|
--
|
|||||||||||||||
|
Other consumer
|
--
|
--
|
--
|
--
|
--
|
|||||||||||||||
|
Total
|
$
|
323
|
$
|
329
|
$
|
4
|
$
|
536
|
$
|
25
|
||||||||||
The loan portfolio also includes certain loans
that have been modified in a troubled debt restructuring, where economic concessions have been granted to borrowers who have experienced or are expected to experience financial difficulties. These concessions
typically result from loss mitigation activities and could include reductions in the interest rate, payment extensions, forbearance, or other actions. At December 31, 2020, the Company had two loans totaling
$150,000 that were identified as troubled debt restructurings. One of these loans was performing in accordance with its modified terms and one was on non-accrual as of December 31, 2020. During the year ended December 31, 2020, no new loans were identified as TDRs. At December 31, 2019, the Company had two loans
totaling $151,000 that were identified as troubled debt restructurings. Both of these loans were performing in accordance with their modified terms. If a TDR is placed on non-accrual it is not reverted back to
accruing status until the borrower makes timely payments as contracted for at least six months and future collection under the revised terms is probable.
43
|
Quaint Oak Bancorp, Inc.
|
Notes to Consolidated Financial Statements (Continued)
Note 7 - Loans Receivable, Net and Allowance for Loan Losses (Continued)
The following tables present the Company’s TDR loans as of December 31, 2020 and 2019 (dollar amounts in thousands):
|
December 31, 2020
|
||||||||||||||||||||
|
Number of
Contracts
|
Recorded
Investment
|
Non-
Accrual
|
Accruing
|
Related
Allowance
|
||||||||||||||||
|
One-to-four family residential owner occupied
|
--
|
$
|
--
|
$
|
--
|
$
|
--
|
$
|
--
|
|||||||||||
|
One-to-four family residential non-owner occupied
|
1
|
19
|
19
|
--
|
--
|
|||||||||||||||
|
Multi-family residential
|
--
|
--
|
--
|
--
|
--
|
|||||||||||||||
|
Commercial real estate
|
1
|
131
|
--
|
131
|
--
|
|||||||||||||||
|
Construction
|
--
|
--
|
--
|
--
|
--
|
|||||||||||||||
|
Home equity
|
--
|
--
|
--
|
--
|
--
|
|||||||||||||||
|
Commercial business
|
--
|
--
|
--
|
--
|
--
|
|||||||||||||||
|
Other consumer
|
--
|
--
|
--
|
--
|
--
|
|||||||||||||||
|
Total
|
2
|
$
|
150
|
$
|
19
|
$
|
131
|
$
|
--
|
|||||||||||
|
December 31, 2019
|
||||||||||||||||||||
|
Number of
Contracts
|
Recorded
Investment
|
Non-
Accrual
|
Accruing
|
Related
Allowance
|
||||||||||||||||
|
One-to-four family residential owner occupied
|
--
|
$
|
--
|
$
|
--
|
$
|
--
|
$
|
--
|
|||||||||||
|
One-to-four family residential non-owner occupied
|
1
|
19
|
--
|
19
|
--
|
|||||||||||||||
|
Multi-family residential
|
--
|
--
|
--
|
--
|
--
|
|||||||||||||||
|
Commercial real estate
|
1
|
132
|
--
|
132
|
4
|
|||||||||||||||
|
Construction
|
--
|
--
|
--
|
--
|
--
|
|||||||||||||||
|
Home equity
|
--
|
--
|
--
|
--
|
--
|
|||||||||||||||
|
Commercial business
|
--
|
--
|
--
|
--
|
--
|
|||||||||||||||
|
Other consumer
|
--
|
--
|
--
|
--
|
--
|
|||||||||||||||
|
Total
|
2
|
$
|
151
|
$
|
--
|
$
|
151
|
$
|
4
|
|||||||||||
The contractual aging of the TDRs in the tables above as of December 31, 2020 and 2019 is as follows (in thousands):
|
December 31, 2020
|
||||||||||||||||||||
|
Current
|
Past Due
30-89 Days |
Greater
than 90
Days and
Accruing
|
Non-
Accrual
|
Total
|
||||||||||||||||
|
One-to-four family residential owner occupied
|
$
|
--
|
$
|
--
|
$
|
--
|
$
|
--
|
$
|
--
|
||||||||||
|
One-to-four family residential non-owner occupied
|
--
|
--
|
--
|
19
|
19
|
|||||||||||||||
|
Multi-family residential
|
--
|
--
|
--
|
--
|
--
|
|||||||||||||||
|
Commercial real estate
|
131
|
--
|
--
|
--
|
131
|
|||||||||||||||
|
Construction
|
--
|
--
|
--
|
--
|
--
|
|||||||||||||||
|
Home equity
|
--
|
--
|
--
|
--
|
--
|
|||||||||||||||
|
Commercial business
|
--
|
--
|
--
|
--
|
--
|
|||||||||||||||
|
Other consumer
|
--
|
--
|
--
|
--
|
--
|
|||||||||||||||
|
Total
|
$
|
131
|
$
|
--
|
$
|
--
|
$
|
19
|
$
|
150
|
||||||||||
44
|
Quaint Oak Bancorp, Inc.
|
Notes to Consolidated Financial Statements (Continued)
Note 7 - Loans Receivable, Net and Allowance for Loan Losses (Continued)
|
December 31, 2019
|
||||||||||||||||||||
|
Current
|
Past Due
30-89 Days
|
Greater
than 90
Days and
Accruing
|
Non-
Accrual
|
Total
|
||||||||||||||||
|
One-to-four family residential owner occupied
|
$
|
--
|
$
|
--
|
$
|
--
|
$
|
--
|
$
|
--
|
||||||||||
|
One-to-four family residential non-owner occupied
|
--
|
19
|
--
|
--
|
19
|
|||||||||||||||
|
Multi-family residential
|
--
|
--
|
--
|
--
|
--
|
|||||||||||||||
|
Commercial real estate
|
132
|
--
|
--
|
--
|
132
|
|||||||||||||||
|
Construction
|
--
|
--
|
--
|
--
|
--
|
|||||||||||||||
|
Home equity
|
--
|
--
|
--
|
--
|
--
|
|||||||||||||||
|
Commercial business
|
--
|
--
|
--
|
--
|
--
|
|||||||||||||||
|
Other consumer
|
--
|
--
|
--
|
--
|
--
|
|||||||||||||||
|
Total
|
$
|
132
|
$
|
19
|
$
|
--
|
$
|
--
|
$
|
151
|
||||||||||
Any reserve for an impaired TDR loan is based upon the present value of the future expected cash flows discounted at the loan’s original effective rate or upon the fair value
of the collateral less costs to sell, if the loan is deemed collateral dependent. At December 31, 2020 there were no commitments to lend additional funds to debtors whose loan terms have been modified as TDRs.
The general practice of the Bank is to work with borrowers so that they are able to pay back their loan in full. If a borrower continues to be delinquent or cannot meet the
terms of a TDR modification and the loan is determined to be uncollectible, the loan will be charged off.
Following is a summary, by loan portfolio class, of changes in the allowance for loan losses for the year ended December 31, 2020 and recorded investment in loans receivable
based on impairment evaluation as of December 31, 2020 (in thousands):
|
December 31, 2020
|
||||||||||||||||||||||||||||||||||||
|
1-4 Family
Residential
Owner
Occupied
|
1-4 Family
Residential Non-
Owner
Occupied
|
Multi-
Family
Residential
|
Commercial
Real Estate
|
Construction
|
Home
Equity
|
Commercial
Business
and Other
Consumer
|
Unallocated
|
Total
|
||||||||||||||||||||||||||||
|
Allowance for loan losses:
|
||||||||||||||||||||||||||||||||||||
|
Beginning balance
|
$
|
52
|
$
|
351
|
$
|
145
|
$
|
854
|
$
|
250
|
$
|
19
|
$
|
500
|
$
|
60
|
$
|
2,231
|
||||||||||||||||||
|
Charge-offs
|
--
|
--
|
--
|
--
|
--
|
--
|
--
|
--
|
--
|
|||||||||||||||||||||||||||
|
Recoveries
|
--
|
--
|
--
|
--
|
--
|
--
|
--
|
--
|
--
|
|||||||||||||||||||||||||||
|
Provision
|
36
|
11
|
84
|
433
|
(188
|
)
|
1
|
263
|
190
|
830
|
||||||||||||||||||||||||||
|
Ending balance
|
$
|
88
|
$
|
362
|
$
|
229
|
$
|
1,287
|
$
|
62
|
$
|
20
|
$
|
763
|
$
|
250
|
$
|
3,061
|
||||||||||||||||||
|
Ending balance evaluated
|
||||||||||||||||||||||||||||||||||||
|
for impairment:
|
||||||||||||||||||||||||||||||||||||
|
Individually
|
$
|
--
|
$
|
--
|
$
|
--
|
$
|
--
|
$
|
--
|
$
|
--
|
$
|
--
|
$
|
--
|
$
|
-
|
||||||||||||||||||
|
Collectively
|
$
|
88
|
$
|
362
|
$
|
229
|
$
|
1,287
|
$
|
62
|
$
|
20
|
763
|
$
|
250
|
$
|
3,061
|
|||||||||||||||||||
|
Loans receivable:
|
||||||||||||||||||||||||||||||||||||
|
Ending balance
|
$
|
7,528
|
$
|
38,884
|
$
|
24,043
|
$
|
131,820
|
$
|
4,775
|
$
|
3,788
|
$
|
154,404
|
$
|
365,242
|
||||||||||||||||||||
|
Ending balance evaluated
|
||||||||||||||||||||||||||||||||||||
|
for impairment:
|
||||||||||||||||||||||||||||||||||||
|
Individually
|
$
|
171
|
$
|
19
|
$
|
--
|
$
|
131
|
$
|
--
|
$
|
--
|
$
|
--
|
$
|
321
|
||||||||||||||||||||
|
Collectively
|
$
|
7,357
|
$
|
38,865
|
$
|
24,043
|
$
|
131,689
|
$
|
4,775
|
$
|
3,788
|
$
|
154,404
|
$
|
364,921
|
||||||||||||||||||||
45
|
Quaint Oak Bancorp, Inc.
|
Notes to Consolidated Financial Statements (Continued)
Note 7 - Loans Receivable, Net and Allowance for Loan Losses (Continued)
The Bank allocated increased allowance for loan loss provisions to the commercial real estate loan portfolio class for the year ended December 31, 2020, due primarily to changes in volume and qualitative
factors in this portfolio class. The Bank allocated increased allowance for loan loss provisions to the commercial business loan portfolio class for the year ended December 31, 2020, due primarily to
changes in qualitative and quantitative factors in this portfolio class. The Bank allocated increased allowance for loan loss provisions to the multi-family loan portfolio class for the year ended December
31, 2020, due primarily to changes in qualitative factors in this portfolio class. The Bank allocated decreased allowance for loan loss provisions to the construction loan portfolio class for the year
ended December 31, 2020, due primarily to changes in quantitative and qualitative factors in this portfolio class. In general, the primary driver of the increase in qualitative factors was the economic
trends factor associated with the COVID-19 pandemic. In this regard, the Bank increased the unallocated component of the allowance for the year ended December 31, 2020 to cover uncertainties that could
affect management’s estimate of probable losses primarily associated with the COVID-19 pandemic.
Following is a summary, by loan portfolio class, of changes in the allowance for loan losses for the year ended December 31, 2019 and recorded
investment in loans receivable based on impairment evaluation as of December 31, 2019 (in thousands):
|
December 31, 2019
|
||||||||||||||||||||||||||||||||||||
|
1-4 Family
Residential
Owner
Occupied
|
1-4 Family
Residential
Non-Owner
Occupied
|
Multi-
Family
Residential
|
Commercial
Real Estate
|
Construction
|
Home
Equity
|
Commercial
Business and
Other
Consumer
|
Unallocated
|
Total
|
||||||||||||||||||||||||||||
|
Allowance for loan losses:
|
||||||||||||||||||||||||||||||||||||
|
Beginning balance
|
$
|
51
|
$
|
435
|
$
|
156
|
$
|
839
|
$
|
175
|
$
|
21
|
$
|
247
|
$
|
41
|
$
|
1,965
|
||||||||||||||||||
|
Charge-offs
|
--
|
(37
|
)
|
--
|
--
|
--
|
--
|
--
|
--
|
(37
|
)
|
|||||||||||||||||||||||||
|
Recoveries
|
--
|
--
|
--
|
--
|
--
|
--
|
--
|
--
|
--
|
|||||||||||||||||||||||||||
|
Provision
|
1
|
(47
|
)
|
(11
|
)
|
15
|
75
|
(2
|
)
|
253
|
19
|
303
|
||||||||||||||||||||||||
|
Ending balance
|
$
|
52
|
$
|
351
|
$
|
145
|
$
|
854
|
$
|
250
|
$
|
19
|
$
|
500
|
$
|
60
|
$
|
2,231
|
||||||||||||||||||
|
Ending balance evaluated
|
||||||||||||||||||||||||||||||||||||
|
for impairment:
|
||||||||||||||||||||||||||||||||||||
|
Individually
|
$
|
--
|
$
|
--
|
$
|
--
|
$
|
4
|
$
|
--
|
$
|
--
|
$
|
--
|
$
|
--
|
$
|
4
|
||||||||||||||||||
|
Collectively
|
$
|
52
|
$
|
351
|
$
|
145
|
$
|
850
|
$
|
250
|
$
|
19
|
500
|
$
|
60
|
$
|
2,227
|
|||||||||||||||||||
|
Loans receivable:
|
||||||||||||||||||||||||||||||||||||
|
Ending balance
|
$
|
6,298
|
$
|
39,897
|
$
|
22,233
|
$
|
119,323
|
$
|
12,523
|
$
|
3,726
|
$
|
45,767
|
$
|
249,767
|
||||||||||||||||||||
|
Ending balance evaluated
|
||||||||||||||||||||||||||||||||||||
|
for impairment:
|
||||||||||||||||||||||||||||||||||||
|
Individually
|
$
|
172
|
$
|
19
|
$
|
--
|
$
|
132
|
$
|
--
|
$
|
--
|
$
|
--
|
$
|
323
|
||||||||||||||||||||
|
Collectively
|
$
|
6,126
|
$
|
39,878
|
$
|
22,233
|
$
|
119,191
|
$
|
12,523
|
$
|
3,726
|
$
|
45,767
|
$
|
249,444
|
||||||||||||||||||||
The Bank allocated increased allowance for loan loss provisions to the commercial business loan portfolio class, the construction loan portfolio class, and the commercial
real estate loan portfolio class for the year ended December 31, 2019, due primarily to increased balances in these portfolio classes. The Bank allocated decreased allowance for loan loss provisions to the
1-4 family non-owner occupied loan portfolio class for the year ended December 31, 2019, due primarily to a decrease in balances in this portfolio class.
46
|
Quaint Oak Bancorp, Inc.
|
Notes to Consolidated Financial Statements (Continued)
Note 7 - Loans Receivable, Net and Allowance for Loan Losses (Continued)
The following table presents non-accrual loans by classes of the loan portfolio as of December 31, 2020 and 2019 (in thousands):
|
December 31,
2020
|
December 31,
2019
|
|||||||
|
One-to-four family residential owner occupied
|
$
|
171
|
$
|
172
|
||||
|
One-to-four family residential non-owner occupied
|
19
|
--
|
||||||
|
Multi-family residential
|
--
|
--
|
||||||
|
Commercial real estate
|
--
|
--
|
||||||
|
Construction
|
--
|
--
|
||||||
|
Home equity
|
--
|
--
|
||||||
|
Commercial business
|
--
|
--
|
||||||
|
Other consumer
|
--
|
--
|
||||||
|
Total
|
$
|
190
|
$
|
172
|
||||
Non-performing loans, which consist of non-accruing loans plus accruing loans 90 days or more past due, amounted to $643,000 and $362,000 at December 31, 2020 and 2019, respectively. For the
delinquent loans in our portfolio, we have considered our ability to collect the past due interest, as well as the principal balance of the loan, in order to determine whether specific loans should be
placed on non-accrual status. In cases where our evaluations have determined that the principal and interest balances are collectible, we have continued to accrue interest.
For the years ended December 31, 2020 and 2019 there was no interest income recognized on non-accrual loans on a cash basis. Interest income foregone on non-accrual loans was approximately $1,000
and $10,000 for the years ended December 31, 2020 and 2019, respectively.
The performance and credit quality of the loan portfolio are also monitored by analyzing the age of the loans receivable as determined by the length of time a recorded payment is past due. The
following tables present the classes of the loan portfolio summarized by the past due status as of December 31, 2020 and 2019 (in thousands):
|
December 31, 2020
|
||||||||||||||||||||||||
|
30-89
Days Past
Due
|
90 Days
or More
Past Due
|
Total
Past Due
|
Current
|
Total Loans
Receivable
|
Loans
Receivable 90
Days or More
Past Due and
Accruing
|
|||||||||||||||||||
|
One-to-four family residential owner occupied
|
$
|
822
|
$
|
171
|
$
|
993
|
$
|
6,535
|
$
|
7,528
|
$
|
--
|
||||||||||||
|
One-to-four family residential non-owner
occupied
|
189
|
66
|
255
|
38,629
|
38,884
|
66
|
||||||||||||||||||
|
Multi-family residential
|
1,947
|
--
|
1,947
|
22,096
|
24,043
|
--
|
||||||||||||||||||
|
Commercial real estate
|
569
|
387
|
956
|
130,864
|
131,820
|
387
|
||||||||||||||||||
|
Construction
|
1,783
|
--
|
1,783
|
2,992
|
4,775
|
--
|
||||||||||||||||||
|
Home equity
|
--
|
--
|
--
|
3,788
|
3,788
|
--
|
||||||||||||||||||
|
Commercial business
|
574
|
--
|
574
|
153,813
|
154,387
|
--
|
||||||||||||||||||
|
Other consumer
|
--
|
--
|
--
|
17
|
17
|
--
|
||||||||||||||||||
|
Total
|
$
|
5,884
|
$
|
624
|
$
|
6,508
|
$
|
358,734
|
$
|
365,242
|
$
|
453
|
||||||||||||
47
|
Quaint Oak Bancorp, Inc.
|
Notes to Consolidated Financial Statements (Continued)
Note 7 - Loans Receivable, Net and Allowance for Loan Losses (Continued)
|
December 31, 2019
|
||||||||||||||||||||||||
|
30-89
Days Past
Due
|
90 Days
or More
Past Due
|
Total
Past Due
|
Current
|
Total Loans
Receivable
|
Loans
Receivable
90 Days or
More Past
Due and
Accruing
|
|||||||||||||||||||
|
One-to-four family residential owner occupied
|
$
|
1,199
|
$
|
172
|
$
|
1,371
|
$
|
4,927
|
$
|
6,298
|
$
|
--
|
||||||||||||
|
One-to-four family residential non-owner occupied
|
1,069
|
--
|
1,069
|
38,828
|
39,897
|
--
|
||||||||||||||||||
|
Multi-family residential
|
--
|
--
|
--
|
22,233
|
22,233
|
--
|
||||||||||||||||||
|
Commercial real estate
|
986
|
190
|
1,176
|
118,147
|
119,323
|
190
|
||||||||||||||||||
|
Construction
|
1,120
|
--
|
1,120
|
11,403
|
12,523
|
--
|
||||||||||||||||||
|
Home equity
|
--
|
--
|
--
|
3,726
|
3,726
|
--
|
||||||||||||||||||
|
Commercial business
|
66
|
--
|
66
|
45,679
|
45,745
|
--
|
||||||||||||||||||
|
Other consumer
|
--
|
--
|
--
|
22
|
22
|
--
|
||||||||||||||||||
|
Total
|
$
|
4,440
|
$
|
362
|
$
|
4,802
|
$
|
244,965
|
$
|
249,767
|
$
|
190
|
||||||||||||
Note 8 - Premises and Equipment
The components of premises and equipment at December 31, 2020 and 2019 are as follows (in thousands):
|
2020
|
2019
|
|||||||
|
Land and land improvements
|
$
|
292
|
$
|
292
|
||||
|
Buildings
|
1,553
|
1,695
|
||||||
|
Leasehold improvements
|
564
|
441
|
||||||
|
Furniture, fixtures and equipment
|
1,827
|
1,444
|
||||||
|
4,236
|
3,872
|
|||||||
|
Accumulated depreciation
|
(1,895
|
)
|
(1,646
|
)
|
||||
|
Premises and equipment, net
|
$
|
2,341
|
$
|
2,226
|
||||
Depreciation expense for the years ended December 31, 2020 and 2019 amounted to approximately $249,000 and $200,000, respectively.
Note 9 – Goodwill and Other Intangible, Net
On August 1, 2016, Quaint Oak Insurance Agency, LLC began operations by acquiring the renewal rights to a book of business produced and serviced by an independent insurance agency located in New
Britain, Pennsylvania, that provides a broad range of personal and commercial insurance coverage solutions. The Company paid $1.0 million for these rights. Based on a valuation, $515,000 of the
purchase price was determined to be goodwill and $485,000 was determined to be related to the renewal rights to the book of business and deemed to be an other intangible asset. This other
intangible asset is being amortized over a ten year period based upon the annual retention rate of the book of business. The balance of other intangible asset at December 31, 2020 was $271,000,
net of accumulated amortization of $214,000. Amortization expense for both years ended December 31, 2020 and 2019 amounted to approximately $49,000.
48
|
Quaint Oak Bancorp, Inc.
|
Notes to Consolidated Financial Statements (Continued)
Note 9 – Goodwill and Other Intangible, Net (Continued)
Estimated amortization expense of other intangible for each of the next five years and thereafter is as follows (in thousands):
|
2021
|
$
|
49
|
||
|
2022
|
49
|
|||
|
2023
|
49
|
|||
|
2024
|
49
|
|||
|
2025
|
49
|
|||
|
Thereafter
|
26
|
|||
|
Total
|
$
|
271
|
Note 10 - Deposits
Deposits and the weighted average interest rate at December 31, 2020 and 2019 consist of the following (in thousands):
| 2020 | 2019 |
|||||||||||||||
| Weighted | Weighted | |||||||||||||||
| Average |
Average | |||||||||||||||
| Interest | Interest | |||||||||||||||
| Amount | Rate |
Amount |
Rate | |||||||||||||
|
Non-interest bearing checking accounts
|
$
|
54,202
|
--
|
%
|
$
|
15,775
|
--
|
%
|
||||||||
|
Passbook accounts
|
8
|
0.16
|
5
|
0.15
|
||||||||||||
|
Savings accounts
|
1,570
|
0.20
|
1,722
|
0.20
|
||||||||||||
|
Money market accounts
|
99,638
|
0.80
|
25,504
|
0.80
|
||||||||||||
|
Certificate of deposit accounts
|
199,427
|
1.49
|
184,452
|
2.27
|
||||||||||||
|
Total
|
$
|
354,845
|
1.03
|
%
|
$
|
227,458
|
1.87
|
%
|
||||||||
A summary of certificates of deposit by maturity at December 31, 2020 is as follows (in thousands):
|
Years ending December 31:
|
||||
|
2021
|
$
|
101,170
|
||
|
2022
|
37,688
|
|||
|
2023
|
37,135
|
|||
|
2024
|
16,630
|
|||
|
2025
|
6,804
|
|||
|
Total
|
$
|
199,427
|
||
The aggregate amount of certificates of deposit with a minimum denomination of $250,000 was $29.0 million and $29.9 million at December 31, 2020 and 2019, respectively.
Note 11 - Borrowings
As of December 31, 2020, Quaint Oak Bank has a maximum borrowing capacity with the Federal Home Loan Bank of approximately $159.7 million. Quaint Oak Bank’s
Federal Home Loan Bank advances outstanding were $38.2 million and $36.3 million at December 31, 2020 and 2019, respectively. As of December 31, 2020, Quaint Oak Bank has $613,000 in borrowing
capacity with the Federal Reserve Bank of Philadelphia under the discount window program. There were no borrowings under this facility at December 31, 2020 and 2019. The Bank also has
borrowing capacity with the FRB under the PPPLF program in the amount of the outstanding pledged PPP loans that totaled $93.3 million at December 31, 2020. Quaint Oak Bank’s outstanding advances
with the FRB under the PPPLF program were $48.1 million as of December 31, 2020.
49
|
Quaint Oak Bancorp, Inc.
|
Notes to Consolidated Financial Statements (Continued)
Note 11 – Borrowings (Continued)
Federal Home Loan Bank short-term borrowings and the weighted interest rate consist of the following at December 31, 2020 and 2019 (dollars in thousands):
|
At or For the Year
Ended December 31,
|
||||||||
|
2020
|
2019
|
|||||||
|
FHLB short-term borrowings:
|
||||||||
|
Average balance outstanding
|
$
|
3,292
|
$
|
5,585
|
||||
|
Maximum amount outstanding at any month-end during the period
|
20,000
|
11,000
|
||||||
|
Balance outstanding at end of period
|
10,000
|
10,000
|
||||||
|
Average interest rate during the period
|
1.12
|
%
|
2.52
|
%
|
||||
|
Weighted average interest rate at end of period
|
0.41
|
%
|
1.81
|
%
|
||||
Federal Home Loan Bank long-term borrowings and the weighted interest rate consist of the following at December 31, 2020 and 2019 (in thousands):
| December 31,
2020 |
December 31, 2019 |
|||||||||||||||
| Weighted |
Weighted | |||||||||||||||
| Interest | Interest | |||||||||||||||
| Fixed rate
borrowings maturing: |
Amount | Rate | Amount | Rate | ||||||||||||
|
2020
|
$
|
--
|
--
|
%
|
$
|
2,000
|
2.00
|
%
|
||||||||
|
2021
|
5,000
|
2.20
|
5,000
|
2.20
|
||||||||||||
|
2022
|
7,171
|
2.10
|
7,171
|
2.10
|
||||||||||||
|
2023
|
7,000
|
2.16
|
7,000
|
2.16
|
||||||||||||
|
2024
|
6,167
|
2.05
|
5,100
|
2.28
|
||||||||||||
|
2025
|
2,855
|
1.25
|
--
|
--
|
||||||||||||
|
Total FHLB long-term debt
|
$
|
28,193
|
2.03
|
%
|
$
|
26,271
|
2.16
|
%
|
||||||||
Federal Reserve Bank long-term borrowings increased to $48.1 million at December 31, 2020 compared to zero at December 31, 2019 as the Company borrowed this amount to fund PPP loans under
the Federal Reserve’s Paycheck Protection Program Liquidity Facility (PPPLF). Under the PPPLF the Company pledged certain PPP loans as collateral and borrowed from the Federal Reserve at a
rate of 0.35% that is fixed for two years. These borrowings are paid off as the PPP loans pledged as collateral are forgiven through the SBA PPP loan forgiveness program.
Note 12 – Subordinated Debt
On December 27, 2018, the Quaint Oak Bancorp, Inc. issued $8.0 million in subordinated notes. These notes have a maturity date of December 31, 2028, and bear
interest at a fixed rate of 6.50%. The Company may, at its option, at any time on an interest payment date on or after December 31, 2023, redeem the notes, in whole or in part, at par plus
accrued interest to the date of redemption.
50
|
Quaint Oak Bancorp, Inc.
|
Notes to Consolidated Financial Statements (Continued)
Note 12 – Subordinated Debt (Continued)
The balance and unamortized issuance costs of subordinated debt at December 31, 2020 are as follows (in thousands):
|
Principal
|
Unamortized
Debt Issuance
Costs
|
Net
|
||||||||||
|
6.5% subordinated notes, due December 31, 2028
|
$
|
8,000
|
$
|
111
|
$
|
7,899
|
||||||
All subordinated notes are not subject to repayment at the option of the noteholders. These notes are all unsecured and rank junior in right of payment to the Company’s
obligations to its general creditors.
Note 13 - Income Taxes
The components of income tax expense for the years ended December 31, 2020 and 2019 are as follows (in thousands):
|
2020
|
2019
|
|||||||
|
Federal:
|
||||||||
|
Current
|
$
|
1,442
|
$
|
724
|
||||
|
Deferred
|
(566
|
)
|
(41
|
)
|
||||
|
Total federal
|
876
|
683
|
||||||
|
State, current
|
416
|
267
|
||||||
|
Total
|
$
|
1,292
|
$
|
950
|
||||
The following table presents the reconciliation between the reported income tax expense and the income tax expense which would be computed by applying the normal federal income tax rate
of 21% to income before taxes for the years ended December 31, 2020 and 2019, respectively, as follows (in thousands):
| 2020 |
2019 |
|||||||||||||||
| Amount |
Rate |
Amount |
Rate |
|||||||||||||
|
Federal income tax at statutory rate
|
$
|
953
|
21.0
|
%
|
$
|
719
|
21.0
|
%
|
||||||||
|
State tax, net of federal benefit
|
328
|
7.2
|
211
|
6.2
|
||||||||||||
|
Stock compensation expense
|
23
|
0.5
|
30
|
0.9
|
||||||||||||
|
Other
|
(12
|
)
|
(0.3
|
)
|
(10
|
)
|
(0.2
|
)
|
||||||||
|
Total
|
$
|
1,292
|
28.4
|
%
|
$
|
950
|
27.9
|
%
|
||||||||
51
|
Quaint Oak Bancorp, Inc.
|
Notes to Consolidated Financial Statements (Continued)
Note 13 - Income Taxes (Continued)
The components of the net deferred tax asset at December 31, 2020 and 2019 are as follows (in thousands):
|
2020
|
2019
|
|||||||
|
Deferred tax assets:
|
||||||||
|
Allowance for loan losses
|
$
|
643
|
$
|
468
|
||||
|
Deferred loan fees
|
642
|
177
|
||||||
|
Stock-based compensation
|
6
|
8
|
||||||
|
Interest on non-accrual loans
|
3
|
2
|
||||||
|
Organization cost
|
-
|
1
|
||||||
|
Total deferred tax assets
|
1,294
|
656
|
||||||
|
Deferred tax liabilities:
|
||||||||
|
Bank premises and equipment
|
(168
|
)
|
(100
|
)
|
||||
|
Unrealized gain on investment securities available for sale
|
(31
|
)
|
(5
|
)
|
||||
|
Intangible
|
(17
|
)
|
(13
|
)
|
||||
|
Total deferred tax liabilities
|
(216
|
)
|
(118
|
)
|
||||
|
Net Deferred Tax Asset
|
$
|
1,078
|
$
|
538
|
||||
The net deferred tax asset at December 31, 2020 and 2019 of $1.1 million and $538,000, respectively, is included in other assets. No valuation allowance was established at December 31, 2020 and 2019, in view of
the Company’s tax strategies and anticipated future taxable income as evidenced by the Company’s earnings potential.
Note 14 – Stock Compensation Plans
Employee Stock Ownership Plan
The Company maintains an Employee Stock Ownership Plan (ESOP) for the benefit of employees who meet the eligibility requirements of the plan. Using proceeds from a loan from the Company, the ESOP purchased 8%, or
222,180 shares of the Company’s then outstanding common stock in the open market during 2007. The Bank makes cash contributions to the ESOP on a quarterly basis sufficient to enable the ESOP to make the required
loan payments to the Company. The loan bears an interest rate of 7.75% per annum, with principal and interest to be paid quarterly in equal installments over 15 years pursuant to the terms of the original note. The
loan is secured by the unallocated shares of common stock held by the ESOP. As of December 31, 2020, there were three quarterly payments remaining on the 2007 loan.
Shares of the Company’s common stock purchased by the ESOP are held in a suspense account and reported as unallocated common stock held by the ESOP in stockholders’ equity until released for allocation to
participants. As the debt is repaid, shares are released from collateral and are allocated to each eligible participant based on the ratio of each such participant’s base compensation to the total base compensation
of eligible plan participants. As the unearned shares are committed to be released and allocated among participants, the Company recognizes compensation expense equal to the average market value of the shares, and
the shares become outstanding for earnings per share computations. During the years ended December 31, 2020 and 2019, the Company recognized $173,000 and $186,000 of ESOP expense, respectively.
52
|
Quaint Oak Bancorp, Inc.
|
Notes to Consolidated Financial Statements (Continued)
Note 14 – Stock Compensation Plans (Continued)
The following table represents the components of the ESOP shares at December 31, 2020 and 2019:
|
2020
|
2019
|
|||||||
|
Allocated shares
|
179,507
|
180,959
|
||||||
|
Unreleased shares
|
10,821
|
25,249
|
||||||
|
Total ESOP shares
|
190,328
|
206,208
|
||||||
|
Fair value of unreleased shares (in thousands)
|
$
|
160
|
$
|
372
|
||||
Stock Incentive Plans
In May 2013, the shareholders of Quaint Oak Bancorp approved the adoption of the 2013 Stock Incentive Plan (the “2013 Stock Incentive Plan”). The 2013 Stock Incentive Plan approved by shareholders in May 2013
covered a total of 195,000 shares, of which 48,750, or 25%, may be restricted stock awards, for a balance of 146,250 stock options assuming all the restricted shares are awarded. In May 2018, the shareholders of
Quaint Oak Bancorp approved the adoption of the 2018 Stock Incentive Plan (the “2018 Stock Incentive Plan”). The 2018 Stock Incentive Plan approved by shareholders in May 2018 covered a total of 155,000 shares, of
which 38,750, or 25%, may be restricted stock awards, for a balance of 116,250 stock options assuming all the restricted shares are awarded.
As of December 31, 2020 a total of 28,266 share awards were unvested under the 2013 and 2018 Stock Incentive Plans and up to 11,750 share awards were available for future grant under the 2018 Stock Incentive Plan
and 1,200 share awards under the 2013 Stock Incentive Plan. The 2013 and 2018 Stock Incentive Plan share awards have vesting periods of five years.
Recognition and Retention and Stock Incentive Plans
A summary of option activity under the Company’s Option Plan and 2013 and 2018 Stock Incentive Plans as of December 31, 2020 and 2019 and changes during the year ended December 31, 2020 and 2019 is as follows:
|
2020
|
2019
|
|||||||||||||||
|
Number of
Shares
|
Weighted
Average Grant
Date Fair Value
|
Number of
Shares
|
Weighted
Average Grant
Date Fair Value
|
|||||||||||||
|
Unvested at the beginning of the year
|
38,887
|
$
|
13.30
|
48,608
|
$
|
13.30
|
||||||||||
|
Granted
|
--
|
--
|
--
|
--
|
||||||||||||
|
Vested
|
(9,421
|
)
|
13.30
|
(9,721
|
)
|
13.30
|
||||||||||
|
Forfeited
|
(1,200
|
)
|
13.30
|
--
|
--
|
|||||||||||
|
Unvested at the end of the year
|
28,266
|
$
|
13.30
|
38,887
|
$
|
13.30
|
||||||||||
Compensation expense on the restricted stock awards is recognized ratably over the five year vesting period in an amount which is equal to the fair value of the common stock at the date of grant. During both of
the years ended December 31, 2020 and 2019, the Company recognized approximately $129,000 of compensation expense. A tax benefit of approximately $27,000 was recognized during both of the years ended December 31,
2020 and 2019. As of December 31, 2020, approximately $307,000 in additional compensation expense will be recognized over the remaining service period of approximately 2.4 years.
53
|
Quaint Oak Bancorp, Inc.
|
Notes to Consolidated Financial Statements (Continued)
Note 14 – Stock Compensation Plans (Continued)
Stock Options
In May 2008, the shareholders of Quaint Oak Bancorp approved the adoption of the 2008 Stock Option Plan (the “Option Plan”). In May 2013, the shareholders of Quaint Oak Bancorp approved the adoption of the 2013
Stock Incentive Plan (the “2013 Stock Incentive Plan”). The Option Plan authorized the grant of stock options to officers, employees and directors of the Company to acquire 277,726 shares of common stock with an
exercise price no less than the fair market value on the date of the grant. The Option Plan expired February 13, 2018, however, outstanding options granted in 2013 remain valid and existing for the remainder of
their terms. The 2013 Stock Incentive Plan approved by shareholders in May 2013 covered a total of 195,000 shares, of which 48,750, or 25%, may be restricted stock awards, for a balance of 146,250 stock options
assuming all the restricted shares are awarded. In May 2018, the shareholders of Quaint Oak Bancorp approved the adoption of the 2018 Stock Incentive Plan (the “2018 Stock Incentive Plan”). The 2018 Stock Incentive
Plan approved by shareholders in May 2018 covered a total of 155,000 shares, of which 38,750, or 25%, may be restricted stock awards, for a balance of 116,250 stock options assuming all the restricted shares are
awarded.
All incentive stock options issued under the Option Plan and the 2013 and 2018 Stock Incentive Plans are intended to comply with the requirements of Section 422 of the Internal Revenue Code. Options will become
vested and exercisable over a five year period and are generally exercisable for a period of ten years after the grant date.
As of December 31, 2020, a total of 240,636 grants of stock options were outstanding under the Option Plan and 2013 and 2018 Stock Incentive Plans and 37,250 stock options were available for future grant under the
2018 Stock Incentive Plan, 3,200 stock options under the 2013 Stock Incentive Plan and none under the Option Plan. Options will become vested and exercisable over a five year period and are generally exercisable for
a period of ten years after the grant date.
A summary of option activity under the Company’s Option Plan and Stock Incentive Plan for the years ended December 31, 2020 and 2019 and changes during the years ended December 31, 2020 and 2019 is as follows:
|
2020
|
2019
|
|||||||||||||||||||||||
|
Number
of
Shares
|
Weighted
Average
Exercise
Price
|
Weighted
Average
Remaining
Contractual
Life (in
years)
|
Number
of
Shares
|
Weighted
Average
Exercise
Price
|
Weighted
Average
Remaining
Contractual
Life (in
years)
|
|||||||||||||||||||
|
Outstanding at the beginning of the year
|
256,336
|
$
|
10.87
|
6.0
|
279,836
|
$
|
10.64
|
6.8
|
||||||||||||||||
|
Granted
|
--
|
--
|
--
|
--
|
--
|
--
|
||||||||||||||||||
|
Exercised
|
(12,500
|
)
|
8.10
|
--
|
(23,500
|
)
|
8.10
|
--
|
||||||||||||||||
|
Forfeited
|
(3,200
|
)
|
13.30
|
--
|
--
|
--
|
--
|
|||||||||||||||||
|
Outstanding at the end of the period
|
240,636
|
$
|
10.98
|
5.5
|
256,336
|
$
|
10.87
|
6.0
|
||||||||||||||||
|
Exercisable at the end of the period
|
161,054
|
$
|
9.84
|
5.4
|
147,027
|
$
|
9.07
|
4.8
|
||||||||||||||||
The estimated fair value of the options granted in May 2018 was $1.75 per share. The fair value was estimated on the date of grant using the Black-Scholes option pricing model with the following assumptions:
Expected dividend yield 2.11%
Risk-free interest rate 2.96%
Expected life of options 6.5 years
Expected stock-price volatility 12.42%
54
|
Quaint Oak Bancorp, Inc.
|
Notes to Consolidated Financial Statements (Continued)
Note 14 – Stock Compensation Plans (Continued)
Stock Options (Continued)
The dividend yield was calculated on the dividend amount and stock price existing at the grant date. The risk free interest rate used was based on the rates of United States Treasury securities with maturities
equal to the expected lives of the options. Although the contractual term of the options granted is ten years, the expected term of the options is less. Management estimated the expected term of the stock options
to be the average of the vesting period and the contractual term. The expected stock-price volatility was estimated by considering the Company’s own stock volatility. The actual future volatility may differ from
our historical volatility.
At December 31, 2020, the aggregate intrinsic value of options outstanding was $906,000 and options exercisable was $791,000. At December 31, 2019, the aggregate intrinsic value of the options outstanding was
$994,000 on and options exercisable was $836,000. The aggregate intrinsic value of a stock option represents the total pre-tax intrinsic value (the amount by which the current market value of the underlying stock
exceeds the exercise price of the option) that would have been received by the option holder had all option holders exercised their options on December 31, 2020 and December 31, 2019. This amount changes based on
changes in the market value of the Company’s common stock.
During both the years ended December 31, 2020 and 2019, approximately $44,000 in compensation expense on stock options was recognized. A tax benefit of approximately $2,000, was recognized during each of these
periods. As of December 31, 2020, approximately $105,000 in additional compensation expense will be recognized over the remaining service period of approximately 2.4 years.
Note 15 - Transactions with Executive Officers and Directors
Certain directors and executive officers of the Company, their families and their affiliates are customers of the Bank. Any transactions with such parties, including loans and commitments, are in the ordinary
course of business at normal terms, including interest rate and collateralization, prevailing at the time and do not represent more than normal risks of collectability. None of these individuals were indebted to
the Company for loans at December 31, 2020 and 2019, respectively.
Note 16 - Financial Instruments with Off-Balance Sheet Risk
The Company is a party to financial instruments with off-balance sheet risk in the normal course of business to meet the financing needs of its customers. These financial
instruments include commitments to extend credit. Those instruments involve, to varying degrees, elements of credit risk in excess of the amount recognized in the balance sheet.
The Company’s exposure to credit loss in the event of nonperformance by the other party to the financial instrument for commitments to extend credit is represented by the contractual
amount of those instruments. The Company uses the same credit policies in making commitments as it does for on-balance sheet instruments.
A summary of the Company’s financial instrument commitments at December 31, 2020 and 2019 is as follows (in thousands):
|
2020
|
2019
|
|||||||
|
Commitments to originate loans
|
$
|
17,631
|
$
|
10,184
|
||||
|
Unfunded commitments under lines of credit
|
22,431
|
15,181
|
||||||
|
Standby letters of credit
|
1,621
|
38
|
||||||
55
|
Quaint Oak Bancorp, Inc.
|
Notes to Consolidated Financial Statements (Continued)
Note 16 - Financial Instruments with Off-Balance Sheet Risk (Continued)
Commitments to extend credit are agreements to lend to a
customer as long as there is no violation of any condition established in the contract. Since the commitments may expire without being drawn upon, the total commitment amounts do not necessarily represent
future cash requirements. Commitments generally have fixed expiration dates or other termination clauses and may require payment of a fee. The Company evaluates each customer’s credit worthiness on a
case-by-case basis. The amount of collateral obtained, if deemed necessary by the Company upon extension of credit, is based on management’s credit evaluation. Collateral held varies, but includes principally
residential and commercial real estate.
Note 17 - Leases
The Company leases its office at 501 Knowles Avenue in Southampton, Pennsylvania as well as other office facilities and equipment. Due to the adoption of ASU 2016-02, Leases
(Topic 842), the Company completed a comprehensive review and analysis of all its property contracts. As a result of this review, it was determined that the Company leases three office locations under
operating leases. Several assumptions and judgments were made when applying the requirements of Topic 842 to the Corporation’s existing lease commitments, including the allocation of consideration in the
contracts between lease and nonlease components, determination of the lease term, and determination of the discount rate used in calculating the present value of the lease payments.
The Company has elected to account for the variable nonlease components, such as common area maintenance charges, utilities, real estate taxes, and insurance, separately from the lease component. Such variable
nonlease components are reported in net occupancy expense on the Consolidated Statements of Income when paid. These variable nonlease components were excluded from the calculation of the present value of the
remaining lease payments, therefore, they are not included in the right-of-use assets and lease liabilities reported on the Consolidated Balance Sheets. The lease cost associated with the operating leases was
$208,000 for the year ending December 31, 2020 and $139,000 for the year ending December 31, 2019.
Certain of the Company’s leases contain options to renew the lease after the initial term. Management considers the Corporation’s historical pattern of exercising renewal options on leases and the positive
performance of the leased locations, when determining whether it is reasonably certain that the leases will be renewed. If management concludes that there is reasonable certainty about the renewal option, it is
included in the calculation of the remaining term of each applicable lease. The discount rate utilized in calculating the present value of the remaining lease payments for each lease was the Federal Home Loan
Bank of Pittsburgh advance rate corresponding to the remaining maturity of the lease. The following table presents the weighted-average remaining lease term and discount rate for the leases outstanding at
December 31, 2020.
|
Operating
|
||||
|
Weighted average remaining term (years)
|
11.0
|
|||
|
Weighted average discount rate
|
3.09
|
%
|
||
56
|
Quaint Oak Bancorp, Inc.
|
Notes to Consolidated Financial Statements (Continued)
Note 17 – Leases (Continued)
The following table presents the undiscounted cash flows due related to operating leases as of December 31, 2020, along with a reconciliation to the discounted amount recorded on
the Consolidated Balance Sheets:
|
Undiscounted cash flows due (In thousands):
|
Operating
|
|||
|
2021
|
$
|
207
|
||
|
2022
|
213
|
|||
|
2023
|
219
|
|||
|
2024
|
308
|
|||
|
2025
|
219
|
|||
|
2026 and thereafter
|
1,111
|
|||
|
Total undiscounted cash flows
|
2,277
|
|||
|
Discount on cash flows
|
(440
|
)
|
||
|
Total lease liabilities
|
$
|
1,837
|
||
Under Topic 842, the lessee can elect to not record on the Consolidated Balance Sheets a lease whose term is twelve months or less and does not include a purchase option that the
lessee is reasonably certain to exercise. As of December 31, 2020, the Corporation had no leases that had a term of twelve months or less.
Rental expense under operating leases totaled approximately $255,000 in 2020 and $187,000 in 2019.
Note 18 - Regulatory Matters
The Bank is subject to various regulatory capital requirements administered by the federal banking agencies. Failure to meet minimum capital requirements can initiate certain
mandatory and possibly additional discretionary actions by regulators that, if undertaken, could have a direct material effect on the Company’s financial statements. Under capital adequacy guidelines and the
regulatory framework for prompt corrective action, the Bank must meet specific capital guidelines that involve quantitative measures of the Bank’s assets, liabilities and certain off-balance sheet items as
calculated under regulatory accounting practices. The Bank’s capital amounts and classification are also subject to qualitative judgments by the regulators about components, risk-weightings and other factors.
Quantitative measures established by regulation to ensure capital adequacy require the Bank to maintain minimum amounts and ratios (set forth below) of total, Tier 1, and common
equity Tier 1 capital (as defined in the regulations) to risk-weighted assets, and of Tier 1 capital to average assets. Management believes, as of December 31, 2020, that the Bank meets all capital adequacy
requirements to which it is subject.
In July of 2013 the respective U.S. federal banking agencies issued final rules implementing Basel III and the Dodd-Frank Act capital requirements to be
fully-phased in on a global basis on January 1, 2019. The new regulations established a new tangible common equity capital requirement, increase the minimum requirement for the current Tier 1 risk-weighted
asset (“RWA”) ratio, phase out certain kinds of tangibles treated as capital and certain types of instruments and change the risk weightings of certain assets used to determine requirement capital ratios.
Provisions of the Dodd-Frank Act generally require these capital rules to apply to bank holding companies and their subsidiaries. The new common equity Tier 1 capital component requires capital of the highest
quality-predominantly composed of retained earnings and common stock instruments. For community banks, such as Quaint Oak Bank, a common equity Tier 1 capital ratio of 4.5% became effective on January 1, 2015.
The new capital rules also increased the current minimum of Tier 1 capital ratio from 4.0% to 6.0% beginning on January 1, 2015. In addition, in order to make capital distributions and pay discretionary bonuses
to executive officers without restriction, an institution must also maintain greater than 2.5% in common equity attributable to a capital conservation buffer to be phased in from January 1, 2016 until January
1, 2019. The new rules also increase the risk weights for several categories of assets, including an increase from 100% to 150% for certain acquisition, development and construction loans and more than 90-day
past due exposures. The new capital rules maintain the general structure of the prompt corrective action rules, but incorporate the new common equity Tier 1 capital requirement and the increased Tier 1 RWA
requirement into the prompt corrective action framework.
57
|
Quaint Oak Bancorp, Inc.
|
Notes to Consolidated Financial Statements (Continued)
Note 18 - Regulatory Matters (Continued)
Bank holding companies are generally subject to statutory capital requirements, which were implemented by certain of the new capital regulations described above that became
effective on January 1, 2015. However, the Small Banking Holding Company Policy Statement exempts certain small bank holding companies like the Company from those requirements provided that they meet certain
conditions.
On December 27, 2018, Quaint Oak Bancorp, Inc. issued $8.0 million in subordinated notes (see Note 12) and infused $6.5 million to the Bank as Tier 1 capital. As of December 31, 2020 the Bank was well
capitalized under the regulatory framework for prompt corrective action. There are no conditions or events since December 31, 2020 that management believes have changed the Bank’s category. The Company’s
ratios do not differ significantly from the Bank’s ratios presented below.
The Bank’s actual capital amounts and ratios at December 31, 2020 and 2019 and the minimum amounts and ratios required for capital adequacy purposes and to be well capitalized
under the prompt corrective action provisions are as follows (dollars in thousands):
|
Actual |
For Capital Adequacy
Purposes
|
To be Well Capitalized
Under Prompt
Corrective Action
Provisions
|
|||||||||||
|
Amount
|
Ratio
|
Amount
|
Ratio
|
Amount
|
Ratio
|
||||||||
|
As of December 31, 2020:
|
|||||||||||||
|
Total capital (to risk-weighted assets)
|
$37,084
|
14.52%
|
≥$20,438
|
≥8.00%
|
≥$25,548
|
≥10.00%
|
|||||||
|
Tier 1 capital (to risk-weighted assets)
|
33,996
|
13.31
|
≥ 15,329
|
≥6.00
|
≥ 20,438
|
≥ 8.00
|
|||||||
|
Common Equity Tier 1 capital (to risk-weighted assets)
|
33,996
|
13.31
|
≥ 11,496
|
≥4.50
|
≥ 16,606
|
≥ 6.50
|
|||||||
|
Tier 1 capital (to average assets)
|
33,996
|
8.56
|
≥ 15,889
|
≥4.00
|
≥ 19,861
|
≥ 5.00
|
|||||||
|
Actual |
For Capital Adequacy
Purposes |
To be Well Capitalized
Under Prompt
Corrective Action
Provisions
|
|||||||||||
|
Amount
|
Ratio
|
Amount
|
Ratio
|
Amount
|
Ratio
|
||||||||
|
As of December 31, 2019:
|
|||||||||||||
|
Total capital (to risk-weighted assets)
|
$33,087
|
14.41%
|
≥$18,373
|
≥8.00%
|
≥$22,966
|
≥10.00%
|
|||||||
|
Tier 1 capital (to risk-weighted assets)
|
30,829
|
13.42
|
≥ 13,780
|
≥6.00
|
≥ 18,373
|
≥ 8.00
|
|||||||
|
Common Equity Tier 1 capital (to risk-weighted assets)
|
30,829
|
13.42
|
≥ 10,335
|
≥4.50
|
≥ 14,928
|
≥ 6.50
|
|||||||
|
Tier 1 capital (to average assets)
|
30,829
|
10.35
|
≥ 11,915
|
≥4.00
|
≥ 14,894
|
≥ 5.00
|
|||||||
58
|
Quaint Oak Bancorp, Inc.
|
Notes to Consolidated Financial Statements (Continued)
Note 18 - Regulatory Matters (Continued)
Under the Dodd-Frank Wall Street Reform and Consumer Protection Act the Board of Governors of the Federal Reserve System as the primary regulator for the Company is authorized to extend leverage capital
requirements and risk based capital requirements applicable to depository institutions and bank holding companies to thrift holding companies. Legislation adopted in late 2014 generally exempts small savings
and loan holding companies like Quaint Oak Bancorp from these capital requirements if certain conditions are met.
Banking regulations place certain restrictions on dividends paid by the Bank to the Company. The Company is dependent upon dividends from the Bank to provide funds for the
payment of dividends to the Company’s shareholders, interest payments on the subordinated debt and other general corporate purposes. The Bank’s ability to pay cash dividends directly or indirectly to the
Company is governed by federal law, regulations and related guidance. These include the requirement that the Bank must receive approval to declare a dividend if the total amount of all dividends, including the
proposed dividend, declared by the Bank in any current year exceeds the total of the Bank’s net income for the current year to date, combined with its retained net income for the previous two years. The term
“retained net income” as defined by federal regulations means the Bank’s net income for a specified period less the total amount of all dividends declared in that period.
The Bank may not pay dividends to the Company if, after paying those dividends, it would fail to meet the required minimum levels under risk-based capital guidelines or if the
bank regulators have notified the Bank that it is in need of more than normal supervision. Under the Federal Deposit Insurance Act, an insured depository institution such as the Bank is prohibited from making
capital distributions, including the payment of dividends, if, after making such distribution, the institution would become “undercapitalized” (as such term is used in the Federal Deposit Insurance Act).
Payment of dividends by the Bank also may be restricted at any time at the discretion of the appropriate regulator if it deems the payment to constitute an unsafe and unsound banking practice.
In 2020, the Bank paid a total of $500,000 in cash dividends to the Company. In 2019, the Bank did not pay cash dividends to the Company. At December 31, 2020, the Bank’s retained net income for the years
ended December 31, 2020 and 2019 less the dividends declared and paid during those periods, totaled $6.0 million.
Note 19 – Fair Value Measurements and Fair Values of Financial Instruments
Fair value estimates are based on quoted market prices, if available, quoted market prices of similar assets or liabilities, or the present value of expected future cash flows and
other valuation techniques. These valuations are significantly affected by discount rates, cash flow assumptions, and risk assumptions used. Therefore, fair values estimates may not be substantiated by
comparison to independent markets and are not intended to reflect the proceeds that may be realizable in an immediate settlement of the instruments.
Fair value is determined at one point in time and is not representative of future value. These amounts do not reflect the total value of a going concern organization. Management does
not have the intention to dispose of a significant portion of its assets and liabilities and therefore, the unrealized gains or losses should not be interpreted as a forecast of future earnings and cash flows.
The following disclosures show the hierarchal disclosure framework associated with the level of pricing observations utilized in measuring assets and liabilities at fair value. The three broad levels of
pricing are as follows:
| Level I: |
Quoted prices are available in active markets for identical assets or liabilities as of the reported date.
|
| Level II: |
Pricing inputs are other than the quoted prices in active markets, which are either directly or indirectly observable as of the reported date. The
nature of these assets and liabilities includes items for which quoted prices are available but traded less frequently and items that are fair-valued using other financial instruments, the parameters of
which can be directly observed.
|
| Level III: |
Valuations derived from valuation techniques in which one or more significant inputs or significant value drivers are unobservable.
|
59
|
Quaint Oak Bancorp, Inc.
|
Notes to Consolidated Financial Statements (Continued)
Note 19 – Fair Value Measurements and Fair Values of Financial Instruments (Continued)
This hierarchy requires the use of observable market data when available.
The methods of determining the fair value of assets and liabilities presented in this note are consistent with our methodologies disclosed in Note 18 of the Company’s 2020 Form 10-K, as the fair value of
loans, excluding previously presented impaired loans measured at fair value on a non-recurring basis, is estimated using discounted cash flow analyses. The discount rates used to determine fair value use
interest rate spreads that reflect factors such as liquidity, credit and non-performance risk. Loans are considered a Level 3 classification.
The following is a discussion of assets and liabilities measured at fair value on a recurring and non-recurring basis and valuation techniques applied:
Investment Securities Available For
Sale: The fair value of securities available for sale are determined by obtaining quoted market prices on nationally recognized securities exchanges (Level 1), or
matrix pricing (Level 2), which is a mathematical technique used widely in the industry to value debt securities without relying exclusively on quoted market prices for the specific securities but rather by
relying on the securities’ relationship to other benchmark quoted prices.
We may be required from time to time to measure certain assets at fair value on a nonrecurring basis in accordance with U.S. GAAP. These adjustments to fair value usually result
from application of lower-of-cost-or-market accounting or write-downs of individual assets.
Impaired Loans: Impaired loans are carried at the lower of cost or the fair value of the collateral for collateral-dependent loans less estimated costs to sell. Collateral is primarily in the form
of real estate. The use of independent appraisals, discounted cash flow models and management’s best judgment are significant inputs in arriving at the fair value measure of the underlying collateral and
impaired loans are therefore classified within Level 3 of the fair value hierarchy.
Other Real Estate Owned: Other real estate owned is carried at the lower of the investment in the real estate or the fair value of the real estate less estimated selling costs. The use of independent
appraisals and management’s best judgment are significant inputs in arriving at the fair value measure of the underlying collateral and therefore other real estate owned is classified within Level 3 of the
fair value hierarchy.
60
|
Quaint Oak Bancorp, Inc.
|
Notes to Consolidated Financial Statements (Continued)
Note 19 – Fair Value Measurements and Fair Values of Financial Instruments (Continued)
The table below sets forth the financial assets and liabilities that were accounted for on a recurring and nonrecurring basis by level within the fair value hierarchy as of December 31, 2020 (in
thousands):
|
December 31, 2020
|
||||||||||||||||
|
Fair Value Measurements Using:
|
||||||||||||||||
|
Total Fair
Value
|
Quoted
Prices in
Active
Markets for
Identical
Assets
(Level 1)
|
Significant Other Observable
Inputs
(Level 2)
|
Unobservable
Inputs
(Level 3)
|
|||||||||||||
|
Recurring fair value measurements:
|
||||||||||||||||
|
Investment securities available for sale
|
||||||||||||||||
|
Government National Mortgage Association mortgage-backed securities
|
$
|
4,913
|
$
|
--
|
$
|
4,913
|
$
|
--
|
||||||||
|
Federal National Mortgage Association mortgage-backed securities
|
189
|
--
|
189
|
--
|
||||||||||||
|
Corporate notes
|
5,623
|
--
|
5,623
|
--
|
||||||||||||
|
Total investment securities available for sale
|
$
|
10,725
|
$
|
--
|
$
|
10,725
|
$
|
--
|
||||||||
|
Total recurring fair value measurements
|
$
|
10,725
|
$
|
--
|
$
|
10,725
|
$
|
--
|
||||||||
|
Nonrecurring fair value measurements
|
||||||||||||||||
|
Impaired loans
|
$
|
321
|
$
|
--
|
$
|
--
|
$
|
321
|
||||||||
|
Other Real Estate Owned
|
286
|
--
|
--
|
286
|
||||||||||||
|
Total nonrecurring fair value measurements
|
$
|
607
|
$
|
--
|
$
|
--
|
$
|
607
|
||||||||
The table below sets forth the financial assets and liabilities that were accounted for on a recurring and nonrecurring basis by level within the fair value hierarchy as of
December 31, 2019 (in thousands):
|
December 31, 2019
|
||||||||||||||||
|
Fair Value Measurements Using:
|
||||||||||||||||
|
Total Fair
Value
|
Quoted
Prices in
Active
Markets for
Identical
Assets
(Level 1)
|
Significant Other Observable
Inputs
(Level 2)
|
Unobservable
Inputs
(Level 3)
|
|||||||||||||
|
Recurring fair value measurements:
|
||||||||||||||||
|
Investment securities available for sale
|
||||||||||||||||
|
Government National Mortgage Association mortgage-backed securities
|
$
|
5,853
|
$
|
--
|
$
|
5,853
|
$
|
--
|
||||||||
|
Federal National Mortgage Association mortgage-backed securities
|
260
|
--
|
260
|
--
|
||||||||||||
|
Corporate notes
|
1,510
|
--
|
1,510
|
--
|
||||||||||||
|
Total investment securities available for sale
|
$
|
7,623
|
$
|
--
|
$
|
7,623
|
$
|
--
|
||||||||
|
Total recurring fair value measurements
|
$
|
7,623
|
$
|
--
|
$
|
7,623
|
$
|
--
|
||||||||
|
Nonrecurring fair value measurements
|
||||||||||||||||
|
Impaired loans
|
$
|
319
|
$
|
--
|
$
|
--
|
$
|
319
|
||||||||
|
Other Real Estate Owned
|
1,824
|
--
|
--
|
1,824
|
||||||||||||
|
Total nonrecurring fair value measurements
|
$
|
2,143
|
$
|
--
|
$
|
--
|
$
|
2,143
|
||||||||
61
|
Quaint Oak Bancorp, Inc.
|
Notes to Consolidated Financial Statements (Continued)
Note 19 – Fair Value Measurements and Fair Values of Financial Instruments (Continued)
The following table presents additional quantitative information about assets measured at fair value on a nonrecurring basis and for which the Company has used Level 3 inputs to determine fair value as
of December 31, 2020 and 2019 (dollars in thousands):
|
December 31, 2020
|
|||||||||||
|
Quantitative Information About Level 3 Fair Value Measurements
|
|||||||||||
|
Total Fair Value
|
Valuation Techniques
|
Unobservable Input
|
Range (Weighted Average)
|
||||||||
|
Impaired loans
|
$
|
321
|
Appraisal of collateral (1)
|
Appraisal adjustments (2)
|
8% (8
|
%)
|
|||||
|
Other real estate owned
|
$
|
286
|
Appraisal of collateral (1)
|
Appraisal adjustments (2)
|
0%-12% (12
|
%)
|
|||||
|
December 31, 2019
|
|||||||||||
|
Quantitative Information About Level 3 Fair Value Measurements
|
|||||||||||
|
Total Fair Value
|
Valuation Techniques
|
Unobservable Input
|
Range (Weighted Average)
|
||||||||
|
Impaired loans
|
$
|
319
|
Appraisal of collateral (1)
|
Appraisal adjustments (2)
|
0%-3% (1
|
%)
|
|||||
|
Other real estate owned
|
$
|
1,824
|
Appraisal of collateral (1)
|
Appraisal adjustments (2)
|
0%-12% (12
|
%)
|
|||||
_______________
| (1) |
Fair value is generally determined through independent appraisals of the underlying collateral, which generally include various Level 3 inputs
which are identifiable.
|
| (2) |
Appraisals may be adjusted by management for qualitative factors such as economic conditions and estimated liquidation expenses. The range and
weighted average of liquidation expenses and other appraisal adjustments are presented as a percentage of the appraisal.
|
The estimated fair values of the Company’s financial instruments that are not required to be measured or reported at fair value were as follows at December 31, 2020 and 2019 (in thousands):
|
Fair Value Measurements at
|
||||||||||||||||||||
|
December 31, 2020
|
||||||||||||||||||||
|
Carrying
Amount
|
Fair Value
Estimate
|
Quoted Prices in
Active Markets
for Identical
Assets
(Level 1)
|
Significant Other Observable
Inputs
(Level 2)
|
Unobservable
Inputs
(Level 3)
|
||||||||||||||||
|
Financial Assets
|
||||||||||||||||||||
|
Investment in interest-earning time deposits
|
$
|
9,463
|
$
|
10,536
|
$
|
--
|
$
|
--
|
$
|
10,536
|
||||||||||
|
Loans held for sale
|
53,191
|
62,396
|
--
|
62,396
|
--
|
|||||||||||||||
|
Loans receivable, net
|
359,122
|
363,527 |
--
|
--
|
363,527
|
|||||||||||||||
|
Financial Liabilities
|
||||||||||||||||||||
|
Deposits
|
354,845
|
358,112
|
155,417
|
--
|
202,695
|
|||||||||||||||
|
FHLB long-term borrowings
|
28,193
|
28,284
|
--
|
--
|
28,284
|
|||||||||||||||
|
FRB long-term borrowings
|
48,134
|
48,126
|
-
|
-
|
48,126
|
|||||||||||||||
|
Subordinated debt
|
7,899
|
8,283
|
-
|
-
|
8,283
|
|||||||||||||||
62
|
Quaint Oak Bancorp, Inc.
|
Notes to Consolidated Financial Statements (Continued)
Note 19 – Fair Value Measurements and Fair Values of Financial Instruments (Continued)
|
Fair Value Measurements at
|
||||||||||||||||||||
|
December 31, 2019
|
||||||||||||||||||||
|
Carrying
Amount
|
Fair Value
Estimate
|
Quoted Prices in
Active Markets
for Identical
Assets
(Level 1)
|
Significant Other Observable
Inputs
(Level 2)
|
Unobservable
Inputs
(Level 3)
|
||||||||||||||||
|
Financial Assets
|
||||||||||||||||||||
|
Investment in interest-earning time deposits
|
$
|
10,172
|
$
|
10,536
|
$
|
--
|
$
|
--
|
$
|
10,536
|
||||||||||
|
Loans held for sale
|
8,928
|
9,205
|
--
|
9,205
|
--
|
|||||||||||||||
|
Loans receivable, net
|
246,692
|
250,550
|
--
|
--
|
250,550
|
|||||||||||||||
|
Financial Liabilities
|
||||||||||||||||||||
|
Deposits
|
227,458
|
230,521
|
43,006
|
--
|
187,515
|
|||||||||||||||
|
FHLB long-term borrowings
|
26,271
|
26,292
|
--
|
--
|
26,292
|
|||||||||||||||
|
Subordinated debt
|
7,865
|
8,146
|
--
|
--
|
8,146
|
|||||||||||||||
For cash and cash equivalents, accrued interest receivable, investment in FHLB stock, bank-owned life insurance, FHLB short-term borrowings, accrued
interest payable, and advances from borrowers for taxes and insurance, the carrying value is a reasonable estimate of the fair value and are considered Level 1 measurements.
63
|
Quaint Oak Bancorp, Inc.
|
Notes to Consolidated Financial Statements (Continued)
Note 20 – Operating Segments
The Company’s operations currently consist of two reportable operating segments: Banking and Mortgage Banking. The Company offers different products and services through its two segments. The
accounting policies of the segments are generally the same as those of the consolidated company.
The Banking Segment generates its revenues primarily from its lending, deposit gathering and fee business activities. The profitability of this segment’s operations depends primarily on its net
interest income after provision for credit losses, which is the difference between interest earned on interest earning assets and interest paid on interest bearing liabilities less provision for
credit losses. The provision for credit losses is almost entirely dependent on changes in the Banking Segment’s loan portfolio and management’s assessment of the collectability of the loan portfolio
as well as prevailing economic and market conditions. The profitability of this segment’s operations also depends on the generation of non-interest income which includes fees and commissions generated
by Quaint Oak Bank and its wholly-owned subsidiaries, Quaint Oak Real Estate, LLC, Quaint Oak Abstract, LLC, and Quaint Oak Insurance Agency, LLC which are included in the Banking Segment for segment
reporting purposes. The Banking Segment is also subject to an extensive system of laws and regulations that are intended primarily for the protection of depositors and other customers, federal
deposit insurance funds and the banking system as a whole. These laws and regulations govern such areas as capital, permissible activities, allowance for loan and lease losses, loans and investments,
and rates of interest that can be charged on loans. For segment reporting purposes, Quaint Oak Bancorp, Inc. is included as part of the Company’s Banking segment.
The Mortgage Banking Segment originates residential mortgage loans which are sold into the secondary market along with the loans’ servicing rights. The profitability of this segment’s operations
depends primarily on the gains realized from the sale of loans and processing fees. The Mortgage Banking Segment is also subject to an extensive system of laws and regulations that are intended
primarily for the protection of consumers.
64
|
Quaint Oak Bancorp, Inc.
|
Notes to Consolidated Financial Statements (Continued)
Note 20 – Operating Segments (Continued)
The following table present summary financial information for the reportable segments (in thousands):
|
As of or for the Year Ended December 31,
|
||||||||||||||||||||||||
|
2020
|
2019
|
|||||||||||||||||||||||
|
Quaint
Oak
Bank(1)
|
Quaint
Oak
Mortgage
|
Consolidated
|
Quaint
Oak
Bank(1)
|
Quaint
Oak
Mortgage
|
Consolidated
|
|||||||||||||||||||
|
Net Interest Income
|
$
|
11,190
|
$
|
(355
|
)
|
$
|
10,835
|
$
|
8,845
|
$
|
(160
|
)
|
$
|
8,685
|
||||||||||
|
Provision for Loan Losses
|
830
|
--
|
830
|
303
|
--
|
303
|
||||||||||||||||||
|
Net Interest Income after Provision for
Loan Losses
|
10,360
|
(355
|
)
|
10,005
|
8,542
|
(160
|
)
|
8,382
|
||||||||||||||||
|
Non-Interest Income
|
||||||||||||||||||||||||
|
Mortgage banking and title abstract fees
|
923
|
656
|
1,579
|
649
|
503
|
1,152
|
||||||||||||||||||
|
Real estate sales commissions, net
|
159
|
--
|
159
|
180
|
--
|
180
|
||||||||||||||||||
|
Insurance commissions
|
490
|
--
|
490
|
419
|
--
|
419
|
||||||||||||||||||
|
Other fees and services charges
|
109
|
--
|
109
|
68
|
--
|
68
|
||||||||||||||||||
|
Income from bank-owned life insurance
|
80
|
--
|
80
|
80
|
--
|
80
|
||||||||||||||||||
|
Net gain on loans held for sale
|
--
|
4,320
|
4,320
|
1
|
3,013
|
3,014
|
||||||||||||||||||
|
Gain on the sale of SBA loans
|
115
|
--
|
115
|
265
|
--
|
265
|
||||||||||||||||||
|
Loss on sale of investment securities
available for sale
|
--
|
--
|
--
|
(4
|
)
|
--
|
(4
|
)
|
||||||||||||||||
|
(Loss) gain on sales and write-downs of
other real estate owned
|
(197
|
)
|
--
|
(197
|
)
|
(221
|
)
|
--
|
(221
|
)
|
||||||||||||||
|
Total Non-Interest Income
|
1,679
|
4,976
|
6,655
|
1,437
|
3,516
|
4,953
|
||||||||||||||||||
|
Non-Interest Expense
|
||||||||||||||||||||||||
|
Salaries and employee benefits
|
6,980
|
1,447
|
8,427
|
5,768
|
1,179
|
6,947
|
||||||||||||||||||
|
Directors’ fees and expenses
|
232
|
--
|
232
|
223
|
--
|
223
|
||||||||||||||||||
|
Occupancy and equipment
|
631
|
282
|
913
|
478
|
214
|
692
|
||||||||||||||||||
|
Data processing
|
470
|
247
|
717
|
366
|
142
|
508
|
||||||||||||||||||
|
Professional fees
|
501
|
40
|
541
|
357
|
59
|
416
|
||||||||||||||||||
|
FDIC deposit insurance assessment
|
121
|
--
|
121
|
15
|
--
|
15
|
||||||||||||||||||
|
Other real estate owned expenses
|
42
|
--
|
42
|
22
|
--
|
22
|
||||||||||||||||||
|
Advertising
|
92
|
21
|
113
|
140
|
55
|
195
|
||||||||||||||||||
|
Amortization of other intangible
|
49
|
--
|
49
|
49
|
--
|
49
|
||||||||||||||||||
|
Other
|
909
|
59
|
968
|
780
|
61
|
841
|
||||||||||||||||||
|
Total Non-Interest Expense
|
10,027
|
2,096
|
12,123
|
8,198
|
1,710
|
9,908
|
||||||||||||||||||
|
Pretax Segment Profit
|
$
|
2,012
|
$
|
2,525
|
$
|
4,537
|
$
|
1,781
|
$
|
1,646
|
$
|
3,427
|
||||||||||||
|
Segment Assets
|
$
|
422,230
|
$
|
61,845
|
$
|
484,075
|
$
|
286,986
|
$
|
15,554
|
$
|
302,540
|
||||||||||||
___________________
|
(1)
|
Includes Quaint Oak Bancorp, Inc. and the Bank’s Subsidiaries, Quaint Oak Real Estate, Quaint Oak Abstract, Quaint Oak Insurance Agency,
and QOB Properties.
|
65
|
Quaint Oak Bancorp, Inc.
|
Notes to Consolidated Financial Statements (Continued)
Note 21 – Subsequent Events
Subsequent events are events or transactions that occur after the balance sheet date but before financial statements are issued. Recognized subsequent events are events or transactions that provide
additional evidence about conditions that existed at the date of the balance sheet, including estimates inherent in the process of preparing financial statements. Nonrecognized subsequent events are
events that provide evidence about conditions that did not exist at the date of the balance sheet but arose after that date. Management has reviewed all events occurring through the date the financial
statements were available to be issued and determined the following subsequent events required disclosure:
On January 4, 2021, Quaint Oak Bank, the wholly-owned subsidiary of Quaint Oak Bancorp, Inc., invested $3.0 million for a 51% majority ownership interest in Oakmont Capital Holdings, LLC (“Oakmont”),
a multi-state equipment finance company based in West Chester, Pennsylvania with a second significant facility located in Albany, Minnesota. Oakmont has been providing commercial equipment financing
and working capital throughout all 50 states since 1998. Quaint Oak Bank and Oakmont have had an existing business relationship since 2015. The investment in Oakmont provides additional financial
resources to support Oakmont’s national expansion plans within the equipment finance industry as well as support an expansion of Oakmont’s business lines, while adding an equipment finance company to
Quaint Oak Bank’s subsidiary companies.
66
|
Quaint Oak Bancorp, Inc.
|
Notes to Consolidated Financial Statements (Continued)
Note 22 – Quaint Oak Bancorp, Inc. (Parent Company Only)
Condensed financial statements of Quaint Oak Bancorp, Inc. are as follows (in thousands):
Balance Sheets
|
December 31,
|
||||||||
|
2020
|
2019
|
|||||||
|
Assets
|
||||||||
|
Cash and cash equivalents
|
$
|
333
|
$
|
669
|
||||
|
Investment in Quaint Oak Bank
|
34,766
|
31,512
|
||||||
|
Premises and equipment, net
|
1,513
|
1,559
|
||||||
|
Other assets
|
15
|
32
|
||||||
|
Total Assets
|
$
|
36,627
|
$
|
33,772
|
||||
|
Liabilities and Stockholders’ Equity
|
||||||||
|
Subordinated debt
|
$
|
7,899
|
$
|
7,865
|
||||
|
Stockholders’ equity
|
28,728
|
25,907
|
||||||
|
Total Liabilities and Stockholders’ Equity
|
$
|
36,627
|
$
|
33,772
|
||||
Statements of Income
|
For the Year Ended December 31,
|
||||||||
|
2020
|
2019
|
|||||||
|
Income
|
||||||||
|
Dividends from subsidiary
|
$
|
500
|
$
|
--
|
||||
|
Interest income
|
2
|
20
|
||||||
|
Rental income
|
339
|
199
|
||||||
|
Total Income
|
841
|
219
|
||||||
|
Expenses
|
||||||||
|
Occupancy and equipment expense
|
96
|
120
|
||||||
|
Interest on subordinated debt
|
520
|
519
|
||||||
|
Other expenses
|
158
|
161
|
||||||
|
Total Expenses
|
774
|
800
|
||||||
|
Net Income (Loss) Before Income Taxes
|
67
|
(581
|
)
|
|||||
|
Equity in Undistributed Net Income of Subsidiary
|
3,087
|
2,936
|
||||||
|
Income Tax Benefit
|
91
|
122
|
||||||
|
Net Income
|
$
|
3,245
|
$
|
2,477
|
||||
|
Comprehensive Income
|
$
|
3,343
|
$
|
2,499
|
||||
67
|
Quaint Oak Bancorp, Inc.
|
Notes to Consolidated Financial Statements (Continued)
Note 22 – Quaint Oak Bancorp, Inc. (Parent Company Only) (Continued)
Statements of Cash Flows
|
For the Year Ended December 31,
|
||||||||
|
2020
|
2019
|
|||||||
|
Operating Activities
|
||||||||
|
Net income
|
$
|
3,245
|
$
|
2,477
|
||||
|
Adjustments to reconcile net income to net cash provided by (used in) operating activities:
|
||||||||
|
Undistributed net income in subsidiary
|
(3,087
|
)
|
(2,936
|
)
|
||||
|
Depreciation expense
|
53
|
53
|
||||||
|
Amortization of subordinated debt issuance costs
|
34
|
34
|
||||||
|
Stock-based compensation expense
|
346
|
359
|
||||||
|
Decrease (increase) in other assets
|
(52
|
)
|
(2
|
)
|
||||
|
Net cash provided by (used in) operating activities
|
539
|
(15
|
)
|
|||||
|
Investing Activities
|
||||||||
|
Purchase of property and equipment
|
(7
|
)
|
(125
|
)
|
||||
|
Net cash used in investing activities
|
(7
|
)
|
(125
|
)
|
||||
|
Financing Activities
|
||||||||
|
Dividends paid
|
(717
|
)
|
(676
|
)
|
||||
|
Purchase of treasury stock
|
(349
|
)
|
(339
|
)
|
||||
|
Proceeds from the reissuance of treasury stock
|
97
|
38
|
||||||
|
Proceeds from the exercise of stock options
|
101
|
190
|
||||||
|
Net cash used in financing activities
|
(868
|
)
|
(787
|
)
|
||||
|
Net Decrease in Cash and Cash Equivalents
|
(336
|
)
|
(927
|
)
|
||||
|
Cash and Cash Equivalents-Beginning of Year
|
669
|
1,596
|
||||||
|
Cash and Cash Equivalents-End of Year
|
$
|
333
|
$
|
669
|
||||
68
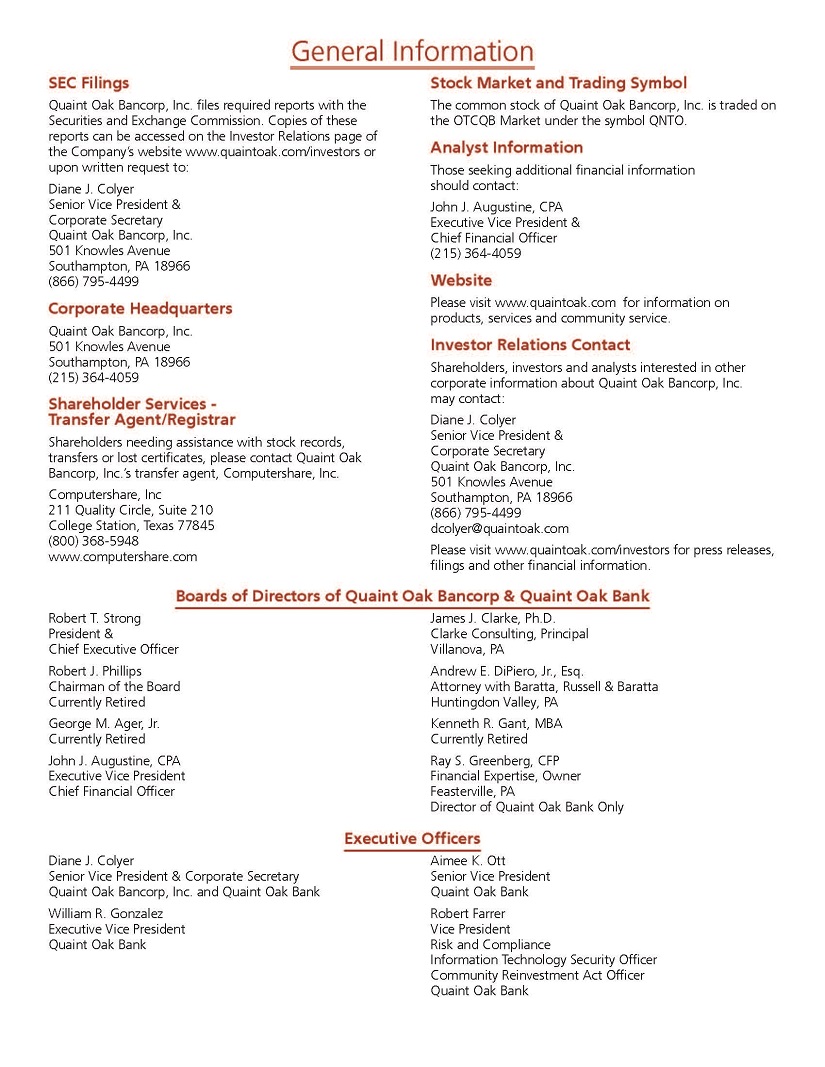
69
|
Quaint Oak Bancorp, Inc.
|
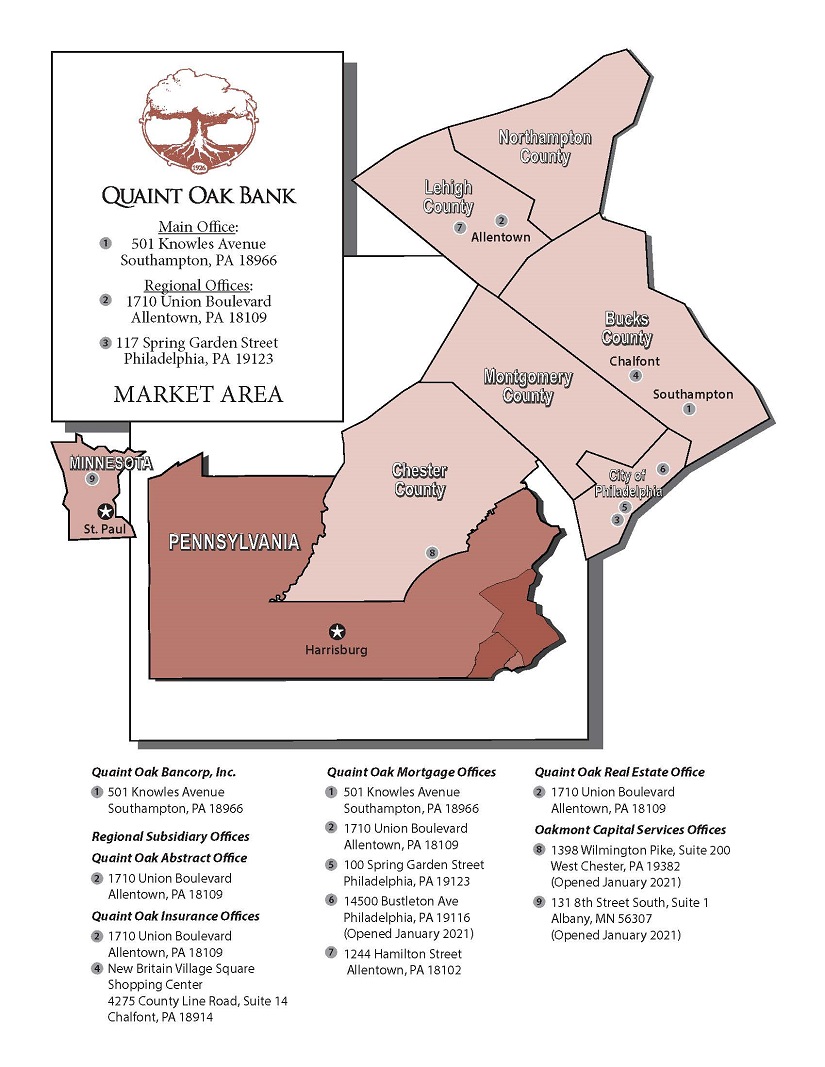
70