false2021FY0001385867--01-31us-gaap:OtherAssetsus-gaap:OtherAssetsus-gaap:OtherAssetsP3Y75P4YP4YP3YP3YP3YP3Y100013858672020-02-012021-01-31iso4217:USD00013858672020-07-31xbrli:shares00013858672021-03-1100013858672021-01-3100013858672020-01-31iso4217:USDxbrli:shares0001385867us-gaap:SubscriptionAndCirculationMember2020-02-012021-01-310001385867us-gaap:SubscriptionAndCirculationMember2019-02-012020-01-310001385867us-gaap:SubscriptionAndCirculationMember2018-02-012019-01-310001385867coup:ProfessionalServicesAndOtherMember2020-02-012021-01-310001385867coup:ProfessionalServicesAndOtherMember2019-02-012020-01-310001385867coup:ProfessionalServicesAndOtherMember2018-02-012019-01-3100013858672019-02-012020-01-3100013858672018-02-012019-01-310001385867us-gaap:CommonStockMember2018-01-310001385867us-gaap:AdditionalPaidInCapitalMember2018-01-310001385867us-gaap:AccumulatedOtherComprehensiveIncomeMember2018-01-310001385867us-gaap:RetainedEarningsMember2018-01-3100013858672018-01-310001385867us-gaap:CommonStockMember2018-02-012019-01-310001385867us-gaap:AdditionalPaidInCapitalMember2018-02-012019-01-310001385867us-gaap:RetainedEarningsMembersrt:CumulativeEffectPeriodOfAdoptionAdjustmentMember2018-01-310001385867srt:CumulativeEffectPeriodOfAdoptionAdjustmentMember2018-01-310001385867us-gaap:AccumulatedOtherComprehensiveIncomeMember2018-02-012019-01-310001385867us-gaap:RetainedEarningsMember2018-02-012019-01-310001385867us-gaap:CommonStockMember2019-01-310001385867us-gaap:AdditionalPaidInCapitalMember2019-01-310001385867us-gaap:AccumulatedOtherComprehensiveIncomeMember2019-01-310001385867us-gaap:RetainedEarningsMember2019-01-3100013858672019-01-310001385867us-gaap:AdditionalPaidInCapitalMember2019-02-012020-01-310001385867us-gaap:CommonStockMember2019-02-012020-01-310001385867us-gaap:AccumulatedOtherComprehensiveIncomeMember2019-02-012020-01-310001385867us-gaap:RetainedEarningsMember2019-02-012020-01-310001385867us-gaap:CommonStockMember2020-01-310001385867us-gaap:AdditionalPaidInCapitalMember2020-01-310001385867us-gaap:AccumulatedOtherComprehensiveIncomeMember2020-01-310001385867us-gaap:RetainedEarningsMember2020-01-310001385867us-gaap:CommonStockMember2020-02-012021-01-310001385867us-gaap:AdditionalPaidInCapitalMember2020-02-012021-01-310001385867us-gaap:AccumulatedOtherComprehensiveIncomeMember2020-02-012021-01-310001385867us-gaap:RetainedEarningsMember2020-02-012021-01-310001385867us-gaap:CommonStockMember2021-01-310001385867us-gaap:AdditionalPaidInCapitalMember2021-01-310001385867us-gaap:AccumulatedOtherComprehensiveIncomeMember2021-01-310001385867us-gaap:RetainedEarningsMember2021-01-310001385867country:US2020-02-012021-01-310001385867country:US2019-02-012020-01-310001385867country:US2018-02-012019-01-310001385867us-gaap:NonUsMember2020-02-012021-01-310001385867us-gaap:NonUsMember2019-02-012020-01-310001385867us-gaap:NonUsMember2018-02-012019-01-310001385867srt:MinimumMemberus-gaap:FurnitureAndFixturesMember2020-02-012021-01-310001385867srt:MaximumMemberus-gaap:FurnitureAndFixturesMember2020-02-012021-01-310001385867us-gaap:LeaseholdImprovementsMember2020-02-012021-01-310001385867srt:MaximumMember2020-02-012021-01-3100013858672021-02-012021-01-310001385867coup:TwoThousandAndSixteenEmployeeStockPurchasePlanMember2020-02-012021-01-31xbrli:pure0001385867us-gaap:USTreasurySecuritiesMember2021-01-310001385867coup:CorporateNotesAndBondsMember2021-01-310001385867us-gaap:CertificatesOfDepositMember2021-01-310001385867us-gaap:USTreasurySecuritiesMember2020-01-310001385867coup:CorporateNotesAndBondsMember2020-01-310001385867us-gaap:CommercialPaperMember2020-01-310001385867us-gaap:AssetBackedSecuritiesMember2020-01-310001385867us-gaap:CertificatesOfDepositMember2020-01-310001385867coup:LLamasoftIncMember2020-11-022020-11-020001385867coup:LLamasoftIncMemberus-gaap:CommonStockMember2020-11-022020-11-020001385867coup:LLamasoftIncMember2020-11-020001385867coup:LLamasoftIncMember2020-02-012021-01-310001385867coup:BellinTreasuryInternationalGmbHMember2020-11-0200013858672020-11-020001385867coup:LLamasoftIncMemberus-gaap:DevelopedTechnologyRightsMember2020-11-020001385867coup:LLamasoftIncMemberus-gaap:DevelopedTechnologyRightsMember2020-11-022020-11-020001385867us-gaap:CustomerRelationshipsMembercoup:LLamasoftIncMember2020-11-020001385867us-gaap:CustomerRelationshipsMembercoup:LLamasoftIncMember2020-11-022020-11-020001385867coup:LLamasoftIncMemberus-gaap:TrademarksMember2020-11-020001385867coup:LLamasoftIncMemberus-gaap:TrademarksMember2020-11-022020-11-020001385867coup:LLamasoftIncMember2021-01-310001385867coup:LLamasoftIncMember2020-11-022020-12-310001385867coup:LLamasoftIncMember2019-02-012020-01-310001385867coup:MuchNetGmbHMember2020-09-152020-09-150001385867us-gaap:DevelopedTechnologyRightsMembercoup:MuchNetGmbHMember2020-09-152020-09-150001385867coup:MuchNetGmbHMember2020-09-150001385867coup:BellinTreasuryInternationalGmbHMember2020-06-092020-06-090001385867coup:BellinTreasuryInternationalGmbHMember2020-06-090001385867us-gaap:CommonStockMembercoup:BellinTreasuryInternationalGmbHMember2020-06-092020-06-090001385867coup:UnvestedCommonStockMembercoup:BellinTreasuryInternationalGmbHMember2020-06-092020-06-090001385867coup:UnvestedCommonStockMembercoup:BellinTreasuryInternationalGmbHMember2020-06-090001385867coup:BellinTreasuryInternationalGmbHMember2020-02-012021-01-310001385867us-gaap:DevelopedTechnologyRightsMembercoup:BellinTreasuryInternationalGmbHMember2020-06-090001385867us-gaap:DevelopedTechnologyRightsMembercoup:BellinTreasuryInternationalGmbHMember2020-06-092020-06-090001385867us-gaap:CustomerRelationshipsMembercoup:BellinTreasuryInternationalGmbHMember2020-06-090001385867us-gaap:CustomerRelationshipsMembercoup:BellinTreasuryInternationalGmbHMember2020-06-092020-06-090001385867us-gaap:TrademarksMembercoup:BellinTreasuryInternationalGmbHMember2020-06-090001385867us-gaap:TrademarksMembercoup:BellinTreasuryInternationalGmbHMember2020-06-092020-06-090001385867us-gaap:GeneralAndAdministrativeExpenseMembercoup:BellinTreasuryInternationalGmbHMember2020-02-012021-01-310001385867coup:ConnXusIncMember2020-05-012020-05-010001385867coup:ConnXusIncMember2020-05-010001385867coup:ConnXusIncMember2020-02-012021-01-310001385867us-gaap:DevelopedTechnologyRightsMembercoup:ConnXusIncMember2020-05-010001385867us-gaap:DevelopedTechnologyRightsMembercoup:ConnXusIncMember2020-05-012020-05-010001385867coup:ConnXusIncMemberus-gaap:GeneralAndAdministrativeExpenseMember2020-02-012021-01-310001385867coup:YaptaIncMember2019-12-132019-12-130001385867coup:YaptaIncMember2019-12-130001385867coup:YaptaIncMember2021-01-310001385867coup:YaptaIncMember2020-02-012021-01-310001385867coup:YaptaIncMember2019-12-310001385867us-gaap:DevelopedTechnologyRightsMembercoup:YaptaIncMember2019-12-130001385867us-gaap:DevelopedTechnologyRightsMembercoup:YaptaIncMember2019-12-132019-12-130001385867us-gaap:CustomerRelationshipsMembercoup:YaptaIncMember2019-12-130001385867us-gaap:CustomerRelationshipsMembercoup:YaptaIncMember2019-12-132019-12-130001385867us-gaap:TrademarksMembercoup:YaptaIncMember2019-12-130001385867us-gaap:TrademarksMembercoup:YaptaIncMember2019-12-132019-12-130001385867us-gaap:GeneralAndAdministrativeExpenseMembercoup:YaptaIncMember2020-02-012021-01-310001385867coup:ExariGroupIncMember2019-05-062019-05-060001385867coup:ExariGroupIncMember2020-02-012021-01-310001385867coup:ExariGroupIncMember2019-05-060001385867coup:ExariGroupIncMemberus-gaap:DevelopedTechnologyRightsMember2019-05-060001385867srt:MinimumMembercoup:ExariGroupIncMemberus-gaap:DevelopedTechnologyRightsMember2019-05-062019-05-060001385867coup:ExariGroupIncMembersrt:MaximumMemberus-gaap:DevelopedTechnologyRightsMember2019-05-062019-05-060001385867coup:ExariGroupIncMemberus-gaap:CustomerRelationshipsMember2019-05-060001385867coup:ExariGroupIncMemberus-gaap:CustomerRelationshipsMember2019-05-062019-05-060001385867coup:ExariGroupIncMemberus-gaap:TrademarksMember2019-05-060001385867coup:ExariGroupIncMemberus-gaap:TrademarksMember2019-05-062019-05-060001385867coup:ExariGroupIncMemberus-gaap:GeneralAndAdministrativeExpenseMember2020-02-012021-01-310001385867us-gaap:FairValueInputsLevel1Memberus-gaap:MoneyMarketFundsMemberus-gaap:FairValueMeasurementsRecurringMember2021-01-310001385867us-gaap:MoneyMarketFundsMemberus-gaap:FairValueInputsLevel2Memberus-gaap:FairValueMeasurementsRecurringMember2021-01-310001385867us-gaap:MoneyMarketFundsMemberus-gaap:FairValueMeasurementsRecurringMemberus-gaap:FairValueInputsLevel3Member2021-01-310001385867us-gaap:MoneyMarketFundsMemberus-gaap:FairValueMeasurementsRecurringMember2021-01-310001385867us-gaap:FairValueInputsLevel1Memberus-gaap:FairValueMeasurementsRecurringMemberus-gaap:USTreasurySecuritiesMember2021-01-310001385867us-gaap:FairValueInputsLevel2Memberus-gaap:FairValueMeasurementsRecurringMemberus-gaap:USTreasurySecuritiesMember2021-01-310001385867us-gaap:FairValueMeasurementsRecurringMemberus-gaap:USTreasurySecuritiesMemberus-gaap:FairValueInputsLevel3Member2021-01-310001385867us-gaap:FairValueMeasurementsRecurringMemberus-gaap:USTreasurySecuritiesMember2021-01-310001385867us-gaap:FairValueInputsLevel1Membercoup:CorporateNotesAndBondsMemberus-gaap:FairValueMeasurementsRecurringMember2021-01-310001385867coup:CorporateNotesAndBondsMemberus-gaap:FairValueInputsLevel2Memberus-gaap:FairValueMeasurementsRecurringMember2021-01-310001385867coup:CorporateNotesAndBondsMemberus-gaap:FairValueMeasurementsRecurringMemberus-gaap:FairValueInputsLevel3Member2021-01-310001385867coup:CorporateNotesAndBondsMemberus-gaap:FairValueMeasurementsRecurringMember2021-01-310001385867us-gaap:FairValueInputsLevel1Memberus-gaap:FairValueMeasurementsRecurringMemberus-gaap:CertificatesOfDepositMember2021-01-310001385867us-gaap:FairValueInputsLevel2Memberus-gaap:FairValueMeasurementsRecurringMemberus-gaap:CertificatesOfDepositMember2021-01-310001385867us-gaap:FairValueMeasurementsRecurringMemberus-gaap:CertificatesOfDepositMemberus-gaap:FairValueInputsLevel3Member2021-01-310001385867us-gaap:FairValueMeasurementsRecurringMemberus-gaap:CertificatesOfDepositMember2021-01-310001385867us-gaap:FairValueInputsLevel1Memberus-gaap:FairValueMeasurementsRecurringMember2021-01-310001385867us-gaap:FairValueInputsLevel2Memberus-gaap:FairValueMeasurementsRecurringMember2021-01-310001385867us-gaap:FairValueMeasurementsRecurringMemberus-gaap:FairValueInputsLevel3Member2021-01-310001385867us-gaap:FairValueMeasurementsRecurringMember2021-01-310001385867us-gaap:FairValueInputsLevel1Memberus-gaap:FairValueMeasurementsRecurringMemberus-gaap:NondesignatedMemberus-gaap:ForeignExchangeForwardMember2021-01-310001385867us-gaap:FairValueInputsLevel2Memberus-gaap:FairValueMeasurementsRecurringMemberus-gaap:NondesignatedMemberus-gaap:ForeignExchangeForwardMember2021-01-310001385867us-gaap:FairValueMeasurementsRecurringMemberus-gaap:FairValueInputsLevel3Memberus-gaap:NondesignatedMemberus-gaap:ForeignExchangeForwardMember2021-01-310001385867us-gaap:FairValueMeasurementsRecurringMemberus-gaap:NondesignatedMemberus-gaap:ForeignExchangeForwardMember2021-01-310001385867us-gaap:ForeignExchangeForwardMember2021-01-310001385867us-gaap:FairValueInputsLevel1Memberus-gaap:MoneyMarketFundsMemberus-gaap:FairValueMeasurementsRecurringMember2020-01-310001385867us-gaap:MoneyMarketFundsMemberus-gaap:FairValueInputsLevel2Memberus-gaap:FairValueMeasurementsRecurringMember2020-01-310001385867us-gaap:MoneyMarketFundsMemberus-gaap:FairValueMeasurementsRecurringMemberus-gaap:FairValueInputsLevel3Member2020-01-310001385867us-gaap:MoneyMarketFundsMemberus-gaap:FairValueMeasurementsRecurringMember2020-01-310001385867us-gaap:FairValueInputsLevel1Membercoup:CorporateNotesAndBondsMemberus-gaap:FairValueMeasurementsRecurringMember2020-01-310001385867coup:CorporateNotesAndBondsMemberus-gaap:FairValueInputsLevel2Memberus-gaap:FairValueMeasurementsRecurringMember2020-01-310001385867coup:CorporateNotesAndBondsMemberus-gaap:FairValueMeasurementsRecurringMemberus-gaap:FairValueInputsLevel3Member2020-01-310001385867coup:CorporateNotesAndBondsMemberus-gaap:FairValueMeasurementsRecurringMember2020-01-310001385867us-gaap:FairValueInputsLevel1Memberus-gaap:FairValueMeasurementsRecurringMemberus-gaap:USTreasurySecuritiesMember2020-01-310001385867us-gaap:FairValueInputsLevel2Memberus-gaap:FairValueMeasurementsRecurringMemberus-gaap:USTreasurySecuritiesMember2020-01-310001385867us-gaap:FairValueMeasurementsRecurringMemberus-gaap:USTreasurySecuritiesMemberus-gaap:FairValueInputsLevel3Member2020-01-310001385867us-gaap:FairValueMeasurementsRecurringMemberus-gaap:USTreasurySecuritiesMember2020-01-310001385867us-gaap:FairValueInputsLevel1Memberus-gaap:FairValueMeasurementsRecurringMemberus-gaap:CommercialPaperMember2020-01-310001385867us-gaap:FairValueInputsLevel2Memberus-gaap:FairValueMeasurementsRecurringMemberus-gaap:CommercialPaperMember2020-01-310001385867us-gaap:FairValueMeasurementsRecurringMemberus-gaap:FairValueInputsLevel3Memberus-gaap:CommercialPaperMember2020-01-310001385867us-gaap:FairValueMeasurementsRecurringMemberus-gaap:CommercialPaperMember2020-01-310001385867us-gaap:FairValueInputsLevel1Memberus-gaap:AssetBackedSecuritiesMemberus-gaap:FairValueMeasurementsRecurringMember2020-01-310001385867us-gaap:AssetBackedSecuritiesMemberus-gaap:FairValueInputsLevel2Memberus-gaap:FairValueMeasurementsRecurringMember2020-01-310001385867us-gaap:AssetBackedSecuritiesMemberus-gaap:FairValueMeasurementsRecurringMemberus-gaap:FairValueInputsLevel3Member2020-01-310001385867us-gaap:AssetBackedSecuritiesMemberus-gaap:FairValueMeasurementsRecurringMember2020-01-310001385867us-gaap:FairValueInputsLevel1Memberus-gaap:FairValueMeasurementsRecurringMemberus-gaap:CertificatesOfDepositMember2020-01-310001385867us-gaap:FairValueInputsLevel2Memberus-gaap:FairValueMeasurementsRecurringMemberus-gaap:CertificatesOfDepositMember2020-01-310001385867us-gaap:FairValueMeasurementsRecurringMemberus-gaap:CertificatesOfDepositMemberus-gaap:FairValueInputsLevel3Member2020-01-310001385867us-gaap:FairValueMeasurementsRecurringMemberus-gaap:CertificatesOfDepositMember2020-01-310001385867us-gaap:FairValueInputsLevel1Memberus-gaap:FairValueMeasurementsRecurringMember2020-01-310001385867us-gaap:FairValueInputsLevel2Memberus-gaap:FairValueMeasurementsRecurringMember2020-01-310001385867us-gaap:FairValueMeasurementsRecurringMemberus-gaap:FairValueInputsLevel3Member2020-01-310001385867us-gaap:FairValueMeasurementsRecurringMember2020-01-310001385867us-gaap:FairValueInputsLevel1Membercoup:ContingentConsiderationPayableMemberus-gaap:FairValueMeasurementsRecurringMember2020-01-310001385867us-gaap:FairValueInputsLevel2Membercoup:ContingentConsiderationPayableMemberus-gaap:FairValueMeasurementsRecurringMember2020-01-310001385867coup:ContingentConsiderationPayableMemberus-gaap:FairValueMeasurementsRecurringMemberus-gaap:FairValueInputsLevel3Member2020-01-310001385867coup:ContingentConsiderationPayableMemberus-gaap:FairValueMeasurementsRecurringMember2020-01-310001385867coup:YaptaIncMember2020-01-310001385867coup:ConvertibleSeniorNotesDueTwoThousandTwentySixMember2021-01-310001385867coup:ConvertibleSeniorNotesDueTwoThousandTwentyFiveMember2021-01-310001385867coup:ConvertibleSeniorNotesDueTwoThousandTwentyThreeMember2021-01-310001385867us-gaap:FairValueInputsLevel2Membercoup:ConvertibleSeniorNotesDueTwoThousandTwentySixMember2021-01-310001385867coup:ConvertibleSeniorNotesDueTwoThousandTwentyFiveMemberus-gaap:FairValueInputsLevel2Member2021-01-310001385867coup:ConvertibleSeniorNotesDueTwoThousandTwentyThreeMemberus-gaap:FairValueInputsLevel2Member2021-01-310001385867coup:ConvertibleSeniorNotesDueTwoThousandTwentyFiveMemberus-gaap:FairValueInputsLevel2Member2020-01-310001385867coup:ConvertibleSeniorNotesDueTwoThousandTwentyThreeMemberus-gaap:FairValueInputsLevel2Member2020-01-310001385867us-gaap:FurnitureAndFixturesMember2021-01-310001385867us-gaap:FurnitureAndFixturesMember2020-01-310001385867us-gaap:SoftwareDevelopmentMember2021-01-310001385867us-gaap:SoftwareDevelopmentMember2020-01-310001385867us-gaap:LeaseholdImprovementsMember2021-01-310001385867us-gaap:LeaseholdImprovementsMember2020-01-310001385867us-gaap:ConstructionInProgressMember2021-01-310001385867us-gaap:ConstructionInProgressMember2020-01-310001385867us-gaap:DevelopedTechnologyRightsMember2020-02-012021-01-310001385867us-gaap:DevelopedTechnologyRightsMember2021-01-310001385867us-gaap:DevelopedTechnologyRightsMember2020-01-310001385867us-gaap:CustomerRelationshipsMember2020-02-012021-01-310001385867us-gaap:CustomerRelationshipsMember2021-01-310001385867us-gaap:CustomerRelationshipsMember2020-01-310001385867us-gaap:TrademarksMember2020-02-012021-01-310001385867us-gaap:TrademarksMember2021-01-310001385867us-gaap:TrademarksMember2020-01-31coup:segment0001385867us-gaap:EmployeeStockMember2021-01-310001385867us-gaap:EmployeeStockMember2020-01-310001385867us-gaap:PrivatePlacementMembercoup:ConvertibleSeniorNotesDueTwoThousandTwentySixMember2020-06-300001385867coup:ConvertibleSeniorNotesDueTwoThousandTwentySixMember2020-06-012020-06-300001385867coup:ConvertibleSeniorNotesDueTwoThousandTwentySixMember2020-06-3000013858672020-06-30utr:D0001385867coup:ConvertibleNotesHoldersConversionRightsUnderCircumstancesOneMembercoup:ConvertibleSeniorNotesDueTwoThousandTwentySixMember2020-06-012020-06-300001385867coup:ConvertibleNotesHoldersConversionRightsUnderCircumstancesTwoMembercoup:ConvertibleSeniorNotesDueTwoThousandTwentySixMember2020-06-012020-06-300001385867srt:MinimumMembercoup:ConvertibleSeniorNotesDueTwoThousandTwentySixMember2020-06-300001385867coup:ConvertibleSeniorNotesDueTwoThousandTwentyFiveMemberus-gaap:PrivatePlacementMember2019-06-300001385867coup:ConvertibleSeniorNotesDueTwoThousandTwentyFiveMember2019-06-012019-06-3000013858672019-06-300001385867coup:ConvertibleSeniorNotesDueTwoThousandTwentyFiveMember2019-06-300001385867coup:ConvertibleSeniorNotesDueTwoThousandTwentyThreeMember2018-01-310001385867coup:ConvertibleSeniorNotesDueTwoThousandTwentyThreeMember2017-02-012018-01-310001385867coup:ConvertibleSeniorNotesDueTwoThousandTwentyThreeMember2020-02-012021-01-310001385867coup:ConvertibleSeniorNotesDueTwoThousandTwentyThreeMemberus-gaap:CommonStockMember2020-02-012021-01-310001385867coup:PrincipalAmountOfDebtCancelledMembercoup:ConvertibleSeniorNotesDueTwoThousandTwentyThreeMember2020-02-012021-01-310001385867coup:ConvertibleSeniorNotesDueTwoThousandTwentyThreeMember2021-01-312021-01-310001385867coup:ConvertibleSeniorNotesDueTwoThousandTwentyFiveMember2020-01-310001385867coup:ConvertibleSeniorNotesDueTwoThousandTwentyThreeMember2020-01-310001385867us-gaap:PrivatePlacementMembercoup:ConvertibleSeniorNotesDueTwoThousandTwentySixMember2021-01-310001385867coup:ConvertibleSeniorNotesDueTwoThousandTwentyFiveMember2020-02-012021-01-310001385867coup:ConvertibleSeniorNotesDueTwoThousandTwentyFiveMember2019-02-012020-01-310001385867coup:ConvertibleSeniorNotesDueTwoThousandTwentyThreeMember2019-02-012020-01-310001385867coup:ConvertibleSeniorNotesDueTwoThousandTwentySixMember2020-02-012021-01-310001385867us-gaap:CallOptionMembercoup:ConvertibleSeniorNotesDueTwoThousandTwentySixMember2020-02-012021-01-310001385867us-gaap:CallOptionMembercoup:ConvertibleSeniorNotesDueTwoThousandTwentyFiveMember2020-02-012021-01-310001385867us-gaap:CallOptionMembercoup:ConvertibleSeniorNotesDueTwoThousandTwentyThreeMember2020-02-012021-01-31iso4217:USDcoup:shares0001385867us-gaap:CallOptionMembercoup:ConvertibleSeniorNotesDueTwoThousandTwentySixMember2021-01-310001385867us-gaap:CallOptionMembercoup:ConvertibleSeniorNotesDueTwoThousandTwentyFiveMember2021-01-310001385867us-gaap:CallOptionMembercoup:ConvertibleSeniorNotesDueTwoThousandTwentyThreeMember2021-01-310001385867coup:TwoThousandSixteenEquityIncentivePlanMember2021-01-310001385867coup:TwoThousandSixteenEquityIncentivePlanMember2020-02-012021-01-310001385867coup:TwoThousandSixStockPlanAndTwoThousandSixteenPlanMember2020-01-310001385867coup:TwoThousandSixStockPlanAndTwoThousandSixteenPlanMember2019-02-012020-01-310001385867coup:TwoThousandSixStockPlanAndTwoThousandSixteenPlanMember2020-02-012021-01-310001385867coup:TwoThousandSixStockPlanAndTwoThousandSixteenPlanMember2021-01-310001385867coup:MarketAndServiceBasedStockOptionsMembercoup:TwoThousandSixStockPlanAndTwoThousandSixteenPlanMember2021-01-310001385867us-gaap:RestrictedStockUnitsRSUMembercoup:TwoThousandSixteenEquityIncentivePlanMember2020-01-310001385867us-gaap:RestrictedStockUnitsRSUMembercoup:TwoThousandSixteenEquityIncentivePlanMember2020-02-012021-01-310001385867us-gaap:RestrictedStockUnitsRSUMembercoup:TwoThousandSixteenEquityIncentivePlanMember2021-01-310001385867coup:MarketAndServiceBasedRestrictedStockUnitAwardsMembercoup:TwoThousandSixteenEquityIncentivePlanMember2020-02-012021-01-310001385867us-gaap:EmployeeStockMember2020-02-012021-01-31coup:period0001385867us-gaap:EmployeeStockMember2019-02-012020-01-310001385867coup:MarketBasedStockOptionsMembercoup:TwoThousandSixStockPlanMembersrt:ChiefExecutiveOfficerMember2016-09-012016-09-300001385867coup:MarketBasedStockOptionsMembercoup:TwoThousandSixteenEquityPlanMembersrt:ChiefExecutiveOfficerMember2018-03-012018-03-310001385867coup:TwoThousandSixteenEquityIncentivePlanMembercoup:MarketBasedRestrictedStockUnitAwardsMember2020-03-012020-03-310001385867srt:MinimumMembercoup:TwoThousandSixteenEquityIncentivePlanMembercoup:MarketBasedRestrictedStockUnitAwardsMember2020-03-012020-03-310001385867srt:MaximumMembercoup:TwoThousandSixteenEquityIncentivePlanMembercoup:MarketBasedRestrictedStockUnitAwardsMember2020-03-012020-03-310001385867coup:MarketBasedStockOptionsMembercoup:TwoThousandSixStockPlanMembersrt:ChiefExecutiveOfficerMember2021-01-310001385867coup:TwoThousandSixteenEquityPlanMembersrt:ChiefExecutiveOfficerMembercoup:MarketBasedRestrictedStockUnitAwardsMember2021-01-310001385867coup:TwoThousandSixteenEquityIncentivePlanMembercoup:MarketBasedRestrictedStockUnitAwardsMember2020-02-012021-01-310001385867coup:MarketBasedStockOptionsMembercoup:TwoThousandSixteenEquityPlanMembersrt:ChiefExecutiveOfficerMember2021-01-310001385867coup:MarketBasedStockOptionsMembercoup:TwoThousandSixteenEquityPlanMembersrt:ChiefExecutiveOfficerMember2020-02-012021-01-310001385867coup:MarketBasedStockOptionsMembercoup:TwoThousandSixteenEquityPlanMembersrt:ChiefExecutiveOfficerMember2019-02-012020-01-310001385867coup:MarketBasedStockOptionsMembercoup:TwoThousandSixteenEquityPlanMembersrt:ChiefExecutiveOfficerMember2018-02-012019-01-310001385867coup:SubscriptionServicesMember2020-02-012021-01-310001385867coup:SubscriptionServicesMember2019-02-012020-01-310001385867coup:SubscriptionServicesMember2018-02-012019-01-310001385867coup:ProfessionalServicesAndOtherMember2020-02-012021-01-310001385867coup:ProfessionalServicesAndOtherMember2019-02-012020-01-310001385867coup:ProfessionalServicesAndOtherMember2018-02-012019-01-310001385867us-gaap:ResearchAndDevelopmentExpenseMember2020-02-012021-01-310001385867us-gaap:ResearchAndDevelopmentExpenseMember2019-02-012020-01-310001385867us-gaap:ResearchAndDevelopmentExpenseMember2018-02-012019-01-310001385867us-gaap:SellingAndMarketingExpenseMember2020-02-012021-01-310001385867us-gaap:SellingAndMarketingExpenseMember2019-02-012020-01-310001385867us-gaap:SellingAndMarketingExpenseMember2018-02-012019-01-310001385867us-gaap:GeneralAndAdministrativeExpenseMember2020-02-012021-01-310001385867us-gaap:GeneralAndAdministrativeExpenseMember2019-02-012020-01-310001385867us-gaap:GeneralAndAdministrativeExpenseMember2018-02-012019-01-310001385867us-gaap:SoftwareDevelopmentMember2020-02-012021-01-310001385867us-gaap:SoftwareDevelopmentMember2019-02-012020-01-310001385867coup:TwoThousandSixStockPlanAndTwoThousandSixteenPlanMember2019-01-310001385867coup:TwoThousandSixStockPlanAndTwoThousandSixteenPlanMemberus-gaap:EmployeeStockOptionMember2020-02-012021-01-310001385867us-gaap:RestrictedStockUnitsRSUMembercoup:TwoThousandSixteenEquityIncentivePlanMember2019-01-310001385867us-gaap:EmployeeStockOptionMember2019-02-012020-01-310001385867us-gaap:EmployeeStockOptionMember2018-02-012019-01-310001385867us-gaap:EmployeeStockOptionMember2020-02-012021-01-310001385867srt:MinimumMemberus-gaap:EmployeeStockMember2020-02-012021-01-310001385867srt:MaximumMemberus-gaap:EmployeeStockMember2020-02-012021-01-310001385867srt:MinimumMemberus-gaap:EmployeeStockMember2019-02-012020-01-310001385867srt:MaximumMemberus-gaap:EmployeeStockMember2019-02-012020-01-310001385867srt:MinimumMemberus-gaap:EmployeeStockMember2018-02-012019-01-310001385867srt:MaximumMemberus-gaap:EmployeeStockMember2018-02-012019-01-310001385867us-gaap:EmployeeStockMember2018-02-012019-01-310001385867coup:MarketBasedStockOptionsMember2020-02-012021-01-310001385867coup:MarketBasedStockOptionsMember2018-02-012019-01-310001385867coup:MarketBasedStockOptionsMember2019-02-012020-01-310001385867srt:MinimumMember2020-02-012021-01-310001385867us-gaap:DomesticCountryMember2021-01-310001385867us-gaap:StateAndLocalJurisdictionMember2021-01-310001385867us-gaap:ResearchMemberus-gaap:DomesticCountryMember2021-01-310001385867us-gaap:ResearchMemberus-gaap:CaliforniaFranchiseTaxBoardMember2021-01-310001385867us-gaap:ForeignCountryMember2021-01-310001385867us-gaap:EmployeeStockOptionMember2020-02-012021-01-310001385867us-gaap:EmployeeStockOptionMember2019-02-012020-01-310001385867us-gaap:EmployeeStockOptionMember2018-02-012019-01-310001385867us-gaap:RestrictedStockUnitsRSUMember2020-02-012021-01-310001385867us-gaap:RestrictedStockUnitsRSUMember2019-02-012020-01-310001385867us-gaap:RestrictedStockUnitsRSUMember2018-02-012019-01-310001385867coup:UnvestedCommonSharesSubjectToRepurchaseMember2020-02-012021-01-310001385867coup:UnvestedCommonSharesSubjectToRepurchaseMember2019-02-012020-01-310001385867coup:UnvestedCommonSharesSubjectToRepurchaseMember2018-02-012019-01-310001385867coup:SharesCommittedUnderEmployeeStockPurchasePlanMember2020-02-012021-01-310001385867coup:SharesCommittedUnderEmployeeStockPurchasePlanMember2019-02-012020-01-310001385867coup:SharesCommittedUnderEmployeeStockPurchasePlanMember2018-02-012019-01-310001385867coup:ContingentStockConsiderationForDCRAcquisitionMember2020-02-012021-01-310001385867coup:ContingentStockConsiderationForDCRAcquisitionMember2019-02-012020-01-310001385867coup:ContingentStockConsiderationForDCRAcquisitionMember2018-02-012019-01-310001385867coup:HoldbackSharesForAquiireAcquisitionMember2020-02-012021-01-310001385867coup:HoldbackSharesForAquiireAcquisitionMember2019-02-012020-01-310001385867coup:HoldbackSharesForAquiireAcquisitionMember2018-02-012019-01-310001385867srt:MaximumMembercoup:ConvertibleSeniorNotesDueTwoThousandTwentySixMember2020-02-012021-01-310001385867srt:MaximumMembercoup:ConvertibleSeniorNotesDueTwoThousandTwentyFiveMember2020-02-012021-01-310001385867coup:ConvertibleSeniorNotesDueTwoThousandTwentyThreeMembersrt:MaximumMember2020-02-012021-01-310001385867coup:ConvertibleSeniorNotesDueTwoThousandTwentyThreeMemberus-gaap:CommonStockMember2021-01-310001385867coup:ConvertibleSeniorNotesDueTwoThousandTwentyFiveMemberus-gaap:CommonStockMember2021-01-310001385867coup:ConvertibleSeniorNotesDueTwoThousandTwentySixMemberus-gaap:CommonStockMember2021-01-310001385867us-gaap:CallOptionMembercoup:MorganStanleyMember2019-06-012019-06-300001385867us-gaap:CallOptionMembercoup:MorganStanleyMember2018-01-012018-01-310001385867us-gaap:CallOptionMembercoup:ConvertibleSeniorNotesDueTwoThousandTwentyFiveMembercoup:MorganStanleyMember2020-02-012021-01-310001385867us-gaap:CallOptionMembercoup:ConvertibleSeniorNotesDueTwoThousandTwentyThreeMembercoup:MorganStanleyMember2020-02-012021-01-3100013858672020-11-012021-01-3100013858672020-08-012020-10-3100013858672020-05-012020-07-3100013858672020-02-012020-04-3000013858672019-11-012020-01-3100013858672019-08-012019-10-3100013858672019-05-012019-07-3100013858672019-02-012019-04-300001385867us-gaap:SubsequentEventMembercoup:PanaIndustriesIncMember2021-02-012021-02-010001385867us-gaap:SubsequentEventMember2021-02-012021-02-01
UNITED STATES
SECURITIES AND EXCHANGE COMMISSION
Washington, D.C. 20549
FORM 10-K
(Mark One)
☒ ANNUAL REPORT PURSUANT TO SECTION 13 OR 15(d) OF THE SECURITIES EXCHANGE ACT OF 1934
For the fiscal year ended January 31, 2021
OR
☐ TRANSITION REPORT PURSUANT TO SECTION 13 OR 15(d) OF THE SECURITIES EXCHANGE ACT OF 1934
For the transition period from to
Commission File Number 001-37901
COUPA SOFTWARE INCORPORATED
(Exact name of Registrant as specified in its charter)
| | | | | | | | | | | | | | |
| Delaware | | 20-4429448 |
(State or other jurisdiction of
incorporation or organization) | | (I.R.S. Employer
Identification No.) |
| | | | |
| 1855 S. Grant Street | | |
| San Mateo | , | CA | | 94402 |
| (Address of principal executive offices) | | (Zip Code) |
Registrant’s telephone number, including area code: (650) 931-3200
Securities registered pursuant to Section 12(b) of the Act:
| | | | | | | | | | | | | | |
| Title of each class | | Trading Symbol | | Name of each exchange on which registered |
| Common Stock, par value $0.0001 per share | | COUP | | The Nasdaq Stock Market LLC |
| | | | (Nasdaq Global Select Market) |
Securities registered pursuant to Section 12(g) of the Act: None
Indicate by check mark if the Registrant is a well-known seasoned issuer, as defined in Rule 405 of the Securities Act. Yes ☒ No ☐
Indicate by check mark if the Registrant is not required to file reports pursuant to Section 13 or Section 15(d) of the Act. Yes ☐ No ☒
Indicate by check mark whether the Registrant: (1) has filed all reports required to be filed by Section 13 or 15(d) of the Securities Exchange Act of 1934 during the preceding 12 months (or for such shorter period that the Registrant was required to file such reports), and (2) has been subject to such filing requirements for the past 90 days. Yes ☒ No ☐
Indicate by check mark whether the Registrant has submitted electronically every Interactive Data File required to be submitted pursuant to Rule 405 of Regulation S-T (§232.405 of this chapter) during the preceding 12 months (or for such shorter period that the Registrant was required to submit such files). Yes ☒ No ☐
Indicate by check mark whether the Registrant is a large accelerated filer, an accelerated filer, a non-accelerated filer, a smaller reporting company, or emerging growth company. See the definition of “large accelerated filer”, “accelerated filer”, “smaller reporting company”, and “emerging growth company” in Rule 12b-2 of the Exchange Act.
| | | | | | | | | | | | | | |
| Large accelerated filer | ☒ | | Accelerated filer | ☐ |
| Non-accelerated filer | ☐ | | Smaller reporting company | ☐ |
| | | Emerging growth company | ☐ |
If an emerging growth company, indicate by check mark if the registrant has elected not to use the extended transition period for complying with any new or revised financial accounting standards provided pursuant to Section 13(a) of the Exchange Act. ☐
Indicate by check mark whether the Registrant is a shell company (as defined in Rule 12b-2 of the Act). Yes ☐ No ☒
Indicate by check mark whether the registrant has filed a report on and attestation to its management’s assessment of the effectiveness of its internal control over financial reporting under Section 404(b) of the Sarbanes-Oxley Act (15 U.S.C. 7262(b)) by the registered public accounting firm that prepared or issued its audit report. ☒
Based on the closing price of the Registrant’s Common Stock on the last business day of the Registrant’s most recently completed second fiscal quarter, which was July 31, 2020, the aggregate market value of its shares (based on a closing price of $306.45 per share) held by non-affiliates was approximately $21.0 billion. Shares of common stock held by each executive officer, director, and their affiliated holders have been excluded in that such persons may be deemed to be affiliates. This determination of affiliate status is not necessarily a conclusive determination for other purposes.
The number of shares of Registrant’s common stock outstanding as of March 11, 2021 was 72,852,361.
DOCUMENTS INCORPORATED BY REFERENCE
Portions of the Registrant’s Proxy Statement relating to the 2021 Annual Meeting of Stockholders, scheduled to be filed with the Securities and Exchange Commission within 120 days after the end of the Registrant’s fiscal year ended January 31, 2021, are incorporated by reference into Part III of this Annual Report on Form 10-K.
COUPA SOFTWARE INCORPORATED
Form 10-K for the Fiscal Year Ended January 31, 2021
Table of Contents
NOTE ABOUT FORWARD-LOOKING STATEMENTS
This Annual Report on Form 10-K contains forward-looking statements. All statements other than statements of historical facts contained in this report, including statements regarding our future results of operations and financial position, the expected impact of the COVID-19 pandemic on our business, results of operations and financial condition, customer lifetime value, strategy and plans, market size and opportunity, competitive position, industry environment, potential growth opportunities, product capabilities, expected impact of business acquisitions, our expectations for future operations and our convertible senior notes, are forward-looking statements. The words “believe,” “may,” “will,” “estimate,” “continue,” “anticipate,” “design,” “intend,” “expect,” “could,” “plan,” “potential,” “predict,” “seek,” “should,” “would” or the negative version of these words and similar expressions are intended to identify forward-looking statements. We have based these forward-looking statements on our current expectations and projections about future events and trends that we believe may affect our financial condition, results of operations, strategy, short-and long-term business operations and objectives, and financial needs. The forward-looking statements are contained principally in “Management’s Discussion and Analysis of Financial Condition and Results of Operations,” "Business" and “Risk Factors.”
These forward-looking statements are subject to a number of risks, uncertainties and assumptions, including those described in “Risk Factors” and elsewhere in this Annual Report on Form 10-K. Moreover, we operate in a very competitive and rapidly changing environment. New risks emerge from time to time. It is not possible for our management to predict all risks, nor can we assess the impact of all factors on our business or the extent to which any factor, or combination of factors, may cause actual results to differ materially from those contained in any forward-looking statements we may make. In light of these risks, uncertainties and assumptions, the forward-looking events and circumstances discussed in this Annual Report on Form 10-K may not occur and actual results could differ materially and adversely from those anticipated or implied in the forward-looking statements.
You should not rely upon forward-looking statements as predictions of future events. Although we believe that the expectations reflected in the forward-looking statements are reasonable, we cannot guarantee that the future results, levels of activity, performance or events and circumstances reflected in the forward-looking statements will be achieved or occur. Moreover, except as required by law, neither we nor any other person assumes responsibility for the accuracy and completeness of the forward-looking statements. We undertake no obligation to update publicly any forward-looking statements for any reason after the date of this Annual Report on Form 10-K to conform these statements to actual results or to changes in our expectations.
PART I
Item 1. Business.
Overview
We are a leading provider of Business Spend Management (“BSM”) solutions. We offer a comprehensive, cloud-based BSM platform that has connected our customers with more than seven million suppliers globally. Our platform provides greater visibility into and control over how companies spend money, optimize supply chains, and manage liquidity. Using our platform, businesses are able to achieve real, measurable value and savings that drive their profitability.
Our BSM platform is designed for the modern global workforce that is mobile and expects real-time results, flexibility, and agility from software solutions. The look, feel and functionality of our intuitive, mobile and browser-based interface evoke a familiar e-commerce experience that is intended to appeal to users across an entire organization, rather than just a small group of power users with specialized training. The simplicity and accessibility of our solution encourages widespread adoption within an organization—and the broader the user adoption, the more spend under management that an organization achieves. In this way, our user-centric approach enables organizations to gain greater control over their procurement, invoicing, payment and other related spend activities, and to manage these processes more efficiently than with traditional, legacy solutions. By de-centralizing BSM workflows and removing unnecessary complexity, our platform reduces an organization’s dependence on its often-backlogged back-office functions, and empowers personnel across the organization to source and purchase goods and services on their own—without sacrificing visibility and control over spending.
Our BSM platform delivers a broad range of capabilities that would typically require the purchase and use of multiple disparate point applications. The core of our platform consists of procurement, invoicing, expense management, and payment solutions that form the transactional engine for managing a company’s business spend. In addition, our platform offers specialized modules targeted for power users, to help companies manage more technical and strategic areas of BSM, including areas such as strategic sourcing, contract management, contingent workforce, supplier risk management, supply chain design and planning, treasury management, and spend analysis.
We benefit from powerful network effects as our customer and supplier populations continue to grow. As more businesses subscribe to our BSM platform, the collective spend under management on our platform grows. The greater the total amount of spend under management on our platform, the more attractive our platform is to suppliers. As more suppliers join our platform, our buyers benefit from a broader range of purchasing options, which in turn encourages greater use of our platform by existing customers, while also attracting new customers to our platform. In addition, the increasing number of transactions on our platform leads to incrementally powerful prescriptive spend insights and risk management recommendations from our Coupa Community Intelligence solutions, creating more value for customers and providing additional incentives for increased adoption. As we generate more revenue from the increase in customer subscriptions to our services, we are able to make greater investments into our platform, for example, to add new features or improve the functionality and user interface of our solutions, and these enhancements further encourage greater adoption of our platform by businesses, enhancing the network effects that benefit all constituencies.
Our customers benefit from our rapidly growing network in a multitude of ways. We describe the ecosystem of business buyers, suppliers and partners that use our services as a “community.” Like any community, each member can contribute value to the community, and can also benefit, directly or indirectly, from the participation of other members of the community. For example, through programs that leverage group buying power; through recommendations based on insights extracted from anonymized data on transactions occurring within the platform; and through access to community message boards and channels for direct communication between community participants. Our Community Intelligence capabilities apply artificial intelligence and machine learning to spend transactions across the growing Coupa community to identify trends and prescribe best practices that help customers optimize spend, reduce risk, and improve efficiency. Additionally, we provide purchasing programs, such as Coupa Advantage, which offers access to pre-negotiated discounts from various suppliers, and Source Together, which connects community members to engage in group sourcing events, allowing them to leverage pooled buying power to achieve better contracting terms and capture greater savings. Moreover, through our Coupa Open Business Network, suppliers of all sizes can list their goods and services, establish pricing, and interact with buyers electronically, thus significantly reducing paper, improving operating efficiencies, and reducing costs.
We believe a critical, differentiating feature of Coupa’s approach to BSM is our company culture. That culture is built on three guiding principles we refer to as our core values: (1) ensuring customer success, (2) focusing on results; and (3) striving for excellence. We emphasize these principles continuously through formal training and informal messaging within the organization, and the results of our annual employee surveys consistently demonstrate that our employees have adopted and strive to embody them. These principles inform how we treat each other within our organization, and how we approach interactions with our customers, suppliers, partners, and others with whom we do business. Our unwavering focus on customer success means that we expect to deliver quantifiable business value to our customers by helping them maximize their spend under management. We believe this mindset serves as the foundation for the successful execution of our strategy, and, as a result, is critical to our growth. We focus on results. Our market leading technology supports rapid time-to-deployment, typically ranging from a few weeks to several months, achieving swift time to value. We strive for excellence in many ways, one example of which is through our product release and update cycles. Here, we seek to improve product design iteratively, based on user feedback, as we look to build ever-more intuitive, easy-to-use interfaces to shield users from the complexity associated with more traditional, legacy enterprise resource planning ("ERP") and procurement solutions. Our relentless commitment to the embodiment of our core values supports the creation of meaningful, measurable customer value within a short timeframe, resulting in a rapid return on investment for our customers.
We have developed a rich partner ecosystem of systems integrators, implementation partners, resellers, and technology partners. We work closely with several global systems integrators, including Accenture, Deloitte, KPMG, and others that help us scale our business, extend our global reach, and drive increased market penetration. We expect the number of partner-led implementations and sales referrals to continue to increase over time.
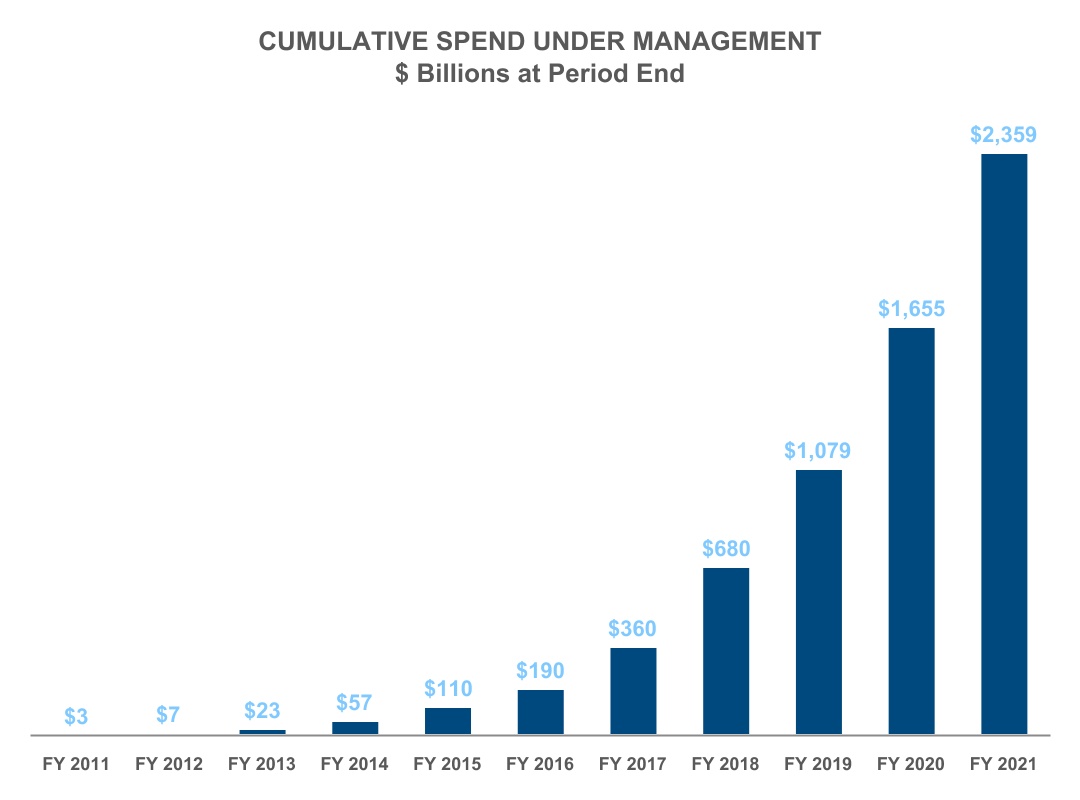
We have achieved rapid growth in customer adoption, cumulative spend under management, and transactions conducted through our platform which currently has over 2,000 customers. Our cumulative spend under management is highlighted below:
As of January 31, 2021, 2020, and 2019, our cumulative spend under management was $2,359 billion, $1,655 billion and $1,079 billion, respectively. Cumulative spend under management does not directly correlate to our revenue or results of operations because we do not generally charge our customers based on actual usage of our BSM platform. However, we believe that cumulative spend under management illustrates the adoption, scale, and value of our platform, which we believe enhances our ability to maintain existing customers and attract new customers.
For our fiscal years ended January 31, 2021, 2020, and 2019, our total revenues were $541.6 million, $389.7 million and $260.4 million, respectively, and our net losses were $180.1 million, $90.8 million and $55.5 million, respectively, as we focused on growing our business.
The Coupa BSM Platform
Our BSM platform provides businesses with real-time visibility and control of spend and liquidity. The platform’s modern, user-centric interface enables businesses to drive adoption of the platform, to capture, analyze, and control their spend, and to achieve real, measurable value and savings, and directly improve their profitability:
•Adopt. Our platform applies a user-centric approach that shields users from complexity and provides a mobile-enabled consumer intuitive experience, thus enabling widespread adoption of our platform by users across the entire organization, and across the customer’s supplier base.
•Capture. At the core of our platform is our transactional engine comprised of our procurement, invoicing, expense management, and payment management modules, which comprehensively help capture and manage spend within an organization. Because purchase orders, invoices, expense reports, and payments flow through our platform and the data is stored centrally in a clean and organized fashion, businesses are able to observe their spending activities in real-time.
•Analyze. Our spending analytics capabilities provide intuitive spend analysis dashboards and reports that deliver real-time analytical insights to help businesses identify problems and make better spending decisions. Real-time analytical and prescriptive insights are critical to helping identify savings opportunities and risks, isolating problem areas in the spending process, and providing recommendations to target improvement efforts.
•Control. We help our customers control and streamline their spending activity, realize efficiencies that result in real savings, and reduce supplier risk. Our platform has extensive functionality that enables managers to prevent excessive spend, reduce spend through efficiencies and cost savings associated with strategic sourcing and contract compliance, and identify and manage risky suppliers across various layers of the supply base.
•Value. Within a short timeframe, we help our customers realize measurable value by taking advantage of pre-negotiated supplier discounts, achieving contract compliance, improving process efficiencies, and reducing redundant and wasteful spending, as well as enabling strategic sourcing via reverse auctions where suppliers bid down prices at which they are willing to sell their goods and services to businesses.
Our BSM Platform’s Capabilities
Our BSM platform includes the following capabilities:
Coupa’s Transactional Engine
The core of our platform is our transactional engine, which is comprised of the following modules:
•Procure: Our procurement module enables customers to strategically establish spend policies and approval rules to govern company spending. The application provides an intuitive, e-commerce-type shopping experience so that employees can easily and quickly find the goods and services they need to do their jobs. For example, employees searching for goods can see inventory-on-hand balances in the search results, which eliminates redundant spending. Our procurement module streamlines purchase requisition and purchase order processes, allowing businesses to track and manage purchases in real-time, thus reducing time and cost. Upon approval of an employee request, purchase orders are automatically sent to suppliers for fulfillment and invoicing. Benchmark data allows customers to spot process inefficiencies, while ease of configuration enables businesses to effortlessly adjust business processes to meet continually changing requirements.
•Invoice: Customers may quickly configure invoice approval and matching rules so invoices can be routed without accounts payable team member effort and cost. Easy, no-cost means for suppliers to create electronic invoices that comply with government regulations allow businesses to eliminate paper and further reduce their invoice processing costs, all while reducing invoice payment fraud risk. Furthermore, our invoicing module enables customers to improve cash management through the effective management of supplier invoices via embedded dashboards and work queues that prioritize invoices with early payment discount opportunities.
•Expense: Our expense management module enables customers to gain control of the expenses incurred by employees. Innovative mobile capabilities such as GPS and geo-location make it easy for travelers to create expense reports on-the-go. Frugal meter capabilities automatically assess the appropriateness of employee charges based on the customer’s configured policies and thresholds. Seamless connectivity to credit card providers directly feeds charges into our expense management module for added visibility and reporting ease. Coupa also provides additional travel management capabilities, such as travel price assurance that helps companies capture savings from flight and hotel price decreases that happen after the booking has been placed.
•Pay: Coupa Pay represents a set of solutions that help customers consolidate and optimize their processes to manage working capital and make payments to suppliers and contractors, as well as to employees for travel and expense reimbursements. With Coupa Pay, customers can make payments using different methods, including domestic and international bank transfers, one-time-use virtual credit cards, digital checks, and digital wallets. Coupa's comprehensive approach to payments removes silos between Procurement, Accounts Payable, and Treasury, thus increasing process efficiency, reducing invoice volume through the use of secure virtual credit cards at the time of purchase order, and unlocking the opportunity to take advantage of early pay discounts. Customers are equipped with a single portal to manage all payments across multiple banks, and their suppliers get visibility into payment status. The process to create, approve, and release payments is automated to save time and avoid potential error and fraud. This process is secured with access controls and encrypted transmission and storage of payment-related information. With payments management as a core capability within our unified BSM platform, all types of payment transactions are automatically reconciled to supporting documentation for better visibility and control of business spend.
Supporting Modules
Our platform offers the following supporting modules that help companies further manage their spend, and associated back-office processes:
Strategic Sourcing. Our strategic sourcing module enables customers to find the best suppliers for the goods or services they need to run their businesses. It also offers advanced capabilities for complex sourcing categories such as direct raw materials and logistics. Customers easily create sourcing events containing the specifics of their business needs and invite suppliers to participate. Suppliers are able to review and bid effortlessly and without any fees to participate. Collaboration capabilities enable employees to review bids and provide feedback that is automatically compiled and scored. For the sourcing of complex categories, Coupa applies advanced mathematical optimization techniques, allowing customers to analyze price and non-price elements to find the combination of suppliers and goods and services that meet the constraints they specify.
Contract Management. Our contracts module enables customers to let their employees author new contracts within “guardrails” to manage risk while improving efficiency for their legal teams. Higher-risk contract terms can be escalated for legal review, while lower-risk choices can be pre-approved. Once negotiated, approved and signed, customers can operationalize contracts, making these contracts easily available for use by employees across the organization. Buying under the terms of negotiated contracts can increase savings through the use of pre-agreed rates and mitigate risk through contractual protections. Customers get visibility into how contracts affect spending with embedded dashboards at both the contract and summary level. Advanced contract analysis capabilities give customers visibility into contract terms and risk, while automatic alerts remind employees to review contracts prior to expiration or auto-renewal dates.
Contingent Workforce. Our contingent workforce module enables customers to gain better visibility, control and optimization of services spend, as part of their holistic business spend management program. Customers can easily initiate requests for temporary work or advanced SOW-based projects as well as source and collect bids. Having better visibility to preferred suppliers helps customers optimize costs by selecting appropriate vendors with competitive rates. Onboarding and offboarding contingent workers is fast and secure, while tracking worker performance and ensuring compliance with company policies is simplified for both customers and contingent workers.
Supplier Risk Management. Our supplier risk management module enables customers to collect the supplier information required to manage and pay suppliers and provides data about potential risks associated with a given supplier. Customers can also use this module to help ensure compliance and mitigate third-party risk by extensively evaluating their supplier base against critical risk domains, including information security, anti-bribery and anti-corruption, and GDPR compliance, while also staying informed on potential supplier risk by leveraging credit ratings and other searches of publicly available databases. Customers can track additional supplier attributes related to sustainability, diversity and inclusion, and other measures and then report on program performance against sustainability and diversity and inclusion goals.
Supply Chain Design and Planning. Our supply chain design and planning module leverages a foundation of internal and external data sources, in addition to artificial intelligence and advanced analytics, to generate a comprehensive digital model of the extended supply chain. Customers with global, complex physical supply chains use Coupa to continuously design their supply chains, performing scenario planning to analyze options and trade-offs that help build supply chain resiliency and agility. This includes an easy-to-use “no code” app building environment that enables customers to leverage Coupa’s deep domain-specific algorithm library, along with open source or custom code components, to efficiently deploy purpose-built apps to support a range of supply chain use cases made available to decision makers across the enterprise.
Treasury Management. Our treasury management module enables organizations to optimize cash and liquidity by gaining better insights into future liquidity demands and linking cash management to purchasing and invoicing processes to improve forecasting across the entire enterprise. Organizations can connect to most banks worldwide using SWIFT, H2H or domestic communication standards for statement collection. Coupa provides organizations with visibility into their financial data across multiple subsidiaries, entities, currencies, and geographies, automating liquidity planning and enabling them to manage and record financial instruments. Organizations can consolidate subsidiary exposure and streamline intercompany transfers with centralized group-wide payments, cash pooling and intercompany account structures for all subsidiaries. Organizations can reduce risk and protect liquidity compliant workflows with exposure and hedge ratio tracking and by having all spend and payment data in one place enabled by real-time data and insights through analytics and reporting. Fraud prevention detects suspicious activities with a central vendor database and streamlines payment approval using validation status.
Spend Analysis. Our spend analysis module provides managers a large set of built-in reports and dashboards that allow users to see spending activity, find bottlenecks in workflows, analyze granular data by commodity, supplier, location and cost center, and drill down into the spend transactions. Customers can also leverage our artificial intelligence capabilities to automate complex business spend data classification. We have created more than one hundred out-of-the-box reports covering some of the most important business metrics, such as unified spend for purchase orders, invoices or expense reports, spend trends over time, and spend by commodity, supplier and contract. Users can also create new metrics, reports and dashboards with our intuitive user interface, as well as include external data like corporate and travel expenses or integrate with third-party systems, to get a holistic view of their spend patterns.
Coupa Open Business Network
Our Coupa Open Business Network instantly connects business customers and suppliers, providing businesses with a platform that is accessible to suppliers of all sizes—even those typically ignored by fee-based closed networks—to drive success. Suppliers have a variety of options to connect with businesses including:
•Coupa Supplier Portal. This portal is a tool for suppliers to easily do business with our customers. The Supplier Portal lets suppliers manage content and settings on a customer-by-customer basis, including managing company information, setting up purchase order transmission preferences, creating and managing online catalogs, managing procurement orders and invoices across multiple customers and gaining visibility into the status of invoices.
•Coupa Supplier Actionable Notifications. These notifications enable suppliers to receive HTML purchaser orders and convert these purchase orders into invoices right from the procurement order e-mail, which represents the easiest way to submit electronic invoices through our platform.
•Direct Connection via cXML and EDI. Our platform supports various communication formats such as cXML or EDI for suppliers that want to automate their invoicing through a tighter integration with our platform.
•Direct E-mail. Suppliers can choose to send PDF invoices simply through e-mail.
By using our Coupa Open Business Network, companies can improve compliance with government regulations, increase profitability, and reduce costs by driving electronic transactions away from paper-based transactions. Our Coupa Open Business Network user interface is easy to navigate and requires little to no training for suppliers. Businesses are able to interact with millions of suppliers already using our Coupa Supplier Portal, quickly onboard new suppliers, integrate directly or simply use our smart e-mail tools. Businesses can also use the Coupa Open Business Network to layer on top of their existing technology, including third-party systems such as Oracle iProcurement, SAP SRM and others. Suppliers of all sizes benefit, as they are able to join the networked economy without changing their technology or spending money on transaction fees.
Coupa Advantage and Coupa Source Together
Our Coupa Advantage program offers customers the opportunity to leverage pre-negotiated discounts from select suppliers in several business categories such as office supplies, branded promotional products, background checks, employee perquisites and more. The program leverages the collective buying power of Coupa customers to offer potential savings opportunities. Similarly, the Coupa Source Together program offers customers the ability to pool spend for bespoke sourcing events, driving better outcomes across price, quality, and terms.
Coupa Community Collaboration
Our Community Collaboration capabilities connect industry practitioners across companies to foster best practice knowledge sharing and mutually beneficial relationships in the BSM space. These capabilities are embedded throughout our platform and include, for example: informative discussion forums surfaced in-context to users as they make spend decisions within Coupa; an exchange for companies to share and download forms and content from across the community; and a spend matchmaking capability that automatically recommends connections with community experts to provide input or work together on a sourcing event, among others. These capabilities, combined with the scale of Coupa’s customer base and the volume of educational content and programming produced on Coupa for the entire BSM community, produce a network effect that enables us to provide more value to our customers.
Coupa Community Intelligence
Our Community Intelligence capability, which extends across our BSM platform, provides information to Coupa customers by applying artificial intelligence-powered analysis to the structured, normalized data collected from the comprehensive set of business spend transactions that have occurred on the Coupa platform. This innovative analysis provides Coupa customers with prescriptive recommendations to optimize their spend decisions, improve operational efficiency, and reduce risk based on best practices from the Coupa community. Participating customers are able to contribute to and benefit from Community Intelligence, with use cases spanning various areas of spend management, including: Supplier Insights and Supplier Risk Management which help companies evaluate and reduce the risk levels of suppliers; operational insights which help businesses measure their own performance on key operational metrics against other Coupa customers and follow best practices to drive efficiency and savings, Commodity and Procurable Insights which help companies identify spend consolidation and savings opportunities, and Spend Guard, which leverages artificial intelligence on behavior patterns to automatically surface potential errors and fraud across all business spend.
Key Benefits to Businesses
•Rapid time to value through fast deployment cycles and low cost of ownership of a cloud-based model.
•Opportunity to achieve significant and sustainable savings that can translate into improved profitability.
•High employee adoption of our easy-to-use BSM platform, which enables better visibility into spend, allowing both procurement and sourcing professionals to better manage their time.
•Strong supplier adoption as suppliers are motivated to join our network due to ease of enablement, flexibility, and lack of supplier fees.
•Access to extensive spending data in real-time, which leads to superior decision-making that can result in significant cost savings.
•Ability to stay agile and adapt to changes in operating and regulatory environments with our easily configurable platform.
•Process efficiency improvements that allow businesses to free up valuable resources and staff who can be deployed effectively elsewhere in the organization.
•Enhanced compliance with governmental regulations through greater auditability, documentation and control of spending activity.
Key Benefits to Employees
•Intuitive and simple user experience that shields users from complexity and enables adoption of our platform with minimal training.
•Efficiency improvements as employees are more rapidly able to procure the goods and services they need to fulfill their job responsibilities.
•Mobile access from anywhere in the world.
•Convenience to employees, as our platform gathers data on historical activity and leverages the insights to help populate requests and minimize data entry.
•Faster reimbursement to employees due to more efficient expense management processes.
Key Benefits to Suppliers
•Participating in our Coupa Open Business Network, which allows suppliers to display their information and catalog of products and services on our platform for existing and prospective customers.
•Fast registration process and flexibility to interact with customers through the Coupa Supplier Portal, direct integration or simply by use of direct email.
•Elimination of manual processes and efficiency improvements through electronic invoicing and streamlined procurement and payment processes.
•Real-time visibility into invoice status, often through direct push notifications without having to log in to a portal.
•Seamless audit, documentation and archiving of electronic purchase orders and invoices that helps suppliers comply with changing government regulations, as well as avoid risks.
Sales and Marketing
We sell our software applications through our direct sales organization and our partner program, Coupa Partner Connect. Our direct sales team is global and comprised of inside sales and field sales personnel who are organized by geography, account size, and application type.
We generate customer leads, accelerate sales opportunities, and build brand awareness through our marketing programs, including such programs with our strategic relationships. For example, we have joint marketing programs and sponsorship agreements with KPMG, Deloitte, and Accenture.
Our principal marketing programs include:
•our annual Coupa Inspire conferences which are held in multiple jurisdictions and over multiple days to connect customers, disseminate best practices, and reinforce our brand among existing and new customers. As a result of the COVID-19 pandemic, we replaced our 2020 in-person Inspire conference with web-based events for our customers, prospects, and partners;
•field marketing events for customers and prospective customers;
•development of our ideal customer profile (ICP), which helps identify the accounts with the highest propensity to buy, for each of our sales segments;
•programmatic account-based marketing and field efforts in close partnership with sales to target the ICP accounts in our respective sales segments;
•territory development representatives who respond to incoming leads to convert them into new sales opportunities;
•participation in, and sponsorship of, user conferences, executive events, trade shows, and industry events;
•focused cross-channel campaigns with existing customers to drive expansion;
•public relations, industry analyst relations, and social media initiatives;
•thought leadership development in the form of books, blogs, and third-party content;
•integrated marketing campaigns, including direct e-mail, online web advertising, blogs, and webinars;
•cooperative marketing efforts with partners, including joint press announcements, joint trade show activities, channel marketing campaigns, and joint seminars;
•customer programs, including regional user group meetings; and
•use of our website to provide application and company information, as well as learning opportunities for potential customers.
Recent Acquisitions
•In May 2020, we acquired all of the equity interest in ConnXus, Inc. (“ConnXus”), a cloud-based supplier relationship management platform that enables enterprises, health systems and government agencies to monitor all aspects of their supplier diversity compliance programs. The purchase consideration was approximately $10.0 million in cash of which approximately $1.4 million is being held back by us for fifteen months after the transaction closing date.
•In June 2020, we acquired all of the equity interest in Bellin Treasury International GmbH (“Bellin”), a cloud-based treasury management software platform that improves visibility and control over cash and optimizes treasury processes. The purchase consideration was approximately $121.0 million, comprised of $79.1 million in cash (of which $8.0 million is being held in escrow for eighteen months after the transaction closing date) and 186,300 shares of our common stock with a fair value of approximately $41.8 million as of the transaction close date.
•In September 2020, we acquired all of the equity interest in Much-Net GmbH ("Much-Net"), a financial instrument software and service provider that specializes in risk management. The purchase consideration was approximately $4.3 million in cash, which is net of $1.8 million in cash acquired.
•In November 2020, we completed the acquisition of Laurel Parent Holdings, Inc. and its subsidiaries ("LLamasoft"), a supply chain design and analysis software and solutions company. The acquisition strengthens Coupa’s supply chain capabilities, enabling businesses to drive greater value through Business Spend Management. In connection with the acquisition, we issued approximately 2.4 million shares of our common stock and paid aggregate cash of approximately $791.5 million. Approximately $15.0 million of the cash paid is being held in escrow for fifteen months after the transaction closing date as security for the former LLamasoft stockholders' indemnification obligations, and approximately $7.5 million of the cash paid is being held in escrow until the completion of final adjustment on the purchase consideration.
•In February 2021, we completed the acquisition of Pana Industries, Inc. ("Pana"), a corporate travel booking solution company that puts an emphasis on the traveler experience. In connection with the completion of the acquisition, we paid aggregate cash of approximately $48.5 million, and issued 23,822 shares of our common stock.
Partnerships and Strategic Relationships
As a core part of our strategy, we have developed an ecosystem of partners to extend our sales capabilities and coverage, to broaden and complement our application offerings, and to provide a broad array of services that lie outside of our primary areas of focus.
Our partnerships increase our ability to grow and scale quickly and efficiently and allow us to maintain greater focus on executing against our strategy.
•Referral Partners. Our referral partners provide global, national and regional expertise in business spend management, procurement and expense management. They help organizations through operational transformation by leveraging process, best practices and new technology. These partners may refer customer prospects to us and assist us in selling to them. In return, we typically pay these partners a percentage of the first-year subscription revenue generated by the customers they refer.
•Implementation Partners. In order to offer the full breadth of implementation services, change management, and strategic consulting services to our customers, we work with leading global systems integrators such as Accenture, Deloitte and KPMG, as well as boutique and regional consulting firms. Our strategy is to enable the majority of our projects to be led by implementation partners with additional specialized support from us. Our implementation partners are highly skilled and trained by our team. When working with implementation partners, we are typically in a “co-sell” arrangement where we will sell our subscription directly to the customer and our partner will sell its implementation services directly to the customer.
•Reseller Partners. Our reseller partners enhance our customer impact and extend our global presence with integrated technologies, applications, business process outsourcing (BPO) services and region-specific offerings. All of our reseller partners have been trained to demonstrate and promote our applications suites.
•Financial Services Company Partners. Our financial services company partners provide deep expertise as well as transactional solutions for executing payments. Partners include leading card issuers American Express, Barclaycard, Citibank, PayPal, J.P. Morgan Chase, and money-movement provider Transfermate, as well as others. These partner-provided solutions let customers use their existing bank relationships to move money globally.
•Technology Partners. Our technology partners provide market-leading technology, complementary products and infrastructure-related services that power and extend our suite of cloud-based business spend management applications. Our technology partners span a wide range of solutions providers including MuleSoft, Dell, Egencia, and DocuSign that enhance the capabilities of our platform by facilitating integrations that can deliver a higher level of value to customers. As a core part of our strategy, we have developed an ecosystem of partners to extend our sales capabilities and coverage, to broaden and complement our application offerings and to provide a broad array of services that lie outside of our primary areas of focus.
Technology Infrastructure and Operations
The technologies used to build our platform and modules are cloud-native and designed to scale to millions of users. We utilize a modern technology stack to take advantage of advancements in web design, open-source technologies, scalability and security. We have implemented industry-standard security practices to help us protect our customers’ critical information.
We have partnered with leading hosting and infrastructure companies to provide the hardware and infrastructure to support our BSM platform. With these partnerships, we are able to easily scale the service during peak load periods, allowing us to continuously add users and customers without significant downtime or lead-time to procure new capacity. We also have the ability to offer our solutions globally across various different physical locations, such as the U.S., Europe and Asia-Pacific.
Research and Development
Our ability to compete depends in large part on our continuous commitment to research and development, and our ability to rapidly introduce new applications, technologies, features and functionality. Our research and development organization is responsible for the design, development, testing and certification of our applications. We focus our efforts on developing new applications and core technologies and further enhancing the usability, functionality, reliability, performance and flexibility of existing applications.
Competition
We believe the overall market for BSM software is highly competitive, marked by rapid consolidation, fragmented, and rapidly evolving due to technological innovations. We have been recognized, however, as a technology and market leader.
Our main competitors fall into the following categories:
•Large enterprise software vendors such as Oracle Corporation, SAP AG and Workday that predominantly focus on database and ERP software solutions;
•Niche software vendors that either address only a portion of the capabilities we provide or predominantly focus on narrow industry verticals.
We believe the principal competitive factors in our market include the following:
•focus on customer success;
•ability to deliver measurable value and savings;
•ability to offer a comprehensive BSM platform;
•ease of use;
•widespread adoption by users;
•time to deployment;
•cloud-based architecture;
•total cost of ownership;
•configurability and agility;
•rich reporting capabilities;
•product extensibility and ability to integrate with other technology infrastructures;
•independence;
•adoption by suppliers;
•ability to deliver prescriptive insights based on aggregated, anonymized data;
•ability to leverage extensive data to detect supplier and employee risk; and
•community-driven collaboration and savings opportunities.
We believe that we compare favorably on the basis of these factors. However, many of our competitors have greater financial, technical and other resources, greater brand recognition and larger sales and marketing budgets; therefore, we may not compare favorably with respect to some or all of the factors above.
Intellectual Property
We rely on a combination of trade secrets, patents, copyrights and trademarks, as well as contractual protections, to establish and protect our intellectual property rights. While we have obtained or applied for patent protection for some of our intellectual property, we do not believe that we are materially dependent on any one or more of our patents. We require our employees, consultants and other third parties to enter into confidentiality and proprietary rights agreements and control access to software, documentation and other proprietary information.
We pursue the registration of domain names, trademarks, and service marks in the United States and in various jurisdictions outside the United States. We also actively seek patent protection covering inventions originating from our company.
We control access to and use of our proprietary technology and other confidential information through the use of internal and external controls, including contractual protections with employees, contractors, customers, and partners, and our software is protected by U.S. and international intellectual property laws. Our policy is to require employees and independent contractors to sign agreements assigning to us any inventions, trade secrets, works of authorship, developments and other processes generated by them on our behalf and agreeing to protect our confidential information. In addition, we generally enter into confidentiality agreements with our vendors and customers. We also control and monitor access to, and distribution of our software, documentation, and other proprietary information.
Despite our efforts to protect our proprietary technology and our intellectual property rights, unauthorized parties may attempt to copy or obtain and use our technology to develop applications with the same functionality as our applications. Policing unauthorized use of our technology and intellectual property rights is difficult. In addition, we intend to expand our international operations, and effective protection of our technology and intellectual property rights may not be available to us in every country in which our software or services are available.
We and others in our industry have been, and we expect that we will continue to be, subject to third-party infringement claims as the number of competitors grows and the functionality of applications in different industry segments overlaps. Moreover, many of our competitors and other industry participants have been issued patents and/or have filed patent applications, and have asserted claims and related litigation regarding patent and other intellectual property rights. From time to time, third parties, including certain of these companies, have asserted patent, copyright, trademark, trade secret and other intellectual property rights within the industry. Any of these third parties might make a claim of infringement against us at any time.
Our Customers
As of January 31, 2021, we have over 2,000 customers that are doing business in more than 60 countries and our products are offered in more than 30 languages. We generally define a customer as a separate and distinct entity (such as a company or an educational or government institution), a distinct business unit of a large corporation or a partner organization, in each case that have an active contract with us to access our services. Our customers include leading businesses in a diverse set of industries, including healthcare and pharmaceuticals, retail, financial services, manufacturing, and technology.
Human Capital
We are committed to fostering a diverse and inclusive workplace that attracts and retains exceptional talent through ongoing employee development, comprehensive compensation and benefits, and a focus on health, safety and employee well-being. As of January 31, 2021, we had 2,615 full-time employees globally, of which 1,347 work in the U.S. and 1,268 work in our international locations. Coupa was ranked in the top 50 of Fortune's "100 Best Medium Workplaces" for 2020.
Culture and Values
Coupa’s culture plays a critical role in guiding how we identify, develop and deploy our human capital resources. We have built our culture around three principles:
•Ensure customer success
•Focus on results
•Strive for excellence
We believe these principles set clear expectations for those who join our community; help ensure our employees are working towards the same goals; and guide how we treat one another, our customers, and the communities we serve.
We conduct an annual employee survey to better understand and improve the employee experience. Part of the survey seeks to measure the extent to which these three principles have been adopted by our workforce. In 2020, 88% of our global employees participated in our annual survey, 97% of our employees believe the organization works hard to ensure customer success, 98% believe there is a strong focus on results, and 97% are encouraged to strive for excellence day to day.
Diversity, Equity and Inclusion
We believe that diversity and inclusion must be embedded into the way that we do business. Our aim is to ensure that our employees feel a strong sense of belonging and are comfortable bringing their authentic selves to work every day, and our employee resource groups help support that. These groups consist of volunteer Coupa employees who provide personal and professional support to our diverse communities, beyond the scope of their core job duties. Our employee resource groups include the following:
Coupa Empower. Empower's mission is to break down barriers to women’s success by creating a community of individuals and organizations working together to unleash the impact of women in business. The three pillars of Empower are as follows:
•Discover. Focused on the individual, Discover provides development tools for career growth to build a gender balanced pool of leaders who can create and sustain a positive culture.
•Connect. Focused on driving company initiatives, Connect partners with other organizations to expand beyond its existing internal network to develop bonds and impact change across our shared ecosystem of women's leadership.
•Impact. Focused on the community we live in and the world around us, Impact provides opportunities to work with socially responsible programs and organizations that benefit the global community.
Coupa Illuminate. Illuminate’s purpose is to support our LGBTQ+ community by inspiring connection, inclusiveness, and diversity. We respect gender fluidity and non-traditional family units, advocate for equality and fairness, and foster opportunities for stewardship and growth in our local communities.
Coupa Engage. Engage stands to uplift and expand the underrepresented community at Coupa. This group provides a personal and professional platform to support colleagues of color to network and form closer relationships with allies within the company. This group sets its principles on three major pillars: leadership development, inclusion and equity, and community enrichment.
Growth and Development
We foster a learning culture where employees are empowered to drive their career progression and professional development. Our Coupa University platform provides our employees with access to a wide range of training and development programs, as well as virtual learning resources on-demand to help them excel in their careers. Employees may also participate in our student loan repayment assistance program to help pay off their student loans faster.
Compensation and Benefits Program
Our compensation program is designed to attract and reward talented individuals who possess the skills necessary to support our business objectives, assist in the achievement of our strategic goals and create long-term value for our stockholders. We provide employees with compensation packages that typically include base salary, annual incentive bonuses, and long-term equity awards that vest subject to continued service. We also offer an employee stock purchase plan which allows our employees to contribute a portion of their wages towards the purchase of our stock at a discount. During the year ended January 31, 2021, our overall ESPP participation rate was approximately 80% which remains strong relative to the global benchmark. We believe that a compensation program with both short-term and long-term incentives provides fair and competitive compensation and aligns employee and stockholder interests. In addition to cash and equity compensation, we also offer employees benefits such as life and health (medical, dental and vision) insurance, paid time off, paid parental leave, and a 401(k) plan.
Health, Safety and Wellness
We believe we maintain a high-quality work environment, and we strive to provide a safe and healthy workplace for all employees. We endeavor to comply with applicable local laws and regulations regarding workplace safety, including recognition and control of workplace hazards, tracking injury and illness rates, utilizing a global travel health program, and maintaining robust emergency and disaster recovery plans. We also offer our employees with a wide range of virtual on-demand fitness programs to promote regular physical fitness.
COVID-19 Response
During the COVID-19 pandemic, our primary focus has been on the safety and well-being of our employees and their families. In the first quarter of fiscal 2021, we closed our offices globally and required our employees to work remotely. Additionally, due to concerns over risks related to travel and large gatherings, we have replaced our in-person, annual Inspire conferences and other in-person marketing events with other web-based virtual events. As the pandemic continues, the health and well-being of our workforce remains our top priority while we work to ensure the productivity and enablement of our workforce as they continue to work from home.
Corporate Social Responsibility: "Coupa Cares"
Coupa is committed to advancing our sustainable business practices and strives to drive environmental and social impact for our customers and in our communities. While we have begun building a foundation for employee volunteerism and community giving, we are in the process of developing a more comprehensive sustainability strategy and have designated a sustainability and corporate social responsibility ("CSR") program to do so. We also ensure to work cross-functionally to make progress across our various sustainability efforts.
Our recent efforts on our sustainability strategy and CSR initiatives expand our “Coupa Cares”, which is a CSR effort we launched in 2016. The core mission of Coupa Cares is to sponsor projects and initiatives that:
•are intended to improve Coupa’s social impact;
•feature measurable goals; and
•utilize the particular skills and knowledge of the Coupa workforce.
The program seeks to identify needs in local and global communities, and to take actions to address those needs. The program includes initiatives in employee volunteerism, diversity and inclusion, and education, such as building a Science, Technology, Engineering, or Math (STEM) program for local youth.
Corporate Information
We were incorporated in February 2006 in Delaware. Our principal executive offices are located at 1855 S. Grant Street, San Mateo, CA 94402, and our telephone number is (650) 931-3200. Our website address is www.coupa.com. The information on, or that can be accessed through, our website is not part of this report. We have included our website address as an inactive textual reference only.
Available Information
Our Annual Report on Form 10-K, Quarterly Reports on Form 10-Q, Current Reports on Form 8-K and amendments to reports filed pursuant to Sections 13(a) and 15(d) of the Securities Exchange Act of 1934, as amended, are available free of charge on the Investor Relations section of our website at www.coupa.com as soon as reasonably practicable after we file such material with the Securities and Exchange Commission (“SEC”). The SEC also maintains an Internet website that contains reports and other information regarding issuers, such as Coupa, that file electronically with the SEC. The SEC’s Internet website is located at http://www.sec.gov.
We have used, and intend to continue to use, our website, LinkedIn, and Twitter accounts as a means of disclosing material non-public information and for complying with our disclosure obligations under Regulation FD. We webcast our earnings calls and certain events we participate in or host with members of the investment community on our investor relations website. Additionally, we provide notifications of news or announcements regarding our financial performance, including SEC filings, investor events, press and earnings releases as part of our investor relations website.
Item 1A. Risk Factors.
A description of the risks and uncertainties associated with our business is set forth below. You should carefully consider the risks described below, as well as the other information in this Annual Report on Form 10-K, including our consolidated financial statements and the related notes and “Management’s Discussion and Analysis of Financial Condition and Results of Operations,” particularly before deciding whether to invest in our securities. The occurrence of any of the events or developments described below could materially and adversely affect our business, financial condition, results of operations and growth prospects. In such an event, the market price of our common stock could decline, and you may lose all or part of your investment. The risks described below are not the only ones we face. Additional risks and uncertainties not presently known to us or that we currently deem immaterial may also impair our business operations.
Summary Risk Factors
The following is a summary of key risk factors you should consider in connection with an investment in our common stock. You should read this summary together with the more detailed description of each risk factor under the bold and italicized subcaptions further below.
•Our business and revenue growth may be adversely impacted by the COVID-19 pandemic, and the uncertainty caused by the pandemic has made it more difficult to manage our business.
•We have a limited operating history at our current scale, which makes it difficult to predict our future operating results.
•If we fail to manage our growth effectively, we may be unable to execute our business plan, maintain high levels of service, or adequately address competitive challenges.
•We may not achieve the benefits and synergies that we had expected from our acquisitions, and our business may be adversely impacted by integration challenges, assumption of unknown or unforeseen liabilities, or our inability to retain customers.
•If we are unable to attract new customers, our revenue growth will be adversely affected.
•Because we sell our services to large enterprises with complex operating environments, we tend to encounter long and unpredictable sales cycles.
•The markets in which we participate are intensely competitive.
•Our business depends in part on our existing customers renewing their subscriptions and purchasing additional subscriptions.
•We may not be successful in expanding our marketing and sales capabilities or in developing widespread brand awareness in a cost-effective manner.
•If we lose the services of our chief executive officer or one or more of our other key employees, or if we are unable to attract and retain highly skilled employees more broadly, our business could be adversely affected.
•Our international operations and sales to customers outside the United States or with international operations expose us to risks inherent in international sales.
•Our business may be adversely impacted by foreign currency exchange rates.
•If our security measures are breached, or if we fail to prevent unauthorized access to customer data, our reputation may be harmed and we may face contractual liability as well as fines from government agencies.
•If we fail to integrate our platform with a variety of third-party technologies, our platform may become less marketable.
•Any failure to protect our intellectual property rights could impair the value of our technology and harm our brand.
•Our quarterly results may fluctuate significantly and may not fully reflect the underlying performance of our business.
•We have a history of cumulative losses, and we do not expect to be profitable for the foreseeable future.
•Changes in privacy laws, regulations, and standards may cause our business to suffer.
•Servicing our debt will require a significant amount of cash, and we may not have sufficient cash flow from our business or the ability to raise the funds necessary to settle conversions of, or to repurchase or redeem, our convertible senior notes.
•Our stock price has been subject to fluctuations, and will likely continue to be subject to fluctuations, due to factors beyond our control.
•Sales of a substantial number of shares of our common stock in the public market, or the perception that they might occur, could cause the price of our common stock to decline.
•If securities or industry analysts do not continue to publish research or if they publish inaccurate or unfavorable research about our business, our stock price and trading volume could decline.
•Delaware law, provisions in our charter documents, and provisions in the indentures for our convertible senior notes could make a merger, tender offer or proxy contest difficult, thereby depressing the trading price of our common stock.
Risks Related to COVID-19 and Global Economic Trends
We face risks related to the current COVID-19 pandemic, which could have a material adverse effect on our business and results of operations.
Aspects of our business have been and could continue to be adversely affected by the COVID-19 pandemic. Global health concerns relating to the COVID-19 pandemic continue to adversely affect the macroeconomic environment, and the pandemic has increased economic and stock market volatility and uncertainty. In response to the pandemic, government authorities have implemented measures to try to contain the virus or mitigate the harm, such as travel bans and restrictions, quarantines, shelter-in-place or stay-at-home orders, and mandatory shutdowns of non-essential businesses. These measures by government authorities may continue to remain in place for a significant period of time or even if lifted, could be reinstated at any time, and they have and may continue to adversely affect our sales activities, operations and growth prospects. These restrictions, and changes in consumer and business spending behavior prompted by the pandemic, have forced businesses in the United States and other jurisdictions to reduce or suspend their operations, lay-off employees, and in some cases shutdown operations—a pattern of global economic phenomena for which there is little precedent in modern times. Although we derive a significant portion of our revenue from sales to enterprise customers (a segment that may be more resilient to economic volatility), a prolonged downturn is likely to impact many of our enterprise customers adversely. The extent of the damage to this segment of our customer base may not be apparent as quickly as for other segments, and is likely to differ by industry.
The COVID-19 pandemic has had and may continue to have an adverse impact on us in a number of ways, any of which individually or together could have a material adverse impact on our results of operations, financial condition and growth prospects. For example, the pandemic may limit the ability of our suppliers and business partners to perform under their contracts with us, and we may not be able to find and engage additional or substitute suppliers and partners in a timely manner and on terms acceptable to us. We believe that many businesses have been and may continue to be more reluctant to invest in the purchase and implementation of a new software solution like ours in the near term because of the economic uncertainty. This trend may make it more difficult for us to acquire new customers and could lead to longer sales cycles and greater uncertainty around the timing and likelihood of closing sales opportunities to which we have already devoted meaningful time and resources. Our existing customers may reduce their subscriptions or choose not to add new users or adopt new modules at the rate we expect based on past experience. We may have difficulty collecting payment from some customers on a timely basis or at all, and we may see higher rates of bankruptcies, restructurings, dissolutions and similar events among our customer base. In addition, if our results of operations or our assessment of our growth prospects or potential for future profitability fail to meet investor and analyst expectations for any particular financial period, our stock price may experience a substantial decline, even if our revenues have increased or our margins have improved relative to past periods.
The spread of COVID-19 has caused us to modify our business practices, including restricting employee travel, mandating that all non-essential personnel work from home, prolonged closures of our offices, and cancellation of physical participation in sales activities, meetings, events and conferences. We may take further actions as may be required by government authorities or that we determine are in the best interests of our employees, customers and business partners. The COVID-19 pandemic has already created logistical challenges for our business operations, in particular those associated with the transition to an entirely remote workforce. For example, our personnel located at our headquarters in California and elsewhere in the United States and in other countries have in many cases been working from home since March of 2020. Working remotely has made our workforce more reliant on certain cloud-based communication and collaboration services, and any disruption to these services would likely have an adverse impact on employee productivity. In addition to the limitations imposed by this new work environment, many of our employees must contend with additional challenges from the COVID-19 pandemic, such as unexpected child-care and home-schooling responsibilities, among others. If significant portions of our workforce are unable to work effectively, including due to illness, quarantines, social distancing, government actions or other restrictions in connection with the COVID-19 pandemic, our operations will be further impacted.
If and when local regulations permit, we may decide to re-open one or more of our offices and allow our employees to return to work, which would create additional risks and operational challenges. We anticipate that the re-opening of our offices will require non-trivial investments in the design, implementation and enforcement of new workplace safety protocols. Furthermore, even if we re-open some of our offices, it is possible that local authorities could impose stay at home orders which would require us to close our offices in the future. These efforts may divert management attention, and the protocols may create logistical challenges for our workforce which could adversely impact employee productivity and morale. Even if we follow what we believe to be best practices, there can be no assurance that our measures will prevent the transmission of COVID-19 between workers. Any incidents of actual or perceived transmission may expose us to liability from employee claims, adversely impact employee productivity and morale, and even result in negative publicity and reputational harm.
In addition, the stock market has experienced periods of high volatility during the COVID-19 pandemic and such volatility may continue. As a result, our stock price may be adversely impacted for reasons unrelated to our performance. A decline in stock price may make it more difficult for us to raise capital on terms acceptable to us or at all.
The extent to which the COVID-19 pandemic impacts our business, results of operations and financial condition will depend on future developments, which are highly uncertain and difficult to predict, including, but not limited to, the duration and spread of the pandemic, its severity, the actions to contain the virus or address its impact, and how quickly and to what extent normal economic and operating activities can resume. To the extent the COVID-19 pandemic adversely affects our business, results of operations and financial condition, it may also have the effect of heightening many of the other risks described in this “Risk Factors” section. Even after the pandemic has subsided, we may continue to experience an adverse impact to our business as a result of its global economic impact, including any recession that has occurred or may occur in the future. For the reasons discussed above and others that we may not have foreseen, we expect that the pandemic will have adverse impacts to aspects of our business in the near term, any of which individually or together may have a material adverse impact on our results of operations, financial condition, growth prospects and stock price.
Weakened global economic conditions, including those from the recent COVID-19 pandemic, may harm our industry, business and results of operations.
Our overall performance depends in part on worldwide economic conditions. Global financial developments, downturns and global health crises or pandemics seemingly unrelated to us or the enterprise software industry may harm us, including disruptions or restrictions on our employees’ ability to work and travel. The United States and other key international economies have been affected from time to time by falling demand for a variety of goods and services, restricted credit, poor liquidity, reduced corporate profitability, volatility in credit, equity and foreign exchange markets, bankruptcies, outbreaks of COVID-19 and the resulting impact on business continuity and travel, and overall uncertainty with respect to the economy, including with respect to tariff and trade issues. In particular, the economies of countries in Europe continue to experience some instability as a result of “Brexit,” the United Kingdom’s decision to exit the European Union. While the UK and the European Union reached a Trade Cooperation Agreement in December 2020, the impact of Brexit depends on the implementation of this agreement, as well as the terms of the UK’s future trade agreements with other countries and such impact may not be fully realized for several years or more. We are unable to predict how and to what extent Brexit will impact our business and operating results. We have operations, as well as current and potential new customers, throughout most of Europe. If economic conditions in Europe and other key markets for our platform continue to remain uncertain or deteriorate further as a result of COVID-19 or otherwise, many customers may delay or reduce their information technology spending.
Our overall performance depends in part on worldwide economic conditions. Global financial developments, downturns and global health crises or pandemics seemingly unrelated to us or the enterprise software industry may harm us, including disruptions or restrictions on our employees’ ability to work and travel. The United States and other key international economies have been affected from time to time by falling demand for a variety of goods and services, restricted credit, poor liquidity, reduced corporate profitability, volatility in credit, equity and foreign exchange markets, bankruptcies, outbreaks of COVID-19 and the resulting impact on business continuity and travel, and overall uncertainty with respect to the economy, including with respect to tariff and trade issues. In particular, the economies of countries in Europe have been experiencing weakness associated with high sovereign debt levels, weakness in the banking sector and uncertainty over the future of the Euro zone, including instability as a result of “Brexit,” the United Kingdom’s decision to exit the European Union. We are unable to predict how and to what extent Brexit will impact our business and operating results. We have operations, as well as current and potential new customers, throughout most of Europe. If economic conditions in Europe and other key markets for our platform continue to remain uncertain or deteriorate further as a result of COVID-19 or otherwise, many customers may delay or reduce their information technology spending.
The growth of our revenues and potential profitability of our business depends on demand for platform and modules generally, and business spend management specifically. In addition, our revenues are dependent on the number of users of our modules. Historically, during economic downturns there have been reductions in spending on enterprise software as well as pressure for extended billing terms or pricing discounts, which would limit our ability to grow our business and negatively affect our operating results. These conditions affect the rate of enterprise software spending and could adversely affect our customers’ ability or willingness to subscribe to our platform, delay prospective customers’ purchasing decisions, reduce the value or duration of their subscriptions or affect renewal rates, all of which could harm our operating results. While it remains a developing situation, the COVID-19 pandemic and resulting quarantines, restrictions on travel and business disruptions with respect to us, our customers or partners are adversely affecting our business. Although we are continuing to monitor and assess the effects of the COVID-19 pandemic on our business, the ultimate impact of the COVID-19 pandemic is highly uncertain and subject to change.
Risks Related to Our Growth
We have a limited operating history at our current scale, which makes it difficult to predict our future operating results.
We were incorporated in 2006 and introduced our first cloud-based software solution shortly thereafter. Over time we have invested in building a comprehensive, integrated platform of business spend management (“BSM”) services, partly through business acquisitions, and in marketing, selling and supporting this platform. Although in recent years we have grown our annual revenues each year at a substantial rate, our historical revenue growth should not be considered indicative of our future performance. Further, in future periods, our revenue growth could slow or our revenues could decline for a number of reasons, including any reduction in demand for our platform, increased competition, contraction of our overall market, international or domestic economic instability, downturns or other events, such as the COVID-19 pandemic, our inability to accurately forecast demand for our platform or our failure, for any reason, to capitalize on growth opportunities.
As a result of our limited operating history, our ability to forecast our future operating results is limited and subject to a number of uncertainties, including our ability to plan for and model future growth. We have encountered and will encounter risks and uncertainties frequently experienced by growing companies in rapidly changing industries, such as the risks and uncertainties described in this report. If our assumptions regarding these risks and uncertainties (which we use to plan our business) are incorrect or change, or if we do not address these risks successfully, our operating and financial results could differ materially from our expectations and our business could suffer.
We have experienced rapid growth and expect our growth to continue and if we fail to manage our growth effectively, we may be unable to execute our business plan, maintain high levels of service or adequately address competitive challenges.
We have experienced a rapid growth in our business, headcount and operations in recent years. We anticipate that we will continue to expand our operations and headcount, including internationally, in the near future. This growth has placed, and future growth will place, a significant strain on our management, administrative, operational and financial infrastructure. Our success will depend in part on our ability to manage this growth effectively. Although our business has experienced significant growth, we cannot provide any assurance that our business will continue to grow at the same rate or at all. The rapid growth in our headcount and operations has placed and will continue to place significant demands on our management and our operational and financial infrastructure. As we continue to grow, we must effectively integrate, develop and motivate a large number of new employees, while maintaining the effectiveness of our business execution and the beneficial aspects of our corporate culture. In particular, we intend to continue to make directed and substantial investments to expand our research and development, sales and marketing, and general and administrative organizations, as well as our international operations.
To effectively manage growth, we must continue to improve our operational, financial and management controls, risk management activities, and our reporting systems and procedures by, among other things:
•improving our key business applications, processes and IT infrastructure to support our business needs;
•enhancing information and communication systems to ensure that our employees and offices around the world are well-coordinated and can effectively communicate with each other and our growing base of customers and channel partners;
•enhancing our internal controls to ensure timely and accurate reporting of all of our operations and financial results;
•appropriately documenting our IT systems and our business processes; and
•continuing to expand our risk management activities to keep up with the growth in our relationships with partners, acquired companies, customers, suppliers, employees, and other internal and external constituencies.
The systems enhancements and improvements necessary to support our business as we continue to scale will require significant capital expenditures and allocation of valuable management and employee resources. If we fail to implement these improvements effectively, our ability to manage our expected growth, ensure uninterrupted operation of key business systems and comply with the rules and regulations that are applicable to public reporting companies will be impaired. Additionally, failure to effectively manage growth could result in difficulty or delays in deploying customers, declines in quality or customer satisfaction, increases in costs, difficulties in introducing new features and/or other operational difficulties, any of which could adversely affect our business performance and results of operations.
Acquisitions could be difficult to identify, pose integration challenges, divert the attention of management, disrupt our business, dilute stockholder value, and adversely affect our operating results and financial condition.
We have in the past acquired and may in the future seek to acquire or invest in businesses, products or technologies that we believe could complement or expand our platform, enhance our technical capabilities or otherwise offer growth opportunities. For example, we acquired LLamasoft, Inc. in November 2020, Bellin Treasury International GmbH in June 2020, ConnXus, Inc. in May 2020, Yapta, Inc. in December 2019 and Exari Group, Inc. in May 2019. Acquisitions may disrupt our business, divert our resources and require significant management attention that would otherwise be available for development of our existing business.
In addition, we may not be able to integrate the acquired personnel, operations and technologies successfully, or effectively manage the combined business following the acquisition. We also may not achieve the anticipated benefits from the acquired business due to a number of factors, including:
•inability to integrate or benefit from acquired technologies or services in a profitable manner;
•unanticipated costs, accounting charges or other liabilities associated with the acquisition;
•incurrence of acquisition-related costs;
•difficulty integrating the accounting systems, internal controls, operations and personnel of the acquired business;
•difficulties and additional expenses associated with supporting legacy products and hosting infrastructure of the acquired business, including due to language, geographical or cultural differences;
•difficulty fulfilling the contractual obligations or expectations of customers of acquired businesses or converting the customers of the acquired business onto our platform and contract terms, including disparities in the revenues, licensing, support or professional services model of the acquired company;
•adverse effects to our existing business relationships with business partners and customers as a result of the acquisition;
•the potential loss of key employees;
•use of resources that are needed in other parts of our business; and
•use of substantial portions of our available cash to consummate the acquisition.
In addition, a significant portion of the purchase price of companies we acquire may be allocated to acquired goodwill and other intangible assets. In connection with our acquisition of LLamasoft, for example, $932.9 million of the purchase price was allocated to goodwill, increasing our total goodwill balance to $1.5 billion as of January 31, 2021, which is roughly three times the amount of goodwill we had as of January 31, 2020. Goodwill must be assessed for impairment at least annually, and other intangible assets are assessed for impairment whenever events or changes in circumstances indicate that the carrying amount may not be recoverable. In the future, if our acquisitions do not yield expected returns, we may be required to take charges to our operating results based on this impairment assessment process, which could adversely affect our results of operations. In addition, our exposure to risks associated with various claims, including the use of intellectual property, may be increased as a result of acquisitions of other companies. For example, we may have a lower level of visibility into the development process with respect to intellectual property or the care taken to safeguard against infringement risks with respect to the acquired company or technology. In addition, third parties may make infringement and similar or related claims after we have acquired technology that were not asserted prior to our acquisition. Acquisitions could also result in dilutive issuances of equity securities or the incurrence of debt, which could adversely affect our operating results. In connection with the LLamasoft acquisition, for example, we issued approximately 2.4 million shares of our common stock as consideration, which represented over 3% of our outstanding shares of common stock at that time. In addition, if the performance of an acquired business fails to meet our expectations, our operating results, business and financial position may suffer.
If we cannot maintain our company culture as we grow, we could lose the innovation, teamwork, passion and focus on execution that we believe contribute to our success and our business may be harmed.
We believe that a critical component of our success has been our company culture, which is based on our core values of ensuring customer success, focusing on results and striving for excellence. We have invested substantial time and resources in building our team within this company culture. As we grow, we may find it difficult to maintain these important aspects of our company culture. If we fail to preserve our culture, our ability to retain and recruit personnel and to effectively focus on and pursue our corporate objectives could be compromised, potentially harming our business.
Risks Related to Our Business and Industry
If we are unable to attract new customers, the growth of our revenues will be adversely affected.
To increase our revenues, we have historically depended more on the addition of new customers to our platform, particularly large enterprise customers, than on increasing the number of users at existing customers or selling additional modules to them. The expansion of our customer base is critical to our ability to continue the growth of our revenues. If we do not grow our customer base, our revenues will slow in future periods or will start to decline, as a result of customers not renewing. This is particularly true for us because we are typically able to capture a majority of the expected annual recurring revenue opportunity at the inception of our customer relationships, rather than targeting specific power users at the outset of the customer relationship with the intention of expanding and capturing more annual recurring revenue at later stages of the customer relationship.
If competitors introduce lower cost and/or differentiated products or services that are perceived to compete with ours or are better able to adapt to changing market conditions, our ability to sell based on factors such as pricing, technology and functionality could be impaired. As a result, we may be unable to attract new customers at rates or on terms that would be favorable or comparable to prior periods, which could have an adverse effect on the growth of our revenues.
Because our platform is sold to large enterprises with complex operating environments, we encounter long and unpredictable sales cycles, which could adversely affect our operating results in a given period.
Our ability to increase revenues and achieve profitability depends, in large part, on our ability to continue to attract large enterprises to our platform and grow this segment of our customer base. We expect to continue to focus a substantial portion of our sales efforts on these customers in the near future. Accordingly, we will continue to face greater costs, longer sales cycles and less predictability in completing some of our sales, than would be expected from selling to a predominantly small business or midmarket target customer base. A delay in or failure to close a large sale to one or more prospective new customers could cause us to fail to meet the expectations of management or analysts, harm our business and financial results, and cause our financial results to vary significantly from period to period.
Our typical sales cycle ranges from three to nine months. The wide range reflects a number of timing factors that can vary significantly between prospective customers, many of which we cannot control, including:
•customers’ budgetary constraints and priorities;
•the timing of customers’ budget cycles;
•the need by some customers for lengthy evaluations; and
•the length and timing of customers’ approval processes.
In addition, as a result of the recent COVID-19 pandemic, many local governments as well as enterprises have limited travel and in-person meetings and implemented other restrictions that are making the sales process more lengthy and difficult, particularly for new customers.
Large enterprises tend to have more complex operating environments than smaller businesses, making it more difficult and time-consuming for us to demonstrate the value of our platform to these prospective customers. In the large enterprise market, the customer’s decision to use our platform may be an enterprise-wide decision; therefore, these types of sales require us to provide greater levels of education regarding the use and benefits of our platform, which causes us to expend substantial time, effort and money educating them as to the value of our platform. In addition, we have no assurance that a prospective customer will ultimately purchase any services from us at all, regardless of the amount of time or resources we have spent on the opportunity. For example, our target customer may decide in the end to purchase software from one of our larger, more established competitors because they are unsure about moving forward with a newer and less well-known brand such as ours.
As a result of the variability and length of the sales cycle, we have only a limited ability to forecast the timing of sales, and our results of operations may differ from expectations.
The markets in which we participate are intensely competitive, and if we do not compete effectively, our operating results could be adversely affected.
The market for business spend management software is highly competitive, with relatively low barriers to entry for some software or service organizations. Our competitors include Oracle Corporation (“Oracle”), SAP AG (“SAP”) and Workday, Inc. (“Workday”), well-established providers of enterprise resource planning solutions, including BSM software, that have long-standing relationships with many customers. Some customers may be hesitant to switch or to adopt cloud-based software such as ours for this part of their business and prefer to maintain their existing relationships with their legacy software vendors. Oracle, SAP and Workday are larger and have greater name recognition, longer operating histories, larger marketing budgets and significantly greater resources than we do. These vendors, as well as other competitors, may offer business spend management software on a standalone basis at a low price or bundled as part of a larger product sale. In order to take advantage of customer demand for cloud-based software, legacy vendors are expanding their cloud-based software through acquisitions and organic development. Legacy vendors may also seek to partner with other leading cloud providers. We also face competition from custom-built software vendors and from vendors of specific applications, some of which offer cloud-based solutions.
We may also face competition from a variety of vendors of cloud-based and on-premise software products and point solutions that may have some of the core functionality of our BSM services (such as procure-to-pay) but that address only a portion of the capabilities and features of our platform. In addition, other companies that provide cloud-based software in different target markets may develop software or acquire companies that operate in our target markets, and some potential customers may elect to develop their own internal software. With the introduction of new technologies and market entrants, we expect this competition to intensify in the future.
Some of our competitors are able to devote greater resources to the development, promotion and sale of their products and services. Furthermore, our current or potential competitors may be acquired by third parties with greater available resources and the ability to initiate or withstand substantial price competition. In addition, many of our competitors have established marketing relationships, access to larger customer bases and major distribution agreements with consultants, system integrators and resellers. Our competitors may also establish cooperative relationships among themselves or with third parties that may further enhance their product offerings or resources. If our platform does not become more accepted relative to our competitors’, or if our competitors are successful in bringing their products or services to market earlier than ours, or if their products or services are more technologically capable than ours, then our revenues could be adversely affected. In addition, some of our competitors may offer their products and services at a lower price. If we are unable to achieve our target pricing levels, our operating results will be negatively affected. Pricing pressures and increased competition could result in reduced sales, reduced margins, losses or a failure to maintain or improve our competitive market position, any of which could adversely affect our business.
Our business depends significantly on our customers renewing their subscriptions. Any decline in our customer renewals would harm our future operating results.
In order for us to maintain or improve our operating results, it is important that our customers renew their subscriptions when the initial contract term expires and, to a lesser extent, that they add additional authorized users and additional business spend management modules to their subscriptions. Our customers have no obligation to renew their subscriptions, and we cannot assure you that our customers will renew subscriptions with a similar contract period or with the same or a greater number of authorized users and modules. Some of our customers have elected not to renew their agreements with us, and we may not be able to accurately predict renewal rates.
Our renewal rates may decline or fluctuate as a result of a number of factors, including our customers’ satisfaction with our subscription service, our professional services, our customer support, our prices and contract length, the prices of competing solutions, mergers and acquisitions affecting our customer base, the effects of global economic conditions or reductions in our customers’ spending levels. Our future success also depends in part on our ability to add additional authorized users and modules to the subscriptions of our current customers. If our customers do not renew their subscriptions, renew on less favorable terms or fail to add more authorized users or additional business spend management modules, our revenues may decline, and we may not realize improved operating results from our customer base.
Our customers may fail to pay us in accordance with the terms of their agreements, necessitating action by us to compel payment.
We typically enter into multiple year, non-cancelable arrangements with our customers. If customers fail to pay us under the terms of our agreements, we may be adversely affected both from the inability to collect amounts due and the cost of enforcing the terms of our contracts, including litigation. The risk of such negative effects increases with the term length of our customer arrangements. Furthermore, some of our customers may seek bankruptcy protection or other similar relief and fail to pay amounts due to us, or pay those amounts more slowly, either of which could adversely affect our operating results, financial position and cash flow. The recent and ongoing global COVID-19 pandemic may also increase the likelihood of these risks.
If we fail to develop widespread brand awareness cost-effectively, our business may suffer.
We believe that developing and maintaining widespread awareness of our brand in a cost-effective manner is critical to achieving widespread acceptance of our platform and attracting new customers. For example, widespread awareness of our brand is critical to ensuring that we are invited to participate in requests for proposals from prospective customers. Our success in this area will depend on a wide range of factors, some of which are beyond our control, including the following:
•the efficacy of our marketing efforts;
•our ability to offer high-quality, innovative and error-and bug-free modules;
•our ability to retain existing customers and obtain new customers;
•the ability of our customers to achieve successful results by using our platform;
•the quality and perceived value of our platform;
•our ability to successfully differentiate our offerings from those of our competitors;
•actions of competitors and other third parties;
•our ability to provide customer support and professional services;
•any misuse or perceived misuse of our platform and modules;
•positive or negative publicity;
•interruptions, delays or attacks on our platform or modules; and
•litigation, legislative or regulatory-related developments.
The COVID-19 pandemic and regulatory restrictions adopted in response have forced us to suspend or reduce some of our marketing activities, particularly those that require travel and in-person participation. Brand promotion activities may not generate customer awareness or increase revenues, and, even if they do, any increase in revenues may not offset the expenses we incur in building our brand. If we fail to successfully promote and maintain our brand, or incur substantial expenses in doing so, we may fail to attract or retain customers necessary to realize a sufficient return on our brand-building efforts or to achieve the widespread brand awareness that is critical for broad customer adoption of our platform.
Furthermore, negative publicity (whether or not justified) relating to events or activities attributed to us, our employees, our partners or others associated with any of these parties, may tarnish our reputation and reduce the value of our brand. Damage to our reputation and loss of brand equity could reduce demand for our platform and have an adverse effect on our business, operating results and financial condition. Moreover, any attempts to rebuild our reputation and restore the value of our brands may be costly and time consuming, and such efforts may not ultimately be successful.
Failure to effectively develop and expand our marketing and sales capabilities could harm our ability to increase our customer base and achieve broader market acceptance of our platform.
Our ability to increase our customer base and achieve broader market acceptance of our platform will depend to a significant extent on our ability to expand our marketing and sales operations, both domestically and internationally. We plan to continue expanding our direct sales force and engaging additional partners that can provide sales referrals. This expansion will require us to invest significant financial and other resources. Our business will be harmed if our efforts do not generate a corresponding increase in revenues. We may not achieve anticipated revenue growth from expanding our direct sales force if we are unable to hire and develop talented direct sales personnel, if our new direct sales personnel are unable to achieve desired productivity levels in a reasonable period of time or if we are unable to retain our existing direct sales personnel. It often takes six months or longer before our sales representatives are fully-trained and productive. We also may not achieve anticipated growth in revenues from our partners if we are unable to attract and retain additional motivated partners, if any existing or future channel partners fail to successfully market, resell, implement or support our platform for their customers, or if they represent multiple providers and devote greater resources to market, resell, implement and support the products and solutions of these other providers. For example, some of our partners also sell or provide integration and administration services for our competitors’ products, and if such partners devote greater resources to marketing, reselling and supporting competing products, this could harm our business, results of operations and financial condition.
If we cannot continue to expand the use of our platform, our ability to grow our business may be harmed and the growth rate of our revenues may decline.
Our ability to grow our business depends in part on our ability to compete in the market for the additional modules on our platform, including strategic sourcing, inventory, contracts, supplier management, spend analysis and travel optimization. Our efforts to market these other modules is relatively new and we have allocated significant resources to develop, acquire or otherwise bring to market these modules, and it is uncertain whether these other modules will ever result in significant revenues for us. While we have recently acquired businesses related to certain of these modules, there can be no assurance that these acquisitions will facilitate our efforts to market and sell these other modules in a cost-effective manner. Further, the introduction of new modules beyond these markets may not be successful.
The profitability of our customer relationships may fluctuate.
Our business model focuses on maximizing the lifetime value of our customer relationships and we need to make significant investments in order to add new customers to grow our customer base. The profitability of a customer relationship in any particular period depends in part on how long the customer has been a subscriber on our platform. In general, the upfront costs associated with new customers are higher in the first year than the aggregate revenues we recognize from those new customers in the first year.
We review the lifetime value and associated acquisition costs of our customers, as discussed further in “Management’s Discussion and Analysis of Financial Condition and Results of Operations” in this Annual Report. The lifetime value of our customers and customer acquisition costs has and will continue to fluctuate from one period to another depending upon the amount of our net new subscription revenues (which depends on the number of new customers in a period, upsells of additional modules to existing customers and changes in subscription fees charged to existing customers), gross margins (which depends on investments in and other changes to our cost of customer support and allocated overhead), sales and marketing expenses and renewal rates (which depend on our ability to maintain or grow subscription fees from customers). These amounts have fluctuated from quarter to quarter and will continue to fluctuate in the future. We may not experience lifetime value to customer acquisition cost ratios in future years or periods similar to those we have achieved to date. Furthermore, as a result of the ongoing global COVID-19 pandemic, it is possible that customers may not renew or may temporarily halt paying us, which would adversely affect our lifetime value metrics. Other companies may calculate lifetime value and customer acquisition costs differently than our chosen method and, therefore, may not be directly comparable.
Large customers often demand more configuration and integration services, or customized features and functions that we do not offer, which could adversely affect our business and operating results.
We have historically focused our sales and marketing efforts on large enterprise customers and expect this trend to continue in the near future. Large customers may demand more configuration and integration services, which generally increases our upfront investment in sales and deployment efforts—even for deployments that are handled primarily by one of our implementation partners—with no guarantee that these customers will increase the scope of their subscription in order to offset our greater upfront costs. As a result of these factors, we and our partners must devote a significant amount of sales support and professional services resources to individual customers, increasing the cost and time required to complete sales. Additionally, our platform does not currently permit customers to modify our code. If prospective customers require customized features or functions that we do not offer and that would be difficult for them to deploy themselves, then the market for our platform will be more limited and our business could suffer.
The loss of one or more of our key customers could negatively affect our ability to market our platform.
We rely on our reputation and recommendations from key customers in order to promote subscriptions to our platform. The loss of any of our key customers could have a significant impact on our revenues, reputation and our ability to obtain new customers. We may lose customers for a variety of reasons, including the decision of a business customer to commence bankruptcy proceedings, restructure itself, dissolve or otherwise cease operations. We believe the risk of such events has increased with the recent COVID-19 pandemic and further increase as the pandemic continues. In addition, acquisitions of our customers by unrelated third parties could lead to cancellation of our contracts with those customers or by the acquiring companies, thereby reducing the number of our existing and potential customers.
Contractual disputes with our customers could be costly, time-consuming and harm our reputation.
Our business is contract intensive and we are party to contracts with our customers all over the world. Our contracts can contain a variety of terms, including service levels, security obligations, indemnification and regulatory requirements. Contract terms may not always be standardized across our customers and can be subject to differing interpretations, which could result in disputes with our customers from time to time. If our customers notify us of a contract breach or otherwise dispute our contract, the resolution of such disputes in a manner adverse to our interests could negatively affect our operating results.
Our business is subject to the risks of earthquakes, fire, floods and other natural catastrophic events, and to interruption by man-made problems such as power disruptions, computer viruses, data security breaches or terrorism.
Our corporate headquarters are located in the San Francisco Bay Area, a region known for seismic activity. A significant natural disaster, such as an earthquake, fire or flood, occurring at our headquarters, at one of our other facilities, at any of our cloud hosting provider facilities, or where a business partner is located could adversely affect our business, results of operations and financial condition. For example, the rapid spread of COVID-19 globally in 2020 has resulted in travel restrictions and in some cases, prohibitions of non-essential travel, disruption and shutdown of businesses and greater uncertainty in global financial markets. Prolonged health concerns or political or governmental developments in countries in which we or our customers, partners and service providers operate could result in further economic, social or labor instability, slow our sales process, result in customers not purchasing or renewing our products or failing to make payments, and could otherwise have a material adverse effect on our business and our results of operations and financial condition. The extent to which the COVID-19 pandemic impacts our results will depend on future developments, which are highly uncertain and will include emerging information concerning the re-opening of private businesses, infection rates and the actions taken by governments and private businesses to attempt to contain and cope with COVID-19. Continued contractions in the travel and hospitality industries, along with any effects on supply chain or on other industries in which our customers or partners operate, could materially and adversely impact our business, results of operations and financial condition.
Further, if a natural disaster or man-made problem were to affect Internet Service Providers ("ISPs"), this could adversely affect the ability of our customers to use our products and platform. Although we maintain incident management and disaster response plans, in the event of a major disruption caused by a natural disaster or man-made problem, we may be unable to continue our operations and may endure system interruptions, reputational harm, delays in our development activities, lengthy interruptions in service, breaches of data security and loss of critical data, any of which could adversely affect our business, results of operations and financial condition.
Our growth depends in part on the success of our strategic relationships with third parties.
We have established strategic relationships with a number of other companies. In order to grow our business, we anticipate that we will continue to establish and maintain relationships with third parties, such as implementation partners, system integrator partners and technology providers. Identifying partners, and negotiating and documenting relationships with them, requires significant time and resources. Our competitors may be effective in providing incentives to third parties to favor their products or services or to prevent or reduce subscriptions to our services. In addition, acquisitions of our partners by our competitors could result in a decrease in the number of our current and potential customers, as our partners may no longer facilitate the adoption of our platform by potential customers.
If we are unsuccessful in establishing or maintaining our relationships with third parties, our ability to compete in the marketplace or to grow our revenues could be impaired and our operating results could suffer. Even if we are successful in our strategic relationships, we cannot assure you that these relationships will result in increased customer usage of our platform or increased revenues.
Our estimates of market opportunity and forecasts of market growth that we have publicly disclosed may prove to be inaccurate, and even if the market in which we compete achieves the forecasted growth, our business could fail to grow at similar rates.
Market opportunity estimates and growth forecasts are subject to significant uncertainty and are based on assumptions and estimates that may not prove to be accurate and could be adversely affected in the near term by the COVID-19 pandemic. Our estimates and forecasts relating to the size and expected growth of our market that we have publicly disclosed may prove to be inaccurate. Even if the market in which we compete meets our size estimates and forecasted growth, our business could fail to grow at similar rates.
We depend on our senior management team and the loss of our chief executive officer or one or more key employees or an inability to attract and retain highly skilled employees could adversely affect our business.
Our success depends largely upon the continued services of our key executive officers. In particular, our chief executive officer, Robert Bernshteyn, is critical to our vision, strategic direction, culture and overall business success. We also rely on our leadership team in the areas of research and development, marketing, sales, services and general and administrative functions, and on mission-critical individual contributors in research and development. From time to time, there may be changes in our executive management team resulting from the hiring or departure of executives, which could disrupt our business. We do not maintain key-man insurance for Mr. Bernshteyn or any other member of our senior management team. We do not have employment agreements with our executive officers or other key personnel that require them to continue to work for us for any specified period and, therefore, they could terminate their employment with us at any time. The loss of one or more of our executive officers or key employees could have a serious adverse effect on our business.
To execute our growth plan, we must attract and retain highly qualified personnel. Competition for these personnel is intense, especially for engineers with high levels of experience in designing and developing software for Internet-related services. We have from time to time experienced, and we expect to continue to experience, difficulty in hiring and retaining employees with appropriate qualifications. Many of the companies with which we compete for experienced personnel have greater resources than we have. If we hire employees from competitors or other companies, their former employers may attempt to assert that these employees or our company have breached their legal obligations, resulting in a diversion of our time and resources. In addition, job candidates and existing employees in the San Francisco Bay Area often consider the value of the stock awards they receive in connection with their employment. If the perceived value of our stock declines, it may adversely affect our ability to recruit and retain highly skilled employees. If we fail to attract new personnel or fail to retain and motivate our current personnel, our business and future growth prospects could be adversely affected.
Our international operations and sales to customers outside the United States or with international operations expose us to risks inherent in international sales.
A key element of our growth strategy is to expand our international operations and develop a worldwide customer base. The revenues from non-U.S. regions, as determined based on the billing address of our customers, constituted 38%, 36% and 38% of our total revenues for the fiscal years ended January 31, 2021, 2020 and 2019, respectively. Operating in international markets requires significant resources and management attention and will subject us to regulatory, economic and political risks that are different from those in the United States. While we are gaining additional experience with international operations, our international expansion efforts may not be successful in creating additional demand for our platform outside of the United States or in effectively selling subscriptions to our platform in all of the international markets we enter. There can be no assurance that we will be able to grow our combined revenues from non-U.S. regions as a percentage of our total revenues. In addition, we will face risks in doing business internationally that could adversely affect our business, including:
•the need to localize and adapt our platform for specific countries, including translation into foreign languages and associated expenses;
•data privacy laws that require customer data to be stored and processed in a designated territory;
•difficulties in staffing and managing foreign operations and working with foreign partners;
•different pricing environments, longer sales cycles and longer accounts receivable payment cycles and collections issues;
•new and different sources of competition;
•weaker protection for intellectual property and other legal rights than in the United States and practical difficulties in enforcing intellectual property and other rights outside of the United States;
•laws and business practices favoring local competitors;
•compliance challenges related to the complexity of multiple, conflicting and changing governmental laws and regulations, including employment, tax, privacy and data protection laws and regulations;
•increased financial accounting and reporting burdens and complexities;
•restrictions on the transfer of funds;
•fluctuations in currency exchange rates, which could increase the price of our products outside of the United States, increase the expenses of our international operations and expose us to foreign currency exchange rate risk;
•adverse tax consequences;
•unstable regional and economic political conditions;
•uncertainty surrounding the COVID-19 pandemic and the restrictions imposed by government authorities to combat the virus, which may impact our international operations and growth prospects differently than our operations and growth prospects in the United States due to differences in, for example, virus transmission rates, the effectiveness of government responses, the quality of the regional health care systems, and the economic resilience of the regions, among other factors; and
•the fragmentation of longstanding regulatory frameworks caused by Brexit.
As we continue to expand our business globally, our success will depend, in large part, on our ability to anticipate and effectively manage these and other risks associated with our international sales and operations. Our failure to manage any of these risks successfully, or to comply with these laws and regulations, could harm our operations, reduce our sales and harm our business, operating results and financial condition. For example, in certain foreign countries, particularly those with developing economies, certain business practices that are prohibited by laws and regulations applicable to us, such as the Foreign Corrupt Practices Act, may be more commonplace. Although we have policies and procedures designed to ensure compliance with these laws and regulations, our employees, contractors and agents, as well as channel partners involved in our international sales, may take actions in violation of our policies. Any such violation could have an adverse effect on our business and reputation.
Some of our business partners also have international operations and are subject to the risks described above. Even if we are able to successfully manage the risks of international operations, our business may be adversely affected if our business partners are not able to successfully manage these risks.
We may face exposure to foreign currency exchange rate fluctuations, which could adversely affect our business, results of operations and financial condition.
As our international operations expand, our exposure to the effects of fluctuations in currency exchange rates grows because our international contracts are sometimes denominated in local currencies, in particular with respect to the Euro, British Pound Sterling, Swedish Krona, Swiss Franc, and Australian Dollar. Over time, an increasing portion of our international contracts may be denominated in local currencies. Therefore, as exchange rates vary, revenues, cost of revenues, operating expenses and other operating results, when re-measured, may differ materially from expectations. Currently, we use foreign currency forward contracts to hedge certain exposures to fluctuations in foreign currency exchange rates, but these contracts are generally short-term in duration and we do not designate them as hedging instruments. In the future, we may use foreign currency forward and option contracts and/or other derivative instruments to hedge certain exposures to fluctuations in foreign currency exchange rates. The use of such hedging activities may not offset any or more than a portion of the adverse financial effects of unfavorable movements in foreign exchange rates over the limited time the hedges are in place. Additionally, the use of hedging instruments may introduce additional risks if we are unable to structure effective hedges with such instruments. Moreover, we anticipate growing our business further outside of the United States, and the effects of movements in currency exchange rates will increase as our transaction volume outside of the United States increases. These effects of movements in currency exchange rates could also affect our customers. A strengthening of the U.S. dollar could increase the real cost of our platform to our customers outside of the United States, which could adversely affect our business, operating results, financial condition, and cash flows.
Risks Related to Our Services and Our Platform
If our security measures are breached or unauthorized access to customer data is otherwise obtained, our platform may be perceived as not being secure, customers may reduce the use of or stop using our platform and we may incur significant liabilities.
Our platform involves the storage and transmission of customer data, including, for example, sensitive and proprietary information about our customers’ spending. We may become the target of cyber-attacks by third parties seeking unauthorized access to our data or users' data or to disrupt our platform. Computer malware, viruses, spear phishing attacks, and general hacking have become more prevalent in our industry, particularly against cloud services. Any unauthorized access or security breaches could result in the loss of sensitive customer information, litigation, fines and penalties, liability under indemnity obligations and other economic and reputational damage. While we have security measures in place that are designed to protect customer information and prevent data loss and other security breaches, if these measures are breached as a result of third-party action, employee error, malfeasance or otherwise, and someone obtains unauthorized access to our customers’ data, we could face loss of business, regulatory investigations or orders, and our reputation could be severely damaged. In addition, we could be required to expend significant capital and other resources to alleviate the problem, as well as incur significant costs and liabilities, including due to litigation, indemnity obligations, damages for contract breach, penalties for violation of applicable laws or regulations, and costs for remediation and other incentives offered to customers or other business partners in an effort to maintain business relationships after a breach.
We cannot assure you that any limitations of liability provisions in our contracts would be enforceable or adequate or would otherwise protect us from any liabilities or damages with respect to any particular claim relating to a security lapse or breach. We also cannot be sure that our existing insurance coverage will continue to be available on acceptable terms or will be available in sufficient amounts to cover one or more large claims related to a security breach, or that the insurer will not deny coverage as to any future claim. The successful assertion of one or more large claims against us that exceed available insurance coverage, or the occurrence of changes in our insurance policies, including premium increases or the imposition of large deductible or co-insurance requirements, could have a material adverse effect on our business, including our financial condition, operating results, and reputation.
Cyber-attacks and other malicious Internet-based activities continue to increase generally. Because the techniques used to obtain unauthorized access or sabotage systems change frequently and generally are not identified until they are launched against a target, we may be unable to anticipate these techniques or to implement adequate preventative measures. In addition, third parties may attempt to fraudulently induce employees or users to disclose information to gain access to our data or our customers’ data. If any of these events occur, our or our customers’ information could be accessed or disclosed improperly. Any or all of these issues could negatively affect our ability to attract new customers, cause existing customers to elect to not renew their subscriptions, result in reputational damage or subject us to third-party lawsuits, regulatory fines or other action or liability, which could adversely affect our operating results.
If we are not able to provide successful and timely enhancements, new features and modifications for our platform and modules, we may lose existing customers or fail to attract new customers and our revenues and financial performance may suffer.
If we are unable to provide enhancements and new features for our existing modules or new modules that achieve market acceptance or to integrate technology, products and services that we acquire into our platform, our business could be adversely affected. The success of enhancements, new features and modules depends on several factors, including the timely completion, introduction and market acceptance of the enhancements or new features or modules. Failure in this regard may significantly impair the growth of our revenues. We have experienced, and may in the future experience, delays in the planned release dates of enhancements to our platform, and we have discovered, and may in the future discover, errors in new releases after their introduction. Either situation could result in adverse publicity, loss of sales, delay in market acceptance of our platform or customer claims, including, among other things, warranty claims against us, any of which could cause us to lose existing customers or affect our ability to attract new customers.
We rely on Amazon Web Services to deliver our platform and modules to our customers, and any disruption in service from Amazon Web Services or material change to our arrangement with Amazon Web Services could adversely affect our business.
We rely upon Amazon Web Services (“AWS”) to operate certain aspects of our platform and any disruption of or interference with our use of AWS could impair our ability to deliver our platform and modules to our customers, resulting in customer dissatisfaction, damage to our reputation, loss of customers and harm to our business. We have architected our software and computer systems to use data processing, storage capabilities and other services provided by AWS. Currently, most of our cloud service infrastructure is run on AWS. Given this, we cannot easily switch our AWS operations to another cloud provider, so any disruption of or interference with our use of AWS would adversely affect our operations and potentially our business.
AWS provides us with computing and storage capacity pursuant to an agreement that continues until terminated by either party. AWS may terminate the agreement for cause with 30 days’ prior written notice, including any material default or breach of the agreement by us that we do not cure within the 30 day period. Additionally, AWS has the right to terminate the agreement immediately with notice to us in certain scenarios such as if AWS believes providing the services could create a substantial economic or technical burden or material security risk for AWS, or in order to comply with the law or requests of governmental entities. The agreement requires AWS to provide us their standard computing and storage capacity and related support in exchange for timely payment by us. If any of our arrangements with AWS were terminated, we could experience interruptions in our software as well as delays and additional expenses in arranging new facilities and services.
We utilize third-party data center hosting facilities operated by AWS, located in various facilities around the world. Our operations depend, in part, on AWS’s abilities to protect these facilities against damage or interruption due to a variety of factors, including infrastructure changes, human or software errors, natural disasters, power or telecommunications failures, criminal acts, capacity constraints and similar events. For instance, in February 2017, AWS suffered a significant outage in the United States that had a widespread impact on the ability of certain of our customers to fully use our modules for a small period of time. Despite precautions taken at these data centers, the occurrence of spikes in usage volume, a natural disaster, an act of terrorism, vandalism or sabotage, a decision to close a facility without adequate notice or other unanticipated problems at a facility could result in lengthy interruptions in the availability of our platform. Even with current and planned disaster recovery arrangements, our business could be harmed. Also, in the event of damage or interruption, our insurance policies may not adequately compensate us for any losses that we may incur. These factors in turn could further reduce our revenues, subject us to liability and cause us to issue credits or cause customers to fail to renew their subscriptions, any of which could harm our business.
If we fail to manage our technical operations infrastructure, our existing customers may experience service outages and our new customers may experience delays in the implementation of our platform.
We have experienced significant growth in the number of users, transactions and data that our operations infrastructure supports. We seek to maintain sufficient excess capacity in our operations infrastructure to meet the needs of all of our customers, as well as to facilitate the rapid provision of new customer implementations and the expansion of existing customer implementations. In addition, we need to properly manage our technological operations infrastructure in order to support version control, changes in hardware and software parameters and the evolution of our platform. However, the provision of new hosting infrastructure requires significant lead time. We have experienced, and may in the future experience, website disruptions, outages and other performance problems. These problems may be caused by a variety of factors, including infrastructure changes, human or software errors, viruses, security attacks, fraud, spikes in customer usage and denial of service issues. In some instances, we may not be able to identify the cause or causes of these performance problems within an acceptable period of time. If we do not accurately predict our infrastructure requirements, our customers may experience service outages that may subject us to financial penalties, financial liabilities and customer losses. If our operations infrastructure fails to keep pace with increased sales, customers may experience delays as we seek to obtain additional capacity, which could adversely affect our revenue as well as our reputation.
Our business could be adversely affected if our customers are not satisfied with the implementation services provided by us or our partners.
Our business depends on our ability to satisfy our customers, both with respect to our platform and modules and the professional services that are performed to help our customers use features and functions that address their business needs. Professional services may be performed by our own staff, by a third-party partner or by a combination of the two. Our strategy is to work with partners to increase the breadth of capability and depth of capacity for delivery of these services to our customers, and we expect the number of our partner-led implementations to continue to increase over time. If a customer is not satisfied with the quality of work performed by us or a partner or with a virtual implementation or with the type of professional services or modules delivered, we may incur additional costs in addressing the situation, the profitability of that work might be impaired and the customer’s dissatisfaction with our services or those of our partners could damage our ability to retain that customer or expand the number of modules subscribed to by that customer. In addition, negative publicity related to our customer relationships, regardless of its accuracy, may further damage our business by affecting our ability to compete for new business with current and prospective customers.
We typically provide service level commitments under our customer contracts. If we fail to meet these contractual commitments, we could be obligated to provide credits or refunds for prepaid amounts related to unused subscription services or face contract terminations, which could adversely affect our revenues.
Our customer agreements typically provide service level commitments on a monthly basis. If we are unable to meet the stated service level commitments or suffer extended periods of unavailability for our platform, we may be contractually obligated to provide these customers with service credits, typically 10% of the customer’s subscription fees for the month in which the service level was not met, and we could face contract terminations, in which case we would be subject to refunds for prepaid amounts related to unused subscription services. Our revenues could be significantly affected if we suffer unexcused downtime under our agreements with our customers. Any extended service outages could adversely affect our reputation, revenues and operating results.
If we fail to integrate our platform with a variety of third-party technologies, our platform may become less marketable and less competitive or obsolete and our operating results may be harmed.
Our platform must integrate with a variety of third-party technologies, and we need to continuously modify and enhance our platform to adapt to changes in cloud-enabled hardware, software, networking, browser and database technologies. Any failure of our platform to operate effectively with future technologies could reduce the demand for our platform, resulting in customer dissatisfaction and harm to our business. If we are unable to respond to these changes in a cost-effective manner or if third-party developers and technology are unable or unwilling to provide necessary or complementary integrations, our platform may become less marketable and less competitive or obsolete and our operating results may be negatively affected. In addition, an increasing number of individuals within the enterprise are utilizing mobile devices to access the Internet and corporate resources and to conduct business. If we cannot continue to effectively make our platform available on these mobile devices and offer the information, services and functionality required by enterprises that widely use mobile devices, we may experience difficulty attracting and retaining customers.
Any failure to offer high-quality technical support services may adversely affect our relationships with our customers and our financial results.
Once our modules are implemented, our customers depend on our support organization to resolve technical issues relating to our modules. We may be unable to respond quickly enough to accommodate short-term increases in customer demand for support services. We also may be unable to modify the format of our support services to compete with changes in support services provided by our competitors. Increased customer demand for these services, without corresponding revenues, could increase costs and adversely affect our operating results. In addition, our sales process is highly dependent on our platform and business reputation and on positive recommendations from our existing customers. Any failure to maintain high-quality technical support, or a market perception that we do not maintain high-quality support, could adversely affect our reputation, our ability to sell subscriptions to our modules to existing and prospective customers and our business, operating results and financial position.
If our platform fails to perform properly, our reputation could be adversely affected, our market share could decline and we could be subject to liability claims.
Our platform is inherently complex and may contain material defects or errors. Any defects in functionality or that cause interruptions in the availability of our platform could result in:
•loss or delayed market acceptance and sales;
•breach of warranty claims;
•sales credits or refunds for prepaid amounts related to unused subscription services;
•loss of customers;
•loss of customer data;
•diversion of development and customer service resources; and
•Negative publicity and injury to our reputation.
The costs incurred in correcting any material defects or errors might be substantial and could adversely affect our operating results.
Because of the large amount of data that we collect and manage, it is possible that hardware failures or errors in our systems could result in data loss or corruption or cause the information that we collect to be incomplete or contain inaccuracies that our customers regard as significant. Furthermore, the availability or performance of our platform could be adversely affected by a number of factors, including customers’ inability to access the Internet, failure of our network or software systems, security breaches or variability in user traffic for our platform. We may be required to issue credits or refunds for prepaid amounts related to unused services or otherwise be liable to our customers for damages they incur resulting from certain of these events. For example, our customers access our modules through their ISPs. If an ISP fails to provide sufficient capacity to support our modules or otherwise experiences service outages, such failure could interrupt our customers’ access to our modules and adversely affect their perception of our modules’ reliability. In addition to potential liability, if we experience interruptions in the availability of our platform, our reputation could be adversely affected and we could lose customers.
Our errors and omissions insurance may be inadequate or may not be available in the future on acceptable terms, or at all. In addition, our policy may not cover all claims made against us and defending a suit, regardless of its merit, could be costly and divert management’s attention.
Risk Related to our Technology and Intellectual Property
We may be sued by third parties for various claims including alleged infringement of their proprietary rights.
We are involved in various legal matters arising from normal course of business activities. These may include claims, suits, and other proceedings involving alleged infringement of third-party patents and other intellectual property rights, as well as commercial, corporate and securities, labor and employment, wage and hour, and other matters. In particular, there has been considerable activity in our industry to develop and enforce intellectual property rights. Our success depends upon our not infringing upon the intellectual property rights of others. Our competitors, as well as a number of other entities and individuals, may own or claim to own intellectual property relating to our industry. In the past third parties have claimed and in the future third parties may claim that we are infringing upon their intellectual property rights, and we may be found to be infringing upon such rights.
We may experience future claims that our platform and underlying technology infringe or violate others’ intellectual property rights, and it is possible we may be found to be infringing upon such rights. We may be unaware of the intellectual property rights that others may claim cover some or all of our technology or services. Any claims or litigation could cause us to incur significant expenses and, if successfully asserted against us, could require that we pay substantial damages or ongoing royalty payments, prevent us from offering our services or require that we comply with other unfavorable terms. We may also be obligated to indemnify our customers and business partners or to pay substantial settlement costs, including royalty payments, in connection with any such claim or litigation and to obtain licenses, modify our platform or refund fees, which could be costly. Even if we were to prevail in such a dispute, any litigation regarding our intellectual property could be costly, distracting and time-consuming and could harm our brand, business, results of operations and financial condition.
Any failure to protect our intellectual property rights could impair the value of our proprietary technology and damage our brand.
Our success and ability to compete depend in part upon our intellectual property. We primarily rely on copyright, patent, trade secret and trademark laws, trade secret protection and confidentiality or contractual agreements with our employees, customers, partners and others to protect our intellectual property rights. However, the steps we take to protect our intellectual property rights may be inadequate.
In order to protect our intellectual property rights, we may be required to expend significant resources to monitor and protect such rights. Litigation brought to protect and enforce our intellectual property rights could be costly, time-consuming and distracting to management and could result in the impairment or loss of portions of our intellectual property. Furthermore, our efforts to enforce our intellectual property rights may be met with defenses, counterclaims and countersuits attacking the validity and enforceability of our intellectual property rights. Our failure to secure, protect and enforce our intellectual property rights could seriously adversely affect our brand and our business. For example, such failures could delay further sales or the implementation of our platform, impair the functionality of our platform, delay introductions of new modules, result in our substituting inferior or more costly technologies into our platform, or injure our reputation.
Our platform utilizes open source software, and any failure to comply with the terms of one or more of these open source licenses could negatively affect our business.
Our platform utilizes software governed by open source licenses, including for example the MIT License and the Apache License. The terms of various open source licenses have not been interpreted by United States courts, and there is a risk that such licenses could be construed in a manner that imposes unanticipated conditions or restrictions on our ability to market our platform. By the terms of certain open source licenses, if we combine our proprietary software with open source software in a certain manner, we could be required to release the source code of our proprietary software and make it available under open source licenses. In the event that portions of our proprietary software are determined to be subject to an open source license, we could be required to publicly release the affected portions of our source code, or to re-engineer all or a portion of our technologies or otherwise be limited in the licensing of our technologies, each of which could reduce or eliminate the value of our technologies and services. We have established processes to help alleviate these risks, but we cannot assure you that our processes for controlling our use of open source software in our platform will be effective. In addition to risks related to license requirements, the use of open source software can lead to greater risks than use of third-party commercial software, as open source licensors generally do not provide warranties or controls on the origin of the software. Many of the risks associated with the use of open source software cannot be eliminated and could negatively affect our business.
We employ third-party licensed software for use in or with our platform, and the inability to maintain these licenses or errors in the software we license could result in increased costs, or reduced service levels, which could adversely affect our business.
Our platform incorporates certain third-party software obtained under licenses from other companies. We anticipate that we will continue to rely on such third-party software and development tools from third parties in the future. Although we believe that there are commercially reasonable alternatives to the third-party software we currently license, this may not always be the case, or it may be difficult or costly to replace. In addition, integration of the software used in our platform with new third-party software may require significant work and require substantial investment of our time and resources. Also, to the extent that our platform depends upon the successful operation of third-party software in conjunction with our software, any undetected errors or defects in this third-party software could prevent the deployment or impair the functionality of our platform, delay new module introductions, result in a failure of our modules and injure our reputation. Our use of additional or alternative third-party software would require us to enter into license agreements with third parties, which may be time consuming to negotiate or result in increased licensing costs.
Risks Relating to our Financial Results and Reporting
Our quarterly results may fluctuate significantly and may not fully reflect the underlying performance of our business.
Our results of operations and key metrics discussed elsewhere in this report, such as trailing twelve months calculated billings, remaining performance obligations, deferred revenue and cumulative spend under management, may vary significantly in the future and period-to-period comparisons of our operating results and key metrics may not provide a full picture of our performance. Accordingly, the results of any one quarter or year should not be relied upon as an indication of future performance. Our quarterly financial results and metrics may fluctuate as a result of a variety of factors, many of which are outside of our control, as a result they may not fully reflect the underlying performance of our business. These quarterly fluctuations may negatively affect the value of our common stock. Factors that may cause these fluctuations include, without limitation:
•our ability to attract new customers and complete the sale of our platform to them within the range of our typical sales cycle;
•the addition or loss of one or more of our larger customers, including as the result of acquisitions or consolidations;
•the timing of recognition of revenues;
•the amount and timing of operating expenses;
•general economic, industry and market conditions, both domestically and internationally, including the impact of the market volatility and economic downturn caused by COVID-19 on our business, including but not limited to a decreased demand for our platform and services, negative impacts on our revenue results, an increasing unpredictability in expenses and cash flow, and a decreased ability by our customers to pay for our platform and services;
•the timing of our billing and collections;
•customer renewal and expansion rates;
•security breaches of, technical difficulties with, or interruptions to the delivery and use of our products on our platform;
•the amount and timing of completion of professional services engagements;
•increases or decreases in the number of users for our platform, increases or decreases in the modules purchased for our platform or pricing changes upon any renewals of customer agreements;
•changes in our pricing policies or those of our competitors;
•seasonal variations in sales of our software subscriptions, which have historically been highest in the fourth quarter of a calendar year but may vary in future quarters;
•the timing and success of new product or module introductions by us or our competitors or any other change in the competitive dynamics of our industry, including consolidation among competitors, customers or strategic partners;
•changes in foreign currency exchange rates;
•extraordinary expenses such as litigation or other dispute-related expenses or settlement payments;
•sales tax and other tax determinations by authorities in the jurisdictions in which we conduct business;
•the impact of new accounting pronouncements and the adoption thereof;
•fluctuations in stock-based compensation expense;
•expenses in connection with mergers, acquisitions or other strategic transactions; and
•the timing of expenses related to the development or acquisition of technologies or businesses and potential future charges for impairment of goodwill or intangibles from acquired companies.
Further, in future periods, our revenue growth could slow or our revenues could decline for a number of reasons, including slowing demand for our offerings, increasing competition, a decrease in the growth of our overall market, global economic conditions, or our failure, for any reason, to continue to capitalize on growth opportunities. In addition, our growth rate may slow in the future as our market penetration rates increase. As a result, our revenues, operating results and cash flows may fluctuate significantly on a quarterly basis and revenue growth rates may not be sustainable and may decline in the future, and we may not be able to achieve or sustain profitability in future periods, which could harm our business and cause the market price of our common stock to decline.
Because we recognize subscription revenues over the term of the contract, fluctuations in new sales and renewals may not be immediately reflected in our operating results and may be difficult to discern.
We generally recognize subscription revenues from customers ratably over the terms of their contracts. Most of the subscription revenues we report on each quarter are derived from the recognition of deferred revenue relating to subscriptions entered into during previous quarters. Consequently, a decline in new or renewed subscriptions in any single quarter would likely have only a small impact on our revenues for that quarter. However, such a decline would negatively affect our revenues in future quarters. Accordingly, the effect of significant downturns in sales and market acceptance of our platform, delays in our sales cycles as a result of COVID-19 and potential changes in our pricing policies or rate of renewals, may not be fully apparent from our reported results of operations until future periods.
We may be unable to adjust our cost structure to reflect the changes in revenues. In addition, a significant majority of our costs are expensed as incurred, while subscription revenues are recognized over the life of the customer agreement. As a result, increased growth in the number of our customers could result in our recognition of more costs than revenues in the earlier periods of the terms of our agreements. Our subscription model also makes it difficult for us to rapidly increase our revenues through additional sales in any period, as revenues from new customers must be recognized over the applicable subscription term.
We have a history of cumulative losses, and we do not expect to be profitable for the foreseeable future.
We incurred net losses of $180.1 million, $90.8 million, and $55.5 million in the fiscal years ended January 31, 2021, 2020 and 2019, respectively. We had an accumulated deficit of $525.8 million at January 31, 2021. Our losses and accumulated deficit reflect the substantial investments we made to acquire new customers and develop our platform. We expect our operating expenses to increase in the future due to anticipated increases in sales and marketing expenses, research and development expenses, operations costs and general and administrative costs, and, therefore, we expect our losses to continue for the foreseeable future. A significant contributor to each of these categories of expense is stock compensation expense associated with equity awards that we grant to many of our employees at the time of hire and thereafter on an annual basis. If we continue to grow at or near the pace at which our headcount increased during our 2021 fiscal year, we would expect our stock compensation expenses likewise to increase at a similar pace in future periods. Furthermore, to the extent we are successful in gaining new customers, we will also incur increased losses because many costs associated with acquiring new customers are generally incurred up front, while subscription revenues are generally recognized ratably over the terms of the agreements (typically three years, although some customers commit for longer or shorter periods). If we are unable to maintain consistent or increasing revenue or revenue growth, the market price of our common stock could be volatile, and it may be difficult for us to achieve and maintain profitability or maintain or increase cash flow on a consistent basis. Accordingly, we cannot assure you that we will achieve profitability in the future, or that, if we do become profitable, we will sustain profitability or achieve our target margins on a midterm or long-term basis.
If we are unable to maintain effective internal controls over financial reporting in the future, investors may lose confidence in the accuracy and completeness of our financial reports and the market price of our common stock may be negatively affected.
As a public company, we are required to maintain internal controls over financial reporting and to report any material weaknesses in such internal controls. Section 404 of the Sarbanes-Oxley Act of 2002 (“Sarbanes-Oxley Act”) requires that we evaluate and determine the effectiveness of our internal controls over financial reporting and provide a management report on the internal controls over financial reporting, which must be attested to by our independent registered public accounting firm. If we have a material weakness in our internal controls over financial reporting (including in the control environment of our acquired companies), we may not detect errors on a timely basis and our financial statements may be materially misstated. In the future, we may not be able to complete our evaluation, testing, and any required remediation in a timely fashion, or otherwise assert that our internal controls are effective, and additionally, our independent registered public accounting firm may not be able to formally attest to the effectiveness of our internal controls over financial reporting.
If in the future we identify material weaknesses in our internal controls over financial reporting (including in the control environment of our acquired companies), if we are unable to comply with the requirements of Section 404 in a timely manner, if we are unable to assert that our internal controls over financial reporting are effective or if our independent registered public accounting firm is unable to express an opinion as to the effectiveness of our internal controls over financial reporting, investors may lose confidence in the accuracy and completeness of our financial reports and the market price of our common stock could be negatively affected, and we could become subject to investigations by the Securities and Exchange Commission (“SEC”), Nasdaq or other regulatory authorities, which could require additional financial and management resources to address.
Our reported financial results may be adversely affected by changes in accounting principles generally accepted in the United States.
Generally accepted accounting principles in the United States are subject to interpretation by the Financial Accounting Standards Board (“FASB”), the SEC and various bodies formed to promulgate and interpret appropriate accounting principles. Accounting for revenue from sales of subscriptions to software is particularly complex, is often the subject of intense scrutiny by the SEC and will evolve as FASB continues to consider applicable accounting standards in this area. A change in accounting principles or interpretations could have a significant effect on our reported financial results for periods prior and subsequent to such change. We may adopt new accounting standards retrospectively to prior periods and the adoption may result in an adverse change to previously reported results. Additionally, the adoption of these standards may potentially require enhancements or changes in our systems and will require significant time and cost on behalf of our financial management.
Regulatory and Tax-Related Risks
Changes in privacy laws, regulations, and standards may cause our business to suffer.
Our customers can use our platform to collect, use and store certain types of personal or identifying information regarding their employees and suppliers. Federal, state and foreign government bodies and agencies have adopted, are considering adopting or may adopt laws and regulations regarding the collection, use, storage and disclosure of personal information obtained from consumers and individuals, such as compliance with the Health Insurance Portability and Accountability Act in the US and GDPR in the EU. The costs of compliance with, and other burdens imposed by, such laws and regulations that are applicable to the businesses of our customers may limit the use and adoption of our platform and reduce overall demand or lead to significant fines, penalties or liabilities for any noncompliance with such privacy laws. Furthermore, privacy concerns may cause our customers’ employees to resist providing the personal data necessary to allow our customers to use our platform effectively. Even the perception of privacy concerns, whether or not valid, may inhibit market adoption of our platform in certain industries.
All of these domestic and international legislative and regulatory initiatives may adversely affect our customers’ ability to process, handle, store, use and transmit demographic and personal information from their employees, customers and suppliers, which could reduce demand for our platform. The European Union (“EU”) and many countries in Europe have stringent privacy laws and regulations, which may affect our ability to operate cost effectively in certain European countries. In particular, the EU has adopted the General Data Protection Regulation (“GDPR”) which went into effect on May 25, 2018 and contains numerous requirements and changes, including more robust obligations on data processors and heavier documentation requirements for data protection compliance programs by companies. Specifically, the GDPR introduced numerous privacy-related changes for companies operating in the EU, including greater control for data subjects (e.g., the “right to be forgotten”), increased data portability for EU consumers, data breach notification requirements, and increased fines. In particular, under the GDPR, fines of up to 20 million Euros or up to 4% of the annual global revenue of the noncompliant company, whichever is greater, could be imposed for violations of certain of the GDPR’s requirements. Complying with the GDPR may cause us to incur substantial operational costs or require us to change our business practices. Despite our efforts to bring practices into compliance with the GDPR, we may not be successful either due to internal or external factors such as resource allocation limitations or a lack of vendor cooperation. Non-compliance could result in proceedings against us by governmental entities, customers, data subjects or others. We may also experience difficulty retaining or obtaining new European or multi-national customers due to the compliance cost, potential risk exposure, and uncertainty for these entities, and we may experience significantly increased liability with respect to these customers pursuant to the terms set forth in our engagements with them. We may find it necessary to establish systems in the EU to maintain personal data originating from the EU, which may involve substantial expense and distraction from other aspects of our business. In the meantime, there could be uncertainty as to how to comply with EU privacy law.
In addition, California enacted the California Consumer Privacy Act of 2018 (“CCPA”) which took effect on January 1, 2020,
and the California Privacy Rights Act (“CPRA”), which expands upon the CCPA, was passed in the recent California election in November 2020 and comes into effect on January 1, 2023, with a “lookback” period to January 1, 2022. This legislation broadly defines personal information, gives California residents expanded privacy rights and protections and provides for civil penalties for violations. The effects of this legislation are potentially far-reaching and may require us to modify our data management practices and to incur substantial expense in an effort to comply.
Because the interpretation and application of many privacy and data protection laws along with contractually imposed industry standards are uncertain, it is possible that these laws may be interpreted and applied in a manner that is inconsistent with our existing data management practices or the features of our products and platform capabilities. If so, in addition to the possibility of fines, lawsuits, and other claims and penalties, we could be required to fundamentally change our business activities and practices or modify our products and platform capabilities, which could have an adverse effect on our business. Any inability to adequately address privacy and security concerns, even if unfounded, or comply with applicable privacy and data security laws, regulations, and policies, could result in additional cost and liability to us, damage our reputation, inhibit sales, and adversely affect our business. Furthermore, the costs of compliance with, and other burdens imposed by, the laws, regulations, and policies that are applicable to the businesses of our customers may limit the use and adoption of, and reduce the overall demand for, our products. Privacy and data security concerns, whether valid or not valid, may inhibit market adoption of our products, particularly in certain industries and foreign countries. If we are not able to adjust to changing laws, regulations, and standards related to the Internet, our business may be harmed.
We are subject to the tax laws of various jurisdictions, which are subject to unanticipated changes and to interpretation, which could harm our future results.
We are subject to income taxes in the United States and foreign jurisdictions, and our domestic and international tax liabilities are subject to the allocation of expenses in differing jurisdictions. Our effective tax rate could be adversely affected by changes in the mix of earnings and losses in countries with differing statutory tax rates, certain non-deductible expenses as a result of acquisitions, the valuation of deferred tax assets and liabilities, and changes in federal, state, or international tax laws and accounting principles.
Further, each jurisdiction has different rules and regulations governing sales and use, value added, and similar taxes, and these rules and regulations are subject to varying interpretations that change over time. Certain jurisdictions in which we did not collect such taxes may assert that such taxes are applicable, which could result in tax assessments, penalties, and interest, and we may be required to collect such taxes in the future. In addition, we may be subject to income tax audits by many tax jurisdictions throughout the world, many of which have not established clear guidance on the tax treatment of cloud-based companies. Any tax assessments, penalties, and interest, or future requirements may adversely affect our results of operations. Moreover, imposition of such taxes on us going forward would effectively increase the cost of our products to our customers and might adversely affect our ability to retain existing customers or to gain new customers in the areas in which such taxes are imposed.
In addition, the application of the tax laws of various jurisdictions, including the United States, to our international business activities is subject to interpretation and depends on our ability to operate our business in a manner consistent with our corporate structure. As we operate in numerous taxing jurisdictions, the application of tax laws can also be subject to diverging and sometimes conflicting interpretations by tax authorities of these jurisdictions. Our determination of our tax liability is subject to review by applicable United States and foreign tax authorities. Any adverse outcome of such a review could harm our operating results and financial condition.
We may not be able to utilize a significant portion of our net operating loss or research tax credit carryforwards, which could adversely affect our potential profitability.
We have federal and state net operating loss carryforwards due to prior period losses, which if not utilized will begin to expire in 2026 and 2029 for federal and state purposes, respectively. These net operating loss carryforwards could expire unused and be unavailable to offset future income tax liabilities, which could adversely affect our potential profitability.
In addition, under Sections 382 and 383 of the Internal Revenue Code of 1986, as amended (the “Code”), our ability to utilize net operating loss carryforwards or other tax attributes, such as research tax credits, in any taxable year may be limited if we experience an “ownership change.” Such an “ownership change” generally occurs if one or more stockholders or groups of stockholders who own at least 5% of our stock increase their ownership by more than 50 percentage points over their lowest ownership percentage within a rolling three-year period. Similar rules may apply under state tax laws. As of our initial public offering and our subsequent follow-on offering we have not had an ownership change that has triggered any material limitation on the use of our tax attributes for purposes of Section 382 of the Code. Subsequent changes in our stock ownership, however, could cause an “ownership change.” It is possible that an ownership change, or any future ownership change, could have a material effect on the use of our net operating loss carryforwards or other tax attributes, which could adversely affect our potential profitability.
We have incurred and will continue to incur significantly increased costs and devote substantial management time as a result of operating as a public company.
As a public company, we have incurred and will continue to incur significant legal, accounting and other expenses. For example, we are subject to the reporting requirements of the Securities Exchange Act of 1934, as amended, and are required to comply with the applicable requirements of the Sarbanes-Oxley Act and the Dodd-Frank Wall Street Reform and Consumer Protection Act, as well as rules and regulations subsequently implemented by the SEC and the Nasdaq Global Select Market, including the establishment and maintenance of effective disclosure and financial controls and changes in corporate governance practices. Compliance with these requirements has increased our legal and financial compliance costs and made some activities more time consuming and costly. In addition, our management and other personnel need to divert attention from operational and other business matters to devote substantial time to these public company requirements. In particular, we are incurring significant expenses and devoting substantial management effort toward ensuring ongoing compliance with the requirements of Section 404 of the Sarbanes-Oxley Act. We have hired and may need to continue to hire additional accounting and financial staff with appropriate public company experience and technical accounting knowledge and maintain an internal audit function. We cannot predict or estimate the amount of additional costs we may incur as a result of being a public company.
The rules and regulations applicable to public companies make it more expensive for us to obtain and maintain director and officer liability insurance, particularly in the current environment of the COVID-19 pandemic, and we may be required to accept reduced coverage or incur substantially higher costs to obtain coverage. These factors could also make it more difficult for us to attract and retain qualified members of our board of directors, particularly to serve on our audit committee and compensation committee, and qualified executive officers.
Risks Related to our Indebtedness
We have incurred substantial indebtedness that may decrease our business flexibility, access to capital, and/or increase our borrowing costs, and we may still incur substantially more debt, which may adversely affect our operations and financial results.
In January 2018, we issued $230 million aggregate principal amount of 0.375% Convertible Senior Notes due 2023, which we refer to as the 2023 Notes, in June 2019, we issued $805 million aggregate principal amount of our 0.125% Convertible Senior Notes due 2025, which we refer to as the 2025 Notes, and in June 2020, we issued $1,380 million aggregate principal amount of our 0.375% Convertible Senior Notes due 2026, which we refer to as the 2026 Notes, which we collectively refer to as the Convertible Notes. As of January 31, 2021, we had $1,003.1 million in total long-term liabilities, comprised primarily of $897.5 million related to the carrying amount of the 2026 Notes. Our indebtedness may:
•limit our ability to borrow additional funds for working capital, capital expenditures, acquisitions or other general business purposes;
•limit our ability to use our cash flow or obtain additional financing for future working capital, capital expenditures, acquisitions or other general business purposes;
•require us to use a substantial portion of our cash flow from operations to make debt service payments;
•limit our flexibility to plan for, or react to, changes in our business and industry;
•place us at a competitive disadvantage compared to our less leveraged competitors; and
•increase our vulnerability to the impact of adverse economic and industry conditions.
Further, the indentures governing the Convertible Notes do not restrict our ability to incur additional indebtedness and we and our subsidiaries may incur substantial additional indebtedness in the future, subject to the restrictions contained in any future debt instruments existing at the time, some of which may be secured indebtedness.
Servicing our debt will require a significant amount of cash. We may not have sufficient cash flow from our business to pay our substantial debt, and we may not have the ability to raise the funds necessary to settle conversions of the Convertible Notes in cash or to repurchase the Convertible Notes upon a fundamental change, which could adversely affect our business and results of operations.
Our ability to make scheduled payments of the principal of, to pay interest on, or to refinance our indebtedness, including the amounts payable under the Convertible Notes, depends on our future performance, which is subject to economic, financial, competitive, and other factors beyond our control. Our business may not continue to generate cash flow from operations in the future sufficient to service our indebtedness and make necessary capital expenditures. If we are unable to generate such cash flow, we may be required to adopt one or more alternatives, such as selling assets, restructuring debt, or obtaining additional equity capital on terms that may be onerous or highly dilutive. Our ability to refinance our indebtedness will depend on the capital markets and our financial condition at such time. We may not be able to engage in any of these activities or engage in these activities on desirable terms, which could result in a default on our debt obligations.
Further, holders of the Convertible Notes have the right to require us to repurchase all or a portion of their Convertible Notes upon the occurrence of a “fundamental change” (as defined in the indentures governing the Convertible Notes (the “indentures”)) before the maturity date at a repurchase price equal to 100% of the principal amount of the Convertible Notes to be repurchased, plus accrued and unpaid interest, if any. In addition, upon conversion of the Convertible Notes, unless we elect to deliver solely shares of our common stock to settle such conversion (other than paying cash in lieu of delivering any fractional share), we will be required to make cash payments in respect of the Convertible Notes being converted. However, we may not have enough available cash or be able to obtain financing at the time we are required to make repurchases of Convertible Notes surrendered therefor or pay cash with respect to Convertible Notes being converted.
The conditional conversion feature of the Convertible Notes, when triggered, may adversely affect our financial condition and operating results.
In the event the conditional conversion feature of the Convertible Notes is triggered, holders of the Convertible Notes will be entitled to convert their Convertible Notes at any time during specified periods at their option. If one or more holders elect to convert their Convertible Notes, unless we elect to satisfy our conversion obligation by delivering solely shares of our common stock (other than paying cash in lieu of delivering any fractional share), we would be required to settle a portion or all of our conversion obligation in cash, which could adversely affect our liquidity. As disclosed in Note 9, “Convertible Senior Notes” in our notes to our consolidated financial statements, the conditional conversion feature of the 2023 Notes and the 2025 Notes was triggered as of January 31, 2021.
In addition, even if certain holders of Convertible Notes do not elect to convert their Convertible Notes, we could be required under applicable accounting rules to reclassify all or a portion of the outstanding principal of the Convertible Notes as a current rather than long-term liability, which would result in a material reduction of our net working capital.
The accounting method for convertible debt securities that may be settled in cash, such as the Convertible Notes, could have a material effect on our reported financial results.
Under Accounting Standards Codification 470-20, Debt with Conversion and Other Options (“ASC 470-20”), an entity must separately account for the liability and equity components of the convertible debt instruments (such as the Convertible Notes) that may be settled entirely or partially in cash upon conversion in a manner that reflects the issuer’s economic interest cost. The effect of ASC 470-20 on the accounting for the Convertible Notes is that the equity component is required to be included in the additional paid-in capital section of stockholders’ equity on our consolidated balance sheet at the issuance date and the value of the equity component would be treated as debt discount for purposes of accounting for the debt component of the Convertible Notes. As a result, we will be required to record a greater amount of non-cash interest expense as a result of the amortization of the discounted carrying value of the Convertible Notes to their face amount over the term of the Convertible Notes. We will report larger net losses (or lower net income) in our financial results because ASC 470-20 will require interest to include the amortization of the debt discount, which could adversely affect our reported or future financial results, the trading price of our common stock and the trading price of the Convertible Notes.
In addition, under certain circumstances, convertible debt instruments (such as the Convertible Notes) that may be settled entirely or partly in cash may be accounted for utilizing the treasury stock method, the effect of which is that the shares issuable upon conversion of such Convertible Notes are not included in the calculation of diluted earnings per share except to the extent that the conversion value of such Convertible Notes exceeds their principal amount. Under the treasury stock method, for diluted earnings per share purposes, the transaction is accounted for as if the number of shares of common stock that would be necessary to settle such excess, if we elected to settle such excess in shares, are issued. In August 2020, the Financial Accounting Standards Board issued ASU No. 2020-06, Debt—Debt with Conversion and Other Options (Subtopic 470-20) and Derivatives and Hedging - Contracts in Entity’s Own Equity (Subtopic 815-40) to amend current accounting standards to eliminate the treasury stock method for convertible instruments and instead require application of the “if-converted” method. Under that method, diluted earnings per share will generally be calculated assuming that all the Convertible Notes are converted solely into shares of common stock at the beginning of the reporting period, unless the result would be anti-dilutive. The application of the if-converted method may change previously reported per share results.
The capped call transactions may affect the value of the Convertible Notes and our common stock.
In connection with the pricing of the Convertible Notes, we entered into capped call transactions with certain financial institutions. The capped call transactions are expected generally to reduce or offset the potential dilution upon conversion of the Convertible Notes and/or offset any cash payments we are required to make in excess of the principal amount of converted Convertible Notes, as the case may be, with such reduction and/or offset subject to a cap.
In connection with establishing their initial hedges of the capped call transactions, these financial institutions or their respective affiliates likely purchased shares of our common stock and/or entered into various derivative transactions with respect to our common stock concurrently with or shortly after the pricing of the Convertible Notes. These financial institutions or their respective affiliates may modify their hedge positions by entering into or unwinding various derivatives with respect to our common stock and/or purchasing or selling our common stock or other securities of ours in secondary market transactions following the pricing of the Convertible Notes and prior to the maturity of the Convertible Notes (and are likely to do so during any observation period related to a conversion of Convertible Notes). This activity could also cause or avoid an increase or a decrease in the market price of our common stock or the Convertible Notes.
The potential effect, if any, of these transactions and activities on the price of our common stock or the Convertible Notes will depend in part on market conditions and cannot be ascertained at this time. Any of these activities could adversely affect the value of our common stock.
Conversion of the Convertible Notes will dilute the ownership interest of existing stockholders, including holders who had previously converted their Convertible Notes, or may otherwise depress the price of our common stock.
The conversion of some or all of the Convertible Notes will dilute the ownership interests of existing stockholders to the extent we deliver shares of our common stock upon conversion of any of the Convertible Notes. The Convertible Notes are currently convertible and may from time to time in the future be convertible at the option of their holders prior to their scheduled terms under certain circumstances. Any sales in the public market of the common stock issuable upon such conversion could adversely affect prevailing market prices of our common stock. In addition, the existence of the Convertible Notes may encourage short selling by market participants because the conversion of the Convertible Notes could be used to satisfy short positions, or anticipated conversion of the Convertible Notes into shares of our common stock could depress the price of our common stock.
Risks Related to Ownership of Our Common Stock
Our stock price has been subject to fluctuations, and will likely continue to be subject to fluctuations and decline, due to factors beyond our control and you may lose all or part of your investment.
The market price of our common stock is subject to wide fluctuations in response to various factors, some of which are beyond our control. These factors, as well as the volatility of our common stock, could affect the price at which our convertible noteholders could sell the common stock received upon conversion of the Convertible Notes and could also impact the trading price of the Convertible Notes. Since shares of our common stock were sold in our initial public offering in October 2016 at a price of $18.00 per share, the reported high and low sales prices of our common stock have ranged from $22.50 to $369.12 through January 31, 2021. The market price of our common stock may fluctuate significantly in response to numerous factors, many of which are beyond our control, including:
•the overall performance of the equity markets;
•our operating performance and the performance of other similar companies;
•changes in our projected or target operating results and key metrics that we provide to the public, as well as those published by research analysts that follow our stock, our failure to meet or exceed these projections or targets or changes in recommendations by securities analysts;
•changes in our financial, operating or other metrics, regardless of whether we consider those metrics as reflective of the current state or long-term prospects of our business, and how those results compare to securities analyst expectations, including whether those results fail to meet, exceed, or significantly exceed securities analyst expectations;
•announcements of technological innovations, pricing changes, new software or enhancements to services, acquisitions, strategic alliances or significant agreements by us or by our competitors;
•announcements of our intent to conduct debt or equity financings or repurchases, redemptions, conversions or the like;
•disruptions in our services due to computer hardware, software or network problems;
•announcements of customer additions and customer cancellations or delays in customer purchases;
•recruitment or departure of key personnel;
•the economy as a whole, market conditions in our industry and the industries of our customers;
•extraordinary expenses such as litigation or other dispute-related expenses or settlement payments;
•conversion of the Convertible Notes;
•the impact of the COVID-19 pandemic, including on the global economy, our results of operations, enterprise software spending and business continuity;
•the size of our market float; and
•any other factors discussed in this Annual Report.
In addition, the stock markets have experienced extreme price and volume fluctuations that have affected and continue to affect the market prices of equity securities of many technology companies. Stock prices of many technology companies have fluctuated in a manner unrelated or disproportionate to the operating performance of those companies. In the past, stockholders have filed securities class action litigation following periods of market volatility. If we were to become involved in securities litigation, it could subject us to substantial costs, divert resources and the attention of management from our business and adversely affect our business.
Sales of a substantial number of shares of our common stock in the public market, or the perception that they might occur, could cause the price of our common stock to decline.
The price of our common stock could decline if there are substantial sales of our common stock, particularly sales by our directors, executive officers, and significant stockholders. The shares held by these persons may be sold in the public market in the United States, subject to prior registration in the United States, if required, or reliance upon an exemption from United States registration, including, in the case of shares held by affiliates or control persons, compliance with the volume restrictions of Rule 144. In addition, some of our executive officers have entered into Rule 10b5-1 trading plans under which they have contracted with a broker to sell shares of our common stock on a periodic basis.
Sales of a substantial number of shares of our common stock in the public market, or the perception that these sales might occur, for whatever reason, including as a result of the conversion of the outstanding Convertible Notes, could cause the market price of our common stock to decline or make it more difficult for our stockholders to sell their common stock at a time and price that they deem appropriate and could impair our ability to raise capital through the sale of additional equity or equity linked securities. In addition, we have filed a registration statement to register shares reserved for future issuance under our equity compensation plans. Subject to the satisfaction of applicable exercise periods and, in the case of shares held by affiliates or control persons, compliance with the volume restrictions of Rule 144, the shares issued upon exercise of outstanding stock options, settlement of outstanding restricted stock units, or conversion of the Convertible Notes into common stock will be available for immediate resale in the United States in the open market.
We have also reserved a substantial amount of shares of our common stock in connection with awards issued under our equity incentive plans and upon conversion of the Convertible Notes, the issuance of which will dilute the ownership interests of existing stockholders. Any sales in the public market of the common stock issuable upon such issuance or conversion could adversely affect prevailing market prices of our common stock.
We are unable to predict the effect that sales, or the perception that our shares may be available for sale, will have on the prevailing market price of our common stock and the trading price of the Convertible Notes.
If securities or industry analysts do not continue to publish research or publish inaccurate or unfavorable research about our business, our stock price and trading volume could decline.
The trading market for our common stock depends in part on the research and reports that securities or industry analysts publish about us or our business. If industry analysts cease coverage of us, the trading price for our common stock and the trading price of the Convertible Notes will be negatively affected. If one or more of the analysts who cover us downgrade our common stock or publish inaccurate or unfavorable research about our business or if our results fall short of the projected results published by one or more research analyst, our common stock price and the trading price of the Convertible Notes will likely decline. If one or more of these analysts ceases coverage of us or fail to publish reports on us regularly, demand for our common stock could decrease, which might cause our common stock price and trading volume, and the trading price of the Convertible Notes, to decline.
In addition, independent industry analysts, such as Gartner and Forrester, often provide reviews of our products and platform capabilities, as well as those of our competitors, and perception of our offerings in the marketplace may be significantly influenced by these reviews. We have no control over what these industry analysts report, and because industry analysts may influence current and potential customers, our brand could be harmed if they do not provide a positive review of our products and platform capabilities or view us as a market leader.
We do not intend to pay dividends for the foreseeable future.
We have never declared nor paid cash dividends on our capital stock. We currently intend to retain any future earnings to finance the operation and expansion of our business, and we do not expect to declare or pay any dividends in the foreseeable future. Consequently, stockholders, including holders of our Convertible Notes who receive shares of our common stock upon conversion of the Convertible Notes, must rely on sales of their common stock after price appreciation, which may never occur, as the only way to realize any future gains on their investment.
Delaware law, provisions in our amended and restated certificate of incorporation (“Restated Certificate”) and amended and restated bylaws (“Restated Bylaws”), and provisions in the indentures for our Convertible Notes could make a merger, tender offer or proxy contest difficult, thereby depressing the trading price of our common stock and Convertible Notes.
Our status as a Delaware corporation and the anti-takeover provisions of the Delaware General Corporation Law may discourage, delay or prevent a change in control by prohibiting us from engaging in a business combination with an interested stockholder for a period of three years after the person becomes an interested stockholder, even if a change of control would be beneficial to our existing stockholders. In addition, our Restated Certificate and Restated Bylaws contain provisions that may make the acquisition of our company more difficult, including the following:
•the requirement of a classified board of directors with three-year staggered terms, which could delay the ability of stockholders to change the membership of a majority of our board of directors;
•the ability of our board of directors to issue shares of preferred stock and to determine the price and other terms of those shares, including preferences and voting rights, without stockholder approval, which could be used to significantly dilute the ownership of a hostile acquiror;
•the exclusive right of our board of directors to elect a director to fill a vacancy created by the expansion of our board of directors or the resignation, death or removal of a director, which prevents stockholders from being able to fill vacancies on our board of directors;
•a prohibition on stockholder action by written consent, which forces stockholder action to be taken at an annual or special meeting of our stockholders;
•the requirement that a special meeting of stockholders be called only by a majority vote of our entire board of directors, the chairman of our board of directors or our chief executive officer, which could delay the ability of our stockholders to force consideration of a proposal or to take action, including to remove directors;
•the requirement for the affirmative vote of holders of at least 66 2/3% of the voting power of all of the then-outstanding shares of the voting stock, voting together as a single class, to amend the provisions of our Restated Certificate relating to the management of our business or our Restated Bylaws, which may inhibit the ability of an acquiror to effect such amendments to facilitate an unsolicited takeover attempt; and
•advance notice procedures with which stockholders must comply to nominate candidates to our board of directors or to propose matters to be acted upon at a stockholders’ meeting, which may discourage or deter a potential acquiror from conducting a solicitation of proxies to elect the acquiror’s own slate of directors or otherwise attempting to obtain control of us.
In addition, as a Delaware corporation, we are subject to Section 203 of the Delaware General Corporation Law. These provisions may prohibit large stockholders, in particular those owning 15% or more of our outstanding voting stock, from merging or combining with us for a certain period of time. A Delaware corporation may opt out of this provision by express provision in its original certificate of incorporation or by amendment to its certificate of incorporation or bylaws approved by its stockholders. However, we have not opted out of this provision.
In addition, if a fundamental change occurs prior to the maturity date of the Convertible Notes, holders of the Convertible Notes will have the right, at their option, to require us to repurchase all or a portion of their Convertible Notes. If a “make-whole fundamental change” (as defined in the applicable indenture) occurs prior the maturity date, we will in some cases be required to increase the conversion rate of the Convertible Notes for a holder that elects to convert its Convertible Notes in connection with such make-whole fundamental change. These features of the Convertible Notes may make a potential acquisition more expensive for a potential acquiror, which may in turn make it less likely for a potential acquiror to offer to purchase our company, or reduce the amount of consideration offered for each share of our common stock in a potential acquisition. Furthermore, the indentures prohibit us from engaging in certain mergers or acquisitions unless, among other things, the surviving entity assumes our obligations under the Convertible Notes.
These and other provisions in our Restated Certificate, Restated Bylaws, Convertible Notes, indentures and in Delaware law could deter or prevent a third party from acquiring us or could make it more difficult for stockholders or potential acquirors to obtain control of our board of directors or initiate actions that are opposed by our then-current board of directors, including to delay or impede a merger, tender offer, or proxy contest involving our company. The existence of these provisions could negatively affect the price of our common stock and the trading price of the Convertible Notes and limit opportunities for you to realize value in a corporate transaction.
Our Restated Certificate provides that the Court of Chancery of the State of Delaware is the exclusive forum for substantially all disputes between us and our stockholders, which could limit our stockholders’ ability to obtain a favorable judicial forum for disputes with us or our directors, officers or employees.
Our Restated Certificate provides that the Court of Chancery of the State of Delaware is the exclusive forum for any derivative action or proceeding brought on our behalf, any action asserting a breach of fiduciary duty, any action asserting a claim against us arising pursuant to the Delaware General Corporation Law, our Restated Certificate or our Restated Bylaws or any action asserting a claim against us that is governed by the internal affairs doctrine. This choice of forum provision may limit a stockholder’s ability to bring a claim in a judicial forum that it finds favorable for disputes with us or our directors, officers or other employees and may discourage these types of lawsuits. Alternatively, if a court were to find the choice of forum provision contained in our amended and restated certificate of incorporation to be inapplicable or unenforceable in an action, we might incur additional costs associated with resolving such action in other jurisdictions. For the avoidance of doubt, these choice of forum provisions may not apply to suits brought to enforce a duty or liability created by the Securities Act, the Exchange Act or any other claim for which the federal courts have exclusive jurisdiction.
Item 1B. Unresolved Staff Comments.
None.
Item 2. Properties.
We lease approximately 69,220 square feet of space for our corporate headquarters in San Mateo, California pursuant to a master lease that expires in April 2024.
We have additional domestic offices in Ann Arbor, Boca Raton, Boston, Cincinnati, Chicago, Evanston, New York, Pittsburgh, Reno, San Diego, Seattle, and Somerville. We also have international offices in Australia, Canada, France, Germany, India, Ireland, Italy, Japan, Luxembourg, Mexico, the Netherlands, Norway, Singapore, Sweden, Switzerland, and the United Kingdom. We may further expand our facilities capacity as our employee base grows. We believe that we will be able to obtain additional space on commercially reasonable terms.
Item 3. Legal Proceedings.
From time to time we may become involved in legal proceedings or be subject to claims arising in the ordinary course of business. As our growth continues, we may become party to an increasing number of litigation matters and claims. Although the results of litigation and claims cannot be predicted with certainty, we currently believe that the final outcome of these ordinary course matters will not have a material adverse effect on our business, operating results, financial condition or cash flows. Regardless of the outcome, litigation can have an adverse impact on us because of defense and settlement costs, diversion of management resources and other factors.
Item 4. Mine Safety Disclosures.
Not applicable.
PART II
Item 5. Market for Registrant’s Common Equity, Related Stockholder Matters and Issuer Purchases of Equity Securities. Market Information for Common Stock
Our common stock is traded on the Nasdaq Global Select Market under the symbol “COUP.”
Holders
As of January 31, 2021 there were 106 registered stockholders of record of our common stock and we believe a substantially greater number of beneficial owners who hold shares through brokers, banks or other nominees.
Dividends
We have never declared or paid any cash dividends on our capital stock, and we do not currently intend to pay any cash dividends on our capital stock in the foreseeable future. We currently intend to retain all available funds and any future earnings to support operations and to finance the growth and development of our business. Any future determination to pay dividends will be made at the discretion of our board of directors subject to applicable laws and will depend upon, among other factors, our results of operations, financial condition, contractual restrictions and capital requirements. Our future ability to pay cash dividends on our capital stock may also be limited by the terms of any future debt or preferred securities or future credit facility.
Unregistered Sales of Equity Securities
None.
Performance Graph
The following shall not be deemed “filed” for purposes of Section 18 of the Securities Exchange Act of 1934, as amended, or incorporated by reference into any of our other filings under the Securities Exchange Act of 1934, as amended, or the Securities Act of 1933, as amended.
The graph below compares the cumulative total stockholder return on our common stock with the cumulative total return on the Nasdaq Composite Index and the Nasdaq Computer Index. The graph assumes $100 was invested at the market close on October 6, 2016, which was our initial trading day, in our common stock. Data for the Nasdaq Composite Index and the Nasdaq Computer Index assume reinvestment of dividends. Our offering price of our common stock in our IPO, which had a closing stock price of $33.28 on October 6, 2016, was $18.00 per share.
The comparisons in the graph below are based upon historical data and are not indicative of, nor intended to forecast, future performance of our common stock.
Item 6. Selected Financial Data.
The following selected consolidated financial data should be read in conjunction with “Management’s Discussion and Analysis of Financial Condition and Results of Operations” and the consolidated financial statements and related notes included within this Annual Report on Form 10-K. The consolidated statements of operations data for the fiscal years ended January 31, 2021, 2020 and 2019, and the consolidated balance sheet data as of January 31, 2021 and 2020 are derived from our audited consolidated financial statements and related notes included elsewhere in this Annual Report on Form 10-K. The consolidated statements of operations data for the fiscal years ended January 31, 2018 and 2017, and the consolidated balance sheet data as of January 31, 2019, 2018 and 2017 are derived from audited consolidated financial statements that are not included in this Annual Report on Form 10-K. Our historical results are not necessarily indicative of our future results. The selected consolidated financial data in this section are not intended to replace our consolidated financial statements and the related notes, and are qualified in their entirety by the consolidated financial statements and related notes included elsewhere in this Annual Report on Form 10-K. Since we adopted the new revenue standard effective on February 1, 2018 using the modified retrospective method, the financial data for fiscal 2021, 2020 and 2019 were prepared under the new revenue standard, and the financial data for fiscal 2018 and 2017 were prepared prior to the adoption of the new revenue standard.
| | | | | | | | | | | | | | | | | | | | | | | | | | | | | |
| For the year ended January 31, |
| 2021 | | 2020 | | 2019 | | 2018 | | 2017 |
| (in thousands, except per share data) |
| Consolidated Statements of Operations Data: | | | | | | | | | |
| Revenues: | | | | | | | | | |
| Subscription | $ | 470,341 | | | $ | 345,261 | | | $ | 233,428 | | | $ | 164,865 | | | $ | 117,788 | |
| Professional services and other | 71,302 | | | 44,458 | | | 26,938 | | | 21,915 | | | 15,987 | |
| Total revenues | 541,643 | | | 389,719 | | | 260,366 | | | 186,780 | | | 133,775 | |
| | | | | | | | | |
| Cost of revenues: | | | | | | | | | |
Subscription (1) | 147,374 | | | 89,452 | | | 53,153 | | | 36,481 | | | 25,055 | |
Professional services and other (1) | 74,327 | | | 49,764 | | | 30,301 | | | 23,425 | | | 21,214 | |
| Total cost of revenues | 221,701 | | | 139,216 | | | 83,454 | | | 59,906 | | | 46,269 | |
| Gross profit | 319,942 | | | 250,503 | | | 176,912 | | | 126,874 | | | 87,506 | |
| | | | | | | | | |
| Operating expenses: | | | | | | | | | |
Research and development (1) | 133,842 | | | 93,089 | | | 61,608 | | | 44,536 | | | 30,262 | |
Sales and marketing (1) | 236,312 | | | 155,216 | | | 105,659 | | | 88,722 | | | 68,562 | |
General and administrative (1) | 116,341 | | | 75,623 | | | 57,005 | | | 38,578 | | | 24,106 | |
| Total operating expenses | 486,495 | | | 323,928 | | | 224,272 | | | 171,836 | | | 122,930 | |
| Loss from operations | (166,553) | | | (73,425) | | | (47,360) | | | (44,962) | | | (35,424) | |
| Interest expense | (91,271) | | | (37,658) | | | (12,518) | | | (502) | | | (14) | |
| Interest income and other, net | 13,321 | | | 9,316 | | | 3,817 | | | 3,307 | | | (1,321) | |
| Loss before provision for (benefit from) income taxes | (244,503) | | | (101,767) | | | (56,061) | | | (42,157) | | | (36,759) | |
| Provision for (benefit from) income taxes | (64,386) | | | (10,935) | | | (537) | | | 1,648 | | | 848 | |
| Net loss | $ | (180,117) | | | $ | (90,832) | | | $ | (55,524) | | | $ | (43,805) | | | $ | (37,607) | |
Net loss per share, basic and diluted (2) | $ | (2.63) | | | $ | (1.45) | | | $ | (0.96) | | | $ | (0.83) | | | $ | (1.88) | |
| | | | | | | | | |
Weighted-average number of shares used in computing net loss per share, basic and diluted (2) | 68,559 | | | 62,484 | | | 57,716 | | | 52,999 | | | 19,988 | |
| | | | | | | | | |
| Other Financial Data: | | | | | | | | | |
| Non-GAAP operating income (loss) | $ | 52,694 | | | $ | 31,927 | | | $ | 12,466 | | | $ | (11,833) | | | $ | (24,869) | |
| Non-GAAP net income (loss) | 55,725 | | | 36,616 | | | 11,583 | | | (11,319) | | | (27,125) | |
| Net cash provided by (used in) operating activities | 78,202 | | | 68,156 | | | 37,436 | | | 19,626 | | | (20,955) | |
| Adjusted free cash flows | $ | 113,547 | | | $ | 56,186 | | | $ | 29,908 | | | $ | 15,138 | | | $ | (25,446) | |
(1)Includes stock-based compensation expense as follows:
| | | | | | | | | | | | | | | | | | | | | | | | | | | | | |
| For the year ended January 31, |
| 2021 | | 2020 | | 2019 | | 2018 | | 2017 |
| (in thousands) |
| Cost of revenues: | | | | | | | | | |
| Subscription | $ | 11,438 | | | $ | 6,982 | | | $ | 4,285 | | | $ | 2,105 | | | $ | 715 | |
| Professional services and other | 15,563 | | | 7,773 | | | 4,269 | | | 2,722 | | | 772 | |
| Research and development | 37,685 | | | 20,159 | | | 11,841 | | | 6,928 | | | 1,766 | |
| Sales and marketing | 48,414 | | | 23,352 | | | 14,786 | | | 8,476 | | | 3,130 | |
| General and administrative | 55,750 | | | 23,110 | | | 17,765 | | | 9,464 | | | 3,069 | |
| Total stock-based compensation | $ | 168,850 | | | $ | 81,376 | | | $ | 52,946 | | | $ | 29,695 | | | $ | 9,452 | |
(2)See Note 13 to our consolidated financial statements for an explanation of the method used to calculate basic and diluted net loss per share.
| | | | | | | | | | | | | | | | | | | | | | | | | | | | | |
| As of January 31, |
| 2021 | | 2020 | | 2019 | | 2018 | | 2017 |
| (in thousands) |
| Consolidated Balance Sheet Data: | | | | | | | | | |
| Cash and cash equivalents | $ | 323,284 | | | $ | 268,045 | | | $ | 141,250 | | | $ | 412,903 | | | $ | 201,721 | |
| Marketable securities | 283,036 | | | 499,160 | | | 180,169 | | | — | | | — | |
| Working capital | (207,256) | | | 418,563 | | | 32,051 | | | 335,278 | | | 153,039 | |
| Total assets | 3,105,165 | | | 1,594,073 | | | 740,064 | | | 572,450 | | | 283,864 | |
| Deferred revenue, current and non-current | 361,888 | | | 261,783 | | | 182,587 | | | 128,030 | | | 90,840 | |
| Convertible senior notes, net | 1,506,593 | | | 749,727 | | | 174,615 | | | 163,010 | | | — | |
| | | | | | | | | |
| Total stockholders’ equity | $ | 1,040,231 | | | $ | 445,657 | | | $ | 313,281 | | | $ | 240,545 | | | $ | 173,892 | |
Non‑GAAP Financial Measures
In addition to our results determined in accordance with U.S. generally accepted accounting principles, or GAAP, we believe the following non‑GAAP measures are useful in evaluating our operating performance:
•Non-GAAP operating income (loss);
•Non-GAAP net income (loss); and
•Adjusted free cash flows.
We regularly review and consider these measures when we evaluate our business and for internal planning and forecasting purposes.
The following tables provide a reconciliation of loss from operations to non‑GAAP operating income (loss), from net loss to non-GAAP net income (loss), and from net cash provided by (used in) operating activities to adjusted free cash flows (in thousands):
| | | | | | | | | | | | | | | | | | | | | | | | | | | | | |
| For the year ended January 31, |
| 2021 | | 2020 | | 2019 | | 2018 | | 2017 |
| (in thousands) |
| Loss from operations | $ | (166,553) | | | $ | (73,425) | | | $ | (47,360) | | | $ | (44,962) | | | $ | (35,424) | |
| Stock-based compensation | 168,850 | | | 81,376 | | | 52,946 | | | 29,695 | | | 9,452 | |
| Litigation-related costs | — | | | — | | | — | | | — | | | 151 | |
| Amortization of acquired intangible assets | 62,897 | | | 23,976 | | | 6,880 | | | 3,434 | | | 952 | |
| Change in fair value of contingent consideration payable | (12,500) | | | — | | | — | | | — | | | — | |
| Non-GAAP operating income (loss) | $ | 52,694 | | | $ | 31,927 | | | $ | 12,466 | | | $ | (11,833) | | | $ | (24,869) | |
| | | | | | | | | |
| For the year ended January 31 |
| 2021 | | 2020 | | 2019 | | 2018 | | 2017 |
| (in thousands) |
| Net loss | $ | (180,117) | | | $ | (90,832) | | | $ | (55,524) | | | $ | (43,805) | | | $ | (37,607) | |
| Stock-based compensation | 168,850 | | | 81,376 | | | 52,946 | | | 29,695 | | | 9,452 | |
| Litigation-related costs | — | | | — | | | — | | | — | | | 151 | |
| Amortization of acquired intangible assets | 62,897 | | | 23,976 | | | 6,880 | | | 3,434 | | | 952 | |
| Change in fair value of contingent consideration payable | (12,500) | | | — | | | — | | | — | | | — | |
| Amortization of debt discount and issuance costs | 86,541 | | | 35,922 | | | 11,605 | | | 459 | | | — | |
| Gain on conversion of convertible senior notes | (3,154) | | | — | | | — | | | — | | | — | |
| Income tax effects and adjustments | (66,792) | | | (13,826) | | | (4,324) | | | (1,102) | | | (73) | |
| Non-GAAP net income (loss) | $ | 55,725 | | | $ | 36,616 | | | $ | 11,583 | | | $ | (11,319) | | | $ | (27,125) | |
| | | | | | | | | |
| For the year ended January 31 |
| 2021 | | 2020 | | 2019 | | 2018 | | 2017 |
| (in thousands) |
| Net cash provided by (used in) operating activities | $ | 78,202 | | | $ | 68,156 | | | $ | 37,436 | | | $ | 19,626 | | | $ | (20,955) | |
| Less: purchases of property and equipment | (11,492) | | | (11,970) | | | (7,528) | | | (4,488) | | | (4,491) | |
| Add: repayments of convertible senior notes attributable to debt discount | 27,409 | | | — | | | — | | | — | | | — | |
Add: one-time payout of legacy unvested equity awards accelerated in conjunction with a business combination | 19,428 | | | — | | | — | | | — | | | — | |
| Adjusted free cash flows | $ | 113,547 | | | $ | 56,186 | | | $ | 29,908 | | | $ | 15,138 | | | $ | (25,446) | |
We define non-GAAP operating income (loss) as loss from operations before stock-based compensation, amortization of acquired intangible assets, the change in fair value of contingent consideration related to an acquisition, and in fiscal 2017, before litigation-related costs. We define non-GAAP net income (loss) as net loss before stock-based compensation, amortization of acquired intangible assets, the change in fair value of contingent consideration related to an acquisition, amortization of debt discount and issuance costs, gain or loss on conversion of convertible senior notes, and related tax effects, including non-recurring income tax adjustments, and in fiscal 2017, before litigation-related costs. We define adjusted free cash flows as net cash provided by (used in) operating activities, less purchases of property and equipment, plus repayments of convertible senior notes attributable to debt discount, plus one-time payout of legacy unvested equity awards accelerated in conjunction with a business combination.
We believe non-GAAP operating income (loss) and non-GAAP net income (loss) provide investors and other users of our financial information consistency and comparability with our past financial performance and facilitate period to period comparisons of operations. We believe non-GAAP operating income (loss) and non-GAAP net income (loss) are useful in evaluating our operating performance compared to that of other companies in our industry, as these metrics generally eliminate the effects of certain items that may vary for different companies for reasons unrelated to overall operating performance.
We believe information regarding adjusted free cash flows provides useful information to investors because it is an indicator of our capital strength and liquidity, and we also use it to measure performance of our business operations. We exclude repayment of convertible senior notes attributable to debt discount in calculating this measure in part because our use of cash to satisfy this obligation (relating to the Convertible Notes) was discretionary, and we have the ability to satisfy similar obligations in the near future through shares of our common stock, or a combination of cash and shares of our common stock, at our election. However, you should bear in mind that this measure does not reflect any reduction for cash settlements of our debt obligations, nor does it represent our residual cash flow available for discretionary expenditures. In calculating this metric, we also excluded one-time payout of legacy unvested equity awards accelerated in conjunction with a business combination that occurred in November 2020, primarily because it was not a normal recurring cash operating activity necessary for our business operations. In addition, other companies in our industry may calculate similarly titled measures differently than we do, limiting their usefulness as comparative measures. Due to these and other limitations, you should not consider this non-GAAP measure in isolation or as a substitute for analysis of other GAAP financial measures, such as net cash provided by (used in) operating activities.
We use non-GAAP operating income (loss), non-GAAP net income (loss) and adjusted free cash flows in conjunction with traditional GAAP measures as part of our overall assessment of our performance and liquidity, including the preparation of our annual operating budget and quarterly forecasts, to evaluate the effectiveness of our business strategies and to communicate with our board of directors concerning our financial performance and liquidity. Our definitions may differ from the definitions used by other companies and therefore comparability may be limited. In addition, other companies may not publish these or similar metrics. Thus, our non-GAAP operating income (loss), non-GAAP net income (loss) and adjusted free cash flows should be considered in addition to, not as substitutes for, or in isolation from, measures prepared in accordance with GAAP.
We compensate for these limitations by providing investors and other users of our financial information a reconciliation of non-GAAP operating income (loss) to loss from operations, non-GAAP net income (loss) to net loss, and adjusted free cash flows to net cash provided by (used in) operating activities. We encourage investors and others to review our financial information in its entirety, not to rely on any single financial measure and to view non-GAAP operating income (loss), non-GAAP net income (loss), and adjusted free cash flows in conjunction with loss from operations, net loss, and the consolidated statements of cash flows.
Item 7. Management’s Discussion and Analysis of Financial Condition and Results of Operations.
The following discussion and analysis of our financial condition and results of operations should be read in conjunction with our consolidated financial statements and related notes appearing elsewhere in this Annual Report on Form 10-K. As discussed in the section titled “Note About Forward-Looking Statements,” the following discussion and analysis contains forward-looking statements that involve risks and uncertainties, as well as assumptions that, if they never materialize or prove incorrect, could cause our results to differ materially from those expressed or implied by such forward-looking statements. Factors that could cause or contribute to these differences include, but are not limited to, impacts on our business and general economic conditions due to the current COVID-19 pandemic, those identified below, those discussed in “Note About Forward-Looking Statements” and those discussed in the section titled “Risk Factors” under Part I, Item 1A in this Annual Report on Form 10-K.
This section of this Form 10-K generally discusses fiscal 2021 and 2020 items and year-to-year comparisons between fiscal 2021 and 2020. Discussions of fiscal 2019 items and year-to-year comparisons between fiscal 2020 and fiscal 2019 that are not included in this Form 10-K can be found in “Management’s Discussion and Analysis of Financial Condition and Results of Operations” in Part II, Item 7 of the Company’s Annual Report on Form 10-K for the fiscal year ended January 31, 2020.
Overview
We are a leading provider of Business Spend Management (“BSM”) solutions. We offer a comprehensive, cloud-based BSM platform that has connected our customers with more than seven million suppliers globally. Our platform provides greater visibility into and control over how companies spend money, optimize supply chains, and manage liquidity. Using our platform, businesses are able to achieve real, measurable value and savings that drive their profitability.
We refer to the process companies use to purchase goods and services as business spend management and to the money that they manage with this process as spend under management. Our BSM platform delivers a broad range of capabilities that would typically require the purchase and use of multiple disparate point applications. The core of our platform consists of procurement, invoicing, expense management, and payment solutions that form the transactional engine for managing a company’s business spend. In addition, our platform offers specialized modules targeted for power users, to help companies manage more technical and strategic areas of BSM, including areas such as strategic sourcing, contract management, contingent workforce, supplier risk management, supply chain design and planning, treasury management, and spend analysis.
We also provide purchasing programs, such as Coupa Advantage, which offers access to pre-negotiated discounts from various suppliers, and Source Together, which connects community members to engage in group sourcing events, allowing them to leverage pooled buying power to achieve better contracting terms and capture greater savings. Moreover, through our Coupa Open Business Network, suppliers of all sizes can list their goods and services, establish pricing, and interact with buyers electronically, thus significantly reducing paper, improving operating efficiencies, and reducing costs.
We offer access to our platform under a Software-as-a-Service (“SaaS”) business model. At the time of initial deployment, our customers often make a set of common functions available to the majority of their licensed employees, as well as incremental modules for select employees and procurement specialists, whom we refer to as power users. Therefore, we are typically able to capture a majority of the expected annual recurring revenue opportunity at the inception of our customer relationships, rather than targeting specific power users at the outset of the customer relationship with the intention of expanding and capturing more annual recurring revenue at later stages of the customer relationship. Customers can rapidly implement our platform, with implementation periods typically ranging from a few weeks to several months. Customers also benefit from software updates that typically require little downtime.
We market and sell our solutions to a broad range of enterprises worldwide. We have a diverse, multi-national customer base spanning various sizes and industries and no significant customer concentration. No customer accounted for more than 10% of our total revenues for the years ended January 31, 2021, and 2020, respectively.
We market our platform primarily through a direct sales force and also benefit from leads driven by our partner ecosystem. Our initial contract terms are typically three years, although some customers commit for longer or shorter periods. The large majority of our customers pay annually, one year in advance. Our subscription fee includes access to our service, technical support and management of the hosting infrastructure. We generally recognize revenues from our subscription fees ratably over the contractual term of the arrangement. We do not charge suppliers who are on our platform to transact with our customers. We believe this approach helps attract more suppliers to our platform and increases the value of our platform to customers.
We have continued to make significant expenditures and investments for long-term growth, including investment in our platform and infrastructure to deliver new functionality and modules to meet the evolving needs of our customers and to take advantage of our market opportunity. We intend to continue to increase our investment in sales and marketing, as we further expand our sales teams, increase our marketing activities, and grow our international operations. Internationally, we currently offer our platform in Europe, the Middle East and Africa, Latin America and Asia-Pacific, including Japan. The combined revenues from non-U.S. regions, as determined based on the billing address of our customers, constituted 38% and 36%, respectively, of our total revenues for the years ended January 31, 2021 and 2020. We believe there is further opportunity to increase our international revenues in absolute dollars and as a percentage of our total revenues. As a result, we are increasingly investing in our international operations and we intend to expand our footprint in international markets.
Operating in international markets requires significant resources and management attention and will subject us to regulatory, economic and political risks that are different from those in the United States. While we are gaining additional experience with international operations, our international expansion efforts may not be successful in creating additional demand for our platform outside of the United States or in effectively selling subscriptions to our platform in any or all of the international markets we enter.
In late 2019, a novel strain of the coronavirus disease (“COVID-19”) was identified in China, and in March 2020, the World Health Organization characterized the COVID-19 outbreak as a pandemic. The COVID-19 pandemic has resulted in authorities implementing numerous measures to try to contain and mitigate the virus, including travel bans and restrictions, business shut-downs and limitations, quarantines, and shelter-in-place and social distancing orders.
The extent to which the COVID-19 pandemic may impact our financial condition or results of operations in future periods remains uncertain. The effect of the COVID-19 pandemic may not be fully reflected in our results of operations and overall financial performance until future periods. We may experience decreased customer demand, reduced customer spend, customer bankruptcies and other non-payment situations, shorter contract duration, longer sales cycles and extended payment terms, any of which could materially adversely impact our business, results of operations and overall financial performance in future periods. The extent and continued impact of the COVID-19 pandemic on our operational and financial performance will depend in part on future developments and conditions, including the duration and spread of the outbreak; government responses to the pandemic; the impact on our customers and our sales cycles; extent of delays in hiring and onboarding new employees; and effect on our partners, vendors and supply chains, all of which are uncertain and difficult to predict. Additionally, due to concerns over the COVID-19 pandemic, we have replaced our in-person, annual Inspire conferences and other in-person marketing events with web-based alternatives. In the first quarter of fiscal 2021, we closed our offices globally and required our employees to work remotely. These changes remained in effect throughout the fourth quarter of fiscal 2021 and are expected to extend into future quarters. The impact, if any, of these and any additional operational changes we may implement is uncertain, but changes we have implemented to date have not materially impaired and are not expected to materially impair our ability to maintain operations, including financial reporting systems, internal control over financial reporting and disclosure controls and procedures. See the section “Risk Factors” for further discussion of the possible impact of the COVID-19 pandemic on our business.
Recent Business Developments
In May 2020, we acquired all of the equity interest in ConnXus, Inc. (“ConnXus”), a cloud-based supplier relationship management platform that enables enterprises, health systems and government agencies to monitor all aspects of their supplier diversity compliance programs. The purchase consideration was approximately $10.0 million in cash of which approximately $1.4 million is being held back by the Company for fifteen months after the transaction closing date.
In June 2020, we acquired all of the equity interest in Bellin Treasury International GmbH (“Bellin”), a cloud-based treasury management software platform that improves visibility and control over cash and optimizes treasury processes. The purchase consideration was approximately $121.0 million, comprised of $79.1 million in cash (of which $8.0 million is being held in escrow for eighteen months after the transaction closing date) and 186,300 shares of our common stock with a fair value of approximately $41.8 million as of the transaction close date.
In June 2020, we issued $1,380.0 million aggregate principal amount of our 0.375% Convertible Senior Notes due 2026. In conjunction with the issuance of these notes, we purchased capped calls at a total price of $192.8 million. The net proceeds from the issuance of the 2026 Notes were $1,162.3 million, net of debt issuance costs, including the underwriting discount, and the cash used to purchase the capped call. In addition, we used proceeds of approximately $450.6 million from the 2026 Notes issuance to repurchase 2023 Notes in an aggregate principal amount of approximately $89.0 million.
In September 2020, we acquired all of the equity interest in Much-Net GmbH ("Much-Net"), a financial instrument software and service provider that specializes in risk management. The purchase consideration was approximately $4.3 million in cash, which is net of $1.8 million in cash acquired.
In November 2020, we completed the acquisition of Laurel Parent Holdings, Inc. and its subsidiaries ("LLamasoft"), a supply chain design and analysis software and solutions company. The acquisition strengthens Coupa’s supply chain capabilities, enabling businesses to drive greater value through Business Spend Management. In connection with the acquisition, we issued approximately 2.4 million shares of our common stock and paid aggregate cash of approximately $791.5 million. Approximately $15.0 million of the cash paid is being held in escrow for fifteen months after the transaction closing date as security for the former LLamasoft stockholders' indemnification obligations, and approximately $7.5 million of the cash paid is being held in escrow until the completion of final adjustment on the purchase consideration.
In February 2021, we completed the acquisition of Pana Industries, Inc. ("Pana"), a corporate travel booking solution company that puts an emphasis on the traveler experience. In connection with the completion of the acquisition, we paid aggregate cash of approximately $48.5 million, and issued 23,822 shares of our common stock.
Our Business Model
Our business model focuses on maximizing the lifetime value of a customer relationship, and we continue to make significant investments in order to grow our customer base. Due to our subscription model, we recognize subscription revenues ratably over the term of the subscription period. As a result, the profitability of a customer to our business in any particular period depends in part upon how long a customer has been a subscriber on our platform. In general, the associated upfront costs with respect to new customers are higher in the first year than the aggregate revenues we recognize from those new customers in the first year. We believe that, over time, as our customer base grows and a relatively higher percentage of our subscription revenues are attributable to renewals versus new customers or upsells to existing customers, associated sales and marketing expenses and other allocated upfront costs as a percentage of revenues will decrease, subject to investments we plan to make in our business. Over the lifetime of the customer relationship, we also incur sales and marketing costs to manage the account, renew or upsell the customer to more modules and more users. However, these costs are significantly less than the costs initially incurred to acquire the customer. We calculate the lifetime value of our customers and associated customer acquisition costs for a particular year by comparing (i) gross profit from net new subscription revenues for the year multiplied by the inverse of the estimated subscription renewal rate to (ii) total sales and marketing expense incurred in the preceding year. On this basis, we estimate that for each of fiscal 2021 and 2020, the calculated lifetime value of our customers has exceeded six times the associated cost of acquiring them.
Key Metrics
We review the following key metrics to evaluate our business, measure our performance, identify trends affecting our business, formulate business plans and make strategic decisions:
| | | | | | | | | | | | | | | | | |
| As of January 31, |
| 2021 | | 2020 | | 2019 |
| Cumulative spend under management (in billions) | $ | 2,359.3 | | | $ | 1,655.2 | | | $ | 1,079.2 | |
| Remaining performance obligations (in millions) | $ | 952.3 | | | $ | 724.9 | | | $ | 498.6 | |
| Deferred revenue (in millions) | $ | 361.9 | | | $ | 261.8 | | | $ | 182.6 | |
| Trailing twelve months calculated billings (in millions) | $ | 641.7 | | | $ | 468.9 | | | $ | 314.9 | |
| Customers with annualized subscription revenue above $100,000 | 1,082 | | 813 | | 602 |
Cumulative Spend Under Management
Cumulative spend under management represents the aggregate dollar value of transactions through our core platform for all of our customers collectively since we launched our core platform. We define our core platform for purposes of this metric as our procurement, invoicing and expense management modules. We calculate this metric by aggregating the actual transaction data for purchase orders, invoices and expenses from customers using our core platform. Cumulative spend under management does not include spending data or transactions associated with modules from acquired companies. We regularly review our process for calculating this metric and periodically make adjustments to improve its accuracy. We believe that any such adjustments are immaterial unless otherwise stated.
The cumulative spend under management metric presented above does not directly correlate to our revenue or results of operations because we do not generally charge our customers based on actual usage of our core platform. However, we believe the cumulative spend under management metric does illustrate the adoption, scale and value of our platform, which we believe enhances our ability to maintain existing customers and attract new customers.
Remaining Performance Obligations and Deferred Revenue
Remaining performance obligations represents the amount of consideration allocated to unsatisfied performance obligations related to non-cancelable contracts, which include both the deferred revenue balance and amounts that will be invoiced and recognized as revenue in future periods. In calculating the remaining performance obligation amount, we elected to apply the two expedients under the revenue standard to exclude remaining performance obligations amounts related to contracts that are twelve months or less and contracts where revenue is being recognized under the as-invoiced method.
We generally execute multiple year subscription contracts for our platform and invoice an initial amount at contract signing followed by subsequent annual invoices. At any point in the contract term, there might be amounts that are not due for billing yet. These amounts are not recorded in our consolidated financial statements, and are considered to be part of the remaining performance obligations amount.
The remaining performance obligations amount is intended to provide visibility into future revenue streams. We expect remaining performance obligations to fluctuate up or down from period to period for several possible reasons, including amounts, timing, and duration of customer contracts (including changes that we may see to customer contracts as a result of the COVID-19 pandemic), as well as the timing of billing cycles for each order.
Our deferred revenue consists of amounts that have been invoiced but not yet recognized as revenues as of the end of a reporting period. The majority of our deferred revenue balance consists of subscription revenues that are recognized ratably over the related contractual period.
Trailing Twelve Months Calculated Billings
Trailing twelve months calculated billings represents total revenues recognized during the period of consecutive twelve months ended January 31, 2021 and 2020 plus the change in deferred revenue for each of those same periods. Trailing twelve month calculated billings is comprised of subscription contracts with existing customers (including renewal contracts and add-on contracts), subscription contracts with new customers, and contracts for professional services, training and other revenues.
The trailing twelve months calculated billings is intended to provide information about our subscription revenue growth over time, and can typically be seen as an early indicator of trends in revenue growth. While trailing twelve months calculated billings can increase as our revenues grow, it may fluctuate up or down from period to period for several reasons, including amounts, timing, and duration of customer contracts (including changes that we may see to customer contracts as a result of the COVID-19 pandemic), as well as the timing of billing cycles for each order.
Customers with Annualized Subscription Revenue Above $100,000
We define customers with annualized subscription revenue above $100,000 as the total number of customers that contributed subscription revenues in excess of $25,000 during the relevant fiscal quarter, which corresponds to $100,000 on an annualized basis. For purposes of this metric, we generally define a customer as a separate and distinct entity (such as a company or an educational or government institution), a distinct business unit of a large corporation or a partner organization, in each case that has an active contract with us to access our services. Most of the subscription revenue we recognize each quarter is attributable to customers that accounted for more than $25,000 of that revenue during the quarter, and our sales and marketing strategy focuses heavily on the acquisition of customers that have the potential to contribute at least $100,000 in subscription revenues annually. Accordingly, we believe that this metric is a useful tool to aid investors in understanding a key factor that drives changes in our subscription revenues from period to period and in assessing trends in our growth, penetration of our core customer market, and our overall performance. Because the dollar threshold is tied to the actual revenue recognized during a particular quarter, customers that we acquired midway through or at the end of the quarter may not yet be included in this count, even if they have placed orders representing more than $100,000 in annual subscription revenue.
Components of Results of Operations
Revenues
We primarily offer subscriptions to our cloud-based BSM platform, including procurement, invoicing and expense management and pay. We derive our revenues primarily from subscription fees and professional services fees.
Subscription revenues consist primarily of fees to provide our customers access to our cloud-based platform, which includes routine customer support at no additional cost. Term-based licenses are sold as bundled arrangements that include the rights to a term license and post-contract customer support (“PCS”). Accordingly, we allocate the transaction price to each performance obligation. The revenues related to the amount allocated to PCS are included in subscription revenue, which are recognized ratably over the contract term beginning on the license delivery date. Professional services fees and other include deployment services, optimization services, training, and revenues allocated to license component for the sales of term-based licenses. Subscription revenues are a function of renewal rates, the number of customers, the number of users at each customer, the number of modules subscribed to by each customer, and the price of our modules.
Generally, subscription fees are recognized ratably as revenues over the contract term beginning on the date the application is made available to the customer. Our new business subscriptions typically have a term of three years, although some customers commit for longer or shorter periods. We generally invoice our customers in annual installments at the beginning of each year in the subscription period. Amounts that have been invoiced are initially recorded as deferred revenue and are recognized ratably over the subscription period. Amounts that will be invoiced and recognized as revenue in future periods are reflected as remaining performance obligations within the notes to our consolidated financial statements.
Professional services revenues and other consist primarily of fees associated with the implementation and configuration of our subscription service and revenues allocated to the license component for sales of term-based licenses. Professional services are generally sold on a time-and-materials or fixed-fee basis. Revenue for both time-and-material and fixed-fee arrangements are recognized over-time as the services are performed. We have the ability to reasonably measure progress towards completion of the professional services arrangements. For fixed-fee arrangements, we recognize revenue on the basis of performed hours relative to the total estimated hours to complete satisfaction of the professional service arrangement. For the license component from the sales of term-based licenses, we recognize revenues at the start of the license term when delivery is complete.
Our professional services engagements typically span from a few weeks to several months. For this reason, our professional services revenues may fluctuate significantly from period to period. The terms of our typical professional services arrangements provide that our customers pay us within 30 days from the invoice date. Fixed-fee services arrangements are generally invoiced in advance. We have made significant investments in our professional services business that are designed to ensure customer success and adoption of our platform. We are continuing to invest in expanding our professional services partner ecosystem to further support our customers. As the professional services practices of our partner firms continue to develop, we expect them to increasingly contract directly with our subscription customers and we incentivize our sales force to further this objective.
Cost of Revenues
Subscription
Cost of subscription consists primarily of expenses related to hosting our service and providing customer support. Significant expenses are comprised of data center capacity costs; personnel and related costs directly associated with our cloud infrastructure and customer support, including salaries, benefits, bonuses and stock-based compensation; allocated overhead; and amortization of acquired developed technology and capitalized software development costs.
Professional Services and Other Cost of Revenues
Cost of professional services and other cost of revenues consist primarily of personnel and related costs directly associated with our professional services and training departments, including salaries, benefits, bonuses and stock-based compensation; the costs of contracted third-party vendors, amortization of acquired developed technology; and allocated overhead. These costs are generally expensed in the period incurred.
Professional services associated with the implementation and configuration of our subscription platform are performed directly by our services team, as well as by contracted third-party vendors. In cases in which third-party vendors invoice us for services performed for our customers, those fees are accrued over the requisite service period.
Operating Expenses
Research and Development
Research and development expenses consist primarily of personnel costs of our development team, including salaries, benefits, bonuses, stock-based compensation expense and allocated overhead costs. Our cycle of frequent updates has facilitated rapid innovation and the introduction of new modules throughout our history. We have aggressively invested, and intend to continue to invest, in developing technology to support our growth. We capitalize certain software development costs that are attributable to developing new modules and features and adding incremental functionality to our platform, and we amortize such costs as costs of subscription revenues over the estimated life of the new application or incremental functionality, which is typically either two or three years.
Sales and Marketing
Sales and marketing expenses consist primarily of personnel and related costs directly associated with our sales and marketing staff, including salaries, benefits, bonuses, commissions and stock-based compensation. Commissions earned by our sales force that are considered incremental costs for obtaining a non-cancelable subscription contract are deferred and amortized over a period of benefit that we have determined to be five years. For commissions earned from the sale of term-based license contracts, we allocate the costs of commission in proportion to the allocation of transaction price of license and PCS performance obligations. Commissions associated with the license component are expensed at the time the related revenue is recognized. Commissions allocated to PCS are deferred and then amortized over five years. Other sales and marketing costs include promotional events to promote our brand, including our Inspire conferences, web advertising, events, allocated overhead and amortization of customer relationships and trademark.
General and Administrative
General and administrative expenses consist of personnel costs and related expenses for executive, finance, legal, human resources, recruiting, and administrative personnel, including salaries, benefits, bonuses and stock-based compensation expense; professional fees for external legal, accounting, recruiting and other consulting services and allocated overhead costs. During fiscal 2021, general and administrative expenses included a benefit of $12.5 million related to the reversal of the Yapta contingent consideration payable, as explained in Note 4, “Business Combinations” in the notes to our consolidated financial statements.
Interest Expense
Interest expense consists primarily of interest expense associated with our outstanding convertible senior notes.
Interest Income and Other, Net
Interest income and other, net consists primarily of interest income earned on our investments in marketable securities and cash and cash equivalents, and gain or loss on conversion of convertible senior notes, in addition to the effects of exchange rates on our foreign currency-denominated asset and liability balances which are recorded as foreign currency gains (losses) in the consolidated statements of operations.
Provision for (Benefit from) Income Taxes
Provision for income taxes consists primarily of income taxes related to foreign and state jurisdictions in which we conduct business. Benefit from income taxes is primarily related to the release of valuation allowances for deferred tax assets for the year ended January 31, 2021, partially offset by income taxes related to foreign and state jurisdictions. We maintain a full valuation allowance on net deferred tax assets of our U.S. and the majority of our international entities as we have concluded that it is not more likely than not that the deferred assets will be utilized.
Results of Operations
The following tables set forth selected consolidated statements of operations data and such data as a percentage of total revenues for each of the periods indicated:
| | | | | | | | | | | | | | | | | | | | | | | | | | | | | | | | | | | |
| For the year ended January 31, |
| 2021 | | 2020 | | 2019 |
| (in thousands, except percentages) | | |
| Revenues: | | | |
| Subscription | $ | 470,341 | | | 87 | % | | $ | 345,261 | | | 89 | % | | $ | 233,428 | | | 90 | % |
| Professional services and other | 71,302 | | | 13 | | | 44,458 | | | 11 | | | 26,938 | | | 10 | |
| Total revenues | 541,643 | | | 100 | | | 389,719 | | | 100 | | | 260,366 | | | 100 | |
| Cost of revenues: | | | | | | | | | | | |
| Subscription | 147,374 | | | 27 | | | 89,452 | | | 23 | | | 53,153 | | | 20 | |
| Professional services and other | 74,327 | | | 14 | | | 49,764 | | | 13 | | | 30,301 | | | 12 | |
| Total cost of revenues | 221,701 | | | 41 | | | 139,216 | | | 36 | | | 83,454 | | | 32 | |
| Gross profit | 319,942 | | | 59 | | | 250,503 | | | 64 | | | 176,912 | | | 68 | |
| Operating expenses: | | | | | | | | | | | |
| Research and development | 133,842 | | | 25 | | | 93,089 | | | 24 | | | 61,608 | | | 24 | |
| Sales and marketing | 236,312 | | | 44 | | | 155,216 | | | 40 | | | 105,659 | | | 41 | |
| General and administrative | 116,341 | | | 21 | | | 75,623 | | | 19 | | | 57,005 | | | 22 | |
| Total operating expenses | 486,495 | | | 90 | | | 323,928 | | | 83 | | | 224,272 | | | 87 | |
| Loss from operations | (166,553) | | | (31) | | | (73,425) | | | (19) | | | (47,360) | | | (19) | |
| Interest expense | (91,271) | | | (17) | | | (37,658) | | | (10) | | | (12,518) | | | (5) | |
| Interest income and other, net | 13,321 | | | 2 | | | 9,316 | | | 2 | | | 3,817 | | | 1 | |
| Loss before benefit from income taxes | (244,503) | | | (46) | | | (101,767) | | | (27) | | | (56,061) | | | (23) | |
| Benefit from income taxes | (64,386) | | | (12) | | | (10,935) | | | (3) | | | (537) | | | — | |
| Net loss | $ | (180,117) | | | (34) | % | | $ | (90,832) | | | (24) | % | | $ | (55,524) | | | (23) | % |
Fiscal Years Ended January 31, 2021 and 2020
Revenues
| | | | | | | | | | | | | | | | | |
| For the year ended
January 31, | | % Change |
| 2021 | | 2020 | |
| (in thousands) | | |
| Subscription | $ | 470,341 | | | $ | 345,261 | | | 36 | % |
| Professional services and other | 71,302 | | | 44,458 | | | 60 | % |
| Total revenues | $ | 541,643 | | | $ | 389,719 | | | 39 | % |
Total revenues were $541.6 million for the fiscal year ended January 31, 2021 compared to $389.7 million for the fiscal year ended January 31, 2020, an increase of $151.9 million, or 39%. Subscription revenues were $470.3 million, or 87% of total revenues, for the fiscal year ended January 31, 2021, compared to $345.3 million, or 89% of total revenues, for the fiscal year ended January 31, 2020. This increase in absolute dollars was predominantly driven by the increase in the number of customers with annualized subscription revenue above $100,000, which was 1,082 as of January 31, 2021, compared to 813 as of January 31, 2020. Professional services and other revenues were $71.3 million for the fiscal year ended January 31, 2021 compared to $44.5 million for the fiscal year ended January 31, 2020. The increase of $26.8 million, or 60%, was primarily due to an increase in implementation services as a result of our expanded customer base.
We will continue to monitor the COVID-19 pandemic carefully and its impact on our customers and customer acquisitions.
Cost of Revenues
| | | | | | | | | | | | | | | | | |
| For the year ended
January 31, | | % Change |
| 2021 | | 2020 | |
| (in thousands) | | |
| Subscription | $ | 147,374 | | | $ | 89,452 | | | 65 | % |
| Professional services and other | 74,327 | | | 49,764 | | | 49 | % |
| Total cost of revenues | $ | 221,701 | | | $ | 139,216 | | | 59 | % |
Cost of subscription was $147.4 million for the fiscal year ended January 31, 2021 compared to $89.5 million for the fiscal year ended January 31, 2020, an increase of $57.9 million, or 65%. The increase in cost of subscription was primarily due to an increase of $18.4 million in hosting fees to accommodate increased customer spend, an increase of $18.4 million in amortization of developed technology assets related to acquisitions, an increase of $11.3 million in employee compensation costs related to higher headcount, including stock-based compensation costs, an increase of $5.0 million in license and subscription fees, an increase of $3.6 million in amortization of capitalized development costs, and a $1.2 million increase in other costs driven by our overall growth.
Cost of professional services was $74.3 million for the fiscal year ended January 31, 2021, compared to $49.8 million for the fiscal year ended January 31, 2020, an increase of $24.5 million, or 49%. The increase in cost of professional services was primarily due to an increase of $20.7 million in employee compensation costs related to higher headcount, including stock-based compensation costs, an increase of $6.7 million in amortization of developed technology assets related to acquisitions, and an increase of $1.1 million of other costs. This was partially offset by a decrease of $2.6 million due to a reduction in travel costs due to current travel restrictions associated with the COVID-19 pandemic, and from a decrease of $1.4 million in professional and outside services primarily related to customer implementations.
We will continue to monitor the COVID-19 pandemic carefully and its impact on our cost profile in providing hosting solutions and services to our customers.
Gross Profit
| | | | | | | | | | | | | | | | | |
| For the year ended
January 31, | | % Change |
| 2021 | | 2020 | |
| (in thousands) | | |
| Gross profit | $ | 319,942 | | | $ | 250,503 | | | 28 | % |
Gross profit was $319.9 million for the fiscal year ended January 31, 2021, compared to $250.5 million for the fiscal year ended January 31, 2020, an increase of $69.4 million, or 28%. The increase in gross profit was primarily due to the acquisition of new customers with annualized subscription revenue above $100,000. Gross margin was 59% for the fiscal year ended January 31, 2021, compared to 64% for the fiscal year ended January 31, 2020. The decrease in gross margin was primarily due to the increase in amortization of developed technology assets related to acquisitions.
Operating Expenses
Research and Development
| | | | | | | | | | | | | | | | | |
| For the year ended
January 31, | | % Change |
| 2021 | | 2020 | |
| (in thousands) | | |
| Research and development | $ | 133,842 | | | $ | 93,089 | | | 44 | % |
Research and development expenses were $133.8 million for the fiscal year ended January 31, 2021 compared to $93.1 million for the fiscal year ended January 31, 2020, an increase of $40.7 million, or 44%. The increase was primarily due to an increase of $39.3 million in employee compensation costs related to higher headcount, including stock-based compensation costs, an increase of $1.8 million in costs associated with the development of our platform and other costs for research and development activities, an increase in outside services of $1.5 million, and a $1.6 million increase in other costs driven by our overall growth. This was partially offset by a $2.1 million increase in capitalization of development costs and $1.4 million reduction in travel costs due to current travel restrictions associated with the COVID-19 pandemic.
Sales and Marketing
| | | | | | | | | | | | | | | | | |
| For the year ended
January 31, | | % Change |
| 2021 | | 2020 | |
| (in thousands) | | |
| Sales and marketing | $ | 236,312 | | | $ | 155,216 | | | 52 | % |
Sales and marketing expenses were $236.3 million for the fiscal year ended January 31, 2021, compared to $155.2 million for the fiscal year ended January 31, 2020, an increase of $81.1 million, or 52%. The increase was primarily due to an increase of $66.2 million in employee compensation costs related to higher headcount, including stock-based compensation costs, an increase of $13.9 million increase in customer relationship amortization costs, an increase of $2.4 million in marketing costs, an increase of $1.7 million in hosting fees to accommodate sales related activities, an increase in outside services of $1.7 million, and an increase of $3.5 million in other costs driven by our overall growth. This was partially offset by a reduction in travel costs of $8.3 million due to current travel restrictions associated with the COVID-19 pandemic. In response to the COVID-19 pandemic, we have replaced our in-person marketing events with web-based marketing and remote events.
General and Administrative
| | | | | | | | | | | | | | | | | |
| For the year ended
January 31, | | % Change |
| 2021 | | 2020 | |
| (in thousands) | | |
| General and administrative | $ | 116,341 | | | $ | 75,623 | | | 54 | % |
General and administrative expenses were $116.3 million for the fiscal year ended January 31, 2021 compared to $75.6 million for the fiscal year ended January 31, 2020, an increase of $40.7 million, or 54%. The increase was primarily due to $44.6 million in employee compensation costs related to higher headcount, including stock-based compensation costs, an increase in outside services of $4.0 million, an increase in allowances for doubtful accounts and credit losses of $3.4 million, and from an increase of $1.2 million in other costs driven by our overall growth. This was partially offset by a benefit of $12.5 million arising from the reversal of the Yapta contingent consideration liability during the fiscal year ended January 31, 2021.
Interest Expense
| | | | | | | | | | | | | | | | | |
| For the year ended
January 31, | | % Change |
| 2021 | | 2020 | |
| (in thousands) | | |
| Interest expense | $ | 91,271 | | | $ | 37,658 | | | 142 | % |
Interest expense was $91.3 million for the fiscal year ended January 31, 2021, compared to $37.7 million for the fiscal year ended January 31, 2020. The $53.6 million increase in interest expense was primarily due to amortization of the debt discount and issuance costs on the 2026 Notes issued in the second quarter of fiscal 2021, and from the 2025 Notes issued in the second quarter of fiscal 2020, partially offset by a reduction of interest expenses associated with the repurchases and conversions of a portion of the 2023 Notes during fiscal 2021.
Interest Income and Other, Net
| | | | | | | | | | | | | | | | | |
| For the year ended
January 31, | | % Change |
| 2021 | | 2020 | |
| (in thousands) | | |
| Interest income and other, net | $ | 13,321 | | | $ | 9,316 | | | 43 | % |
Interest income and other, net was $13.3 million for the fiscal year ended January 31, 2021 compared to $9.3 million for the fiscal year ended January 31, 2020. The $4.0 million increase in interest income and other, net was primarily due to a favorable impact of $5.5 million related to foreign currency exchange, an increase of $3.2 million from early conversions gains on the 2023 Notes, and an increase of $0.3 million in other miscellaneous income, partially offset by a decrease of $5.0 million in income earned from our investments in marketable securities and money market funds primarily as a result of a lower market yield.
Benefit From Income Taxes
| | | | | | | | | | | | | | | | | |
| For the year ended
January 31, | | % Change |
| 2021 | | 2020 | |
| (in thousands) | | |
| Benefit from income taxes | $ | (64,386) | | | $ | (10,935) | | | NM |
The benefit from income taxes was $64.4 million for the fiscal year ended January 31, 2021, compared to benefit from income taxes of $10.9 million for the fiscal year ended January 31, 2020. Benefit from income taxes for the fiscal year ended January 31, 2021 is primarily related to the release of valuation allowances for deferred tax assets due to the recognition of deferred tax liabilities from acquisitions completed during the year, partially offset by income taxes related to foreign and state jurisdictions. We maintain a full valuation allowance on net deferred tax assets of our U.S. and the majority of our international entities as we have concluded that it is not more likely than not that the deferred assets will be utilized.
Fiscal Years Ended January 31, 2020 and 2019
For a comparison of our results of operations for the fiscal years ended January 31, 2020 and 2019, see Item 7, Management’s Discussion and Analysis of Financial Condition and Results of Operations, of our Annual Report on Form 10-K for the fiscal year ended January 31, 2020, filed with the SEC on March 20, 2020.
Liquidity and Capital Resources
Our principal sources of liquidity are cash, cash equivalents, marketable securities, and cash generated from operations. As of January 31, 2021, we had cash and cash equivalents of $323.3 million, and marketable securities of $283.0 million. In November 2020, we completed the acquisition of LLamasoft, Inc. In connection with the completion of the acquisition, we paid approximately $791.5 million in cash and issued approximately 2.4 million shares of our common stock.
We had outstanding 2023 Notes, 2025 Notes and 2026 Notes with principal amounts of $8.8 million, $805.0 million and $1,380.0 million, respectively, as of January 31, 2021.
As of January 31, 2021, the remaining 2023 Notes with a principal amount of $8.8 million and 2025 Notes with a principal amount of $805.0 million are convertible at the option of the holders. We have the ability to settle the Convertible Notes in cash, shares of our common stock, or a combination of cash and shares of our common stock at our own election. As of January 31, 2021, the unsettled conversion requests related to the 2023 Notes and 2025 Notes were not material. From February 1, 2021 to the date of this Annual Report, we have not received additional requests on either of the 2023 Notes or 2025 Notes. The 2026 Notes were not convertible as of January 31, 2021. It is our current intent to settle conversions of the remaining 2023 Notes and the 2025 and 2026 Notes through combination settlement, which involves repayment of the principal portion in cash and any excess of the conversion value over the principal amount in shares of our common stock.
In conjunction with the issuance of the Convertible Notes, we entered into capped call transactions that reduce our exposure to additional cash payments above principal balances in the event of a cash conversion of the Convertible Notes. We may owe additional cash to the noteholders upon early conversion if our stock price exceeds $63.821 per share for the 2023 Notes, $295.55 for the 2025 Notes, or $503.42 for the 2026 Notes. Although our incremental exposure to the additional cash payment above the principal amount of the Convertible Notes is reduced by the capped calls, conversion of the Convertible Notes by noteholders may cause dilution to the ownership interests of existing stockholders. We did not exercise the capped calls for the converted 2023 Notes and 2025 Notes. As of January 31, 2021 all the capped calls for the 2023 Notes and 2025 Notes remained outstanding.
Our cash equivalents are comprised primarily of bank deposits and money market funds. Cash from operations could be affected by various risks and uncertainties, including, but not limited to, the effects of the COVID-19 pandemic and other risks detailed in Part I, Item 1A titled “Risk Factors.” However, we believe our existing cash and cash equivalents and marketable securities will be sufficient to meet our projected operating requirements for at least the next 12 months from the filing of this Annual Report.
Our future capital requirements will depend on many factors, including our pace of growth, subscription renewal activity, the timing and extent of spend to support development efforts, the expansion of sales and marketing activities, the introduction of new and enhanced services offerings and the continuing market acceptance of our services. We continually assess potential acquisitions and expect to continue to pursue acquisitions of or investments in complementary businesses, services and technologies and intellectual property rights. We may be required to seek additional equity or debt financing. In the event that additional financing is required from outside sources, we may not be able to raise it on terms acceptable to us, or at all. If we are unable to raise additional capital when desired, our business, operating results and financial condition would be adversely affected.
Operating Activities
Cash provided by operating activities for the fiscal year ended January 31, 2021 was $78.2 million compared to $68.2 million for the year ended January 31, 2020. This increase was primarily driven by cash collections from customers, partially offset by approximately $27.4 million repayments of convertible senior notes attributable to debt discount and $19.4 million from one-time payout of legacy unvested stock awards accelerated in conjunction with the LLamasoft acquisition, which were classified as cash outflows in operating activities for the fiscal year ended January 31, 2021.
Investing Activities
Cash used in investing activities for the fiscal year ended January 31, 2021 of $661.1 million was primarily related to cash used in the acquisition of ConnXus, Bellin, Much-Net and LLamasoft of $856.7 million, $11.5 million for the purchases of property and equipment, and from $6.9 million release of holdback purchase consideration related to previous business acquisitions, partially offset by $214.0 million of net purchases, maturities and sales of short-term marketable securities.
Financing Activities
Cash provided by financing activities for the fiscal year ended January 31, 2021 of $641.8 million was primarily due to net proceeds of $1,355.1 million from the issuance of 2026 Notes, partially offset by $192.8 million proceeds used to purchase the associated capped calls and $555.4 million for repayments and cancellations of the 2023 Notes. In addition, there was approximately $34.9 million of proceeds from the exercise of stock options and issuance of common stock under the ESPP during the fiscal year ended January 31, 2021.
Off-Balance Sheet Arrangements
Through January 31, 2021, we did not have any relationships with unconsolidated organizations or financial partnerships, such as structured finance or special purpose entities that would have been established for the purpose of facilitating off-balance sheet arrangements or other contractually narrow or limited purposes.
Commitments and Contractual Obligations
Our principal commitments and contractual obligations consist of our Convertible Notes, obligations under operating leases for office facilities and contractual purchase obligations for hosting services and web development services that support our business operations. The following table summarizes our non-cancelable contractual obligations as of January 31, 2021.
| | | | | | | | | | | | | | | | | | | | | | | | | | | | | |
| | | Payments due by period |
| Total | | Less Than
1 Year | | 1-3 Years | | 3-5 Years | | More Than
5 Years |
| (in thousands) |
Convertible senior notes (1) | $ | 2,193,831 | | | $ | 2,957 | | | $ | 5,877 | | | $ | 804,997 | | | $ | 1,380,000 | |
Aggregate interest obligation(1)(2) | 32,532 | | | 6,204 | | | 12,387 | | | 11,353 | | | 2,588 | |
| Operating lease obligations | 49,217 | | | 14,060 | | | 23,727 | | | 9,125 | | | 2,305 | |
| Purchase obligations | 40,287 | | | 15,669 | | | 23,468 | | | 1,150 | | | — | |
| Total contractual obligations | $ | 2,315,867 | | | $ | 38,890 | | | $ | 65,459 | | | $ | 826,625 | | | $ | 1,384,893 | |
(1)The conversion period for the 2023 Notes and 2025 Notes was open as of January 31, 2021, and as such the net carrying value of the 2023 Notes and 2025 Notes are included within current liabilities on our consolidated balance sheet. The principal balances of $8.8 million and $805.0 million of the 2023 Notes and 2025 Notes, respectively, were reflected in the payment period in the table above based on the contractual maturity assuming no conversion or repurchase.
(2)Represents estimated aggregate interest obligations for our outstanding Convertible Notes that are payable in cash.
Critical Accounting Policies and Estimates
Our management’s discussion and analysis of our financial condition and results of operations is based on our financial statements, which have been prepared in accordance with GAAP. The preparation of these financial statements requires us to make estimates and assumptions that affect the reported amounts of assets and liabilities and the disclosure of contingent assets and liabilities at the date of the financial statements, as well as the reported revenues generated and expenses incurred during the reporting periods. Our estimates are based on our historical experience and on various other factors that we believe are reasonable under the circumstances, the results of which form the basis for making judgments about the carrying value of assets and liabilities that are not readily apparent from other sources. Actual results may differ from these estimates under different assumptions or conditions. We believe that the accounting policies discussed below are critical to understanding our historical and future performance, as these policies relate to the more significant areas involving management’s judgments and estimates.
Revenue Recognition
We derive our revenues primarily from subscription fees, professional services fees and other. Revenues are recognized when control of these services are transferred to our customers in an amount that reflects the consideration we expect to be entitled to in exchange for those services. Revenues are recognized net of applicable taxes imposed on the related transaction. Our revenue recognition policy follows guidance from Accounting Standards Codification 606, Revenue from Contracts with Customers (Topic 606).
We determine revenue recognition through the following five-step framework:
• Identification of the contract, or contracts, with a customer;
• Identification of the performance obligations in the contract;
• Determination of the transaction price;
• Allocation of the transaction price to the performance obligations in the contract; and
• Recognition of revenue when, or as, we satisfy a performance obligation.
Subscription Revenues
We offer subscriptions to our cloud-based business spend management platform, including procurement, invoicing, expense management and pay. Subscription services revenues consist primarily of fees to provide our customers access to our cloud-based platform, which includes routine customer support. Subscription service contracts do not provide customers with the right to take possession of the software, are non-cancelable, and do not contain general rights of return. Generally subscription revenues are recognized ratably over the contractual term of the arrangement, beginning on the date that the service is made available to the customer. Subscription contracts typically have a term of three years with invoicing occurring in annual installments at the beginning of each year in the subscription period.
Subscription revenues also include fees to provide post-contract customer support related to the term-based licenses. The post-contract customer support revenues are recognized ratably over the contract term beginning on the license delivery date.
Professional Services Revenues and Other
We offer professional services which include deployment services, optimization services, and training. Professional services are generally sold on a time-and-materials basis or fixed-fee basis. For services billed on a fixed-fee basis, invoicing typically occurs in advance, and revenue is recognized over time based on the proportion performed. For services billed on a time-and-materials basis, revenue is recognized over time as services are performed.
Other revenues include the sales of term-based licenses that we acquired from business combinations. The revenues are recognized at the start of the license term when delivery is complete.
Significant Judgments
Our contracts with customers often include promises to transfer multiple products and services to a customer. For these contracts, we account for individual performance obligations separately if they are distinct. Subscription services, professional services, the right to term-based licenses, and related post-contract customer support are distinct performance obligations that are accounted for separately. In contracts with multiple performance obligations, the transaction price is allocated to each separate performance obligations on a relative standalone selling price ("SSP") basis.
The determination of standalone selling price for each distinct performance obligations requires judgment. We determine SSP for performance obligations based on overall pricing objectives, which take into consideration market conditions and entity-specific factors. This includes a review of historical sales data related to the size of arrangements, the applications being sold, customer demographics and the numbers and types of users within the arrangements. We use a range of amounts to estimate SSP for performance obligations. There is typically more than one SSP for individual products and services due to the stratification of those products and services by certain considerations such as size and sales regions.
Deferred Commissions
Commissions are earned by sales personnel upon the execution of the sales contract by the customer, and commission payments are made shortly after they are earned. Commission costs can be associated specifically with subscription, professional services, and license arrangements. Commissions earned by our sales personnel are considered incremental and recoverable costs of obtaining a contract with a customer. These costs are deferred and then amortized over a period of benefit of five years. We determined the period of benefit by taking into consideration our past experience with customers, future cash flows expected from customers, industry peers and other available information.
For commissions earned from the sale of term-based license contracts, we allocate the costs of commission in proportion to the allocation of transaction price of license and PCS performance obligations. Commissions associated with the license component are expensed at the time the related revenue is recognized. Commissions allocated to PCS are deferred and then amortized over a period of benefit of five years.
We capitalized commission costs of $24.2 million, and $26.2 million and amortized $14.7 million and $9.6 million to sales and marketing expense in the accompanying consolidated statements of operations during the years ended January 31, 2021 and 2020, respectively.
Business Combinations
We account for acquisitions of entities that include inputs and processes and have the ability to create outputs as business combinations. For acquired businesses, we record tangible and intangible assets acquired and liabilities assumed based on their estimated fair values at the acquisition dates. The excess of the purchase price over those fair values is recorded as goodwill. During the measurement period, which may be up to one year from the acquisition date, we may record adjustments to the assets acquired and liabilities assumed with the corresponding offset to goodwill. Upon the conclusion of the measurement period or final determination of the values of assets acquired or liabilities assumed, whichever comes first, any subsequent adjustments are recorded to the consolidated statements of operations.
Accounting for business combinations requires our management to make significant estimates and assumptions at the acquisition date, including estimated fair value of acquired intangible assets, and related amortization period. The estimates of fair value require management to also make estimates of, among other things, future expected cash flows, discount rates or expected costs to reproduce an asset. Although we believe the assumptions and estimates we have made in the past have been reasonable and appropriate, these estimates are based on historical experience and information obtained from the management of the acquired companies and are inherently uncertain.
We review goodwill for impairment annually during the fourth quarter or more frequently if events or changes in circumstances would more likely than not reduce the fair value of our single reporting unit below its carrying value. As of January 31, 2021, no impairment of goodwill has been identified.
Acquired finite-lived intangible assets are amortized over their estimated useful lives. We evaluate the recoverability of our intangible assets for possible impairment whenever events or circumstances indicate that the carrying amount of such assets may not be recoverable. We have not recorded any significant impairment charges during the years presented.
In addition to the recoverability assessment, we routinely review the remaining estimated useful lives of our finite-lived intangible assets. If we modify the estimated useful life assumption for any asset, the remaining unamortized balance would be amortized over the revised estimated useful life.
Convertible Notes
We account for the issued convertible senior notes (“Convertible Notes”) as separate liability and equity components. The carrying amount of the liability component was calculated by measuring the fair value of a similar liability that does not have an associated convertible feature using a discounted cash flow model with a discount rate associated with each convertible note. The discount rates were determined primarily using observable yields for stand-alone debt instruments with a comparable credit rating and term. In addition, for the 2026 Notes, the Company also used lattice models to determine the discount rate. The carrying amount of the equity component representing the conversion option was determined by deducting the fair value of the liability component from the par value of the Convertible Notes as a whole. This difference represents a debt discount that is amortized to interest expense over the term of the Convertible Notes using the effective interest rate method. The equity component is not remeasured as long as it continues to meet the conditions for equity classification. We allocated issuance costs incurred to the liability and equity components. Issuance costs attributable to the liability component are being amortized to expense over the respective term of the Convertible Notes, and issuance costs attributable to the equity components were netted with the respective equity component in additional paid in capital.
To the extent that we receive note conversion requests prior to the maturity of the Convertible Notes, a portion of the equity component is classified as temporary equity, which is measured as the difference between the principal and net carrying amount of the notes requested for conversion. Upon settlement of the conversion requests, the difference between the fair value and the amortized book value of the liability component of the Convertible Notes requested for conversion is recorded as a gain or loss on early note conversion. The fair value of the Convertible Notes are measured based on a similar liability that does not have an associated convertible feature over the remaining term of the Convertible Notes.
Recent Accounting Pronouncements
Refer to Note 2, “Significant Accounting Policies” in the notes to consolidated financial statements included elsewhere in this Annual Report for analysis of recent accounting pronouncements that are applicable to our business.
Item 7A. Quantitative and Qualitative Disclosures About Market Risk.
Foreign Currency Exchange Risk
Our results of operations and cash flows are subject to fluctuations due to changes in foreign currency exchange rates, particularly changes in the Euro, British Pound Sterling, and Canadian Dollar. We expect our international operations to continue to grow in the future and we are continually monitoring the magnitude of our foreign currency exposure.
We performed a sensitivity analysis and determined that if an adverse 10% foreign currency exchange rate change was applied to total monetary assets and liabilities denominated in currencies other than the functional currency at the balance sheet dates, it would have resulted in an adverse effect on our net losses of approximately $7.8 million and $6.3 million as of January 31, 2021 and 2020, respectively. We expect our international operations to continue to grow in the near term and the effects of movements in currency exchange rates will increase as our transaction volume outside of the United States increases. In addition, we will continue to monitor the COVID-19 pandemic carefully and its impact on our foreign currencies. Most of our agreements have been and we expect will continue to be denominated in U.S. dollars.
Market Risk and Market Interest Risk
In June 2020, we issued $1,380.0 million aggregate principal amount of 0.375% convertible senior notes due 2026. In June 2019, we issued $805.0 million aggregate principal amount of 0.125% convertible senior notes due 2025. In January 2018, we issued $230.0 million aggregate principal amount of 0.375% convertible senior notes due 2023, of which approximately $221.2 million aggregate principal amount had been settled by January 31, 2021. The 2026 Notes, 2025 Notes and 2023 Notes have fixed annual interest rates at 0.375%, 0.125% and 0.375%, respectively, and, therefore, we do not have economic interest rate exposure on our Convertible Notes. However, the values of the Convertible Notes are exposed to interest rate risk. Generally, the fair market value of our fixed interest rate Convertible Notes will increase as interest rates fall and decrease as interest rates rise. In addition, the fair values of the Convertible Notes are affected by our stock price. The fair value of the convertible senior notes will generally increase as our common stock price increases and will generally decrease as our common stock price declines in value. Additionally, we carry the Convertible Notes at face value less unamortized discount and issuance costs on our balance sheet, and we present the fair value for disclosure purposes only.
Our exposure to interest rate risk also is related to our interest-bearing assets, primarily our cash and cash equivalents. Fluctuations in interest rates impact the yield of the investment. A hypothetical 100 basis points increase in interest rates would have impacted interest income by $3.1 million and $2.8 million for the years ended January 31, 2021 and 2020, respectively.
Item 8. Financial Statements and Supplementary Data.
The financial statements and supplementary financial information required by this Item 8 are included in our consolidated financial statements and notes and are set forth in the pages indicated in Part IV, Item 15(a) of this Annual Report on Form 10‑K and are incorporated herein by reference.
Item 9. Changes in and Disagreements With Accountants on Accounting and Financial Disclosure.
None.
Item 9A. Controls and Procedures.
a)Evaluation of Disclosure Controls and Procedures.
Our management, with the participation of our principal executive officer and our principal financial officer, evaluated the effectiveness of our disclosure controls and procedures as of January 31, 2021. The term “disclosure controls and procedures,” as defined in Rules 13a-15(e) and 15d-15(e) under the Exchange Act, means controls and other procedures of a company that are designed to ensure that information required to be disclosed by a company in the reports that it files or submits under the Exchange Act is recorded, processed, summarized and reported, within the time periods specified in the SEC's rules and forms. Disclosure controls and procedures include, without limitation, controls and procedures designed to ensure that information required to be disclosed by a company in the reports that it files or submits under the Exchange Act is accumulated and communicated to our management, including its principal executive and principal financial officers, as appropriate to allow timely decisions regarding required disclosure.
Based on the evaluation of our disclosure controls and procedures as of January 31, 2021, our principal executive officer and principal financial officer concluded that, as of such date, our disclosure controls and procedures were effective at the reasonable assurance level.
b)Management's Report on Internal Control Over Financial Reporting.
Our management is responsible for establishing and maintaining adequate internal control over financial reporting, as such term is defined in Exchange Act Rule 13a-15(f). Our internal control over financial reporting is designed to provide reasonable assurance regarding the reliability of financial reporting and the preparation of financial statements for external purposes in accordance with generally accepted accounting principles.
Our management, including the principal executive officer and principal financial officer, conducted an evaluation of the effectiveness of our internal control over financial reporting based on the Internal Control—Integrated Framework issued by the Committee of Sponsoring Organizations of the Treadway Commission (2013 framework). In accordance with guidance issued by the Securities and Exchange Commission, companies are permitted to exclude acquisitions from their final assessment of internal control over financial reporting for the first fiscal year in which the acquisition occurred. We have excluded from our evaluation of internal control over financial reporting, the internal control activities of ConnXus, Inc. acquired in May 2020, Bellin Treasury International GmbH acquired in June 2020, Much-Net GmbH acquired in September 2020, and Laurel Parent Holdings, Inc. acquired in November 2020. The financial results of these acquisitions are included from the date of acquisition in the January 31, 2021 consolidated financial statements and collectively constituted less than 10% of total assets as of January 31, 2021, and less than 10% of total revenues for the year then ended. Based on the results of this evaluation, our management concluded that our internal control over financial reporting was effective as of January 31, 2021.
The effectiveness of our internal control over financial reporting as of January 31, 2021 has been audited by Ernst & Young LLP, an independent registered public accounting firm, as stated in their report which is included elsewhere herein.
c)Changes in Internal Control Over Financial Reporting.
There was no change in our internal control over financial reporting that occurred during the quarter ended January 31, 2021 that has materially affected, or is reasonably likely to materially affect, our internal control over financial reporting.
d)Inherent Limitations on Effectiveness of Controls.
Our management, including our principal executive officer and principal financial officer, do not expect that our disclosure controls or our internal control over financial reporting will prevent all errors and all fraud. A control system, no matter how well conceived and operated, can provide only reasonable, not absolute, assurance that the objectives of the control system are met. Further, the design of a control system must reflect the fact that there are resource constraints, and the benefits of controls must be considered relative to their costs. Because of the inherent limitations in all control systems, no evaluation of controls can provide absolute assurance that all control issues and instances of fraud, if any, have been detected. These inherent limitations include the realities that judgments in decision-making can be faulty, and that breakdowns can occur because of a simple error or mistake. Additionally, controls can be circumvented by the individual acts of some persons, by collusion of two or more people or by management override of the controls. The design of any system of controls is also based in part upon certain assumptions about the likelihood of future events, and there can be no assurance that any design will succeed in achieving its stated goals under all potential future conditions; over time, controls may become inadequate because of changes in conditions, or the degree of compliance with policies or procedures may deteriorate. Because of the inherent limitations in a cost-effective control system, misstatements due to error or fraud may occur and not be detected.
Item 9B. Other Information.
None.
PART III
Item 10. Directors, Executive Officers and Corporate Governance.
The information called for by this item will be set forth in our Proxy Statement for the 2021 Annual Meeting of Stockholders to be filed with the SEC within 120 days of the fiscal year ended January 31, 2021 (Proxy Statement) and is incorporated herein by reference.
Item 11. Executive Compensation.
The information called for by this item will be set forth in our Proxy Statement and is incorporated herein by reference.
Item 12. Security Ownership of Certain Beneficial Owners and Management and Related Stockholder Matters.
The information required by this item will be set forth in our Proxy Statement and is incorporated herein by reference.
Item 13. Certain Relationships and Related Transactions, and Director Independence.
The information required by this item will be set forth in our Proxy Statement and is incorporated herein by reference.
Item 14. Principal Accountant Fees and Services.
The information required by this item will be set forth in our Proxy Statement and is incorporated herein by reference.
PART IV
Item 15. Exhibits, Financial Statement Schedules.
(a) Documents Filed with Report
(1) Financial Statements.
(2) Financial Statement Schedules.
Schedule II – Valuation and Qualifying Accounts
(in thousands)
| | | | | | | | | | | | | | | | | | | | | | | |
| Balance as of beginning of year | | Additions | | Deductions | | Balance as of end of year |
Year ended January 31, 2021 | | | | | | | |
Allowance for doubtful accounts | $ | 61 | | | $ | 3,448 | | | $ | (62) | | | $ | 3,447 | |
Year ended January 31, 2020 | | | | | | | |
Allowance for doubtful accounts | $ | 70 | | | $ | 76 | | | $ | (85) | | | $ | 61 | |
Year ended January 31, 2019 | | | | | | | |
Allowance for doubtful accounts | $ | 9 | | | $ | 94 | | | $ | (33) | | | $ | 70 | |
Schedules not listed above have been omitted because the information required to be set forth therein is not applicable or is shown in the financial statements or notes herein.
(3) Exhibits.
| | | | | | | | | | | | | | | | | | | | | | | | | | | | | | | | | | | | | | |
| | | | Incorporated by Reference | | |
| Exhibit No. | | Description | | Form | | File No. | | Exhibit | | Filing Date | | Filed Herewith |
| 2.1 | | | | 8-K | | 001-37901 | | 2.1 | | 4/16/2019 | | |
| 2.2 | | Agreement and Plan of Merger and Reorganization, dated November 2, 2020, by and among Coupa Software Incorporated, Lloyd Merger Sub, Inc., Lloyd Merger Sub, LLC, Laurel Parent Holdings, Inc. and TPG VII Laurel Holdings, L.P., as stockholder representative. | | 8-K | | 001-37901 | | 2.1 | | 11/2/2020 | | |
| 3.1 | | | | 10-Q | | 001-37901 | | 3.1 | | 12/9/2016 | | |
| 3.2 | | | | 10-Q | | 001-37901 | | 3.2 | | 12/9/2016 | | |
| 4.1 | | | | S-1 | | 333-213546 | | 4.1 | | 9/8/2016 | | |
| 4.2 | | | | S-1/A | | 333-217105 | | 4.1.2 | | 4/10/2017 | | |
| 4.3 | | | | 8-K | | 001-37901 | | 4.1 | | 1/18/2018 | | |
| 4.4 | | | | 8-K | | 001-37901 | | 4.1 | | 6/11/2019 | | |
| 4.5 | | | | 8-K | | 001-37901 | | 4.1 | | 6/16/2020 | | |
| 4.6 | | | | 8-K | | 001-37901 | | 2.2 | | 11/2/2020 | | |
| 4.7 | | | | 10-K | | 001-37901 | | 4.5 | | 3/20/2020 | | |
| 10.1* | | | | S-1/A | | 333-213546 | | 10.1 | | 9/23/2016 | | |
| 10.2* | | | | S-1/A | | 333-213546 | | 10.2 | | 9/23/2016 | | |
| 10.3* | | | | S-1/A | | 333-213546 | | 10.3 | | 9/23/2016 | | |
| 10.4* | | | | S-1/A | | 333-213546 | | 10.4 | | 10/4/2016 | | |
| 10.5* | | | | S-1 | | 333-213546 | | 10.5 | | 9/8/2016 | | |
| | | | | | | | | | | | | | | | | | | | | | | | | | | | | | | | | | | | | | |
| | | | Incorporated by Reference | | |
| Exhibit No. | | Description | | Form | | File No. | | Exhibit | | Filing Date | | Filed Herewith |
| 10.6* | | | | S-1 | | 333-213546 | | 10.6 | | 9/8/2016 | | |
| 10.6.1* | | | | 10-Q | | 001-37901 | | 10.1 | | 12/3/2019 | | |
| 10.7* | | | | S-1 | | 333-213546 | | 10.8 | | 9/8/2016 | | |
| 10.7.1* | | | | 10-Q | | 001-37901 | | 10.4 | | 12/3/2019 | | |
| 10.8* | | | | 10-K | | 001-37901 | | 10.8 | | 3/27/2019 | | |
| 10.8.1* | | | | 10-Q | | 001-37901 | | 10.2 | | 12/3/2019 | | |
| 10.9* | | | | S-1 | | 333-213546 | | 10.1 | | 9/8/2016 | | |
| 10.9.1* | | | | 10-Q | | 001-37901 | | 10.3 | | 12/3/2019 | | |
| 10.10 | | | | S-1 | | 333-213546 | | 10.11 | | 9/8/2016 | | |
| 10.10.1 | | | | 10-Q | | 001-37901 | | 10.1 | | 9/8/2017 | | |
| 10.11* | | | | 10-Q | | 001-37901 | | 10.1 | | 9/6/2018 | | |
| 10.12* | | | | 10-Q | | 001-37901 | | 10.1 | | 12/8/2020 | | |
| 10.13 | | | | 8-K | | 001-37901 | | 99.1 | | 1/18/2018 | | |
| 10.14 | | | | 8-K | | 001-37901 | | 99.2 | | 1/18/2018 | | |
| 10.15 | | | | 8-K | | 001-37901 | | 99.1 | | 6/11/2019 | | |
| 10.16 | | | | 8-K | | 001-37901 | | 99.2 | | 6/11/2019 | | |
| 10.17 | | | | 8-K | | 001-37901 | | 99.1 | | 6/16/2020 | | |
| 10.18 | | | | 8-K | | 001-37901 | | 99.2 | | 6/16/2020 | | |
| 10.19 | | | | 10-K | | 001-37901 | | 10.14 | | 3/28/2018 | | |
| | | | | | | | | | | | | | | | | | | | | | | | | | | | | | | | | | | | | | |
| | | | Incorporated by Reference | | |
| Exhibit No. | | Description | | Form | | File No. | | Exhibit | | Filing Date | | Filed Herewith |
| 21.1 | | | | | | | | | | | | X |
| 23.1 | | | | | | | | | | | | X |
| 24.1 | | | | | | | | | | | | |
| 31.1 | | | | | | | | | | | | X |
| 31.2 | | | | | | | | | | | | X |
| 32.1 | | | | | | | | | | | | X |
| 32.2 | | | | | | | | | | | | X |
| 101.INS | | Inline XBRL Instance Document - the instance document does not appear in the Interactive Data File because its XBRL tags are embedded within the Inline XBRL document. | | | | | | | | | | X |
| 101.SCH | | Inline XBRL Taxonomy Extension Schema Document. | | | | | | | | | | |
| 101.CAL | | Inline XBRL Taxonomy Extension Calculation Linkbase Document | | | | | | | | | | X |
| 101.DEF | | Inline XBRL Taxonomy Extension Definition Linkbase Document. | | | | | | | | | | X |
| 101.LAB | | Inline XBRL Taxonomy Extension Label Linkbase Document. | | | | | | | | | | X |
| 101.PRE | | Inline XBRL Taxonomy Extension Presentation Linkbase Document | | | | | | | | | | X |
| 104 | | The cover page for the Company’s Annual Report on Form 10-K for the year ended January 31, 2021, has been formatted in Inline XBRL. | | | | | | | | | | X |
* Indicates a management contract or compensatory plan.
(b) Exhibits: See Item 15(a)(3), above.
(c) Financial Statement Schedules: See Item 15(a)(2), above.
Item 16. Form 10-K Summary.
None.
SIGNATURES
Pursuant to the requirements of Section 13 or 15(d) of the Securities Exchange Act of 1934, the Registrant has duly caused this report to be signed on its behalf by the undersigned, thereunto duly authorized.
| | | | | | | | |
| Coupa Software Incorporated |
| | |
| Date: March 18, 2021 | By: | /s/ Robert Bernshteyn |
| | Robert Bernshteyn Chief Executive Officer, Director and Chairman of the Board (Principal Executive Officer) |
POWER OF ATTORNEY
KNOW ALL PERSONS BY THESE PRESENTS, that each person whose signature appears below hereby constitutes and appoints Robert Bernshteyn and Todd Ford, and each of them, as his or her true and lawful attorney-in-fact and agent with full power of substitution, for him or her in any and all capacities, to sign any and all amendments to this Annual Report on Form 10-K, and to file the same, with all exhibits thereto and other documents in connection therewith, with the SEC, granting unto said attorney-in-fact and agent full power and authority to do and perform each and every act and thing requisite and necessary to be done in connection therewith, as fully for all intents and purposes as he or she might or could do in person, hereby ratifying and confirming all that said attorney-in-fact and agent, or his substitute, may lawfully do or cause to be done by virtue hereof.
Pursuant to the requirements of the Securities Exchange Act of 1934, this report has been signed below by the following persons on behalf of the Registrant in the capacities and on the dates indicated.
| | | | | | | | | | | | | | |
| Name | | Title | | Date |
| | | | |
| /s/ Robert Bernshteyn | | Chief Executive Officer and Director and Chairman of the Board | | March 18, 2021 |
| Robert Bernshteyn | | (Principal Executive Officer) | | |
| | | | |
| /s/ Todd Ford | | Chief Financial Officer | | March 18, 2021 |
| Todd Ford | | (Principal Financial Officer) | | |
| | | | |
| /s/ Anthony Tiscornia | | Chief Accounting Officer | | March 18, 2021 |
| Anthony Tiscornia | | (Principal Accounting Officer) | | |
| | | | |
| /s/ Michelle Brennan | | Director | | March 18, 2021 |
| Michelle Brennan | | | | |
| | | | |
| /s/ Leslie Campbell | | Director | | March 18, 2021 |
| Leslie Campbell | | | | |
| | | | |
| /s/ Roger Siboni | | Director | | March 18, 2021 |
| Roger Siboni | | | | |
| | | | |
| /s/ Tayloe Stansbury | | Director | | March 18, 2021 |
| Tayloe Stansbury | | | | |
| | | | |
| /s/ Scott Thompson | | Director | | March 18, 2021 |
| Scott Thompson | | | | |
| | | | |
| /s/ Frank van Veenendaal | | Director | | March 18, 2021 |
| Frank van Veenendaal | | | | |
INDEX TO CONSOLIDATED FINANCIAL STATEMENTS
Report of Independent Registered Public Accounting Firm
The Stockholders and Board of Directors of Coupa Software Incorporated
Opinion on the Financial Statements
We have audited the accompanying consolidated balance sheets of Coupa Software Incorporated (the Company) as of January 31, 2021 and 2020, the related consolidated statements of operations, comprehensive loss, stockholders’ equity and cash flows for each of the three years in the period ended January 31, 2021, and the related notes and financial statement schedule listed in the Index at Item 15(a)(2) (collectively referred to as the “consolidated financial statements”). In our opinion, the consolidated financial statements present fairly, in all material respects, the financial position of the Company as of January 31, 2021 and 2020, and the results of its operations and its cash flows for each of the three years in the period ended January 31, 2021, in conformity with U.S. generally accepted accounting principles.
We also have audited, in accordance with the standards of the Public Company Accounting Oversight Board (United States) (PCAOB), the Company's internal control over financial reporting as of January 31, 2021, based on criteria established in Internal Control - Integrated Framework issued by the Committee of Sponsoring Organizations of the Treadway Commission (2013 framework) and our report dated March 18, 2021 expressed an unqualified opinion thereon.
Basis for Opinion
These financial statements are the responsibility of the Company's management. Our responsibility is to express an opinion on the Company’s financial statements based on our audits. We are a public accounting firm registered with the PCAOB and are required to be independent with respect to the Company in accordance with the U.S. federal securities laws and the applicable rules and regulations of the Securities and Exchange Commission and the PCAOB.
We conducted our audits in accordance with the standards of the PCAOB. Those standards require that we plan and perform the audit to obtain reasonable assurance about whether the financial statements are free of material misstatement, whether due to error or fraud. Our audits included performing procedures to assess the risks of material misstatement of the financial statements, whether due to error or fraud, and performing procedures that respond to those risks. Such procedures included examining, on a test basis, evidence regarding the amounts and disclosures in the financial statements. Our audits also included evaluating the accounting principles used and significant estimates made by management, as well as evaluating the overall presentation of the financial statements. We believe that our audits provide a reasonable basis for our opinion.
Critical Audit Matters
The critical audit matters communicated below are matters arising from the current period audit of the financial statements that were communicated or required to be communicated to the audit committee and that: (1) relate to accounts or disclosures that are material to the financial statements and (2) involved our especially challenging, subjective or complex judgments. The communication of critical audit matters does not alter in any way our opinion on the consolidated financial statements, taken as a whole, and we are not, by communicating the critical audit matters below, providing separate opinions on the critical audit matters or on the accounts or disclosures to which they relate.
| | | | | |
| Revenue recognition - Identifying and evaluating terms and conditions in contracts |
Description of the Matter | As discussed in Note 2 to the consolidated financial statements, the Company derives its revenues primarily from subscription services fees, professional services fees and term-based licenses. The Company determines revenue recognition following five-step framework in line with ASC 606, Revenue from Contracts with Customers (Topic 606) “ASC 606”. Management applies significant effort and judgment in identifying and evaluating any non-standard terms and conditions in contracts which may impact revenue recognition.
Auditing revenue recognition was complex due to the significant amount of effort and judgment required in the identification and evaluation of terms and conditions in contracts that impact revenue recognition. |
|
|
How We Addressed the Matter in Our Audit | We obtained an understanding, evaluated the design and tested the operating effectiveness of the Company's controls over the internal review and assessment of terms and conditions within contracts that would impact revenue recognition in accordance with ASC 606.
Our substantive procedures included, among others, testing the completeness and accuracy of management’s identification and evaluation of terms and conditions within contracts, reading executed contracts for a sample of revenue transactions and evaluating whether the Company appropriately applied its revenue recognition policy to the arrangements based on the terms and conditions therein. We additionally assessed the appropriateness of the related disclosures in the consolidated financial statements. |
|
|
| Acquisition of Laurel Parent Holdings, Inc. and its subsidiaries (“LLamasoft”) – Fair Value of technology-related intangible assets |
Description of the Matter | As discussed in Note 4 to the consolidated financial statements, the Company completed the acquisition during fiscal 2021 of Laurel Parent Holdings, Inc. and its subsidiaries (“LLamasoft”) for consideration of $1.4 billion, accounted for as a business combination.
Auditing the Company's accounting for its acquisition of LLamasoft was complex due to the significant estimation required in determining the fair value of developed technology intangible assets, which were valued and recorded at $316.1 million. The Company used a discounted cash flow model to measure developed technology intangible assets. The significant estimation was primarily due to the judgmental nature of the inputs to the valuation model and the sensitivity of the fair value to certain underlying significant assumptions, in particular, the projections of future revenue, including the impact of the technology migration curve. This significant assumption is forward-looking and could be affected by future economic and market conditions. |
| |
How We Addressed the Matter in Our Audit | We obtained an understanding, evaluated the design and tested the operating effectiveness of the Company's controls over its accounting for acquisitions, such as controls over the recognition and measurement of developed technology intangible assets, including the valuation model and underlying assumptions used to develop such estimates.
To test the estimated fair value of the developed technology intangible assets, our audit procedures included, among others, involvement of our valuation specialists to assist us in the evaluation of the valuation methodology used by the Company and procedures to test the assumptions used in the valuation, including the completeness and accuracy of the underlying data. We performed a sensitivity analysis of the discount rate and revenue projections to evaluate the change in the fair value resulting from changes in the assumptions. We also compared the revenue forecast assumptions, including the impact of technology migration curves, to current industry, market and economic trends, to the assumptions used to value similar assets in other acquisitions, to historical results of the acquired business and to other guideline companies within the same industry. |
| |
| | | | | |
| Fair Value determination of Convertible Senior Notes |
Description of the Matter | As discussed in Note 9 to the consolidated financial statements, in June 2020, the Company issued $1,380.0 million in Convertible Senior Notes (Convertible Notes). Concurrent with the issuance of the Convertible Notes, the Company entered into capped call transactions that are exercisable upon conversion of the Convertible Notes (collectively with the Convertible Notes referred to as the Convertible Notes Transactions). The accounting for the Convertible Notes Transactions was complex as it required assessment as to whether features in the Convertible Notes required bifurcation and an evaluation of the appropriate classification of those features in the financial statements. Additionally, the Convertible Notes Transactions were complex as valuation of the conversion feature in the Convertible Notes involved estimation of the fair value of the liability component of the Convertible Notes on a stand-alone basis.
Auditing management’s evaluation of the Convertible Notes Transactions involved addressing the complexity in assessing the components for separability and assessing valuation of the liability component on a stand-alone basis. The Company estimated the fair value of the liability component of the Convertible Notes using a discounted cash flow model with a discount rate determined primarily using observable yields for stand-alone debt instruments with a comparable credit rating and term as well as using lattice models. The fair value of the liability component is sensitive to changes in the discount rate. The Company also performed a detailed analysis of the terms of the Convertible Notes Transactions to identify whether there were any embedded derivatives that required separate identification and valuation under applicable accounting guidance. |
| |
How We Addressed the Matter in Our Audit | We obtained an understanding, evaluated the design and tested the operating effectiveness of controls over the Company’s accounting for the Convertible Notes Transactions, including its controls over estimating the fair value of the stand-alone liability component and evaluating the existence and valuation of embedded derivatives.
To test the initial accounting for the Convertible Notes Transactions, our procedures included, among others, inspection of the agreements for the Convertible Notes Transactions and assessing management’s application of the relevant accounting guidance. We also involved our valuation specialists to assist in our evaluation of the Company’s determination of the fair value of the liability component on a stand-alone basis, including testing the appropriateness of the methodology and the discount rate. |
/s/ Ernst & Young LLP
We have served as the Company’s auditor since 2015.
Redwood City, California
March 18, 2021
Report of Independent Registered Public Accounting Firm
The Stockholders and Board of Directors of Coupa Software Incorporated
Opinion on Internal Control over Financial Reporting
We have audited Coupa Software Incorporated’s internal control over financial reporting as of January 31, 2021, based on criteria established in Internal Control - Integrated Framework issued by the Committee of Sponsoring Organizations of the Treadway Commission (2013 framework) (the COSO criteria). In our opinion, Coupa Software Incorporated (the Company) maintained, in all material respects, effective internal control over financial reporting as of January 31, 2021, based on the COSO criteria.
As indicated in the accompanying Management's Report on Internal Control over Financial Reporting, management's assessment of and conclusion on the effectiveness of internal control over financial reporting did not include the internal controls of ConnXus, Inc., Bellin Treasury International GmbH, Much-Net GmbH, and Laurel Parent Holdings, Inc., which are included in the January 31, 2021 consolidated financial statements of the Company and collectively constituted less than 10% of total assets as of January 31, 2021, and less than 10% of revenues for the year then ended. Our audit of internal control over financial reporting of the Company also did not include an evaluation of the internal control over financial reporting of ConnXus, Inc., Bellin Treasury International GmbH, Much-Net GmbH, and Laurel Parent Holdings, Inc.
We also have audited, in accordance with the standards of the Public Company Accounting Oversight Board (United States) (PCAOB), the 2021 consolidated balance sheets of the Company as of January 31, 2021 and 2020, the related (consolidated) statements of operations, comprehensive loss, stockholders’ equity and cash flows for each of the three years in the period ended January 31, 2021 and the related notes and schedule and our report dated March 18, 2021 expressed an unqualified opinion thereon.
Basis for Opinion
The Company’s management is responsible for maintaining effective internal control over financial reporting and for its assessment of the effectiveness of internal control over financial reporting included in the accompanying Management’s Report on Internal Control over Financial Reporting. Our responsibility is to express an opinion on the Company’s internal control over financial reporting based on our audit. We are a public accounting firm registered with the PCAOB and are required to be independent with respect to the Company in accordance with the U.S. federal securities laws and the applicable rules and regulations of the Securities and Exchange Commission and the PCAOB.
We conducted our audit in accordance with the standards of the PCAOB. Those standards require that we plan and perform the audit to obtain reasonable assurance about whether effective internal control over financial reporting was maintained in all material respects.
Our audit included obtaining an understanding of internal control over financial reporting, assessing the risk that a material weakness exists, testing and evaluating the design and operating effectiveness of internal control based on the assessed risk, and performing such other procedures as we considered necessary in the circumstances. We believe that our audit provides a reasonable basis for our opinion.
Definition and Limitations of Internal Control Over Financial Reporting
A company’s internal control over financial reporting is a process designed to provide reasonable assurance regarding the reliability of financial reporting and the preparation of financial statements for external purposes in accordance with generally accepted accounting principles. A company’s internal control over financial reporting includes those policies and procedures that (1) pertain to the maintenance of records that, in reasonable detail, accurately and fairly reflect the transactions and dispositions of the assets of the company; (2) provide reasonable assurance that transactions are recorded as necessary to permit preparation of financial statements in accordance with generally accepted accounting principles, and that receipts and expenditures of the company are being made only in accordance with authorizations of management and directors of the company; and (3) provide reasonable assurance regarding prevention or timely detection of unauthorized acquisition, use, or disposition of the company’s assets that could have a material effect on the financial statements.
Because of its inherent limitations, internal control over financial reporting may not prevent or detect misstatements. Also, projections of any evaluation of effectiveness to future periods are subject to the risk that controls may become inadequate because of changes in conditions, or that the degree of compliance with the policies or procedures may deteriorate.
/s/ Ernst & Young LLP
Redwood City, California
March 18, 2021
COUPA SOFTWARE INCORPORATED
CONSOLIDATED BALANCE SHEETS
(in thousands, except share and per share amounts)
| | | | | | | | | | | |
| As of January 31, |
| 2021 | | 2020 |
| Assets | | | |
| Current assets: | | | |
| Cash and cash equivalents | $ | 323,284 | | | $ | 268,045 | |
| Marketable securities | 283,036 | | | 499,160 | |
| Accounts receivable, net of allowances | 196,009 | | | 118,508 | |
| Prepaid expenses and other current assets | 36,381 | | | 31,636 | |
| Deferred commissions, current portion | 15,541 | | | 11,982 | |
| Total current assets | 854,251 | | | 929,331 | |
| Property and equipment, net | 28,266 | | | 18,802 | |
| Deferred commissions, net of current portion | 36,832 | | | 30,921 | |
| Goodwill | 1,480,847 | | | 442,112 | |
| Intangible assets, net | 632,173 | | | 128,660 | |
| Operating lease right-of-use assets | 41,305 | | | 32,026 | |
| Other assets | 31,491 | | | 12,221 | |
| Total assets | $ | 3,105,165 | | | $ | 1,594,073 | |
| Liabilities, Temporary Equity and Stockholders’ Equity | | | |
| Current liabilities: | | | |
| Accounts payable | $ | 4,831 | | | $ | 3,517 | |
| Accrued expenses and other current liabilities | 80,271 | | | 54,245 | |
| Deferred revenue, current portion | 356,115 | | | 257,692 | |
| Convertible senior notes, net (Note 9) | 609,068 | | | 187,115 | |
| Operating lease liabilities, current portion | 11,222 | | | 8,199 | |
| Total current liabilities | 1,061,507 | | | 510,768 | |
| Convertible senior notes, net (Note 9) | 897,525 | | | 562,612 | |
| Deferred revenue, net of current portion | 5,773 | | | 4,091 | |
| Operating lease liabilities, net of current portion | 31,845 | | | 25,490 | |
| Other liabilities | 67,915 | | | 28,620 | |
| Total liabilities | 2,064,565 | | | 1,131,581 | |
| Commitments and contingencies (Note 10) | — | | | — | |
| Temporary equity (Note 9) | 369 | | | 16,835 | |
| Stockholders’ equity: | | | |
Preferred stock, $0.0001 par value per share; 25,000,000 shares authorized at January 31, 2021 and 2020; zero shares issued and outstanding at January 31, 2021 and 2020 | — | | | — | |
Common stock, $0.0001 par value per share; 625,000,000 shares authorized at January 31, 2021 and 2020; 72,753,659 and 64,528,970 shares issued and outstanding as of January 31, 2021 and 2020, respectively | 7 | | | 7 | |
| Additional paid-in capital | 1,556,865 | | | 790,468 | |
| Accumulated other comprehensive income | 9,165 | | | 871 | |
| Accumulated deficit | (525,806) | | | (345,689) | |
| Total stockholders’ equity | 1,040,231 | | | 445,657 | |
| Total liabilities, temporary equity and stockholders’ equity | $ | 3,105,165 | | | $ | 1,594,073 | |
See Notes to Consolidated Financial Statements.
COUPA SOFTWARE INCORPORATED
CONSOLIDATED STATEMENTS OF OPERATIONS
(in thousands, except per share amounts)
| | | | | | | | | | | | | | | | | |
| For the year ended
January 31, |
| 2021 | | 2020 | | 2019 |
| Revenues: | | | | | |
| Subscription | $ | 470,341 | | | $ | 345,261 | | | $ | 233,428 | |
| Professional services and other | 71,302 | | | 44,458 | | | 26,938 | |
| Total revenues | 541,643 | | | 389,719 | | | 260,366 | |
| Cost of revenues: | | | | | |
| Subscription | 147,374 | | | 89,452 | | | 53,153 | |
| Professional services and other | 74,327 | | | 49,764 | | | 30,301 | |
| Total cost of revenues | 221,701 | | | 139,216 | | | 83,454 | |
| Gross profit | 319,942 | | | 250,503 | | | 176,912 | |
| Operating expenses: | | | | | |
| Research and development | 133,842 | | | 93,089 | | | 61,608 | |
| Sales and marketing | 236,312 | | | 155,216 | | | 105,659 | |
| General and administrative | 116,341 | | | 75,623 | | | 57,005 | |
| Total operating expenses | 486,495 | | | 323,928 | | | 224,272 | |
| Loss from operations | (166,553) | | | (73,425) | | | (47,360) | |
| Interest expense | (91,271) | | | (37,658) | | | (12,518) | |
| Interest income and other, net | 13,321 | | | 9,316 | | | 3,817 | |
| Loss before benefit from income taxes | (244,503) | | | (101,767) | | | (56,061) | |
| Benefit from income taxes | (64,386) | | | (10,935) | | | (537) | |
| Net loss | $ | (180,117) | | | $ | (90,832) | | | $ | (55,524) | |
Net loss per share, basic and diluted | $ | (2.63) | | | $ | (1.45) | | | $ | (0.96) | |
Weighted-average number of shares used in computing net loss per share, basic and diluted | 68,559 | | | 62,484 | | | 57,716 | |
See Notes to Consolidated Financial Statements.
COUPA SOFTWARE INCORPORATED
CONSOLIDATED STATEMENTS OF COMPREHENSIVE LOSS
(in thousands)
| | | | | | | | | | | | | | | | | |
| For the year ended
January 31, |
| 2021 | | 2020 | | 2019 |
| Net loss | $ | (180,117) | | | $ | (90,832) | | | $ | (55,524) | |
Other comprehensive gain in relation to defined benefit plans, net of tax | 287 | | | 119 | | | 598 | |
| Changes in unrealized gain (loss) on marketable securities, net of tax | (484) | | | 417 | | | 35 | |
| Foreign currency translation adjustments, net of tax | 8,491 | | | — | | | — | |
| Comprehensive loss | $ | (171,823) | | | $ | (90,296) | | | $ | (54,891) | |
See Notes to Consolidated Financial Statements.
COUPA SOFTWARE INCORPORATED
CONSOLIDATED STATEMENTS OF STOCKHOLDERS’ EQUITY
(in thousands, except share amounts)
| | | | | | | | | | | | | | | | | | | | | | | | | | | | | | | | | | | |
| Common Stock | | Additional Paid-In Capital | | Accumulated Other Comprehensive Income (Loss) | | Accumulated Deficit | | Total Stockholders' Equity |
| Shares | | Amount | | | | |
| Balance at January 31, 2018 | 55,712,342 | | | $ | 6 | | | $ | 445,318 | | | $ | (298) | | | $ | (204,481) | | | $ | 240,545 | |
| Issuance of common stock for acquisitions | 553,746 | | | — | | | 46,157 | | | — | | | — | | | 46,157 | |
| Issuance of common stock for employee share purchase plan | 505,717 | | | — | | | 8,778 | | | — | | | — | | | 8,778 | |
| Exercise of stock options | 2,824,836 | | | — | | | 13,606 | | | — | | | — | | | 13,606 | |
| Vesting of early exercised stock options | — | | | — | | | 333 | | | — | | | — | | | 333 | |
| Stock-based compensation expense | — | | | — | | | 53,605 | | | — | | | — | | | 53,605 | |
| Vested restricted stock units | 858,740 | | | — | | | — | | | — | | | — | | | — | |
| Impact of the adoption of new accounting pronouncements | — | | | — | | | — | | | — | | | 5,148 | | | 5,148 | |
| Other comprehensive income | — | | | — | | | — | | | 633 | | | — | | | 633 | |
| Net loss | — | | | — | | | — | | | — | | | (55,524) | | | (55,524) | |
| Balance at January 31, 2019 | 60,455,381 | | | 6 | | | 567,797 | | | 335 | | | (254,857) | | | 313,281 | |
| Equity component of 2025 Notes, net of issuance costs | — | | | — | | | 246,967 | | | — | | | — | | | 246,967 | |
| Purchase of capped calls | — | | | — | | | (118,738) | | | — | | | — | | | (118,738) | |
| Cancellation of common stock issued from acquisitions | (7,784) | | | — | | | — | | | — | | | — | | | — | |
| Issuance of common stock for employee share purchase plan | 215,472 | | | — | | | 11,455 | | | — | | | — | | | 11,455 | |
| Exercise of stock options | 2,712,063 | | | 1 | | | 17,419 | | | — | | | — | | | 17,420 | |
| Stock-based compensation expense | — | | | — | | | 82,403 | | | — | | | — | | | 82,403 | |
| Vested restricted stock units | 1,153,838 | | | — | | | — | | | — | | | — | | | — | |
| Temporary equity reclassification | — | | | — | | | (16,835) | | | — | | | — | | | (16,835) | |
| Other comprehensive income | — | | | — | | | — | | | 536 | | | — | | | 536 | |
| Net loss | — | | | — | | | — | | | — | | | (90,832) | | | (90,832) | |
| Balance at January 31, 2020 | 64,528,970 | | | 7 | | | 790,468 | | | 871 | | | (345,689) | | | 445,657 | |
| Issuance of common stock for acquisitions (Note 4) | 2,849,537 | | | — | | | 668,026 | | | — | | | — | | | 668,026 | |
| Issuance of common stock for employee share purchase plan | 209,306 | | | — | | | 15,631 | | | — | | | — | | | 15,631 | |
| Exercise of stock options | 1,615,784 | | | — | | | 19,245 | | | — | | | — | | | 19,245 | |
| Stock-based compensation expense | — | | | — | | | 150,578 | | | — | | | — | | | 150,578 | |
| Vested restricted stock units | 1,348,975 | | | — | | | — | | | — | | | — | | | — | |
| Equity component of 2026 Notes, net of issuance costs | — | | | — | | | 501,053 | | | — | | | — | | | 501,053 | |
| Purchase of capped calls in relation to 2026 Notes | — | | | — | | | (192,786) | | | — | | | — | | | (192,786) | |
| Settlement of 2023 Notes (Note 9) | 2,201,087 | | | — | | | (385,393) | | | — | | | — | | | (385,393) | |
| Deferred tax related to convertible senior notes | — | | | — | | | (9,588) | | | — | | | — | | | (9,588) | |
| Temporary equity reclassification | — | | | — | | | (369) | | | — | | | — | | | (369) | |
| Other comprehensive income | — | | | — | | | — | | | 8,294 | | | — | | | 8,294 | |
| Net loss | — | | | — | | | — | | | — | | | (180,117) | | | (180,117) | |
| Balance at January 31, 2021 | 72,753,659 | | | $ | 7 | | | $ | 1,556,865 | | | $ | 9,165 | | | $ | (525,806) | | | $ | 1,040,231 | |
See Notes to Consolidated Financial Statements.
COUPA SOFTWARE INCORPORATED
CONSOLIDATED STATEMENTS OF CASH FLOWS
(in thousands)
| | | | | | | | | | | | | | | | | |
| For the year ended
January 31, |
| 2021 | | 2020 | | 2019 |
| Cash flows from operating activities | | | | | |
| Net loss | $ | (180,117) | | | $ | (90,832) | | | $ | (55,524) | |
| Adjustments to reconcile net loss to net cash provided by operating activities: | | | | | |
| Depreciation and amortization | 72,105 | | | 28,553 | | | 10,442 | |
| Amortization of premium on marketable securities, net | 1,038 | | | 325 | | | (1,621) | |
| Amortization of deferred commissions | 14,704 | | | 9,556 | | | 5,791 | |
| Amortization of debt discount and issuance costs | 86,541 | | | 35,922 | | | 11,605 | |
| Stock-based compensation | 149,423 | | | 81,376 | | | 52,945 | |
| Gain on conversion of convertible senior notes | (3,154) | | | — | | | — | |
| Repayments of convertible senior notes attributable to debt discount (Note 9) | (27,409) | | | — | | | — | |
| Other | 3,761 | | | (1,381) | | | 282 | |
| Changes in operating assets and liabilities net of effects from acquisitions: | | | | | |
| Accounts receivable | (36,757) | | | (11,154) | | | (28,493) | |
| Prepaid expenses and other current assets | 2,954 | | | (16,380) | | | 410 | |
| Other assets | 6,786 | | | 9,176 | | | (3,402) | |
| Deferred commissions | (24,157) | | | (26,231) | | | (15,332) | |
| Accounts payable | (851) | | | (3,720) | | | 3,182 | |
| Accrued expenses and other liabilities | (65,995) | | | (20,727) | | | 11,399 | |
| Deferred revenue | 79,330 | | | 73,673 | | | 45,752 | |
| Net cash provided by operating activities | 78,202 | | | 68,156 | | | 37,436 | |
| Cash flows from investing activities | | | | | |
| Purchases of marketable securities | (1,017,751) | | | (583,151) | | | (302,922) | |
| Maturities of marketable securities | 396,595 | | | 66,363 | | | 124,139 | |
| Sale of marketable securities | 835,123 | | | 199,314 | | | — | |
| Acquisitions, net of cash acquired | (863,597) | | | (308,406) | | | (143,885) | |
| Purchases of property and equipment | (11,492) | | | (11,970) | | | (7,528) | |
| Net cash used in investing activities | (661,122) | | | (637,850) | | | (330,196) | |
| Cash flows from financing activities | | | | | |
| Proceeds from issuance of convertible senior notes, net of issuance costs | 1,355,066 | | | 786,157 | | | (639) | |
| Purchase of capped calls | (192,786) | | | (118,738) | | | — | |
| Repayments of convertible senior notes | (555,352) | | | — | | | — | |
| Proceeds from the exercise of common stock options | 19,232 | | | 17,781 | | | 12,964 | |
| Proceeds from issuance of common stock for employee stock purchase plan | 15,631 | | | 11,455 | | | 8,778 | |
| Net cash provided by financing activities | 641,791 | | | 696,655 | | | 21,103 | |
| Effects of foreign currency exchange rates on cash, cash equivalents, and restricted cash | 438 | | | — | | | — | |
| Net increase in cash, cash equivalents, and restricted cash | 59,309 | | | 126,961 | | | (271,657) | |
| Cash, cash equivalents, and restricted cash at beginning of year | 268,280 | | | 141,319 | | | 412,976 | |
| Cash, cash equivalents, and restricted cash at end of period | $ | 327,589 | | | $ | 268,280 | | | $ | 141,319 | |
Reconciliation of cash, cash equivalents, and restricted cash to the consolidated balance sheets | | | | | |
| Cash and cash equivalents | $ | 323,284 | | | $ | 268,045 | | | $ | 141,250 | |
| Restricted cash, included in other assets | 4,305 | | | 235 | | | 69 | |
| Total cash, cash equivalents, and restricted cash | $ | 327,589 | | | $ | 268,280 | | | $ | 141,319 | |
See Notes to Consolidated Financial Statements.
COUPA SOFTWARE INCORPORATED
CONSOLIDATED STATEMENTS OF CASH FLOWS
(in thousands)
| | | | | | | | | | | | | | | | | |
| For the year ended
January 31, |
| 2021 | | 2020 | | 2019 |
| Supplemental disclosure of cash flow data | | | | | |
| Cash paid for income taxes | $ | 3,328 | | | $ | 2,294 | | | $ | 4,910 | |
| Interest expense paid | $ | 3,640 | | | $ | 1,489 | | | $ | 858 | |
| Supplemental disclosure of non-cash investing and financing activities | | | | | |
| Issuance of common stock in connection with acquisitions | $ | 668,026 | | | $ | — | | | $ | 46,157 | |
| Vesting of early exercised stock options | $ | — | | | $ | — | | | $ | 333 | |
Property and equipment included in accounts payable and accrued expenses and other current liabilities | $ | 321 | | | $ | 337 | | | $ | 832 | |
See Notes to Consolidated Financial Statements.
COUPA SOFTWARE INCORPORATED
NOTES TO CONSOLIDATED FINANCIAL STATEMENTS
Note 1. Organization and Description of Business
The Company
Coupa Software Incorporated (the “Company”) was incorporated in the state of Delaware in 2006. The Company provides a comprehensive, cloud-based business spend management (or BSM) platform that provide greater visibility into and control over how companies spend money. The BSM platform enables businesses to achieve savings that drive profitability. The Company is based in San Mateo, California.
The Company’s fiscal year ends on January 31.
Note 2. Significant Accounting Policies
Basis of Presentation
The accompanying consolidated financial statements have been prepared using accounting principles generally accepted in the United States of America (“GAAP”). The consolidated financial statements include the results of the Company and its wholly owned subsidiaries. All significant intercompany transactions and balances have been eliminated during consolidation.
Use of Estimates
The preparation of consolidated financial statements in conformity with GAAP requires management to make estimates and assumptions that affect the reported amounts of assets and liabilities and disclosure of contingent assets and liabilities as of the date of the consolidated financial statements and the reported amounts of revenue and expenses during the reporting period. On an ongoing basis, management evaluates its significant estimates including, but not limited to, the valuation of accounts receivable, the lives of tangible and intangible assets, the fair value of certain equity awards, the fair value of contingent purchase consideration, the valuation of acquired intangible assets and the recoverability or impairment of intangible assets, including goodwill, revenue recognition, convertible senior notes fair value, the benefit period of deferred commissions, and provision for (benefit from) income taxes. Management bases its estimates on historical experience and on various other market-specific and relevant assumptions that management believes to be reasonable under the circumstances. Actual results could differ from those estimates and such differences could be material to the financial position and results of operations.
Foreign Currency Translation
The functional currency of the Company's foreign operations is primarily the U.S. dollar, while a few of its subsidiaries use the Euro as their functional currency. In cases where the Company uses a foreign functional currency, the Company translates the foreign functional currency financial statements to U.S. dollars using the exchange rates at the balance sheet date for assets and liabilities, the period average exchange rates for revenues and expenses, and the historical exchange rates for equity. The effects of foreign currency translation adjustments are recorded in other comprehensive income as a component of stockholders' equity and the related periodic movements are presented in the consolidated statements of comprehensive loss. Foreign currency transaction gains and losses are included in interest income and other, net, in the consolidated statements of operations for the period. For the years ended January 31, 2021, 2020 and 2019, realized foreign currency transaction gains and losses were comprised of a net gain of $568,000, a net loss of $523,000, and a loss of $225,000, respectively.
Risks and Uncertainties
The Company’s services are concentrated in an industry which is characterized by significant competition, rapid technological advances and changes in customer requirements and industry standards. The success of the Company depends on management’s ability to anticipate and respond quickly and adequately to technological developments in the industry and changes in customer requirements and industry standards. Any significant delays in the development or introduction of services could have a material adverse effect on the Company’s business and operating results. Furthermore, the effects of potential legal activity that could be brought against the Company, including costs incurred to defend legal cases, relationships with customers and market perception, and the financial impact of any judicial decisions, could have a material adverse effect on the Company’s business and operating results.
The Company serves customers and users from data center facilities located across various different physical locations, such as the U.S., Europe and Asia-Pacific, most of which are operated by a single third party. The Company has internal procedures to restore services in the event of disasters at the current data center facilities. Even with these procedures for disaster recovery in place, cloud applications could be significantly interrupted during the procedures to restore services.
Concentration of Risk and Significant Customers
Financial instruments that potentially subject the Company to a concentration of credit risk consist of cash and cash equivalents, marketable securities and accounts receivable. Cash deposits may, at times, exceed amounts insured by the Federal Deposit Insurance Corporation (“FDIC”) and the Securities Investor Protection Corporation (“SIPC”). Marketable securities balances may, at times, also exceed SIPC limits. The Company has not experienced any losses on its deposits of cash and cash equivalents to date.
No single customer balance comprised 10% or more of total accounts receivable at January 31, 2021 or 2020.
During the years ended January 31, 2021, 2020 and 2019, revenues by geographic area, based on billing addresses of the customers, was as follows (in thousands):
| | | | | | | | | | | | | | | | | |
| For the year ended
January 31, |
| 2021 | | 2020 | | 2019 |
| United States | $ | 338,084 | | | $ | 248,107 | | | $ | 161,494 | |
| Foreign countries | 203,559 | | | 141,612 | | | 98,872 | |
| Total revenues | $ | 541,643 | | | $ | 389,719 | | | $ | 260,366 | |
No single foreign country represented more than 10% of the Company’s revenues in any period.
Additionally, no single customer represented more than 10% of the Company’s revenues in any period.
Fair Value Measurements
Fair value is the exchange price that would be received for an asset or paid to transfer a liability (an exit price) in the principal or most advantageous market for the asset or liability in an orderly transaction between market participants on the measurement date. Subsequent changes in fair value of these financial assets and liabilities are recognized in earnings or other comprehensive loss when they occur. When determining the fair value measurements for assets and liabilities which are required to be recorded at fair value, the Company considers the principal or most advantageous market in which the Company would transact and the market-based risk measurement or assumptions that market participants would use in pricing the assets or liabilities, such as inherent risk, transfer restrictions and credit risk.
The Company applies the following fair value hierarchy, which prioritizes the inputs used to measure fair value into three levels and bases the categorization within the hierarchy upon the lowest level of input that is available and significant to the fair value measurement:
•Level 1 - Quoted prices in active markets for identical assets or liabilities.
•Level 2 - Observable inputs other than quoted price in active markets for identical assets or similar assets or liabilities in inactive markets, or other inputs that are observable or can be corroborated by observable market data for substantially full term of assets or liabilities.
•Level 3 - Inputs that are generally unobservable and typically reflect management’s estimates of assumptions that market participants would use in pricing the assets or liabilities.
Fair Value of Financial Instruments
The Company’s financial instruments primarily include cash and cash equivalents, marketable securities, trade receivables, accounts payable, accrued liabilities, contingent cash consideration payable, and convertible senior notes. Cash and cash equivalents, marketable securities, and contingent cash consideration payable are reported at fair value. The recorded carrying amount of trade receivables, accounts payable, and accrued liabilities approximate their fair value due to their short-term nature. The Company carries convertible senior notes at the allocated liability value less unamortized debt discount and issuance costs on its consolidated balance sheet, and it presents the fair value of the convertible senior notes for disclosure purposes only.
Cash and Cash Equivalents
The Company considers all highly liquid investments purchased with original maturities of less than three months from the date of purchase to be cash equivalents. The Company’s cash and cash equivalents consist of monies held in bank demand deposits and money market funds and are presented at fair market value based on quoted market prices.
Marketable Securities
Marketable securities consist of financial instruments such as U.S. treasury securities, U.S. agency obligations, corporate notes and bonds, commercial paper, asset backed securities and certificates of deposit. The Company classifies marketable securities as available-for-sale at the time of purchase and reevaluates such classification as of each balance sheet date. All marketable securities are recorded at estimated fair value. Credit losses related to the marketable securities are recorded in interest income and other, net in the consolidated statements of operations through an allowance for credit losses rather than as a reduction in the amortized cost basis of the securities. No credit losses related to marketable securities were recorded by the Company during the year ended January 31, 2021. Any remaining unrealized losses, or any unrealized gains, for marketable securities are included in accumulated other comprehensive income, a component of stockholders’ equity.
If quoted prices for identical instruments are available in an active market, marketable securities are classified within Level 1 of the fair value hierarchy. If quoted prices for identical instruments in active markets are not available, fair values are estimated using quoted prices of similar instruments and are classified within Level 2 of the fair value hierarchy.
Research and Development Costs
Research and development costs are expensed as incurred. Research and development costs consist primarily of compensation related costs incurred for the maintenance and bug fixing of the Company’s software platform, as well as planning, predevelopment and post implementation costs associated with the development of enhancements to the Company’s software platform.
Advertising Costs
Advertising costs are expensed as incurred and are primarily included in sales and marketing expense in the accompanying consolidated statements of operations. Advertising expense totaled $7.7 million, $2.9 million and $2.2 million for the years ended January 31, 2021, 2020 and 2019, respectively.
Capitalized Software Development Costs
The Company capitalizes certain development costs incurred in connection with software development for its cloud-based platform. Costs incurred in the preliminary stages of development are expensed as incurred. Once the software has reached the development stage, internal and external costs, if direct and incurred for adding incremental functionality to the Company’s platform, are capitalized until the software is substantially complete and ready for its intended use. Capitalization ceases upon completion of all substantial testing. These software development costs are recorded as part of property and equipment.
Capitalized software development costs are amortized on a straight-line basis to cost of revenues—subscription services over the technology’s estimated useful life, which is generally three years. During the years ended January 31, 2021, 2020 and 2019, the Company capitalized $10.5 million, $8.4 million and $5.6 million, respectively, in software development costs.
Costs incurred in the maintenance and minor upgrade and enhancement of the Company’s software platform without adding additional functionality are expensed as incurred.
Property and Equipment
Property and equipment are stated at cost net of accumulated depreciation and amortization. Depreciation is calculated using the straight-line method over the estimated useful lives of the assets. Furniture and equipment is amortized over an estimated useful life of three to five years. Leasehold improvements are amortized over the shorter of their useful life, estimated at five years, or the remaining term of the lease. Upon retirement or sale of assets, the cost and related accumulated depreciation and amortization are removed from the consolidated balance sheet and the resulting gain or loss is reflected in the consolidated statement of operations. Maintenance and repair costs are expensed as incurred.
Goodwill and Other Intangible Assets
Goodwill is the excess of costs over fair value of net assets of the business acquired. Goodwill and other intangible assets acquired that are determined to have an indefinite useful life are not amortized but are tested for impairment at least annually.
Other intangible assets, which includes acquired developed technology, customer relationships, and trademarks are recorded at fair value, net of accumulated amortization, and are amortized using the straight-line method. The Company assesses the impairment of long-lived intangible assets whenever events or changes in circumstances indicate that the carrying amount may not be recoverable.
The Company has not recorded impairment charges on goodwill and other intangible assets for the periods presented in these consolidated financial statements.
Revenue Recognition
The Company derives its revenues primarily from subscription fees, professional services fees and other. Revenues are recognized when control of these services are transferred to the Company’s customers in an amount that reflects the consideration expected to be entitled to in exchange for those services. Revenues are recognized net of applicable taxes imposed on the related transaction. The Company’s revenue recognition policy follows guidance from Accounting Standards Codification 606, Revenue from Contracts with Customers (Topic 606).
The Company determines revenue recognition through the following five-step framework:
•Identification of the contract, or contracts, with a customer;
•Identification of the performance obligations in the contract;
•Determination of the transaction price;
•Allocation of the transaction price to the performance obligations in the contract; and
•Recognition of revenue when, or as, the Company satisfies a performance obligation.
Subscription Revenues
The Company offers subscriptions to its cloud-based business spend management platform, including procurement, invoicing and expense management. Subscription revenues consist primarily of fees to provide the Company’s customers access to its cloud-based platform, which includes routine customer support. Subscription contracts do not provide customers with the right to take possession of the software, are non-cancelable, and do not contain general rights of return. Generally, subscription revenues are recognized ratably over the contractual term of the arrangement, beginning on the date that the service is made available to the customer. Subscription contracts typically have a term of three years with invoicing occurring in annual installments at the beginning of each year in the subscription period.
Term-based licenses are sold as bundled arrangements that include the rights to a term license and post-contract customer support (“PCS”). Accordingly, the Company allocates the transaction price to each performance obligation. The revenues related to the amount allocated to PCS are included in subscription revenue, which are recognized ratably over the contract term beginning on the license delivery date.
Professional Services Revenues and Other
The Company offers professional services which primarily include deployment services, optimization services, and training. Professional services are generally sold on a fixed-fee or time-and-materials basis. For services billed on a fixed-fee basis, invoicing typically occurs in advance, and revenue is recognized over time based on the proportion performed. For services billed on a time-and-materials basis, revenue is recognized over time as services are performed.
Term-based licenses are sold as bundled arrangements that include the rights to a term license and PCS. Accordingly, the Company allocates the transaction price to each performance obligation. The revenues related to the amount allocated to term-based licenses are included in other revenue, which is recognized at the start of the license term when delivery is complete.
Significant Judgments
The Company’s contracts with customers often include promises to transfer multiple products and services to a customer. For these contracts, the Company accounts for individual performance obligations separately if they are distinct. Subscription services, professional services, term-based licenses, and related PCS are distinct performance obligations that are accounted for separately. In contracts with multiple performance obligations, the transaction price is allocated to separate performance obligations on a relative standalone selling price ("SSP") basis.
The determination of SSP for each distinct performance obligation requires judgment. The Company determines SSP for performance obligations based on overall pricing objectives, which take into consideration market conditions and entity-specific factors. This includes a review of historical data related to the size of arrangements, the applications being sold, customer demographics and the numbers and types of users within the arrangements. The Company uses a range of amounts to estimate SSP for performance obligations. There is typically more than one SSP for individual products and services due to the stratification of those products and services by considerations such as size and sales regions.
Contract Balances
The timing of revenue recognition may differ from the timing of invoicing for contracts with customers. The Company records a receivable when revenue is recognized prior to invoicing. Deferred revenue primarily consists of billings or payments received in advance of revenue recognition. Subscription and fixed-fee professional services arrangements are commonly billed in advance, recognized as deferred revenue, and then amortized into revenue over time. The Company's term-based license contracts are billed in advance, recognized as deferred revenue, and then recognized as revenues upfront for the license component and ratably over the term license for the PCS component. However, other professional services arrangements, primarily those recognized on a time-and-materials basis, are billed in arrears following services that have been rendered. In addition, for multi-year term-based license contracts, the revenue allocated to license component is recognized upfront while the billing is on annual basis. This may result in revenue recognition greater than invoiced amounts which results in a receivable balance. Receivables represent an unconditional right to payment. As of January 31, 2021 and 2020, the balance of accounts receivable, net of the allowance for doubtful accounts, was $196.0 million and $118.5 million, respectively. Of these balances, $24.2 million and $6.5 million represent unbilled receivable amounts as of January 31, 2021 and 2020, respectively. In addition, as of January 31, 2021 and 2020, the balance of long-term unbilled receivables was approximately $7.1 million and $353,000, respectively, which are included in other assets on the Company's consolidated balance sheet.
When the timing of revenue recognition differs from the timing of invoicing, the Company uses judgment to determine whether the contract includes a significant financing component requiring adjustment to the transaction price. Various factors are considered in this determination including the duration of the contract, payment terms, and other circumstances. Generally, the Company determined that contracts do not include a significant financing component. The Company applies the practical expedient for instances where, at contract inception, the expected timing difference between when promised goods or services are transferred and associated payment will be one year or less. Payment terms vary by contract type, however arrangements typically stipulate a requirement for the customer to pay within 30 days.
At any point in the contract term, the transaction price may be allocated to performance obligations that are unsatisfied or are partially unsatisfied. These amounts relate to remaining performance obligations on non-cancelable contracts which include both the deferred revenue balance and amounts that will be invoiced and recognized as revenue in future periods. As of January 31, 2021, approximately $952.3 million of revenue is expected to be recognized from remaining performance obligations, a majority of which is related to multi-year subscription arrangements. The Company expects to recognize revenue on approximately three-fourths of these remaining performance obligations within the next 24 months and the remainder thereafter. The Company applies the practical expedient to exclude remaining performance obligations that are part of contracts with an original expected duration of one year or less. During the year ended January 31, 2021, the revenue recognized from performance obligations satisfied in prior periods was approximately $5.0 million.
Accounts Receivable and Allowances for Doubtful Accounts and Credit Losses
The Company extends credit to its customers in the normal course of business and does not require cash collateral or other security to support the collection of customer receivables. The Company estimates the amount of uncollectible accounts receivable at the end of each reporting period and provides a reserve when needed based on an assessment of various factors including the aging of the receivable balance, historical experience, and expectations of forward-looking loss estimates. When developing the expectations of forward-looking loss estimates, the Company takes into consideration forecasts of future economic conditions, information about past events, such as historical trends of write-offs, and customer-specific circumstances, such as bankruptcies and disputes. Accounts receivable are written off when deemed uncollectible. The allowances for doubtful accounts and credit losses were not material at January 31, 2021 and 2020.
Deferred Revenue
Deferred revenue consists of customer billings or payments received in advance of the recognition of revenue and is recognized as revenue as the revenue recognition criteria are met. The Company generally invoices its customers annually for the forthcoming year of service. Accordingly, the Company’s deferred revenue balance does not include revenue for future years of multiple year non-cancellable contracts that have not yet been billed. During the year ended January 31, 2021, the Company recognized revenue of $253.2 million that was included in the deferred revenue balance as of January 31, 2020.
Deferred Commissions
Commissions are earned by sales personnel upon the execution of the sales contract by the customer, and commission payments are made shortly after they are earned. Commission costs can be associated specifically with subscription, professional services and license arrangements. Commissions earned by the Company’s sales personnel are considered incremental and recoverable costs of obtaining a contract with a customer. These costs are deferred and then amortized over a period of benefit of five years. The Company determined the period of benefit by taking into consideration its past experience with customers, future cash flows expected from customers, industry peers and other available information.
For commissions earned from the sale of term-based license contracts, the Company allocates the costs of commission in proportion to the allocation of transaction price of license and PCS performance obligations. Commissions associated with the license component are expensed at the time the related revenue is recognized. Commissions allocated to PCS are deferred and then amortized over five years.
The Company capitalized commission costs of $24.2 million, $26.2 million and $15.3 million and amortized $14.7 million, $9.6 million and $5.8 million to sales and marketing expense in the accompanying consolidated statements of operations during the years ended January 31, 2021, 2020 and 2019, respectively.
Income Taxes
The Company accounts for income taxes under the asset and liability method, which requires that deferred income taxes be provided for temporary differences between the financial reporting and tax basis of the Company’s assets and liabilities. In addition, deferred tax assets are recorded for the future benefit from the utilization of net operating losses and research and development credit carryforwards. A valuation allowance is provided against deferred tax assets unless it is more likely than not that they will be realized.
The Company’s policy for accounting for uncertainty in income taxes requires the evaluation of tax positions taken or expected to be taken in the course of the preparation of tax returns to determine whether the tax positions are “more-likely-than-not” of being sustained on examination by the applicable tax authorities based on the technical merits of the position. Tax positions not deemed to meet the more-likely-than-not threshold would be recorded as a tax expense in the current year. The Company recognizes interest and penalties related to unrecognized tax benefits as income tax expense. Since the date of adoption of accounting for uncertain tax positions, the Company has accrued immaterial interest and penalties associated with unrecognized tax benefits for all periods presented.
Stock-Based Compensation
The Company measures and recognizes stock-based compensation expense for all stock-based awards, including grants of stock, restricted stock units (“RSU”) and options to purchase stock, made to employees, outside directors and consultants based on estimated fair values.
The Company uses the Black-Scholes option pricing model to value its options at the date of grant based on certain assumptions. The Company recognizes stock-based compensation expense for grants that vest based on only a service condition using the straight-line single-option approach. The Company recognizes stock-based compensation expense related to shares issued pursuant to its 2016 Employee Stock Purchase Plan (“ESPP”) on a straight-line basis over the offering period, which is 24 months.
For RSUs, the Company generally recognizes stock-based compensation using the straight-line method as the awards only contain a service condition. The fair value of an RSU is measured using the market price of the Company’s common stock on the date of the grant.
The Company recognizes stock-based compensation expense from market-based awards using the graded-vesting method. The fair value of such awards is determined using a Monte Carlo simulation approach.
The Company records stock-based compensation expense from stock-based awards granted to non-employees at the estimated fair value of the awards upon vesting.
The Company recognizes stock-based compensation expense based on actual forfeitures.
Convertible Senior Notes
The Company accounts for the issued Convertible Senior Notes (“Convertible Notes”) as separate liability and equity components. The carrying amount of the liability component was calculated by measuring the fair value of a similar liability that does not have an associated convertible feature using a discounted cash flow model with a discount rate associated with each convertible note. The discount rates were determined primarily using observable yields for stand-alone debt instruments with a comparable credit rating and term. In addition, for the 2026 Notes, the Company also used lattice models to determine the discount rate. The carrying amount of the equity component representing the conversion option was determined by deducting the fair value of the liability component from the par value of the Convertible Notes as a whole. This difference represents a debt discount that is amortized to interest expense over the term of the Convertible Notes using the effective interest rate method. The equity component is not remeasured as long as it continues to meet the conditions for equity classification. The Company has allocated issuance costs incurred to the liability and equity components. Issuance costs attributable to the liability component are being amortized to expense over the respective term of the Convertible Notes, and issuance costs attributable to the equity components were netted with the respective equity component in additional paid in capital.
To the extent that the Company receives note conversion requests prior to the maturity of the Convertible Notes, a portion of the equity component is classified as temporary equity, which is measured as the difference between the principal and net carrying amount of the notes requested for conversion. Upon settlement of the conversion requests, the difference between the fair value and the amortized book value of the liability component of the Convertible Notes requested for conversion is recorded as a gain or loss on early note conversion. The fair value of the Convertible Notes are measured based on a similar liability that does not have an associated convertible feature based on the remaining term of the Convertible Notes.
Leases
Leases arise from contracts that convey the right to control the use of identified property or equipment for a period of time in exchange for consideration. The Company’s leasing arrangements are primarily for office space used to conduct operations.
Leases are classified at commencement as either operating or finance leases. As of January 31, 2021, all of the Company’s leases are classified as operating leases. Rent expense for operating leases is recognized using the straight-line method over the term of the agreement beginning on the lease commencement date.
At commencement, the Company records a lease liability at the present value of future lease payments, net of any future lease incentives to be received. Lease agreements may include options to renew the lease term, which is not included in the lease periods to calculate future lease payments unless it is reasonably certain the Company will renew the lease. The Company estimates its incremental borrowing rate (“IBR”) based on the information available at the lease commencement date in determining the present value of lease payments. In determining the appropriate IBR, the Company considers information including, but not limited to, the lease term and the currency in which the arrangement is denominated.
At commencement, the Company also records a corresponding right-of-use asset, which is calculated based on the amount of the lease liability, adjusted for any advance lease payments made and initial direct costs incurred. Right-of-use assets are subject to evaluation for impairment or disposal on a basis consistent with other long-lived assets.
As of January 31, 2021, the Company was not a material lessor in leasing arrangements or a party to material sublease arrangements.
Comprehensive Loss
Comprehensive loss is defined as the change in equity of a business enterprise during a period from transactions and other events and circumstances from non-owner sources. The Company’s comprehensive loss consists of net loss, other comprehensive gain (loss) in relation to defined benefits plans, net of tax, changes in unrealized gain (loss) on marketable securities, net of tax, and foreign currency translation adjustments, net of tax. The other comprehensive gain (loss) in relation to defined benefits plans represents net deferred gains and losses and prior service costs and credits for the defined benefit pension plans.
Recent Accounting Guidance
Recently Adopted Accounting Pronouncements
In June 2016, the FASB issued ASU No. 2016-13, Financial Instruments - Credit Losses (Topic 326): Measurement of Credit Losses on Financial Instruments, which requires the measurement and recognition of expected credit losses for financial assets held at amortized cost, including trade receivables. ASU No. 2016-13 replaces the incumbent incurred loss impairment model with an expected loss model that requires the use of forward-looking information to calculate credit loss estimates. It also eliminates the concept of other-than-temporary impairment and requires credit losses related to available-for-sale debt securities to be recorded through an allowance for credit losses rather than as a reduction in the amortized cost basis of the securities. The Company adopted this standard on February 1, 2020, and the adoption did not have a material impact on the Company’s consolidated financial statements.
In December 2019, the FASB issued ASU No. 2019-12, Income Taxes (Topic 740). The standard simplifies the accounting for income taxes by removing certain exceptions to the general principles in Topic 740 related to the approach for intraperiod tax allocation and the recognition of deferred tax liabilities for outside basis differences. The standard also clarifies the accounting for transactions that result in a step-up in the tax basis of goodwill. The standard also improves consistent application of and simplifies GAAP for other areas of Topic 740 by clarifying and amending existing guidance. The amendment is effective for fiscal years, and interim periods within those fiscal years, beginning after December 15, 2020, and early adoption is permitted. The Company early adopted this standard on February 1, 2020, and the adoption did not have a material impact on the Company’s consolidated financial statements.
In May 2020, the SEC issued Final Rule Release No. 33-10786, which amends the financial statement requirements for acquisitions and dispositions of businesses and related pro forma financial information required under SEC Regulation S-X, Rule 3-05. Among other modifications, the amendments change certain criteria in the significance tests used to determine the requirements for audited financial statements and related pro forma financial information, the periods audited financial statements must cover, and the form and content of the pro forma financial information. The final rule was effective on January 1, 2021, however, voluntary early adoption is permitted as long as all amendments are adopted in their entirety. The Company early adopted the final rule during the third quarter of fiscal 2021.
In August 2018, the FASB issued ASU No. 2018-14, which amends FASB ASC Topic 715, "Compensation - Retirement Benefits." The amendments in this guidance modify the disclosure requirements for employers that sponsor defined benefit pension or other postretirement plans. The amendments in this guidance remove disclosures that no longer are considered cost beneficial, clarify the specific requirements of disclosures and add disclosure requirements identified as relevant. This guidance is effective for annual reporting periods ending after December 15, 2020, with early adoption permitted, and is required to be adopted retrospectively. The Company early adopted this standard on November 1, 2020, and the adoption did not have a material impact on the Company’s consolidated financial statements.
New Accounting Pronouncements Not Yet Adopted
In August 2020, the FASB issued ASU No. 2020-06, Debt—Debt with Conversion and Other Options (Subtopic 470-20) and Derivatives and Hedging - Contracts in Entity’s Own Equity (Subtopic 815-40), which simplifies the accounting for convertible instruments. The guidance removes certain accounting models that separate the embedded conversion features from the host contract for convertible instruments, requiring bifurcation only if the convertible debt feature qualifies as a derivative under ASC 815 or for convertible debt issued at a substantial premium. The ASU removes certain settlement conditions required for equity contracts to qualify for the derivative scope exception, permitting more contracts to qualify for it. In addition, the guidance eliminates the treasury stock method to calculate diluted earnings per share for convertible instruments and requires the use of the if-converted method. The ASU is effective for annual reporting periods beginning after December 15, 2021, including interim reporting periods within those annual periods, with early adoption permitted no earlier than the fiscal year beginning after December 15, 2020. The ASU allows entities to use a modified or full retrospective transition method. Under the modified approach, entities will apply the guidance to all financial instruments that are outstanding as of the beginning of the year of adoption with the cumulative effect recognized as an adjustment to the opening balance of retained earnings. Under the full retrospective method, entities will apply it to all outstanding financial instruments for each prior reporting period presented. The Company is currently evaluating the timing and method of adoption and the related impact of the new guidance on the earnings per share and on its financial statements.
Note 3. Marketable Securities
The following is a summary of available-for-sale marketable securities, excluding those securities classified within cash and cash equivalents on the consolidated balance sheets (in thousands):
| | | | | | | | | | | | | | | | | | | | | | | |
| January 31, 2021 |
| Amortized Costs | | Unrealized Gains | | Unrealized Losses | | Fair Value |
| U.S. treasury securities | $ | 268,141 | | | $ | 29 | | | $ | (1) | | | $ | 268,169 | |
| Corporate notes and bonds | 14,487 | | | 100 | | | — | | | 14,587 | |
| | | | | | | |
| | | | | | | |
| Certificates of deposit | 280 | | | — | | | — | | | 280 | |
| Total marketable securities | $ | 282,908 | | | $ | 129 | | | $ | (1) | | | $ | 283,036 | |
| | | | | | | | | | | | | | | | | | | | | | | |
| January 31, 2020 |
| Amortized Costs | | Unrealized Gains | | Unrealized Losses | | Fair Value |
| U.S. treasury securities | $ | 306,871 | | | $ | 324 | | | $ | — | | | $ | 307,195 | |
| Corporate notes and bonds | 155,751 | | | 272 | | | — | | | 156,023 | |
| Commercial paper | 15,977 | | | — | | | — | | | 15,977 | |
| Asset backed securities | 15,501 | | | 17 | | | — | | | 15,518 | |
| Certificates of deposit | 4,447 | | | — | | | — | | | 4,447 | |
| Total marketable securities | $ | 498,547 | | | $ | 613 | | | $ | — | | | $ | 499,160 | |
As of January 31, 2021, the fair values of available-for-sale marketable securities, by remaining contractual maturity, were as follows (in thousands):
| | | | | |
| Due within one year | $ | 210,350 | |
| Due in one year through five years | 72,686 | |
| Total | $ | 283,036 | |
The Company's marketable securities consist primarily of U.S. Treasury securities and high credit quality corporate notes and bonds. As the Company views its marketable securities as available to support its current operations, it has classified all available for sale securities as short-term.
During the year ended January 31, 2021, the Company recognized gross realized gains of approximately $1.0 million and there were no material gross realized losses, from the sale of certain available-for-sale marketable securities that were reclassified out of accumulated other comprehensive loss. During the years ended January 31, 2020 and 2019, there were no material gross realized gains or losses from the sale of certain available-for-sale marketable securities that were reclassified out of accumulated other comprehensive loss.
The Company regularly reviews the changes to the rating of its debt securities by rating agencies as well as reasonably monitors the surrounding economic conditions to assess the risk of expected credit losses. As of January 31, 2021, the unrealized losses and the related risk of expected credit losses were insignificant.
Note 4. Business Combinations
Acquisitions in Fiscal Year Ended January 31, 2021
LLamasoft, Inc.
On November 2, 2020, the Company completed the acquisition of Laurel Parent Holdings, Inc. and its subsidiaries ("LLamasoft"), a supply chain design and analysis software and solutions company. The acquisition strengthens Coupa’s supply chain capabilities, enabling businesses to drive greater value through Business Spend Management. In connection with the acquisition, all outstanding equity securities of LLamasoft were cancelled with the payment by the Company of approximately $1.4 billion, of which approximately $791.5 million was paid in cash, and the remainder was paid in the form of 2,371,014 shares of the Company's common stock with a fair value of approximately $634.5 million. Approximately $15.0 million of the cash paid is being held in escrow for fifteen months after the transaction closing date as security for the former LLamasoft stockholders' indemnification obligations, and approximately $7.5 million of the cash paid is being held in escrow until the completion of final adjustment on the purchase consideration.
Out of the total payment, approximately $27.8 million, comprised of $19.4 million of cash and 31,098 shares of the Company's common stock issued with a fair value of $8.3 million, was accounted for as a one-time post acquisition stock-based compensation expense. This stock-based compensation expense was due to accelerated vesting of legacy LLamasoft employee stock awards in connection with the acquisition.
The total purchase consideration as of November 2, 2020 is as follows (in thousands):
| | | | | |
| Total cash paid | $ | 791,532 | |
| Fair value of share consideration | 634,507 | |
| Less: One-time stock-based compensation expense | (27,750) | |
| Total purchase consideration | $ | 1,398,289 | |
In addition, the Company issued 45,889 shares of common stock subject to vesting restrictions with an approximate fair value of $12.3 million to certain employee-shareholders of LLamasoft. These shares are subject to service-based vesting conditions including continued employment with the Company. The value assigned to these shares will be recorded as post-acquisition compensation expense as the shares vest and has been excluded from the purchase consideration.
The acquisition was accounted for as a business combination and, accordingly, the total fair value of purchase consideration was allocated to the tangible and intangible assets acquired and liabilities assumed based on their fair values on the acquisition date. The major classes of assets and liabilities to which the Company has allocated the total fair value of purchase consideration were as follows (in thousands): | | | | | |
| November 2, 2020 |
| Cash and cash equivalents | $ | 1,389 | |
| Accounts receivable | 38,124 | |
| Goodwill | 932,878 | |
| Intangible assets | 517,600 | |
| Operating lease right-of-use assets | 14,820 | |
| Other assets | 23,440 | |
| Accounts payable and other current liabilities | (10,090) | |
| Deferred revenue | (14,764) | |
| Operating lease liabilities | (14,644) | |
| Deferred tax liability, net | (76,091) | |
| Other non-current liabilities | (14,373) | |
| Total consideration | $ | 1,398,289 | |
Other assets include indemnification assets totaling approximately $2.1 million due to an assumed liability for which the seller is responsible.
The purchase price allocation is preliminary. The Company continues to collect information with regard to its estimates and assumptions, including potential liabilities and contingencies. The Company will record adjustments to the fair value of the assets acquired, liabilities assumed and goodwill within the twelve months measurement period, if necessary. The goodwill recognized was primarily attributed to the assembled workforce and increased synergies that are expected to be achieved from the integration of LLamasoft and is not deductible for income tax purposes. The Company determined the fair values of intangible assets acquired and liabilities assumed with the assistance of third-party valuation consultants. Based on this valuation, the intangible assets acquired were (in thousands): | | | | | | | | | | | |
| Fair Value | | Useful life
(in Years) |
| Developed technology | $ | 316,100 | | | 7 |
| Customer relationships | 200,300 | | | 5 |
| Trademarks | 1,200 | | | 1 |
| Total intangible assets | $ | 517,600 | | | |
The Company incurred costs related to this acquisition of approximately $3.2 million for the year ended January 31, 2021. All acquisition related costs were expensed as incurred and have been recorded in general and administrative expenses in the accompanying consolidated statements of operations.
Revenue of approximately $22.5 million of the acquired business since the acquisition date has been included in the Company's results. The earnings of the acquired business have been included in the Company's results since the acquisition date. After excluding the impact of acquired intangible asset amortization, the earnings of the acquired business are not material to the Company's consolidated financial results.
The following unaudited pro forma financial information presents combined results of operations for each of the periods presented, as if LLamasoft had been acquired as of the beginning of the comparable prior annual reporting period, giving effect on a pro forma basis to purchase accounting adjustments such as amortization of intangible assets and acquisition related costs, among others. The unaudited pro forma information presented below is for informational purposes only and is not necessarily indicative of the Company's consolidated results of operations of the combined business had the acquisition actually occurred at the beginning of the Company's fiscal year 2020 or of the results of the Company's future operations of the combined business (in thousands).
| | | | | | | | | | | |
| Year Ended January 31, |
| 2021 | | 2020 |
| Pro forma total revenues | $ | 624,152 | | | $ | 489,587 | |
| Pro forma net loss | $ | (209,886) | | | $ | (227,959) | |
Much-Net GmbH
On September 15, 2020, the Company acquired all of the equity interest in Much-Net GmbH ("Much-Net"), a financial instrument software and service provider that specializes in risk management. The purchase consideration was approximately $4.3 million in cash which is net of $1.8 million in cash acquired. The acquisition was accounted for as a business combination and, accordingly, the total fair value of purchase consideration was allocated to the tangible and intangible assets acquired and liabilities assumed based on their fair values on the acquisition date. In aggregate, the Company recorded $1.0 million for developed technology intangible assets with an estimated useful life of four years, and $4.2 million of goodwill which is primarily attributed to assembled workforce and expected synergies. The goodwill is not deductible for income tax purposes. The other assets acquired and liabilities assumed were not material.
The purchase price allocation is preliminary. The Company continues to collect information with regard to its estimates and assumptions, including potential liabilities and contingencies. The Company will record adjustments to the fair value of the net assets acquired and goodwill within the twelve months measurement period, if necessary.
The revenue and earnings of the acquired business have been included in the Company’s results since the acquisition date and are not material to the Company’s consolidated financial results. Pro forma results of operations for this acquisition have not been presented as the financial impact on the Company’s consolidated financial statements would be immaterial.
Bellin Treasury International GmbH
On June 9, 2020, the Company acquired all of the equity interest in Bellin Treasury International GmbH (“Bellin”), a cloud-based treasury management software platform that improves visibility and control over cash and optimizes treasury processes. The purchase consideration was approximately $121.0 million, comprised of $79.1 million in cash (of which $8.0 million is being held in escrow for eighteen months after the transaction closing date) and 186,300 shares of the Company’s common stock with a fair value of approximately $41.8 million as of the transaction close date. In addition, the Company issued 208,766 shares of unvested common stock with an approximate fair value of $46.9 million to one of the sellers who became a Coupa employee. These shares are subject to service-based vesting conditions including continued employment with the Company, and all these shares were unvested as of January 31, 2021. The value assigned to the unvested common stock will be recorded as post-acquisition compensation expense as the shares vest and has been excluded from the purchase consideration.
The acquisition was accounted for as a business combination and, accordingly, the total fair value of purchase consideration was allocated to the tangible and intangible assets acquired and liabilities assumed based on their fair values on the acquisition date. The major classes of assets and liabilities to which the Company has allocated the total fair value of purchase consideration were as follows (in thousands):
| | | | | |
| June 9, 2020 |
| Cash and cash equivalents | $ | 4,783 | |
| Accounts receivable | 5,345 | |
| Intangible assets | 42,745 | |
| Other assets | 5,203 | |
| Goodwill | 85,301 | |
| Accounts payable and other current liabilities | (3,795) | |
| Deferred revenue | (4,230) | |
| Deferred tax liability, net | (11,610) | |
| Other non-current liabilities | (2,769) | |
Total consideration | $ | 120,973 | |
The purchase price allocation is preliminary. The Company continues to collect information with regard to its estimates and assumptions, including potential liabilities and contingencies. The Company will record adjustments to the fair value of the assets acquired, liabilities assumed and goodwill within the twelve months measurement period, if necessary. The goodwill recognized was primarily attributed to the assembled workforce and increased synergies that are expected to be achieved from the integration of Bellin and is not deductible for income tax purposes. The Company determined the fair values of intangible assets acquired and liabilities assumed with the assistance of third-party valuation consultants. Based on this valuation, the intangible assets acquired were (in thousands):
| | | | | | | | | | | |
| Fair Value | | Useful life
(in Years) |
| Developed technology | $ | 27,800 | | | 5 |
| Customer relationships | 14,700 | | | 5 |
| Trademarks | 245 | | | 0.5 |
Total intangible assets | $ | 42,745 | | | |
The Company incurred costs related to this acquisition of approximately $1.2 million for the year ended January 31, 2021. All acquisition related costs were expensed as incurred and have been recorded in general and administrative expenses in the accompanying consolidated statements of operations.
The revenue and earnings of the acquired business have been included in the Company’s results since the acquisition date and are not material to the Company’s consolidated financial results. Pro forma results of operations for this acquisition have not been presented as the financial impact on the Company’s consolidated financial statements would be immaterial.
ConnXus, Inc.
On May 1, 2020, the Company acquired all of the equity interest in ConnXus, Inc. (“ConnXus”), a cloud-based supplier relationship management platform that enables enterprises, health systems and government agencies to monitor all aspects of their supplier diversity compliance programs. The purchase consideration was approximately $10.0 million in cash of which approximately $1.4 million is being held back by the Company for fifteen months after the transaction closing date.
The acquisition was accounted for as a business combination and, accordingly, the total fair value of purchase consideration was allocated to the tangible and intangible assets acquired and liabilities assumed based on their fair values on the acquisition date. The major classes of assets and liabilities to which the Company has allocated the total fair value of purchase consideration were as follows (in thousands): | | | | | |
| May 1, 2020 |
| Intangible assets | $ | 1,900 | |
| Other assets | 540 | |
| Goodwill | 8,527 | |
| Accounts payable and other liabilities | (967) | |
Total consideration | $ | 10,000 | |
The purchase price allocation is preliminary. The Company continues to collect information with regard to its estimates and assumptions, including potential liabilities and contingencies. The Company will record adjustments to the fair value of the assets acquired, liabilities assumed and goodwill within the twelve months measurement period, if necessary. The goodwill recognized was primarily attributed to increased synergies that are expected to be achieved from the integration of ConnXus and is not deductible for income tax purposes. The Company determined the fair values of intangible assets acquired and liabilities assumed. Based on this valuation, the intangible assets acquired was (in thousands):
| | | | | | | | | | | |
| Fair Value | | Useful life
(in Years) |
| Developed technology | $ | 1,900 | | | 4 |
Total intangible assets | $ | 1,900 | | | |
The Company incurred costs related to this acquisition of approximately $400,000 for the year ended January 31, 2021. All acquisition related costs were expensed as incurred and have been recorded in general and administrative expenses in the accompanying consolidated statements of operations.
The revenue and earnings of the acquired business have been included in the Company’s results since the acquisition date and are not material to the Company’s consolidated financial results. Pro forma results of operations for this acquisition have not been presented as the financial impact on the Company’s consolidated financial statements would be immaterial.
Acquisitions in Fiscal Year Ended January 31, 2020
Yapta Inc.
On December 13, 2019, the Company completed the acquisition of Yapta, Inc., (“Yapta”). Yapta developed technology that enables the Company to offer price assurance capabilities that dynamically track prices on airline and hotel reservations and instantly rebooks them at the lowest available price, without impacting the traveler experience. The purchase consideration comprised of approximately $98.7 million in cash and $12.5 million in cash contingent on the achievement of Yapta’s revenue target during the twelve months starting from the transaction closing date. Approximately $9.8 million of the purchase consideration is being held in escrow for fifteen months after the transaction closing day.
The acquisition was accounted for as a business combination and, accordingly, the total fair value of purchase consideration was allocated to the tangible and intangible assets acquired and liabilities assumed based on their fair values on the acquisition date. The contingent cash consideration was classified as a liability and included in other liabilities on the Company’s consolidated balance sheet, subject to measurement on a recurring basis at fair value. The valuation of the contingent consideration was determined based on the probable achievement of Yapta’s revenues target within a specified time period from the transaction date. As of the acquisition date and January 31, 2020, the fair value of the contingent consideration payable was determined to be $12.5 million. Yapta did not achieve the revenues target during the measurement period of twelve months starting from the transaction closing date and the Company reversed the $12.5 million of contingent consideration payable with an offset to general and administrative expenses in the consolidated statements of operations during the year-ended January 31, 2021.
The major classes of assets and liabilities to which the Company has allocated the total fair value of purchase consideration of $111.2 million were as follows (in thousands):
| | | | | |
| December 13,
2019 |
| Cash and cash equivalents | $ | 333 | |
| Accounts receivable | 3,796 | |
| Intangible assets | 39,710 | |
| Other assets | 1,482 | |
| Goodwill | 70,748 | |
| Deferred tax liability, net | (2,498) | |
| Accounts payable and other liabilities | (2,387) | |
| Total consideration | $ | 111,184 | |
The goodwill recognized was primarily attributed to increased synergies that are expected to be achieved from the integration of Yapta and is not deductible for income tax purposes. The Company determined the fair values of intangible assets acquired and liabilities assumed with the assistance of third-party valuation consultants. Based on this valuation, the intangible assets acquired were (in thousands):
| | | | | | | | | | | |
| Fair Value | | Useful life
(in Years) |
| Developed technology | $ | 31,300 | | | 4 |
| Customer relationships | 8,300 | | | 5 |
| Trademarks | 110 | | | 0.5 |
| Total intangible assets | $ | 39,710 | | | |
The Company incurred costs related to this acquisition of approximately $800,000 for the year ended January 31, 2020. All acquisition related costs were expensed as incurred and have been recorded in general and administrative expenses in the accompanying consolidated statements of operations.
The revenue and earnings of the acquired business have been included in the Company’s results since the acquisition date and are not material to the Company’s consolidated financial results. Pro forma results of operations for this acquisition have not been presented as the financial impact on the Company’s consolidated financial statements would be immaterial.
Exari Group, Inc.
On May 6, 2019, the Company completed the acquisition of Exari Group, Inc. (“Exari”) for consideration of approximately $214.6 million in cash. The acquisition extends the Company’s BSM platform with advanced contract lifecycle management capabilities to enable companies to comprehensively manage their contract lifecycle and operationalize their contracts against spend transactions.
The acquisition was accounted for as a business combination and, accordingly, the total fair value of purchase consideration was allocated to the tangible and intangible assets acquired and liabilities assumed based on their fair values on the acquisition date. The major classes of assets and liabilities to which the Company has allocated the fair value of purchase consideration were as follows (in thousands):
| | | | | |
| May 6, 2019 |
| Cash and cash equivalents | $ | 6,337 | |
| Accounts receivable | 7,863 | |
| Intangible assets | 57,000 | |
| Other assets | 5,646 | |
| Goodwill | 163,170 | |
| Accounts payable and other current liabilities | (6,232) | |
| Deferred revenue | (4,443) | |
| Deferred tax liability, net | (11,046) | |
| Other non-current liabilities | (3,679) | |
| Total consideration | $ | 214,616 | |
The goodwill recognized was primarily attributed to increased synergies that are expected to be achieved from the integration of Exari and is partially deductible for income tax purposes. The Company determined the fair values of intangible assets acquired and liabilities assumed with the assistance of third-party valuation consultants. Based on this valuation, the intangible assets acquired were (in thousands):
| | | | | | | | | | | | | | | | | |
| Fair Value | | Useful life
(in Years) |
| Developed technology | $ | 45,400 | | | 3 | to | 5 |
| Customer relationships | 11,100 | | | 5 |
| Trademarks | 500 | | | 1 |
| Total intangible assets | $ | 57,000 | | | | | |
The Company incurred costs related to this acquisition of approximately $2.8 million for the year ended January 31, 2020. All acquisition related costs were expensed as incurred and have been recorded in general and administrative expenses in the accompanying consolidated statements of operations.
Note 5. Fair Value Measurements
The following table summarizes the Company’s fair value hierarchy for its financial assets and liabilities measured at fair value on a recurring basis at January 31, 2021 (in thousands):
| | | | | | | | | | | | | | | | | | | | | | | |
| Level 1 | | Level 2 | | Level 3 | | Total |
Cash equivalents: (1) | | | | | | | |
Money market funds | $ | 90,437 | | | $ | — | | | $ | — | | | $ | 90,437 | |
| Marketable securities: | | | | | | | |
U.S. treasury securities | — | | | 268,169 | | | — | | | 268,169 | |
Corporate notes and bonds | — | | | 14,587 | | | — | | | 14,587 | |
| | | | | | | |
| | | | | | | |
Certificate of deposit | — | | | 280 | | | — | | | 280 | |
| | | | | | | |
| | | | | | | |
Total assets | $ | 90,437 | | | $ | 283,036 | | | $ | — | | | $ | 373,473 | |
Derivative liabilities: (2) | | | | | | | |
Foreign currency forward contracts not designated as hedges | $ | — | | | $ | 47 | | | $ | — | | | $ | 47 | |
Total liabilities | $ | — | | | $ | 47 | | | $ | — | | | $ | 47 | |
(1)Included in cash and cash equivalents.
(2)The derivative liabilities are related to foreign currency forward contracts at a notional amount of $2.9 million. The derivative liabilities were included in the accrued expenses and other current liabilities on the Company’s consolidated balance sheets at January 31, 2021. The foreign currency forward contracts were accounted for as an economic hedge and as a result the changes in the fair value of the derivative liabilities were recognized in the Company’s consolidated statements of operations. The changes in the fair value during the year ended January 31, 2021 were not material.
The following table summarizes the Company’s fair value hierarchy for its financial assets and liabilities measured at fair value on a recurring basis at January 31, 2020 (in thousands):
| | | | | | | | | | | | | | | | | | | | | | | |
| Level 1 | | Level 2 | | Level 3 | | Total |
Cash equivalents: (1) | | | | | | | |
| Money market funds | $ | 120,242 | | | $ | — | | | $ | — | | | $ | 120,242 | |
| Corporate notes and bonds | — | | | 2,011 | | | — | | | 2,011 | |
| Marketable securities: | | | | | | | |
| U.S. treasury securities | — | | | 307,195 | | | — | | | 307,195 | |
| Corporate notes and bonds | — | | | 156,023 | | | — | | | 156,023 | |
| Commercial paper | — | | | 15,977 | | | — | | | 15,977 | |
| Asset backed securities | — | | | 15,518 | | | — | | | 15,518 | |
| Certificates of deposit | — | | | 4,447 | | | — | | | 4,447 | |
| Total assets | $ | 120,242 | | | $ | 501,171 | | | $ | — | | | $ | 621,413 | |
| Other liabilities: | | | | | | | |
| Contingent consideration payable | $ | — | | | $ | — | | | $ | 12,500 | | | $ | 12,500 | |
| Total liabilities | $ | — | | | $ | — | | | $ | 12,500 | | | $ | 12,500 | |
(1) Included in cash and cash equivalents
The contingent consideration payable of $12.5 million as of January 31, 2020 represents the estimated fair value of the additional variable cash consideration payable in connection with the acquisition of Yapta that was contingent upon the achievement of Yapta’s revenue target during the twelve months from the transaction closing day. Yapta did not achieve the revenues target during the measurement period of twelve months starting from the transaction closing date and the Company reversed the $12.5 million of contingent consideration payable with an offset to general and administrative expenses in the consolidated statements of operations during the year-ended January 31, 2021. Refer to Note 4, “Business Combinations” for further details on the contingent consideration.
The Company has $1,380.0 million in aggregate principal amount of 0.375% convertible senior notes due in 2026 (the “2026 Notes”), $805.0 million in aggregate principal amount of 0.125% convertible senior notes due in 2025 (the “2025 Notes”) and $8.8 million in aggregate principal amount of 0.375% convertible senior notes due in 2023 (the “2023 Notes” and together with the 2025 Notes and 2026 Notes, the “Convertible Notes”), outstanding as of January 31, 2021. Refer to Note 9, “Convertible Senior Notes” for further details on the Convertible Notes.
The Company carries the Convertible Notes at par value less the portion allocated to equity and the related unamortized discount and issuance costs on its consolidated balance sheets and presents the fair value for disclosure purposes only. The estimated fair value of the 2026 Notes, 2025 Notes and 2023 Notes, based on a market approach as of January 31, 2021 was approximately $1,775.0 million, $1,617.5 million and $61.2 million, respectively, which represents a Level 2 valuation estimate. The estimated fair value of the 2025 Notes and 2023 Notes, based on a market approach as of January 31, 2020 was approximately $1,015.3 million and $858.3 million, respectively, which represents a Level 2 valuation estimate. The estimated fair value was determined based on the estimated or actual bids and offers of the Convertible Notes in an over-the-counter market on the last trade completed prior to the end of the period.
Note 6. Property and Equipment, Net
Property and equipment consisted of the following (in thousands):
| | | | | | | | | | | |
| As of January 31, |
| 2021 | | 2020 |
| Furniture and equipment | $ | 11,955 | | | $ | 6,767 | |
| Software development costs | 43,857 | | | 33,326 | |
| Leasehold improvements | 5,465 | | | 1,880 | |
| Construction in progress | 848 | | | 45 | |
| Total property and equipment | 62,125 | | | 42,018 | |
| Less: accumulated depreciation and amortization | (33,859) | | | (23,216) | |
| Property and equipment, net | $ | 28,266 | | | $ | 18,802 | |
Depreciation and amortization expense related to property and equipment, excluding software development costs, was approximately $3.6 million, $1.7 million and $849,000 for the years ended January 31, 2021, 2020 and 2019, respectively. Amortization expense related to software development costs was approximately $7.1 million, $3.6 million and $3.1 million for the years ended January 31, 2021, 2020 and 2019, respectively.
Note 7. Goodwill and Other Intangible Assets
Goodwill
The following table represents the changes in goodwill (in thousands):
| | | | | |
| Balance at January 31, 2019 | $ | 209,560 | |
| Additions from acquisitions | 232,890 | |
| Adjustments | (338) | |
| Balance at January 31, 2020 | 442,112 | |
| Additions from acquisitions | 1,030,924 | |
Foreign currency translation adjustments | 6,784 | |
| Other adjustments | 1,027 | |
| Balance at January 31, 2021 | $ | 1,480,847 | |
Other Intangible Assets
The following table summarizes the other intangible asset balances (in thousands):
| | | | | | | | | | | | | | | | | | | | | | | | | | | | | | | | | | | | | | | | | |
| As of January 31, |
| 2021 | | 2020 |
| Weighted Average Remaining Useful
Lives
(in years) | |
Gross Carrying Amount | | Accumulated Amortization | |
Net Carrying Amount | |
Gross Carrying Amount | | Accumulated Amortization | |
Net Carrying Amount |
| Developed technology | 6.0 | | $ | 474,120 | | | $ | (69,560) | | | $ | 404,560 | | | $ | 125,135 | | | $ | (26,840) | | | $ | 98,295 | |
| Customer relationships | 4.6 | | 254,437 | | | (27,727) | | | 226,710 | | | 38,294 | | | (8,061) | | | 30,233 | |
| Trademarks | 0.8 | | 2,419 | | | (1,516) | | | 903 | | | 955 | | | (823) | | | 132 | |
| Total other intangible assets | | | $ | 730,976 | | | $ | (98,803) | | | $ | 632,173 | | | $ | 164,384 | | | $ | (35,724) | | | $ | 128,660 | |
Amortization expense related to other intangible assets was approximately $62.9 million, $24.0 million and $6.9 million for the years ended January 31, 2021, 2020 and 2019, respectively.
As of January 31, 2021, the future amortization expense of other intangible assets is as follows (in thousands):
| | | | | |
Year Ending January 31, | |
| 2022 | $ | 130,550 | |
| 2023 | 125,094 | |
| 2024 | 118,977 | |
| 2025 | 99,831 | |
| 2026 | 78,571 | |
| Thereafter | 79,150 | |
| Total | $ | 632,173 | |
The Company, which has one reporting unit, performed an annual test for goodwill impairment and determined that goodwill was not impaired. In addition, there have been no significant events or circumstances affecting the valuation of goodwill subsequent to the Company’s annual assessment. Furthermore, no events or changes in circumstances have occurred to suggest that the carrying amounts for any of the Company’s long-lived assets or identifiable intangible assets may be non-recoverable. As such, the Company was not required to reevaluate the recoverability of its long-lived assets.
Note 8. Accrued Expenses and Other Current Liabilities
Accrued expenses and other current liabilities consisted of the following (in thousands):
| | | | | | | | | | | |
| As of January 31, |
| 2021 | | 2020 |
| Accrued compensation | $ | 45,120 | | | $ | 24,741 | |
| Accrued expenses | 17,500 | | | 11,767 | |
| Other current liabilities | 13,238 | | | 8,723 | |
| Income tax payable | 2,396 | | | 1,535 | |
| Holdback payable | 2,017 | | | 7,479 | |
| Total accrued expenses and other current liabilities | $ | 80,271 | | | $ | 54,245 | |
Included in the accrued compensation liability caption for the years ended January 31, 2021 and 2020, the Company had accrued $8.3 million and $5.8 million of employee stock purchase plan contributions received, respectively. For further information on the Company’s employee stock purchase plan see Note 11, "Common Stock and Stockholders' Equity".
Note 9. Convertible Senior Notes
2026 Notes
In June 2020, the Company issued $1,380.0 million aggregate principal amount of its 0.375% Convertible Senior Notes due 2026 in a private placement to qualified institutional buyers pursuant to Rule 144A under the Securities Act of 1933, as amended. The 2026 Notes are subject to the terms and conditions of an Indenture (the “Indenture”) between the Company and Wilmington Trust, National Association, as trustee.
The net proceeds from the issuance of the 2026 Notes were $1,162.3 million, net of debt issuance costs, including the underwriting discount and the cash used to purchase the capped call discussed below.
The 2026 Notes are senior, unsecured obligations of the Company, and interest is payable semi-annually in cash at a rate of 0.375% per annum on June 15 and December 15 of each year, beginning on December 15, 2020. The 2026 Notes will mature on June 15, 2026 unless redeemed, repurchased or converted prior to such date. Prior to the close of business on the business day immediately preceding March 15, 2026, the 2026 Notes are convertible at the option of holders during certain periods, upon satisfaction of certain conditions as described below. On or after March 15, 2026, the 2026 Notes are convertible at any time until the close of business on the second scheduled trading day immediately preceding the maturity date. The 2026 Notes have an initial conversion rate of 3.3732 shares of common stock per $1,000 principal (equivalent to an initial conversion price of approximately $296.45 per share of common stock). The conversion rate is subject to customary adjustments for certain events as described in the Indenture. Upon conversion, the Company will pay or deliver, as the case may be, cash, shares of its common stock or a combination of cash and shares of common stock, at its election. It is the Company’s current intent to settle conversions of the 2026 Notes through combination settlement, which involves repayment of the principal portion in cash and any excess of the conversion value over the principal amount in shares of its common stock.
Holders may convert their 2026 Notes, at their option, prior to the close of business on the business day immediately preceding March 15, 2026, in multiples of $1,000 principal amount, only under the following circumstances:
•during any fiscal quarter commencing after the fiscal quarter ending on October 31, 2020 (and only during such fiscal quarter), if the last reported sale price of its common stock for at least 20 trading days (whether or not consecutive) during a period of 30 consecutive trading days ending on, and including, the last trading day of the immediately preceding fiscal quarter is greater than or equal to 130% of the conversion price on each applicable trading day;
•during the five business day period after any ten consecutive trading day period (the “Measurement Period”) in which the trading price per $1,000 principal amount of the 2026 Notes for each trading day of the Measurement Period was less than 98% of the product of the last reported sales price of the Company’s common stock and the conversion rate for the 2026 Notes on each such trading day;
•after the Company’s issuance of a notice of redemption and prior to the close of business on the second scheduled trading day immediately preceding the redemption date; or
•upon the occurrence of specified corporate events, as defined in the Indenture.
If the Company undergoes a fundamental change, as described in the Indenture, subject to certain conditions, holders may require the Company to repurchase for cash all or any portion of their 2026 Notes. The fundamental change repurchase price is equal to 100% of the principal amount of the 2026 Notes to be repurchased, plus accrued and unpaid interest up to, but excluding the fundamental change repurchase date. If holders elect to convert their 2026 Notes in connection with a make-whole fundamental change or during a redemption period, as described in the Indenture, the Company will, to the extent provided in the Indenture, increase the conversion rate applicable to the 2026 Notes.
The 2026 Notes are the Company’s senior unsecured obligations and rank senior in right of payment to any of its indebtedness that is expressly subordinated in right of payment to the 2026 Notes, and equal in right of payment to any of its indebtedness that is not so subordinated, including the 2023 Notes and the 2025 Notes. The 2026 Notes are effectively junior in right of payment to any of the Company’s secured indebtedness to the extent of the value of the assets securing such indebtedness; and structurally junior to all indebtedness and other liabilities (including trade payables) and any preferred equity of its current or future subsidiaries.
The Indenture contains customary events of default with respect to the 2026 Notes and provides that upon certain events of default occurring and continuing, the Trustee may, and at the request of holders of at least 25% in principal amount of the 2026 Notes the Trustee is required to, declare all principal and accrued and unpaid interest, if any, of the 2026 Notes to be due and payable. In case of certain events of bankruptcy, insolvency or reorganization, involving the Company, all of the principal of and accrued and unpaid interest on the 2026 Notes will automatically become due and payable.
In accounting for the issuance of the 2026 Notes, the Company separated the 2026 Notes into liability and equity components. The carrying amount of the liability component was calculated by measuring the fair value of a similar liability that does not have an associated convertible feature using a discounted cash flow model with a discount rate associated with the 2026 Notes. The discount rate was determined primarily using observable yields for stand-alone debt instruments with a comparable credit rating and term. In addition, the Company also used lattice models to determine the discount rate. The carrying amount of the equity component representing the conversion option was determined by deducting the fair value of the liability component from the par value of the 2026 Notes as a whole. The difference between the principal amount of the 2026 Notes and the liability component, equal to $510.3 million (the “debt discount”), is amortized to interest expense using the effective interest method over the term of the 2026 Notes. The equity component of the 2026 Notes will not be remeasured as long as it continues to meet the conditions for equity classification.
The Company incurred $24.9 million of transaction costs related to the issuance of the 2026 Notes. The Company allocated the total amount incurred to the liability and equity components using the same proportions as the proceeds from the 2026 Notes. Issuance costs attributable to the liability component are being amortized to interest expense over the term of the 2026 Notes using the effective interest method, and issuance costs attributable to the equity component are included along with the equity component in stockholders' equity.
2025 Notes
In June 2019, the Company issued 2025 Notes in aggregate principal amount of $805.0 million in a private placement to qualified institutional buyers pursuant to Rule 144A under the Securities Act of 1933, as amended. The net proceeds from the issuance of the 2025 Notes were $667.4 million, net of debt issuance costs, including the underwriting discount and the cash used to purchase the capped call, discussed below. The 2025 Notes have an initial conversion rate of 6.2658 shares of common stock per $1,000 principal (equivalent to an initial conversion price of approximately $159.60 per share of its common stock). The interest rate is fixed at 0.125% per annum for the 2025 Notes and is payable semi-annually in arrears on June 15 and December 15 of each year, which commenced on December 15, 2019. The accounting for 2025 Notes was substantially consistent with the accounting for 2026 Notes as disclosed above. Refer to the Company’s consolidated financial statements for the year ended January 31, 2020 for details of the issuance and accounting of 2025 Notes.
The conversion condition for the 2025 Notes was initially met during the three months ended July 31, 2020 and it continued to be met during the three months ended January 31, 2021. As a result, the 2025 Notes continued to be convertible at the option of the holders and remained classified as current liabilities on the consolidated balance sheet as of January 31, 2021.
As of January 31, 2021, an immaterial principal amount of 2025 Notes was requested for conversion, which is expected to be settled during the quarter ended April 30, 2021. In addition, from February 1, 2021 to the date of this filing, the Company has not received any additional conversion requests for the 2025 Notes.
2023 Notes
In January 2018, the Company issued 2023 Notes in aggregate principal amount of $230.0 million in a private placement to qualified institutional buyers pursuant to Rule 144A under the Securities Act of 1933, as amended. The net proceeds from the issuance of the 2023 Notes were $200.4 million, net of debt issuance costs, including the underwriting discount and the cash used to purchase the capped call, discussed below. The 2023 Notes have an initial conversion rate of 22.4685 shares of common stock per $1,000 principal (equivalent to an initial conversion price of approximately $44.5068 per share of its common stock). The interest rate is fixed at 0.375% per annum for the 2023 Notes and is payable semi-annually in arrears on July 15 and January 15 of each year, which commenced on July 15, 2018. The accounting for 2023 Notes was substantially consistent with the accounting for 2026 Notes as disclosed above. Refer to the Company’s consolidated financial statements for the year ended January 31, 2019 for details of the issuance of 2023 Notes.
The conversion condition for the 2023 Notes was initially met during the three months ended April 30, 2019, and has been met for each subsequent fiscal quarter. As a result, the 2023 Notes were convertible at the option of the holders and remained classified as current liabilities on the consolidated balance sheet as of January 31, 2021. For the year ended January 31, 2021, the Company settled conversion requests on the principal amount of the 2023 Notes totaling approximately $132.1 million by paying cash for the principal amount of $132.1 million and issuing approximately 2.2 million shares of the Company’s common stock, bearing a fair value of approximately $410.0 million. In addition, during the year ended January 31, 2021, using proceeds from the 2026 Notes issuance, the Company repurchased approximately $89.0 million principal amount of the 2023 Notes by paying cash of approximately $450.6 million. For the year ended January 31, 2021, the Company recognized a gain of approximately $3.2 million on the conversion and repurchase of the 2023 Notes representing the net carrying amount in excess of the fair value of the liability component of the converted and repurchased notes on the respective settlement dates. The amount is included in interest income and other, net in the Company’s consolidated statement of operations.
As of January 31, 2021, approximately $8.8 million principal amount of 2023 Notes remained outstanding, out of which approximately $3.0 million principal amount was requested for conversion. In relation to the $3.0 million principal amount of requested conversion, the Company reclassified a portion of the equity of approximately $369,000, representing the difference between the principal and net carrying amount of the notes requested for conversion, into temporary equity, as these requests will be settled during the subsequent quarter. In addition, from February 1, 2021 to the date of this filing, the Company has not received additional conversion requests for the 2023 Notes.
The 2026 Notes, 2025 Notes and 2023 Notes consisted of the following (in thousands):
| | | | | | | | | | | | | | | | | | | | | | | | | | | | | |
| As of January 31, 2021 | | As of January 31, 2020 |
| 2026 Notes | | 2025 Notes | | 2023 Notes | | 2025 Notes | | 2023 Notes |
| Liability: | | | | | | | | | |
| Principal | $ | 1,380,000 | | | $ | 804,999 | | | $ | 8,832 | | | $ | 805,000 | | | $ | 230,000 | |
Unamortized debt discount and issuance costs (1) | (482,475) | | | (203,638) | | | (1,125) | | | (242,388) | | | (42,885) | |
| Net carrying amount | $ | 897,525 | | | $ | 601,361 | | | $ | 7,707 | | | $ | 562,612 | | | $ | 187,115 | |
Carrying amount of the equity component (2) | $ | 501,053 | | | $ | 246,966 | | | $ | 1,560 | | | $ | 246,967 | | | $ | 60,470 | |
(1)Included in the consolidated balance sheets within Convertible senior notes, net and amortized over the remaining lives of the convertible senior notes. The 2026 Notes are classified as long-term liabilities, and the 2025 Notes and 2023 Notes are classified as current liabilities.
(2)Included in the consolidated balance sheets within additional paid-in capital and temporary equity.
The effective interest rates of the liability component of the 2026 Notes, 2025 Notes and 2023 Notes, excluding each tranche of notes’ conversions options, is 8.83%, 7.05% and 7.66%, respectively. As of January 31, 2021, the if-converted value of the 2026 Notes exceeded the principal amount of by $62.5 million. As of January 31, 2021 and January 31, 2020, the if-converted value of the 2025 Notes exceeded the principal amount by $757.9 million and $7.8 million, respectively. As of January 31, 2021 and January 31, 2020, the if-converted value of the 2023 Notes exceeded the principal amount by $52.7 million and $602.8 million, respectively.
During the years ended January 31, 2021, 2020 and 2019, the Company recognized $86.5 million, $35.9 million and $11.6 million, respectively, of interest expense related to the amortization of debt discount and issuance costs, and $3.8 million, $1.5 million, and $900,000 respectively, of coupon interest expense.
As of January 31, 2021, the remaining life of the 2026 Notes, 2025 Notes and 2023 Notes is approximately 5.4 years, 4.4 years and 2.0 years, respectively.
Capped Calls
In conjunction with the issuance of the 2026 Notes, 2025 Notes and 2023 Notes, the Company entered into capped call transactions (the “Capped Calls”) on the Company’s stock with certain counterparties at a price of $192.8 million, $118.7 million and $23.3 million, respectively.
The Capped Calls exercise price is equal to the initial conversion price of each of the Convertible Notes, and the cap price is $503.42 per share for 2026 Notes, $295.55 per share for 2025 Notes and $63.821 per share for 2023 Notes, each subject to certain adjustments under the terms of the Capped Call transactions. If any tranche of convertible notes’ conversion option is exercised, the corresponding convertible note capped call will become exercisable on the same date. As of the date of filing, the Company has not exercised the Capped Calls in relation to the conversion of 2023 Notes or 2025 Notes.
By entering into the Capped Calls, the Company expects to reduce the potential dilution to its common stock (or, in the event the conversion is settled in cash, to reduce its cash payment obligation) in the event that at the time of conversion its stock price exceeds the conversion price.
The cost of the Capped Calls is not expected to be tax-deductible as the Company did not elect to integrate the Capped Calls into the respective convertible notes for tax purposes. The cost of the Capped Calls was recorded as a reduction of the Company’s additional paid-in capital in the accompanying consolidated financial statements.
Note 10. Commitments and Contingencies
Commitments
The Company leases office space under non-cancelable operating leases with various expiration dates through February 2030. For the years ended January 31, 2021 and January 31, 2020, lease costs in relation to long-term leases were approximately $11.5 million and $8.6 million, respectively. For the years ended January 31, 2021 and January 31, 2020, short-term leases costs were approximately $1.6 million and $1.6 million, respectively. Variable lease costs were immaterial for the years ended January 31, 2021 and January 31, 2020. Total lease expenses recognized prior to the adoption of ASC 842 was $7.4 million for the year ended January 31, 2019. Certain lease agreements include options to renew or terminate the lease, which are not reasonably certain to be exercised and therefore are not factored into the determination of lease payments or the lease right-of-use asset/lease liability.
For the years ended January 31, 2021 and January 31, 2020, cash paid for operating lease liabilities was approximately $11.9 million and $8.6 million, respectively, and right-of-use assets obtained in exchange of lease obligations was approximately $18.3 million and $11.2 million, respectively. As of January 31, 2021, the weighted-average remaining lease term was 4.0 years, and the weighted-average discount rate was 6.3%.
Additionally, the Company has contractual purchase obligations for hosting services and other services to support the Company's business operations. As of January 31, 2021, the remaining maturities of operating lease liabilities and future purchase obligations are as follows (in thousands):
| | | | | | | | | | | |
Year Ending January 31, | Operating Lease Obligations | | Future Purchase Obligations |
| 2022 | $ | 13,520 | | | $ | 15,669 | |
| 2023 | 12,379 | | | 18,580 | |
| 2024 | 11,348 | | | 4,888 | |
| 2025 | 6,117 | | | 600 | |
| 2026 | 3,008 | | | 550 | |
| Thereafter | 2,305 | | | — |
| Total payments | 48,677 | | | $ | 40,287 | |
| Less: imputed interest | (5,610) | | | |
| Total | $ | 43,067 | | | |
Contingencies
The Company may become involved in legal proceedings or be subject to claims arising in the ordinary course of business. Although the results of litigation and claims cannot be predicted with certainty, the Company currently believes that the final outcome of these ordinary course matters will not have a material adverse effect on the Company’s business, operating results, financial condition or cash flows. The Company accrues estimates for resolution of legal and other contingencies when losses are probable and estimable. Regardless of the outcome, litigation can have an adverse impact on the Company because of defense and settlement costs, diversion of management resources and other factors.
Warranties and Indemnifications
The Company’s cloud-based software platform and applications are typically warranted against material decreases in functionality and to perform in a manner consistent with general industry standards and in accordance with the Company’s online documentation under normal use and circumstances.
The Company includes service level commitments to its customers, typically regarding certain levels of uptime reliability and performance and if the Company fails to meet those levels, customers can receive credits and, in some cases, terminate their relationship with the Company. To date, the Company has not incurred any material costs as a result of such commitments.
The Company generally agrees to defend and indemnify its customers against legal claims that the Company’s platform infringes patents, copyrights or other intellectual property rights of third parties. To date, the Company has not been required to make any payment resulting from such infringement claims and has not recorded any related liabilities. In addition, the Company has indemnification agreements with its directors and certain of its officers that require the Company to indemnify them against certain liabilities that may arise by reason of their status or service as directors or officers. To date, the Company has not incurred any material costs, and not accrued any liabilities in its consolidated financial statements, as a result of these obligations.
Note 11. Common Stock and Stockholders’ Equity
Common Stock
Each share of common stock has the right to one vote. The holders of the common stock are also entitled to receive dividends whenever funds are legally available and when declared by the board of directors of the Company (the “Board of Directors”), subject to the prior rights of holders of all classes of stock outstanding having priority rights as to dividends. No dividends have been declared or paid since inception.
Preferred Stock
As of January 31, 2021, the Company had authorized 25,000,000 shares of preferred stock, par value $0.0001, of which no shares were issued and outstanding.
2016 Equity Incentive Plan
The 2016 Equity Incentive Plan (the “2016 Plan”) was approved by the Company’s stockholders in September 2016. The 2016 Plan provides for the grant of incentive stock options, nonstatutory stock options, restricted stock, restricted stock units, stock appreciation rights and performance cash awards. Awards could be granted under the 2016 Plan beginning on the effective date of the registration statement relating to the Company’s initial public offering, October 5, 2016. The 2016 Plan replaced the Company’s 2006 Stock Plan; however, awards outstanding under the 2006 Stock Plan will continue to be governed by their existing terms.
As of January 31, 2021, the Company had 9,874,723 shares of its common stock available for future issuance under the 2016 Plan. The number of shares reserved for issuance under the 2016 Plan will automatically increase on the first day of each fiscal year during the term of the 2016 Plan by a number of shares equal to 5% of its outstanding shares of common stock on the last day of the prior fiscal year. The number and class of shares reserved under the Company’s 2016 Plan will be adjusted in the event of a stock split, stock dividend or other changes in its capitalization.
The following table summarizes stock option activity under the Company’s 2006 Stock Plan and the 2016 Plan during the year ended January 31, 2021 (aggregate intrinsic value in thousands):
| | | | | | | | | | | | | | | | | | | | | | | |
| Options Outstanding |
| Outstanding Stock Options | | Weighted- Average Exercise Price | | Weighted-Average Remaining Contractual Life (in years) | | Aggregate Intrinsic Value |
| Balance, January 31, 2020 | 4,233,435 | | | $ | 17.28 | | | 6.36 | | $ | 609,061 | |
| Option grants | — | | | $ | — | | | — | | | — | |
| Options exercised | (1,615,784) | | | $ | 11.91 | | | — | | | — | |
| Options forfeited | (9,011) | | | $ | 5.66 | | | — | | | — | |
| Balance, January 31, 2021 | 2,608,640 | | | $ | 20.65 | | | 5.61 | | $ | 754,478 | |
| Exercisable at January 31, 2021 | 2,348,569 | | | $ | 16.40 | | | 5.42 | | $ | 689,231 | |
(1)The above table includes 878,869 stock options with market and service based conditions.
The options exercisable as of January 31, 2021 include options that are exercisable prior to vesting. The aggregate intrinsic value of options vested and exercisable as of January 31, 2021 is calculated based on the difference between the exercise price and the fair value of the Company’s common stock as of January 31, 2021. The aggregate intrinsic value of exercised options was $375.7 million, $318.2 million and $157.6 million for the years ended January 31, 2021, 2020 and 2019, respectively, and is calculated based on the difference between the exercise price and the fair value of the Company’s common stock as of the exercise date.
No options were granted during the year ended January 31, 2021. The weighted-average grant date fair value of options granted for the years ended January 31, 2020 and 2019 was $41.81 and $15.93 per share, respectively. The total grant date fair value of options vested during fiscal 2021, 2020 and 2019 was $8.0 million, $8.6 million and $9.0 million, respectively.
Restricted Stock Units (“RSUs”)
The following table summarizes the activity related to the Company’s RSUs during the year ended January 31, 2021:
| | | | | | | | | | | |
| Number of RSUs Outstanding | | Weighted- Average Grant Date Fair Value |
| Awarded and unvested at January 31, 2020 | 2,830,782 | | | $ | 70.90 | |
| Awards granted | 1,251,959 | | | $ | 180.84 | |
| Awards vested | (1,348,975) | | | $ | 68.44 | |
| Awards forfeited | (203,486) | | | $ | 108.71 | |
| Awarded and unvested at January 31, 2021 | 2,530,280 | | | $ | 123.56 | |
(1)The above table includes 100,178 restricted share units with market and service based conditions.
2016 Employee Stock Purchase Plan
The Board of Directors adopted the 2016 Employee Stock Purchase Plan (the “ESPP”) in September 2016 and it has been approved by the Company’s stockholders. The ESPP allows eligible employees to purchase shares of common stock through payroll deductions and is intended to qualify under Section 423 of the Internal Revenue Code.
As of January 31, 2021, the Company had 1,755,814 shares of its common stock available for future issuances under the ESPP. The number of shares reserved for issuance under the ESPP will automatically increase on the first day of each fiscal year during the term of the ESPP by a number of shares equal to the least of (i) 1% of its outstanding shares of common stock on the last day of the prior fiscal year, (ii) 1,250,000 shares or (iii) a lesser number of shares determined by the board of directors. The number and class of shares reserved under the ESPP will be adjusted in the event of a stock split, stock dividend or other changes in its capitalization.
Each offering period will last a number of months determined by the administrator, up to a maximum of 27 months. The initial offering period began on the effective date of the Company’s initial public offering, October 5, 2016, and ended on September 15, 2018, and new 24 months offering period begins on each March 16 or September 16 thereafter. Currently, each offering period consists of four consecutive purchase periods, of approximately six months duration, at the end of which payroll contributions are used to purchase shares of the Company’s common stock. Participants may purchase Company’s common stock through payroll deductions, up to a maximum of 15% of their eligible compensation. Participants may withdraw from the ESPP and receive a refund of their accumulated payroll contributions at any time prior to a purchase date. Unless changed by the administrator, the purchase price for each share of common stock purchased under the ESPP will be 85% of the lower of the fair market value per share on the first day of the applicable offering period or the fair market value per share on the applicable purchase date.
The Company purchased 209,306 and 215,472 shares of common stock under the 2016 ESPP during the years ended January 31, 2021 and 2020, respectively. The Company selected the Black-Scholes option-pricing model as the method for determining the estimated fair value for the Company’s 2016 ESPP. As of January 31, 2021, total unrecognized compensation cost related to 2016 ESPP was $12.7 million which will be amortized over a weighted-average period of approximately 1.4 years.
Market-based Options and Awards
In September 2016, the Board of Directors of the Company granted 544,127 stock options to the Chief Executive Officer (the “2016 CEO Grant”) under the 2006 Stock Plan with an exercise price of $13.04 per share. The 2016 CEO Grant is eligible to vest based on the achievement of market capital appreciation targets after the consummation of the initial public offering, as well as continuous service over a four-year period following the grant date. In March 2018, the Board of Directors granted 334,742 stock options to the Chief Executive Officer (the “2018 CEO Grant”) under the 2016 Equity Plan with an exercise price of $48.47 per share. The 2018 CEO Grant is eligible to vest based on the achievement of a stock price appreciation target as well as continuous service over a four-year period following the grant date. The fair value of the 2016 and 2018 CEO Grants were determined using a Monte Carlo simulation approach. The Company amortizes the fair value of the option awards using the graded-vesting method.
In March 2020, the Board of Directors of the Company granted market-based restricted stock unit awards (the “2020 PSU Grant”) to certain members of management. The target number of market-based restricted stock unit awards granted was 100,178. The number of shares that could be earned will range from 0% to 200% of the target number of shares, based on the relative growth of the per share price of the Company’s common stock as compared to the NASDAQ Composite Index over the three-year performance period ending on the third anniversary of the date of grant and subject to continuous employment through such date. The fair value of the 2020 PSU Grant was determined using a Monte Carlo simulation approach. The Company amortizes the fair value of the 2020 PSU Grant using the straight-line method over the three-year performance term.
As of January 31, 2021, all market-based milestones of the 2016 CEO Grant and 2018 CEO Grant were achieved, resulting in 544,127 shares and 237,108 shares, respectively, being vested and exercisable. As of January 31, 2021, the three-year performance period related to 2020 PSU Grant had not been completed, resulting in no shares being vested and exercisable. Stock-based compensation expense recognized for market-based awards was approximately $6.6 million, $1.7 million and $2.2 million for the years ended January 31, 2021, 2020 and 2019, respectively.
Stock-based Compensation
The Company’s total stock-based compensation expense was as follows (in thousands):
| | | | | | | | | | | | | | | | | |
| For the year ended
January 31, |
| 2021 | | 2020 | | 2019 |
| Cost of revenue: | | | | | |
| Subscription | $ | 11,438 | | | $ | 6,982 | | | $ | 4,285 | |
| Professional services and other | 15,563 | | | 7,773 | | | 4,269 | |
| Research and development | 37,685 | | | 20,159 | | | 11,841 | |
| Sales and marketing | 48,414 | | | 23,352 | | | 14,786 | |
| General and administrative | 55,750 | | | 23,110 | | | 17,765 | |
| Total | $ | 168,850 | | | $ | 81,376 | | | $ | 52,946 | |
Out of the total stock-based compensation expense for the year ended January 31, 2021, approximately $27.8 million was a one-time post acquisition stock-based compensation expense resulting from the accelerated vesting of legacy employee stock awards in conjunction with the acquisition of LLamasoft.
Stock-based compensation included in capitalized software development costs was approximately $3.2 million and $2.1 million at January 31, 2021 and 2020, respectively.
Of the total stock-based compensation expense, costs recognized for options granted to non-employees were immaterial for all periods presented.
As of January 31, 2021, 2020 and 2019, there was approximately $4.5 million, $11.5 million and $16.1 million, respectively, of total unrecognized compensation cost related to unvested stock options granted to employees and non-employee service providers under the 2006 Stock Plan and 2016 Equity Incentive Plan. This unrecognized compensation cost as of January 31, 2021, is expected to be recognized over an estimated weighted-average amortization period of approximately 1.6 years.
As of January 31, 2021, 2020 and 2019, there was approximately $319.6 million, $186.3 million and $110.8 million, respectively, of total unrecognized compensation cost related to unvested restricted stock units granted to employees under the 2016 Equity Incentive Plan. This unrecognized compensation cost as of January 31, 2021 is expected to be recognized over an estimated weighted-average amortization period of approximately 2.7 years.
The fair values of the Company’s stock options, ESPP and market-based awards granted during the years ended January 31, 2021, 2020 and 2019 were estimated using the following assumptions:
| | | | | | | | | | | | | | | | | | | | | | | | | | | | | | | | | | | |
| For the year ended
January 31, |
| 2021 | | 2020 | | 2019 |
| Employee Stock Options: | | | | | | | | | | | |
| Expected term (in years) | — | | 6.0 | | 6.0 |
| Volatility | — | | 42.7% | | 42.2% |
| Risk-free interest rate | — | | 2.4% | | 2.8% |
| Dividend yield | — | | — | | — |
| Employee Stock Purchase Plan: | | | | | | | | | | | |
| Expected term (in years) | 0.5 | - | 2.0 | | 0.5 | - | 2.0 | | 0.5 | - | 2.0 |
| Volatility | 48.6 | % | - | 60.7 % | | 44.4 | % | - | 65.9 % | | 31.1 | % | - | 34.1 % |
| Risk-free interest rate | 0.1 | % | - | 0.4 % | | 1.7 | % | - | 2.5 % | | 2.0 | % | - | 2.8 % |
| Dividend yield | — | | — | | — |
| Market-Based Awards: | | | | | | | | | | | |
| Expected term (in years) | 3.0 | | — | | 7.1 |
| Volatility | 48.4% | | — | | 43.7% |
| Risk-free interest rate | 40.0% | | — | | 2.8% |
| Dividend yield | — | | — | | — |
These assumptions and estimates are as follows:
•Fair Value of Common Stock. The Company used the publicly quoted price as reported on the Nasdaq Global Select Market as the fair value of its common stock.
•Expected Term. The expected term represents the weighted-average period that the stock options are expected to remain outstanding. To determine the expected term for employee stock options, the Company generally applies the simplified approach in which the expected term of an award is presumed to be the mid-point between the vesting date and the expiration date of the award as the Company does not have sufficient historical exercise data to provide a reasonable basis for an estimate of expected term. The expected term for the employee stock purchase plan ranges from six months, the length of one purchase period, to two years, the length of one offering period. The market-based awards have a three-year expected term.
•Risk-Free Interest Rate. The Company bases the risk-free interest rate on the yields of U.S. Treasury securities with maturities approximately equal to the term of employee stock option or market-based awards.
•Expected Volatility. Prior to the first quarter of fiscal year 2020, the Company used the historic volatility of publicly traded peer companies as an estimate for expected volatility to determine the fair value of stock options and the shares granted under the ESPP. In considering peer companies, characteristics such as industry, stage of development, size and financial leverage were considered. Beginning from the first quarter of fiscal year 2020, the Company began to use its own sufficient historical trading prices to calculate the expected volatility in determining the fair value of the shares granted under the ESPP. In addition, beginning from the first quarter of fiscal year 2020, the Company began using its own historical volatility in combination with publicly traded peers’ volatility to determine the expected volatility of stock options.
Note 12. Income Taxes
The following table presents the domestic and foreign components of loss before benefit from income taxes for the periods presented (in thousands):
| | | | | | | | | | | | | | | | | |
| For the year ended
January 31, |
| 2021 | | 2020 | | 2019 |
| United States | $ | (243,435) | | | $ | (106,743) | | | $ | (59,070) | |
| Foreign | (1,068) | | | 4,976 | | | 3,009 | |
| Loss before benefit from income taxes | $ | (244,503) | | | $ | (101,767) | | | $ | (56,061) | |
The benefit from income taxes is composed of the following (in thousands):
| | | | | | | | | | | | | | | | | |
| For the year ended
January 31, |
| 2021 | | 2020 | | 2019 |
| Current income taxes: | | | | | |
| Federal | $ | — | | | $ | — | | | $ | — | |
| State | 216 | | | 126 | | | 151 | |
| Foreign | 2,891 | | | 2,246 | | | 3,514 | |
| Total current income taxes | 3,107 | | | 2,372 | | | 3,665 | |
| Deferred income taxes: | | | | | |
| Federal | (52,715) | | | (10,125) | | | (2,701) | |
| State | (7,991) | | | (1,510) | | | (365) | |
| Foreign | (6,787) | | | (1,672) | | | (1,136) | |
| Total deferred income taxes | (67,493) | | | (13,307) | | | (4,202) | |
| Total benefit from income taxes | $ | (64,386) | | | $ | (10,935) | | | $ | (537) | |
The effective tax rate differs from the federal statutory rate as follows:
| | | | | | | | | | | | | | | | | |
| For the year ended
January 31, |
| 2021 | | 2020 | | 2019 |
| Federal statutory income tax rate | 21.0 | % | | 21.0 | % | | 21.0 | % |
| | | | | |
| State tax, net of federal benefit | 3.4 | | | 3.2 | | | 2.9 | |
| Change in valuation allowance | (48.9) | | | (107.1) | | | (98.1) | |
| Stock-based compensation | 45.2 | | | 90.3 | | | 71.6 | |
| Other non-deductible items | (0.1) | | | 0.8 | | | (2.1) | |
| Foreign rate differential | 1.9 | | | (1.4) | | | (2.9) | |
| Tax credits | 3.8 | | | 3.9 | | | 8.6 | |
| Total | 26.3 | % | | 10.7 | % | | 1.0 | % |
The difference between the U.S. federal statutory tax rate of 21% and the Company’s effective tax rate in all periods presented is primarily due to a full valuation allowance related to the Company’s U.S. deferred tax assets offset by foreign tax expense on the Company’s profitable foreign operations. The Company recognized a significant release in the U.S. valuation allowance related to acquisitions closed during fiscal 2021.
Deferred income taxes reflect the net tax effects of temporary differences between the carrying amounts of assets and liabilities for financial reporting purposes and the amounts used for income tax purposes. The following table presents the significant components of the Company’s deferred tax assets and liabilities for the periods presented (in thousands):
| | | | | | | | | | | |
| As of January 31, |
| 2021 | | 2020 |
| Deferred tax assets: | | | |
| Net operating loss carryforwards | $ | 412,850 | | | $ | 224,372 | |
| Accruals and reserves | 9,209 | | | 4,767 | |
| Lease liabilities | 11,217 | | | 7,875 | |
| Stock-based compensation | 8,994 | | | 7,382 | |
| Tax credits | 23,116 | | | 12,174 | |
| Gross deferred tax assets | 465,386 | | | 256,570 | |
| Valuation allowance | (177,918) | | | (160,510) | |
Total deferred tax assets, net of valuation allowance | 287,468 | | | 96,060 | |
| Deferred tax liabilities: | | | |
| Fixed assets and intangibles assets | (146,441) | | | (22,564) | |
| Accruals and reserves | (1,874) | | | (1,527) | |
| Right-of-use assets | (10,743) | | | (7,495) | |
| Discount on convertible notes | (158,438) | | | (63,788) | |
| Gross deferred tax liabilities | (317,496) | | | (95,374) | |
| Net deferred tax (liabilities) assets | $ | (30,028) | | | $ | 686 | |
A valuation allowance is provided for deferred tax assets where the recoverability of the assets is uncertain. The determination to provide a valuation allowance is dependent upon the assessment of whether it is more likely than not that sufficient future taxable income will be generated to utilize the deferred tax assets. Based on the weight of the available evidence, which includes the Company’s historical operating losses, and lack of taxable income, the Company provided a full valuation allowance against the deferred tax assets for the U.S. and some of the international entities. The valuation allowance increased by $17.4 million, $47.0 million and $55.5 million during the years ended January 31, 2021, 2020 and 2019, respectively.
As of January 31, 2021, the Company had net operating loss carryforwards of approximately $1.7 billion and $806.7 million available to reduce future taxable income, if any, for federal and state income tax purposes, respectively. The U.S. federal and California state net operating loss carryforwards will begin to expire in 2026 and 2029, respectively. As of January 31, 2021, the Company had research and development credit carryforwards of approximately $18.8 million and $13.1 million available to reduce its future tax liability, if any, for federal and California state income tax purposes, respectively. The federal credit carryforwards begin to expire in 2031. California credit carryforwards have no expiration date. As of January 31, 2021, the Company has U.S. federal foreign tax credits carryforwards of approximately $700,000 that will begin to expire in 2025. As of January 31, 2021, the Company had foreign net operating loss carryforwards of $44.1 million, the majority of which may be carried forward indefinitely.
Federal and state laws impose restrictions on the utilization of net operating loss carryforwards and R&D credit carryforwards in the event of a change in ownership of the Company, which constitutes an ‘ownership change’ as defined by Internal Revenue Code Section 382 and 383. The Company experienced an ownership change in the past that does not materially impact the availability of its net operating losses and tax credits. Should there be ownership change in the future, the Company’s ability to utilize existing carryforwards could be substantially restricted.
As of January 31, 2021, the Company did not have unremitted earnings when evaluating the outside basis difference relating to its U.S. investment in foreign subsidiaries. However, there could be local withholding taxes payable due to various foreign countries if certain lower tier earnings are distributed. Withholding taxes and state income that would be payable upon remittance of these lower tier earnings were not material as of January 31, 2021.
The Company accounts for uncertainty in income taxes in accordance with ASC 740. Tax positions are evaluated in a two-step process, whereby the Company first determines whether it is more likely than not that a tax position will be sustained upon examination by tax authorities, including resolutions of any related appeals or litigation processes, based on technical merit. If a tax position meets the more-likely-than-not recognition threshold it is then measured to determine the amount of benefit to recognized in the financial statements. The tax position is measured as the largest amount of benefit that is greater than 50% likely of being realized upon ultimate settlement.
The following table summarizes the activity related to unrecognized tax benefits (in thousands):
| | | | | | | | | | | | | | | | | |
| For the year ended
January 31, |
| 2021 | | 2020 | | 2019 |
| Unrecognized tax benefit — beginning of year | $ | 14,864 | | | $ | 20,077 | | | $ | 12,663 | |
| Gross increases — prior year tax positions | 52 | | | 620 | | | 295 | |
| Gross decreases — prior year tax positions | (160) | | | (11,538) | | | (8) | |
| Gross increases — acquisitions | 3,282 | | | 4,174 | | | — | |
| Gross increases — current year tax positions | 2,586 | | | 1,531 | | | 7,127 | |
| Settlements | (32) | | | — | | | — | |
| Unrecognized tax benefit — end of year | $ | 20,592 | | | $ | 14,864 | | | $ | 20,077 | |
As of January 31, 2021, 2020 and 2019, $10.2 million, $6.4 million, and $14.9 million of the unrecognized tax benefits were accounted for as a reduction in the Company’s deferred tax assets. Due to the Company’s valuation allowance, only $10.4 million of the $20.6 million of unrecognized tax benefits would affect the Company’s effective tax rate, if recognized. The Company does not believe it is reasonably possible that its unrecognized tax benefits will significantly change in the next twelve months.
The Company recognizes interest and penalties related to unrecognized tax benefits as income tax expense. There was $1.4 million of accrued interest and penalties related to unrecognized tax benefits as of January 31, 2021, and an immaterial amount as of January 31, 2020.
The Company’s material income tax jurisdictions are the United States (federal) and California. As a result of net operating loss carryforwards, the Company is subject to audits for tax years 2006 and forward for federal purposes and 2009 and forward for California purposes. There are tax years which remain subject to examination in various other jurisdictions that are not material to the Company’s financial statements.
On March 27, 2020, the President signed into law the Coronavirus Aid, Relief, and Economic Security Act (the “CARES” Act). The CARES Act provides numerous tax provisions and other stimulus measures, including temporary changes regarding the prior and future utilization of net operating losses, temporary changes to the prior and future limitations on interest deductions, temporary suspension of certain payment requirements for the employer portion of Social Security taxes, technical corrections from prior tax legislation for tax depreciation of certain qualified improvement property, and the creation of certain refundable employee retention credits. The Company does not expect there to be a significant tax impact on its consolidated financial statements at this time, and will continue to assess the implications of the CARES Act and its continuing developments and interpretations.
Note 13. Net Loss per Share
Basic net loss per share is calculated by dividing the net loss by the weighted-average number of shares of common stock outstanding during the period, without consideration for potentially dilutive securities as they do not share in losses. During periods when the Company is in a net loss position, basic net loss per share is the same as diluted net loss per share as the effects of potentially dilutive securities are antidilutive given the net loss of the Company.
The following table sets forth the computation of the basic and diluted net loss per share during the years ended January 31, 2021, 2020 and 2019 (in thousands, except per share amounts):
| | | | | | | | | | | | | | | | | |
| January 31, |
| 2021 | | 2020 | | 2019 |
Numerator: | | | | | |
| Net loss | $ | (180,117) | | | $ | (90,832) | | | $ | (55,524) | |
Denominator: | | | | | |
| Weighted-average common shares outstanding | 68,559 | | | 62,484 | | | 57,716 | |
| Net loss per share, basic and diluted | $ | (2.63) | | | $ | (1.45) | | | $ | (0.96) | |
Since the Company was in a loss position for all periods presented, basic net loss per share is the same as diluted net loss per share for all periods as the inclusion of all potential common shares outstanding would have been anti-dilutive. Potentially dilutive securities that were not included in the diluted per share calculations because they would be anti-dilutive were as follows:
| | | | | | | | | | | | | | | | | |
| As of January 31, |
| 2021 | | 2020 | | 2019 |
| Options to purchase common stock | 2,608,640 | | 4,233,435 | | 6,850,928 |
| RSUs | 2,530,280 | | 2,830,782 | | 2,792,117 |
| Unvested common shares subject to repurchase | 243,775 | | 66,450 | | 193,894 |
| Shares committed under the ESPP | 64,456 | | 80,775 | | 189,168 |
| Contingent stock consideration for DCR acquisition | 377,138 | | 377,138 | | 377,138 |
| Holdback shares for Aquiire acquisition | — | | 37,570 | | 37,570 |
| Total | 5,824,289 | | 7,626,150 | | 10,440,815 |
Additionally, approximately 4.7 million, 5.0 million and 0.2 million shares underlying the conversion option in the 2026 Notes, 2025 Notes and 2023 Notes, respectively, are not considered in the calculation of diluted net loss per share as the effect would be anti-dilutive. These numbers of shares are subject to adjustment up to approximately 6.2 million, 6.8 million and 0.3 million shares for the 2026 Notes, 2025 Notes and 2023 Notes, respectively, if certain corporate events occur prior to the maturity date or if the Company issues a notice of redemption. The Company uses the treasury stock method for calculating any potential dilutive effect of the conversion option on diluted net income per share, if applicable. During the year ended January 31, 2021, the average market price of the Company’s common stock exceeded the conversion price of the 2023 Notes and 2025 Notes of $44.51 per share and $159.60 per share, respectively, and did not exceed the conversion price of the 2026 Notes of $296.45 per share.
Note 14. Business Segment Information
The Company’s chief operating decision maker is the Chief Executive Officer (“CEO”). The CEO reviews the financial information presented on a consolidated basis for purposes of allocating resources and evaluating the Company’s financial performance. Accordingly, the Company has determined that it operates in a single reporting segment: cloud platform.
Note 15. Employee Benefit Plan
The Company maintained a qualified defined contribution plan under Section 401(k) of the Internal Revenue Code. Under the 401(k) Plan, participating employees may elect to contribute up to 90% of their eligible compensation, subject to certain limitations. The Company matches certain percentages of employee contributions. Both employee and employer contributions vest immediately upon contribution. During the years ended January 31, 2021, 2020 and 2019, the Company’s contributions to the 401(k) Plan amounted to approximately $3.9 million, $2.9 million and $2.0 million, respectively.
The Company also maintains a limited number of defined benefit plans for certain non-U.S. locations. Total costs under these plans were not significant.
Note 16. Related Parties
Morgan Stanley, together with its affiliates, held more than 10% of the Company’s voting common stock during the year ended January 31, 2021. Morgan Stanley was a counterparty to certain capped call transactions with the Company, was an initial purchaser in the offering of the 2025 Notes and the 2023 Notes, and is also a customer of the Company. In June 2019 and January 2018, the Company paid approximately $29.7 million and $7.0 million to Morgan Stanley in connection with its purchase of capped calls relating to the 2025 Notes and 2023 Notes, respectively. Morgan Stanley also earned fees of $8.0 million and $2.8 million for acting as an initial purchaser of the 2025 Notes and 2023 Notes, respectively. As of and for the years ended January 31, 2021 and 2020, the Company’s revenue recognized and receivables balances from this customer were not material.
Note 17. Selected Quarterly Financial Data (unaudited)
The following tables set forth selected unaudited quarterly consolidated statements of operations data for each of the eight quarters in fiscal 2021 and 2020 (in thousands except per share data).
| | | | | | | | | | | | | | | | | | | | | | | | | | | | | | | | | | | | | | | | | | | | | | | |
| Three months ended |
| January 31, | | October 31, | | July 31, | | April 30, | | January 31, | | October 31, | | July 31, | | April 30, |
| 2021 | | 2020 | | 2020 | | 2020 | | 2020 | | 2019 | | 2019 | | 2019 |
| (in thousands) |
| Total revenues | $ | 163,544 | | | $ | 132,964 | | | $ | 125,921 | | | $ | 119,214 | | | $ | 111,452 | | | $ | 101,784 | | | $ | 95,139 | | | $ | 81,344 | |
| Gross profit | 83,907 | | | 82,177 | | | 77,482 | | | 76,376 | | | 71,349 | | | 64,490 | | | 60,649 | | | 54,015 | |
| Loss from operations | 95,357 | | | 33,647 | | | 31,923 | | | 5,626 | | | 15,869 | | | 16,945 | | | 22,804 | | | 17,807 | |
| Net loss | 61,387 | | | 60,798 | | | 43,116 | | | 14,816 | | | 24,053 | | | 26,317 | | | 19,994 | | | 20,468 | |
| Net loss per share, basic and diluted | $ | 0.85 | | | $ | 0.88 | | | $ | 0.64 | | | $ | 0.23 | | | $ | 0.38 | | | $ | 0.42 | | | $ | 0.32 | | | $ | 0.34 | |
Note 18. Subsequent Event
On February 1, 2021, the Company completed the acquisition of Pana Industries, Inc. ("Pana"), a corporate travel booking solution company that puts an emphasis on the traveler experience. In connection with the completion of the acquisition, the Company paid aggregate cash of approximately $48.5 million, and issued 23,822 shares of the Company's common stock. The cash amount is subject to adjustment for up to 90 days following the transaction closing date based on a comparison of Pana's actual working capital and other amounts at closing against pre-closing estimates.