Exhibit 99.1

| INVESTOR CONTACT: | Peter Goulding, CFA | |||||||
| Investor Relations | ||||||||
| 203.338.6799 | ||||||||
| peter.goulding@peoples.com | ||||||||
| MEDIA CONTACT: | Valerie Carlson | |||||||
| Corporate Communications | ||||||||
| 203.338.2351 | ||||||||
| valerie.carlson@peoples.com | ||||||||
FOR IMMEDIATE RELEASE
October 18, 2012
PEOPLE’S UNITED FINANCIAL REPORTS THIRD QUARTER OPERATING EARNINGS OF $0.19 PER SHARE; NET INCOME OF $0.18 PER SHARE
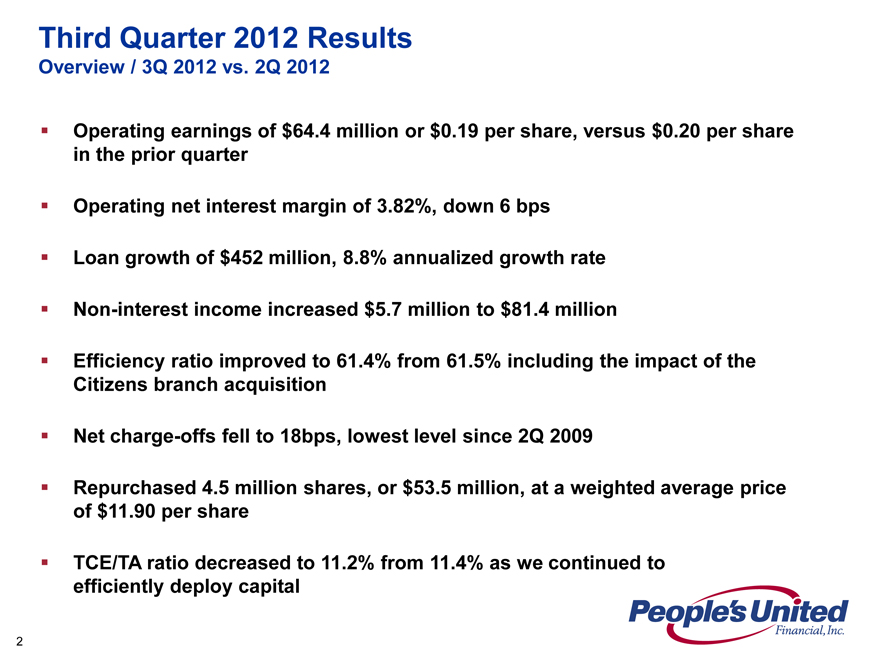
BRIDGEPORT, CT. – People’s United Financial, Inc. (NASDAQ: PBCT) today reported net income of $62.2 million, or $0.18 per share, for the third quarter of 2012, compared to $51.5 million, or $0.14 per share, for the third quarter of 2011, and $64.6 million, or $0.19 per share, for the second quarter of 2012. Operating earnings were $64.4 million, or $0.19 per share, for the third quarter of 2012, compared to $65.9 million, or $0.18 per share, for the third quarter of 2011 and $67.0 million, or $0.20 per share, for the second quarter of 2012.
The Company’s Board of Directors declared a $0.16 per share quarterly dividend, payable November 15, 2012 to shareholders of record on November 1, 2012. Based on the closing stock price on October 17, 2012, the dividend yield on People’s United Financial common stock is 5.3 percent.
During the third quarter of 2012 the Company repurchased 4.5 million shares of People’s United Financial common stock at a total cost of $54 million and, during the first nine months of 2012, the Company repurchased 13.5 million shares of common stock at a total cost of $164 million. Under the existing stock repurchase authorization, 4.5 million shares of common stock remain available for repurchase.
“Our performance in the third quarter of 2012 continues to build on the execution of our primary objectives – optimizing existing businesses and efficiently deploying capital,” stated Jack Barnes, President and Chief Executive Officer. “Our third quarter financial results reflect another quarter of solid operating metrics in a challenging economic environment, supported by significant loan growth, ongoing strength in our fee income businesses and meaningful cost control, all of which contributed to an improvement in our efficiency ratio.
— more —
People’s United Financial, Inc. Reports 3Q Earnings
Page 2
“We anticipate continued momentum in loan growth based on our retail and commercial lending pipelines and remain encouraged by the significant opportunity for growth throughout the franchise, particularly within the Boston and New York City MSAs,” added Barnes. “In addition, strategic revenue initiatives in commercial and retail banking, wealth management and insurance are positively impacting our operating results. Moreover, we are pleased with the continued progress in managing the overall level of operating expenses despite absorbing a full quarter of costs related to the 57 branches we acquired late in the second quarter.”
Barnes concluded, “Our strong business fundamentals, ongoing ability to leverage our brand in attractive markets, dedicated and customer-focused employees, and prospects for growth continue to be the foundations of our strength relative to others in the industry. We have demonstrated our ability to prudently and effectively deploy capital through organic loan and deposit growth, a consistent dividend policy, continued share repurchases and a thoughtful acquisition strategy.”
“On an operating basis, earnings were $64 million, or 19 cents per share, this quarter,” stated Kirk W. Walters, Senior Executive Vice President and Chief Financial Officer. “The Company’s performance in the third quarter reflects our continued focus on improving operating leverage by increasing fee-based income and ongoing expense control.”
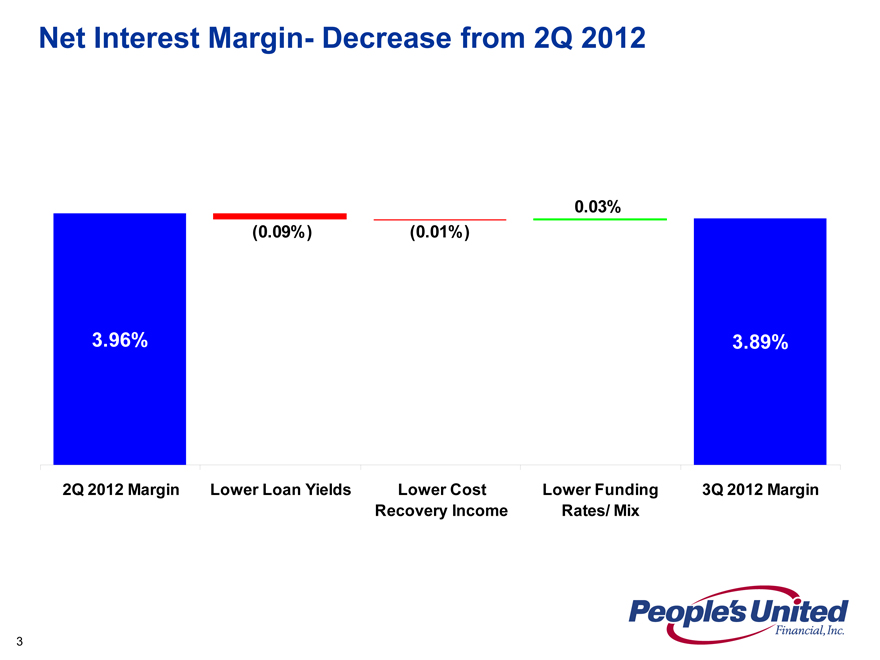
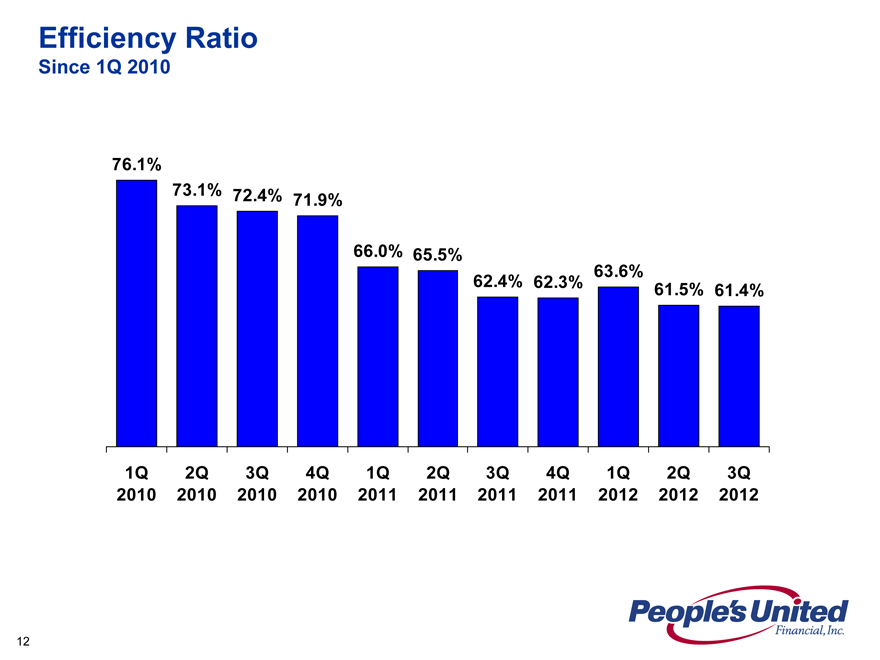
Walters continued, “The decline in the net interest margin this quarter on both a GAAP and operating basis reflects continued repricing pressure within the loan portfolios partially offset by a reduction in our cost of deposits. Non-interest income reflects ongoing improvement in most of our fee-based businesses, the seasonal increase in insurance revenue and higher loan prepayment fees. The efficiency ratio improved to 61.4 percent this quarter, as revenue growth and the progress we are making as a result of cost savings initiatives offset the increase in the level of operating non-interest expense this quarter attributable to our recent purchase of 57 branches.”
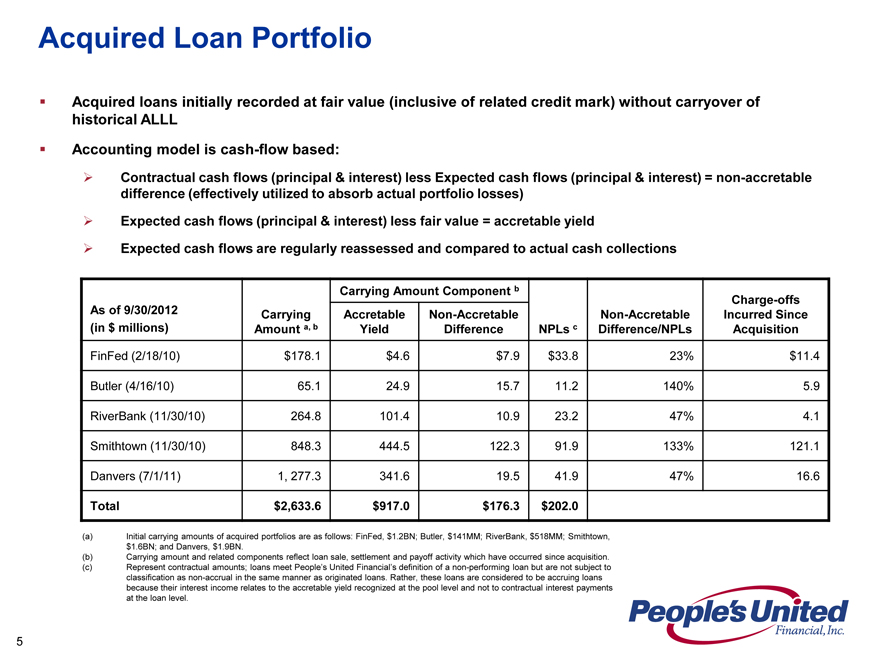
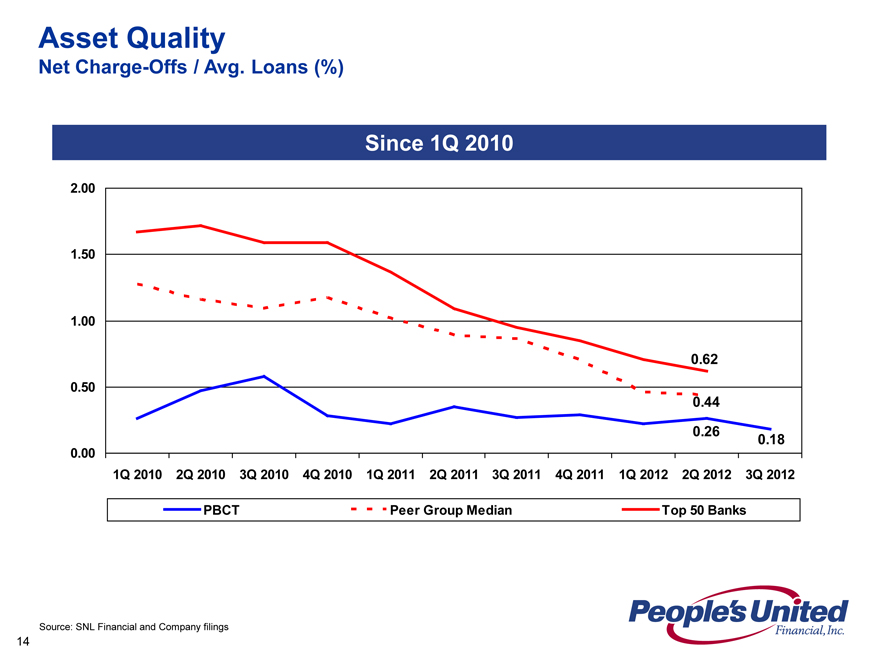
Walters concluded, “We certainly are pleased with the continued improvement in asset quality. Our loan charge-off ratio of 18 basis points this quarter, which represents less than one-half of our peers’, is the Company’s lowest in over three years. This is a reflection of the Company’s historically strong underwriting standards, the economic strength of the geography in which we operate and the resilience of our customers. Of note, non-performing loans in the acquired portfolio have declined $158 million, or 44 percent, since December 31, 2010.”
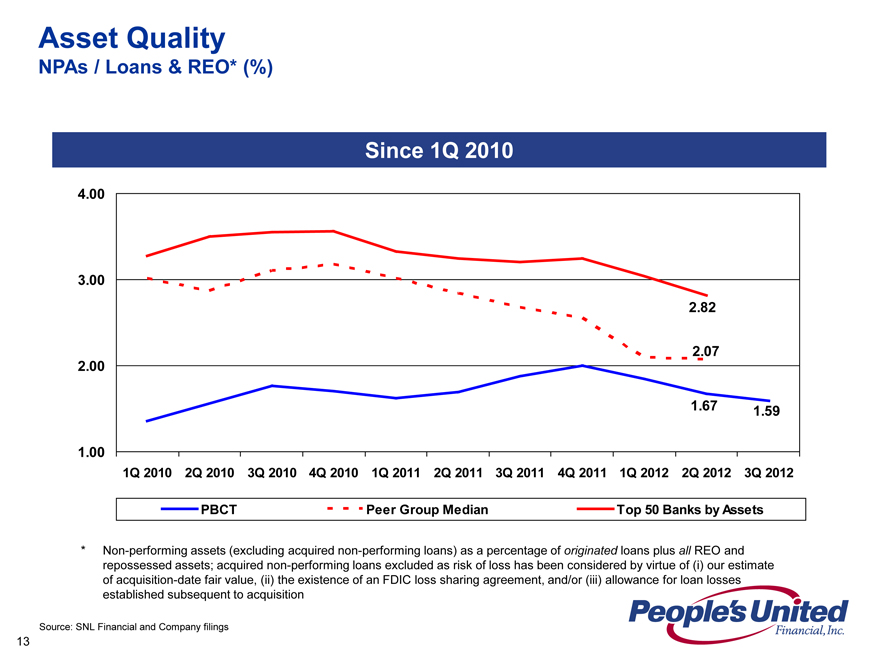
For the originated loan portfolio, non-performing loans equaled 1.45 percent of loans at September 30, 2012, compared to 1.52 percent at June 30, 2012 and 1.60 percent at September 30, 2011. Non-performing assets (excluding acquired non-performing loans) equaled 1.59 percent of originated loans, REO and repossessed assets at September 30, 2012, compared to 1.67 percent at June 30, 2012 and 1.88 percent at September 30, 2011. Net loan charge-offs as a percentage of average loans on an annualized basis were 0.18 percent in the third quarter of 2012 compared to 0.26 percent in this year’s second quarter.
— more —
People’s United Financial, Inc. Reports 3Q Earnings
Page 3
Non-performing loans in the acquired portfolio, which represent the contractual balances of loans acquired that meet our definition of non-performing but are not, under the accounting model for acquired loans, subject to classification as non-accrual in the same manner as originated loans, totaled $202.0 million at September 30, 2012, compared to $236.6 million at June 30, 2012 and $241.6 million at September 30, 2011.
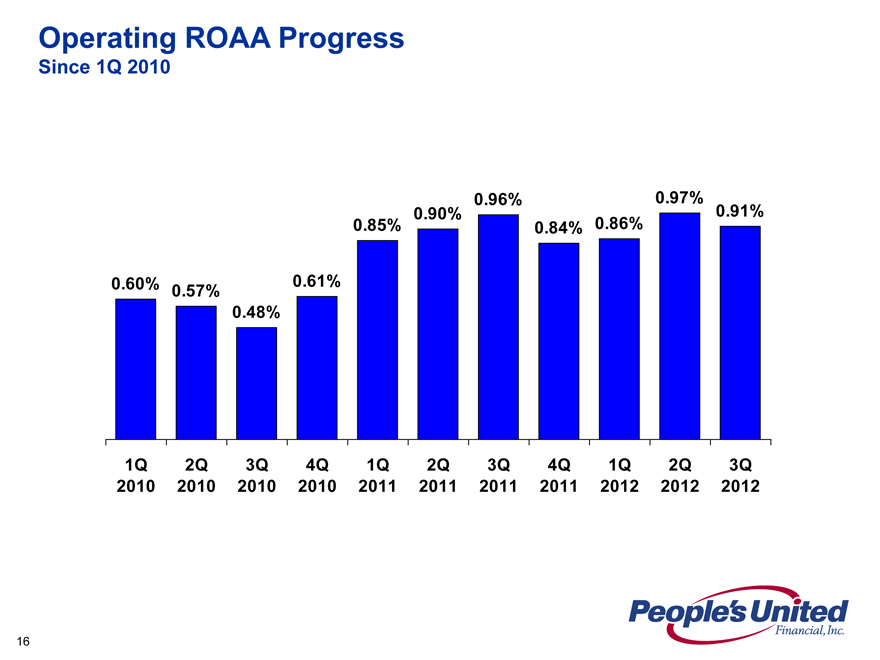
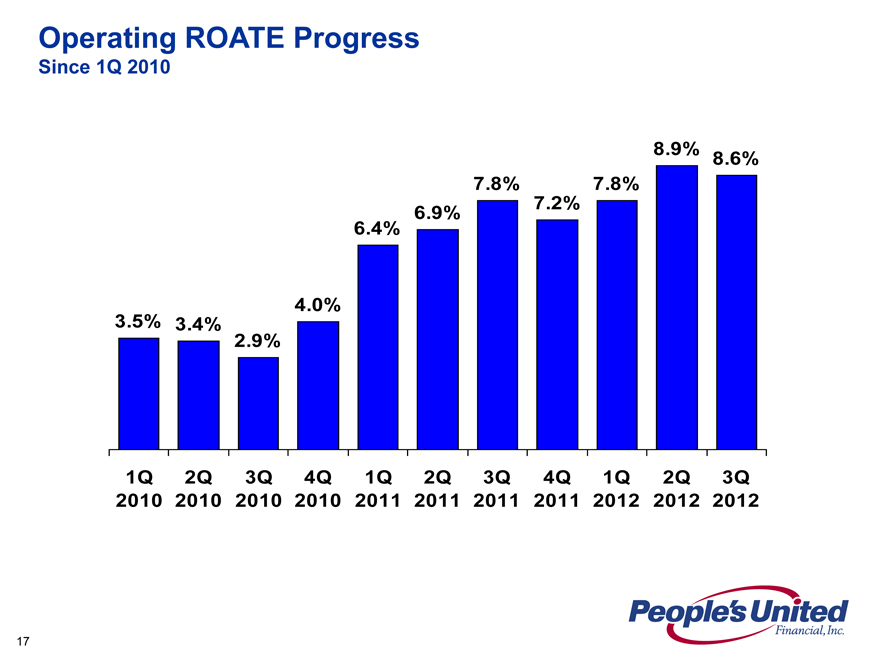
Operating return on average assets was 0.91 percent for the third quarter of 2012, compared to 0.96 percent for the third quarter of 2011 and 0.97 percent for the second quarter of 2012. Operating return on average tangible stockholders’ equity was 8.6 percent for the third quarter of 2012, compared to 7.8 percent for the third quarter of 2011 and 8.9 percent for the second quarter of 2012.
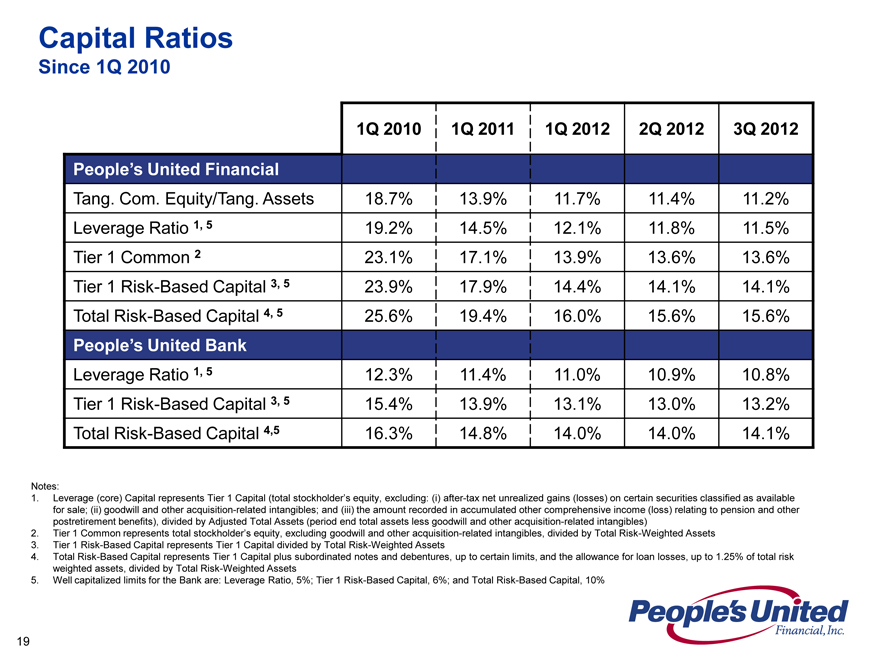
At September 30, 2012, People’s United Financial’s tier 1 common and total risk-based capital ratios were 13.6 percent and 15.6 percent, respectively, and the tangible equity ratio stood at 11.2 percent. People’s United Bank’s tier 1 and total risk-based capital ratios were 13.2 percent and 14.1 percent, respectively, at September 30, 2012.
Previously reported results for (i) the first two quarters of 2012, (ii) all four quarters of 2011, and (iii) the fourth quarter of 2010 have been revised to reflect a reduction in interest income on certain acquired loans relating to an unintentional overstatement of interest income. The effect of these revisions was immaterial to each period (no change in basic and diluted earnings per share for the first and second quarters of 2012 and the first and fourth quarters of 2011, and a one cent reduction in basic and diluted earnings per share for the second and third quarters of 2011 and the fourth quarter of 2010). Net income for the three months ended June 30, 2012, March 31, 2012, December 31, 2011, September 30, 2011, June 30, 2011, March 31, 2011 and December 31, 2010 was reduced by $0.2 million, $1.3 million, $1.6 million, $1.4 million, $1.7 million, $1.7 million and $3.2 million, respectively, reflecting the after-tax decreases in total interest on loans and net interest income in each period.
People’s United Financial, a diversified financial services company with $29 billion in assets, provides commercial and retail banking, as well as wealth management services through a network of 417 branches in Connecticut, New York, Massachusetts, Vermont, New Hampshire and Maine. Through its subsidiaries, People’s United Financial provides equipment financing, brokerage and insurance services. Assets under administration and those under full discretionary management, neither of which are reported as assets of People’s United Financial, totaled $12.0 billion and $4.5 billion, respectively, at September 30, 2012.
Conference Call
On October 18, 2012, at 5 p.m., Eastern Time, People’s United Financial will host a conference call to discuss this earnings announcement. The call may be heard through www.peoples.com by selecting “Investor Relations” in the “About Us” section on the home page, and then selecting “Conference Calls” in the “News and Events” section. Additional materials relating to the call may also be accessed at People’s United Bank’s web site. The call will be archived on the web site and available for approximately 90 days.
— more —
People’s United Financial, Inc. Reports 3Q Earnings
Page 4
3Q 2012 Financial Highlights
Summary
| • | Net income was $62.2 million, or $0.18 per share. |
| • | Operating earnings were $64.4 million, or $0.19 per share. |
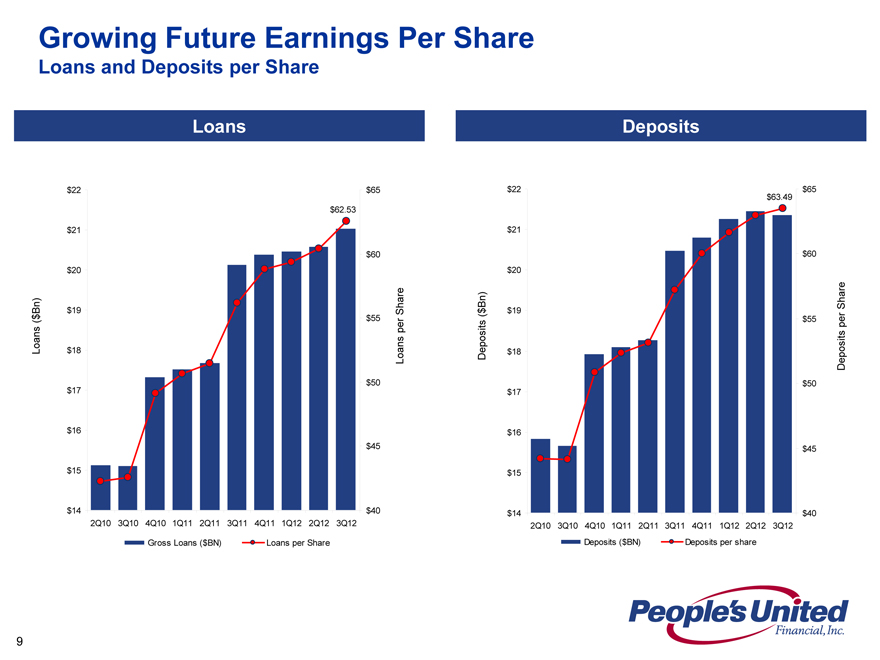
| • | Net interest income totaled $234.8 million compared to $235.6 million in 2Q12. |
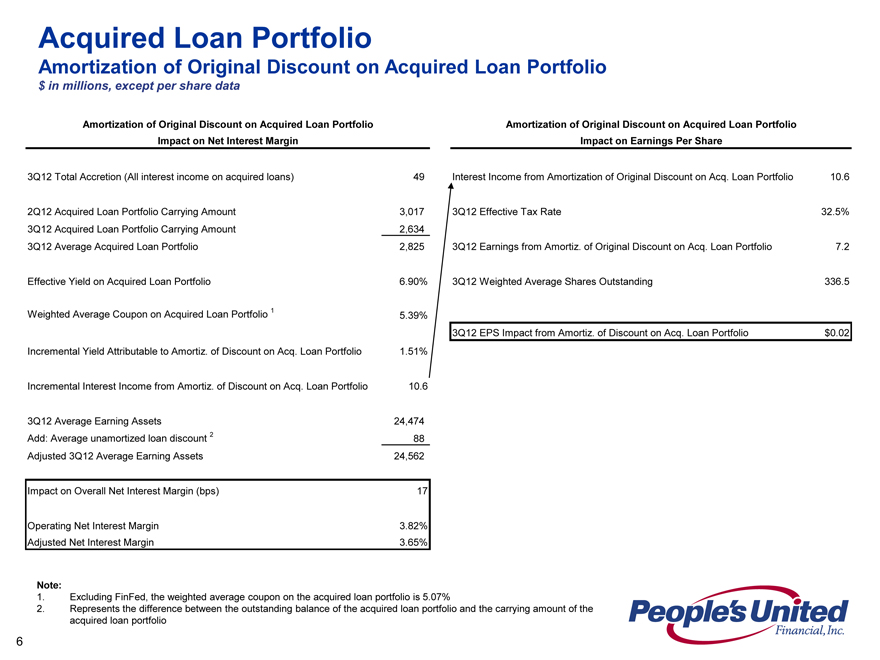
| • | Cost recovery income on acquired loans, representing cash receipts in excess of carrying amount, totaled $4.1 million in 3Q12 ($4.7 million in 2Q12). |
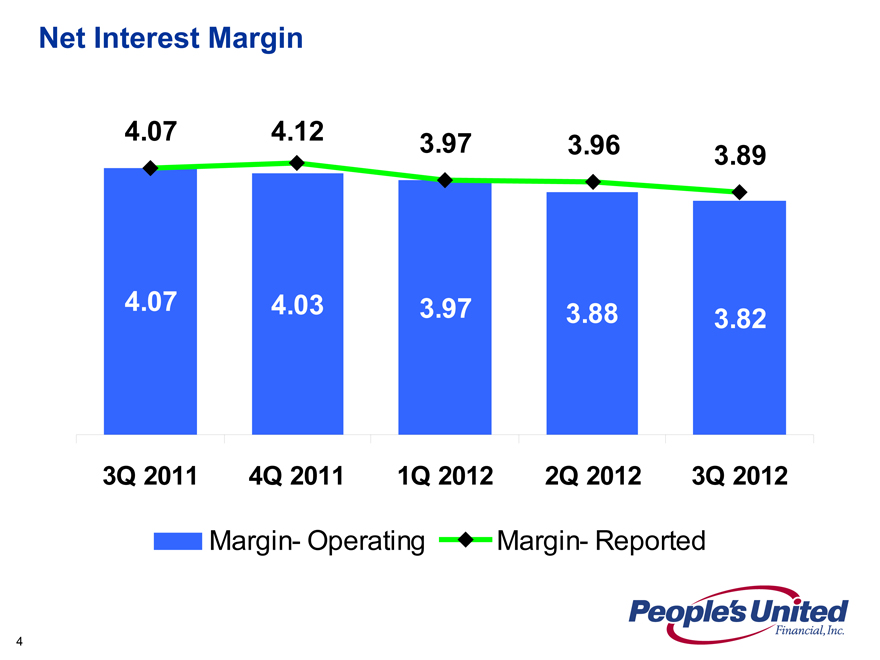
| • | Operating net interest margin decreased 6 basis points from 2Q12 to 3.82%. |
| • | Loan yields reduced the net interest margin by 9 basis points. |
| • | Lower funding costs in 3Q12 benefited the net interest margin by 3 basis points. |
| • | Provision for loan losses totaled $15.1 million. |
| • | Net loan charge-offs totaled $9.4 million, of which $4.8 million related to loans with specific reserves established in prior periods. |
| • | Reflects a $4.8 million increase in the allowance for loan losses due to loan growth. |
| • | Includes a provision for loan losses on acquired loans of $5.7 million. |
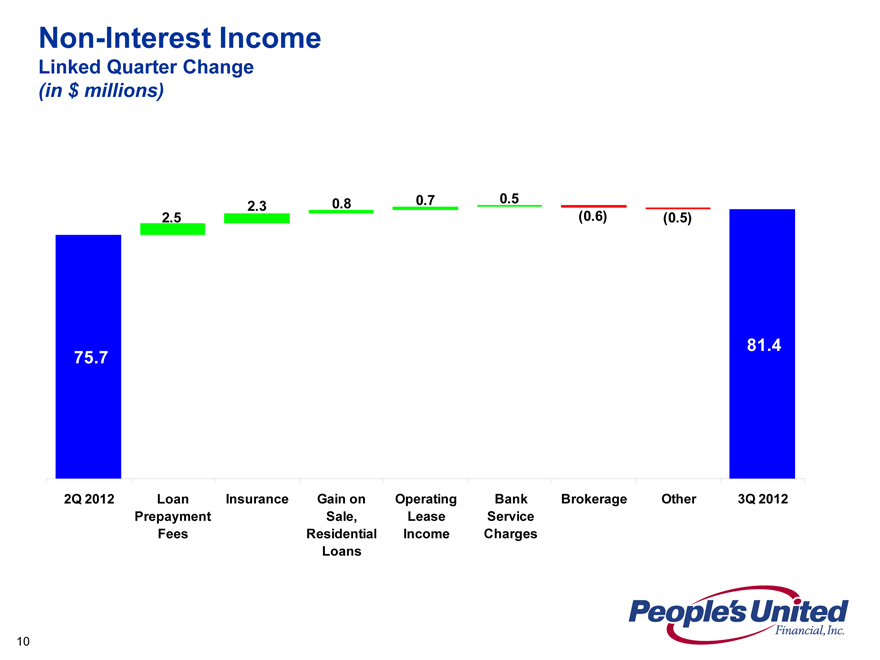
| • | Non-interest income was $81.4 million in 3Q12 compared to $75.7 million in 2Q12. |
| • | Loan prepayment fees increased $2.5 million from 2Q12. |
| • | Insurance revenue increased $2.3 million from 2Q12, primarily reflecting the seasonal nature of insurance renewals. |
| • | Net gains on sales of residential mortgage loans increased $0.8 million from 2Q12. |
| • | Bank service charges increased $0.5 million from 2Q12 to $33.0 million. |
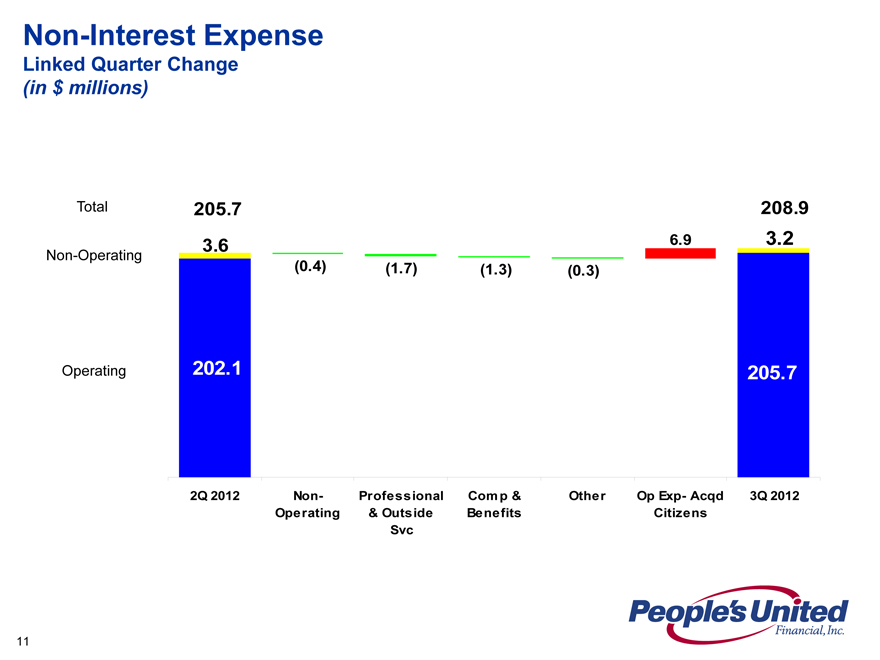
| • | Non-interest expense totaled $208.9 million in 3Q12 compared to $205.7 million in 2Q12. |
| • | Operating non-interest expense was $205.7 million in 3Q12 compared to $202.1 million in 2Q12. |
| • | 3Q12 includes a full quarter of non-interest expense (approximately $7.6 million) related to the purchase of 57 branches late in 2Q12. |
| • | Efficiency ratio in 3Q12 decreased to 61.4% from 61.5% in 2Q12, reflecting a $6.0 million increase in operating revenues and a $3.1 million increase in operating expenses. |
| • | Effective income tax rate was 32.5% for 3Q12 compared to 32.0% for 2Q12. |
— more —
People’s United Financial, Inc. Reports 3Q Earnings
Page 5
Commercial Banking
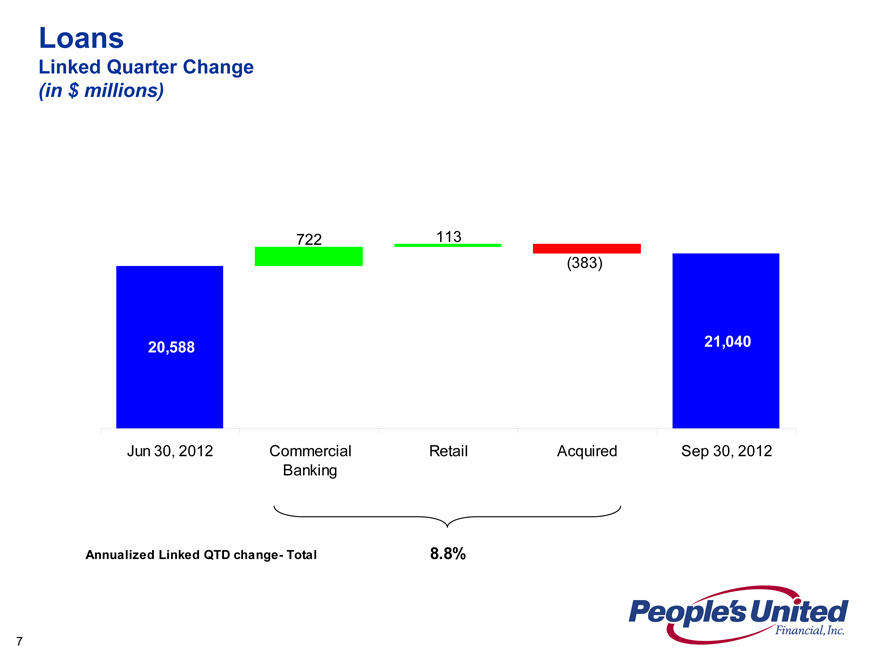
| • | Commercial banking loans, excluding acquired loans, increased $722 million from June 30, 2012. |
| • | Average commercial banking loans totaled $14.7 billion in 3Q12, an increase of $184 million, or 5% annualized, from 2Q12. |
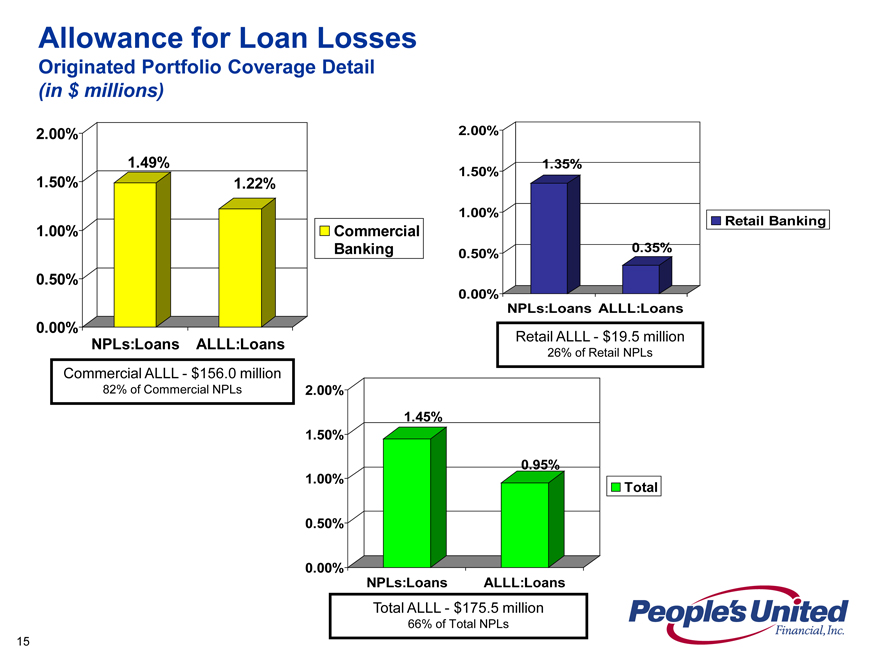
| • | The ratio of originated non-performing commercial banking loans to originated commercial banking loans was 1.49% at September 30, 2012 compared to 1.57% at June 30, 2012. |
| • | Non-performing commercial banking assets, excluding acquired non-performing loans, totaled $211.3 million at September 30, 2012 compared to $211.2 million at June 30, 2012. |
| • | Net loan charge-offs totaled $7.2 million, or 0.20% annualized, of average commercial banking loans in 3Q12, compared to $10.4 million, or 0.29% annualized, in 2Q12. |
| • | For the originated commercial banking portfolio, the allowance for loan losses as a percentage of loans was 1.22% at September 30, 2012 compared to 1.29% at June 30, 2012. |
| • | The commercial banking originated allowance for loan losses represented 82% of originated non-performing commercial banking loans at both September 30, 2012 and at June 30, 2012. |
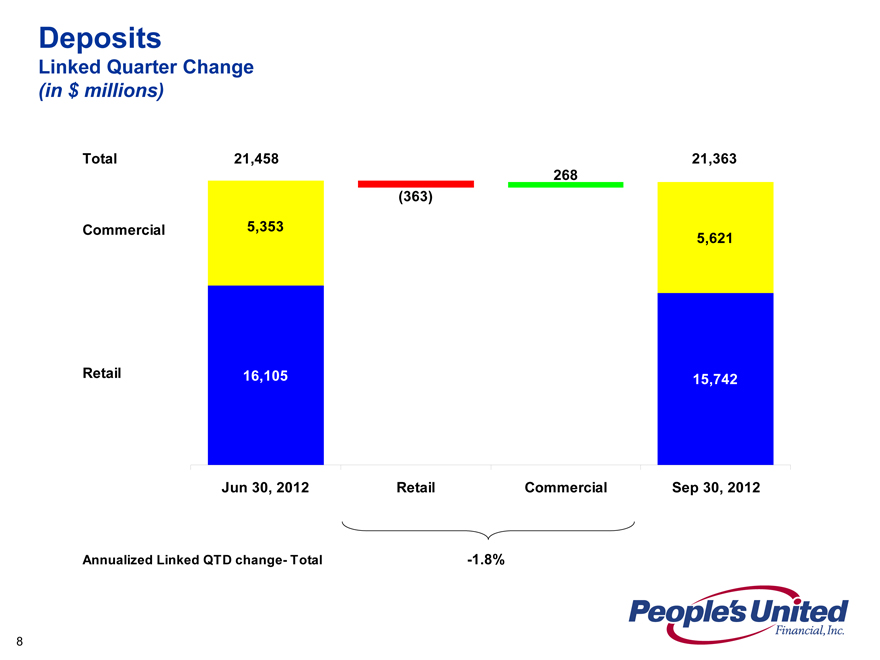
| • | Commercial deposits totaled $5.6 billion at September 30, 2012 compared to $5.4 billion at June 30, 2012. |
Retail Banking
| • | Residential mortgage loans, excluding acquired loans, increased $97 million from June 30, 2012. |
| • | Average residential mortgage loans totaled $3.9 billion in 3Q12, an increase of $68 million, or 7% annualized, from 2Q12. |
| • | The ratio of originated non-performing residential mortgage loans to originated residential mortgage loans was 1.73% at September 30, 2012 compared to 1.87% at June 30, 2012. |
| • | Net loan charge-offs totaled $1.3 million, or 0.13% annualized, of average residential mortgage loans in 3Q12, compared to $1.4 million, or 0.14% annualized, in 2Q12. |
| • | Home equity loans, excluding acquired loans, increased $27 million from June 30, 2012. |
| • | Average home equity loans totaled $2.0 billion in 3Q12, unchanged from 2Q12. |
| • | The ratio of originated non-performing home equity loans to originated home equity loans was 0.74% at September 30, 2012 compared to 0.71% at June 30, 2012. |
| • | Net loan charge-offs totaled $0.6 million, or 0.13% annualized, of average home equity loans in 3Q12, compared to $1.4 million, or 0.28% annualized, in 2Q12. |
| • | Retail deposits totaled $15.8 billion at September 30, 2012 compared to $16.1 billion at June 30, 2012. |
— more —
People’s United Financial, Inc. Reports 3Q Earnings
Page 6
Certain statements contained in this release are forward-looking in nature. These include all statements about People’s United Financial’s plans, objectives, expectations and other statements that are not historical facts, and usually use words such as “expect,” “anticipate,” “believe” and similar expressions. Such statements represent management’s current beliefs, based upon information available at the time the statements are made, with regard to the matters addressed. All forward-looking statements are subject to risks and uncertainties that could cause People’s United Financial’s actual results or financial condition to differ materially from those expressed in or implied by such statements. Factors of particular importance to People’s United Financial include, but are not limited to: (1) changes in general, national or regional economic conditions; (2) changes in interest rates; (3) changes in loan default and charge-off rates; (4) changes in deposit levels; (5) changes in levels of income and expense in non-interest income and expense related activities; (6) residential mortgage and secondary market activity; (7) changes in accounting and regulatory guidance applicable to banks; (8) price levels and conditions in the public securities markets generally; (9) competition and its effect on pricing, spending, third-party relationships and revenues; (10) the successful integration of acquired companies; and (11) changes in regulation resulting from or relating to financial reform legislation. People’s United Financial does not undertake any obligation to update or revise any forward-looking statements, whether as a result of new information, future events or otherwise.
###
Access Information About People’s United Financial at www.peoples.com.
People’s United Financial, Inc.
FINANCIAL HIGHLIGHTS
| Three Months Ended | ||||||||||||||||||||
| (dollars in millions, except per share data) |
Sept. 30, 2012 |
June 30, 2012 (1) |
March 31, 2012 (1) |
Dec. 31, 2011 (1) |
Sept. 30, 2011 (1) |
|||||||||||||||
| Earnings Data: |
||||||||||||||||||||
| Net interest income |
$ | 234.8 | $ | 235.6 | $ | 233.2 | $ | 239.6 | $ | 237.7 | ||||||||||
| Provision for loan losses |
15.1 | 10.6 | 11.5 | 20.7 | 14.4 | |||||||||||||||
| Non-interest income (2) |
81.4 | 75.7 | 72.4 | 71.7 | 84.7 | |||||||||||||||
| Non-interest expense (3) |
208.9 | 205.7 | 208.6 | 230.2 | 231.9 | |||||||||||||||
| Income before income tax expense |
92.2 | 95.0 | 85.5 | 60.4 | 76.1 | |||||||||||||||
| Net income |
62.2 | 64.6 | 57.3 | 41.4 | 51.5 | |||||||||||||||
| Operating earnings (4) |
64.4 | 67.0 | 59.3 | 57.1 | 65.9 | |||||||||||||||
| Selected Statistical Data: |
||||||||||||||||||||
| Net interest margin (5) |
3.89 | % | 3.96 | % | 3.97 | % | 4.12 | % | 4.07 | % | ||||||||||
| Operating net interest margin (4), (5) |
3.82 | 3.88 | 3.97 | 4.03 | 4.07 | |||||||||||||||
| Return on average assets (5) |
0.88 | 0.93 | 0.83 | 0.61 | 0.75 | |||||||||||||||
| Operating return on average assets (4), (5) |
0.91 | 0.97 | 0.86 | 0.84 | 0.96 | |||||||||||||||
| Return on average tangible assets (5) |
0.95 | 1.01 | 0.91 | 0.66 | 0.82 | |||||||||||||||
| Return on average stockholders’ equity (5) |
4.8 | 5.0 | 4.4 | 3.1 | 3.7 | |||||||||||||||
| Return on average tangible stockholders’ equity (5) |
8.3 | 8.5 | 7.5 | 5.2 | 6.1 | |||||||||||||||
| Operating return on average tangible stockholders’ equity (4), (5) |
8.6 | 8.9 | 7.8 | 7.2 | 7.8 | |||||||||||||||
| Efficiency ratio (4) |
61.4 | 61.5 | 63.6 | 62.3 | 62.4 | |||||||||||||||
| Common Share Data: |
||||||||||||||||||||
| Basic and diluted earnings per share |
$ | 0.18 | $ | 0.19 | $ | 0.17 | $ | 0.12 | $ | 0.14 | ||||||||||
| Operating earnings per share (4) |
0.19 | 0.20 | 0.18 | 0.17 | 0.18 | |||||||||||||||
| Dividends paid per share |
0.1600 | 0.1600 | 0.1575 | 0.1575 | 0.1575 | |||||||||||||||
| Dividend payout ratio |
87.3 | % | 85.4 | % | 95.9 | % | 132.6 | % | 111.5 | % | ||||||||||
| Operating dividend payout ratio (4) |
84.3 | 82.2 | 92.6 | 96.0 | 87.1 | |||||||||||||||
| Book value per share (end of period) |
$ | 15.20 | $ | 15.09 | $ | 15.00 | $ | 14.96 | $ | 15.15 | ||||||||||
| Tangible book value per share (end of period) (4) |
8.77 | 8.72 | 8.71 | 8.72 | 8.98 | |||||||||||||||
| Stock price: |
||||||||||||||||||||
| High |
12.55 | 13.50 | 13.79 | 13.07 | 13.96 | |||||||||||||||
| Low |
11.20 | 11.25 | 12.20 | 10.91 | 10.50 | |||||||||||||||
| Close (end of period) |
12.14 | 11.61 | 13.23 | 12.85 | 11.40 | |||||||||||||||
| Common shares (end of period) (in millions) |
335.95 | 340.33 | 344.73 | 348.68 | 348.59 | |||||||||||||||
| Weighted average diluted common shares (in millions) |
336.48 | 340.67 | 344.97 | 346.68 | 358.28 | |||||||||||||||
| (1) | Previously reported amounts for the three months ended June 30, 2012, March 31, 2012, Dec. 31, 2011 and Sept. 30, 2011 have been revised to reflect a reduction in net interest income, which, after taxes, reduced net income by $0.2 million, $1.3 million, $1.6 million and $1.4 million, respectively. Basic and diluted earnings per share were reduced by $0.01 for the three months ended Sept. 30, 2011 (no change for the three months ended June 30, 2012, March 31, 2012 and Dec. 31, 2011). Certain statistical data and other per common share data have been revised accordingly. |
| (2) | Includes net security gains of $8.6 million for the three months ended Sept. 30, 2011. |
| (3) | Includes a total of $3.2 million, $3.6 million, $3.0 million, $23.0 million and $21.5 million of merger-related expenses and one-time charges for the three months ended Sept. 30, 2012, June 30, 2012, March 31, 2012, Dec. 31, 2011 and Sept. 30, 2011, respectively. |
| (4) | See Non-GAAP financial measures and reconciliation to GAAP beginning on page 17. |
| (5) | Annualized. |
7
People’s United Financial, Inc.
FINANCIAL HIGHLIGHTS - Continued
| Nine Months Ended September 30, |
||||||||
| (dollars in millions, except per share data) |
2012 | 2011 (1) | ||||||
| Earnings Data: |
||||||||
| Net interest income |
$ | 703.6 | $ | 673.9 | ||||
| Provision for loan losses |
37.2 | 43.0 | ||||||
| Non-interest income |
229.5 | 235.9 | ||||||
| Non-interest expense (2) |
623.2 | 641.7 | ||||||
| Income before income tax expense |
272.7 | 225.1 | ||||||
| Net income |
184.1 | 151.0 | ||||||
| Operating earnings (3) |
190.7 | 173.6 | ||||||
| Selected Statistical Data: |
||||||||
| Net interest margin (4) |
3.94 | % | 4.09 | % | ||||
| Operating net interest margin (3), (4) |
3.89 | 4.02 | ||||||
| Return on average assets (4) |
0.88 | 0.79 | ||||||
| Operating return on average assets (3), (4) |
0.91 | 0.90 | ||||||
| Return on average tangible assets (4) |
0.96 | 0.85 | ||||||
| Return on average stockholders’ equity (4) |
4.7 | 3.8 | ||||||
| Return on average tangible stockholders’ equity (4) |
8.1 | 6.2 | ||||||
| Operating return on average tangible stockholders’ equity (3), (4) |
8.4 | 7.1 | ||||||
| Efficiency ratio (3) |
62.2 | 64.5 | ||||||
| Common Share Data: |
||||||||
| Basic and diluted earnings per share |
$ | 0.54 | $ | 0.43 | ||||
| Operating earnings per share (3) |
0.57 | 0.49 | ||||||
| Dividends paid per share |
0.4775 | 0.4700 | ||||||
| Dividend payout ratio |
89.3 | % | 110.0 | % | ||||
| Operating dividend payout ratio (3) |
86.2 | 95.7 | ||||||
| Book value per share (end of period) |
$ | 15.20 | $ | 15.15 | ||||
| Tangible book value per share (end of period) (3) |
8.77 | 8.98 | ||||||
| Stock price: |
||||||||
| High |
13.79 | 14.49 | ||||||
| Low |
11.20 | 10.50 | ||||||
| Close (end of period) |
12.14 | 11.40 | ||||||
| Common shares (end of period) (in millions) |
335.95 | 348.59 | ||||||
| Weighted average diluted common shares (in millions) |
340.69 | 349.43 | ||||||
| (1) | Previously reported amounts for the nine months ended September 30, 2011 have been revised to reflect a reduction in net interest income, which, after taxes, reduced net income by $4.8 million and basic and diluted earnings per share by $0.02. Certain statistical data and other per common share data have been revised accordingly. |
| (2) | Includes a total of $9.8 million and $33.8 million of merger-related expenses and one-time charges for the nine months ended September 30, 2012 and 2011, respectively. |
| (3) | See Non-GAAP financial measures and reconciliation to GAAP beginning on page 17. |
| (4) | Annualized. |
8
People’s United Financial, Inc.
FINANCIAL HIGHLIGHTS - Continued
| As of and for the Three Months Ended | ||||||||||||||||||||
| (dollars in millions) |
Sept. 30, 2012 |
June 30, 2012 |
March 31, 2012 |
Dec. 31, 2011 |
Sept. 30, 2011 |
|||||||||||||||
| Financial Condition Data: |
||||||||||||||||||||
| General: |
||||||||||||||||||||
| Total assets |
$ | 28,576 | $ | 28,137 | $ | 27,791 | $ | 27,553 | $ | 27,200 | ||||||||||
| Loans |
21,040 | 20,588 | 20,472 | 20,385 | 20,136 | |||||||||||||||
| Securities |
3,787 | 3,702 | 2,895 | 2,931 | 2,540 | |||||||||||||||
| Short-term investments (1) |
64 | 73 | 767 | 411 | 779 | |||||||||||||||
| Allowance for loan losses |
186 | 180 | 183 | 183 | 177 | |||||||||||||||
| Goodwill and other acquisition-related intangibles |
2,160 | 2,166 | 2,169 | 2,174 | 2,151 | |||||||||||||||
| Deposits |
21,363 | 21,458 | 21,268 | 20,816 | 20,487 | |||||||||||||||
| Borrowings |
1,524 | 960 | 811 | 857 | 881 | |||||||||||||||
| Subordinated notes and debentures |
160 | 160 | 160 | 160 | 159 | |||||||||||||||
| Stockholders’ equity |
5,107 | 5,135 | 5,170 | 5,215 | 5,282 | |||||||||||||||
| Non-performing assets (2) |
294 | 295 | 316 | 337 | 305 | |||||||||||||||
| Net loan charge-offs |
9.4 | 13.5 | 11.2 | 14.8 | 13.4 | |||||||||||||||
| Average Balances: |
||||||||||||||||||||
| Loans |
$ | 20,727 | $ | 20,488 | $ | 20,407 | $ | 20,217 | $ | 19,856 | ||||||||||
| Securities |
3,608 | 2,964 | 2,751 | 2,411 | 2,976 | |||||||||||||||
| Short-term investments (1) |
108 | 562 | 536 | 854 | 756 | |||||||||||||||
| Loans held for sale |
31 | 26 | 39 | 60 | 26 | |||||||||||||||
| Total earning assets |
24,474 | 24,040 | 23,733 | 23,542 | 23,614 | |||||||||||||||
| Total assets |
28,234 | 27,753 | 27,463 | 27,285 | 27,355 | |||||||||||||||
| Deposits |
21,372 | 21,190 | 20,843 | 20,597 | 20,259 | |||||||||||||||
| Total funding liabilities |
22,709 | 22,184 | 21,862 | 21,653 | 21,499 | |||||||||||||||
| Stockholders’ equity |
5,161 | 5,188 | 5,217 | 5,302 | 5,515 | |||||||||||||||
| Ratios: |
||||||||||||||||||||
| Net loan charge-offs to average loans (annualized) |
0.18 | % | 0.26 | % | 0.22 | % | 0.29 | % | 0.27 | % | ||||||||||
| Non-performing assets to originated loans, real estate owned and repossessed assets (2) |
1.59 | 1.67 | 1.85 | 2.00 | 1.88 | |||||||||||||||
| Originated allowance for loan losses to: |
||||||||||||||||||||
| Originated loans (2) |
0.95 | 1.00 | 1.03 | 1.05 | 1.09 | |||||||||||||||
| Originated non-performing loans (2) |
66.0 | 65.6 | 61.5 | 59.7 | 68.5 | |||||||||||||||
| Average stockholders’ equity to average total assets |
18.3 | 18.7 | 19.0 | 19.4 | 20.2 | |||||||||||||||
| Stockholders’ equity to total assets |
17.9 | 18.3 | 18.6 | 18.9 | 19.4 | |||||||||||||||
| Tangible stockholders’ equity to tangible assets (3) |
11.2 | 11.4 | 11.7 | 12.0 | 12.5 | |||||||||||||||
| Total risk-based capital (4) |
15.6 | 15.6 | 16.0 | 16.2 | 16.7 | |||||||||||||||
| (1) | Includes securities purchased under agreements to resell. |
| (2) | Excludes acquired loans. |
| (3) | See Non-GAAP financial measures and reconciliation to GAAP beginning on page 17. |
| (4) | Consolidated. |
9
People’s United Financial, Inc.
CONSOLIDATED STATEMENTS OF CONDITION
| (in millions) |
Sept. 30, 2012 |
June 30, 2012 |
Dec. 31, 2011 |
Sept. 30, 2011 |
||||||||||||
| Assets |
||||||||||||||||
| Cash and due from banks |
$ | 358.3 | $ | 415.1 | $ | 370.2 | $ | 370.9 | ||||||||
| Short-term investments |
63.7 | 72.8 | 410.7 | 779.1 | ||||||||||||
|
|
|
|
|
|
|
|
|
|||||||||
| Total cash and cash equivalents |
422.0 | 487.9 | 780.9 | 1,150.0 | ||||||||||||
|
|
|
|
|
|
|
|
|
|||||||||
| Securities: |
||||||||||||||||
| Trading account securities, at fair value |
6.3 | 12.0 | 71.8 | 69.9 | ||||||||||||
| Securities available for sale, at fair value |
3,651.0 | 3,560.0 | 2,725.5 | 2,336.0 | ||||||||||||
| Securities held to maturity, at amortized cost |
56.2 | 56.4 | 56.4 | 56.4 | ||||||||||||
| Federal Home Loan Bank stock, at cost |
73.7 | 73.7 | 77.7 | 77.7 | ||||||||||||
|
|
|
|
|
|
|
|
|
|||||||||
| Total securities |
3,787.2 | 3,702.1 | 2,931.4 | 2,540.0 | ||||||||||||
|
|
|
|
|
|
|
|
|
|||||||||
| Loans held for sale |
60.0 | 57.1 | 101.9 | 45.4 | ||||||||||||
|
|
|
|
|
|
|
|
|
|||||||||
| Loans: |
||||||||||||||||
| Commercial |
7,951.7 | 7,590.1 | 7,366.8 | 7,249.8 | ||||||||||||
| Commercial real estate |
7,032.8 | 6,999.7 | 7,172.2 | 7,142.9 | ||||||||||||
| Residential mortgage |
3,891.3 | 3,831.9 | 3,628.4 | 3,502.0 | ||||||||||||
| Consumer |
2,164.2 | 2,166.7 | 2,217.4 | 2,240.8 | ||||||||||||
|
|
|
|
|
|
|
|
|
|||||||||
| Total loans |
21,040.0 | 20,588.4 | 20,384.8 | 20,135.5 | ||||||||||||
| Less allowance for loan losses |
(186.0 | ) | (180.3 | ) | (182.9 | ) | (177.0 | ) | ||||||||
|
|
|
|
|
|
|
|
|
|||||||||
| Total loans, net |
20,854.0 | 20,408.1 | 20,201.9 | 19,958.5 | ||||||||||||
|
|
|
|
|
|
|
|
|
|||||||||
| Goodwill and other acquisition-related intangibles |
2,160.3 | 2,166.4 | 2,174.2 | 2,151.2 | ||||||||||||
| Premises and equipment |
334.7 | 337.4 | 339.6 | 363.1 | ||||||||||||
| Bank-owned life insurance |
335.5 | 334.6 | 332.7 | 330.7 | ||||||||||||
| Other assets |
622.3 | 643.0 | 690.1 | 661.4 | ||||||||||||
|
|
|
|
|
|
|
|
|
|||||||||
| Total assets |
$ | 28,576.0 | $ | 28,136.6 | $ | 27,552.7 | $ | 27,200.3 | ||||||||
|
|
|
|
|
|
|
|
|
|||||||||
| Liabilities |
||||||||||||||||
| Deposits: |
||||||||||||||||
| Non-interest-bearing |
$ | 4,746.9 | $ | 4,799.2 | $ | 4,506.2 | $ | 4,217.5 | ||||||||
| Savings, interest-bearing checking and money market |
11,729.0 | 11,617.9 | 10,970.4 | 10,789.5 | ||||||||||||
| Time |
4,886.7 | 5,040.7 | 5,339.2 | 5,479.7 | ||||||||||||
|
|
|
|
|
|
|
|
|
|||||||||
| Total deposits |
21,362.6 | 21,457.8 | 20,815.8 | 20,486.7 | ||||||||||||
|
|
|
|
|
|
|
|
|
|||||||||
| Borrowings: |
||||||||||||||||
| Federal Home Loan Bank advances |
629.3 | 330.3 | 332.4 | 333.4 | ||||||||||||
| Retail repurchase agreements |
479.0 | 452.7 | 497.2 | 519.8 | ||||||||||||
| Federal funds purchased |
415.0 | 150.0 | — | — | ||||||||||||
| Other borrowings |
1.0 | 26.6 | 27.1 | 27.3 | ||||||||||||
|
|
|
|
|
|
|
|
|
|||||||||
| Total borrowings |
1,524.3 | 959.6 | 856.7 | 880.5 | ||||||||||||
|
|
|
|
|
|
|
|
|
|||||||||
| Subordinated notes and debentures |
160.4 | 160.1 | 159.6 | 159.4 | ||||||||||||
| Other liabilities |
421.3 | 423.7 | 505.2 | 391.3 | ||||||||||||
|
|
|
|
|
|
|
|
|
|||||||||
| Total liabilities |
23,468.6 | 23,001.2 | 22,337.3 | 21,917.9 | ||||||||||||
|
|
|
|
|
|
|
|
|
|||||||||
| Stockholders’ Equity |
||||||||||||||||
| Common stock |
3.9 | 3.9 | 3.9 | 3.9 | ||||||||||||
| Additional paid-in capital |
5,263.9 | 5,258.5 | 5,247.0 | 5,242.5 | ||||||||||||
| Retained earnings |
750.1 | 743.2 | 734.5 | 749.6 | ||||||||||||
| Treasury stock, at cost |
(656.2 | ) | (602.9 | ) | (493.5 | ) | (494.3 | ) | ||||||||
| Accumulated other comprehensive loss |
(79.0 | ) | (90.2 | ) | (95.8 | ) | (36.8 | ) | ||||||||
| Unallocated common stock of Employee Stock Ownership Plan, at cost |
(175.3 | ) | (177.1 | ) | (180.7 | ) | (182.5 | ) | ||||||||
|
|
|
|
|
|
|
|
|
|||||||||
| Total stockholders’ equity |
5,107.4 | 5,135.4 | 5,215.4 | 5,282.4 | ||||||||||||
|
|
|
|
|
|
|
|
|
|||||||||
| Total liabilities and stockholders’ equity |
$ | 28,576.0 | $ | 28,136.6 | $ | 27,552.7 | $ | 27,200.3 | ||||||||
|
|
|
|
|
|
|
|
|
|||||||||
10
People’s United Financial, Inc.
CONSOLIDATED STATEMENTS OF INCOME
| Three Months Ended | ||||||||||||||||||||
| (in millions, except per share data) |
Sept. 30, 2012 |
June 30, 2012 (1) |
March 31, 2012 (1) |
Dec. 31, 2011 (1) |
Sept. 30, 2011 (1) |
|||||||||||||||
| Interest and dividend income: |
||||||||||||||||||||
| Commercial real estate |
$ | 91.3 | $ | 96.4 | $ | 91.7 | $ | 100.3 | $ | 98.0 | ||||||||||
| Commercial |
91.3 | 91.1 | 92.8 | 94.4 | 95.1 | |||||||||||||||
| Residential mortgage |
37.1 | 35.8 | 36.2 | 35.6 | 34.5 | |||||||||||||||
| Consumer |
19.8 | 20.0 | 20.7 | 21.2 | 21.5 | |||||||||||||||
|
|
|
|
|
|
|
|
|
|
|
|||||||||||
| Total interest on loans |
239.5 | 243.3 | 241.4 | 251.5 | 249.1 | |||||||||||||||
| Securities |
20.3 | 18.3 | 18.0 | 17.3 | 21.7 | |||||||||||||||
| Loans held for sale |
0.5 | 0.4 | 0.5 | 0.7 | 0.4 | |||||||||||||||
| Short-term investments |
— | 0.4 | 0.3 | 0.5 | 0.5 | |||||||||||||||
|
|
|
|
|
|
|
|
|
|
|
|||||||||||
| Total interest and dividend income |
260.3 | 262.4 | 260.2 | 270.0 | 271.7 | |||||||||||||||
|
|
|
|
|
|
|
|
|
|
|
|||||||||||
| Interest expense: |
||||||||||||||||||||
| Deposits |
22.1 | 23.6 | 23.1 | 25.9 | 28.5 | |||||||||||||||
| Borrowings |
1.8 | 1.6 | 1.7 | 1.7 | 2.4 | |||||||||||||||
| Subordinated notes and debentures |
1.6 | 1.6 | 2.2 | 2.8 | 3.1 | |||||||||||||||
|
|
|
|
|
|
|
|
|
|
|
|||||||||||
| Total interest expense |
25.5 | 26.8 | 27.0 | 30.4 | 34.0 | |||||||||||||||
|
|
|
|
|
|
|
|
|
|
|
|||||||||||
| Net interest income |
234.8 | 235.6 | 233.2 | 239.6 | 237.7 | |||||||||||||||
| Provision for loan losses |
15.1 | 10.6 | 11.5 | 20.7 | 14.4 | |||||||||||||||
|
|
|
|
|
|
|
|
|
|
|
|||||||||||
| Net interest income after provision for loan losses |
219.7 | 225.0 | 221.7 | 218.9 | 223.3 | |||||||||||||||
|
|
|
|
|
|
|
|
|
|
|
|||||||||||
| Non-interest income: |
||||||||||||||||||||
| Bank service charges |
33.0 | 32.5 | 30.3 | 31.6 | 35.8 | |||||||||||||||
| Investment management fees |
8.7 | 8.7 | 8.6 | 8.3 | 8.4 | |||||||||||||||
| Insurance revenue |
9.5 | 7.2 | 8.4 | 7.2 | 9.0 | |||||||||||||||
| Brokerage commissions |
2.8 | 3.4 | 3.1 | 2.6 | 2.8 | |||||||||||||||
| Net gains on sales of residential mortgage loans |
3.6 | 2.8 | 3.6 | 2.1 | 1.3 | |||||||||||||||
| Net gains (losses) on sales of acquired loans |
— | 0.7 | — | (0.4 | ) | (4.8 | ) | |||||||||||||
| Bank-owned life insurance |
1.3 | 1.2 | 1.8 | 1.7 | 2.0 | |||||||||||||||
| Merchant services income, net |
1.2 | 1.3 | 1.1 | 1.1 | 1.1 | |||||||||||||||
| Net security gains |
— | — | — | — | 8.6 | |||||||||||||||
| Other non-interest income |
21.3 | 17.9 | 15.5 | 17.5 | 20.5 | |||||||||||||||
|
|
|
|
|
|
|
|
|
|
|
|||||||||||
| Total non-interest income |
81.4 | 75.7 | 72.4 | 71.7 | 84.7 | |||||||||||||||
|
|
|
|
|
|
|
|
|
|
|
|||||||||||
| Non-interest expense: |
||||||||||||||||||||
| Compensation and benefits |
106.7 | 104.5 | 110.3 | 111.0 | 110.1 | |||||||||||||||
| Occupancy and equipment |
36.5 | 34.1 | 33.4 | 34.4 | 34.9 | |||||||||||||||
| Professional and outside service fees |
15.8 | 17.5 | 15.3 | 18.7 | 18.6 | |||||||||||||||
| Amortization of other acquisition-related intangibles |
6.7 | 6.8 | 6.6 | 6.9 | 7.0 | |||||||||||||||
| Merger-related expenses |
— | — | — | 13.3 | 20.1 | |||||||||||||||
| Other non-interest expense |
43.2 | 42.8 | 43.0 | 45.9 | 41.2 | |||||||||||||||
|
|
|
|
|
|
|
|
|
|
|
|||||||||||
| Total non-interest expense (2) |
208.9 | 205.7 | 208.6 | 230.2 | 231.9 | |||||||||||||||
|
|
|
|
|
|
|
|
|
|
|
|||||||||||
| Income before income tax expense |
92.2 | 95.0 | 85.5 | 60.4 | 76.1 | |||||||||||||||
| Income tax expense |
30.0 | 30.4 | 28.2 | 19.0 | 24.6 | |||||||||||||||
|
|
|
|
|
|
|
|
|
|
|
|||||||||||
| Net income |
$ | 62.2 | $ | 64.6 | $ | 57.3 | $ | 41.4 | $ | 51.5 | ||||||||||
|
|
|
|
|
|
|
|
|
|
|
|||||||||||
| Basic and diluted earnings per common share |
$ | 0.18 | $ | 0.19 | $ | 0.17 | $ | 0.12 | $ | 0.14 | ||||||||||
|
|
|
|
|
|
|
|
|
|
|
|||||||||||
| (1) | See Financial Highlights footnote 1 on page 7. |
| (2) | In addition to merger-related expenses, total non-interest expense includes $3.2 million, $3.6 million, $3.0 million, $9.7 million and $1.4 million of non-operating expenses for the three months ended Sept. 30, 2012, June 30, 2012, March 31, 2012, Dec. 31, 2011 and Sept. 30, 2011, respectively. See Non-GAAP financial measures and reconciliation to GAAP beginning on page 17. |
11
People’s United Financial, Inc.
CONSOLIDATED STATEMENTS OF INCOME
| Nine Months Ended September 30, |
||||||||
| (in millions, except per share data) |
2012 | 2011 (1) | ||||||
| Interest and dividend income: |
||||||||
| Commercial real estate |
$ | 279.4 | $ | 292.1 | ||||
| Commercial |
275.2 | 254.3 | ||||||
| Residential mortgage |
109.1 | 93.5 | ||||||
| Consumer |
60.5 | 63.0 | ||||||
|
|
|
|
|
|||||
| Total interest on loans |
724.2 | 702.9 | ||||||
| Securities |
56.6 | 66.1 | ||||||
| Loans held for sale |
1.4 | 1.4 | ||||||
| Short-term investments |
0.7 | 1.6 | ||||||
|
|
|
|
|
|||||
| Total interest and dividend income |
782.9 | 772.0 | ||||||
|
|
|
|
|
|||||
| Interest expense: |
||||||||
| Deposits |
68.8 | 81.5 | ||||||
| Borrowings |
5.1 | 7.3 | ||||||
| Subordinated notes and debentures |
5.4 | 9.3 | ||||||
|
|
|
|
|
|||||
| Total interest expense |
79.3 | 98.1 | ||||||
|
|
|
|
|
|||||
| Net interest income |
703.6 | 673.9 | ||||||
| Provision for loan losses |
37.2 | 43.0 | ||||||
|
|
|
|
|
|||||
| Net interest income after provision for loan losses |
666.4 | 630.9 | ||||||
|
|
|
|
|
|||||
| Non-interest income: |
||||||||
| Bank service charges |
95.8 | 99.7 | ||||||
| Investment management fees |
26.0 | 24.9 | ||||||
| Insurance revenue |
25.1 | 23.5 | ||||||
| Brokerage commissions |
9.3 | 9.3 | ||||||
| Net gains on sales of residential mortgage loans |
10.0 | 5.5 | ||||||
| Net gains on sales of acquired loans |
0.7 | 7.9 | ||||||
| Bank-owned life insurance |
4.3 | 4.6 | ||||||
| Merchant services income, net |
3.6 | 3.2 | ||||||
| Net security gains |
— | 8.8 | ||||||
| Other non-interest income |
54.7 | 48.5 | ||||||
|
|
|
|
|
|||||
| Total non-interest income |
229.5 | 235.9 | ||||||
|
|
|
|
|
|||||
| Non-interest expense: |
||||||||
| Compensation and benefits |
321.5 | 318.0 | ||||||
| Occupancy and equipment |
104.0 | 98.9 | ||||||
| Professional and outside service fees |
48.6 | 51.9 | ||||||
| Amortization of other acquisition-related intangibles |
20.1 | 18.9 | ||||||
| Merger-related expenses |
— | 29.6 | ||||||
| Other non-interest expense |
129.0 | 124.4 | ||||||
|
|
|
|
|
|||||
| Total non-interest expense (2) |
623.2 | 641.7 | ||||||
|
|
|
|
|
|||||
| Income before income tax expense |
272.7 | 225.1 | ||||||
| Income tax expense |
88.6 | 74.1 | ||||||
|
|
|
|
|
|||||
| Net income |
$ | 184.1 | $ | 151.0 | ||||
|
|
|
|
|
|||||
| Basic and diluted earnings per common share |
$ | 0.54 | $ | 0.43 | ||||
|
|
|
|
|
|||||
| (1) | See Financial Highlights footnote 1 on page 8. |
| (2) | In addition to merger-related expenses, total non-interest expense includes $9.8 million and $4.2 million of non-operating expenses for the nine months ended September 30, 2012 and 2011, respectively. See Non-GAAP financial measures and reconciliation to GAAP beginning on page 17. |
12
People’s United Financial, Inc.
AVERAGE BALANCE SHEET, INTEREST AND YIELD/RATE ANALYSIS (1)
| September 30, 2012 | June 30, 2012 (2) | September 30, 2011 (2) | ||||||||||||||||||||||||||||||||||
| Three months ended (dollars in millions) |
Average Balance |
Interest | Yield/ Rate |
Average Balance |
Interest | Yield/ Rate |
Average Balance |
Interest | Yield/ Rate |
|||||||||||||||||||||||||||
| Assets: |
||||||||||||||||||||||||||||||||||||
| Short-term investments |
$ | 107.7 | $ | — | 0.17 | % | $ | 561.6 | $ | 0.4 | 0.25 | % | $ | 755.9 | $ | 0.5 | 0.29 | % | ||||||||||||||||||
| Securities (3) |
3,607.7 | 21.5 | 2.38 | 2,964.4 | 19.1 | 2.58 | 2,976.3 | 22.2 | 2.99 | |||||||||||||||||||||||||||
| Loans held for sale |
31.4 | 0.5 | 6.05 | 25.9 | 0.4 | 6.63 | 25.6 | 0.4 | 5.80 | |||||||||||||||||||||||||||
| Loans: |
||||||||||||||||||||||||||||||||||||
| Commercial (4) |
7,737.6 | 93.1 | 4.81 | 7,493.5 | 93.0 | 4.97 | 7,102.3 | 97.3 | 5.48 | |||||||||||||||||||||||||||
| Commercial real estate (5) |
6,952.2 | 91.3 | 5.25 | 7,011.9 | 96.4 | 5.50 | 7,157.0 | 98.0 | 5.48 | |||||||||||||||||||||||||||
| Residential mortgage (6) |
3,874.6 | 37.1 | 3.83 | 3,806.6 | 35.8 | 3.76 | 3,356.4 | 34.5 | 4.10 | |||||||||||||||||||||||||||
| Consumer |
2,163.2 | 19.8 | 3.67 | 2,176.0 | 20.0 | 3.68 | 2,240.7 | 21.5 | 3.84 | |||||||||||||||||||||||||||
|
|
|
|
|
|
|
|
|
|
|
|
|
|
|
|
|
|
|
|||||||||||||||||||
| Total loans |
20,727.6 | 241.3 | 4.66 | 20,488.0 | 245.2 | 4.79 | 19,856.4 | 251.3 | 5.06 | |||||||||||||||||||||||||||
|
|
|
|
|
|
|
|
|
|
|
|
|
|
|
|
|
|
|
|||||||||||||||||||
| Total earning assets |
24,474.4 | $ | 263.3 | 4.30 | % | 24,039.9 | $ | 265.1 | 4.41 | % | 23,614.2 | $ | 274.4 | 4.65 | % | |||||||||||||||||||||
|
|
|
|
|
|
|
|
|
|
|
|
|
|||||||||||||||||||||||||
| Other assets |
3,759.9 | 3,713.2 | 3,740.5 | |||||||||||||||||||||||||||||||||
|
|
|
|
|
|
|
|||||||||||||||||||||||||||||||
| Total assets |
$ | 28,234.3 | $ | 27,753.1 | $ | 27,354.7 | ||||||||||||||||||||||||||||||
|
|
|
|
|
|
|
|||||||||||||||||||||||||||||||
| Liabilities and stockholders’ equity: |
||||||||||||||||||||||||||||||||||||
| Deposits: |
||||||||||||||||||||||||||||||||||||
| Non-interest-bearing |
$ | 4,724.6 | $ | — | — | % | $ | 4,596.5 | $ | — | — | % | $ | 4,094.5 | $ | — | — | % | ||||||||||||||||||
| Savings, interest-bearing checking and money market |
11,661.7 | 9.0 | 0.31 | 11,511.4 | 10.1 | 0.35 | 10,642.9 | 14.1 | 0.53 | |||||||||||||||||||||||||||
| Time |
4,985.9 | 13.1 | 1.05 | 5,081.8 | 13.5 | 1.06 | 5,522.0 | 14.4 | 1.04 | |||||||||||||||||||||||||||
|
|
|
|
|
|
|
|
|
|
|
|
|
|
|
|
|
|
|
|||||||||||||||||||
| Total deposits |
21,372.2 | 22.1 | 0.41 | 21,189.7 | 23.6 | 0.45 | 20,259.4 | 28.5 | 0.58 | |||||||||||||||||||||||||||
|
|
|
|
|
|
|
|
|
|
|
|
|
|
|
|
|
|
|
|||||||||||||||||||
| Borrowings: |
||||||||||||||||||||||||||||||||||||
| Retail repurchase agreements |
478.4 | 0.2 | 0.23 | 465.9 | 0.3 | 0.27 | 520.6 | 0.5 | 0.43 | |||||||||||||||||||||||||||
| Federal Home Loan Bank advances |
390.7 | 1.3 | 1.31 | 330.8 | 1.2 | 1.48 | 514.6 | 1.8 | 1.39 | |||||||||||||||||||||||||||
| Federal funds purchased |
295.9 | 0.2 | 0.23 | 10.5 | — | 0.21 | — | — | — | |||||||||||||||||||||||||||
| Other borrowings |
11.1 | 0.1 | 1.03 | 26.8 | 0.1 | 0.98 | 27.9 | 0.1 | 0.95 | |||||||||||||||||||||||||||
|
|
|
|
|
|
|
|
|
|
|
|
|
|
|
|
|
|
|
|||||||||||||||||||
| Total borrowings |
1,176.1 | 1.8 | 0.54 | 834.0 | 1.6 | 0.77 | 1,063.1 | 2.4 | 0.91 | |||||||||||||||||||||||||||
|
|
|
|
|
|
|
|
|
|
|
|
|
|
|
|
|
|
|
|||||||||||||||||||
| Subordinated notes and debentures |
160.3 | 1.6 | 4.07 | 160.0 | 1.6 | 4.05 | 176.0 | 3.1 | 6.86 | |||||||||||||||||||||||||||
|
|
|
|
|
|
|
|
|
|
|
|
|
|
|
|
|
|
|
|||||||||||||||||||
| Total funding liabilities |
22,708.6 | $ | 25.5 | 0.45 | % | 22,183.7 | $ | 26.8 | 0.48 | % | 21,498.5 | $ | 34.0 | 0.63 | % | |||||||||||||||||||||
|
|
|
|
|
|
|
|
|
|
|
|
|
|||||||||||||||||||||||||
| Other liabilities |
364.9 | 381.4 | 341.0 | |||||||||||||||||||||||||||||||||
|
|
|
|
|
|
|
|||||||||||||||||||||||||||||||
| Total liabilities |
23,073.5 | 22,565.1 | 21,839.5 | |||||||||||||||||||||||||||||||||
| Stockholders’ equity |
5,160.8 | 5,188.0 | 5,515.2 | |||||||||||||||||||||||||||||||||
|
|
|
|
|
|
|
|||||||||||||||||||||||||||||||
| Total liabilities and stockholders’ equity |
$ | 28,234.3 | $ | 27,753.1 | $ | 27,354.7 | ||||||||||||||||||||||||||||||
|
|
|
|
|
|
|
|||||||||||||||||||||||||||||||
| Net interest income/spread (7) |
$ | 237.8 | 3.85 | % | $ | 238.3 | 3.93 | % | $ | 240.4 | 4.02 | % | ||||||||||||||||||||||||
|
|
|
|
|
|
|
|
|
|
|
|
|
|||||||||||||||||||||||||
| Net interest margin |
3.89 | % | 3.96 | % | 4.07 | % | ||||||||||||||||||||||||||||||
|
|
|
|
|
|
|
|||||||||||||||||||||||||||||||
| Operating net interest margin (8) |
3.82 | % | 3.88 | % | 4.07 | % | ||||||||||||||||||||||||||||||
|
|
|
|
|
|
|
|||||||||||||||||||||||||||||||
| (1) | Average yields earned and rates paid are annualized. |
| (2) | See Financial Highlights footnote 1 on page 7. |
| (3) | Average balances and yields for securities available for sale are based on amortized cost. |
| (4) | Includes commercial and industrial loans and equipment financing loans. |
| (5) | Interest income for the three months ended September 30, 2012 and June 30, 2012 includes $3.3 million and $4.7 million, respectively, of cost recovery income; yield of 5.06% and 5.23%, respectively, without cost recovery income. |
| (6) | Interest income for the three months ended September 30, 2012 includes $0.8 million of cost recovery income; yield of 3.75% without cost recovery income. |
| (7) | The fully taxable equivalent adjustment was $3.0 million, $2.7 million and $2.7 million for the three months ended September 30, 2012, June 30, 2012 and September 30, 2011, respectively. |
| (8) | See Non-GAAP financial measures and reconciliation to GAAP beginning on page 17. |
13
People’s United Financial, Inc.
AVERAGE BALANCE SHEET, INTEREST AND YIELD/RATE ANALYSIS (1)
| September 30, 2012 | September 30, 2011 (2) | |||||||||||||||||||||||
| Nine months ended (dollars in millions) |
Average Balance |
Interest | Yield/ Rate |
Average Balance |
Interest | Yield/ Rate |
||||||||||||||||||
| Assets: |
||||||||||||||||||||||||
| Short-term investments |
$ | 400.7 | $ | 0.7 | 0.24 | % | $ | 705.8 | $ | 1.5 | 0.29 | % | ||||||||||||
| Securities purchased under agreements to resell |
— | — | — | 36.4 | 0.1 | 0.17 | ||||||||||||||||||
| Securities (3) |
3,109.4 | 59.3 | 2.54 | 3,109.3 | 67.2 | 2.88 | ||||||||||||||||||
| Loans held for sale |
32.1 | 1.4 | 5.77 | 31.5 | 1.4 | 5.96 | ||||||||||||||||||
| Loans: |
||||||||||||||||||||||||
| Commercial (4) |
7,535.6 | 280.7 | 4.97 | 6,199.1 | 258.4 | 5.56 | ||||||||||||||||||
| Commercial real estate (5) |
7,027.3 | 279.4 | 5.30 | 6,923.5 | 292.1 | 5.63 | ||||||||||||||||||
| Residential mortgage |
3,798.4 | 109.1 | 3.83 | 2,976.9 | 93.5 | 4.19 | ||||||||||||||||||
| Consumer |
2,180.2 | 60.5 | 3.71 | 2,176.6 | 63.0 | 3.86 | ||||||||||||||||||
|
|
|
|
|
|
|
|
|
|
|
|
|
|||||||||||||
| Total loans |
20,541.5 | 729.7 | 4.74 | 18,276.1 | 707.0 | 5.16 | ||||||||||||||||||
|
|
|
|
|
|
|
|
|
|
|
|
|
|||||||||||||
| Total earning assets |
24,083.7 | $ | 791.1 | 4.38 | % | 22,159.1 | $ | 777.2 | 4.68 | % | ||||||||||||||
|
|
|
|
|
|
|
|
|
|||||||||||||||||
| Other assets |
3,734.5 | 3,460.9 | ||||||||||||||||||||||
|
|
|
|
|
|||||||||||||||||||||
| Total assets |
$ | 27,818.2 | $ | 25,620.0 | ||||||||||||||||||||
|
|
|
|
|
|||||||||||||||||||||
| Liabilities and stockholders’ equity: |
||||||||||||||||||||||||
| Deposits: |
||||||||||||||||||||||||
| Non-interest-bearing |
$ | 4,576.5 | $ | — | — | % | $ | 3,915.0 | $ | — | — | % | ||||||||||||
| Savings, interest-bearing checking and money market |
11,454.0 | 30.1 | 0.35 | 9,676.5 | 38.6 | 0.53 | ||||||||||||||||||
| Time |
5,105.5 | 38.7 | 1.01 | 5,226.6 | 42.9 | 1.09 | ||||||||||||||||||
|
|
|
|
|
|
|
|
|
|
|
|
|
|||||||||||||
| Total deposits |
21,136.0 | 68.8 | 0.43 | 18,818.1 | 81.5 | 0.58 | ||||||||||||||||||
|
|
|
|
|
|
|
|
|
|
|
|
|
|||||||||||||
| Borrowings: |
||||||||||||||||||||||||
| Retail repurchase agreements |
479.6 | 1.0 | 0.27 | 472.8 | 1.5 | 0.43 | ||||||||||||||||||
| Federal Home Loan Bank advances |
351.3 | 3.7 | 1.42 | 497.7 | 5.5 | 1.48 | ||||||||||||||||||
| Federal funds purchased |
104.6 | 0.2 | 0.23 | 8.5 | — | 0.11 | ||||||||||||||||||
| Other borrowings |
21.6 | 0.2 | 0.99 | 28.3 | 0.3 | 0.93 | ||||||||||||||||||
|
|
|
|
|
|
|
|
|
|
|
|
|
|||||||||||||
| Total borrowings |
957.1 | 5.1 | 0.70 | 1,007.3 | 7.3 | 0.96 | ||||||||||||||||||
|
|
|
|
|
|
|
|
|
|
|
|
|
|||||||||||||
| Subordinated notes and debentures |
160.0 | 5.4 | 4.53 | 174.0 | 9.3 | 7.09 | ||||||||||||||||||
|
|
|
|
|
|
|
|
|
|
|
|
|
|||||||||||||
| Total funding liabilities |
22,253.1 | $ | 79.3 | 0.48 | % | 19,999.4 | $ | 98.1 | 0.65 | % | ||||||||||||||
|
|
|
|
|
|
|
|
|
|||||||||||||||||
| Other liabilities |
376.6 | 326.8 | ||||||||||||||||||||||
|
|
|
|
|
|||||||||||||||||||||
| Total liabilities |
22,629.7 | 20,326.2 | ||||||||||||||||||||||
| Stockholders’ equity |
5,188.5 | 5,293.8 | ||||||||||||||||||||||
|
|
|
|
|
|||||||||||||||||||||
| Total liabilities and stockholders’ equity |
$ | 27,818.2 | $ | 25,620.0 | ||||||||||||||||||||
|
|
|
|
|
|||||||||||||||||||||
| Net interest income/spread (6) |
$ | 711.8 | 3.90 | % | $ | 679.1 | 4.03 | % | ||||||||||||||||
|
|
|
|
|
|
|
|
|
|||||||||||||||||
| Net interest margin |
3.94 | % | 4.09 | % | ||||||||||||||||||||
|
|
|
|
|
|||||||||||||||||||||
| Operating net interest margin (7) |
3.89 | % | 4.02 | % | ||||||||||||||||||||
|
|
|
|
|
|||||||||||||||||||||
| (1) | Average yields earned and rates paid are annualized. |
| (2) | See Financial Highlights footnote 1 on page 9. |
| (3) | Average balances and yields for securities available for sale are based on amortized cost. |
| (4) | Includes commercial and industrial loans and equipment financing loans. |
| (5) | Interest income for the nine months ended September 30, 2012 includes $8.0 million of cost recovery income; yield of 5.15% without cost recovery income. |
| (6) | The fully taxable equivalent adjustment was $8.2 million and $5.2 million for the nine months ended September 30, 2012 and 2011, respectively. |
| (7) | See Non-GAAP financial measures and reconciliation to GAAP beginning on page 17. |
14
People’s United Financial, Inc.
Loans acquired in connection with acquisitions have been recorded at fair value based on an initial estimate of expected cash flows, including a reduction for estimated credit losses, and without carryover of the respective portfolio’s historical allowance for loan losses. A decrease in expected cash flows in subsequent periods may indicate that a loan is impaired, which would require the establishment of an allowance for loan losses. As such, selected asset quality metrics have been highlighted to distinguish between the ‘originated’ portfolio and the ‘acquired’ portfolio.
NON-PERFORMING ASSETS
| (dollars in millions) |
Sept. 30, 2012 |
June 30, 2012 |
March 31, 2012 |
Dec. 31, 2011 |
Sept. 30, 2011 |
|||||||||||||||
| Originated non-performing loans: |
||||||||||||||||||||
| Commercial Banking: |
||||||||||||||||||||
| Commercial real estate |
$ | 88.5 | $ | 90.5 | $ | 97.3 | $ | 106.7 | $ | 91.0 | ||||||||||
| Commercial and industrial |
64.6 | 62.2 | 63.0 | 59.2 | 49.2 | |||||||||||||||
| Equipment financing |
37.4 | 37.3 | 39.6 | 42.9 | 37.9 | |||||||||||||||
|
|
|
|
|
|
|
|
|
|
|
|||||||||||
| Total |
190.5 | 190.0 | 199.9 | 208.8 | 178.1 | |||||||||||||||
|
|
|
|
|
|
|
|
|
|
|
|||||||||||
| Retail: |
||||||||||||||||||||
| Residential mortgage |
60.6 | 63.7 | 70.0 | 68.9 | 65.5 | |||||||||||||||
| Home equity |
14.6 | 13.7 | 15.3 | 15.8 | 14.2 | |||||||||||||||
| Other consumer |
0.3 | 0.2 | 0.2 | 0.3 | 0.5 | |||||||||||||||
|
|
|
|
|
|
|
|
|
|
|
|||||||||||
| Total |
75.5 | 77.6 | 85.5 | 85.0 | 80.2 | |||||||||||||||
|
|
|
|
|
|
|
|
|
|
|
|||||||||||
| Total originated non-performing loans (1) |
266.0 | 267.6 | 285.4 | 293.8 | 258.3 | |||||||||||||||
| REO |
19.8 | 19.7 | 21.9 | 26.8 | 27.7 | |||||||||||||||
| Repossessed assets |
8.2 | 7.2 | 9.1 | 16.1 | 19.2 | |||||||||||||||
|
|
|
|
|
|
|
|
|
|
|
|||||||||||
| Total non-performing assets |
$ | 294.0 | $ | 294.5 | $ | 316.4 | $ | 336.7 | $ | 305.2 | ||||||||||
|
|
|
|
|
|
|
|
|
|
|
|||||||||||
| Acquired non-performing loans (contractual amount) (2) |
$ | 202.0 | $ | 236.6 | $ | 247.2 | $ | 249.0 | $ | 241.6 | ||||||||||
|
|
|
|
|
|
|
|
|
|
|
|||||||||||
| Originated non-performing loans as a percentage of originated loans |
1.45 | % | 1.52 | % | 1.67 | % | 1.75 | % | 1.60 | % | ||||||||||
| Non-performing assets as a percentage of: |
||||||||||||||||||||
| Originated loans, REO and repossessed assets |
1.59 | 1.67 | 1.85 | 2.00 | 1.88 | |||||||||||||||
| Tangible stockholders’ equity and originated allowance for loan losses |
9.41 | 9.37 | 9.96 | 10.47 | 9.22 | |||||||||||||||
| (1) | Reported net of government guarantees totaling $14.1 million at Sept. 30, 2012, $14.8 million at June 30, 2012, $15.6 million at March 31, 2012, $12.1 million at Dec. 31, 2011 and $11.3 million at Sept. 30, 2011. |
| (2) | Represents acquired loans that meet People’s United Financial’s definition of a non-performing loan but are not, under the accounting model for acquired loans, subject to classification as non-accrual in the same manner as originated loans. Because acquired loans are initially recorded at an amount estimated to be collectible, losses on such loans, when incurred, are first applied against the non-accretable difference established in purchase accounting and then to any allowance for loan losses recognized subsequent to acquisition. |
15
People’s United Financial, Inc.
PROVISION AND ALLOWANCE FOR LOAN LOSSES
| Three Months Ended | ||||||||||||||||||||
| (dollars in millions) |
Sept. 30, 2012 |
June 30, 2012 |
March 31, 2012 |
Dec. 31, 2011 |
Sept. 30, 2011 |
|||||||||||||||
| Allowance for loan losses on originated loans: |
||||||||||||||||||||
| Balance at beginning of period |
$ | 175.5 | $ | 175.5 | $ | 175.5 | $ | 177.0 | $ | 176.0 | ||||||||||
| Charge-offs |
(11.1 | ) | (12.3 | ) | (12.9 | ) | (15.7 | ) | (14.6 | ) | ||||||||||
| Recoveries |
1.7 | 1.5 | 1.7 | 0.9 | 1.2 | |||||||||||||||
|
|
|
|
|
|
|
|
|
|
|
|||||||||||
| Net loan charge-offs |
(9.4 | ) | (10.8 | ) | (11.2 | ) | (14.8 | ) | (13.4 | ) | ||||||||||
| Provision for loan losses |
9.4 | 10.8 | 11.2 | 13.3 | 14.4 | |||||||||||||||
|
|
|
|
|
|
|
|
|
|
|
|||||||||||
| Balance at end of period |
175.5 | 175.5 | 175.5 | 175.5 | 177.0 | |||||||||||||||
|
|
|
|
|
|
|
|
|
|
|
|||||||||||
| Allowance for loan losses on acquired loans: |
||||||||||||||||||||
| Balance at beginning of period |
4.8 | 7.7 | 7.4 | — | — | |||||||||||||||
| Charge-offs |
— | (2.7 | ) | — | — | — | ||||||||||||||
| Provision for loan losses |
5.7 | (0.2 | ) | 0.3 | 7.4 | — | ||||||||||||||
|
|
|
|
|
|
|
|
|
|
|
|||||||||||
| Balance at end of period |
10.5 | 4.8 | 7.7 | 7.4 | — | |||||||||||||||
|
|
|
|
|
|
|
|
|
|
|
|||||||||||
| Total allowance for loan losses |
$ | 186.0 | $ | 180.3 | $ | 183.2 | $ | 182.9 | $ | 177.0 | ||||||||||
|
|
|
|
|
|
|
|
|
|
|
|||||||||||
| Originated allowance for loan losses as a percentage of: |
||||||||||||||||||||
| Originated loans |
0.95 | % | 1.00 | % | 1.03 | % | 1.05 | % | 1.09 | % | ||||||||||
| Originated non-performing loans |
66.0 | 65.6 | 61.5 | 59.7 | 68.5 | |||||||||||||||
| Commercial banking originated allowance for loan losses as a percentage of originated commercial banking loans |
1.22 | 1.29 | 1.34 | 1.39 | 1.48 | |||||||||||||||
| Retail originated allowance for loan losses as a percentage of originated retail loans |
0.35 | 0.37 | 0.34 | 0.29 | 0.26 | |||||||||||||||
|
|
|
|
|
|
|
|
|
|
|
|||||||||||
NET LOAN CHARGE-OFFS
| Three Months Ended | ||||||||||||||||||||
| (dollars in millions) |
Sept. 30, 2012 |
June 30, 2012 |
March 31, 2012 |
Dec. 31, 2011 |
Sept. 30, 2011 |
|||||||||||||||
| Commercial Banking: |
||||||||||||||||||||
| Commercial real estate |
$ | 3.5 | $ | 6.1 | $ | 5.0 | $ | 3.9 | $ | 4.6 | ||||||||||
| Commercial and industrial |
2.6 | 3.1 | 1.6 | 3.4 | 4.4 | |||||||||||||||
| Equipment financing |
1.1 | 1.2 | 0.6 | 4.5 | 0.8 | |||||||||||||||
|
|
|
|
|
|
|
|
|
|
|
|||||||||||
| Total |
7.2 | 10.4 | 7.2 | 11.8 | 9.8 | |||||||||||||||
|
|
|
|
|
|
|
|
|
|
|
|||||||||||
| Retail: |
||||||||||||||||||||
| Residential mortgage |
1.3 | 1.4 | 2.0 | 1.6 | 2.1 | |||||||||||||||
| Home equity |
0.6 | 1.4 | 1.7 | 0.7 | 1.1 | |||||||||||||||
| Other consumer |
0.3 | 0.3 | 0.3 | 0.7 | 0.4 | |||||||||||||||
|
|
|
|
|
|
|
|
|
|
|
|||||||||||
| Total |
2.2 | 3.1 | 4.0 | 3.0 | 3.6 | |||||||||||||||
|
|
|
|
|
|
|
|
|
|
|
|||||||||||
| Total |
$ | 9.4 | $ | 13.5 | $ | 11.2 | $ | 14.8 | $ | 13.4 | ||||||||||
|
|
|
|
|
|
|
|
|
|
|
|||||||||||
| Net loan charge-offs to average loans (annualized) |
0.18 | % | 0.26 | % | 0.22 | % | 0.29 | % | 0.27 | % | ||||||||||
|
|
|
|
|
|
|
|
|
|
|
|||||||||||
16
People’s United Financial, Inc.
NON-GAAP FINANCIAL MEASURES AND RECONCILIATION TO GAAP
In addition to evaluating People’s United Financial’s results of operations in accordance with U.S. generally accepted accounting principles (“GAAP”), management routinely supplements their evaluation with an analysis of certain non-GAAP financial measures, such as the efficiency and tangible equity ratios, tangible book value per share and operating earnings metrics. Management believes these non-GAAP financial measures provide information useful to investors in understanding People’s United Financial’s underlying operating performance and trends, and facilitates comparisons with the performance of other banks and thrifts. Further, the efficiency ratio and operating earnings metrics are used by management in its assessment of financial performance, including non-interest expense control, while the tangible equity ratio and tangible book value per share are used to analyze the relative strength of People’s United Financial’s capital position.
The efficiency ratio, which represents an approximate measure of the cost required by People’s United Financial to generate a dollar of revenue, is the ratio of (i) total non-interest expense (excluding goodwill impairment charges, amortization of other acquisition-related intangibles, losses on real estate assets and non-recurring expenses) (the numerator) to (ii) net interest income on a fully taxable equivalent (“FTE”) basis plus total non-interest income (including the FTE adjustment on bank-owned life insurance (“BOLI”) income, and excluding gains and losses on sales of assets other than residential mortgage loans, and non-recurring income) (the denominator). People’s United Financial generally considers an item of income or expense to be non-recurring if it is not similar to an item of income or expense of a type incurred within the last two years and is not similar to an item of income or expense of a type reasonably expected to be incurred within the following two years.
Operating earnings exclude from net income those items that management considers to be of such a non-recurring or infrequent nature that, by excluding such items (net of income taxes), People’s United Financial’s results can be measured and assessed on a more consistent basis from period to period. Items excluded from operating earnings, which include, but are not limited to, merger-related expenses, charges related to executive-level management separation costs, severance-related costs and writedowns of banking house assets, are generally also excluded when calculating the efficiency ratio. Operating earnings per share is calculated by dividing operating earnings by the weighted average number of dilutive common shares outstanding for the respective period. Operating return on average assets is calculated by dividing operating earnings (annualized) by average assets. Operating return on average tangible stockholders’ equity is calculated by dividing operating earnings (annualized) by average tangible stockholders’ equity. The operating dividend payout ratio is calculated by dividing dividends paid by operating earnings for the respective period.
Operating net interest margin excludes from the net interest margin those items that management considers to be of such a discrete nature that, by excluding such items, People’s United Financial’s net interest margin can be measured and assessed on a more consistent basis from period to period. Items excluded from operating net interest margin include cost recovery income on acquired loans and changes in the accretable yield on acquired loans stemming from periodic cash flow reassessments. Operating net interest margin is calculated by dividing operating net interest income (annualized) by average earning assets.
The tangible equity ratio is the ratio of (i) tangible stockholders’ equity (total stockholders’ equity less goodwill and other acquisition-related intangibles) (the numerator) to (ii) tangible assets (total assets less goodwill and other acquisition-related intangibles) (the denominator). Tangible book value per share is calculated by dividing tangible stockholders’ equity by common shares (total common shares issued, less common shares classified as treasury shares and unallocated Employee Stock Ownership Plan (“ESOP”) common shares).
In light of diversity in presentation among financial institutions, the methodologies used by People’s United Financial for determining the non-GAAP financial measures discussed above may differ from those used by other financial institutions.
17
People’s United Financial, Inc.
NON-GAAP FINANCIAL MEASURES AND RECONCILIATION TO GAAP - continued
EFFICIENCY RATIO
| Three Months Ended | Nine Months Ended | |||||||||||||||||||||||||||
| (dollars in millions) |
Sept. 30, 2012 |
June 30, 2012 |
March 31, 2012 |
Dec. 31, 2011 |
Sept. 30, 2011 |
Sept. 30, 2012 |
Sept. 30, 2011 |
|||||||||||||||||||||
| Total non-interest expense |
$ | 208.9 | $ | 205.7 | $ | 208.6 | $ | 230.2 | $ | 231.9 | $ | 623.2 | $ | 641.7 | ||||||||||||||
| Adjustments: |
||||||||||||||||||||||||||||
| Amortization of other acquisition-related intangibles |
(6.7 | ) | (6.8 | ) | (6.6 | ) | (6.9 | ) | (7.0 | ) | (20.1 | ) | (18.9 | ) | ||||||||||||||
| Severance-related costs |
(0.9 | ) | (1.1 | ) | (2.4 | ) | (3.9 | ) | (1.4 | ) | (4.4 | ) | (1.4 | ) | ||||||||||||||
| Merger-related expenses |
— | — | — | (13.3 | ) | (20.1 | ) | — | (29.6 | ) | ||||||||||||||||||
| Executive-level separation costs |
— | — | — | (1.0 | ) | — | — | (2.8 | ) | |||||||||||||||||||
| Writedowns of banking house assets |
— | — | — | (4.8 | ) | — | — | — | ||||||||||||||||||||
| Other (1) |
(5.0 | ) | (4.6 | ) | (3.0 | ) | (4.0 | ) | (2.3 | ) | (12.6 | ) | (6.3 | ) | ||||||||||||||
|
|
|
|
|
|
|
|
|
|
|
|
|
|
|
|||||||||||||||
| Total |
$ | 196.3 | $ | 193.2 | $ | 196.6 | $ | 196.3 | $ | 201.1 | $ | 586.1 | $ | 582.7 | ||||||||||||||
|
|
|
|
|
|
|
|
|
|
|
|
|
|
|
|||||||||||||||
| Net interest income (FTE basis) |
$ | 237.8 | $ | 238.3 | $ | 235.7 | $ | 242.2 | $ | 240.4 | $ | 711.8 | $ | 679.1 | ||||||||||||||
| Total non-interest income |
81.4 | 75.7 | 72.4 | 71.7 | 84.7 | 229.5 | 235.9 | |||||||||||||||||||||
|
|
|
|
|
|
|
|
|
|
|
|
|
|
|
|||||||||||||||
| Total revenues |
319.2 | 314.0 | 308.1 | 313.9 | 325.1 | 941.3 | 915.0 | |||||||||||||||||||||
| Adjustments: |
||||||||||||||||||||||||||||
| BOLI FTE adjustment |
0.7 | 0.6 | 0.9 | 0.8 | 0.9 | 2.2 | 2.3 | |||||||||||||||||||||
| Net security gains |
— | — | — | — | (8.6 | ) | — | (8.8 | ) | |||||||||||||||||||
| Net (gains) losses on sales of acquired loans |
— | (0.7 | ) | — | 0.4 | 4.8 | (0.7 | ) | (7.9 | ) | ||||||||||||||||||
| Other (2) |
— | — | — | (0.1 | ) | 0.1 | — | 2.3 | ||||||||||||||||||||
|
|
|
|
|
|
|
|
|
|
|
|
|
|
|
|||||||||||||||
| Total |
$ | 319.9 | $ | 313.9 | $ | 309.0 | $ | 315.0 | $ | 322.3 | $ | 942.8 | $ | 902.9 | ||||||||||||||
|
|
|
|
|
|
|
|
|
|
|
|
|
|
|
|||||||||||||||
| Efficiency ratio |
61.4 | % | 61.5 | % | 63.6 | % | 62.3 | % | 62.4 | % | 62.2 | % | 64.5 | % | ||||||||||||||
|
|
|
|
|
|
|
|
|
|
|
|
|
|
|
|||||||||||||||
| (1) | Items classified as “other” and deducted from non-interest expense include, as applicable, certain franchise taxes, real estate |
| owned | expenses, contract termination costs and non-recurring expenses. |
| (2) | Items classified as “other” and added to (deducted from) total revenues include, as applicable, asset write-offs, gains associated with the sale of branch locations and mortgage servicing rights, and interest on an income tax refund. |
18
People’s United Financial, Inc.
NON-GAAP FINANCIAL MEASURES AND RECONCILIATION TO GAAP - continued
OPERATING EARNINGS
| Three Months Ended | Nine Months Ended | |||||||||||||||||||||||||||
| (dollars in millions, except per share data) |
Sept. 30, 2012 |
June 30, 2012 |
March 31, 2012 |
Dec. 31, 2011 |
Sept. 30, 2011 |
Sept. 30, 2012 |
Sept. 30, 2011 |
|||||||||||||||||||||
| Net income, as reported |
$ | 62.2 | $ | 64.6 | $ | 57.3 | $ | 41.4 | $ | 51.5 | $ | 184.1 | $ | 151.0 | ||||||||||||||
|
|
|
|
|
|
|
|
|
|
|
|
|
|
|
|||||||||||||||
| Adjustments to arrive at operating earnings: |
||||||||||||||||||||||||||||
| Severance-related costs |
0.9 | 1.1 | 2.4 | 3.9 | 1.4 | 4.4 | 1.4 | |||||||||||||||||||||
| Other non-operating expenses |
2.3 | 2.5 | 0.6 | — | — | 5.4 | — | |||||||||||||||||||||
| Merger-related expenses |
— | — | — | 13.3 | 20.1 | — | 29.6 | |||||||||||||||||||||
| Executive-level separation costs |
— | — | — | 1.0 | — | — | 2.8 | |||||||||||||||||||||
| Writedowns of banking house assets |
— | — | — | 4.8 | — | — | — | |||||||||||||||||||||
|
|
|
|
|
|
|
|
|
|
|
|
|
|
|
|||||||||||||||
| Total pre-tax adjustments |
3.2 | 3.6 | 3.0 | 23.0 | 21.5 | 9.8 | 33.8 | |||||||||||||||||||||
|
|
|
|
|
|
|
|
|
|
|
|
|
|
|
|||||||||||||||
| Tax effect |
(1.0 | ) | (1.2 | ) | (1.0 | ) | (7.3 | ) | (7.1 | ) | (3.2 | ) | (11.2 | ) | ||||||||||||||
|
|
|
|
|
|
|
|
|
|
|
|
|
|
|
|||||||||||||||
| Total adjustments, net of tax |
2.2 | 2.4 | 2.0 | 15.7 | 14.4 | 6.6 | 22.6 | |||||||||||||||||||||
|
|
|
|
|
|
|
|
|
|
|
|
|
|
|
|||||||||||||||
| Operating earnings |
$ | 64.4 | $ | 67.0 | $ | 59.3 | $ | 57.1 | $ | 65.9 | $ | 190.7 | $ | 173.6 | ||||||||||||||
|
|
|
|
|
|
|
|
|
|
|
|
|
|
|
|||||||||||||||
| Earnings per share, as reported |
$ | 0.18 | $ | 0.19 | $ | 0.17 | $ | 0.12 | $ | 0.14 | $ | 0.54 | $ | 0.43 | ||||||||||||||
|
|
|
|
|
|
|
|
|
|
|
|
|
|
|
|||||||||||||||
| Adjustments to arrive at operating earnings per share: |
||||||||||||||||||||||||||||
| Severance-related costs |
— | — | 0.01 | 0.01 | — | 0.01 | — | |||||||||||||||||||||
| Other non-operating expenses |
0.01 | 0.01 | — | — | — | 0.02 | — | |||||||||||||||||||||
| Merger-related expenses |
— | — | — | 0.03 | 0.04 | — | 0.06 | |||||||||||||||||||||
| Executive-level separation costs |
— | — | — | — | — | — | — | |||||||||||||||||||||
| Writedowns of banking house assets |
— | — | — | 0.01 | — | — | — | |||||||||||||||||||||
|
|
|
|
|
|
|
|
|
|
|
|
|
|
|
|||||||||||||||
| Total adjustments per share |
0.01 | 0.01 | 0.01 | 0.05 | 0.04 | 0.03 | 0.06 | |||||||||||||||||||||
|
|
|
|
|
|
|
|
|
|
|
|
|
|
|
|||||||||||||||
| Operating earnings per share |
$ | 0.19 | $ | 0.20 | $ | 0.18 | $ | 0.17 | $ | 0.18 | $ | 0.57 | $ | 0.49 | ||||||||||||||
|
|
|
|
|
|
|
|
|
|
|
|
|
|
|
|||||||||||||||
| Average total assets |
$ | 28,234 | $ | 27,753 | $ | 27,463 | $ | 27,285 | $ | 27,355 | $ | 27,818 | $ | 25,620 | ||||||||||||||
|
|
|
|
|
|
|
|
|
|
|
|
|
|
|
|||||||||||||||
| Operating return on average assets (annualized) |
0.91 | % | 0.97 | % | 0.86 | % | 0.84 | % | 0.96 | % | 0.91 | % | 0.90 | % | ||||||||||||||
|
|
|
|
|
|
|
|
|
|
|
|
|
|
|
|||||||||||||||
OPERATING NET INTEREST MARGIN
| Three Months Ended | Nine Months Ended | |||||||||||||||||||||||||||
| (dollars in millions) |
Sept. 30, 2012 |
June 30, 2012 |
March 31, 2012 |
Dec. 31, 2011 |
Sept. 30, 2011 |
Sept. 30, 2012 |
Sept. 30, 2011 |
|||||||||||||||||||||
| Net interest income (FTE basis) |
$ | 237.8 | $ | 238.3 | $ | 235.7 | $ | 242.2 | $ | 240.4 | $ | 711.8 | $ | 679.1 | ||||||||||||||
|
|
|
|
|
|
|
|
|
|
|
|
|
|
|
|||||||||||||||
| Adjustments to arrive at operating net interest income: |
||||||||||||||||||||||||||||
| Cost recovery income |
(4.1 | ) | (4.7 | ) | — | (5.0 | ) | — | (8.8 | ) | — | |||||||||||||||||
| Changes in accretable yield |
— | — | — | — | — | — | (11.2 | ) | ||||||||||||||||||||
|
|
|
|
|
|
|
|
|
|
|
|
|
|
|
|||||||||||||||
| Total adjustments |
(4.1 | ) | (4.7 | ) | — | (5.0 | ) | — | (8.8 | ) | (11.2 | ) | ||||||||||||||||
|
|
|
|
|
|
|
|
|
|
|
|
|
|
|
|||||||||||||||
| Operating net interest income |
$ | 233.7 | $ | 233.6 | $ | 235.7 | $ | 237.2 | $ | 240.4 | $ | 703.0 | $ | 667.9 | ||||||||||||||
|
|
|
|
|
|
|
|
|
|
|
|
|
|
|
|||||||||||||||
| Net interest margin, as reported (1) |
3.89 | % | 3.96 | % | 3.97 | % | 4.12 | % | 4.07 | % | 3.94 | % | 4.09 | % | ||||||||||||||
|
|
|
|
|
|
|
|
|
|
|
|
|
|
|
|||||||||||||||
| Adjustments to arrive at operating net interest margin: (1) |
||||||||||||||||||||||||||||
| Cost recovery income |
(0.07 | ) | (0.08 | ) | — | (0.09 | ) | — | (0.05 | ) | — | |||||||||||||||||
| Changes in accretable yield |
— | — | — | — | — | — | (0.07 | ) | ||||||||||||||||||||
|
|
|
|
|
|
|
|
|
|
|
|
|
|
|
|||||||||||||||
| Total adjustments |
(0.07 | ) | (0.08 | ) | — | (0.09 | ) | — | (0.05 | ) | (0.07 | ) | ||||||||||||||||
|
|
|
|
|
|
|
|
|
|
|
|
|
|
|
|||||||||||||||
| Operating net interest margin (1) |
3.82 | % | 3.88 | % | 3.97 | % | 4.03 | % | 4.07 | % | 3.89 | % | 4.02 | % | ||||||||||||||
|
|
|
|
|
|
|
|
|
|
|
|
|
|
|
|||||||||||||||
| Total earning assets |
$ | 24,474 | $ | 24,040 | $ | 23,733 | $ | 23,542 | $ | 23,614 | $ | 24,084 | $ | 22,159 | ||||||||||||||
|
|
|
|
|
|
|
|
|
|
|
|
|
|
|
|||||||||||||||
| (1) | Annualized |
19
People’s United Financial, Inc.
NON-GAAP FINANCIAL MEASURES AND RECONCILIATION TO GAAP - continued
OPERATING RETURN ON AVERAGE TANGIBLE STOCKHOLDERS’ EQUITY
| Three Months Ended | Nine Months Ended | |||||||||||||||||||||||||||
| (dollars in millions) |
Sept. 30, 2012 |
June 30, 2012 |
March 31, 2012 |
Dec. 31, 2011 |
Sept. 30, 2011 |
Sept. 30, 2012 |
Sept. 30, 2011 |
|||||||||||||||||||||
| Operating earnings |
$ | 64.4 | $ | 67.0 | $ | 59.3 | $ | 57.1 | $ | 65.9 | $ | 190.7 | $ | 173.6 | ||||||||||||||
|
|
|
|
|
|
|
|
|
|
|
|
|
|
|
|||||||||||||||
| Average stockholders’ equity |
$ | 5,161 | $ | 5,188 | $ | 5,217 | $ | 5,302 | $ | 5,515 | $ | 5,188 | $ | 5,294 | ||||||||||||||
| Less: Average goodwill and average other acquisition-related intangibles |
2,164 | 2,166 | 2,171 | 2,148 | 2,154 | 2,167 | 2,021 | |||||||||||||||||||||
|
|
|
|
|
|
|
|
|
|
|
|
|
|
|
|||||||||||||||
| Average tangible stockholders’ equity |
$ | 2,997 | $ | 3,022 | $ | 3,046 | $ | 3,154 | $ | 3,361 | $ | 3,021 | $ | 3,273 | ||||||||||||||
|
|
|
|
|
|
|
|
|
|
|
|
|
|
|
|||||||||||||||
| Operating return on average tangible stockholders’ equity (annualized) |
8.6 | % | 8.9 | % | 7.8 | % | 7.2 | % | 7.8 | % | 8.4 | % | 7.1 | % | ||||||||||||||
|
|
|
|
|
|
|
|
|
|
|
|
|
|
|
|||||||||||||||
OPERATING DIVIDEND PAYOUT RATIO
| Three Months Ended | Nine Months Ended | |||||||||||||||||||||||||||
| (dollars in millions) |
Sept. 30, 2012 |
June 30, 2012 |
March 31, 2012 |
Dec. 31, 2011 |
Sept. 30, 2011 |
Sept. 30, 2012 |
Sept. 30, 2011 |
|||||||||||||||||||||
| Dividends paid |
$ | 54.3 | $ | 55.1 | $ | 54.9 | $ | 54.8 | $ | 57.4 | $ | 164.3 | $ | 166.1 | ||||||||||||||
|
|
|
|
|
|
|
|
|
|
|
|
|
|
|
|||||||||||||||
| Operating earnings |
$ | 64.4 | $ | 67.0 | $ | 59.3 | $ | 57.1 | $ | 65.9 | $ | 190.7 | $ | 173.6 | ||||||||||||||
|
|
|
|
|
|
|
|
|
|
|
|
|
|
|
|||||||||||||||
| Operating dividend payout ratio |
84.3 | % | 82.2 | % | 92.6 | % | 96.0 | % | 87.1 | % | 86.2 | % | 95.7 | % | ||||||||||||||
|
|
|
|
|
|
|
|
|
|
|
|
|
|
|
|||||||||||||||
TANGIBLE EQUITY RATIO
| (dollars in millions) |
Sept. 30, 2012 |
June 30, 2012 |
March 31, 2012 |
Dec. 31, 2011 |
Sept. 30, 2011 |
|||||||||||||||
| Total stockholders’ equity |
$ | 5,107 | $ | 5,135 | $ | 5,170 | $ | 5,215 | $ | 5,282 | ||||||||||
| Less: Goodwill and other acquisition-related intangibles |
2,160 | 2,166 | 2,169 | 2,174 | 2,151 | |||||||||||||||
|
|
|
|
|
|
|
|
|
|
|
|||||||||||
| Tangible stockholders’ equity |
$ | 2,947 | $ | 2,969 | $ | 3,001 | $ | 3,041 | $ | 3,131 | ||||||||||
|
|
|
|
|
|
|
|
|
|
|
|||||||||||
| Total assets |
$ | 28,576 | $ | 28,137 | $ | 27,791 | $ | 27,553 | $ | 27,200 | ||||||||||
| Less: Goodwill and other acquisition-related intangibles |
2,160 | 2,166 | 2,169 | 2,174 | 2,151 | |||||||||||||||
|
|
|
|
|
|
|
|
|
|
|
|||||||||||
| Tangible assets |
$ | 26,416 | $ | 25,971 | $ | 25,622 | $ | 25,379 | $ | 25,049 | ||||||||||
|
|
|
|
|
|
|
|
|
|
|
|||||||||||
| Tangible equity ratio |
11.2 | % | 11.4 | % | 11.7 | % | 12.0 | % | 12.5 | % | ||||||||||
|
|
|
|
|
|
|
|
|
|
|
|||||||||||
TANGIBLE BOOK VALUE PER SHARE
| (in millions, except per share data) |
Sept. 30, 2012 |
June 30, 2012 |
March 31, 2012 |
Dec. 31, 2011 |
Sept. 30, 2011 |
|||||||||||||||
| Tangible stockholders’ equity |
$ | 2,947 | $ | 2,969 | $ | 3,001 | $ | 3,041 | $ | 3,131 | ||||||||||
|
|
|
|
|
|
|
|
|
|
|
|||||||||||
| Common shares issued |
395.88 | 395.87 | 395.84 | 395.42 | 395.46 | |||||||||||||||
| Less: Shares classified as treasury shares |
51.48 | 47.00 | 42.49 | 38.03 | 38.07 | |||||||||||||||
| Unallocated ESOP shares |
8.45 | 8.54 | 8.62 | 8.71 | 8.80 | |||||||||||||||
|
|
|
|
|
|
|
|
|
|
|
|||||||||||
| Common shares |
335.95 | 340.33 | 344.73 | 348.68 | 348.59 | |||||||||||||||
|
|
|
|
|
|
|
|
|
|
|
|||||||||||
| Tangible book value per share |
$ | 8.77 | $ | 8.72 | $ | 8.71 | $ | 8.72 | $ | 8.98 | ||||||||||
|
|
|
|
|
|
|
|
|
|
|
|||||||||||
20