 |
Asanko Gold Inc. NI 43-101 Technical Report on Asanko Gold Mine, Ghana |
|
OFFICE LOCATIONS
Level 6, 130 Stirling Street Tel: +61 8 9213 9213
104 Melbourne Street Tel: +61 7 3026 6666
Henley House, Greenacres Office Park, PO Box 2613, Parklands 2121 Tel: +27 11 782 2379
www.snowdengroup.com
|
This report was prepared as a National Instrument 43-101 Standards of Disclosure for Mineral Projects Technical Report for Asanko Gold Inc. ("Asanko Gold") by Snowden Mining Industry Consultants Pty Limited (Snowden) and the Authors. The quality of information, conclusions, and estimates contained herein are consistent with the quality of effort involved in Snowden's and the Authors' services. The information, conclusions, and estimates contained herein are based on: (i) information available at the time of preparation; (ii) data supplied by outside sources; and (iii) the assumptions, conditions, and qualifications set forth in this Technical Report. This report is intended for use by Asanko Gold subject to the terms and conditions of its contract with Snowden and relevant securities legislation. The contract permits Asanko Gold to file this report as a Technical Report with Canadian Securities Administrators/regulatory authorities pursuant to National Instrument 43-101. © 2020 All rights are reserved. No part of this document may be reproduced, stored in a retrieval system, or transmitted in any form or by any means, electronic, mechanical, photocopying, recording or otherwise, without the prior written permission of Snowden. |
||
|
Issued by: |
|
Johannesburg Office |
|
|
Doc ref: |
|
Asanko Gold NI 43-101 |
|
|
|
|
|
|
|
Number of copies: |
|
|
|
|
Snowden: |
|
2 |
|
|
Asanko Gold Inc |
|
2 |
|
|
|
|||
|
Asanko Gold Inc. NI 43-101 Technical Report on Asanko Gold Mine, Ghana |
Table of Contents
| 1 SUMMARY | 20 |
| 1.1 Introduction | 20 |
| 1.2 Property description and ownership | 21 |
| 1.3 Geology and mineralisation | 24 |
| 1.4 Status of exploration, development and operations | 24 |
| 1.5 Mineral Resource estimates (MREs) | 25 |
| 1.6 Mineral Reserve estimates (MRev) | 26 |
| 1.7 Mining | 27 |
| 1.7.1 Mining schedule | 27 |
| 1.8 Minerals processing and metallurgical testwork | 31 |
| 1.8.1 Minerals processing facility | 31 |
| 1.8.2 Metallurgical testwork and process development | 33 |
| 1.9 Environmental studies, permitting and social community impact | 35 |
| 1.9.1 Project permitting process | 35 |
| 1.9.2 Environmental and social monitoring | 35 |
| 1.9.3 Stakeholder engagement | 35 |
| 1.9.4 Closure costs | 35 |
| 1.10 Mine site and bulk infrastructure | 35 |
| 1.11 Capital cost estimate | 36 |
| 1.12 Operating cost estimate | 36 |
| 1.13 Economic analysis | 38 |
| 1.14 Risks and opportunities | 39 |
| 1.15 Conclusions and recommendations | 39 |
| 2 INTRODUCTION | 41 |
| 2.1 Overview | 41 |
| 2.2 Qualified Persons | 42 |
| 2.3 Issuer - Asanko Gold Inc | 42 |
| 2.4 References and information sources | 43 |
| 2.5 Units, currency and abbreviations | 43 |
| 3 RELIANCE ON OTHER EXPERTS | 47 |
| 4 PROPERTY DESCRIPTION AND LOCATION | 48 |
| 4.1 Project location and area | 48 |
| 4.2 Licences and mineral tenure | 51 |
| 4.2.1 Mining legislation overview | 51 |
| 4.2.2 Issuer's title to the AGM concessions | 51 |
| 4.3 Agreements, royalties and encumbrances | 53 |
| 4.4 Environmental obligations | 53 |
| 4.5 Permits | 53 |
|
Asanko Gold Inc. NI 43-101 Technical Report on Asanko Gold Mine, Ghana |
| 5 ACCESSIBILITY, CLIMATE, LOCAL RESOURCES, INFRASTRUCTURE AND PHYSIOGRAPHY | 55 |
| 5.1 Topography, elevation and vegetation | 55 |
| 5.2 Access | 56 |
| 5.3 Proximity to population centre and transport | 56 |
| 5.4 Climate and length of operating season | 56 |
| 5.5 Infrastructure | 56 |
| 5.6 Surface rights | 58 |
| 6 HISTORY | 60 |
| 6.1 Prior ownership and ownership changes | 60 |
| 6.2 Historical exploration and development | 60 |
| 6.3 Previous Mineral Resource estimates | 62 |
| 6.4 Previous Mineral Reserve estimates | 63 |
| 6.5 Historical production | 65 |
| 7 GEOLOGICAL SETTING AND MINERALISATION | 66 |
| 7.1 Regional geology | 66 |
| 7.2 Local geology | 69 |
| 7.3 Property geology and mineralisation | 71 |
| 7.3.1 Nkran | 71 |
| 7.3.2 Esaase | 74 |
| 7.3.3 Akwasiso | 78 |
| 7.3.4 Abore | 79 |
| 7.3.5 Asuadai | 82 |
| 7.3.6 Adubiaso | 84 |
| 8 DEPOSIT TYPES | 86 |
| 9 EXPLORATION | 87 |
| 9.1 Survey procedures and parameters | 87 |
| 9.1.1 Geophysical survey | 87 |
| 9.1.2 Geological mapping | 87 |
| 9.1.3 Sampling | 88 |
| 9.1.4 Trenching | 88 |
| 9.2 Sampling methods and sample quality | 88 |
| 9.2.1 Drill core sampling | 88 |
| 9.2.2 Density sampling | 89 |
| 9.2.3 RC sampling | 89 |
| 9.2.4 Soil geochemical sampling | 90 |
| 9.2.5 Trench sampling | 90 |
| 9.2.6 Sample quality | 91 |
| 9.3 Sample data | 91 |
| 9.3.1 Geophysical surveys | 91 |
| 9.3.2 Geological mapping | 91 |
| 9.3.3 Sampling | 91 |
|
Asanko Gold Inc. NI 43-101 Technical Report on Asanko Gold Mine, Ghana |
| 9.4 Results and interpretation of exploration information | 93 |
| 9.4.1 Physical surveys | 93 |
| 9.4.2 Geological mapping | 95 |
| 9.4.3 Sampling | 95 |
| 10 DRILLING | 97 |
| 10.1 Type and extent of drilling | 97 |
| 10.2 Factors influencing the accuracy of results | 100 |
| 10.2.1 Drill hole location | 100 |
| 10.2.2 Down hole survey | 100 |
| 10.2.3 Core recovery | 100 |
| 10.2.4 Core handling | 101 |
| 10.2.5 Drill core logging | 101 |
| 10.2.6 Core photography | 102 |
| 10.2.7 Core cutting | 102 |
| 10.2.8 Geotechnical logging | 102 |
| 10.2.9 Core storage | 103 |
| 10.3 Exploration properties - drill hole details | 103 |
| 11 SAMPLE PREPARATION, ANALYSES, AND SECURITY | 108 |
| 11.1 Sample preparation methods & quality control (QC) measures | 108 |
| 11.1.1 Current methodology | 108 |
| 11.2 Sample splitting | 108 |
| 11.3 Security measures | 109 |
| 11.4 Bulk density measurements | 109 |
| 11.4.1 Methodology | 109 |
| 11.4.2 Density quality assurance/quality control (QA/QC) | 110 |
| 11.5 Sample preparation and analysis | 110 |
| 11.6 Check umpire assay analysis | 111 |
| 11.7 Laboratory certification | 111 |
| 11.7.1 Umpire/lab check laboratory | 111 |
| 11.8 Results of quality assurance/quality control (QA/QC) | 112 |
| 11.8.1 Results - standards, blanks and duplicates | 112 |
| 11.9 Results - umpire analysis | 121 |
| 11.10 Author's opinion | 122 |
| 12 DATA VERIFICATION | 123 |
| 12.1 CSA Global data validation and site visits | 123 |
| 12.2 CSA Global data validation | 124 |
| 12.3 Database structure | 124 |
| 12.4 Data review | 125 |
| 12.4.1 Asanko Gold exploration database | 125 |
| 12.4.2 Asanko Gold grade control database | 125 |
| 12.5 Database conclusions and recommendations | 125 |
| 12.6 Qualified Person's opinion on adequacy of data for purposes used in Technical Report | 125 |
|
Asanko Gold Inc. NI 43-101 Technical Report on Asanko Gold Mine, Ghana |
| 13 MINERAL PROCESSING AND METALLURGICAL TESTING | 126 |
| 13.1 Project testwork | 126 |
| 13.1.1 Previous metallurgical testwork | 126 |
| 13.1.2 Current metallurgical testwork | 128 |
| 13.1.3 Summary of ALS testwork results | 154 |
| 13.1.4 Recovery assessment | 155 |
| 13.1.5 Estimation of LOM recovery | 161 |
| 13.1.6 Addendum testwork A20208 | 164 |
| 14 MINERAL RESOURCE ESTIMATES | 168 |
| 14.1 Introduction | 168 |
| 14.2 Effective date of Mineral Resource | 168 |
| 14.3 Assumptions and parameters | 169 |
| 14.4 Drilling database | 170 |
| 14.5 Nkran | 174 |
| 14.5.1 Geological and mineralisation modelling | 174 |
| 14.5.2 Statistical analysis | 187 |
| 14.5.3 Bulk density | 194 |
| 14.5.4 Block model | 194 |
| 14.5.5 Grade estimation | 196 |
| 14.5.6 Block model validations | 202 |
| 14.5.7 Mineral Resource classification | 207 |
| 14.5.8 Mineral Resource reporting | 209 |
| 14.5.9 Comparison with the previous MRE | 210 |
| 14.5.10 Risk | 211 |
| 14.6 Esaase MRE | 213 |
| 14.6.1 Geological and mineralisation modelling | 213 |
| 14.6.2 Statistical analysis | 218 |
| 14.6.3 Bulk density | 223 |
| 14.6.4 Block model | 224 |
| 14.6.5 Grade estimation | 226 |
| 14.6.6 Block model validations | 234 |
| 14.6.7 Mineral Resource classification | 240 |
| 14.6.8 Mineral Resource reporting | 241 |
| 14.6.9 Risk | 243 |
| 14.7 Akwasiso MRE | 244 |
| 14.7.1 Background | 244 |
| 14.7.2 Drill hole data | 244 |
| 14.7.3 Geological and mineralisation modelling | 244 |
| 14.7.4 Exploratory data analysis | 247 |
| 14.7.5 Block model | 251 |
| 14.7.6 Grade estimation | 251 |
| 14.7.7 Mineral Resource classification | 252 |
| 14.7.8 Mineral Resource reporting | 253 |
| 14.7.9 Risk | 255 |
| 14.8 Abore MRE | 255 |
| 14.8.1 Background | 255 |
|
Asanko Gold Inc. NI 43-101 Technical Report on Asanko Gold Mine, Ghana |
| 14.8.2 Drill hole data | 256 |
| 14.8.3 Geological modelling | 256 |
| 14.8.4 Compositing | 259 |
| 14.8.5 Data capping | 260 |
| 14.8.6 Gaussian anamorphosis modelling | 260 |
| 14.8.7 Variography | 260 |
| 14.8.8 Block model definition | 260 |
| 14.8.9 Estimation | 261 |
| 14.8.10 Model validation | 262 |
| 14.8.11 Bulk density | 262 |
| 14.8.12 Classification | 262 |
| 14.8.13 Mineral Resource reporting | 263 |
| 14.9 Asuadai MRE | 264 |
| 14.9.1 Background | 264 |
| 14.9.2 Drill hole data | 265 |
| 14.9.3 Geological modelling | 265 |
| 14.9.4 Exploratory data analysis | 267 |
| 14.9.5 Variography | 269 |
| 14.9.6 Block model definition | 269 |
| 14.9.7 Estimation | 269 |
| 14.9.8 Mineral Resource classification | 270 |
| 14.9.9 Mineral Resource statement | 271 |
| 14.10 Adubiaso MRE | 273 |
| 14.10.1 Background | 273 |
| 14.10.2 Drill hole data | 273 |
| 14.10.3 Geological modelling | 273 |
| 14.10.4 Exploratory data analysis | 276 |
| 14.10.5 Variography | 277 |
| 14.10.6 Block model definition | 277 |
| 14.10.7 Estimation | 278 |
| 14.10.8 Mineral Resource classification | 278 |
| 14.10.9 Mineral Resource statement | 279 |
| 15 MINERAL RESERVE ESTIMATES | 281 |
| 15.1 Introduction | 281 |
| 15.2 Key assumptions, parameters and methods | 283 |
| 15.2.1 Methodology | 283 |
| 15.2.2 Mining model | 283 |
| 15.2.3 Geotechnical parameters | 285 |
| 15.2.4 Optimisation parameters | 286 |
| 15.2.5 Optimisation results | 287 |
| 15.2.6 Pit design | 291 |
| 15.3 Cut-off grade | 296 |
| 15.4 Mineral Reserve reconciliation | 298 |
| 15.5 Factors affecting Mineral Reserve estimation | 303 |
| 16 MINING METHODS | 305 |
| 16.1 Mining strategy | 305 |
|
Asanko Gold Inc. NI 43-101 Technical Report on Asanko Gold Mine, Ghana |
| 16.1.1 Mining method | 305 |
| 16.1.2 Blending strategy | 305 |
| 16.1.3 Operating philosophy | 305 |
| 16.2 Geotechnical considerations | 306 |
| 16.2.1 Nkran | 307 |
| 16.2.2 Esaase | 314 |
| 16.2.3 Satellite Pits | 316 |
| 16.3 Mining operations | 317 |
| 16.3.1 Grade control | 317 |
| 16.3.2 Site preparation | 317 |
| 16.3.3 Drill and blast | 317 |
| 16.3.4 Load and haul | 319 |
| 16.3.5 Ore blending operations | 322 |
| 16.3.6 Ancillary equipment | 322 |
| 16.3.7 Rehabilitation | 323 |
| 16.3.8 In-pit water management | 323 |
| 16.4 Site layout | 324 |
| 16.4.1 Overall layouts | 324 |
| 16.4.2 Waste rock dumps (WRDs) | 327 |
| 16.4.3 Ore stockpiles | 329 |
| 16.4.4 Overland haul road | 330 |
| 16.5 Mining schedule | 331 |
| 16.5.1 Methodology | 331 |
| 16.5.2 Parameters and constraints | 331 |
| 16.5.3 Schedule results | 336 |
| 16.6 Mining requirements | 341 |
| 16.6.1 Primary mining equipment | 341 |
| 16.6.2 Auxiliary equipment | 345 |
| 16.6.3 Mining labour | 346 |
| 16.6.4 Current split between Asanko Gold and contractor responsibilities | 350 |
| 17 RECOVERY METHODS | 353 |
| 17.1 Process description | 353 |
| 17.1.1 Crushing | 355 |
| 17.1.2 Milling | 356 |
| 17.1.3 Gravity gold recovery | 356 |
| 17.1.4 Pre-leach thickening | 356 |
| 17.1.5 Carbon in leach (CIL) | 357 |
| 17.1.6 Tailings and detoxification | 357 |
| 17.1.7 Carbon treatment | 358 |
| 17.1.8 Electrowinning | 358 |
| 17.1.9 Gold room | 359 |
| 17.1.10 Reagents | 359 |
| 17.1.11 Plant process services | 360 |
| 18 PROJECT INFRASTRUCTURE | 363 |
| 18.1 Overview | 363 |
| 18.2 New infrastructure required | 363 |
|
Asanko Gold Inc. NI 43-101 Technical Report on Asanko Gold Mine, Ghana |
| 18.3 Existing infrastructure | 363 |
| 18.3.1 Obotan - Existing site infrastructure | 363 |
| 18.3.2 Esaase - Existing site infrastructure | 364 |
| 18.4 Site layout | 364 |
| 18.4.1 Obotan | 364 |
| 18.4.2 Esaase | 366 |
| 18.4.3 Haul road Esaase to Obotan | 367 |
| 18.5 Site access | 367 |
| 18.6 Site conditions | 367 |
| 18.6.1 Meteorology | 367 |
| 18.7 Hydrology | 368 |
| 18.7.1 Esaase | 368 |
| 18.7.2 Haul road hydrology | 369 |
| 18.8 Earthworks | 370 |
| 18.8.1 Bulk earthworks | 370 |
| 18.8.2 Buffer dam | 370 |
| 18.8.3 Waste dumps sediment control dam | 370 |
| 18.9 Mine services area (Esaase) | 370 |
| 18.10 Roads | 370 |
| 18.10.1 Local public roads (Esaase) | 370 |
| 18.10.2 Mining haul roads (Esaase) | 370 |
| 18.10.3 Esaase-Obotan haul road | 371 |
| 18.10.4 Haul road optimisation | 373 |
| 18.11 Buildings and facilities | 373 |
| 18.11.1 Esaase camp upgrade | 373 |
| 18.11.2 Esaase miscellaneous services upgrade | 373 |
| 18.12 Storm water management | 374 |
| 18.12.1 General | 374 |
| 18.12.2 Drains and channels | 374 |
| 18.12.3 Dams and sediment control structures | 374 |
| 18.13 Potable water supply | 375 |
| 18.14 Sewage handing | 375 |
| 18.15 Power | 375 |
| 18.15.1 Power supply - Obotan | 375 |
| 18.15.2 Power supply - Esaase | 375 |
| 18.15.3 Estimated loads | 375 |
| 18.16 Fuel | 376 |
| 18.17 Re-settlements | 376 |
| 19 MARKET STUDIES AND CONTRACTS | 377 |
| 19.1 Introduction | 377 |
| 19.2 Marketing strategy | 377 |
| 19.3 Marketing contracts | 377 |
| 19.3.1 Refining contract | 377 |
| 19.3.2 Off-take agreement | 377 |
|
Asanko Gold Inc. NI 43-101 Technical Report on Asanko Gold Mine, Ghana |
| 19.4 Pricing | 377 |
| 19.4.1 Payment terms | 378 |
| 19.4.2 Gold price forecast | 378 |
| 19.5 Product specification | 378 |
| 19.6 Shipping, storage and distribution | 378 |
| 19.7 Qualified Person opinion on gold price applied | 378 |
| 20 ENVIRONMENTAL STUDIES, PERMITTING & SOCIAL/ COMMUNITY IMPACT | 379 |
| 20.1 Ghanaian legislation and guidelines | 379 |
| 20.1.1 Environmental and social | 379 |
| 20.1.2 Minerals and mining | 379 |
| 20.1.3 Compensation | 381 |
| 20.1.4 Health, safety and labour | 381 |
| 20.2 Project permitting process | 381 |
| 20.2.1 Obotan expansion project permitting process | 381 |
| 20.2.2 Minerals Commission permitting process | 382 |
| 20.2.3 EPA permitting process | 382 |
| 20.3 Stakeholder engagement | 385 |
| 20.3.1 Guiding principles of stakeholder engagement | 385 |
| 20.3.2 Engagement with communities | 386 |
| 20.3.3 Governmental stakeholders | 388 |
| 20.3.4 Industry group stakeholder | 389 |
| 20.4 Environmental and social baseline | 389 |
| 20.5 Environmental and social impacts identified | 393 |
| 20.6 Environmental and social monitoring | 396 |
| 21 CAPITAL AND OPERATING COSTS | 401 |
| 21.1 Capital costs | 401 |
| 21.1.1 Capital cost summary | 401 |
| 21.1.2 Compilation of capital estimate | 401 |
| 21.1.3 Project Scope of Work | 401 |
| 21.1.4 General qualifications | 402 |
| 21.1.5 Estimating system and format | 402 |
| 21.2 Operating costs | 402 |
| 21.2.1 Operating philosophy | 402 |
| 21.2.2 Operating cost summary and basis | 403 |
| 22 ECONOMIC ANALYSIS | 405 |
| 22.1 Capex summary | 405 |
| 22.2 Principal assumptions | 406 |
| 22.2.1 Commodity prices | 407 |
| 22.2.2 Exchange rate | 407 |
| 22.2.3 Discount rate | 407 |
| 22.2.4 DCF cashflow extract | 407 |
| 22.2.5 NPV | 409 |
| 22.3 Taxes, royalties and other government levies | 409 |
| 22.3.1 Taxes | 409 |
|
Asanko Gold Inc. NI 43-101 Technical Report on Asanko Gold Mine, Ghana |
| 22.3.2 Royalties | 409 |
| 22.3.3 Other government levies | 409 |
| 22.4 Sensitivity analysis | 409 |
| 23 ADJACENT PROPERTIES | 412 |
| 24 OTHER RELEVANT DATA AND INFORMATION | 414 |
| 24.1 Project Execution Plan (PEP) | 414 |
| 24.2 Security | 416 |
| 24.2.1 Obotan Project Site | 416 |
| 24.2.2 Esaase | 416 |
| 24.3 Logistics | 416 |
| 24.3.1 Site location | 416 |
| 24.3.2 Ports | 416 |
| 24.3.3 Logistics costs | 416 |
| 24.3.4 Insurance | 416 |
| 24.3.5 Transport of staff to site | 416 |
| 24.3.6 Transport on site | 416 |
| 24.4 Tailings storage facility (TSF) and mine residue | 417 |
| 24.4.1 Tailings Storage Facility (TSF) design | 417 |
| 24.4.2 Monitoring | 419 |
| 24.4.3 Water management strategy | 420 |
| 24.4.4 Rehabilitation | 420 |
| 24.4.5 Geotechnical investigation | 420 |
| 24.4.6 Tailings physical characteristics | 421 |
| 24.4.7 Tailings geochemical characteristics | 422 |
| 24.5 Mine closure | 422 |
| 24.6 Risk | 423 |
| 25 INTERPRETATION AND CONCLUSIONS | 425 |
| 25.1 Project risks | 425 |
| 25.2 Geology and Mineral Resources | 425 |
| 25.3 Mining and Reserves | 426 |
| 25.4 Processing | 426 |
| 25.4.1 Process flowsheet | 426 |
| 25.4.2 Mill throughput | 426 |
| 25.4.3 Recovery | 427 |
| 25.5 Infrastructure | 427 |
| 25.6 Economic analysis outcomes | 427 |
|
Asanko Gold Inc. NI 43-101 Technical Report on Asanko Gold Mine, Ghana |
| 26 RECOMMENDATIONS AND CONCLUSIONS | 428 |
| 27 REFERENCES | 430 |
| 28 DATES AND SIGNATURE | 434 |
| 29 CERTIFICATE OF QUALIFIED PERSON | 435 |
Figures
| Figure 1-1 Location of the AGM tenements | 23 |
| Figure 1-2 Regional geology map of south-west Ghana, West Africa | 24 |
| Figure 1-3 Mining schedule by deposit | 28 |
| Figure 1-4 Esaase haulage schedule | 28 |
| Figure 1-5 Long-term stockpile balance | 29 |
| Figure 1-6 Processing schedule by deposit | 29 |
| Figure 1-7 Gold production schedule by deposit | 30 |
| Figure 1-8 Obotan plant, 5.4 Mtpa block flow diagram | 32 |
| Figure 1-9 LOM grade and recovery profile | 34 |
| Figure 4-1 Location of the Asanko Gold Mine in Ghana, West Africa | 49 |
| Figure 4-2 Location of the AGM tenements | 50 |
| Figure 5-1 Example of topography and vegetation around Esaase Pit location | 55 |
| Figure 5-2 Nkran Pit regional infrastructure | 58 |
| Figure 7-1 Regional geology of southwest Ghana around AGM concessions | 67 |
| Figure 7-2 Generalised stratigraphy of southwest Ghana | 68 |
| Figure 7-3 Location of AGM deposits along the Asankrangwa Gold Belt | 70 |
| Figure 7-4 Nkran plan view and cross section through pit showing geology | 73 |
| Figure 7-5 Esaase plan view and cross section through pit showing geology | 75 |
| Figure 7-6 Esaase mapping of %OC by stratigraphic unit colour-coded by %OC threshold | 77 |
| Figure 7-7 Akwasiso plan view and cross section through pit showing geology | 79 |
| Figure 7-8 Abore plan view and cross section through pit showing geology | 81 |
| Figure 7-9 Asuadai plan view and cross section through pit showing geology | 83 |
| Figure 7-10 Adubiaso plan view and cross section through pit showing geology | 85 |
| Figure 9-1 Surface geochemistry sampling locations (2017 to 2019) | 92 |
| Figure 9-2 Regional geological interpretation from VTEM survey | 94 |
| Figure 9-3 Plan showing gold in soil anomalies | 96 |
| Figure 10-1 Plan showing distribution of drill hole collars at Nkran pit | 104 |
| Figure 10-2 Plan showing distribution of drill hole collars at Esaase | 104 |
| Figure 10-3 Plan showing distribution of drill hole collars at Akwasiso and Nkran Extension | 105 |
| Figure 10-4 Plan showing distribution of drill hole collars at Abore | 105 |
| Figure 10-5 Plan showing distribution of drill hole collars at Asuadai | 106 |
| Figure 10-6 Plan showing distribution of drill hole collars at Adubiaso and Adubiaso Extension | 107 |
| Figure 11-1 Nkran blanks (2017 - 2018) | 112 |
| Figure 11-2 Nkran grade control field duplicates showing mean bias to duplicates* | 113 |
| Figure 11-3 Nkran exploration field duplicates with mean bias of 32% to originals* | 113 |
| Figure 11-4 Esaase grade control CRM G912-2 showing apparent misidentified CRMs | 114 |
| Figure 11-5 Akwasiso GC RC field duplicate scatter and QQ plots* | 117 |
| Figure 11-6 Asuadai exploration blank Shewhart plot with three outliers removed | 118 |
| Figure 11-7 Adubiaso exploration RC field duplicate scatter and QQ plots* | 120 |
| Figure 11-8 Adubiaso GC field duplicate scatter and QQ plots* | 121 |
| Figure 13-1 Asanko Gold Esaase Main Pit metallurgical testwork sampling location | 130 |
| Figure 13-2 Esaase Main Pit metallurgical testwork sampling cross section 23 | 130 |
| Figure 13-3 Esaase Main Pit metallurgical testwork sampling cross section 10 | 131 |
| Figure 13-4 Asanko Gold metallurgical test program flowsheet: Campaign 1 (ALS A18754) | 132 |
| Figure 13-5 Asanko Gold metallurgical test program flowsheet: Campaign 2 (ALS A19208) | 135 |
| Figure 13-6 Asanko Gold metallurgical test Campaign 2 (A19208), organic carbon % versus PRI % | 138 |
| Figure 13-7 Asanko Gold metallurgical test program flowsheet: Campaign 3 (ALS A19437) | 139 |
| Figure 13-8 Asanko Gold metallurgical test Campaign 2 (A19437), organic carbon % versus PRI % | 141 |
|
Asanko Gold Inc. NI 43-101 Technical Report on Asanko Gold Mine, Ghana |
| Figure 13-9 Asanko Gold metallurgical test program flowsheet: Campaign 4 ALS A19681 | 146 |
| Figure 13-10 Asanko Gold metallurgical test Campaign 4 (A19681), organic carbon % versus PRI % | 150 |
| Figure 13-11 Raman ratio as a function of organic carbon content for Esaase samples | 153 |
| Figure 13-12 Raman ratio as a function of preg-robbing index (PRI) for Esaase samples | 153 |
| Figure 13-13 Position of average Esaase sample on the Raman calibration curve | 154 |
| Figure 13-14 Organic carbon % versus PRI % for all relevant samples tested | 155 |
| Figure 13-15 Organic carbon % versus total Au recovery for all relevant samples tested | 155 |
| Figure 13-16 Esaase Main Pit geological ore domains (Pit floor December 2019) | 156 |
| Figure 13-17 Grade recovery curve - samples with organic carbon greater than 0.5% | 157 |
| Figure 13-18 Grade recovery curve - samples with organic carbon less than 0.5% | 157 |
| Figure 13-19 Organic carbon vs residue grade relationship for each domain | 160 |
| Figure 13-20 Head grade recovery relationship per domain (as function of organic carbon relationship) | 160 |
| Figure 13-21 Nkran and Obotan Satellite Pits head grade vs residue grade correlation | 161 |
| Figure 13-22 LOM grade and recovery profile | 163 |
| Figure 13-23 Head grade and recovery profile | 163 |
| Figure 13-24 Preg-robbing index versus organic carbon grades | 165 |
| Figure 13-25 Gravity/direct leach recovery results for Esaase and Nkran | 166 |
| Figure 13-26 Gravity/CIL recovery results for Esaase and Nkran | 167 |
| Figure 14-1 Plan view - MRE drill hole collar locations | 172 |
| Figure 14-2 Drill hole collar locations for Adubiaso, Akwasiso and Nkran by hole type | 173 |
| Figure 14-3 Drill hole collar locations for Abore and Asuadai by hole type | 173 |
| Figure 14-4 Drill hole collar locations for Esaase by hole type | 174 |
| Figure 14-5 3D view of the Nkran geological domains within the December 2018 pit shell | 175 |
| Figure 14-6 Variogram for the indicator variable (ORE) | 177 |
| Figure 14-7 Trial area to compare EXP with GC data (Figure 14-8), coloured by geology | 178 |
| Figure 14-8 Trial area to compare GC data with EXP data (Figure 14-7), coloured by geology | 179 |
| Figure 14-9 IK GC vs IK EXP model ORE % and BCM - GEOL 210 (western sandstone) | 181 |
| Figure 14-10 IK GC vs IK EXP back-flagged 'ore' Au g/t and NSAMP | 181 |
| Figure 14-11 Plan view - EXP data separated into Grid 1 (red) and Grid 2 (black) | 182 |
| Figure 14-12 Log probability plot of EXP data separated into Grid 1 (red) and Grid 2 (blue) | 183 |
| Figure 14-13 EXP Grid 1 vs Grid 2 model ORE % and BCM - GEOL 210 (western sandstone) | 185 |
| Figure 14-14 EXP Grid 1 vs Grid 2 back-flagged 'ore' samples - Au g/t and NSAMP | 185 |
| Figure 14-15 Cross-section showing mineralised volume model and back-flagged exploration data | 187 |
| Figure 14-16 Log probability plot comparing top-cut Au grades: DD (red), RC (blue), RCD (green) | 188 |
| Figure 14-17 Log probability plot comparing top-cut Au grades in DD (red), RC (blue), RCD (green) | 189 |
| Figure 14-18 Normal histogram plot, core recoveries grouped by weathering | 190 |
| Figure 14-19 Histogram of mineralised sampling intervals (IK_USE = 1) | 192 |
| Figure 14-20 Residual analysis post-compositing | 193 |
| Figure 14-21 Histogram of in-pit density - Fresh rock | 195 |
| Figure 14-22 Gaussian anamorphosis model for Domain 210 | 197 |
| Figure 14-23 Histogram of Au (left) and Gaussian transformed Au (right) for Domain 210 | 198 |
| Figure 14-24 Experimental variogram and model (Gaussian space) for Au g/t in Domain 210 | 199 |
| Figure 14-25 Back transformed variogram model for Au g/t in Domain 210 (normalised to 1) | 200 |
| Figure 14-26 Cross-section view - OK panel model and composites (Domain 210 - Western Sandstone) | 203 |
| Figure 14-27 Swath plot and histogram: declustered composites, panels & LUC estimate for Domain 210 | 204 |
| Figure 14-28 Scatterplot of UC panel grade (x-axis) versus OK panel grade for Domain 210 | 206 |
| Figure 14-29 Scatterplot of mean LUC grade (x-axis) versus UC grade for Domain 210 | 206 |
| Figure 14-30 Grade (left) and tonnage curves (right) for Domain 210 | 207 |
| Figure 14-31 3D view looking NE of the classified model, nominal US$1,500/oz pit shell shown in orange | 208 |
| Figure 14-32 Nkran grade-tonnage curve for the Indicated Mineral Resource | 210 |
| Figure 14-33 Cross section showing weathering profile, shears, geology and mineralisation domains | 213 |
| Figure 14-34 Plan view of shears (3D lines) and mineralisation (shaded wireframes) | 214 |
| Figure 14-35 3D view looking west, showing shears with higher grade around topographic highs (& E-W shears) | 215 |
| Figure 14-36 Probability plot comparing grades in RC (green), RCD (blue), DD (red) holes | 218 |
| Figure 14-37 Contact analysis - Oxidation zones | 219 |
| Figure 14-38 Histogram of sample intervals within mineralised domains | 221 |
|
Asanko Gold Inc. NI 43-101 Technical Report on Asanko Gold Mine, Ghana |
| Figure 14-39 Residual analysis post-compositing | 221 |
| Figure 14-40 Gaussian anamorphosis model for Domain 2010 | 227 |
| Figure 14-41 Histogram of Au (left) and Gaussian transformed Au (right) for Domain 2010 | 228 |
| Figure 14-42 Experimental variogram and model (Gaussian space) for Domain 2010 (normalised to 1) | 229 |
| Figure 14-43 Back transformed variogram model for Domain 2010 (normalised to 1) | 230 |
| Figure 14-44 Swath plot and histogram showing declustered composites, panel & LUC for Domain 1010 | 234 |
| Figure 14-45 Swath plot and histogram showing declustered composites, panel & LUC for Domain 1021 | 235 |
| Figure 14-46 Swath plot and histogram showing declustered composites, panel & LUC for Domain 2010 | 235 |
| Figure 14-47 Swath plot and histogram showing declustered composites, panel & LUC for Domain 2021 | 236 |
| Figure 14-48 Swath plot and histogram showing declustered composites, panel & LUC for Domain 2022 | 236 |
| Figure 14-49 Scatterplot of UC panel grade vs OK panel grade, Domain 1010 (left) & Domain 2010 (right) | 237 |
| Figure 14-50 Scatterplot of mean LUC grade of SMUs vs UC grade for Domain 1010 (left) & Domain 2021 (right) | 238 |
| Figure 14-51 Grade (left) and tonnage curves (right) for UC (red) and LUC (green) models in Domain 1010 | 239 |
| Figure 14-52 Grade (left) and tonnage curves (right) for UC (red) and LUC (green) models in Domain 2010 | 240 |
| Figure 14-53 Esaase grade-tonnage curve for Indicated Mineral Resource | 243 |
| Figure 14-54 Plan view showing the two granitic bodies at Akwasiso | 245 |
| Figure 14-55 Plan view showing the five mineralised lodes relative to the Akwasiso pit | 246 |
| Figure 14-56 Plan view (110 m elevation) of domains relative to the granitic-sedimentary contact (black line) | 247 |
| Figure 14-57 Log QQ plot of Au grades within the GC area for DD versus GC drilling | 248 |
| Figure 14-58 Probability plots comparing Au grade in sandstone (red) and shale/siltstone (green) for lode 1 | 249 |
| Figure 14-59 Contact analysis of oxidation zones | 249 |
| Figure 14-60 Classification of the undepleted model relative to open pit surface and drilling data | 253 |
| Figure 14-61 Akwasiso grade-tonnage curve for Indicated Mineral Resource | 254 |
| Figure 14-62 Plan at 140 m elevation showing lithology and fault models | 257 |
| Figure 14-63 Section through southern granite showing weathering models | 258 |
| Figure 14-64 Plan at 175 m elevation showing primary mineralisation domains | 259 |
| Figure 14-65 Histograms of raw and composited drill hole sample length | 260 |
| Figure 14-66 Isometric view looking northwest of normalised drill hole spacing, domain 4140 | 263 |
| Figure 14-67 Abore grade-tonnage curve for Indicated Mineral Resource | 264 |
| Figure 14-68 Lithological and structural models | 266 |
| Figure 14-69 Mineralisation model | 268 |
| Figure 14-70 Classification comparison on section 709200mN | 271 |
| Figure 14-71 Asuadai grade-tonnage curve for Indicated Mineral Resources | 272 |
| Figure 14-72 Lithological and structural models (plan view) | 274 |
| Figure 14-73 Lithological and structural models (section view) | 274 |
| Figure 14-74 Lithological and structural models (section view) | 275 |
| Figure 14-75 Mineralisation model (cross section view) | 276 |
| Figure 14-76 Mineralisation model (long section view) | 276 |
| Figure 14-77 Adubiaso grade-tonnage curve for Indicated Mineral Resources | 280 |
| Figure 15-1 Asanko Gold Mineral Reserve location map | 282 |
| Figure 15-2 Esaase Main pit-by-pit graph | 288 |
| Figure 15-3 Esaase South pit-by-pit graph | 289 |
| Figure 15-4 Nkran pit-by-pit graph | 289 |
| Figure 15-5 Nkran south west corner pit shell widths (azimuth 68˚) | 290 |
| Figure 15-6 Nkran Cut 3 pit design | 292 |
| Figure 15-7 Esaase Main Pit design | 293 |
| Figure 15-8 Esaase South Pit design | 294 |
| Figure 15-9 Satellite Pit designs (Akwasiso, Asuadai, Adubiaso and Abore) | 295 |
| Figure 15-10 Nkran 2016 to 2019 Mineral Reserve waterfall chart | 299 |
| Figure 15-11 Esaase 2016 to 2019 Mineral Reserve waterfall chart | 300 |
| Figure 15-12 2016 to 2019 Resource to Reserve waterfall chart | 302 |
| Figure 15-13 Asanko Gold 2016 to 2019 Resource to Reserve waterfall chart | 303 |
| Figure 16-1 Nkran West Wall on 27 November (left) prior to failure, and 28 November (right) post failure | 307 |
| Figure 16-2 Proposed Nkran Cut 2 sections considered for slope analyses | 308 |
| Figure 16-3 Nkran Cut 2 proposed remedial design | 309 |
| Figure 16-4 Section A, showing original topography, Nov pit profiles & proposed Cut 2 remedial design | 310 |
|
Asanko Gold Inc. NI 43-101 Technical Report on Asanko Gold Mine, Ghana |
| Figure 16-5 Proposed Nkran Cut 3 sections considered for slope analyses | 312 |
| Figure 16-6 Nkran Cut 3 pit design | 314 |
| Figure 16-7 Proposed Esaase sections considered for slope analyses | 315 |
| Figure 16-8 Esaase explosive magazine design | 319 |
| Figure 16-9 Nkran ROM pad design | 320 |
| Figure 16-10 Typical Satellite Pit ROM pad design (Akwasiso) | 321 |
| Figure 16-11 Esaase Pit ROM pad design | 322 |
| Figure 16-12 Asanko Gold site layout (Nkran and Satellite Pits) | 325 |
| Figure 16-13 Asanko Gold site layout (Esaase Main Pit) | 326 |
| Figure 16-14 Management of arsenic rich waste in WRDs | 327 |
| Figure 16-15 Nkran, Adubiaso and Akwasiso waste dump locations | 328 |
| Figure 16-16 Abore and Asuadai waste dump locations | 329 |
| Figure 16-17 Esaase waste dump locations | 329 |
| Figure 16-18 Esaase main pit staging | 332 |
| Figure 16-19 Esaase South pit stages | 334 |
| Figure 16-20 Mining schedule by deposit | 337 |
| Figure 16-21 Esaase haulage schedule | 338 |
| Figure 16-22 Long-term stockpile balance | 338 |
| Figure 16-23 Processing schedule by deposit | 339 |
| Figure 16-24 Processing schedule by rock type and hardness | 339 |
| Figure 16-25 Gold production schedule by deposit | 340 |
| Figure 16-26 Primary production mining equipment requirements over LOM | 343 |
| Figure 16-27 Number of 200 t excavators required by pit | 343 |
| Figure 16-28 Number of 100 t excavators required by pit | 344 |
| Figure 16-29 Number of 100 t rigid dump trucks required by pit | 344 |
| Figure 16-30 Number of 40 t articulated dump trucks required by pit | 344 |
| Figure 16-31 Number of blast hole drill rigs required by pit | 345 |
| Figure 16-32 Organisational structure for mining technical services (Owner's Team) | 347 |
| Figure 16-33 Organisational structure for mining production team (Owner's Team) | 348 |
| Figure 16-34 Organisational structure for mining contractor at Esaase and Nkran (PW Mining) | 348 |
| Figure 16-35 Mining contractor typical organisational structure at the Satellite Pits (Rocksure) | 349 |
| Figure 17-1 Obotan plant, 5.4 Mtpa block flow diagram | 354 |
| Figure 18-1 Obotan site plan and surrounding infrastructure (04018IH-7130-00146, rev A) | 365 |
| Figure 18-2 Obotan plant layout (IGHEBR-4018-0045, rev C) | 366 |
| Figure 18-3 Esaase site infrastructure layout (04018IH-7130-00141, rev A) | 366 |
| Figure 18-4 Asanko Gold haul road - Overall site infrastructure layout (04018IH-7130-00140, rev D) | 367 |
| Figure 18-5 Mean monthly rainfall, evaporation and temperature | 368 |
| Figure 18-6 Esaase pit with surface landform overlaid | 369 |
| Figure 18-7 Typical haul road cross section | 371 |
| Figure 18-8 Proposed improvements to the haul road profile | 372 |
| Figure 20-1 EIA approach for the Esaase Project | 383 |
| Figure 20-2 Community members at the EPA public hearing | 384 |
| Figure 20-3 A cross section of chiefs and members of the community at the EPA public hearing | 385 |
| Figure 20-4 Asanko Gold's principles for stakeholder engagement | 386 |
| Figure 22-1 LOM capex scheduling | 406 |
| Figure 22-2 Sensitivity analysis of key parameters | 410 |
| Figure 23-1 AGM tenements and adjacent properties | 413 |
| Figure 24-1 High level execution schedule | 415 |
| Figure 24-2 Stage 15 TSF expansion | 419 |
Tables
| Table 1-1 Asanko Gold mining licences | 22 |
| Table 1-2 Asanko Gold Mineral Resource as at 31 December 2019 at a 0.5 g/t Au cut-off | 26 |
| Table 1-3 Asanko Gold Mineral Reserve, as at 31 December 2019 | 27 |
| Table 1-4 Planned mining production schedule | 30 |
| Table 1-5 Obotan key process plant design criteria for 5.4 Mtpa throughput | 31 |
|
Asanko Gold Inc. NI 43-101 Technical Report on Asanko Gold Mine, Ghana |
| Table 1-6 Percent OC populations by stratigraphic unit (in %) | 33 |
| Table 1-7 Nkran (Obotan) historical annualised recovery | 34 |
| Table 1-8 Comparative LOM recovery per ore body | 34 |
| Table 1-9 Capital estimate summary | 36 |
| Table 1-10 Operating cost summary | 37 |
| Table 1-11 Summary of key financial assumptions and outcomes | 38 |
| Table 1-12 Gold price and discount rate sensitivity (NPV in US$ M) | 38 |
| Table 2-1 Site visits undertaken by Qualified Persons | 42 |
| Table 2-2 Abbreviations and unit of measurement | 43 |
| Table 4-1 Asanko Gold Mine Mining Lease and Prospecting concession areas | 52 |
| Table 6-1 Summary history of ownership per deposit | 60 |
| Table 6-2 Summary of historical exploration and development per deposit | 61 |
| Table 6-3 Previous Measured and Indicated Mineral Resource estimates as per Asanko Gold, 2017 | 63 |
| Table 6-4 Previous Inferred Mineral Resource estimates as per Asanko Gold, 2017 | 63 |
| Table 6-5 Previous Mineral Reserve estimate by deposit as per Asanko Gold, 2017 | 64 |
| Table 7-1 Summary of mineralisation style per deposit | 71 |
| Table 7-2 Stratigraphic unit with general description | 74 |
| Table 7-3 Statistics of %OC populations by stratigraphic unit (in %) | 77 |
| Table 9-1 Drill hole sample summary by deposit since 2014 | 93 |
| Table 9-2 Grade control sample summary by deposit since 2014 | 93 |
| Table 10-1 Drilling summary by deposit | 97 |
| Table 10-2 Grade control drilling summary by deposit since 2014 | 99 |
| Table 11-1 Summary of sample preparation techniques | 110 |
| Table 11-2 Summary of analytical laboratories and assay techniques | 111 |
| Table 11-3 Esaase exploration CRM results (method FA50_AAS)* | 115 |
| Table 11-4 Esaase grade control CRM results (method BR307) showing systematic under-reporting | 115 |
| Table 11-5 Akwasiso Exploration CRM results (method BR307) showing systematic under-reporting | 116 |
| Table 11-6 Akwasiso GC CRM results (method BR307) showing systematic under-reporting | 116 |
| Table 11-7 Asuadai exploration CRM results (method FA_AAS)* | 119 |
| Table 13-1 Estimated LOM metal recoveries for gravity flotation CIL process | 126 |
| Table 13-2 Summary of AGM Expansion Project Phase 1 testwork programme | 127 |
| Table 13-3 Relevant analysis on Nkran and Esaase (ALS A16645, July 2016) | 127 |
| Table 13-4 Summary of the data used to derive gravity-CIL recovery estimates | 128 |
| Table 13-5 Percent OC populations by stratigraphic unit (in %) | 129 |
| Table 13-6 Identification of samples for Esaase metallurgical testwork | 129 |
| Table 13-7 Assays summary on Esaase Composite head samples | 133 |
| Table 13-8 Results on Esaase KERC Composites gravity/direct/CIL cyanidation | 133 |
| Table 13-9 Preg-robbing characterisation results on Esaase KERC Composite samples | 134 |
| Table 13-10 Assays summary on Esaase Composite head samples | 136 |
| Table 13-11 Preg-robbing characterisation on Esaase Composite head samples | 137 |
| Table 13-12 Head assays on Esaase core and plant activated carbon samples (A19437) | 140 |
| Table 13-13 Preg-robbing characterisation testwork on Esaase Composite head samples | 141 |
| Table 13-14 Gravity/direct cyanidation on Esaase Composite head samples | 142 |
| Table 13-15 Gravity/direct cyanidation/CIL cyanidation* | 143 |
| Table 13-16 Investigative scouting testwork on gravity/direct cyanidation options at P80 106 µm* | 144 |
| Table 13-17 Investigative scouting testwork on gravity/CIL cyanidation at P80 106 µm grind size* | 144 |
| Table 13-18 Head assays summary on Esaase broken core (A19681) | 147 |
| Table 13-19 Gravity/direct cyanidation/CIL cyanidation on Esaase broken core | 148 |
| Table 13-20 Gravity/direct cyanidation/CIL cyanidation on Esaase broken core (continued) | 149 |
| Table 13-21 Preg-robbing characterisation on Esaase Composite head samples | 150 |
| Table 13-22 Investigative leach testwork on Esaase composite gravity tails samples | 151 |
| Table 13-23 Raman ratio, analysis and PRI results for Esaase samples | 152 |
| Table 13-24 Raman ratio, analysis and PRI results for Esaase samples | 154 |
| Table 13-25 Statistical analysis - Removing outliers in grade recovery models | 158 |
| Table 13-26 Esaase Main Pit weighted average recovery for all geological domains | 159 |
| Table 13-27 Head grade recovery model correlations applied to LOM feed schedule | 161 |
| Table 13-28 LOM feed schedule grades and recoveries per ore source | 162 |
|
Asanko Gold Inc. NI 43-101 Technical Report on Asanko Gold Mine, Ghana |
| Table 13-29 Nkran (Obotan) historical annualised recovery | 164 |
| Table 14-1 Summary of the Mineral Resource at a 0.5 g/t Au cut-off, as at 31 December 2019 | 168 |
| Table 14-2 Confidence levels of key criteria for drilling, sampling and geology | 170 |
| Table 14-3 Summary of exploration databases | 171 |
| Table 14-4 Summary of grade control databases | 171 |
| Table 14-5 Summary of exploration drill data used in the MREs | 171 |
| Table 14-6 Variogram parameters for indicator variable (ORE) | 177 |
| Table 14-7 Search neighbourhood parameters for indicator variable (ORE) and NPOINTS | 177 |
| Table 14-8 IK GC vs IK EXP model ore volume | 180 |
| Table 14-9 IK GC vs IK EXP back-flagged 'ore' samples | 180 |
| Table 14-10 Statistics - EXP data separated into Grid 1 (nkg1) and Grid 2 (nkg2) by GEOL | 182 |
| Table 14-11 Stats - EXP data separated into Grid 1 & 2 - Model (left) & back flagged sample data (right) | 184 |
| Table 14-12 Criteria for defining the indicator probability parameter representing expected mineralisation | 186 |
| Table 14-13 Data field flagging and description | 191 |
| Table 14-14 Naïve statistics per domain where IK_USE = 1 | 191 |
| Table 14-15 Composite statistics per domain | 192 |
| Table 14-16 Top-cut statistics per domain | 194 |
| Table 14-17 Block model dimensions | 195 |
| Table 14-18 Block model attributes | 195 |
| Table 14-19 Variogram models for Au g/t | 200 |
| Table 14-20 Change of Support calculations | 201 |
| Table 14-21 Statistical validation of estimation domains | 205 |
| Table 14-22 Class field and description | 208 |
| Table 14-23 Assumptions considered for selection of reporting cut-off grade | 209 |
| Table 14-24 Nkran Mineral Resource at a 0.5 g/t Au cut-off as at 31 December 2019 | 209 |
| Table 14-25 Nkran MRE comparison - 31 December 2016 vs 31 Dec 2019, at a 0.5 g/t Au cut-off | 211 |
| Table 14-26 Risk matrix for the Nkran MRE | 212 |
| Table 14-27 Data coding | 216 |
| Table 14-28 Naïve statistics per domain | 220 |
| Table 14-29 Comparison of grade statistics pre- and post-compositing | 222 |
| Table 14-30 Composite statistics per domain | 222 |
| Table 14-31 Top-cut statistics per domain | 223 |
| Table 14-32 In situ dry bulk densities assigned to domains | 224 |
| Table 14-33 Block model dimensions | 224 |
| Table 14-34 Block model attributes | 224 |
| Table 14-35 Variogram models for Au grade | 230 |
| Table 14-36 Change of Support calculations | 233 |
| Table 14-37 Statistical validation of main domains | 237 |
| Table 14-38 Assumptions considered for selection of reporting cut-off grade | 242 |
| Table 14-39 Esaase Mineral Resource as a 0.5 g/t Au cut-off as at 31 December 2019 | 242 |
| Table 14-40 Risk matrix for the Esaase MRE | 243 |
| Table 14-41 Naïve statistics (length-weighted) for full dataset | 250 |
| Table 14-42 Naïve statistics (length-weighted) for exploration dataset | 250 |
| Table 14-43 Top-cut statistics per domain | 251 |
| Table 14-44 Classification criteria | 252 |
| Table 14-45 Assumptions considered for selection of reporting cut-off grade | 253 |
| Table 14-46 Akwasiso Mineral Resource at a 0.5 g/t Au cut-off as at 31 December 2019 | 254 |
| Table 14-47 Risk Matrix for the Akwasiso MRE | 255 |
| Table 14-48 Block model fields | 261 |
| Table 14-49 Dry bulk density statistics | 262 |
| Table 14-50 Drill hole spacing confidence classification criteria | 262 |
| Table 14-51 Assumptions considered for selection of reporting cut-off grade | 263 |
| Table 14-52 Abore Mineral Resource reported at a 0.5 g/t Au cut-off as at 31 December 2019 | 264 |
| Table 14-53 Variogram parameters | 269 |
| Table 14-54 Dry bulk density values assigned to the block model | 269 |
| Table 14-55 Classification criteria | 270 |
| Table 14-56 Assumptions considered for selection of reporting cut-off grade | 271 |
|
Asanko Gold Inc. NI 43-101 Technical Report on Asanko Gold Mine, Ghana |
| Table 14-57 Asuadai Mineral Resource reported at a 0.5 g/t Au cut-off as at 31 December 2019 | 272 |
| Table 14-58 Variogram parameters | 277 |
| Table 14-59 Dry bulk density values assigned to the block model | 278 |
| Table 14-60 Classification criteria | 278 |
| Table 14-61 Assumptions considered for selection of reporting cut-off grade | 279 |
| Table 14-62 Adubiaso Mineral Resource reported at a 0.5 g/t Au cut-off as at 31 December 2019 | 279 |
| Table 15-1 Summary of the Mineral Reserves as at 31 December 2019 | 281 |
| Table 15-2 Asanko Gold - MSO parameters by deposit | 284 |
| Table 15-3 Mining models used for mine planning | 284 |
| Table 15-4 Modifying Factors applied for mine planning | 285 |
| Table 15-5 Overall wall angles applied for pit optimisations | 286 |
| Table 15-6 Common parameters | 286 |
| Table 15-7 Process recoveries | 286 |
| Table 15-8 Mining cost parameters | 287 |
| Table 15-9 Selected shells for design | 288 |
| Table 15-11 Design parameters | 291 |
| Table 15-12 Pit design to pit shell reconciliation | 296 |
| Table 15-13 Cut-off grade calculations | 297 |
| Table 15-14 Nkran Mineral Reserve comparison - 31 December 2016 vs 31 December 2019 | 298 |
| Table 15-15 Esaase Mineral Reserve comparison - 31 December 2016 vs 31 December 2019 | 300 |
| Table 15-16 Satellite Pits Mineral Reserve comparison - 31 December 2016 vs 20 December 2019 | 301 |
| Table 16-1 Asanko Gold roster | 305 |
| Table 16-2 Acceptance criteria | 307 |
| Table 16-3 Nkran Cut 2 recommended design parameters | 310 |
| Table 16-4 Nkran Cut 3 recommended design parameters | 313 |
| Table 16-5 Esaase recommended slope parameters | 316 |
| Table 16-6 Satellite Pits recommended slope parameters | 316 |
| Table 16-7 Percent free dig vs blasting | 318 |
| Table 16-8 Blast design parameters | 318 |
| Table 16-9 Waste rock dump capacities by deposit | 328 |
| Table 16-10 Stockpile capacity requirements by deposit | 330 |
| Table 16-11 Haulage distance by deposit | 330 |
| Table 16-12 Material type bins used for scheduling | 334 |
| Table 16-13 Scheduling inventory | 335 |
| Table 16-14 Approximate vertical advance (m) by deposit/cut | 337 |
| Table 16-15 Mining schedule annual summary | 340 |
| Table 16-16 Current mining equipment at Nkran | 341 |
| Table 16-17 Current mining equipment at Esaase | 341 |
| Table 16-18 Current mining equipment at Akwasiso | 342 |
| Table 16-19 Mining equipment productivity summary | 342 |
| Table 16-20 PW Mining auxiliary equipment | 345 |
| Table 16-21 Estimated total mining contractor labour requirements | 350 |
| Table 17-1 Obotan 5.4 Mtpa key process plant design criteria | 353 |
| Table 17-2 AGM Obotan process plant major equipment | 355 |
| Table 18-1 Design rainfall intensity, duration and recurrence intervals | 368 |
| Table 18-2 Project haul road design parameters | 371 |
| Table 18-3 LOM fuel volumes | 376 |
| Table 19-1 Off-take agreement capacity analysis | 377 |
| Table 20-1 Summary of meetings with local stakeholders | 387 |
| Table 20-2 Stakeholder groups and committee membership | 388 |
| Table 20-3 Waste types and their management and disposal | 396 |
| Table 21-1 Capital estimate summary | 401 |
| Table 21-2 Operating cost summary | 403 |
| Table 22-1 Responsible party for economic aspects | 405 |
| Table 22-2 Total capital costs | 405 |
| Table 22-3 Principal assumptions | 406 |
| Table 22-4 Project cashflow extract | 408 |
|
Asanko Gold Inc. NI 43-101 Technical Report on Asanko Gold Mine, Ghana |
| Table 22-5 Project NPV results (in US$ M) | 409 |
| Table 22-6 Sensitivity factors applied | 410 |
| Table 22-7 Commodity price and discount rate sensitivity analysis (NPV in US$ M) | 411 |
| Table 23-1 Adjacent property listing | 412 |
| Table 24-1 TSF design summary for LOM development | 417 |
|
Asanko Gold Inc. NI 43-101 Technical Report on Asanko Gold Mine, Ghana |
1 SUMMARY
1.1 Introduction
This report is a National Instrument 43-101 (NI 43-101) Technical Report on the updated Life of Mine (LOM) Study of the Asanko Gold Mine (AGM). This Technical Report supersedes the following previous reports:
-
Definitive Feasibility Study (DFS 2017) prepared by DRA Projects (Pty) Limited on behalf of Asanko Gold Inc (Asanko Gold)
-
NI 43-101 Technical Report prepared by DRA Projects (Pty) Limited on behalf of Asanko Gold Inc in June 2017
-
Amended NI 43-101 Technical Report in December 2017. Amendments involved changing the Mineral Resource gold price from US$2,000 per ounce (/oz) to US$1,500/oz, and to remove the Inferred Resource from the economic analysis.
Following the conclusion of a 50/50 Joint Venture transaction with a subsidiary of Gold Fields on 31 July 2018, Asanko Gold holds a 45% economic interest in the AGM and gold exploration tenements (collectively the "joint venture" or JV) on both the Asankrangwa and Sefwi Gold Belts in the Republic of Ghana (Ghana), West Africa. The ownership structure of the JV is 45% Asanko Gold, 45% Gold Fields with the remaining 10% held by the Government of Ghana as a free-carried equity interest. The AGM concessions, the Obotan and Esaase project areas, are located in the Amansie West District of the Ashanti Region of Ghana (Figure 1-1 and Figure 1-2).
The AGM is a multi-deposit complex with two main deposits, Nkran and Esaase, eight satellite deposits and a carbon-in-leach (CIL) processing plant with a current operating capacity of five million four hundred thousand tonnes per annum (Mtpa). Operations successfully commenced in January 2016 following an 18-month construction period. The LOM Study is based on the current operations and updated resources and reserves as outlined in this report.
The LOM Study (with associated supporting documentation) is considered to have been compiled to the level of confidence as presented in a Preliminary Feasibility Study (PFS). The term "Preliminary-Feasibility Study" has the meaning ascribed by the Canadian Institute of Mining, Metallurgy and Petroleum (CIM), as the CIM Definition Standards on Mineral Resources and Mineral Reserves adopted by CIM Council, and amended as of May 2014 (CIM, 2014). Under CIM guidelines, AGM is a "production property" - property on which mining is taking place; with adjacent "development property" sections (properties that are being prepared for mineral production and for which economic viability has been demonstrated by a PFS).
This Technical Report has been prepared on behalf of Asanko Gold, a gold mining company listed on the Toronto Stock Exchange (TSX) and New York Stock Exchange American (NYSE-American).
The 2019 LOM Study includes the following over the period considered:
-
Open pit gold mining from the current Nkran, Esaase, Akwasiso and future Abore, Asuadai and Adubiaso reserves. Mining will be completed in just over eight years ramping up over the first three years to a peak of 60 Mtpa of ore and waste in 2022 to 2024
-
A Measured and Indicated Mineral Resource of 2.3 Mt at 0.76 g/t gold (57 kilo-ounces or koz) and 61.7 Mt at 1.74 g/t gold (3,447 koz), respectively
-
The Measured and Indicated Resources are inclusive of Proven and Probable Mineral Reserve totalling 2.3 Mt at 0.76 g/t gold (57 koz) and 51.1 Mt at 1.41 g/t gold (2,320 koz), respectively
-
Additional Inferred Mineral Resources of 7.0 Mt at 1.59 g/t gold (357 koz)
-
The metallurgical process plant, currently in full operation, is a combination gravity/CIL circuit operating at a throughput of circa 5.4 Mtpa dry ore feed. Including existing Run of Mine (ROM) stockpiles of 2.3 Mt, the processing plant will be in operation for 10 years
|
Asanko Gold Inc. NI 43-101 Technical Report on Asanko Gold Mine, Ghana |
-
The process plant will process an average of 5.4 Mtpa of ore over the LOM as presented. Gold production is an average of 245,000 oz per annum for the first seven years. Thereafter gold production tapers off as lower-grade ROM stockpiles are fed into the plant to augment ore from depleted mining operations
-
Cash operating costs of US$860/oz for the next 8 years, increasing to US1,120/oz for the last two years while low grade stockpiles are fed into the plant
-
Total capital expenditure of US$249 million (including closure costs of US$60.2 million) over the LOM
-
NPV of US$291 million at a realised gold price of US$1,400/oz and real discount rate of 5%.
The capital cost (capex) estimate for this Project has been developed to a Class 3 level of accuracy (+/- 25%). The capex estimates have a base date of Q4 2019.
This report has been prepared in accordance with the terminology, definitions and guidelines of CIM (2014) and the Rules and Policies of the Canadian Securities Administrators National Instrument 43-101 Standards of Disclosure for Mineral Projects, Form 43-101 F1 and Companion Policy 43-101CP (NI 43-101).
CSA Global (UK) Ltd (CSA Global), Snowden Mining and Industry Consultants (Snowden), DRA Global (DRA), ABS Africa (Pty) Ltd, Ernst & Young Advisory Services (Pty) Ltd (EY), Knight Piésold, Wood Mining South Africa (Pty) Ltd (Wood) and SRK (South Africa) (Pty) Ltd (SRK), collectively referred to as the Authors, were commissioned by Asanko Gold to produce the LOM Study for the Project. The Project includes the AGM, planned mining and production expansions, proposed capital expenditure, and extension of mine life.
Metric units have been used throughout this report. All currency values are expressed in United States dollars (US$) exclusively, unless otherwise stated. 'Section' and 'Item' have been used interchangeably in this Technical Report.
1.2 Property description and ownership
The AGM mining concessions, the Obotan and Esaase project areas, are 250 km NW of the capital of Ghana (Accra), and about 50 km to 80 km southwest of the regional capital of Kumasi (Figure 1-1). The terms 'mining leases' and 'mining licences' have been used interchangeably below.
Asanko Gold holds seven mining leases (Table 1-1), as well as prospecting and reconnaissance licences, which collectively make up the AGM operations and span 40 km strike length of the Asankrangwa Belt. The mining lease concessions cover an area of approximately 228 km2. The Esaase, Abore, Abirem, Datano, Jeni River and Adubea mining leases contain all the mineral resources defined to date. All other concessions held by Asanko Gold in the area contain exploration potential defined to date. The Ghana Environmental Protection Agency (EPA) grants permits on a perennial basis to conduct exploration. The Authors have relied on Asanko Gold's confirmation that all necessary permits are in place for the operation.
All concessions carry a 10% free carried interest in favour of the Ghanaian government under Section 8 of the Ghanaian Mining Act. The government interest is reflected in a 10% ownership of the operating company, and the government has a right to 10% of any dividends paid by Asanko Gold Ghana Limited (Asanko Gold Ghana). The leases are also subject to a 5% Net Smelter Return (NSR) royalty payable to the Government of Ghana. In addition, the Adubea concession is also subject to an additional 0.5% NSR royalty payable to the original concession owner. The Esaase mining lease is also subject to an additional 0.5% NSR royalty payable to the Bonte Liquidation Committee (BLC). The Akwasiso pit on the Abirem mining lease is also subject to an additional 2% NSR royalty payable to the original concession owner.
|
Asanko Gold Inc. NI 43-101 Technical Report on Asanko Gold Mine, Ghana |
On advice from Asanko Gold, under the current ownership arrangement and status of holdings, there is no environmental liability held over Asanko Gold for any of the AGM concessions relating to the Project area, with the exception of project works to date.
Table 1-1 Asanko Gold mining licences
|
Tenement name |
Licence category |
Title ownership |
Minerals Commission file |
Status of licence/expiration date |
Licence area (km²) |
|
Datano |
Mining Lease |
Asanko Gold |
PL 6/32/Vol 3 |
Valid-ML* |
53.78 |
|
Abore |
Mining Lease |
PL 6/303 |
Valid-ML 7/2031 |
28.47 |
|
|
Abirem |
Mining Lease |
PL 6/303 |
Valid-ML* |
47.13 |
|
|
Adubea |
Mining Lease |
PL 6/310 |
Valid-ML 7/2028 |
13.38 |
|
|
Esaase |
Mining Lease |
PL 6/8/Vol.8 |
Valid-ML 9/2020 |
27.03 |
|
|
Jeni River |
Mining Lease |
RL 6/21 |
Valid-ML 3/2020 |
43.41 |
|
|
Miradani |
Mining Lease |
|
PL 6/122 |
Valid-ML 5/2025 |
14.98 |
Note: * Renewal applications have been submitted for the Datano and Abirem mining leases (May 2019) and Asanko Gold does not foresee any complications with the renewal process
There is a potential environmental liability on the Company's Jeni River concession which was inherited with the acquisition of the concessions and is not material to the Company but is reported in its recent financial statements as an Asset Retirement Obligation.
|
Asanko Gold Inc. NI 43-101 Technical Report on Asanko Gold Mine, Ghana |
Figure 1-1 Location of the AGM tenements
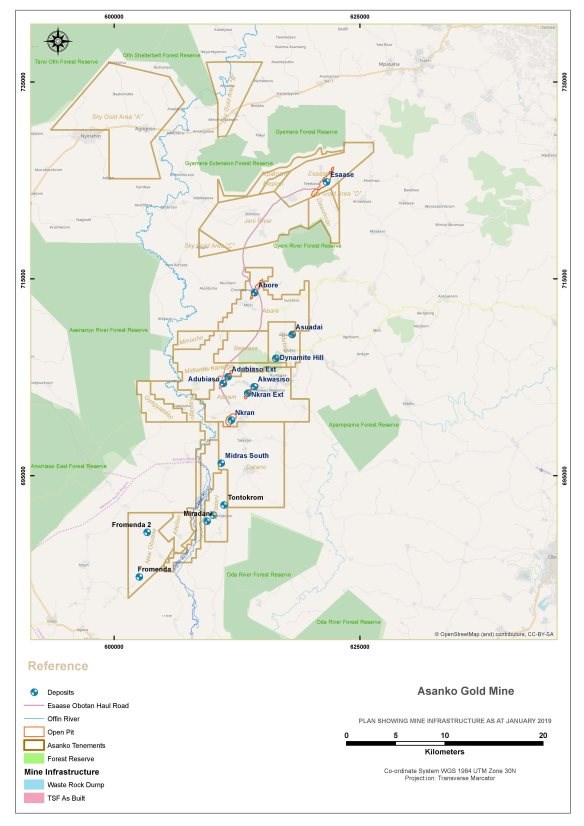
Source: Asanko Gold, 2019
|
Asanko Gold Inc. NI 43-101 Technical Report on Asanko Gold Mine, Ghana |
1.3 Geology and mineralisation
The geology of Ghana is dominated by predominantly metavolcanic paleoproterozoic Birimian Supergroup (2.25 - 2.06 billion years ago) sequences inclusive of the clastic Tarkwaian Group sediments (2.12 - 2.14 billion years), in the central-west and northern parts of the country. Clastic shallow water sediments of the Neoproterozoic Volta Basin cover the northeast of the country (Figure 1-2). A small strip of Paleozoic and Cretaceous to Tertiary sediments occur along the coast and in the extreme southeast of the country.
In Ghana, the Paleoproterozoic Birimian terrains consist of five linear northeast-trending volcanic belts with intervening sedimentary basins. The volcanic belts have been folded by multiple deformation events and are generally 15-40 km wide and extend for several hundred kilometres laterally (Leube, et al., 1990). The Kumasi Basin is 90 km wide and lies between the Ashanti Belt to the south-east and the Sefwi Belt to the north-west. The Kumasi Basin also continues under the Neoproterozoic Volta Basin to the north east and is covered by more recent Phanerozoic sediments and the Atlantic Ocean to the south-west.
The combined Sefwi and Ashanti volcanic belts and intervening Kumasi Basin host the vast majority of the gold endowment in Ghana (Figure 1-2); gold deposit and prospect locations are shown as yellow dots on the main map and red dots in the insert.
Figure 1-2 Regional geology map of south-west Ghana, West Africa
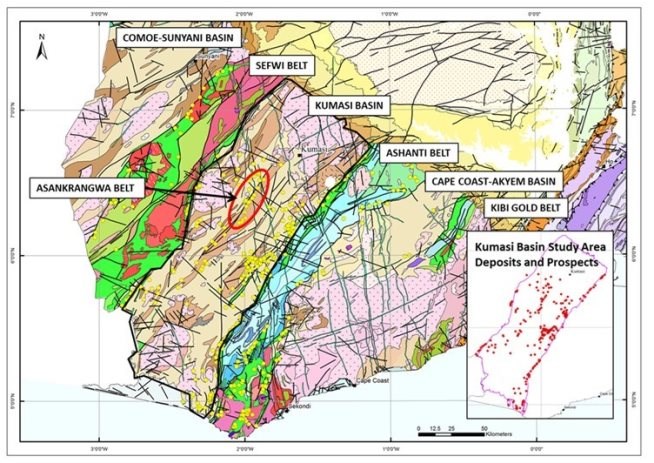
Source: Modified from Agyei Duodu, et al., 2009
1.4 Status of exploration, development and operations
Extensive exploration has been completed in the areas of interest over many decades by numerous companies and interested parties.
|
Asanko Gold Inc. NI 43-101 Technical Report on Asanko Gold Mine, Ghana |
In 2013, 3D litho-structural models for all of the AGM deposits were completed. This increased the geological and structural understanding, as well as introduce improved geological and structural controls into subsequent Mineral Resource estimates (MREs) of the AGM deposits. The process involved geological and structural re-logging of drill core, interpretation of historic flitch diagrams, and use of LeapfrogTM software to produce the 3D litho-structural models.
In addition to the creation of the 3D litho-structural models, Asanko Gold initiated a prospectively mapping analysis of the Asankrangwa Belt in collaboration with Corporate Geoscience Group (CGSG). This exercise provided a basis to collate available regional geophysical and geological data, as well as drilling and geochemical survey information.
During 2016, Asanko Gold completed a full (72 borehole) re-log of the Nkran deposit, and subsequently updated the 3D litho-domaining used for the Nkran MRE.
Between 2016 and 2019 additional drilling has been ongoing for most ore bodies listed, continued re-logging and pit mapping, resulting in improved geological and structural interpretations, especially for Nkran, Esaase and Akwasiso. All this information has formed the basis of the revised 2019 Mineral Resources and Reserve estimates.
Greenfields project development for the construction of a 3 Mtpa processing facility and associated infrastructure was approved by the Asanko Gold Board of Directors in July 2014 and DRA (South Africa) was awarded an engineering, procurement, construction management (EPCM) contract immediately following approval. Contractor mobilization to site occurred in August 2014 and the development was successfully commissioned in Q1 2016 with commercial production declared in Q2 2016, ahead of schedule and under budget.
The subsequent further expansion to accommodate a 5 Mtpa plant throughput was approved by the Asanko Gold Board in November 2016. Over the course of 2017 the expansion to 5 Mtpa was commissioned in stages for a total capital cost of approximately US$29 million. Through 2018 and 2019 the plant outperformed expectations with milling rates of 5.4 Mtpa. To date, Asanko Gold Ghana has processed a total of 17.5 Mt to produce 842,000 oz Au from the Nkran pit, Akwasiso pit, Dynamite Hill pit and the newly developed Esaase pit.
1.5 Mineral Resource estimates (MREs)
MREs are reported for six deposits - all updated since the previous NI 43-101 (2017) report. Referencing Table 1-2, CSA Global compiled the updated MREs for Nkran, Esaase and Akwasiso. The updated MREs for Abore, Adubiaso and Asuadai were compiled by the Asanko Gold technical team under supervision of the CSA Global Qualified Person (QP).
The MREs are reported in compliance with the definitions and guidelines for the reporting of Exploration Information, Mineral Resources and Mineral Reserves in Canada, as per CIM (2014). These MREs adhere to the rules, policies and standards of disclosure for NI 43-101 (as discussed in Section 1.1).
The effective date of the Mineral Resource (comprising six deposits) is 31 December 2019, presented in the form of a combined global Mineral Resource table (Table 1-2). The 2019 Mineral Resource conforms to CIM (2014) and NI 43-101. The Esaase Resources below includes the Mineral Resources contained in both the Esaase Main and Esaase South pits (as described in the Mineral Resource Estimate).
|
Asanko Gold Inc. NI 43-101 Technical Report on Asanko Gold Mine, Ghana |
Table 1-2 Asanko Gold Mineral Resource as at 31 December 2019 at a 0.5 g/t Au cut-off
|
Deposit |
Measured & Indicated |
Inferred |
||||
|
Tonnes (Mt) |
Au grade |
Au content (koz) |
Tonnes (Mt) |
Au grade |
Au content (koz) |
|
|
Nkran |
8.5 |
2.14 |
586 |
- |
- |
- |
|
Esaase |
43.2 |
1.69 |
2,348 |
5.4 |
1.54 |
269 |
|
Akwasiso |
2.8 |
1.82 |
165 |
0.4 |
2.16 |
29 |
|
Abore |
4.7 |
1.46 |
221 |
0.9 |
1.69 |
48 |
|
Asuadai |
1.3 |
1.32 |
55 |
0.0 |
1.24 |
2 |
|
Adubiaso |
1.2 |
1.88 |
71 |
0.2 |
1.43 |
9 |
|
Stockpiles |
2.3 |
0.76 |
57 |
|
|
|
|
Total |
64.1 |
1.70 |
3,504 |
7.0 |
1.59 |
357 |
|
Notes: |
||||||
|
• The effective date of the Mineral Resource is 31 December 2019 • Mineral Resources are reported at a cut-off grade of 0.5 g/t gold assuming a metal price of US$1,500/oz Au • Mining, G&A, processing costs, and process recovery are dependent on deposit and detailed in the respective deposit sections • Figures are rounded to the appropriate level of precision for the reporting of Mineral Resources • Due to rounding, some columns or rows may not compute as shown • The Mineral Resource is stated as in situ dry metric tonnes • The Mineral Resource is classified under the guidelines of CIM (2014), and procedures for classifying the reported Mineral Resources were undertaken within the context of the NI 43-101 • Mineral Resources that are not Mineral Reserves do not have demonstrated economic viability. The estimate of Mineral Resources may be materially affected by environmental, permitting, legal, title, taxation, socio-political, marketing, or other relevant issues • The Mineral Resource is reported inclusive of Mineral Reserves • The Nkran, Esaase and Akwasiso MREs have been prepared by CSA Global who are independent of Asanko Gold. The Abore, Asuadai and Adubiaso MREs have been prepared by Gold Fields and reviewed and accepted by CSA Global • CSA Global does not know of any known legal, political, environmental, or other risks that could materially affect the potential development of the mineral resources. CSA Global considers the risks regarding permitting and socio-economic factors to be low. |
||||||
1.6 Mineral Reserve estimates (MRev)
The Mineral Reserve estimate (MRev) has been prepared as part of the LOM Study by CSA Global using CIM (2014) procedures for Mineral Reserve classification. The reported Mineral Reserves were undertaken within the context of the NI 43-101.
The Mineral Reserves were derived from the Mineral Resource block models and estimates. The Mineral Reserves are based on the Measured and Indicated Mineral Resources that have been identified as being economically extractable and which incorporate mining losses and the addition of waste dilution. The Mineral Reserve estimate as at 31 December 2019 is provided in Table 1-3.
|
Asanko Gold Inc. NI 43-101 Technical Report on Asanko Gold Mine, Ghana |
Table 1-3 Asanko Gold Mineral Reserve, as at 31 December 2019
|
Deposit |
Proven |
Probable |
Total |
||||||
|
Tonnes (Mt) |
Au Grade (g/t) |
Au Content (koz) |
Tonnes (Mt) |
Au Grade (g/t) |
Au Content (koz) |
Tonnes (Mt) |
Au Grade (g/t) |
Au Content (koz) |
|
|
Nkran |
|
|
|
10.9 |
1.64 |
577 |
10.9 |
1.64 |
577 |
|
Esaase Main |
|
|
|
29.1 |
1.33 |
1,245 |
29.1 |
1.33 |
1,245 |
|
Esaase South |
|
|
|
4.5 |
1.44 |
210 |
4.5 |
1.44 |
210 |
|
Akwasiso |
|
|
|
1.9 |
1.43 |
87 |
1.9 |
1.43 |
87 |
|
Abore |
|
|
|
2.8 |
1.42 |
127 |
2.8 |
1.42 |
127 |
|
Adubiaso |
|
|
|
0.8 |
1.51 |
38 |
0.8 |
1.51 |
38 |
|
Asuadai |
|
|
|
1.0 |
1.12 |
37 |
1.0 |
1.12 |
37 |
|
Stockpiles |
2.3 |
0.76 |
57 |
|
|
|
2.3 |
0.76 |
57 |
|
Total |
2.3 |
0.76 |
57 |
51.1 |
1.41 |
2,320 |
53.4 |
1.38 |
2,377 |
Notes:
• The effective date of the Mineral Reserve is 31 December 2019 based on projected mining depletions
• Mineral Reserves are reported assuming a gold price of US$1,300/oz
• Mineral Reserves are defined within pit designs guided by pit shells derived from Whittle Four-X™ software (Whittle)
• Mineral Reserves are reported based on the maximum of: (a) the calculated marginal cut-off grades for each of the pits ranging between 0.38 - 0.71 g/t gold, and (b) 0.50 g/t gold
• Mining, G&A, processing costs, and process recovery are dependent on deposit and detailed in the respective deposit sections.
• Figures are rounded to the appropriate level of precision for the reporting of Mineral Reserves. Due to rounding, some columns or rows may not compute as shown
• The Mineral Reserve is stated as in situ dry metric tonnes
• The mine plan underpinning the Mineral Reserves has been prepared by Snowden and reviewed and accepted by the CSA Global. Both Snowden and CSA Global are independent of Asanko Gold
• In accordance with the CIM definitions and guidelines (2014) the reporting of Mineral Reserves is classified as either "Probable" or "Proven" Mineral Reserves and are based on Indicated and Measured Mineral Resources only. For the LOM Study, no Mineral Reserves have been estimated using Inferred Mineral Resources.
• CSA Global does not know of any known legal, political, environmental, or other risks that could materially affect the potential development of the Mineral Reserves.
1.7 Mining
1.7.1 Mining schedule
Mining takes place over eight years (Figure 1-3), ramping up over the first three years to a peak of 60 Mtpa of ore and waste in 2022 to 2024. The mining rate peaks during this period whilst waste stripping for Nkran Cut 3 is being completed.
|
Asanko Gold Inc. NI 43-101 Technical Report on Asanko Gold Mine, Ghana |
Figure 1-3 Mining schedule by deposit
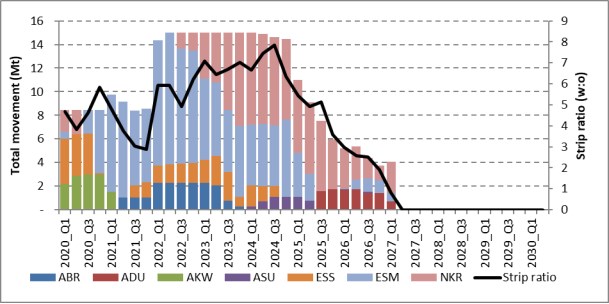
Note: ABR - Abore; ADU - Adubiaso; AKW - Akwasiso; ASU - Asuadai; ESS - Esaase South; ESM - Esaase Main; NKR - Nkran
The Esaase haulage to the Obotan plant is variable over the LOM, largely dependent on the feed available from Nkran and other satellite ore sources (Figure 1-4).
Figure 1-4 Esaase haulage schedule

Note: ESS - Esaase South; ESM - Esaase Main
Stockpile inventories of approximately 14 Mt are built up for the Project (Figure 1-5). The largest inventory is at Esaase, with a peak stockpile size of 11.1 Mt. The stockpile grade averages approximately 0.7 - 0.8 g/t Au and is predominantly marginal grade ore, planned to be depleted at the end of the mine life.
|
Asanko Gold Inc. NI 43-101 Technical Report on Asanko Gold Mine, Ghana |
Figure 1-5 Long-term stockpile balance
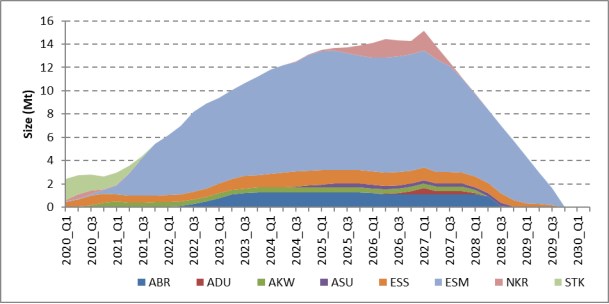
Note: ABR - Abore; ADU - Adubiaso; AKW - Akwasiso; ASU - Asuadai; ESS - Esaase South; ESM - Esaase Main; NKR - Nkran; STK - Stockpile.
The plant operates at current operating capacity for most of the LOM (Figure 1-6), except for half a year in 2025, when higher grade is being processed (thus meeting the gold production target with fewer processed tonnes).
Figure 1-6 Processing schedule by deposit
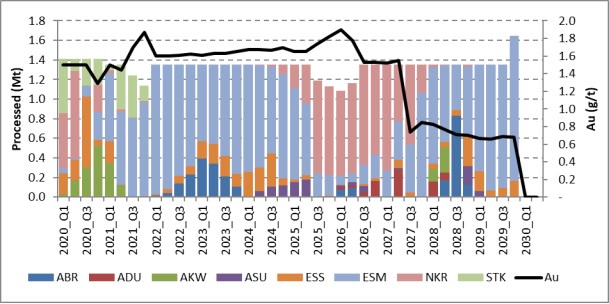
Note: ABR - Abore; ADU - Adubiaso; AKW - Akwasiso; ASU - Asuadai; ESS - Esaase South; ESM - Esaase Main; NKR - Nkran; STK - Stockpile
The gold production schedule (Figure 1-7) achieves the target for the majority of the first eight years. Following this production drops to approximately 100 koz/a when the mining operation is exhausted and low-grade stockpiles are being depleted. Reclaiming of these low-grade stockpiles could be deferred if additional ore sources are identified in future exploration.
|
Asanko Gold Inc. NI 43-101 Technical Report on Asanko Gold Mine, Ghana |
Figure 1-7 Gold production schedule by deposit

Note: ABR - Abore; ADU - Adubiaso; AKW - Akwasiso; ASU - Asuadai; ESS - Esaase South; ESM - Esaase Main; NKR - Nkran; STK - Stockpile
An annual summary of the mining schedule is provided in Table 1-4.
Table 1-4 Planned mining production schedule
|
Component/area |
Total |
2020 |
2021 |
2022 |
2023 |
2024 |
2025 |
2026 |
2027 |
2028 |
2029 |
|
Mining |
|
|
|
|
|
|
|
|
|
|
|
|
Total ex-pit movement (Mt) |
304.3 |
33.8 |
35.9 |
59.4 |
60.0 |
59.0 |
33.6 |
18.7 |
4.1 |
- |
- |
|
Abore |
17.6 |
- |
3.1 |
9.1 |
5.4 |
- |
- |
- |
- |
- |
- |
|
Adubiaso |
10.3 |
- |
- |
- |
- |
- |
3.3 |
6.3 |
0.7 |
- |
- |
|
Akwasiso |
12.6 |
11.1 |
1.5 |
- |
- |
- |
- |
- |
- |
- |
- |
|
Asuadai |
5.1 |
- |
- |
- |
- |
3.2 |
1.8 |
0.1 |
- |
- |
- |
|
Esaase South |
31.2 |
10.9 |
2.3 |
6.3 |
7.6 |
4.0 |
0.0 |
- |
- |
- |
- |
|
Esaase Main |
134.4 |
7.9 |
28.9 |
41.1 |
24.5 |
22.0 |
6.1 |
3.3 |
0.7 |
- |
- |
|
Nkran |
93.0 |
3.9 |
- |
2.9 |
22.5 |
29.8 |
22.3 |
9.0 |
2.6 |
- |
- |
|
Strip ratio (w:o) |
5.0 |
4.7 |
3.6 |
5.7 |
6.8 |
7.0 |
4.8 |
2.5 |
0.8 |
- |
- |
|
Ex-pit waste movement (Mt) |
253.2 |
27.8 |
28.0 |
50.5 |
52.3 |
51.6 |
27.8 |
13.3 |
1.8 |
- |
- |
|
Ex-pit ore mined (Mt) |
51.1 |
6.0 |
7.9 |
8.9 |
7.7 |
7.3 |
5.8 |
5.3 |
2.2 |
- |
- |
|
Grade mined (g/t) |
1.41 |
1.38 |
1.38 |
1.24 |
1.34 |
1.43 |
1.56 |
1.60 |
1.68 |
- |
- |
|
Long-term stockpiling |
|
|
|
|
|
|
|
|
|
|
|
|
Stockpile size (Mt) |
14.3 |
2.7 |
5.4 |
8.9 |
11.2 |
13.1 |
13.9 |
14.3 |
11.1 |
5.7 |
0.0 |
|
Stockpile grades (g/t) |
|
0.68 |
0.82 |
0.76 |
0.74 |
0.74 |
0.73 |
0.73 |
0.71 |
0.67 |
- |
|
Processing |
|
|
|
|
|
|
|
|
|
|
|
|
Total processed (Mt) |
53.4 |
5.7 |
5.1 |
5.4 |
5.4 |
5.4 |
5.0 |
4.9 |
5.4 |
5.4 |
5.7 |
|
Grade processed (g/t) |
1.38 |
1.45 |
1.62 |
1.61 |
1.63 |
1.68 |
1.71 |
1.67 |
1.16 |
0.75 |
0.67 |
|
Oxide % |
27% |
28% |
50% |
39% |
20% |
20% |
20% |
20% |
20% |
20% |
31% |
|
Asanko Gold Inc. NI 43-101 Technical Report on Asanko Gold Mine, Ghana |
1.8 Minerals processing and metallurgical testwork
1.8.1 Minerals processing facility
The existing process plant has the capacity to treat approximately 5.4 Mtpa of total ore, comprised of both Fresh and Oxide ores from the Obotan complex and Esaase. The key process design criteria (PDC) are shown in Table 1-5 and the process block flow diagram in Figure 1-8.
Table 1-5 Obotan key process plant design criteria for 5.4 Mtpa throughput
|
Parameter |
Units |
Value |
|
Crushing plant running time |
Hours/annum (hpa) |
5,125 |
|
Crushing plant feed rate |
Tonnes per hour (tph) |
1,054 |
|
Milling & CIL plant running time |
hpa |
8,000 |
|
Milling & CIL plant feed rate |
Tph |
675 |
|
LOM Au head grade |
g/t |
1.40 |
|
LOM gravity gold recovery |
% |
50 |
|
ROM feed size (F100) |
Mm |
800 |
|
SAG mill feed size (F100) |
Mm |
300 |
|
SAG mill feed size (P80) |
Mm |
125 |
|
Leach feed size (F80) |
µm |
106 |
|
Pre leach (1 stage) |
hr |
2.1 |
|
CIL (7 stages) |
hr |
15.0 |
|
CIL slurry feed density |
% w/w |
50.2 |
|
CIL feed grade |
Au g/t |
0.846 |
|
LOM average CIL cyanide consumption |
kg/t |
0.10 |
|
LOM average lime consumption |
kg/t |
0.14 |
|
Elution circuit type |
|
Split AARL |
|
Elution circuit size |
t |
5 |
|
Frequency of elution |
batches/day |
2.0 |
Note: SAG - Semi-autogenous; CIL - carbon in leach; LOM - Life of Mine; ROM - Run of Mine;
AARL - Anglo American Research Laboratories
|
Asanko Gold Inc. NI 43-101 Technical Report on Asanko Gold Mine, Ghana |
Figure 1-8 Obotan plant, 5.4 Mtpa block flow diagram
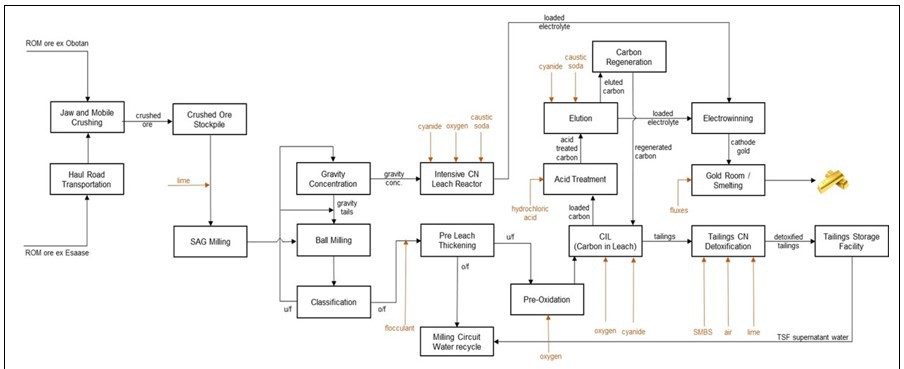
|
Asanko Gold Inc. NI 43-101 Technical Report on Asanko Gold Mine, Ghana |
1.8.2 Metallurgical testwork and process development
Historical metallurgical testwork campaigns for proposed expansions phases for AGM have included the following:
-
Phase 1 (2014 - 2015) - metallurgical response evaluation of a gravity-CIL circuit (as per the existing AGM design) and a gravity-flotation-CIL circuit (as per the Esaase PFS design) when treating blends of Esaase and Obotan ores. Testwork also considered potential carbon poisoning by flotation reagents
-
Phase 2 (2015 - 2016) - combined processing of gravity-CIL circuit tailings and flotation concentrate regrind product (from a gravity-flotation-CIL circuit), through a combined CIL circuit when treating blends of Esaase and Obotan ore types. Diagnostic testwork was also conducted on the treatment of Nkran material through a gravity-flotation-CIL circuit.
In 2018 an additional limited testwork campaign was initiated. The purpose of the program was to address two key technical aspects with respect to the Esaase fresh ore component, namely to:
-
Create a better understanding of the structural geology of the ore body
-
Formulate a metallurgical test program that would focus on the structural interpretation and its different lithologies which would then lead into the creation of a future geometallurgical model and a more defined recovery profile
The key component of the geometallurgy of the Fresh, unoxidised gold mineralisation at Esaase, is the distribution and abundance of organic carbon (OC) which shows enrichment in the following areas:
-
Within and immediately adjacent to the NE-SW trending shear zones and sheared lithological contacts within the stratigraphic units
-
Within the deformed shales and siltstones of the identified "Cobra" unit.
One of the planned outputs of this metallurgical testwork campaign was the development of an unbiased recovery model which reflects the distribution and abundance of organic carbon (OC) and is therefore applicable to all sections of the ore body. The testwork campaign also considered comparative benchmark performance relative to the Nkran ore body which had experienced similar OC enrichment.
The OC content variances were determined by appropriate drill core sampling and assaying, with the Cobra unit identified as a distinctly elevated OC geometallurgical domain (narrow 2-5 m intervals of greater than 0.5% OC). The OC content levels in the central sandstone zone are significantly lower (Table 1-6).
Table 1-6 Percent OC populations by stratigraphic unit (in %)
|
Stratigraphic unit |
Probability of OC above 0.5% threshold |
Mean %OC of sample population below threshold |
Mean %OC of sample population above threshold |
|
Upper |
15 |
0.30 |
0.84 |
|
Cobra |
55 |
0.38 |
0.89 |
|
Central Sandstone |
12 |
0.30 |
0.62 |
|
Python |
26 |
0.32 |
0.62 |
Geological observations from ongoing pit mapping (linked to drill hole %OC stratigraphic characterisation) suggests that elevated OC levels are predictable and occur within identifiable "structural domains" that are however not continuous across the full strike length of the Esaase Main and South deposits. Metallurgical sampling and testing completed in 2018/ 2019 is better aligned with the growing understanding of the resource geology but was biased towards the thinking at that time that the OC was more widespread (not necessarily diagnostic).
|
Asanko Gold Inc. NI 43-101 Technical Report on Asanko Gold Mine, Ghana |
Over the LOM of Nkran (3.5 years) the plant has achieved consistent recoveries exceeding 91.6%, notwithstanding the treatment of a blended ore comprising Oxides, Transition and Fresh and despite some mineralised lithologies with recorded preg-robbing characteristics. The recoveries achieved are shown in Table 1-7.
Table 1-7 Nkran (Obotan) historical annualised recovery
|
Annualised recovery |
2016 |
2017 |
2018 |
2019 |
|
Nkran Au recovery percent (%) |
91.6 |
94.3 |
93.8 |
93.8 |
Ore with OC values of greater than 0.5% would generally originate from the shear zones (Python and Cobra) within the Esaase LOM pit. Ore originating within these zones comprise approximately 15% of the LOM tonnage. These ores are easily distinguishable from the ores outside the shear zones and have the potential therefore to be separately mined and stockpiled.
Fresh Esaase ore has not yet been introduced into the process plant.
The predicted LOM recovery profile is indicated in Figure 1-9 below.
Figure 1-9 LOM grade and recovery profile
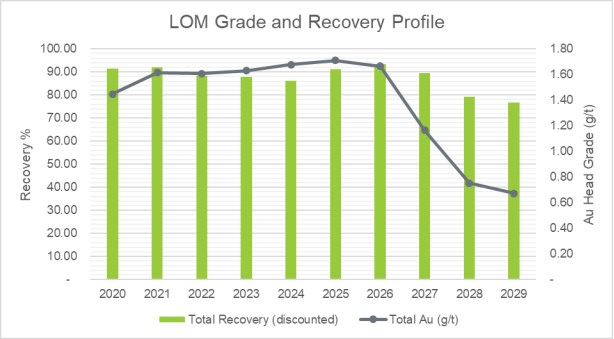
Table 1-8 shows the comparative (undiscounted) LOM recovery per ore body.
Table 1-8 Comparative LOM recovery per ore body
|
Ore body |
Recovery (%) |
Ore body |
Recovery (%) |
|
Abore |
93.8 |
Esaase Main |
86.2 |
|
Adubiaso |
93.9 |
Esaase South |
87.4 |
|
Akwasiso |
93.8 |
Nkran |
94.1 |
|
Asuadai |
93.1 |
Stockpiles |
86.9 |
Note: The overall LOM recovery is 89.1% (88.6% discounted due to soluble gold losses and carbon losses).
|
Asanko Gold Inc. NI 43-101 Technical Report on Asanko Gold Mine, Ghana |
1.9 Environmental studies, permitting and social community impact
1.9.1 Project permitting process
Two key regulatory permits are required for ongoing operations in Ghana:
-
The Mine Operating Permit (MOP) issued by the Minerals Commission
-
The environmental permit issued by the EPA.
These two permits are currently in good standing with the authorities but may require an amendment to be in alignment with the LOM Study description.
Following the required engagements, regulatory site visits and submission of the relevant project details, the AGM is currently operating under a MOP issued in November 2018. The MOP applies to the following licence areas:
-
LVD 110. 299/2013 - Abirem
-
LVD 21721/2012 located at Adubea
-
LVD 21722/20 located at Abore
-
LVD 3969A/90 located at Esaase.
The environmental permit for the current operations was approved in August 2019.
1.9.2 Environmental and social monitoring
Monitoring information is assessed against the Ghana EPA guidelines (January 2001) and international best practice guidelines for the mining industry, including:
-
IFC Environmental, Health & Safety Guidelines - Mining (December 2007)
-
IFC Performance Standards on Social and Environmental Sustainability (July 2006)
-
"Equator Principles III" 2013
-
The Government of Ghana and EPA's Environmental Performance Rating and Disclosure Methodology for Mining Companies (AKOBEN Programme)
-
Asanko Gold Ghana is monitoring and reporting on any environmental incidents that may occur as a result of its operations. Environmental incidents are classified into five different levels of severity. Asanko Gold has not recorded any level three incidents (e.g. spills that have impact outside the mine boundary) or above in its operating history.
1.9.3 Stakeholder engagement
Interactions include various stakeholder groups including the government, regulatory authorities and, particularly, members of communities that will be impacted by the operations.
The engagements follow the lines of free, prior and informed consent (FPIC) so as to ensure that, apart from legal and regulatory consent to the project, affected communities are fully informed about the Project, its potential technical and socio-economic impacts and interventions to mitigate these impacts.
1.9.4 Closure costs
An amount of US$60.2 million has been included in capex for closure costs.
1.10 Mine site and bulk infrastructure
The Obotan complex and process plant commenced production in early 2016. The plant was installed close to the Nkran ore deposit and several satellite orebodies. It is currently operating successfully at a throughput of circa 5.4 Mtpa ore.
|
Asanko Gold Inc. NI 43-101 Technical Report on Asanko Gold Mine, Ghana |
In 2018, development of the Esaase ore body commenced. It is located 29 km north of the processing plant. Oxide ore is currently transported from Esaase to Obotan via a haul road at a maximum rate of 180 kt per month (approximately 2.2 Mtpa). The balance of the ore is sourced from Nkran, other satellite deposits and ROM stockpiles.
Over time, the Nkran deposit will be depleted and additional ore is proposed to be sourced from Esaase. The scope of this LOM Study provides for upgrade of the haul road to transport up to 5.4 Mtpa of ore from Esaase to Obotan and the associated provision or upgrade of existing facilities at Esaase.
Additional infrastructure anticipated to support the LOM includes:
-
Upgrades to the haul road to cater for up to 5.4 of Mtpa ore
-
Additional lifts for the tailings storage facility (TSF) at Obotan
-
Minor upgrades at Esaase. These upgrades include:
-
Potable and sewage water treatment plants, fire system, pollution control infrastructure, sediment control structures, camp upgrade, power distribution, public road diversion, river/public road crossings and pit dewatering wells
-
Esaase pit water buffer dam
-
Esaase resettlement action plan (RAP) which includes relocation of approximately 105 dwellings
-
Water treatment plants (at both Obotan and Esaase).
-
1.11 Capital cost estimate
The capex estimate for this Project has been developed to a Class 3 level of accuracy (+/- 25%). The base date for the capex estimate is Q4 2019. The summary capex estimate is included in Table 1-9 below.
Table 1-9 Capital estimate summary
|
Item |
Value (US$ M) |
|
Sustaining capital |
|
|
General plant sustaining capex |
26.7 |
|
TSF lifts |
57.3 |
|
Total sustaining capital |
84.0 |
|
Development capital |
|
|
Resettlement action plan |
38.7 |
|
Esaase haul road |
33.6 |
|
Esaase infrastructure (mining and non-mining) |
22.1 |
|
Mining (pre-production costs) |
10.8 |
|
Total development capital |
105.2 |
|
Closure costs |
60.2 |
|
Total capital |
249.3 |
The capital cost estimate excludes stripping costs of US$278.2 million. These costs are included as part of all-in sustaining costs (refer to Table 1-11).
1.12 Operating cost estimate
Cash operating costs are defined as direct operating costs and includes contract mining and Owner's Team mining cost (excluding capital stripping costs), ore haulage, processing and general and administrative costs.
The LOM plan considers the optimisation of mining and metallurgical processing (via the Obotan process plant) at a throughput of 5.4 Mtpa. Mining is completed in eight years, and as the plant is already producing, no ramp-up phase is included in the mine plan. Gold production is targeted at 220 to 250 koz/a.
|
Asanko Gold Inc. NI 43-101 Technical Report on Asanko Gold Mine, Ghana |
A blending program (as currently practised) will be followed throughout the LOM that considers grade-bins, ore-types and the Bond-Work-Index (BWI). To manage mill throughput, the proportion of oxide in the feed is constrained to between 20-50% of the overall feed, with planned average BWI of less than 13 kWh/t. Buffer stockpiles will include Oxide (OX), Transitional (TR) and Fresh (FR) material, located in close proximity to the primary crusher. An estimated 25% of the plant feed tonnage will be directly fed into the crusher, with the remaining 75% requiring re-handle.
The plant operates at capacity for most of the LOM except for half a year in 2025, when higher grade is being processed (thus meeting the gold production target with fewer processed tonnes).
The Nkran ore deposit is located within close proximity to the process plant at Obotan, whilst ore from Esaase (South and Main Pit), Akwasiso, Adubiaso, Abore and Asuadai is transported by haul road 28 km, 5 km, 5 km, 13 km and 14 km, respectively. Oxide ore from Esaase is currently transported to Obotan at circa 2.2 Mtpa. The scope of the LOM Study includes the upgrade of the road to facilitate the transport of up to 5.4 Mtpa ore from the Esaase pit.
The operating cost estimate for the LOM is summarised in Table 1-10 below. The summary corresponds to a total of 304.4 Mt mined, and 53.4 Mt ore feed to the process plant.
Table 1-10 Operating cost summary
|
Opex component |
Amount (US$ M) |
Unit value (US$/oz) |
|
Mining cost |
783 |
371 |
|
Ore haulage |
224 |
106 |
|
Processing cost |
597 |
283 |
|
General & administration (G&A) |
263 |
124 |
|
Cash operating costs |
1,867 |
884 |
|
Royalties |
157 |
74 |
|
Refining costs |
8 |
4 |
|
Sustaining capital expenditure |
84 |
40 |
|
Sustaining capital stripping |
278 |
132 |
|
All-in sustaining costs |
2,394 |
1,135 |
|
Asanko Gold Inc. NI 43-101 Technical Report on Asanko Gold Mine, Ghana |
1.13 Economic analysis
A cash flow based financial evaluation has been undertaken based on a realised gold price of US$1,400/oz, the summary of which is presented in Table 1-11. The analysis has been prepared by EY based on inputs from DRA, Snowden and Asanko Gold. All economics are shown after tax and royalties on a 100% basis. Corporate tax in Ghana is 35%.
Table 1-11 Summary of key financial assumptions and outcomes
|
Component |
Unit |
Value |
|
Realised gold price |
US$/oz |
1,400 |
|
Opening capital allowance tax shield |
US$ M |
394 |
|
Opening tax losses carried forward |
US$ M |
93 |
|
Corporate tax rate |
% |
35 |
|
Obotan royalty rate |
% |
5 |
|
Esaase royalty rate |
% |
5.5 |
|
Discount rate |
% |
5 |
|
Sustaining capital |
US$ M |
84 |
|
Cash operating costs |
US$/oz |
884 |
|
All-in sustaining cost |
US$/oz |
1,135 |
|
Net present value |
US$ M |
291 |
A range of sensitivities have been evaluated to assess their impact on the financial numbers included in the financial model. The significant financial sensitivities identified were discount rate and gold price (Table 1-12).
Table 1-12 Gold price and discount rate sensitivity (NPV in US$ M)
|
Realised gold price (US$/oz) |
Discount rate |
|||
|
5.0% |
7.5% |
10.0% |
12.5% |
|
|
1,200 |
(24) |
(25) |
(26) |
(27) |
|
1,300 |
144 |
130 |
118 |
107 |
|
1,400 |
291 |
268 |
248 |
230 |
|
1,500 |
423 |
393 |
366 |
343 |
|
1,600 |
546 |
510 |
478 |
450 |
The Project is most sensitive to gold price. The zero post-tax NPV is reached only if prices fall by approximately 14% from US$1,400/oz. This suggests that the Project is robust and material reductions in gold price would be required to make the Project uneconomic.
The economic analysis shows that the gold price would need to decrease below US$1,215/oz for the NPV of the Project to be negative at discount rate of 5% (US$1,219/oz at a discount rate of 10%). The spot gold price was US$1,521/oz at 31 December 2019 and the three-year average trailing gold price was US$1,307/oz. The median long-term real gold price of a number of independent brokers reviewed by EY is US$1,400/oz. With reference to the spot, three-year average and long-term median broker forecast gold prices, the economics of the Project is considered to be robust, with the Project considered to be able to endure significant price reductions before proving to be uneconomical.
|
Asanko Gold Inc. NI 43-101 Technical Report on Asanko Gold Mine, Ghana |
1.14 Risks and opportunities
The risk assessment process for the LOM Study included a facilitated workshop.
The objective of the risk workshop was to determine and develop a risk profile for the Project moving forward and as a tool to support future key decisions.
The following risks are worth noting:
-
Haul road design - the transition to a hauling potential of 5.4 Mtpa from Esaase will be confirmed through a more detailed review
-
Timing of implementation of environmental closure liabilities
-
Geotechnical risk associated with pit design - stability will be assessed/confirmed as mining continues and necessary measures are implemented by design
-
The OC content inherent to mineralised zones within the Esaase ore.
The LOM Study has identified the following opportunities:
-
Potential processing recovery upside through additional testwork on the effects of OC
-
Improvement on mining cost from a new tender process to be initiated in 2020
-
Improvement on hauling cost from a new tender process to be initiated in 2020
-
Multiple exploration targets to augment current ore sources.
1.15 Conclusions and recommendations
In recognition of Asanko Gold's ongoing commitment to Mineral Resource and Mineral Reserve development, metal production, and cost control, whilst maintaining a high standard of social benefit and environmental compliance, the authors of this technical report recommended the following:
-
Geology and Resources
-
Nkran
-
Continue to review reverse circulation (RC) sampling quality assurance, quality control (QAQC), especially field duplicate precision of high-grade samples. If significant high-grade bias above 10% is detected, alternate sampling and assay methods should be investigated
-
Continue to monitor the primary mineralisation controls by interpretation of grade control data and pit mapping, with primary focus on the Western Bounding Shear, the Western Sandstone, Granite contacts and Central Sandstone
-
Review the indicator kriging (IK) controls used to estimate the mineralisation volumes used for the gold grade estimation
-
Ensure production grade control models are constructed using the updated geology interpretation discussed above.
-
-
Esaase
-
Continue to monitor and analyse any drill sampling bias between RC and other drilling methods. If the bias exceeds 2% to 3% an investigation to improve RC drill sampling should be implemented
-
With mining having already commenced, it is essential that detailed structural and lithological mapping and analysis is completed. Early mapping observations indicate strong visual correlation between vein type, vein orientation and vein density with gold grade continuity. Identification of additional shear structures including thrusting and folding plus N-S dilational zones are critical in production grade control modelling and will provide important data for subsequent MRE improvement and update
-
Continuous structural pit mapping is required to improve the understanding and interpretation of the higher OC zones
-
Use of close spaced production grade control data is recommended to improve in variogram structure and ranges
-
-
|
Asanko Gold Inc. NI 43-101 Technical Report on Asanko Gold Mine, Ghana |
- Review of the IK methodology used in LeapfrogTM for mineralisation volume estimates is recommended. Alternate methods using Datamine StudioRMTM block model IK processes or conditional simulation are also recommended once adequate production grade control data is available for bench marking studies.
-
Akwasiso
-
Ongoing review of QAQC control on RC samples assayed used bottle roll is suggested to control under reporting bias
-
Continue analysis of pit mapping and grade control data to improve the interpretation of the MRE grade domains
-
In-situ dry bulk density sampling and analysis is required as a routine part of production grade control. Limited BD data is available for Akwasiso, especially in the oxide and transitional zones.
-
-
Abore, Asuadai and Adubiaso
-
Survey void pick-up of artisanal miners' workings is suggested to improve estimates of depletion zones from artisanal mining activity
-
Review of upper surface mineral resource classification once artisanal mining depletion activity is better understood.
-
-
Geotechnical risk/pit slope stability
-
Additional slope depressurisation measures for the Nkran Cut 2 and Cut 3 slopes
-
Update surface water management plans to reduce water ingress into the pits
-
Detailed and continuous movement monitoring of Nkran Cut 2
-
Adherence to SRK geotechnical design recommendations.
-
-
Mining production throughput
-
Improved tonnage and grade reconciliation and short-term planning at Esaase as mining progresses through better understanding of the mineralisation and continuous improvement of the Asanko Gold mineral resource management (MRM) business processes.
-
-
Modifying Factors
-
The use of the Mine Shape Optimiser (MSO) process by Asanko Gold is considered "best practise" for the application of practical dilution and mining loss modifying factors to a mine plan. To ensure continuous improvement, it is recommended that the MSO process be applied using a well-documented auditable approach to ensure consistent input parameters, reconciliation and appropriate benchmarking of the calculated dilution and mining loss outputs.
-
-
Process plant
-
It is recommended that further OC mapping is undertaken on the available drill cores and composites of these that represent the four stratigraphic unit are subjected to gravity/CIL testwork to establish more comprehensive geometallurgy of the Esaase Fresh and Transition ores
-
In addition to optimizing the existing gold recovery processes, it has been recommended that investigations be made into enhancing the recovery from the Cobra Zone at Esaase.
-
-
Environmental and social
-
The ongoing risk of ore depletion by illegal miners will need to be closely monitored and managed
-
Regular local stakeholder engagement particularly on the Tetrem Village resettlement negotiation
-
Ongoing environmental and social monitoring - the 2019 LOM Study has resulted in some changes from the project description presented in earlier impact assessment studies and will require updating to align the impact assessment and associated mitigation measures with the revised LOM plan.
-
|
Asanko Gold Inc. NI 43-101 Technical Report on Asanko Gold Mine, Ghana |
2 INTRODUCTION
2.1 Overview
This report is a National Instrument 43-101 (NI 43-101) Technical Report on the Life of Mine (LOM) Study of the Asanko Gold Mine (AGM). This Technical Report supersedes the following historic reports:
-
Definitive Feasibility Study (DFS 2017) prepared by DRA Projects (Pty) Limited on behalf of Asanko Gold Inc (Asanko Gold)
-
NI 43-101 Technical Report prepared by DRA Projects (Pty) Limited on behalf of Asanko Gold Inc in June 2017
-
Amended NI 43-101 Technical Report in December 2017. Amendments involved changing the Mineral Resource gold price from US$2,000 per ounce (/oz) to US$1,500/oz, and to remove the Inferred Resource from the economic analysis.
Following the conclusion of a 50/50 Joint Venture transaction with a subsidiary of Gold Fields on 31 July 2018, Asanko Gold holds a 45% economic interest in the AGM and gold exploration tenements (collectively the "joint venture" or JV) on both the Asankrangwa and Sefwi Gold Belts in the Republic of Ghana (Ghana), West Africa. The ownership structure of the JV is 45% Asanko Gold, 45% Gold Fields with the remaining 10% held by the Government of Ghana as a free-carried equity interest. The AGM concessions, the Obotan and Esaase project areas, are located in the Amansie West District of the Ashanti Region of Ghana (Figure 1-2).
The AGM is a multi-deposit complex with two main deposits, Nkran and Esaase, eight satellite deposits and a carbon-in-leach (CIL) processing plant with a current operating capacity of 5.4 Mtpa. Operations successfully commenced in January 2016 following an 18-month construction period. The LOM Study is focused on the current operations and updated resources and reserves as outlined in this report.
The LOM Study with associated supporting documentation is considered to have been compiled to the level of confidence as presented in a Preliminary Feasibility Study (PFS). The term "Preliminary Feasibility Study" has the meaning ascribed by the Canadian Institute of Mining, Metallurgy and Petroleum (CIM), as the CIM Definition Standards on Mineral Resources and Mineral Reserves adopted by CIM Council, and amended as of May 2014 (CIM, 2014). Under CIM guidelines, AGM is a "production property" - property on which mining is taking place; with adjacent "development property" sections (properties that are being prepared for mineral production and for which economic viability has been demonstrated by a PFS).
This Technical Report has been prepared by Snowden on behalf of Asanko Gold, a gold mining company listed on the Toronto Stock Exchange (TSX) and New York Stock Exchange American (NYSE-American).
|
Asanko Gold Inc. NI 43-101 Technical Report on Asanko Gold Mine, Ghana |
2.2 Qualified Persons
The nominated list of Qualified Persons involved in the compilation of this Report are shown below.
Table 2-1 Site visits undertaken by Qualified Persons
|
Qualified Person |
Company |
Site visit date(s) |
Item/ Section |
Purpose of site visit/tasks undertaken |
|
Mike Begg |
Asanko Gold |
February 15, 2020 |
1.1-1.4, 1.10, 1.11, 1.14, 1.15, 2-6, 7.1, 7.2, 9, 21.1, 23, 24.2, 24.3, 18, 25 (excl. 25.4), 26 |
Regional geology and exploration; updates on infrastructure scope including security and logistics |
|
Malcolm Titley |
CSA Global |
January 23, 2020 |
1.5, 1.14, 1.15, 7.3, 8, 10, 11, 12, 14, 25.2, 26 |
Geology and Mineral Resource |
|
Jonathan Hudson |
CSA Global |
Apr-2019 |
1.6, 1.7, 1.11, 1.12, 1.14, 1.15, 15, 16 (excl. 15.2.3 & 16.2), 25.3, 26 |
Mining and mineral reserve |
|
Glenn Bezuidenhout |
DRA Global |
- |
1.8, 1.12, 1.14, 1.15, 13, 17, 21.2, 25.4, 26 (process plant) |
Metallurgical processing |
|
Jeff Coffin |
Knight Piésold |
July 8, 2019 |
1.11, 21.1, 24.4 |
Tailings storage facility |
|
Desmond Mossop |
SRK |
Jan 2020 |
1.14, 1.15, 15.2.3, 16.2, 26 |
Mining geotechnical design |
|
Jeffrey Stevens |
Wood |
- |
1.11, 1.12, 1.14, 1.15, 21.1, 21.2, 24.1, 24.6, 25.1, 26 |
Study project management co-ordination including capex and opex, risk assessment |
|
Fanie Coetzee |
ABS Africa |
Oct 2019 |
1.9, 1.11, 1.14, 1.15, 20, 21.1, 24.5, 25.1, 26 |
Environmental and sustainable development, closure |
|
Godknows Njowa |
EY |
Nov 2019 |
1.13, 19, 22, 25.6 |
Financial modelling assessment |
Note: Wood - Wood Mining South Africa (Pty) Ltd; EY - Ernst & Young Advisory Services (Pty) Ltd; SRK - SRK (South Africa) (Pty) Ltd
Seven of the nine QPs have been to site. It was not deemed necessary for Jeffrey Stevens to attend based on the assigned responsibility and the availability of detailed engineering design documents. In the case of Glenn Bezuidenhout on metallurgical processing, Mr. Bezuidenhout led DRA's design activities associated with the existing metallurgical processing plant and possesses sufficient knowledge and understanding of the metallurgical process to not necessitate a site visit.
2.3 Issuer - Asanko Gold Inc
The Company is a gold mining company listed on the TSX and NYSE American, with headquarters at 1640-1066 West Hastings Street, Vancouver, British Columbia (https://asanko.com). The Company's flagship project is the jointly owned AGM with Gold Fields Limited (JSE, NYSE: GFI). AGM is a large scale, multi-pit gold asset. The mine is managed and operated by Asanko Gold and was built in 2015, with first gold poured in January 2016, and commercial production commencing in April 2016. In 2019, the mine had record production of 251,044 ounces (oz). In 2020, the mine is targeting 225,000 to 245,000 oz (on a 100% basis). AGM holds the largest land package on the highly prospective and underexplored Asankrangwa Belt.
|
Asanko Gold Inc. NI 43-101 Technical Report on Asanko Gold Mine, Ghana |
2.4 References and information sources
All references and information sources are listed in Section 27.
2.5 Units, currency and abbreviations
Unless otherwise stated, all currencies are expressed in US dollars (US$), with metric units applied throughout this Technical Report.
'Section' and 'Item' have been used interchangeably in this Technical Report.
Abbreviations and units are shown in Table 2-2.
Table 2-2 Abbreviations and unit of measurement
|
Abbreviation/Unit of measurement |
Description |
|
% |
Percent |
|
% w/w |
% of solids mass in liquid mass |
|
° |
Degrees |
|
°C |
degrees Celsius |
|
2.5H:1V |
2.5 Horizontal: 1 Vertical |
|
3D |
three-dimensional |
|
AAGM |
Akrokerri-Ashanti Gold Mines |
|
AARL |
Anglo American Research Laboratories |
|
AAS |
Atomic Absorption Spectrometry |
|
ABR |
Abore |
|
AC |
activated carbon |
|
ACSR |
Aluminium Conductor Steel Reinforced |
|
ADU |
Adubiaso |
|
AERC |
African Environmental Research and Consulting |
|
Ag |
silver |
|
AGF |
Associated Gold Fields |
|
AGM |
Asanko Gold Mine |
|
AHP |
analytical hierarchy process |
|
AIG |
Australian Institute of Geoscientists |
|
AISC |
all-in sustaining capital |
|
AKW |
Akwasiso |
|
ALS |
Australian Laboratory Services (Pty) Limited |
|
ANCOLD |
Australian National Committee On Large Dams |
|
As |
arsenic |
|
ASU |
Asuadai |
|
AusIMM |
Australasian Institute of Mining and Metallurgy |
|
Au |
gold |
|
BAIS |
best applicable industry standards |
|
BD |
bulk density |
|
BGM |
Bonte Gold Mines |
|
BLC |
Bonte Liquidation Committee |
|
Capex |
capital expenditure |
|
CIL |
carbon in leach |
|
CIM |
Canadian Institute of Mining, Metallurgy and Petroleum |
|
cm |
centimetre(s) |
|
Corg |
organic carbon |
|
CP |
Competent Person |
|
CRM |
certified reference material |
|
CSV |
comma separated value |
|
CTS |
Central Technical Services |
|
Cu |
copper |
|
Asanko Gold Inc. NI 43-101 Technical Report on Asanko Gold Mine, Ghana |
|
Abbreviation/Unit of measurement |
Description |
|
CV |
Coefficient of Variation |
|
DC |
diamond core |
|
DD |
diamond drill |
|
DDH |
diamond drill hole |
|
DBA |
database administrator |
|
DFS |
definitive feasibility report |
|
DRA |
DRA Projects (Pty) Limited |
|
EBSZ |
eastern bounding shear zone |
|
EGL |
equivalent grinding length |
|
EIS |
Environmental Impact Study |
|
EM |
electromagnetic |
|
EPA |
Environmental Protection Agency |
|
EPCM |
engineering, procurement and construction management |
|
EPMA |
electron probe microanalysis |
|
ESE |
east-south-east |
|
ESIA |
Environmental and Social Impact Assessment |
|
ESM |
Esaase Main |
|
ESS |
Esaase South |
|
EV |
eastern vein |
|
EXP |
exploration |
|
EY |
Ernst & Young Advisory Services (Pty) Ltd |
|
FEED |
front end design engineering |
|
FEL |
front end loader |
|
FIDIC |
Fédération Internationale Des Ingénieurs-Conseils (International Federation of Consulting Engineers) |
|
FS |
feasibility study |
|
g |
gram(s) |
|
Ga |
giga-annum |
|
GC |
grade control |
|
GDP |
gross domestic product |
|
GIT |
goods in transit |
|
GPS |
Global Positioning System |
|
g/cm3 |
grams(s) per cubic centimetre |
|
g/t |
grams per tonne |
|
G&A |
general and administration |
|
h |
hour(s) |
|
ha |
hectare(s) |
|
HDPE |
high density polyethylene |
|
ICMC |
International Cyanide Management Code |
|
Keegan |
Keegan Resources Inc (name changed to Asanko Gold in February 2013) |
|
kg |
kilogram |
|
KIR |
Kiwi International Resources |
|
KNA |
Kriging neighbourhood analysis |
|
JORC |
Joint Ore Reserves Committee |
|
JORC Code, 2012 |
Current Australasian Code for the reporting of mineral resources and ore reserves (the JORC Code, 2012 edition) |
|
kg/hr |
kilogram(s) |
|
kg/hr |
kilograms per hour |
|
Km |
kilometre(s) |
|
koz |
kilo ounce/thousand ounce (troy) |
|
Knight Piésold |
Knight Piésold (Pty) Limited |
|
KRGL |
Keegan Resources Ghana Limited |
|
kt |
thousand tonnes |
|
kW |
kilowatt |
|
ℓ |
litre |
|
Asanko Gold Inc. NI 43-101 Technical Report on Asanko Gold Mine, Ghana |
|
Abbreviation/Unit of measurement |
Description |
|
kℓ |
kilolitre |
|
LOI |
loss on ignition |
|
LOM |
Life of Mine |
|
LRS |
liquid resistance starter |
|
m |
metre(s) |
|
m2 |
square metre(s) |
|
m3 |
cubic metres(s) |
|
Ma |
million years |
|
MAMSL |
metres above mean sea level |
|
MCC(s) |
motor control centre(s) |
|
mm |
millimetre(s) |
|
MRE |
Mineral Resource estimate |
|
MRev |
Mineral Reserve estimate |
|
mRL |
reduced level/depth or height of a place (in m) above a reference datum or mean sea level |
|
MSRL |
mild steel rubber lined |
|
Mt |
million tonnes |
|
Mtpa |
million tonnes per annum |
|
NI 43-101 |
Canadian Securities Administrators National Instrument 43-101 |
| NPV | net present value |
|
OC |
organic carbon |
|
Opex |
operating expenditure |
|
OK |
Ordinary kriging |
|
oz |
ounce (troy) |
|
oz Au |
ounce of gold |
|
Pb |
lead |
|
PFC |
power correction factor |
|
PFS |
prefeasibility study |
|
pH |
activity of hydrogen ions |
|
PMI |
PMI Gold Corporation |
|
Ppm |
parts per million |
|
PRI |
preg-robbing index |
|
Project |
The AGM, planned mining and production expansions, proposed capital expenditure, and extension of mine life. |
|
PRV |
preg-robbing value |
|
Q1, Q2, Q3, Q4 |
quarter one, quarter two, quarter three, quarter four |
|
QA |
quality assurance |
|
QA/QC |
quality assurance/quality control |
|
QC |
quality control |
|
QEMSCAN |
quantitative evaluation of materials by scanning electron microscopy |
|
QP(s) |
Qualified Person(s) |
|
RAP |
resettlement action plan |
|
RC |
reverse circulation |
|
RCD |
reverse circulation with diamond tail |
|
QSP |
quartz sericite pyrite |
|
Qtz |
quartz |
|
QV |
quartz veins |
|
Resolute |
Resolute Mining Limited |
|
RF |
revenue factor |
|
ROM |
run of mine |
|
RQD |
rock quality designations |
|
SABC |
semi-autogenous and ball milling circuit |
|
SAG |
semi-autogenous grinding |
|
Sametro |
Sametro Company Limited |
|
Sb |
antimony |
|
SD |
standard deviation(s) |
|
Asanko Gold Inc. NI 43-101 Technical Report on Asanko Gold Mine, Ghana |
|
Abbreviation/Unit of measurement |
Description |
|
SE |
south-east |
|
SER |
slip energy recovery |
|
SGS |
SGS Laboratories |
|
SIB |
stay-in-business capital |
|
SiO2 |
silicon dioxide (silica) |
|
SMBS |
sodium meta-bisulphite |
|
SMU |
selective mining unit |
|
Snowden |
Snowden Mining Industry Consultants Pty Limited |
|
SOX |
strongly-oxidized |
|
SQL |
Structured Query Language |
|
SRK |
SRK (South Africa) (Pty) Ltd |
|
SS |
stainless steel |
|
SW |
south-west |
|
SSW |
south-south-west |
|
t |
tonne(s) |
|
T&A |
time and attendance |
|
t/m3 |
tonnes per cubic metre |
|
Tpa |
tonnes per annum |
|
TSF |
tailings storage facility |
|
TSX |
Toronto Stock Exchange |
|
TWL |
Transworld Laboratories |
|
UCS |
unconfined compressive strength |
|
u/f |
underflow |
|
µm |
micron |
|
USB |
universal serial bus |
|
US$ |
United States dollars |
|
VTEM |
versatile time-domain electromagnetic surveying |
|
XRD |
x-ray diffraction |
|
XRF |
x-ray fluorescence |
|
WAXI |
West Africa Exploration Initiative |
|
WBSZ |
western bounding shear zone |
|
WNW |
west-north-west |
|
WOX |
weakly-oxidized |
|
WRD |
waste rock dump |
|
WRDF |
waste rock dump facility |
|
Zn |
Zinc |
|
Asanko Gold Inc. NI 43-101 Technical Report on Asanko Gold Mine, Ghana |
3 RELIANCE ON OTHER EXPERTS
For the purposes of this Technical Report, Mr. Mike Begg has relied on ownership and title information which was based on the report entitled; "Root to Title Asanko Gold Mine" dated July 2014 and prepared by Kimathi and Partners Legal and Advisory Services, Accra Ghana (the "Tenement Report"). This Technical Report has been prepared on the understanding that the property is, or will be lawfully accessible for evaluation, development, mining and processing.
Dr. Godknows Njowa has undertaken his sections in compliance with the reporting requirements of CIM (2014) and the NI 43-101 and, in so doing, has received and accepted information provided by Asanko Gold and its independent contractors as to its operational methods and forecasts. This included information related to the appropriate income tax and royalty rates. Dr. Njowa does not purport to be an expert on Ghanaian tax, royalties and government levies and the information on these matters was supplied by Asanko Gold and was in turn based on publicly accessible Ghanaian legal and tax information compiled by International Comparative Legal Guides (ICGL). ICGL compiles its information from named local legal practitioners and makes this information available for purchase.
https://iclg.com/practice-areas/mining-laws-and-regulations/ghana#chaptercontent3
Mr. Jeffrey Stevens, in carrying out his duties as the Qualified Person related to capital expenditure in accordance with CIM (2014) and the NI 43-101, received, reviewed and accepted information in a report prepared by Professional Cost Consultants (Pty) Ltd (PCC) entitled "Basis of Estimate for Asanko LOM Project" dated February 4, 2020. PCC is a firm of professional quantity surveyors based in Johannesburg, South Africa.
|
Asanko Gold Inc. NI 43-101 Technical Report on Asanko Gold Mine, Ghana |
4 PROPERTY DESCRIPTION AND LOCATION
Ghana is located in West Africa, sharing boundaries with Togo to the east, Cote d'Ivoire to the west, Burkina Faso to the north and the Gulf of Guinea to the south.
Gold represents Ghana's major export commodity, followed by cocoa and timber products. Ghana is the world's eighth and Africa's largest producer of gold. Manganese, bauxite and diamonds are also mined.
Ghana has an estimated population of 30.7 million (2019 estimate) and covers an area of approximately 238,530 km². Ghana has a large variety of African tribal, or sub-ethnic units. English is the official language, a legacy of British colonial rule. Twi is the most widely spoken local African language. The majority of the population are Christian (71%) whilst the northern ethnic groups are largely Muslim (17%) and indigenous beliefs (22%) are also practiced throughout the country.
In 1957 Ghana, (formerly known as the Gold Coast), became the first country in sub-Saharan Africa to gain independence. Ghana has been a stable democracy since 1992, which marked the drafting of a new constitution. Ghana is governed under a multi-party democratic system, with elected presidents allowed to hold power for a maximum of two terms of four years each.
Major international airlines fly into and from the newly refurbished international airport in Ghana's capital city, Accra. Domestic air travel has increased significantly and the country has a vibrant telecommunications sector, with six cellular phone operators and several internet service providers.
Ghana predominantly has a tropical climate and consists mostly of low savannah regions with a central, hilled forest belt. Ghana's one dominant geographic feature is the Volta River, upon which the Akosombo Hydro-Electric Dam was built in 1964. The damming of the Volta created the enormous Lake Volta, which occupies a sizeable portion of Ghana's south-eastern territory.
Ghana has a market-based economy with relatively few policy barriers to trade and investment in comparison with other countries in the region. Ghana has substantial natural resources and a much higher per capita output than many other countries in West Africa.
4.1 Project location and area
The AGM tenements are in the Amansie West District, of the Ashanti Region of Ghana, approximately 250 km NW of the capital Accra and some 50 km to 80 km south west of the regional capital Kumasi (Figure 4-1 and Figure 4-2).
The AGM areas are accessed from the town of Obuasi, northward towards Kumasi on the Kumasi-Dunkwa highway to the Anwian-Kwanta junction. The concessions cover an area of approximately 370 km2 between latitudes 6º 19'40" N and 6º 28' 40" N; and longitudes 2º 00' 55" W and 1º 55' 00" W.
|
Asanko Gold Inc. NI 43-101 Technical Report on Asanko Gold Mine, Ghana |
Figure 4-1 Location of the Asanko Gold Mine in Ghana, West Africa

Source: CJM, 2014
AGM is an operating entity with a current processing facility treating approximately 5.4 Mtpa, The recent development of the Esaase deposit, in conjunction with production from the currently operated Nkran and Akwasiso pits, as well as the optimal integration of other satellite Oxide and Fresh ore sources, results in a reported LOM of approximately 10 years of process plant operations.
The AGM is accessed by travelling 35 km south to Anwiankwanta Junction, and then west into the Project area on surfaced and un-surfaced all weather roads.
|
Asanko Gold Inc. NI 43-101 Technical Report on Asanko Gold Mine, Ghana |
Figure 4-2 Location of the AGM tenements
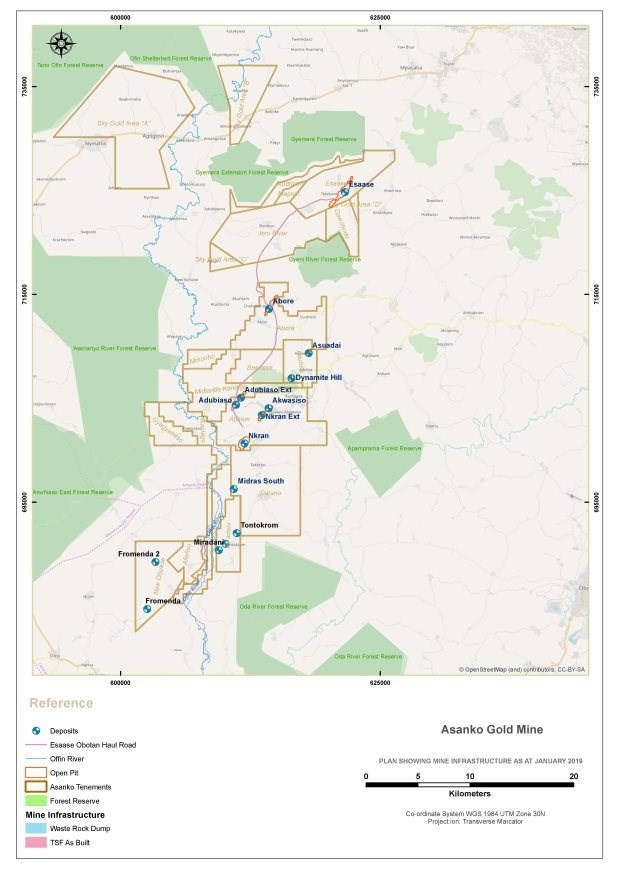
Source: Asanko Gold, 2019
|
Asanko Gold Inc. NI 43-101 Technical Report on Asanko Gold Mine, Ghana |
4.2 Licences and mineral tenure
4.2.1 Mining legislation overview
The Minerals and Mining Act, 2006 (Act 703) (as amended by the Minerals and Mining (Amendment) Act, 2015 (Act 900) and the Minerals Commission Act, 1993 (Act 450) are the principal enactments setting out the framework of Ghanaian mining law. These acts express the basic position that minerals in their natural state are owned by the state; they also outline the licensing scheme for mineral operations, the incidents of the various mineral rights and the powers of the principal regulatory institutions. The following pieces of subordinate legislation add detail in specific areas to the regime set out in the principal legislation:
(a) Minerals and Mining (General) Regulations, 2012
(b) Minerals and Mining (Support Services) Regulations, 2012
(c) Minerals and Mining (Compensation and Settlement) Regulations
(d) Minerals and Mining (Licensing) Regulations, 2012
(e) Minerals and Mining (Explosives) Regulations, 2012
(f) Minerals and Mining (Health, Safety and Technical) Regulations, 2012.
The mining law divides the various licences that can be granted for a mineral right into three sequential categories, Reconnaissance Licence, Prospecting Licence and a Mining Lease, defined under the Minerals and Mining Act, 2006 (Act 703). These licences are discussed below.
Reconnaissance Licence (Sections 31-33)
A reconnaissance licence entitles the holder to search for specified minerals by geochemical, geophysical and geological means. It does not generally permit drilling, excavation, or other physical activities on the land, except where such activity is specifically permitted by the licence. It is normally granted for 12 months and may be renewed for a period not exceeding 12 months, if it is in the public interest. The area extent is negotiable, related to the proposed reconnaissance program.
Prospecting Licence (Sections 34-38)
A prospecting licence entitles the holder to search for the stipulated minerals and to determine their extent and economic value. This licence is granted initially for a period of up to three years covering a maximum area of 150 km2. This may be renewed for an additional period of two years, but with a 50% reduction in the size of the licence area if requested. A prospecting licence will only be granted if the applicant shows adequate financial resources, technical competence and experience and shows an adequate prospecting program. It enables the holder to carry out drilling, excavation and other physical activities on the ground.
Mining Lease (Sections 39-46)
When the holder of a prospecting licence establishes that the mineral to which the licence relates is present in commercial quantities, notice of this must be given to the Minister of Lands, Forestry and Mines and if the holder wishes to proceed towards mining, an application for a mining lease must be made to the Minister within three months of the date of the notice.
4.2.2 Issuer's title to the AGM concessions
The AGM concessions are owned 100% by Asanko Gold Ghana Limited (Asanko Gold Ghana). The legal status of the mineral properties in Ghana in which Asanko Gold has an interest have been verified by Asanko Gold and by an independent legal entity, Kimathi Partners Corporate Attorneys based in Accra. As at 31 December 2019, all mineral tenements were in good standing with the Government of Ghana. Furthermore, it has been confirmed that the properties are lawfully accessible for evaluation and also mineral production.
|
Asanko Gold Inc. NI 43-101 Technical Report on Asanko Gold Mine, Ghana |
Asanko Gold holds 7 mining leases, 11 prospecting licences, 1 reconnaissance licence and 1 prospecting licence in application, which collectively make up the AGM and span over 40 km strike length of the Asankrangwa Belt. The AGM is made up of the Obotan Project area which consists of a series of contiguous concessions, and the Esaase Project area (Figure 4-2). These concessions cover an area in total of approximately 670 km2.
The areas of the respective mining leases and prospecting licences with respective company owners are tabulated in (Table 4-1).
Table 4-1 Asanko Gold Mine Mining Lease and Prospecting concession areas
|
Name |
Mincom reference number |
Licence area (km2) |
Type |
Status/ Expiry date |
Ownership |
|
Abore |
PL 6/352 |
28.47 |
Mining Lease |
Valid-ML 7/2031 |
Asanko Gold |
|
Abirem |
PL 6/303 |
47.13 |
Mining Lease |
Valid-ML |
|
|
Adubea |
PL 6/310 |
13.38 |
Mining Lease |
Valid-ML 7/2028 |
|
|
Miradani |
PL 6/122 |
14.98 |
Mining Lease |
Valid-ML 5/2025 |
Asanko Gold |
|
Esaase |
PL 6/8 Vol 8 |
27.03 |
Mining Lease |
Valid-ML 9/2020 |
|
|
Jeni River |
RL 6/21 |
43.41 |
Mining Lease |
Valid-ML 3/2020 |
|
|
Kaniago |
PL 6/307 |
25.27 |
Prospecting |
UA -2019 (3 years) |
Asanko Gold |
|
New Obuase |
PL 3/84 |
33.67 |
Prospecting |
UA -2019 (3 years) |
|
|
Datano |
PL 6/32 |
|
Prospecting |
UA -2019 (3 years) |
|
|
Mepom |
Pl 6/245 |
2.37 |
Prospecting |
Note 1 |
Asanko Gold |
|
Dawohoda |
PL 6/43 |
10.00 |
Prospecting |
UA -2019 (3 years) |
|
|
Asumura |
PL 7/107 Vol 2 |
82.11 |
Prospecting |
UA -2019 (3 years) |
|
|
Fosukrom |
PL 2/413R/Vol 2 |
62.16 |
Prospecting |
UA -2019 (3 years) |
Asanko Gold |
|
Sky Gold |
RL 6/86 |
91.50 |
Reconnaissance |
Note 2 |
|
|
Pomaakrom |
Under application |
102.69 |
Application |
UA -2019 (3 years) |
|
|
Kaniago |
PL 6/289 |
25.50 |
Prospecting |
UA -2019 (3 years) |
Asanko Gold |
|
Besease |
PL.6/120 |
15.55 |
Prospecting |
UA -2019 (3 years) |
|
|
Mimooha |
PL 6/352 |
5.70 |
Prospecting |
UA -2019 (3 years) |
Note: UA - Updated Application
Note 1: Mepom License renewal pending since 2012. In process of being merged with Esaase ML
Note 2: License conversion from RL to PL pending since 2012.
In the case where a Mining Lease or Prospecting License is an Updated Application (UA) the renewed application has been submitted and recognised by the Ghana Minerals Commission (Mincom) and is awaiting final Ministerial approval. Mining Leases are renewed for an extended ten (10) year period and Prospecting Licenses are renewed for an additional three (3) years from date of application acceptance by the Minerals Commission. The final step which may reverse this accepted status is the ratification by Parliament preventing the Ministerial approval. This is typically a formality.
In the case of the Updated Applications registered in Table 4.1 above all the necessary technical reports and required application, processing and other necessary fees have been settled. Relevant reminder letters have been submitted where necessary and Asanko awaits feedback from the relevant authorities.
A prospecting renewal application (3 years) and a renewal for a Mining Lease (10 years) is submitted to Mincom and is always accompanied by an updated technical report, relevant processing fees, consideration fees, annual mineral right fees and Stool Land fees. The renewal application is subsequently submitted by Mincom to the Ministry of Lands and Natural Resources for secondary approvals and is completed by Ministerial Approval thereafter.
|
Asanko Gold Inc. NI 43-101 Technical Report on Asanko Gold Mine, Ghana |
The lease/concession boundaries have been surveyed by global positioning system (GPS) and are correlated with the latitude and longitude via degree co-ordinates as per the Ghanaian Mining Cadastre (July 2016).
Asanko Gold Ghana is the merged entity of Keegan Resources Ghana Limited (KRGL) and Adansi Gold. When Asanko Gold acquired the Esaase concessions, there was a mining lease in place from the historical alluvial mining operations. The Minister of Lands and Natural Resources granted the other Mining Leases for the Obotan Project to PMI Gold Inc (PMI) in November 2012, prior to the acquisition of PMI by Asanko Gold in early 2014.
In November 2012, the Company formally received mining leases on the Abore-Abirem and Adubea prospecting licences.
The formal grant of these three Mining Leases, renewable under the terms of the Minerals and Mining Act, 2006 (Act 703), followed the favourable recommendation by the Minerals Commission of Ghana in September 2012. The Mining Leases cover a total area of 167 km2, encompassing the two main deposits, Nkran and Esaase and the smaller satellite deposits, Abore, Adubiaso, Dynamite Hill, Akwasiso, Asuadai, Adubiaso Extension and Nkran Extension.
In 2017, the Company acquired the Miradani Mining Lease area situated in the southern camp adjacent to the Datano concession area.
Surface rights have been discussed in Section 5.6.
4.3 Agreements, royalties and encumbrances
All concessions carry a 10% free carried interest in favour of the Ghanaian government and as a result, the Ghanaian government holds a 10% interest Asanko Gold Ghana. The mining leases are also subject to a 5% royalty payable to the Government of Ghana. In addition, the Adubea mining concession is subject to an additional 0.5% royalty to the original concession owner. The Esaase mining lease is also subject to an additional 0.5% royalty to the Bonte Liquidation Committee (BLC).
4.4 Environmental obligations
Under the current ownership arrangement and status of holdings, there is no environmental liability held over Asanko Gold for any of the AGM concessions, except for project works to date. Monitoring information is assessed against the Ghana EPA guidelines (January 2001) and international best practice guidelines for the mining industry. There is a potential environmental liability on the Company's Jeni River concession which was inherited with the acquisition of the concessions and is not material to the Company but is reported in its recent financial statements as an Asset Retirement Obligation.
4.5 Permits
The Esaase, Abore, Abirem, Adubea and Miradani Mining Leases contain all the resources defined to date. All other concessions held by Asanko Gold in the area contain exploration potential defined to date. The Environmental Protection Agency (EPA) grants permits on a perennial basis to conduct exploration. On advice from Asanko Gold, with respect to the project areas, all permitting within the afore-mentioned governmental permitting structure is up to date.
Prior to approval to commence operations being granted by the Ghanaian government, the Company completed an ESIA and EIS for Esaase which have been submitted to the EPA for final approvals, for which record of payment has been received and approvals imminent.
In conjunction with the formal issue of the mining leases, the Company also received a key water discharge permit which allowed dewatering of the Nkran (completed in 2016) and Adubiaso pits.
|
Asanko Gold Inc. NI 43-101 Technical Report on Asanko Gold Mine, Ghana |
The approval permit for the commencement of mining operations at the Esaase site required certain conditions to be met. These included the resettlement of certain communities affected by the operations and that fall within the 500 m buffer zone from blasting activity as stipulated in the Mining Laws. The Tetrem Village resettlement program has been initiated and is expected to be complete by the end of 2020.
|
Asanko Gold Inc. NI 43-101 Technical Report on Asanko Gold Mine, Ghana |
5 ACCESSIBILITY, CLIMATE, LOCAL RESOURCES, INFRASTRUCTURE AND PHYSIOGRAPHY
5.1 Topography, elevation and vegetation
The AGM lies in the Amansie West District of the western region of Ghana. The AGM is located in hilly terrain dissected by broad, flat drainages that typically form swamps in the wet season between May and late October (Figure 5-1). Hill tops are generally at very similar elevations, reflecting the elevation of a previous erosional peneplane that is now extensively eroded. Maximum elevations are approximately 80 m above sea level (masl), but the areas impacted by the Project generally lie at less than 50 m elevation. Despite the subdued topography, hill slopes are typically steep. The concession areas are covered by a series of low, gently undulating hills, which rarely exceed 680 masl in elevation. Ecologically the AGM is situated in the wet evergreen forest zone. Fauna and flora have been discussed further in Section 20.4.
In general, the concession areas have been largely transformed, having experienced extensive degradation in recent years. The main land uses include secondary forest, subsistence and cash crop farming, and artisanal gold mining.
Figure 5-1 Example of topography and vegetation around Esaase Pit location
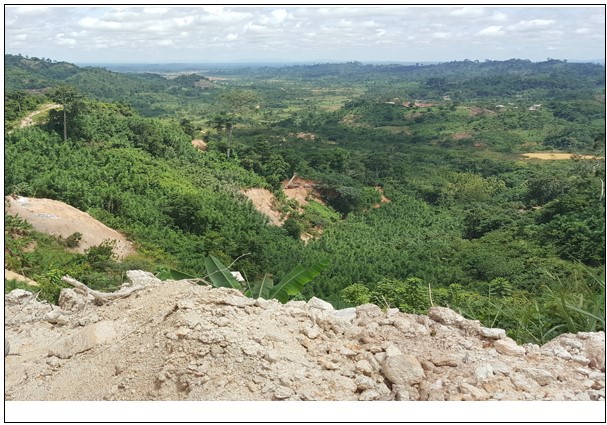
Source: Asanko Gold, 2019
The soils of the area fall within the Bekwai and Nzema Oda classification. The soils of the Bekwai series are found on the summits and some upper slope sites of the hills of the area. They are generally deep to very deep (over 20 cm), humus, well drained, red in colour, loam to clay loam, gravelly and concretionary, with well-developed sub angular blocky structure and clay cutans within sub-soils. The soils are acidic throughout the profile.
|
Asanko Gold Inc. NI 43-101 Technical Report on Asanko Gold Mine, Ghana |
The soils of the Nzema Oda series are heavy textured soils developed on alluvial deposits along streams of the area. The soils are poorly drained and are subjected to flooding during the wet seasons and are greyish in colour with prominent yellowish orange mottles. The soils are deep, acidic with clay loam to clay textures, but are structureless in the sub-soils.
5.2 Access
The Obotan project area is accessed by road from the city of Kumasi, south towards Obuasi on the Kumasi-Dunkwa highway to the Anwian-Kwanta junction then approximately 20 km west from this junction through Poano and Antoakurom on a tarred road onto a laterite road for approximately 30 km through Manso Akropon, Manso Atwere, Manso Nkwanta, Suntreso, Gyadukurom to Abore. At Abore, the road branches northwest to Akuntam, then northeast to Nkasu. At Gyadukurum, the road branches off south to Asuadai, Dynamite Hill, and Adubea. At Adubea, the road continues south to Kumpese and westward to Abirem, to Besease, then north to Mmooho. At Kumpese, the road branches south to Akwasiso, south west to Koninase and to Nkran and Adubiaso. Areas of interest within the concession are reached via a combination of secondary roads, four-wheel drive tracks, logging roads, and farming/ hunting footpaths.
The Esaase property is accessed by road from the city of Kumasi by taking the tarred Sunyani-Kumasi road west for 10 km to the Bibiani Junction at Abuakwa and then southwest for 10 km along the tarred Bibiani-Kumasi highway to the village of Wiaso. A secondary tarred road is taken 8 km south from Wiaso to the village of Amankyea. Secondary gravel roads can be taken for a further 11 km via the villages of Ahewerwa and Tetrem.
The Esaase deposit itself is accessed by a series of secondary roads constructed either by the former Bonte Gold Mines Limited (BGM) or by Asanko Gold.
5.3 Proximity to population centre and transport
There are several local villages near the AGM site. The closest to the plant site is the Manso Nkran village, while the villages of Tetrem and Esaase are in close proximity to the Esaase deposit. Current site infrastructure and transport means are discussed in Section 5.5.
5.4 Climate and length of operating season
The following is noted:
-
Rainfall. The annual rainfall is in the range of 1,500 mm to 2,000 mm and temperatures range from 22°C to 36°C. The major rainy season takes place from April to July followed by a minor rainy season from September to October. The AGM has operated without cessation or delay throughout both rainy seasons
-
Temperature. Maximum temperatures occur between January and April ranging between 26°C and 28°C and minimum temperatures between May and December when values range between 24°C to 25°C. The respective monthly average temperature for the period 2014 to 2016 ranged from 25.8°C to 27.2°C
-
Wind speed and direction. The mean monthly wind speed is 0.59 knots with a mean monthly range from 0.4 to 1.3 knots. Mean monthly wind speeds rarely exceed 1.3 knots (0.67 m/s). August is generally the windiest month and wind direction is predominantly SE during the year.
5.5 Infrastructure
Current site infrastructure with respect to the Obotan concessions consists of an office complex, metallurgical facility, tailings storage facility (TSF), senior and junior accommodation and mess facilities, workshops, power distribution facility, a new core storage facility, potable and operational water supplies, a waste rock dump facility, an upgraded dry weather air strip and a haul road from Esaase pit to Nkran pit. In addition, the following is noted for the Obotan concessions:
|
Asanko Gold Inc. NI 43-101 Technical Report on Asanko Gold Mine, Ghana |
-
Local facilities of importance to exploration and mining include towns, villages, roads, trails, power lines, rivers and rail roads
-
The principal towns within the area are Abore and Adubea
-
Akwasiso and Nkran are the principal towns within the Phase 1 mining area
-
Surrounding villages are connected to the national electrical grid
-
There is grid power to the Nkran area, the processing plant and town site
-
Most areas are adequately serviced by several cellular telephone suppliers
-
The principal towns have potable water and health posts which cover local needs
-
Ghana has a good base of skilled mining and exploration personnel.
The following resources are available for the Esaase concession area:
-
The Esaase camp and surrounding villages are connected to the national electrical grid
-
The Project is in an area well serviced by the Ghana national power grid with at least two alternate points of supply within a 50 km radius of the open pit mining site
-
Mobile phone communication is accessible in most parts of the concession
-
Hospitals and most government offices are available in Kumasi
-
Food and general supplies are also purchased in Kumasi.
Ghana has a mature mining industry that has resulted in the local availability of both skilled and unskilled personnel. An aerial photograph of the regional infrastructure is shown below (Figure 5-2).
|
Asanko Gold Inc. NI 43-101 Technical Report on Asanko Gold Mine, Ghana |
Figure 5-2 Nkran Pit regional infrastructure
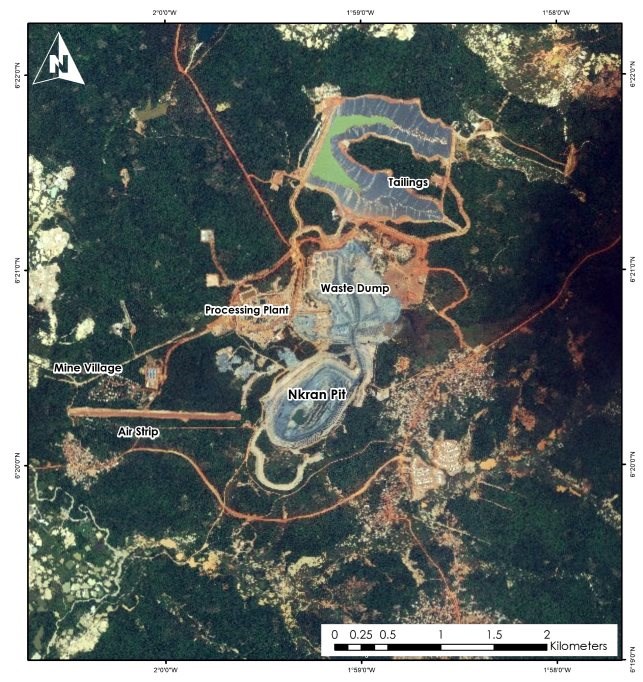
Source: Asanko Gold, 2019
5.6 Surface rights
The laws regarding surface rights is captured in the Mineral and Mining Act 206, Act 703 sub-section 72. This section gives rights to the owners of the land (i.e. Chiefs, family, individuals, etc.) to be compensated by Mineral Rights holders (i.e. mining companies).
Sub-section: 72
(1) The holder of a mineral right shall exercise the rights under this Act subject to limitations that relate to surface rights that apply under an enactment and further limitations reasonably determined by the Minister.
|
Asanko Gold Inc. NI 43-101 Technical Report on Asanko Gold Mine, Ghana |
(2) In the case of a dispute between a holder of a mining lease and the Minister concerning the limitations determined by the Minister under this subsection, the dispute shall be referred for resolution under section 27.
(3) The lawful occupier of land within an area subject to a mineral right shall retain the right to graze livestock upon or to cultivate the surface of the land if the grazing or cultivation does not interfere with the mineral operations in the area.
(4) In the case of a mining area, the owner or lawful occupier of the land within the mining area shall not erect a building or a structure without the consent of the holder of the mining lease, or if the consent is unreasonably withheld, without the consent of the Minister.
(5) The owner of a mining lease shall, in the presence of the owner or lawful occupier or accredited representative of the owner or lawful occupier of land, the subject of a mining lease and in the presence of an officer of the Government agency responsible for land valuation carry out a survey of the crops and produce a crop identification map for the compensation in the event that mining activities are extended to the areas.
(6) An owner or lawful occupier of land shall not upgrade to a higher value crop without the written consent of the holder of the mining lease, or if the consent is unreasonably withheld, without the consent of the Minister.
In the case of AGM, all concessions belong to the Ashanti Kingdom who has in turn given same right to the relevant Divisional Chiefs and in some cases specific individuals to exercise that right in terms of compensation. Compensation with regards to surface right comes in the form of:
- Crop compensation
- Deprivation for land use compensation
- Compensation of immovable properties (shrines, ponds, etc.)
- Royalty payment through the Stool lands.
|
Asanko Gold Inc. NI 43-101 Technical Report on Asanko Gold Mine, Ghana |
6 HISTORY
6.1 Prior ownership and ownership changes
The individual Project Areas have largely undergone a number of ownership changes since their discovery. A summary of this is provided in Table 6-1.
Table 6-1 Summary history of ownership per deposit
|
Year |
Ownership |
|
Nkran (historically Nkran Hill, or Obotan Mine) |
|
|
Late 1980s |
Obotan Minerals awarded prospecting concession over 106 km² (current Abirem Mining Lease, Adubea Mining Lease and Abore Mining Lease). |
|
1990 |
Kiwi Resources Limited (KIR) took over Obotan Minerals interest. Concession explored by Australian juniors Associated Gold Fields NL (AGF) and KIR. |
|
1996 |
Resolute Mining Limited (Resolute) bought combined interests of AGF and KIR (Nkran, Akwasiso, Asuadai, Adubiaso and Abore). |
|
1999 |
Resolute changed name to Resolute Amansie Limited. |
|
2001 |
Obotan Mine closed. |
|
2006 |
Resolute relinquished ground to Government of Ghana who granted several small-scale mining leases on the deposits. PMI Gold Inc (PMI) acquired the Abirem, Abore and Adubea prospecting licences. |
|
2014 |
Asanko Gold acquired mining leases Abirem, Adubea and Abore from PMI through purchase agreement. Obotan Mine renamed to Nkran Mine. |
|
Esaase |
|
|
1900-1939 |
Artisanal mining. |
|
1990 |
Adjacent Jeni River mining lease granted to Jeni River Development Company Limited. |
|
1990 |
Esaase (previously Bonte) mining lease granted to Akrokerri-Ashanti Gold Mines (AAGM) and later transferred to local subsidiary Bonte Gold Mines Limited (BGM). |
|
2002 |
Ghanaian incorporated private company Dawohodo Manufacturing and Marketing Limited granted adjacent prospecting licence to the south (Dawohodo-Esaase prospecting licence). |
|
2003 |
Jeni River Development Company Limited and BGM declared bankrupt. Esaase mining lease acquired from the Bonte Liquidation Committee by private Ghanaian company Sametro Company Limited (Sametro). |
|
2006 |
Keegan Resources Inc (Keegan) entered into an option agreement with Sametro to earn 100% of the Esaase mining lease. |
|
2007 |
Esaase mining lease transferred to Keegan. |
|
2013 |
Keegan changed name to Asanko Gold. |
|
Akwasiso see Nkran - Abirem lease area |
|
|
Abore |
|
|
Pre-1990 |
Small scale mining licence held by Oda River Gold. |
|
1990 |
Mutual Resources acquired Oda River Gold and formed JV with Leo Shield Exploration. |
|
1990 |
Leo Shield Exploration (which became Shield Resources) bought out Mutual Resources. |
|
2001 |
Agreement entered with Resolute; and Resolute took ownership of project. |
|
2006 |
Resolute relinquished lease to Government of Ghana. PMI acquired Abore licence. |
|
2015 |
Asanko Gold acquired ground from PMI. |
|
Asuadai - Adubea lease area |
|
|
1996 |
Resolute purchased combined interests of AGF and KIR. Released to six small scale operators at the time of mine closure. |
|
2006 |
Resolute relinquished ground to Government of Ghana. Adubea licence granted to Chief Joseph Biney family, and later acquired by PMI. |
|
2015 |
Asanko Gold acquired ground from PMI. |
|
Adubiaso see Nkran - Abirem lease area |
|
6.2 Historical exploration and development
Gold rushes in the area occurred in 1898 to 1901 and again in the 1930s. Most of the Asanko Gold concessions, however, have no record of the work undertaken on the properties for this period. Interest in the area was renewed in the early 1990s mainly because of the successful exploration work carried out on the adjacent concession where the Nkran deposit is located.
|
Asanko Gold Inc. NI 43-101 Technical Report on Asanko Gold Mine, Ghana |
Table 6-2 below summarises the extent of the exploration activities and developments per project area relevant to the current Mineral Resource. Additional regional exploration activities (including on adjacent properties) have been carried out but are not included here as they do not form the subject of this Technical Report. All of the Mineral Resources that are the subject of this Technical Report (refer to Section 14) have been remodelled in 2019.
Table 6-2 Summary of historical exploration and development per deposit
|
Period |
Workings |
|
Nkran |
|
|
Historical |
Alluvial and elluvial gold artisanal gold mining which extend for ±610 m in a northeast-southwest direction. European settlers worked the deposits - adits and drives extend 80 m into the hill on site of old native workings. |
|
1980s |
Limited exploration work undertaken with minor attention paid to the alluvial gold potential. |
|
1990-1995 |
Exploration focused on known prospects at Nkran deposit (formerly known as Jabokassie). Regional soil geochemical survey carried out that identified numerous anomalies around Nkran. Early reverse circulation (RC) drilling phase (details not available) yielded encouraging results over wide zone of bedrock mineralisation, extending along strike for 600 m. The broad, low-lying Nkran had relief of only about 40 m with oxidation extending to depths of 40 m. |
|
1995 |
Additional diamond drill hole (DDH), RC, RC with diamond tail (RCD) drilling was completed. Mineral Resources (Measured, Indicated and Inferred classes) were estimated and reported. A feasibility study (FS) was completed, and mining lease was granted. |
|
1996 |
Combined interests of KIR and AGF bought out by Resolute who immediately reviewed and expanded project scope. Further RC and DDH drilling over 74,168 m conducted to increase Mineral Resources to a depth of 150 m at Nkran and to further assess the known mineralisation at nearby Adubiaso. |
|
July 1996 |
Revised mine development plan completed with decision to proceed into production at a rate of 1.4 Mtpa. |
|
Early 1997 |
Initial mining commenced, and further exploration drilling continued. |
|
May 1997 |
First gold poured. |
|
1998-2000 |
Additional DDH, RC, RCD holes drilled. |
|
2001 |
Nkran Mine closed due to low gold price having produced 590,743 oz Au at an average grade of 2.35 g/t Au. |
|
2002 |
Intensive exploration undertaken. |
|
2011 |
PMI carried out a 5 km² Induced Potential (IP) ground geophysical survey. PMI also completed a VTEM electromagnetic (EM) and magnetic survey centred over the Nkran pit. |
|
2015-2016 |
Nkran Mine dewatered and re-opened by Asanko Gold as a deeper opencast operation. |
|
2016-current |
Open pit production. Plant refurbishment and expansion to circa 5 Mtpa |
|
Esaase |
|
|
Historical |
Artisanal mining in Bonte Area associated with the Ashanti Kingdom. |
|
1900-1939 |
Workings by European settlers evidenced by old adits - no documented records remain. |
|
1966-1967 |
Drilling conducted on the Bonte River valley alluvial sediments to determine alluvial gold potential - no information available. |
|
1990 |
Bonte mining lease granted to Akrokerri-Ashanti Gold Mines (AAGM) and later transferred to BGM. |
|
1990-2002 |
Recovered approximately 200,000 oz of alluvial gold on Esaase concession +300,000 oz downstream on Jeni River concession. |
|
2006-2013 |
Keegan consolidates further concessions. Intensive exploration - geophysics (airborne VTEM - 2,266 line-km), soil geochemistry (>4,000 samples) and exploration drilling. Drilling included 112 diamond core (DDH) over 25,190 m, 40 DTH over 2,692 m, 667 RC holes over 106,854 m and 321 RC with RCD holes over 100,102 m. |
|
2013-2018 |
Asanko Gold continues extensive exploration in order to update the Mineral Resources. 2018 included 43,383 m of re-logging and 4,992 m infill RC drilling. |
|
Dec 2018-current |
Open pit production. |
|
Nkran Extension Project area |
|
|
Historical |
No known historical exploration or mining activity. |
|
1997-current |
Exploration on north-eastern extension of Nkran structure delineated a number of mineralised zones - Akwasiso and Nkran Extension that have all been drilled (2016) to Indicated Mineral Resource classification. |
|
Akwasiso |
|
|
1996-2000 |
Exploration programs including 145 RC holes over 5,088 m and 32 DDH holes over 9,489 m to delineate the target. |
|
Asanko Gold Inc. NI 43-101 Technical Report on Asanko Gold Mine, Ghana |
|
2001 |
Artisanal miners mined oxides. 6 DDH holes drilled (1,826 m). |
|
2014-2018 |
Exploration continues with purpose of refining the Mineral Resource. Drilling undertaken including RC holes over 6,256 m, 25 DDH holes over 5,499 m and RCD holes over 6,619 m. |
|
2017 |
Open pit operations commence. |
|
Dec 2018 |
Open pit operations suspended in Q1 2019. |
|
Abore |
|
|
Historical |
Alluvial and elluvial artisanal gold mining. |
|
1990-1998 |
Mutual Resources and Leo Shield Exploration initiated regional exploration program (73 km²) including soil geochemistry and trenching. Soil geochemistry revealed a strong north-north-east trending gold anomaly over the area of artisanal mining (bedrock areas); the anomaly is several hundred metres wide and traceable along strike for about 3 km, well beyond the area of old workings. Extensive trenching confirmed continuous bedrock mineralisation over 1,000 m with widths in the range 50 m to 100 m. The mineralisation consists of a broad quartz stock work system hosted mainly by a north-north-east trending intermediate granitoid intrusion. Early artisanal pitting was focused mainly on narrow quartz veins associated with the stock work system Extensive drilling in the area (mainly RC, some DDH) outlined sizeable resources (now known as the Abore, Adubiaso, Asuadai and Akwasiso prospects). Full details of this work are not available. Prospecting in area north of Abore revealed artisanal mining in alluvial areas, as well as many old pits in the saprolite along a low hill immediately adjacent to the alluvial workings. |
|
2007-2012 |
Exploration programs which included 31,639 m RC (408 holes) and 10,188 DDH (57 holes) drilling completed. Resulted in a Mineral resource estimate. Open pit mining, and an agreement was reached whereby ore was trucked from Abore north to Nkran plant for treatment. |
|
2012-current |
No further exploration undertaken. Mineral Resource estimate restated. |
|
Asuadai |
|
|
Historical |
No known formal historical mining or exploration on this area. Minor pitting in the region by artisanal miners down to 5 m to 10 m through the oxide material to expose stock work vein sets. |
|
1996 |
Mining undertaken by artisanal workers (to present day). |
|
2000-2012 |
Exploration programs which included 447 holes for 5,551 m RC and 8,785 m DDH drilling completed. |
|
2014 - current |
No further exploration undertaken. Mineral Resource estimate restated. |
|
Adubiaso |
|
|
Historical |
No known formal historical mining or exploration on this area. |
|
1996-2000 |
Drilling undertaken over 292 holes for 639 m DD, 590 m RCD and 21,693 m RC. |
|
1999-2000 |
Open pit mining. Oxide ore processed at Nkran plant. |
|
2007-2013 |
Exploration programs which included 1,359 m RC and 9,691 DDH (50 holes) drilling completed. |
|
2016 |
Exploration continues with 35 RC holes over 3,460 m to refine ore body definition. |
|
2017 - current |
No further exploration undertaken. Mineral Resource estimate restated. |
6.3 Previous Mineral Resource estimates
A number of Mineral Resource and Mineral Reserve estimations and declarations have been conducted over the various project areas that are the subject of this Technical Report since 1995. It is accepted that the Mineral Resources were estimated in accordance with best practice guidelines and international mineral reporting codes but suitable qualified persons. The current Mineral Resources and Mineral Reserves are not based on the previous estimates and have been re-estimated from first principals.
A summary of the previously disclosed Measured and Indicated Mineral Resources per Project as presented in the DFS (2017) and Asanko Gold NI 43-101 (2017) is shown in Table 6-3. The Inferred Mineral Resources per Project area are presented in Table 6 4. All Mineral Resources are stated inclusive of Mineral Reserves.
|
Asanko Gold Inc. NI 43-101 Technical Report on Asanko Gold Mine, Ghana |
Table 6-3 Previous Measured and Indicated Mineral Resource estimates as per Asanko Gold, 2017
|
Deposit |
Indicated Mineral Resources |
Measured Mineral Resources |
Total Indicated and Measured Mineral Resources |
||||||
|
Tonnage (Mt) |
Grade (Au g/t) |
Content (Au Moz) |
Tonnage (Mt) |
Grade (Au g/t) |
Content (Au Moz) |
Tonnage (Mt) |
Grade (Au g/t) |
Content (Au Moz) |
|
|
Esaase Main |
57.53 |
1.38 |
2.55 |
26.49 |
1.38 |
1.17 |
84.02 |
1.38 |
3.72 |
|
Nkran Main |
24.57 |
1.81 |
1.43 |
5.50 |
1.68 |
0.30 |
30.07 |
1.78 |
1.72 |
|
Abore |
3.09 |
1.48 |
0.15 |
2.23 |
1.41 |
0.10 |
5.33 |
1.45 |
0.25 |
|
Dynamite Hill |
3.41 |
1.48 |
0.16 |
- |
- |
- |
3.41 |
1.48 |
0.16 |
|
Akwasiso |
6.33 |
1.50 |
0.31 |
- |
- |
- |
6.33 |
1.50 |
0.31 |
|
Adubiaso |
1.35 |
1.72 |
0.07 |
1.38 |
1.89 |
0.08 |
2.73 |
1.80 |
0.16 |
|
Esaase D |
2.00 |
1.29 |
0.08 |
- |
- |
- |
2.00 |
1.29 |
0.08 |
|
Esaase B |
2.65 |
0.84 |
0.07 |
- |
- |
- |
2.65 |
0.84 |
0.07 |
|
Asuadai |
1.88 |
1.22 |
0.07 |
- |
- |
- |
1.88 |
1.22 |
0.07 |
|
Adubiaso Ext |
0.26 |
1.71 |
0.01 |
0.16 |
1.96 |
0.01 |
0.42 |
1.61 |
0.02 |
|
Nkran Ext |
0.19 |
2.70 |
0.02 |
- |
- |
- |
0.19 |
2.70 |
0.02 |
|
Total |
103.26 |
1.48 |
4.92 |
35.76 |
1.44 |
1.66 |
139.01 |
1.47 |
6.59 |
Notes: Effective date 31 December 2016 (Akwasiso: 25 April 2017) at a 0.5 g/t Au cut-off within a US$1,500/oz Au shell. Columns may not add up due to rounding. Tonnage and grade measurements are in metric units. MREs reported as in situ tonnes. Individual densities applied per mineral zone. The tonnages and contents are reported as 100%; no attributable portions reported. One troy ounce is equivalent to 31.1035 grams. Dynamite Hill is excluded from the current disclosure.
Table 6-4 Previous Inferred Mineral Resource estimates as per Asanko Gold, 2017
| Deposit | Inferred Mineral Resources | ||
| Tonnage (Mt) | Grade (Au g/t) | Content (Au Moz) | |
| Esaase Main | 0.09 | 1.08 | 0.003 |
| Nkran Main | 0.31 | 1.86 | 0.018 |
| Abore | 1.28 | 1.61 | 0.066 |
| Dynamite Hill | 0.21 | 1.58 | 0.011 |
| Akwasiso | 0.18 | 0.81 | 0.005 |
| Adubiaso | 0.01 | 1.92 | 0.000 |
| Esaase D | 1.01 | 1.26 | 0.041 |
| Esaase B | 2.12 | 0.86 | 0.058 |
| Asuadai | 0.63 | 1.75 | 0.035 |
| Adubiaso Ext | 0.14 | 3.10 | 0.014 |
| Nkran Ext | 0.01 | 1.02 | 0.000 |
| Total | 5.96 | 1.31 | 0.251 |
Notes: Effective date 31 December 2016 (Akwasiso: 25 April 2017) at a 0.5 g/t Au cut-off within a US$1,500/oz Au shell. Columns may not add up due to rounding. Tonnage and grade measurements are in metric units. MREs reported as in situ tonnes. Individual densities applied per mineral zone. The tonnages and contents are reported as 100%; no attributable portions reported. One troy ounce is equivalent to 31.1035 grams. Dynamite Hill is excluded from the current disclosure.
6.4 Previous Mineral Reserve estimates
A summary of previous Mineral Reserves per Project area as presented in the DFS (2017) and Asanko Gold NI 43-101 (2017) is shown in Table 6-5. It is accepted that the Mineral Reserves were estimated in accordance with best practice guidelines and international mineral reporting codes by suitable qualified persons.
|
Asanko Gold Inc. NI 43-101 Technical Report on Asanko Gold Mine, Ghana |
Table 6-5 Previous Mineral Reserve estimate by deposit as per Asanko Gold, 2017
|
Deposit |
Mineral Reserves |
|||
|
Classification |
Tonnage (Mt) |
Grade (g/t Au) |
Content (Moz Au) |
|
|
Nkran |
Proven |
4.40 |
1.85 |
0.26 |
|
Probable |
18.37 |
1.93 |
1.14 |
|
|
Total |
22.77 |
1.91 |
1.40 |
|
|
Nkran Ext |
Proven |
0.11 |
2.47 |
0.01 |
|
Probable |
0.08 |
1.91 |
0.00 |
|
|
Total |
0.19 |
2.24 |
0.01 |
|
|
Abore |
Proven |
1.59 |
1.44 |
0.07 |
|
Probable |
1.60 |
1.53 |
0.08 |
|
|
Total |
3.18 |
1.48 |
0.15 |
|
|
Adubiaso |
Proven |
1.04 |
2.00 |
0.07 |
|
Probable |
1.04 |
1.82 |
0.07 |
|
|
Total |
2.09 |
2.08 |
0.14 |
|
|
Adubiaso Ext |
Proven |
0.12 |
1.66 |
0.01 |
|
Probable |
0.09 |
1.34 |
0.00 |
|
|
Total |
0.21 |
1.53 |
0.01 |
|
|
Dynamite Hill |
Proven |
- |
- |
- |
|
Probable |
2.84 |
1.49 |
0.14 |
|
|
Total |
2.84 |
1.49 |
0.14 |
|
|
Akwasiso |
Proven |
- |
- |
- |
|
Probable |
4.95 |
1.51 |
0.24 |
|
|
Total |
4.95 |
1.51 |
0.24 |
|
|
Asuadai |
Proven |
- |
- |
- |
|
Probable |
1.30 |
1.09 |
0.05 |
|
|
Total |
1.30 |
1.09 |
0.05 |
|
|
Total Obotan Reserve |
Proven |
7.26 |
1.79 |
0.42 |
|
Probable |
30.47 |
1.76 |
1.72 |
|
|
Total |
37.74 |
1.76 |
2.14 |
|
|
Esaase (Main Pit) |
Proven |
21.51 |
1.44 |
1.00 |
|
Probable |
41.05 |
1.47 |
1.94 |
|
|
Total Main Pit |
62.57 |
1.46 |
2.94 |
|
|
Esaase (B Zone) |
Proven |
0.10 |
0.83 |
- |
|
Probable |
0.00 |
0.92 |
- |
|
|
Total B Zone |
0.10 |
0.83 |
- |
|
|
Esaase (D Zone) |
Proven |
0.20 |
1.05 |
0.01 |
|
Probable |
0.40 |
1.70 |
0.02 |
|
|
Total D Zone |
0.60 |
1.56 |
0.03 |
|
|
Total AGM Reserve |
Proven |
29.08 |
1.52 |
1.42 |
|
Probable |
71.92 |
1.59 |
3.68 |
|
|
Total |
101.00 |
1.57 |
5.11 |
|
Notes: Mineral Reserves are defined within a mine design guided by Lerchs-Grossman (LG) pit shells. The LG shell generation was performed on Measured and Indicated materials only. Rounding has been applied to totals. Tonnage and grade measurements are in metric units. Reserves for each pit are based on detailed pit designed informed by US$1,300/oz pit shells. Minimum economic cut-off grade for Esaase deposits is 0.6 g/t Au and Nkran fresh 0.7 g/t Au. All other pits use an economic cut-off grade of 0.5 g/t Au and 0.7 g/t Au for oxide and fresh material respectively. No inferred, deposit, or mineralised waste contributes value to the pit optimisation or has been included in the Mineral Reserve. Proven and Probable Mineral Reserves are modified to include ore-loss and dilution. Reserve excludes Obotan surface stockpiles (as at 1 April 2011) of 1.95 Mt at 1.22 g/t Au. Mineral Reserve excludes approximately 10 Mt at 0.55 g/t Au of very low-grade material in the Measured and Indicated categories contained within the Esaase main pit design. Dynamite Hill is excluded from the current disclosure.
|
Asanko Gold Inc. NI 43-101 Technical Report on Asanko Gold Mine, Ghana |
6.5 Historical production
Artisanal mining has occurred at a number of the Asanko Gold target areas, focusing mainly on placer gold production. Prior to the Asanko Gold consolidation of the Keegan and PMI mineral assets in 2014, a number of satellite pit mining and evaluation projects were in operation.
The main producing mine in the area was the Obotan Mine (now Nkran Mine). Open pit mining commenced in February 1997. A total of 16.11 Mm3 of material was excavated from the open pit at a production rate of 1.4 Mtpa. Following several re-designs, the pit was mined in two stages. A total of 7.82 Mt of material was milled at an average recovery of 89% at a reported reserve grade of 2.35 g/t (Brinkley 2001). The mine was closed in July 2001 after having produced 590,743 oz Au. Operations were ceased due to a low gold price environment coupled with the requirement to push back the Nkran pit to access deeper, more competent reserves. Asanko Gold dewatered the Nkran pit and re-commenced mining operations in February 2015.
At Esaase, under the Bonte mining lease BGM recovered approximately 200,000 oz of alluvial gold during the period 1990-2002. No mining or production details are available. Asanko Gold has commenced operations of the Esaase ore body extracting ore from non-alluvial sources.
At Abore, Resolute Mining Limited (Resolute) conducted mining in the late 1990s to early 2000s. Mining targeted mainly oxides and transition material by open cast blast, load and haul to be processed at the old Nkran plant. Production details are unknown.
At Adubiaso, Resolute mined mostly oxides and transition material from the deposit by open cast free dig, load and haul to the Nkran plant. Mining was from October 1999 to December 2000. As reported by Brinkley (2001), a total of 3.79 Mm3 of material was excavated from Adubiaso open pit. A total of 0.70 Mt at 2.43 g/t Au was delivered to the ROM pad, containing a total of 54,654 oz of gold. Total production of 52,677 oz (recovered) was achieved with a pre-production cost of US$90/oz (February 1999 to October 1999); and an operating cost of US$262/oz (October 1999 to December 2000).
The Asuadai deposit has seen no legal mining conducted since the mineralisation was identified. Artisanal miners had and still are undertaking pitting within the mineralised zones of the prospect.
No large-scale mining was conducted at Akwasiso prior to Asanko Gold. Akwasiso has been in operation since 2018.
The Abore, Adubiaso, Asuadai and Akwasiso ore bodies form part of the LOM plan for Asanko Gold and are included in the Mineral Resources and Reserves declared in this Technical Report.
There is no record of formal historical mining activity for the other target areas.
|
Asanko Gold Inc. NI 43-101 Technical Report on Asanko Gold Mine, Ghana |
7 GEOLOGICAL SETTING AND MINERALISATION
Unless specified otherwise, all diagrams in this section are sourced from Asanko Gold, 2019.
7.1 Regional geology
The geology of Ghana is comprised predominantly of metavolcanic Paleoproterozoic Birimian Supergroup (2.25 to 2.06 Ga) sequences inclusive of the clastic Tarkwaian Group sediments (2.12 to 2.14 Ga), in the central-west and northern parts of the country (WAXI, 2015). Clastic shallow water sediments of the Neoproterozoic Volta Basin cover the northeast of the country. Minor Paleozoic and Cretaceous to Tertiary sediments occur along the coast and in the extreme southeast of the country.
The Birimian rocks formed during two major orogenic phases, namely the Eoeburnian (ca. 2.25 to 2.15 Ga) and the Eburnian (ca. 2.12 to 2.06 Ga). These two orogenic stages were separated by a major extensional event during which flysch type basins developed throughout the southern and western parts of the Birimian.
The Birimian rocks consist of narrow greenstone (volcanic) belts, which may be traced for hundreds of kilometres along strike but are usually only 20 km to 60 km wide. These belts are separated by wider basins, (such as the Kumasi Basin) of mainly marine clastic sediments. Along the margins of the basins and belts, there appears to be considerable inter-bedding of basin sediments and volcanoclastic and pyroclastic units derived from the volcanic belts. Thin, but laterally extensive chemical sediments (exhalites), consisting of chert and fine-grained manganese-rich and graphitic sediments often mark the transitional zones. The margins of the belts commonly exhibit faulting on local and regional scales. These structures are fundamentally important in the development of gold deposits for which the region is well known.
The Birimian sediments and volcanic rocks have been extensively metamorphosed. The most widespread metamorphic facies appear to be greenschist, although in many areas, higher temperatures and pressures are indicated by amphibolite facies. Multiple tectonic events have affected virtually all Birimian rocks with the most substantive being a fold thrust compressional event (Eburnean Orogeny), that affected both volcanic and sedimentary belts throughout the region and to a lesser extent, Tarkwaian rocks. For this reason, relative age relations suggest that final deposition of Tarkwaian rocks took place as the underlying and adjacent volcanic and sedimentary rocks were undergoing the initial stages of compressional deformation.
The regional geology of southwest Ghana is illustrated in Figure 7-1, while the general stratigraphy is provided in Figure 7-2.
|
Asanko Gold Inc. NI 43-101 Technical Report on Asanko Gold Mine, Ghana |
Figure 7-1 Regional geology of southwest Ghana around AGM concessions
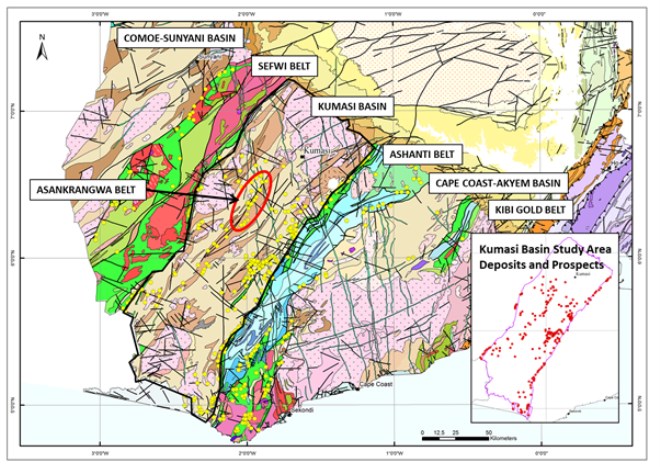
Source: Ghana Geological Survey; CJM, 2014
|
Asanko Gold Inc. NI 43-101 Technical Report on Asanko Gold Mine, Ghana |
Figure 7-2 Generalised stratigraphy of southwest Ghana
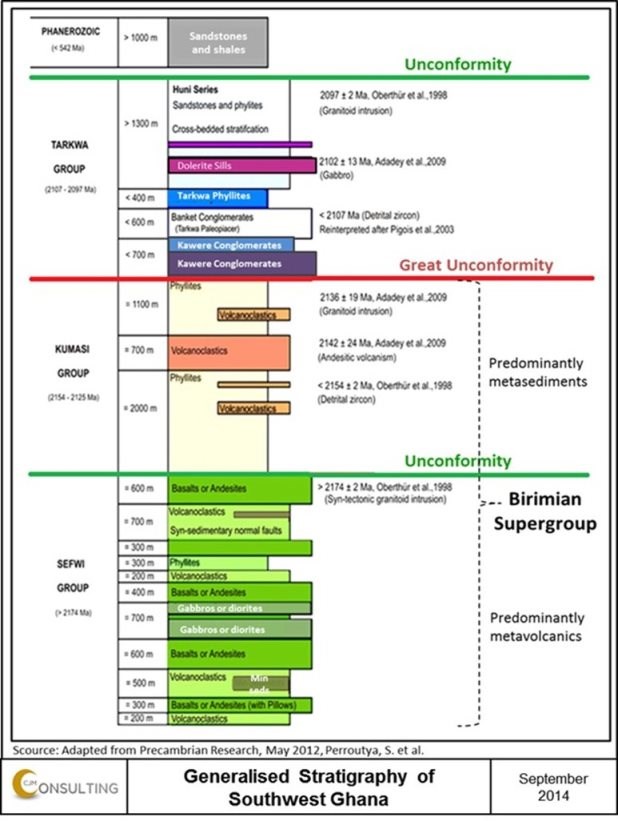
Source: CJM, 2014
|
Asanko Gold Inc. NI 43-101 Technical Report on Asanko Gold Mine, Ghana |
7.2 Local geology
The AGM deposits are located within the Kumasi Basin on the Asankrangwa Gold Belt (Figure 7-3), which was recognised after decades of artisanal mining in gold-bearing, shear zone hosted quartz reefs. The basin is bound to the south by the Ashanti Fault/Shear and the Bibiani shear to the north. The Asankrangwa Belt expresses itself as a complex of northeast trending shear zones situated along the central axis of the Kumasi Basin. Several major northeast trending shears/structures that bisect the Kumasi Basin/Asankrangwa Belt. The Nkran deposit is located on a jog along the regional 35-40° trending Nkran Shear, which is a zone of about 15 km in width and may be traced on a northeast to southwest trend for a distance of some 150 km. The Nkran Shear Corridor also hosts the Asuadai, Dynamite Hill and Akwasiso deposits. The parallel Esaase Shear Corridor hosts the Esaase, Adubiaso and Abore deposits. The Miradani Shear Corridor hosts the Tontokrom, Miradani and Fromenda deposits.
The local geological setting, i.e. the Kumasi Basin, is heavily faulted and consists of an isoclinally folded sequence of metasediments, dominated by turbiditic sequences of greywackes and shales, intercalated with rare andesites and volcanoclastics, previously described as greywackes, phyllites, argillites and shales.
The Asankrangwa Belt straddles two broad domains of distinct magnetic character. The western portion is characterised by the low magnetic relief that is typical of the Kumasi Basin as a whole. In the east, moderately magnetic mafic volcanic rocks results in a high magnetic zone corresponding to the Lower Birimian Supergroup, and the infolded, strongly magnetic rocks of the Ashanti Belt volcano-sedimentary and Tarkwaian sedimentary packages. This domain is in sharp contact with the weakly, to non-magnetic rocks of the upper Birimian metasediments, which dominate the Kumasi Basin in the west. This zone of contrast coincides with the prominent, shear zone which bounds the northwest margin of the Ashanti volcanic belt that plays host to most of the large gold deposits in the area.
A sharp NE trending break separates these two distinct magnetic domains and also truncates the dominant ENE to WSW trends typical of the eastern domain. Evident, dramatic changes in the structural grain in the area indicate the presence of a major shear zone separating the two domains. This interpretation results in the Upper Birimian metasediments of the western domain occurring in the hanging wall of the shear zone, and above Lower Birimian metavolcanics of the eastern domain which occur in the shear zone footwall. This arrangement of 'younger-over-older' supports a long and intense thrusting history on the shear zone.
One of the structural setting interpretations of the Asankrangwa Belt that explains these relationships is an inverted half-graben, in which growth faulting-controlled accumulation of the upper Birimian metasediments, above the Lower Birimian metavolcanics in the footwall.
|
Asanko Gold Inc. NI 43-101 Technical Report on Asanko Gold Mine, Ghana |
Figure 7-3 Location of AGM deposits along the Asankrangwa Gold Belt
|
|

|
Asanko Gold Inc. NI 43-101 Technical Report on Asanko Gold Mine, Ghana |
7.3 Property geology and mineralisation
The geology at each AGM target that is the focus of this Technical Report is provided in the sections to follow. The deposits are hosted along the NE-SW Asankrangwa structural shear corridor, which is defined by NE-SW trending lineaments and magnetic lows. It is about 7 km wide and over 50 km long. A summary of the mineralisation and dominant host rocks at each deposit is presented in Table 7-1.
Table 7-1 Summary of mineralisation style per deposit
|
Deposit |
Mineral style |
Main host rock |
|
Nkran |
D2 shear + granite + Late conjugate QVs |
Quartz (Qtz) sandstone + granite + quartz veins (QVs) |
|
Nkran Extension |
D2 shear + Late conjugate QVs |
Qtz sandstone |
|
Esaase |
D2 shear + tensional QVs |
Highly deformed sandstone-siltstone-shale + QVs |
|
Akwasiso |
D2 shear + granite + Late conjugate QVs |
Qtz sandstone + granite + QVs |
|
Abore |
D2 shear + granite dyke + Late conjugate QVs |
Granite + QVs |
|
Asuadai |
D2 + Granite + late conjugate QVs |
Granite + QVs |
|
Adubiaso |
D2 shear + granite dyke + Late conjugate QVs |
Qtz sandstone + granite |
|
Adubiaso Ext |
D2 shear + late conjugate QVs |
Qtz sandstone |
7.3.1 Nkran
Nkran, as with Asuadai, occurs on a 20° trending jog on Nkran Shear Corridor. The Nkran Shear is characterised by sheared siltstones (phyllites) dominant on the west and sandstone dominant on the east. The core of the Nkran deposit consists of a series of wacke and sandstone dominated stratigraphy that has been intruded by several granitic intrusions.
In plan, the Nkran pit covers approximately 850 m in a NE-SW direction along the strike length of the ore body, and at its widest point measures 450 m across strike. The main rock types at Nkran pit consist of thinly bedded greywacke and thickly bedded to massive sandstone, phyllite and carbonaceous shale. The metasediments have been isoclinally folded and sheared, and generally dip steeply to the north-west at between 70º to 80º, with a steep 70º southerly plunge.
Intruding the metasediments are two lensoid granitic intrusions. The granite is largely restricted to the NE portion of the pit, with isolated pods of granite in the southern portion. Granite is present at depth in the south end of the pit. The re-opening of the Nkran deposit has provided extensive in-pit exposure. The granites intrude structures marked by a stratigraphic discordance and are variably sericite altered. Of note is that the granites post-date the D1-D2 deformational events, and yet host a brittle vein style of gold mineralisation.
The regional stratigraphy trends in a NE direction, while in the middle of the Nkran pit the stratigraphy trends north. The stratigraphic discordance in the centre of the pit correlates with both the southern extent of the granite intrusion (GR01) at upper levels, and the presence of sandstone-dominant stratigraphy. Phyllites locally are observed to splay and merge along strike, and mark zones of higher strain (shear zones) within a more competent sandstone dominant package and granite. Duplex structures present through the centre of pit, cut the GR01 granite and repeat the sandstone-dominant stratigraphy along sheared phyllites and granite contacts.
Three predominant deformation/geotectonic phases are identified at the Nkran area:
- Closure of the Kumasi Basin through NW-SE compression
-
D1 NW-SE shortening, creating NE-trending, steep NW-dipping isoclinally folded stratigraphic package of greywacke, phyllite and carbonaceous shale
-
D2 WNW-ESE shortening, dextral movement along the Nkran shear, duplication of stratigraphy along phyllite/shale rich horizons. Formation of 4 main controlling structures - Freelander, Defender, Discovery and County. Early phase of Au-mineralisation (Galamsey Vein [GV], Central Vein [CV], Eastern Vein [EV]) associated with ductile fabric associated with D2 deformation.
-
|
Asanko Gold Inc. NI 43-101 Technical Report on Asanko Gold Mine, Ghana |
-
Change/rotation in stress field resulting in SW-NE compression
-
D3 SW-NE shortening, resulting in crenulation cleavage.
-
-
Change/rotation in stress field resulting in NE-SW compression
-
D4a NE-SW shortening, resulting in shallow stacked veins that cross cut D2 fabric. Vein arrays predominantly hosted within the thick sand (broad sandstone) package, the synformal keel of prior D1/D2 deformation and several granite stocks. High grade gold associated with these vein arrays
-
D4b NW-SE extension, resulting in steep, narrow extension veins striking NW. Often contain high grade gold.
-
-
D5 NW-SE shortening, sinistral reactivation of major structures, resuling in barren quartz breccia and laminated veins, contain xenoliths of early D2 and D4 related mineralisation.
Figure 7-4 shows a plan and cross section view of the geology at Nkran.
Mineralisation
Mineralisation at Nkran is split into two major phases:
1) Ductile, shear hosted mineralisation, within the NNE-striking, steeply W-dipping GV, CV and EV systems. These zones typically measure approximately 2 m in wide in the central area, with higher grades associated with the intersection of the lodes and the controlling structures (Freelander, Defender, etc.) resulting in high grade steeply plunging shoots. These lodes are overprinted by a barren quartz event that significantly disrupts the continuous nature of the mineralisation in the central zone of the pit.
2) Cross cutting, NW to NNW-striking, shallow to moderately NE-dipping brittle quartz-carbonate vein hosted mineralisation, and associated sericite-albite-arsenopyrite-magnetite alteration. Steep, narrow (2-5 cm thick) high grade veins overprint the shallow dipping mineralisation. The first set of shallow dipping veins are linked to NE-SW shortening. The second phase of veins were linked to NNE-SSW extension. This mineralisation is predominantly hosted in the folded thickened broad sandstone and granite stocks.
There is a very strong control on the gold mineralisation distribution by structures associated with the Western Sandstone and the Eastern Breccia.
Nkran Extension is more planar shear-controlled mineralisation locating on splays off the Nkran structure.
|
Asanko Gold Inc. NI 43-101 Technical Report on Asanko Gold Mine, Ghana |
Figure 7-4 Nkran plan view and cross section through pit showing geology
|
|
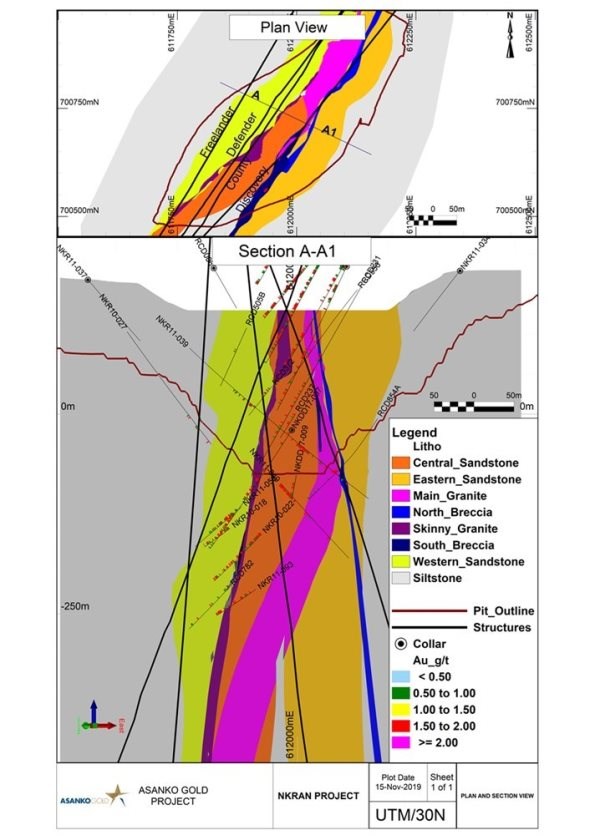
|
Asanko Gold Inc. NI 43-101 Technical Report on Asanko Gold Mine, Ghana |
7.3.2 Esaase
The Esaase Project area contains a system of gold-bearing quartz veins hosted by tightly folded Birimian-age sedimentary rocks arranged along a NNE-SSW trending strike. The host rocks are phyllite and siltstone (with substantial carbonate in matrix) in the hangingwall of a regional geophysical resistivity break, and a greywacke/sandstone succession in the footwall of the resistivity break extending to a regional footwall Viper shear zone. Four stratigraphic units are recognised, all of which are bounded by NE - SW trending sheared contacts (Table 7-2).
Table 7-2 Stratigraphic unit with general description
|
Stratigraphic unit |
General description |
|
Upper Siltstone |
Interbedded succession of sandstone (Upper Sandstone unit) and siltstone layers. The Mamba shear zone marks the top contact of the unit. |
|
Cobra Siltstone |
Distinctive, sheared and folded pelitic and carbonaceous succession which caps the Central Sandstone. The Cobra unit contains shear - bounded discontinuous shale bands. |
|
Central Sandstone |
The Dominant gold-bearing unit which is exposed in the Esaase starter pit and represents the principal economic unit. |
|
Python Shear Sandstone |
High-strain bounding Python shear with relatively undeformed Sandstone in the footwall which extends to the Viper Shear Zone. |
The weathering profile is strongly influenced by topography and comprises saprolite, oxidised bedrock, and bedrock (often with a gradational zone, "saprock", between the saprolite and oxidised bedrock).
The structural architecture is dominated by fold-thrust patterning followed by a late stage strike-slip deformation event. Open to tight, NW-dipping folds (axial planes of the folds strike 020° to 035°, and plunge NE 30° to 70°), are asymmetric and climb to the SE as shear zones are approached. Folds tighten and deformation increases systematically to the SE as shear zones are approached. This patterning repeats itself on the 10 m to 100 m scale. Folding in the deformed siltstone/shale package is open to tight, locally approaching isoclinal. Fold orientation ranges from upright to moderately inclined with their dip direction to the NW. The pattern of deformation is consistent with regional interpretations of tectonic transport to the SW. The fold limbs steepen as high strain zones (shears /thrust faults) are approached from the NW. Within these shear zones shearing commonly shows lower, or lesser strain and repeats the pattern of low to high strain at the next shear. These NE striking, NW dipping syn-kinematic shears, which roughly parallel fold axial planes, appear to demarcate zones of mineralisation. In many instances, the basal shear /thrust, divides the more deformed, altered, mineralised and electrically conductive siltstone shale unit in the hanging wall (Upper and Cobra units) from the more massively bedded and less deformed greywacke/sandstone in the footwall (Central and Viper sandstones).
E-W secondary conjugate structures are present and correspond to E-W topographic highs, which are typically coincident with mineralisation in the Asankrangwa Belt and are interpreted to result from enhanced resistivity to weathering resulting from silicification and hydrothermal alteration associated with mineralisation. The Main and South zones at Esaase are both associated with topographic ridges as well as the secondary conjugate structures in the Main Zone.
At Esaase, the zone of oxidation is differentiated into strongly (SOX), moderately (MOX) and weakly (WOX) oxidised transition zone material. These zones collectively vary in depth from surface by 80-100 m.
The stratigraphic succession of rocks at Esaase is illustrated in plan view and cross section in Figure 7-5. The pit outline shown in the Figure represents the oxide pit. Geological mapping of the pit since start of mining has provided invaluable insight to the lithological and structural geology of Esaase, and associated geometallurgy and controls on gold mineralisation.
|
Asanko Gold Inc. NI 43-101 Technical Report on Asanko Gold Mine, Ghana |
Figure 7-5 Esaase plan view and cross section through pit showing geology
|
|
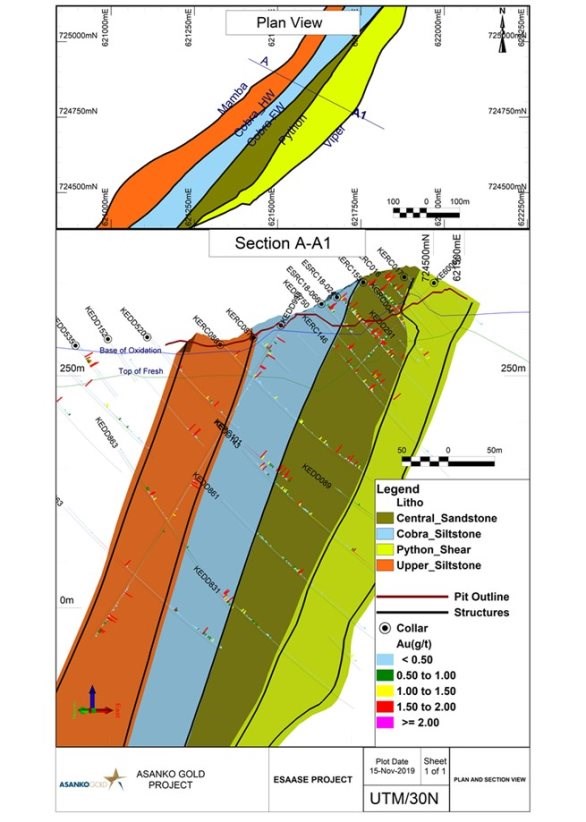
|
Asanko Gold Inc. NI 43-101 Technical Report on Asanko Gold Mine, Ghana |
Mineralisation
Gold mineralisation at Esaase is associated with alteration of the host rocks, generally in the form of disseminated hydrothermal alteration known as quartz sericite pyrite (QSP) alteration. At closer scale, pyrite pseudomorphs can be distinguished. The second stage of alteration consists of pervasive carbonate alteration in the form of carbonate porphyroblasts, particularly after andalusite in phyllitic rocks. Carbonate flooding is more prevalent in siltstone where precursor andalusite porphyroblasts did not form.
Hematite alteration is also noted in discrete areas of the deposit. There may be an association between the hematite alteration and the secondary E-W structures (and their intersections with the primary NE-SW shear structures).
Gold mineralisation occurs in late stage brittle quartz-carbonate veins hosted within the Stratigraphic units, generally as NE trending sheeted veins and N-S extensional veins within broad mineralisation envelopes. Quartz veins formed within the mineralisation envelopes throughout the duration of the extensive fold and thrust and strike slip deformation events. Four stages of veins can be identified:
1) Early un-mineralised quartz-only vein stage which has undergone deformation and brecciation
2) Second vein stage consists of a myriad of fine spider web like quartz carbonate veins
3) Third stage quartz-carbonate-sulphide veins with visible free gold. The associated sulphide is generally pyrite, but up to 15% of it can be chalcopyrite, with minor arsenopyrite
4) Late stage post-mineral calcite veins crosscut all previous features.
In addition, although minor pyrite and arsenopyrite are associated with the hydrothermal alteration, there is only a very minor affiliation between sulphides and gold mineralisation and it is estimated that less than 5% of gold occurs as inclusions. Rather than a chemical precipitation due to the chemistry of the host rocks as occurs elsewhere in the adjacent Birimian volcanic belts, the method of mineralisation here appears to be controlled by fluid pressure.
Geometallurgy
The key component of the geometallurgy of the fresh, unoxidised gold mineralisation at Esaase and potentially within the WOX transition zone, is the distribution and relative abundance of organic carbon (OC) which shows enrichment in the following areas:
-
Within and immediately adjacent to the NE-SW trending shear zones and sheared lithological contacts within the stratigraphic units
-
Within the deformed shales and siltstones of the Cobra unit.
In terms of mapping OC by stratigraphy, five diamond drill hole intersections located in Fresh rock below the Esaase Main oxide starter pit were selected and analysed at 1.0 m sample intervals for OC. The intersections extended continuously from the upper Mamba shear zone to the lower Python shear zone.
Column plots of the percent of OC in the drill holes colour-coded above and below 0.5% threshold are presented in Figure 7-6. The Cobra unit is highlighted as a distinct elevated OC geometallurgical domain in all five holes. Narrow 2 to 5 m intervals greater than 0.5% OC are also found in the Upper unit and to a much lesser extent in the Central Sandstone. Examination of core photographs shows that these intervals are related to narrow intra-lithology shear zones (which may represent thrust faults causing thickening of the units) or associated with sheared siltstone/sandstone lithological contacts as occurs in the Upper unit. A notable feature is the pronounced thinning of the Cobra unit to the south, between drill holes KEDD967 and KEDD965, and recent pit mapping has shown that the Cobra unit terminates at the southern end of the pit against a structural contact which doubles the thickness of the low OC Central Sandstone. These are fundamental continuous improvement observations which are scheduled for follow up in 2020.
|
Asanko Gold Inc. NI 43-101 Technical Report on Asanko Gold Mine, Ghana |
Geological observations from ongoing pit mapping and linked to the %OC drill hole stratigraphic mapping suggest that elevated OC is predictable and occurs within identifiable "structural domains" that are not continuous across the full strike length of the Esaase Main and South deposits. It is noted that the metallurgical sampling and testing completed in 2018/ 2019 is better aligned with the growing geological understanding, but still remains biased towards the thinking that OC is more widespread - this is to be addressed in 2020.
Figure 7-6 Esaase mapping of %OC by stratigraphic unit colour-coded by %OC threshold
|
|

Cumulative frequency analysis of the %OC data by stratigraphic unit supports these observations and is summarised in Table 7-3. In terms of practical open pit mining with geological controls, the %OC data indicate that there is a 280 m on-strike interval below the oxide starter pit, extending from KEDD967 to KEDD530, which shows elevated %OC predominantly associated with the Cobra unit. However, evidence from updated pit mapping suggests the strike length of the Cobra unit is limited to 200 - 400 m NE plunging fold closures and these concepts are to be tested in 2020. In summary, the %OC mapping and associated 2018/2019 metallurgical testing may carry a sampling bias which Asanko Gold is not able to quantify at this stage of the Project, but early indications are that the elevated %OC by stratigraphy in terms of volume may be overstated in current metallurgical models.
Table 7-3 Statistics of %OC populations by stratigraphic unit (in %)
|
Stratigraphic unit |
Probability of OC above 0.5% threshold |
Mean %OC of sample population below threshold |
Mean %OC of sample population above threshold |
|
Upper |
15 |
0.30 |
0.84 |
|
Cobra |
55 |
0.38 |
0.89 |
|
Central Sandstone |
12 |
0.30 |
0.62 |
|
Python |
26 |
0.32 |
0.62 |
In summary, the following is noted:
-
Organic carbon (OC) is present in all geological and metallurgical samples tested to date
-
Samples with greater than 0.5% OC occur in the Cobra unit and in narrow shear zones/lithological contacts in the Upper and Central Sandstone units which are amenable to selective mining and stockpiling
-
Emerging geological evidence from oxide pit mapping indicates NE plunging fold-structural domains with elevated OC within 200 - 300 m strike lengths (specifically the Cobra unit)
|
Asanko Gold Inc. NI 43-101 Technical Report on Asanko Gold Mine, Ghana |
- Available geological evidence indicates metallurgical over-sampling of high OC units.
7.3.3 Akwasiso
The Akwasiso target lies some 4 km NE of the main Nkran deposit and geologically bears many similarities to Nkran. A granite intrusion surrounds a 080° dipping cross structure and mineralisation hosted in bounding 035°N sub vertical shear structures transgressing a sandstone/siltstone sequence.
The deposit is predominantly underlain by Lower Birimian metasediments with dominant lithologies being sandstone, siltstone, shales and a granitic intrusion. The contact between these sediments is intruded by granitoids mainly of felsic composition (belt granitoids), which form elongated bodies parallel to the regional shears. In many areas, the contact between the metasediments and the granitoids delineates high zones of mineralisation. The metasediments occasionally host disseminated sulphides and carbonates. Pyrite, the most prevalent sulphide, is most often oxidized to limonite or leached out leaving cubic casts. Carbonates, phyllites, graphitic schists and volcaniclastics constitute the major components of these supra crustal rocks. They have well developed schistosity that is parallel to bedding, striking NE usually between 40° and 50° and often dip steeply to either NW or SE away from the granitic body. The rocks are generally foliated with the shales displaying better development of foliation planes than the sandstones. Foliation dips steeply and slightly oblique to bedding.
The sandstone unit appears to be the favourable host rock for mineralisation where more brittle quartz-carbonate veins are localized.
A plan view and cross section at Akwasiso showing the deposit geology is provided in Figure 7-7.
Mineralisation
Akwasiso represents a smaller scale version of Nkran, with mineralisation hosted in shears on siltstone/sandstone contacts, and around and within the granitic intrusive. Strong alteration zones are associated with higher grades around the sandstone-granite contact. Mineralisation is hosted in the sandstone unit with gold occurring within quartz-carbonate veins, similar to the other deposits in the belt. Alteration mineral assemblages associated with gold mineralisation are sericite-quartz-carbonate-pyrite and arsenopyrite. Higher grade intersections occur at the margins of the sandstone with the granite.
|
Asanko Gold Inc. NI 43-101 Technical Report on Asanko Gold Mine, Ghana |
Figure 7-7 Akwasiso plan view and cross section through pit showing geology
|
|
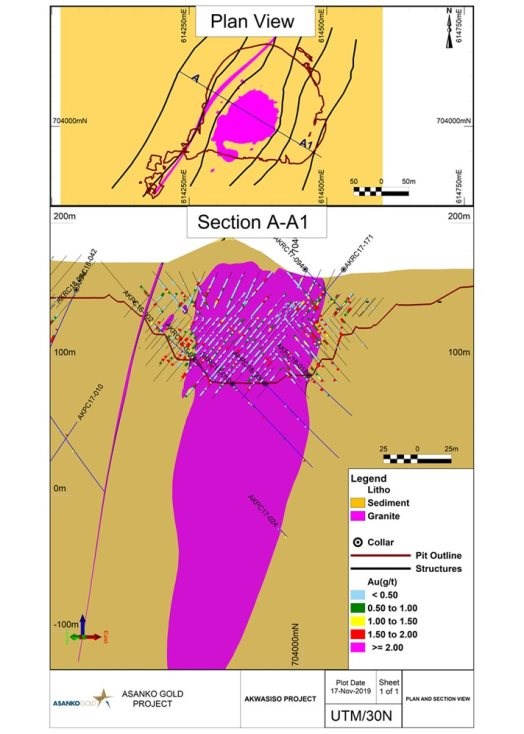
7.3.4 Abore
The Abore deposit is located on the Abore-Esaase shear corridor which also hosts the Esaase deposit.
The main rock types observed within the Abore pit consist of carbonaceous shale, siltstone (phyllite), thinly bedded wacke and thickly bedded sandstone. The sedimentary sequence has been intruded by a granitic (tonalitic) intrusion. For the purpose of the development of the geological model, the various lithologies have been grouped into the following:
|
Asanko Gold Inc. NI 43-101 Technical Report on Asanko Gold Mine, Ghana |
-
Interbedded siltstone dominant: The thinly bedded siltstone and shale (with a minor interbedded wacke component) is the principal geology domain on the western portion of the deposit. This forms the hanging wall host sequence to the granite intrusion
-
Interbedded sandstone dominant: The footwall sandstone and greywacke interbedded sedimentary sequence is the principal lithology on the eastern portion of the deposit. This forms the footwall host sequence to the granite intrusion. The sediments dip steeply to the NW between 70° to 85°
-
Granite intrusion: An elongate granite (tonalitic) intrusion has intruded parallel to the main lithological domain boundary. The granite, which is foliated, dips steeply to the NW. The granite has been boudinaged
-
Dyke. A late cross-cutting west-east striking dyke features in the northern section of the deposit.
Several foliation and bedding relationships are observed at the Abore deposit. The most common feature is a pervasive foliation that is well developed in the fine-grained siltstones and shales and to a lesser extent in the coarser interbedded sandstone and wacke sequences. A strong foliation (040° strike and steep dip west) is also present on both the hanging wall and footwall margins of the granite, indicating emplacement prior to deformation. The hanging wall sequence of interbedded siltstone, shale and wacke is significantly more deformed and foliated than the footwall sequence of sandstone with minor wacke, with several shears, trending on a bearing of 020°. These shears developed preferentially within the carbonaceous shale-rich units.
The presence of large-scale folding within the Abore pit is supported by the observation of opposing foliation/bedding relationships within drill core. The second notable folding event is a NNE trending, steep north-westerly dipping foliation which cuts the earlier 040° trending fabric. Several of these structures are recognisable within the pit. These structures appear to be spatially associated with high grade gold trends.
A plan view and cross section at Abore showing the deposit geology is provided in Figure 7-8.
Mineralisation
At least two (potentially three) phases of mineralisation are recognised at Abore. Mineralisation is constrained to the granite, with the overall trend of mineralisation being parallel to that of the stratigraphy.
The dominant phase of mineralisation is hosted in shallow west dipping 1 cm to 10 cm thick quartz vein arrays which have developed primarily along the eastern margin of the granite contact and the sandstone-wacke dominated stratigraphy. Minor disseminated alteration is observed, despite the significant hydrothermal (sericite and arsenopyrite) alteration associated with the mineralised zones. Vein density, rather than vein thickness, seems be indicative of higher-grade zones. Analysis of vein orientations showed that two vein types shallow west dipping and steep west dipping occur.
Analysis of the grade control data shows discrete NNE zones of high-grade mineralisation that have developed in the boudin necks of the granite bodies relating to early NNE trending structures. It is probable that this pre-dates the quartz vein hosted mineralisation, and is similar to that of Nkran, where shallow west dipping vein arrays overprint steep, high grade mineralisation.
|
Asanko Gold Inc. NI 43-101 Technical Report on Asanko Gold Mine, Ghana |
Figure 7-8 Abore plan view and cross section through pit showing geology
|
|
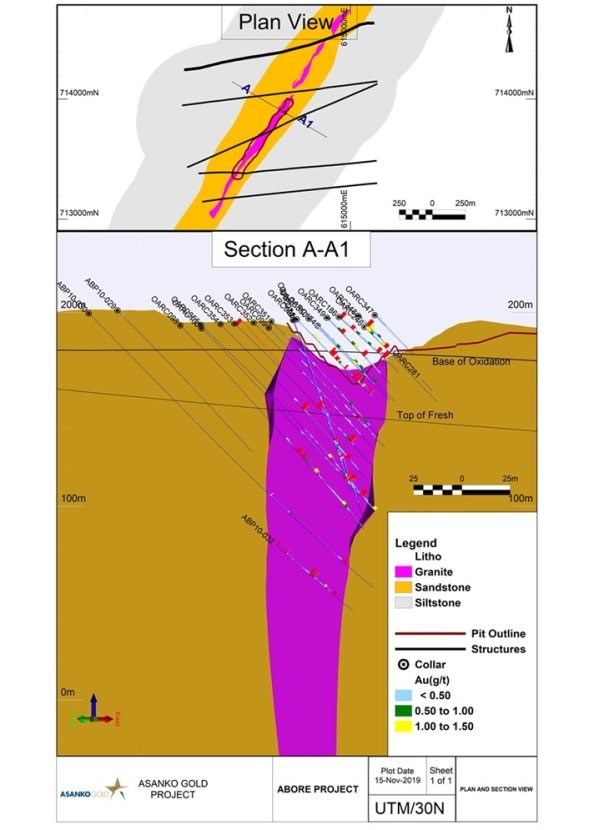
|
Asanko Gold Inc. NI 43-101 Technical Report on Asanko Gold Mine, Ghana |
7.3.5 Asuadai
The Asuadai deposit is located on the regional NE trending Nkran shear zone, approximately 10 km along strike from Nkran. The prospect features a massive intermediate (tonalite) granitoid hosting a quartz stock work system.
The main rock types observed within the Asuadai pits consist of thinly bedded carbonaceous shale, siltstone (phyllite) and more thickly bedded wacke and sandstone. Two narrow granitic intrusions (diorite dykes) intrude the metasedimentary sequence on the boundary between the two main sedimentary domains. Extensive shearing in places associated with silica flooding (and associated alteration), makes it difficult to determine volcanic component of these rocks.
The general geology of the deposit may be broadly sub-divided into two main sedimentary domains:
-
NW sedimentary sequence comprising interbedded wacke and siltstone (with a minor shale component)
-
SE sedimentary sequence consisting of interbedded sandstones and wacke lithologies, with a minor shale component. The sequence is separated by a granitic dyke intruding parallel to this main lithological boundary.
Bedding trends on a bearing of 40°, with local variations, along major structures of up to 00°.The stratigraphy at Asuadai has, like Nkran, been isoclinally folded and dips steeply (approximately 70°) to the west. The stratigraphy is locally imbricated and transposed along major structures which trend on a bearing of 00°.
As with Nkran, Asuadai is located on a 20° trending jog on a regional 35-40° trending structure and is characterised by phyllites dominant on the western margin and sandstone dominant on the eastern portion of the deposit. The granite forms the core of the deposit and is bounded by the two main sedimentary sequences.
Figure 7-9 shows the geology at Asuadai in plan view and cross section.
Mineralisation
The Asuadai deposit is characterised by preferential alteration of the sandstone and wacke (to a lesser extent) lithologies to a sericite-magnetite (±albite) assemblage. This alteration style appears to be distinctive to mineralisation associated with the Nkran regional structural trend. Various stages of arsenopyrite and pyrite are observed, either disseminated throughout the core, or as selvages to gold bearing quartz veins. Arsenopyrite appears to be dominantly associated with the shallow SW dipping vein arrays, with significant disseminated alteration occurring within the granitic intrusion. Siltstone (and carbonaceous shale) lithologies are generally unaltered.
Early ductile mineralisation appears to be associated with silicification and minor pyrite. The extensive over printing and later reactivation of these structures makes it difficult to establish a distinct alteration package.
The deposit is relatively complex with several controls of mineralisation which influences the geometry of the mineralisation. Two distinct styles of mineralisation are recognised:
-
Steep ductile type mineralisation associated with the metasedimentary lithologies: This style was selectively overprinted by a later brittle brecciating event. This mineralisation parallels bedding, or foliation. Stereographic projections of vein arrays show a 020° to 040° orientation dipping steeply towards the west. The steep ductile mineralisation is seen to bind the granitic intrusion. This mineralisation is also associated with parallel structures to the main granitic intrusion
-
Shallow dipping quartz veins: This is the dominant phase of gold mineralisation at Asuadai and consists of veins that vary in thickness from 1 cm to 60 cm. The flat lying vein arrays are best developed in the granite. The veins have associated sericite-albite-arsenopyrite-magnetite alteration.
|
Asanko Gold Inc. NI 43-101 Technical Report on Asanko Gold Mine, Ghana |
Figure 7-9 Asuadai plan view and cross section through pit showing geology
|
|
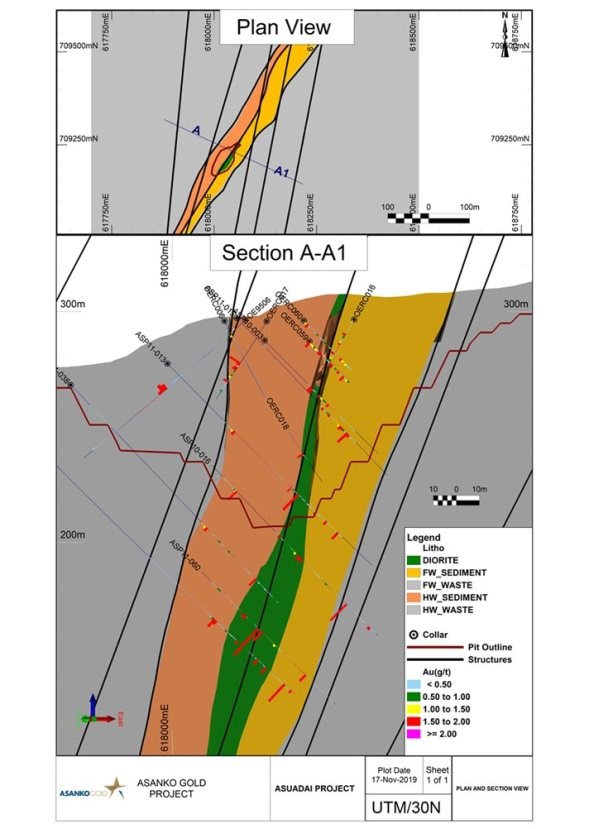
|
Asanko Gold Inc. NI 43-101 Technical Report on Asanko Gold Mine, Ghana |
7.3.6 Adubiaso
The Adubiaso geology comprises a sub-vertical stratigraphy of interbedded greywacke and phyllite, with three sub-vertical granite (porphyry) dykes obliquely cross-cutting the stratigraphy. A steep dipping (65° E) quartz vein system cuts across Birimian metasediments, which dip steeply at 75° to the west. The vein system appears to be related to a NE fracture system (distinct from the Nkran structure) along the contact zone between dominantly phyllitic units on the east and coarser greywackes on the west, which host most of the gold bearing veins. The central part of the vein system is 15 m to 20 m wide, but it tapers to about 10 m at both ends; the vein system has a strike length of about 700 m although the main area of economic significance is the central 300 m of the zone.
As at Nkran, there are narrow granitoids running generally parallel to the Adubiaso ore body in the pit area, but these are un-mineralised. It is also noteworthy that the gold mineralisation is restricted to the quartz veins and the metasedimentary host rocks are essentially barren, whereas at Nkran the gold values extend well into the host rocks.
The geology at the main Adubiaso deposit is illustrated in plan view and cross section in Figure 7-10.
The Adubiaso Extension (or North) deposit is located to the NE of main Adubiaso deposit, separated by the broad River Adubia drainage line. The deposit lies on the structure which host the Abore deposit known as the Abore shear.
Mineralisation
The gold mineralisation at Adubiaso occurs along the main NE to SW striking shear vein system in sub-vertically interbedded greywackes and phyllites intruded by later felsic intrusives. Subtle jogs in the felsic intrusives give rise to higher grade ore shoots. The ore body plunges shallowly to the NE at 20° parallel to the intersection of ENE dipping veins with the main strike direction.
Mineralisation at Adubiaso is split into two phases:
1) Ductile, shear hosted mineralisation, within the NNE striking, steeply west dipping Nkran Shear Corridor. This zone measures approximately 25 m in width in the central area, thinning to approximately 6 m at the northern and southern ends of the pit
2) Cross cutting, NW to NNW striking, moderately east dipping brittle quartz carbonate vein hosted mineralisation. This mineralisation cross cuts the shear zone and porphyry zones, and clearly postdates the early phase of mineralisation and can be found in the hanging wall and footwall to the central mineralised zone. These structures appear to be spaced 35 m to 60 m vertically.
The deposit extends for some 1,000 m along strike and 180 m depth. The mineralised zones are typically 1 m to 4 m wide, but may occasionally reach up to 20 m. The gold mineralisation occurs as free gold and is associated with the NE plunging quartz veins, along the intersection of the metasediments and sheared porphyries.
The mineralised vein set strikes NNW to NNE and dips towards the east, cross-cuts the regional NE striking foliation, and is variably deformed near the shear zone.
A subtle jog in the strike of the porphyries and carbonaceous schist, correlates with ore zone terminations. The ore shoots plunge shallowly to the north, parallel to the intersection of the ENE dipping veins with the sub-vertical north to south striking shear zone, and sub-parallel stretching lineation. The ore body occurs parallel to the strike inflection, which would be parallel to the north plunging stretching lineation.
The mineralisation shows an overall north-south trend and a broadly anastomosing character. The undulations in the grade outlines are considered to correlate with interpreted NE to SW striking shears that appear to dextrally off-set the lithology and mineralisation to differing degrees. The overall movement is on a metre to tens of metre scale, with small offsets noted in the geological modelling.
|
Asanko Gold Inc. NI 43-101 Technical Report on Asanko Gold Mine, Ghana |
Figure 7-10 Adubiaso plan view and cross section through pit showing geology
|
|
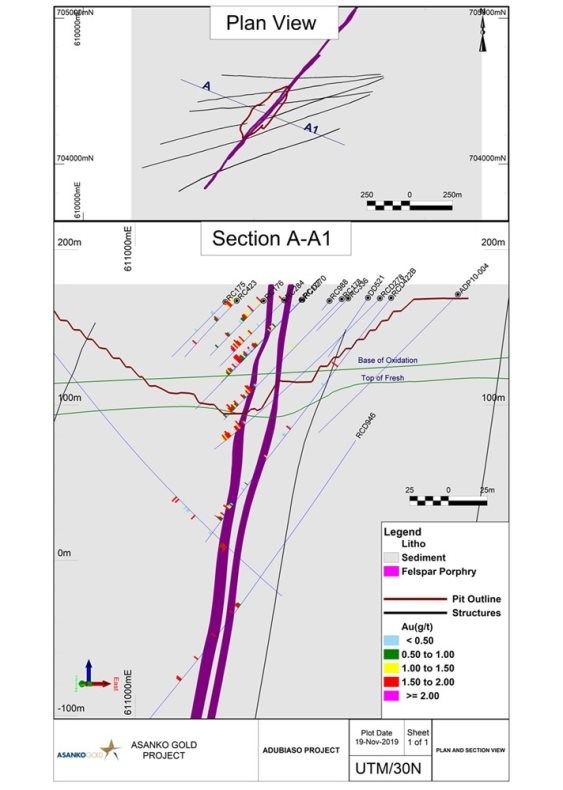
|
Asanko Gold Inc. NI 43-101 Technical Report on Asanko Gold Mine, Ghana |
8 DEPOSIT TYPES
Two broad styles of gold deposits are present in southwest Ghana:
-
Structurally controlled lode or orogenic gold deposits
-
Paleoplacer disseminated gold deposits in Tarkwaian conglomerates.
The primary controls on mineralisation in the Asankrangwa Belt are structural in origin. Certain sandstone units within the Birimian metasedimentary package provided favourable rheological conditions that optimised gold deposition often close to major lithological contacts with either Birimian metavolcanics, or Tarkwaian metasediments. The deposit type targeted by Asanko Gold is this structurally controlled mesothermal quartz vein style mineralisation. This is the most important type of gold occurrence in West Africa and is commonly referred to as the Ashanti-type. Milesi et al. (1992) recognised that mesothermal quartz vein style deposits are largely confined to tectonic corridors that are often over 50 km long and up to several kilometres wide and usually display complex, multi-phase structural features, which control the mineralisation.
There are at least two separate gold mineralising events that are linked to the structural evolution of the area. Mineralisation is linked to:
-
Early isoclinal folding, shearing and/or duplexing of stratigraphy controlling the location of deformation zones and fluid flow
-
A late approximate east-west compressional event that generated shallow dipping to flat orientated conjugate vein sets that crosscut the earlier fabric and gold mineralisation.
This brittle style deformation postdates the emplacement of granitic intrusives into the core of the existing deformed and sheared sediments.
Two distinct gold events are recognised in southwest Ghana:
-
D2 gold related to regional north-east south-west compression and reverse faulting (ca. 2,110 Ma)
-
D4/D5 gold related to regional sinistral strike slip faulting (ca. 2,090 Ma).
Gold mineralisation is associated with major NE striking, 5 m to 40 m wide graphite-chlorite-sericite fault zones. In particular, gold mineralisation is developed where the NE fault zones intersect major ENE striking fault zones, and especially where they are recognised to have influenced granite emplacement, alteration and gold geochemical trends.
Left stepping flexures (10 km to 30 km scale) in the NE striking fault zones (which produce more northerly striking fault sections), are important for the localisation of gold mineralisation. Other local complexities in stratigraphy and fault geometry, associated with major NE striking faults, are also important for example, folds in stratigraphy that may produce saddle reef style mineralisation, or fault duplexes.
The most common host rock is usually fine-grained metasediments, often in close proximity to graphitic, siliceous, or manganiferous chemical sediments. However, in some areas, mafic volcanics and belt intrusions are also known to host significant gold occurrences. Refractory type deposits feature early-stage disseminated sulphides in which pyrite and arsenopyrite host important amounts of gold overprinted by extensive late stage quartz veining in which visible gold is fairly common and accessory polymetallic sulphides are frequently observed. This type includes important lode /vein deposits in Ghana such as at the Obotan and Esaase area. However, a second non-refractory style of gold mineralisation occurs in which gold is not hosted within sulphide minerals either in early, or late stage mineralisation. These deposit types have lower sulphide content in general and often lack the needle-like arsenopyrite that is common in the refractory type deposits.
The Obotan deposits demonstrate a late (second) phase of gold mineralisation hosted in granitoids (Nkran basin type granite), emplaced in regional shear corridors. The deposits are situated within the Birimian metasediments, but the granitoid and mineralisation both occur at contacts between greywacke and carbonaceous phyllite units. The deposits are dominated by D2 regional reverse faulting gold, and only contain quartz vein-hosted free-milling gold lodes.
|
Asanko Gold Inc. NI 43-101 Technical Report on Asanko Gold Mine, Ghana |
9 EXPLORATION
Asanko Gold has employed an ongoing systematic exploration programme including regional (generative) and near mine (advanced) programmes, targeting new gold deposits as well as incremental mineral resources (oxide and fresh). Regional prospectivity work was initiated in 2014 in collaboration with Corporate Geoscience Group (CGSG), and advanced drilling programmes undertaken thereafter from early 2015. The key elements completed to date include:
-
Prospectivity mapping analysis of the Asankrangwa Belt (collation of available regional geophysical and geological data and drilling and geochemical survey information)
-
Review of previous exploration and drilling programs
-
Exploration target prioritisation for generative and advanced exploration
-
3,000-line kilometre Heli-borne versatile time-domain electromagnetic surveying (VTEM) survey infilling previous gaps in coverage
-
Updated regional geological interpretation based on the interpretation of the VTEM survey
-
3D inversion study of the VTEM data
-
Relogging of DDH core (Nkran, Abore, Esaase)
-
RC, RCD and DDH drilling to indicated Mineral Resource classification on all selected and reported targets.
Asanko Gold have collated all historical work and integrated the databases from previous owners with more current and ongoing activities. Work completed under Asanko Gold ownership is described in the following sections.
9.1 Survey procedures and parameters
9.1.1 Geophysical survey
Geophysical surveys over AGM have included regional aeromagnetic imaging of the Ashanti Belt and adjacent Kumasi Basin by the Ghana Geological Survey, as well as IP ground geophysical surveying and airborne VTEM and magnetic survey centred over specific targets.
Airborne geophysical surveys were commissioned by Asanko Gold during 2015/2016 to advance the understanding of the geological and structural settings of the Asankrangwa Belt. The regional magnetic and VTEM data for the Ashanti Belt and adjacent Kumasi Basin provide a good indication of the distribution of the principal geological units occurring in the region as well as on the AGM properties.
A ground geophysics orientation study was initiated over the Esaase deposit in 2019 using Planetary Geophysics based in Australia. Planetary Geophysics has extensive experience working in West Africa for other gold mining companies such as Newmont Corporation, Gold Fields and AngloGold Ashanti. The orientation survey focused on four surveys that are known to produce useful results for the direct detection of orogenic gold deposits. The outcomes of this work will guide similar such surveys as an exploration technique applied to the Asanko Gold exploration projects in the future. Surveys completed over the Esaase deposit are as follows:
-
Gradient array IP
-
Pole-dipole resistivity
-
HaiTEM MLEM (electromagnetic)
-
Gravity.
9.1.2 Geological mapping
Field mapping has been undertaken at the target properties by qualified Asanko Gold geologists. Outcrop and visible features have been mapped and locations identified using handheld GPS.
|
Asanko Gold Inc. NI 43-101 Technical Report on Asanko Gold Mine, Ghana |
9.1.3 Sampling
Sampling programmes have been conducted at the target properties, including grab, rock and soil sampling, as well as sampling of the RC drill chips and DDH core. In addition, extensive grade control sampling in operational pits, generally on a 10 m x 10 m grid spacing, has been undertaken at Nkran, Esaase and Akwasiso which inform the Mineral Resource estimations for these deposits.
9.1.4 Trenching
Trenching is undertaken when deemed appropriate to get preliminary information as to the width and structural integrity of possible exploration targets. In general surface top soil profiles are too thick to use this method extensively.
Planned and approved programs are sited with a GPS by a geologist or technician, and after pegging, must be ground-truthed by a geologist. The trenches are surveyed by the mine surveyor after or during the course of geological mapping and sampling of the trench. The trenches are dug by using an excavator or manual labour. All dug trenches are barricaded with caution or flagging tapes.
The saprolite exposure and regolith profile in the trench are mapped and the thicknesses measured with reference to the profile line. Beginning or collar coordinates of each trench, rock type, lithological boundaries, structural measurements, visible mineralisation, sample intervals and assay are to be recorded digitally into a field tough book computer (DataShed™) or on the field data collection sample sheet and entered in DataShed™.
9.2 Sampling methods and sample quality
The sampling methodology and procedures used by Asanko Gold at the AGM properties are deemed best practise and are described below. All exploration drill core, geochemical and other exploration related samples are assayed by an external accredited laboratory (SGS Tarkwa or ALS Kumasi)). Internal operational pit sampling, channel sampling and samples derived from GC drilling are assayed in the Asanko Gold mine laboratory.
9.2.1 Drill core sampling
Sampling is undertaken after geological, structural and geotechnical logging. Sampling intervals are selected by the geologist, and for both HQ and NQ core conform to a minimum sample length of 30 cm and maximum of 200 cm. they should not cross lithological boundaries as defined by the logging and are defined within similar alteration zones and structural features. The following procedures are followed:
-
A coloured orientation line is marked along the length of the core to indicate where the core should be cut in two equal halves. The line is traced perpendicular to the stratification; where there is mineralisation the optimum distribution is used so that 50% of mineralisation is represented in each half of the core. The same side of the cut core is removed consistently throughout the drill hole (i.e. the right-hand side from the top to the bottom of the hole)
-
A sampling form is completed with the intervals indicated for the samples. Ticket forms are completed with the drill hole ID number and FROM-TO interval for the sample. The samples numbers must be in consecutive order and are derived from the sample ticket book. Only the sample numbers are written on the plastic sample bags
-
Metallic marker blocks are inserted at the start and end of each sample and the number of the corresponding sample is written with felt-tip pen on the core box to the side of the marker. Samples of approximately 2 to 3 kg are collected carefully and placed in plastic bags. The sample number is written on the plastic sample bag with a permanent marker pen. The sample ticket is stapled on the upper part of the bag, and the bag sample number is checked against ticket sample number. The bag is sealed with plastic ties.
|
Asanko Gold Inc. NI 43-101 Technical Report on Asanko Gold Mine, Ghana |
9.2.2 Density sampling
The samples used for density measurements must be representative of the deposit for which resource or reserve estimates are to be determined.
The logging geologist selects a 10 to 20 cm length of half core for the density measurement. One representative sample is taken in each 10 m interval of unmineralised core, or in each 5 m interval of mineralised core. The geologist marks with a permanent marker pen the interval of the half core which is to be sampled. A technician labels the density sample with a black permanent marker indicating the hole number and the "FROM" and "TO" measurements. Details of each sample are recorded on a density sample registration form.
The technician in charge of the density measurement takes a photograph of the sample outside the core box with the sample registration details. The photographs are downloaded to a computer. Photographs are named using the HOLE NUMBER_FROM_TO information, and download on the exploration database computer, with a backup in the server. A wooden block is placed in the core box where the sample was taken. The sample interval ("FROM" and "TO") is written on the wedge, together with the word 'Density'.
9.2.3 RC sampling
The grade control (GC) geologist receives and reviews the designed RC sampling plan from the Project Manager. Prior to commencing drilling, a series of sample bags for each hole are labelled with "FROM" and "TO" depths. For the original samples 40 cm x 50 cm bags are used, and for the reject samples 50 cm x 100 cm bags are used. Chip trays are labelled with Hole ID, sample number and From-To depths, as well as any quality control samples with FB (field blank) or FD (field duplicate).
The hole is drilled dry to maximise sample recovery and avoid losing fines, and a rig mounted rotary splitter is used wherever possible. In exploration drilling a triple-tiered riffle splitter is used whenever a rotary splitter is not available. In GC drilling a stationary cone splitter is used whenever a rotary splitter is not available. The auxiliary booster and compressor must be operational and utilised if water is encountered.
A triple-tiered riffle splitter is used to obtain homogenised and representative samples. The riffle splitter is frequently inspected and cleaned with compressed air or by hammering the side of the splitter between each sample, to avoid contamination and ensure representative samples.
Samples are taken at precise 1 m intervals for exploration drilling and 1.5 m intervals for GC drilling with no lag in the sampling. For every sample the complete sample interval is collected from the cyclone.
Samples of approximately 2-3 kg are collected in the pre-labelled (FROM_TO) plastic bags and sealed with plastic tags. Samples are collected from the drill site every shift and transported to the Obotan (Nkran) and Esaase camp.
In exploration drilling rejects are placed in plastic bags correctly labelled with FROM-TO depths and the samples bag securely closed. Reject bags are placed on the ground in organised piles. After each sample is placed in a sample bag, the technician takes a sub-sample of the field reject, sieves and washes the sample where fresh, and spoons the sample into the sequential trays. This provides a permanent record of the geology of each sample.
The cyclone is continuously monitored to avoid contamination from clogging and to ensure it is cleaned as required, and at a minimum after completing each hole. The drill rods, down-hole hammer bit and the sampling equipment are cleaned regularly using compressed air, at each rod addition and after each hole. Sample buckets/bags are removed when the hole is flushed by the driller at the change of rods.
The sampling method (riffle splitter, rotating cone splitter, rotating wet splitter, grab sample), estimation of recovery (%) and sample condition (dry, damp, wet) are recorded in a log.
|
Asanko Gold Inc. NI 43-101 Technical Report on Asanko Gold Mine, Ghana |
A sample weighing programme is undertaken on the RC rig, across each shift over a 24-hour period, to ensure that the optimal sample size is being taken, and to determine the recovery. All material reporting through the splitter is weighed for every interval drilled. The A and B samples are weighed to ensure a representative split, and the field reject is weighed to allow calculation of total sample recovery per interval drilled. The A and B samples must be consistently within 10% of the weight of each other. If this is not achieved it must be communicated to the driller, drilling manager and Project Manager so that the rotary/cone splitter can be calibrated.
As the samples are drilled, they are lined-up in order according to the FROM-TO intervals. The ordered samples are checked against the log sheet from the drill rig. The technician then writes the sample bag number on the plastic sample bag according to the number in the log sheet. Sample tickets are stapled to the plastic bags (bag sample number against ticket number is checked). QAQC samples are inserted as per the sampling protocols at every 20 m at the core yard.
Detailed logging is undertaken by the exploration or grade control RC geologist using the MaxGeo LogChief™ data collection system.
9.2.4 Soil geochemical sampling
Sampling points are generated using Micromine or ArcGIS and downloaded into a handheld GPS. The sampling points are pegged out in the field. Soil geochemical sampling is not conducted in formal settlements, roads, cemeteries and other culturally sensitive areas.
The sampling grid or sampling spacing may vary from one place to another and is determined by factors that control mineralisation and the level of information required. Sampling programs are typically undertaken on 400 m x 50 m spacing and the sampling lines azimuth is determined by the orientation of the structure suspected to be associated with mineralisation. In some cases, the sampling spacing is be reduced to 200 m x 25 m or 100 m x 25 m. The depth at which geochemical samples are collected is between 20-50 cm or more precisely on the B-horizon.
Sample sites are located with GPS receiver and entered into database/GIS platform. During sampling, organic material is avoided. The soil fraction is sampled and analysed (generally either bulk soil or a particular size fraction). The regolith landform setting is recorded and range in clast size is estimated. The proportion of transported and in situ lag (based on degree of clast rounding, size of clasts, composition of clasts) is estimated. Lag is swept up with plastic dustpan and brush over about a 5 m diameter area. A sample of approximately 2.5 kg is sufficient. Coarse pebbles and organic material (greater than 1 or 2 cm) are sieved and picked out on a plastic sheet. A sufficient number and type of duplicate/replicate samples are taken for QAQC and standard samples are submitted to check laboratory accuracy.
9.2.5 Trench sampling
Trench sampling is carried out by even chipping of the sample using a geological hammer or chisel along the sidewalls of the trench with a collecting cut PVC pipe. The sample is homogenized by rolling it once or twice in a canvas tarpaulin before collecting a split for assay; 2.5 kg of the homogenised sample is collected. The samples are placed in a clean labelled sample bag with the sample number and sample ticket number folded and stapled into a fold at the top of the bag. At the core yard the labelled samples are sorted and re-checked.
QAQC samples are inserted as per the QAQC protocol. The samples are then placed in a big white bag and labelled with the project name, sample interval for each big white bag and the number of samples in it. The sample sequence numbers must be written on the big sample bags. Once samples have been bagged, they are ready for dispatch and are not reopened until they reach the laboratory. The analytical request sheet (sample submission sheet) is completed, signed and dated by the project geologist prior to dispatch. The project geologist keeps copies of the analytical request form. An Asanko Gold item removal form is completed by the project geologist and approved by the head of department (HOD) and the security manager before samples are allowed to be sent out of site.
|
Asanko Gold Inc. NI 43-101 Technical Report on Asanko Gold Mine, Ghana |
Sampled intervals in the trench are photographed. The hole ID, sample interval and sample ID are written clearly on a white board and displayed within the sample interval before photographing. After data collection, all trenches are backfilled to allow vegetation regeneration.
9.2.6 Sample quality
The drilling sampling procedures adopted are consistent with current industry best practise. Samples collected by diamond coring within the highly weathered zones are of moderate quality, with the remainder being high. Sample recoveries and quality for the RC drilling are high with drilling switching to diamond core once wet samples are noticed.
The methodologies are considered appropriate and the samples collected from all mining and exploration activities are considered representative of the respective orebodies.
Mineralisation in all the target orebodies is related in part to quartz veining. Where encountered, the presence of these may inherently introduce a bias in the sampling.
9.3 Sample data
9.3.1 Geophysical surveys
The geophysical survey work is a standard routine method conducted by practicing professionals and thus the integrity of the source survey data would be of an acceptable standard. The greater, extensive regional area has been surveyed. All surveys grid location information is in WGS 84, Zone 30N Universal Transverse Mercator (UTM) coordinates.
9.3.2 Geological mapping
The geological data points used in the geological mapping exercises across AGM are stored in an extensive database. The exercises are considered qualitative studies of the nature of and geological genesis for the deposits as opposed to being quantitative in nature.
9.3.3 Sampling
Sampling has been and is currently conducted across the extent of the AGM tenements as described in Section 4 of this Technical Report. Asanko Gold employs the procedures as described in the above section. The sampling datasets taken over the years appear to be complete and well annotated, including nature of sample taken. All samples are considered qualitative in nature.
Since 2017, a total of 882 surface geochemical samples (grab, soil, stream sediment) have been taken across the greater AGM tenements, with the focus on greenfields targets that are not the subject of this Technical Report.
Figure 9-1 illustrates on a regional level the location of the sampling points.
|
Asanko Gold Inc. NI 43-101 Technical Report on Asanko Gold Mine, Ghana |
Figure 9-1 Surface geochemistry sampling locations (2017 to 2019)
|
|

Source: Asanko Gold, 2019
Since 2014, Asanko Gold has taken a total of 38,469 channel, pulp, DDH and RC samples across the Adubiaso, Akwasiso, Esaase and Nkran deposits, as shown in Table 9-1.
|
Asanko Gold Inc. NI 43-101 Technical Report on Asanko Gold Mine, Ghana |
Table 9-1 Drill hole sample summary by deposit since 2014
|
Prospect |
Channel |
DDH |
Pulp |
RC |
Total |
|
Nkran |
9 |
2,934 |
|
390 |
3,333 |
|
Esaase Main Zone North |
|
|
960 |
3,871 |
4,831 |
|
Esaase Main Zone South |
|
|
|
2,325 |
2,325 |
|
Akwasiso |
|
8,741 |
|
7,239 |
15,980 |
|
Adubiaso |
|
|
|
3,298 |
3,298 |
|
Total |
9 |
12,128 |
960 |
25,372 |
38,469 |
Note: DDH - Diamond drill hole; RC - Reverse circulation.
In addition to this, grade control sampling has occurred as summarised in Table 9-2.
Table 9-2 Grade control sample summary by deposit since 2014
|
Pit |
COMP_RC |
FC |
Grab |
RC |
RPL |
Total |
|
Akwasiso Pit |
|
|
|
21,851 |
127 |
21,978 |
|
Esaase Main Pit |
|
|
|
58,996 |
|
58,996 |
|
Nkran Ext Pit |
|
|
|
6,736 |
|
6,736 |
|
Nkran Pit |
37,974 |
23 |
19 |
75,748 |
|
113,764 |
|
Total |
37,974 |
23 |
19 |
163,331 |
127 |
201,474 |
Note: RPL - Ripline; FC - Face channel; RC - Reverse circulation
9.4 Results and interpretation of exploration information
9.4.1 Physical surveys
The interpreted simplified derivative geology from the collated geophysical surveys that have been conducted is shown in Figure 9-2. The surveys have also aided in identifying structures to guide further activities.
|
Asanko Gold Inc. NI 43-101 Technical Report on Asanko Gold Mine, Ghana |
Figure 9-2 Regional geological interpretation from VTEM survey
|
|
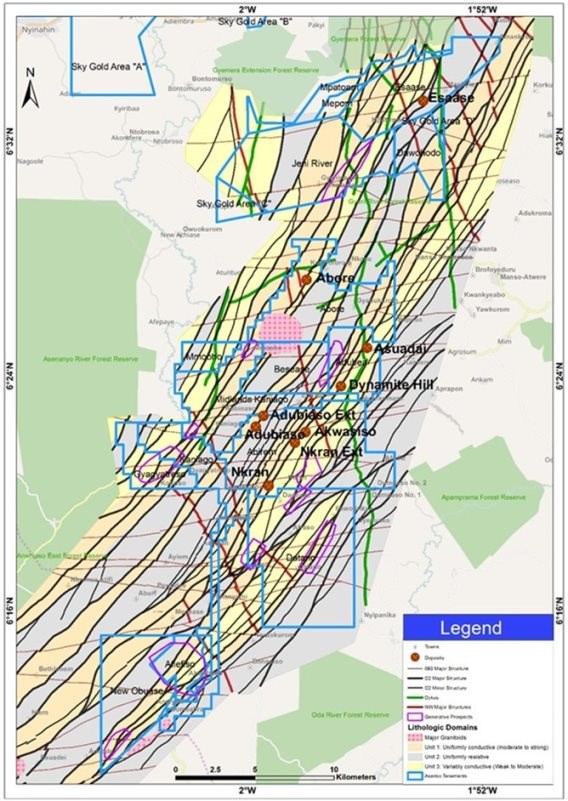
Source: Asanko Gold, 2019
|
Asanko Gold Inc. NI 43-101 Technical Report on Asanko Gold Mine, Ghana |
9.4.2 Geological mapping
Geological plans showing lithologies, structures and gold occurrences as presented in Section 7 of this Technical Report have been produced utilising information gathered from field mapping as well as geophysical surveys.
9.4.3 Sampling
The discovery of significant gold anomalies encountered on the tenements have led to the development of the current open pits and have outlined the NE-SW trending regional anomalies. The soil sampling exercises have assisted in identifying higher grade target areas. This is shown in Figure 9-3.
|
Asanko Gold Inc. NI 43-101 Technical Report on Asanko Gold Mine, Ghana |
Figure 9-3 Plan showing gold in soil anomalies
|
|
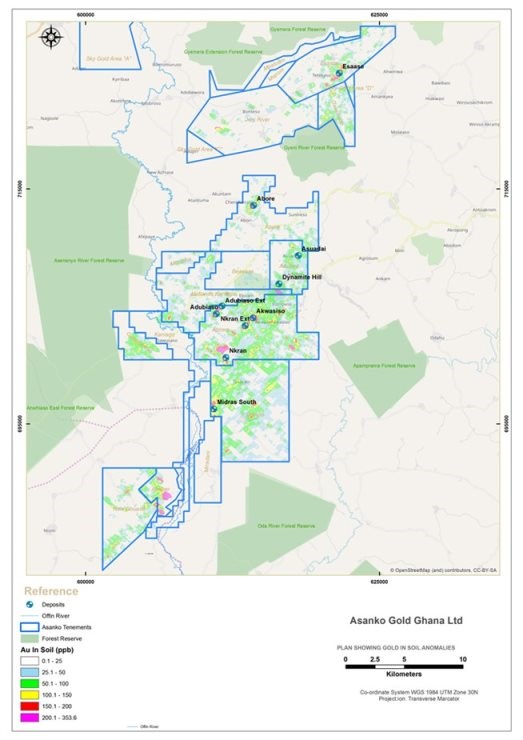
Source: Asanko Gold, 2019
Sampling and analysis of the drilled chips and/or core have informed the Mineral Resource estimates as described in this Technical Report.
|
Asanko Gold Inc. NI 43-101 Technical Report on Asanko Gold Mine, Ghana |
10 DRILLING
Asanko Gold have integrated historical databases with more recent and ongoing drilling programmes. Drilling completed under Asanko Gold ownership is described in the following sections. Unless specified otherwise, all diagrams in this section are sourced from Asanko Gold, 2019.
10.1 Type and extent of drilling
Historically, surface drilling at AGM included RC, DDH and RCD drilling. Drilling for Mineral Resource delineation focused on Nkran, Esaase, Akwasiso and Abore, although extensive drilling has also been undertaken at Asuadai and Adubiaso. The most extensive drilling was conducted over the Project Areas as well as adjacent tenements under the auspices of Resolute, PMI and Keegan. An overview of the historical drilling per deposit is provided in Section 6.2.
To date, a combined total of 6,150 evaluation aircore (AC), DD, RC and RCD drill holes totalling 521,122 m have been drilled at the AGM deposits that are the subject of this Technical Report, as well as additional grade control and other drill holes. Mineral Resource definition drilling at AGM mainly includes RC and DDH. A summary of the drilling completed at each deposit that is the subject of this Technical Report, on a yearly basis, is provided in Table 10-1. It is noted that the table only reflects AC, DDH, RC and RCD drilling. Additional drilling work has been completed but is not utilised in the Mineral Resource estimation.
Table 10-1 Drilling summary by deposit
|
Prospect |
Year |
No. of holes |
Metres drilled |
||||
|
AC |
DDH |
RC |
RCD |
Total |
|||
|
Abore |
2010 |
30 |
|
4,886.68 |
|
|
4,886.68 |
|
2011 |
24 |
|
4,550.30 |
|
|
4,550.30 |
|
|
Abore North |
2000 |
485 |
|
1,224.70 |
31,594.00 |
|
32,818.70 |
|
2010 |
2 |
|
408.00 |
|
|
408.00 |
|
|
2011 |
2 |
|
352.60 |
|
|
352.60 |
|
|
Adubiaso |
1996 |
49 |
|
|
5,958.17 |
|
5,958.17 |
|
1997 |
20 |
|
|
876.00 |
|
876.00 |
|
|
1998 |
11 |
|
|
1,745.20 |
|
1,745.20 |
|
|
1999 |
34 |
|
|
|
|
- |
|
|
2000 |
178 |
|
638.90 |
13,113.87 |
589.70 |
14,342.47 |
|
|
2009 |
3 |
|
488.28 |
|
|
488.28 |
|
|
2010 |
10 |
|
1,567.27 |
|
|
1,567.27 |
|
|
2011 |
37 |
|
7,635.60 |
|
|
7,635.60 |
|
|
2013 |
14 |
|
|
1,359.00 |
|
1,359.00 |
|
|
2016 |
35 |
|
|
3,460.00 |
|
3,460.00 |
|
|
Akwasiso |
1996 |
1 |
|
250.00 |
|
|
250.00 |
|
1997 |
18 |
|
1,278.30 |
1,098.00 |
|
2,376.30 |
|
|
1998 |
189 |
|
824.50 |
2,372.00 |
|
3,196.50 |
|
|
2000 |
102 |
|
2,736.03 |
6,019.00 |
|
8,755.03 |
|
|
2016 |
51 |
|
5,498.60 |
1,742.00 |
1,888.00 |
9,128.60 |
|
|
2017 |
91 |
|
|
4,514.00 |
4,731.30 |
9,245.30 |
|
|
Akwasiso South |
2018 |
65 |
|
|
4,946.00 |
225.10 |
5,171.10 |
|
Asuadai |
2000 |
384 |
|
329.00 |
5,551.00 |
|
5,880.00 |
|
2010 |
15 |
|
1,739.82 |
|
|
1,739.82 |
|
|
2011 |
45 |
|
6,063.87 |
|
|
6,063.87 |
|
|
2012 |
3 |
|
652.60 |
|
|
652.60 |
|
|
Esaase B Zone |
2007 |
24 |
|
300.53 |
3,023.00 |
|
3,323.53 |
|
2008 |
184 |
|
|
1,728.00 |
1,630.30 |
3,358.30 |
|
|
2011 |
73 |
|
608.00 |
7,265.00 |
3,659.60 |
11,532.60 |
|
|
Asanko Gold Inc. NI 43-101 Technical Report on Asanko Gold Mine, Ghana |
|
Esaase B1 Zone |
2007 |
8 |
|
1,009.80 |
265.00 |
|
1,274.80 |
|
2009 |
2 |
|
|
|
580.60 |
580.60 |
|
|
2010 |
1 |
|
|
|
156.30 |
156.30 |
|
|
Esaase C Zone |
2007 |
5 |
|
651.36 |
|
|
651.36 |
|
2010 |
6 |
|
|
897.00 |
|
897.00 |
|
|
2011 |
66 |
|
|
177.00 |
|
177.00 |
|
|
Esaase D Zone |
2007 |
1 |
|
232.26 |
|
|
232.26 |
|
2008 |
37 |
|
|
3,035.00 |
1,845.10 |
4,880.10 |
|
|
2010 |
2 |
|
|
150.00 |
311.90 |
461.90 |
|
|
2011 |
19 |
|
|
360.00 |
4,202.40 |
4,562.40 |
|
|
Esaase E Zone |
2008 |
9 |
|
|
251.00 |
|
251.00 |
|
2009 |
3 |
|
|
351.00 |
|
351.00 |
|
|
2011 |
12 |
|
|
1,303.00 |
802.00 |
2,105.00 |
|
|
Esaase Main Zone NE |
2007 |
2 |
|
506.58 |
|
|
506.58 |
|
2008 |
28 |
|
|
3,161.00 |
642.10 |
3,803.10 |
|
|
2009 |
1004 |
|
|
11,041.00 |
2,082.10 |
13,123.10 |
|
|
2010 |
61 |
|
|
7,787.00 |
177.00 |
7,964.00 |
|
|
2011 |
70 |
|
439.50 |
2,152.00 |
|
2,591.50 |
|
|
Esaase Main Zone North |
2006 |
14 |
|
4,084.46 |
|
|
4,084.46 |
|
2007 |
236 |
|
1,464.47 |
20,375.00 |
14,095.20 |
35,934.67 |
|
|
2008 |
202 |
|
833.00 |
23,955.00 |
13,624.60 |
38,412.60 |
|
|
2009 |
73 |
|
915.70 |
891.00 |
3,332.10 |
5,138.80 |
|
|
2010 |
92 |
|
5,096.40 |
1,494.00 |
18,570.60 |
25,161.00 |
|
|
2011 |
102 |
|
5,625.80 |
5,285.00 |
14,169.30 |
25,080.10 |
|
|
2013 |
6 |
|
1,322.60 |
|
|
1,322.60 |
|
|
2018 |
82 |
|
|
4,872.00 |
|
4,872.00 |
|
|
Esaase Main Zone South |
2007 |
68 |
|
381.61 |
9,831.00 |
1,270.20 |
11,482.81 |
|
2008 |
39 |
|
224.60 |
3,795.00 |
3,492.00 |
7,511.60 |
|
|
2010 |
36 |
|
1,063.60 |
764.00 |
5,936.60 |
7,764.20 |
|
|
2011 |
47 |
|
490.90 |
2,513.00 |
2,249.90 |
5,253.80 |
|
|
2013 |
1 |
|
100.00 |
|
|
100.00 |
|
|
2018 |
27 |
|
|
2,378.00 |
|
2,378.00 |
|
|
Nkran |
1995 |
57 |
|
4,305.85 |
985.00 |
1,285.71 |
6,576.56 |
|
1997 |
59 |
|
100.00 |
3,435.00 |
1,324.90 |
4,859.90 |
|
|
1998 |
28 |
|
|
190.00 |
|
190.00 |
|
|
1999 |
5 |
|
|
100.00 |
|
100.00 |
|
|
2000 |
671 |
|
32,376.88 |
20,500.45 |
3,000.99 |
55,878.32 |
|
|
2010 |
21 |
|
9,049.57 |
|
|
9,049.57 |
|
|
2011 |
79 |
|
34,646.53 |
|
494.00 |
35,140.53 |
|
|
2012 |
452 |
20,677.00 |
546.30 |
800.00 |
2,426.50 |
24,449.80 |
|
|
2017 |
12 |
|
1,699.60 |
|
2,600.30 |
4,299.90 |
|
|
Nkran Ext |
1997 |
49 |
|
|
|
|
- |
|
1998 |
60 |
|
|
370.00 |
|
370.00 |
|
|
2000 |
19 |
|
|
1,591.00 |
|
1,591.00 |
|
|
2013 |
10 |
|
|
1,002.00 |
|
1,002.00 |
|
|
2014 |
18 |
|
|
1,785.90 |
|
1,785.90 |
|
|
2016 |
38 |
|
|
3,032.00 |
|
3,032.00 |
|
|
2017 |
24 |
|
257.20 |
930.00 |
702.30 |
1,889.50 |
|
|
Nkran NE |
2015 |
4 |
|
|
368.00 |
|
368.00 |
|
2016 |
4 |
|
|
352.00 |
|
352.00 |
|
|
Total |
|
6,150 |
20,677.00 |
149,458.15 |
238,888.59 |
112,098.70 |
521,122.44 |
Note: AC - Aircore; DDH - Diamond drill hole; RC - Reverse circulation; RCD - Reverse circulation with diamond tail.
The following drilling is excluded from the above - Auger (AG), Rotary Air Blast (AB).
Esaase B, B1, C, D & E zones do not form part of the declared Esaase Mineral Resources.
Nkran has been drilled formally from the early 1990s prior to mine establishment and has since undergone numerous RC and DDH drilling and infill drilling programmes to define and refine the ore body model, as well as relogging of available core materials.
|
Asanko Gold Inc. NI 43-101 Technical Report on Asanko Gold Mine, Ghana |
Drilling at Esaase by Keegan from 2006 to 2012 focused mainly on the NW-striking, main gold bearing structures. An oxide RC infill drilling program was completed in May to June 2018 with the aim to target the two-year oxide pit and drill a staggered 40 m x 40 m infill pattern to increase the confidence in the mineralisation within the upper portion of the deposit. Overall, the drill holes averaged approximately 60 m in depth and were spread along the length of the proposed two-year oxide pit. In addition to this program, 21,000 m of historical diamond drill core was re-logged from a selection of 83 holes covering the full strike of the Esaase Main ore body. A further 6,950 m was re-logged from 38 diamond drill holes covering the Esaase South ore body.
Resolute originally tested the Akwasiso oxide material in 2001 by RC and DD drilling. After acquiring the Project Area, Asanko Gold completed further RC and DD drilling, including a second phase of RC and RCD drilling to upgrade Inferred Mineral Resources. Akwasiso was suspended as an operating pit in December 2018, and additional infill RC drilling was undertaken to define the continuation of mineralisation below the current pit. It is anticipated that operations at Akwasiso will resume in 2020.
The Abore and Asuadai project database comprises historical drill hole data from Resolute and PMI. These are utilised in the Mineral Resource and form part of LOM plan. Further drilling is anticipated to upgrade the Mineral Resources and prepare the sites for mining.
Asanko Gold continued testing the Adubiaso target during 2016 with a RC drilling program, successfully. Identifying over 500 m of strike of additional multiple thin mineralised zones, which have subsequently been infill drilled. During 2016 Asanko Gold conducted RC exploration and RC infill drilling on the NE extension of the Adubiaso pit mineralisation. These programs resulted in further Mineral Resources and open pittable reserves being estimated for what is known as Adubiaso Extension.
Currently mainly RC and DDH are utilised and employ standard industry practices. Many of the DDH was drilled as a tail to the initial RC. Shallow drill holes targeting oxidised material and shallow fresh material generally utilise RC drilling.
Drill traverses for all project areas are generally aligned perpendicular to the local NE-SW mineralised trends. The drill hole spacing varies between the projects, ranging from 10 m to 20 m across strike to 20 m to 50 m along strike (to define near mine surface projections of mineralisation).
GC drilling is conducted at the Nkran, Esaase, Akwasiso and Adubiaso pits. A summary of this work as completed by Asanko Gold since 2014 shown in Table 10-2. Further infill drilling is anticipated in the future at the operational pits.
Table 10-2 Grade control drilling summary by deposit since 2014
|
Pit |
No. of holes |
Reverse circulation (RC) metres drilled |
|
Adubiaso Pit |
323 |
11,877 |
|
Akwasiso Pit |
1,961 |
51,873 |
|
Esaase Main Pit |
3,728 |
84,369 |
|
Nkran Ext Pit |
473 |
10,896 |
|
Nkran Pit |
10,514 |
332,060 |
|
Total |
16,999 |
491,075 |
The drilling density is considered appropriate to define the geometry and extent of the mineralisation for the purpose of estimating Mineral Resources, given the understanding of the local project geology, structure and confining formations. Asanko Gold's strategy is to conduct drilling sufficient to assume geology and grade continuity to a level to support at least Indicated Mineral Resources and thus support the application of modifying factors in sufficient detail to support mine planning and evaluation of economic viability. Section 14.4 of this Technical report summarises the drill hole data used in the estimation of Mineral Resources.
|
Asanko Gold Inc. NI 43-101 Technical Report on Asanko Gold Mine, Ghana |
10.2 Factors influencing the accuracy of results
10.2.1 Drill hole location
The proposed drill hole coordinates are prepared by the geologist and approved by the project manager. The geologist provides the field technician with the proposed drill hole coordinates and corresponding location map; and the proposed coordinates are saved in the drill hole database.
The drill hole collar location is marked and surveyed using a handheld GPS to an accuracy of 1 m. If any deviations in the proposed drill hole location are encountered due to topography or other reasons, alternative locations should be determined by the field technician and communicated to the geologist for approval before pad construction begins.
Once the position of drill hole collar is defined, it is marked up using a stake labelled with the hole ID, azimuth and dip (the stake is either painted or marked with fluorescent tape). Once the planned hole has been marked up the drill platform is then constructed (usually by an excavator or bulldozer) based on the requirements of the drilling equipment to be utilized (i.e. DD or RC drill). With the platform constructed, the geologist and field technician return to re-mark the proposed collar location with a single stake where the hole is to be "collared". If the proposed drill hole is inclined, the geologist marks-up the orientation of the drill hole (azimuth) with two additional stakes referred to as a front-site and a back-site and finishes by marking the line (created by the three points) with flagging tape. If the proposed drill hole is vertical, the topographer leaves the single stake.
Once the drill has been installed and set-up based on the stakes and/or flagging tape line the geologist completes a pre-start geology check list ensuring that the drill is on the correct platform, the hole ID is established and the azimuth and inclination of the drill coincides with the information on the proposed drill hole list. Before the drill crew initiates its activities a senior geologist, drilling supervisor and/or a representative from the safety department completes a pre-start safety checklist.
Once the drill hole has been completed, the surveyor returns to pick up the "final coordinate" with a total station GPS. This information must be sent to the senior geologist and the data base administrator who save the file.
10.2.2 Down hole survey
Asanko Gold utilises single shot downhole surveying using the Reflex EZ Shot survey tool and is completed in all RC and DD holes. Hole ID and depth are manually entered into the EZ palm. The drill crew is responsible for completing the survey. The first survey or "shot" is collected within the first run (3 rods or 9 m) and subsequently at 30 m intervals. The last run to end of hole (EOH) must be surveyed. The down hole survey is monitored by the rig geologist while drilling so that any excessive deviation (0.2 degrees per metre) can be identified and resurveyed. The Reflex EZ Shot tool is a completely manual single shot tool and only gives a read out of the basic azimuth (AZ), dip (Incl), temperature (Temp) and magnetic susceptibility (Mag Field) data which is manually recorded and reported via a Reflex data (template) which is signed by the drilling supervisor.
Once the survey has been completed the driller communicates with the project geologist to report the results (Az, Incl, Mag Field and Temp data). The driller also notes the data in a prepared sheet which is submitted to the drill supervisor or project geologist at the end of each drill hole. The Project geologist is responsible for downloading the raw data from the EZ palm (via USB) on a weekly basis. Geodrill also reports the data later via the drill shift report which is signed by the administrator.
10.2.3 Core recovery
Core recoveries are typically calculated at the drilling site by qualified technicians and recorded in the geological logs. The core is transferred from the trays and pieced together on a V-rail (angle iron) rack and the recoveries calculated. Alternatively, core recoveries are recorded once the trays are delivered back to the core facility/yard and recorded in the geological logs. The recording of recoveries is the responsibility of the geologist. Core recoveries are typically in excess of 95%.
|
Asanko Gold Inc. NI 43-101 Technical Report on Asanko Gold Mine, Ghana |
10.2.4 Core handling
Core is carefully handled by the drill crew, correctly oriented with regard to the down hole direction and then carefully placed directly on to pre-marked core trays. Prior to loading with core, core boxes are labelled with the drill hole number, box sequence and depth recorded in permanent marker. The core is placed in the trays starting from the top left corner. The core is placed neatly in the trays. Core breaks are clearly identified by marking the core on both sides of all such breaks with an "X". To ensure that pieces of core are not lost, rotated end for end, or misplaced in the tray the operator reconstructs the core after it has been placed in the tray. Wooden block markers are inserted by the driller to record depth.
A Reflex ACT IID electronic core orientation tool and barrel is used for orienting and marking core. The barrel is oriented using the electronic orientation unit prior to the drill run. The full, oriented barrel is then retrieved, the core aligned and marked using a bottom hole convention. The down hole direction is marked on the core at the base. If two sections of broken core cannot be matched, then no structural mark-up is made for the lower (down hole) part of the core run until the next barrel is retrieved and oriented.
The core is marked with a red permanent marker in the bottom hole position and a directional arrow put on at regular intervals to record the down hole direction. The core is transported carefully back to the core yard. The core is laid out in aluminium boxes that can accommodate 5 m of core.
10.2.5 Drill core logging
After unloading the boxes in the logging room and placing them on the logging table, the geologist checks all the boxes to verify the correct box numbering and the correct place for the wood drilling blocks. The core in its split tube is placed on angle iron channels with the same length as the maximum drill core run length. Ideally several lengths of core are placed together in order to provide an overview of a number of drill core runs. Logging records include the prospect name, hole ID, person logging, date of logging, depth from/to:
-
Lithology
-
Lithological unit
-
Regolith domain
-
Stratigraphic domain.
-
-
Alteration
-
Alteration intensity
-
Alteration mineral
-
Sulphide intensity and type.
-
-
Structure
-
Structure type
-
Younging (if visible for beds)
-
Alpha (dip of structure)
-
Beta (strike of structure)
-
Structure style
-
Lode name (if known).
-
-
Structure zones
-
Veining
-
Veining density.
|
Asanko Gold Inc. NI 43-101 Technical Report on Asanko Gold Mine, Ghana |
All logging data is captured digitally and then transferred to Maxwell DataShedTM software. Once imported into DataShedTM all data is validated and undergoes QA/QC. Validated data is stored in a SQL database and is exported into appropriate file formats for resource estimation in Isatis™ and Datamine™ RM. Once logged, the core is boxed and stored.
The logging detail is considered appropriate for the nature of the open pit mineralisation and suitable for Mineral Resource estimation and related studies.
10.2.6 Core photography
Prior to cutting, all core is routinely photographed by the geologists. The photographs must be of a high quality so that the textures and fabric of the rock and the fracture patterns are clearly visible. The core may be photographed both dry and wet. The colour and texture of the rock are best seen when the core is wet but the fracture patterns which are important to the geotechnical study are best viewed when the core is dry. The core is washed with water using a hard-bristle brush.
Core boxes are placed in correct order on the table where photos are taken. The interval and box number of each core box is written on the top left corner of the box with a permanent marker. Core photographs are taken after the core has been oriented and returned to the core tray with the reference line facing the bottom edge of the tray so that any structures or fabric in the rock are consistently aligned. The metre marks and core blocks must be clearly visible. The project location, drill hole ID, tray number, depths start/end of tray and indication whether the core was dry or wet is written on white board and placed at the top of the box. Photographs are taken ensuring that core box including the white board with the box information are centred and in focus. Photos are downloaded after each day and named in an acceptable format for storage on the server for a digital photographic record for the drill core.
10.2.7 Core cutting
Once logged, the core is carefully marked for sampling. Core boxes are arranged in an organized manner by placing one next to the other horizontally on an appropriate stand. The core is carefully removed and placed in the core holder such that it fits and can be taken out with ease. Pieces of core are loaded in order (preferably in from-to order) with the orientation line facing up and dividing the bowl equally. Loaded blocks are placed in core feed area in sequential order and the sequence of core blocks is maintained. The core is cut completely in two halves using an electric diamond blade saw. The core holder containing cut core is removed from the machine and core is replaced in original position in core tray.
The standard protocol is that the cut is made 1 cm to the right in a down hole direction of the orientation line, with the left side being retained and the other half broken up for assay. In the upper Oxide zone, where the core is too friable for diamond saw cutting, the core is dry cut or cleaved.
10.2.8 Geotechnical logging
The geologist records the data of the drilling blocks in the geotechnical logging form; the geologist verifies that the blocks are marked in the box trays and checks the run length data. The geotechnical characteristics of the rock mass are described based on international standard practices and is structured to provide all necessary data for rock mass classification schemes. Logging records include:
-
Depth from/to
-
Core diameter
-
Recovery
-
Rock quality designation
-
Lithology
-
Alteration
-
Defects
-
Origin
|
Asanko Gold Inc. NI 43-101 Technical Report on Asanko Gold Mine, Ghana |
-
Alpha, beta
-
Planarity, roughness
-
Infill type and thickness
-
Hardness
-
Broken zone
-
Orientation.
Four geotechnical rock tests may be undertaken, including point load testing and tilt testing (conducted on-site), and uniaxial compressive strength (UCS) testing and direct shear testing (conducted at off-site laboratory).
10.2.9 Core storage
After samples are dispatched to the laboratory, drill core boxes are stored in order. Aluminium tags are attached to the front of the box with the drill hole ID, box number and from and to depths. Core boxes are sent for final storage.
A new core shed facility is located at Nkran. This facility has spacious core logging facilities, a dedicated XRF/spectrometer office, a dedicated core saw/splitter facility, covered core storage on pallets and pallet racking with a forklift, and containerised storage for pulps. With the exception of Esaase, all core from the other deposits is transported to the Nkran core shed for logging and storage.
The storage facility at Esaase consists of sheds with elevated racks on concrete floors that are sheltered from wind and rain. The core is stored following geological logging, photography, core cutting and sampling.
10.3 Exploration properties - drill hole details
The Nkran, Esaase and Akwasiso operations are mature operating mines with extensive drilling data within the Mine Lease area and thus this section is regarded as being not applicable to these deposits. The location, azimuth and dip of drill holes completed by Asanko Gold at the true exploration properties (Abore, Asuadai and Adubiaso) are available for review, if needed.
Due to the variable orientations of mineralisation in each deposit, a range of drilling orientations are used. All deposits are generally drilled perpendicular to mineralisation.
The 1 m core sampling intervals are significantly smaller than the true width of overall mineralised zones, which are variable throughout the deposits, but are often in excess of 30 m.
Plans showing the location of drill collars and drilling type per AGM Project Area are provided in Figure 10-1 to Figure 10-6. Significant drill hole intersections per deposit are illustrated in Section 7.3.
|
Asanko Gold Inc. NI 43-101 Technical Report on Asanko Gold Mine, Ghana |
Figure 10-1 Plan showing distribution of drill hole collars at Nkran pit
|
|
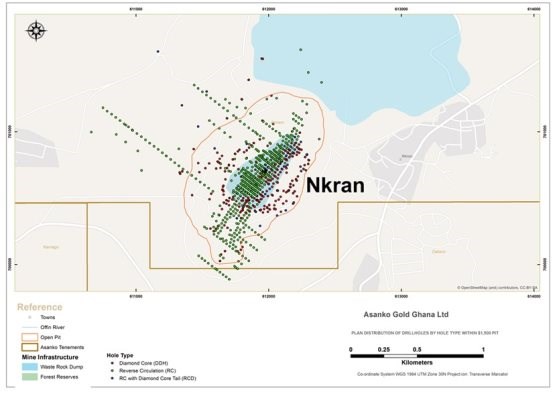
Figure 10-2 Plan showing distribution of drill hole collars at Esaase
|
|
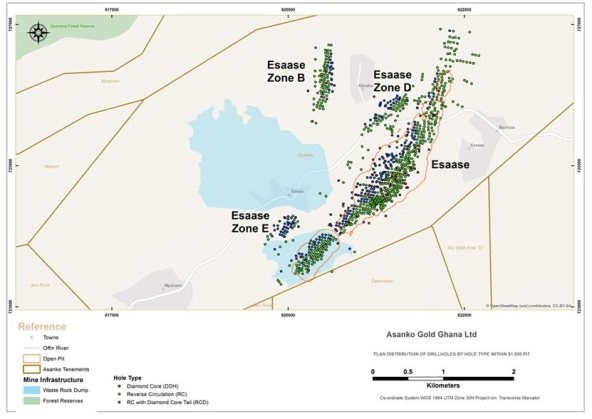
|
Asanko Gold Inc. NI 43-101 Technical Report on Asanko Gold Mine, Ghana |
Figure 10-3 Plan showing distribution of drill hole collars at Akwasiso and Nkran Extension
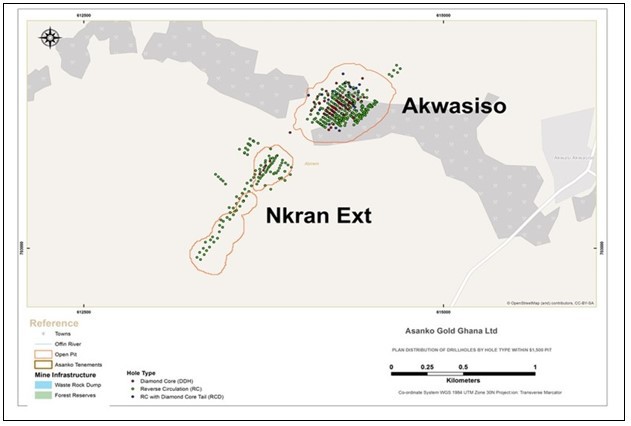
Figure 10-4 Plan showing distribution of drill hole collars at Abore

|
Asanko Gold Inc. NI 43-101 Technical Report on Asanko Gold Mine, Ghana |
Figure 10-5 Plan showing distribution of drill hole collars at Asuadai
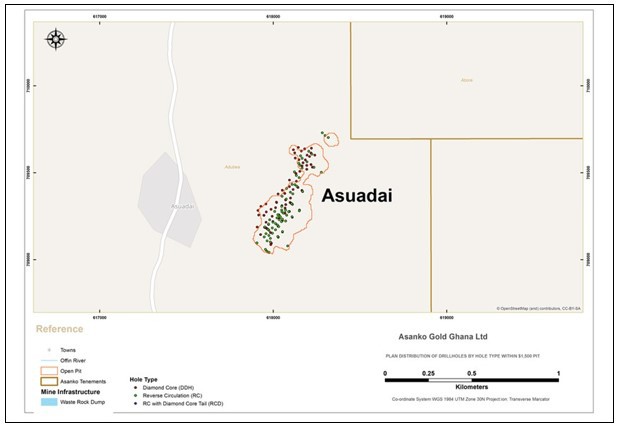
|
Asanko Gold Inc. NI 43-101 Technical Report on Asanko Gold Mine, Ghana |
Figure 10-6 Plan showing distribution of drill hole collars at Adubiaso and Adubiaso Extension
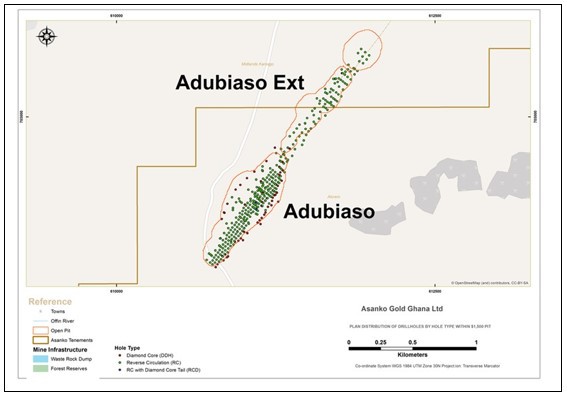
 |
Asanko Gold Inc. NI 43-101 Technical Report on Asanko Gold Mine, Ghana |
11 SAMPLE PREPARATION, ANALYSES, AND SECURITY
Historical (PMI at Nkran and Keegan at Esaase) as well as current Asanko Gold sampling methods are discussed in the following sections. Historical descriptions are from the DFS (2017) document. Unless specified otherwise, all diagrams in this section are sourced from Asanko Gold, 2019.
11.1 Sample preparation methods & quality control (QC) measures
At Nkran all sampling was carried out under the direct supervision of senior geological personnel. All drill core was geologically and structurally logged, split (sawn), photographed and stored at AGM's field offices, or the sampling and storage facility in Nkran.
Samples with visible gold were routinely submitted for either screen fire assay or a bulk cyanide leach assay. Crushing and grinding were completed at the analytical laboratory. The quality of analysis at the laboratories was monitored using blanks, standards, duplicates and check assays.
Esaase RC chips, half-core and core photographs, duplicate pulps and residues of all submitted samples were retained and stored at the Asanko Gold exploration camp at Tetrem. Keegan used HQ3 drilling to maximise sample recovery in weathered zones. RC drilling switched to diamond core drilling once wet samples were noted.
11.1.1 Current methodology
Asanko Gold Diamond Drill core samples are determined by the logging geologist and should be between 30 cm and 150 cm in length. Samples must not cross lithological boundaries and must be defined within similar alteration zones and structural features. Samples should weigh between 2 and 3 kg. QC samples are inserted by the logging geologist at the core shed. Quarter core duplicates are taken to measure precision.
Asanko Gold RC samples of approximately 2 to 3 kg are collected from the cyclone at 1 m intervals and split in a riffle splitter. If the resultant sample is greater than 3 kg, then the entire sample is re-split. The cyclone is continuously monitored to avoid contamination from clogging and at a minimum cleaned after every hole. The drill rods, down-hole hammer bit and the sampling equipment are cleaned regularly using compressed air. To determine recovery and ensure that the optimal sample size was taken, recovery is monitored by weighing samples at the RC rig.
The geologist ensures that the quality control samples are inserted at the core yard and monitors the dispatch of the samples to the laboratory. A 2 to 3 kg duplicate sample is taken in an identical manner as the original and stored in a pre-labelled sample bag.
To avoid contamination, no metal jewellery is permitted to be worn by the Asanko Gold samplers. All sample preparation, apart from discussed above, is undertaken by the preparation and analytical laboratories.
11.2 Sample splitting
Diamond core cutting procedures vary slightly between the earlier work and the current Asanko Gold sampling. In both cases an orientation line was drawn on the core and an electric diamond core saw used to cut the core, retaining the left-hand side for reference (when looking down hole). Historical samples were cut 1 cm to the right of the line and Asanko Gold samples are cut along the line. Asanko Gold procedures state that the line should be traced perpendicular to the stratification, or where there is mineralisation one should try to get the optimum distribution so that 50% of mineralisation is represented in each half of the core.
Where core was too friable to cut with a diamond saw, the core was dry cut or cleaved.
|
Asanko Gold Inc. NI 43-101 Technical Report on Asanko Gold Mine, Ghana |
Nkran GC and exploration RC samples were taken from the drilling rig using a rotary splitter which produced equal aliquots to mitigate any bias. A 3 kg sample was collected for laboratory submission and coarse rejects of all samples were kept as a backup for at least three months (GC) and six months (exploration).
Esaase and other RC samples are split using a three-tier riffle splitter (1 in 8 split) to obtain a sub-sample of 3 kg or less and collected in pre-labelled plastic bags. Rejects are stored in plastic bags.
11.3 Security measures
At Nkran, individually bagged core and RC drilling samples were packed in polyweave, or heavy plastic sacks, tied with binding wire and prepared for transport to the laboratory. The geologist was responsible for sample security and prior to dispatch, the samples were firmly secured and locked in a designated sample room at PMI's field office.
Esaase sampling procedures required samples to be collected in staple-closed bags once taken from the rig or core-cutting facility. The samples were then transported to the project camp to be picked up by the laboratory truck and taken directly to the laboratory.
The Asanko Gold procedure for sample submission is as follows:
-
RC samples are collected from the drill site every shift and transported to the Obotan and Esaase camp
-
Samples are packed in 50 kg bags and stored in the logging shed until shipped to the laboratory
-
The QA/QC geologist supervises loading of samples on to the truck
-
A sample dispatch form accompanies the samples, and another signed by the exploration manager is provided to the security guards to authorise the shipment to leave the camp
-
At the laboratory, the laboratory representative signs the sample dispatch form confirming receipt and change of custody for the samples.
11.4 Bulk density measurements
11.4.1 Methodology
Esaase bulk density measurements were collected over a range of lithological and weathered profiles. The Archimedes principal was used and is summarised as follows:
-
10 cm billet of clean, dry core (core dried in oven for 4 hours at 60°C) was weighed
-
Core was immersed in paraffin wax and then reweighed (to determine wax weight)
-
Billet was suspended and weighed in water
-
Bulk density (BD) calculated as: BD = [Mass core] /[(Mass air -Mass water) - (Mass wax /0.9)].
Asanko Gold samples are sent for laboratory bulk density analysis using the Archimedes method, methodology as follows:
-
10 to 20 cm length of half core from each 10 m interval of unmineralised core, or 5 m interval of mineralised core (dried in an oven at 105oC) was weighed (W1)
-
Samples were coated with paraffin wax and reweighed (W2)
-
The volume of the sample was measured (V1)
-
Density was calculated from the following equation:
Density= W1 /(V1- ((W2-W1)/DP) where DP = wax density (0.8 g/cm3).
|
Asanko Gold Inc. NI 43-101 Technical Report on Asanko Gold Mine, Ghana |
11.4.2 Density quality assurance/quality control (QA/QC)
Duplicate measurements were taken by the laboratory for every tenth sample. Selected samples (1 in 30), located adjacent to the primary samples, were sent to a second laboratory for check density measurements.
11.5 Sample preparation and analysis
Samples were prepared and analysed at commercial external laboratories until the establishment of the Asanko Gold Mine Laboratory in 2017. Thereafter the AGM laboratory has been used as the primary preparation and analytical laboratory for production sampling. Exploration samples are sent to an external accredited laboratory (Intertek Tarkwa or ALS Kumasi). The tables below have been adapted from the DFS (2017) document and summarise the preparation (Table 11-1) and analytical techniques (Table 11-2) used.
Table 11-1 Summary of sample preparation techniques
|
Laboratory |
Locality |
Period |
Preparation |
|
SGS |
Accra |
1995 |
Jaw crush to -6 mm, then cone crushed or disk milled to -2 mm. Pulverisation of 300 g to 1 kg split -200 mesh in labtechnic homogenizing mill |
|
Inchcape |
Obuasi |
1995-1997 |
Dry, crush, pulp 2 kg. SFA dry at 105 °C, ringmill 500 g to 1.5 kg 75 µms |
|
Analabs |
Nkran Site |
1997-1998 |
Drying, jaw crushing to nominal 6 mm to 12 mm. Sample volume reduction - riffle split. Ringmill <1 kg, nominal 75 microns |
|
SGS |
Bibiani |
2009 - 2012 |
|
|
SGS |
Tarkwa |
2010-2012 |
3 kg or less of sample is dried, disaggregated, and jaw crushed to 3 mm. Sample is pulverised to 95% passing 75 µm using an LM2 pulveriser. Two pulp samples are taken for analysis and pulp storage |
|
Min Analytical |
Perth |
2011-2014 |
|
|
ALS Kumasi |
Kumasi |
2006-present |
3 kg, or less of sample is dried, disaggregated, and jaw crushed with 70% passing 2 mm. Sample is pulverised to 85% passing 75 µm using an LM2 pulveriser. Two pulp samples are taken for analysis and pulp storage |
|
Trans World (TWL) |
Tarkwa |
2009-2010 |
3 kg or less of sample is dried, disaggregated, and jaw crushed to 3 mm. Sample is pulverised to a nominal 95% passing 75 µm using an LM2 pulveriser. Two pulp samples are taken for analysis and pulp storage |
|
Intertek |
Tarkwa |
2010-present |
Samples are crushed to 2 mm and pulverised to 75 µm |
|
Performance Labs |
Bibiani |
2010-2012 |
|
|
Asanko Gold |
Nkran site |
2017-present |
Samples are crushed to 2 mm and pulverised to 90% passing 75 µm in LM2 pulverisers. 250 g pulp sample taken for analysis |
|
Asanko Gold Inc. NI 43-101 Technical Report on Asanko Gold Mine, Ghana |
Table 11-2 Summary of analytical laboratories and assay techniques
|
Laboratory |
Locality |
Period |
Accreditation |
Au assay method |
Lower detection limit |
|
SGS |
Accra |
1995 |
ISO/IEC 17025 |
Fire assay |
0.01 g/t |
|
Inchcape |
Obuasi |
1995-1997 |
ISO/IEC 17025 |
Fire assay, screen fire assay |
0.01 g/t |
|
Analabs |
Nkran Site |
1997-1998 |
ISO/IEC 17025 |
Fire assay |
0.01 g/t |
|
SGS |
Bibiani |
2009 - 2012 |
ISO/IEC 17025 |
Fire assay |
0.01 g/t |
|
SGS |
Tarkwa |
2010-2011 |
ISO/IEC 17025 |
Fire assay, screen fire assay |
0.01 g/t |
|
Min Analytical |
Perth |
2011-2014 |
ISO/IEC 17025 |
Fire assay |
0.005 g/t |
|
ALS Kumasi |
Kumasi |
2006-present |
ISO 9001:2000 |
Fire assay, Leachwell bottle roll, screen fire assay |
0.01 g/t |
|
Trans World (TWL) |
Tarkwa |
2009-2010 |
ISO/IEC 17025 |
Fire assay |
0.01 g/t |
|
Intertek |
Tarkwa |
2010-present |
ISO/IEC 17025 |
Fire assay, Leachwell bottle roll |
0.01 g/t |
|
Performance Labs |
Bibiani |
2010-2012 |
ISO/IEC 17025 |
Fire assay, BLEG |
0.01 g/t |
|
Asanko Gold |
Nkran site |
2017-present |
Nil |
Leachwell bottle roll & fire assay |
0.01 g/t |
11.6 Check umpire assay analysis
External check assays (umpires) are used to monitor between laboratory bias:
-
Esaase samples analysed at TWL, were sent to SGS Tarkwa and Genalysis Perth for external check analysis. In both cases, the TWL results had a mean positive bias compared to the checks (i.e. over-reported)
-
Esaase samples originally analysed at SGS Tarkwa and ALS Kumasi were sent to Genalysis Perth for external check analysis and results had no significant bias
-
Exploration samples analysed at the Asanko Gold mine laboratory since 2016 were sent to ALS Kumasi for umpire analysis. The procedure requires monthly dispatches of a range of samples which include ore and waste material.
11.7 Laboratory certification
Analytical laboratories used (Intertek/SGS Tarkwa, ALS Kumasi) are independent of the issuer and are accredited (Table 11-1).
The Asanko Gold mine laboratory is owned and operated by Asanko Gold and whilst currently not accredited, this process has commenced under the supervision of Deloitte Touche Tohmatsu Limited (Deloitte) with the goal of achieving accreditation by 2021.
11.7.1 Umpire/lab check laboratory
Umpire analytical laboratories are independent of the issuer and are accredited.
|
Asanko Gold Inc. NI 43-101 Technical Report on Asanko Gold Mine, Ghana |
11.8 Results of quality assurance/quality control (QA/QC)
11.8.1 Results - standards, blanks and duplicates
Nkran
QC samples were reviewed for the Nkran exploration and GC drilling. The GC samples for 2017 onwards were reviewed by CSA Global:
-
Assay methods were predominantly fire assay with an AAS finish for the pre-2017 samples and bottle roll for samples assayed in 2017 onwards
-
Some minor misallocation of CRMs in database - identified and to be corrected in database.
Cross contamination
-
Historical samples had blank failures likley due to mixing of samples - insignificant impact.
-
No indications of cross contamination in samples from 2017 onwards (Figure 11-1).
Figure 11-1 Nkran blanks (2017 - 2018)
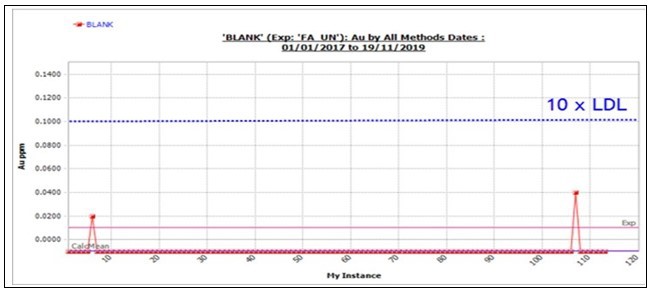
Source: CSA Global, 2019
Assay accuracy (bias)
-
Bottle roll assay results appear to align better with aqua regia expected values than fire assay expected values (tend to under-report compared to fire-assay expected values).
-
A CRM with an expected gold value close to the cut-off grade is recommended to monitor accuracy.
-
Failures in CRMs. Some instances of CRM bias, but no consistent over or under reporting (i.e. bias is non-systematic).
Assay precision
-
The number of duplicates included in the database is low and there are no duplicates for the historical samples.
-
Field duplicates from both the 2017 GC and exploration datasets have poor precision which is primarily due to the relatively high nugget effect of the deposit. The overall grade distribution from multiple datasets is consistent and repeatable.
|
Asanko Gold Inc. NI 43-101 Technical Report on Asanko Gold Mine, Ghana |
- Pulp duplicates from the Asanko Gold lab show marginal to poor precision, there is no bias and the issue is considered minor due to the GC sample density available. CSA Global suggest that there could be homogenisation or pulverisation issues at this laboratory, and recommend further investigation.
The mean bias of Nkran grade control field duplicates and Nkran exploration field duplicates is shown in Figure 11-2 and Figure 11-3 respectively.
Figure 11-2 Nkran grade control field duplicates showing mean bias to duplicates*
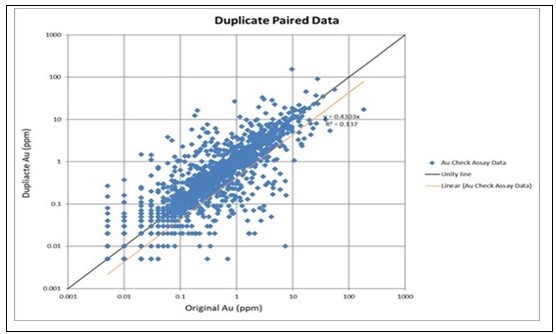
Note: * Showing mean bias of 8% to duplicates and CVAVE of 54% (n = 1,187).
Source: CSA Global, 2019
Figure 11-3 Nkran exploration field duplicates with mean bias of 32% to originals*

Note: * Showing mean bias of 32% to originals and CVAVE of 47% (n = 21).
Source: CSA Global, 2019
|
Asanko Gold Inc. NI 43-101 Technical Report on Asanko Gold Mine, Ghana |
CSA Global comment
Historical data had indications of cross contamination as well as multiple CRM failures, and no precision controls. Samples from 2017 onwards had no significant cross contamination or systematic assay bias (multiple failures present). Field duplicates and Asanko Gold laboratory duplicates had poor precision.
Esaase
QA/QC data were extracted from the structured query language (SQL) databases for review. Asanko Gold exploration RC and mining RC data were reviewed separately by CSA Global, and results are summarised below. Exploration samples were analysed at Intertek Tarkwa by fire assay and GC samples at the AGM laboratory by bottle roll. CSA Global notes that there is some minor incorrect labeling of CRMs in database; this will be corrected in the database (Figure 11-4).
Figure 11-4 Esaase grade control CRM G912-2 showing apparent misidentified CRMs
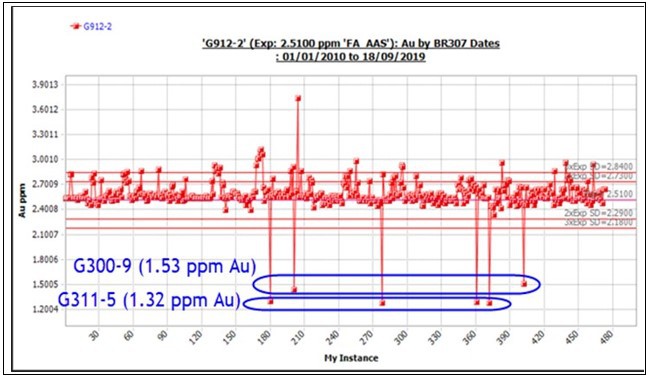
Note: CRM - certified reference material
Source: CSA Global, 2019
Cross contamination
- No significant concerns.
Assay accuracy (bias)
-
No significant or systematic bias noted in exploration samples (Table 11-3)
-
Asanko Gold lab method (BR307) usually under reports by up to 4% which is not unexpected as this method only reports cyanide soluble gold (Table 11-4)
-
Overall, taking the methods into account, there are no significant concerns with the assay accuracy for the range up to ~3 ppm Au. Over 3 ppm Au there are no controls on assay accuracy.
|
Asanko Gold Inc. NI 43-101 Technical Report on Asanko Gold Mine, Ghana |
Table 11-3 Esaase exploration CRM results (method FA50_AAS)*
|
Au standard(s) |
No. of samples |
Calculated values |
|||||||
|
Standard code |
Method |
Exp method |
Exp value |
Mean Au |
SD |
CV |
Mean bias |
||
|
G300-9 |
FA50_AAS |
FA_UN |
1.53 |
20 |
1.49 |
0.076 |
0.051 |
-3% |
|
|
G311-5 |
FA50_AAS |
FA_UN |
1.32 |
92 |
1.358 |
0.05 |
0.037 |
3% |
|
|
G901-3 |
FA50_AAS |
FA_UN |
2.87 |
3 |
2.863 |
0.202 |
0.071 |
0% |
|
|
G910-1 |
FA50_AAS |
FA_AAS |
1.43 |
61 |
1.433 |
0.079 |
0.055 |
0% |
|
|
G912-2 |
FA50_AAS |
FA_UN |
2.51 |
10 |
2.475 |
0.069 |
0.028 |
-1% |
|
|
G914-6 |
FA50_AAS |
FA_AAS |
3.21 |
89 |
3.191 |
0.121 |
0.038 |
-1% |
|
Note: * No systematic bias noted; SD - Standard deviation; CV - Coefficient of variation; CRM - certified reference material
Source: CSA Global, 2019
Table 11-4 Esaase grade control CRM results (method BR307) showing systematic under-reporting
|
Au standard(s) |
No. of samples |
Calculated values |
||||||
|
Standard code |
Method |
Exp method |
Exp value |
Mean Au |
SD |
CV |
Mean bias |
|
|
G300-9 |
BR307 |
FA_UN |
1.53 |
6 |
1.565 |
0.0122 |
0.0078 |
2% |
|
G311-5 |
BR307 |
FA_UN |
1.32 |
5 |
1.266 |
0.0134 |
0.0106 |
-4% |
|
G901-3 |
BR307 |
FA_AAS |
2.87 |
200 |
2.8067 |
0.1548 |
0.0552 |
-2% |
|
G901-5 |
BR307 |
FA_UN |
1.65 |
1 |
1.6 |
0 |
0 |
-3% |
|
G916-10 |
BR307 |
FA_UN |
2.81 |
270 |
2.8053 |
0.1542 |
0.055 |
0% |
Note: SD - Standard deviation; CV - Coefficient of variation; CRM - certified reference material
Source: CSA Global, 2019
Assay precision
-
RC field duplicate pairs have poor repeatability due to local nugget effect. There is no significant bias.
-
DD field duplicates have acceptable precision, but significant mean bias, usually influenced by high grade outlier pairs, indicating the nuggety nature of the deposit.
CSA Global comment
Due to local sample nugget effect GC assay precision is poor, but no significant bias is apparent. Overall, taking the different analytical methods into account, there are no material concerns regarding assay accuracy up to approximately 3 ppm Au, but there is a lack of higher value CRMs. No concerns regarding potential cross contamination were noted.
Akwasiso
QA/QC data were extracted from the SQL databases for review by CSA Global. Asanko Gold exploration DD, exploration RC and mining RC data were reviewed separately, and results are summarised below. Conclusions for contamination and accuracy apply to all three datasets whilst precision conclusions are dependent on the drill type and laboratory. There is minor mislabeling of CRMs in database - this will be corrected in the database.
Cross contamination
- No significant concerns.
Assay accuracy (bias)
- CRMs used are low grade with the highest value of 3.21 ppm Au, therefore no control on higher grade assay accuracy
|
Asanko Gold Inc. NI 43-101 Technical Report on Asanko Gold Mine, Ghana |
-
Asanko Gold lab method (BR307) usually under reports by up to 12% when compared against CRM expected values for fire assay (Table 11-5)
-
Overall there are no significant concerns with the assay accuracy for the range up to approximately 3 ppm Au. Over 3 ppm Au, there are no controls on assay accuracy (Table 11-6).
Table 11-5 Akwasiso Exploration CRM results (method BR307) showing systematic under-reporting
|
Au standard(s) |
No. of samples |
Calculated values |
||||||
|
Standard code |
Method |
Exp method |
Exp value |
Mean Au |
SD |
CV |
Mean bias |
|
|
G300-8 |
BR307 |
FA_UN |
1.07 |
78 |
0.94 |
0.03 |
0.04 |
-12% |
|
G300-9 |
BR307 |
FA_UN |
1.53 |
61 |
1.51 |
0.05 |
0.04 |
-1% |
|
G311-5 |
BR307 |
FA_UN |
1.32 |
86 |
1.29 |
0.02 |
0.01 |
-2% |
|
G313-1 |
BR307 |
AR_UN |
1.01 |
32 |
0.99 |
0.01 |
0.01 |
-2% |
|
G901-1 |
BR307 |
Au-AA26 |
2.58 |
2 |
2.70 |
0.30 |
0.11 |
4% |
|
G901-3 |
BR307 |
FA_UN |
2.87 |
39 |
2.82 |
0.12 |
0.04 |
-2% |
|
G910-1 |
BR307 |
FA_AAS |
1.43 |
13 |
1.35 |
0.09 |
0.07 |
-6% |
|
G912-2 |
BR307 |
FA_UN |
2.51 |
70 |
2.52 |
0.14 |
0.06 |
0% |
|
G914-6 |
BR307 |
FA_AAS |
3.21 |
45 |
3.11 |
0.14 |
0.04 |
-3% |
Note: SD - Standard deviation; CV -Coefficient of variation
Source: CSA Global, 2019
Table 11-6 Akwasiso GC CRM results (method BR307) showing systematic under-reporting
|
Au standard(s) |
No. of samples |
Calculated values |
||||||
|
Standard code |
Method |
Exp method |
Exp value |
Mean Au |
SD |
CV |
Mean bias |
|
|
G300-8 |
BR307 |
FA_UN |
1.07 |
127 |
0.96 |
0.04 |
0.04 |
-10% |
|
G300-9 |
BR307 |
FA_UN |
1.53 |
13 |
1.53 |
0.08 |
0.05 |
0% |
|
G311-5 |
BR307 |
FA_UN |
1.32 |
453 |
1.29 |
0.03 |
0.02 |
-3% |
|
G313-1 |
BR307 |
FA_AAS |
1.00 |
375 |
0.99 |
0.04 |
0.04 |
-1% |
|
G901-3 |
BR307 |
FA_AAS |
2.87 |
352 |
2.78 |
0.15 |
0.05 |
-3% |
|
G901-5 |
BR307 |
FA_UN |
1.65 |
441 |
1.59 |
0.05 |
0.03 |
-4% |
|
G912-2** |
BR307 |
FA_AAS |
2.51 |
92 |
2.60 |
0.13 |
0.05 |
4% |
Note: ** G912-2 over-reports, but appears to include misidentified G901-3 CRM samples
SD - Standard deviation; CV -Coefficient of variation
Source: CSA Global, 2019
Assay precision
-
ALS results (DD) have acceptable precision for a nuggety ore body, with no significant bias noted
-
RC results from the Asanko Gold mine lab have poor repeatability with significant bias to the original results (Figure 11-5). This was highlighted in the 2017 QA/QC review where it was recommended that the bias to the original results in the RC duplicates should be investigated.
|
Asanko Gold Inc. NI 43-101 Technical Report on Asanko Gold Mine, Ghana |
Figure 11-5 Akwasiso GC RC field duplicate scatter and QQ plots*
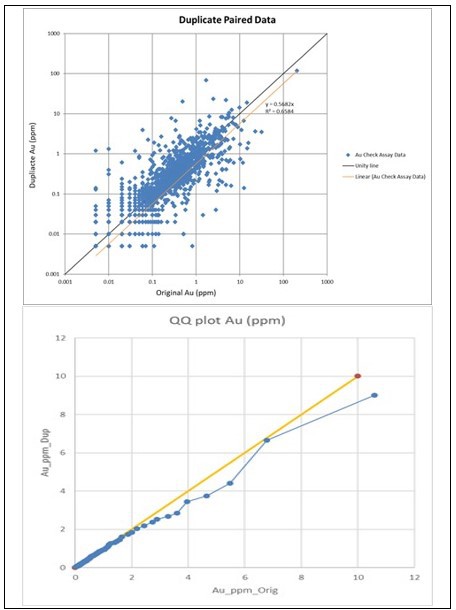
Note: * Scatter and QQ plots show poor precision and 8% bias to the original
Source: CSA Global, 2019
CSA Global comment
Assay precision reported from the ALS laboratory has acceptable repeatability despite being a very nuggety deposit. Overall, taking the different analytical methods into account, there are no material concerns regarding assay accuracy up to ~3 ppm Au, but there is a lack of higher value CRMs. No concerns regarding potential cross contamination were noted.
Abore
Where available, QA/QC data were extracted from the SQL database and reviewed by CSA Global. Observations and conclusions are summarised below:
-
Minor mislabeling of CRMs in database - the will be corrected in the database
-
Only the exploration data were included in this review
-
Proportion of historical QC samples available for review was less than acceptable practice. Additional infill drilling is planned whuch will address this observation.
|
Asanko Gold Inc. NI 43-101 Technical Report on Asanko Gold Mine, Ghana |
Cross contamination
- 5% of blank samples had values > 10 x LDL (only one > 1 ppm Au), but overall no material concerns with cross contamination.
Assay accuracy (bias)
-
Some apparent misidentified QC material resulting in failures
-
No systematic bias noted and overall an acceptable accuracy.
Assay precision
- Insufficient historical samples to make any conclusions regarding precision.
CSA Global comment
Due to the absence of duplicate samples, assay precision cannot be quantified, which indicates that there are risks associated with the repeatability of assay results for this deposit. No material failings were observed with cross contamination or assay accuracy, but it must be noted that the proportion of blank and CRM samples included with the primary samples was lower than industry norms.
Asuadai
Where available, QA/QC data were extracted from the exploration SQL database and reviewed by CSA Global. Observations and conclusions are summarised below:
-
Minor mislabeling of CRMs - this will be corrected in the database
-
Only the exploration data were included in this review
-
Proportion of QC samples (CRM and blanks) available for review appears appropriate.
Cross contamination
- 5% of blank samples had values > 10 x LDL (three samples > 1 ppm Au), but overall no material concerns with cross contamination (Figure 11-6).
Figure 11-6 Asuadai exploration blank Shewhart plot with three outliers removed
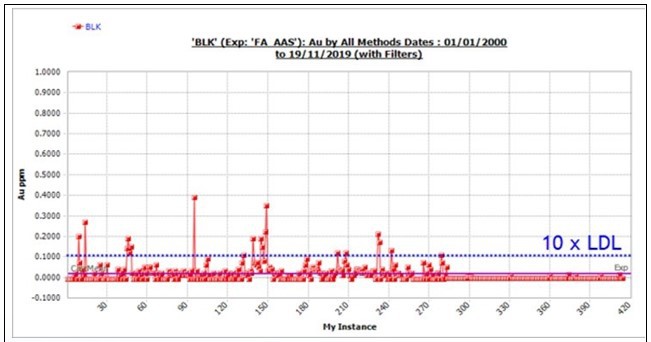
Source: CSA Global, 2019
Assay accuracy (bias)
|
Asanko Gold Inc. NI 43-101 Technical Report on Asanko Gold Mine, Ghana |
- Some apparent misidentified QC material resulting in failures
- No systematic bias noted and overall an acceptable accuracy (Table 11-7).
Table 11-7 Asuadai exploration CRM results (method FA_AAS)*
|
Au standard(s) |
No. of samples |
Calculated values |
||||||
|
Standard code |
Method |
Exp method |
Exp value |
Mean Au |
SD |
CV |
Mean bias |
|
|
CU163 |
FA50_AAS |
UN_UN |
4.35 |
15 |
4.44 |
0.31 |
0.07 |
2% |
|
G300-9 |
FA50_AAS |
FA_UN |
1.53 |
14 |
1.51 |
0.06 |
0.04 |
-2% |
|
G397-6 |
FA50_AAS |
FA_UN |
3.95 |
14 |
3.91 |
0.18 |
0.05 |
-1% |
|
G996-4 |
FA50_AAS |
FA_UN |
0.51 |
10 |
0.47 |
0.04 |
0.09 |
-9% |
|
PM198 |
FA50_AAS |
FA_UN |
0.51 |
14 |
0.52 |
0.07 |
0.14 |
2% |
|
PM431 |
FA_AAS |
FA_UN |
2.78 |
78 |
2.81 |
0.10 |
0.04 |
1% |
|
PM432 |
FA50_AAS |
FA_UN |
2.03 |
15 |
1.99 |
0.28 |
0.14 |
-2% |
|
PM441 |
FA50_AAS |
FA_UN |
0.53 |
21 |
0.52 |
0.03 |
0.06 |
-2% |
|
PM442 |
FA50_AAS |
FA_UN |
0.62 |
40 |
0.64 |
0.02 |
0.03 |
4% |
|
PM443 |
FA50_AAS |
FA_UN |
4.75 |
17 |
4.76 |
0.30 |
0.06 |
0% |
|
PM444 |
FA50_AAS |
FA_UN |
5.36 |
45 |
5.49 |
0.33 |
0.06 |
2% |
|
PM450 |
FA50_AAS |
FA_UN |
0.56 |
3 |
0.55 |
0.03 |
0.05 |
-2% |
Note: * No systematic bias noted; SD - Standard deviation; CV - Coefficient of variation
Source: CSA Global, 2019
Assay precision
- No field duplicate results in the database therefore no conclusions regarding precision.
CSA Global comment
Due to the absence of duplicate samples, assay precision cannot be quantified which indicates that there are risks associated with the repeatability of assay results for this deposit. No material failings were observed with cross contamination or assay accuracy.
Adubiaso
Where available, QA/QC data were extracted from the exploration and mining SQL databases and reviewed by CSA Global. Observations and conclusions are summarised below:
-
Apparent misidentification of CRMs in database - requires review and correction in database
-
Exploration data includes DD and RC drill holes.
Cross contamination
- No issues were noted with respect to cross contamination i.e. no significantly elevated blank results in database, although the proportion of exploration blank samples was low (< 1% of total samples). The proportion of mining blank samples was appropriate (5% of samples).
Assay accuracy (bias)
-
Minor failures noted which usually appear to be mislabeling of QC material
-
No systematic bias therefore overall assay accuracy appears to be acceptable.
|
Asanko Gold Inc. NI 43-101 Technical Report on Asanko Gold Mine, Ghana |
Assay precision
-
Exploration:
-
DD - No data for DD drill holes (53 DD drill holes vs 331 RC drill holes in database) therefore no control on repeatability.
-
-
RC - poor repeatability CVAVR% of 58% (n=28) and significant bias (70% to duplicate). However, bias heavily influenced by 2 pairs indicating the nuggety nature of the ore body (Figure 11-7).
-
Mining:
-
Poor repeatability CVAVR% of 50% (n=113) and significant bias (50% to original). However, bias heavily influenced by three pairs indicating the nuggety nature of the ore body (Figure 11-8).
-
Figure 11-7 Adubiaso exploration RC field duplicate scatter and QQ plots*
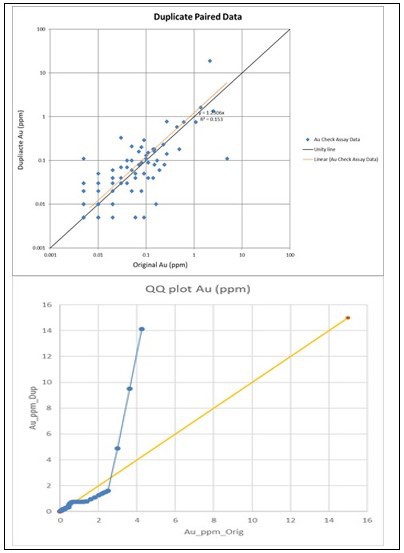
Note: * Duplicate scatter and QQ plots show poor precision and bias
Source: CSA Global, 2019
|
Asanko Gold Inc. NI 43-101 Technical Report on Asanko Gold Mine, Ghana |
Figure 11-8 Adubiaso GC field duplicate scatter and QQ plots*
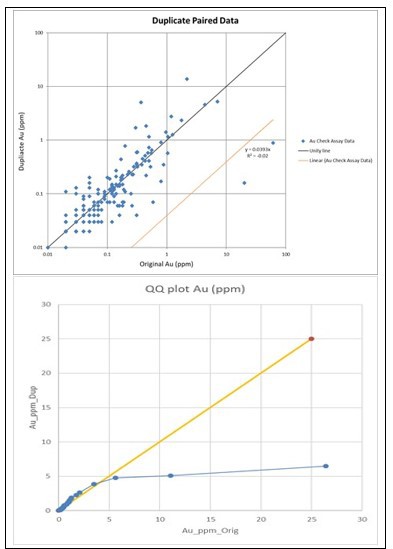
Note: * Duplicate scatter and QQ plots show poor precision and bias
Source: CSA Global, 2019
CSA Global comment
RC sample assay precision is poor (even for a very nuggety deposit), with significant mean bias between original and duplicate samples, and there are no DD duplicate data available. However, this bias is significantly influenced by a few extreme outliers. There are no material concerns regarding assay accuracy or potential cross contamination of samples.
11.9 Results - umpire analysis
No external check (umpire) samples were analysed for the grade control samples. The following is noted:
-
Nkran. External check samples were analysed at ALS Kumasi and had poor repeatability. Only ten external check samples were available for review
-
Esaase. External check samples were assayed at Genalysis and SGS Laboratories. Repeatability was poor with bias of 12% and 10% respectively to the original samples
-
Akwasiso. Umpires had a significant bias to the duplicates with poor precision. However, the bias and lack of precision can be explained by the differences in assay techniques used. Original samples were analysed at the AGM laboratory using a bottle roll cyanide leach and the umpires at Intertek Tarkwa by fire assay
|
Asanko Gold Inc. NI 43-101 Technical Report on Asanko Gold Mine, Ghana |
-
Abore. Only five samples available for review, therefore no definitive conclusions could be made
-
Asuadai. Only five samples available for review, therefore no definitive conclusions could be made
-
Adubiaso. Only eight samples available for review, therefore no definitive conclusions could be made.
11.10 Author's opinion
It is the opinion of CSA Global that the adequacy of the sample preparation, security, and analytical procedures for the Asanko Gold deposits under investigation are acceptable for use in Mineral Resource estimation. A number of QAQC issues have been highlighted for which CSA Global recommend further action is taken to improve the quality of data management and QAQC analysis.
|
Asanko Gold Inc. NI 43-101 Technical Report on Asanko Gold Mine, Ghana |
12 DATA VERIFICATION
Previous and extensive data verification has been undertaken by several independent consultants over the periods Keegan and PMI owned the Esaase and Nkran properties respectively, prior to the Asanko Gold takeover of PMI and the merger of the two entities as Asanko Gold and the commencement of mining from the Nkran pit in 2015. These independent consultants included SRK (2011, 2012), CJM (2014, 2016) and CSA Global (2016). CSA Global remain the current independent QP and remain responsible for this section of the NI43-101 report.
The verification steps undertaken by the earlier Companies are shown below. These verifications are disclosed as being documentation of previous verification, but that it hasn't been relied upon as a proxy for current verification by the current QPs.
The data for the various Obotan and Esaase tenements was based on the available exploration drill hole data and geological models and litho-domains which was provided to CSA Global and CJM by Asanko Gold. The steps taken for verification of the data relied upon for the current MRE are shown in Section 12.2 for CJM, and in Section 12.3 for CSA Global. Both QPs are satisfied with the accuracy of the data for the purposes of estimation mineral resources.
12.1 CSA Global data validation and site visits
Malcolm Titley (CSA Global principal consultant and QP for the Nkran, Esaase and Akwasiso MREs) visited the AGM on numerous occasions. The first site visit was during the period 1 to 6 September 2016 with follow-up visits during November 2016 and 12 to 16 January 2017. During 2018 and 2019 he has visited site for one week each quarter, and in some quarters, more regularly and for longer periods. The visits included reviews of the following:
-
Drilling techniques with emphasis on appropriateness of the drilling method
-
Sampling procedures
-
Logging procedures
-
Structural logging procedures
-
Density estimation procedures
-
Data entry procedures
-
Review of geology interpretation and inputs for Mineral Resource Estimation
-
Geological review of core and comparable relationships with open pit mapping
-
Review of QA/QC results of pit grade control and related infill drilling programs
-
Geological discussions related to continuous improvement of the geological understanding with the site geologist
-
Review of mining and grade control procedures with emphasis on reconciliation between production and the MRE models
-
Review of mining and metallurgical plant reconciliation and metal accounting
-
Review and validation of Nkran and Esaase geology and drill hole sample data, in preparation for MRE update
-
Site reviews of Akwasiso, Abore and Asuadai, with reference to drilling programs and galamsey workings.
|
Asanko Gold Inc. NI 43-101 Technical Report on Asanko Gold Mine, Ghana |
12.2 CSA Global data validation
Digital copies of the Asanko Gold exploration (Nkran, Esaase and Akwasiso) and Asanko Gold GC SQL databases were received by CSA Global in January 2017. The databases were validated and checked to ensure that both their structures and the data contained were valid. Checks undertaken are discussed in the following sections.
Updated Exploration and GC SQL databases were received by CSA Global in April 2019. Standard database load-up validation procedures were undertaken (see Section 12.3) for these databases, with no material data issues noted.
12.3 Database structure
The database schema used is the Maxwell DataShed™ (MDS) which has standard constraints, keys and triggers to ensure that only validated data can be loaded. If these constraints, keys or triggers have been edited or removed, invalidated data can be merged into the database, (e.g. overlapping intervals, data that exceeds the maximum depth of the drill hole, etc.).
Standard validation rules in the MDS include the following:
-
Data is captured in the correct format:
-
Real number: This is a number such as a drill hole depth, co-ordinate, etc. In some cases, there can be a constraint on a number (e.g. a number which is a percent should be ≤ 100)
-
Date: Set format such as dd/mm/yyyy
-
Text: Usually a comment
-
Library field: A library field (lookup) has a predetermined list of values allowing only those values to be entered in the field (e.g. lithotype codes, or responsible person). This ensures that there is consistency in the database (e.g. a quartz vein is always captured as "Qv" not as Q-V, Qtz V, etc.)
-
Collar table: Incorrect co-ordinates (not within known range), unique hole IDs per dataset. Data can only be merged into the database if the drill hole has been entered into the collar table.
-
-
Survey table: Duplicate entries, survey intervals past the specified maximum depth in the collar table and anomalous dips and azimuths are not merged until corrected
-
Geotechnical tables: Core recoveries and rock quality designations (RQDs) less than 0%, or greater than 120% (Recovery), or 100% (RQD), overlapping intervals, negative widths and geotechnical results past the specified maximum depth in the collar table are not merged until corrected
-
Geology table: Duplicate entries, lithological intervals past the specified maximum depth in the collar table, overlapping intervals and negative widths are not merged until corrected. Standardised logging codes are required
-
Sampling table: Duplicate entries, sampling intervals past the specified maximum depth in the collar table, negative widths, overlapping intervals, sampling widths exceeding tolerance levels, missing intervals and duplicated sample IDs are not merged until corrected
-
Assay table: Missing samples (assay results received, but no samples in database) are imported into an incoming assay table, assay metadata such as detection limits, methods, etc. are captured where possible.
AdeptSQL™ was used to compare database structures against each other and against the MDS to determine whether the database structures were still intact. Changes had been made, but none of these were material with respect to the integrity of the databases. The database comparison reports are available if required and changes noted included:
-
Additional tables
-
Additional fields in a table
-
Field column order within tables.
|
Asanko Gold Inc. NI 43-101 Technical Report on Asanko Gold Mine, Ghana |
However, it must be noted that the even though the database structures were not materially different from the MDS, constraints could have been removed to merge data and reinstated once data had been merged. Therefore, checks of the data within the databases were also undertaken.
12.4 Data review
12.4.1 Asanko Gold exploration database
The exploration database is a large database with 62,872 drill holes (to April 2019) in the collar file and data was extracted from the database for the various projects using bounding values for easting and northings. These data extractions were validated and exported for downstream work. During the validations, some minor issues were noted and resolved.
The database did not contain all the available data as there were instance where data had been used in resource calculations, or QA/QC reviews which weren't in the master database. This issue of surrogate datasets has been fixed by Asanko Gold.
A review of the assay tables for Esaase was undertaken by CSA Global in March 2018 where multiple issues were noted and handed over to Asanko Gold database administrator (DBA) for resolution. Validation during the April 2019 resource preparation stage verified that these issues had been appropriately resolved.
12.4.2 Asanko Gold grade control database
The Asanko Gold grade control database has 14,454 drill holes (April 2019). Minor validation issues with some gaps and missing data were noted in the 2017 review which were subsequently resolved by Asanko Gold.
12.5 Database conclusions and recommendations
The structures of both databases are intact, but it is apparent that the exploration database has had constraints removed and then re-instated, permitting some non-validated data to be loaded. Some minor validation issues were noted when reviewing the data extractions, but overall these were deemed to not materially impact the quality of the data used for resource estimation. Gaps were present and some of these are material to downstream work (e.g. density data). These issues have been resolved by Asanko Gold.
Other recommendations that have been already remedied by Asanko Gold included:
-
A comprehensive audit of the Nkran database to identify invalid records and resolve these (completed Q2 2017)
-
Resolve the issues noted in the GC database such as future dates in the assay batch table (remedied)
-
Ensure that all available data are captured in the master database (remedied)
-
Where possible, fill in any gaps identified in the databases (remedied).
12.6 Qualified Person's opinion on adequacy of data for purposes used in Technical Report
Malcolm Titley, Associate Principal Consultant with CSA Global and QP for the Asanko Gold Mineral Resource Estimates (MREs), has reviewed the data used for the MREs and is satisfied that the data used is acceptable for estimation of the Asanko Gold MREs.
|
Asanko Gold Inc. NI 43-101 Technical Report on Asanko Gold Mine, Ghana |
13 MINERAL PROCESSING AND METALLURGICAL TESTING
Unless specified otherwise, all diagrams in this section are sourced from Asanko Gold, 2019.
13.1 Project testwork
13.1.1 Previous metallurgical testwork
Prior to 2016 the Esaase ore was evaluated separately in test campaigns between 2008 and 2013. Four rounds of metallurgical testwork were carried out on samples extracted from the Esaase ore body, prior to the involvement of DRA. The findings of each of these testwork phases are comprehensively discussed in the Lycopodium report, completed as part of the feasibility study submission in 2012.
A fifth phase testwork programme was scoped to quantify the metallurgical recovery that could be achieved through the combination of gravity recovery within the milling circuit and flotation on gravity tailings, with a leach on the flotation concentrates. The fifth phase of testwork took place between 2012 and 2013 at Amdel Laboratories in Perth under the management of DRA. As per NI 43-101 Technical Report "Asanko Gold Project in Ghana - Pre-Feasibility Study" issued 27 June 2013 (DRA, 2013).
The summarized LOM recovery estimate is presented in Table 13-1 below.
Table 13-1 Estimated LOM metal recoveries for gravity flotation CIL process
|
Component |
Recovery (Gravity-flotation-concentrate CIL) |
|
Laterite |
84.54% |
|
Oxide |
84.67% |
|
Transitional |
91.20% |
|
Fresh |
94.23% |
|
Recovery discount |
1.11% |
|
LOM recovery |
90.03% |
The AGM Expansion Project testwork was conducted in two phases of testwork programmes. Both testwork phases were undertaken by the Perth based, Australian Laboratory Services Pty Ltd (ALS) under the management of DRA. These testwork phases evaluated blends of Esaase and Nkran ores for processing at a central facility.
AGM Expansion Project - Phase 1 testwork 2014 to 2015
As per the Asanko Gold NI 43-101 Technical Report (2015), the following is noted:
This phase of testwork was designed to evaluate the metallurgical response of a gravity-CIL circuit (as per the existing AGM Phase 1 design) and a gravity-flotation-CIL circuit (as per the Esaase PFS design) when treating blends of Esaase and Obotan ores. It was further investigated if it would prove feasible to dedicate specific ore types to either one of the two processing routes to optimise overall recoveries and operating costs. Refer to Table 13-2 for a summary of the results obtained.
|
Asanko Gold Inc. NI 43-101 Technical Report on Asanko Gold Mine, Ghana |
Table 13-2 Summary of AGM Expansion Project Phase 1 testwork programme
|
Testwork scope |
Samples |
Tests |
Total recovery results |
|
Evaluation of the metallurgical response of a gravity-CIL circuit and a gravity-flotation-CIL circuit when treating blends of Esaase and Obotan ores. |
Composite samples of Oxide, Transitional and Fresh ores, produced from individual core samples from the Nkran and Esaase ore bodies |
Gravity separation and sighter, batch flotation tests on blends of Nkran Fresh and Esaase material at P80 -75 µm and 106 µm. |
Nkran Fresh - 95.1% at P80 -75 µm Nkran Fresh and Esaase Fresh blend at P80 -75 µm - 93.2% to 96.6% Nkran Fresh and Esaase Oxide blend at P80 -106 µm 90.6% to 94.7% Nkran Fresh and Esaase Transition blend at P80 -106 µm 81.6% to 92.9% |
|
|
|
CIL tests on blends of Nkran Fresh and Esaase material gravity tailings at P80 -106 µm |
Esaase Oxide - 94.7% Nkran Fresh and Esaase Oxide blend 81.1% to 93.7% Esaase Transition - 87.4% Nkran Fresh and Esaase Transition blend 90.9% to 92.2% Nkran Fresh - 94.0% Esaase Fresh of 94.1% 50% Esaase Fresh: 50% Nkran Fresh 93.5% |
AGM Expansion Project - Phase 2 testwork, 2015 to 2016
As per the Asanko Gold NI 43-101 Technical Report (2017), the following is noted:
The testwork scope of this phase of the project was designed to evaluate the opportunity to process tailings from the gravity-CIL circuit together with the reground flotation concentrate product from a gravity-flotation circuit in a combined CIL circuit, when treating blends of Esaase and Obotan ore types. Additional testwork was undertaken which identified carbon poisoning by flotation reagents to be an added risk to CIL recoveries. Addendum DFS testwork on composites of Esaase Fresh and Nkran ores, was conducted in Q4 2016 to confirm the gravity/CIL processing route.
Table 13-3 shows that both composites had OC values of less than 0.5% minimising the effect of preg-robbing.
Table 13-3 Relevant analysis on Nkran and Esaase (ALS A16645, July 2016)
|
Ore type |
Silver |
Arsenic |
Total carbon (%) |
Organic carbon (%) |
Sulphur total (%) |
Sulphide (%) |
SiO2 |
|
Esaase Oxide |
<0.3 |
1720 |
0.36 |
0.24 |
0.24 |
0.18 |
72.8 |
|
Esaase Fresh |
0.3 |
460 |
0.90 |
0.27 |
0.36 |
0.32 |
68.8 |
|
Nkran Fresh |
0.6 |
4760 |
1.32 |
0.33 |
1.08 |
0.76 |
63.6 |
|
Nkran Fresh LG |
0.3 |
3620 |
1.68 |
0.36 |
0.64 |
0.60 |
53.6 |
|
Nkran Fresh V2 |
0.6 |
4080 |
1.56 |
0.42 |
0.72 |
0.72 |
60.0 |
|
Asanko Gold Inc. NI 43-101 Technical Report on Asanko Gold Mine, Ghana |
Recoveries for Esaase Fresh, Transitional and Oxide ore components were largely based on benchmarking against Nkran ores, with residue values applied to each based on a pre-determined gravity gold recovery. Refer to Table 13.4 for the comparative gravity recoveries and tails grades.
Table 13-4 Summary of the data used to derive gravity-CIL recovery estimates
|
Ore type |
Phase 2A gravity CIL plant |
|
|
Gravity stage recovery |
Gravity tails CIL residue grade |
|
|
Nkran Oxide |
37.0% |
0.148 |
|
Nkran Transition |
44.0% |
0.103 |
|
Nkran Fresh |
55.0% |
0.103 |
|
Esaase Oxide |
37.0% |
0.148 |
|
Esaase Transition |
44.0% |
0.080 |
|
Esaase Fresh |
55.0% |
0.080 |
|
Recovery estimation criteria |
||
|
Gravity recovery estimate derived from GRG testwork and modelling and operating data |
||
|
CIL residue per ore type derived from testwork and operational data and weighted as per mine blend |
||
|
106 µm target grind |
||
|
100 ppm terminal cyanide concentration in CIL circuit |
||
|
Discount factors |
||
|
CIL Carbon fines losses |
Based on 40 g/t carbon at 50 g/t Au |
Based on 40 g/t carbon at 50 g/t Au |
|
Solution Au losses |
Based on 45% solids in CIL tailings and 0.01 g/ℓ Au in solution |
Based on 45% solids in CIL tailings and 0.01 g/ℓ Au in solution |
It was recommended by DRA (2017) that further variability testwork be conducted on the Esaase Fresh material to further substantiate the benchmarking against the Nkran material and the similarities between the two deposits.
13.1.2 Current metallurgical testwork
In 2019, a limited metallurgical testwork campaign was undertaken.
The purpose of the program was to address two key technical aspects with respect to the Esaase Fresh component:
-
To create a better understanding of the structural geology
-
To formulate a metallurgical test program that would focus on the structural interpretation and its different lithologies which would then lead into the future creation of a geometallurgical model and a more defined recovery profile.
The key component of the geometallurgy of the fresh, unoxidised gold mineralisation at Esaase, and potentially within the Weakly - Oxidized (WOX) transition zone, is the distribution and abundance of Organic Carbon (OC) which shows enrichment in the following areas:
-
Within and immediately adjacent to the NE-SW trending shear zones and sheared lithological contacts within the stratigraphic units
-
Within the deformed shales and siltstones of the Cobra unit.
One of the planned outputs of the metallurgical testwork campaign was the development of an unbiased recovery model which considers the distribution and abundance of OC and is therefore applicable to all sections of the ore body.
The OC content variances were determined by appropriate drill core sampling and assaying, with the Cobra unit identified as a distinctly elevated OC geometallurgical domain (narrow 2-5 m intervals of greater than 0.5% OC). The OC content levels in the central sandstone zone are significantly lower.
|
Asanko Gold Inc. NI 43-101 Technical Report on Asanko Gold Mine, Ghana |
Geological observations from ongoing pit mapping (linked to drill hole %OC stratigraphic characterisation) suggests that elevated OC levels are predictable and occurs within identifiable "structural domains" that are not continuous across the full strike length of the Esaase Main and South deposits (Table 13-5). Metallurgical sampling and testing completed in 2018/ 2019 is better aligned with the growing understanding of the resource geology but are biased towards the thinking at that time that OC is equally widespread across all lithologies (not necessarily diagnostic).
Table 13-5 Percent OC populations by stratigraphic unit (in %)
|
Stratigraphic unit |
Probability of OC above |
Mean %OC of sample |
Mean %OC of sample |
|
Upper |
15 |
0.30 |
0.84 |
|
Cobra |
55 |
0.38 |
0.89 |
|
Central Sandstone |
12 |
0.30 |
0.62 |
|
Python |
26 |
0.32 |
0.62 |
The OC is present in all geological and metallurgical samples tested to date demonstrating various degrees of metallurgical recovery performance. The metallurgical testwork described below does not have the benefit of geological interpretation that has been developed in this phase of study and because of that certain discounts relating to recovery may have been overstated (preliminary geological pointers to over-sampling of high OC units).
Metallurgical testwork on Esaase composites
In support of the AGM LOM Study, four defined testwork campaigns were undertaken at the ALS Metallurgy Services Laboratory in Perth (Western Australia) and one Raman ratio investigation program at Curtin University in Western Australia. The objective of the testwork was as follows:
-
To determine the metallurgical performance of the samples through a program of gravity recovery and CIL testwork
-
To determine whether samples were likely to be preg-robbing during cyanide leaching (Campaigns 1, 2, 3 and 4)
-
Preparation of samples for analysis at Curtin University (Campaign 2 only)
-
To determine the gold extraction of samples under various process conditions (Campaigns 1, 3 and 4)
-
Preparation of samples for analysis at Curtin University to determine the Raman preg-robbing ratio.
Geological /testwork sample origination
Samples were derived from a number of geological diamond drill cores and tested at Analytical Laboratory Services - ALS Perth as Testwork Campaigns A19208, A19437, A19681, A19765 and A18745 from RC drilling. The identification of samples obtained per testwork phase is shown in Table 13-6.
Table 13-6 Identification of samples for Esaase metallurgical testwork
|
Testwork |
Sample type |
Geological samples ID |
Geological section/s |
|
A18754 |
Reverse circulation |
KERC 039, 114, 155, 156, 157, 158, 164, 220, 227, 233 |
18, earlier testwork |
|
A19208 |
Selected diamond core |
KEDD 162, 550, 813, 989, 6032, KE 6013C |
1, 2, 3 |
|
A19437 |
Diamond core |
KE6013C, KEDD 6032, 959, 550, 813, 949 |
16, 23, 24 |
|
A19681 |
Diamond core |
KEDD 162, 6032, 582, 509, 863, 862, 860, 302, 537, 821, 334, 822, 864, 832, 784, 785, 480, 488, 754, 913 |
13, 16, 17, 18, 22, 23, 24 |
|
A19765 |
Diamond core |
KEDD 530, 967, 821, 947, 965 |
17, 18 |
Test results for A19765 are not available.
|
Asanko Gold Inc. NI 43-101 Technical Report on Asanko Gold Mine, Ghana |
The plans depicting the various geological drill sections are shown in Figure 13-1, Figure 13-2 and Figure 13-3.
Figure 13-1 Asanko Gold Esaase Main Pit metallurgical testwork sampling location
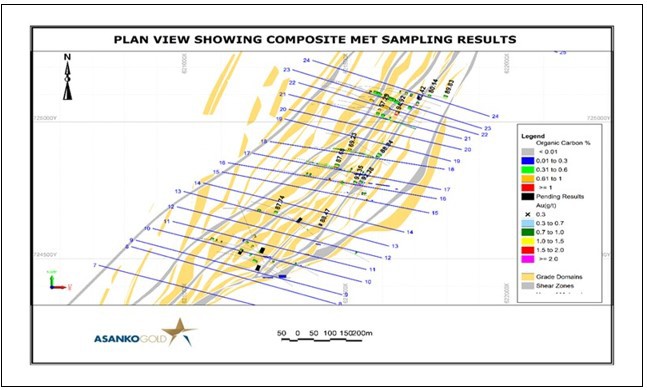
Figure 13-2 Esaase Main Pit metallurgical testwork sampling cross section 23

|
Asanko Gold Inc. NI 43-101 Technical Report on Asanko Gold Mine, Ghana |
Figure 13-3 Esaase Main Pit metallurgical testwork sampling cross section 10
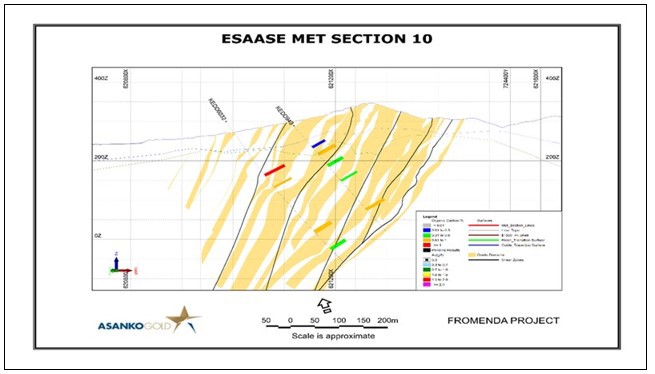
ALS testwork: Campaign 1 (ALS Report A18754, March 2018)
Campaign 1 involved ten RC Esaase samples, comprising five Fresh, two Transitional and three Oxide samples (KERC 039,114, 155, 156,157, 158, 164, 220, 227, 233).
The chip samples were control crushed to -3.35 mm. Samples were then homogenized and split into the various individual sub samples for head assays, grind establishment testwork, gravity separation testwork and whole ore preg-robbing characterization testwork.
The test program is shown in Figure 13-4.
|
Asanko Gold Inc. NI 43-101 Technical Report on Asanko Gold Mine, Ghana |
Figure 13-4 Asanko Gold metallurgical test program flowsheet: Campaign 1 (ALS A18754)
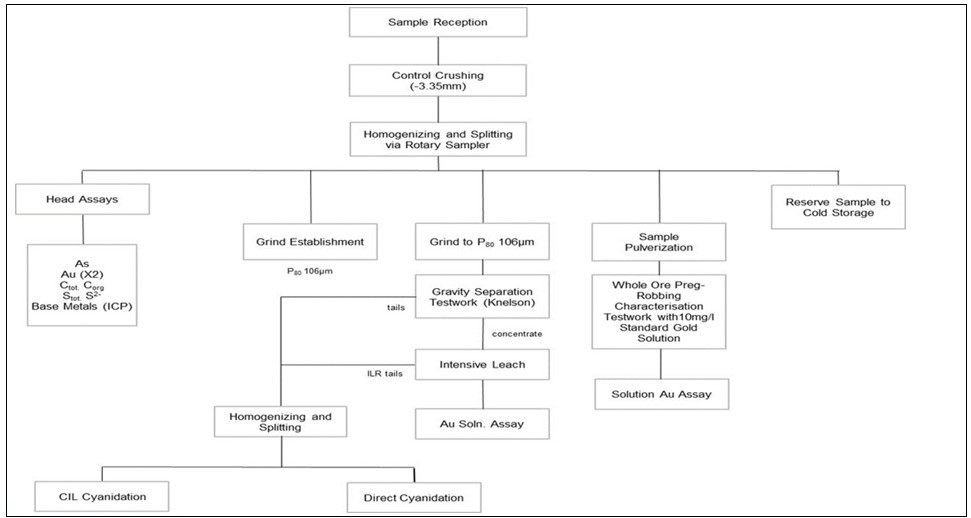
|
Asanko Gold Inc. NI 43-101 Technical Report on Asanko Gold Mine, Ghana |
Head assays (A18754)
Sub-samples of KERC composites were submitted for head assays. Key results are shown in Table 13-7.
Table 13-7 Assays summary on Esaase Composite head samples
|
Composite sample ID |
Sample type |
Composite head assay summary |
|||
|
Gold (g/t) |
Total carbon (%) |
Organic carbon (%) |
Sulphide (%) |
||
|
KERC 114 |
Oxide |
1.41 |
0.15 |
0.15 |
<0.02 |
|
KERC 227 |
Oxide |
1.09 |
0.21 |
0.21 |
<0.02 |
|
KERC 233 |
Oxide |
1.25 |
0.12 |
0.12 |
<0.02 |
|
KERC 156 |
Transition |
1.66 |
0.48 |
0.48 |
0.12 |
|
KERC 164 |
Transition |
1.43 |
0.30 |
0.30 |
<0.02 |
|
KERC 039 |
Fresh |
1.74 |
0.75 |
0.48 |
0.34 |
|
KERC 155 |
Fresh |
0.91 |
1.26 |
0.57 |
0.14 |
|
KERC 157 |
Fresh |
1.97 |
0.63 |
0.24 |
0.34 |
|
KERC158 |
Fresh |
2.03 |
0.75 |
0.45 |
0.38 |
|
KERC220 |
Fresh |
2.14 |
1.02 |
0.39 |
0.24 |
Gravity/cyanidation testwork (A18754)
The ten sub-samples, ground to a P80 of 106 µm were submitted for gravity followed by direct cyanidation and CIL on the gravity tails fraction. The results are shown in Table 13-8.
Table 13-8 Results on Esaase KERC Composites gravity/direct/CIL cyanidation
|
Composite sample ID |
Test type |
Percent gold extraction, at set intervals (% Au) |
Au grade (g/t) |
|||||
|
Gravity (%) |
4hr |
8hr |
12hr |
24hr |
Calcined head |
Leach residue |
||
|
KERC 114 |
CIL CN |
78.61 |
93.68 |
93.11 |
93.29 |
93.11 |
1.23 |
0.09 |
|
Direct CN |
79.04 |
94.86 |
95.63 |
95.63 |
96.33 |
1.23 |
0.05 |
|
|
KERC 227 |
CIL CN |
65.60 |
94.71 |
93.91 |
93.91 |
93.91 |
1.48 |
0.09 |
|
Direct CN |
64.18 |
92.21 |
93.45 |
93.76 |
94.05 |
1.51 |
0.09 |
|
|
KERC 233 |
CIL CN |
56.85 |
90.11 |
91.28 |
93.06 |
92.68 |
1.71 |
0.13 |
|
Direct CN |
50.02 |
89.05 |
91.23 |
91.70 |
93.30 |
1.94 |
0.13 |
|
|
KERC 156 |
CIL CN |
60.21 |
84.14 |
87.18 |
87.18 |
89.76 |
1.61 |
0.17 |
|
Direct CN |
60.30 |
82.78 |
84.53 |
83.40 |
82.29 |
1.61 |
0.29 |
|
|
KERC 164 |
CIL CN |
64.72 |
85.78 |
87.79 |
87.64 |
88.66 |
1.50 |
0.17 |
|
Direct CN |
60.32 |
86.37 |
86.95 |
86.95 |
86.95 |
1.61 |
0.211 |
|
|
KERC 039 |
CIL CN |
61.09 |
89.42 |
90.51 |
92.54 |
94.65 |
1.59 |
0.09 |
|
Direct CN |
60.03 |
90.44 |
93.63 |
93.35 |
94.43 |
1.62 |
0.09 |
|
|
KERC 155 |
CIL CN |
83.33 |
94.90 |
97.85 |
97.85 |
97.85 |
1.16 |
0.03 |
|
Direct CN |
80.69 |
91.48 |
91.09 |
91.47 |
90.02 |
1.20 |
0.12 |
|
|
KERC 157 |
CIL CN |
64.42 |
89.48 |
89.01 |
89.01 |
90.68 |
1.50 |
0.14 |
|
Direct CN |
65.23 |
89.72 |
90.35 |
90.35 |
90.92 |
1.49 |
0.14 |
|
|
KERC 158 |
CIL CN |
53.92 |
88.27 |
90.12 |
90.00 |
90.00 |
1.80 |
0..18 |
|
Direct CN |
55.62 |
83.09 |
82.01 |
80.70 |
78.22 |
1.74 |
0.38 |
|
|
KERC 220 |
CIL CN |
81.62 |
96.83 |
96.64 |
96.64 |
96.64 |
1.19 |
0.04 |
|
Direct CN |
78.61 |
95.56 |
96.32 |
97.05 |
96.35 |
1.23 |
0.05 |
|
The following is noted:
-
Gravity gold is generally high with recoveries from 50% Au to 83.3% Au
-
Potential preg-robbing is exhibited in samples KERC 155, 156 and 158. The results are however countered by the CIL cyanidation route
-
Gravity/CIL cyanidation results range for 88.66% to 96.64% recovery.
|
Asanko Gold Inc. NI 43-101 Technical Report on Asanko Gold Mine, Ghana |
Characterisation testwork (A18754)
Sub-samples of all 10 KERC composites were submitted for preg-robbing characterisation. The results are summarized in the Table 13-9. The preg-robbing results vary, with no correlation of OC to the preg-robbing index (PRI) percent.
Table 13-9 Preg-robbing characterisation results on Esaase KERC Composite samples
|
Sample ID |
Organic carbon (%) |
Au assays (mg/ℓ) |
Preg-robbing index (%) |
|
|
Initial |
Final |
|||
|
KERC 114 |
0.15 |
9.90 |
10.2 |
0.00 |
|
KERC 227 |
0.21 |
9.90 |
10.2 |
0.00 |
|
KERC 233 |
0.12 |
9.90 |
11.1 |
0.00 |
|
KERC 156 |
0.48 |
9.90 |
6.06 |
33.74 |
|
KERC 164 |
0.30 |
9.90 |
9.87 |
0.30 |
|
KERC 039 |
0.48 |
9.90 |
6.26 |
36.8 |
|
KERC 155 |
0.57 |
9.90 |
9.00 |
9.09 |
|
KERC 157 |
0.24 |
9.90 |
9.52 |
3.84 |
|
KERC 158 |
0.45 |
9.90 |
7.29 |
26.36 |
|
KERC 220 |
0.39 |
9.90 |
9.47 |
4.34 |
ALS testwork: Campaign 2 (ALS Report A19208, October 2018)
Campaign 2 comprised 39 hand specimen samples, that were specifically for visible OC content from drill core samples EXES0618 5443-548. Selection of these samples was not based on current knowledge of the mining schedule.
The core samples were control crushed to -3.35 mm, and control dried at less than 40ºC with the temperature recorded. The samples were then pulverized in short periods (approximately 30 seconds) in a small ring mill. Samples were then homogenized and split into the various sub samples for head assays, preg-robbing characterization testwork. Gold assays were completed under the standard fire assay procedure. Sub samples were prepared for Raman spectroscopy testwork (Campaign 6) at Curtin University.
The test program is shown diagrammatically in Figure 13-5.
|
Asanko Gold Inc. NI 43-101 Technical Report on Asanko Gold Mine, Ghana |
Figure 13-5 Asanko Gold metallurgical test program flowsheet: Campaign 2 (ALS A19208)
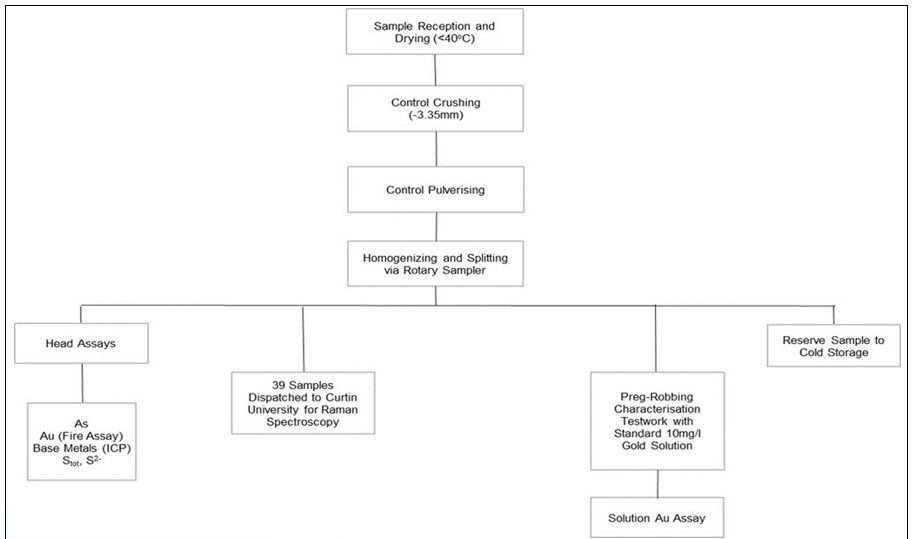
|
Asanko Gold Inc. NI 43-101 Technical Report on Asanko Gold Mine, Ghana |
Head assays (A19208)
The samples were subjected to fire assay for gold (and screen fire assay on selected samples) and a multi element inductively coupled plasma mass spectrometry (ICP) scan for base metals and other elements. A summary of the results is shown in Table 13-10.
Table 13-10 Assays summary on Esaase Composite head samples
|
Sample ID |
Composite head assay summary |
Sample ID |
Composite head assay summary |
||||
|
Au (g/t) |
Total carbon (%) |
Organic carbon (%) |
Au (g/t) |
Total carbon (%) |
Organic carbon (%) |
||
|
EXES06185443 |
0.02 |
0.63 |
0.36 |
EXES06185463 |
0.03 |
1.29 |
0.69 |
|
EXES06185444 |
0.22 |
0.93 |
0.54 |
EXES06185464 |
<0.02 |
1.05 |
0.21 |
|
EXES06185445 |
0.49 |
2.10 |
0.24 |
EXES06185465 |
<0.02 |
0.99 |
0.48 |
|
EXES06185446 |
<0.02 |
0.84 |
0.45 |
EXES06185466 |
0.51 |
0.96 |
0.09 |
|
EXES06185447 |
0.03 |
1.17 |
0.66 |
EXES06185467 |
0.12 |
0.96 |
0.84 |
|
EXES06185448 |
0.30 |
0.72 |
0.36 |
EXES06185468 |
1.21 |
0.75 |
0.12 |
|
EXES06185449 |
0.14 |
0.60 |
0.21 |
EXES06185469 |
<0.05 |
3.00 |
1.23 |
|
EXES06185450 |
0.58 |
1.11 |
0.24 |
EXES06185470 |
7.79 |
2.40 |
0.69 |
|
EXES06185451 |
0.55 |
0.90 |
0.48 |
EXES06185471 |
1.25 |
1.86 |
0.09 |
|
EXES06185452 |
0.09 |
2.61 |
0.15 |
EXES06185472 |
1.39 |
2.25 |
0.78 |
|
EXES06185453 |
<0.02 |
1.23 |
0.57 |
EXES06185473 |
1.49 |
1.14 |
0.69 |
|
EXES06185454 |
1.24 |
2.16 |
1.20 |
EXES06185474 |
0.06 |
1.47 |
0.45 |
|
EXES06185455 |
0.42 |
1.35 |
0.51 |
EXES06185475 |
<0.02 |
0.87 |
0.36 |
|
EXES06185456 |
<0.02 |
1.29 |
0.06 |
EXES06185476 |
<0.02 |
<0.03 |
<0.03 |
|
EXES06185457 |
0.16 |
1.65 |
0.24 |
EXES06185477 |
1.84 |
<0.03 |
<0.03 |
|
EXES06185458 |
1.55 |
2.04 |
0.66 |
EXES06185478 |
<0.05 |
4.14 |
3.99 |
|
EXES06185459 |
0.35 |
1.53 |
0.57 |
EXES06185479 |
0.05 |
0.09 |
0.09 |
|
EXES06185460 |
0.22 |
1.80 |
0.42 |
EXES06185480 |
0.74 |
1.23 |
0.24 |
|
EXES06185461 |
0.18 |
1.59 |
0.93 |
EXES06185481 |
0.48 |
1.77 |
0.84 |
|
EXES06185462 |
0.04 |
0.72 |
0.39 |
|
|
|
|
The following trends are noted:
-
Gold content of samples ranged from less than 0.02 g/t to 7.79 g/t
-
The OC content ranged from less than 0.03% to 3.99%.
Characterisation testwork (A19208)
Sub-samples of all 39 composites were submitted for preg-robbing characterisation testwork. The results are summarized in the Table 13-11.
|
Asanko Gold Inc. NI 43-101 Technical Report on Asanko Gold Mine, Ghana |
Table 13-11 Preg-robbing characterisation on Esaase Composite head samples
|
Sample ID |
Test ID |
Organic carbon (%) |
Au assays (mg/ℓ) |
Preg-robbing index (% ) |
|
|
Initial |
Final |
||||
|
EXES06185443 |
JR4129 |
0.36 |
12.0 |
8.33 |
30.58 |
|
EXES06185444 |
JR4130 |
0.54 |
12.0 |
7.92 |
34.00 |
|
EXES06185445 |
JR4131 |
0.24 |
12.0 |
9.97 |
16.92 |
|
EXES06185446 |
JR4132 |
0.45 |
12.0 |
7.94 |
33.83 |
|
EXES06185447 |
JR4133 |
0.66 |
12.0 |
5.49 |
54.25 |
|
EXES06185448 |
JR4134 |
0.36 |
12.0 |
9.04 |
24.67 |
|
EXES06185449 |
JR4135 |
0.21 |
12.0 |
10.7 |
10.83 |
|
EXES06185450 |
JR4136 |
0.24 |
12.0 |
9.35 |
22.08 |
|
EXES06185451 |
JR4137 |
0.48 |
12.0 |
8.07 |
32.75 |
|
EXES06185452 |
JR4138 |
0.15 |
12.0 |
11.1 |
7.50 |
|
EXES06185453 |
JR4139 |
0.57 |
12.1 |
7.05 |
41.74 |
|
EXES06185454 |
JR4140 |
1.20 |
12.1 |
3.99 |
66.75 |
|
EXES06185455 |
JR4141 |
0.51 |
12.1 |
5.10 |
57.50 |
|
EXES06185456 |
JR4142 |
0.06 |
12.1 |
11.80 |
1.67 |
|
EXES06185457 |
JR4143 |
0.24 |
12.1 |
10.10 |
15.83 |
|
EXES06185458 |
JR4144 |
0.66 |
12.1 |
5.31 |
55.75 |
|
EXES06185459 |
JR4145 |
0.57 |
12.1 |
7.41 |
38.25 |
|
EXES06185460 |
JR4146 |
0.42 |
12.1 |
7.85 |
34.58 |
|
EXES06185461 |
JR4147 |
0.93 |
12.1 |
5.06 |
57.83 |
|
EXES06185462 |
JR4148 |
0.39 |
12.1 |
8.17 |
31.92 |
|
EXES06185463 |
JR4149 |
0.69 |
12.7 |
5.20 |
59.06 |
|
EXES06185464 |
JR4150 |
0.21 |
12.7 |
10.70 |
15.75 |
|
EXES06185465 |
JR4151 |
0.48 |
12.7 |
8.82 |
30.55 |
|
EXES06185466 |
JR4152 |
0.09 |
12.7 |
11.80 |
7.09 |
|
EXES06185467 |
JR4153 |
0.84 |
12.7 |
4.10 |
67.72 |
|
EXES06185468 |
JR4154 |
0.12 |
12.7 |
11.80 |
7.09 |
|
EXES06185469 |
JR4155 |
1.23 |
12.7 |
3.79 |
70.16 |
|
EXES06185470 |
JR4156 |
0.69 |
12.7 |
4.97 |
60.87 |
|
EXES06185471 |
JR4157 |
0.09 |
12.7 |
12.20 |
3.94 |
|
EXES06185472 |
JR4158 |
0.78 |
12.7 |
4.20 |
66.93 |
|
EXES06185473 |
JR4159 |
0.69 |
12.3 |
8.18 |
33.50 |
|
EXES06185474 |
JR4160 |
0.45 |
12.3 |
9.17 |
25.45 |
|
EXES06185475 |
JR4161 |
0.36 |
12.3 |
10.20 |
17.07 |
|
EXES06185476 |
JR4162 |
<0.03 |
12.3 |
12.21 |
0.81 |
|
EXES06185477 |
JR4163 |
<0.03 |
12.3 |
12.3 |
0.00 |
|
EXES06185478 |
JR4164 |
3.99 |
12.3 |
3.44 |
72.03 |
|
EXES06185480 |
JR4165 |
0.09 |
12.3 |
12.1 |
1.63 |
|
EXES06185481 |
JR4166 |
0.24 |
12.3 |
9.55 |
22.36 |
|
EXES06185482 |
JR4167 |
0.84 |
12.3 |
2..13 |
82.68 |
The results indicate a linear relationship with percentage OC levels and PRI% as indicated in Figure 13-6.
|
Asanko Gold Inc. NI 43-101 Technical Report on Asanko Gold Mine, Ghana |
Figure 13-6 Asanko Gold metallurgical test Campaign 2 (A19208), organic carbon % versus PRI %
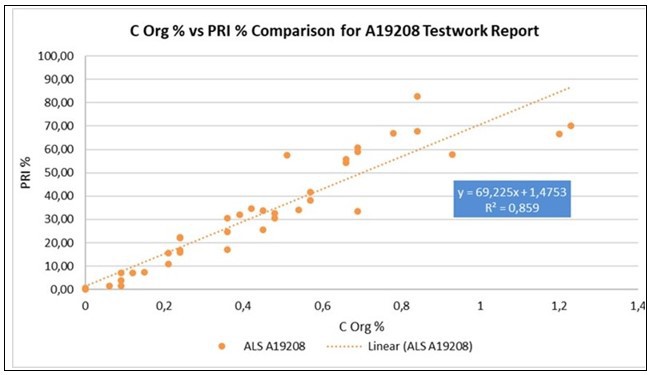
ALS testwork: Campaign 3 (ALS Report A19437, November 2018)
Campaign 3 comprised 25 full mining cut core samples (EXES101800001-EXES101800025). In addition, three activated carbon samples were submitted for testwork. These originated from the Asanko Gold Obotan plant CIL tanks 1,2 and 3, with a sampling date of 29 May 2018.
The core samples were control crushed to -3.35 mm and split into the various sub samples for head assays, grind establishment testwork, gravity separation/direct cyanidation/CIL cyanidation testwork and preg-robbing characterization testwork.
The activated carbon samples were sub sampled and submitted for gold assays. These carbons were to be used in the CIL test program together with fresh carbon.
The test program process is shown in Figure 13-7.
|
Asanko Gold Inc. NI 43-101 Technical Report on Asanko Gold Mine, Ghana |
Figure 13-7 Asanko Gold metallurgical test program flowsheet: Campaign 3 (ALS A19437)
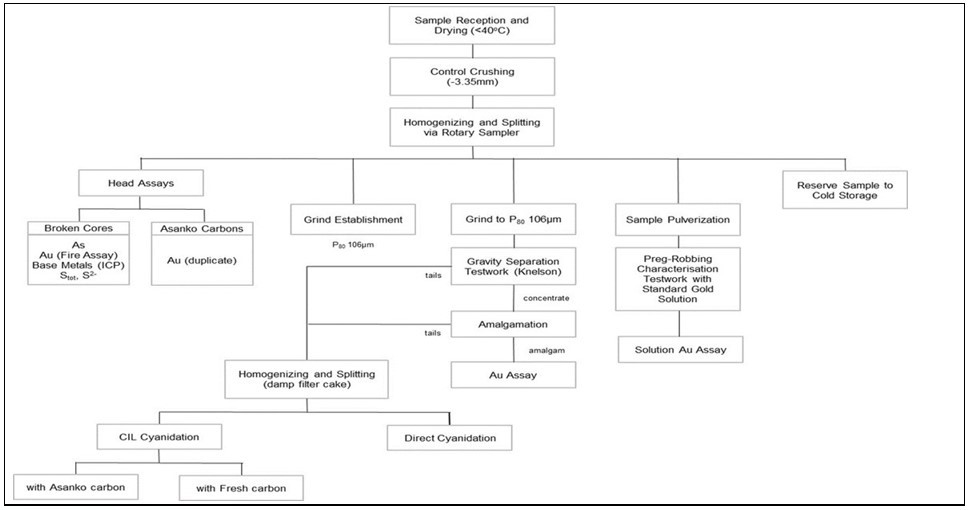
|
Asanko Gold Inc. NI 43-101 Technical Report on Asanko Gold Mine, Ghana |
Head assays (A19437)
The samples were subjected to fire assay for gold (and screen fire assay on selected samples) and a multi-element ICP scan for base metals and other elements, with relevant summary results shown in Table 13-12.
Table 13-12 Head assays on Esaase core and plant activated carbon samples (A19437)
|
Sample ID |
AGM Esaase samples head assay summary |
|||||||||
|
Original |
Repeat |
Average |
||||||||
|
Au (g/t) |
Au (g/t) |
Au (g/t) |
SFA (g/t) |
As (ppm) |
C org (%) |
Cu (ppm) |
Ni (ppm) |
S (%) |
S2- (%) |
|
|
EXES101800001 |
0.25 |
0.26 |
0.26 |
|
210 |
0.24 |
46 |
20 |
<0.02 |
<0.02 |
|
EXES101800002 |
0.50 |
0.53 |
0.52 |
|
580 |
0.36 |
32 |
55 |
0.24 |
0.20 |
|
EXES101800003 |
0.34 |
0.43 |
0.39 |
|
180 |
0.30 |
36 |
50 |
0.22 |
0.20 |
|
EXES101800004 |
0.55 |
0.68 |
0.62 |
|
570 |
0.48 |
34 |
70 |
0.20 |
0.18 |
|
EXES101800005 |
0.31 |
0.65 |
0.48 |
|
350 |
0.42 |
22 |
65 |
0.08 |
0.08 |
|
EXES101800006 |
2.71 |
1.53 |
2.12 |
|
380 |
0.60 |
36 |
55 |
0.40 |
0.40 |
|
EXES101800007 |
0.78 |
0.79 |
0.79 |
|
1360 |
0.42 |
38 |
55 |
0.32 |
0.32 |
|
EXES101800008 |
0.61 |
0.27 |
0.44 |
|
200 |
0.42 |
40 |
55 |
0.18 |
0.18 |
|
EXES101800009 |
0.63 |
0.29 |
0.46 |
|
110 |
0.81 |
34 |
60 |
0.24 |
0.22 |
|
EXES101800010 |
0.42 |
0.59 |
0.51 |
|
500 |
0.63 |
44 |
55 |
0.30 |
0.26 |
|
EXES101800011 |
4.00 |
2.03 |
3.02 |
|
560 |
0.30 |
32 |
65 |
0.26 |
0.24 |
|
EXES101800012 |
1.08 |
4.53 |
2.81 |
|
470 |
0.24 |
34 |
75 |
0.40 |
0.36 |
|
EXES101800013 |
0.46 |
0.53 |
0.50 |
0.60 |
150 |
0.60 |
36 |
90 |
0.16 |
0.16 |
|
EXES101800014 |
0.44 |
1.43 |
0.94 |
|
220 |
0.39 |
28 |
80 |
0.24 |
0.20 |
|
EXES101800015 |
0.52 |
0.49 |
0.51 |
0.89 |
380 |
0.66 |
32 |
80 |
0.42 |
0.40 |
|
EXES101800016 |
0.83 |
0.72 |
0.78 |
|
260 |
0.60 |
44 |
75 |
0.52 |
0.46 |
|
EXES101800017 |
1.71 |
2.79 |
2.25 |
|
2490 |
0.30 |
34 |
90 |
0.28 |
0.28 |
|
EXES101800018 |
0.43 |
0.54 |
0.49 |
0.49 |
1220 |
0.33 |
30 |
80 |
0.34 |
0.32 |
|
EXES101800019 |
0.52 |
1.17 |
0.85 |
|
350 |
1.50 |
66 |
95 |
0.40 |
0.38 |
|
EXES101800020 |
0.66 |
1.59 |
1.13 |
|
1380 |
0.42 |
46 |
70 |
0.28 |
0.26 |
|
EXES101800021 |
0.54 |
0.51 |
0.53 |
0.77 |
530 |
0.24 |
28 |
80 |
0.38 |
0.40 |
|
EXES101800022 |
0.57 |
1.07 |
0.82 |
|
1120 |
0.30 |
26 |
80 |
0.40 |
0.36 |
|
EXES101800023 |
0.85 |
0.84 |
0.85 |
|
260 |
0.60 |
36 |
80 |
0.36 |
0.36 |
|
EXES101800024 |
0.57 |
1.10 |
0.84 |
|
240 |
0.54 |
34 |
70 |
0.12 |
0.10 |
|
EXES101800025 |
0.67 |
0.55 |
0.61 |
|
660 |
0.57 |
38 |
65 |
0.30 |
0.28 |
|
Comb. Gravity Tails |
0.52 |
0.56 |
0.54 |
|
|
0.60 |
|
|
|
|
|
*AC CIL Tank 1 |
1335 |
1305 |
1320 |
|
|
|
|
|
|
|
|
*AC CIL Tank 2 |
747 |
720 |
734 |
|
|
|
|
|
|
|
|
*AC CIL Tank 3 |
498 |
480 |
489 |
|
|
|
|
|
|
|
Note: * AC - activated carbon; SFA - Screen fire assay
The following trends are noted:
-
The variation in the gold values is indicative of the presence of coarse gold
-
The levels of OC >0.5% are indicative of preg-robbing behaviour.
Characterisation testwork (A19437)
The results of this testwork are shown in Table 13-13.
|
Asanko Gold Inc. NI 43-101 Technical Report on Asanko Gold Mine, Ghana |
Table 13-13 Preg-robbing characterisation testwork on Esaase Composite head samples
|
Sample ID |
Test ID |
Organic carbon (%) |
Au assays (mg/ℓ) |
Preg-robbing index (%) |
|
|
Initial |
Final |
||||
|
EXES101800001 |
JR4305 |
0.24 |
10.0 |
9.61 |
3.42 |
|
EXES101800002 |
JR4306 |
0.36 |
10.0 |
7.97 |
19.9 |
|
EXES101800003 |
JR4307 |
0.30 |
10.0 |
9.17 |
7.84 |
|
EXES101800004 |
JR4308 |
0.48 |
10.0 |
6.52 |
34.47 |
|
EXES101800005 |
JR4309 |
0.42 |
10.0 |
7.18 |
27.84 |
|
EXES101800006 |
JR4310 |
0.60 |
10.0 |
6.16 |
38.09 |
|
EXES101800007 |
JR4311 |
0.42 |
10.0 |
7.82 |
21.41 |
|
EXES101800008 |
JR4312 |
0.42 |
10.0 |
8.37 |
15.88 |
|
EXES101800009 |
JR4313 |
0.81 |
10.0 |
5.83 |
41.41 |
|
EXES101800010 |
JR4314 |
0.63 |
10.0 |
6.58 |
33.87 |
|
EXES101800011 |
JR4430 |
0.30 |
10.0 |
8.98 |
9.75 |
|
EXES101800012 |
JR4431 |
0.24 |
10.0 |
9.24 |
7.14 |
|
EXES101800014 |
JR4434 |
0.39 |
10.0 |
8.60 |
13.57 |
|
EXES101800016 |
JR4439 |
0.60 |
10.0 |
4.23 |
57.49 |
|
EXES101800017 |
JR4432 |
0.30 |
10.0 |
8.89 |
10.65 |
|
EXES101800019 |
JR4435 |
1.50 |
10.0 |
0.135 |
98.64 |
|
EXES101800020 |
JR4433 |
0.42 |
10.0 |
9.10 |
8.54 |
|
EXES101800022 |
JR4438 |
0.30 |
10.0 |
8.41 |
15.48 |
|
EXES101800023 |
JR4436 |
0.60 |
10.0 |
5.59 |
43.82 |
|
EXES101800024 |
JR4437 |
0.54 |
10.0 |
6.43 |
35.38 |
|
EXES101800025 |
JR4440 |
0.57 |
10.0 |
5.85 |
41.21 |
|
Combined gravity tails |
JR4806 |
0.60 |
9.8 |
6.72 |
31.43 |
The above results indicate a direct linear relationship between the OC value and the PRI as depicted in Figure 13-8.
Figure 13-8 Asanko Gold metallurgical test Campaign 2 (A19437), organic carbon % versus PRI %
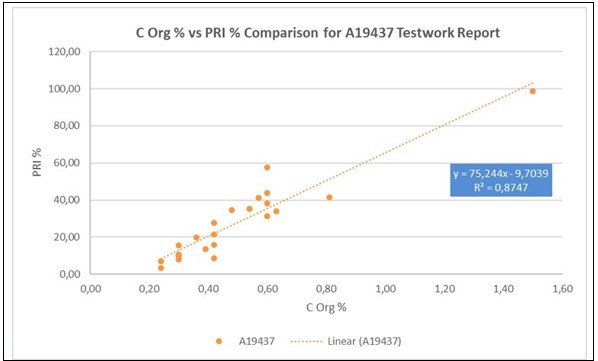
|
Asanko Gold Inc. NI 43-101 Technical Report on Asanko Gold Mine, Ghana |
Direct cyanidation testwork (A19437)
Initially sub samples of selected composites (EXES1018000-01, 02, 03, 05, 08, 09 and 10) were submitted to determine gold extraction via gravity recovery and direct cyanidation at a P80 of 106 µm.
These results are shown in Table 13-14.
Table 13-14 Gravity/direct cyanidation on Esaase Composite head samples
|
Sample ID* |
PRI (%) |
Organic carbon (%) |
Residue grade (Au g/t) |
Gravity gold (%) |
24 hr total extraction (%) |
Calcined head (Au g/t) |
Assay head (Au g/t) |
|
EXES101800001 |
3.42 |
0.24 |
0.10 |
40.35 |
68.83 |
0.30 |
0.26 /0.26 |
|
EXES101800002 |
19.90 |
0.36 |
0.32 |
45.23 |
48.38 |
0.61 |
0.50 /0.53 |
|
EXES101800003 |
7.84 |
0.30 |
0.20 |
38.84 |
70.01 |
0.67 |
0.34 /0.43 |
|
EXES101800005 |
27.84 |
0.42 |
0.36 |
31.98 |
35.01 |
0.55 |
0.31 /0.65 |
|
EXES101800008 |
15.88 |
0.42 |
0.18 |
48.35 |
55.14 |
0.40 |
0.61 /0.27 |
|
EXES101800009 |
41.41 |
0.81 |
0.33 |
50.28 |
52.51 |
0.69 |
0.63 /0.29 |
|
EXES101800010 |
33.87 |
0.63 |
0.38 |
38.68 |
41.27 |
0.64 |
0.42 /0.59 |
The following trends are noted:
-
Overall extraction was low to moderate for all samples, ranging from 35% to 70%. More importantly gravity gold recovery was relatively high, ranging from 32% to 50%. This indicated low direct cyanidation leach recoveries in the range 2.2% to 31.2%. Most samples showed a reduction in recovery as the leach progressed indicating that preg-robbing was occurring
-
A study of the results showed that in all cases the head grade values were below mine cut-off grades and as such the testwork results were of academic interest. At this stage, further testwork was stopped, and the JV partners elected to continue the testwork program with selected samples only, based on these having a minimum head grade value of 0.6 g/t
-
Following this initial work, sub samples of selected composites were submitted for gold extraction testwork under three different sets of leach conditions. The results are shown in the relevant sections pertaining to Campaign 3 (ALS19437).
Gravity recovery and CIL/Cyanidation testwork (A19437)
A total of 21 Esaase broken core samples were ground to a P80 of 106 µm, and then submitted for gravity/CIL and gravity/direct leach cyanidation testwork.
Gravity recovery was undertaken using a Knelson KC-MD3 concentrator. The concentrate was subjected to mercury amalgamation. The amalgam tails and gravity tails were combined into a single sample for direct cyanidation and CIL cyanidation, using fresh carbon and site loaded carbon, testwork.
The results are shown in Table 13-15.
|
Asanko Gold Inc. NI 43-101 Technical Report on Asanko Gold Mine, Ghana |
Table 13-15 Gravity/direct cyanidation/CIL cyanidation*
|
Sample ID |
Leach type |
PRI |
Organic |
Residue |
Gravity |
24 hr-total |
Calcined |
Assay |
|
EXES101800004 |
CIL site carbon |
34.47 |
0.48 |
0.24 |
39.54 |
77.22 |
1.03 |
0.55 /0.68 |
|
EXES101800004 |
CIL Fresh |
34.47 |
0.48 |
0.24 |
47.40 |
72.12 |
0.86 |
0.55 /0.68 |
|
EXES101800006 |
CIL site carbon |
38.09 |
0.60 |
0.52 |
18.79 |
76.54 |
2.23 |
2.71 /1.53 |
|
EXES101800006 |
CIL Fresh |
38.09 |
0.60 |
0.46 |
32.81 |
64.33 |
1.28 |
2.71 /1.53 |
|
EXES101800007 |
CIL site carbon |
21.41 |
0.42 |
0.22 |
33.10 |
94.09 |
3.64 |
0.78 /0.79 |
|
EXES101800007 |
CIL Fresh |
21.41 |
0.42 |
0.20 |
62.11 |
89.94 |
1.94 |
0.78 /0.79 |
|
EXES101800011 |
CIL site carbon |
9.75 |
0.30 |
0.46 |
62.87 |
82.23 |
2.56 |
4.00 /2.03 |
|
EXES101800011 |
CIL Fresh |
9.75 |
0.30 |
0.17 |
49.25 |
94.80 |
3.27 |
4.00 /2.03 |
|
EXES101800011 |
CIL site carbon |
9.75 |
0.30 |
0.21 |
63.30 |
91.94 |
2.54 |
4.00 /2.03 |
|
EXES101800012 |
CIL Fresh |
7.14 |
0.24 |
0.49 |
30.05 |
84.76 |
3.18 |
1.08 /4.53 |
|
EXES101800012 |
CIL site carbon |
7.14 |
0.24 |
0.15 |
26.78 |
95.87 |
3.57 |
1.08 /4.53 |
|
EXES101800012 |
CIL Fresh |
7.14 |
0.24 |
0.16 |
35.63 |
94.13 |
2.68 |
1.08 /4.53 |
|
EXES101800014 |
CIL site carbon |
13.57 |
0.39 |
0.29 |
44.94 |
48.99 |
0.57 |
0.44 /1.53 |
|
EXES101800014 |
CIL Fresh |
13.57 |
0.39 |
0.14 |
24.15 |
86.77 |
1.06 |
0.44 /1.43 |
|
EXES101800014 |
CIL site carbon |
13.57 |
0.39 |
0.15 |
42.37 |
75.12 |
0.60 |
0.44 /1.43 |
|
EXES101800016 |
CIL Fresh |
57.49 |
0.60 |
0.72 |
32.82 |
34.17 |
1.09 |
0.83 /0.72 |
|
EXES101800016 |
CIL site carbon |
57.49 |
0.60 |
0.34 |
28.16 |
73.54 |
1.27 |
0.83 /0.72 |
|
EXES101800016 |
CIL Fresh |
57.49 |
0.60 |
0.52 |
36.23 |
47.66 |
0.98 |
0.83 /0.72 |
|
EXES101800017 |
CIL site carbon |
10.65 |
0.30 |
0.61 |
62.84 |
79.85 |
3.00 |
1.71 /2.79 |
|
EXES101800017 |
CIL Fresh |
10.65 |
0.30 |
0.22 |
46.33 |
94.72 |
4.07 |
1.71 /2.79 |
|
EXES101800017 |
CIL site carbon |
10.65 |
0.30 |
0.28 |
63.49 |
90.75 |
2.97 |
1.71 /2.79 |
|
EXES101800019 |
CIL Fresh |
98.64 |
1.50 |
0.56 |
32.43 |
32.73 |
0.83 |
0.52 /1.17 |
|
EXES101800019 |
CIL site carbon |
98.64 |
1.50 |
0.96 |
22.00 |
22.20 |
1.23 |
0.52 /1.17 |
|
EXES101800019 |
CIL Fresh |
98.64 |
1.50 |
0.52 |
33.26 |
36.56 |
0.81 |
0.52 /1.17 |
|
EXES101800020 |
CIL site carbon |
8.54 |
0.42 |
0.34 |
47.54 |
56.14 |
0.78 |
0.66 /1.59 |
|
EXES101800020 |
CIL Fresh |
8.54 |
0.42 |
0.18 |
20.74 |
89.73 |
1.78 |
0.66 /1.59 |
|
EXES101800020 |
CIL site carbon |
8.54 |
0.42 |
0.15 |
45.75 |
82.00 |
0.81 |
0.66 /1.59 |
|
EXES101800022 |
CIL Fresh |
15.48 |
0.30 |
0.38 |
35.83 |
46.49 |
0.71 |
0.57 /1.07 |
|
EXES101800022 |
CIL site carbon |
15.48 |
0.30 |
0.15 |
19.09 |
89.12 |
1.33 |
0.57 /1.07 |
|
EXES101800022 |
CIL Fresh |
15.48 |
0.30 |
0.15 |
42.89 |
75.56 |
0.59 |
0.57 /1.07 |
|
EXES101800023 |
CIL site carbon |
43.82 |
0.60 |
0.66 |
40.77 |
41.70 |
1.12 |
0.85 /0.84 |
|
EXES101800023 |
CIL Fresh |
43.82 |
0.60 |
0.55 |
28.58 |
65.99 |
1.60 |
0.85 /0.84 |
|
EXES101800023 |
CIL site carbon |
43.82 |
0.60 |
0.60 |
35.95 |
52.90 |
1.27 |
0.85 /0.84 |
|
EXES101800024 |
CIL Fresh |
35.38 |
0.54 |
0.18 |
41.88 |
42.68 |
0.31 |
0.57 /1.10 |
|
EXES101800024 |
CIL site carbon |
35.38 |
0.54 |
0.26 |
32.80 |
35.14 |
0.40 |
0.57 /1.10 |
|
EXES101800024 |
CIL Fresh |
35.38 |
0.54 |
0.17 |
39.62 |
48.78 |
0.33 |
0.57 /1.10 |
|
EXES101800025 |
CIL site carbon |
41.21 |
0.57 |
0.48 |
43.69 |
44.88 |
0.86 |
0.67 /0.55 |
|
EXES101800025 |
CIL Fresh |
41.21 |
0.57 |
0.52 |
32.73 |
55.22 |
1.15 |
0.67 /0.55 |
|
EXES101800025 |
CIL site carbon |
41.21 |
0.57 |
0.32 |
47.77 |
60.03 |
0.79 |
0.67 /0.55 |
Note: * Using plant and fresh carbon on Esaase Composite head samples
The following trends are noted:
-
In the majority of cases, during leach work conducted using plant loaded carbon, metallurgical accounting was poor
-
In almost all cases, gold extraction improved in the presence of fresh activated carbon in the leach. Total extraction for the direct leach series averaged 54.1%, compared to 70.1% for the fresh carbon CIL series.
|
Asanko Gold Inc. NI 43-101 Technical Report on Asanko Gold Mine, Ghana |
Investigative direct cyanidation testwork to mitigate preg-robbing effect (A19437)
Following the above tests, a bulk composite was prepared by combining sub-samples of gravity tailings for the following composites: EXES1018000-06, 16, 23, 24, and 25.
Sub-samples of the composite were submitted for cyanide leach testwork, to determine the impact of various parameters on leach performance to mitigate the effect of preg-robbing. The results are shown in Table 13-16:
-
Under direct leach conditions, gold extraction increased after pre-conditioning for 4 hours with 2 kg/t of kerosene. This resulted in a leach residue grade 0.31 g/t Au approaching that of the intensive leach test (JR4808)
-
Under direct leach conditions, the highest gold extraction was achieved under intensive leach conditions (strong cyanide, LeachWELL, and caustic) resulting in a 0.26 g/t Au residue grade.
Table 13-16 Investigative scouting testwork on gravity/direct cyanidation options at P80 106 µm*
|
Variations |
Test no. |
Percent gold extraction, at set hours (% Au) |
Au grade |
Consumption (kg/t) |
|||||
|
2hr |
4hr |
8hr |
24hr |
Calcined head |
Leach residue |
NaCN |
Ca(OH)2 |
||
|
Baseline |
4807 |
3.93 |
3.93 |
3.19 |
2.50 |
0.64 |
0.62 |
0.04 |
0.54 |
|
LeachWELL/Int. 30% solids |
4808 |
NA |
NA |
NA |
57.38 |
0.61 |
0.26 |
117 |
16.33 (NaOH) |
|
NaCN 0.05% |
4812 |
5.08 |
4.10 |
3.14 |
1.35 |
0.49 |
0.49 |
0.07 |
0.53 |
|
NaCN 0.1% |
4813 |
4.41 |
3.55 |
3.55 |
2.00 |
0.57 |
0.56 |
0.12 |
0.44 |
|
NaCN 0.2% |
4814 |
4.19 |
3.38 |
3.38 |
2.64 |
0.60 |
0.58 |
0.22 |
0.37 |
|
NaCN 0.05%, pH 12.5, O2 >20 mg/ℓ |
4815 |
6.90 |
5.94 |
5.02 |
4.15 |
0.51 |
0.49 |
0.07 |
87.86 |
|
NaCN 0.05%; O2 >20 mg/ℓ |
4816 |
3.90 |
3.14 |
3.14 |
2.45 |
0.64 |
0.63 |
0.15 |
0.26 |
|
Kerosene 2 kg/t, pre-conditioned 4 hrs |
4817 |
54.26 |
53.41 |
51.77 |
44.04 |
0.57 |
0.31 |
0.06 |
0.48 |
|
Sodium lauryl sulphate 200 g/t, pre-conditioned |
4818 |
40.46 |
36.33 |
30.33 |
20.12 |
0.47 |
0.37 |
0.009 |
0.43 |
|
Heated vat |
4819 |
7.56 |
5.12 |
6.30 |
5.19 |
0.40 |
0.38 |
0.27 |
1.08 |
Note: * Based on combined gravity tails composite
Investigative CIL testwork to mitigate preg-robbing effect (A19437)
Further investigative testwork using higher carbon concentrations and a high level of added kerosene was undertaken. The results are shown in Table 13-17.
Table 13-17 Investigative scouting testwork on gravity/CIL cyanidation at P80 106 µm grind size*
|
Variations |
Test no. |
Percent gold extraction, at set hours (% Au) |
Au grade (g/t) |
Consumption |
|||||
|
2 |
4 |
8 |
24 |
Calcined head |
Leach residue |
NaCN |
Ca(OH)2 |
||
|
10 g/ℓ carbon |
4809 |
12.96 |
14.81 |
12.96 |
30.56 |
0.54 |
0.38 |
0.30 |
0.62 |
|
50 g/ℓ carbon |
4810 |
33.33 |
31.48 |
46.30 |
50.93 |
0.54 |
0.27 |
0.50 |
0.53 |
|
P80 45 µm, 50 g/ℓ carbon |
4811 |
50.00 |
51.85 |
61.11 |
74.07 |
0.54 |
0.14 |
0.57 |
0.55 |
|
Kerosene 2 kg/t, pre-conditioned 10 g/ℓ carbon |
4953 |
62.96 |
74.07 |
77.78 |
80.56 |
0.54 |
0.11 |
0.27 |
0.43 |
|
Kerosene 2 kg/t, pre-conditioned 50 g/ℓ carbon |
4954 |
59.26 |
75.93 |
79.63 |
80.37 |
0.54 |
0.11 |
0.51 |
0.52 |
Note: * Based on combined gravity tails composite
|
Asanko Gold Inc. NI 43-101 Technical Report on Asanko Gold Mine, Ghana |
A four-hour kerosene pre-conditioning stage resulted in the highest CIL extraction of 80.5% and a residue grade of 0.11 g/t Au, with no benefit from a higher carbon concentration.
ALS testwork: Campaign 4 (ALS Report A19681, February 2019)
Campaign 4 comprised 20 core samples (EXES101900001-EXES 101900020). The core samples were control crushed to -3.35 mm and split into the various sub samples for head assays, grind establishment testwork, gravity separation/direct cyanidation/CIL cyanidation testwork and preg-robbing characterization testwork.
The test program is shown in Figure 13-9.
|
Asanko Gold Inc. NI 43-101 Technical Report on Asanko Gold Mine, Ghana |
Figure 13-9 Asanko Gold metallurgical test program flowsheet: Campaign 4 ALS A19681
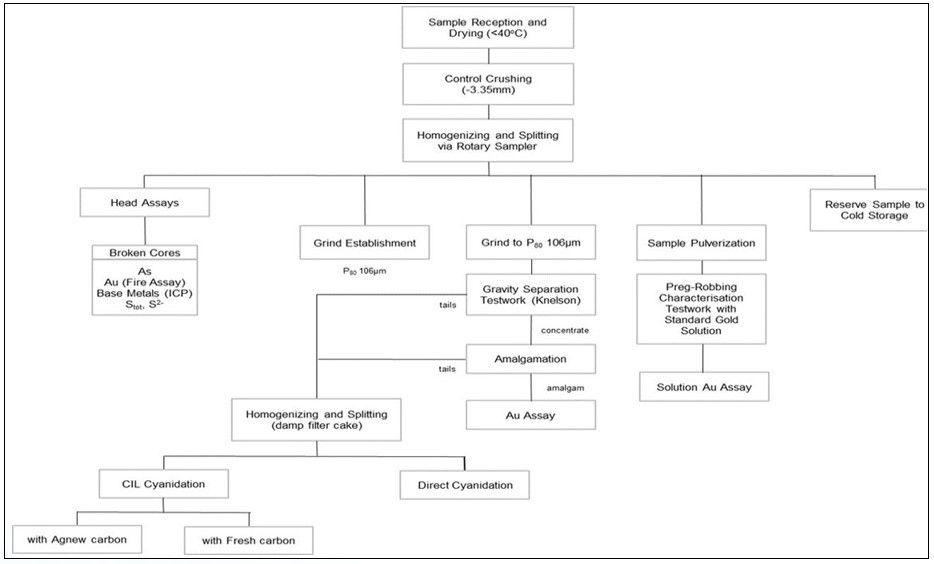
|
Asanko Gold Inc. NI 43-101 Technical Report on Asanko Gold Mine, Ghana |
Head assays (A19681)
The samples were subjected to fire assay for gold and a multi element ICP scan for base metals and other elements; with summary results shown in Table 13-18.
Table 13-18 Head assays summary on Esaase broken core (A19681)
|
Sample ID (Asanko Gold) |
Sample ID (ALS) |
AGM Esaase samples head assay summary |
||||
|
Au |
As |
Cu |
C org |
S2- |
||
|
KEDD162 |
EXES101900001 |
0.68 /0.57 |
210 |
32 |
0.39 |
0.14 |
|
KEDD6032 |
EXES101900002 |
2.58 /1.95 |
5990 |
22 |
0.42 |
0.48 |
|
KEDD582 |
EXES101900003 |
1.86 /1.28 |
650 |
34 |
0.6 |
0.3 |
|
KEDD509 |
EXES101900004 |
88.7 /92.3 |
1000 |
56 |
0.27 |
0.24 |
|
KEDD863 |
EXES101900005 |
0.92 /1.34 |
1240 |
26 |
0.39 |
0.52 |
|
KEDD862 |
EXES101900006 |
1.83 /3.47 |
210 |
24 |
0.36 |
0.28 |
|
KEDD960 |
EXES101900007 |
1.98 /2.82 |
370 |
28 |
0.3 |
0.2 |
|
KEDD302 |
EXES101900008 |
3.72 / 2.12 |
590 |
34 |
0.33 |
0.32 |
|
KEDD537 |
EXES101900009 |
2.41 /5.55 |
740 |
36 |
0.54 |
0.3 |
|
KEDD821 |
EXES101900010 |
1.55 /1.68 |
920 |
48 |
0.63 |
0.34 |
|
KEDD334 |
EXES101900011 |
0.66 / 0.75 |
870 |
44 |
0.3 |
0.32 |
|
KEDD822 |
EXES101900012 |
7.47 /6.68 |
580 |
32 |
0.63 |
0.5 |
|
KEDD864 |
EXES101900013 |
1.29 /1.16 |
1760 |
46 |
0.75 |
0.42 |
|
KEDD832 |
EXES101900014 |
1.22 /1.19 |
1810 |
34 |
0.42 |
0.42 |
|
KEDD784 |
EXES101900015 |
0.81 /1.14 |
1140 |
36 |
0.3 |
0.32 |
|
KEDD785 |
EXES101900016 |
2.55 /2.88 |
650 |
32 |
0.57 |
0.34 |
|
KEDD480 |
EXES101900017 |
1.08 /1.08 |
4630 |
50 |
0.48 |
0.32 |
|
KEDD488 |
EXES101900018 |
1.02 /0.93 |
2820 |
38 |
0.51 |
0.24 |
|
KEDD753 |
EXES101900019 |
8.22 /5.63 |
3720 |
62 |
0.48 |
0.48 |
|
KEDD913 |
EXES101900020 |
0.41 /0.53 |
2510 |
28 |
0.33 |
0.16 |
The following trends are noted:
-
Variation in Au head grade assays are indicative of coarse gold
-
Levels of OC range from 0.3% to 0.75%.
Gravity recovery and CIL/cyanidation testwork (A19681)
The 20 Esaase broken core samples, ground to a P80 of 106 µm, were submitted for gravity/CIL and gravity/direct leach cyanidation testwork. The leach tests were completed on the combined gravity tails/amalgamation tails.
The results are shown in Table 13-19, Table 13-20 and Table 13-21. The following trends are noted:
-
Assay values of the Agnew "barren carbon" indicated this to have been mislabelled as the Au value was 510 ppm. The JV partners elected to continue with this carbon in the testwork. However, the JV partners agreed to the use of the calculated head grade from the corresponding direct leach test to minimize the impact of assay variation due to use of the loaded carbon values
-
Total average extraction for direct leach tests was 57.3%; for fresh carbon CIL tests 80.4%; for barren carbon CIL tests 74.6%.
|
Asanko Gold Inc. NI 43-101 Technical Report on Asanko Gold Mine, Ghana |
Table 13-19 Gravity/direct cyanidation/CIL cyanidation on Esaase broken core
|
Sample ID (EXES19000) |
Test no. |
Leach type |
Gravity gold (%) |
4 hr extraction (%) |
12 hr extraction (%) |
16 hr extraction (%) |
24 hr extraction (%) |
Calcined grade (Au g/t) |
Residue grade |
NaCN consumption (kg/t) |
Lime consumption (kg/t) |
|
1 |
JR4877 |
Direct |
64.75 |
67.92 |
67.12 |
67.12 |
66.39 |
1.74 |
0.59 |
0.07 |
0.53 |
|
1 |
JR4861 |
CIL Fresh C |
67.86 |
77.72 |
82.54 |
83.74 |
84.65 |
1.66 |
0.26 |
0.23 |
0.54 |
|
1 |
JR4845 |
CIL Site/Barren C |
64.77 |
74.71 |
76.44 |
77.59 |
80.46 |
1.74 |
0.34 |
0.18 |
0.52 |
|
2 |
JR4878 |
Direct |
30.03 |
57.23 |
54.17 |
53.30 |
51.33 |
1.51 |
0.74 |
0.09 |
0.40 |
|
2 |
JR4862 |
CIL Fresh C |
30.13 |
72.10 |
79.41 |
79.41 |
78.41 |
1.51 |
0.33 |
0.23 |
0.49 |
|
2 |
JR4846 |
CIL Site/Barren C |
30.03 |
68.21 |
75.50 |
76.82 |
78.15 |
1.51 |
0.33 |
0.17 |
0.66 |
|
3 |
JR4879 |
Direct |
42.97 |
44.19 |
43.91 |
43.91 |
43.91 |
1.66 |
0.93 |
0.07 |
0.64 |
|
3 |
JR4863 |
CIL Fresh C |
45.87 |
49.79 |
58.80 |
60.09 |
64.27 |
1.55 |
0.56 |
0.22 |
0.63 |
|
3 |
JR4847 |
CIL Site/Barren C |
42.92 |
57.23 |
55.42 |
58.43 |
56.93 |
1.66 |
0.72 |
0.19 |
0.72 |
|
4 |
JR4880 |
Direct |
34.03 |
46.69 |
48.88 |
47.14 |
45.13 |
1.27 |
0.70 |
0.11 |
0.59 |
|
4 |
JR4864 |
CIL Fresh C |
35.65 |
66.91 |
74.36 |
73.53 |
74.36 |
1.21 |
0.31 |
0.21 |
0.61 |
|
4 |
JR4848 |
CIL Site/Barren C |
33.94 |
66.14 |
72.44 |
73.23 |
70.87 |
1.27 |
0.37 |
0.20 |
0.71 |
|
5 |
JR4881 |
Direct |
52.07 |
61.74 |
62.38 |
61.77 |
61.77 |
1.45 |
0.56 |
0.07 |
0.53 |
|
5 |
JR4865 |
CIL Fresh C |
58.03 |
80.81 |
86.18 |
86.95 |
87.72 |
1.30 |
0.16 |
0.23 |
0.62 |
|
5 |
JR4849 |
CIL Site/Barren C |
52.14 |
82.07 |
84.83 |
84.14 |
81.72 |
1.45 |
0.27 |
0.17 |
0.72 |
|
6 |
JR4882 |
Direct |
48.93 |
78.90 |
79.57 |
78.19 |
77.30 |
2.86 |
0.65 |
0.05 |
0.43 |
|
6 |
JR4866 |
CIL Fresh C |
45.98 |
89.83 |
93.76 |
93.76 |
94.20 |
3.05 |
0.18 |
0.19 |
0.53 |
|
6 |
JR4850 |
CIL Site/Barren C |
48.99 |
87.76 |
91.96 |
91.26 |
92.66 |
2.86 |
0.21 |
0.17 |
0.50 |
|
7 |
JR4883 |
Direct |
72.96 |
83.29 |
84.34 |
83.79 |
82.75 |
4.06 |
0.70 |
0.07 |
0.50 |
|
7 |
JR4867 |
CIL Fresh C |
87.10 |
90.29 |
91.47 |
92.06 |
93.38 |
3.40 |
0.23 |
0.22 |
0.72 |
|
7 |
JR4851 |
CIL Site/Barren C |
72.91 |
92.61 |
92.86 |
93.60 |
92.61 |
4.06 |
0.30 |
0.17 |
0.61 |
|
8 |
JR4884 |
Direct |
54.49 |
55.10 |
55.66 |
55.14 |
54.89 |
0.84 |
0.38 |
0.07 |
0.51 |
|
8 |
JR4868 |
CIL Fresh C |
27.65 |
74.70 |
84.34 |
86.75 |
87.65 |
1.66 |
0.21 |
0.25 |
0.60 |
|
8 |
JR4852 |
CIL Site/Barren C |
54.64 |
64.29 |
54.76 |
58.33 |
56.55 |
0.84 |
0.37 |
0.17 |
0.70 |
|
9 |
JR4885 |
Direct |
30.39 |
33.09 |
32.75 |
32.42 |
32.42 |
1.31 |
0.89 |
0.11 |
0.53 |
|
9 |
JR4869 |
CIL Fresh C |
31.43 |
48.67 |
60.52 |
61.31 |
69.20 |
1.27 |
0.39 |
0.30 |
0.64 |
|
9 |
JR4853 |
CIL Site/Barren C |
30.38 |
49.62 |
58.02 |
56.49 |
56.11 |
1.31 |
0.58 |
0.19 |
0.62 |
|
10 |
JR4886 |
Direct |
25.30 |
69.89 |
67.80 |
67.30 |
64.42 |
0.89 |
0.32 |
0.09 |
0.51 |
|
10 |
JR4870 |
CIL Fresh C |
25.08 |
82.08 |
86.56 |
85.44 |
88.80 |
0.89 |
0.10 |
0.28 |
0.52 |
|
10 |
JR4854 |
CIL Site/Barren C |
25.17 |
75.28 |
83.15 |
82.02 |
84.83 |
0.89 |
0.14 |
0.19 |
0.21 |
|
Asanko Gold Inc. NI 43-101 Technical Report on Asanko Gold Mine, Ghana |
Table 13-20 Gravity/direct cyanidation/CIL cyanidation on Esaase broken core (continued)
|
Sample ID (EXES19000) |
Test no. |
Leach type |
Gravity gold (%) |
4 hr extraction (%) |
12 hr extraction (%) |
16 hr extraction (%) |
24 hr extraction (%) |
Calcined grade (Au g/t) |
Residue grade (Au g/t) |
NaCN consumption (kg/t) |
Lime consumption (kg/t) |
|
11 |
JR4887 |
Direct |
53.90 |
75.96 |
81.96 |
82.08 |
81.61 |
7.18 |
1.32 |
0.14 |
0.63 |
|
11 |
JR4871 |
CIL Fresh C |
52.40 |
93.50 |
94.45 |
94.58 |
94.58 |
7.38 |
0.40 |
0.28 |
0.71 |
|
11 |
JR4855 |
CIL Site/Barren C |
53.89 |
93.04 |
94.43 |
94.99 |
95.96 |
7.18 |
0.29 |
0.19 |
0.78 |
|
12 |
JR4888 |
Direct |
21.36 |
24.05 |
24.06 |
23.73 |
23.73 |
1.31 |
1.00 |
0.11 |
0.80 |
|
12 |
JR4872 |
CIL Fresh C |
23.03 |
41.61 |
49.84 |
53.95 |
57.24 |
1.22 |
0.52 |
0.28 |
0.87 |
|
12 |
JR4856 |
CIL Site/Barren C |
21.37 |
52.67 |
45.04 |
51.15 |
54.58 |
1.31 |
0.60 |
0.22 |
0.84 |
|
13 |
JR4889 |
Direct |
22.65 |
53.01 |
52.12 |
50.80 |
49.11 |
1.00 |
0.51 |
0.16 |
1.14 |
|
13 |
JR4873 |
CIL Fresh C |
19.69 |
72.25 |
78.32 |
80.05 |
80.05 |
1.15 |
0.23 |
0.32 |
0.96 |
|
13 |
JR4857 |
CIL Site/Barren C |
22.70 |
63.00 |
69.00 |
71.00 |
71.50 |
1.00 |
0.29 |
0.22 |
1.26 |
|
14 |
JR4890 |
Direct |
26.97 |
70.34 |
72.03 |
72.03 |
72.41 |
1.12 |
0.31 |
0.12 |
0.68 |
|
14 |
JR4874 |
CIL Fresh C |
26.88 |
81.37 |
84.92 |
88.47 |
89.80 |
1.13 |
0.12 |
0.28 |
0.68 |
|
14 |
JR4858 |
CIL Site/Barren C |
27.05 |
81.25 |
85.71 |
83.93 |
88.39 |
1.12 |
0.13 |
0.19 |
0.84 |
|
15 |
JR4891 |
Direct |
39.93 |
40.93 |
40.70 |
40.70 |
40.48 |
1.99 |
1.19 |
0.12 |
0.81 |
|
15 |
JR4875 |
CIL Fresh C |
41.27 |
52.76 |
57.43 |
60.54 |
63.40 |
1.93 |
0.71 |
0.28 |
0.74 |
|
15 |
JR4859 |
CIL Site/Barren C |
39.95 |
39.70 |
58.79 |
56.78 |
55.53 |
1.99 |
0.89 |
0.19 |
0.83 |
|
16 |
JR4892 |
Direct |
41.57 |
62.98 |
62.61 |
60.82 |
59.45 |
1.23 |
0.50 |
0.09 |
0.47 |
|
16 |
JR4876 |
CIL Fresh C |
42.26 |
81.86 |
86.81 |
88.45 |
88.45 |
1.21 |
0.14 |
0.29 |
0.49 |
|
16 |
JR4860 |
CIL Site/Barren C |
41.67 |
78.86 |
83.74 |
83.74 |
86.18 |
1.23 |
0.17 |
0.17 |
0.59 |
|
17 |
JR5050 |
Direct |
58.15 |
81.99 |
81.60 |
81.80 |
81.61 |
2.28 |
0.42 |
0.06 |
0.53 |
|
17 |
JR5046 |
CIL Fresh C |
60.20 |
90.93 |
92.75 |
92.75 |
91.84 |
2.21 |
0.18 |
0.21 |
0.60 |
|
17 |
JR5042 |
CIL Site/Barren C |
58.25 |
89.04 |
90.35 |
91.67 |
91.08 |
2.28 |
0.20 |
0.19 |
0.62 |
|
18 |
JR5048 |
Direct |
27.73 |
28.88 |
28.08 |
28.08 |
28.08 |
0.87 |
0.63 |
0.10 |
0.58 |
|
18 |
JR5044 |
CIL Fresh C |
28.46 |
32.70 |
37.42 |
40.96 |
46.28 |
0.85 |
0.46 |
0.22 |
0.57 |
|
18 |
JR5040 |
CIL Site/Barren C |
27.70 |
35.63 |
31.03 |
29.89 |
33.72 |
0.87 |
0.58 |
0.19 |
0.62 |
|
19 |
JR5051 |
Direct |
66.92 |
69.94 |
69.21 |
68.79 |
68.79 |
3.16 |
0.99 |
0.10 |
0.61 |
|
19 |
JR5047 |
CIL Fresh C |
62.60 |
78.66 |
83.10 |
83.70 |
86.81 |
3.37 |
0.45 |
0.19 |
0.59 |
|
19 |
JR5043 |
CIL Site/Barren C |
66.84 |
75.32 |
78.80 |
78.16 |
79.85 |
3.16 |
0.64 |
0.19 |
0.59 |
|
20 |
JR5049 |
Direct |
49.00 |
60.76 |
58.47 |
58.15 |
61.18 |
1.40 |
0.55 |
0.12 |
0.45 |
|
20 |
JR5045 |
CIL Fresh C |
56.55 |
81.92 |
83.56 |
84.38 |
87.67 |
1.22 |
0.15 |
0.19 |
0.47 |
|
20 |
JR5041 |
CIL Site/Barren C |
49.14 |
84.29 |
86.43 |
85.71 |
85.24 |
1.40 |
0.21 |
0.20 |
0.49 |
|
Asanko Gold Inc. NI 43-101 Technical Report on Asanko Gold Mine, Ghana |
Preg-robbing characterisation testwork (A19681)
All 20 samples were submitted for preg-robbing characteristic testwork. The results of this testwork are summarized in Table 13-21. The results below indicate a direct linear relationship between the OC value and the PRI, as shown in Figure 13-10.
Table 13-21 Preg-robbing characterisation on Esaase Composite head samples
|
Sample ID |
Test ID |
Organic carbon (%) |
Preg-robbing Index (%) |
|
EXES101900001 |
JR4790 |
0.39 |
32.45 |
|
EXES101900002 |
JR4791 |
0.42 |
21.33 |
|
EXES101900003 |
JR4792 |
0.60 |
53.67 |
|
EXES101900004 |
JR4793 |
0.27 |
13.88 |
|
EXES101900005 |
JR4794 |
0.39 |
25.51 |
|
EXES101900006 |
JR4795 |
0.36 |
23.67 |
|
EXES101900007 |
JR4796 |
0.30 |
18.27 |
|
EXES101900008 |
JR4797 |
0.33 |
20.51 |
|
EXES101900009 |
JR4798 |
0.54 |
38.27 |
|
EXES101900010 |
JR4799 |
0.63 |
45.92 |
|
EXES101900011 |
JR4800 |
0.30 |
11.53 |
|
EXES101900012 |
JR4801 |
0.63 |
16.94 |
|
EXES101900013 |
JR4802 |
0.75 |
55.61 |
|
EXES101900014 |
JR4803 |
0.42 |
21.84 |
|
EXES101900015 |
JR4804 |
0.30 |
13.16 |
|
EXES101900016 |
JR4805 |
0.57 |
78.27 |
|
EXES101900017 |
JR4806 |
0.48 |
11.79 |
|
EXES101900018 |
JR4804 |
0.48 |
70.74 |
|
EXES101900019 |
JR4805 |
0.33 |
48.89 |
|
EXES101900020 |
JR4806 |
0.51 |
25.47 |
Figure 13-10 Asanko Gold metallurgical test Campaign 4 (A19681), organic carbon % versus PRI %
|
|

|
Asanko Gold Inc. NI 43-101 Technical Report on Asanko Gold Mine, Ghana |
Investigative leach testwork (A19681)
Representative samples of KEDD582 (EXES101900003), KEDD785 (EXES101900016) and KEDD821 (101900010) were blended to generate the gravity tails composite sample, sub-samples of which were required for CIL leach testwork at a P80 of 106 µm. The test procedure followed the standard but included varying concentrations of diesel fuel added at the start of a 1-hour pre-conditioning phase. These tests were designed to determine if the OC content of the sample could be successfully blinded in order to reduce the preg-robbing characteristic of the ore.
In addition, sub samples of the Fresh feed of KEDD582, KEDD 785 and KEDD821 were combined to create a "Combined Fresh Composite". This composite was then submitted for gravity /CIL leach testwork at grind sizes of P80 75 µm and P80 45 µm. The results are shown in Table 13-22.
Table 13-22 Investigative leach testwork on Esaase composite gravity tails samples
|
Variation |
Test no. |
Au extraction percent, at select hours (%) |
Au grade (g/t) |
Consumption (kg/t) |
||||||
|
Gravity (%) |
2 hr |
4 hr |
8 hr |
24 hr |
Calcined head |
Leach residue |
NaCN |
Lime |
||
|
Combined Fresh composite |
||||||||||
|
P80 75 µm |
5105 |
39.88 |
44.01 |
53.12 |
51.17 |
53.77 |
1.54 |
0.71 |
0.26 |
0.68 |
|
P80 45 µm |
5106 |
32.00 |
43.48 |
44.13 |
48.03 |
49.98 |
1.54 |
0.77 |
0.26 |
0.76 |
|
Gravity tails composite (P80 106 µm) |
||||||||||
|
500 g/t diesel |
5102 |
- |
58.82 |
63.73 |
70.59 |
75.49 |
1.02 |
0.25 |
0.32 |
0.60 |
|
250 g/t diesel |
5103 |
- |
44.12 |
50.98 |
56.86 |
65.36 |
1.02 |
0.35 |
0.32 |
0.54 |
|
75 g/t diesel |
5104 |
- |
38.24 |
40.20 |
43.14 |
53.92 |
1.02 |
0.47 |
0.30 |
0.58 |
The following trends are noted:
-
For the combined Fresh composite, no benefit was obtained when grinding finer; possibly due to the finer grinding resulting in enhanced activity of the preg-robbing carbon
-
In agreement with Asanko Gold/Gold Fields. The head grade for the gravity tails composite was calculated from direct leach tests of the constituent samples
-
The application of a pre-conditioning stage with diesel showed a correlation between dosage rate and leach performance.
Characterisation of Esaase samples using Raman spectroscopy: Campaign 5 (Curtin University Report: April 2019)
The 39 pulverized samples, originating from ALS Test Campaign 2 (A19208), were received at The Gold Technology Group (GTG) at Curtain University. These samples had been subjected to comprehensive assays including gold, total carbon, and OC (graphitic carbon) at ALS. In addition, PRI testing had also been carried out at ALS.
The carbonaceous material within each sample was characterized using Raman spectroscopy. The results are shown in Table 13-23.
|
Asanko Gold Inc. NI 43-101 Technical Report on Asanko Gold Mine, Ghana |
Table 13-23 Raman ratio, analysis and PRI results for Esaase samples
|
Sample ID |
Raman ratio |
Au (g/t) |
Total carbon (%) |
Organic carbon (%) |
PRI (%) |
|
EXES06185443 |
0.49 |
0.02 |
0.63 |
0.36 |
30.58 |
|
EXES06185444 |
0.51 |
0.22 |
0.93 |
0.54 |
34.00 |
|
EXES06185445 |
0.51 |
0.49 |
2.10 |
0.24 |
16.92 |
|
EXES06185446 |
0.52 |
<0.02 |
0.84 |
0.45 |
33.83 |
|
EXES06185447 |
0.67 |
0.03 |
1.17 |
0.66 |
54.25 |
|
EXES06185448 |
0.55 |
0.30 |
0.72 |
0.36 |
24.67 |
|
EXES06185449 |
0.65 |
0.14 |
0.60 |
0.21 |
10.83 |
|
EXES06185450 |
0.55 |
0.58 |
1.11 |
0.24 |
22.08 |
|
EXES06185451 |
0.52 |
0.55 |
0.90 |
0.48 |
32.75 |
|
EXES06185452 |
0.44 |
0.09 |
2.61 |
0.15 |
7.50 |
|
EXES06185453 |
0.56 |
<0.02 |
1.23 |
0.57 |
41.74 |
|
EXES06185454 |
0.54 |
1.24 |
2.16 |
1.20 |
66.75 |
|
EXES06185455 |
0.61 |
0.42 |
1.35 |
0.51 |
57.50 |
|
EXES06185456 |
0.77 |
<0.02 |
1.29 |
0.06 |
1.67 |
|
EXES06185457 |
0.43 |
0.16 |
1.65 |
0.24 |
15.83 |
|
EXES06185458 |
0.48 |
1.55 |
2.04 |
0.66 |
55.75 |
|
EXES06185459 |
0.51 |
0.35 |
1.53 |
0.57 |
38.25 |
|
EXES06185460 |
0.59 |
0.22 |
1.80 |
0.42 |
34.58 |
|
EXES06185461 |
0.64 |
0.18 |
1.59 |
0.93 |
57.83 |
|
EXES06185462 |
0.53 |
0.04 |
0.72 |
0.39 |
31.92 |
|
EXES06185463 |
0.53 |
0.03 |
1.29 |
0.69 |
59.06 |
|
EXES06185464 |
0.51 |
<0.02 |
1.05 |
0.21 |
15.75 |
|
EXES06185465 |
0.51 |
<0.02 |
0.99 |
0.48 |
30.55 |
|
EXES06185466 |
0.60 |
0.51 |
0.96 |
0.09 |
7.09 |
|
EXES06185467 |
0.58 |
0.12 |
0.96 |
0.84 |
67.72 |
|
EXES06185468 |
0.65 |
1.21 |
0.75 |
0.12 |
7.09 |
|
EXES06185469 |
0.51 |
<0.05 |
3.00 |
1.23 |
70.16 |
|
EXES06185470 |
0.55 |
7.79 |
2.40 |
0.69 |
60.87 |
|
EXES06185471 |
0.45 |
1.25 |
1.86 |
0.09 |
3.94 |
|
EXES06185472 |
0.53 |
1.39 |
2.25 |
0.78 |
66.93 |
|
EXES06185473 |
0.58 |
1.49 |
1.14 |
0.69 |
33.50 |
|
EXES06185474 |
0.74 |
0.06 |
1.47 |
0.45 |
25.45 |
|
EXES06185475 |
0.74 |
<0.02 |
0.87 |
0.36 |
17.07 |
|
EXES06185476 |
0.00 |
<0.02 |
<0.03 |
0.00 |
0.81 |
|
EXES06185477 |
0.55 |
1.84 |
<0.03 |
0.00 |
0.00 |
|
EXES06185478 |
0.74 |
<0.05 |
4.14 |
3.99 |
72.03 |
|
EXES06185480 |
0.64 |
0.05 |
0.09 |
0.09 |
1.63 |
|
EXES06185481 |
0.57 |
0.74 |
1.23 |
0.24 |
22.36 |
|
EXES06185482 |
0.61 |
0.48 |
1.77 |
0.84 |
82.68 |
The following trends are noted:
-
The Raman ratio results ranged from 0.43 to 0.77 with an average of 0.56
-
Based on the Raman ratio results, the submitted Esaase samples would be classified as low to moderately preg-robbing
-
It should be noted that Raman spectroscopy gives an indication of the preg-robbing behaviour of the carbon in the sample but not the concentration of the carbon (which will affect the overall preg-robbing capacity of the ore).
|
Asanko Gold Inc. NI 43-101 Technical Report on Asanko Gold Mine, Ghana |
Figure 13-11 and Figure 13-12 show a scatter of results without any correlation. However, based on published past Raman experience, the graph shows that generally, the higher the graphitic (organic) carbon content, the higher the Raman ratio.
Figure 13-11 Raman ratio as a function of organic carbon content for Esaase samples
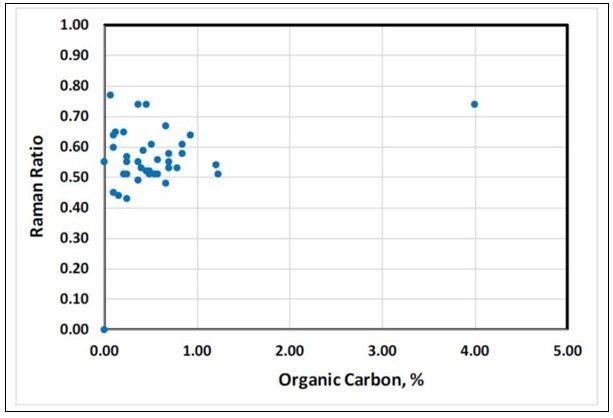
Figure 13-12 Raman ratio as a function of preg-robbing index (PRI) for Esaase samples

|
Asanko Gold Inc. NI 43-101 Technical Report on Asanko Gold Mine, Ghana |
Over several years, the GTG has built up a database of Raman ratio and preg-robbing value (PRV) data from operations with preg-robbing ores. The ores range from mildly preg-robbing to highly preg-robbing and the data has been used to plot the Raman calibration line. Table 13-24 presents the averaged data, including the calculated PRV, for the Esaase samples compared to a selection of ore types from the GTG preg-robbing database. Figure 13-13 shows the position of the Esaase samples on the Raman calibration line.
The Esaase samples are at the lower end of both the calibration curve and the Raman ratio versus OC content curve. Indications are that the carbonaceous material in Esaase is similar to that found in the Macraes and Stawell samples.
Table 13-24 Raman ratio, analysis and PRI results for Esaase samples
|
Site |
Raman ratio |
Preg-robbing value |
Organic carbon (%) |
Total carbon (%) |
|
Stawell |
0.31 |
3.8 |
0.53 |
1.93 |
|
Esaase |
0.55 |
8.4 |
0.58 |
1.37 |
|
Macraes |
0.66 |
- |
0.60 |
1.08 |
|
Penjom |
1.11 |
84 |
1.61 |
4.31 |
|
Gympie |
1.44 |
110 |
1.35 |
1.44 |
|
Barrick Goldstrike |
2.14 |
225 |
2.42 |
7.42 |
Figure 13-13 Position of average Esaase sample on the Raman calibration curve
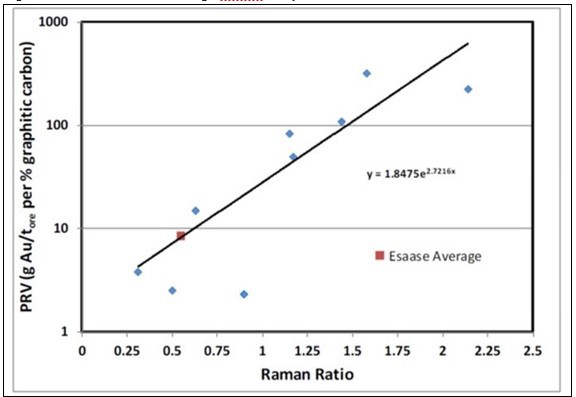
13.1.3 Summary of ALS testwork results
The general testwork results for the relevant ALS reports, A18754, A19208, A19437 and A19681 are summarized in Figure 13-10, Figure 13-11 and Figure 13-12. Relevant Au recovery results are discussed in Section 13.1.4 under the Esaase grade-recovery relationship section. There is a strong correlation between the OC content and the PRI as shown in Figure 13-14.
|
Asanko Gold Inc. NI 43-101 Technical Report on Asanko Gold Mine, Ghana |
Figure 13-14 Organic carbon % versus PRI % for all relevant samples tested
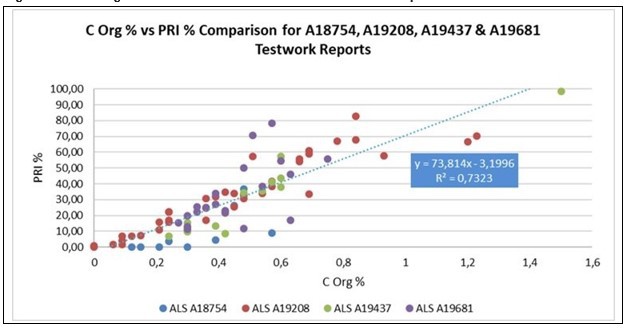
When comparing OC values to total recovery results (gravity/Fresh carbon CIL) there is a correlation as shown in Figure 13-15 below. However, this is biased towards the lower recoveries obtained with OC values greater than 0.5%. The recovery correlation between different OC levels is discussed in Section 13.1.4: Recovery assessment.
Figure 13-15 Organic carbon % versus total Au recovery for all relevant samples tested

13.1.4 Recovery assessment
Relevant recovery values obtained from testwork results conducted during ALS testwork Campaigns 3 and 4 (Reports ALS A19437, November 2018 and ALS A19681, March 2019), were used to derive the grade-recovery relationship for the Esaase ore body. This was based on the grouping of the samples firstly into OC categories greater than 0.5%, less than 0.5% and thereafter correlation of the head grade with Au recovery.
|
Asanko Gold Inc. NI 43-101 Technical Report on Asanko Gold Mine, Ghana |
In all recovery determinations, the following criteria was used:
-
Upfront gravity recovery of coarse gold
-
Cyanidation leaching of gravity tailings with Fresh carbon for 24 hrs
-
Recalculation of Au head grade based on gravity recovery, CIL solids, CIL solution and loaded carbon
-
Recovery based on calculated head grade and CIL residue
-
All results based on no kerosene enhancement.
Esaase Main Pit geological ore domains
In Section 7.3.2 Esaase Geometallurgy, it is reported that samples with an OC value of greater than 0.5% would occur in the Cobra unit and in the narrow shear zones of the Upper and Sandstone units within the Esaase Main pit. It was also stated that ores originating from these zones comprise approximately 15% of the LOM tonnage are distinguishable from the ores outside the shear zones and as such can be separately mined and stockpiled for specialised treatment at the end of the LOM. There is geological evidence of metallurgical over sampling of high organic units. Figure 13-16 depicts the geological domains at the Esaase Main Pit.
Figure 13-16 Esaase Main Pit geological ore domains (Pit floor December 2019)
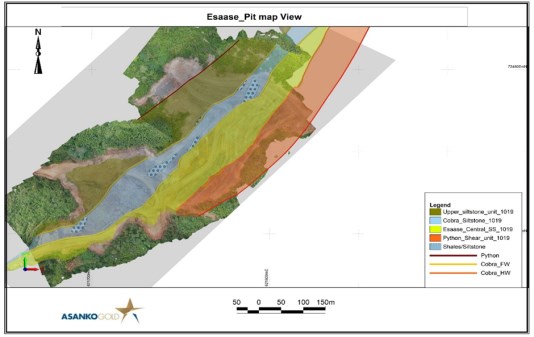

|
Asanko Gold Inc. NI 43-101 Technical Report on Asanko Gold Mine, Ghana |
The geological recommendation in an annexure report is for three recovery models:
-
Central Sandstone
-
Composite recovery model calculated for Upper and Python units based on less than 0.5% total OC
-
Composite recovery model applied to the Cobra unit.
The relevant sample drill hole core data as well as the grade intervals were supplied in the form of an ore domain spreadsheet by Asanko Gold and the subsequent recoveries were calculated on an OC/Au recovery relationship using OC values of greater than 0.5% and less than 0.5% as shown in Figure 13-17 and Figure 13-18.
Figure 13-17 Grade recovery curve - samples with organic carbon greater than 0.5%
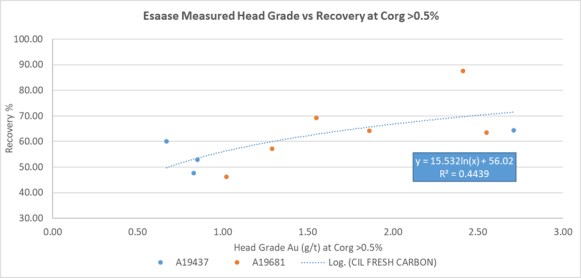
Figure 13-18 Grade recovery curve - samples with organic carbon less than 0.5%
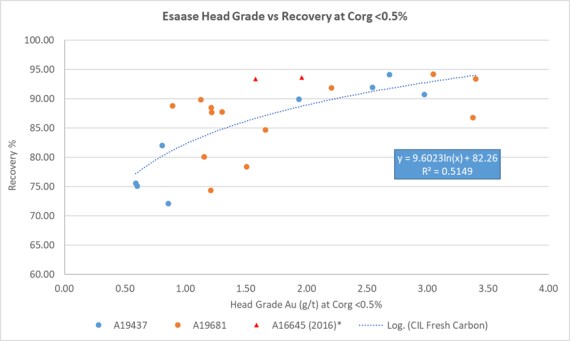
|
Asanko Gold Inc. NI 43-101 Technical Report on Asanko Gold Mine, Ghana |
Included in Figure 13-17 are two data points A16645 from the AGM Expansion Project - Phase 2 Testwork 2015 to 2016. These are included in the head grade recovery correlation. An OC standard deviation was applied to each ore domain to eliminate bias of high and low OC values (Table 13-25).
Table 13-25 Statistical analysis - Removing outliers in grade recovery models
|
Domain |
Average |
Standard deviation |
Average standard deviation |
Average + standard deviation |
New average |
New standard deviation |
|
Upper |
0.44 |
0.14 |
0.30 |
0.58 |
0.42 |
0.08 |
|
Cobra |
0.53 |
0.11 |
0.42 |
0.64 |
0.58 |
0.05 |
|
Central |
0.38 |
0.11 |
0.27 |
0.48 |
0.37 |
0.08 |
Following the a GeoMet methodology formulated for Central, Upper and Cobra, DRA applied a direct head grade recovery relationship for Central Sandstone. For Cobra and Upper, the OC value was normalised using a ± 1x standard deviation to characterise a representative OC value for the entire domain. The average OC grade for each ore domain was used to characterise the OC value and applied to the relevant grade-recovery equation for above and below 0.5% OC threshold.
Table 13-26 shows the identified lower and upper OC values in each of the ore domains and the normalised organic value for Upper and Cobra domains. The OC values for Central were not normalised.
|
Asanko Gold Inc. NI 43-101 Technical Report on Asanko Gold Mine, Ghana |
Table 13-26 Esaase Main Pit weighted average recovery for all geological domains
|
Year |
Sample ID |
Borehole ID |
From |
To |
Interval (m) |
Stratigraphic unit |
Stratigraphic code |
Calc Au (g/t) |
Organic carbon (%) |
Organic carbon (% Norm) |
Organic carbon grade recovery formula |
Recovery (%) +- 0.5 Corg (%) |
|
Total Upper |
||||||||||||
|
2018 |
EXES101800004[3] |
KEDD6032 |
155 |
162 |
7 |
Upper |
4 |
0.86 |
0.48 |
0.420 |
y = 9.6023ln(x) + 82.26 |
80.82 |
|
2018 |
EXES101800006[3] |
KEDD6032 |
220 |
225 |
5 |
Upper |
4 |
1.28 |
0.60[2] |
0.420 |
Excluded |
0.00 |
|
2018 |
EXES101800014[3] |
KEDD550 |
376 |
381 |
5 |
Upper |
4 |
0.60 |
0.39 |
0.420 |
y = 9.6023ln(x) + 82.26 |
77.40 |
|
2018 |
EXES101800017[3] |
KEDD813 |
221 |
227 |
6 |
Upper |
4 |
2.97 |
0.30[2] |
0.420 |
Excluded |
0.00 |
|
2018 |
EXES101800022[3] |
KEDD949 |
86 |
95 |
9 |
Upper |
4 |
0.59 |
0.30[2] |
0.420 |
Excluded |
0.00 |
|
2019 |
EXES101900002[4] |
KEDD6032 |
161 |
176 |
15 |
Upper |
4 |
1.51 |
0.42 |
0.420 |
y = 9.6023ln(x) + 82.26 |
86.19 |
|
2019 |
EXES101900004[4] |
KEDD863 |
180 |
196 |
16 |
Upper |
4 |
1.21 |
0.39 |
0.420 |
y = 9.6023ln(x) + 82.26 |
84.08 |
|
2019 |
EXES101900005[4] |
KEDD862 |
125 |
139 |
14 |
Upper |
4 |
1.30 |
0.36 |
0.420 |
y = 9.6023ln(x) + 82.26 |
84.80 |
|
2019 |
EXES101900008[4] |
KEDD537 |
194 |
213 |
19 |
Upper |
4 |
1.66 |
0.54 |
0.420 |
y = 9.6023ln(x) + 82.26 |
87.12 |
|
2019 |
EXES101900012[4] |
KEDD864 |
238 |
253 |
15 |
Upper |
4 |
1.22 |
0.75[2] |
0.420 |
Excluded |
0.00 |
|
2019 |
EXES101900020[4] |
KEDD913 |
169 |
179 |
10 |
Upper |
4 |
1.22 |
0.33 |
0.420 |
y = 9.6023ln(x) + 82.26 |
84.14 |
|
Total Cobra |
|
|
|
|
|
|
|
|
|
|
|
|
|
2018 |
EXES101800011[3] |
KEDD959 |
321 |
331 |
10 |
Cobra |
3 |
2.54 |
0.30[2] |
0.58 |
Excluded |
0.00 |
|
2018 |
EXES101800023[3] |
KEDD949 |
122 |
130 |
8 |
Cobra |
3 |
1.27 |
0.60 |
0.58 |
y = 15.532ln(x) + 56.02 |
59.78 |
|
2018 |
EXES101800024[3] |
KEDD949 |
172 |
177 |
5 |
Cobra |
3 |
0.33[1] |
0.54 |
0.58 |
Excluded |
0.00 |
|
2019 |
EXES101900003[4] |
KEDD582 |
229 |
244 |
15 |
Cobra |
3 |
1.55 |
0.60 |
0.58 |
y = 15.532ln(x) + 56.02 |
62.86 |
|
2019 |
EXES101900009[4] |
KEDD821 |
254 |
270 |
16 |
Cobra |
3 |
1.27 |
0.63 |
0.58 |
y = 15.532ln(x) + 56.02 |
59.69 |
|
2019 |
EXES101900011[4] |
KEDD822 |
238 |
252 |
14 |
Cobra |
3 |
7.38[1] |
0.63 |
0.58 |
Excluded |
0.00 |
|
2019 |
EXES101900013[4] |
KEDD832 |
254 |
270 |
16 |
Cobra |
3 |
1.15 |
0.42[2] |
0.58 |
Excluded |
0.00 |
|
2019 |
EXES101900015[4] |
KEDD785 |
291 |
303 |
12 |
Cobra |
3 |
1.93 |
0.57 |
0.58 |
y = 15.532ln(x) + 56.02 |
66.20 |
|
2019 |
EXES101900018[4] |
KEDD488 |
179 |
188 |
9 |
Cobra |
3 |
0.85 |
0.51 |
0.58 |
y = 15.532ln(x) + 56.02 |
53.44 |
|
Total Central |
|
|
|
|
|
|
|
|
|
|
|
|
|
2018 |
EXES101800007[3] |
KEDD6032 |
331 |
341 |
10 |
Central |
2 |
1.94 |
0.42 |
0.42 |
y = 9.6023ln(x) + 82.26 |
88.61 |
|
2018 |
EXES101800012[3] |
KEDD959 |
357 |
366 |
9 |
Central |
2 |
2.68 |
0.24[2] |
0.24 |
Excluded |
0.00 |
|
2018 |
EXES101800016[3] |
KEDD550 |
483 |
489 |
6 |
Central |
2 |
0.98 |
0.60[2] |
0.60 |
Excluded |
0.00 |
|
2018 |
EXES101800020[3] |
KEDD813 |
386 |
394 |
8 |
Central |
2 |
0.81 |
0.42 |
0.42 |
y = 9.6023ln(x) + 82.26 |
80.18 |
|
2019 |
EXES101900001[4] |
KEDD162 |
166 |
183 |
17 |
Central |
2 |
1.66 |
0.39 |
0.39 |
y = 9.6023ln(x) + 82.26 |
88.48 |
|
2019 |
EXES101900006[4] |
KEDD860 |
304 |
319 |
15 |
Central |
2 |
3.05 |
0.30 |
0.30 |
y = 9.6023ln(x) + 82.26 |
93.00 |
|
2019 |
EXES101900007[4] |
KEDD302 |
264 |
278 |
14 |
Central |
2 |
3.40 |
0.33 |
0.33 |
y = 9.6023ln(x) + 82.26 |
93.22 |
|
2019 |
EXES101900010[4] |
KEDD334 |
251.9 |
267 |
15.1 |
Central |
2 |
0.89 |
0.30 |
0.30 |
y = 9.6023ln(x) + 82.26 |
88.43 |
|
2019 |
EXES101900014[4] |
KEDD784 |
210 |
229 |
19 |
Central |
2 |
1.13 |
0.30 |
0.30 |
y = 9.6023ln(x) + 82.26 |
89.30 |
|
2019 |
EXES101900016[4] |
KEDD509 |
165 |
183 |
18 |
Central |
2 |
1.21 |
0.27[2] |
0.27 |
Excluded |
0.00 |
|
2019 |
EXES101900017[4] |
KEDD480 |
235 |
245 |
10 |
Central |
2 |
2.21 |
0.48 |
0.48 |
y = 9.6023ln(x) + 82.26 |
89.85 |
|
2019 |
EXES101900019[4] |
KEDD753 |
162 |
180 |
18 |
Central |
2 |
3.37 |
0.48 |
0.48 |
y = 9.6023ln(x) + 82.26 |
93.93 |
|
Total Python |
|
|
|
|
|
|
|
|
|
|
|
|
|
2018 |
EXES101800025[3] |
KEDD949 |
263 |
271 |
8 |
Python |
1 |
0.79 |
0.57 |
|
y = 15.532ln(x) + 56.02 |
52.32 |
Note: 1 Points excluded from calculation as not being a true representation of LOM feed grades;
2 Outlier point excluded due to standard deviation limits as described in Table 13-25;
3 A19437 CIL Fresh carbon/gravity recovery testwork report, 2018; 4 A19681 CIL Fresh carbon/gravity recovery testwork report, 2019.
|
Asanko Gold Inc. NI 43-101 Technical Report on Asanko Gold Mine, Ghana |
Figure 13-19 shows the Central Sandstone has a distinct residue grade/OC relationship in comparison to Upper and Cobra domains.
Figure 13-19 Organic carbon vs residue grade relationship for each domain
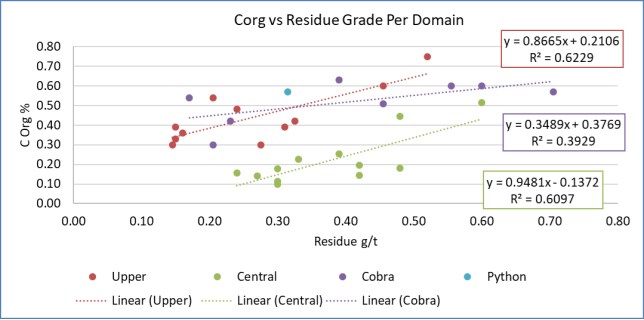
Figure 13-20 Head grade recovery relationship per domain (as function of organic carbon relationship)

Figure 13-20 shows the head grade-recovery relationships for the three domains. Python applies Upper domain correlation due to similar stratigraphy. These head grade recovery correlations (Fig 13-21) have been applied to the Esaase head grades in the LOM feed schedule in Table 13-28.
|
Asanko Gold Inc. NI 43-101 Technical Report on Asanko Gold Mine, Ghana |
13.1.5 Estimation of LOM recovery
Head grade correlations for Esaase Fresh ore domains and the head grade residue correlations for Nkran and Obotan Satellite Pits are shown in Table 13-27, with LOM feed schedule in Table 13-28.
Table 13-27 Head grade recovery model correlations applied to LOM feed schedule
|
Ore source |
Head grade recovery correlation |
M (slope) |
C (coefficient) |
|
|
Upper (Fresh/Trans) |
y = 9.600ln(x) + 82.260 |
9.60 |
82.26 |
|
|
Cobra (Fresh/Trans) |
y = 15.532ln(x) + 56.020 |
15.5. |
56.02 |
|
|
Central (Fresh/Trans) |
y = 6.202ln(x) + 85.792 |
6.20 |
85.79 |
|
|
Python (Fresh/Trans) |
=upper |
9.60 |
82.26 |
|
|
Other (Fresh/Trans) (2020-2027) |
=upper |
9.60 |
82.26 |
|
|
Obotan (Nkran + Pits)* |
y = 0.0371x + 0.036 |
0.04 |
0.036 |
|
|
Ore type |
Residue value Au (g/t) |
|||
|
Esaase Other (Fresh/Trans) (27/28) |
0.25 |
|||
|
Esaase Oxides |
0.10 |
|||
|
Recovery Discount Factor (due to Soluble Au Losses & Carbon Losses) |
0.5% |
|||
Note: * Head grade residue grade correlation
The following is noted:
-
A fixed residue grade has been applied to the Esaase Oxide ore
-
The fixed residue grade applied to Esaase Other ores (Fresh and Transition), scheduled for 2027/28, assumes a high OC content.
Asanko Gold provided plant production head grade and residue grade data for 2017 to 2019 from which a linear correlation was developed to determine residues values for Nkran Fresh ore and the Obotan Satellite Pits (Fig 13-21). This correlation is included in Table 13-27.
Figure 13-21 Nkran and Obotan Satellite Pits head grade vs residue grade correlation
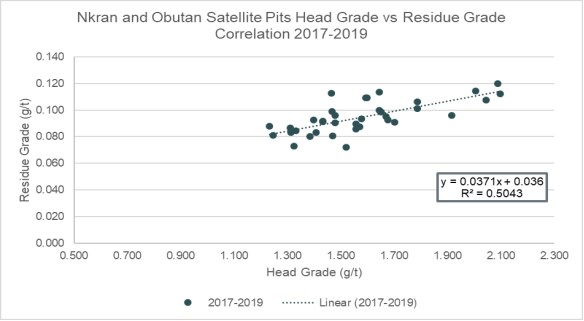
|
Asanko Gold Inc. NI 43-101 Technical Report on Asanko Gold Mine, Ghana |
Table 13-28 LOM feed schedule grades and recoveries per ore source
|
Source |
2020 |
2021 |
2022 |
2023 |
2024 |
2025 |
2026 |
2027 |
2028 |
2029 |
Grand total |
|
Abore |
|
|
|
|
|
|
|
|
|
|
|
|
Tonnes (kt) |
- |
4.48 |
424.35 |
1,049.62 |
- |
- |
162.97 |
- |
1,125.13 |
- |
2,766.55 |
|
Au (g/t) |
- |
1.59 |
1.90 |
2.17 |
- |
- |
0.64 |
- |
0.66 |
- |
1.42 |
|
Recovery % |
- |
93.70 |
93.87 |
93.89 |
- |
- |
84.29 |
- |
80.25 |
- |
91.07 |
|
Adubiaso |
|
|
|
|
|
|
|
|
|
|
|
|
Tonnes (kt) |
- |
- |
- |
- |
- |
5.66 |
262.76 |
275.51 |
237.56 |
- |
781.49 |
|
Au (g/t) |
- |
- |
- |
- |
- |
1.48 |
2.22 |
1.59 |
0.64 |
- |
1.51 |
|
Recovery % |
- |
- |
- |
- |
-! |
93.23 |
94.33 |
- |
79.01 |
- |
91.26 |
|
Akwasiso |
|
|
|
|
|
|
|
|
|
|
|
|
Tonnes (kt) |
1,021.02 |
463.36 |
- |
- |
- |
5.55 |
- |
- |
398.04 |
- |
1,887.96 |
|
Au (g/t) |
1.72 |
1.48 |
- |
- |
- |
0.65 |
- |
- |
0.63 |
- |
1.43 |
|
Recovery % |
91.97 |
90.62 |
- |
- |
- |
- |
- |
- |
77.66 |
- |
90.30 |
|
Asuadai |
|
|
|
|
|
|
|
|
|
|
|
|
Tonnes (kt) |
- |
- |
- |
- |
293.86 |
333.92 |
117.72 |
20.81 |
191.27 |
58.87 |
1,016.45 |
|
Au (g/t) |
- |
- |
- |
- |
1.47 |
1.34 |
0.74 |
1.08 |
0.61 |
0.58 |
1.12 |
|
Recovery % |
- |
- |
- |
- |
92.74 |
90.14 |
85.95 |
87.07 |
79.05 |
76.11 |
89.20 |
|
Esaase Main |
|
|
|
|
|
|
|
|
|
|
|
|
Tonnes (kt) |
463.77 |
3,204.55 |
4,759.48 |
3,629.98 |
4,087.58 |
2,112.11 |
619.67 |
2,204.24 |
2,953.55 |
5,110.72 |
29,145.65 |
|
Au (g/t) |
1.41 |
2.03 |
1.58 |
1.47 |
1.66 |
1.63 |
0.95 |
0.91 |
0.83 |
0.68 |
1.33 |
|
Recovery % |
92.44 |
93.46 |
88.21 |
85.89 |
85.54 |
87.63 |
89.43 |
83.06 |
74.18 |
77.17 |
86.21 |
|
Esaase South |
|
|
|
|
|
|
|
|
|
|
|
|
Tonnes (kt) |
1,212.44 |
234.32 |
216.18 |
720.40 |
901.58 |
77.97 |
54.90 |
140.22 |
451.90 |
526.63 |
4,536.55 |
|
Au (g/t) |
1.73 |
1.04 |
1.65 |
1.66 |
1.93 |
1.00 |
0.76 |
0.70 |
0.73 |
0.66 |
1.44 |
|
Recovery % |
89.15 |
83.66 |
93.34 |
87.24 |
88.47 |
86.67 |
86.78 |
83.77 |
78.91 |
78.65 |
87.44 |
|
Nkran |
|
|
|
|
|
|
|
|
|
|
|
|
Tonnes (kt) |
1,728.96 |
77.43 |
- |
- |
116.98 |
2,482.50 |
3,726.37 |
2,759.21 |
42.55 |
- |
10,934.01 |
|
Au (g/t) |
1.51 |
0.64 |
- |
- |
0.94 |
1.85 |
1.83 |
1.35 |
0.59 |
- |
1.64 |
|
Recovery % |
90.73 |
77.98 |
- |
- |
85.14 |
92.45 |
92.36 |
89.62 |
76.07 |
- |
91.47 |
|
Stockpiles |
|
|
|
|
|
|
|
|
|
|
|
|
Tonnes (kt) |
1,225.81 |
1,099.78 |
- |
- |
- |
- |
- |
- |
- |
- |
2,325.58 |
|
Au (g/t) |
0.87 |
0.64 |
- |
- |
- |
- |
- |
- |
- |
- |
0.76 |
|
Recovery % |
76.11 |
61.12 |
- |
- |
- |
- |
- |
- |
- |
- |
70.13 |
|
Totals |
|
|
|
|
|
|
|
|
|
|
|
|
Total tonnes (kt) |
5,652.00 |
5,083.91 |
5,400.00 |
5,400.00 |
5,400.00 |
5,017.70 |
4,944.39 |
5,400.00 |
5,400.00 |
5,696.23 |
53,394.24 |
|
Total Au (g/t) |
1.45 |
1.62 |
1.61 |
1.63 |
1.68 |
1.71 |
1.67 |
1.16 |
0.75 |
0.67 |
1.38 |
|
Total recovery % |
91.9 |
92.4 |
89.0 |
88.3 |
86.6 |
91.5 |
93.9 |
90.1 |
79.6 |
77.2 |
89.1 |
|
Recovery discount %* |
0.50 |
0.50 |
0.50 |
0.50 |
0.50 |
0.50 |
0.50 |
0.50 |
0.50 |
0.50 |
0.50 |
|
Total recovery (discounted) |
91.4 |
91.9 |
88.5 |
87.8 |
86.1 |
91.0 |
93.4 |
89.6 |
79.1 |
76.7 |
88.6 |
Note: * Recovery is discounted due to soluble gold losses and carbon losses
|
Asanko Gold Inc. NI 43-101 Technical Report on Asanko Gold Mine, Ghana |
Table 13-28 shows the overall recovery for the LOM feed at 88.6% after applying the recovery criteria to the Obotan and Esaase ore sources from Table 13-27Figure 13-22 shows a decline in head grade from Year 2027 to 2029 when the surface stockpiles are being processed.
Figure 13-22 LOM grade and recovery profile
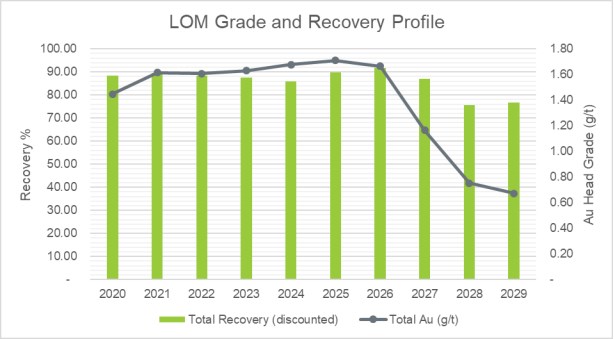
Figure 13-23 below shows a strong head grade to recovery over the LOM.
Figure 13-23 Head grade and recovery profile
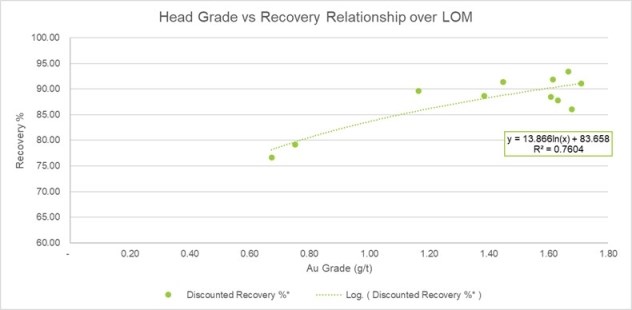
|
Asanko Gold Inc. NI 43-101 Technical Report on Asanko Gold Mine, Ghana |
13.1.6 Addendum testwork A20208
Nkran testwork and historical LOM performance
Over the LOM of Nkran (3.5 years) the plant has achieved consistent recoveries exceeding 91.6%, notwithstanding the treatment of a blended ore comprising Oxides, Transition and Fresh and that preg-robbing zones are also encountered in the Nkran pit geology. The recoveries are shown in Table 13-29.
Table 13-29 Nkran (Obotan) historical annualised recovery
|
Annualised recovery |
2016 |
2017 |
2018 |
2019 |
|
Nkran Au recovery percent (%) |
91.6 |
94.3 |
93.8 |
93.8 |
In October 2019, a testwork program A20208 was undertaken at ALS Metallurgy in Perth (Western Australia). The objective of this testwork was as follows:
-
Provide a direct comparison of the preg-robbing, gravity/leach and gravity/CIL performance of the Nkran core samples with the recent Esaase testwork using identical methods
-
Compare the AGM laboratory testwork with typical plant performance results, though information on the Asanko Gold plant performance was limited at the time
-
Compare Raman spectroscopy PRI of Nkran and Esaase: An email has been received from Curtin University with preliminary results
-
Check that the current laboratory test methods produce results that are reasonably comparable with what is expected at plant scale
-
Historical Nkran testwork is also considered here.
PRI testing was carried out on the new A20208 Nkran core composites samples and the rock specimen samples, in order to compare the activity of the natural carbon at Nkran with Esaase.
PRI is the percentage of gold in a spiked ~10 ppm gold solution at 30% solids that is adsorbed by the sample under conditions of low free cyanide concentration. This quantifies how much gold the natural carbon can adsorb from a selected gold solution grade (i.e. 10 ppm) over a selected time period (i.e. 24 hours) and, is loosely referred to in this memorandum as "carbon activity".
The comparison of natural carbon activity is made by plotting the relationship between PRI and the OC grade of the sample, in order to correct for the quantity of carbon in each sample (Figure 13-24).
|
Asanko Gold Inc. NI 43-101 Technical Report on Asanko Gold Mine, Ghana |
Figure 13-24 Preg-robbing index versus organic carbon grades

The following conclusions can be made, as supported and illustrated by Figure 13-24:
-
On average, the activity of Esaase natural carbon is double that of Nkran
-
The natural carbon activity of the historical Esaase samples is relatively consistent and has relatively low variability
-
The natural carbon activity of the Nkran samples is relatively more variable than Esaase.
Raman spectroscopy
Preliminary reporting of the results by Curtin University on 7 November 2019.
"Essentially, by comparing the spectra from the Esaase and Nkran spectra with each other and with other spectra from our database, indications are that the carbonaceous material in the Nkran samples is slightly more preg-robbing than that in the Esaase samples, although both would be considered to have low to moderate preg-robbing capacity when compared with the wider dataset. However, the lower normalised PRI values for the Nkran samples relative to the Esaase samples are a little anomalous and I suspect that some of the Nkran samples contain graphitic (non preg-robbing) carbon which may be skewing the results."
|
Asanko Gold Inc. NI 43-101 Technical Report on Asanko Gold Mine, Ghana |
Gravity/direct leach (not CIL) results
Gravity/direct leach testing was carried out on both the Esaase and Nkran samples. A direct leach test represents the worst-case scenario for recovering gold from a preg-robbing ore, as there is no circuit carbon to "compete" with the adsorption capability of the natural carbon. This test allows the detrimental nature of preg-robbing to be more clearly identified by the metallurgist. This approach is standard practice for testing future ores at all other Gold Fields operating sites. Direct leaching tests on Nkran samples is limited to the A20208 (2019) and earlier A13906 (2012) testwork programs. A trend of the results correlated to OC grade is shown in Figure 13-25.
Figure 13-25 Gravity/direct leach recovery results for Esaase and Nkran

Gravity/CIL results
Gravity/CIL testing was carried out on both the Esaase and Nkran samples. The purpose of a gravity/CIL test is to more closely represent plant conditions for processing preg-robbing ores, where there is circuit carbon to "compete" with the adsorption capability of the ore's natural carbon at the very start of the cyanidation leaching step. A trend of the results correlated to OC grade is shown in Figure 13-26.
|
Asanko Gold Inc. NI 43-101 Technical Report on Asanko Gold Mine, Ghana |
Figure 13-26 Gravity/CIL recovery results for Esaase and Nkran

The following trends are noted from Figure 13-26:
-
All the Nkran samples follow a relatively consistent gravity/CIL recovery trend with OC grade, with a slight deteriorating trend in recovery from 93% recovery at 0.09% OC, decreasing to 90% recovery at 0.50% OC, down to 84.5% at 0.81% OC
-
The Esaase composites samples indicate a more aggressive deteriorating recovery trend with increasing OC grade, decreasing from 94% at 0.25% OC to ~50% at ~0.78% OC grade.
These laboratory test results indicate:
-
Nkran ores are mildly preg-robbing, and the preg-robbing activity is much lower than at Esaase
-
Esaase ores will likely return lower plant gravity/CIL recoveries as compared to Nkran ores
-
At the assumed average Nkran OC grade of 0.24% (based on the limited plant sample assays), the laboratory testwork would indicate a gravity/CIL recovery of ~92%, which is similar to current plant recoveries from Nkran Fresh ore blended with non-preg-robbing and free-milling oxide ores)
-
The latest laboratory test methods being used are providing results that are responding as expected to the differences in the preg-robbing nature of the Esaase and Nkran ores
-
Current plant recovery characteristics associated with the treatment of Nkran ore (blends) cannot be used to predict recoveries for processing Esaase Fresh ores.
 |
Asanko Gold Inc. NI 43-101 Technical Report on Asanko Gold Mine, Ghana |
14 MINERAL RESOURCE ESTIMATES
14.1 Introduction
CSA Global compiled three of the Mineral Resource estimates (MREs), supervised the compilation of the other three, and have reported all MREs in compliance with the definitions and guidelines for the reporting of Exploration Information, Mineral Resources and Mineral Reserves in Canada, "the CIM Standards on Mineral Resources and Reserves - Definitions and Guidelines" dated 10 May 2014 (CIM, 2014). These MREs adhere to the Rules and Policies of the Canadian Securities Administrators National Instrument 43-101 Standards of Disclosure for Mineral Projects, Form 43-101F1 and Companion Policy 43-101CP (NI 43-101).
CSA Global is satisfied that the MREs reflect the nature of the deposits based on the available data. Suitably experienced and qualified geologists, surveyors and other Mineral Resource practitioners employed by Asanko Gold were responsible for the capture of the drill hole information and geological information. The QPs do not disclaim responsibility for the technical data and information captured.
For the purposes of this disclosure, CSA Global has estimated the MREs for the Asanko Gold Mine (AGM) projects Nkran, Esaase and Akwasiso; and Gold Fields estimated the MREs for Abore, Asuadai and Adubiaso. CSA Global has reviewed and accepted the MREs for the latter three deposits. Grade estimation was completed using ordinary kriging, followed by local uniform conditioning for Nkran, Esaase and Akwasiso. Simulation and a localised selective mining unit (SMU) estimation technique was used for Abore, Asuadai and Adubiaso. The estimation approach was considered appropriate based on a review of various factors, including the quantity and spacing of available data, the interpreted controls on mineralisation, and the style and geometry of mineralisation.
14.2 Effective date of Mineral Resource
The effective date of the Mineral Resource is 31 December 2019 and comprises six deposits, which have been combined into a global Mineral Resource table (Table 14-1). The 2019 Mineral Resource conforms to CIM (2014) and NI 43-101.
Table 14-1 Summary of the Mineral Resource at a 0.5 g/t Au cut-off, as at 31 December 2019
|
Deposit |
Measured & Indicated |
Inferred |
||||
|
Tonnes (Mt) |
Au grade (g/t) |
Au content (koz) |
Tonnes (Mt) |
Au grade (g/t) |
Au content (koz) |
|
|
Nkran |
8.5 |
2.14 |
586 |
- |
- |
- |
|
Esaase |
43.2 |
1.69 |
2,348 |
5.4 |
1.54 |
269 |
|
Akwasiso |
2.8 |
1.82 |
165 |
0.4 |
2.16 |
29 |
|
Abore |
4.7 |
1.46 |
221 |
0.9 |
1.69 |
48 |
|
Asuadai |
1.3 |
1.32 |
55 |
0.0 |
1.24 |
2 |
|
Adubiaso |
1.2 |
1.88 |
71 |
0.2 |
1.43 |
9 |
|
Stockpiles |
2.3 |
0.76 |
57 |
- |
- |
- |
|
Total |
64.1 |
1.70 |
3,504 |
7.0 |
1.59 |
357 |
Notes:
• The effective date of the Mineral Resource is 31 December 2019
• Mineral Resources are reported at a cut-off grade of 0.5 g/t gold assuming a metal price of US$1,500/oz Au
• Mining, G&A, processing costs, and process recovery are dependent on deposit and detailed in the respective deposit sections
• Figures are rounded to the appropriate level of precision for the reporting of Mineral Resources
• Due to rounding, some columns or rows may not compute as shown
• The Mineral Resource is stated as in situ dry metric tonnes
• The Mineral Resource is classified under the guidelines of CIM (2014), and procedures for classifying the reported Mineral Resources were undertaken within the context of the NI 43-101.
• Mineral Resources that are not Mineral Reserves do not have demonstrated economic viability. The estimate of Mineral Resources may be materially affected by environmental, permitting, legal, title, taxation, socio-political, marketing, or other relevant issues
• The Mineral Resource is reported inclusive of Mineral Reserves
• The Nkran, Esaase and Akwasiso MREs have been prepared by CSA Global who are independent of Asanko Gold. The Abore, Asuadai and Adubiaso MREs have been prepared by Gold Fields and reviewed and accepted by CSA Global
• CSA Global does not know of any known legal, political, environmental, or other risks that could materially affect the potential development of the mineral resources. CSA Global considers the risks regarding permitting and socio-economic factors to be low.
|
Asanko Gold Inc. NI 43-101 Technical Report on Asanko Gold Mine, Ghana |
Cautionary note about Mineral Resources
Mineral Resources that are not Mineral Reserves do not have demonstrated economic viability. Mineral Resources do not account for mine ability, selectivity, mining loss and dilution. The reported Mineral Resources include material classified as Inferred Mineral Resources that have a lower level of confidence than Indicated Mineral Resources and as such have not been converted to Mineral Reserves. It is reasonably expected that the majority of Inferred Mineral Resources could be upgraded to the Indicated category through further exploration. The Company advises investors that while the term "Inferred Mineral Resources" is recognised and required by Canadian regulations, the U.S. Securities and Exchange Commission (SEC) does not recognise it. Under Canadian rules, estimates of Inferred Mineral Resources may not form the basis of economic studies and they have not been used in the 2019 Pre-Feasibility Study or this NI 43-101 to estimate Mineral Reserves.
As per CIM (2014), it is reasonably expected that the majority of Inferred Mineral Resources could be upgraded to Indicated Mineral Resources with further evaluation, considering Inferred Mineral Resources are commonly direct extensions of higher confidence Mineral Resources. All Inferred Resources reported are constrained by a US$1500/oz gold pit shell and as such, are considered to have a reasonable prospect for eventual economic extraction.
14.3 Assumptions and parameters
The deposits are located along major shear corridors at the intersection of cross-cutting faults. The mineralisation is directly related to the structural setting and interactions with specific lithological units. Interpreted 3D geological models, based on lithological-structural domains, form the basis for the estimates. Host lithologies are primarily isoclinally folded basin sedimentary units regionally overprinted by greenschist facies metamorphism and small granitic intrusions. Gold mineralisation is directly associated with quartz veins distributed preferentially within these units. The gold in all deposits is free-milling and non-refractory.
All geological and structural inputs into the 3D geological models were collected by Asanko Gold personnel. Model updates were guided by standard best practice updates to the existing knowledge base resulting from the addition of new understanding based on reinterpretation of results.
A summary of key criteria for drilling, sampling and geology are tabulated below in Table 14-2. These criteria and the estimation parameters were consistently applied to all MREs.
|
Asanko Gold Inc. NI 43-101 Technical Report on Asanko Gold Mine, Ghana |
Table 14-2 Confidence levels of key criteria for drilling, sampling and geology
|
Items |
Discussion |
Confidence |
|
Drilling techniques |
Diamond core (DD) and reverse circulation (RC) - Industry standard approach |
High |
|
Logging |
Standard nomenclature and apparent high quality |
High |
|
Drill sample recovery |
DD core and RC recovery adequate |
High |
|
Sub-sampling techniques and sample preparation |
Industry standard for both DD core and RC |
High |
|
Quality of assay data |
Quality control conclusions outlined in Section 11. Some issues were identified. Recent improvements were noted |
Moderate |
|
Verification of sampling and assaying |
Dedicated drill hole twinning to reproduce original drill intercepts |
High |
|
Location of sampling points |
Survey of all collars with adequate downhole survey. Investigation of available downhole survey indicates expected deviation |
High |
|
Data density and distribution |
Core mineralisation defined on a notional 40 mE by 30 mN drill spacing with a small area drilled at 20 mE by 20 mN. Other areas more broadly spaced to approximately 80 mN |
Moderate to High |
|
Database integrity |
Minor errors identified and rectified |
High |
|
Geological interpretation |
The broad mineralisation constraints are subject to a large amount of uncertainty concerning localised mineralisation trends as a reflection of geological complexity. Closer spaced drilling is required to resolve this issue |
Moderate |
|
Rock dry bulk density |
Dry BD measurements taken from drill core; dry BD applied is considered robust when compared with 3D data. Dry BD supported by in pit sampling and tonnage reconciliation of active operating pit |
High below top of transition, moderate in oxide material |
All directional references in the MRE portions of this Technical Report are as per the UTM grid (Zone 30 North in WGS 84 datum). In some of the operating pits the UTM elevation includes the addition of 1,000 m to avoid negative bench elevations.
The MRE preparation dates were as follows:
-
Nkran - February 2019 (based on use of production GC drilling, re-logging and updated geological interpretations, updated pit shell for reporting)
-
Esaase - January 2019 (based on additional infill drilling, re-logging and substantial geological interpretations, updated pit shell for reporting)
-
Akwasiso - July 2019 (based on additional infill drilling, re-logging and substantial geological interpretations, updated pit shell for reporting)
-
Abore - February 2019 (updated pit shell for reporting)
-
Asuadai - 2018 (updated pit shell for reporting)
-
Adubiaso - January 2019 (updated pit shell for reporting).
The definition of Indicated Mineral Resource states that there should be sufficient confidence for mine design, mine planning, or economic studies. CSA Global is of the opinion that there is sufficient confidence in the estimate of the Indicated Resource areas to allow the appropriate application of technical and economic parameters and enable an evaluation of economic viability.
14.4 Drilling database
CSA Global was provided exports from the DataShedTM database for each of the deposits. These data files contained collar, downhole survey, assay, geology (lithology and oxidation), recovery and bulk density (BD) data (Table 14-3 and Table 14-4).
|
Asanko Gold Inc. NI 43-101 Technical Report on Asanko Gold Mine, Ghana |
Table 14-3 Summary of exploration databases
|
Deposit |
Cut-off date |
Collars |
Assays |
Surveys |
Geology |
Bulk density |
|
Nkran |
11 July 2018 |
924 |
77,925 |
3,678 |
32,258 |
268 |
|
Esaase |
14 July 2018 |
898 |
102,900 |
8,653 |
164,219 |
16,564 |
|
Akwasiso |
9 July 2019 |
296 |
27,752 |
1,504 |
3,967 |
- |
|
Abore |
11 April 2019 |
537 |
24,644 |
2,140 |
17,174 |
183 |
|
Asuadai |
9 April 2019 |
282 |
12,458 |
729 |
7,652 |
128 |
|
Adubiaso |
9 April 2019 |
468 |
29,421 |
1,143 |
8,022 |
84 |
Note: The Esaase collar file was provided on 5 September 2018, with corrected collar elevations
Table 14-4 Summary of grade control databases
|
Deposit |
Hole type |
Collars |
Assays |
Surveys |
Geology |
|
Nkran |
RC |
8,878 |
180,963 |
9,786 |
112,893 |
|
Akwasiso |
RC |
1,881 |
34,078 |
1,891 |
14,060 |
|
Abore |
RC |
3,006 |
40,459 |
6,012 |
21,405 |
|
Adubiaso |
RC |
5,308 |
68,026 |
10,219 |
7,717 |
Note: RC - Reverse circulation drilling
A summary of the exploration drilling data used in the MREs are shown in Table 14-5.
Table 14-5 Summary of exploration drill data used in the MREs
|
Deposit |
Component |
DD |
RC |
RCD |
Total |
|
Nkran |
Number of holes |
189 |
162 |
21 |
372 |
|
Metres drilled |
66,861 |
11,467 |
8,393 |
86,721 |
|
|
Number of assays |
39,982 |
7,216 |
5,070 |
52,268 |
|
|
Number of BD measurements |
268 |
- |
- |
268 |
|
|
Esaase* |
Number of holes |
99 |
577 |
222 |
898 |
|
Metres drilled |
22,499 |
87,973 |
76,892 |
187,364 |
|
|
Number of assays |
18,169 |
87,361 |
76,341 |
181,871 |
|
|
Number of BD measurements |
5,588 |
- |
9,410 |
14,998 |
|
|
Akwasiso |
Number of holes |
28 |
237 |
30 |
295 |
|
Metres drilled |
5,279 |
17,660 |
6,753 |
29,692 |
|
|
Number of assays |
1,772 |
5,699 |
2,160 |
9,631 |
|
|
Number of BD measurements |
- |
- |
- |
- |
|
|
Abore |
Number of holes |
62 |
406 |
- |
468 |
|
Metres drilled |
6,069 |
30,925 |
- |
36,994 |
|
|
Number of assays |
6,082 |
30,925 |
- |
37,007 |
|
|
Number of BD measurements |
- |
- |
|
|
|
|
Asuadai |
Number of holes |
58 |
80 |
- |
138 |
|
Metres drilled |
7,570 |
5,635 |
- |
13,205 |
|
|
Number of assays |
7,570 |
5,504 |
- |
13,074 |
|
|
Number of BD measurements |
- |
- |
- |
|
|
|
Adubiaso |
Number of holes |
50 |
293** |
4 |
347 |
|
Metres drilled |
9,652 |
27,243 |
590 |
37,485 |
|
|
Number of assays |
9,967 |
27,244 |
590 |
37,801 |
|
|
Number of BD measurements |
- |
- |
- |
- |
Note: DD - Diamond drilling; RC - Reverse circulation drilling; RCD - Reverse circulation hole with diamond core tail; BD - Bulk density
* The Esaase collar file was provided on 5 September 2018, with corrected collar elevations.
** KIT holes were included in the RC database (12 holes for 731 m and 731 assays)
|
Asanko Gold Inc. NI 43-101 Technical Report on Asanko Gold Mine, Ghana |
All subsequent data analysis, statistics and estimation for the MREs are limited to the validated and restricted datasets relevant for each deposit. Location plans of drill hole collars (coloured by drill hole type), which were used to prepare the 2019 Mineral Resource tabulation are shown in Figure 14-1 to Figure 14-4.
Figure 14-1 Plan view - MRE drill hole collar locations
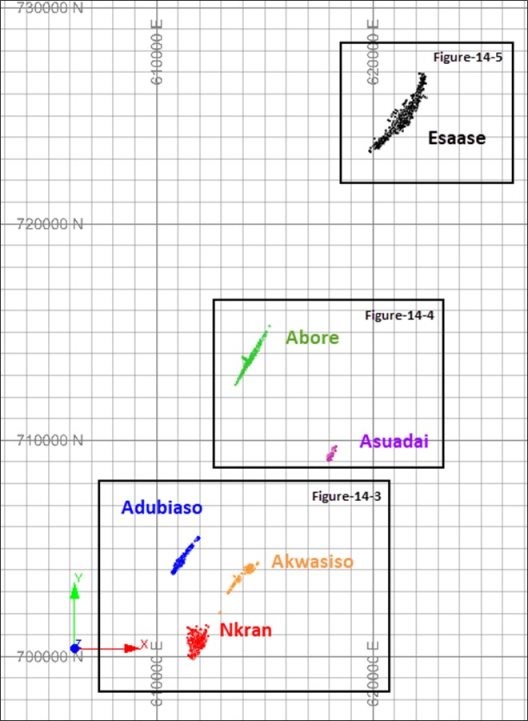
Source: CSA Global, 2019
|
Asanko Gold Inc. NI 43-101 Technical Report on Asanko Gold Mine, Ghana |
Figure 14-2 Drill hole collar locations for Adubiaso, Akwasiso and Nkran by hole type

Source: CSA Global, 2019
Figure 14-3 Drill hole collar locations for Abore and Asuadai by hole type
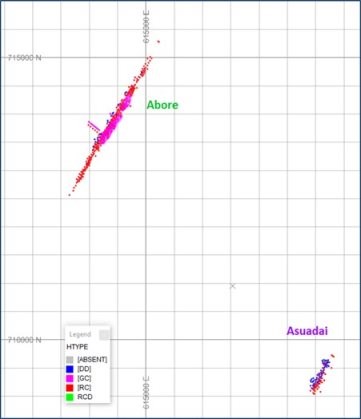
Source: CSA Global, 2019
|
Asanko Gold Inc. NI 43-101 Technical Report on Asanko Gold Mine, Ghana |
Figure 14-4 Drill hole collar locations for Esaase by hole type
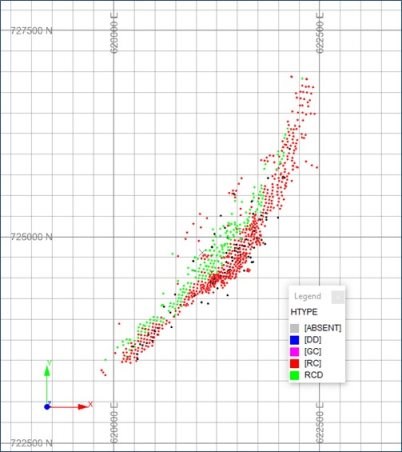
Source: CSA Global, 2019
The following sections describe the methodology, parameters and key assumptions regarding the preparation of the MREs.
The MRE interpretations, modelling, and estimation work was conducted using LeapfrogTM, Datamine StudioRMTM and ISATISTM software packages. GeoAccess ProfessionalTM and Snowden SupervisorTM software packages were used for statistical analysis and MRE validations.
14.5 Nkran
14.5.1 Geological and mineralisation modelling
Lithology
The following section was modified after the DFS (2017) and references therein.
The Nkran deposit is located along a major shear zone crosscut by secondary fault structures. Deposit scale mineralisation is directly controlled by the structural setting and specific lithological units. The 3D lithological and structural models provide the geological boundaries for the MRE.
During 2014, a geology and structure model was developed for Nkran based on information from a relogging programme of 35 PMI drill holes. The relogging captured lithology, alteration, structure, mineralisation and veining, and identified five key structures which separate the lithologies and control distribution of mineralisation within the ore body. The shears/structures have been presented as planes which are zones of intense deformation up to several metres in width. The geology of the Nkran deposit consists of a south plunging sandstone dominated units, a granitic intrusion and a breccia unit bounded by siltstone dominant sediments with sheared structures influencing mineralisation intensity.
|
Asanko Gold Inc. NI 43-101 Technical Report on Asanko Gold Mine, Ghana |
A 2016 geology programme by Asanko Gold included the relogging of 72 DD holes used in the 2017 MRE. In the 2016 interpretation, a vein and alteration paragenesis was completed by Brett Davis of Orefind Pty Ltd. The ensuing interpretation provided a better definition of the various lithological units, structural controls and continuity of mineralisation, alteration and understanding of mineralising events and deformation history. The mineralisation host lithologies are the sandstone, granite and breccia units. These units are the preferential host of the mineralisation due to the rheological contrast with the siltstone and shale country rock around them. These units are harder and more massive making them prone to deforming in a brittle fashion during the late stage mineralising events. This brittle deformation causes dilation which is filled with quartz veins and gold mineralisation. The siltstone and shale intercalated units are finer grained and contain many slip planes. During the mineralising deformation events, they tend to slip on these planes without brittle deformation or dilation occurring.
The gold mineralisation occurs within quartz-carbonate veins within these preferential host units. The anastomosing network of shear zones separating the lithological units acts as the conduit for mineralised fluids which is emplaced in the host units during the late mineralising brittle deformation events.
Post the 2017 MRE, geological logging from pit mapping and additional infill and step-out drilling has been used by Asanko Gold geologists to regularly update the geology model in LeapfrogTM. The updated host lithologies constitute three sandstone units (western, central and eastern), two granite units (main and skinny), and two breccia units (north and south). Unmineralised country rock consists of intercalated siltstones and shales. These are shown in Figure 14-5. These units are separated by an anastomosing network of controlling structures which act as conduits for the mineralising fluids. The modelled geological wireframes provide the basis of the mineralisation domains.
Figure 14-5 3D view of the Nkran geological domains within the December 2018 pit shell
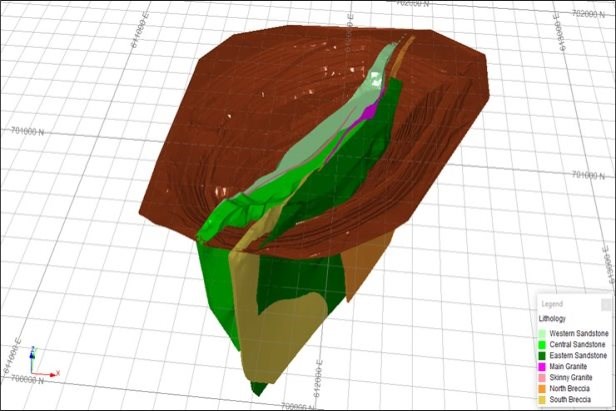
Source: CSA Global, 2019
|
Asanko Gold Inc. NI 43-101 Technical Report on Asanko Gold Mine, Ghana |
The host lithologies are bounded to the west and east by the Western Bounding Shear Zone (WBSZ) and Eastern Bounding Shear Zone (EBSZ). The WBSZ and EBSZ are characterised by wide (≥50 m) zones of strongly sheared phyllite, carbonaceous shale and siltstone. All the mineralisation occurs between these broad bounding shears influenced by internal shear zones. Three dominant shears, within the main mineralisation trend, are named the County, Discovery and Freelander.
The level of geological understanding has increased with mining of the Nkran pit, GC drilling and in pit mapping since 2016.
Weathering
Asanko Gold geologists created weathering profiles for the bottom of complete oxidation and the top of fresh material in LeapfrogTM, based on the logged oxidation/weathering state.
In general, the weathering surfaces are broadly parallel to the topographical profile, although weathering tends to be deeper within zones of mineralisation and tend to parallel the footwall to the mineralisation where the footwall approaches the surface (CJM, 2014). The Nkran pit has developed more than 150 m below the weathering surface and is in fresh rock material.
Mineralisation - Indicator estimation
The main lithological units form the basis for delineating geological domains (GEOL). Within the domains, the separation into mineralised and waste volumes was defined using an indicator kriging (IK) method.
A grade compositing process in Datamine StudioRMTM (COMPSE) was used to generate 'mineralisation' intercepts - that is, a set of intercepts that meets or exceeds a minimum length, grade and dilution criteria. The minimum grade used to delineate mineralisation from waste was 0.3 g/t Au. The minimum true width used was 3 m. Intercepts that met the COMPSE criteria were assigned a value of 1 and intercepts that did not, were assigned a value of zero. The 1 and 0 values are then estimated into a block model (2.5 m x 2.5 m x 3 m, XYZ) using dynamic anisotropy based on structural wireframes.
Indicator variography
The variography for the indicator variable (ORE) for the MRE was completed on the exploration drill data, composited to 1 m, and restricted to the geology wireframes. The nugget was obtained from the downhole variogram.
The semi-variogram was well structured, with a moderate nugget and moderate to long range, as shown in Figure 14-6. The variogram parameters are detailed in Table 14-6, with the search neighbourhood parameters for the ORE and NPOINTS (an indicator of drill spacing within the search ellipsoid) shown in Table 14-7.
|
Asanko Gold Inc. NI 43-101 Technical Report on Asanko Gold Mine, Ghana |
Figure 14-6 Variogram for the indicator variable (ORE)
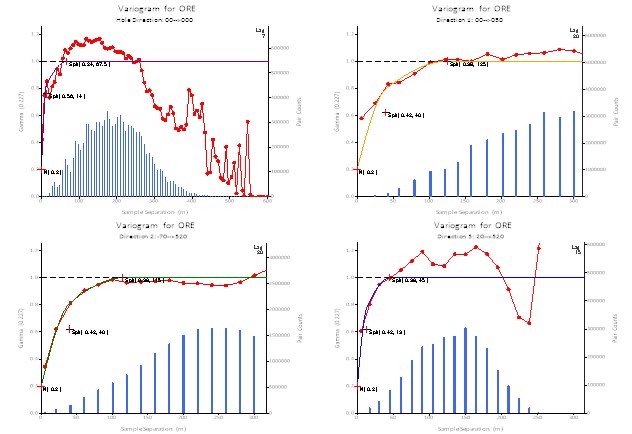
Source: CSA Global, 2019
Table 14-6 Variogram parameters for indicator variable (ORE)
|
Variable |
Rotation |
Nugget |
Structure 1 |
Structure 2 |
||
|
Partial sill |
Range (m) |
Partial sill |
Range (m) |
|||
|
ORE |
-40 |
0.20 |
0.42 |
40 |
0.38 |
125 |
|
70 |
40 |
115 |
||||
|
0 |
13 |
45 |
||||
Table 14-7 Search neighbourhood parameters for indicator variable (ORE) and NPOINTS
|
Variable |
Search volume 1 (SVOL1) |
Search volume 2 (SVOL2) |
MAXKEY |
||||
|
Range (m) |
Composites |
Range (m) |
Composites |
||||
|
Min. |
Max. |
Min. |
Max. |
||||
|
ORE |
45 x 35 x 7 |
12 |
20 |
SVOL1 x 3 |
8 |
16 |
4 |
|
NPOINTS |
45 x 35 x 7 |
0 |
9999 |
|
|
|
4 |
The dynamic anisotropy allowed the rotation angles for variograms to be defined individually for each cell in the models, so that the variogram orientation is aligned with the axes of mineralisation. These angles were dip direction (VANGLE1 = DIPDIRN) and true dip (VANGLE2 = TRUEDIP).
The indicator estimate produces a value between 0 and 1 which is then used as a probability for establishing if a cell is potentially mineralised. Specific probabilities are selected for each domain that represent expected mineralisation volumes. A trial volume with good exploration (EXP) and GC data coverage was used to benchmark probability thresholds and other variables to be used to define the mineralised volume to be used for both sample data flagging and subsequent grade estimation.
|
Asanko Gold Inc. NI 43-101 Technical Report on Asanko Gold Mine, Ghana |
Indicator kriging (IK) mineralised volume selection
A trial area for the IK mineralised volume parameter selection verification was selected, based on good EXP (Figure 14-7) and GC data coverage (Figure 14-8).
Figure 14-7 Trial area to compare EXP with GC data (Figure 14-8), coloured by geology
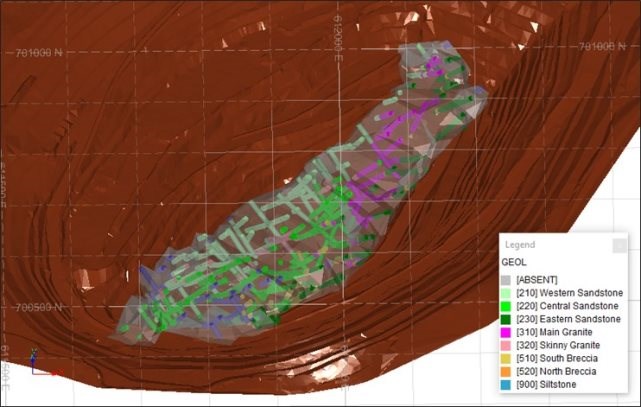
Note: December 2018 pit shell (brown)
Source: CSA Global, 2019
|
Asanko Gold Inc. NI 43-101 Technical Report on Asanko Gold Mine, Ghana |
Figure 14-8 Trial area to compare GC data with EXP data (Figure 14-7), coloured by geology
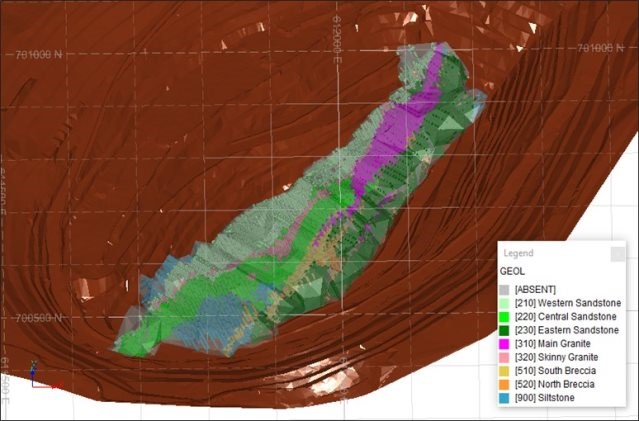
Note: December 2018 pit shell (brown)
Source: CSA Global, 2019
A GC IK model, estimated with ORE = 0 or 1 within the GC data, and an EXP IK model, estimated with ORE = 0 or 1 within the EXP data, were estimated. Through a process of trial and error a combination of three criteria were selected for defining the appropriate EXP IK mineralised volume. These were ORE (IK probability), KV (kriging variance) and NPOINTS (indicator of drill grid spacing within the search ellipsoid). The results of the EXP IK volume optimisation based on these three criteria are shown in Table 14-8, Table 14-9, Figure 14-9 and Figure 14-10. Domains with insufficient EXP data vary significantly from the GC data, which is not unexpected, however; on average the selected parameters define EXP mineralised volumes within ±2% of GC mineralised volumes (where KBcm refers to 1,000 bank cubic metre).
|
Asanko Gold Inc. NI 43-101 Technical Report on Asanko Gold Mine, Ghana |
Table 14-8 IK GC vs IK EXP model ore volume
|
Bench (m) |
nk_IK_USE_gc |
nk_IK_USE_ex |
||||
|
Volume (KBcm) |
ORE (%) |
Kriging variance |
Volume (KBcm) |
ORE (%) |
Kriging variance |
|
|
1,106 |
1.2 |
59 |
0.25 |
1.3 |
63 |
0.47 |
|
1,094 |
12.2 |
63 |
0.22 |
13.6 |
67 |
0.40 |
|
1,082 |
23.0 |
64 |
0.27 |
25.7 |
65 |
0.33 |
|
1,070 |
41.4 |
67 |
0.24 |
48.3 |
63 |
0.32 |
|
1,058 |
79.3 |
69 |
0.26 |
78.4 |
63 |
0.38 |
|
1,046 |
222.8 |
72 |
0.26 |
219.3 |
69 |
0.43 |
|
1,034 |
359.4 |
72 |
0.26 |
355.9 |
69 |
0.44 |
|
1,022 |
444.6 |
74 |
0.24 |
433.6 |
69 |
0.44 |
|
1,010 |
451.0 |
74 |
0.23 |
471.0 |
67 |
0.44 |
|
998 |
470.3 |
74 |
0.24 |
476.7 |
66 |
0.45 |
|
986 |
449.7 |
73 |
0.24 |
467.1 |
66 |
0.45 |
|
974 |
470.4 |
74 |
0.23 |
455.5 |
67 |
0.42 |
|
962 |
468.8 |
74 |
0.24 |
445.8 |
68 |
0.40 |
|
950 |
437.5 |
73 |
0.25 |
449.4 |
69 |
0.40 |
|
938 |
345.5 |
74 |
0.29 |
385.7 |
69 |
0.41 |
|
926 |
119.4 |
71 |
0.39 |
144.1 |
70 |
0.40 |
|
914 |
3.6 |
57 |
0.44 |
8.0 |
67 |
0.31 |
|
902 |
0.0 |
|
|
0.1 |
88 |
0.15 |
|
Grand total |
4,400.1 |
73 |
0.25 |
4,479.4 |
68 |
0.42 |
|
|
Difference % compared to GC |
|
|
|
||
|
|
BCM |
ORE % |
KV |
|
|
|
|
|
2% |
-8% |
69% |
|
|
|
Table 14-9 IK GC vs IK EXP back-flagged 'ore' samples
|
Bench (m) |
nk_dh_IK_USE_gc |
nk_dh_IK_USE_ex |
||||
|
Grade (Au g/t) |
LENGTH |
NSAMP |
Grade (Au g/t) |
LENGTH |
NSAMP |
|
|
1,106 |
0.96 |
23 |
15 |
1.90 |
2 |
2 |
|
1,094 |
2.12 |
294 |
196 |
0.50 |
23 |
23 |
|
1,082 |
1.46 |
329 |
219 |
1.31 |
54 |
54 |
|
1,070 |
2.41 |
851 |
567 |
2.49 |
116 |
116 |
|
1,058 |
2.07 |
1,415 |
943 |
1.75 |
79 |
79 |
|
1,046 |
2.07 |
3,852 |
2,568 |
1.59 |
277 |
277 |
|
1,034 |
2.15 |
6,524 |
4,349 |
2.27 |
337 |
339 |
|
1,022 |
2.15 |
9,179 |
6,119 |
1.62 |
429 |
429 |
|
1,010 |
2.05 |
9,615 |
6,410 |
1.69 |
428 |
428 |
|
998 |
2.01 |
9,656 |
6,437 |
1.98 |
395 |
395 |
|
986 |
1.76 |
9,480 |
6,320 |
2.50 |
338 |
338 |
|
974 |
1.79 |
10,359 |
6,906 |
1.68 |
448 |
448 |
|
962 |
1.88 |
9,956 |
6,637 |
2.13 |
471 |
471 |
|
950 |
1.77 |
8,624 |
5,749 |
1.70 |
495 |
495 |
|
938 |
1.66 |
4,901 |
3,267 |
2.07 |
499 |
499 |
|
926 |
1.42 |
650 |
433 |
1.46 |
208 |
208 |
|
914 |
1.50 |
15 |
10 |
1.27 |
31 |
31 |
|
Grand total |
1.93 |
85,718 |
57,145 |
1.89 |
4,630 |
4,632 |
|
|
Difference % compared to GC |
|
|
|
||
|
|
Au g/t |
LENGTH |
NSAMP |
|
|
|
|
|
-2% |
-95% |
-92% |
|
|
|
|
Asanko Gold Inc. NI 43-101 Technical Report on Asanko Gold Mine, Ghana |
Figure 14-9 IK GC vs IK EXP model ORE % and BCM - GEOL 210 (western sandstone)
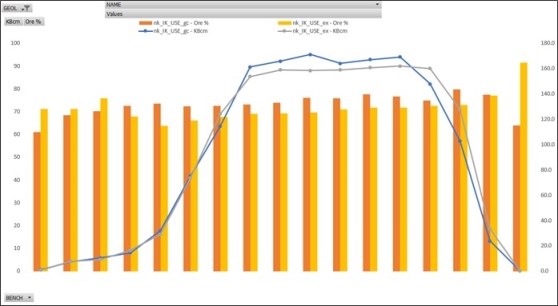
Source: CSA Global, 2019
Figure 14-10 IK GC vs IK EXP back-flagged 'ore' Au g/t and NSAMP
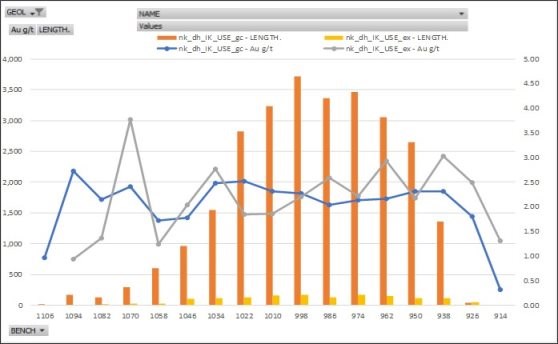
Source: CSA Global, 2019
Further fine tuning to determine the sensitivity of the EXP IK parameters to drill spacing was completed. This was required as some parts of the deposit have wider spaced drilling. The EXP drilling was separated into two halves - based on selection of every alternate 40 m section line (Figure 14-11). The statistics for the sub-divided EXP dataset are shown in Table 14-10 and Figure 14-12.
|
Asanko Gold Inc. NI 43-101 Technical Report on Asanko Gold Mine, Ghana |
Figure 14-11 Plan view - EXP data separated into Grid 1 (red) and Grid 2 (black)
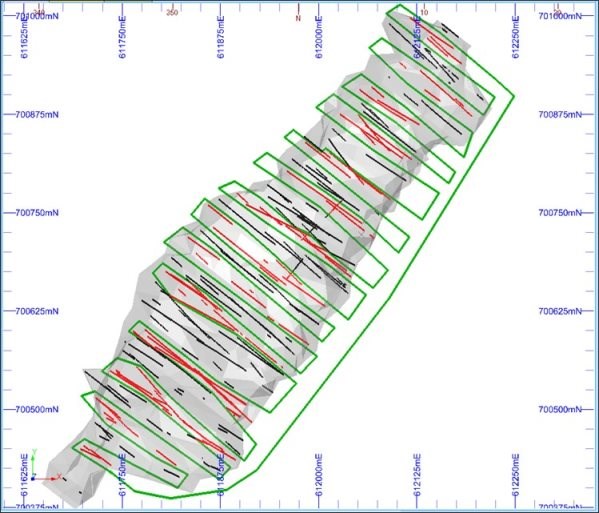
Source: CSA Global, 2019
Table 14-10 Statistics - EXP data separated into Grid 1 (nkg1) and Grid 2 (nkg2) by GEOL
|
Data Set: nkg1_0p3ex.ik.csv Field: AU Grouped by geological domains (GEOL) |
||||||||
|
Component |
Total |
210 |
220 |
230 |
310 |
320 |
510 |
520 |
|
Number |
5,610 |
1,287 |
1,737 |
671 |
909 |
307 |
283 |
68 |
|
Mean |
0.8 |
1.3 |
0.4 |
0.3 |
1.2 |
0.8 |
0.5 |
1.9 |
|
Variance |
9.6 |
15.7 |
3.8 |
5.2 |
18.6 |
7.2 |
6.2 |
22.3 |
|
Data Set: nkg2_0p3ex.ik.csv Field: AU Grouped by GEOL |
||||||||
|
Component |
Total |
210 |
220 |
230 |
310 |
320 |
510 |
520 |
|
Number |
6,210 |
1,627 |
2,127 |
767 |
621 |
318 |
316 |
80 |
|
Mean |
0.9 |
1.3 |
0.6 |
0.3 |
1.3 |
1.3 |
0.7 |
0.8 |
|
Variance |
12.1 |
16.5 |
9.6 |
2.0 |
23.0 |
31.3 |
2.4 |
3.8 |
|
Percent difference cf gd 1 |
||||||||
|
Component |
Total |
210 |
220 |
230 |
310 |
320 |
510 |
520 |
|
Number |
11% |
26% |
22% |
14% |
-32% |
4% |
12% |
18% |
|
Mean |
13% |
6% |
61% |
-11% |
6% |
59% |
23% |
-57% |
|
Variance |
26% |
5% |
154% |
-62% |
24% |
333% |
-62% |
-83% |
|
Asanko Gold Inc. NI 43-101 Technical Report on Asanko Gold Mine, Ghana |
Figure 14-12 Log probability plot of EXP data separated into Grid 1 (red) and Grid 2 (blue)
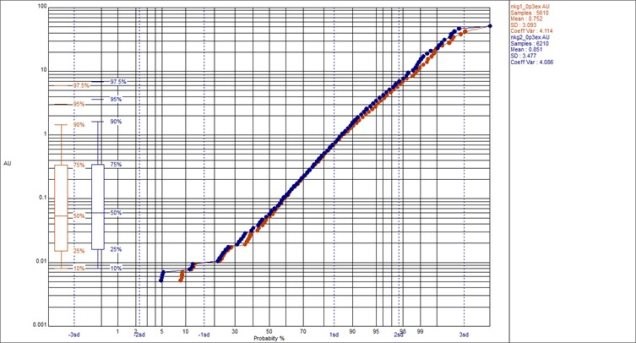
Source: CSA Global, 2019
The statistics and results for the EXP IK back flagged sample data and model, sub-divided into Grid 1 and Grid 2, are shown in Table 14-11, and Figure 14-13 and Figure 14-14. There is noticeable variability within the domains based on grid spacing, however; on average the two gold sample populations are similar.
|
Asanko Gold Inc. NI 43-101 Technical Report on Asanko Gold Mine, Ghana |
Table 14-11 Stats - EXP data separated into Grid 1 & 2 - Model (left) & back flagged sample data (right)
|
Bench (m) |
nk_IK_USE_exg1 |
nk_IK_USE_exg2 |
|||||||
|
Volume (KBcm) |
ORE (%) |
NPoints |
KV |
Volume |
ORE (%) |
NPoints |
KV |
||
|
1,106 |
2.0 |
46 |
7 |
0.55 |
2.0 |
55 |
7 |
0.66 |
|
|
1,094 |
16.3 |
53 |
7 |
0.53 |
19.3 |
57 |
6 |
0.58 |
|
|
1,082 |
29.6 |
59 |
10 |
0.47 |
25.4 |
60 |
7 |
0.52 |
|
|
1,070 |
47.7 |
61 |
10 |
0.45 |
36.5 |
63 |
10 |
0.46 |
|
|
1,058 |
73.6 |
59 |
9 |
0.53 |
67.8 |
63 |
10 |
0.49 |
|
|
1,046 |
177.1 |
69 |
6 |
0.56 |
216.6 |
65 |
8 |
0.52 |
|
|
1,034 |
305.1 |
68 |
6 |
0.57 |
344.6 |
65 |
8 |
0.53 |
|
|
1,022 |
402.7 |
66 |
7 |
0.58 |
419.7 |
65 |
8 |
0.54 |
|
|
1,010 |
462.1 |
65 |
8 |
0.57 |
458.4 |
64 |
8 |
0.55 |
|
|
998 |
480.9 |
64 |
8 |
0.55 |
466.4 |
64 |
9 |
0.57 |
|
|
986 |
479.4 |
65 |
9 |
0.55 |
472.8 |
65 |
8 |
0.57 |
|
|
974 |
455.3 |
64 |
9 |
0.53 |
482.7 |
64 |
9 |
0.55 |
|
|
962 |
456.5 |
64 |
10 |
0.53 |
471.9 |
66 |
9 |
0.53 |
|
|
950 |
447.7 |
64 |
9 |
0.54 |
461.9 |
67 |
9 |
0.53 |
|
|
938 |
347.2 |
65 |
8 |
0.53 |
384.5 |
68 |
8 |
0.54 |
|
|
926 |
127.1 |
66 |
9 |
0.51 |
158.6 |
70 |
7 |
0.57 |
|
|
914 |
5.8 |
69 |
8 |
0.59 |
7.9 |
69 |
9 |
0.39 |
|
|
902 |
0.0 |
|
|
|
0.1 |
91 |
8 |
0.16 |
|
|
Grand total |
4,316.2 |
65 |
8 |
0.55 |
4,496.9 |
65 |
8 |
0.55 |
|
|
Bench (m) |
nk_dh_IK_USE_exg1 |
nk_dh_IK_USE_exg2 |
||||
|
Grade |
LENGTH |
NSAMP |
Grade |
LENGTH |
NSAMP |
|
|
1,106 |
1.90 |
2 |
2 |
|
|
|
|
1,094 |
0.61 |
19 |
19 |
0.02 |
4 |
4 |
|
1,082 |
1.39 |
27 |
27 |
1.23 |
27 |
27 |
|
1,070 |
2.61 |
67 |
67 |
2.33 |
49 |
49 |
|
1,058 |
1.01 |
27 |
27 |
2.10 |
53 |
53 |
|
1,046 |
1.54 |
132 |
132 |
1.63 |
145 |
145 |
|
1,034 |
1.66 |
157 |
157 |
2.73 |
185 |
187 |
|
1,022 |
1.73 |
179 |
180 |
1.49 |
250 |
250 |
|
1,010 |
1.93 |
187 |
187 |
1.52 |
235 |
235 |
|
998 |
1.84 |
218 |
218 |
2.26 |
168 |
168 |
|
986 |
2.85 |
165 |
165 |
2.14 |
175 |
175 |
|
974 |
1.68 |
223 |
223 |
1.67 |
228 |
228 |
|
962 |
1.86 |
184 |
184 |
2.26 |
286 |
286 |
|
950 |
1.84 |
243 |
243 |
1.55 |
253 |
253 |
|
938 |
1.17 |
252 |
252 |
3.03 |
244 |
244 |
|
926 |
1.01 |
128 |
128 |
2.18 |
80 |
80 |
|
914 |
0.90 |
8 |
8 |
1.24 |
27 |
27 |
|
902 |
|
|
|
|
|
|
|
Grand |
1.74 |
2,218 |
2,219 |
2.01 |
2,409 |
2,411 |
|
Parameter |
GC model |
Full EXP model |
||||||
|
Volume |
ORE (%) |
NPoints |
KV |
Volume |
ORE (%) |
NPoints |
KV |
|
|
Grand total |
4,400.1 |
73 |
|
0.25 |
4,479.4 |
68 |
16 |
0.42 |
|
Diff % GC vs EXP |
2% |
|
|
|
|
|
|
|
|
Diff % GC vs EXG1 |
-2% |
|
|
|
|
|
|
|
|
Diff % GC vs EXG2 |
2% |
|
|
|
|
|
|
|
|
Asanko Gold Inc. NI 43-101 Technical Report on Asanko Gold Mine, Ghana |
Figure 14-13 EXP Grid 1 vs Grid 2 model ORE % and BCM - GEOL 210 (western sandstone)

Source: CSA Global, 2019
Figure 14-14 EXP Grid 1 vs Grid 2 back-flagged 'ore' samples - Au g/t and NSAMP
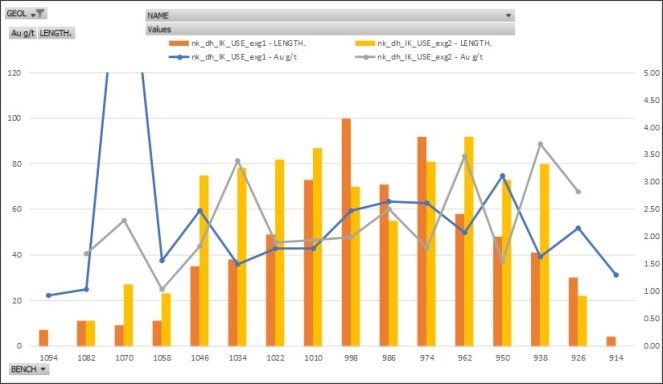
Source: CSA Global, 2019
|
Asanko Gold Inc. NI 43-101 Technical Report on Asanko Gold Mine, Ghana |
The conclusions and observations of the IK testwork are as follows:
-
IK parameters can be optimised based on ORE %, and KV within NPOINTS groups (<9, 9 - 24, >24) by GEOL domain
-
Demonstrates ability to match ORE BCM by geology to within ±2% globally for all test models including splitting the EXP drill grid into two spatially representative separate datasets
-
Volume variability within GEOL domains generally better than ±3% for larger domains (210, 220, 230 and 310)
-
Model ORE % (Indicator) and average Sample Au g/t graphs demonstrate the differences between GC and EXP data on a 12 m level basis. These differences impact the accuracy of the EXP drilling to predict both the mineralisation volume and grade of mineralisation. In some levels (BENCH) and GEOL there are very significant differences, which if persist at depth (below the existing GC data), will result in significant variance between predicted (MRE) and actual in the ground volumes and grade
-
The GEOL domains which will behave poorly are 230, 320, 510 and 520 with variances of ±50% on both tonnes and grade to be expected
-
Additional drilling in advance of mining will be required to reduce the risk - ("site based dynamic modelling").
Mineralised volume coding and sample back flagging
Following the IK estimation, the mineralised volume selection criteria were used to code IK_USE into the block model. IK_USE = 1 represents the expected mineralisation volumes within each GEOL domain with IK_USE = 0 for waste. The probability threshold, KV factor and NPOINTS criteria derived from the results of the comparison with the GC model, were applied as shown in Table 14-12 to assign IK_USE.
The COMPSE exploration sample data was back-flagged with the IK_USE values in the IK model. An example of the IK model with back-flagged exploration data coded by IK_USE is presented in Figure 14-15.
Table 14-12 Criteria for defining the indicator probability parameter representing expected mineralisation
|
NPOINTS |
Geology |
GEOL |
ORE |
KV |
Elevation (mRL) |
|
<9 |
Western Sandstone |
210 |
≥0.35 |
≤0.80 |
|
|
≥0.35 |
≤0.85 |
ZC>749 AND ZC<950 |
|||
|
Central Sandstone |
220 |
≥0.35 |
≤0.80 |
|
|
|
≥0.35 |
≤0.85 |
ZC>749 AND ZC<950 |
|||
|
Eastern Sandstone |
230 |
≥0.26 |
≤0.80 |
|
|
|
Main Granite |
310 |
≥0.32 |
≤0.80 |
|
|
|
Skinny Granite |
320 |
≥0.24 |
≤0.90 |
|
|
|
South Breccia |
510 |
≥0.36 |
≤0.75 |
|
|
|
North Breccia |
520 |
≥0.37 |
≤0.75 |
|
|
|
≥9 and <24 |
Western Sandstone |
210 |
≥0.37 |
≤0.75 |
|
|
≥0.37 |
≤0.85 |
ZC>749 AND ZC<950 |
|||
|
Central Sandstone |
220 |
≥0.37 |
≤0.70 |
|
|
|
≥0.35 |
≤0.85 |
ZC>749 AND ZC<950 |
|||
|
Eastern Sandstone |
230 |
≥0.26 |
≤0.80 |
|
|
|
Main Granite |
310 |
≥0.34 |
≤0.70 |
|
|
|
≥0.34 |
≤0.90 |
ZC>749 and ZC<977 |
|||
|
Skinny Granite |
320 |
≥0.24 |
≤0.75 |
|
|
|
South Breccia |
510 |
≥0.34 |
≤0.75 |
|
|
|
North Breccia |
520 |
≥0.37 |
≤0.70 |
|
|
Asanko Gold Inc. NI 43-101 Technical Report on Asanko Gold Mine, Ghana |
|
NPOINTS |
Geology |
GEOL |
ORE |
KV |
Elevation (mRL) |
|
≥24 |
Western Sandstone |
210 |
≥0.37 |
≤0.50 |
|
|
≥0.37 |
≤0.65 |
ZC>749 and ZC<950 |
|||
|
Central Sandstone |
220 |
≥0.37 |
≤0.55 |
|
|
|
≥0.37 |
≤0.60 |
ZC>749 AND ZC<950 |
|||
|
Eastern Sandstone |
230 |
≥0.26 |
≤0.70 |
|
|
|
Main Granite |
310 |
≥0.34 |
≤0.58 |
|
|
|
≥0.34 |
≤0.62 |
ZC>842 AND ZC<968 |
|||
|
Skinny Granite |
320 |
≥0.24 |
≤0.58 |
|
|
|
South Breccia |
510 |
≥0.34 |
≤0.60 |
|
|
|
North Breccia |
520 |
≥0.37 |
≤0.60 |
|
Figure 14-15 Cross-section showing mineralised volume model and back-flagged exploration data
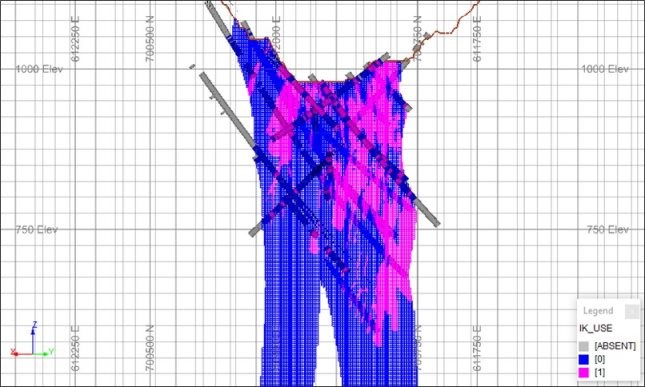
Note: Mineralised volume model and back-flagged exploration data coloured on the indicator probability parameter
Source: CSA Global, 2019
14.5.2 Statistical analysis
Hole type analysis
Statistics were reviewed for the flagged exploration drill hole data to assess for bias in Au grade between the sample types (DD, RC and RCD). Data used for the statistics review were restricted to samples flagged as ORE = 1, based on a selective compositing process called COMPSE where the minimum grade used to delineate mineralisation from waste was 0.3 g/t Au, with a minimum true width of 3 m.
Data used for grade estimation were restricted to 1 m, top-cut composites, flagged as IK_USE = 1, based on criteria defined during the IK process comparing GC and EXP estimates. As only fresh material remains in the Nkran pit, only fresh material composites were used in the grade estimate.
There is a minor high-grade bias within the DD samples when compared to the RC and RCD samples, below 0.3 g/t Au (Figure 14-16 and Figure 14-17), which is due to the different sampling regimes, as well as the criteria to define mineralisation (based on COMPSE - ORE = 1, and grade estimation - IK_USE = 1). The limited number of RC composites used for OK does not give a meaningful comparative result.
CSA Global considers any potential risk due to the slight sample bias as minimal.
|
Asanko Gold Inc. NI 43-101 Technical Report on Asanko Gold Mine, Ghana |
Figure 14-16 Log probability plot comparing top-cut Au grades: DD (red), RC (blue), RCD (green)
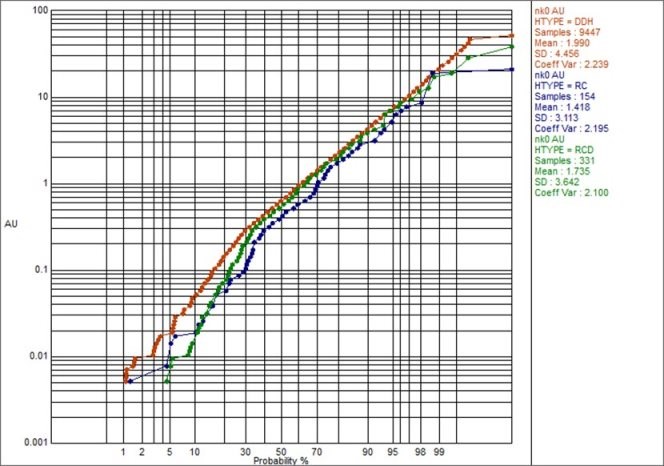
Note: Samples used for IK, restricted to ORE = 1, based on COMPSE criteria
Source: CSA Global, 2019
|
Asanko Gold Inc. NI 43-101 Technical Report on Asanko Gold Mine, Ghana |
Figure 14-17 Log probability plot comparing top-cut Au grades in DD (red), RC (blue), RCD (green)
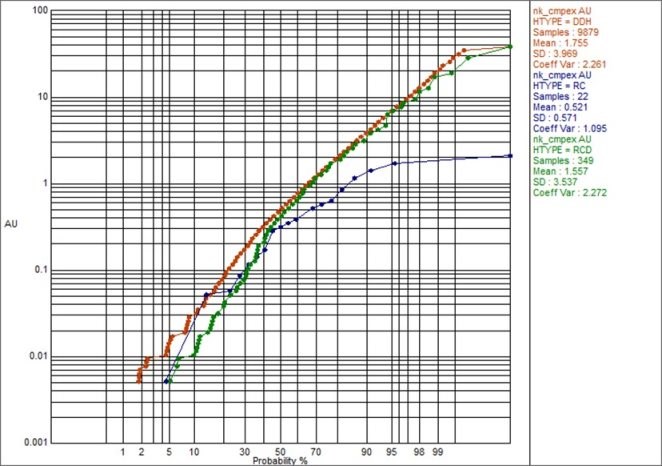
Note: 1 m, top-cut composites used for grade estimation, were restricted to IK_USE = 1, based on criteria defined during IK testwork
Source: CSA Global, 2019
Recovery
Core recovery data were reviewed for DD and RCD core, selected below the 31 May 2017 mined surface. Recovery percentage values greater than 100% and less than 105% were reset to 100%. Values greater than 105% were removed from the analysis.
The review results show that recoveries are reasonable within oxide (74% for 357 intercepts), good within transitional (85% for 140 intercepts) and excellent within fresh material (98% for 6,458 intercepts), as reported in Figure 14-18. Oxide material in core accounts for 5% of the recovery data, whereas transitional and fresh material in core accounts for 2% and 93% of the recovery data, respectively.
|
Asanko Gold Inc. NI 43-101 Technical Report on Asanko Gold Mine, Ghana |
Figure 14-18 Normal histogram plot, core recoveries grouped by weathering
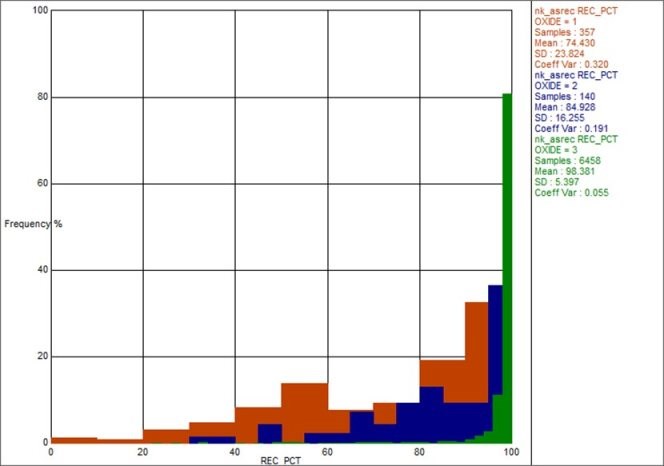
Red = oxide; blue = transitional; green = fresh
Source: CSA Global, 2019
Only composites in fresh material were used in the grade estimate. Core recovery for the fresh material was reviewed by drill hole type, with results showing good recovery for both DD (98% for 6,135 intercepts) and RCD (98% for 323 intercepts).
Review of the core recovery data indicates that there is no relationship between grade and recovery.
Naïve statistics
The samples were coded by geological and mineralisation domains, and oxidation state. Summaries of the domain codes, used to distinguish the data during geostatistical analysis and estimation, are shown in Table 14-13. ESTZON defines the mineralisation domains and is based on GEOL, and where IK_USE = 1.
The naïve statistics, per estimation domain (ESTZON), are shown in Table 14-14.
|
Asanko Gold Inc. NI 43-101 Technical Report on Asanko Gold Mine, Ghana |
Table 14-13 Data field flagging and description
|
Field |
Code |
Description |
|
OXIDE |
1 2 3 |
Oxide Transitional Fresh/Sulphide |
|
GEOL |
210 220 230 310 320 510 520 900 |
Western Sandstone Central Sandstone Eastern Sandstone Main Granite Skinny Granite South Breccia North Breccia Siltstone/Waste |
|
ESTZON |
210 220 230 310 320 510 |
Western Sandstone and IK_USE = 1 Central Sandstone and IK_USE = 1 Eastern Sandstone and IK_USE = 1 Main Granite and IK_USE = 1 Skinny Granite and IK_USE = 1 South Breccia/North Breccia and IK_USE = 1 |
|
IK_USE |
0 1 |
Waste Mineralisation |
Table 14-14 Naïve statistics per domain where IK_USE = 1
|
ESTZON |
#Samples |
Minimum |
Maximum |
Mean |
SD |
CV |
|
210 |
4,504 |
0.003 |
364.00 |
2.32 |
8.17 |
3.52 |
|
220 |
2,721 |
0.003 |
96.93 |
1.59 |
4.65 |
2.92 |
|
230 |
547 |
0.003 |
24.00 |
1.31 |
2.75 |
2.10 |
|
310 |
1,398 |
0.005 |
192.80 |
1.45 |
7.54 |
5.20 |
|
320 |
650 |
0.005 |
101.00 |
1.84 |
5.76 |
3.12 |
|
510 |
596 |
0.003 |
38.66 |
1.48 |
3.05 |
2.06 |
Note: SD - Standard deviation; CV - Coefficient of variation
Compositing
CSA Global reviewed all sample lengths for the exploration drill data, coded as mineralised (IK_USE = 1). The dominant as well as the mean sample length within the drill data is 1 m (Figure 14-19), which was selected as the compositing length. Prior to compositing, data flagged as oxide and transitional were removed, since the area for the current MRE update is all within fresh material.
During the compositing process in Datamine StudioRM™, the zone code (ESTZON) controlling the compositing was set to a combination of both the GEOL and IK_USE units i.e. new composites were created each time the value of ESTZON changed. No residuals were excluded from the geostatistical analysis and the estimate. The potential bias impact of retaining the six residuals were considered minimal (Figure 14-20).
The descriptive analysis for the composites by estimation domain is shown in Table 14-15.
|
Asanko Gold Inc. NI 43-101 Technical Report on Asanko Gold Mine, Ghana |
Table 14-15 Composite statistics per domain
|
ESTZON |
#Samples |
Minimum |
Maximum |
Mean |
SD |
CV |
|
210 |
4,505 |
0.003 |
364.00 |
2.32 |
8.17 |
3.52 |
|
220 |
2,649 |
0.003 |
96.93 |
1.59 |
4.67 |
2.93 |
|
230 |
547 |
0.003 |
24.00 |
1.31 |
2.75 |
2.10 |
|
310 |
1,398 |
0.005 |
192.80 |
1.45 |
7.54 |
5.20 |
|
320 |
650 |
0.005 |
101.00 |
1.84 |
5.76 |
3.12 |
|
510 |
501 |
0.005 |
38.66 |
1.59 |
3.15 |
1.98 |
Note: SD - Standard deviation; CV - Coefficient of variation
Figure 14-19 Histogram of mineralised sampling intervals (IK_USE = 1)
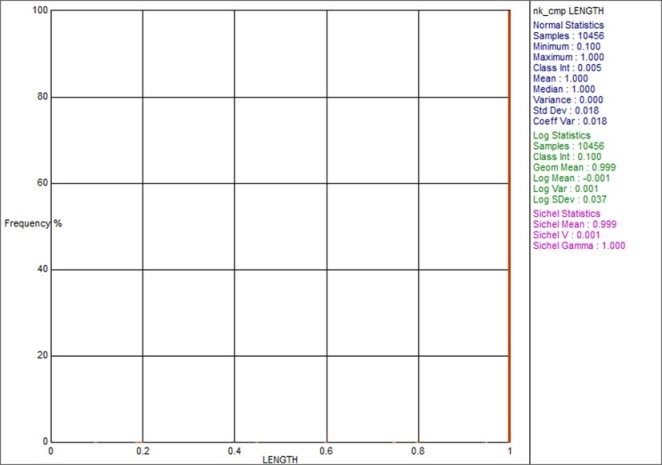
Source: CSA Global, 2019
|
Asanko Gold Inc. NI 43-101 Technical Report on Asanko Gold Mine, Ghana |
Figure 14-20 Residual analysis post-compositing
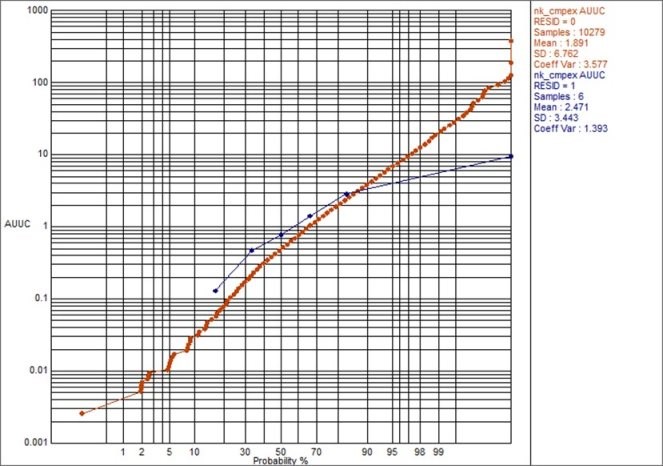
Note: Red - not residual; blue - residual
Source: CSA Global, 2019
Grade capping
Grade caps (top-cuts) were reviewed by disintegration analysis of probability plots and histograms and were applied to all domains to reduce the impact of outliers, which although real, are unrepresentative of the underlying grade distribution.
The number of extreme values cut was minimal compared to the total domain population, and cutting these values had insignificant impact on the mean grade of most domains. Domain 310 (Main Granite) had a 17% decrease in mean grade. Spatial review of the 7 out of 1,398 samples top-cut supports the validity of applying the 40 g/t Au top-cut, as the high-grade outliers were randomly scattered throughout the zone.
Composites greater than the top-cut values were reset to the respective top-cut values. The uncut and top-cut statistics, including the impact on metal cut and number of samples cut, per estimation domain, are shown in Table 14-16.
|
Asanko Gold Inc. NI 43-101 Technical Report on Asanko Gold Mine, Ghana |
Table 14-16 Top-cut statistics per domain
|
ESTZON |
Top-cut |
#Samples |
#Samples cut |
Uncut mean |
Cut mean |
Metal cut (%) |
|
210 |
40 |
4,505 |
16 |
2.32 |
2.13 |
-8% |
|
220 |
40 |
2,649 |
7 |
1.59 |
1.51 |
-5% |
|
230 |
18 |
547 |
1 |
1.31 |
1.30 |
-1% |
|
310 |
40 |
1,398 |
7 |
1.45 |
1.21 |
-17% |
|
320 |
30 |
650 |
3 |
1.84 |
1.68 |
-9% |
|
510 |
25 |
501 |
2 |
1.59 |
1.56 |
-2% |
14.5.3 Bulk density
In-situ dry bulk density (BD) data provided by Asanko Gold was reviewed by CSA Global. The BD dataset consisted of point density data, measured from in-pit grab samples, and billets of drill core. Drill core billets were de-surveyed with collar and survey data, to locate them in 3D space. In-pit grab samples were generally located by GPS in most cases, allowing them to be modelled in 3D space.
BD measurements for the Nkran deposit were determined by applying the "Archimedes" method (water displacement). The BD is calculated with the following formula:

BD samples were flagged by the weathering surfaces, prior to analysis. As most mining is well below the weathered and oxidised surface, most samples resided in the fresh domain. Median and mean densities for fresh sandstone, the dominant ore host rock, were in the region of 2.67 to 2.71 t/m3 with low variance. Other fresh lithologies (granite, breccia and siltstone) indicated a similar BD. On this basis, a BD of 2.68 t/m3 (median of in-pit density in fresh rock, Figure 14-21) was selected for all fresh material, which matches the survey-reconciled BD currently determined during mining. Densities for partially weathered material were set at ~75% of the fresh material, 2.00 t/m3, and totally weathered material set at ~65% of the fresh material, 1.72 t/m3. It is important to note that only 0.1% of the remaining mining volume is oxide and transitional, so the accuracy of these in-situ dry bulk densities is not significant. There is no relationship between BD and gold or arsenic grade, allowing density to be applied based on lithology.
14.5.4 Block model
A volume model was built in Datamine StudioRMTM using geology, oxide, fault (Western Bounding Shear) and depletion wireframe. A parent cell size of 10 m x 20 m x 6 m (XYZ) was used and sub-cells were applied where appropriate to honour wireframe volumes.
The model was cut to below the 31 May 2017 depletion surface. A model prototype with parent cells and sub-celling was constructed, with parameters as shown in Table 14-17. The model was not rotated.
Block model attributes are shown in Table 14-18. The IK_USE and ESTZON fields were coded following IK.
|
Asanko Gold Inc. NI 43-101 Technical Report on Asanko Gold Mine, Ghana |
Figure 14-21 Histogram of in-pit density - Fresh rock
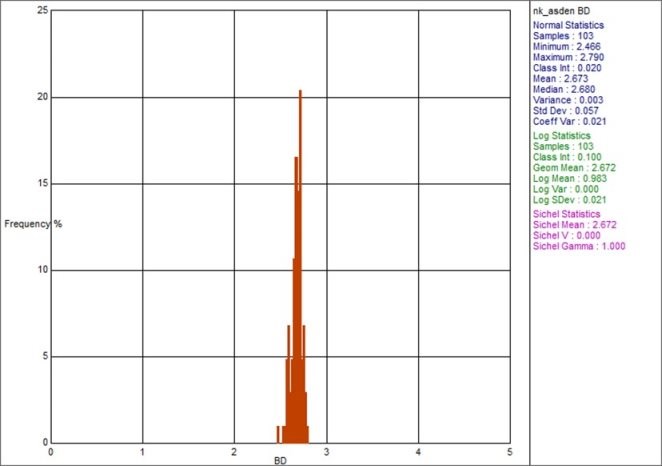
Source: CSA Global, 2019
Table 14-17 Block model dimensions
|
Axis |
Origin (m) |
Model extent (m) |
n blocks |
Maximum cell size (m) |
Minimum cell size (m) |
|
Easting (X) |
610,500 |
2,500 |
250 |
10 |
2.5 |
|
Northing (Y) |
699,600 |
2,400 |
120 |
20 |
2.5 |
|
Elevation (Z) |
494 |
1,212 |
202 |
6 |
3.0 |
Table 14-18 Block model attributes
|
Attribute |
Wireframe (if applicable) |
Code |
Code description |
|
GEOL |
western_sandstone |
210 |
Western Sandstone |
|
central_sandstone |
220 |
Central Sandstone |
|
|
eastern_sandstone |
230 |
Eastern Sandstone |
|
|
main_granite |
310 |
Main Granite |
|
|
skinny_granite |
320 |
Skinny Granite |
|
|
south_breccia |
510 |
South Breccia |
|
|
north_breccia |
520 |
North Breccia |
|
|
|
900 |
Siltstone |
|
|
FAULT |
nk_wbs |
1 |
Western Bounding Fault |
|
OXIDE |
base_oxide |
1 |
Base of complete weathering |
|
base_oxide/top_fresh |
2 |
Between base of complete weathering and Top of Fresh |
|
|
top_fresh |
3 |
Top of Fresh material |
|
Asanko Gold Inc. NI 43-101 Technical Report on Asanko Gold Mine, Ghana |
|
Attribute |
Wireframe (if applicable) |
Code |
Code description |
|
DENSITY |
In situ dry bulk density (t/m3) |
1.72 |
Strongly Weathered Rock |
|
2.00 |
Moderately Weathered Rock |
||
|
2.68 |
Fresh Rock |
||
|
TOPO |
nk_full_may17 |
1 |
Below 31 May 2017 Mined Surface |
|
IK_USE |
|
0 |
Waste |
|
1 |
Mineralisation |
||
|
ESTZON |
|
210 |
Western Sandstone and IK_USE = 1 |
|
220 |
Central Sandstone and IK_USE = 1 |
||
|
230 |
Eastern Sandstone and IK_USE = 1 |
||
|
310 |
Main Granite and IK_USE = 1 |
||
|
320 |
Skinny Granite and IK_USE = 1 |
||
|
510 |
South Breccia/North Breccia and IK_USE = 1 |
14.5.5 Grade estimation
The Nkran Mineral Resource has been estimated using post-processing of OK panel estimates to produce a recoverable Mineral Resource by using uniform and localised conditioning algorithms (UC/LUC). This method provides SMU scale block estimates that honour the theoretical grade-tonnage relationship determined from discrete Gaussian change of support. UC results for the OK panels are transferred to SMU blocks using LUC. The confidence in the result is related to sample spacing and the nature of the spatial variance.
The domain containing the most gold metal is 210 and results from this domain (ESTZON) are used to demonstrate the workflow.
Declustering
Sensitivity of each domain to clustering was considered, and while it was noted that the mean grade was not overly sensitive to a range of declustered cell sizes, declustering was applied.
Declustering at Nkran was undertaken in two stages. For preliminary statistics and first pass estimation, a cell weighting strategy was used, honouring the nominal drill spacing of 20 m x 40 m. Following first pass OK, the kriging weights were written out and the process was re-run. The process using kriging declustering weights is what was used to generate the estimate and what is presented here.
Gaussian anamorphosis modelling
UC uses the Gaussian anamorphosis and Hermitian polynomial to define the distributions of point, SMU and panel scale estimates. Hermite polynomials were applied to the composited top-cut samples (declustered using OK panel weights) for transformation to a normal distribution.
The Gaussian anamorphosis model for domain 210 is presented in Figure 14-22, with the histograms for the composite Au grades for the domain presented in Figure 14-23 alongside the Gaussian transformed values. The Gaussian transform has resulted in a mean of zero and a variance of one, as expected.
|
Asanko Gold Inc. NI 43-101 Technical Report on Asanko Gold Mine, Ghana |
Figure 14-22 Gaussian anamorphosis model for Domain 210
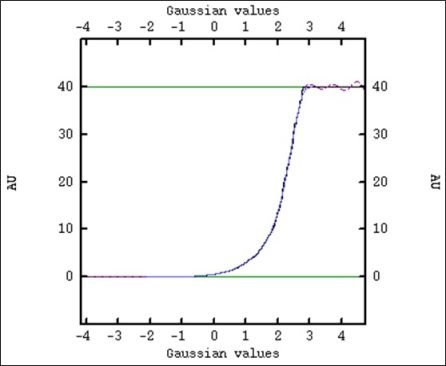
Source: CSA Global, 2019
|
Asanko Gold Inc. NI 43-101 Technical Report on Asanko Gold Mine, Ghana |
Figure 14-23 Histogram of Au (left) and Gaussian transformed Au (right) for Domain 210

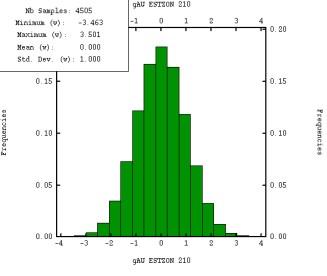
Source: CSA Global, 2019
Variography
Due to availability of close spaced data, the variograms were modelled for Au using the 1.5 m top-cut GC data - back-flagged with the IK_USE parameter and restricted to the trial area used for the IK testwork. Nuggets were obtained from the downhole variograms. Directional experimental semi variograms were calculated in Gaussian space and modelled, and then back-transformed to raw space.
Although nuggets and sills were obtained from the 1.5 m GC data in SupervisorTM, they were scaled to the 1 m exploration sample variance when used in ISATISTM, prior to change of support calculations and estimation.
The semi-variograms were moderately structured (smaller domains 230, 310, 320 and 510) to well structured (larger domains 210 and 220). Variograms were characterised by moderate to high nuggets (43%), short scale structures of approximately 60 m and longer scale structure of approximately 85 m. The variograms were back-transformed prior to estimation and results for domain 210 are shown in Figure 14-24 and Figure 14-25. Table 14-19 shows the variogram model parameters used for OK and change of support calculations. It is important to note that even though the variogram ranges of up to 85 m may indicate good continuity, most of the spatial variability occurs at distances between 5 m and 10 m. This supports the requirement for close spaced GC drilling to provide definition of mining blocks.
|
Asanko Gold Inc. NI 43-101 Technical Report on Asanko Gold Mine, Ghana |
Dynamic anisotropy was used during estimation to allow the rotation angles for variograms to be defined individually for each cell in the models, so that the variogram orientation is aligned with the axes of mineralisation which based on geological evidence follows the primary directions of the shear structures within the deposit. These angles were dip direction (VANGLE1 = DIPDIRN) and true dip (VANGLE2 = TRUEDIP).
Figure 14-24 Experimental variogram and model (Gaussian space) for Au g/t in Domain 210
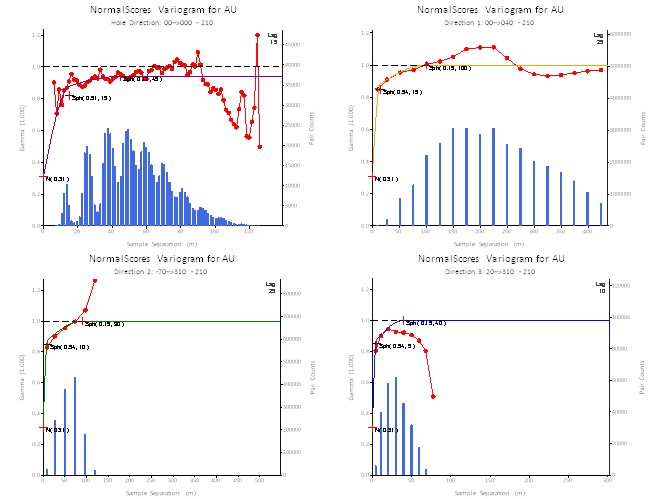
Source: CSA Global, 2019
|
Asanko Gold Inc. NI 43-101 Technical Report on Asanko Gold Mine, Ghana |
Figure 14-25 Back transformed variogram model for Au g/t in Domain 210 (normalised to 1)
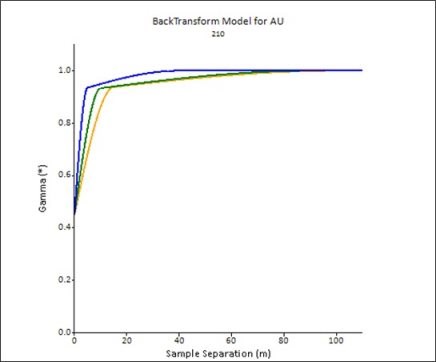
Source: CSA Global, 2019
Table 14-19 Variogram models for Au g/t
|
ESTZON |
Rotation (ISATISTM ZYX) |
Nugget |
Structure 1 |
Structure 2 |
||
|
Partial sill |
Range (m) |
Partial sill |
Range (m) |
|||
|
210 |
50 |
8.03 |
8.39 |
15 |
1.43 |
100 |
|
0 |
10 |
90 |
||||
|
-70 |
5 |
40 |
||||
|
220 |
50 |
4.63 |
5.70 |
10 |
0.43 |
55 |
|
0 |
10 |
50 |
||||
|
-80 |
8 |
35 |
||||
|
230 |
60 |
3.14 |
3.00 |
10 |
1.17 |
85 |
|
0 |
10 |
30 |
||||
|
-80 |
4.5 |
12 |
||||
|
310 |
70 |
5.09 |
6.18 |
45 |
0.85 |
110 |
|
0 |
40 |
80 |
||||
|
-80 |
10 |
30 |
||||
|
320 |
50 |
5.28 |
6.75 |
10 |
0.25 |
50 |
|
0 |
10 |
50 |
||||
|
-80 |
10 |
20 |
||||
|
510 |
60 |
3.96 |
3.96 |
15 |
1.29 |
100 |
|
0 |
15 |
80 |
||||
|
-80 |
10 |
20 |
||||
|
Asanko Gold Inc. NI 43-101 Technical Report on Asanko Gold Mine, Ghana |
Ordinary kriging (OK)
Gold grade was estimated using OK into 10 m x 20 m x 6 m (XYZ) panels and 5 m x 5 m x 3 m SMUs in ISATISTM. It is important to note that the mining SMU is larger than 5 m x 5 m in XY, however; as Asanko Gold do not use a local mine grid rotated to the dominant mineralisation strike direction, CSA Global were required to use the smaller SMU to honour mineralisation geometry. This compromise does mean that the MRE grade will need to be smoothed (lower grade, high tonnes) for Mineral Reserve estimation.
Search ellipsoid orientations were defined by dynamic anisotropy, derived from the interpreted structures and geological controls. The dip and dip direction of the major axis of anisotropy were calculated from the interpreted shear structural wireframes (Freelander, County and Discovery) using the process ANISOANG in Datamine StudioRMTM, which calculates the dip direction (SANGLE1_F) as well as the true dip angles (SANGLE2_F).
Sample search neighbourhoods were extended to ensure a smoothed panel estimate, a requirement for UC. The OK estimate used for ranking the SMUs for LUC requires increased variability, so the minimum and maximum number of samples were decreased substantially.
Support correction
Block and point anamorphosis modelling of the estimated values and sampled data were undertaken as the primary input for UC. The support definition for the block anamorphosis is based on the SMU size (5 m x 5 m x 3 m). Information effect, based on the GC drill spacing, was computed. Block support correction values for each of the domains range from 0.67 to 0.84 and following application of 10 m x 10 m x 1 m information effect reduced to 0.62 to 0.80 (Table 14-20).
Table 14-20 Change of Support calculations
|
ESTZON |
Raw block support correction (r) |
Final block support correction (s) |
|
210 |
0.68 |
0.64 |
|
220 |
0.71 |
0.67 |
|
230 |
0.67 |
0.62 |
|
310 |
0.84 |
0.80 |
|
320 |
0.72 |
0.67 |
|
510 |
0.75 |
0.69 |
Uniform conditioning (UC)
Estimation of recoverable resources was completed using UC.
The input for UC was the OK model at the panel (large block) scale and the output was a grade-tonnage curve for each panel at the SMU scale for Au g/t.
Dispersion variance is the attribute that contributes to the level of de-smoothing or grade variability that is modelled in UC. It is estimated during OK along with the grade of the panel. During UC, 90 cut-offs were used to discretise the grade tonnage curves and variable dispersion variances were used per panel.
Localised uniform conditioning (LUC)
The UC grade (Q) and tonnage (T) factors of the panel were proportioned based on the domain SMU in the panel to accurately represent Q (metal), T (tonnes) and M (grade) in the domain.
To provide a block model for use in mine planning, SMU sized blocks were kriged and the resultant SMUs were ranked from 1 to 64 (highest to lowest grade), with the actual grades being discarded and only the ranking remaining. Grades were then read off the panel grade-tonnage curve for each SMU (from highest to lowest grade) and assigned based on the estimated ranking, through a process called LUC. The result is the assignment of single grades to SMU sized blocks so that the 64 SMUs in each panel achieve a grade-tonnage tabulation matching that of the panel estimated through UC.
|
Asanko Gold Inc. NI 43-101 Technical Report on Asanko Gold Mine, Ghana |
To assess the performance of the LUC process, grade tonnage curves from LUC were compared to those derived from UC for the main domains. These were found to be comparable.
14.5.6 Block model validations
Validation of the block model was completed by comparing input and output means. Several techniques were used for the validation. These included:
-
Validation of the OK panel results through visual review (cross section/plan views and 3D), statistical comparison of blocks and composites, and swath plots
-
Validation of UC results by comparing OK, UC and LUC results at a 0 g/t Au cut-off.
OK panel validation
Visual
The block models were visually reviewed, section by section, and in 3D to ensure that the grade tenor of the input data was reflected in the block models. Generally, the estimates compare well with the input data.
An example cross section for the largest domain 210 is shown in Figure 14-26. The grades in the composites align with the corresponding grades in the block model.
Swath plots
Swath plots were created as part of the validation process, by comparing the model block grades and input composites (declustered and top cut) in spatial increments of northing, easting and elevation slices. Swath plots for domain 210 are shown in Figure 14-27.
The plots show that the distribution of block grades honours the distribution of input composite grades. The degree of smoothing is appropriate and accounts for volume variance effects, where block grades should be smoother than point grades. The general trend of the composite grades is reflected in the block models.
|
Asanko Gold Inc. NI 43-101 Technical Report on Asanko Gold Mine, Ghana |
Figure 14-26 Cross-section view - OK panel model and composites (Domain 210 - Western Sandstone)
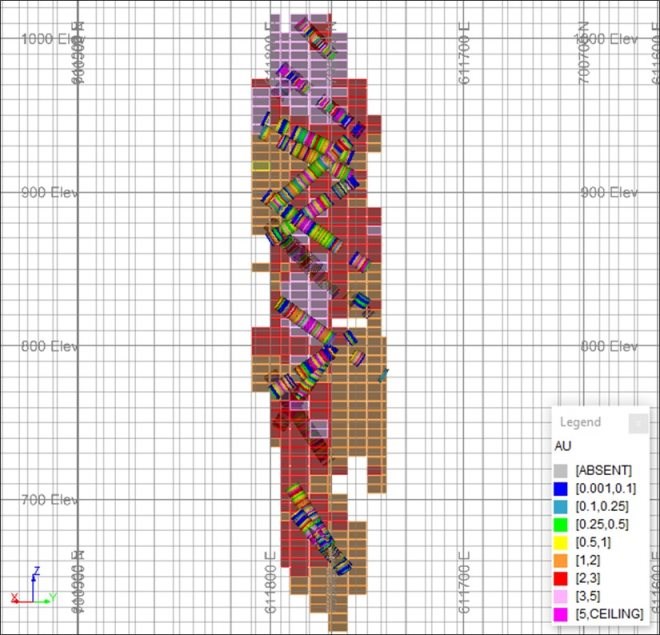
Source: CSA Global, 2019
|
Asanko Gold Inc. NI 43-101 Technical Report on Asanko Gold Mine, Ghana |
Figure 14-27 Swath plot and histogram: declustered composites, panels & LUC estimate for Domain 210
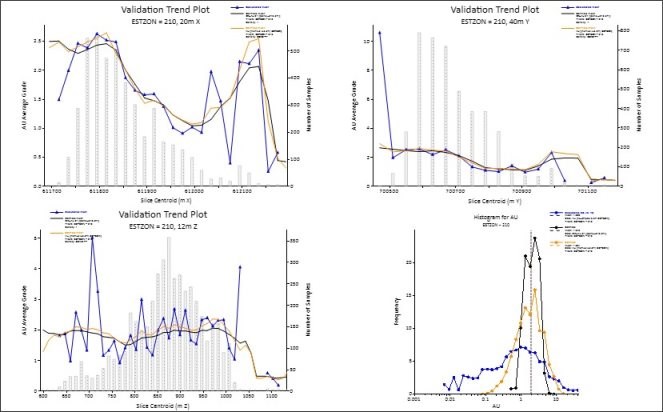
Note: Declustered composites (blue line), panels (black) and LUC estimate (orange)
Source: CSA Global, 2019
Statistical
The statistical difference between the naïve and declustered composites against the OK block grades and the LUC block grades were assessed both globally and by individual domains (Table 14-21). Scatterplots showing UC panel grade versus OK panel grade, both at a 0 g/t Au cut-off, are shown in Figure 14-28 for domain 210.
Globally, both the OK and LUC models validate well, showing 1% and 6% difference between the declustered composites and the block estimates, respectively. By estimation domain, the validation results are reasonable, taking into account that areas with over or underestimation are generally coincident with poorer drill hole support (as shown in swath plots in Figure 14-27).
|
Asanko Gold Inc. NI 43-101 Technical Report on Asanko Gold Mine, Ghana |
Table 14-21 Statistical validation of estimation domains
|
ESTZON |
Type |
Variable |
Count |
Minimum |
Maximum |
Mean |
|
GLOBAL |
Composites naïve |
AU |
10,250 |
0.01 |
40.00 |
1.75 |
|
Composites declustered |
AU |
10,250 |
0.01 |
40.00 |
1.57 |
|
|
OK model |
AU |
25,696 |
0.01 |
6.89 |
1.55 |
|
|
LUC model |
AU |
318,184 |
0.01 |
20.47 |
1.67 |
|
|
Difference [(OK grade - Composite declustered grade) /Composite declustered grade] |
-1% |
|||||
|
Difference [(LUC grade - Composite declustered grade) /Composite declustered grade] |
+6% |
|||||
|
210 |
Composites naïve |
AU |
4,505 |
0.01 |
40.00 |
2.13 |
|
Composites declustered |
AU |
4,505 |
0.01 |
40.00 |
1.94 |
|
|
OK model |
AU |
11,843 |
0.40 |
6.89 |
1.84 |
|
|
LUC model |
AU |
130,808 |
0.08 |
15.58 |
1.98 |
|
|
Difference [(OK grade - Composite declustered grade) /Composite declustered grade] |
-5% |
|||||
|
Difference [(LUC grade - Composite declustered grade) /Composite declustered grade] |
+2% |
|||||
|
220 |
Composites naïve |
AU |
2,649 |
0.01 |
40.00 |
1.51 |
|
Composites declustered |
AU |
2,649 |
0.01 |
40.00 |
1.44 |
|
|
OK model |
AU |
7,410 |
0.44 |
4.45 |
1.52 |
|
|
LUC model |
AU |
70,763 |
0.05 |
12.72 |
1.64 |
|
|
Difference [(OK grade - Composite declustered grade) /Composite declustered grade] |
+5% |
|||||
|
Difference [(LUC grade - Composite declustered grade) /Composite declustered grade] |
+14% |
|||||
|
230 |
Composites naïve |
AU |
547 |
0.01 |
18.00 |
1.30 |
|
Composites declustered |
AU |
547 |
0.01 |
18.00 |
1.24 |
|
|
OK model |
AU |
3,970 |
0.01 |
3.77 |
1.25 |
|
|
LUC model |
AU |
32,746 |
0.01 |
8.27 |
1.23 |
|
|
Difference [(OK grade - Composite declustered grade) /Composite declustered grade] |
+1% |
|||||
|
Difference [(LUC grade - Composite declustered grade) /Composite declustered grade] |
0% |
|||||
|
310 |
Composites naïve |
AU |
1,398 |
0.01 |
40.00 |
1.21 |
|
Composites declustered |
AU |
1,398 |
0.01 |
40.00 |
1.17 |
|
|
OK model |
AU |
3,929 |
0.16 |
6.93 |
0.97 |
|
|
LUC model |
AU |
44,688 |
0.05 |
20.47 |
1.01 |
|
|
Difference [(OK grade - Composite declustered grade) /Composite declustered grade] |
-17% |
|||||
|
Difference [(LUC grade - Composite declustered grade) /Composite declustered grade] |
-13% |
|||||
|
320 |
Composites naïve |
AU |
650 |
0.01 |
30.00 |
1.68 |
|
Composites declustered |
AU |
650 |
0.01 |
30.00 |
1.60 |
|
|
OK model |
AU |
2,537 |
0.67 |
3.98 |
1.57 |
|
|
LUC model |
AU |
23,156 |
0.08 |
10.64 |
1.57 |
|
|
Difference [(OK grade - Composite declustered grade) /Composite declustered grade] |
-2% |
|||||
|
Difference [(LUC grade - Composite declustered grade) /Composite declustered grade] |
-2% |
|||||
|
510 |
Composites naïve |
AU |
501 |
0.01 |
25.00 |
1.56 |
|
Composites declustered |
AU |
501 |
0.01 |
25.00 |
2.01 |
|
|
OK model |
AU |
2,167 |
0.55 |
6.64 |
1.88 |
|
|
LUC model |
AU |
16,023 |
0.08 |
12.62 |
1.78 |
|
|
Difference [(OK grade - Composite declustered grade) /Composite declustered grade] |
-7% |
|||||
|
Difference [(LUC grade - Composite declustered grade) /Composite declustered grade] |
-11% |
|||||
|
Asanko Gold Inc. NI 43-101 Technical Report on Asanko Gold Mine, Ghana |
Figure 14-28 Scatterplot of UC panel grade (x-axis) versus OK panel grade for Domain 210
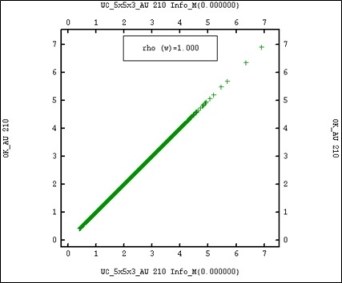
Note: Zero g/t Au cut-off applied
Source: CSA Global, 2019
LUC validation
In addition to the statistical and visual validation steps outlined above, the LUC estimate was subject to additional checks. These included:
-
Comparing the mean grade of LUC grades within the panel with the mean grade of the panel (Figure 14-29)
-
Comparing the grade-tonnage curve of UC and LUC estimates (shown in Figure 14-30 for domain 210).
Figure 14-29 Scatterplot of mean LUC grade (x-axis) versus UC grade for Domain 210
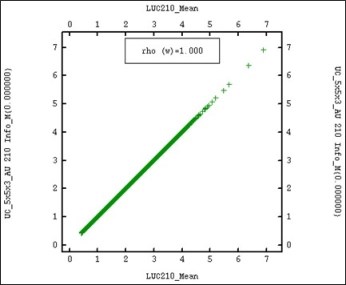
Note: Zero g/t Au cut-off applied
Source: CSA Global, 2019
|
Asanko Gold Inc. NI 43-101 Technical Report on Asanko Gold Mine, Ghana |
Figure 14-30 Grade (left) and tonnage curves (right) for Domain 210
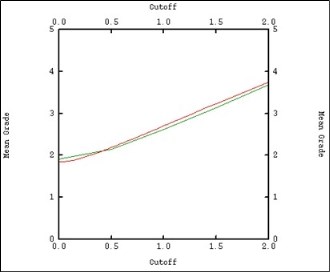
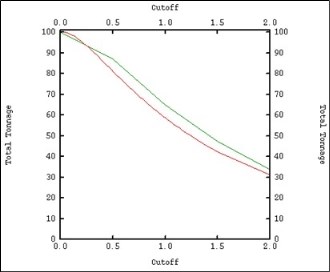
Note: UC model in red and LUC in green
Source: CSA Global, 2019
Reconciliation with mine production
The Nkran MRE model has been reconciled with the past 12 months mine production (Jan to Dec 2019). During the past 12 months 2.1 Mt at a gold grade of 2.03 g/t for 137 koz at a 0.5 g/t cut-off was depleted from the MRE model. The corresponding mine production grade control model shows 2% less tonnes at a 6% lower grade for 8% less ounces. The variance over the past 12 months is well within the expected variance for an Indicated MRE.
14.5.7 Mineral Resource classification
The Mineral Resource was classified as Indicated Mineral Resources under the guidelines of CIM (2014), and procedures for classifying the reported Mineral Resources were undertaken within the context of the NI 43-101.
The classification level is based upon an assessment of geological understanding of the deposit, geological and mineralisation continuity, drill hole spacing, quality control results, search and estimation parameters, and an analysis of available bulk density information.
|
Asanko Gold Inc. NI 43-101 Technical Report on Asanko Gold Mine, Ghana |
The Nkran deposit shows good continuity of mineralisation within well-defined geological constraints. Drill holes are located at a nominal spacing of 25 m to 40 m sections extending out to 80 m on the peripheries of the deposit. The drill spacing is sufficient to allow the geology (and associated mineralisation) to be modelled into coherent wireframes for each domain. Reasonable consistency is evident in the orientations, thickness and grades of the mineralised zone, as defined by indicator kriging.
Indicated Mineral Resources were informed by slope statistics and average distance of samples and is generally defined where drilling is spaced at approximately 40 m x 40 m.
A summary of the classification codes applied in the model are shown in Table 14-22, and Figure 14-31 shows the final classified block model in 3D view.
Table 14-22 Class field and description
|
RESCAT |
Description |
|
1 |
Measured Mineral Resource (none classified) |
|
2 |
Indicated Mineral Resource |
|
3 |
Inferred Mineral Resource (none classified) |
|
9 |
Mineralisation not estimated - Waste material |
Figure 14-31 3D view looking NE of the classified model, nominal US$1,500/oz pit shell shown in orange
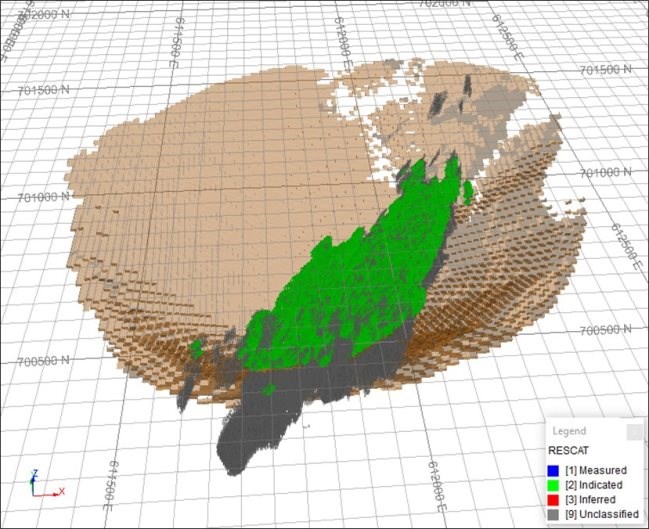
Source: CSA Global, 2019
|
Asanko Gold Inc. NI 43-101 Technical Report on Asanko Gold Mine, Ghana |
14.5.8 Mineral Resource reporting
CIM (2014) defines a Mineral Resource as:
"a concentration or occurrence of solid material of economic interest in or on the Earth's crust in such form, grade or quality and quantity that there are reasonable prospects for eventual economic extraction. The location, quantity, grade or quality, continuity and other geological characteristics of a Mineral Resource are known, estimated or interpreted from specific geological evidence and knowledge, including sampling."
The Nkran estimate compiled by CSA Global has been classified and reported as Indicated Mineral Resources under CIM (2014), and the procedures for classifying the reported Mineral Resources were undertaken within the context of the NI 43-101.
CSA Global considers that the gold mineralisation in the Nkran deposit is amenable to open pit extraction. The parameters are listed in Table 14-23 with a reporting cut-off grade of 0.5 g/t Au.
Table 14-23 Assumptions considered for selection of reporting cut-off grade
|
Parameter |
Value |
|
Mining cost (maximum US$/t ore) |
2.37 |
|
General and administration (US$/t ore) |
6.48 |
|
Process cost (US$/t ore) |
10.90 |
|
Gold recovery (%) |
94.5 |
|
Gold price (US$/oz) |
1,500 |
The Mineral Resource Statement has been depleted for mining as at 31 December 2019 (Table 14-24). The grade versus tonnage curves for the Indicated Mineral Resource at Nkran were calculated (Figure 14-32).
Table 14-24 Nkran Mineral Resource at a 0.5 g/t Au cut-off as at 31 December 2019
|
Resource category |
Tonnes (Mt) |
Au grade (g/t) |
Au metal (koz) |
|
Indicated |
8.5 |
2.14 |
586 |
|
Notes: |
|||
|
• The effective date of the Mineral Resource Statement is 31 December 2019 • Mineral Resources are reported at a cut-off grade of 0.5 g/t gold assuming: metal price of US$1,500/oz Au, maximum mining cost of US$2.37/t ore, G&A cost of US$6.48/t, processing cost of US$10.90/t, process recovery of 94.5% • Figures have been rounded to the appropriate level of precision for the reporting of Mineral Resources. Tonnages are rounded to the nearest 10,000 t, and metal content is rounded to the nearest 100 oz, to reflect this as an estimate • Due to rounding, some columns or rows may not compute exactly as shown • The Mineral Resources are stated as in situ dry tonnes. All figures are in metric tonnes • The Mineral Resource has been classified under the guidelines of CIM (2014), and procedures for classifying the reported Mineral Resources were undertaken within the context of the NI 43-101 • Mineral Resources that are not Mineral Reserves do not have demonstrated economic viability. The estimate of Mineral Resources may be materially affected by environmental, permitting, legal, title, taxation, socio-political, marketing, or other relevant issues • Mineral Resources have been reported inclusive of Mineral Reserves, where applicable • The MRE has been prepared by CSA Global who are independent of Asanko Gold • CSA Global does not know of any known legal, political, environmental, or other risks that could materially affect the potential development of the mineral resources. CSA Global believes the risks regarding permitting and socio-economic factors to be low. |
|||
|
Asanko Gold Inc. NI 43-101 Technical Report on Asanko Gold Mine, Ghana |
Figure 14-32 Nkran grade-tonnage curve for the Indicated Mineral Resource
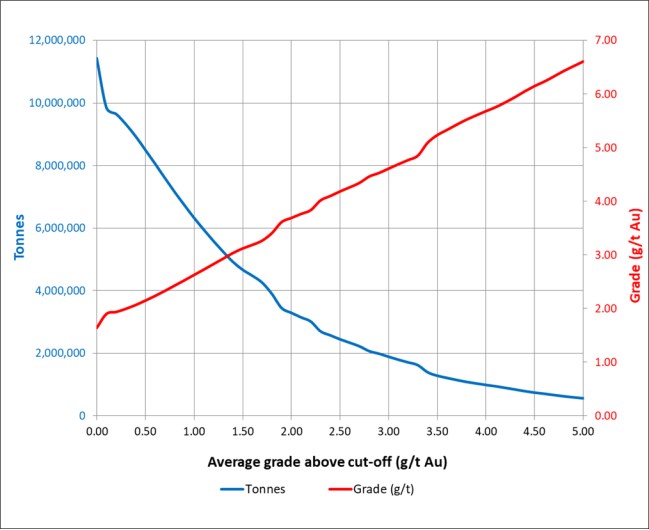
Source: CSA Global, 2020
14.5.9 Comparison with the previous MRE
The Nkran deposit was previously estimated and reported in December 2016 at a 0.5 g/t Au cut-off by CSA Global. For the purposes of comparison, the previous MRE is presented alongside the current MRE in Table 14-25.
|
Asanko Gold Inc. NI 43-101 Technical Report on Asanko Gold Mine, Ghana |
Table 14-25 Nkran MRE comparison - 31 December 2016 vs 31 Dec 2019, at a 0.5 g/t Au cut-off
|
Date |
Resource category |
Tonnes (Mt) |
Grade Au (g/t) |
Au metal (koz) |
|
31 December 2016 |
Measured |
5.50 |
1.68 |
297 |
|
Indicated |
24.57 |
1.81 |
1,427 |
|
|
Total M&I |
30.07 |
1.78 |
1,724 |
|
|
Inferred |
- |
- |
- |
|
|
31 December 2019 |
Measured |
- |
- |
- |
|
Indicated |
8.50 |
2.14 |
586 |
|
|
Total M&I |
8.50 |
2.14 |
586 |
|
|
Inferred |
- |
- |
- |
|
|
% Difference |
Measured |
-100% |
-100% |
-100% |
|
Indicated |
-65% |
+18% |
-58% |
|
|
Total M&I |
-72% |
+20% |
-66% |
|
|
Inferred |
- |
- |
- |
Note: M&I is the combined Measured and Indicated Mineral Resource
The reasons for changes, subject to the limitations and assumptions, are outlined below:
-
The 2016 MRE was depleted with mining as at 31 December 2016. The 2019 MRE is depleted with mining as at 31 December 2019
-
Changes to the mineralisation, geology and weathering models as a result of infill drilling and re-interpretation due to GC and infill drilling
o For the 2016 model, within the modelled geological domains, the mineralised and waste volumes were defined using an IK method. The probability threshold chosen for the main (steep) mineralisation was 0.30, which was representative of the interpreted continuity of the mineralisation. A secondary IK run was conducted to estimate shallower flat-lying structures that were identified during mining. Shallower structures do not extend into the Low Grade/Waste domain. The probability threshold used was 0.80. The models were combined with the steep structures taking priority over the shallower structures
o For the 2019 model, within the modelled geological domains, the mineralised and waste volumes were also being defined using an IK method. However, the probability threshold was derived from the results of testwork completed in a trial area with good EXP and GC data coverage. Three criteria were used for optimising the EXP IK parameters: ORE %; KV (kriging variance); and NPOINTS (indicator of drill grid spacing with search ellipsoid). IK parameters were thus optimised based on ORE %, and KV within NPOINTS groups (<9, 9 to 24 and >24) by GEOL domain.
The reported Nkran Mineral Resource changed as follows:
• The M&I Mineral Resources decreased by 21.57 Mt (-72%), increased in grade from 1.78 g/t Au to 2.14 g/t Au, for a decrease in metal of 1,138 koz (-68%)
• No Inferred Mineral Resources were reported for either the 2016 MRE or 2019 MRE.
14.5.10 Risk
A summary of key risk factors is presented in Table 14-26.
|
Asanko Gold Inc. NI 43-101 Technical Report on Asanko Gold Mine, Ghana |
Table 14-26 Risk matrix for the Nkran MRE
|
Factor |
Risk |
Comment |
|
Sample collection, preparation and assaying |
Moderate |
The database has been reviewed and while issues were identified, the dataset used for the MRE is of sufficient quality for estimation of Mineral Resources. Drilling has been completed by RC and DD drilling. Statistics have been reviewed for both and are comparable. Field duplicate precision exceeds acceptable limits for a nuggety gold deposit i.e. repeatability issues. Mean grade bias is exhibited, but this is often disproportionally affected by high grade outliers, a further indication of the nuggety nature of the mineralisation. |
|
QAQC |
Low |
CRMs under report due to the assay method, but generally show no issues. |
|
Geological data and model |
Moderate |
The core has been subject to re-logging and the geological model and mineralisation controls are better understood than previously. The geological wireframes, which are bounding volumes within which mineralisation is defined by IK, have been modelled to have a high degree of continuity along strike. If the continuity along strike is not as great as has been modelled, there is a risk of overstatement of metal. |
|
Grade estimate |
Moderate |
The estimate is based on mineralisation defined by IK and further informed by reconciliation with GC drilling. Model ORE % (Indicator) and average sample Au g/t graphs demonstrate the difference between GC and EXP data on 12 m levels. These differences impact the accuracy of the exploration drilling to predict both the mineralisation volume and grade of mineralisation. In some levels and GEOL (geological domain) there are very significant differences, which if persist at depth (below the existing GC data, will result in significant variance between predicted (MRE) and actual in ground volumes and grade. Additional drilling in advance of mining will be required to reduce this risk i.e. "site based dynamic modelling". |
|
Tonnage estimate |
Moderate |
There are a reasonable number of density values which are spatially representative of the deposit. The choice of IK to estimate the mineralisation volume models is dependent on the relationship/comparability between the GC and EXP data. In some levels and GEOL there are very significant differences, which if persistent with depth, will result in significant variance between predicted (MRE) and actual in ground volumes. This has the largest impact of any of the risk factors on tonnage. |
|
Resource upgrading and extension |
Low |
The gold mineralisation is open at depth, however; it is not currently considered economic so is not classified as a resource. |
|
Economic factors including mineral processing |
Low |
Nkran is currently in production. |
|
Accuracy of the estimate |
Moderate |
No simulation studies have been undertaken to quantitatively evaluate accuracy at Nkran. Conditional simulation and risk analysis may quantify risk for defined production periods/volume. |
|
Overall rating |
Moderate |
The current MRE carries moderate uncertainty and risk. The risk is principally related to the indicator mineralisation interpretation. |
|
Asanko Gold Inc. NI 43-101 Technical Report on Asanko Gold Mine, Ghana |
14.6 Esaase MRE
14.6.1 Geological and mineralisation modelling
Geological and mineralisation modelling was completed in LeapfrogTM by Asanko Gold geologists. The following wireframes were provided to CSA Global (example cross section shown in Figure 14-33 and plan view shown in Figure 14-34):
-
Sandstone and siltstone
-
Base of strongly, moderately and weakly oxidised
-
Shears - Viper, Scorpion, Python, Mamba, Hawk, Crow, Cobra, Antelope
-
25 refined mineralisation zones
-
27 broad mineralisation zones
-
A broad wireframe to delineate higher from lower grade domains (relevant to domains 1 and 2)
-
Topography derived from LiDAR survey.
Figure 14-33 Cross section showing weathering profile, shears, geology and mineralisation domains
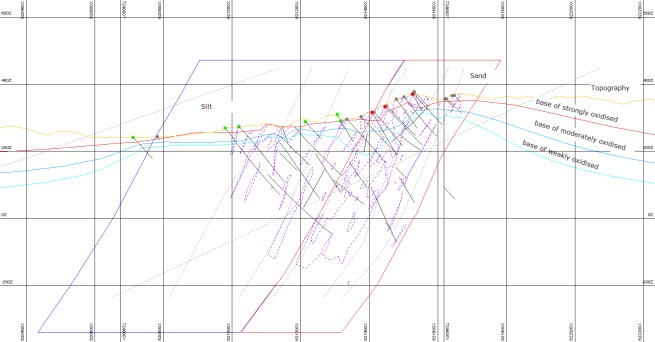
Note: Shears are represented with finely dotted lines; geology and mineralisation domains shown by dashed lines
Source: CSA Global, 2019
|
Asanko Gold Inc. NI 43-101 Technical Report on Asanko Gold Mine, Ghana |
Figure 14-34 Plan view of shears (3D lines) and mineralisation (shaded wireframes)
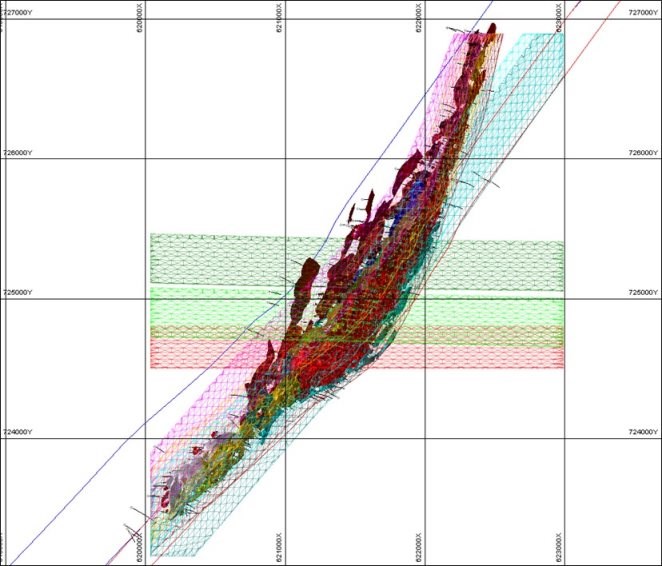
Source: CSA Global, 2019
The mineralisation at Esaase is hosted within the sandstone/siltstone and local high grades within quartz veins. Higher grades are located around intersections of shear zones and topographic highs (Figure 14-35).
|
Asanko Gold Inc. NI 43-101 Technical Report on Asanko Gold Mine, Ghana |
Figure 14-35 3D view looking west, showing shears with higher grade around topographic highs (& E-W shears)
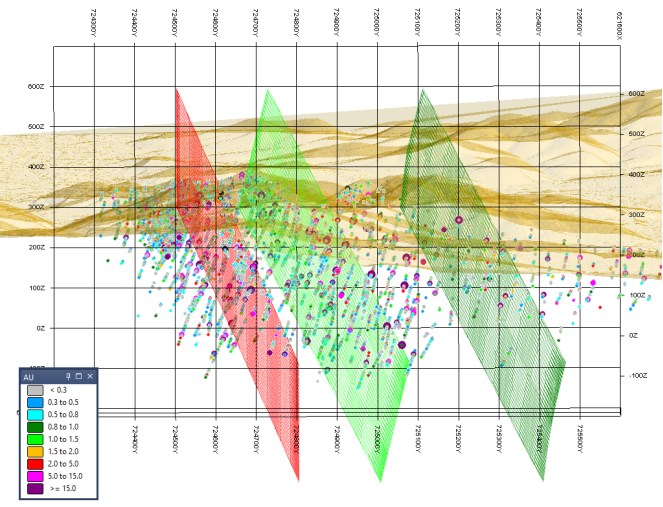
Source: CSA Global, 2019
De-surveyed assays were flagged using wireframes and the data was coded accordingly. The DOMAIN field was flagged using the broad mineralisation trends, while the MINZON field was a binary field which was coded as 1 if data lay within the LeapfrogTM indicator wireframes and 0 if outside. An ESTZON field merged these two into a two- to three-digit code for 'mineralised waste' (matching the DOMAIN field) and a four-digit code for mineralisation which was to be modelled.
Additional fields for NE-SW trending shears, E-W trending shears, geology unit and oxidation were also created and coded (Table 14-27).
|
Asanko Gold Inc. NI 43-101 Technical Report on Asanko Gold Mine, Ghana |
Table 14-27 Data coding
|
Field |
Original wireframe name |
Name |
Wireframe |
Code |
Description |
|
MINZON |
DM1 - 0.3 prob 40%.dxf |
1 |
ID10 |
1 |
Inside modelled mineralisation zones (LeapfrogTM indicator threshold) |
|
DM10_1 - 0.4.dxf |
10.1 |
ID101 |
|||
|
DM10_2 - 0.4.dxf |
10.2 |
ID102 |
|||
|
DM11_1 - 0.4.dxf |
11.1 |
ID110 |
|||
|
Refined_MinDomains_DM13.dxf* |
13 |
ID130 |
|||
|
DM14_1 - 0.4.dxf |
14.1 |
ID140 |
|||
|
DM15_1 - 0.4.dxf |
15.1 |
ID151 |
|||
|
DM15_2 - 04.dxf |
15.2 |
ID152 |
|||
|
DM15_4 - 0.4.dxf |
15.4 |
ID154 |
|||
|
DM15_6 - 0.4.dxf |
15.6 |
ID156 |
|||
|
DM2_1- 0.4.dxf |
2.1 |
ID21 |
|||
|
DM2_2 - 0.4.dxf |
2.2 |
ID22 |
|||
|
DM3_2 - 0.4.dxf |
3.2 |
ID32 |
|||
|
DM3_3 - 0.4.dxf |
3.3 |
ID33 |
|||
|
DM3_4 - 0.4.dxf |
3.4 |
ID34 |
|||
|
DM4_1 - 0.4.dxf |
4.1 |
ID41 |
|||
|
DM5_1 - 0.4.dxf |
5.1 |
ID51 |
|||
|
DM5_3 - 0.4.dxf |
5.3 |
ID53 |
|||
|
DM6_1 - 0.4.dxf |
6.1 |
ID61 |
|||
|
DM6_2 - 0.4.dxf |
6.2 |
ID62 |
|||
|
Refined_MinDomains_DM6_3.dxf* |
6.3 |
ID63 |
|||
|
DM7_1 - 0.4.dxf |
7.1 |
ID71 |
|||
|
DM7_2 - 0.4.dxf |
7.2 |
ID72 |
|||
|
DM7_3 - 0.4.dxf |
7.3 |
ID73 |
|||
|
DM7_4 - 0.4.dxf |
7.4 |
ID74 |
|||
|
DM9_1 - 0.4.dxf |
9.1 |
ID91 |
|||
|
DM9_2 - 0.4.dxf |
9.2 |
ID92 |
|||
|
|
|
|
0 |
Outside modelled mineralisation (LeapfrogTM indicator threshold) |
|
Asanko Gold Inc. NI 43-101 Technical Report on Asanko Gold Mine, Ghana |
|
Field |
Original wireframe name |
Name |
Wireframe |
Code |
Description |
|
DOMAIN |
Refined_MinDomains_DM1.dxf |
|
M10 |
10 |
Inside broad mineralisation wireframes |
|
Refined_MinDomains_DM10_1.dxf |
|
M101 |
101 |
||
|
Refined_MinDomains_DM10_2.dxf |
|
M102 |
102 |
||
|
Refined_MinDomains_DM11.dxf |
|
M110 |
110 |
||
|
Refined_MinDomains_DM13.dxf |
|
M130 |
130 |
||
|
Refined_MinDomains_DM14.dxf |
|
M140 |
140 |
||
|
Refined_MinDomains_DM15_1.dxf |
|
M151 |
151 |
||
|
Refined_MinDomains_Dm15_2.dxf |
|
M152 |
152 |
||
|
Refined_MinDomains_Dm15_4.dxf |
|
M154 |
154 |
||
|
Refined_MinDomains_Dm15_6.dxf |
|
M156 |
156 |
||
|
Refined_MinDomains_DM2_1.dxf |
|
M21 |
21 |
||
|
Refined_MinDomains_DM2_2.dxf |
|
M22 |
22 |
||
|
Refined_MinDomains_DM3_2.dxf |
|
M32 |
32 |
||
|
Refined_MinDomains_DM3_3.dxf |
|
M33 |
33 |
||
|
Refined_MinDomains_DM3_4.dxf |
|
M34 |
34 |
||
|
Refined_MinDomains_DM4_1.dxf |
|
M41 |
41 |
||
|
Refined_MinDomains_DM5_1.dxf |
|
M51 |
51 |
||
|
Refined_MinDomains_DM5_3.dxf |
|
M53 |
53 |
||
|
Refined_MinDomains_DM6_1.dxf |
|
M61 |
61 |
||
|
Refined_MinDomains_DM6_2.dxf |
|
M62 |
62 |
||
|
Refined_MinDomains_DM6_3.dxf |
|
M63 |
63 |
||
|
Refined_MinDomains_DM7_1.dxf |
|
M71 |
71 |
||
|
Refined_MinDomains_DM7_2.dxf |
|
M72 |
72 |
||
|
Refined_MinDomains_DM7_3.dxf |
|
M73 |
73 |
||
|
Refined_MinDomains_DM7_4.dxf |
|
M74 |
74 |
||
|
Refined_MinDomains_DM9_1.dxf |
|
M91 |
91 |
||
|
Refined_MinDomains_DM9_2.dxf |
|
M92 |
92 |
||
|
|
|
|
9999 |
Outside broad mineralisation wireframes |
|
|
GEOL |
|
|
Sand |
100 |
Sandstone |
|
|
|
Silt |
200 |
Siltstone |
|
|
FAULTA |
|
|
Scorpion |
1 |
South of Scorpion |
|
|
|
Antelope |
2 |
Between Antelope and Scorpion |
|
|
|
|
Crow |
3 |
Between Crow and Antelope |
|
|
|
|
Crow |
4 |
North of Crow |
|
|
FAULTB |
|
|
|
10 |
|
|
|
|
|
20 |
|
|
|
|
|
|
30 |
|
|
|
|
|
|
40 |
|
|
|
|
|
|
50 |
|
|
|
|
|
|
60 |
|
|
|
OXIDE |
|
|
Sox |
1 |
Strongly oxidised |
|
|
|
Mox |
2 |
Moderately oxidised |
|
|
|
|
Wox |
3 |
Weakly oxidised |
|
|
|
|
|
4 |
Fresh |
|
Asanko Gold Inc. NI 43-101 Technical Report on Asanko Gold Mine, Ghana |
|
Field |
Original wireframe name |
Name |
Wireframe |
Code |
Description |
|
ESTZON |
|
|
|
1010 |
ESTZON=(MINZON*1000)+DOMAIN and outside hg_dom_all |
|
|
|
1021 |
|||
|
|
|
1022 |
|||
|
|
|
1032 |
ESTZON=(MINZON*1000)+DOMAIN |
||
|
|
|
1033 |
|||
|
|
|
1034 |
|||
|
|
|
1041 |
|||
|
|
|
1051 |
|||
|
|
|
1053 |
|||
|
|
|
1061 |
|||
|
|
|
1062 |
|||
|
|
|
1063 |
|||
|
|
|
1071 |
|||
|
|
|
1072 |
|||
|
|
|
1073 |
|||
|
|
|
1074 |
|||
|
|
|
1091 |
|||
|
|
|
1092 |
|||
|
|
|
1101 |
|||
|
|
|
1102 |
|||
|
|
|
1110 |
|||
|
|
|
1130 |
|||
|
|
|
1140 |
|||
|
|
|
1151 |
|||
|
|
|
1152 |
|||
|
|
|
1154 |
|||
|
|
|
1156 |
|||
|
|
|
2010 |
ESTZON=(MINZON*2000)+DOMAIN and inside hg_dom_all |
||
|
|
|
2021 |
|||
|
|
|
2022 |
14.6.2 Statistical analysis
Hole type analysis
Statistics were reviewed for the composited flagged drill hole data, by hole type to assess for bias in Au grade between the sample types.
There was no grade bias apparent between DD and RC samples within the modelled mineralisation wireframes (Figure 14-36).
Figure 14-36 Probability plot comparing grades in RC (green), RCD (blue), DD (red) holes
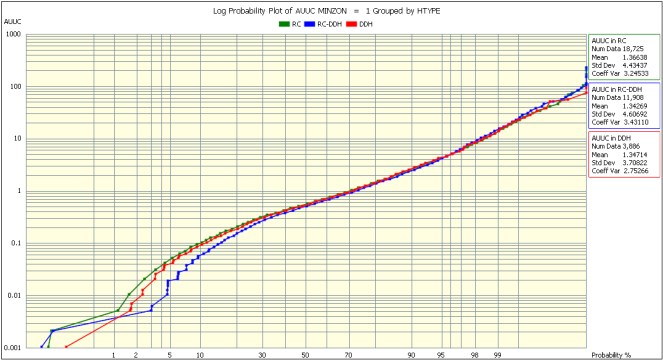
Source: CSA Global, 2019
Recovery
No recovery data was provided by Asanko Gold as part of the MRE data package. However, CSA Global completed a review of the database in early 2018 and this recovery data was reviewed in advance of the MRE.
Sample weight for RC drilling appears to be incorrect, with all 2,205 intercepts (out of 225,381) that have recovery data, having a recovery recorded of 100%. RC recovery data was therefore not considered valid for this Mineral Resource.
|
Asanko Gold Inc. NI 43-101 Technical Report on Asanko Gold Mine, Ghana |
Of 97 intercepts that have recovery data recorded in the DD data, only eight have values less than 100%.
These values are unlikely to be representative and may reflect errors in data input. Procedures should be investigated to ensure recovery data is accurately collected for all drill holes.
Contact analysis
Boundaries are either treated as "hard" or "soft". Hard boundaries represent a sharp geological contact. A soft boundary is a gradational one and represents a gradual change in grade.
Contact analysis for Au g/t between the oxidation zones was carried out to assess the nature of the domain boundaries by graphing the average grade with increasing distance from the domain boundary (Figure 14-37).
Contact analysis indicated that oxidation boundaries are gradational, and that no distinctive changes occur across the boundary. This supports the use of soft oxidation boundaries during estimation.
Figure 14-37 Contact analysis - Oxidation zones

Source: CSA Global, 2019
Naïve statistics
The tabulation of domained naïve statistics is presented in Table 14-28. There are 30 domains, with 2010 being the largest.
|
Asanko Gold Inc. NI 43-101 Technical Report on Asanko Gold Mine, Ghana |
Table 14-28 Naïve statistics per domain
|
ESTZON |
Samples |
Minimum |
Maximum |
Mean |
SD |
CV |
|
1010 |
1,361 |
0.001 |
38.10 |
1.38 |
3.25 |
2.36 |
|
1021 |
1,221 |
0.001 |
83.60 |
1.21 |
3.33 |
2.76 |
|
1022 |
465 |
0.001 |
101.00 |
1.83 |
6.04 |
3.30 |
|
1032 |
675 |
0.001 |
112.36 |
1.66 |
5.98 |
3.60 |
|
1033 |
291 |
0.005 |
22.00 |
1.08 |
2.09 |
1.94 |
|
1034 |
251 |
0.005 |
31.60 |
1.28 |
2.53 |
1.98 |
|
1041 |
1,790 |
0.001 |
32.40 |
0.95 |
2.14 |
2.25 |
|
1051 |
394 |
0.005 |
10.90 |
0.91 |
1.40 |
1.54 |
|
1053 |
69 |
0.005 |
9.01 |
0.90 |
1.40 |
1.56 |
|
1061 |
118 |
0.001 |
78.00 |
1.65 |
7.61 |
4.61 |
|
1062 |
251 |
0.010 |
35.40 |
1.10 |
2.75 |
2.50 |
|
1063 |
43 |
0.001 |
21.10 |
0.64 |
3.21 |
5.00 |
|
1071 |
350 |
0.005 |
20.70 |
0.90 |
1.82 |
2.03 |
|
1072 |
100 |
0.005 |
8.30 |
0.86 |
1.40 |
1.64 |
|
1073 |
46 |
0.005 |
20.70 |
1.57 |
3.57 |
2.27 |
|
1074 |
56 |
0.010 |
33.60 |
2.49 |
5.60 |
2.25 |
|
1091 |
91 |
0.005 |
11.10 |
0.64 |
1.36 |
2.13 |
|
1092 |
31 |
0.005 |
59.60 |
2.75 |
10.61 |
3.86 |
|
1101 |
1,022 |
0.001 |
215.00 |
1.44 |
7.94 |
5.53 |
|
1102 |
157 |
0.005 |
15.18 |
1.22 |
2.26 |
1.85 |
|
1110 |
606 |
0.001 |
135.50 |
1.18 |
5.87 |
4.96 |
|
1130 |
597 |
0.001 |
3.19 |
0.10 |
0.28 |
2.87 |
|
1140 |
200 |
0.005 |
10.75 |
0.89 |
1.36 |
1.54 |
|
1151 |
1,256 |
0.001 |
125.00 |
1.58 |
5.20 |
3.30 |
|
1152 |
1,590 |
0.001 |
107.00 |
1.60 |
5.27 |
3.29 |
|
1154 |
799 |
0.001 |
108.00 |
1.30 |
4.75 |
3.66 |
|
1156 |
146 |
0.001 |
46.80 |
1.50 |
4.96 |
3.30 |
|
2010 |
14,814 |
0.001 |
197.87 |
1.41 |
4.51 |
3.19 |
|
2021 |
2,600 |
0.001 |
214.32 |
1.42 |
5.42 |
3.82 |
|
2022 |
2,719 |
0.001 |
100.00 |
1.46 |
4.60 |
3.14 |
Note: SD - Standard deviation; CV - Coefficient of variation
Compositing
Data was composited to 1 m lengths which honours the dominant sampling interval (Figure 14-38). MODE = 0 was used since the impact of removing residuals less than 0.5 m was considered minimal (332/34,851). Residuals were removed because they were negatively biasing the composites (Figure 14-39). Validation of the compositing confirms minimal metal loss (Table 14-29) and this methodology optimises consistent sample support.
|
Asanko Gold Inc. NI 43-101 Technical Report on Asanko Gold Mine, Ghana |
Figure 14-38 Histogram of sample intervals within mineralised domains

Source: CSA Global, 2019
Figure 14-39 Residual analysis post-compositing
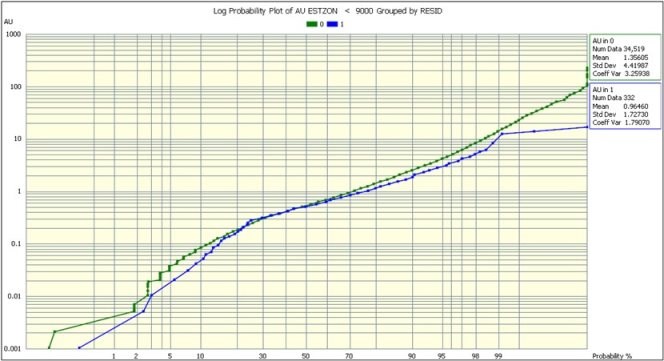
Source: CSA Global, 2019
A small number of intercepts (1,924/34,109 i.e. 6%) were greater than 1 m and were therefore split in the process of compositing. A test was run during variography to assess the impact of this on grade continuity models and the sensitivity was determined to be low. This is discussed in further detail in the Esaase variography section.
|
Asanko Gold Inc. NI 43-101 Technical Report on Asanko Gold Mine, Ghana |
Table 14-29 Comparison of grade statistics pre- and post-compositing
|
File |
n |
Min |
Max |
Mean |
Var |
Comment |
|
Es_ass.z (Pre-compositing) |
34,109 |
0.001 |
215.00 |
1.36 |
20.41 |
Length Weighted |
|
Es_estcmp (Post-compositing) |
34,519 |
0.001 |
215.00 |
1.36 |
19.54 |
Residuals <1 m removed |
The descriptive analysis for the estimation domains (ESTZON) is shown in Table 14-30.
Table 14-30 Composite statistics per domain
|
ESTZON |
Samples |
Minimum |
Maximum |
Mean |
SD |
CV |
|
1010 |
1,367 |
0.005 |
38.10 |
1.38 |
3.24 |
2.35 |
|
1021 |
1,236 |
0.001 |
83.60 |
1.21 |
3.30 |
2.73 |
|
1022 |
470 |
0.005 |
101.00 |
1.83 |
6.01 |
3.28 |
|
1032 |
682 |
0.005 |
112.36 |
1.69 |
5.97 |
3.53 |
|
1033 |
292 |
0.005 |
22.00 |
1.09 |
2.09 |
1.92 |
|
1034 |
250 |
0.005 |
31.60 |
1.28 |
2.53 |
1.97 |
|
1041 |
1,798 |
0.001 |
32.40 |
0.95 |
2.11 |
2.23 |
|
1051 |
398 |
0.005 |
10.90 |
0.91 |
1.39 |
1.52 |
|
1053 |
69 |
0.005 |
7.02 |
0.88 |
1.25 |
1.43 |
|
1061 |
119 |
0.001 |
78.00 |
1.64 |
7.58 |
4.61 |
|
1062 |
255 |
0.01 |
35.40 |
1.09 |
2.72 |
2.51 |
|
1063 |
43 |
0.001 |
21.10 |
0.64 |
3.21 |
5.00 |
|
1071 |
351 |
0.005 |
20.70 |
0.90 |
1.82 |
2.02 |
|
1072 |
101 |
0.005 |
8.30 |
0.86 |
1.39 |
1.63 |
|
1073 |
46 |
0.005 |
20.70 |
1.57 |
3.57 |
2.27 |
|
1074 |
56 |
0.01 |
33.60 |
2.49 |
5.60 |
2.25 |
|
1091 |
91 |
0.005 |
11.10 |
0.60 |
1.25 |
2.07 |
|
1092 |
33 |
0.005 |
59.60 |
2.59 |
10.28 |
3.97 |
|
1101 |
1,035 |
0.001 |
215.00 |
1.37 |
7.30 |
5.35 |
|
1102 |
156 |
0.005 |
15.18 |
1.25 |
2.27 |
1.81 |
|
1110 |
605 |
0.002 |
48.33 |
1.06 |
2.89 |
2.73 |
|
1130 |
598 |
0.001 |
3.19 |
0.10 |
0.28 |
2.83 |
|
1140 |
199 |
0.005 |
10.75 |
0.88 |
1.31 |
1.48 |
|
1151 |
1,263 |
0.005 |
87.78 |
1.59 |
4.78 |
3.01 |
|
1152 |
1,594 |
0.001 |
107.00 |
1.60 |
5.25 |
3.28 |
|
1154 |
801 |
0.005 |
108.00 |
1.30 |
4.74 |
3.65 |
|
1156 |
146 |
0.001 |
46.80 |
1.50 |
4.96 |
3.30 |
|
2010 |
15,097 |
0.001 |
197.87 |
1.42 |
4.44 |
3.13 |
|
2021 |
2,625 |
0.001 |
214.32 |
1.42 |
5.38 |
3.79 |
|
2022 |
2,743 |
0.001 |
100.00 |
1.45 |
4.12 |
2.85 |
Note: SD - Standard deviation; CV - Coefficient of variation
Grade capping
Grade caps (top-cuts) were reviewed by disintegration analysis of probability plots and histograms and were applied to all domains to reduce the impact of outliers, which although real, are unrepresentative of the underlying grade distribution.
|
Asanko Gold Inc. NI 43-101 Technical Report on Asanko Gold Mine, Ghana |
The number of extreme values cut was minimal compared to the total domain population, and cutting these values had little impact on the mean grade of the larger domains. For domains with smaller populations, grade caps had a more severe effect, but these domains were deemed to not be material, and it is anticipated as more drilling is completed, the tail of the distribution would have more data, reducing the impact of grade caps.
Several domains were assessed to require no grade capping. These were ESTZON 1010, 1072, 1102, 1110, 1051, 1033,1140 and 1130. Grade caps applied to domains are presented in Table 14-31. This shows the impact on metal and number of samples cut.
Table 14-31 Top-cut statistics per domain
|
ESTZON |
Top-cut |
No. of samples |
No. of samples cut |
Uncut mean |
Cut mean |
Metal cut (%) |
|
2010 |
50 |
15,097 |
24 |
1.42 |
1.38 |
-3% |
|
1021 |
30 |
1,236 |
2 |
1.21 |
1.16 |
-4% |
|
2021 |
50 |
2,625 |
2 |
1.42 |
1.36 |
-4% |
|
1022 |
18 |
470 |
4 |
1.83 |
1.52 |
-17% |
|
2022 |
40 |
2,743 |
4 |
1.30 |
1.39 |
7% |
|
1041 |
15 |
1,798 |
8 |
0.95 |
0.90 |
-5% |
|
1101 |
30 |
1,035 |
3 |
1.36 |
1.15 |
-15% |
|
1032 |
50 |
682 |
1 |
1.69 |
1.60 |
-5% |
|
1151 |
40 |
1,263 |
5 |
1.59 |
1.53 |
-4% |
|
1154 |
20 |
801 |
4 |
1.30 |
1.12 |
-14% |
|
1091 |
3 |
91 |
1 |
0.60 |
0.51 |
-15% |
|
1034 |
10 |
250 |
1 |
1.28 |
1.20 |
-6% |
|
1071 |
11 |
351 |
2 |
0.90 |
0.86 |
-4% |
|
1062 |
5 |
255 |
7 |
1.09 |
0.91 |
-17% |
|
1053 |
3 |
69 |
3 |
0.88 |
0.75 |
-15% |
|
1061 |
5 |
119 |
3 |
1.64 |
0.76 |
-54% |
|
1063 |
2 |
43 |
1 |
0.64 |
0.20 |
-69% |
|
1156 |
15 |
146 |
2 |
1.50 |
1.16 |
-23% |
|
1152 |
50 |
1,594 |
4 |
1.60 |
1.52 |
-5% |
|
1092 |
5 |
33 |
1 |
2.59 |
1.24 |
-52% |
|
1073 |
8 |
46 |
2 |
1.57 |
1.21 |
-23% |
|
1074 |
10 |
56 |
4 |
2.48 |
1.76 |
-29% |
14.6.3 Bulk density
In situ bulk density (BD) measurements for the Esaase deposit were determined by applying the "Archimedes" method (water displacement). The BD is calculated with the following formula:
![]()
A total of 15,053 BD measurements for Esaase were supplied by Asanko Gold. Within the MRE area, a total of 14,998 BD measurements were reviewed by CSA Global, coded by mineralisation domain, geology unit and oxidation.
There is no significant difference in BD between the mineralisation and waste domains. However, there is a difference in BD between oxidised and fresh material, and minor differences between the siltstone and sandstone.
There is a small area of the model that has no geology wireframes, it is entirely waste. Densities of this undefined area were reviewed and assigned to the block model. Again, there was little variability compared to sandstone and siltstone.
|
Asanko Gold Inc. NI 43-101 Technical Report on Asanko Gold Mine, Ghana |
Following statistical analysis, outliers were identified and removed, and the mean BD applied per weathering profile, geological unit and mineralisation/waste zone (Table 14-32).
Table 14-32 In situ dry bulk densities assigned to domains
|
Material |
Geology |
Oxidation |
Bulk density (BD) assigned (t/m3) |
|
Mineralisation and waste |
Sandstone |
Strong |
2.22 |
|
Moderate |
2.27 |
||
|
Weak |
2.41 |
||
|
Fresh |
2.72 |
||
|
Siltstone |
Strong |
2.37 |
|
|
Moderate |
2.35 |
||
|
Weak |
2.45 |
||
|
Fresh |
2.75 |
||
|
Waste |
Undefined |
Strong |
2.40 |
|
Moderate |
2.35 |
||
|
Weak |
2.62 |
||
|
Fresh |
2.76 |
14.6.4 Block model
A volume model was built in Datamine StudioRMTM using geology, mineralisation, oxide, fault and topography wireframes.
A parent cell size of 20 m x 40 m x 6 m (XYZ) was used and sub-cells applied where appropriate to honour wireframe volumes.
The block model prototype parameters and block model attributes are shown in Table 14-33 and Table 14-34, respectively.
Table 14-33 Block model dimensions
|
Axis |
Origin (m) |
Model extent (m) |
# Blocks |
Maximum cell size (m) |
Minimum cell size (m) |
|
Easting (X) |
620,000 |
3,000 |
150 |
20 |
2.5 |
|
Northing (Y) |
723,000 |
5,000 |
125 |
40 |
5.0 |
|
Elevation (Z) |
-242 |
792 |
132 |
6 |
1.0 |
Table 14-34 Block model attributes
|
Attribute |
Wireframe |
Code |
Description |
|
MINZON |
ID* M63 M130 |
1 |
Inside modelled mineralisation zones (LeapfrogTM indicator threshold) |
|
|
0 |
Outside modelled mineralisation zones (LeapfrogTM indicator threshold) |
|
Asanko Gold Inc. NI 43-101 Technical Report on Asanko Gold Mine, Ghana |
|
Attribute |
Wireframe |
Code |
Description |
|
DOMAIN |
M10 |
10 |
Inside broad mineralisation wireframes |
|
M101 |
101 |
||
|
M102 |
102 |
||
|
M110 |
110 |
||
|
M130 |
130 |
||
|
M140 |
140 |
||
|
M151 |
151 |
||
|
M152 |
152 |
||
|
M154 |
154 |
||
|
M156 |
156 |
||
|
M21 |
21 |
||
|
M22 |
22 |
||
|
M32 |
32 |
||
|
M33 |
33 |
||
|
M34 |
34 |
||
|
M41 |
41 |
||
|
M51 |
51 |
||
|
M53 |
53 |
||
|
M61 |
61 |
||
|
M62 |
62 |
||
|
M63 |
63 |
||
|
M71 |
71 |
||
|
M72 |
72 |
||
|
M73 |
73 |
||
|
M74 |
74 |
||
|
M91 |
91 |
||
|
M92 |
92 |
||
|
|
9999 |
Outside broad mineralisation wireframes |
|
|
GEOL |
Sand |
100 |
Sandstone |
|
Silt |
200 |
Siltstone |
|
|
FAULTA |
Scorpion |
1 |
South of Scorpion |
|
Antelope |
2 |
Between Antelope and Scorpion |
|
|
Crow |
3 |
Between Crow and Antelope |
|
|
Crow |
4 |
North of Crow |
|
|
FAULTB |
|
10 |
|
|
|
20 |
|
|
|
|
30 |
|
|
|
|
40 |
|
|
|
|
50 |
|
|
|
|
60 |
|
|
|
OXIDE |
Sox |
1 |
Strongly oxidised |
|
Mox |
2 |
Moderately oxidised |
|
|
Wox |
3 |
Weakly oxidised |
|
|
|
4 |
Fresh |
|
Asanko Gold Inc. NI 43-101 Technical Report on Asanko Gold Mine, Ghana |
|
Attribute |
Wireframe |
Code |
Description |
|
|
|
1010 |
ESTZON=(MINZON*1000)+DOMAIN and outside hg_dom_all |
|
1021 |
|||
|
1022 |
|||
|
1032 |
ESTZON=(MINZON*1000)+DOMAIN |
||
|
1033 |
|||
| ESTZON |
1034 |
||
|
1041 |
|||
|
1051 |
|||
|
1053 |
|||
|
1061 |
|||
|
1062 |
|||
|
1063 |
|||
|
1071 |
|||
|
1072 |
|||
|
1073 |
|||
|
1074 |
|||
|
1091 |
|||
|
1092 |
|||
|
1101 |
|||
|
1102 |
|||
|
1110 |
|||
|
1130 |
|||
|
1140 |
|||
|
1151 |
|||
|
1152 |
|||
|
1154 |
|||
|
1156 |
|||
|
2010 |
ESTZON=(MINZON*2000)+DOMAIN and inside hg_dom_all |
||
|
2021 |
|||
|
2022 |
|||
|
DENSITY |
|
2.22 |
Strongly oxidised sandstone |
|
2.27 |
Moderately oxidised sandstone |
||
|
2.41 |
Weakly oxidised sandstone |
||
|
2.71 |
Fresh sandstone |
||
|
2.37 |
Strongly oxidised siltstone |
||
|
2.35 |
Moderately oxidised siltstone |
||
|
2.45 |
Weakly oxidised siltstone |
||
|
2.75 |
Fresh siltstone |
||
|
2.40 |
Strongly oxidised undefined lithology |
||
|
2.35 |
Moderately oxidised undefined lithology |
||
|
2.62 |
Weakly oxidised undefined lithology |
||
|
2.76 |
Fresh undefined lithology |
||
|
TOPO |
es_topo_lidar |
1 |
Below LiDAR topography |
14.6.5 Grade estimation
The Esaase Mineral Resource has been estimated using post-processing of OK large panel estimates to produce a recoverable Mineral Resource. This method provides SMU scale block estimates that honour the theoretical grade-tonnage relationship determined from discrete Gaussian change of support. UC results for the large OK panels are transferred to SMU blocks using LUC. The quality of the results is dependent on the availability of drill hole data and the nature of the spatial variance.
The most important domains in terms of metal are 1010, 2010, 1021, 2021, 1022, 2022, 1151, 1152, 1154 and where examples are used to document the workflow, these domains are used and presented here.
Declustering
Sensitivity in each domain to clustering was considered, and while it was noted that the mean grade was not overly sensitive to a range of decluster cell sizes, declustering was applied.
|
Asanko Gold Inc. NI 43-101 Technical Report on Asanko Gold Mine, Ghana |
Declustering at Esaase was undertaken in two stages. For preliminary statistics and first pass estimation, a cell weighting strategy was used honouring the nominal drill spacing of 30 m x 30 m. Following first pass OK, the kriging weights were written out and the process was re-run. A process of kriging declustering weights was applied to generate the estimate and is presented here.
Gaussian anamorphosis modelling
UC uses the Gaussian anamorphosis and Hermitian polynomial formalism to define the joint distributions of point, SMU and panel scale estimates. Hermite polynomials were used on grade capped (top-cut), declustered data (declustering weights derived through OK).
The model for Domain 2010 is presented in Figure 14-40, with the histogram for raw Au grades for this domain presented in Figure 14-41 alongside the Gaussian transformed values. The Gaussian transform has resulted in a mean of zero and a variance of one, as expected.
Figure 14-40 Gaussian anamorphosis model for Domain 2010
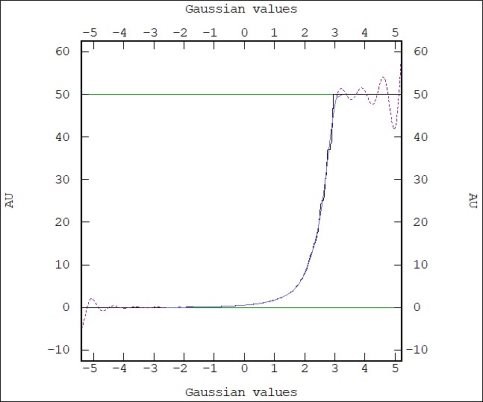
Source: CSA Global, 2019
|
Asanko Gold Inc. NI 43-101 Technical Report on Asanko Gold Mine, Ghana |
Figure 14-41 Histogram of Au (left) and Gaussian transformed Au (right) for Domain 2010
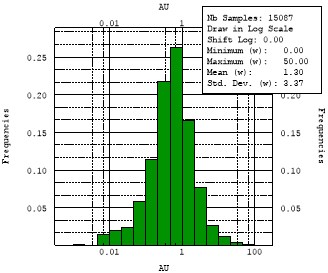
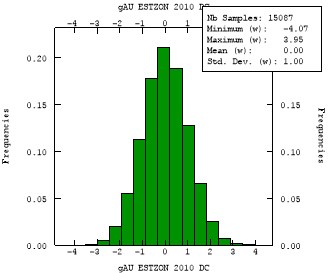
Source: CSA Global, 2019
Variography
Variography was calculated from composited data in SupervisorTM. Directional experimental semi variograms were calculated in Gaussian space and modelled. Outliers were removed where applicable, since the presence of outliers can have a disproportionate effect on the back-transform process, in particular on the nugget value. This is reasonable since the variogram model is attempting to model the continuity of the majority of the grade distribution. However, above a certain grade, values are more likely to be random, and display pure nugget tendencies.
The variogram was back-transformed to raw space prior to using it in estimation or change of support calculations.
Variograms were poorly structured. To evaluate the likely structure of the variogram, all data within the domain was used (including below cut-off mineralisation). The structure of the variogram, including nugget, was derived from this variogram and imposed on the ESTZON, with the assumption that if more drilling was undertaken, gaps in the ESTZON would be filled and the overall structure of the variogram would remain the same. The following assumptions were made:
- By including below cut-off mineralisation within the broad zone of mineralisation, that the nugget is not artificially lowered
|
Asanko Gold Inc. NI 43-101 Technical Report on Asanko Gold Mine, Ghana |
- That the ranges would be maintained, should further drilling occur and improve the structure of the variograms.
Variograms were characterised by moderate to high nuggets (c. 40%), a short-scale structure of approximately 25 m and a longer scale structure of approximately 60 m for the main domains. The result for Domain 2010 is shown in Figure 14-42 and Figure 14-43. Table 14-35 presents the variogram model parameters used in change of support calculations and estimation.
Nuggets were modelled from downhole variograms. Although nuggets and sills were normalised to 1 in SupervisorTM, they were scaled to the sample variance when used in ISATISTM, prior to change of support calculations and estimation.
Figure 14-42 Experimental variogram and model (Gaussian space) for Domain 2010 (normalised to 1)
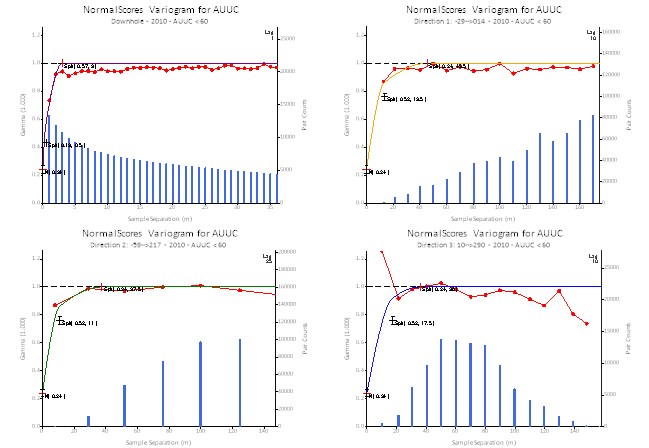
Source: CSA Global, 2019
|
Asanko Gold Inc. NI 43-101 Technical Report on Asanko Gold Mine, Ghana |
Figure 14-43 Back transformed variogram model for Domain 2010 (normalised to 1)
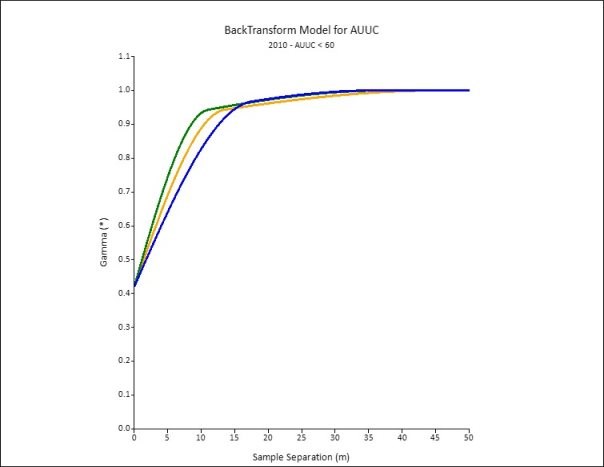
Source: CSA Global, 2019
Table 14-35 Variogram models for Au grade
|
ESTZON |
Rotation |
Nugget |
Structure 1 |
Structure 2 |
||
|
Partial sill |
Range (m) |
Partial sill |
Range (m) |
|||
|
1010 |
61 |
5.44 |
4.25 |
29.5 |
3.59 |
58.0 |
|
28 |
10.5 |
46.0 |
||||
|
-67 |
12.5 |
35.5 |
||||
|
1021 |
50 |
2.34 |
1.73 |
48.5 |
1.51 |
141.0 |
|
0 |
22.0 |
77.5 |
||||
|
-60 |
13.0 |
20.0 |
||||
|
1022 |
50 |
3.47 |
3.47 |
44.0 |
0.95 |
70.5 |
|
0 |
60.5 |
67.5 |
||||
|
-60 |
3.5 |
7.0 |
||||
|
1032 |
60 |
6.00 |
5.85 |
25.5 |
2.78 |
115.5 |
|
0 |
26.0 |
111.5 |
||||
|
-70 |
20.0 |
30.0 |
||||
|
1033 |
60 |
4.83 |
4.68 |
40.0 |
5.12 |
140.0 |
|
0 |
20.5 |
89.0 |
||||
|
-60 |
13.0 |
30.0 |
||||
|
1034 |
60 |
0.87 |
0.95 |
25.5 |
0.67 |
115.5 |
|
0 |
26.0 |
111.5 |
||||
|
-70 |
20.0 |
30.0 |
||||
|
Asanko Gold Inc. NI 43-101 Technical Report on Asanko Gold Mine, Ghana |
|
ESTZON |
Rotation |
Nugget |
Structure 1 |
Structure 2 |
||
|
Partial sill |
Range (m) |
Partial sill |
Range (m) |
|||
|
1041 |
40 |
1.31 |
0.59 |
19.0 |
1.21 |
75.5 |
|
0 |
15.5 |
84.0 |
||||
|
-60 |
13.5 |
30.0 |
||||
|
1071 |
60 |
0.71 |
0.77 |
25.5 |
0.55 |
115.5 |
|
0 |
26.0 |
111.5 |
||||
|
-70 |
20.0 |
30.0 |
||||
|
1101 |
71 |
2.10 |
2.58 |
30.5 |
1.32 |
96.0 |
|
28 |
27.5 |
75.5 |
||||
|
-67 |
21.0 |
25.0 |
||||
|
1110 |
50 |
3.99 |
4.31 |
41.0 |
2.21 |
131.5 |
|
0 |
30.0 |
178.5 |
||||
|
-60 |
2.5 |
30.0 |
||||
|
1154 |
40 |
2.05 |
2.52 |
64.0 |
1.29 |
119.0 |
|
0 |
15.0 |
46.0 |
||||
|
-60 |
4.0 |
9.5 |
||||
|
2010 |
76 |
4.78 |
5.47 |
28.0 |
1.14 |
105.5 |
|
29 |
21.0 |
74.0 |
||||
|
-78 |
17.5 |
75.0 |
||||
|
2021 |
81 |
5.45 |
4.29 |
23.0 |
1.85 |
103.5 |
|
42 |
27.5 |
113.0 |
||||
|
-48 |
12.5 |
39.0 |
||||
|
2022 |
81 |
3.08 |
2.23 |
23.0 |
1.25 |
103.5 |
|
42 |
27.5 |
74.0 |
||||
|
-48 |
12.5 |
39.0 |
||||
|
1102 |
71 |
1.45 |
1.78 |
30.5 |
0.91 |
96.0 |
|
28 |
27.5 |
75.5 |
||||
|
-67 |
21.0 |
25.0 |
||||
|
1152 |
40 |
4.80 |
5.90 |
64.0 |
3.02 |
119.0 |
|
0 |
15.0 |
46.0 |
||||
|
-60 |
4.0 |
9.5 |
||||
|
1151 |
40 |
4.75 |
5.84 |
64.0 |
2.99 |
119.0 |
|
0 |
15.0 |
46.0 |
||||
|
-60 |
4.0 |
9.5 |
||||
|
1072 |
60 |
0.72 |
0.78 |
25.5 |
0.55 |
115.5 |
|
0 |
26.0 |
111.5 |
||||
|
-60 |
20.0 |
30.0 |
||||
|
1051 |
60 |
0.44 |
0.48 |
25.5 |
0.34 |
115.5 |
|
0 |
26.0 |
111.5 |
||||
|
-60 |
20.0 |
30.0 |
||||
|
1053 |
60 |
0.15 |
0.16 |
25.5 |
0.12 |
115.5 |
|
0 |
26.0 |
111.5 |
||||
|
-60 |
20.0 |
30.0 |
||||
|
1061 |
60 |
0.32 |
0.35 |
25.5 |
0.25 |
115.5 |
|
0 |
26.0 |
111.5 |
||||
|
-60 |
20.0 |
30.0 |
||||
|
Asanko Gold Inc. NI 43-101 Technical Report on Asanko Gold Mine, Ghana |
|
ESTZON |
Rotation |
Nugget |
Structure 1 |
Structure 2 |
||
|
Partial sill |
Range (m) |
Partial sill |
Range (m) |
|||
|
1062 |
60 |
0.77 |
0.84 |
25.5 |
0.59 |
115.5 |
|
0 |
26.0 |
111.5 |
||||
|
-60 |
20.0 |
30.0 |
||||
|
1073 |
60 |
0.88 |
0.96 |
25.5 |
0.68 |
115.5 |
|
0 |
26.0 |
111.5 |
||||
|
-60 |
20.0 |
30.0 |
||||
|
1074 |
60 |
3.11 |
3.37 |
25.5 |
2.40 |
115.5 |
|
0 |
26.0 |
111.5 |
||||
|
-60 |
20.0 |
30.0 |
||||
|
1091 |
60 |
0.13 |
0.14 |
25.5 |
0.10 |
115.5 |
|
0 |
26.0 |
111.5 |
||||
|
-60 |
20.0 |
30.0 |
||||
|
1092 |
60 |
0.59 |
0.64 |
25.5 |
0.50 |
115.5 |
|
0 |
26.0 |
111.5 |
||||
|
-60 |
20.0 |
30.0 |
||||
|
1140 |
60 |
0.55 |
0.60 |
25.5 |
0.43 |
115.5 |
|
0 |
26.0 |
111.5 |
||||
|
-60 |
20.0 |
30.0 |
||||
|
1156 |
60 |
2.17 |
2.36 |
25.5 |
1.68 |
115.5 |
|
0 |
26.0 |
111.5 |
||||
|
-60 |
20.0 |
30.0 |
||||
|
1130 |
60 |
0.04 |
0.05 |
25.5 |
0.03 |
115.5 |
|
0 |
26.0 |
111.5 |
||||
|
-60 |
20.0 |
30.0 |
||||
|
1063 |
60 |
0.10 |
0.11 |
25.5 |
0.08 |
115.5 |
|
0 |
26.0 |
111.5 |
||||
|
-60 |
20.0 |
30.0 |
||||
Ordinary kriging (OK)
Estimation was by OK into 20 m x 40 m x 6 m panels and 5 m x 5 m x 3 m SMUs in ISATISTM. Search ellipsoid orientation and anisotropy was derived from the interpreted geometry of the mineralisation and for the main domains, observations from site geologists regarding the dominant plunge component to the mineralisation (060°N with secondary axis along strike). This creates plunging cones of mineralisation, mimicked in the topography, with hills following silicification in crenulation fold axes.
Sample search neighbourhoods were designed to be overly large to ensure a smoothed panel estimate for use in conditioning the panel.
For the ranking of SMUs, the minimum and maximum number of samples were decreased substantially.
Support correction
Block and point anamorphosis modelling of the estimated values and sampled data were undertaken as the primary input of UC. The support definition for the block anamorphosis is based on the SMU. Information effect was computed. Block support correction values for each of the estimation domains range from 0.65 to 0.86, and following application of the 10 m x 10 m x 1 m information effect, reduced to 0.62 to 0.82 (Table 14-36).
|
Asanko Gold Inc. NI 43-101 Technical Report on Asanko Gold Mine, Ghana |
Table 14-36 Change of Support calculations
|
ESTZON |
Raw block support correction (r) |
Final block support correction (s) |
|
1010 |
0.82 |
0.78 |
|
1021 |
0.82 |
0.79 |
|
1022 |
0.65 |
0.62 |
|
1032 |
0.85 |
0.81 |
|
1033 |
0.85 |
0.82 |
|
1034 |
0.81 |
0.77 |
|
1041 |
0.83 |
0.78 |
|
1051 |
0.82 |
0.78 |
|
1053 |
0.79 |
0.74 |
|
1061 |
0.82 |
0.77 |
|
1062 |
0.83 |
0.78 |
|
1063 |
0.84 |
0.80 |
|
1071 |
0.82 |
0.77 |
|
1072 |
0.83 |
0.78 |
|
1073 |
0.83 |
0.78 |
|
1074 |
0.83 |
0.79 |
|
1091 |
0.80 |
0.75 |
|
1092 |
0.80 |
0.75 |
|
1101 |
0.84 |
0.80 |
|
1102 |
0.82 |
0.77 |
|
1110 |
0.75 |
0.72 |
|
1130 |
0.86 |
0.82 |
|
1140 |
0.84 |
0.79 |
|
1151 |
0.78 |
0.76 |
|
1152 |
0.77 |
0.75 |
|
1154 |
0.74 |
0.72 |
|
1156 |
0.85 |
0.80 |
|
2010 |
0.84 |
0.80 |
|
2021 |
0.82 |
0.77 |
|
2022 |
0.80 |
0.76 |
Uniform conditioning (UC)
The input for UC was the OK model at the panel scale and the output was a grade-tonnage curve for each panel at the SMU scale for Au.
For the discretised grade tonnage curve, 67 cut-offs were used. The dispersion variance, which is used to estimate the level of de-smoothing) was estimated using OK alongside the Kriged panel grade per domain.
Localised uniform conditioning (LUC)
The UC grade (Q) tonnage (T) factors of the panel were proportioned based on the domain in the panel to accurately represent Q (metal), T (tonnes) and M (grade) in the domain. The LUC decomposes and distributes the UC grade-tonnage curves into the SMU based on the ranking of Au within the SMUs that make up the panel.
To assess the performance of the LUC process, grade tonnage curves from LUC were compared to those derived from UC for the main domains. These were found to be comparable.
|
Asanko Gold Inc. NI 43-101 Technical Report on Asanko Gold Mine, Ghana |
14.6.6 Block model validations
Validation of the block model was completed as follows:
-
Validation of the OK panel results through statistical comparison of blocks and composites, swath plots and visual review (cross section/plan views and 3D)
-
Validation of UC results by comparing OK, UC and LUC results at a zero cut-off.
The key focus of validations was on the major domains (ESTZON 1010, 1021, 1022, 2010, 2021, 2022) representing greater than 67% of the estimated metal.
Global estimates for each domain compare well with the input data.
OK panel validation
Visual
The block models were visually reviewed on section and in 3D to ensure that the grade tenor of the input data was reflected in the block models. Generally, the estimates compared well with the input data.
Swath plots
Swath plots for domains 1010, 1021, 2010, 2021 and 2022 are shown in Figure 14-44 to Figure 14-48.
Figure 14-44 Swath plot and histogram showing declustered composites, panel & LUC for Domain 1010
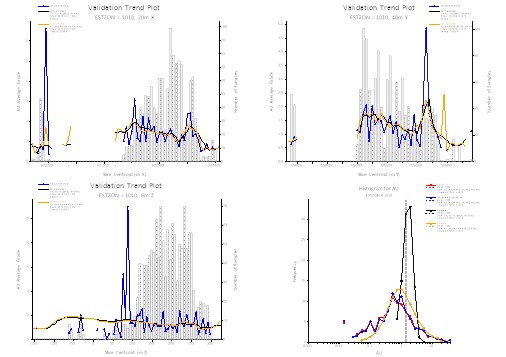
Note: Declustered composites (shown in blue), panel (black) and LUC (orange)
Source: CSA Global, 2019
|
Asanko Gold Inc. NI 43-101 Technical Report on Asanko Gold Mine, Ghana |
Figure 14-45 Swath plot and histogram showing declustered composites, panel & LUC for Domain 1021
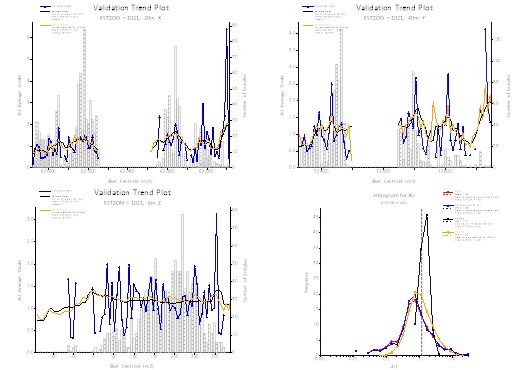
Note: Declustered composites (shown in blue), panel (black) and LUC (orange)
Source: CSA Global, 2019
Figure 14-46 Swath plot and histogram showing declustered composites, panel & LUC for Domain 2010
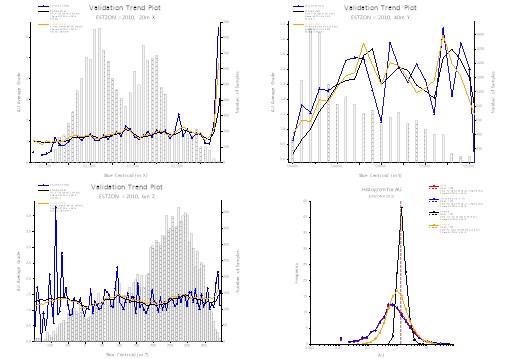
Note: Declustered composites (shown in blue), panel (black) and LUC (orange)
Source: CSA Global, 2019
|
Asanko Gold Inc. NI 43-101 Technical Report on Asanko Gold Mine, Ghana |
Figure 14-47 Swath plot and histogram showing declustered composites, panel & LUC for Domain 2021
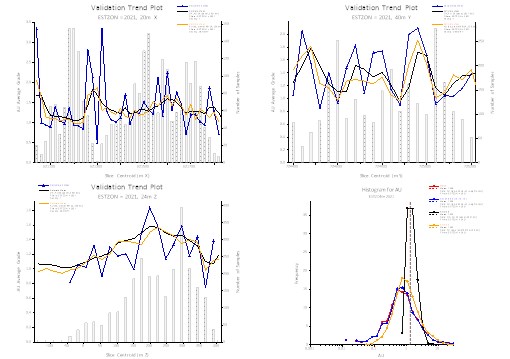
Note: Declustered composites (shown in blue), panel (black) and LUC (orange)
Source: CSA Global, 2019
Figure 14-48 Swath plot and histogram showing declustered composites, panel & LUC for Domain 2022
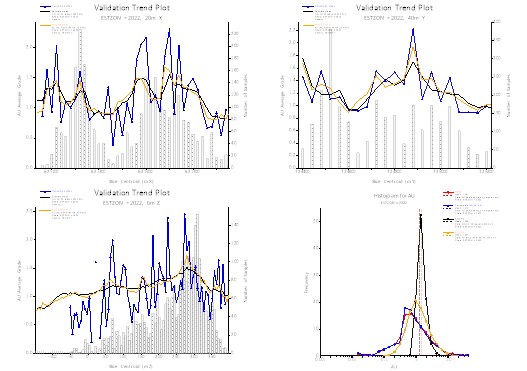
Note: Declustered composites (shown in blue), panel (black) and LUC (orange)
Source: CSA Global, 2019
|
Asanko Gold Inc. NI 43-101 Technical Report on Asanko Gold Mine, Ghana |
Statistical
The statistical difference between the naïve (uncut and top-cut) and declustered (top-cut) composites against the panel and LUC block grades were assessed globally and per domain (Table 14-37). Scatterplots showing UC panel grade vs OK panel grade at a zero g/t Au cut-off are shown in Figure 14-49 for domains 1010 and 2010.
Table 14-37 Statistical validation of main domains
|
ESTZON |
Composites uncut naïve |
Composites top-cut naïve |
Composites top-cut declustered |
Panel model |
LUC model |
Difference |
|
|
Declustered composites to Panel model |
Declustered composites to LUC model |
||||||
|
1010 |
1.38 |
1.38 |
1.44 |
1.44 |
1.46 |
0% |
-1% |
|
1021 |
1.21 |
1.16 |
1.17 |
1.17 |
1.22 |
0% |
-4% |
|
1022 |
1.83 |
1.52 |
1.56 |
1.56 |
1.60 |
0% |
-3% |
|
2010 |
1.42 |
1.37 |
1.30 |
1.30 |
1.31 |
0% |
-1% |
|
2021 |
1.42 |
1.36 |
1.32 |
1.32 |
1.31 |
0% |
1% |
Figure 14-49 Scatterplot of UC panel grade vs OK panel grade, Domain 1010 (left) & Domain 2010 (right)
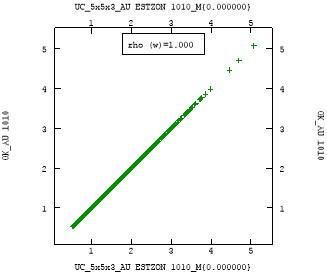
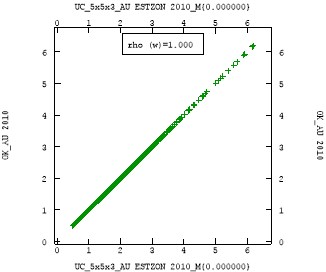
Note: UC panel grade (x-axis) versus OK panel grade at 0 g/t Au cut-off (y-axis) for both domain scatterplots
Source: CSA Global, 2019
|
Asanko Gold Inc. NI 43-101 Technical Report on Asanko Gold Mine, Ghana |
LUC validation
In addition to the statistical and visual validation steps outlined above, the LUC estimate was subject to additional checks. These included:
-
Comparing the grade-tonnage curve of UC and LUC estimates (Figure 14-50)
-
Comparing the mean of the LUC grades within the panel against the mean grade of the panel (Figure 14-51 and Figure 14-52).
Figure 14-50 Scatterplot of mean LUC grade of SMUs vs UC grade for Domain 1010 (left) & Domain 2021 (right)
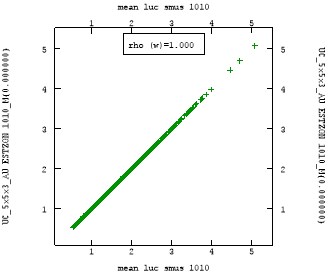
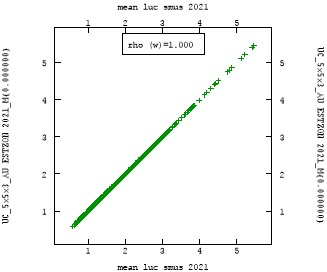
Note: Mean LUC grade of SMUs (x-axis) versus UC grade at 0 g/t Au cut-off (y-axis)
Source: CSA Global, 2019
|
Asanko Gold Inc. NI 43-101 Technical Report on Asanko Gold Mine, Ghana |
Figure 14-51 Grade (left) and tonnage curves (right) for UC (red) and LUC (green) models in Domain 1010
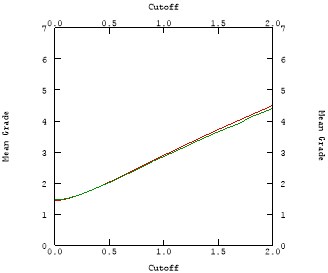
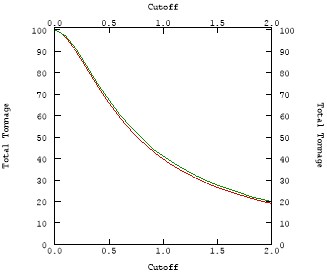
Source: CSA Global, 2019
|
Asanko Gold Inc. NI 43-101 Technical Report on Asanko Gold Mine, Ghana |
Figure 14-52 Grade (left) and tonnage curves (right) for UC (red) and LUC (green) models in Domain 2010
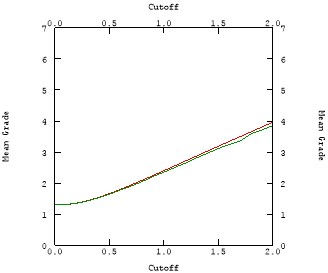
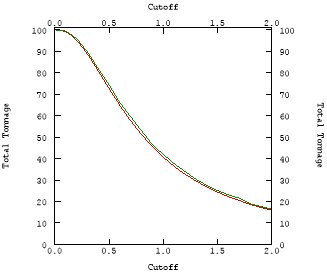
Source: CSA Global, 2019
14.6.7 Mineral Resource classification
The Mineral Resource has been classified as Indicated and Inferred Mineral Resources under the guidelines of CIM (2014); and procedures for classifying the reported Mineral Resources were undertaken within the context of the NI 43-101.
The classification is based upon an assessment of geological understanding of the deposit, geological and mineralisation continuity, drill hole spacing, quality control results, search and estimation parameters, and an analysis of available bulk density data.
The criteria reviewed for classification was as follows:
• Review of geological continuity and understanding of geological and structural setting
• Review of mineralisation controls
• Review of data quality
• Review of QAQC
• Review of drill spacing and estimation quality statistics such as search pass, number of samples used to estimate, slope of regression.
|
Asanko Gold Inc. NI 43-101 Technical Report on Asanko Gold Mine, Ghana |
The drill spacing is sufficient to allow the geology and mineralisation zones to be modelled into coherent wireframes for each domain. Reasonable consistency is evident in the orientations, thickness and grades of the mineralised zone.
Reconciliation with mine production
The Esaase Pit has been mined by Asanko Gold since November 2018. As at 20 December 2019, 2.55 Mt at an Au grade of 1.62 g/t for 133 koz at a cut-off grade of 0.5 g/t has been depleted from the MRE. Comparison with the mine site production grade control model shows a 5.5% loss in tonnes with a 14.5% lower grade for 19.2% lower ounces. Points for consideration relating to this reconciliation are:
• Mining has focused on the near surface oxide material, where exploration drill coverage was impacted by steep topography constraints
• During mining it is clear that local variability in the lithology and structural controls on mineralisation has impacted the reconciliation. Especially recognition of a N-S structure which impacts the local orientation and continuity of gold mineralisation
• The production grade control model is continuously being improved and has likely underestimated some mineralisation as the N-S structures have only recently been identified and were not used in the earlier GC modelling.
Indicated Mineral Resources
A wireframe was created around parts of the model that fit the following criteria:
• In domains where geological confidence is considered higher which are:
o 1010, 2010, 2021, 1021, 1022, 2022, 1041 to the east of the Mamba fault, 1151, 1152, 1101, 1032, 1062, 1140, 1051 to the east of the Mamba fault.
• Where blocks fulfilled the following criteria:
o 40 m x 40 m drill spacing, and in some areas 40 m x 60 m
o Slope of regression >0.50. Lower values in the southern 115* estimation zones which were narrower
o Average distance of samples 40 m to 60 m.
Inferred Mineral Resources
All other blocks within the US$1,500/oz Au pit shell were classified as Inferred Mineral Resources. Blocks that were outside the pit shell were unclassified.
14.6.8 Mineral Resource reporting
The Esaase estimate compiled by CSA Global has been classified and reported as Indicated and Inferred Mineral Resources under the guidelines of CIM (2014), and procedures for classifying the reported Mineral Resources were undertaken within the context of the NI 43-101.
CSA Global considers that the gold mineralisation in the Esaase deposit is amenable to open pit extraction. The parameters are listed in Table 14-38 with a reporting cut-off grade of 0.5 g/t Au.
|
Asanko Gold Inc. NI 43-101 Technical Report on Asanko Gold Mine, Ghana |
Table 14-38 Assumptions considered for selection of reporting cut-off grade
|
Parameter |
Value |
|
Mining cost (maximum US$/t ore) |
2.03 |
|
General and administration (US$/t ore) |
6.48 |
|
Process cost (US$/t ore) |
10.90 |
|
Gold recovery (%) |
93.85 |
|
Gold price (US$/oz) |
1,500 |
The Mineral Resource Statement has been depleted for mining as at 31 December 2019 (Table 14-39). The grade versus tonnage curves for the Indicated Mineral Resource at Esaase were calculated (Figure 14-53).
Table 14-39 Esaase Mineral Resource as a 0.5 g/t Au cut-off as at 31 December 2019
|
Resource category |
Tonnes (Mt) |
Au grade (g/t) |
Au metal (koz) |
|
Indicated |
43.2 |
1.69 |
2,348 |
|
Inferred |
5.4 |
1.54 |
269 |
|
Notes: |
|||
|
• The effective date of the Mineral Resource Statement is 31 December 2019 • The Mineral Resources have been depleted for mining (predicted) up to 31 December 2019 • Mineral Resources are reported at a cut-off grade of 0.5 g/t gold assuming: metal price of US$1,500/oz Au, maximum mining cost of US$2.03/t ore, G&A cost of US$6.48/t, processing cost of US$10.90/t, process recovery of 93.85% • Figures have been rounded to the appropriate level of precision for the reporting of Mineral Resources • Due to rounding, some columns or rows may not compute exactly as shown • The Mineral Resources are stated as in situ dry tonnes. All figures are in metric tonnes • The Mineral Resource has been classified under the guidelines of CIM (2014), and procedures for classifying the reported Mineral Resources were undertaken within the context of the NI 43-101 • Mineral Resources that are not Mineral Reserves do not have demonstrated economic viability. The estimate of Mineral Resources may be materially affected by environmental, permitting, legal, title, taxation, socio-political, marketing, or other relevant issues • Mineral Resources have been reported inclusive of Mineral Reserves, where applicable • The MRE has been prepared by CSA Global who are independent of Asanko Gold • CSA Global does not know of any known legal, political, environmental, or other risks that could materially affect the potential development of the mineral resources. CSA Global believes the risks regarding permitting and socio-economic factors to be low. |
|||
|
Asanko Gold Inc. NI 43-101 Technical Report on Asanko Gold Mine, Ghana |
Figure 14-53 Esaase grade-tonnage curve for Indicated Mineral Resource
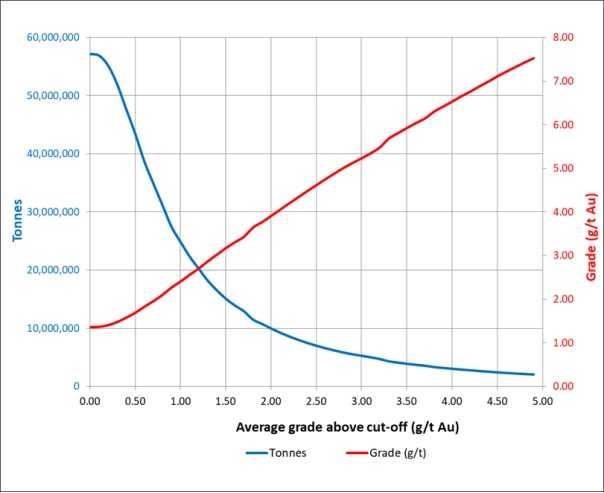
Source: CSA Global, 2020
14.6.9 Risk
A summary of key risk factors is presented in Table 14-40.
Table 14-40 Risk matrix for the Esaase MRE
|
Factor |
Risk |
Comment |
|
Sample collection, preparation and assaying |
Moderate |
The database has been reviewed and while issues were identified, the dataset used for the MRE is of sufficient quality for the estimation of Mineral Resources. RC and DD drilling. Statistics have been reviewed for both drilling types and are comparable. Field duplicate precision exceeds acceptable limits for a nuggety gold deposit i.e. repeatability issues. Mean grade bias is exhibited, but this is often disproportionally affected by high grade outliers, a further indication of the nuggety nature of the mineralisation. |
|
QAQC |
Moderate |
CRMs show instances of apparent mislabelling and minor bias (-2 to 3%) as well as failures. |
|
Geological data and model |
Moderate |
The core has been subject to a re-logging exercise and the geological model/mineralisation controls are better understood than they were previously. There is however insufficient logging data (e.g. quartz content, vein styles etc.) to fully test the revised interpretation. The mineralisation wireframes have been modelled to have a high degree of continuity along strike. If the continuity along strike is not as great as has been modelled, there is a risk of overstating of metal content. |
|
Asanko Gold Inc. NI 43-101 Technical Report on Asanko Gold Mine, Ghana |
|
Factor |
Risk |
Comment |
|
Grade estimate |
Moderate |
The estimate is based on variograms that are quite poorly structured and this directly informs the change of support correction (de-smoothing) applied to the model. Close spaced pre-production drilling will be useful to better model the grade continuity. |
|
Tonnage estimate |
Moderate |
There are a reasonable number of density values which are spatially representative of the deposit. The choice of threshold used in LeapfrogTM to generate the mineralisation models is subjective and has the largest impact of any of the risk factors on volume and therefore tonnage. |
|
Mineral Resource upgrading and extension |
Low |
Mineral Resource is open at depth, though may not be economic. Converting Inferred to Indicated should be possible. Measured not likely without close spaced GC or pre-production drilling. |
|
Economic factors including mineral processing |
Moderate |
Based on the pit optimisation, Esaase has reasonable prospects for eventual economic extraction. From the Phase IV testwork the final process for Esaase included ball milling, gravity gold recovery from the milling circuit and flotation of the milled product (PFS, 2012). Carbon is in the system and has not been modelled. |
|
Accuracy of the estimate |
Moderate |
No simulation studies have been undertaken to quantitatively evaluate accuracy at Esaase. Conditional simulation and risk analysis may quantify RM risk for defined production periods/volume. Reconciliation with the past 12 months of mining has shown local variability in both lithology and structural controls on the mineralisation impacting both volume and grade. Additional mapping data is being collated which will be used to update the MRE during 2020. |
|
Overall rating |
Moderate |
The current MRE carries moderate uncertainty and risk. The risk is principally related to the geological interpretation. |
14.7 Akwasiso MRE
14.7.1 Background
The estimate relating to this Mineral Resource was conducted by CSA Global and finalised following a peer review process. CSA Global is satisfied that the work was conducted at an acceptable level for the reporting of Mineral Resources according to CIM (2014) and the NI 43-101.
14.7.2 Drill hole data
The drill data for the Mineral Resource estimate was supplied by Asanko Gold as a series of csv files exported from LeapfrogTM Central. These data were imported into Datamine StudioRMTM and ISATISTM software. The data were validated upon importing into Datamine StudioRMTM. The QAQC data was reviewed and is detailed in Section 12 of this Technical Report.
14.7.3 Geological and mineralisation modelling
The geological model builds on the observations and concepts modelled by Asanko Gold and B&S Geological Consultants (B&S Geological) in 2019.
The geological model was constructed using LeapfrogTM Geo and was built in three parts:
1. Lithology model (constructed by Asanko Gold and B&S Geological)
2. Mineralisation model (constructed by B&S Geological and CSA Global)
3. Material type model (constructed by Asanko Gold and B&S Geological).
|
Asanko Gold Inc. NI 43-101 Technical Report on Asanko Gold Mine, Ghana |
Lithology
The main lithologies at Akwasiso comprise alternating units of sandstones and shales that strike in a north-easterly direction and dip steeply to the southeast. The orientation of these sedimentary units is subparallel to the regional structural fabric of the Asankrangwa gold belt. Two intrusions of granitic composition occur in the similar orientation to that of the regional fabric. One of the granitic bodies is in the form of a vein and the other is "plug-like" shaped body, plunging to the southeast (purple bodies in Figure 14-54).
Movement indicators within the shear fabric indicate that the last deformational event is likely transpressional, with a sinistral sense of movement. This deformational event is believed to produce the structural fabric and pathways for Au mineralisation, with the best mineralisation occurring in the strain shadow zones of the "plug-like" body (B&S Geological, 2019).
Mineralisation
Mineralisation is associated with the last transpressional, strike-slip deformation that created fluid pathways and low-pressure zones for mineralisation. These pathways follow the main shear fabric and are most pronounced at the rheological boundary between the sediments and the granitic "plug".
There are two styles of mineralisation at Akwasiso, the first are narrow, sinuous, lode type mineralisation that follow the main fabric and wrap around the granitic "plug". The lode type mineralisation has sharp grade boundaries and are relatively simple to link between drill holes. Five lodes are present and modelled (Figure 14-55). The second type of mineralisation is associated with the deformation zones around the contact of the granitic "plug". This type of mineralisation is massive and disseminated with gradational grade contacts (B&S Geological, 2019). In early 2019 B&S Geological modelled several mineralised domains based on grade thresholds.
Figure 14-54 Plan view showing the two granitic bodies at Akwasiso
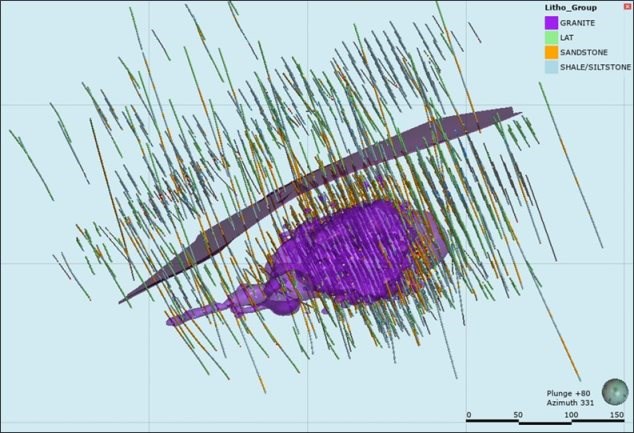
Source: B&S Geological, 2019
|
Asanko Gold Inc. NI 43-101 Technical Report on Asanko Gold Mine, Ghana |
Figure 14-55 Plan view showing the five mineralised lodes relative to the Akwasiso pit
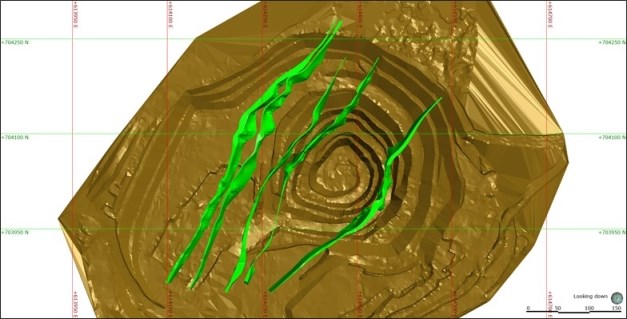
Source: CSA Global, 2019
CSA Global reviewed and updated the mineralisation domains where necessary for use in localised uniform conditioning. The following domains were adopted or re-modelled as an input for estimation:
1. High-grade granitic-sedimentary contact domain - adopted from B&S Geological, based on grade and geological interpretation of a high-grade continuous zone at the granitic-sedimentary contact
2. Low-grade sedimentary zone - constructed by CSA Global based on a <0.5 g/t Au threshold
3. Moderate-grade granitic zone - constructed by CSA Global based on a ≥0.3 g/t Au threshold
4. Low-grade granitic zone - constructed by CSA Global based on a <0.3 g/t Au threshold.
These domains are shown relative to the granitic contact in Figure 14-56. The high-grade contact zone is the only domain that consists of both sedimentary and granitic lithologies.
|
Asanko Gold Inc. NI 43-101 Technical Report on Asanko Gold Mine, Ghana |
Figure 14-56 Plan view (110 m elevation) of domains relative to the granitic-sedimentary contact (black line)
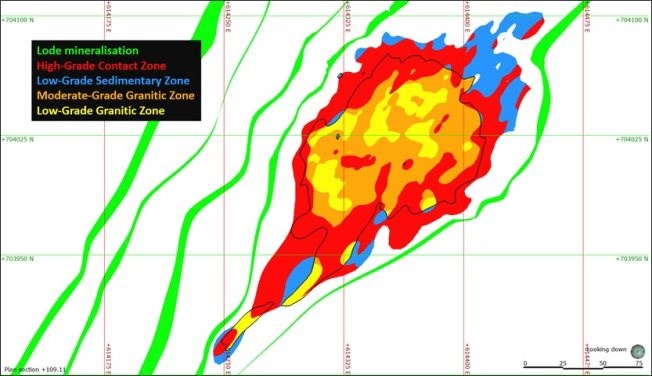
Source: CSA Global, 2019
Material
The material type represents different levels of weathering for material movement purposes. A simple weathering model was constructed from the diamond drill hole logged for the base of complete oxidation (BOCO) and the top of fresh rock (TOFR). The model divided weathering into Oxide (strongly to moderately oxidised), Transitional (weakly oxidised) and Fresh (fresh rock) material types. Away from the drilling, the thickness of weathering was maintained parallel to topography.
14.7.4 Exploratory data analysis
Hole type analysis
Statistics were reviewed for the composited flagged drill hole data, by hole type to assess for bias in Au grade between the sample types. The exploration dataset consists of DD, RCD and RC drilling. Data inside the GC area was selected to check for Au grade bias between the drilling methods, the GC data was declustered for the comparison on a log scale QQ plot (Figure 14-57) which indicates that there is no significant grade bias for the different drilling methods.
|
Asanko Gold Inc. NI 43-101 Technical Report on Asanko Gold Mine, Ghana |
Figure 14-57 Log QQ plot of Au grades within the GC area for DD versus GC drilling

Source: CSA Global, 2019
Contact analysis
Grade population within sediments
Mineralisation primarily occurs on the granite contact and the main mineralised domain (MINZON 101) is spatially derived from this contact. Gold mineralisation also occurs in vein lodes in the surrounding sediments. The sediments consist of sandstone and shale/siltstone that have different grade distributions; Figure 14-58 illustrates this for vein lode 1. These vein lodes were subdivided into these two respective lithological units, where practical, for estimation.
|
Asanko Gold Inc. NI 43-101 Technical Report on Asanko Gold Mine, Ghana |
Figure 14-58 Probability plots comparing Au grade in sandstone (red) and shale/siltstone (green) for lode 1
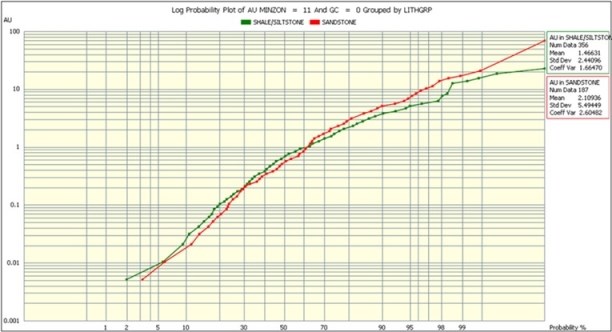
Source: CSA Global, 2019
Contact analysis - Oxidation zones
Contact analysis of grade between the oxidation zones was carried out to assess the nature of the domain boundaries by graphing the average grade with increasing distance from the domain boundary (Figure 14-59).
Contact analysis indicated that oxidation boundaries are gradational, and that no distinctive changes occur across the boundary. This supports the use of soft boundaries during estimation.
Figure 14-59 Contact analysis of oxidation zones
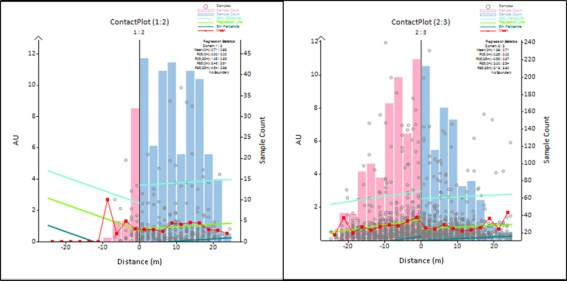
Note: Contact analysis between Oxidised & Transition (1 & 2) left, and between Transition zone & Fresh rock (2 and 3) right
Source: CSA Global, 2019
|
Asanko Gold Inc. NI 43-101 Technical Report on Asanko Gold Mine, Ghana |
Naïve statistics
The tabulation of domained naïve statistics for the whole database and the exploration set is presented in Table 14-41 and Table 14-42, respectively.
Table 14-41 Naïve statistics (length-weighted) for full dataset
|
Mineralisation |
MINZON |
#Samples |
Minimum |
Maximum |
Mean |
SD |
CV |
|
Contact and granite |
101 |
6,758 |
0.005 |
183.20 |
1.93 |
4.57 |
2.37 |
|
102 |
4,843 |
0.005 |
43.36 |
0.66 |
1.70 |
2.59 |
|
|
103 |
3,607 |
0.005 |
23.84 |
0.29 |
0.71 |
2.47 |
|
|
104 |
2,872 |
0 |
25.44 |
0.29 |
0.79 |
2.71 |
|
|
Vein lodes |
111 |
188 |
0.005 |
11.82 |
1.35 |
1.77 |
1.32 |
|
211 |
1,650 |
0.005 |
66.80 |
1.89 |
3.59 |
1.90 |
|
|
112 |
138 |
0.005 |
22.64 |
0.95 |
2.58 |
2.73 |
|
|
212 |
311 |
0.005 |
114.96 |
1.89 |
8.09 |
4.27 |
|
|
13 |
454 |
0.005 |
16.30 |
0.63 |
1.73 |
2.73 |
|
|
14 |
1,418 |
0.005 |
136.00 |
1.29 |
5.72 |
4.45 |
|
|
115 |
336 |
0.005 |
24.88 |
1.16 |
2.61 |
2.25 |
|
|
415 |
388 |
0.005 |
38.84 |
0.95 |
2.62 |
2.76 |
Note: SD - Standard deviation; CV - Coefficient of variation
Table 14-42 Naïve statistics (length-weighted) for exploration dataset
|
Mineralisation |
MINZON |
#Samples |
Minimum |
Maximum |
Mean |
SD |
CV |
|
Contact and granite |
101 |
1,884 |
0.005 |
98.00 |
1.79 |
4.00 |
2.23 |
|
102 |
760 |
0.005 |
38.56 |
0.78 |
2.32 |
2.97 |
|
|
103 |
1,023 |
0.005 |
23.84 |
0.31 |
1.05 |
3.37 |
|
|
104 |
916 |
0.005 |
9.48 |
0.24 |
0.53 |
2.26 |
|
|
Vein lodes |
111 |
18 |
0.13 |
4.90 |
1.11 |
1.28 |
1.15 |
|
211 |
700 |
0.005 |
66.80 |
1.77 |
4.25 |
2.40 |
|
|
112 |
76 |
0.005 |
12.94 |
0.80 |
1.99 |
2.50 |
|
|
212 |
131 |
0.005 |
37.76 |
2.23 |
5.32 |
2.38 |
|
|
13 |
179 |
0.005 |
16.30 |
0.56 |
1.66 |
2.95 |
|
|
14 |
360 |
0.005 |
115.20 |
2.45 |
8.98 |
3.66 |
|
|
115 |
180 |
0.005 |
24.88 |
1.37 |
3.33 |
2.44 |
|
|
415 |
110 |
0.005 |
10.31 |
0.73 |
1.68 |
2.29 |
Note: SD - Standard deviation; CV - Coefficient of variation
Compositing
Sample intervals are 1.5 m for GC drilling (all RC holes) and 1 m for Exploration (DD and RC drilling). Data was composited to 3 m to limit sample splitting.
Grade capping
Grade caps (top cuts) were reviewed by disintegration analysis of probability plots and histograms for the full dataset and were applied to all domains to reduce the impact of outliers, which although real, are unrepresentative of the underlying grade distribution. Grade caps selected using the full dataset were applied to the exploration dataset - as the outliers identified and capped occur in the exploration dataset with less sample support than the full dataset.
|
Asanko Gold Inc. NI 43-101 Technical Report on Asanko Gold Mine, Ghana |
The number of values cut was minimal compared to the total domain population, and cutting these values had little impact on the mean grade of the large domains. For domains with smaller populations, grade caps had a more severe effect, but these domains were not deemed material, and it was anticipated as more drilling was completed, the tail of the distribution would be supported by more data, reducing the impact of grade caps.
Grade caps applied to domains are presented in Table 14-43. This shows the impact on metal cut and number of samples cut. There was no cap applied to MINZON 103 - low grade granite mineralisation.
Table 14-43 Top-cut statistics per domain
|
Mineralisation |
MINZON |
Top-cut value (g/t Au) |
No. of samples |
No. of samples cut |
Uncut mean (g/t Au) |
Cut mean (g/t Au) |
Metal cut (%) |
|
Contact and granite |
101 |
26 |
3,300 |
7 |
1.93 |
1.89 |
-2% |
|
102 |
15 |
2,529 |
5 |
0.65 |
0.64 |
-2% |
|
|
103 |
|
1,813 |
|
0.29 |
|
|
|
|
104 |
8 |
1,448 |
1 |
0.30 |
0.30 |
0% |
|
|
Vein lodes |
111 |
5 |
105 |
3 |
1.37 |
1.27 |
-7% |
|
211 |
13 |
761 |
8 |
1.87 |
1.80 |
-4% |
|
|
112 |
5 |
70 |
2 |
1.00 |
0.72 |
-28% |
|
|
212 |
13 |
171 |
3 |
1.69 |
1.36 |
-20% |
|
|
13 |
4 |
225 |
6 |
0.61 |
0.53 |
-13% |
|
|
14 |
16 |
707 |
7 |
1.26 |
1.12 |
-11% |
|
|
115 |
10 |
152 |
1 |
1.12 |
1.07 |
-4% |
|
|
415 |
5.5 |
200 |
4 |
0.92 |
0.80 |
-13% |
14.7.5 Block model
A volume model was constructed in Datamine StudioRMTM using geology, mineralisation, oxide, fault and topography wireframes. A parent cell size of 20 m x 40 m x 6 m (XYZ) was used and sub-cells were applied where appropriate to honour wireframe volumes. Sub-cell size used is 2 m x 2 m x 1 m for the larger mineralised domains (101-104) and 1 m x 1 m x 1 m for the narrower vein lodes to achieve reasonable resolution of the wireframes.
14.7.6 Grade estimation
The Akwasiso Mineral Resource was estimated using a combination of uniform conditioning (UC) and ordinary kriging (OK) methods. A wireframe was created around the GC data and used to spatially code the block model to (a) limit the influence of clustered, and often high grade data and (b) to identify the portion of the model for which orientation work could be completed to compare models using GC data only and exploration data only to assess the performance of the exploration data based model and calibrate the estimation parameters where required.
The workflow can be summarised as follows:
• Used all data (GC and exploration) to estimate grades and tonnes using UC
• Used exploration data (but the variogram modelled using all data) to estimate grade and tonnes using UC
• Validated these separately and compared grades, tonnes, metal for each domain to assess performance of the exploration only model (orientation review)
• Used OK (with smaller parent cell prototype than UC panel) to estimate the smaller vein lodes 111, 112, 212, 115 and 415 where sample density is low
• Combined models so that:
o Model that uses GC and exploration data used in GC area
|
Asanko Gold Inc. NI 43-101 Technical Report on Asanko Gold Mine, Ghana |
o Model that uses only exploration data used outside GC area
o Added OK results for smaller lode domains (estimated using exploration data).
Uniform conditioning (UC)
UC involves using post-processing of OK large panel estimates to produce a recoverable Mineral Resource. This method provided SMU scale block estimates that honoured the theoretical grade-tonnage relationship determined from discrete Gaussian change of support. UC results for the large OK panels were transferred to SMU blocks using LUC. The quality of the result was dependent on the availability of drill hole data and the nature of the spatial variance.
UC was applied to MINZONs 101, 102, 103, 104, 13, 14 and 211. The most material domains in terms of metal are 101 (high-grade contact zone) and 211 (Lode 1 in western sandstone).
14.7.7 Mineral Resource classification
While a number of factors were considered for classification, the primary criterion is the drill spacing. Indicated classification used a nominal drill spacing of 40 m x 40 m, with the remainder being classified as Inferred up to an 80 m x 80 m drill spacing (Table 14-44). This is generally consistent with other Asanko Gold deposits where a 40 m x 40 m drill spacing had been used to classify material as Indicated.
Table 14-44 Classification criteria
|
Classification category |
Drill spacing (m) |
|
Measured |
Measured classification not applied |
|
Indicated (resource definition) |
40 x 40 drilling |
|
Inferred |
80 x 80 drilling |
A series of wireframes were constructed around areas defined at the relevant drill spacing intervals and these were used to code the undepleted model (Figure 14-60).
|
Asanko Gold Inc. NI 43-101 Technical Report on Asanko Gold Mine, Ghana |
Figure 14-60 Classification of the undepleted model relative to open pit surface and drilling data
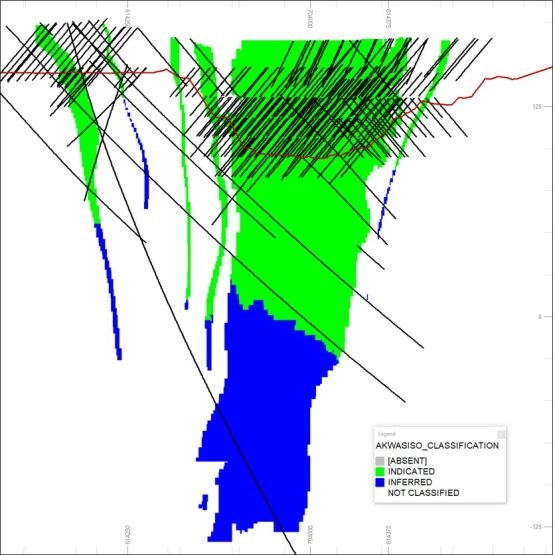
14.7.8 Mineral Resource reporting
The Akwasiso Mineral Resource compiled by CSA Global has been classified and is reported as Indicated and Inferred Mineral Resources under the guidelines of CIM (2014), and procedures for classifying the reported Mineral Resource were undertaken within the context of the NI 43-101. CSA Global considers that the gold mineralisation in the Akwasiso deposit to be amenable to open pit extraction. The parameters are listed in Table 14-45 with a reporting cut-off grade of 0.5 g/t Au.
Table 14-45 Assumptions considered for selection of reporting cut-off grade
|
Parameter |
Value |
|
Mining cost (maximum US$/t ore) |
2.55 |
|
General and administration (US$/t ore) |
6.48 |
|
Process cost (US$/t ore) |
10.90 |
|
Gold recovery (%) |
94 |
|
Gold price (US$/oz) |
1,500 |
The Mineral Resource was depleted for mining as at 31 December 2019. The current Mineral Resource for the Akwasiso deposit is shown in Table 14-46 as at 31 December 2019. The grade versus tonnage curves for the Indicated Mineral Resources category for the Akwasiso deposit is shown in Figure 14-61.
|
Asanko Gold Inc. NI 43-101 Technical Report on Asanko Gold Mine, Ghana |
Table 14-46 Akwasiso Mineral Resource at a 0.5 g/t Au cut-off as at 31 December 2019
|
Resource category |
Tonnes (Mt) |
Au grade (g/t) |
Au metal (koz) |
|
Indicated |
2.8 |
1.82 |
165 |
|
Inferred |
0.4 |
2.16 |
29 |
|
Notes: |
|||
|
• The effective date of the Mineral Resource Statement is 31 December 2019 • The Mineral Resources have been depleted for mining (predicted) up to 31 December 2019 • Mineral Resources are reported at a cut-off grade of 0.5 g/t gold assuming: metal price of US$1,500/oz Au, maximum mining cost of US$2.55/t ore, G&A cost of US$6.48/t, processing cost of US$10.90/t, process recovery of 94% • Figures have been rounded to the appropriate level of precision for the reporting of Mineral Resources • Due to rounding, some columns or rows may not compute exactly as shown • The Mineral Resources are stated as in situ dry tonnes. All figures are in metric tonnes • The Mineral Resource has been classified under the guidelines of CIM (2014), and procedures for classifying the reported Mineral Resources were undertaken within the context of the NI 43-101 • Mineral Resources that are not Mineral Reserves do not have demonstrated economic viability. The estimate of Mineral Resources may be materially affected by environmental, permitting, legal, title, taxation, socio-political, marketing, or other relevant issues • Mineral Resources have been reported inclusive of Mineral Reserves, where applicable • The MRE has been prepared by CSA Global who are independent of Asanko Gold • CSA Global does not know of any known legal, political, environmental, or other risks that could materially affect the potential development of the mineral resources. CSA Global believes the risks regarding permitting and socio-economic factors to be low. |
|||
Figure 14-61 Akwasiso grade-tonnage curve for Indicated Mineral Resource
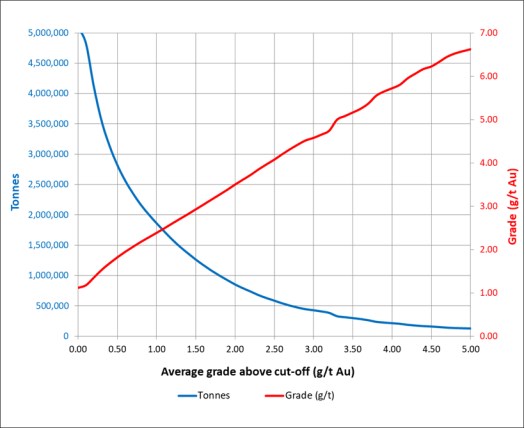
Source: CSA Global, 2020
|
Asanko Gold Inc. NI 43-101 Technical Report on Asanko Gold Mine, Ghana |
14.7.9 Risk
A summary of key risk factors is presented in Table 14-47.
Table 14-47 Risk Matrix for the Akwasiso MRE
|
Factor |
Risk |
Comment |
|
Sample collection, preparation and assaying |
Moderate |
The dataset used for the MRE is considered to be of sufficient quality for estimation of Mineral Resources. Drilling has been completed by RC and DD drilling. Statistics have been reviewed for both and are comparable within common volumes. Grade control data has been used in the upper part of the model, but it's influence has been limited to only that area. |
|
QAQC |
Moderate |
CRMs used are low grade (highest being 3.21 g/t Au), therefore no control on higher grade assay accuracy. Asanko Gold lab method (BR307) under reports by up to 12% compared to CRM expected values for fire assay but this is because of the different methodologies used (bottle roll versus fire assay). ALS results (DD) have acceptable precision for a nuggety ore body with no indication of bias. RC results from the Asanko Gold mine lab have poor repeatability and significant bias to the original results. |
|
Geological data and model |
Moderate |
The geological wireframes are defined in LeapfrogTM using logging. The granitic core is well constrained. Western, central and eastern sandstones are defined. The mineralisation, both sediment hosted lodes and the main mineralisation hosted in the granitic/sediment contact zone have been defined in LeapfrogTM. Continuity of the contact zone hosted mineralisation is interpreted as low which can be seen in the discontinuous nature of the wireframe. Mineralisation in all zones dissipates as you move away from the granite. |
|
Grade estimate |
Moderate |
Grade is highly variable at Akwasiso and while efforts have been made to limit the extent and influence of higher grades, there are some examples of 'blow outs', which get a lower confidence. Because of the variability in grade, additional drilling in advance of mining will be required to reduce this risk i.e. "site based dynamic modelling". |
|
Tonnage estimate |
High |
There are no density measurements at Akwasiso so densities assigned to the model are assumed. |
|
Resource upgrading and extension |
Low |
The gold mineralisation is open at depth, however; it is not currently considered economic so is not classified as a resource. |
|
Economic factors including mineral processing |
Low |
Akwasiso is currently in production. |
|
Accuracy of the estimate |
Moderate |
No simulation studies have been undertaken to quantitatively evaluate accuracy at Akwasiso. Conditional simulation and risk analysis may quantify risk for defined production periods/volume. |
|
Overall rating |
Moderate |
The current MRE carries moderate uncertainty and risk. The risk is principally related to grade continuity and density. |
14.8 Abore MRE
14.8.1 Background
The estimate relating to this Mineral Resource was conducted by Mr. Alex M. Trueman of Gold Fields Ltd. CSA Global has reviewed this estimate and is satisfied that the work was conducted at an acceptable level for the reporting of Mineral Resources according to CIM (2014) and the NI 43-101.
|
Asanko Gold Inc. NI 43-101 Technical Report on Asanko Gold Mine, Ghana |
14.8.2 Drill hole data
Data were provided to Gold Fields by Asanko Gold in the form of csv files extracted from the database for exploration and GC programmes and included fields for collars, downhole surveys and assays. Only those fields required were imported.
14.8.3 Geological modelling
Geological model wireframes for lithology, weathering, and mineralisation domains were provided via Asanko Gold's LeapfrogTM Central server and exported to Datamine's ASCII format. A Datamine macro imported the wireframe files, applied categorical coding, and produced combined wireframe files in Datamine binary format for each type: lithology (abr-wf-grock-tr/pt.dm); weathering (abr-wf-mrock-tr/pt.dm); and primary estimation domains (abr-wf-domain-tr/pt.dm).
The Asanko Gold geologist (Mr. Benjamin Tutu) updated the geology model (lithology, faults, weathering, and gold mineralisation domains) using LeapfrogTM Geo software (23 January 2019). The model builds on the knowledge and interpretations of earlier work (Dusci and Davies, 2014).
Lithology and structure
A series of granitic bodies (average orientation approximately 210°W, 80° dip) and a post-mineralisation dyke (average orientation approximately 254°N, 85° dip) were modelled. The host of these units are earlier sediments divided into hangingwall to the west of the granites and footwall to the east. The granites were divided into Northern, Central, and Southern, separated by the west-northwest dyke and a parallel fault (Figure 14-62). A small internal sediment unit was modelled within the Central Granite. Lithology was coded into the block model using the GROCK field.
|
Asanko Gold Inc. NI 43-101 Technical Report on Asanko Gold Mine, Ghana |
Figure 14-62 Plan at 140 m elevation showing lithology and fault models
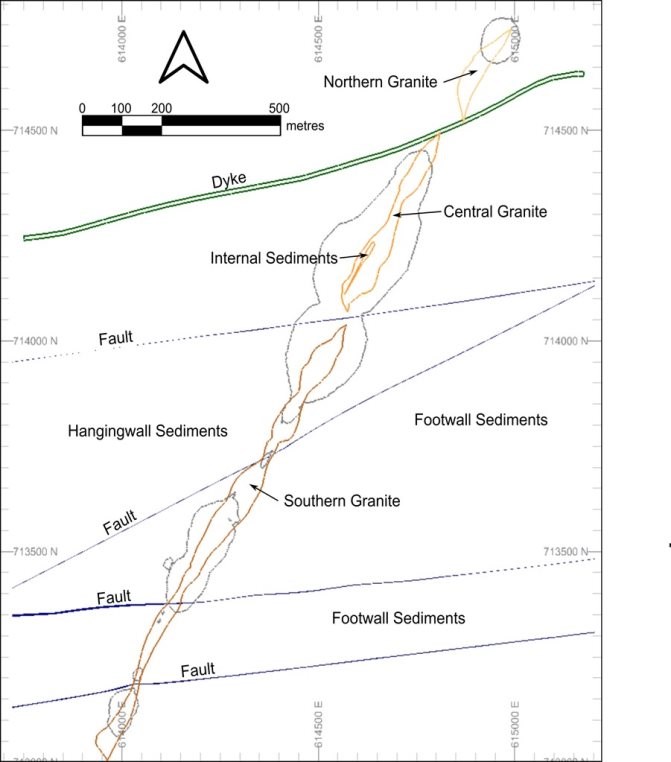
Source: Gold Fields, 2019
Weathering
Weathering was modelled as 'completely oxidized' (hereafter 'Oxide'), 'Transitional', or 'Fresh' based on core and RC logging data (Figure 14-63). The model is made up of horizontal wireframes defining the base of Oxide and the base of Transitional (or top of Fresh). Weathering type was coded into the block model using the MROCK field.
|
Asanko Gold Inc. NI 43-101 Technical Report on Asanko Gold Mine, Ghana |
Figure 14-63 Section through southern granite showing weathering models
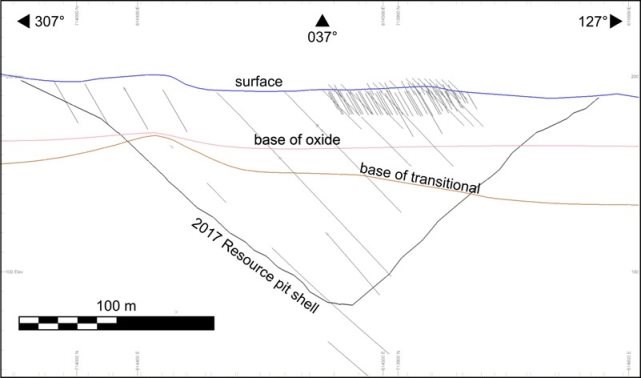
Note: Cross section centre at 614458 mE, 713937 mN; looking towards 037°
Source: Gold Fields, 2019
Mineralisation
The mineralisation model defines volumes of gold mineralisation with similar characteristics (domains), the aim being to define stationary domains for gold grade estimation and simulation. The mineralisation domains were based on a drill hole grade threshold of 0.4 g/t Au and on modelled lithology. The resulting primary domains were a series of tabular bodies sub-parallel to the granite units (Figure 14-64). Domains were defined in the Northern, Central and Southern Granites, in the Hangingwall Sediments, and in the Footwall Sediments.
Drill hole data and the block model were both coded by primary domain in the MAINDOM field.
|
Asanko Gold Inc. NI 43-101 Technical Report on Asanko Gold Mine, Ghana |
Figure 14-64 Plan at 175 m elevation showing primary mineralisation domains
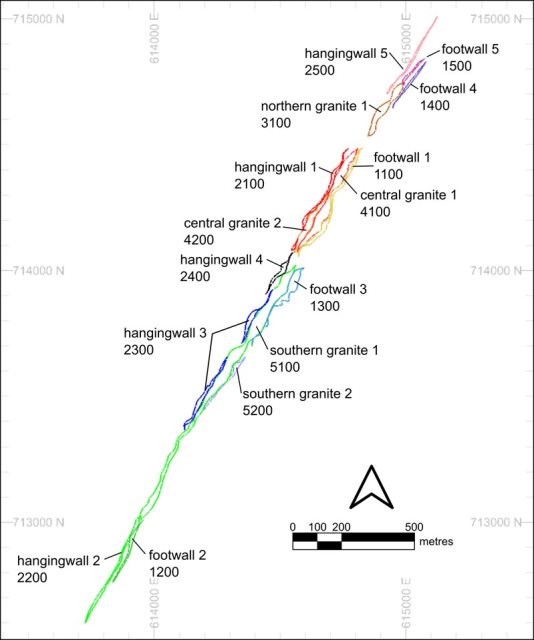
Source: Gold Fields, 2019
14.8.4 Compositing
Following de-surveying of the drill holes, the data were coded by primary estimation domains and then sample lengths were composited to approximately equal lengths within the primary domains. Samples were composited to 1 m lengths using Datamine's COMPDH process with the parameter setting @MODE=1, which optimises the composite length to avoid sample loss. The 1 m length was selected as the majority of samples in the raw drill hole data were 1 m long and this would better represent the variability of the deposit (Figure 14-65).
|
Asanko Gold Inc. NI 43-101 Technical Report on Asanko Gold Mine, Ghana |
Figure 14-65 Histograms of raw and composited drill hole sample length
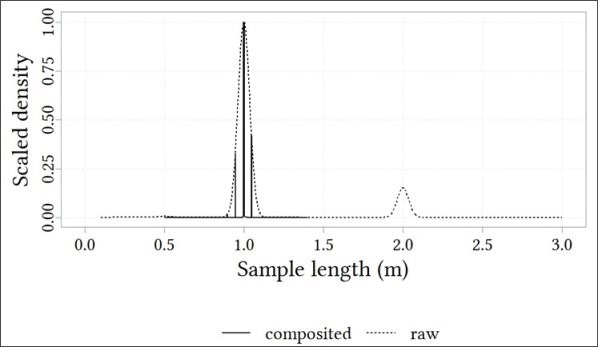
Source: Gold Fields, 2019
14.8.5 Data capping
Analysis of the grouped domain composited data was conducted to identify extreme values that may unduly influence histogram and variogram modelling and therefore the simulated grades. Extreme values were identified by examining the histograms, log probability plots, by visual inspection of the sample location in relation to other samples, and by inspection of the Gaussian anamorphosis models. Data caps selected were generally higher than would be selected for a kriging or uniform conditioning workflow as simulation tends to be more robust in the presence of extreme values, provided that the histogram models of the distribution tails are robust.
14.8.6 Gaussian anamorphosis modelling
Gaussian anamorphosis modelling was conducted in ISATISTM to produce a histogram model and a Gaussian variable for variogram calculation. These inputs are required for turning bands conditional simulation. The goodness of fit was observed to be reasonable and acceptable.
14.8.7 Variography
The calculation of variograms using Gaussian-transformed gold grades was conducted within grouped domains. Multiple variogram directions were calculated in the average plane for each grouped domain to determine a major axis of continuity.
14.8.8 Block model definition
Structure
The model was constructed with a parent cell size of 5 m x 5 m x 3 m (XYZ), which represents the proposed SMU size. The 3 m bench height is standard for Asanko Gold deposits.
|
Asanko Gold Inc. NI 43-101 Technical Report on Asanko Gold Mine, Ghana |
Coding
The block model was created by filling blocks below the topographic surface. The z-axis block dimension was allowed to vary to give a precise fit under the topography. This blank model was then initialised with a series of categorical and continuous fields containing default values (no absent values for any records of the model). Details of these fields, their default values, and the resolution (i.e. degree of sub-blocking in TRIFIL) are shown in Table 14-48.
Table 14-48 Block model fields
|
Field type |
Field |
Description |
Unit |
Default |
Resolution (m) |
|
Categorical |
DOMAIN |
Gold grade estimation domain code |
|
9999 |
1 x 1 x 1 |
|
Categorical |
GROCK |
Lithology code |
|
1000 |
5 x 5 x 3 |
|
Categorical |
GRPDOM |
Domain group code |
|
9999 |
1 x 1 x 1 |
|
Categorical |
MAINDOM |
Primary domain code |
|
9999 |
1 x 1 x 1 |
|
Categorical |
MROCK |
Weathering code |
|
4 |
5 x 5 x 3 |
|
Categorical |
MSTATUS |
Mining status code |
|
1 |
1 x 1 x 1 |
|
Categorical |
RSO2017 |
2017 Resource shell code |
|
0 |
5 x 5 x 3 |
|
Ordinal |
RESCAT |
Confidence classification |
|
5 |
5 x 5 x 3 |
|
Continuous |
AU_PPM |
Estimated in situ gold grade |
g/t |
0.00 |
5 x 5 x 3 |
|
Continuous |
DENSITY |
Assigned density |
t/m3 |
2.67 |
5 x 5 x 3 |
Note: Resolution refers to XYZ dimensions; table excludes the 13 required Datamine block model fields
14.8.9 Estimation
Gold grade was estimated into SMUs using a multi-step process designed to produce an estimate that accurately represents variance and grade at mining scales of quarterly to annual production volumes:
• Conditional simulation of 100 realisations, using the turning bands method, of the point at the centroid of each SMU (ISATISTM script c01-point-simulations.ijnl). This point-scale simulation is intended to represent the GC sample scale
• Extraction of a GC sample grid from the point simulations with a 5 m x 10 m x 3 m pattern. These points represent future GC sample data. The assumption is that more GC data is required in the more variable x-axis direction and less is required in the along-strike (approximately) y-axis direction (ISATISTM script c01-point-simulations.ijnl)
• Ordinary kriging of grades into SMUs using each of the 100 simulated GC data patterns as if estimating 100 possible future GC models. This approach, described by Journel and Kyriakidis (2004), mimics the future GC estimation process and introduces an information effect due to the incomplete GC data (ISATISTM script c01-point-simulations.ijnl)
• Grade re-blocking and localisation to produce a single grade for each SMU (ISATISTM script d01-localize-grade.ijnl):
- The grade re-blocking process takes the 100 GC estimates and produces a panel block model with Q, T, and M fields representing the metal, tonnes, and grade (respectively) distribution at SMU-scale within the larger panel. This is the same format produced by uniform conditioning
- Localisation of the panel data to SMUs using localised uniform conditioning method. This produces a single grade value for each SMU that still honours the SMU block variance expected when mining the SMUs (including an allowance for information effect).
The last step of grade re-blocking and localisation is only required to reduce the number of GC model realisations to one. In future, the desirable approach would be running pit optimisation on all simulated realisations of SMU grade. This allows for the quantification of uncertainty of the SMU grade and the resulting mining optimisation.
|
Asanko Gold Inc. NI 43-101 Technical Report on Asanko Gold Mine, Ghana |
14.8.10 Model validation
Validation of the localised gold grade included visual inspection and swath plots. No issues were identified.
14.8.11 Bulk density
No dry bulk density data were available for the Abore Mineral Resource. Bulk density values were assigned to the block model based on weathering domain. The assigned values were derived from statistics in the 2017 NI 43-101 Technical Report. Table 14-49 shows the density statistics; the mean value was assigned to the weathering domain using the MROCK field in the block model.
Table 14-49 Dry bulk density statistics
|
Weathering domain |
Count |
Minimum (t/m3) |
Mean (t/m3) |
Maximum (t/m3) |
|
Oxide |
6 |
1.72 |
1.85 |
1.98 |
|
Transitional |
6 |
2.14 |
2.42 |
2.57 |
|
Fresh |
21 |
2.08 |
2.67 |
2.87 |
Source: Gold Fields, 2019
14.8.12 Classification
The block model was classified according to confidence and is classified in accordance with CIM (2014).
Drill hole spacing was used as the primary measure of confidence. Drill hole spacing thresholds (Table 14-50) were based on experience from other Asanko Gold deposits, except for Inferred, which was reduced from an 80 m spacing to a maximum of 60 m. An 80 m drill hole spacing for Inferred at Abore was deemed to be too broad and would include excessive extrapolation of the estimates.
Table 14-50 Drill hole spacing confidence classification criteria
|
Classification category |
Sub-category (Internal) |
Spacing (m) |
|
Indicated |
Mine defined |
<20 |
|
Resource defined |
<40 |
|
|
Inferred |
|
<60 |
|
Unclassified |
|
≥60 |
Note: The Indicated sub-category of Mine defined and Resource defined are not CIM definitions and are used for internal purposes only
The final stage of classification was a morphological grid-closing operation which minimised "spotted dog" artefacts (Stephenson et al. 2006) in the classification. The normalised drill hole spacing was used to produce a classification system with minimal "spotted dog" artefacts (Figure 14-66). Lastly, material with 15 m of surface was downgraded by one class to account for unknown artisanal mining activities. This downgrade may be from Indicated (Mine defined) to Indicated (Resource defined). Based on the amount of unknown artisanal mining seen at Abore, consideration should be given to downgrading all material within 15 m of surface to Inferred in future Mineral Resource updates.
Drill hole spacing and classification was calculated using ISATISTM. None of the material at Abore is classified as Measured.
|
Asanko Gold Inc. NI 43-101 Technical Report on Asanko Gold Mine, Ghana |
Figure 14-66 Isometric view looking northwest of normalised drill hole spacing, domain 4140
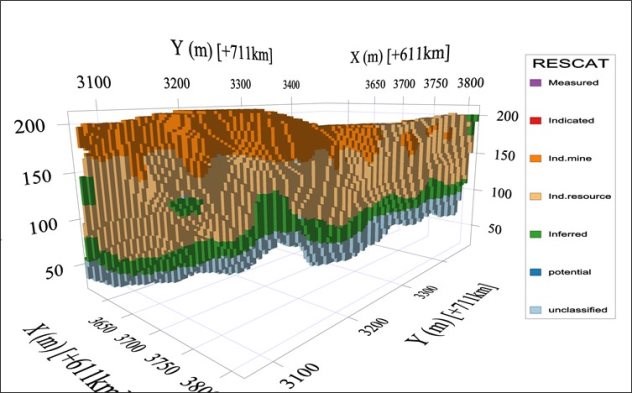
Note: Domain 4140 is the Central Granite Zone 1 combined Oxide and Transitional-Fresh
Source: Gold Fields, 2019
14.8.13 Mineral Resource reporting
The CIM (2014) definition for a Mineral Resource has been provided in Section 14.5.8.
The Abore Mineral Resource compiled by Gold Fields and CSA Global has been classified and is reported as Indicated and Inferred Mineral Resources under the guidelines of CIM (2014), and procedures for classifying the reported Mineral Resource were undertaken within the context of the NI 43-101.
CSA Global considers that the gold mineralisation in the Abore deposit is amenable to open pit extraction. The parameters are listed in Table 14-51 with a reporting cut-off grade of 0.5 g/t Au.
Table 14-51 Assumptions considered for selection of reporting cut-off grade
|
Parameter |
Value |
|
Mining cost (maximum US$/t ore) |
2.65 |
|
General and administration (US$/t ore) |
6.48 |
|
Process cost (US$/t ore) |
10.90 |
|
Gold recovery (%) |
94 |
|
Gold price (US$/oz) |
1,500 |
The Mineral Resource was depleted as at 31 December 2019. The current Mineral Resource for the Abore deposit is shown in Table 14-52 as at 31 December 2019. The grade-tonnage curves for the Indicated Mineral Resource for Abore is shown in Figure 14-67.
|
Asanko Gold Inc. NI 43-101 Technical Report on Asanko Gold Mine, Ghana |
Table 14-52 Abore Mineral Resource reported at a 0.5 g/t Au cut-off as at 31 December 2019
|
Resource category |
Tonnes (Mt) |
Au grade (g/t) |
Au metal (koz) |
|
Indicated |
4.7 |
1.46 |
221 |
|
Inferred |
0.9 |
1.69 |
48 |
|
Notes: |
|||
|
• The effective date of the Mineral Resource Statement is 31 December 2019 • The Mineral Resources have been depleted for mining (predicted) up to 31 December 2019 • Mineral Resources are reported at a cut-off grade of 0.5 g/t gold assuming: metal price of US$1,500/oz Au, maximum mining cost of US$2.55/t ore, G&A cost of US$6.48/t, processing cost of US$10.90/t, process recovery of 94% • Figures have been rounded to the appropriate level of precision for the reporting of Mineral Resources • Due to rounding, some columns or rows may not compute exactly as shown • The Mineral Resources are stated as in situ dry tonnes. All figures are in metric tonnes • The Mineral Resource has been classified under the guidelines of CIM (2014), and procedures for classifying the reported Mineral Resources were undertaken within the context of the NI 43-101 • Mineral Resources that are not Mineral Reserves do not have demonstrated economic viability. The estimate of Mineral Resources may be materially affected by environmental, permitting, legal, title, taxation, socio-political, marketing, or other relevant issues • Mineral Resources have been reported inclusive of Mineral Reserves, where applicable • The MRE has been prepared by CSA Global who are independent of Asanko Gold • CSA Global does not know of any known legal, political, environmental, or other risks that could materially affect the potential development of the mineral resources. CSA Global believes the risks regarding permitting and socio-economic factors to be low. |
|||
Figure 14-67 Abore grade-tonnage curve for Indicated Mineral Resource
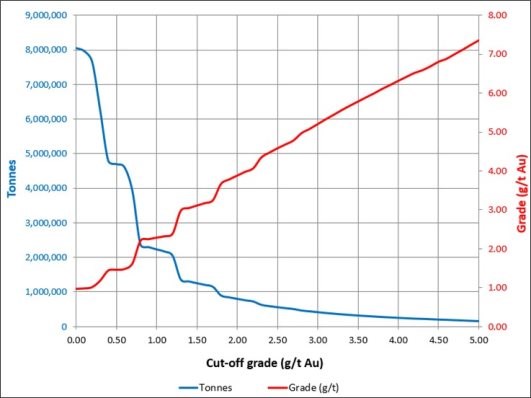
Source: CSA Global, 2019
14.9 Asuadai MRE
14.9.1 Background
The estimate relating to this Mineral Resource was conducted by Mr. Shaun Hackett of Gold Fields. CSA Global has reviewed this estimate and is satisfied that the work was conducted at an acceptable level for the reporting of Mineral Resources according to CIM (2014) and the NI 43-101.
|
Asanko Gold Inc. NI 43-101 Technical Report on Asanko Gold Mine, Ghana |
Asuadai was previously modelled in 2014 and reported as part of the Asanko Gold Mines NI 43-101 report (CJM, 2014). The 2014 Mineral Resource model was based on a geological model prepared by Holistic Minerals and Mining Consultants (Dusci & Davies, 2014). This geological model was used as the basis for the Mineral Resource estimate by CJM Consulting (Pty) Ltd (CJM, 2014).
No mining or additional drilling has been carried out at Asuadai since 2014. However, a relogging program was carried out on the diamond drill core.
The objectives of this updated Mineral Resource estimate were to:
• Build an updated geological model incorporating the relogging of the diamond holes
• Construct a geological and mineralisation model using LeapfrogTM Geo software which can be updated in the future
• Construct a robust mineral inventory model in the well drilled areas which can be used to assess the Mineral Resource and Reserve
• Extrapolate the mineral inventory model into poorly drilled areas based on sound geological assumptions to test for upside mining potential and guide future drill targeting.
14.9.2 Drill hole data
Two drill hole databases were supplied, one for all drilling and one for the relogged diamond drill holes. The database with all drilling did not contain the relogging information.
All drilling methods, sample collection methods and data quality processes and results are described in the 2014 NI 43-101 report (CJM, 2014). These have been reviewed and accepted for use in this Mineral Resource update.
14.9.3 Geological modelling
The updated geological model builds on the observations and concepts modelled by HMM Consultancy in 2014 (Dusci & Davies, 2014).
The geological model was constructed using LeapfrogTM Geo and was built in four parts:
1. Lithology model (GROCK)
2. Structural model (Interpreted structural planes)
3. Mineralisation model (MDOM)
4. Material Type model. (MROCK).
The lithology and material type models were initially interpreted from the diamond drill holes only as these holes include the most reliable logging information and have incorporated a relogging exercise. These models, along with the mineralisation model, were updated to account for the mineralisation intersected in the RC drill holes.
Lithology and structure
Mineralisation is hosted within an east-northeast trending shear zone which cuts through sediment packages and is also found parallel to bedding within wacke/sandstones on the southeast footwall side and wacke/siltstones on the northeast hangingwall side. Diorite dykes have intruded along the central lithological contact of the shear. Sub-parallel to this central contact are hanging wall and footwall extents of the shear zone.
A series of repeating north-south trending structures cross the shear zone, offsetting the main lithological contact and the hangingwall shear contact. Each of the diorite bodies appears to be bracketed by a pair of these north-south structures. These structures are not evident on the magnetic images due to their orientation and the low magnetic contrast in the host lithologies (Figure 14-68).
|
Asanko Gold Inc. NI 43-101 Technical Report on Asanko Gold Mine, Ghana |
Figure 14-68 Lithological and structural models
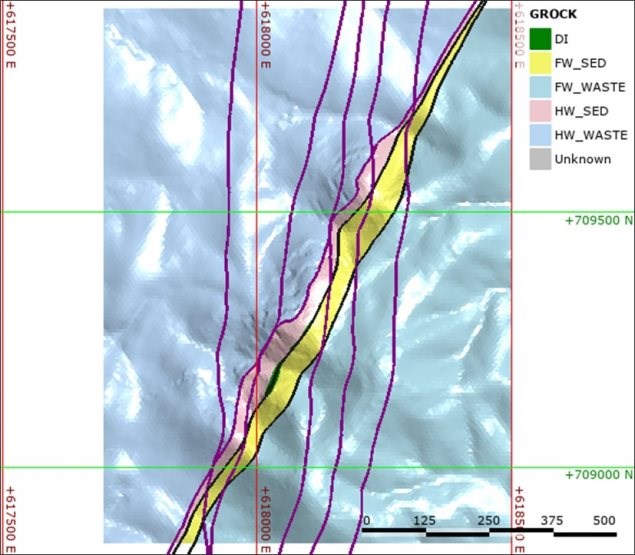
Source: Gold Fields, 2019
Material type
The material type represents different levels of weathering for material movement purposes. A simple weathering model was constructed from the diamond drill hole logged for the base of complete oxidation (BOCO) and the top of fresh rock (TOFR). The model divided weathering into Oxide (strongly to moderately oxidised), Transitional (weakly oxidised) and Fresh (fresh rock) material types. Away from the drilling the thickness of weathering was maintained parallel to topography. The weathering model was deemed to be suitable for assessing simple mineral process flow sheets but may not be sufficiently detailed for complicated processing assessments.
|
Asanko Gold Inc. NI 43-101 Technical Report on Asanko Gold Mine, Ghana |
Mineralisation model
HMM Consultancy observed two generations of mineralisation in 2014 (Dusci & Davies, 2014), an earlier, steep, ductile-type mineralisation, parallel to bedding and foliation and a later set of shallow dipping quartz veins. They considered that the shallow set of veins represented the dominant mineralisation and were best developed within the diorite bodies. They also noted an increase in sheer intensity and mineralisation in the sediments adjacent to the diorite contact. This observation is consistent with Asanko Gold's Dynamite Hill deposit where increased intensity of shearing adjacent to the granite contacts is observed in the pit. They interpreted a moderate plunge to the mineralisation towards the southwest at the intersection between the northeast-southwest main shear and the north-south crosscutting structures (Dusci & Davies, 2014). This is different to other deposits in the area which dominantly show a northerly plunge to mineralisation.
In order to guide the mineralisation modelling a preliminary analysis was undertaken on the raw grades within the modelled lithologies and material types. This confirmed that the diorite (DI) hosts the higher-grade material and that there is only a small difference between the sediment units (FW_SED, HW_SED) within the main shear. The oxide appeared to be slightly higher-grade than the transitional and fresh material.
For the mineralisation model, the main shear was split into fault blocks along strike between the north-south structures (FB1 to FB6) and a wireframe was constructed adjacent to the diorite contact capturing the higher shear intensity mineralisation in the sediments close to the diorite contact (DI shear) (Figure 14-69).
A secondary grade analysis was undertaken to assess the impact of the mineralisation domains. This showed a clear variation in grade between the different fault blocks within the main shear and confirmed the higher-grade mineralisation in the sediments adjacent to the diorite contact.
Comparison with 2014 geological model
Many of the geological concepts observed and modelled by HMM Consultancy in 2014 were supported by the relogging exercise and were incorporated into the updated model. The geological models are therefore similar.
In the current model the diorites were modelled as two discreet bodies as opposed to a continuous dyke as was modelled in 2014. The relogging programme did not support the 2014 modelled phyllite/shale units and these were updated as structural contacts rather than lithological units. The footwall contact to the main shear has been introduced.
14.9.4 Exploratory data analysis
Exploratory data analysis was undertaken to determine how the model data should be separated into estimation domains and to derive parameters for estimation. Coded drill hole sample intervals were composited to 1 m composite lengths for each domain. Where the total drill hole intersection in a domain is not a multiple of the 1 m composite length, it is adjusted to reflect a composite length close to 1 m.
|
Asanko Gold Inc. NI 43-101 Technical Report on Asanko Gold Mine, Ghana |
Figure 14-69 Mineralisation model
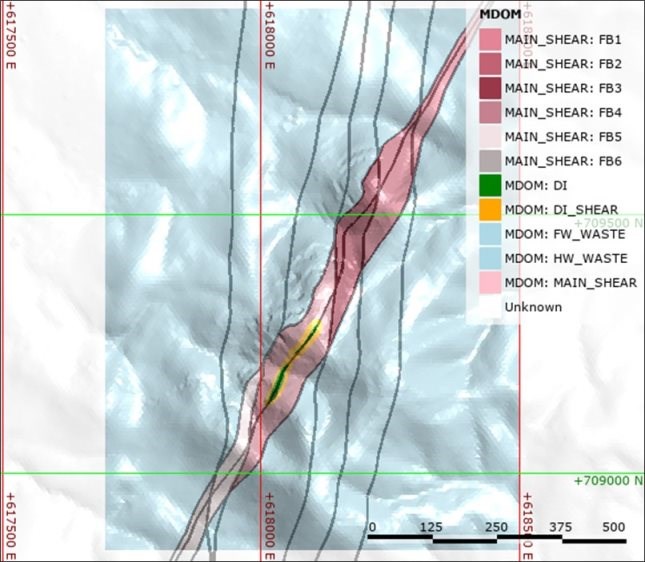
Source: Gold Fields, 2019
The assay data was assessed for high-grade outliers. A conditional simulation technique was being used for grade estimation. Generally, the requirement for controlling high-grade outliers when using conditional simulation is not as critical as when using an estimation technique such as ordinary kriging. However, conditional simulation requires that grade values are converted to Gaussian values prior to simulation through fitting a Gaussian anamorphosis model. High-grade outliers can affect the fit of the anamorphosis model resulting in a poor conversion to Gaussian values. A top-capping (or truncation) approach was used where grade values above the selected top-cap threshold were reduced to the threshold. The threshold was selected by reviewing the anamorphosis model and selecting an upper limit that results in an acceptable fit of the model through the entire grade range. Generally, top-cap thresholds only affected a small number of samples and the thresholds are typically higher than those that would be selected for ordinary kriging where the top-cap is used to control the amount of metal generated by the top end of the data distribution.
|
Asanko Gold Inc. NI 43-101 Technical Report on Asanko Gold Mine, Ghana |
14.9.5 Variography
The domains were grouped for variography based on the geometry of the mineralisation. The diorite and the contact shear mineralisation have a steep southerly plunge and the variogram (V101) was orientated to reflect this (Table 14-53). The mineralisation in the main shear sediment domains are parallel to the shear and V301 is orientated to reflect this. The variograms are modelled on experimental gaussian variograms which are moderately to poorly structured. To reflect the uncertainty in the variogram structure, a second set of alternate variogram models were developed (V102 and V302) and in each of these models a short-range structure was introduced with a local rotation to align the variogram structure to the flat lying vein geometry reported from the drill core.
Table 14-53 Variogram parameters
|
Variogram |
Structure |
Sill |
Range U |
Range V |
Range W |
Rotation |
|
V101 |
S1 Nugget |
0.20 |
|
|
|
|
|
S2 |
0.35 |
14 |
6 |
2 |
-150,65,51 |
|
|
S3 |
0.45 |
80 |
10 |
10 |
-150,65,51 |
|
|
V102 |
S1 Nugget |
0.20 |
|
|
|
|
|
S2 |
0.45 |
10 |
10 |
2 |
180,5,0 |
|
|
S3 |
0.1 |
14 |
12 |
8 |
-150,65,51 |
|
|
V301 |
S4 |
0.25 |
80 |
20 |
10 |
-150,65,51 |
|
S1 Nugget |
0.20 |
|
|
|
|
|
|
S2 |
0.35 |
30 |
20 |
10 |
-115,0,70 |
|
|
V302 |
S3 |
0.45 |
150 |
40 |
30 |
-115,0,70 |
|
S1 Nugget |
0.2 |
|
|
|
|
|
|
S2 |
0.35 |
10 |
10 |
20 |
180,5,0 |
14.9.6 Block model definition
A block model was developed within Datamine StudioRMTM. The model was based on the 2014 block model extents and block sizes. Three block sizes were considered in the block model development, the SMU which is the smallest unit that a mining decision is based on (5 m x 5 m x 3 m), a less selective waste block (10 m x 10 m x 6 m) and a large scale panel (50 m x 50 m x 24 m), each block size being a multiple of the smaller block size.
The block model was coded according to the geological model wireframes. For volume resolution, blocks were sub-celled to a smallest sub-cell resolution of 1 m x 1 m x 1 m.
Dry bulk density was assigned to the block model based on a combination of lithology and material type. Density values have changed slightly from those used in 2014 and were rounded to reflect an appropriate level of precision (Table 14-54).
Table 14-54 Dry bulk density values assigned to the block model
|
Description |
GROCK |
MROCK |
Dry bulk density (t/m3) |
2014 density (t/m3) |
|
All oxide material |
10-32 |
2 |
1.9 |
1.78 |
|
All transitional material |
10-32 |
3 |
2.3 |
2.23 |
|
Fresh sediments |
21-32 |
4 |
2.7 |
2.70 |
|
Fresh diorite |
10 |
4 |
2.6 |
2.70 |
14.9.7 Estimation
The grade model estimated for Asuadai is a localised, recoverable resource model with grades estimated at a SMU scale of 5 m x 5 m x 3 m and is referred to as a localised SMU model (LSMU). The local metal distribution for the recoverable resource was estimated using conditional simulation.
|
Asanko Gold Inc. NI 43-101 Technical Report on Asanko Gold Mine, Ghana |
Basic workflow for LSMU model
1. Point scale conditional simulation (sequential Gaussian simulation)
2. Re-block each realisation to SMU scale (5 m x 5 m x 3 m)
3. Divide the domain into panels (50 m x 50 m x 24 m)
4. Calculate the local metal distribution within each panel from SMUs for all realisations at a sequence of cut-off grades
5. Index the SMU blocks within each panel to represent a local grade distribution
6. Assign grades from the local distribution in increasing sequence to SMUs ranked by the indexed values.
The localisation is the same approach used for LUC which estimates localised SMU grades conforming to the proper grade-tonnage curves as well as maintaining the relative spatial grade distribution pattern indicated by the directly estimated small block grades. The applied estimation differs from LUC by obtaining the local distribution through conditional simulation rather than UC. This maintains the advantages of having a probabilistic conditional simulation model (multiple realisation models) while providing a deterministic summary model (one grade per block) to be used for the reporting and optimisation processes.
14.9.8 Mineral Resource classification
While a number of factors were considered for classification, the primary criterion is the drill spacing. The 2014 Indicated classification used a nominal drill spacing of 20 m x 20 m, with the remainder being classified as Inferred. This was however inconsistent with other Asanko Gold deposits where a 40 m x 40 m drill spacing had been used to classify material as Indicated.
A new classification scheme was proposed and applied. Indicated was split into two categories for mine planning purposes but can be combined for reporting purposes (Table 14-55).
Table 14-55 Classification criteria
|
Classification category |
Drill spacing (m) |
Use |
|
Measured |
Measured classification not applied |
|
|
Indicated (mine defined) |
20 x 20 drilling |
Suitable for detailed mine planning |
|
Indicated (resource definition) |
40 x 40 drilling |
Suitable for long-term mine planning |
|
Inferred |
80 x 80 drilling |
Suitable for conceptual studies |
A series of wireframes were constructed around areas defined at the relevant drill spacing intervals and these were used to code the model in both mineralised and unmineralised areas. If material in the upper 10 m of the model was classified as Indicated (Mine defined), it was downgraded to Indicated (Resource definition) to account for the uncertainty associated with galamsey activity (small scale mining) in the area (Figure 14-70). Based on the amount of unknown artisanal mining, consideration should be given to downgrading all material within 15 m of surface to Inferred in future Mineral Resource updates.
|
Asanko Gold Inc. NI 43-101 Technical Report on Asanko Gold Mine, Ghana |
Figure 14-70 Classification comparison on section 709200mN
|
|
|
|
2014 Mineral Resource classification |
Current block model classification |
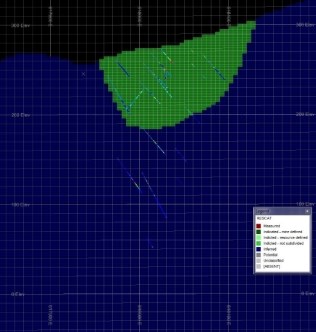
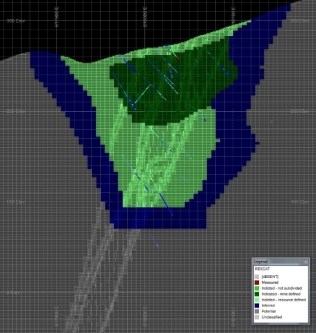
14.9.9 Mineral Resource statement
The CIM (2014) definition for a Mineral Resource has been provided in Section 14.5.8.
The Asuadai Mineral Resource compiled by Gold Fields and CSA Global has been classified and is reported as Indicated and Inferred Mineral Resources under the guidelines of CIM (2014), and procedures for classifying the reported Mineral Resource were undertaken within the context of the NI 43-101.
CSA Global considers that the gold mineralisation in the Asuadai deposit is amenable to open pit extraction. The parameters are listed in Table 14-56 with a reporting cut-off grade of 0.5 g/t Au.
Table 14-56 Assumptions considered for selection of reporting cut-off grade
|
Parameter |
Value |
|
Mining cost (maximum US$/t ore) |
2.55 |
|
General and administration (US$/t ore) |
6.48 |
|
Process cost (US$/t ore) |
10.90 |
|
Gold recovery (%) |
94 |
|
Gold price (US$/oz) |
1,500 |
The Mineral Resource was depleted for mining as at 31 December 2019. The current Mineral Resource for the Asuadai deposit is shown in Table 14-57 as at 31 December 2019. The grade-tonnage curves for the Indicated Mineral Resource for Asuadai is shown in Figure 14-71.
|
Asanko Gold Inc. NI 43-101 Technical Report on Asanko Gold Mine, Ghana |
Table 14-57 Asuadai Mineral Resource reported at a 0.5 g/t Au cut-off as at 31 December 2019
|
Resource category |
Tonnes (Mt) |
Au grade (g/t) |
Au metal (koz) |
|
Indicated |
1.3 |
1.32 |
55 |
|
Inferred |
0.0 |
1.43 |
9 |
|
Notes: |
|||
|
• The effective date of the Mineral Resource Statement is 31 December 2019 • The Mineral Resources have been depleted for mining (predicted) up to 31 December 2019 • Mineral Resources are reported at a cut-off grade of 0.5 g/t gold assuming: metal price of US$1,500/oz Au, maximum mining cost of US$2.55/t ore, G&A cost of US$6.48/t, processing cost of US$10.90/t, process recovery of 94% • Figures have been rounded to the appropriate level of precision for the reporting of Mineral Resources • Due to rounding, some columns or rows may not compute exactly as shown • The Mineral Resources are stated as in situ dry tonnes. All figures are in metric tonnes • The Mineral Resource has been classified under the guidelines of CIM (2014), and procedures for classifying the reported Mineral Resources were undertaken within the context of the NI 43-101 • Mineral Resources that are not Mineral Reserves do not have demonstrated economic viability. The estimate of Mineral Resources may be materially affected by environmental, permitting, legal, title, taxation, socio-political, marketing, or other relevant issues • Mineral Resources have been reported inclusive of Mineral Reserves, where applicable • The MRE has been prepared by CSA Global who are independent of Asanko Gold • CSA Global does not know of any known legal, political, environmental, or other risks that could materially affect the potential development of the mineral resources. CSA Global believes the risks regarding permitting and socio-economic factors to be low. |
|||
Figure 14-71 Asuadai grade-tonnage curve for Indicated Mineral Resources
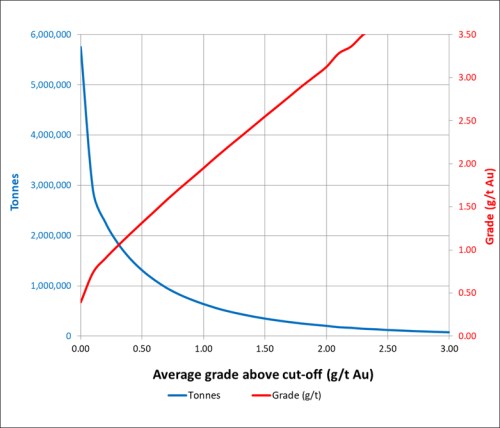
Source: CSA Global, 2019
|
Asanko Gold Inc. NI 43-101 Technical Report on Asanko Gold Mine, Ghana |
14.10 Adubiaso MRE
14.10.1 Background
The estimate relating to this Mineral Resource was conducted by Mr. Shaun Hackett of Gold Fields. CSA Global has reviewed this estimate and is satisfied that the work was conducted at an acceptable level for the reporting of Mineral Resources according to CIM (2014) and the NI 43-101.
The Adubiaso Mineral Resource was previously estimated in 2014 and reported as part of the Asanko Gold Mines NI 43-101 report (CJM, 2014).
There is an existing open pit at Adubiaso that was last mined by Ranger Minerals in the 1990s. No mining or additional drilling has been carried out at Adubiaso since 2014.
The objectives of this modelling exercise were to:
• Build an updated geological model incorporating the relogging of the diamond holes
• Build an updated geological model incorporating Adubiaso and Adubiaso Extension
• Construct a geological and mineralisation model using LeapfrogTM Geo software
• Construct a robust mineral inventory model in the well drilled areas which can be used to assess the mineral resource and mineral reserve
• Extrapolate the mineral inventory model into poorly drilled areas based on sound geological assumptions to test for upside mining potential and guide future drill targeting.
14.10.2 Drill hole data
The drill data for the Mineral Resource estimate was exported from LeapfrogTM as a series of text files and imported into Datamine StudioRMTM software.
All drilling methods, sample collection methods and data quality processes and results were described in the 2014 NI 43-101 report (CJM, 2014). The QAQC data was reviewed and is detailed in Section 12 of this Technical Report.
14.10.3 Geological modelling
The geological model was reinterpreted as the simplistic model used for the 2014 Mineral Resource estimate did not adequately reflect the mineralisation controls. The geological model was reviewed and accepted for the 2019 Mineral Resource update by CSA Global.
Lithology and structure
Mineralisation is hosted within a northwest trending shear zone which cuts through sediment packages and is also found parallel to bedding within resistive greywackes on the eastern footwall side and conductive greywackes on the western hangingwall side. Along the central axis, the shear lithology is dominated by phyllites which were intruded by felsic porphyries.
A series of repeating northwest/southeast trending structures cross the shear zone (Figure 14-72, Figure 14-73 and Figure 14-74).
|
Asanko Gold Inc. NI 43-101 Technical Report on Asanko Gold Mine, Ghana |
Figure 14-72 Lithological and structural models (plan view)
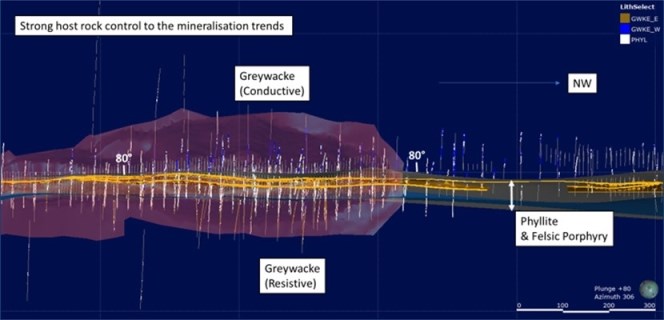
Source: Gold Fields, 2019
Figure 14-73 Lithological and structural models (section view)
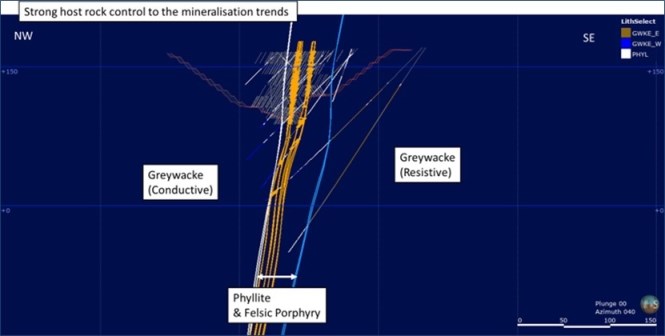
Source: Gold Fields, 2019
|
Asanko Gold Inc. NI 43-101 Technical Report on Asanko Gold Mine, Ghana |
Figure 14-74 Lithological and structural models (section view)
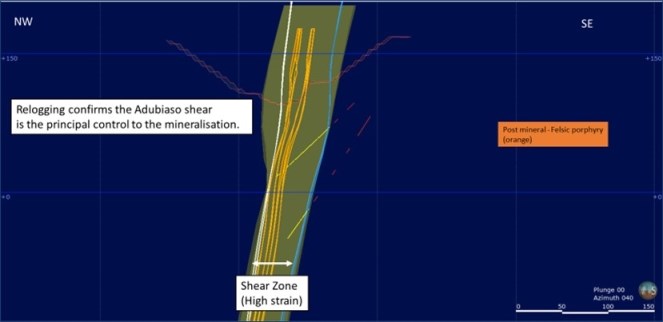
Source: Gold Fields, 2019
Material type
The material type represents different levels of weathering for material movement purposes. A simple weathering model was constructed from the diamond drill hole logged for the base of complete oxidation (BOCO) and the top of fresh rock (TOFR). The model divided weathering into Oxide (strongly to moderately oxidised), Transitional (weakly oxidised) and Fresh (fresh rock) material types. The weathering model was deemed to be suitable for assessing simple mineral process flow sheets but may not be sufficiently detailed for complicated processing assessments.
Mineralisation model
The principal control on the mineralisation is the Adubiaso shear as observed in close-spaced grade control drilling. Within the shear, the mineralisation is best developed along the hangingwall side of the felsic porphyry units. The mineralisation appeared to be a composite of moderately dipping structures hosting higher gold grades (Figure 14-75) within an overall steeper dipping envelope subparallel to the trend of the porphyries.
Local thickening of the mineralisation envelope corresponded with a higher intensity of gold mineralisation and appeared to be controlled, in part, by the interpreted northwest/southeast crosscutting structure, resulting in a moderate north east plunge to the mineralisation (Figure 14-76).
|
Asanko Gold Inc. NI 43-101 Technical Report on Asanko Gold Mine, Ghana |
Figure 14-75 Mineralisation model (cross section view)
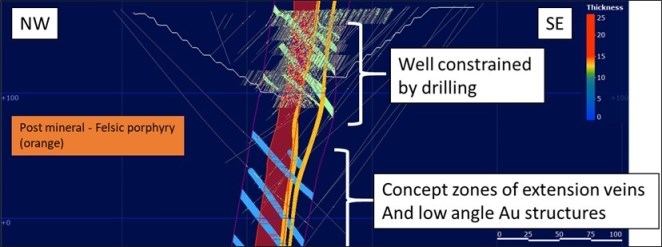
Source: Gold Fields, 2019
Figure 14-76 Mineralisation model (long section view)
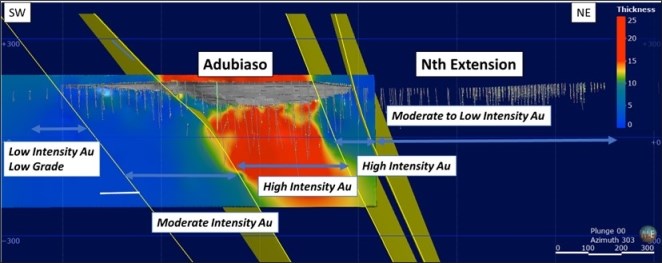
Source: Gold Fields, 2019
14.10.4 Exploratory data analysis
Exploratory data analysis was undertaken to determine how the input data would be divided into estimation domains and to derive parameters for estimation. A field (DOMSIM) was added to the Datamine drill hole file prior to compositing. Coded drill hole sample intervals were composited to 1 m lengths for each domain. Where the total drill hole intersection in a domain was not a regular multiple of 1 m, the composite length was adjusted to reflect an even composite length close to 1 m.
The compositing process removed the influence of short, selective interval sampling in the diamond core which would influence the shape of the data distribution if not accounted for. Most of the samples were originally collected at 1 m lengths or less.
|
Asanko Gold Inc. NI 43-101 Technical Report on Asanko Gold Mine, Ghana |
The assay data was assessed for high-grade outliers. A conditional simulation technique was being used for grade estimation. Generally, the requirement for controlling high-grade outliers when using conditional simulation is not as critical as when using an estimation technique such as ordinary kriging. However, conditional simulation requires that grade values are converted to Gaussian values prior to simulation through fitting a Gaussian anamorphosis model. High-grade outliers can affect the fit of the anamorphosis model resulting in a poor conversion to Gaussian values. A top-capping (or truncation) approach was used where grade values above the selected top-cap threshold were reduced to the threshold. The threshold was selected by reviewing the anamorphosis model and selecting an upper limit that results in an acceptable fit of the model through the entire grade range. Generally, top-cap thresholds only affected a small number of samples and the thresholds are typically higher than those that would be selected for ordinary kriging where the top-cap is used to control the amount of metal generated by the top end of the data distribution.
The data was analysed to check if the different drilling methods (GC, RC and DD) returned comparable assay results. There was an apparent high-grade bias in the GC and RC drilling when considering samples collected in the upper portion of the main domain. The bias was considered to be a function of the drill density, related to the short scale mineralisation structures. As the project advances this bias must be further investigated to confirm the underlying cause. No action was taken for the Mineral Resource estimate.
14.10.5 Variography
Two variogram orientations were applied; the first aligned parallel to the low angle structures (V3100) and the second aligned to the main shear orientation (V3300). Half of the simulation realisations were run using the first variogram and the remaining realisations were run using the second variogram (Table 14-58).
Table 14-58 Variogram parameters
|
Variogram |
Structure |
Sill |
Range U |
Range V |
Range W |
Rotation |
|
V3100 |
S1 Nugget |
0.2 |
|
|
|
|
|
S2 |
0.5 |
5 |
5 |
2 |
210,130,-160 |
|
|
S3 |
0.2 |
20 |
15 |
5 |
210,130,-160 |
|
|
S4 |
0.1 |
110 |
75 |
15 |
210,130,-160 |
|
|
V3300 |
S1 Nugget |
0.15 |
|
|
|
|
|
S2 |
0.33 |
8 |
3 |
3 |
210,75,180 |
|
|
S3 |
0.17 |
19 |
7 |
7 |
210,75,180 |
|
|
S4 |
0.35 |
100 |
30 |
30 |
210,75,180 |
14.10.6 Block model definition
A block model was developed within Datamine StudioRMTM. The model was based on the 2014 block model extents and block sizes. Three block sizes were considered in the block model development, the SMU which is the smallest unit that a mining decision is based on (5 m x 5 m x 3 m), a less selective waste block (10 m x 10 m x 6 m) and a large scale panel (50 m x 50 m x 24 m), each block size being a multiple of the smaller block size.
The block model was coded according to the geological model wireframes. For volume resolution, blocks were sub-celled to a smallest sub-cell resolution of 1 m x 1 m x 1 m.
Dry bulk density was assigned to the block model based on a combination of lithology and material type. The same density values as used for Asuadai were applied as similar rock types are present at both deposits. Density values have changed slightly from those used in 2014 and have been rounded to reflect an appropriate level of precision (Table 14-59).
|
Asanko Gold Inc. NI 43-101 Technical Report on Asanko Gold Mine, Ghana |
Table 14-59 Dry bulk density values assigned to the block model
|
Description |
GROCK |
MROCK |
Dry bulk density (t/m3) |
2014 density (t/m3) |
|
All oxide material |
ALL |
2 |
1.9 |
1.78 |
|
All transitional material |
ALL |
3 |
2.3 |
2.23 |
|
Fresh sediments |
31-33 |
4 |
2.7 |
2.73 |
|
Fresh diorite |
11-18 |
4 |
2.6 |
2.64 |
14.10.7 Estimation
The grade model estimated for this Project is a localised, recoverable resource model with grades estimated at a selective mining unit scale of 5 m x 5 m x 3 m and is referred to as a LSMU model. The local metal distribution for the recoverable resource was estimated using conditional simulation.
Basic workflow for LSMU model
1. Point scale conditional simulation (sequential Gaussian simulation)
2. Re-block each realisation to SMU scale (5 m x 5 m x 3 m)
3. Divide the domain into panels (50 m x 50 m x 24 m)
4. Calculate the local metal distribution within each panel from SMUs for all realisations at a sequence of cut-off grades
5. Index the SMU blocks within each panel to represent a local grade distribution
6. Assign grades from the local distribution in increasing sequence to SMUs ranked by the indexed values.
The localisation is the same approach used for LUC which estimates localised SMU grades conforming to the proper grade-tonnage curves as well as maintaining the relative spatial grade distribution pattern indicated by the directly estimated small block grades. The applied estimation differs from LUC by obtaining the local distribution through conditional simulation rather than UC. This maintains the advantages of having a probabilistic conditional simulation model (multiple realisation models) while providing a deterministic summary model (one grade per block) to be used for the reporting and optimisation processes.
14.10.8 Mineral Resource classification
While a number of factors were considered for classification, the primary criterion is the drill spacing. The 2014 Indicated classification used a nominal drill spacing of 20 m x 20 m, with the remainder being classified as Inferred. This was however inconsistent with other Asanko Gold deposits where a 40 m x 40 m drill spacing had been used to classify material as Indicated.
A new classification scheme was proposed and applied. Indicated was split into two categories for mine planning purposes but can be combined for reporting purposes (Table 14-60).
Table 14-60 Classification criteria
|
Classification category |
Drill spacing (m) |
Use |
|
Measured |
Measured classification not applied |
|
|
Indicated (mine defined) |
20 x 20 drilling |
Suitable for detailed mine planning |
|
Indicated (resource definition) |
40 x 40 drilling |
Suitable for long-term mine planning |
|
Inferred |
80 x 80 drilling |
Suitable for conceptual studies |
A series of wireframes were constructed around areas defined at the relevant drill spacing intervals and these were used to code the model in both mineralised and unmineralised areas. If material was in the upper 15 m of the model was classified as Indicated (Mine defined), it was downgraded to Indicated (Resource definition) to account for the uncertainty associated with galamsey activity (small scale mining) in the area. Based on the amount of unknown artisanal mining, consideration should be given to downgrading all material within 15 m of surface to Inferred in future Mineral Resource updates.
|
Asanko Gold Inc. NI 43-101 Technical Report on Asanko Gold Mine, Ghana |
14.10.9 Mineral Resource statement
The CIM (2014) definition for a Mineral Resource has been provided in Section 14.5.8.
The Adubiaso Mineral Resource compiled by Gold Fields and CSA Global has been classified and is reported as Indicated and Inferred Mineral Resources under the guidelines of CIM (2014), and procedures for classifying the reported Mineral Resource were undertaken within the context of the NI 43-101.
CSA Global considers that the gold mineralisation in the Adubiaso deposit is amenable to open pit extraction. The parameters are listed in Table 14-61 with a reporting cut-off grade of 0.5 g/t Au.
Table 14-61 Assumptions considered for selection of reporting cut-off grade
|
Parameter |
Value |
|
Mining cost (maximum US$/t ore) |
2.55 |
|
General and administration (US$/t ore) |
6.48 |
|
Process cost (US$/t ore) |
10.90 |
|
Gold recovery (%) |
94 |
|
Gold price (US$/oz) |
1,500 |
The Mineral Resource was depleted for mining as at 31 December 2019. The current Mineral Resource for the Adubiaso deposit is shown in Table 14-24 as at 31 December 2019 (Table 14-62). The grade-tonnage curves for the Indicated Mineral Resource for Adubiaso is shown in Figure 14-77.
Table 14-62 Adubiaso Mineral Resource reported at a 0.5 g/t Au cut-off as at 31 December 2019
|
Resource category |
Tonnes (Mt) |
Au grade (g/t) |
Au metal (koz) |
|
Indicated |
1.2 |
1.88 |
71 |
|
Inferred |
0.2 |
1.43 |
9 |
|
Notes: |
|||
|
• The effective date of the Mineral Resource Statement is 31 December 2019 • The Mineral Resources have been depleted for mining (predicted) up to 31 December 2019 • Mineral Resources are reported at a cut-off grade of 0.5 g/t gold assuming: metal price of US$1,500/oz Au, maximum mining cost of US$2.55/t ore, G&A cost of US$6.48/t, processing cost of US$10.90/t, process recovery of 94% • Figures have been rounded to the appropriate level of precision for the reporting of Mineral Resources • Due to rounding, some columns or rows may not compute exactly as shown • The Mineral Resources are stated as in situ dry tonnes. All figures are in metric tonnes • The Mineral Resource has been classified under the guidelines of CIM (2014), and procedures for classifying the reported Mineral Resources were undertaken within the context of the NI 43-101 • Mineral Resources that are not Mineral Reserves do not have demonstrated economic viability. The estimate of Mineral Resources may be materially affected by environmental, permitting, legal, title, taxation, socio-political, marketing, or other relevant issues • Mineral Resources have been reported inclusive of Mineral Reserves, where applicable • The MRE has been prepared by CSA Global who are independent of Asanko Gold • CSA Global does not know of any known legal, political, environmental, or other risks that could materially affect the potential development of the mineral resources. CSA Global believes the risks regarding permitting and socio-economic factors to be low. |
|||
|
Asanko Gold Inc. NI 43-101 Technical Report on Asanko Gold Mine, Ghana |
Figure 14-77 Adubiaso grade-tonnage curve for Indicated Mineral Resources
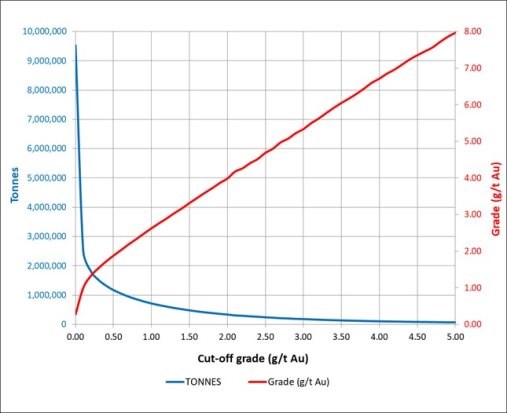
Source: CSA Global, 2019
 |
Asanko Gold Inc. NI 43-101 Technical Report on Asanko Gold Mine, Ghana |
15 MINERAL RESERVE ESTIMATES
15.1 Introduction
The Mineral Reserve estimate (MRev) has been prepared as part of the LOM Study by CSA Global using the CIM definitions and guidelines adopted as of May 2014 (CIM, 2014) and procedures for classifying the reported Mineral Reserves were undertaken within the context of the Canadian Securities Administrators National Instrument 43-101 (NI 43-101).
The Mineral Reserves were derived from the Mineral Resource block models and estimates that are presented in Section 14. The Mineral Reserves are based on the Indicated Mineral Resources that have been identified as being economically extractable and which incorporate mining losses and the addition of waste dilution. A summary of the Mineral Reserves by pit is shown in Table 15-1.
Table 15-1 Summary of the Mineral Reserves as at 31 December 2019
|
Deposit |
Proven |
Probable |
Total |
||||||
|
Tonnes (Mt) |
Au Grade (g/t) |
Au Content (koz) |
Tonnes (Mt) |
Au Grade (g/t) |
Au Content (koz) |
Tonnes (Mt) |
Au Grade (g/t) |
Au Content (koz) |
|
|
Nkran |
|
|
|
10.9 |
1.64 |
577 |
10.9 |
1.64 |
577 |
|
Esaase Main |
|
|
|
29.1 |
1.33 |
1,245 |
29.1 |
1.33 |
1,245 |
|
Esaase South |
|
|
|
4.5 |
1.44 |
210 |
4.5 |
1.44 |
210 |
|
Akwasiso |
|
|
|
1.9 |
1.43 |
87 |
1.9 |
1.43 |
87 |
|
Abore |
|
|
|
2.8 |
1.42 |
127 |
2.8 |
1.42 |
127 |
|
Adubiaso |
|
|
|
0.8 |
1.51 |
38 |
0.8 |
1.51 |
38 |
|
Asuadai |
|
|
|
1.0 |
1.12 |
37 |
1.0 |
1.12 |
37 |
|
Stockpiles |
2.3 |
0.76 |
57 |
|
|
|
2.3 |
0.76 |
57 |
|
Total |
2.3 |
0.76 |
57 |
51.1 |
1.41 |
2,320 |
53.4 |
1.38 |
2,377 |
|
Notes: |
|||||||||
|
• The effective date of the Mineral Reserve is 31 December 2019 based on projected mining depletions |
|||||||||
|
• Mineral Reserves are reported assuming a metal price of US$1,300/oz Au |
|||||||||
|
• Mineral Reserves are defined within pit designs guided by pit shells derived from Whittle Four-X™ software (Whittle) |
|||||||||
|
• Mineral Reserves are reported based on the maximum of: (a) the calculated marginal cut-off grades for each of the pits ranging between 0.38 - 0.71 g/t gold, and (b) 0.50 g/t gold |
|||||||||
|
• Mining, G&A, processing costs, and process recovery are dependent on deposit and detailed in the respective deposit sections |
|||||||||
|
• Figures are rounded to the appropriate level of precision for the reporting of Mineral Reserves. Due to rounding, some columns or rows may not compute as shown |
|||||||||
|
• The Mineral Reserve is stated as in situ dry metric tonnes |
|||||||||
|
• The mine plan underpinning the Mineral Reserves has been prepared by Snowden and reviewed and accepted by the CSA Global. Both Snowden and CSA Global are independent of Asanko Gold |
|||||||||
|
• In accordance with the CIM definitions and guidelines (2014) the reporting of Mineral Reserves is classified as either "Probable" or "Proven" Mineral Reserves and are based on Indicated and Measured Mineral Resources only. For the LOM Study, no Mineral Reserves have been estimated using Inferred Mineral Resources |
|||||||||
|
• CSA Global does not know of any known legal, political, environmental, or other risks that could materially affect the potential development of the Mineral Reserves. CSA Global believes the risks regarding permitting and socio-economic factors to be low. |
|||||||||
The location of all the deposits in the Mineral Reserve statement in relation to the CIL plant (design capacity of 5.0 Mtpa - currently operating at a throughput of 5.4 Mtpa) is shown in Figure 15-1. The overland haul road linking up Esaase and all the satellite deposits to the CIL plant is in the process of being debottlenecked to align with the long-term plan.
|
Asanko Gold Inc. NI 43-101 Technical Report on Asanko Gold Mine, Ghana |
Figure 15-1 Asanko Gold Mineral Reserve location map
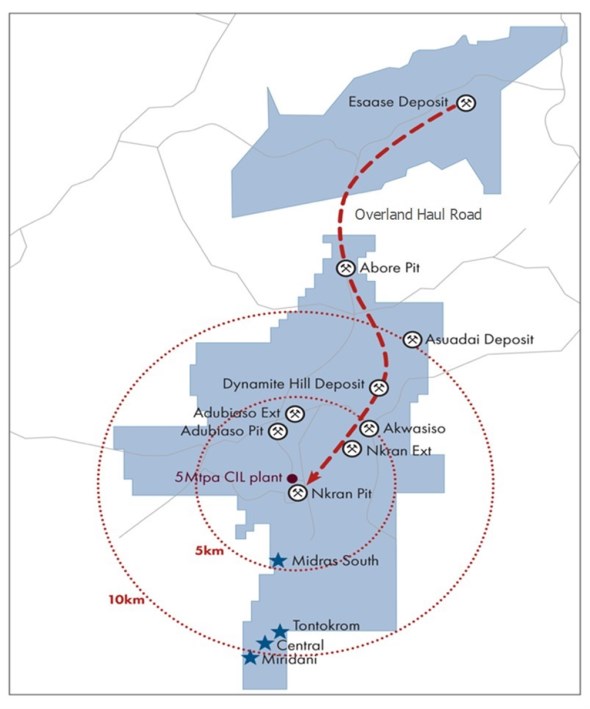
The Dynamite Hill deposit has recently been depleted and is therefore not included in the Mineral Reserve statement.
|
Asanko Gold Inc. NI 43-101 Technical Report on Asanko Gold Mine, Ghana |
15.2 Key assumptions, parameters and methods
15.2.1 Methodology
The Asanko Gold LOM Study and Mineral Reserves followed a process of pit optimisation, design and scheduling:
• The Mineral Resource models were prepared by CSA Global and Gold Fields described in Section 14
• The mining models were derived from the Mineral Resource models modified for dilution and mining loss through a process of reblocking and application of Mineable Shape Optimisor™ (MSO) process by Asanko Gold and CSA Global
• The mining models were depleted to the actual end of December 2019 pit surfaces
• Using the mining models, pit optimisations were completed in Whittle Four-X™ software (Whittle). The software determines the economic limits of each deposit after accounting for estimated revenues and costs associated with mining each block and the maximum allowable slope angles. Nested pit shells produced by the pit optimisation were used in the selection of an "optimum" pit shell and for guiding the location of pit stages
• Using the selected pit shells as templates, pit designs for the final pit limits and stages were developed in MinePlan3D®. The pit designs considered practical access issues and geotechnical aspects
• Based on these designs, a quarterly LOM schedule was completed in Snowden's Evaluator schedule optimisation software. The software is geared to maximise net present value given a set of pit stages and subject to economic and technical parameters and constraints.
15.2.2 Mining model
The Asanko Gold Mineral Reserves and LOM Study is based on the Mineral Resource, as outlined in Section 14. These models were:
• Depleted to the actual mining surfaces as at the end of December 2019
• Assigned planned dilution on the basis of MSO process or reblocking
• Assigned further unplanned dilution and loss according to the planned dilution methodology. Additional planned dilution was applied at zero grade.
MSO is a mining shape optimisation process used to simulate the conversion from grade control or resource model blocks to a more practical mining shape based on several defined mining grade ranges (or bins).
The Mineral Resource Estimate (MRE) and production grade control (GC) models are created using grade estimation processes such as OK, LUC or Conditional Simulation to simulate the grade tonnage distribution based on 5 x 5 x 3 m (X x Y x Z) or smaller block dimensions. During the mining process these small blocks are combined into grade bins based on practical mining, stockpiling and processing considerations, called mining polygons or dig strings.
The size and shape of mining polygons are affected by mining bench height, mining equipment size, blast movement, direction of mining, and orientation of mineralisation continuity. The design of mining polygons is a manual process completed by the mine geology team using both MRE and GC models to develop the three-monthly rolling mine plan and daily production dig plans. The mining polygons represent the mineralisation expected to be recovered by mining.
The MSO process is used to simulate the manual mine polygon design process for both the Mineral Reserve (mine planning) and grade control as pre-processing step to simulate internal dilution and ore loss.
|
Asanko Gold Inc. NI 43-101 Technical Report on Asanko Gold Mine, Ghana |
The MSO process is run for three gold grade cut-off bins. The first run is at the highest-grade cut-off. This run produces a block model coded with the blocks 'mined' which are depleted from the input MRE or GC model. The second MSO run is at the next grade bin with subsequent removal of the blocks 'mined'. The third and final run is completed using the model depleted with the 'mined' blocks from the two previous runs. The output from each run includes a set of wireframe volumes defining the MSO shapes. These shapes are used to create an MSO model which is merged with the MRE and GC models.
The MSO process records the simulated mining block width. This variable is used to estimate the external dilution likely to occur during mining as a results of blast movement and excavation boundary control. External dilution is estimated by applying an edge dilution effect using a block expansion increment. Nominally 0.3 m for Oxide material and 0.5 m for Fresh material. The MSO parameters applied are presented by deposit in the table below (Table 15-2).
Table 15-2 Asanko Gold - MSO parameters by deposit
|
Deposit |
Bench height |
Mining width |
Mining advance |
Grade bins |
Edge dilution |
|
Nkran |
3 m |
6 m |
10 m |
0.5,0.8,1.5 |
0.5 m |
|
Esaase |
6 m |
10 m |
20 m |
0.5,0.8,1.1 |
0.5 m |
|
Akwasiso |
3 m |
6 m |
10 m |
0.5,0.8,1.1 |
0.5 m |
|
Asuadai |
6 m |
10 m |
20 m |
0.5,0.8,1.1 |
0.5 m |
A summary of the models used for the mine planning and derivation of the Mineral Reserves is provided in Table 15-3. The MSO process is considered "best practise" for the application of practical dilution and mining loss modifying factors to a mine plan. The MSO analysis was applied to all the pits except the Abore and Adubiaso pits which were modified through a reblocking process to a practical 5 mE by 5 mN x 6 mRL smallest mining unit (SMU) size aligned with the bench heights.
Table 15-3 Mining models used for mine planning
|
Deposit |
Resource model |
Mining model |
Starting topography |
Dilution model |
|
Nkran |
Nkr19rs.dm |
Nkmd0219luc.mso.dm |
nkran_eom_dec_2019.dtm |
MSO |
|
Esaase - Main |
Es19rs.dm |
es_md_main_mso.dm |
Esaase 2019 EOPtr.dm |
MSO |
|
Esaase - South |
Es19rs.dm |
es_md_south_mso.dm |
Esaase 2019 EOPtr.dm |
MSO |
|
Akwasiso |
Ak19rs.dm |
Ak_0819mre.mso_v2.dm |
Akwa_pit_model_ march2019_eom.dtm |
MSO |
|
Abore |
Abr19rs.dm |
Abr_reg_f_200219_Sched.dm |
Dtopo_tr.dm |
Reblock 5x5x6 |
|
Adubiaso |
Adu19rs.dm |
Adu_reg_f_200219_Sched.dm |
20_lidar_utm_tr.dm |
Reblock 5x5x6 |
|
Asuadai |
Asu19rs.dm |
Asd_mso_f_200219_Sched.dm |
Topotr.dm |
MSO |
A summary of the Modifying Factors (mining loss and dilution) applied to the individual pits for the mine planning and Mineral Reserves derivation is shown in Table 15-4. An additional 3% mining loss was added to the MSO process and an additional 7% mining loss and dilution was added to Abore and Adubiaso that followed the reblocking process.
|
Asanko Gold Inc. NI 43-101 Technical Report on Asanko Gold Mine, Ghana |
Table 15-4 Modifying Factors applied for mine planning
|
Deposit |
MSO/ reblock mining loss |
MSO/ reblock dilution |
Additional mining loss |
Additional dilution |
Total mining loss |
Total dilution |
|
Nkran |
0.1% |
25.5% |
3.0% |
Nil |
3.1% |
25.5% |
|
Esaase - Main/ South |
18.3% |
34.9% |
3.8% |
Nil |
22.1% |
34.9% |
|
Akwasiso |
19.8% |
20.7% |
3.0% |
Nil |
22.8% |
20.7% |
|
Abore |
8.4% |
7.7% |
7.0% |
7% @ zero grade |
15.4% |
14.7% |
|
Adubiaso |
13.6% |
18.8% |
7.0% |
7% @ zero grade |
20.6% |
25.8% |
|
Asuadai |
22.7% |
29.3% |
3.0% |
Nil |
25.7% |
29.3% |
Further, Snowden normalised the various models on a standard set of fields:
• WEATH (Weathering code)
- 1 - Oxide
- 2 - Mottled oxide (only applicable to Esaase)
- 3 - Transition
- 4 - Fresh.
• RESCAT (Resource classification code)
- 1 - Measured
- 2 - Indicated
- 3 - Inferred
- 4 - Unclassified.
• AU (Gold grade after planned dilution)
• STRAT (Esaase only)
- 1 - Python Shear
- 2 - Central Sandstone
- 3 - Cobra Siltstone
- 4 - Upper Siltstone
- 900 - Other.
15.2.3 Geotechnical parameters
SRK carried out a due diligence study for the geotechnical design aspects of all operating pits to support the mine planning inputs for the LOM Study. Refer to the geotechnical considerations Section 16.2 for more details on the geotechnical parameters used.
The overall wall angles used for pit optimisation were based upon an iterative process of pit optimisation and design, where the final angles applied were based upon the overall wall angles able to be achieved in design when incorporating ramps, minimum mining width, and geotechnical berms (Table 15-5).
|
Asanko Gold Inc. NI 43-101 Technical Report on Asanko Gold Mine, Ghana |
Table 15-5 Overall wall angles applied for pit optimisations
|
Deposit |
Oxide (⁰) |
Transition (⁰) |
Fresh (⁰) |
|
Nkran |
|
|
|
|
North |
27.0 |
42.0 |
45.0 |
|
East |
22.0 |
36.0 |
45.0 |
|
West |
17.0 |
29.0 |
43.0 |
|
South |
22.0 |
36.0 |
45.0 |
|
Esaase Main |
|
|
|
|
East |
22.0 |
45.0 |
48.0 |
|
West |
22.0 |
40.0 |
42.0 |
|
Esaase South |
|
|
|
|
East |
22.0 |
40.0 |
40.0 |
|
West |
22.0 |
35.0 |
35.0 |
|
Akwasiso |
20.0 |
20.0 |
45.0 |
|
Abore |
22.0 |
35.0 |
40.0 |
|
Adubiaso |
22.0 |
42.0 |
45.0 |
|
Asuadai |
22.0 |
45.0 |
45.0 |
15.2.4 Optimisation parameters
The optimisation parameters applied were supplied by Asanko Gold based on current operating practice, mining contracts and the results from processing testwork. Table 15-6 outlines the common parameters for all deposits.
Table 15-6 Common parameters
|
Parameter |
Value |
|
Gold price |
US$1,300/oz |
|
Royalty |
Esaase - 5.5%, Others - 5.0% |
|
Refining cost |
US$4/oz |
|
Discount rate |
5% |
|
Process cost |
US$10.90/t ore |
|
G&A cost |
US$6.48/t ore |
Process recoveries are based on historically achieved recoveries for the existing pits, and testwork for the Esaase Transition and Fresh material (Table 15-7).
Table 15-7 Process recoveries
|
Deposit - rock type |
Process recovery |
|
Nkran - All |
94.5% |
|
Satellite Pits - All |
94.0% |
|
Esaase - Oxide |
94.0% |
|
Esaase - Transition /Fresh |
90.15% - (STRAT = 2) 74.70% - (STRAT = 3) 78.53% - (STRAT = 1, 4 and 900) |
Mining cost parameters (Table 15-8) are based on the existing mining contractor rates and incorporate variation for depth and ore/waste classification and rock type.
|
Asanko Gold Inc. NI 43-101 Technical Report on Asanko Gold Mine, Ghana |
Table 15-8 Mining cost parameters
|
Deposit |
Base waste cost (US$/t) |
Base ore cost (US$/t) |
Surface RL (m) |
Down cost* (US$/t/6 m) |
Up cost* (US$/t/6 m) |
Fixed mining cost (US$/t ore) |
Transport cost (US$/t ore) |
|
Nkran |
|
|
|
|
|
|
|
|
Oxide |
1.63 |
1.48 |
1184 |
0.057 |
NA |
4.00 |
0.68 |
|
Transition |
2.50 |
2.37 |
1184 |
0.030 |
NA |
4.00 |
0.68 |
|
Fresh |
2.45 |
2.34 |
1184 |
0.028 |
NA |
4.00 |
0.68 |
|
Esaase Main |
|
|
|
|
|
|
|
|
Oxide |
1.61 |
1.25 |
1280 |
0.029 |
0.018 |
4.00 |
7.18 |
|
MOX |
1.92 |
1.59 |
1280 |
0.029 |
0.018 |
4.00 |
7.18 |
|
Transition |
2.00 |
1.67 |
1280 |
0.035 |
0.019 |
4.00 |
7.18 |
|
Fresh |
2.35 |
2.03 |
1280 |
0.037 |
0.017 |
4.00 |
7.18 |
|
Esaase South |
|
|
|
|
|
|
|
|
Oxide |
1.25 |
1.47 |
1268 |
0.036 |
0.015 |
3.42 |
7.18 |
|
MOX |
1.58 |
1.79 |
1268 |
0.036 |
0.015 |
3.42 |
7.18 |
|
Transition |
1.66 |
1.88 |
1268 |
0.036 |
0.015 |
3.42 |
7.18 |
|
Fresh |
2.02 |
2.23 |
1268 |
0.033 |
0.014 |
3.42 |
7.18 |
|
Akwasiso |
|
|
|
|
|
|
|
|
Oxide |
1.87 |
1.82 |
1178 |
0.027 |
NA |
3.56 |
1.93 |
|
Transition |
2.68 |
2.55 |
1178 |
0.027 |
NA |
3.56 |
1.93 |
|
Fresh |
2.26 |
2.20 |
1178 |
0.015 |
NA |
3.56 |
1.93 |
|
Abore |
|
|
|
|
|
|
|
|
Oxide |
1.87 |
1.82 |
1200 |
0.027 |
NA |
3.56 |
4.03 |
|
Transition |
2.68 |
2.55 |
1200 |
0.027 |
NA |
3.56 |
4.03 |
|
Fresh |
2.26 |
2.20 |
1200 |
0.015 |
NA |
3.56 |
4.03 |
|
Adubiaso |
|
|
|
|
|
|
|
|
Oxide |
1.87 |
1.82 |
1171 |
0.027 |
NA |
3.56 |
1.93 |
|
Transition |
2.68 |
2.55 |
1171 |
0.027 |
NA |
3.56 |
1.93 |
|
Fresh |
2.26 |
2.20 |
1171 |
0.015 |
NA |
3.56 |
1.93 |
|
Asuadai |
|
|
|
|
|
|
|
|
Oxide |
1.87 |
1.82 |
1260 |
0.027 |
NA |
3.56 |
4.23 |
|
Transition |
2.68 |
2.55 |
1260 |
0.027 |
NA |
3.56 |
4.23 |
|
Fresh |
2.26 |
2.20 |
1260 |
0.015 |
NA |
3.56 |
4.23 |
Note: * Down / up costs are the costs per 6 m above (up) and below (down) the specified surface RL. The values presented are averages of those values applied for each deposit.
15.2.5 Optimisation results
A summary of the selected shells is provided in Table 15-9.
|
Asanko Gold Inc. NI 43-101 Technical Report on Asanko Gold Mine, Ghana |
Table 15-9 Selected shells for design
|
Item |
Nkran |
Esaase Main |
Esaase South |
Akwasiso |
Asuadai |
Adubiaso |
Abore |
Total |
|
Pit shell |
14 |
15 |
15 |
15 |
15 |
10 |
15 |
|
|
Revenue factor |
1.20 |
1.00 |
1.00 |
1.00 |
1.00 |
1.00 |
1.00 |
|
|
Apparent price (US$/oz) |
1,560 |
1,300 |
1,300 |
1,300 |
1,300 |
1,300 |
1,300 |
|
|
Approx. depth (m) |
408 |
184 |
172 |
168 |
90 |
135 |
110 |
|
|
Pit size (Mt) |
91.0 |
140.5 |
35.4 |
14.0 |
3.7 |
12.1 |
19.0 |
315.6 |
|
Waste (Mt) |
81.0 |
119.0 |
31.9 |
12.2 |
3.1 |
11.3 |
17.1 |
275.4 |
|
Strip ratio (w:o) |
8.1 |
5.5 |
9.1 |
6.5 |
4.7 |
15.0 |
8.8 |
6.9 |
|
Ore (Mt) |
10.0 |
21.5 |
3.5 |
1.9 |
0.6 |
0.8 |
1.9 |
40.2 |
|
Au (g/t) |
1.72 |
1.58 |
1.67 |
1.63 |
1.36 |
1.78 |
1.76 |
1.63 |
|
Au (koz) |
552 |
1,091 |
188 |
98 |
28 |
43 |
110 |
2,111 |
|
Recovered Au (koz) |
522 |
953 |
170 |
92 |
27 |
41 |
103 |
1,907 |
|
Revenue (US$ M) |
678 |
1,239 |
221 |
120 |
34 |
53 |
134 |
2,479 |
|
Mining cost (US$ M) |
286 |
309 |
65 |
34 |
8 |
27 |
44 |
773 |
|
Process cost (US$ M) |
219 |
606 |
99 |
43 |
16 |
17 |
48 |
1,048 |
|
Selling cost (US$ M) |
36 |
72 |
13 |
6 |
2 |
3 |
7 |
139 |
|
Total cost (US$ M) |
541 |
987 |
177 |
83 |
26 |
46 |
99 |
1,959 |
|
Operating margin (US$ M) |
137 |
252 |
44 |
37 |
9 |
7 |
35 |
520 |
|
Unit cost (US$/oz) |
1,038 |
1,036 |
1,043 |
900 |
970 |
1,139 |
958 |
1,027 |
Pit-by-pit graphs for the largest pits: Esaase Main (Figure 15-2), Esaase South (Figure 15-3), and Nkran (Figure 15-4) are shown. Esaase Main shows high sensitivity to price (and by proxy, other economic factors) and could increase significantly in size with an improvement in modifying factors. Likewise, there is strong downside sensitivity.
Figure 15-2 Esaase Main pit-by-pit graph
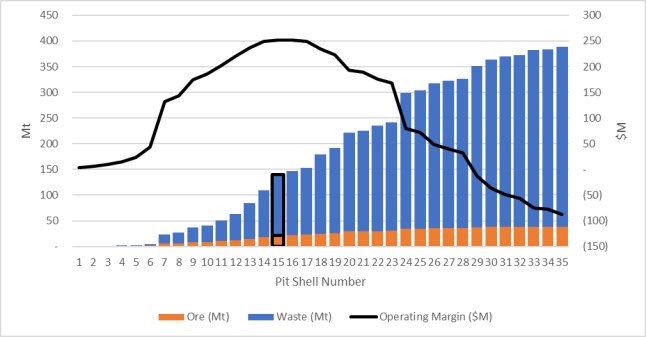
Esaase South is reasonably stable in terms of pit size around the revenue factor (RF) 1 pit but most of the pit enters the pit shell at shell 12 (RF 0.85). There is some scope for this pit to increase in size with improved modifying factors.
|
Asanko Gold Inc. NI 43-101 Technical Report on Asanko Gold Mine, Ghana |
Figure 15-3 Esaase South pit-by-pit graph
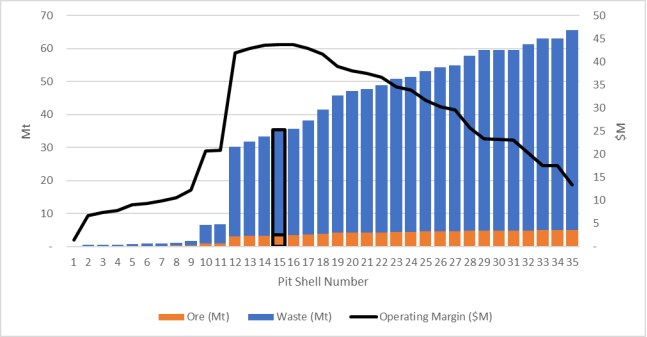
The Nkran Pit size is sensitive to price (and other modifying factors). There is potential for the Nkran inventory to increase materially, should the price rise above US$1,885/oz Au (pit shell 19).
Figure 15-4 Nkran pit-by-pit graph
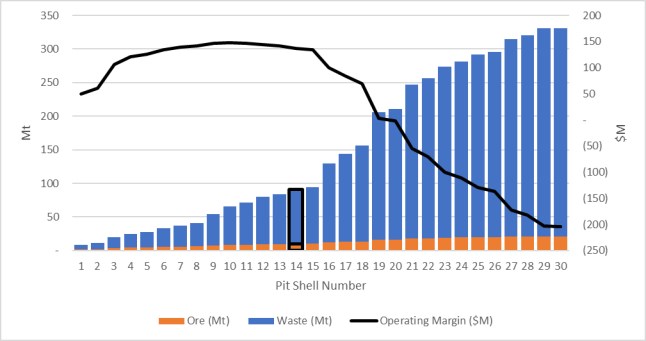
RF 1 shells were selected for all pits except Nkran. Given the high throughput relative to the optimisation inventory, it was deemed prudent to maximise the available inventory to extend mine life. The higher revenue factor for Nkran is based on the need to achieve the necessary mining width around the existing cutback and the need to mine out the western wall to the tension cracks that have developed, to improve wall stability. The RF 1 shell for this pit does not have sufficient width to enable the base of the pit to be accessed. The RF 1.2 shell is about 10 m wider, still cash flow positive and has a lower overall unit cost (US$/oz) compared with the project average. The impact on the pit shell of using the RF 1.2 compared to RF 1 is shown in Figure 15-5.
|
Asanko Gold Inc. NI 43-101 Technical Report on Asanko Gold Mine, Ghana |
Figure 15-5 Nkran south west corner pit shell widths (azimuth 68˚)
|
|
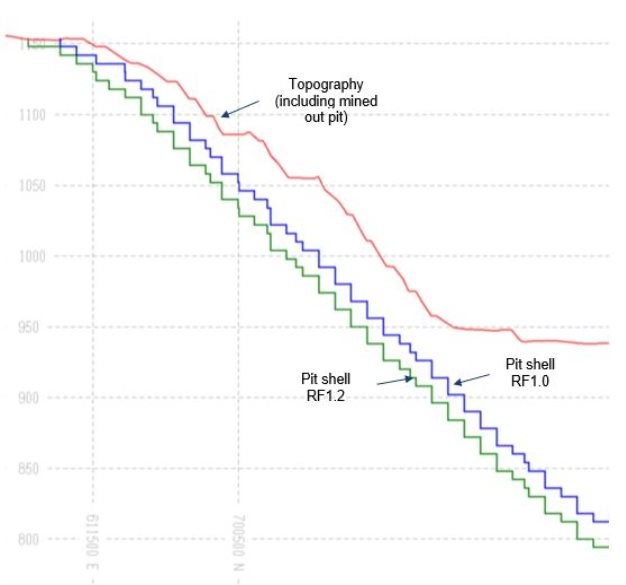
|
Asanko Gold Inc. NI 43-101 Technical Report on Asanko Gold Mine, Ghana |
15.2.6 Pit design
Pit designs were completed based on the selected pit shells for each deposit. The geotechnical parameters used are summarised in Section 16.2. Other practical mining parameters were applied, as shown in Table 15-10.
Table 15-10 Design parameters
|
Parameters |
Nkran |
Esaase |
Satellite Pits |
|
Ramp width - double (m) |
22 |
22 |
16 |
|
Ramp width - single (m) |
16 |
16 |
12 |
|
Slot width (m) |
22 |
22 |
20 |
|
Ramp gradient (1:x) |
10 |
10 |
10 |
|
Minimum mining width - cutback (m) |
40 |
40 |
35 |
|
Minimum mining width - pit base (m) |
20 |
20 |
20 |
All pit designs were subjected to geotechnical review to ensure compliance with the intended parameters and factors of safety.
Nkran Cut 2 is currently in operation and is planned to be mined out in 2020. The Nkran Cut 3 pit design is shown in Figure 15-6. The ramps were orientated towards the existing surface infrastructure. Dual access is maintained to within 150 m of the pit base.
The Esaase Pit design comprises the main pit shown in Figure 15-7 which comprises seven cuts or stages. The Esaase South Pit (Figure 15-8) is planned to be mined in conjunction with the Esaase Main pit. The Esaase North pit is a small satellite pit which has limited production and was combined in the reporting with the Esaase Main Pit. The staging of the Esaase pit is described in more detail in Section 16.
The single cut pit designs for the Satellite Pits (Akwasiso, Asuadai, Adubiaso and Abore) are shown in Figure 15-9.
|
Asanko Gold Inc. NI 43-101 Technical Report on Asanko Gold Mine, Ghana |
Figure 15-6 Nkran Cut 3 pit design
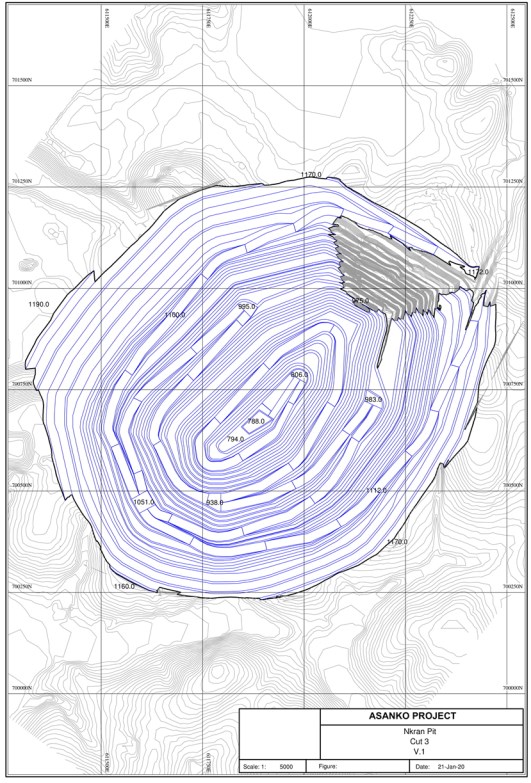
|
Asanko Gold Inc. NI 43-101 Technical Report on Asanko Gold Mine, Ghana |
Figure 15-7 Esaase Main Pit design
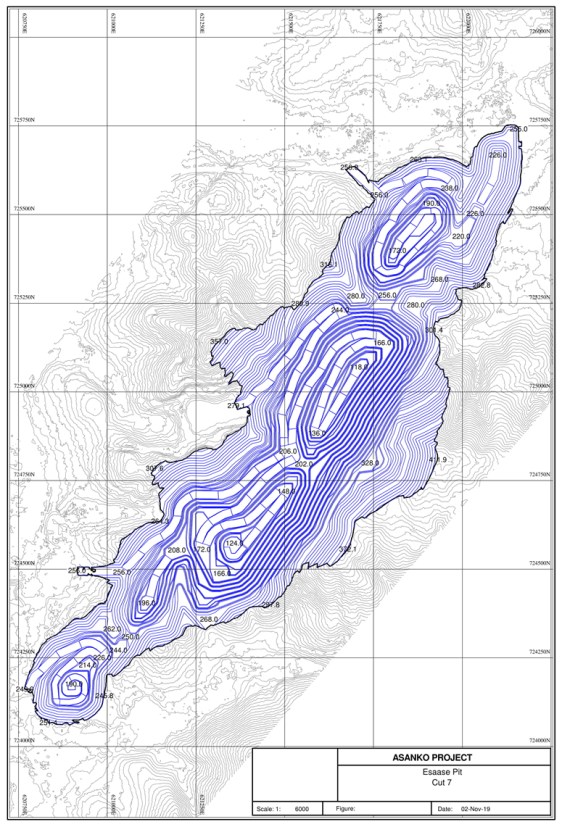
|
Asanko Gold Inc. NI 43-101 Technical Report on Asanko Gold Mine, Ghana |
Figure 15-8 Esaase South Pit design
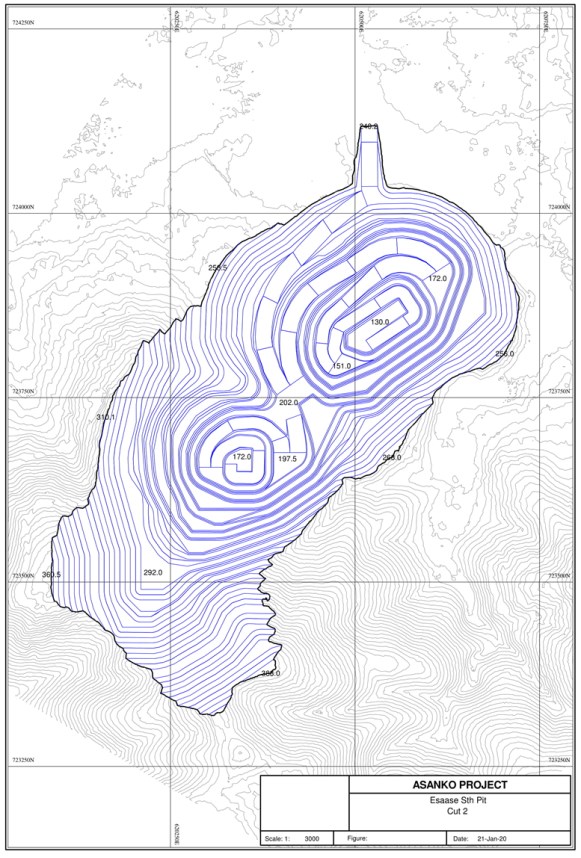
|
Asanko Gold Inc. NI 43-101 Technical Report on Asanko Gold Mine, Ghana |
Figure 15-9 Satellite Pit designs (Akwasiso, Asuadai, Adubiaso and Abore)
|
Akwasiso |
Asuadai |
|
|
|
|
Adubiaso |
Abore |
|
|
|
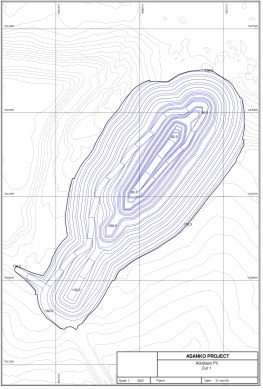
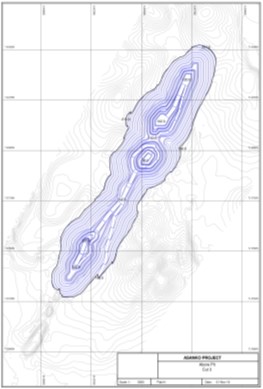
|
Asanko Gold Inc. NI 43-101 Technical Report on Asanko Gold Mine, Ghana |
A reconciliation of the pit design to their selected pit shell is shown in Table 15-11. Overall these differences were deemed acceptable, however some pits performed poorly due to maintaining minimum mining widths around existing excavations.
Table 15-11 Pit design to pit shell reconciliation
|
Item |
Pit shell |
Pit design |
Difference |
Pit shell |
Pit design |
Difference |
|
|
Nkran |
Esaase Main |
||||
|
Pit size (Mt) |
91.0 |
93.0 |
+2% |
140.5 |
134.4 |
-4% |
|
Waste (Mt) |
81.0 |
82.3 |
+2% |
119.0 |
113.2 |
-5% |
|
Ore (Mt) |
10.0 |
10.7 |
+7% |
21.5 |
21.2 |
-1% |
|
Strip ratio (w:o) |
8.1 |
7.7 |
-5% |
5.5 |
5.3 |
-4% |
|
Recovered metal (koz) |
522 |
539 |
+3% |
953 |
942 |
-1% |
|
Margin (US$ M) |
137 |
133 |
-3% |
252 |
261 |
+3% |
|
|
Esaase South |
Akwasiso |
||||
|
Pit size (Mt) |
35.4 |
31.2 |
-12% |
14.0 |
12.6 |
-10% |
|
Waste (Mt) |
31.9 |
27.7 |
-13% |
12.2 |
11.0 |
-10% |
|
Ore (Mt) |
3.5 |
3.5 |
+1% |
1.9 |
1.6 |
-12% |
|
Strip ratio (w:o) |
9.2 |
7.9 |
-13% |
6.5 |
6.7 |
+3% |
|
Recovered metal (koz) |
170 |
170 |
- |
92 |
77 |
-16% |
|
Margin (US$ M) |
44 |
52 |
+19% |
37 |
27 |
-27% |
|
|
Abore |
Adubiaso |
||||
|
Pit size (Mt) |
19.0 |
17.6 |
-7% |
12.1 |
10.3 |
-14% |
|
Waste (Mt) |
17.1 |
15.6 |
-9% |
11.3 |
9.7 |
-15% |
|
Ore (Mt) |
1.9 |
2.0 |
+4% |
0.8 |
0.7 |
-12% |
|
Strip ratio (w:o) |
8.8 |
7.7 |
-12% |
15.0 |
14.5 |
-3% |
|
Recovered metal (koz) |
103 |
105 |
+2% |
41 |
34 |
-17% |
|
Margin (US$ M) |
35 |
38 |
+7% |
7 |
3 |
-55% |
|
|
Asuadai |
|
Overall |
|
||
|
Pit size (Mt) |
3.7 |
5.1 |
+38% |
315.7 |
304.3 |
-4% |
|
Waste (Mt) |
3.1 |
4.4 |
+43% |
275.5 |
263.8 |
-4% |
|
Ore (Mt) |
0.7 |
0.7 |
+13% |
40.2 |
40.5 |
+1% |
|
Strip ratio (w:o) |
4.7 |
5.9 |
+26% |
6.9 |
6.5 |
-4% |
|
Recovered metal (koz) |
27 |
30 |
+16% |
1,907 |
1,897 |
-1% |
|
Margin (US$ M) |
9 |
7 |
-21% |
520 |
520 |
- |
15.3 Cut-off grade
AGM uses three cut-offs:
• Operational cut-off: This is the cut-off grade based on costs incurred during steady state operations. It includes fixed mining costs and full general and administrative costs
• Marginal cut-off: this is the cut-off grade applied after mining is complete and only stockpile depletion and processing occurs. In this case, the mining fixed costs are removed, the general and administrative (G&A) costs was reduced
• Mineral Reserve cut-off: This is the greater of the marginal cut-off and 0.5 g/t (the current site cut-off for marginal-grade stockpiles).
Pit optimisations were completed based on the operational cut-offs. However, the schedule, and ultimately the Mineral Reserve, were calculated on the Mineral Reserve cut-off basis (within the designed pits).
The cut-off grades vary on a block by block basis, due to the depth cost increment. The operational and marginal cut offs used for the pit optimisation and derivation of Mineral Reserves are shown in Table 15-12.
|
Asanko Gold Inc. NI 43-101 Technical Report on Asanko Gold Mine, Ghana |
Table 15-12 Cut-off grade calculations
|
Deposit |
Weathering profile |
Stratigraphic code |
Sell cost (% revenue) |
Metallurgical recovery (%) |
Process cost (US$t/ore) |
Haul cost (US$/t ore) |
Incremental ore mining cost (US$/t ore) |
Process G&A cost (US$/t ore) |
Total marginal cost (US$/t ore) |
Marginal cut-off (g/t) |
Mining fixed cost (US$/t ore) |
Mining G&A (US$/t ore) |
Total operational cost (US$/t ore) |
Operational cut-off (g/t) |
Mineral Reserve cut-off (g/t) |
|
SC |
REC |
PC |
HC |
IOC |
PGA |
TMC= PC+HC+IC+PG |
MCOG= TMC /(RECxPRICEx(1-SC)) |
MFC |
MGA |
TOC= TMC+MFC+MGA |
OCOG= OMC /(RECxPRICEx(1-SC)) |
|
|||
|
Nkran |
Oxide |
|
5.31% |
94.0% |
10.90 |
0.68 |
- 0.14 |
2.78 |
14.22 |
0.38 |
4.00 |
3.70 |
21.92 |
0.59 |
0.50 |
|
Trans |
|
5.31% |
94.0% |
10.90 |
0.68 |
-0.13 |
2.78 |
14.23 |
0.38 |
4.00 |
3.70 |
21.93 |
0.59 |
0.50 |
|
|
Fresh |
|
5.31% |
94.0% |
10.90 |
0.68 |
-0.13 |
2.78 |
14.23 |
0.38 |
4.00 |
3.70 |
21.93 |
0.59 |
0.50 |
|
|
Esaase Main |
Oxide |
|
5.81% |
94.0% |
10.90 |
7.18 |
-0.34 |
2.78 |
20.52 |
0.55 |
4.00 |
3.70 |
28.22 |
0.76 |
0.55 |
|
Trans |
2 |
5.81% |
90.2% |
10.90 |
7.18 |
-0.36 |
2.78 |
20.50 |
0.58 |
4.00 |
3.70 |
28.20 |
0.79 |
0.58 |
|
|
Trans |
3 |
5.81% |
74.7% |
10.90 |
7.18 |
-0.36 |
2.78 |
20.50 |
0.70 |
4.00 |
3.70 |
28.20 |
0.96 |
0.70 |
|
|
Trans |
1,4 and 900 |
5.81% |
78.5% |
10.90 |
7.18 |
-0.36 |
2.78 |
20.50 |
0.66 |
4.00 |
3.70 |
28.20 |
0.91 |
0.66 |
|
|
Fresh |
2 |
5.81% |
90.2% |
10.90 |
7.18 |
-0.41 |
2.78 |
20.45 |
0.58 |
4.00 |
3.70 |
28.15 |
0.79 |
0.58 |
|
|
Fresh |
3 |
5.81% |
74.7% |
10.90 |
7.18 |
-0.41 |
2.78 |
20.45 |
0.70 |
4.00 |
3.70 |
28.15 |
0.96 |
0.70 |
|
|
Fresh |
1, 4 and 900 |
5.81% |
78.5% |
10.90 |
7.18 |
-0.41 |
2.78 |
20.45 |
0.66 |
4.00 |
3.70 |
28.15 |
0.91 |
0.66 |
|
|
Esaase South |
Oxide |
|
5.81% |
94.0% |
10.90 |
7.18 |
0.20 |
2.78 |
21.06 |
0.57 |
3.42 |
3.70 |
28.18 |
0.76 |
0.57 |
|
Trans |
2 |
5.81% |
90.2% |
10.90 |
7.18 |
0.20 |
2.78 |
21.06 |
0.59 |
3.42 |
3.70 |
28.18 |
0.79 |
0.59 |
|
|
Trans |
3 |
5.81% |
74.7% |
10.90 |
7.18 |
0.20 |
2.78 |
21.06 |
0.71 |
3.42 |
3.70 |
28.18 |
0.96 |
0.71 |
|
|
Trans |
1, 4 and 900 |
5.81% |
78.5% |
10.90 |
7.18 |
0.20 |
2.78 |
21.06 |
0.68 |
3.42 |
3.70 |
28.18 |
0.91 |
0.68 |
|
|
Fresh |
2 |
5.81% |
90.2% |
10.90 |
7.18 |
0.15 |
2.78 |
21.01 |
0.59 |
3.42 |
3.70 |
28.13 |
0.79 |
0.59 |
|
|
Fresh |
3 |
5.81% |
74.7% |
10.90 |
7.18 |
0.15 |
2.78 |
21.01 |
0.71 |
3.42 |
3.70 |
28.13 |
0.96 |
0.71 |
|
|
Fresh |
1, 4 and 900 |
5.81% |
78.5% |
10.90 |
7.18 |
0.15 |
2.78 |
21.01 |
0.68 |
3.42 |
3.70 |
28.13 |
0.91 |
0.68 |
|
|
Akwasiso |
Oxide |
|
5.31% |
94.0% |
10.90 |
1.93 |
-0.07 |
2.78 |
15.54 |
0.42 |
3.56 |
3.70 |
22.80 |
0.61 |
0.50 |
|
Trans |
|
5.31% |
94.0% |
10.90 |
1.93 |
-0.02 |
2.78 |
15.59 |
0.42 |
3.56 |
3.70 |
22.85 |
0.61 |
0.50 |
|
|
Fresh |
|
5.31% |
94.0% |
10.90 |
1.93 |
-0.19 |
2.78 |
15.42 |
0.41 |
3.56 |
3.70 |
22.68 |
0.61 |
0.50 |
|
|
Abore |
Oxide |
|
5.31% |
94.0% |
10.90 |
4.03 |
-0.06 |
2.78 |
17.65 |
0.47 |
3.56 |
3.70 |
24.91 |
0.67 |
0.50 |
|
Trans |
|
5.31% |
94.0% |
10.90 |
4.03 |
-0.19 |
2.78 |
17.52 |
0.47 |
3.56 |
3.70 |
24.78 |
0.67 |
0.50 |
|
|
Fresh |
|
5.31% |
94.0% |
10.90 |
4.03 |
-0.06 |
2.78 |
17.65 |
0.47 |
3.56 |
3.70 |
24.91 |
0.67 |
0.50 |
|
|
Adubiaso |
Oxide |
|
5.31% |
94.0% |
10.90 |
1.93 |
-0.06 |
2.78 |
15.55 |
0.42 |
3.56 |
3.70 |
22.81 |
0.61 |
0.50 |
|
Trans |
|
5.31% |
94.0% |
10.90 |
1.93 |
-0.21 |
2.78 |
15.40 |
0.41 |
3.56 |
3.70 |
22.66 |
0.61 |
0.50 |
|
|
Fresh |
|
5.31% |
94.0% |
10.90 |
1.93 |
-0.06 |
2.78 |
15.55 |
0.42 |
3.56 |
3.70 |
22.81 |
0.61 |
0.50 |
|
|
Asuadai |
Oxide |
|
5.31% |
94.0% |
10.90 |
4.23 |
-0.04 |
2.78 |
17.87 |
0.48 |
3.56 |
3.70 |
25.13 |
0.68 |
0.50 |
|
Trans |
|
5.31% |
94.0% |
10.90 |
4.23 |
-0.13 |
2.78 |
17.78 |
0.48 |
3.56 |
3.70 |
25.04 |
0.67 |
0.50 |
|
|
Fresh |
|
5.31% |
94.0% |
10.90 |
4.23 |
-0.06 |
2.78 |
17.85 |
0.48 |
3.56 |
3.70 |
25.11 |
0.67 |
0.50 |
|
Asanko Gold Inc. NI 43-101 Technical Report on Asanko Gold Mine, Ghana |
15.4 Mineral Reserve reconciliation
For the purposes of comparison, the previous Mineral Reserve estimates (MRevs) in 2016 for Nkran, Esaase and the Satellite Pits taken from the "Amended-43-101-Technical-Report_Dec-2017" for Asanko Gold is compared with the current 2019 MRevs.
Table 15-13, Table 15-14 and Table 15-15 show the 2016 and 2019 Mineral Reserves comparisons for Nkran, Esaase and the Satellite Pits respectively based on a gold price of US$1,300/oz.
For the Nkran Mineral Reserve reconciliation, the reasons for changes, subject to the limitations and assumptions, are outlined below:
• The 2016 MRev includes mining depletion 1 as at 31 December 2016. The 2019 MRev includes mining depletion as at 31 December 2019
• Changes to the 2019 MRE (M and I) underpinning the 2019 MRev compared to the 2016 MRE (M and I) as described in Section 14
• Changes in Au reserve cut-off grade used for the MRev from 0.7 g/t for fresh material and 0.5 g/t for oxide material in 2016 to the 0.5 g/t cut off applied in 2019 (refer to Table 15-12)
• The Whittle pit optimisation process resulted in use of a larger pit shell (RF=1.2) for practical reasons described in Section 15.2.5 compared to the pit shell used in 2016 resulting in an increase in Mineral Reserves
• Changes in methodology to derive the Modifying Factors. Fixed dilution and mining recovery percentages of 5% and 95% (mining loss of 5%) was used in 2016 compared to the reblocking, use of MSO analysis and additional mining loss and dilutions used for the 2019 MRev (refer to Table 15-4).
• The revised pit wall slope angles described in Section 15.2.3 also influenced the MRev from 2016 to 2019.
Table 15-13 Nkran Mineral Reserve comparison - 31 December 2016 vs 31 December 2019
|
Date |
Reserve category |
Tonnes (Mt) |
Grade (g/t Au) |
Au metal (koz) |
|
31-Dec-16 |
Proven |
4.51 |
1.87 |
270 |
|
Probable |
18.45 |
1.93 |
1145 |
|
|
Total |
22.96 |
1.92 |
1415 |
|
|
20-Dec-19 |
Proven |
0 |
0 |
0 |
|
Probable |
10.93 |
1.64 |
577 |
|
|
Total |
10.93 |
1.64 |
577 |
|
|
Percent difference (%) |
Proven |
-100% |
-100% |
-100% |
|
Probable |
-41% |
-15% |
-50% |
|
|
Total |
-52% |
-14% |
-59% |
The Modifying Factors supporting the 2019 Nkran Mineral Reserve estimate is described in Section 15.2. The summarised Mineral Reserve waterfall chart for Nkran is shown in Figure 15-10.
1 Mining depletion was based on the depletion of the Mineral Resource models using the topographic surfaces and not ROM production
|
Asanko Gold Inc. NI 43-101 Technical Report on Asanko Gold Mine, Ghana |
Figure 15-10 Nkran 2016 to 2019 Mineral Reserve waterfall chart
|
|
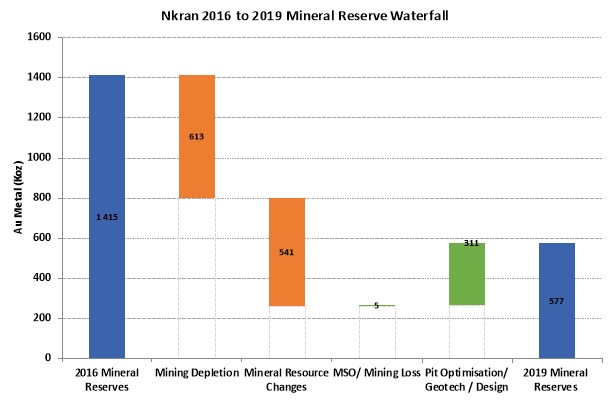
For the Esaase Mineral Reserve reconciliation, the reasons for changes, subject to the limitations and assumptions, are outlined below:
• The 2016 MRev includes mining depletion 2 as at 31 December 2016. The 2019 MRev includes mining depletion as at 31 December 2019
• Changes to the 2019 MRE (M and I) underpinning the 2019 MRev compared to the 2016 MRE (M and I) is described in Section 14
• Changes in Au cut-off grade used for the MRev from the minimum economic cut off of 0.6 g/t in 2016 to a range of cut-offs by rocktype and STRAT (0.55 g/t to 0.71 g/t) used in 2019 (refer to Table 15-12). Esaase has a higher cut off compared to the other pits mainly due to the additional trucking costs required to haul the ore 28 km to the processing plant situated at Nkran
• Changes in methodology to derive the Modifying Factors. Fixed dilution and mining recovery percentages of 5% end 95% (mining loss 5%) was used in 2016 compared to the reblocking, use of MSO analysis and additional mining loss and dilutions used for the 2019 MRev (refer to Table 15-4)
• The revised pit wall slope angles described in Section 15.2.3 also influenced the MRev from 2016 to 2019.
2 Mining depletion was based on the depletion of the Mineral Resource models using the topographic surfaces and not ROM production
|
Asanko Gold Inc. NI 43-101 Technical Report on Asanko Gold Mine, Ghana |
Table 15-14 Esaase Mineral Reserve comparison - 31 December 2016 vs 31 December 2019
|
Date |
Reserve category |
Tonnes (Mt) |
Grade (g/t Au) |
Au metal (koz) |
|
31-Dec-16 |
Proven |
21.81 |
1.43 |
1,005 |
|
Probable |
41.45 |
1.47 |
1,962 |
|
|
Total |
63.26 |
1.46 |
2,967 |
|
|
31-Dec-19 |
Proven |
0 |
0 |
0 |
|
Probable |
33.68 |
1.34 |
1,455 |
|
|
Total |
33.68 |
1.34 |
1,455 |
|
|
Percent difference (%) |
Proven |
-100% |
-100% |
-100% |
|
Probable |
-19% |
-9% |
-26% |
|
|
Total |
-47% |
-8% |
-51% |
The Modifying Factors supporting the 2019 Esaase Mineral Reserve estimate is described in Section 15.2. The summarised Mineral Reserve waterfall chart for Esaase is shown in Figure 15-11.
Figure 15-11 Esaase 2016 to 2019 Mineral Reserve waterfall chart
|
|
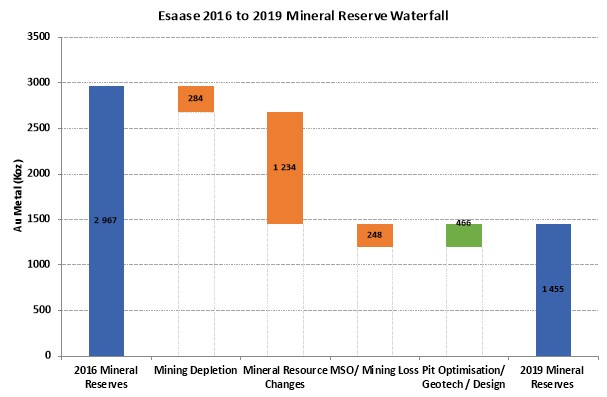
For the Satellite Pits Mineral Reserve reconciliation, the reasons for changes, subject to the limitations and assumptions, are outlined below:
• The 2016 MRev includes mining depletion 3 as at 31 December 2016. The 2019 MRev includes mining depletion as at 31 December 2019 for Akwasiso and Dynamite Hill (which was depleted before the effective date). Abore was mined historically before the 2016 MRev
3 Mining depletion was based on the depletion of the Mineral Resource models using the topographic surfaces and not ROM production
|
Asanko Gold Inc. NI 43-101 Technical Report on Asanko Gold Mine, Ghana |
• Changes to the 2019 MRE (M and I) underpinning the 2019 MRev compared to the 2016 MRE (M and I) is described in Section 14
• The 2016 MRev was depleted with mining as at 31 December 2016. The 2019 MRev is depleted with mining as at 20 December 2019
• Changes in Au cut-off grade used for the MRev from 0.7 g/t for fresh and 0.5 g/t for oxide and transition material in 2016 to the 0.5 g/t cut off applied in 2019 (refer to Table 15-12)
• Changes in methodology to derive the Modifying Factors. Fixed dilution and mining recovery percentages of 5% end 95% (mining loss 5%) was used in 2016 compared to the reblocking, use of MSO analysis and additional mining loss and dilutions used for the 2019 MRev (refer to Table 15-4)
• The revised pit wall slope angles described in Section 15.2.3 also influenced the MRev from 2016 to 2019.
Table 15-15 Satellite Pits Mineral Reserve comparison - 31 December 2016 vs 20 December 2019
|
Date |
Reserve category |
Tonnes (Mt) |
Grade (g/t Au) |
Au metal (koz) |
|
31-Dec-16 |
Proven |
2.75 |
1.66 |
147 |
|
Probable |
12.02 |
1.49 |
577 |
|
|
Total |
14.77 |
1.52 |
724 |
|
|
20-Dec-19 |
Proven |
0 |
0 |
0 |
|
Probable |
6.45 |
1.39 |
288 |
|
|
Total |
6.45 |
1.39 |
288 |
|
|
Percent difference (%) |
Proven |
-100% |
-100% |
-100% |
|
Probable |
-46% |
-7% |
-50% |
|
|
Total |
-56% |
-9% |
-60% |
The Modifying Factors supporting the Mineral Reserve estimate is described in Section 15.2. The summarised Mineral Reserve to Reserve waterfall chart for the Satellite Pits is shown in Figure 15-12.
|
Asanko Gold Inc. NI 43-101 Technical Report on Asanko Gold Mine, Ghana |
Figure 15-12 2016 to 2019 Resource to Reserve waterfall chart
|
|
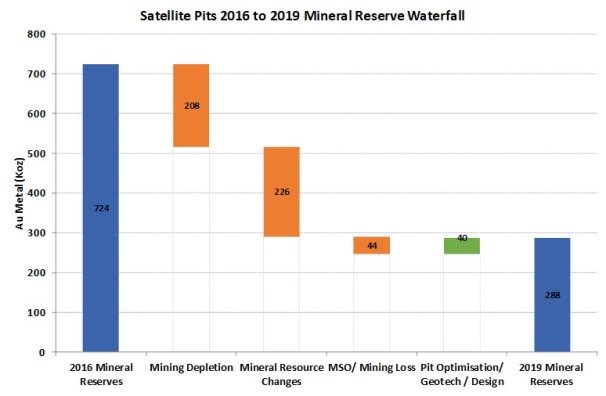
The Mineral Reserve to Reserve comparison and waterfall chart for Asanko Gold combining Esaase, Nkran and the Satellite Pits is shown in Table 15-15 and Figure 15-13.
|
Asanko Gold Inc. NI 43-101 Technical Report on Asanko Gold Mine, Ghana |
Figure 15-13 Asanko Gold 2016 to 2019 Resource to Reserve waterfall chart
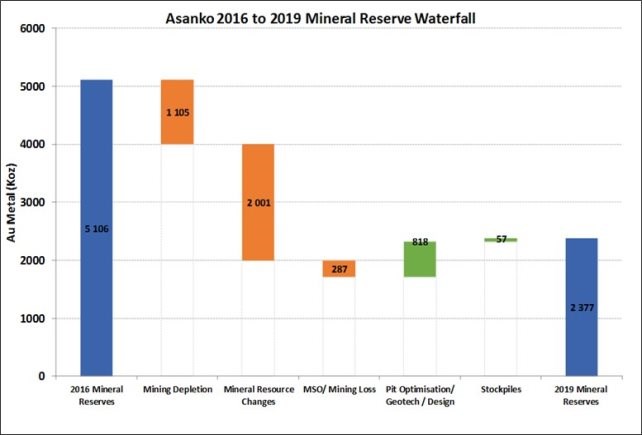
15.5 Factors affecting Mineral Reserve estimation
CSA Global are not aware of any issues that materially affect the Mineral Reserve estimation for Asanko Gold.
The Asanko Gold Mineral Resource and Mineral Reserves are sensitive to cut off grade as shown in Mineral Resource grade tonnage curves from the Mineral Resource Section 14. The factors affecting the Mineral Reserve cut-off grade are:
• Gold price (US$/oz)
• Mining costs in US$/t (this includes the mining contractor rates and the truck hauling rates from Esaase pit to the processing plant)
• Processing recovery
• Processing costs
• Environmental closure costs.
Other factors that can affect the Mineral Reserve estimate are:
• Environmental and social risks
- The ongoing risk of illegal miners will need to be closely monitored and managed. In particular, the influence of the illegal miners on the current Satellite Pits not being mined will need to be addressed
- Regular local stakeholder engagement particularly on the Tetrem Village resettlement negotiation
- Ongoing environmental and social monitoring.
• Geotechnical risk/pit slope stability
|
Asanko Gold Inc. NI 43-101 Technical Report on Asanko Gold Mine, Ghana |
- Additional slope depressurisation measures for the Nkran Cut 2 and Cut 3 slopes
- Update surface water management plans to prevent water ingress into the pits
- Detailed and continuous movement monitoring of the failed sector in Nkran Cut 2
- The current slope stability monitoring programme should be continued and expanded as mining progresses
- Adherence to SRK geotechnical design recommendations.
• Production throughput
- Timeous capital upgrade and ongoing maintenance and management of the 28 km haul road from Esaase to align with the LOM production schedule
- Improved tonnage and grade reconciliation and short-term planning at Esaase as mining progresses through better understanding of the mineralisation and continuous improvement of the Asanko Gold MRM business processes.
• Modifying Factors
- The use of the MSO process by Asanko Gold as stated in the report is considered "best practise" for the application of practical dilution and mining loss modifying factors to a mine plan. To ensure continuous improvement, it is recommended that the MSO process be applied using a well-documented auditable approach to ensure consistent input parameters, reconciliation and appropriate benchmarking of the calculated dilution and mining loss outputs.
|
Asanko Gold Inc. NI 43-101 Technical Report on Asanko Gold Mine, Ghana |
16 MINING METHODS
16.1 Mining strategy
16.1.1 Mining method
Mining by conventional open pit methods of drill and blast followed by load and haul will be employed. Drilling and blasting will be performed on 6 m benches. Loading of the blasted material will be performed on two 3 m flitches. Mining is currently undertaken by two separate mining contractors under the direction of Asanko Gold management. The intention is to get the optimum economical solution from a contracting approach through a tender process planned for 2020.
Underground mining was not considered in this LOM Study.
16.1.2 Blending strategy
The mine plan was developed around a 5.4 Mtpa processing throughput, where between 20% and 50% of the feed is oxide. A blending program is followed throughout the LOM that consider grade-bins, ore-types and Bond-work-index (BWI).
A typical ore type blend will consist of approximately 30% Oxide-, 5% Transition-, 35% soft-Fresh-, 20% moderate-Fresh- and 10% hard-Fresh ore. This will ensure a BWI is controlled to achieve the required comminution for maximum throughput.
The grade bins are split between mill feed (MF), Low grade (LG) and Marginal grade (MO) for the different pits with a philosophy of feeding the higher-grade material first, then the lower grade material to achieve an average head grade of 1.5 g/t and only processing marginal ore when required. The marginal ore stockpiles are planned to be fed at the end of the LOM.
16.1.3 Operating philosophy
The mining operations are scheduled to work 365 days in a year, less unscheduled delays such as high rainfall events which may cause mining operations to be temporarily suspended. Table 16-1 outlines the work roster for the operation.
Table 16-1 Asanko Gold roster
|
Staff type |
Roster |
|
Expats |
6 weeks on site, 2 weeks off |
|
Admin staff |
5-day week (45 hours) |
|
Shift workers |
12 hr shift roster, 1 swing shift |
|
Engineering |
11-day fortnight (i.e. 5 x 10 hr days per week, 5 hr every alternate Saturday and Sunday) |
The contractor mining approach that will be followed is summarised as follow:
1. The current operations at Nkran cut 2 will be completed by PW Mining International Limited (PW Mining)
2. Akwasiso will be mined by Rocksure International Limited (Rocksure) from January 2020 until completed
3. PW Mining will finish the remainder of their BCM contracts at Esaase, which is expected to be June 2020
4. A tender process will commence in Q1 2020, which will be aimed to achieve the best economical contractor approach from Q3 2020. This may require the use of one or more contractors depending on the economics.
|
Asanko Gold Inc. NI 43-101 Technical Report on Asanko Gold Mine, Ghana |
16.2 Geotechnical considerations
SRK carried out a study for the geotechnical design aspects of all operating pits, Nkran Cut 2, Esaase Cut 1 and Akwasiso, and the future proposed pits for Nkran Cut 3, Esaase Cuts 2 to 7, Akwasiso, Abore, Asuadai and Adubiaso to support the mine planning inputs for the LOM Study.
Current geotechnical design values have been derived from back analysis of several Nkran west wall instabilities and geotechnical studies for Esaase and other future open pit mining designs. The Nkran west wall slopes have experienced failures within the unweathered rock mass, the transition zone material beneath the saprolite zone, and within the saprolites. The west wall failures were observed to be due to structural interaction between the north- south striking shear zones, east-west striking faults and dominant joint sets. This geology in similar throughout the Asanko Gold mining area.
A detailed back-analysis of the Nkran instabilities, in conjunction with laboratory test data from geotechnical studies, has provided reliable design input values for geotechnical material parameters for all the pits. Based on the results of the back-analysis, forward analyses of the pit slope geometry were undertaken to assess the stability of the Nkran Cut 2 and Cut 3 slope designs. The material parameters determined from the back analysis, including the assessment of the November 2019 Nkran West Wall failure, were applied to assess the stability of the future designs. A similar process was followed to formulate the Esaase Main Pit slope design.
For ease of design, the geotechnical domains for all pits are divided into:
• Oxides (saprolite material)
• Transition (saprock material)
• Fresh (unweathered rock).
The unweathered rock consists of quartzitic shales, sandstone and localised granitic intrusions, with graphite filled shear zones and associated foliation dominant in the quartzitic shales. The stability analyses modelled these materials in accordance with the available geological models, with the derived slope angles honouring the back-analysed material strengths.
The Akwasiso pit design was assessed based on the observed performance of the current pit. This formed the basis for the assessment of the Abore, Asuadai and Adubiaso Satellite Pits designs. These are all limited life pits that are mainly within the saprolite zone with free-dig operations. Therefore, from previous saprolite back-analyses conducted by SRK and Asanko Gold, these designs were assessed by comparing the given slope design with the recommended slope angles for the saprolite/oxide zone and compared to a benchmarking carried out in similar geological environments.
Results of the stability analyses were compared to accepted design criteria. The purpose of the design criteria is to establish that the walls are stable for the required life of the pit and may extend up to mine closure. The most common method of assessing the performance of open pit mine slopes is the allowable factor of safety (FoS). The FoS is the ratio between the resisting forces (capacity) and the driving forces (demand) of the system. In open pit mines, the FoS is defined as the ratio of the average shear strength of the material constituting the slopes and the average shear stress developed along the potential failure surface. Acceptability criteria adopted for this study are based on recommendations provided in the internationally accepted Guideline for Open Pit Slope Design (CSIRO, 2009; Editors: Read and Stacey) as shown in Table 16-2.
It should be noted that this methodology utilises a deterministic approach and does not define the probability of failure (PoF) of the slope which additionally considers the variability of the analysis input parameters and is data sensitive, time consuming and costly.
|
Asanko Gold Inc. NI 43-101 Technical Report on Asanko Gold Mine, Ghana |
Table 16-2 Acceptance criteria
|
Slope scale |
Consequence of failure |
FoS minimum |
FoS minimum |
PoF (Maxi) |
|
Bench |
Low - high |
1.1 |
NA |
25-50% |
|
Inter ramp |
Low |
1.15-1.2 |
1.0 |
25% |
|
Medium |
1.2 |
1.0 |
20% |
|
|
High |
1.2-1.3 |
1.1 |
10% |
|
|
Overall |
Low |
1.2-1.3 |
1.0 |
15-20% |
|
Medium |
1.3 |
1.05 |
5-10% |
|
|
High |
1.3-1.5 |
1.1 |
≤5% |
Note: FoS - factor of safety; PoF - probability of failure
16.2.1 Nkran
Cut 2
Nkran Cut 2 has a history of instability on the western slope due to unexpected structural interaction between the north-south striking shear zones and east-west striking faults, and sympathetic jointing. Mining step outs were constructed to negate the historical instability. A recent failure of the upper West Wall at Nkran Cut 2 in November 2019 shown in Figure 16-1 resulted in an amendment to the original geotechnical design. Figure 16-1 shows that the lower slope (below the ramp) remained intact until the failure occurred. However, with failure of the upper slope, it appears that excess failed material resulted in additional loading of the lower slope. It is considered that transient pore water pressure increases due to excessive rainfall and potential far field recharge resulting in water along structures below the transition/saprock (below the 70 m drawdown achieved on the West Wall by the mine dewatering programme) unit were the likely cause of the failure.
Figure 16-1 Nkran West Wall on 27 November (left) prior to failure, and 28 November (right) post failure
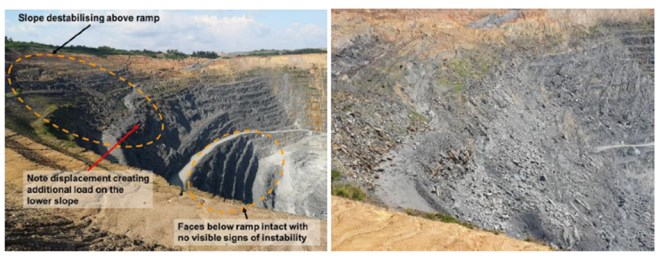
Source: SRK, 2019
Figure 16-2 shows the Cut 2 pit design and the location of the sections considered for the slope stability evaluation. The section lines are positioned in areas where significant slope instability has been historically observed, particularly on the western slope.
|
Asanko Gold Inc. NI 43-101 Technical Report on Asanko Gold Mine, Ghana |
Figure 16-2 Proposed Nkran Cut 2 sections considered for slope analyses
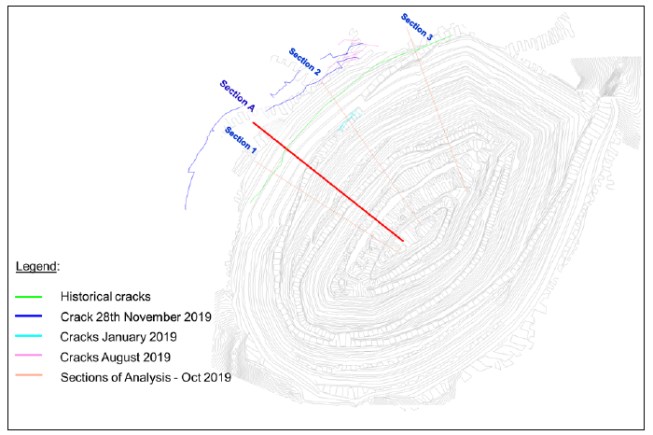
Source: SRK, 2019
The Cut 2 design was assessed assuming that the failed material will remain on the west slope and safe step-off implemented at the toe to prevent debris rolling down to the active production areas, as per the proposed Cut 2 pit redesign provided by Asanko Gold. The failed material within the transition zone and the oxides will be removed during the Cut 3 push back.
The proposed remedial design for Nkran Cut 2 is shown in Figure 16-3, with the position of the critical stability section (Section 'A') indicated.
|
Asanko Gold Inc. NI 43-101 Technical Report on Asanko Gold Mine, Ghana |
Figure 16-3 Nkran Cut 2 proposed remedial design
|
|
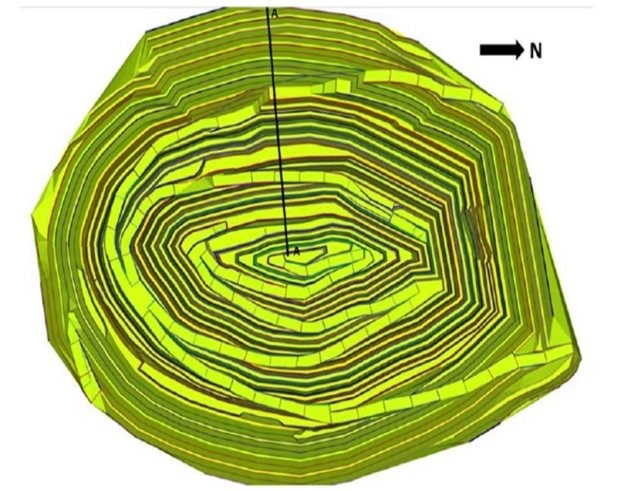
Figure 16-4 shows Section A, including the original topography, November pit and proposed Cut remedial design. Section A, as shown in Figure 16-2 and Figure 16-3 represents the most critical section for the November failure back-analysis and forward-looking stability assessment, with Sections 1, 2 and 3 remaining in the same location as per the previous analyses.
During the stability analysis, the sensitivity of the slope to transient pore water pressure increases was analysed which indicated that with the November 2019 failure back-analysed conditions, the slope develops instability. Resultantly further depressurisation was applied to the proposed design slope to achieve the required stability.
In summary, with additional slope depressurisation implemented, the current Cut 2 design marginally meets the acceptance criteria (minimum acceptable FoS of 1.2 - 1.3 at an inter-ramp scale) and indicates that decoupling or unloading of the Cut 2 slope will result in improved stability. Therefore, to decouple the unstable conditions in the upper slope (current instability) without involving the lower benches, an initial step-out is implemented at the toe of the current instability.
|
Asanko Gold Inc. NI 43-101 Technical Report on Asanko Gold Mine, Ghana |
Figure 16-4 Section A, showing original topography, Nov pit profiles & proposed Cut 2 remedial design
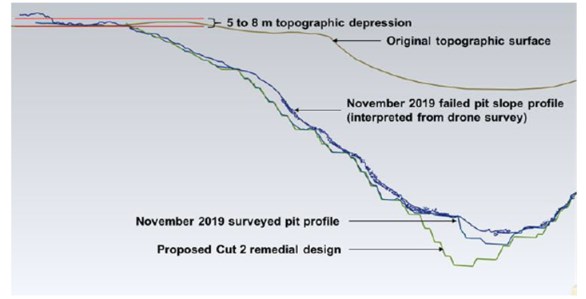
The current Nkran Cut 2 design with additional slope depressurisation marginally meets the acceptance criteria (minimum acceptable FoS of 1.2). Further decoupling or unloading of the Cut 2 slope will result in improved stability.
It needs to be noted that the expected LOM for Nkran Cut 2 is less than six months and the slope conditions may be improved by reducing the principal stresses in the critical zones by accelerating Cut 3 stripping. Further analyses were conducted to determine the requirement for additional mining step-outs to achieve an FoS > 1.3 for the lower slope. These layouts are considered contingencies should the Cut 2 lower slope develop instability. Thereby, effectively buttressing the Cut 2 slope. This will result in a higher FoS. The planned slope angles used for Nkran Cut 2 are shown in Table 16-3.
Table 16-3 Nkran Cut 2 recommended design parameters
|
Slope parameter |
North |
East |
South |
West |
|
Oxide overall slope angle (°) |
30.0 |
26.0 |
26.0 |
22.1 |
|
Oxide face/batter angle (°) |
37.3 |
31.5 |
31.5 |
26.0 |
|
Oxide berm width (m) |
5.0 |
5.0 |
5.0 |
5.0 |
|
Transition overall angle (max) (°) |
42.0 |
41.0 |
37.0 |
36.0 |
|
Transition stack angle (°) |
46.6 |
45.1 |
40.7 |
39.6 |
|
Transition face/batter angle (°) |
70.0 |
70.0 |
60.0 |
60.0 |
|
Transition berm width (m) |
7.0 |
7.6 |
7.0 |
7.6 |
|
Transition stack height (m) |
12.0 |
12.0 |
12.0 |
12.0 |
|
Fresh overall angle (max) (°) |
55.0 |
50.0 |
55.0 |
55.0 |
|
Fresh stack angle (°) |
57.9 |
53.0 |
57.9 |
53.0 |
|
Fresh face/batter angle (°) |
80.0 |
70.0 |
80.0 |
70.0 |
|
Fresh berm width (m) |
8.1 |
7.0 |
8.1 |
7.0 |
|
Fresh min. geotechnical berm width (m)** |
N/A |
N/A |
N/A |
25 |
|
Fresh max. height between geotechnical berms (m)** |
N/A |
N/A |
N/A |
72 |
|
Fresh stack height (m) |
18 |
18 |
18 |
18 |
Note: ** Access ramps should be considered as geotechnical berms for slope decoupling purposes, and where inter-ramp slopes remain < 72 m in vertical height in the fresh rock will suffice. Where inter-ramp slopes exceed 72 m vertical height in the fresh rock, a geotechnical berm should be inserted and can be wedged out against the ramp.
Source: SRK, 2019
|
Asanko Gold Inc. NI 43-101 Technical Report on Asanko Gold Mine, Ghana |
The Nkran pit has an adequate slope stability monitoring programme in place to forewarn of impending slope instability, and mining step-outs of 20 to 25 m have historically stabilised the slope. Thus, the maximum expected potential impact of further instability is a further 20 m design step-out. However, it is considered that given the limited remaining lifespan of Cut 2, this risk is not likely to impact significantly during active Cut 2 mining. The lower Cut 2 slopes will be excavated during the dry season, and the slope depressurisation programme will be expanded as mining continues.
Cut 3
The proposed Nkran Cut 3 pit design has been reviewed by SRK; an analysis for slope stability utilising Rocscience RS2 Finite Element software was carried out on the pit design shell provided by Asanko Gold, based on Cut 2 slope input parameters. Figure 16-5 shows the Cut 3 pit design and the location of the sections considered for the slope stability evaluation. The section lines are positioned in areas where significant slope instability has been historically observed, particularly on the western slope.
The material strength parameters derived from detailed back-analysis of the Cut 2 western slope instabilities to date were applied to the Cut 3 stability analysis, with shear zones projected to the west based on the Cut 2 frequency of occurrence.
Given the nature and frequency of the N-S striking shear zones, and back-analysed strength properties, strength reduction factor (SRFR) > 1.2 were achieved during this analysis.
Considering the Cut 2 instability history, a decoupled slope design was considered in the transition and fresh rock material. A geotechnical berm was inserted after every fourth 18 m bench, i.e. after every 72 m of vertical slope height along the western slope only. The geotechnical berm width considered is 20 m, including the existing 7 m berm width for the associated benches. This nominally results in an overall slope angle in the transition material of 40°, and in the fresh rock of 52°. This resulted in a SRF > 1.3, with the associated recommended slope design parameters indicated in Table 16-4. The resultant final Cut 3 pit design is shown in Figure 16-6.
|
Asanko Gold Inc. NI 43-101 Technical Report on Asanko Gold Mine, Ghana |
Figure 16-5 Proposed Nkran Cut 3 sections considered for slope analyses
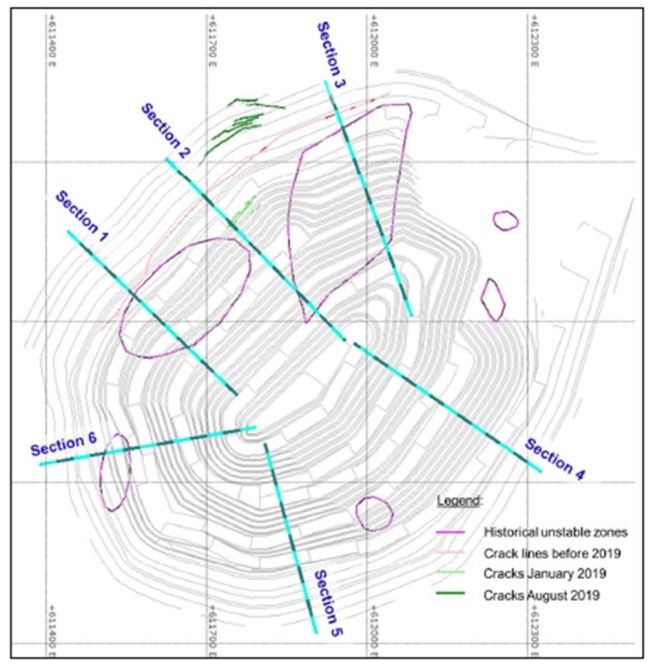
|
Asanko Gold Inc. NI 43-101 Technical Report on Asanko Gold Mine, Ghana |
Table 16-4 Nkran Cut 3 recommended design parameters
|
Slope parameter |
North |
East |
South |
West |
|
Oxide overall slope angle (°) |
30.0 |
26.0 |
26.0 |
22.0 |
|
Oxide face/batter angle (°) |
37.0 |
31.5 |
31.5 |
26 |
|
Oxide berm width (m) |
5.0 |
5.0 |
5.0 |
5.0 |
|
Oxide bench height (m) |
12.0 |
12.0 |
12.0 |
6.0 |
|
Oxide max. stack height (m) |
N/A |
N/A |
N/A |
24.0 |
|
Oxide geotechnical berm width (m) |
N/A |
N/A |
N/A |
20.0 |
|
Waste dump decoupling berm (m) |
N/A |
N/A |
N/A |
20.0 |
|
Oxide to transition decoupling berm |
N/A |
N/A |
N/A |
20.0 |
|
Transition overall angle (max) (°) |
42.0 |
41.0 |
37.0 |
36.0 |
|
Transition stack angle (max) (°) |
47.0 |
45.0 |
41.0 |
40.0 |
|
Transition face/batter angle (°) |
70.0 |
70.0 |
60.0 |
60.0 |
|
Transition berm width (m) |
7.0 |
7.6 |
7.0 |
7.6 |
|
Transition bench height (m) |
12.0 |
12.0 |
1.0 |
12.0 |
|
Transition max. stack height (m) |
48.0 |
48.0 |
48.0 |
48.0 |
|
Stacks per stack slope |
4.0 |
4.0 |
4.0 |
4.0 |
|
Geotechnical berm4 (m) |
N/A |
N/A |
N/A |
20.0 |
|
Fresh overall angle (max) (°) |
55.0 |
50.0 |
55.0 |
50.0 |
|
Fresh stack angle (max) (°) |
58.0 |
53.0 |
58.0 |
53.0 |
|
Fresh face/batter angle (°) |
80.0 |
70.0 |
80.0 |
70.0 |
|
Fresh berm width (m) |
8.1 |
7.0 |
8.1 |
7.0 |
|
Fresh stack height (m) |
N/A |
N/A |
N/A |
18.0 |
|
Max. stack slope height (m) |
N/A |
N/A |
N/A |
72.0 |
|
Stacks per stack slope |
N/A |
N/A |
N/A |
4.0 |
|
Geotechnical berm1 (m) |
N/A |
N/A |
N/A |
20.0 |
Source: SRK, 2019
The Cut 3 oxide slope includes a portion of dumped oxide waste material. Therefore, the overall slope angle recommended for the oxide material is maintained at 22°. The revised parameters apply to the western Cut 3 slope, with the current northern, southern and eastern slope parameters considered adequate based on the current pit slope performance in these areas. Therefore, the current northern, southern and eastern slope parameters remain unchanged.
4 Access ramps should be considered as geotechnical berms for slope decoupling purposes, and where inter-ramp slopes remain < 72 m in vertical height in the fresh rock will suffice. Where inter-ramp slopes exceed 72 m vertical height in the fresh rock, a geotechnical berm should be inserted and can be wedged out against the ramp.
|
Asanko Gold Inc. NI 43-101 Technical Report on Asanko Gold Mine, Ghana |
Figure 16-6 Nkran Cut 3 pit design
|
|
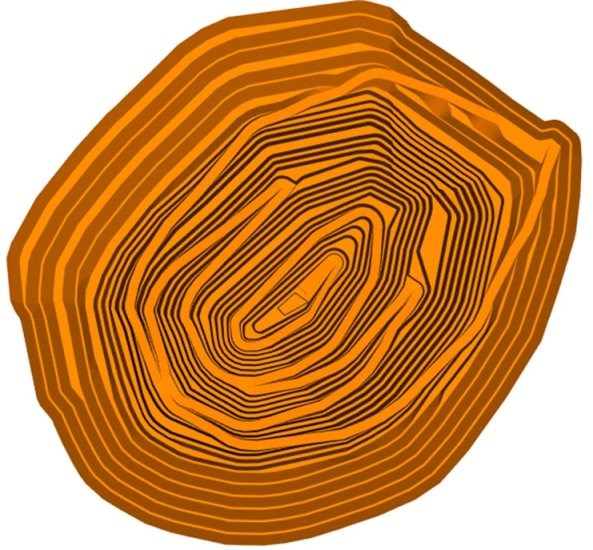
16.2.2 Esaase
Similar N-S striking shears to those present in the Nkran Pit have been observed in the Esaase western slope. Therefore, the Esaase pit slope design is subject to further optimisation with further proposed detailed data gathering. However, it is considered that the current Esaase slope design from SRK is sufficient for annual business planning and this LOM.
Esaase main pit analysis sections are shown in Figure 16-7, with sections 1, 2 and 3 considered to be the critical sections for slope stability (highest risk sections).
It is considered that with further data gathering, analysis and slope stability optimisation, a decoupled slope design similar to the recommended Nkran Cut 3 pit is likely to be realised for the final Esaase Pit slope design. The expected design for the decoupled slope will result in a 20 m berm placed at the intersection of the slope with the N-S striking shears, i.e. where the toe of the slope intersects a shear zone, the step-out should be instituted. Stability and stress analyses are on-going as part of a slope design optimisation, which will evaluate placing a 20 m geotechnical berm, including the existing berm width for the associated bench, every 72 m of vertical slope height. This will decouple the slope, resulting in a reduction in the effective stress. All other slope parameters remain the same as quoted in Table 16-5.
|
Asanko Gold Inc. NI 43-101 Technical Report on Asanko Gold Mine, Ghana |
Figure 16-7 Proposed Esaase sections considered for slope analyses
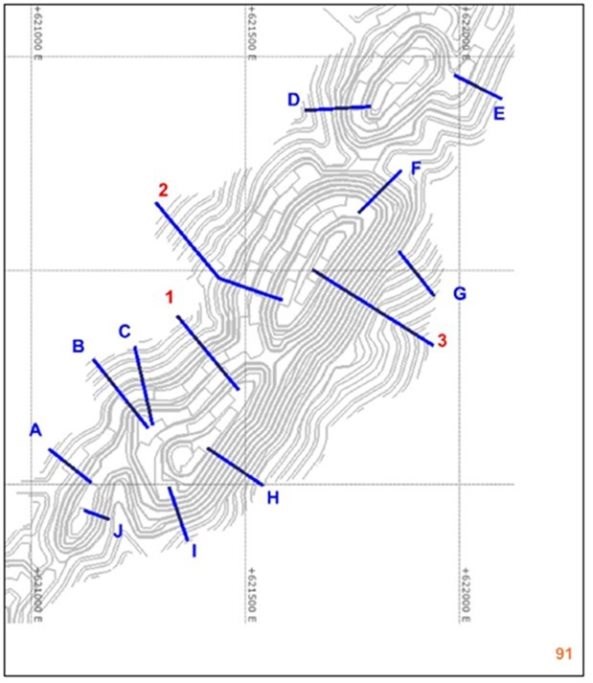
|
Asanko Gold Inc. NI 43-101 Technical Report on Asanko Gold Mine, Ghana |
Table 16-5 Esaase recommended slope parameters
|
Horizon |
Inter |
Maximum |
Maximum |
Berm |
Geotechnical |
Geotech |
|
Highly Weathered (Saprolite) above water table |
27 |
40 |
12 |
7 |
Stack Ht > 36 m |
12 |
|
Highly Weathered (Saprolite) below water table |
26 |
35 |
12 |
5 |
Stack Ht > 36 m |
12 |
|
Transitional East |
45 |
60 |
12 |
5 |
N/A |
N/A |
|
Transitional (South, North) |
48 |
70 |
12 |
6 |
N/A |
N/A |
|
Transitional (West) |
48 |
70 |
12 |
6 |
Stack Ht > 48 m |
12 |
|
Unweathered (East) |
52 |
70 |
18 |
6 |
N/A |
N/A |
|
Unweathered (South, North) |
55 |
75 |
18 |
7 |
N/A |
N/A |
|
Unweathered (West) |
55 |
75 |
18 |
7 |
Stack Ht > 72 m |
15 |
Source: SRK, 2019
16.2.3 Satellite Pits
The recommended design slope angles for the Akwasiso pit, as well as all other Satellite Pits are summarised in Table 16-6. These slope angles should be applied for the first cutback of all Satellite Pits, unless significant changes to the prevailing geological environment are noted. It should be noted that these recommendations consider successful depressurisation of the slopes, and that the current slope depressurisation programme will be required to be maintained and expanded, as required. Where the saprolite slope exceeds 36 m in vertical height, a geotechnical berm of 20 m should be inserted between the saprolite/oxide slope and the transition/saprock slope.
Table 16-6 Satellite Pits recommended slope parameters
|
Slope parameter |
All sectors |
|
Oxide overall slope angle (°) |
26 |
|
Oxide face angle (°) |
32 |
|
Oxide berm width (m) |
5 |
|
Transition overall angle (°) |
47 |
|
Transition stack angle (°) |
60 |
|
Transition berm width (m) |
7 |
|
Transition stack height (m) |
12 |
|
Fresh overall angle (°) |
53 |
|
Fresh stack angle (°) |
70 |
|
Fresh berm width (m) |
7 |
|
Fresh stack height (m) |
18 |
|
Asanko Gold Inc. NI 43-101 Technical Report on Asanko Gold Mine, Ghana |
16.3 Mining operations
16.3.1 Grade control
Grade control (GC) drilling and sampling will be required to determine whether material in a given area is above, or below the cut-off grade. The ore is not anticipated to be visually controlled in the active mining face. GC definition drilling and sampling will be required to delineate the ore zone prior to the blast planning of the ore blocks.
GC drilling will be conducted by a dedicated RC drill that will drill a 10 m by 5 m pattern to a depth of 18 m. Sampling will be conducted at 1.5 m intervals using composited drill chippings along the full length of the hole. This data will be used to generate a GC model, which will be used for short term planning. This GC drilling will be accompanied by deeper holes which is called dynamic drilling, these holes cover the area deeper the 18 m (18 m to 36 m) which is used for the medium-term planning. Blast hole sampling may be required during the mining cycle when/if topographical limitations impact access of GC drilling rigs or if additional samples are required to compile the grade-control model used for short-term planning.
The technical services team will be responsible for collecting the definition drilling assay data and interpreting the results to define the economic ore zones. They will communicate the ore zones to the mine planning engineer and drill and blast supervisor for inclusion into the short term mine plan. Finally, they will delineate those zones in the field and provide direction to the mine operations crew during excavation. The technical services team are also responsible, as part of the sample process, to provide the BWI information to assist with the plant optimisation throughput.
Mapping of the pit for lithology, alteration, structure, mineralisation, hardness will be undertaken utilizing the following process:
• Logging of the blast holes for lithology and alteration
• Development of a hardness model based on logging, mapping and drill penetration rates
• Development of an alteration model based on logging and mapping data
• Generation of dig plans based on assay results and the hardness and alteration models
• These dig plans are communicated to the mining team to direct the mine personnel and mining contractor
• The grade control geologist visits the mining faces on a regular basis to monitor production and can update dig lines.
16.3.2 Site preparation
The entire mining area will be cleared of buildings, installations and vegetation to a depth of 0.3 m. All building rubble, trees, bushes and other vegetable matter shall be stockpiled separately at designated locations. Vegetation suitable for use as firewood shall be stockpiled separately to all other cleared vegetation. The actual depth recovered will vary depending on location and based on recommendations from the Environmental department. All areas, where topsoil stripping occurs, will be surveyed before and after topsoil removal. The topsoil will be pushed into piles by a dozer or grader before a loader or excavator is used to load it into trucks. Trucks will then haul the soil to stockpiles for later use on rehabilitation, or directly to active rehabilitation areas. Prior to topsoil deposition, the stockpile areas will be cleared and surveyed.
16.3.3 Drill and blast
Ore and waste will be broken using conventional drilling and blasting techniques. Experience gained to date during operation of the mine has shown that it is possible to free dig some of the material using either backhoe excavators or by ripping with a CAT D9 dozer, (or equivalent). Some allowances were made for free dig as is shown in the Table 16-7 below.
|
Asanko Gold Inc. NI 43-101 Technical Report on Asanko Gold Mine, Ghana |
Table 16-7 Percent free dig vs blasting
|
Weathering |
Nkran |
Esaase Main |
Esaase South |
Akwasiso + Satellite Pits |
|
(% blasted) |
(% blasted) |
(% blasted) |
(% blasted) |
|
|
Oxides |
0% |
85% |
85% |
7.50% |
|
Transitional |
90% |
100% |
100% |
90% |
|
Fresh |
100% |
100% |
100% |
100% |
The blast hole drilling will be performed using Sandvik DP1500 drill rigs, or equivalent, capable of drilling 102 mm to 152 mm vertical and inclined holes. An explosive delivery truck and several special purposes built LDV's will be used to carry personnel and explosive accessories. Stemming will be used to fill the blast holes after they have been charged.
The blast design parameters are detailed in the Table 16-8 below. These might differ from time to time as required while mining through different zones and weathering areas.
Table 16-8 Blast design parameters
|
Parameters |
Units |
Ore |
Waste |
||||
|
Oxide |
Transitional |
Fresh |
Oxide |
Transitional |
Fresh |
||
|
Bench height |
m |
6.0 |
6.0 |
.06 |
6.0 |
6.0 |
6.0 |
|
Proportion blasted |
% |
15 |
100 |
100 |
15 |
100 |
100 |
|
Hole diameter |
mm |
127 |
127 |
127 |
127 |
127 |
127 |
|
Powder factor |
kg/bcm |
0.5 |
0.6 |
0.8 |
0.4 |
0.5 |
0.6 |
|
Spacing |
m |
5.0 |
4.5 |
4.0 |
6.2 |
5.0 |
4.5 |
|
Burden |
m |
5.6 |
4.8 |
3.5 |
6.1 |
5.0 |
4.5 |
|
Stem |
m |
2.5 |
2.5 |
2.5 |
2.5 |
2.5 |
2.5 |
|
Sub-drill |
m |
1.9 |
1.6 |
1.2 |
2.0 |
1.7 |
1.5 |
|
Explosive per hole |
kg |
77.6 |
73.7 |
67.4 |
80.0 |
74.7 |
72.3 |
|
P80 particle size |
mm |
553 |
579 |
514 |
676 |
638 |
663 |
The pit configuration, bench height and waste material type anticipated best suits drill rigs capable of drilling drill holes with a diameter of 127 mm. The burden, spacing and sub-drill design are dependent on the varying material types of the deposit.
An emulsion-based product with water resistant characteristics and a high velocity of detonation is used to achieve the best fragmentation result.
The blast pattern is dictated by the powder factor required to ensure appropriate fragmentation and heave. The selection of the powder factor is based on the unconfined compressive strength (UCS) measurement results obtained from the preliminary excavation characterisation work. For weathered material, the UCS range is between 8 MPa and 12 MPa, which suggests a very weak rock. For Fresh material, the UCS range is between 28 MPa and 80 MPa, which suggests a weak to moderately strong rock.
As part of the geotechnical study, it was recommended that pre-split blasting techniques be utilized to ensure the stability of the final wall at Nkran. The pre-split holes will be drilled at a spacing of 1.2 m (6 m deep) with a hole diameter of 102 mm; a 15 m buffer trim shot will be blasted in conjunction with the pre-split blast. The pre-split blasting will achieve two goals: reduction of ground vibration for compliance to Ghana regulations regarding surrounding villages, and protection of the high wall condition. The pre-split cost has been included in the operating cost.
|
Asanko Gold Inc. NI 43-101 Technical Report on Asanko Gold Mine, Ghana |
Current explosives contracts are managed by the mining contractor and are included as part of the contractor's cost. This will change going forward as a new tender process is in progress where Asanko Gold will supply explosives to the contractor. There are two magazines on site, one situated at Obotan that services Nkran and all Obotan pits, and one situated at Esaase for the Esaase Main and South Pit (Figure 16-8). Both magazines comply to Ghanaian Minerals and Mining (Explosives) Regulation 145 with clear indication of types of explosives being stored, design, fenced-off and plans supplied to the Commission. Explosives and accessories will be delivered by the explosive contractor to ensure production requirements and legal storage limitations. Emulsion storage capacity is also already established on both sites (Obotan and Esaase) to meet both production and regulatory requirements.
Figure 16-8 Esaase explosive magazine design
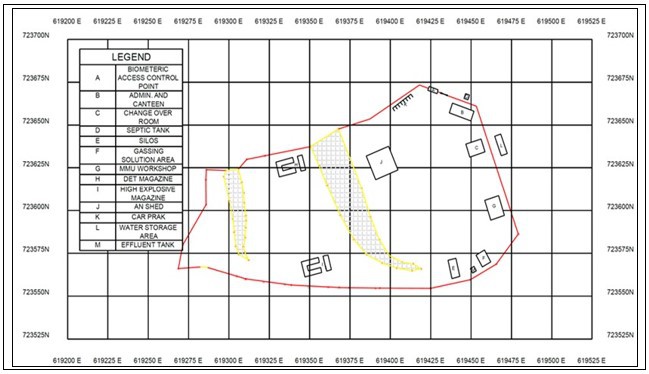
16.3.4 Load and haul
The mining fleet for the major pits (Nkran and Esaase) will include CAT 6030, 300 t hydraulic backhoe excavators with a 17 m3 bucket capacity, or equivalent, and face shovels with a 16.5 m3 bucket and CAT 6015, 140 t hydraulic backhoe excavator with a 6 m3 bucket capacity or equivalent. The primary hauling fleet will be CAT 777D dump trucks with a 94 t capacity.
The mining fleet for the Satellite Pits will typical include CAT 390, 90 t hydraulic excavators with a 6 m3 bucket capacity, or equivalent, and CAT 374, 70 t hydraulic excavators with a 4.5 m3 bucket capacity or equivalent.
Excavation will be executed from the mining dig plan as provided by the mine planning team to the operations team, with ore being hauled from the pits to the respective ore ROM pad, or directly to the crusher. Ore will be separated in different grade bins and material types outside the pit area, from where it will be transported by road haul trucks over land to the Nkran ROM pad for feeding into the Obotan plant.
Waste dumps are designed as close to the operating pit to reduce hauling costs. Load-and-haul costs for Nkran and the Satellite Pits are costed with inclusion of normal load-and-haul rates as per current contract conditions per bench level. The overhaul rates from pit to plant is included, given that the same contractor is responsible for delivering material to the plant at Nkran.
Select ROM pad designs are shown in Figure 16-9, Figure 16-10 and Figure 16-11.
|
Asanko Gold Inc. NI 43-101 Technical Report on Asanko Gold Mine, Ghana |
Figure 16-9 Nkran ROM pad design
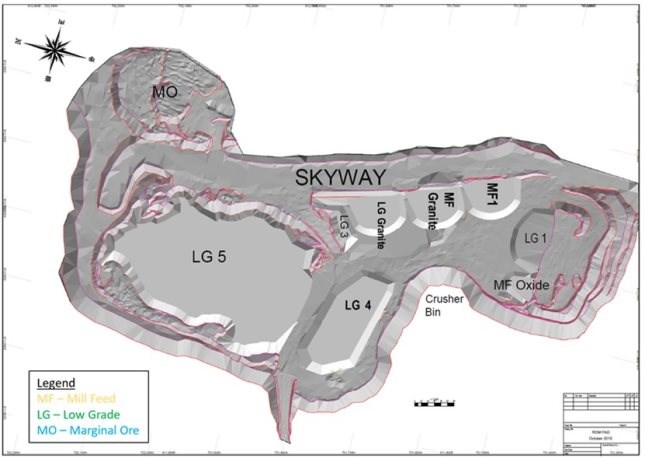
|
Asanko Gold Inc. NI 43-101 Technical Report on Asanko Gold Mine, Ghana |
Figure 16-10 Typical Satellite Pit ROM pad design (Akwasiso)
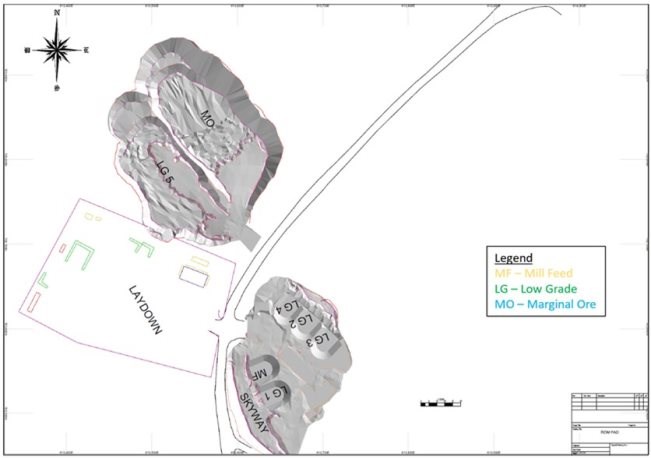
Esaase Pit's haul road costs are calculated separately, given that the hauling distance is 28 km, as discussed in Section 16.4.4. Esaase also has its own planned ROM pad outside the pit where ore will be stockpiled as per grade bin and material type.
|
Asanko Gold Inc. NI 43-101 Technical Report on Asanko Gold Mine, Ghana |
Figure 16-11 Esaase Pit ROM pad design
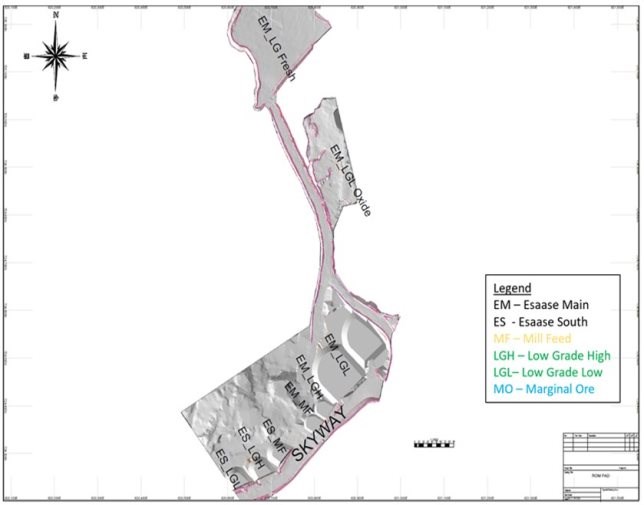
16.3.5 Ore blending operations
Ore stockpiles will be used to manage the feed requirements. The configuration and capacity of the ore handling system will have the capability for direct blended ore feed, or alternatively switch-over between Oxide/ Transitional and Fresh material as and when required. Refer to the Section 17 (processing) on the importance of ore blending for process recovery, preg-robbing, BWI and process throughput.
The proposed stockpile management will consist of buffer stockpiles which include Oxide, Transitional and Fresh material, located close to the primary crusher. It is estimated that 25% of the plant feed tonnage will be directly tip into the crusher and the remaining 75% will require re-handle using a CAT 992 front end loader (or equivalent) and CAT 777D haul truck. This is managed as per discussion in Section 16.1.2. Although direct tipping will be the preferred option, to minimise double-handling cost, this will be superseded by blending requirements.
A longer-term strategic stockpile located approximately 750 m from the ROM pad will be maintained to balance the mining schedule with the plant feed schedule.
16.3.6 Ancillary equipment
The ancillary mining equipment will include dozers, motor graders, fuel bowsers, water bowsers, hydraulic hammer, tractor-loader-and-backhoe and wheel loaders. The function of this equipment will be to support the primary mining equipment by maintaining the pit floor and haul roads, provide clean-up around the excavators to prevent excessive tire damage, secondary breakage of oversize rocks and to water-down road surfaces to supress dust.
|
Asanko Gold Inc. NI 43-101 Technical Report on Asanko Gold Mine, Ghana |
Costing methodology around this is included in the mining rates as per Obotan deposits (Nkran and Satellite Pits). All maintenance cost for the Esaase haul road are included in the overland rates, separate from the Esaase mining rates.
16.3.7 Rehabilitation
The surface waste dumps at each of the various mining locations will be progressively rehabilitated during their construction. Once a mining location is completed, the upper surface of the waste dump will be rehabilitated. Topsoil will be sourced directly from the mining areas or from topsoil stockpiles. There will be no backfilling of the pits based on the guidance from Minerals Commission, Ghana to avoid sterilisation of future potential resources.
The following activities were allowed for the rehabilitation of waste dumps:
• Push down waste dump batters to final formation
• Form waste dump top to final formation
• Load topsoil and dump at rehabilitation area within 1,000 m of source
• Spread topsoil onto battered slopes to minimum thickness of 300 mm
• Rip and seed waste dump battered slopes
• Spread topsoil onto waste dump top to minimum thickness of 300 mm
• Rip and seed waste dump topsoil.
Mine closure and rehabilitation are covered in more detail in Section 20.
16.3.8 In-pit water management
In-pit water management will primarily consist of run-off control and sumps. The dewatering infrastructure and equipment is sized to handle ground water inflows and precipitation. The pit dewatering plan is based on diverting as much surface water as possible away from the open pits. Collecting of water that does report to the open pits is collected, using ditches and sumps before pumping it to the mine water pond. There will be intermediate sumps on the pits walls as well as on the surface between the pit and the mine water pond.
As the LOM pits will be operating at depths greater than 200 m below the crest, specialty high lift pumps will be required. Pontoon mounted pumps will be used to draw water from the sumps. This will ensure the pumps are not submerged as sump water levels rise rapidly in response to rainfall events. Pumping infrastructure will advance as the mining activity advances deeper.
The maximum annual total water shortfall for average conditions is 0.5 Mm³ in Year 5 (occurring over two months) - refer to Section 18. This can be reduced as follows:
• Relocation of the water currently stored in the Adubiaso pit to an alternative storage location during mining of the Adubiaso pit
• By allowing some storage of surplus water within the pit sumps if practicable.
The key operational requirements will be to:
• Minimise water flows into the pit using perimeter bunds, drains and fill, where practicable
• Provide pit pumping capacity for foreseeable extreme events
• Maintain pit wall drainage
• Provide permanent and temporary sumps capable of handling the expected water inflows
• Install settling ponds for the removal of solids prior to discharge off-site
|
Asanko Gold Inc. NI 43-101 Technical Report on Asanko Gold Mine, Ghana |
• Arsenic concentrations for all flows (particularly at Esaase) form an integral part of the projects water management strategy and it will be maintained and calibrated throughout the LOM - refer to Section 18.
16.4 Site layout
16.4.1 Overall layouts
The Asanko Gold site layout for Nkran and the Satellite Pits is shown in Figure 16-12 and for Esaase Pit in Figure 16-13. The layouts include items:
• Pit locations (including waste rock dumps)
• CIL plant
• Tailings storage facility (TSF)
• Waste rock dumps
• ROM pads
• Water treatment plants
• Buffer dams
• Position of local communities.
|
Asanko Gold Inc. NI 43-101 Technical Report on Asanko Gold Mine, Ghana |
Figure 16-12 Asanko Gold site layout (Nkran and Satellite Pits)
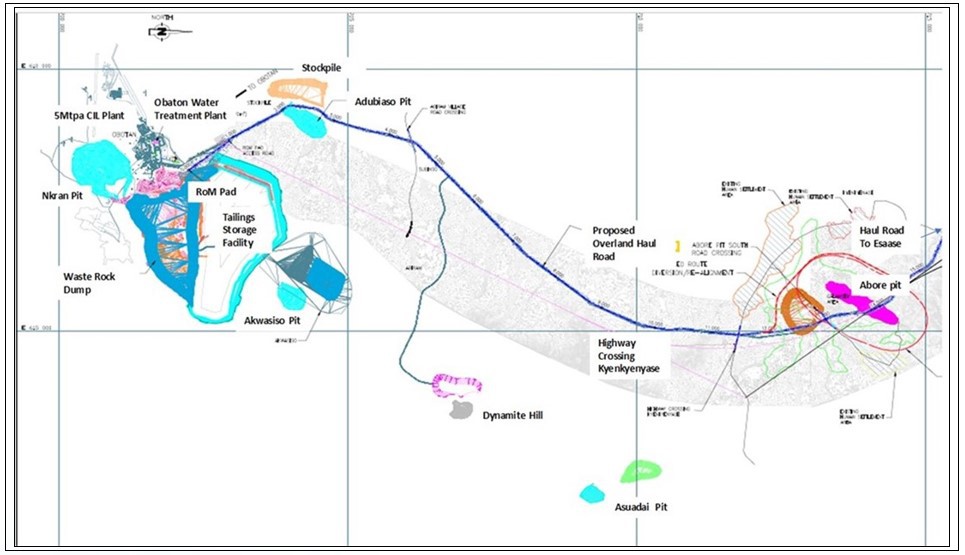
|
Asanko Gold Inc. NI 43-101 Technical Report on Asanko Gold Mine, Ghana |
Figure 16-13 Asanko Gold site layout (Esaase Main Pit)
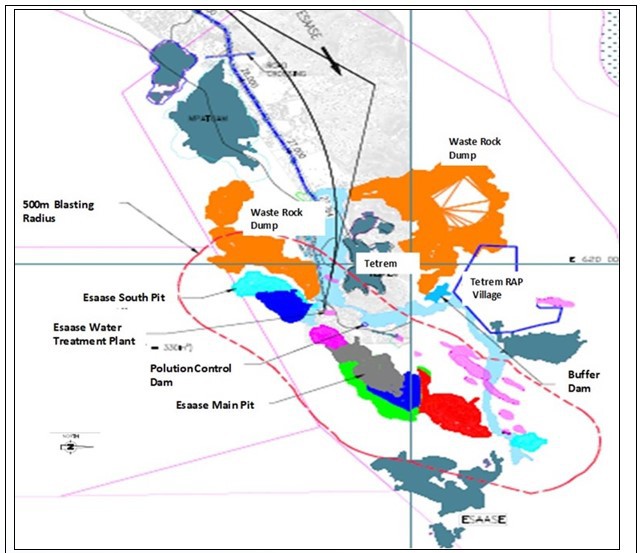
|
Asanko Gold Inc. NI 43-101 Technical Report on Asanko Gold Mine, Ghana |
16.4.2 Waste rock dumps (WRDs)
The WRDs associated with mining operations will be constructed to meet the requirements of the Ghanaian Mining Regulations and AKOBEN guidelines. The WRDs have been initially constructed with the natural rill angle of approximately 35° degrees with 10 m lifts and 17 m berms. This is then to be contoured progressively to an overall slope angle of 18.5° (1:3) to allow for slope stability and re-vegetation. The WRDs will be progressed by tipping from a higher level against a windrow and progressively pushing the waste out with a dozer. Geochemical testwork identified that the waste rock for Esaase and Nkran was non-acid generating. The WRDs locations for Nkran, Esaase and the Satellite Pits are shown on the site layout diagrams, in Figure 16-12 and Figure 16-13.
Arsenic-rich waste management
To minimise the leaching of arsenic from the WRDs it will be essential that high arsenic waste (which is defined as waste rock containing more than 400 mg/kg), and especially high arsenic fresh waste, is not unduly exposed to atmospheric conditions on active dump heads. This material will be identified prior to mining and selectively handled in a manner that allows covering by low arsenic material and/or typical oxide waste in a timely manner. This will involve segregation and selective placement of high arsenic rock within small cells that become encapsulated within the core of the dump and entirely surrounded by a much larger mass of low arsenic or typical oxide material (Figure 16-14).
Figure 16-14 Management of arsenic rich waste in WRDs
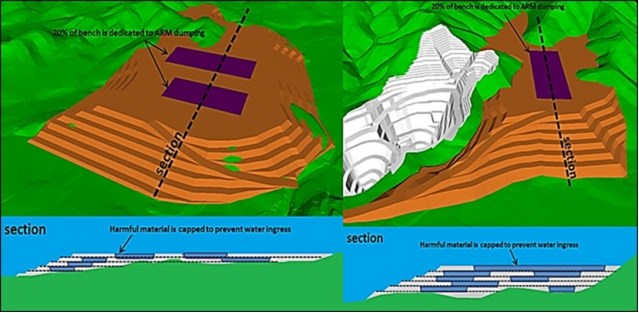
The cells for containing high arsenic material will be constructed in a manner that results in a low permeability within the cell and the overlying oxide cover. This will ensure a high level of control on water flux through high arsenic material. Furthermore, as most arsenic rich material will naturally occur in fresh rock as arsenopyrite, a high degree of compaction will also limit diffusive movement of oxygen into cells and thereby limit the potential for oxidation of arsenopyrite (as well as associated pyrite). The low permeability cells will be constructed by paddock dumping of oxide waste (i.e. dumped as a single layer on a level surface), as this will allow the rock to be levelled and compacted in small lifts.
The waste dumps will be progressively rehabilitated with topsoil, where possible. Progressive rehabilitation has been undertaken where possible to date. Surfaces of dumps will be contoured to minimise batter scour and ripped at 1.5 m centres to a depth of 400 mm, where practicable. All of the rehabilitation work will be carried out progressively. Seepage and shallow ground water flow along the perimeter of the mine residue deposits should be controlled with suitable toe drains.
|
Asanko Gold Inc. NI 43-101 Technical Report on Asanko Gold Mine, Ghana |
Selected waste rock will also be used for the construction of the ROM pad, TSF walls and other infrastructure items during the site construction phase and for further TSF wall lifts during the LOM.
Table 16-9 summarises the dump capacities. Waste was assumed to have a loose density of 1.6 and was swelled by 25%. Enough allowance was made for waste at all the pit.
Table 16-9 Waste rock dump capacities by deposit
|
Deposit |
Capacity (loose cubic metres or lcm) |
|
Nkran |
55,771,680 |
|
Esaase Main |
66,458,903 |
|
Esaase South |
17,387,389 |
|
Akwasiso |
8,173,132 |
|
Adubiaso |
8,993,151 |
|
Asuadai |
5,775,323 |
|
Abore |
12,863,709 |
Selected waste rock at Nkran and Akwasiso will also be used for the construction of further TSF wall lifts during the LoM. The locations of the waste rock dumps with respect to the various open pits and significant infrastructure are shown in Figure 16-15, Figure 16-16 and Figure 16-17.
The waste dumps will be progressively rehabilitated with topsoil, where possible.
Figure 16-15 Nkran, Adubiaso and Akwasiso waste dump locations
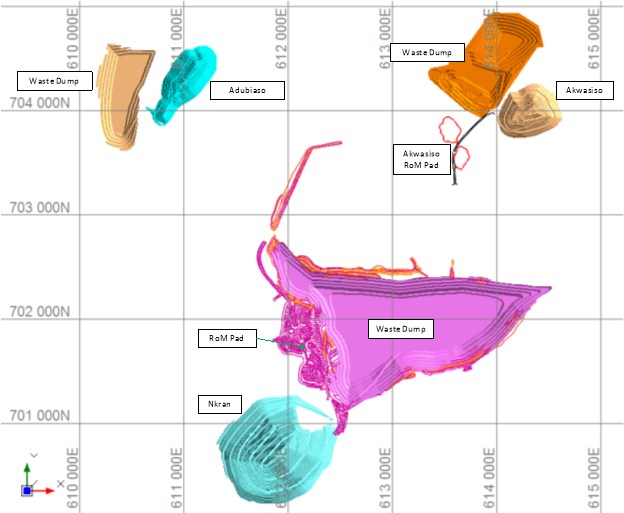
|
Asanko Gold Inc. NI 43-101 Technical Report on Asanko Gold Mine, Ghana |
Figure 16-16 Abore and Asuadai waste dump locations
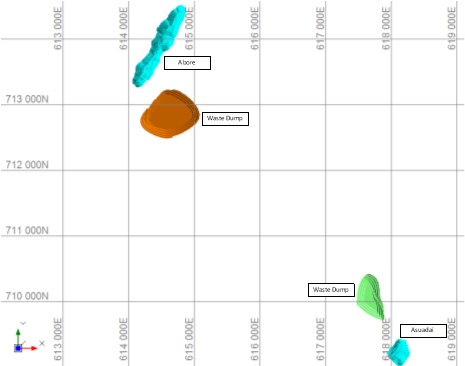
Figure 16-17 Esaase waste dump locations
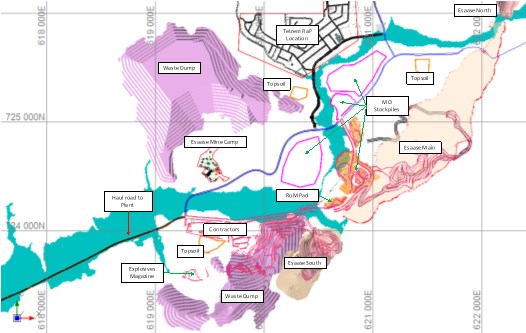
16.4.3 Ore stockpiles
The main ROM pad for ore blending to the CIL plant at Obotan is located on Figure 16-12.
Long term stockpiles for the marginal ore will be large (particularly for Esaase) and were planned by applying the same parameters as the waste dumps. Refer to figure 16-17.
Table 16-10 summarises the marginal ore stockpile capacity requirements for Nkran and Esaase. Material swelled by 25%.
|
Asanko Gold Inc. NI 43-101 Technical Report on Asanko Gold Mine, Ghana |
Table 16-10 Stockpile capacity requirements by deposit
|
Deposit |
Capacity (loose cubic metres or lcm) |
|
Esaase |
6,875,000 |
|
Nkran |
650,000 |
Section 16.3.4 explains the philosophy and operations around the ore stockpiles and blending.
16.4.4 Overland haul road
Ore from Esaase and the Satellite Pits will require haulage to the Obotan plant using an overland haul road as shown in the site layouts (Figure 16-12 and Figure 16-13).
2.2 Mtpa ore is currently hauled from Esaase to the Obotan plant using 20 m3 or 35 t load commercial rigid dump trucks. It is proposed to upgrade the haul road and increase the number of dump trucks to handle a peak tonnage of 5.4 Mtpa as per LOM plan (as described in section 18). The final haul road design and transition to a hauling potential of 5.4 Mtpa from Esaase will be confirmed through a more detailed constructability review (which is currently ongoing).
A summary of the haulage distances by deposit is shown in Table 16-11, but area discussed in detail in Section 16.3.4. Esaase operation's overland haulage are treated as a separate cost item from the load and haul rates.
Table 16-11 Haulage distance by deposit
|
Deposit |
Distance (km) |
|
Esaase |
28.0 |
|
Akwasiso |
5.0 |
|
Abore |
13.4 |
|
Adubiaso |
5.0 |
|
Asuadai |
14.2 |
Source: Asanko Gold, 2019
Approximately 28 km of haul roads is planned from Esaase. This will require cut and fill volumes and portions of the road crossing small water courses and will require culverts to allow water flow under the road.
Phoenix Mine Planning (Phoenix) inspected the haul road and identified six specific sections where changes in the alignment (mainly changes to the vertical curves) reduced the cost of load and haulage. This was determined through a simulation model based on the current equipment, cycle time, equipment cost and fuel usage rates together with the forecast haulage demand for the period January 2020 to December 2023.
DRA then developed a design for upgrade of the entire haul road. This is described in their design report, the design criteria and preliminary drawings. DRA was aware of, but placed low weight on, the specific haul road sections identified by Phoenix for improvement.
The haul road design for the Project is based on a cross section approximately 20 m wide (including drains and shoulders) and allows for dual lane traffic, as well as road drains. Safety berms and barriers (in line with legislated requirements), will be in addition to this cross section, where required.
Mine haul roads will be designed and constructed by the mining contractor.
DRA determined a capital cost estimate for the upgraded haul road. Phoenix then estimated a revised load and haul rate using their simulation model. The impact of fixed monthly charges to the load and haul contractors, together with cost of road maintenance, were then included to determine an estimated total load and haul cost with the upgraded haul road.
|
Asanko Gold Inc. NI 43-101 Technical Report on Asanko Gold Mine, Ghana |
A key underlying assumption in this work is that the reduced operating cost arising from upgraded haul road would be passed on to Asanko Gold in the form of lower load and haul rates. A tender for load and haul services in late 2020 would be the commercial mechanism to achieve this outcome.
Non-point sources of airborne particulate will be dust arising from movement of vehicles on access and haul roads and blasting activities. Water will be sprinkled on the haul and access roads in regular intervals (refer to Section 20).
Noise from hauling of construction material will create a temporary and intermittent increase in road traffic and associated noise levels around the pits, waste rock dumps and the process plant site area. Noise suppression will be undertaken and employees will be supplied with the required personal protection equipment (refer to Section 20).
16.5 Mining schedule
16.5.1 Methodology
The mining schedule was completed in Snowden's Evaluator scheduling software, which is a mixed integer linear programming-based tool. It is driven by the maximisation of net present value (NPV) in the presence of physical quantity, grade and blending constraints.
16.5.2 Parameters and constraints
Pit staging
Most of the pits scheduled are comprised of a single stage, mining to final pit limits. Nkran is completing the last portion of Cut 2 before mining to the final pit in Cut 3 (Cut 1 has already been completed). The main staged pits are Esaase Main which has seven stages, plus a satellite (Figure 16-18). The staging has been designed to, where possible, follow the progression of pit optimisation shells to prioritise value, but also consider practical aspects such as the provision of access to the top of the pits, minimum width and mitigation of shears. The following is noted:
-
Esaase Main Cut 1 - This is the initial cut, currently being mined
-
Esaase Main Cut 2 - Cut 2 mines down much of the ridge that Cut 1 has accessed, leaving access for Cut 3 to be delayed slightly for better ore/waste management
-
Esaase Main Cut 3 - Cut 3 is a continuation of Cut 2, depleting the northern portion of the pit
-
Esaase Main Cut 4 - Cut 4 is a largely independent pit to the north of the main pit
-
Esaase Main Cut 5 - Cut 5 cuts back Cut 2/3 to the west and south
-
Esaase Main Cut 6 - Cut 6 adds a small pit to the southern end of Cut 5
-
Esaase Main Cut 7 - Cut 7 cuts back Cut 5 to final wall in the main pit
-
Esaase North Cut 8 - Cut 8 (or the north pit) is a small independent pit to the north of the main pit
-
Esaase South which has two stages shown in Figure 16-19
-
Esaase South Cut 1 - Cut 1 is a continuation of the current mining at Esaase South and provides some access to reach the top of Cut 2
-
Esaase South Cut 2 - Cut 2 accesses the top of the ridge and mines to final pit.
|
Asanko Gold Inc. NI 43-101 Technical Report on Asanko Gold Mine, Ghana |
Figure 16-18 Esaase main pit staging
|
Esaase Main Cut 1 |
Esaase Main Cut 2 |
|
|
|
|
Esaase Main Cut3 |
Esaase Main Cut 4 |
|
|
|
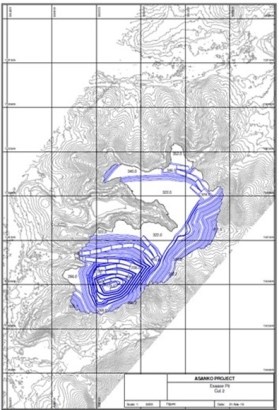
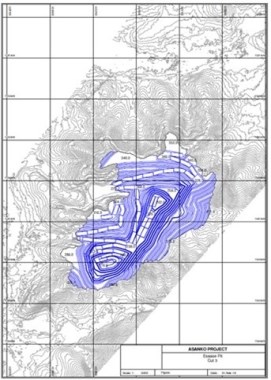
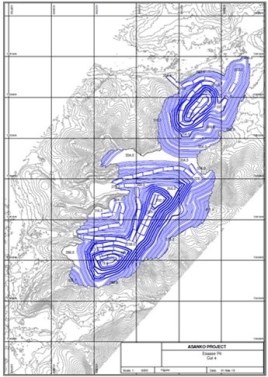
|
Asanko Gold Inc. NI 43-101 Technical Report on Asanko Gold Mine, Ghana |
|
Esaase Main Cut 5 |
Esaase Main Cut 6 |
|
|
|
|
Esaase Main Cut 7 |
Esaase North (Cut 8) |
|
|
|
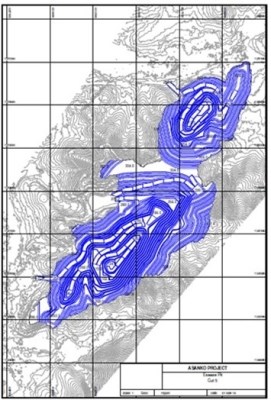


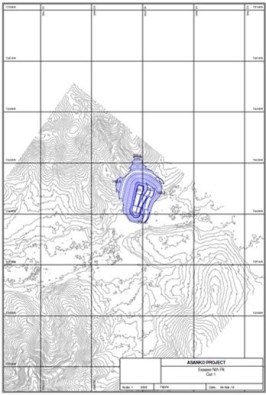
|
Asanko Gold Inc. NI 43-101 Technical Report on Asanko Gold Mine, Ghana |
Figure 16-19 Esaase South pit stages
|
Esaase South Cut 1 |
Esaase South Cut 2 |
|
|
|
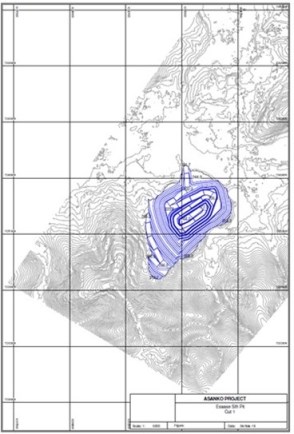
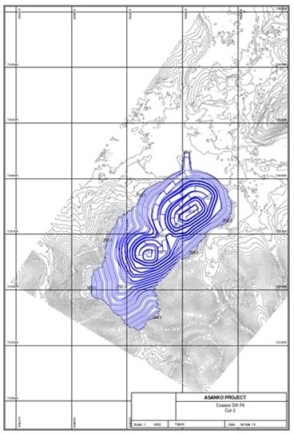
Resolution
The schedule was completed in quarterly increments for the LOM Study.
The mining inventory was separated into pit stages and 12 m vertical benches for scheduling. Within each bench, material was separated into the material types and grade bins for grade maximisation or blending purposes.
Material types
The Snowden Evaluator software is a "binning" scheduler, rather than block-by-block. It groups and aggregates each bench into bins across based on unique combinations of fields. The bins used for this schedule are. shown in Table 16-12. Only Indicated Resources were considered for processing. Only Indicated Resources were considered for processing.
Table 16-12 Material type bins used for scheduling
|
Field |
Bins |
|
WEATH |
OX - Oxide/MOX TR - Transition FR - Fresh |
|
Grade (g/t Au) |
MO - Marginal ore; above marginal cut-off to 0.8 LG - 0.8 to 1.1 MG - 1.1 to 1.5 HG - above 1.5 |
|
Asanko Gold Inc. NI 43-101 Technical Report on Asanko Gold Mine, Ghana |
Mining inventory
A breakdown of the available mining inventory is provided in Table 16-13.
Table 16-13 Scheduling inventory
|
Deposit |
Total mined |
Waste volume |
Strip ratio |
Total |
OX |
TR |
FR |
MO |
LG |
MG |
HG |
||||||||
|
Volume (Mt) |
Grade (g/t) |
Volume (Mt) |
Grade (g/t) |
Volume (Mt) |
Grade (g/t) |
Volume (Mt) |
Grade (g/t) |
Volume (Mt) |
Grade (g/t) |
Volume (Mt) |
Grade (g/t) |
Volume (Mt) |
Grade (g/t) |
Volume (Mt) |
Grade (g/t) |
||||
|
Abore |
17.6 |
14.9 |
5.4 |
2.8 |
1.42 |
0.3 |
0.97 |
1.3 |
1.46 |
1.2 |
1.48 |
1.3 |
0.65 |
0.2 |
0.95 |
0.5 |
1.19 |
0.8 |
3.02 |
|
Adubiaso |
10.3 |
9.5 |
12.2 |
0.8 |
1.51 |
0.1 |
1.39 |
0.2 |
1.45 |
0.5 |
1.55 |
0.3 |
0.64 |
0.1 |
0.94 |
0.1 |
1.29 |
0.3 |
2.85 |
|
Akwasiso |
12.6 |
10.7 |
5.7 |
1.9 |
1.43 |
0.0 |
1.12 |
0.1 |
1.38 |
1.8 |
1.43 |
0.5 |
0.63 |
0.3 |
0.93 |
0.3 |
1.31 |
0.8 |
2.23 |
|
Asuadai |
5.1 |
4.1 |
4.0 |
1.0 |
1.12 |
0.3 |
1.22 |
0.3 |
1.06 |
0.4 |
1.10 |
0.4 |
0.60 |
0.3 |
0.95 |
0.2 |
1.23 |
0.2 |
2.14 |
|
Esaase South |
31.2 |
26.7 |
5.9 |
4.5 |
1.44 |
1.6 |
1.27 |
0.5 |
1.31 |
2.4 |
1.58 |
1.1 |
0.68 |
1.0 |
0.96 |
1.0 |
1.24 |
1.4 |
2.47 |
|
Esaase Main |
134.4 |
105.2 |
3.6 |
29.1 |
1.33 |
11.6 |
1.24 |
5.9 |
1.38 |
11.6 |
1.39 |
7.5 |
0.68 |
7.6 |
0.96 |
5.9 |
1.23 |
8.1 |
2.35 |
|
Nkran |
93.0 |
82.1 |
7.5 |
10.9 |
1.64 |
0.0 |
0.73 |
- |
- |
10.9 |
1.64 |
1.9 |
0.67 |
1.9 |
0.96 |
2.3 |
1.27 |
4.9 |
2.46 |
|
Subtotal |
304.3 |
253.2 |
5.0 |
51.1 |
1.41 |
13.9 |
1.24 |
8.3 |
1.38 |
28.9 |
1.51 |
12.9 |
0.67 |
11.4 |
0.96 |
10.3 |
1.24 |
16.4 |
2.42 |
|
Stockpile |
|
|
|
2.3 |
0.76 |
0.3 |
0.95 |
- |
- |
2.0 |
0.73 |
1.2 |
0.65 |
1.1 |
0.87 |
0.0 |
- |
0.0 |
1.76 |
|
Total |
304.3 |
253.2 |
5.0 |
53.4 |
1.38 |
14.3 |
1.23 |
8.3 |
1.38 |
30.8 |
1.46 |
14.1 |
0.67 |
12.5 |
0.95 |
10.3 |
1.24 |
16.5 |
2.42 |
Notes: OX - Oxides, TR - Transitional, FR - Fresh, MO - Marginal Ore, LG - Low Grade, MG - Medium Grade, HG - High Grade.
|
Asanko Gold Inc. NI 43-101 Technical Report on Asanko Gold Mine, Ghana |
Active mining areas
The schedule minimised the number of pit stages mined in any period to simplify the mining operation. The timing of each mining area was determined by first running an unconstrained schedule (with no limit on active mining areas) and analysing the results. The mining areas and deposits were then restricted to specific timeframes.
Bench turnover
A vertical rate of advance (VRA) of approximately 72 m/a was applied for scheduling, except for Nkran Cut 3 which applied a VRA of 100 m/a, based on current operating experience in Nkran Cut 2. Where there are small tonnages on benches the advance rate can exceed the limit on a proportional basis. The tolerance was loosened in 2020 to match the AGM 2020 budget.
Mining constraints
Snowden was provided with the 2020 budget by AGM and this plan was generally followed in terms of tonnes mined from relevant deposits, tonnes hauled from Esaase and overall ounces produced. This will not be exact as the pit designs are slightly different.
Mining rate
A maximum mining rate of 60 Mtpa was determined through scenario analysis. Mining rates ramp up over four years, commencing at 34 Mtpa in 2020. The Satellite Pits are limited to approximately 10.8 Mtpa over the LOM.
Processing throughput and ramp-up
The process throughput is 5.4 Mtpa. As the plant is already producing, no ramp-up was applied.
Blending constraints
To manage mill throughput, the proportion of oxide in the feed was constrained to 20-50% of the overall feed.
Output constraints
Gold production is targeted at 250 koz/a. It is possible to produce more gold in some periods; however, this was only a marginally improved value (and would require an additional elution circuit) and resulted in a less stable cash flow profile. Therefore, it was agreed to produce a balanced gold profile.
Economic assumptions
The economic assumptions applied for scheduling, driving the discounted value calculation, were the marginal cost parameters and cut-off grades (Section 15).
16.5.3 Schedule results
Mining schedule results
Mining is completed in just over seven years (Figure 16-20), ramping up over the first three years to a peak of 60 Mtpa of ore and waste in 2023 and 2024. The mining rate peaks during this period whilst waste stripping for Nkran Cut 3 is being completed.
|
Asanko Gold Inc. NI 43-101 Technical Report on Asanko Gold Mine, Ghana |
Figure 16-20 Mining schedule by deposit

Note: ABR - Abore; ADU - Adubiaso; AKW - Akwasiso; ASU - Asuadai; ESS - Esaase South; ESM - Esaase Main; NKR - Nkran
The annual vertical advance of each of the pits is shown in Table 16-14. It is typical that five or six cuts would be active within a year.
Table 16-14 Approximate vertical advance (m) by deposit/cut
|
Deposit/Cut |
2020 |
2021 |
2022 |
2023 |
2024 |
2025 |
2026 |
2027 |
|
nkr 02 |
72 |
- |
- |
- |
- |
- |
- |
- |
|
nkr 03 |
- |
- |
24 |
72 |
84 |
84 |
60 |
48 |
|
esm 01 |
108 |
- |
- |
- |
- |
- |
- |
- |
|
esm 02 |
72 |
72 |
84 |
- |
- |
- |
- |
- |
|
esm 03 |
- |
48 |
60 |
- |
- |
- |
- |
- |
|
esm 04 |
- |
- |
72 |
- |
24 |
72 |
- |
- |
|
esm 05 |
- |
- |
72 |
60 |
48 |
- |
- |
- |
|
esm 06 |
- |
- |
- |
- |
- |
- |
60 |
24 |
|
esm 07 |
- |
- |
36 |
60 |
72 |
24 |
- |
- |
|
esm 08 |
- |
84 |
- |
- |
- |
- |
- |
- |
|
ess 01 |
120 |
- |
- |
- |
- |
- |
- |
- |
|
ess 02 |
- |
72 |
72 |
60 |
72 |
- |
- |
- |
|
Akw |
108 |
36 |
- |
- |
- |
- |
- |
- |
|
Abr |
- |
24 |
36 |
48 |
- |
- |
- |
- |
|
Adu |
- |
- |
- |
- |
- |
36 |
60 |
24 |
|
Asu |
- |
- |
- |
- |
72 |
48 |
- |
- |
The Esaase haulage to the Obotan plant is variable over the LOM, largely dependent on the feed available from Nkran (Figure 16-21).
|
Asanko Gold Inc. NI 43-101 Technical Report on Asanko Gold Mine, Ghana |
Figure 16-21 Esaase haulage schedule
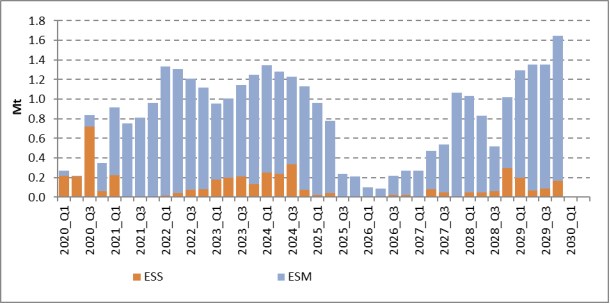
Note: ESS - Esaase South; ESM - Esaase Main
Long term stockpile scheduling results
Long-term stockpile inventories of approximately 14 Mt are built for the Project (Figure 16-22). The largest is at Esaase, with a peak stockpile size of 11.1 Mt. The stockpile grade averages approximately 0.7-0.8 g/t Au and is predominately marginal grade ore, designated to be depleted at the end of the mine life.
Figure 16-22 Long-term stockpile balance

Note: ABR - Abore; ADU - Adubiaso; AKW - Akwasiso; ASU - Asuadai; ESS - Esaase South; ESM - Esaase Main;
NKR - Nkran; STK - Stockpile
Processing schedule results
The plant operates at capacity for most of the LOM (Figure 16-23), except for half a year in 2025, when higher grade is being processed (thus meeting the gold production target with fewer processed tonnes).
|
Asanko Gold Inc. NI 43-101 Technical Report on Asanko Gold Mine, Ghana |
Figure 16-23 Processing schedule by deposit

Note: ABR - Abore; ADU - Adubiaso; AKW - Akwasiso; ASU - Asuadai; ESS - Esaase South; ESM - Esaase Main; NKR - Nkran; STK - Stockpile
The oxide proportion and hardness limits are met over the LOM (Figure 16-24). The oxide proportion is at the minimum requirement (20%) in most periods over the LOM, and the maximum is reached mostly in 2021 and 2022 when limited Transitional and Fresh ore is available from the pits.
Figure 16-24 Processing schedule by rock type and hardness
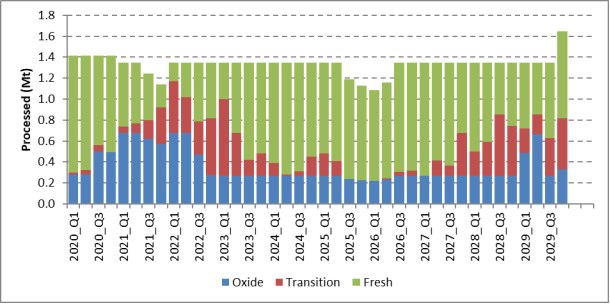
The gold production schedule (Figure 16-25) achieves the target for the majority of the first seven years. Following this production drops to approximately 100 koz/a when the mining operation is exhausted and low-grade stockpiles are being depleted. Reclaiming of these low-grade stockpiles could be deferred if additional higher-grade sources are identified in future.
|
Asanko Gold Inc. NI 43-101 Technical Report on Asanko Gold Mine, Ghana |
Figure 16-25 Gold production schedule by deposit
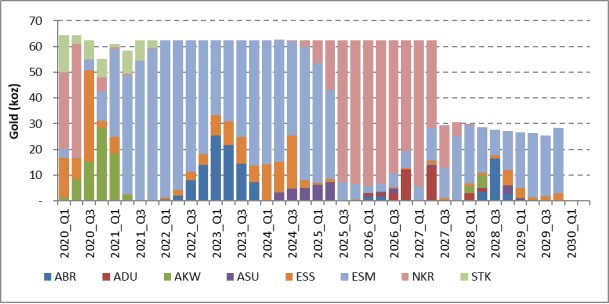
Note: ABR - Abore; ADU - Adubiaso; AKW - Akwasiso; ASU - Asuadai; ESS - Esaase South; ESM - Esaase Main; NKR - Nkran; STK - Stockpile
Schedule summary
An annual summary of the mining schedule is provided in Table 16-15.
Table 16-15 Mining schedule annual summary
|
Component/area |
|
Total |
2020 |
2021 |
2022 |
2023 |
2024 |
2025 |
2026 |
2027 |
2028 |
2029 |
|
Mining |
|
|
|
|
|
|
|
|
|
|
|
|
|
Total ex-pit (Mt) |
|
304.3 |
33.8 |
35.9 |
59.4 |
60.0 |
59.0 |
33.6 |
18.7 |
4.1 |
- |
- |
|
Abore |
Waste |
14.9 |
- |
3.1 |
8.2 |
3.5 |
- |
- |
- |
- |
- |
- |
|
|
Ore |
2.8 |
- |
0.0 |
0.9 |
1.9 |
- |
- |
- |
- |
|
|
|
Adubiaso |
Waste |
9.5 |
- |
- |
- |
- |
- |
3.3 |
5.8 |
0.5 |
- |
- |
|
|
Ore |
0.8 |
- |
- |
- |
- |
- |
0.0 |
0.5 |
0.3 |
|
|
|
Akwasiso |
Waste |
10.7 |
9.7 |
1.1 |
- |
- |
- |
- |
- |
- |
- |
- |
|
|
Ore |
1.9 |
1.4 |
0.5 |
- |
- |
- |
- |
- |
- |
|
|
|
Asuadai |
Waste |
4.1 |
- |
- |
- |
- |
2.7 |
1.3 |
0.0 |
- |
- |
- |
|
|
Ore |
1.0 |
- |
- |
- |
- |
0.5 |
0.5 |
0.1 |
- |
|
|
|
Esaase South |
Waste |
26.7 |
8.9 |
2.3 |
6.0 |
6.6 |
3.0 |
0.0 |
- |
- |
- |
- |
|
|
Ore |
4.5 |
2.0 |
0.0 |
0.4 |
1.1 |
1.1 |
0.0 |
- |
- |
|
|
|
Esaase Main |
Waste |
105.2 |
7.2 |
21.6 |
33.5 |
19.7 |
16.4 |
4.1 |
2.4 |
0.4 |
- |
- |
|
|
Ore |
29.1 |
0.8 |
7.4 |
7.6 |
4.8 |
5.6 |
2.0 |
0.8 |
0.3 |
|
|
|
Nkran |
Waste |
82.1 |
2.1 |
- |
2.9 |
22.5 |
29.6 |
19.0 |
5.1 |
0.9 |
|
|
|
|
Ore |
10.9 |
1.8 |
- |
- |
0.0 |
0.2 |
3.3 |
4.0 |
1.7 |
- |
- |
|
Strip ratio (w:o) |
|
5.0 |
4.7 |
3.6 |
5.7 |
6.8 |
7.0 |
4.8 |
2.5 |
0.8 |
- |
- |
|
Waste Ex-pit (Mt) |
|
253.2 |
27.8 |
28.0 |
50.5 |
52.3 |
51.6 |
27.8 |
13.3 |
1.8 |
- |
- |
|
Ore Ex-pit (Mt) |
|
51.1 |
6.0 |
7.9 |
8.9 |
7.7 |
7.3 |
5.8 |
5.3 |
2.2 |
- |
- |
|
Grade mined (g/t) |
|
1.41 |
1.38 |
1.38 |
1.24 |
1.34 |
1.43 |
1.56 |
1.60 |
1.68 |
- |
- |
|
Long-term stockpiling |
|
|
|
|
|
|
|
|
|
|
|
|
|
Stockpile size (Mt) |
|
14.3 |
2.7 |
5.4 |
8.9 |
11.2 |
13.1 |
13.9 |
14.3 |
11.1 |
5.7 |
0.0 |
|
Stockpile grades (g/t) |
|
|
0.68 |
0.82 |
0.76 |
0.74 |
0.74 |
0.73 |
0.73 |
0.71 |
0.67 |
- |
|
Asanko Gold Inc. NI 43-101 Technical Report on Asanko Gold Mine, Ghana |
|
Component/area |
|
Total |
2020 |
2021 |
2022 |
2023 |
2024 |
2025 |
2026 |
2027 |
2028 |
2029 |
|
Processing |
|
|
|
|
|
|
|
|
|
|
|
|
|
Total processed (Mt) |
|
53.4 |
5.7 |
5.1 |
5.4 |
5.4 |
5.4 |
5.0 |
4.9 |
5.4 |
5.4 |
5.7 |
|
Grade processed (g/t) |
|
1.38 |
1.45 |
1.62 |
1.61 |
1.63 |
1.68 |
1.71 |
1.67 |
1.16 |
0.75 |
0.67 |
|
Oxide % |
|
27% |
28% |
50% |
39% |
20% |
20% |
20% |
20% |
20% |
20% |
31% |
16.6 Mining requirements
16.6.1 Primary mining equipment
The AGM is a contractor-based mining operation. The general approach is that the larger pits, like Nkran and Esaase, will require 200 t excavators with 100 t rigid dump trucks for hauling to increase productivity, while the smaller Satellite Pits will typically use 100 t excavators that will load 40 t articulated dump trucks to improve manoeuvrability and increase selectivity in the smaller deposits.
Currently two mining contractors are operating at the AGM. PW Mining is operating at both Nkran and Esaase, whilst Rocksure is operating at Akwasiso. The selection of equipment is based on the pit designs and mainly driven by the ore body size and production requirement from each pit to achieve the required blend and feed to the plant. Current primary production equipment is summarised in Table 16-16, Table 16-17 and Table 16-18.
Table 16-16 Current mining equipment at Nkran
|
Equipment |
Model |
Number |
Total |
|
Excavators |
CAT 6030 |
3 |
4 |
|
CAT 6015 |
1 |
||
|
Rock breakers |
CAT 336 |
1 |
2 |
|
CAT 330 |
1 |
||
|
Trucks |
CAT 777D |
28 |
28 |
|
Water carts |
CAT 777D |
2 |
2 |
|
Dozers |
CAT D9 |
6 |
6 |
|
Graders |
CAT 16M |
1 |
2 |
|
CAT 16H |
1 |
||
|
Loaders |
CAT 992 |
1 |
3 |
|
CAT 950 |
2 |
||
|
Drill rigs |
1500 Panteras |
8 |
8 |
Table 16-17 Current mining equipment at Esaase
|
Equipment |
Model |
Number |
Total |
|
Excavators |
CAT 6015 |
2 |
8 |
|
CAT 374 |
3 |
||
|
CAT 390 |
1 |
||
|
CAT 336 |
2 |
||
|
Trucks |
CAT ADT |
10 |
29 |
|
CAT 773E |
11 |
||
|
CAT 775E |
8 |
||
|
Water carts |
CAT ADT |
1 |
2 |
|
CAT 773E |
1 |
||
|
Dozers |
CAT D9 |
5 |
6 |
|
CAT D7 |
1 |
|
Asanko Gold Inc. NI 43-101 Technical Report on Asanko Gold Mine, Ghana |
|
Equipment |
Model |
Number |
Total |
|
Graders |
CAT 16H |
1 |
1 |
|
Drill rigs |
1500 Panteras |
3 |
3 |
Table 16-18 Current mining equipment at Akwasiso
|
Equipment |
Model |
Number |
Total |
|
Excavators |
Komatsu 1250 |
2 |
3 |
|
Cat 336 |
1 |
||
|
Trucks |
Volvo ADT |
12 |
12 |
|
Water carts |
TP |
2 |
2 |
|
Dozers |
CAT D8 |
2 |
2 |
|
Grader |
Komatsu GD655 |
1 |
1 |
|
Drill rigs |
1500 Panteras |
3 |
3 |
Based on current typical planned productivities (Table 16-19) at Nkran, Esaase and Akwasiso, the equipment requirements over the LOM can be estimated as per the mining production schedule illustrated in Figure 16-26.
Table 16-19 Mining equipment productivity summary
|
Item |
Type |
Units |
Value |
|
Shifts per day |
2 x 12 Hrs |
Hrs |
24 |
|
Monthly hours |
24 x 30.42 days |
Hrs |
730 |
|
Quarterly hours |
3 x 730 hrs |
Hrs |
2,190 |
|
Monthly tonnes mined |
Quarter tonnes/3 |
Tonnes |
|
|
Availability |
200 t Excavator |
% |
85% |
|
|
100 t Excavator |
% |
85% |
|
|
100 t RDT |
% |
85% |
|
|
40 t ADT |
% |
85% |
|
|
Blast hole rigs |
% |
85% |
|
Utilisation |
200 t Excavator |
% |
85% |
|
|
100 t Excavator |
% |
85% |
|
|
100 t RDT |
% |
85% |
|
|
40 t ADT |
% |
85% |
|
|
Blast hole rigs |
% |
60% |
|
Productivity |
200 t Excavator |
t/hr |
1,300 |
|
|
100 t Excavator |
t/hr |
540 |
|
|
100 t RDT |
t/hr |
120 |
|
|
40 t ADT |
t/hr |
85 |
|
|
Blast hole rigs penetration rate |
m/hr |
27 |
|
|
Average drill yield |
BCM/m |
15 |
|
|
Average productivity @ BCM/hr |
BCM/hr |
405 |
|
|
Average productivity @ 2.8 t/m3 |
t/hr |
1,134 |
|
Asanko Gold Inc. NI 43-101 Technical Report on Asanko Gold Mine, Ghana |
Industry norms were used as basis for availability and utilisation (at 85%), resulting in an effective utilisation of 72%. This is applied to the total available time with two twelve-hour shifts being used for production. The availability and utilisation accounts for shift change, inspections, breaks and all maintenance related aspects.
Figure 16-26 Primary production mining equipment requirements over LOM
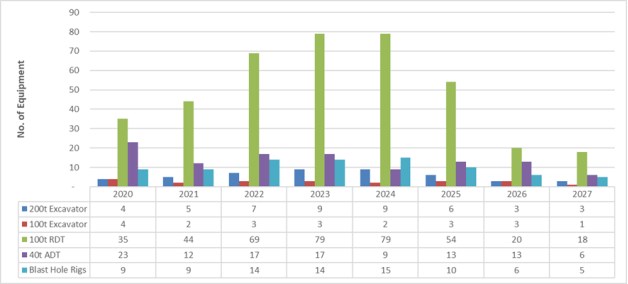
The current equipment pairing at Nkran and Esaase is CAT 6030 excavators loading CAT 777 dump trucks. The current planning loading rate for these excavators is 1,300 t/hr, which will be impacted by the amount of engine hours worked (Figure 16-27).
Figure 16-27 Number of 200 t excavators required by pit

Note: ESS - Esaase South; ESM - Esaase Main; NKR - Nkran
The current equipment paring at the Satellite Pits is Komatsu 1250 excavators loading Volvo 40 articulated dump trucks. This is the typical requirement for smaller pits with smaller turning radius' and manoeuvrability constraints. Productivity was planned at 540 t/hr, levels achieved at Dynamite Hill and the previously mined Akwasiso pit (Figure 16-28, Figure 16-29, Figure 16-30).
|
Asanko Gold Inc. NI 43-101 Technical Report on Asanko Gold Mine, Ghana |
Figure 16-28 Number of 100 t excavators required by pit
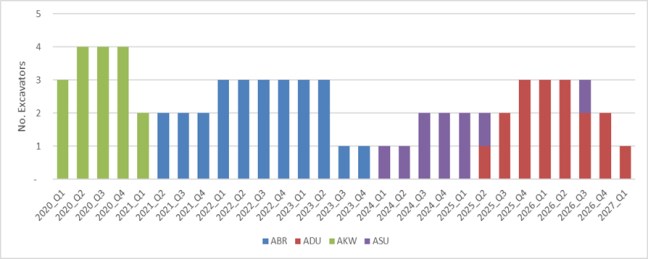
Note: ABR - Abore; ADU - Adubiaso; AKW - Akwasiso; ASU - Asuadai
Figure 16-29 Number of 100 t rigid dump trucks required by pit
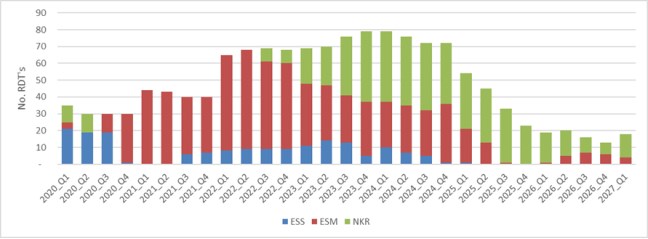
Note: ESS - Esaase South; ESM - Esaase Main; NKR - Nkran
Figure 16-30 Number of 40 t articulated dump trucks required by pit
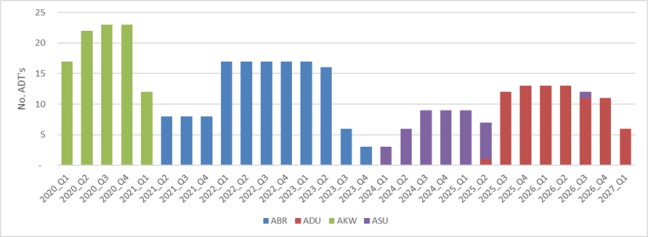
Note: ABR - Abore; ADU - Adubiaso; AKW - Akwasiso; ASU - Asuadai
|
Asanko Gold Inc. NI 43-101 Technical Report on Asanko Gold Mine, Ghana |
Additional 200 t excavators with 100 t dump trucks will be required in 2023 and 2024, when the bulk of mined material will be sourced from Esaase.
Sandvic 1500 Panteras will be used in all pits to drill blast holes. These drill rigs are widely used through the mining industry and are known for good performance, with readily available spares and maintenance capabilities in Africa. For the purpose of this exercise, a penetration rate of 24 m/hr was used (based on current productivities). Number of blast hole drill rigs required by pit is shown in Figure 16-31.
Figure 16-31 Number of blast hole drill rigs required by pit
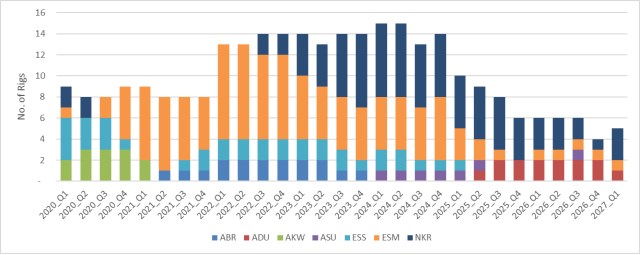
Note: ABR - Abore; ADU - Adubiaso; AKW - Akwasiso; ASU - Asuadai; ESS - Esaase South; ESM - Esaase Main; NKR - Nkran
The LOM schedule will be basis for an open tender, planned for Q3 2020. This will determine equipment requirements from first principles - considering hauling routes as per excavation plan, cycle times, agreed availabilities, guaranteed utilisations and rig requirements (as per pit and blast designs).
16.6.2 Auxiliary equipment
The Asanko Gold Owner's Team includes a technical services division, responsible for planning, quality control & reconciliation and production management. The contractor teams are responsible for mining, hauling and re-handling.
The contractor provides all equipment necessary to execute their work. There are two mining contractors and two long-haul contractors. Table 16-20 indicates the current auxiliary equipment list for Nkran and Esaase from PW Mining.
Table 16-20 PW Mining auxiliary equipment
|
MAKE |
MODEL |
DESCRIPTION |
QTY |
|
Light vehicles |
|
|
|
|
Toyota |
HZJ 78 |
Land Cruiser D/C |
6 |
|
Toyota |
HZJ 78 |
Land Cruiser P/C |
3 |
|
Toyota |
HZJ 78 |
Land Cruiser S/C |
12 |
|
Toyota |
|
Land Cruiser Prado |
1 |
|
Toyota |
|
Land Cruiser GXR |
1 |
|
Hyundai |
|
Carrier |
1 |
|
Nissan |
|
Pick up |
1 |
|
Krupp |
KMK 4080 |
Mobile crane |
1 |
|
Manitowoc |
RT9130 |
Mobile crane |
1 |
|
MAN |
|
Lowloader |
1 |
|
Asanko Gold Inc. NI 43-101 Technical Report on Asanko Gold Mine, Ghana |
|
MAKE |
MODEL |
DESCRIPTION |
QTY |
|
Volvo |
FMX 400 (4x4) |
Fuel bowser |
1 |
|
Volvo |
FMX 400 (6x4) |
Hiab truck |
1 |
|
Volvo |
FMX 400 (4x4) |
Service truck |
2 |
|
Volvo |
FM12 |
Fuel bowser |
1 |
|
Mliler/Mosa/OPT |
XPS450/ 602 |
Welding plant |
5 |
|
Water pumps |
|
|
|
|
Godwin |
CD150M 404D-22 |
6'' water pump |
1 |
|
Godwin |
HL160M/C15 |
8'' water pump |
4 |
|
Generators & compressors |
|
|
|
|
Cummins |
C110D5 |
66KVE Generator |
1 |
|
Cummins |
C33D5 |
26.4 KVA Generator |
1 |
|
Compare |
|
Air compressor |
1 |
|
Ingersoll Rand/ Atlas |
731 |
Air compressor |
2 |
|
Mobile crusher plant |
|
|
|
|
Kleeman Jaw |
SSTR1150X770 |
Crusher |
1 |
|
Terrex Finley Screen |
694T-20x5FT |
Crusher |
1 |
|
Lighting plants |
|
|
|
|
SMG |
TL- 90 |
Lighting set |
7 |
|
VT ENO |
|
Lighting set |
1 |
|
Atlas Copco |
QLT H50 |
Lighting set |
9 |
16.6.3 Mining labour
Mining labour includes technical services and mining production (part of the owner team). Technical services are responsible for all technical input into mining related activities. This includes:
-
Mine planning - responsible for short-term and medium-term planning
-
Mine geology that is responsible for grade-control, modelling (for short-term planning), dilution and loss control and reconciliation
-
Resource geology is responsible for exploration and grade-control drilling
-
Geotechnical engineering to ensure mining compliance to design and pit stability
-
Survey to ensure compliance to design, volume measurement and production reconciliation.
The department consist of 95 employees, with organisational structure shown in Figure 16-32.
The mining production team is a small department that manages all mining production related issues and manages the contractor's team. This team ensures that the contractor adheres spatially and volumetrically to the mining plan, as well as ensuring that the contractors work to the contract guidelines in terms of cost, procedures and other disciplines. This department comprises 19 employees with organisational structure as per Figure 16-33.
|
Asanko Gold Inc. NI 43-101 Technical Report on Asanko Gold Mine, Ghana |
Figure 16-32 Organisational structure for mining technical services (Owner's Team)
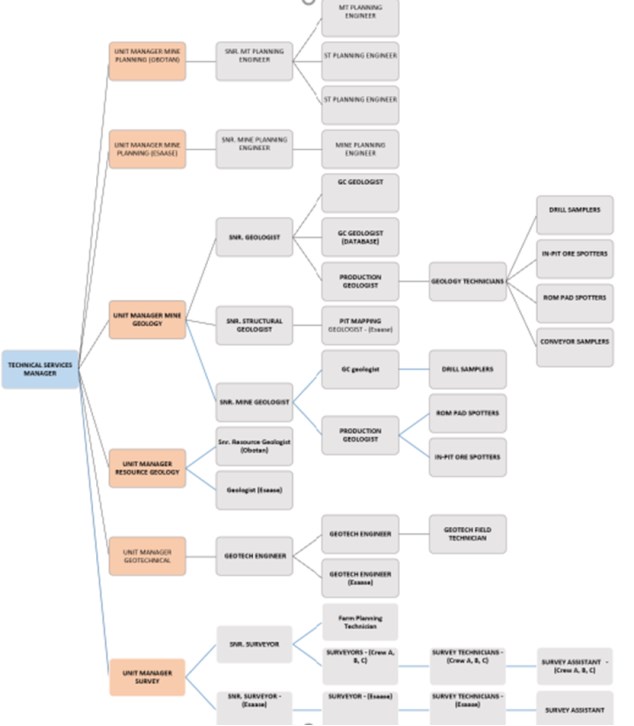
|
Asanko Gold Inc. NI 43-101 Technical Report on Asanko Gold Mine, Ghana |
Figure 16-33 Organisational structure for mining production team (Owner's Team)
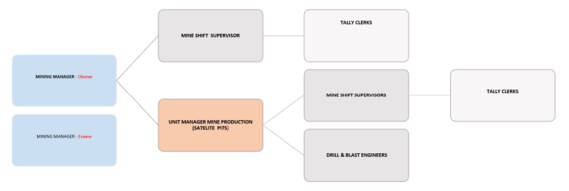
The largest mining contractor is PW Mining - with several other contracts in place in Ghana. Their responsibilities at Esaase and Nkran includes drilling, blasting, load-and-haul and re-handling on ROM pad (both at the Obotan process plant and Esaase).
The total compliment is 667 employees. The organisational structure at Asanko Gold Mine is illustrated in Figure 16-34.
Figure 16-34 Organisational structure for mining contractor at Esaase and Nkran (PW Mining)
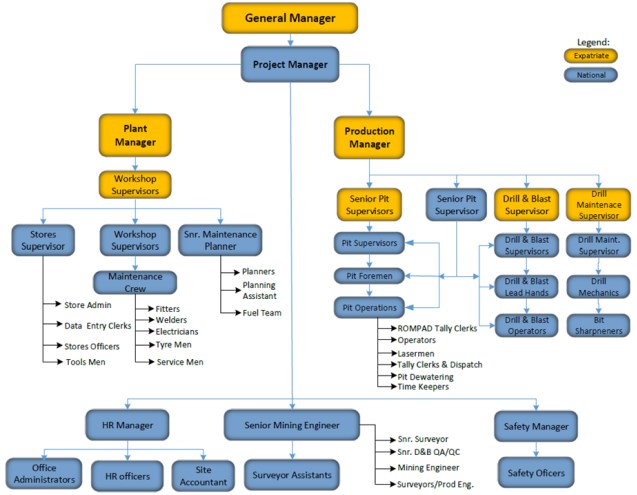
A second mining contractor, Rocksure, operates at the Akwasiso pit, with an operating team structure that is typical of the strategy that will be adopted for the Satellite Pits. The Rocksure team is made up of 255 employees with the production organisational structure at Akwasiso indicated in Figure 16-35.
|
Asanko Gold Inc. NI 43-101 Technical Report on Asanko Gold Mine, Ghana |
Figure 16-35 Mining contractor typical organisational structure at the Satellite Pits (Rocksure)
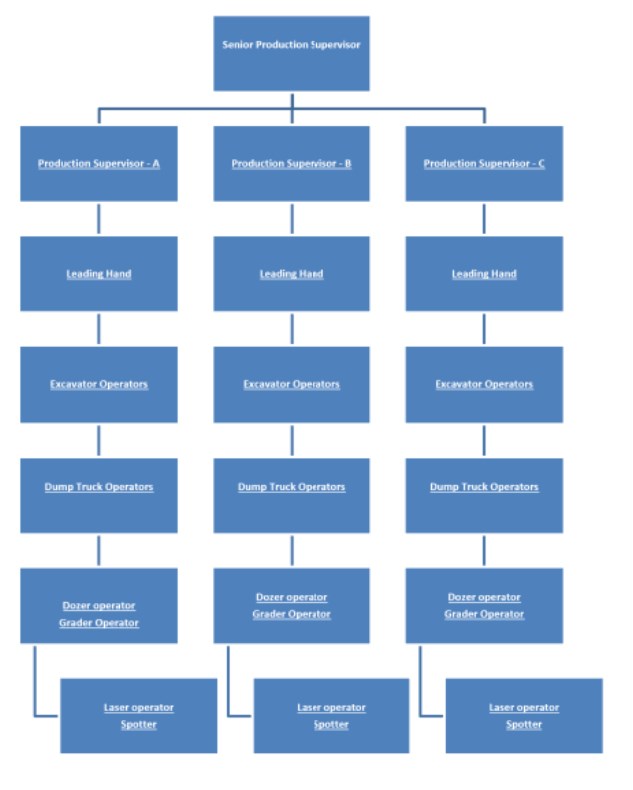
In addition to the two mining contractors, other contractors are responsible for hauling material from Esaase the plant at Obotan, grade-control drilling, equipment at the plant for stockpile management, etc. Table 16-21 indicates the estimated total contractor labour complement in place for mining activities at the AGM.
|
Asanko Gold Inc. NI 43-101 Technical Report on Asanko Gold Mine, Ghana |
Table 16-21 Estimated total mining contractor labour requirements
|
Contractor name/ Project contractors |
Activity |
Permanent staff |
Temporary staff |
Total |
|||||||
|
Expat |
Management |
Senior |
Junior |
||||||||
|
Local |
NLG* |
Local |
NLG* |
Local |
NLG* |
Local |
NLG* |
||||
|
A. Kannin Limited |
Ore haulage from Esaase to Obotan process plant |
- |
- |
3 |
- |
- |
13 |
4 |
9 |
- |
29 |
|
BLOJ Construction |
Ore haulage from Esaase to Obotan process plant |
- |
- |
2 |
- |
2 |
3 |
15 |
10 |
8 |
40 |
|
KAS Live Company Limited |
Dust suppression |
- |
- |
- |
- |
- |
- |
3 |
- |
- |
3 |
|
Kinkubi Solutions |
Construction of boreholes |
- |
- |
- |
- |
3 |
- |
7 |
- |
- |
10 |
|
Amor De Dios Engineering |
Drilling mechanization & pipeline layout to block laydown |
- |
- |
2 |
- |
2 |
3 |
- |
- |
- |
7 |
|
Rabotec Group (Haulage) |
Ore haulage from Esaase to Obotan process plant |
- |
7 |
- |
4 |
- |
46 |
42 |
10 |
31 |
140 |
|
Height Transport Service |
Dust suppression - Esaase catchment |
- |
- |
- |
- |
- |
2 |
- |
- |
- |
2 |
|
A. Kannin Limited |
Dust suppression on the mine haul and access roads |
- |
- |
- |
- |
- |
4 |
- |
- |
- |
4 |
|
Geodrill |
Drill works |
- |
- |
- |
- |
13 |
35 |
16 |
- |
- |
64 |
|
PW Mining |
Mining |
13 |
- |
2 |
- |
27 |
195 |
229 |
201 |
- |
667 |
|
Rocksure International |
Mining |
- |
- |
3 |
1 |
19 |
41 |
143 |
25 |
23 |
255 |
|
Western Transport Services |
Transport services |
- |
- |
- |
1 |
- |
5 |
15 |
- |
- |
21 |
|
Zen Petroleum Ltd |
Fuel and lubricant supply |
1 |
- |
- |
- |
6 |
9 |
5 |
- |
1 |
22 |
|
Plammis Ghana Limited |
Equipment hiring for process operations |
- |
- |
- |
- |
- |
- |
3 |
- |
- |
3 |
|
Nana Danso Opoku Company Limited |
Dust suppression with the catchment communities |
- |
- |
- |
1 |
- |
1 |
1 |
- |
- |
3 |
|
Arkill Ventures |
Dust suppression with the catchment communities |
- |
1 |
- |
- |
- |
2 |
- |
- |
- |
3 |
|
Grand total |
14 |
8 |
12 |
7 |
72 |
359 |
483 |
255 |
63 |
1,273 |
|
Note: * NLG - Non-local Ghanaian
Source: Asanko Gold, 2019
16.6.4 Current split between Asanko Gold and contractor responsibilities
As per current responsibilities, Asanko Gold supplies the following:
- Infrastructure
- Virgin lay down areas requiring bush clearing for complete temporary contractors camp
- Connection points to the main sewerage and waste disposal lines
|
Asanko Gold Inc. NI 43-101 Technical Report on Asanko Gold Mine, Ghana |
- Power supply connection and distribution, at the contractors camp and accommodation area
- Potable water supply connection and distribution to all infrastructure areas
- Non-potable water distribution including water tanker filling facility as required
- All roads (excluding haul roads) within the site extents which are necessary for the carrying out of the works.
- Services
- All mine design of pits, waste dumps and stockpiles, roads, ramps and other site works
- Long term and short term mine planning, which will schedule the production of ore and waste
- Delineation of zones requiring selective mining and waste zones
- Open pit survey control
- The collecting of all grade control samples from normal drilling operations
- The sampling and assaying of all grade control samples taken
- The mark-up of zones of ore and waste material
- Dig plans where applicable
- Environmental Monitoring including blast vibration.
- Survey
- Establishment and maintenance of control stations around the site and on the pit perimeters
- Survey of the working areas to determine payment
- Preparation of plans for the site
- Pit wall stability monitoring, as may be required
- Establishing all secondary survey stations required for setting out and pick-up
- Setting out of the planned working areas
- Supply of benchmarks for use by the contractor in level control of working benches
- Pre-split drilling control
- Survey input for berm drainage control
- Setting out blasts according to the blast master plan
- Pick up of all drilling carried out
- Pick up of "as built" batter and ramp positions
- All other survey activities as required by Asanko Gold
- Establishment of limits of active mining areas and contractor no travel areas.
- Mine plans
- Development plans for the open pit and waste dump areas
- "Blast masters" for each bench
- Waste dump and pit plans showing elevations of toes, crests, and benches
- Plans of zones requiring selective mining showing boundaries between ore and waste
- Detailed grade control drilling plans
- Detailed ore loading blending shift plans
- Detailed ROM feed blending plans per shift.
The contractor will ensure that he has a safety management plan to ensure that all works are conducted safely with the following responsibilities:
- Site establishment
- Temporary offices, change houses, workshops and stores facilities
- Accommodation required for staff and sub-contractors as per final contract
- Permitted fuel and lubricants delivery, storage and dispensing for the operations
- Permitted explosive and accessory storage magazines, with bulk explosive mixing facilities as required
|
Asanko Gold Inc. NI 43-101 Technical Report on Asanko Gold Mine, Ghana |
- Fencing surrounding the nominated accommodation areas, contractor work areas, establishment area and the explosive and accessory magazines will be provided by the contractor
- All tools and other mobile equipment required for repairs and maintenance
- All relevant production and support equipment to fulfil the contract
- All transport vehicles required to execute the contract
- All temporary lighting required for safe operations
- External and internal telecommunications facilities as required
- Permitted radio communications as deemed necessary
- Mobile lighting and pumping plants necessary for carrying out the works.
- Scope of work
- Mobilisation, establishment and demobilisation
- Provision and maintenance of all equipment necessary to carry out works
- Short term planning of works
- Clearing and grubbing, topsoil stripping and stockpiling
- Drill and blast of all relevant ore and waste material, including pre-splitting, as directed by the Owner's Team
- Excavate and load of all materials
- Hauling, dumping and stockpiling of all materials to the designated destinations
- Construction or reconstruction and maintenance of all necessary haul roads
- Grade control drilling and sampling from dedicated drill rigs as per the bill of quantities
- Re-handle of ROM stockpile to the ROM tip as per the plant feed schedule
- The provision and control of surface drainage
- The management and removal of all water within the open pit area and associated surface activities, including removal of storm water and groundwater
- Provision of all pit and dump lighting facilities if required
- Profiling of final dumps and other disturbed areas as directed by the superintendent
- Carry out secondary breaking of ore as required
- Provision and management of all personnel for the mining activities
- Provision of safety, environmental and quality assurance plans
- Attend meetings and report progress of works.
|
Asanko Gold Inc. NI 43-101 Technical Report on Asanko Gold Mine, Ghana |
17 RECOVERY METHODS
17.1 Process description
The existing Asanko Gold process plant located at Obotan, will treat approximately 5.4 Mtpa of total ore, comprised of both fresh and oxide ores from Nkran and Esaase. The key process design criteria (PDC) are shown in Table 17-1, the major equipment in Table 17-2 and the process block flow diagram in Figure 17-1.
Table 17-1 Obotan 5.4 Mtpa key process plant design criteria
|
Parameter |
Units |
Value |
|
Crushing plant running time |
Hours/annum (hpa) |
5,125 |
|
Crushing plant feed rate |
Tonnes per hour (tph) |
1,054 |
|
Milling and carbon in leach (CIL) plant running time |
hpa |
8,000 |
|
Milling and CIL plant feed rate |
Tph |
675 |
|
Life of Mine (LOM) Au head grade |
g/t |
1.38 |
|
LOM gravity gold recovery |
% |
50 |
|
Run of Mine (ROM) feed size (F100) |
Mm |
800 |
|
Semi-autogenous (SAG) mill feed size (F100) |
Mm |
300 |
|
SAG mill feed size (P80) |
Mm |
125 |
|
Leach feed size (F80) |
µm |
106 |
|
Pre leach (1 stage) |
hr |
2.1 |
|
CIL (7 stages) |
hr |
15.0 |
|
CIL slurry feed density |
% w/w |
50.2 |
|
CIL feed grade |
Au g/t |
0.846 |
|
LOM average CIL cyanide consumption |
kg/t |
0.10 |
|
LOM average lime consumption |
kg/t |
0.14 |
|
Elution circuit type |
|
Split AARL |
|
Elution circuit size |
t |
5 |
|
Frequency of elution |
batches/day |
2.0 |
Note: AARL - Anglo American Research Laboratories
|
Asanko Gold Inc. NI 43-101 Technical Report on Asanko Gold Mine, Ghana |
Figure 17-1 Obotan plant, 5.4 Mtpa block flow diagram
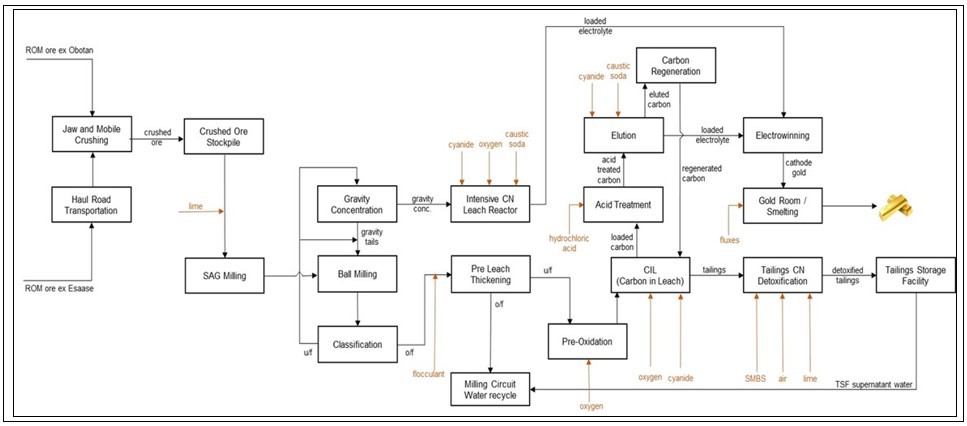
|
Asanko Gold Inc. NI 43-101 Technical Report on Asanko Gold Mine, Ghana |
Table 17-2 AGM Obotan process plant major equipment
|
Equipment description |
No. of units |
Specification |
Power (kW) |
|
Nkran primary jaw crusher |
1 |
CJ815 |
200 |
|
Nkran mobile jaw crusher unit |
3 |
Model UJ440i; CJ412 crusher |
Diesel |
|
Primary SAG mill |
1 |
Shell support; grate discharge; 8.6 m diameter; inside shell: 4 m equivalent grinding length (EGL) |
5,600 |
|
Secondary ball mill |
1 |
Shell support: overflow; 5.8 m diameter; inside shell: 9.1 m EGL |
5,600 |
|
Gravity gold recovery scalping screen |
3 |
Horizontal vibratory, 2.44 m width x 4.88 m length; aperture 2 mm x 19 mm |
44 (4 x 11) |
|
Gravity gold concentrator |
3 |
KC-QS48 (G5 cone) |
55 |
|
Gravity intensive leach reactor |
2 |
2000 BA reactor; 3.2 m3 |
4 |
|
Gravity recovery electrowinning cells |
2 |
12 cathode, 14 anode; 316 stainless steel (SS); 0.73 m (width) x 1.35 m (height) x 1.01 m (length); 1,000 A |
12 |
|
Pre-leach trash screen |
1 |
Horizontal vibratory, 3.05 m (width) x 6.10 m (length); aperture 0.8 mm x 8.8 mm |
44 (4 x 11) |
|
Pre-leach thickener |
1 |
30 m depth; high rate |
11 (hydraulic) |
|
CIL pre-leach tank |
1 |
14.0 m diameter x 14.3 m height; flat bottom; 2,100 m3 live volume |
|
|
CIL pre-leach tank agitator |
1 |
XHH/90/15/90/M4PVSFK (MSRL) hydrofoil dual impeller |
90 |
|
CIL tank agitator |
7 |
XHH/90/15/90/M4PVSFK (MSRL) hydrofoil dual impeller |
90 |
|
CIL inter-stage screens |
7 |
MPS 1450(P); 14.5 m2; 304 L SS; aperture 800 µm |
22 |
|
Elution column |
1 |
5 t carbon capacity, 13 m3 total volume, SAF 2507 duplex SS |
|
|
Regeneration kiln |
1 |
Horizontal tube; tube 321SS, 750 kg |
Diesel |
|
Elution electrowinning cells |
6 |
12 cathode, 14 anode; 316 SS; 0.73 m (width) x 1.35 m (height) x 1.01 m (length); 1,000 A |
12 |
Note: LRS - Liquid resistance starter; SER - modern slip energy recovery drive; MSRL - mild steel rubber lined; SS - stainless steel
17.1.1 Crushing
Obotan sourced ore
The primary crushing circuit consists of a single tip with a dedicated ROM bin and a single jaw crusher in open circuit. Primary crusher product reports to the crushed ore stockpile (COS). The ROM ore (F100 800 mm, F80 500 mm) is loaded into a 100 t ROM bin by means of a front-end loader (FEL), or by direct tipping by haul trucks.
The ROM ore is drawn from the ROM bin at a controlled rate by a single, variable speed apron feeder, and fed directly to the jaw crusher. The speed of the apron feeder is controlled to maintain crusher throughput. Fine material spillage from the apron feeder reports to the primary crushing conveyor, where it is combined with the primary crusher product (P100 300 mm, P80 125 mm). The primary crushing conveyor is fitted with a belt magnet to remove any tramp iron material. The primary crushing conveyor discharges the crushed material onto the COS.
|
Asanko Gold Inc. NI 43-101 Technical Report on Asanko Gold Mine, Ghana |
A mobile crushing array is used to assist with crushing of the ROM material, to optimise fragmentation and maintain throughput in the crushing circuit. Dust suppression, for dust control, is used at the crushing circuit.
Esaase sourced ore
ROM Esaase ore P100 of 800 mm is loaded onto haul trucks which transport the ore approximately 28 km to Obotan, where it is crushed in the Obotan crushing plant and thereafter joins the Obotan crushed ore ahead of feeding to the milling circuit.
17.1.2 Milling
The milling circuit is configured as a SAG milling, ball milling, crushing circuit (SABC circuit) comprising a primary SAG mill, a secondary Ball mill and a pebble crushing circuit. Ore is withdrawn from the 1,550 t COS by apron feeders feeding onto the SAG mill feed conveyor. A weightometer indicates the instantaneous and totalised crushed ore mill feed tonnage and is used to control the SAG mill feed rate via the apron feeders as well as the supplementation rate of the feed with the Esaase oxide material. The SAG mill feed conveyor discharges directly into the SAG mill feed hopper. The SAG mill discharge is screened via a 12 mm x 30 mm aperture trommel screen before gravitating to the mill discharge tank. Screen oversize is conveyed to a single pebble crusher, where it is crushed to below 12 mm prior to recycling back to mill feed conveyor. The pebble crusher feed conveyor is fitted with a weightometer for control purposes. A SAG mill pebble bunker is installed, in which any pebble overflow is stored for further handling.
The SAG mill (slurry discharge) operates in reverse open circuit, discharging directly into the Ball Mill discharge sump, and in closed circuit with the pebble crusher. The ball mill discharges into a sump from where the slurry is pumped to the cyclone classification circuit. A portion of the cyclone underflow (84% target) is diverted to the three gravity concentration units, each with its own scalping screen, removing the oversize fraction and diverting this back to the ball mill discharge sump. The remaining cyclone underflow portion reports back to the ball mill discharge sump for further grinding. Gravity recovered gold concentrate reports to an intensive leaching reactor circuit (ILR) while the gravity tailings fraction reports back to the ball mill discharge sump.
Cyclone overflow gravitates to the pre-leach thickening circuit, comprising a single high rate thickener, where it is thickened to approximately 50% solids ahead of leaching and gold adsorption in the CIL circuit. Supernatant solution overflowing the thickener is recycled back to the process plant.
Quicklime is stored in a 100 t silo and is metered onto the mill feed conveyor using a variable speed screw feeder. Quicklime is delivered to site by tanker and pneumatically transferred to the lime silo using an off-loading blower.
A ball loading system is used for loading of grinding media into the SAG mill (via the mill feed conveyor).
Dust control is by way of a water dust suppression system at the stockpile area.
17.1.3 Gravity gold recovery
Gravity concentrate originating from the three milling gravity recovery concentrators is treated in two ILRs. These reactors contain elevated levels of cyanide, caustic soda and oxygen to enable maximum leaching of the precious metals in the concentrate. Leach residence time is approximately 18 hours. At the end of the leach cycle the pregnant solution is treated for Au recovery in two dedicated electrowinning cells to facilitate separate metallurgical accounting. ILR residue is pumped to the mill discharge sump. Overall gravity recovery is approximately 50%.
17.1.4 Pre-leach thickening
The secondary ball mill classification cyclone overflow stream gravitates to a horizontal vibrating trash removal screen, to remove any coarse ore particles, wood fragments, organic material and plastics that would otherwise become locked up with the circuit carbon and block the CIL inter-tank screens. The trash screen oversize reports directly to a trash bin, whilst the underflow reports to the pre-leach thickener, via a two-stage sampling system.
|
Asanko Gold Inc. NI 43-101 Technical Report on Asanko Gold Mine, Ghana |
The pre-leach thickener is a high rate thickener producing an underflow product of between 50% to 60% solids (w/w). The thickened underflow slurry is pumped to the existing CIL circuit by means of an underflow pumping installation.
The thickener overflow product gravitates to the process water circuit. Flocculant and lime are added to the circuit.
17.1.5 Carbon in leach (CIL)
The CIL circuit comprises a single mechanically agitated, pre-oxidation conditioning tank, followed by seven carbon adsorption stages. Slurry and carbon flows are counter current with loaded carbon pumped up circuit and exiting Stage 1 and tailings slurry gravity flowing down circuit and overflowing Stage 7. The tailings slurry gravitates from Stage 1 to 7 through inter-stage screening (vertical, mechanically swept wedge wire screen) in each tank (facilitating carbon retention), exiting from CIL tank 7 over a carbon safety screen, to recover any stray carbon particles. Carbon is transferred upstream by a submerged pump in each stage with the Stage 1 pump feeding the loaded carbon recovery screen. The associated slurry with the loaded carbon gravitates back to the Stage 1 tank. Each of the tanks contains a bypass facility which allows the removal of any tank from service for maintenance.
A pre-oxidation stage exists; however, this may be converted into a pre-leach stage to maximise residence time, hence recovery when necessary.
Oxygen, (90% purity) from the three, pressure swing absorption (PSA) plants, is included in stages 1-7. The pre-oxidation tank has an intensive reactor injection system to elevate the dissolved oxygen level to approximately 15 ppm, while CIL stages 1 to 7 include sparging systems to elevate dissolved oxygen levels to approximately 12 ppm in stages 2 and 3 and 7 ppm in stages 4 to 7. This process enhances the dissolution of oxygen into the leach slurry, minimising cyanide consumption and improving leach kinetics by increasing the dissolved oxygen concentration
Total slurry circuit residence time is approximately 17.4 hours. Carbon concentration per stage is 11 g/ℓ with an anticipated loaded carbon value of 1,250 g/t. CIL Au recovery is in the order of 85% (tailings approximately 0.131 g/t) resulting in overall plant Au recovery of approximately 92%. Daily loaded carbon recovery is approximately 10 t.
17.1.6 Tailings and detoxification
As per EPA guidelines, the CIL tailings needs to be discharged with a final cyanide concentration of less than 50 g CNWAD/m3 at the TSF spigot.
The current plant operating parameters result in no need for cyanide detoxification of the CIL tailings as the CNWAD values are generally below the 50 ppm compliance standard.
However, provision has been made to use the INCO air/SO2 process for cyanide detoxification. The current detoxification circuit comprises a cyanide destruction feed box, gravity feeding into a single agitated tank, with a blower air sparging facility.
The detoxification process utilises SO2 and air in the presence of a soluble copper catalyst to oxidise cyanide to the less toxic compound cyanate (OCN). Sodium meta-bisulphite (SMBS) is used as the SO2 source and is dosed into the cyanide destruction feed box as a 20% weight/volume (w/v) solution. The detoxification process requires the presence of soluble copper to act as a catalyst and to ensure that any free cyanide present is bound to copper as a CNWAD component. Provision is made for the preparation and dosing of a copper sulphate solution, for dosing to the cyanide destruction feed box as a 15% w/v solution when required. Oxygen required in the reaction will be supplied by sparging of blower air into the cyanide detoxification tank. The reaction is carried out at a pH of 8.5 which is maintained by controlled lime addition to the cyanide destruction feed box. The detoxified tailings are then pumped to the TSF. Supernatant TSF water is recovered via a barge pump and recycled to the plant as process water.
|
Asanko Gold Inc. NI 43-101 Technical Report on Asanko Gold Mine, Ghana |
17.1.7 Carbon treatment
Carbon is received from the loaded carbon recovery screen and loaded directly into the acid wash column. The carbon treatment circuit is designed to handle a batch size of 5 t of loaded carbon per elution. Based on the mass balance, an average of 60 elutions are required per month. The circuit comprises cold acid washing, using a 3% HCl concentration, to remove inorganic foulants such as carbonates, a split AARL elution process operated at approximately 125°C, using an eluant solution comprising 3% NaCN and 3% NaOH, regeneration of the eluted carbon in a rotary kiln at 750°C to remove organic foulants such as grease and oils, and ultimate electrowinning of the pregnant solution in four dedicated electrowinning cells situated in the gold room.
The elution process may be described in more detail as follows. The caustic solution is pumped into the strip (elution) solution make-up tank from the caustic mixing tank and the cyanide solution is pumped from the cyanide dosing tank. The reagents are mixed with filtered raw water in the strip solution make-up tank at the correct concentrations. When the elution column is filled, the strip solution pump turns on and pumps the strip solution through the recovery heat exchangers followed by the primary heat exchangers before entering the bottom of the elution column at 125°C. The strip solution is recycled through the carbon column via the strip solution pump, at a flow rate of two bed volumes per hour (BV/h) equivalent to 20 m3/h, for a total of 50 minutes resulting in a carbon strip (removal of gold from the carbon). Eluate produced during the elution cycle is pumped to either one of the two eluate storage tanks located in the electrowinning area.
The fresh strip solution cycle is followed by a spent solution cycle. During this cycle, the rinse solution from the previous elution (stored in the intermediate solution tank) is circulated through the elution column at 125°C a rate of two BV/h (20 m3/h) for 150 minutes. Once the cycle is complete, the spent solution is pumped to either one of the two eluate storage tanks.
Following this, the rinse cycle involves pumping water for 150 minutes at a rate of two BV/h through the elution column and storing the resulting solution in the intermediate solution tank for the spent solution cycle in the subsequent elution cycle. On completion of the elution cycle, cooling water is pumped from the intermediate solution tank, through the elution column at a rate of two BV/h for 30 minutes and reports to the CIL circuit.
Eluted carbon is removed from the elution column and transferred to the carbon regeneration kiln, via the static sieve bend drainage screen, by means of pressurised water. Drained carbon gravitates to the carbon regeneration kiln feed bin from where it is fed to the carbon regeneration kiln. The regenerated carbon is collected in the barren carbon quench tank, from where it is pumped to the carbon dewatering screen for re-introduction to the CIL circuit via CIL tank 6 or CIL tank 7.
17.1.8 Electrowinning
Currently the pregnant leach solution (PLS) from the ILR is collected in the ILR pregnant solution storage tank. This pregnant solution is circulated through two dedicated electrowinning cells via a common steady head tank.
Pregnant solution from the carbon elution circuit is collected in either one of the two eluate storage tanks. This solution is circulated through a dedicated electrowinning circuit consisting of four cells operating in parallel via a common steady head tank.
Gold is deposited on the electrowinning cell cathodes as a sludge while the solution is circulated until the desired barren gold concentration is achieved, or the cycle time has elapsed. After completion of an electrowinning cycle, barren solution is sampled before being pumped to the CIL feed circuit for disposal. Loaded cathodes are removed periodically from the cells, the gold sludge is washed off using a high-pressure washer after which the washed solution is decanted.
Hydrogen cyanide, ammonia, and hydrogen gas detection equipment is installed in the electrowinning circuit, together with relevant extraction systems.
|
Asanko Gold Inc. NI 43-101 Technical Report on Asanko Gold Mine, Ghana |
17.1.9 Gold room
Electrowon gold is recovered from the electrowinning cells using high pressure water jet sprays. The precious metal slurry is then dried in a drying oven at approximately 110°C to remove associated moisture. Once dried the precious metal powder is smelted in the melting furnace at approximately 1,700°C with fluxes, such as borax, sodium carbonate and silica to remove base metallic impurities such as copper, iron etc. The molten bullion mixture is then poured in moulds, allowed to solidify cleaned and stamped with the mine name and sequential bar number. Gold content varies from 85% to 90%, with approximately 10% silver and approximately 2% to 5% base metal content. The bars are dispatched periodically to a refiner for production of 99.99% gold bars. Slag remaining from the bars may be re-smelted if the gold content warrants this or be returned to the SAG mill for recovery through the circuit. Additional equipment in the gold room includes safes, scales and various security systems.
17.1.10 Reagents
Flocculant
Flocculant is delivered to site dry in 25 kg bags and is added manually to the flocculant hopper. The flocculant is then fed into a venturi tube by a screw feeder, where it is pneumatically transferred into a wetting head. The dry flocculant is mixed with filtered raw water up to a 33% (w/v) solution and discharged into the flocculant mixing tank. After a suitable hydration period, the flocculant is pumped to the flocculant storage and distribution tank, from where it is dosed to the respective areas by means of a ring main system fed via a duty/standby variable speed pumping arrangement.
Copper sulphate
The current installation allows for the delivery of copper sulphate in 1.25 t bulk bags, and manual addition to the mixing tank using a hoist and a bag breaker system. Provision is made for the addition of filtered raw water to the mixing tank to dilute the copper sulphate to a 15% (w/v) solution. The copper sulphate solution gravitates from the mixing tank to the dosing tank, from where it can be dosed directly to the plant CIL tailings cyanide detoxification circuit via a duty/standby variable speed pumping arrangement when required. Copper sulphate spillage is pumped to the CIL tailings cyanide detoxification circuit.
Sodium meta-bisulphite (SMBS)
The existing installation allows for the delivery of SMBS in 1.2 t bulk bags and manual addition to the mixing tank using a hoist and a bag breaker system. Provision is made for filtered raw water addition to the mixing tank to dilute the SMBS to a 20% (w/v) solution. When required, the diluted SMBS solution will be pumped from the mixing tank to the dosing tank, from where it will be dosed directly to the cyanide detoxification circuit and reverse osmosis (RO) plant via a duty/standby variable speed pumping arrangement.
Diesel
Diesel is delivered to the plant site by the fuel tanker and stored in a diesel storage tank for distribution to the fire water system, elution circuit and the gold room.
Caustic soda
Caustic is delivered to site in 1 t bags of 'pearl' pellets. The bags are hoisted by a crane into the mixing tank via a bag breaker system. The caustic soda is diluted with filtered raw water up to a final solution concentration of 20% (w/v). The diluted caustic solution is pumped from the mixing tank to the dosing tank, from where it is dosed to the respective areas (ILR, elution, and electrowinning) by means of a duty/standby variable speed pumping installation.
Sodium cyanide
Sodium cyanide is delivered as dry briquettes in 1 t boxes and added manually via a hoist and bag breaking system into the mixing tank. Filtered raw water is used to prepare a 20% (w/v) solution in the mixing tank. The diluted solution is pumped from the mixing tank to the dosing tank, from where it is distributed by means of dedicated variable speed dosing pumps.
Hydrated lime
|
Asanko Gold Inc. NI 43-101 Technical Report on Asanko Gold Mine, Ghana |
Hydrated lime is delivered dry in 1 t bulk bags, and manually loaded to the lime make-up tank via a hoist and bag breaker system. The hydrated lime is fed into the lime make-up tank by means of a screw feeder. Filtered raw water is added to the make-up tank to produce a 20% (w/v) solution. The diluted milk of lime is distributed throughout the plant by means of a ring main system fed by a fixed speed duty/standby pumping installation.
Ferric chloride
Ferric chloride is delivered in 25 kg bags which are manually loaded via a hoist and bag breaking system into the mixing tank. Filtered raw water is added to the mixing tank to prepare a 20% (w/v) solution. The diluted solution is dosed directly from the mixing tank to the return water treatment circuit, by means of a variable speed, duty/standby pumping installation.
Hydrochloric acid
Hydrochloric acid is delivered in 1,000 ℓ bulk containers at a solution strength of 33% w/v.
Quicklime
Quicklime is delivered in 36 t bulk tankers and pneumatically off-loaded from the tanker into the lime silo. The lime is extracted from the silo using a variable speed screw feeder and dosed directly onto the mill feed conveyor. A suitable dust extraction system is installed on the quicklime dosing system.
Anti-scaling agent
The anti-scaling agent is delivered in 1 t intermediate bulk containers, from where it is pumped to the de-scalant storage tank. The de-scalant reagent is pumped from the storage tank, through the elution heat exchangers, back to the storage tank.
Activated carbon
Fresh activated carbon is delivered in 500 kg bulk bags. The fresh carbon is added to the carbon quench tank using a hoist, as required for carbon make-up to the CIL inventory. The addition point will allow attrition of any friable carbon particles with subsequent fines removal on the sizing screen prior to entering the CIL tanks.
Grinding media
The forged steel (125 mm diameter) grinding media is used in the SAG mill, while 60 mm grinding media is used in the secondary ball mill.
Grinding media is delivered in 200 ℓ drums. SAG mill balls are added to the mill using a hydraulic ball feeder which discharges directly onto the mill feed conveyor. Secondary ball mill media is added to the ball mill feed box by use of a specially designed kibble and hoist, which safely transports the media from the loading area to the feed box.
17.1.11 Plant process services
Filtered raw water
Raw water is currently supplied to the plant raw water storage tank from the pit dewatering boreholes and several borehole pumps. Additional raw water is sourced from the Adubiaso pit and pumped to the plant raw water tank, via the raw water treatment plant.
Provision has further been made on site to route tailings return water to the plant raw water storage tank via the discharge water treatment settling and RO plant.
The raw water is used for gland service, carbon transfer duties, elution, gravity concentrator circuit water, and reagent make-up.
The raw water storage tank has a reserve of water for fire-fighting purposes. This reserve is maintained by suitability positioned fire water and raw water pump suctions.
Fire water
|
Asanko Gold Inc. NI 43-101 Technical Report on Asanko Gold Mine, Ghana |
Firewater is drawn from the raw water tank. The firewater pumping system contains:
-
An electric jockey pump to maintain fire water ring main pressure
-
An electric fire water delivery pump
-
A diesel driven fire water pump that automatically starts in the event that power is unavailable for the electric firewater pump.
Fire hydrants and hose reels are placed throughout the process plant, fuel storage and plant offices at intervals that ensure coverage in areas where flammable materials are present.
Potable water
Potable water is taken from the borehole water line. It is pumped through a water treatment plant before being stored in the potable water tank. The potable water tank feeds the plant potable water tank, from where the plant and mining potable water is distributed.
Process water and plant run-off
Plant run-off is contained in the pollution control dam, from where it is pumped to the plant process water dam.
The Plant process water dam collects the product from the pit-dewatering pumps, TSF return water, and any plant run-off from the pollution control dam. Provision is made for a raw water make-up stream, as required. Filtered water to the plant gravity concentration circuit is supplied by a dedicated pump system, while the remainder of the process water reticulation is undertaken by means of a duty/standby pumping arrangement. Provision is made in the design for the treatment of excess process water prior to discharge to the environment.
Discharge water treatment
The plant design allows for the treatment of the excess process water in a mechanically agitated arsenic precipitation tank, where ferric chloride would be dosed to precipitate out arsenic from solution (in the presence of oxygen), at a pH of 6. Provision was made for lime addition and hydrochloric acid addition to this tank, as required for pH control. The current design allows for the treated water to overflow to an intermediate transfer tank, from where it is pumped to a RO water treatment plant, complete with pre-filters, prior to discharge. Filter cake product from the RO plant filters will be re-pulped with brine in the arsenic waste disposal tank, from where it will be pumped to the final tailings disposal circuit.
|
Asanko Gold Inc. NI 43-101 Technical Report on Asanko Gold Mine, Ghana |
High pressure (compressed) air reticulation
Plant instrument and plant air at 8.0 bar pressure are supplied by a dedicated, duty/standby compressor installation. The compressed air is stored in the instrument air receiver while a dedicated air receiver, located in the milling area, is provided for plant air storage, and is fed from the main instrument air receiver.
All compressed air is dried and filtered prior to storage in the instrument air receiver, from where it is reticulated throughout the plant for instrument air requirements.
Low pressure (blower) air reticulation
A total of three low pressure blowers supply air to the water treatment circuits.
Oxygen reticulation
The plant currently utilises a 15 tpd oxygen plant (comprising three modules of 5 tpd each) to generate oxygen at 90% purity and 300 kPa pressure, for use in the ILR, pre-oxidation, and CIL circuits. The oxygen is stored in the oxygen plant air receiver from where it is distributed.
Return water and return water treatment
Currently, TSF return water is pumped from the TSF via a duty/standby pumping installation to the plant process water circuit. Site has made provision for the routing of the TSF return water to the discharge water treatment and RO plant for treatment prior to discharge to the plant raw water tank, to supplement the raw water requirement.
Esaase mine site services
Provision has been made for run-off water collection at the Esaase pit area, and diversion to a new storm water dam, from where it will be pumped to the intermediate head balancing dam using a submersible pump. The mine curtain dewatering product will also be pumped to the intermediate head balancing dam via borehole pumps. The water quality in the pit balancing dam will be checked on a continuous basis to determine arsenic levels in the dam. In the event that the arsenic levels are below the EPA requirements, water will be released directly to the environment; however, if the arsenic levels are not met, the water will be transferred to the buffer dam, using a duty/standby pumping installation. Water stored in the buffer dam will be utilised for dust suppression purposes. Excess water will be pumped to a water treatment plant which will make use of the NXT-2 arsenic removal media.
The Esaase water treatment system will utilise NXT-2 arsenic removal media. The design will include the conditioning of the contaminated water in an agitated tank, after which the conditioned water will overflow to a second mixing tank where the NXT-2 media will be added manually. The second mixing tank will be suitably sized to allow for the required residence time prior to overflowing to a transfer sump from where the treated water will be discharged to the environment. The spent media will be pumped from the second mixing, to a dewatering screen, and the dewatered media will be collected and drummed prior to disposal to specially designed site within the waste rock dump.
Raw water sourced from boreholes will serve as raw water make-up supply to the Esaase raw water tank from where it will be used as supply to the Esaase potable water plant. The potable water plant product will be transferred to an elevated storage tank, from where the potable water will be distributed.
Provision has been made at the Esaase area for fire water storage and distribution.
|
Asanko Gold Inc. NI 43-101 Technical Report on Asanko Gold Mine, Ghana |
18 PROJECT INFRASTRUCTURE
18.1 Overview
The Obotan plant commenced production in early 2016. The plant was erected close to the Nkran ore deposit and several satellite orebodies. It currently has a throughput capacity of 5.4 Mtpa ore.
In 2018, development of the Esaase ore body, located 28 km away from the Obotan plant, commenced. Oxide ore is currently transported from Esaase to Obotan via a haul road at a current maximum rate of 180 kt per month (~2.2 Mtpa). The balance of the ore is sourced from Nkran and the nearby satellite deposits.
Over time, the Nkran deposit will deplete and additional ore is proposed to be sourced from Esaase.
The scope of this LOM Study provides for addition of arsenic removal water treatment plants, one each for Obotan and Esaase, to reduce arsenic levels in water to be discharged from mining activities to below levels prescribed by the EPA. Additional and brought forward lifts for the tailings storage facility (TSF) at Obotan is included in the LOM Study to address higher production volumes; no other additional infrastructure is required at Obotan for the LOM.
Growing the Esaase Mine project to a full-scale mining operation will require improvement to select infrastructure and provision for additional infrastructure at the mine. The most significant of which is upgrading of the existing haul road to transport up to 5.4 Mtpa of ore from Esaase to Obotan and resettlement of some 131 dwellings and other community structures which will be affected by mining operations at Esaase. New, or upgrading, of existing facilities at Esaase are included in the LOM Study. Provision is made for electrical power distribution on-mine, potable water supply and storage, sewage water treatment, communications, staff accommodation ancillary facilities, warehousing, fuel storage and dispensing, fencing, diversion of local roads, storm water and dewatering water management and storage. The scope includes earth works and civil construction to complete the works.
18.2 New infrastructure required
The new infrastructure required to support the LOM includes:
- Upgrades to the haul road to cater for up to 5.4 Mtpa ore
- Additional and brought forward lifts for the TSF at Obotan
- Minor upgrades at Esaase. These upgrades include:
- Potable and sewage water treatment plants, fire system, pollution control infrastructure, sediment control structures, camp upgrade, power distribution, public road diversion, river/public road crossings and pit dewatering wells
- Esaase pit water buffer dam
- Esaase resettlement action plan (RAP) project which includes relocation of 131 dwellings as well as other structures
- Water treatment plants (at both Obotan and Esaase).
Relatively little new infrastructure is required for the LOM. The following is noted:
- Mining is currently undertaken at Nkran and Esaase
- Road haulage is currently used to transport up to 2.2 Mtpa ore from Esaase to the Obotan plant
- The Obotan plant currently processes circa 5.4 Mtpa.
18.3 Existing infrastructure
18.3.1 Obotan - Existing site infrastructure
Current site infrastructure at Obotan includes:
|
Asanko Gold Inc. NI 43-101 Technical Report on Asanko Gold Mine, Ghana |
- An established mining operation with various structures, including offices, stores, workshops and fuel storage facilities
- A CIL process plant with various structures, including offices, stores, workshops and reagent storage /mixing facilities
- An administration block, training facilities, exploration offices, core storage area, clinic and analytical laboratory
- Senior and junior accommodation facilities located to the west of the Obotan Mine
- An existing TSF
- Multiple operating boreholes for water supply
- A 161 kV incoming power line from the Asawinso sub-station
- Mobile communications facilities. A Vodafone tower is located at the Obotan camp and MTN connectivity is also available.
18.3.2 Esaase - Existing site infrastructure
Current infrastructure (including work budgeted and with construction underway) at Esaase includes:
- An exploration camp and office
- A geological core shed
- Basic camp requirements such as a clinic, offices, kitchen, accommodation, potable water services, power supply, IT connectivity, radio communications and sewage system. Some upgrades and additional scope have been included in the LOM scope
- Community services and relations (CSR) commitments made during the permitting process (e.g. hospital (in progress) and community boreholes (completed)
- Power supplied by the Electricity Company of Ghana (ECG) and transmitted from the ECG network via a 33 kV overhead line. The 33 kV distribution backbone is in place. Some transformers and distribution boards have been included in the LOM scope.
18.4 Site layout
18.4.1 Obotan
The processing plant area is well established on two bulk earthworks terraces with all the major infrastructure already in place. Figure 18-1 shows the Obotan site plan and surrounding infrastructure. Changes proposed in the LOM Study include:
- Updated TSF footprint
- New haul road entry
- New interface between haul road and stockpile area.
|
Asanko Gold Inc. NI 43-101 Technical Report on Asanko Gold Mine, Ghana |
Figure 18-1 Obotan site plan and surrounding infrastructure (04018IH-7130-00146, rev A)

Figure 18-2 shows a closer view of the processing plant. Other than minor upgrades, the plant will remain as-is for the LOM.
|
Asanko Gold Inc. NI 43-101 Technical Report on Asanko Gold Mine, Ghana |
Figure 18-2 Obotan plant layout (IGHEBR-4018-0045, rev C)
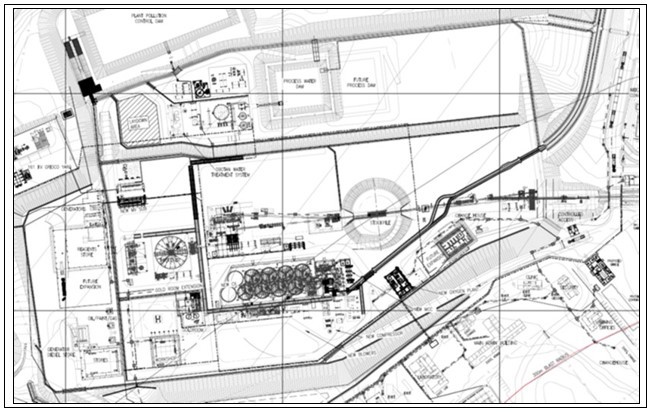
18.4.2 Esaase
For Esaase, the infrastructure scope is shown in Figure 18-2, also referred to as Esaase site infrastructure layout (04018IH-7130-00141, rev A).
Figure 18-3 Esaase site infrastructure layout (04018IH-7130-00141, rev A)
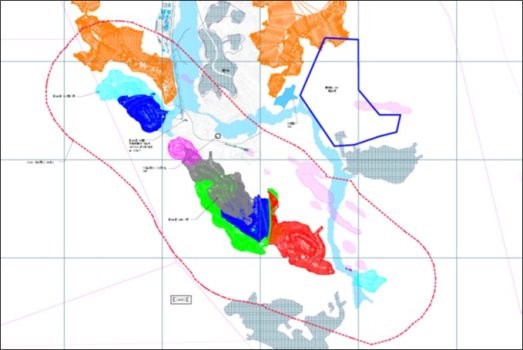
|
Asanko Gold Inc. NI 43-101 Technical Report on Asanko Gold Mine, Ghana |
18.4.3 Haul road Esaase to Obotan
Some 2.2 Mtpa ore is currently hauled from Esaase to Obotan, a distance of approximately 28 km. The haul road route goes through thick vegetation, farmlands and galamsey area. It also crosses various local gravel roads, one paved district road and a few overhead power lines.
The LOM Study proposes to increase haulage along this road up to 5.4 Mtpa as ore from Esaase gradually substitutes for ore from the Nkran and Satellite Pits. Figure 18-4 shows the haul road layout.
Figure 18-4 Asanko Gold haul road - Overall site infrastructure layout (04018IH-7130-00140, rev D)
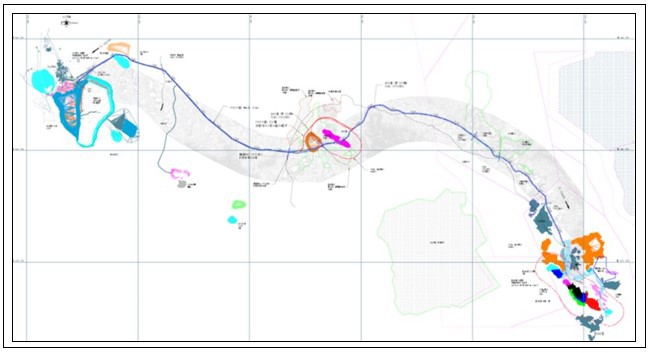
18.5 Site access
The Esaase site is accessed by existing public roads from two directions through three routes:
- Kumasi/Sunyani road to the north-east (sealed road)
- Kumasi/Obuasi road to the south (sealed road)
- Kumasi/Manso Nkwanta road (sealed road), with the last 15 km being the mine's private haul road.
Roads from both directions are gravel topped for the last 20 km to the Esaase site (with road conditions fair to poor).
The Obotan plant is also accessed by an existing public road, namely the Kumasi /Manso Nkwanta road (sealed road), with the last 12 km being AGM's private haul road.
18.6 Site conditions
18.6.1 Meteorology
AGM monthly rainfall, temperature and evaporation are shown in Figure 18-5. The major rainy season occurs in the region from March to July followed by a minor rain period over September and October. Average annual rainfall is 1,382 mm. Average annual evaporation is 1,340 mm.
|
Asanko Gold Inc. NI 43-101 Technical Report on Asanko Gold Mine, Ghana |
Figure 18-5 Mean monthly rainfall, evaporation and temperature

Table 18-1 shows the rainfall intensity/ duration and return period data.
Table 18-1 Design rainfall intensity, duration and recurrence intervals
|
Duration of rain (h) |
Intensity (mm/h) over various recurrence intervals in years (tabled values in mm) |
|||||
|
5 |
10 |
15 |
25 |
50 |
100 |
|
|
0.2 |
135 |
155 |
165 |
175 |
190 |
210 |
|
1 |
77 |
84 |
94 |
102 |
112 |
122 |
|
2 |
46 |
54 |
60 |
65 |
74 |
81 |
|
3 |
33 |
39 |
41 |
45 |
52 |
58 |
|
6 |
19 |
23 |
25 |
28 |
31 |
34 |
|
12 |
10 |
12 |
14 |
15 |
17 |
18 |
|
24 |
5 |
6 |
7 |
8 |
9 |
10 |
Source: HR Wallingford, 2015
18.7 Hydrology
18.7.1 Esaase
Esaase is located within the Bonte River catchment. The Bonte River is a tributary of the Offin River, with a total catchment of 128 km2. It rises in the eastern end of the catchment where forested and farmed hills rise to 600 metres above mean sea level (mamsl) in places and runs west to its confluence with the Offin River at around 19 mamsl. The catchment is around 20 km in length and 9 km in width. At its confluence with the Bonte River, the Offin River catchment has a much larger catchment of 3,475 km2.
|
Asanko Gold Inc. NI 43-101 Technical Report on Asanko Gold Mine, Ghana |
The Esaase property is located within the headwaters of the Bonte River. The pit is aligned along a ridge line oriented north east to south west. The ridge is truncated by a crossing of the Bonte River to the north east at an elevation of about 285 mamsl. It is further crossed by a tributary to Bonte River in a "saddle" zone at less than 270 mamsl, and then rises over the small "southern" pit sector to over 350 mamsl. (Figure 18-6).
Figure 18-6 Esaase pit with surface landform overlaid
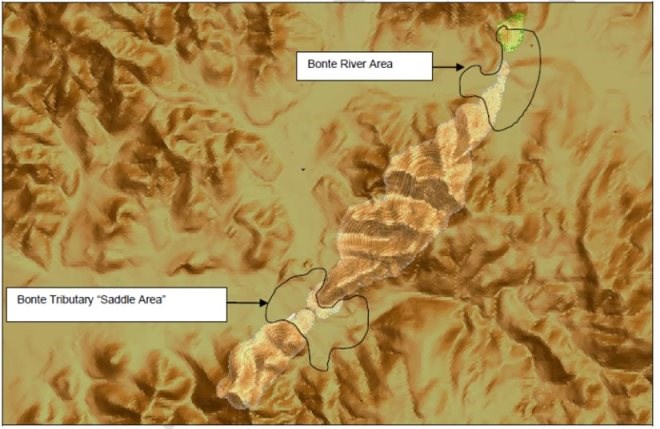
Source: Mining One, 2014
The Bonte River flows east to west across the northern extent of the pit and then meanders over a wide drainage path in a generally SW direction. The river alignment comes within 200 m of the edge of the pit within the "Saddle" area, where the river is joined by a tributary that crosses the pit envelope from the east, over this saddle. The approximate area of catchment of the tributary as it crosses the pit is 5.5 km2.
About 3 km downstream from this confluence, the Bonte River crosses the Mpatoam North weir - a sharp-crested composite weir with V-notch for measuring low to moderate flows and a broad rectangular section for higher flows. The catchment run-off from the 32 km2 catchment area has been monitored on a twice daily basis since September 2008.
The river flood plain is largely man made (originally as a result of the previous placer mining activities of the Bonte Mining Co, and more recently with galamsey activity). Water ponding occurs along the river in low areas created by these activities. Springs are likely to exist but are not significant water producers.
The hydrology of the Offin and Bonte Rivers is discussed extensively in HR Wallingford, 2015.
18.7.2 Haul road hydrology
The LOM scope includes for upgrade of the existing haul road. The haul road will be designed for an average recurrence interval (ARI) of 20 years.
|
Asanko Gold Inc. NI 43-101 Technical Report on Asanko Gold Mine, Ghana |
18.8 Earthworks
18.8.1 Bulk earthworks
Generally, bulk earthworks will be cut to fill operations with a final 150 mm capping layer. Surplus excavated material will be spoiled within a free haul distance of 2 km from the site and all additional fill material will be sourced locally.
18.8.2 Buffer dam
The buffer dam will be constructed from material borrowed within the dam basin, together with a clay core. The entire dam will then be lined with 1.5 mm high density polyethylene (HDPE).
18.8.3 Waste dumps sediment control dam
Installation of sediment control dams is an environmental requirement. The LOM scope includes four unlined dams for the Waste Rock Dump Facility (WRDF); two for WRDF1 and two for WRDF2.
18.9 Mine services area (Esaase)
The mining contractor currently operates from temporary facilities at Esaase. The mine services area will house the facilities and services necessary to fully support the LOM mining operation including heavy motor vehicle workshops, fuel bays, wash-bays, tyre bays, stores, administrative functions and a bulk fuel farm. All the building, structures and facilities required during operations will be part of the mining contractors' scope and hence do not appear in the project capital cost estimate.
The following infrastructure will be provided by Asanko Gold and is included in the LOM scope:
-
Power supply
-
Potable water reticulation, treatment and storage
-
Fire water reticulation
-
Sewer reticulation and treatment
-
Storm water control
-
Fencing of the laydown.
18.10 Roads
18.10.1 Local public roads (Esaase)
Sections of the existing main road between Aboa-Tetekaso and Mpatoam (Phase 1) and Manhiya and Aboa-Tetekaso (Phase 2) will be affected by the pit development and will require re-alignment. The re-aligned road is being constructed in two phases:
-
Phase 1: Development of the WRDF that ultimately covers the village of Tetrem will result in the public road being shifted between the WRDF and the 500 m Esaase Pit blasting radius. This road is being upgraded to ensure safety and usability for locals and mine vehicles (light and supply vehicles only). This scope forms part of the Tetrem RAP project.
-
Phase 2: Based on the current pit and waste rock dump configuration, it is anticipated that the realigned public road will cross the haul road to the Tetrem waste rock dump. The crossing will be operated with flagmen and boom gates. This scope is included in the LOM Study.
18.10.2 Mining haul roads (Esaase)
The bulk earthworks for the haul roads within the mine will be the responsibility of the mining contractor. The public diversion road and storm water crossings form part of the LOM scope.
|
Asanko Gold Inc. NI 43-101 Technical Report on Asanko Gold Mine, Ghana |
18.10.3 Esaase-Obotan haul road
The approximately 28 km long temporary haul road that was constructed for the Esaase Oxide project between Obotan and Esaase will be upgraded to facilitate the transport of ore from Esaase to Obotan for the LOM. The following criteria was used for the design of the haul road:
-
Run of mine material machine loaded
-
Commercial rigid dump trucks, 20 m3 or 35 t loads, 8x4 wheel configuration as per current contractor fleet
-
Daylight operation
-
At 5.4 Mtpa, 365 days per year 14.8 kt/day, 450 truck loads per day at a 95% load factor.
The haul road design for the Project is based on a cross section approximately 9 m wide (including shoulders) and allows for dual lane traffic as well as road drains. Side safety berms and barriers, in line with legislated requirements, will be in addition to this cross section.
An engineering design report (inclusive of design criteria) was developed by DRA. Table 18-2 is a summary of the haul road design parameters.
Table 18-2 Project haul road design parameters
|
Description |
Public roads/ore transport haul road |
|
Lane width |
3.5 m |
|
Shoulder width |
1.0 m |
|
Road width |
9.0 m |
|
Maximum design speed |
60 km/h |
|
Maximum gradient |
10% (1:10) |
|
Cross fall slope |
4.03 % (1:25) (recommended - 1 % to 4 %) |
|
Base and sub-base |
Selected graded material |
|
Surfacing |
Compacted gravel wearing course (no seal) |
|
Finished road level |
700 mm above natural ground level |
The following codes, standards and documentation were used for the overland haul road design:
- Technical recommendations for highways 17 - Geometric design of rural roads 1988 for South Africa
- GAUTRANS typical plans for road design
- Mining haul roads (Thompson, 2018)
- Ghana - "Mineral and Mining (Health, Safety and Technical) Regulations, 2012 (L.I.2181)"
- Ghana - "Minerals and Mining Act (Act 703 of 2006).
Figure 18-7 confirms the typical haul road cross section.
Figure 18-7 Typical haul road cross section
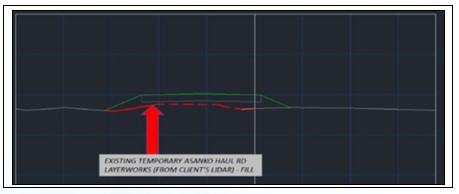
|
Asanko Gold Inc. NI 43-101 Technical Report on Asanko Gold Mine, Ghana |
The scope of the haul road upgrade was developed by DRA in conjunction with Phoenix. The Phoenix report identifies the potential operating cost savings associated with specific elements of scope. The proposed improvements to the haul road profile are shown in Figure 18-8.
Figure 18-8 Proposed improvements to the haul road profile
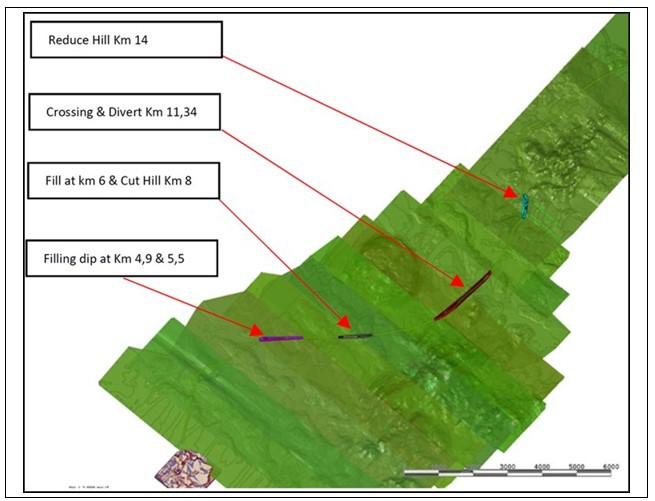
The LOM scope includes the listed enabling infrastructure:
-
Earthworks and engineered layer works
-
Stormwater drainage
-
Highway and feeder road crossings
-
Road signs
-
Pedestrian crossings
-
Security and access control.
Construction planning is based around completion of haul road works before the road is required to operate at full upgrade capacity. The construction timing is linked to the Esaase mining schedule (part of the overall LOM mining schedule).
Both the upgrade and on-going maintenance of the haul road whilst in operation will require careful planning and risk mitigation.
|
Asanko Gold Inc. NI 43-101 Technical Report on Asanko Gold Mine, Ghana |
18.10.4 Haul road optimisation
The LOM includes upgrading of the Esaase - Obotan haul road and an optimisation study to determine the haul truck fleet, cycle times and hauling rates on a fit for purpose basis. Further work is required to ensure that the loading configuration and machine selection matches haulage vehicle selection and that adequate load area is provided. Loading operations are critical to ensure that truck cycle times and thus the production schedule is met.
The following were identified as items to be investigated before full project implementation to ensure a fully optimised and effective load and haul operation:
- Haul road
- Further optimisation of the haul road to incorporate passing lanes and slip lanes for haul traffic from the Satellite Pits
- Updating of hydrological data and review of major river crossing designs to provide for ARI of 1:50
- Review of construction and maintenance philosophy and scheduling to de-risk hauling requirements
- Design of load and tip areas.
- Hauling operations
- Full study that will include haul, load and tip (including number of points) with options for truck and loader sizes and sensitivities for maximum haul speeds
- Extended hours hauling
- In-pit loading
- Night shift road maintenance
- Use of dust suppressants.
Optimisation endeavours may impact on environment and/or the SD plan and optimisation risk assessments will provide for that.
18.11 Buildings and facilities
18.11.1 Esaase camp upgrade
The Esaase camp refurbishment includes:
-
Improved internet connectivity in the camp
-
A small storage warehouse
-
A sewage treatment plant
-
A visitor's washroom and waiting shed at the camp entrance
-
Refurbishment of the wet mess, gym area and equipment
-
Two new housing units
-
A tennis court
-
Establishment of various office, laundry and mess containers, including civils and service connections
-
All fencing requirements to cover the extension of the camp.
18.11.2 Esaase miscellaneous services upgrade
The LOM scope for miscellaneous services includes:
-
A fire suppression system
-
A potable water treatment plant
-
A new core preparation, storage and cutting shed.
|
Asanko Gold Inc. NI 43-101 Technical Report on Asanko Gold Mine, Ghana |
18.12 Storm water management
18.12.1 General
The surface water management system will consist of two separate systems:
-
A clean water diversion system to control the run-off from the higher lying natural environment
-
A storm water system to capture the contaminated storm water from operational areas.
Water accumulated within the clean water system will be diverted around areas of disturbance and directed towards the natural watercourses.
Water accumulated in the dirty water system will either be harvested for use or routed through sediment control structures prior to discharge to the environment. Water will only be discharged to the environment if it meets EPA sector specific effluent guidelines for mining and is approved by the environmental manager.
The systems will consist of drains and channels (lined and unlined) linked to dams (lined and unlined) and sediment control ponds.
18.12.2 Drains and channels
This infrastructure includes interception berms, road drains, cut-off drains, and river training channels. It is the primary means of surface water management and performs the task of separating clean and dirty flows, as well as minimising risk to infrastructure and personnel by diverting flows away from critical points.
To allow efficient extraction of the mineral reserves, and reduce flood risk during extreme rainfall events, a section of the tributary stream draining an area to the southeast of the main pit will be trained between the main and south pits (through the Saddle Area). The channel will be trapezoidal in cross section with an impermeable liner to reduce groundwater influx /seepage into the pits and reduce hydrostatic pressure on the surrounding pit walls. The channel will be protected against erosion and damage. Energy dissipater structures will be constructed at the reintroduction of the channel to the natural watercourse to reduce erosion.
Construction of the channel will take place in Year 3 of operations. In order to achieve the required 100 m buffer between the Saddle tributary channel and the main pit, the Saddle diversion channel will be realigned over the south pit backfilled section and constructed with an impervious liner to limit ingress into the Esaase Main Pit.
18.12.3 Dams and sediment control structures
This infrastructure will include a network of water storage dams (ponds) and sediment control structures (sedimentation ponds), including:
-
ROM pad sediment control dam. This dam will collect surface run-off from the ROM pad and any accumulated stockpiles. Water will then be pumped to the Buffer dam. The total storage capacity of this dam is 2,700 m3 for the 1:20 year 24-hour storm captured from the ROM pad catchment area of 15,900 m2
-
Pit balancing dam. This dam will collect water from in-pit sumps and pit dewatering boreholes. The water collected will be used for mine dust suppression. The dam is sized to contain 8 hours of buffer storage for a pumped flow rate from the pit for the contained runoff from the average wettest month (June - 213 mm plus groundwater inflows) pumped out of 30 days. This equates to a total of 4,200 m3 storage capacity. The dam is configured to pump poor quality water to the Buffer dam, the arsenic water treatment plant, or high-quality water towards natural watercourses via the water treatment discharge pond
|
Asanko Gold Inc. NI 43-101 Technical Report on Asanko Gold Mine, Ghana |
- WRDF sediment control structures - these are constructed at various locations along the toe of the WRDF to collect surface water run-off from the benches of the WRDF. Storm water will be collected in channels on each bench and conveyed to down chutes located where the WRDF intersects natural ground. Run-off from the down chutes, as well as toe seepage channels will be conveyed to the WRDF sediment control structures and monitored to determine if it can be discharged or be retained within the water system, treated and then discharged.
The final sizing of collection dams is dependent on an updated water balance being available.
18.13 Potable water supply
Potable water demands for the Esaase mine services area (MSA) and camp are supplied by ground water boreholes.
There is basic water treatment infrastructure at the Esaase camp already in place. The LOM scope includes for this scope to be upgraded including installation of:
-
Potable water treatment plant including a pre-treatment water tank
-
Potable water storage facility with a two-day storage capacity of 150 m3 in the camp.
18.14 Sewage handing
Sewage is currently collected in tanks, then pumped to a contractor's truck and discharged at the Obotan sewage treatment plant.
The LOM scope includes a new sewage treatment plant (STP) and collection pipes for the Esaase camp. The MSA sewage will be pumped to the STP in the camp, where it will be treated. Treated effluent will meet the Ghanaian EPA discharge standards and discharged to the Bonte River. Only occasional de-sludging will be required on an annual basis.
18.15 Power
Power is supplied to Obotan and Esaase from two different generation sources and two different distribution systems.
18.15.1 Power supply - Obotan
Power to the existing Obotan plant is generated by the Volta River Authority (VRA) and transmitted from the Asawinso sub-station via a 161 kV overhead line, owned and operated by Ghana Grid Company Limited (GRIDCo). The capacity of the overhead line feeding the plant is 150 MW, which far exceeds the estimated power requirements for LOM. The LOM Study does not require new power supply scope.
18.15.2 Power supply - Esaase
Power to Esaase is supplied by ECG and transmitted from the ECG network via a 33 kV overhead line. The 33 kV distribution network is already in place throughout the Esaase mine. The LOM infrastructure scope includes additional transformers and distribution boards.
18.15.3 Estimated loads
The power requirements are shown below:
-
The maximum demand of the existing plant at Obotan is 18.8 MVA with an average consumption of 10 GWh per month. This is expected to remain stable over the LOM
-
The estimated maximum demand at Esaase is 213 kVA.
|
Asanko Gold Inc. NI 43-101 Technical Report on Asanko Gold Mine, Ghana |
18.16 Fuel
Diesel is supplied by road from Takoradi and stored at existing fuel farms at both Nkran and Esaase. The fuel farms are operated by the fuel transport contractor, Zen Petroleum. LOM storage volumes are shown below.
Table 18-3 LOM fuel volumes
|
Area |
Total volume (litre) |
Max daily usage (ℓ/d) |
Max storage (days) |
|
Obotan |
420,000 |
101,750 |
4 |
|
Esaase |
700,000 |
177,500 |
4 |
|
Total |
1,120,000 |
279,250 |
8 |
The LOM plan provides for storage volume at Esaase to be increased from 350,000 ℓ to 700,000 ℓ in line with the production schedule.
18.17 Re-settlements
The LOM plan includes the potential resettlement of affected dwellings as well as other structures at the Esaase-Manhyia village which is located within the ultimate 500 m buffer zone of the Esaase Main Pit.
A resettlement agreement with the affected community has not been put in place as yet and is the next anticipated step in the resettlement process. The relocation cost estimate was based on the as built Nkran resettlement cost as well as the Tetrem Village resettlement estimates.
 |
Asanko Gold Inc. NI 43-101 Technical Report on Asanko Gold Mine, Ghana |
19 MARKET STUDIES AND CONTRACTS
19.1 Introduction
The major commodity produced at AGM is gold, which is widely and freely traded on the international market with known and instantly accessible pricing information.
19.2 Marketing strategy
The marketing approach for LOM gold production is the same as that used for AGM production since commercial production commenced in Q1 2016.
The three key elements of marketing strategy are as listed. Gold, as doré bar, is:
-
Transported from the mine via Accra to Rand Refinery (Pty) Ltd (Rand Refinery) in Johannesburg, South Africa. The transportation of the gold bar is the responsibility of the refining contractor
-
Refined at Rand Refinery under a refining contact
-
Sold to the original project lenders under an off-take agreement.
19.3 Marketing contracts
19.3.1 Refining contract
The gold refining industry is competitive with several gold refineries in South Africa, India, Switzerland and several other countries that have the capacity to refine gold from AGM.
AGM currently refines all doré bars produced at Rand Refinery under a two-year contract that commenced on 1 August 2019. The contract was awarded to Rand Refinery after an open tender on competitive terms.
The contract specifies a standard refining charge. This charge is credited for payables (e.g. silver content of the doré) and debited for any deleterious content (e.g. arsenic) in accordance with specific terms in the contract.
19.3.2 Off-take agreement
AGM has an off-take agreement to sell 100% of the future gold production up to a maximum of 2.2 Moz to the original project lender, Exp T2 Ltd ("Red Kite"). Assuming production as per the LOM plan, AGM will have satisfied its obligations under the offtake agreement in approximately Q3 2025 (Table 19-1). Arrangements for sale of production after this time will be reviewed as required.
Table 19-1 Off-take agreement capacity analysis
|
Component |
Capacity (koz) |
|
Off-take agreement capacity |
2,200 |
|
less: Expected production sold under agreement to 31 December 2019 |
(839) |
|
less: LOM production expected from 1 January 2020 to Q3 2025 |
(1,361) |
|
Balance of off-take capacity at end of Q3 2025 |
nil |
19.4 Pricing
The off-take agreement specifies that the buyer can nominate the purchase price, being either the London Gold Market AM fixing price as publish by the London Bullion Market Association or London Gold Market PM price or Comex (first position) settlement price during the nine-day quotation period following shipment from site. In practice, the buyer nominates the lowest of the spot prices during that period as the purchase price.
|
Asanko Gold Inc. NI 43-101 Technical Report on Asanko Gold Mine, Ghana |
19.4.1 Payment terms
Under the off-take agreement, the buyer pays for 100% of the value of the gold nine business days after shipment from the mine.
A provisional payment of 90% of the estimated value is made within one business day after receipt of the gold credits by the buyer, which is typically 3 or 4 business days after shipment from the mine.
19.4.2 Gold price forecast
A realised gold price of US$1,400/oz was used as the gold price for economic evaluation, for this Technical Report. The applied price is considered as a prudent view, based on the average broker median gold prices over the longer term.
19.5 Product specification
The product specification is defined in the refining contract
19.6 Shipping, storage and distribution
Transport of doré bars from mines across Africa to refineries in South Africa and elsewhere is a relatively common occurrence. For the AGM mine, transport of doré bars from AGM is the responsibility of the refinery. The doré bar is transported from the mine site via helicopter.
19.7 Qualified Person opinion on gold price applied
A realised gold price of US$1,400/oz was used as the gold price for economic evaluation. EY considers this price prudent for the Technical Report.
|
Asanko Gold Inc. NI 43-101 Technical Report on Asanko Gold Mine, Ghana |
20 ENVIRONMENTAL STUDIES, PERMITTING & SOCIAL/ COMMUNITY IMPACT
This section provides an overview of the environmental legislation and guidelines applicable to the AGM, summarises the permitting process and provides an overview of stakeholder engagement conducted in respect of the Project.
20.1 Ghanaian legislation and guidelines
20.1.1 Environmental and social
The key environmental and social legislation in Ghana is the Environmental Protection Agency Act 1994 (Act 490) and the Environmental Assessment Regulations 1999 (LI 1652). The Environmental Protection Agency (EPA) is the regulatory body that administers these laws.
The Environmental Protection Agency Act 1994 (Act 490) establishes Ghana's EPA and defines the functions of the EPA, including, but not limited to the following:
-
Prescribing standards and guidelines relating to the pollution of air, water and land
-
Ensuring compliance with environmental impact assessment procedures in the planning and execution of development projects
-
Any undertaking that has the potential to have an adverse impact on the environment can be required by the EPA to submit an environmental impact statement (EIS) under Part II of the Environmental Protection Agency Act 1994 (Act 490). The EIS covers both the biophysical and the socio-economic aspects and impacts of the project.
The Environmental Assessment Regulations 1999 (LI 1652) support the Environmental Protection Agency Act 1994 (Act 490) and describe the process of environmental assessment in Ghana.
Submission of an EIS is mandatory for any mining project where the mining lease covers a total area in excess of 10 hectares (25 acres). The regulations outline the environmental and social aspects that must be addressed in an EIS. This includes addressing the possible direct and indirect environmental impacts of the proposed undertaking during pre-construction, construction, operation, decommissioning (i.e., mine closure) and post-decommissioning phases.
An environmental scoping report must be prepared and approved by the EPA prior to submitting an EIS. The purpose of the scoping document is to determine an agreed scope of works for the EIS and must include a draft terms of reference.
The regulations also prescribe a number of activities that must be carried out once an Environmental Permit is obtained; these include:
-
Submit, and have approved, an environmental management plan (EMP) within 18 months of commencement of operations and thereafter every 3 years
-
Submit an annual Environmental report 12 months after the commencement of operation and every 12 months thereafter
-
Obtain an Environmental Certificate from the EPA within 24 months of commencement of operations
-
Mining businesses are required to submit closure plans to the EPA and obliged to post reclamation bonds. The Environmental Protection Agency Act, 1994 (Act 490) and the Environmental Assessment Regulations, 1999 (LI 1652) also contain provisions for community engagement
-
The Water Resources Commission Act, 1996 (Act 522) and the subsequent Water Use Regulations, 2001 (LI 1692) govern the abstraction, impoundment, and discharge of water.
20.1.2 Minerals and mining
Six Minerals and Mining Legislative Instruments (LIs) were promulgated in 2012 to govern mining operations in Ghana. These are:
|
Asanko Gold Inc. NI 43-101 Technical Report on Asanko Gold Mine, Ghana |
1) Minerals and Mining (General) Regulations 2012
2) Minerals and Mining (Licensing) Regulations 2012
3) Minerals and Mining (Support Services) Regulations 2012
4) Minerals and Mining (Compensation and Resettlement) Regulations 2012
5) Minerals and Mining (Explosives) Regulations, 2012
6) Minerals and Mining (HSLP and Technical Regulations 2012.
The Minerals Commission is the principal regulatory body that administers these laws. It was established under the Minerals Commission Act, 1993 (Act 450) for the "regulation and management of the utilisation of the mineral resources (of Ghana) and the co-ordination of policies in relation to them".
The Minerals and Mining Act, 2006 (Act 703) aims to:
- Develop a national policy on mining and consolidate the disparate laws on mining in force prior to 2006
- Increase investment by foreign mining companies in Ghana.
- Remove the uncertainty concerning the availability and conditionality of mining rights as well as the bureaucratic gridlock
- This Act requires that an application for a mineral right (e.g., mining lease) be accompanied by a statement providing:
- Particulars of the financial and technical resources available to the applicant
- An estimate of the amount of money proposed to be spent on the operations
- The proposed program of mineral operations
- A detailed program with respect to the employment and training of Ghanaians.
Once granted, the holder of a mining lease must notify the Minister Lands and Natural Resources, who is the sector minister, of amendments the holder intends to make to the program of mining operation. Under Section 72 of the Minerals and Mining Act, 2006 (Act 703) the holder of a mineral right must have due regard to the effects of mineral operations on the environment and must take whatever steps necessary to prevent pollution of the environment as a result of mineral operations.
The Minister may, as part of a mining lease, enter into a Stability Agreement with the holder of the mining lease to ensure that the holder will not, for a period of up to 15 years, be adversely affected by a new enactment, changes to an enactment, or be adversely affected by subsequent changes to the level of, and payment of, royalties, taxes, customs or other related duties. The Stability Agreement becomes effective upon ratification by Ghana's Parliament.
Where the proposed investment to be made by the mining company will exceed US$500 million, the Minister may, on the advice of the Minerals Commission, enter into a development agreement under the mining lease.
The development agreement may contain provisions relating to:
- The mineral right or operations to be conducted under the mining lease
- The circumstance or manner in which the Minister will exercise discretion conferred by, or under, the Minerals and Mining Act, 2006 (Act 703)
- Stability terms under a Stability Agreement
- Environmental management expectations and obligations of the holder to safeguard the environment in accordance with the Minerals and Mining Act 2006, or another enactment
- Settlement of disputes.
The development agreement is also subject to the country's Parliamentary ratification in order to make it effective.
The Minerals and Mining (health, safety and technical) regulations provide mining, health, safety and environmental requirements that must be met by a mining lease holder.
|
Asanko Gold Inc. NI 43-101 Technical Report on Asanko Gold Mine, Ghana |
20.1.3 Compensation
Acquisition and access to land in Ghana for development activities, including mining, may be undertaken either through the State's power of eminent domain, or by private treaty. The taking of land requires the payment of due compensation. The regulatory oversight of private sector land acquisition and resettlement related to mining activities and actions is governed by the Constitution of Ghana and two legislative acts:
- The 1992 Constitution of Ghana ensures protection of private property and establishes requirements for resettlement in the event of displacement from State acquisition (Article 20, Section 1,2 and 3)
- The State Lands Act 1962 (Act 125) and its subsequent amendment, State Lands (Amendment) Act 2000 (Act 586), mandates compensation payment for displaced persons and sets procedures for public land acquisitions.
The Minerals and Mining Act, 2006 (Act 703) vests all mineral rights in land to the State and entitles landowners or occupiers to the right for compensation. Section 74 (1) requires compensation for:
- Deprivation of the use or a particular use of the natural surface of the land, or part of the land
- Loss of, or damage to immovable property
- In the case of land under cultivation, loss of earnings, or sustenance suffered by the owner, or lawful occupier, having due regard to the nature of their interest in the land
- Loss of expected income, depending on the nature of crops on the land and their life expectancy.
20.1.4 Health, safety and labour
The principal health, safety and labour laws applicable in the mining industry include:
- The Minerals and Mining Act, 2006 (Act 703)
- Workmen's Compensation Act, 1987 (PNDCL 187)
- Labour Act, 2003 (Act 651)
- Minerals and Mining (Health Safety and Technical) Regulations (LI 2182).
Provisions in the mining law state in part that a holder of a mineral right shall give preference in employment to citizens of Ghana "to the maximum extent possible and consistent with safety, efficiency and economy."
As with other sectors, a foreign employee in the mining sector needs a work and residence permit in order to work.
However, under the mining laws of Ghana, there are immigration quotas in respect of the approved number of expatriate personnel mining companies may employ.
20.2 Project permitting process
20.2.1 Obotan expansion project permitting process
Two key regulatory permits are required for development of the expanded Obotan gold mining and processing project in Ghana. These are:
- The mine operating permit (MOP) issued by the Minerals Commission
- The environmental permit issued by the EPA.
Following the required engagements, regulatory site visits, and submission of the relevant project details, the Obotan gold mine is currently operating under a MOP issued during November 2018. The MOP applies to the following licence areas:
- LVD 110. 299/2013 - Abirem
- LVD 21721/2012 located at Adubea
- LVD 21722/20 located at Abora
|
Asanko Gold Inc. NI 43-101 Technical Report on Asanko Gold Mine, Ghana |
- LVD 3969A/90 located at Esaase.
The environmental permit for the expanded Obotan gold mining and processing project was received in August 2019.
20.2.2 Minerals Commission permitting process
Asanko Gold (formerly known as Keegan) acquired the Esaase concession in 2006 and, under an exploration permit issued by the Minerals Commission, conducted an extensive geological survey and drilling program to define its mineral reserves.
Following completion of this work stream and preliminary establishment of a business case, a mining area application was submitted to the Minerals Commission in 2012 which defined the location of the proposed mine on the concession as well as locations of the pits, waster rock dumps and other related facilities.
The mining area application was approved by the Minerals Commission and a Temporary MOP issued that same year.
In 2014, further work was conducted to optimise the Project. The Minerals Commission was regularly updated on the Project and a formal application was submitted to the Minerals Commission in December 2016 which led to issuance of the permanent MOP for the Esaase concession in January 2017.
Updated MOPs were issued for the properties listed in Section 20.2.2 during November 2018 and are scheduled to expire on 31 December 2019, unless renewed.
20.2.3 EPA permitting process
The permitting process followed was as per the EPA approved EIA process, which is shown in Figure 20-1. In line with the Company's commitment towards utilising local resources and supporting local business, Asanko Gold appointed a Ghanaian environmental management consulting firm, the African Environmental Research & Consulting Company (AERC), to carry out the required work on its behalf.
The process commenced with formal consultations with the EPA on the proposed plan to develop the Esaase gold project followed by submission of an EIA application for the project which included its basic technical details.
In this regard, the EPA form EA2 application was filed with the EPA on 12 June 2015, for the proposed mining development at Esaase, as well as the 27 km long overland conveyor from Esaase to Obotan.
In line with the permitting process, the EPA responded to the EA2 submission by requesting Asanko Gold to conduct an EIA in respect of the proposal and submit an EIS in line with the requirements of their EIA procedures.
A Scoping Report, with draft terms of reference for the EIA, in respect of the proposed project proposal was prepared and subsequently submitted to the EPA in August 2015.
|
Asanko Gold Inc. NI 43-101 Technical Report on Asanko Gold Mine, Ghana |
Figure 20-1 EIA approach for the Esaase Project

Source: Asanko Gold, 2017
Following this, work was undertaken on the EIA which entailed:
-
Tour(s) by AERC to the project sites for familiarisation with pit locations, conditions, access and general relief of area
-
Technical meetings between Asanko Gold and AERC discuss and clarify the project scope as a basis for determining the spatial and time boundaries of the EIA assignment
-
Identification and review of all appropriate Ghanaian environmental, Mining and Allied Act, regulations, standards, conditions and guidelines
-
Field investigations comprising environmental, socio-economic and cultural surveys within the Project area of influence to determine existing baseline conditions
-
Development of an inventory of all proposed mine infrastructure within the vicinity of the Project area
-
Collection, sorting and review of company documentation relevant to the proposed undertaking, including concept descriptions, independent study reports, design drawings and maps, etc
-
Holding of consultations with all governmental (and non-governmental) institutions
-
Holding of consultations with traditional authorities and all impacted communities.
In line with the EPA's permitting process, the EPA held a Public Hearing on 19 April 2016 at Esaase to collate the views and opinions of all stakeholders, especially potentially impacted communities, on the project.
In attendance at that were:
|
Asanko Gold Inc. NI 43-101 Technical Report on Asanko Gold Mine, Ghana |
-
Officials of the EPA
-
Officials of Asanko Gold
-
Officials of AERC, Asanko Gold's environmental management consultants
-
A representative of the Asantehene, the King of the Ashanti Kingdom
-
The chiefs and members of all 12 communities within the catchment area of the proposed Esaase mining project as well as those along the overland conveyor corridor
-
The member of parliament for the area
-
The district chief executive and officials of the Amansie West district
-
A representative of the district chief of the Atwima Nwabiagya district assembly
-
Religious leaders from the communities
-
The media.
The ceremony was chaired by Dr. Richard Amankwah Kuffour, a lecturer of the University of Education (UEW), Winneba, Ghana.
The AGM general manager for operations, Mr. Charles Amoah, gave an overview of the project highlighting its impacts and the interventions to be implemented by the Company to mitigate these. He further enumerated the financial and socio-economic benefits of the Project to all stakeholders including the Government of Ghana and the local communities.
In an open forum, members of the community, as well as the chiefs of each of the 12 communities, publicly declared their support for the project and expressed their expectation that the expansion projects will create jobs for the youth in the community and also lead to socio-economic development of the catchment area.
The positive outcome of this key EIA activity (i.e. the public hearing) was pivotal to the permitting process and an account of the event formed an integral part of the Draft EIA developed in respect of the Project.
Select community members and chiefs at the EPA public hearing are shown in Figure 20-2 and Figure 20-3.
Figure 20-2 Community members at the EPA public hearing
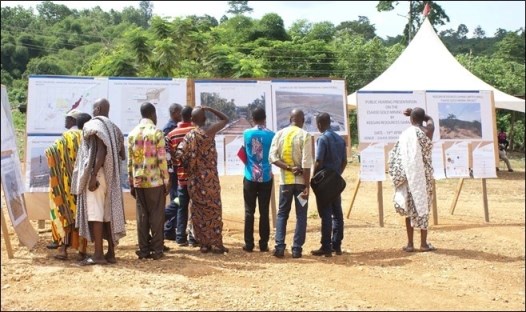
Source: Asanko Gold, 2016
|
Asanko Gold Inc. NI 43-101 Technical Report on Asanko Gold Mine, Ghana |
Figure 20-3 A cross section of chiefs and members of the community at the EPA public hearing

Source: Asanko Gold, 2016
The various findings of the respective EIA activities were subsequently compiled into the Draft Environmental Impact Statement (Draft EIS) which was submitted to the EPA as a sequel to the Scoping Report on 30 September 2016. The Draft EIS outlined the project description, its potential impacts and mitigations, proposed environmental monitoring action plans, provisional environmental management plans and reclamation and closure alternatives of relevance to the mining undertaking. A summary of the baseline studies conducted as part of this process is presented in Section 20.3 of this Technical Report.
The EPA reviewed the Draft EIS and reverted with their comments and queries as well as invoices for the permit processing fees. This effectively marked technical approval of the project by the EPA.
The Draft EIS was revised incorporating the EPA's comments with the final version being submitted to the EPA on 30 November 2016. Payment has also been effected in respect of the EPA's invoice and the environmental permit for the project is expected to be issued shortly.
An updated ESIA was prepared and submitted during 2017 to incorporate the temporary haul road and conveyor line associated with the Esaase development. This ESIA was approved and an environmental permit was issued for the expanded Obotan gold mining and processing project (permit received in August 2019). Asanko Gold is currently operating in terms of the approved EIS dated September 2017 and titled "Second Updated Environmental Impact Statement for The Expanded Obotan Mining Project".
Due to the changes associated with the 2019 LOM plan, the ESIA will need to be updated to reflect the revised mining schedule as well as the fact that the conveyor line will no longer be developed and only hauling of ore by road will take place.
20.3 Stakeholder engagement
20.3.1 Guiding principles of stakeholder engagement
Extensive interactions were held with various stakeholder groups including the government, regulatory authorities and, particularly, members of communities that will be impacted by the development of Esaase and the expansion projects.
These interactions were guided by Asanko Gold's principles of conducting stakeholder engagement in a way that is:
|
Asanko Gold Inc. NI 43-101 Technical Report on Asanko Gold Mine, Ghana |
-
Respectful and sensitive to local culture and societal norms
-
Transparent and honest in deliberations over issues of concern
-
Based on continuous engagement and keeping stakeholders updated, and their opinions sought, every step of the way
-
Aimed at building mutually beneficial long-term partnerships (Figure 20-4).
Further to these, the engagements followed the lines of free, prior and informed consent (FPIC) so as to ensure that, apart from legal and regulatory consent to the project, affected communities were fully informed about the project, its potential technical and socio-economic impacts on them, interventions to mitigate these impacts, among others, so the communities could make the decision on whether or not to allow the Project to be implemented on their land.
Figure 20-4 Asanko Gold's principles for stakeholder engagement

Source: Asanko Gold, 2016
20.3.2 Engagement with communities
The expanded Obotan Project include some 35 villages and some 134,764 inhabitants, based on the latest census information.
Formal consultations regarding various aspects of the AGM Obotan gold project have been conducted since 2011 through: (1) contact with various government ministries, departments and agencies, (2) on-going efforts by the Company to engage with, listen and educate Project-affected people in the Study Area, and (3) the formal EIA Scoping Process (including public hearing). AGM consistently engage with the Obotan catchment communities since the commencement of the Obotan project. However, in updating the previous EIS, these engagements were undertaken in conjunction with AERC along with desktop review of AGM current documents on stakeholder meetings. A summary of the stakeholder meetings held during 2018 is provided in Table 20-1.
|
Asanko Gold Inc. NI 43-101 Technical Report on Asanko Gold Mine, Ghana |
Table 20-1 Summary of meetings with local stakeholders
| Stakeholder group | Number of meetings held |
| Esaase and Tetrem project affected persons (PAP) and resettlement negotiation committee (RNC) members | 14 |
| Esaase/Obotan social responsibility forum meeting | 11 |
| Esaase - All other stakeholder meetings | 74 |
| CDC and entire community meetings (youth groups, women groups, religious groups, chiefs, farmers, etc) | 64 |
| Informal engagements | 40 |
| Community social responsibility (CSR) partners | 16 |
| Blast complainants | 5 |
| Media | 5 |
| District assembly meeting (DISEC, district functional staff, etc) | 3 |
| Community consultative committee (CCC) | 2 |
| Traditional authorities | 2 |
| Assembly and unit committee members | 2 |
| Religious leaders | 2 |
| Total | 240 |
Source: Asanko Gold, 2019
Principal engagement methods and venues to date have included:
-
Multi-stakeholder forums
-
Village level community liaison committees
-
Establishment of staffed community information centres (CIC) as an ongoing access point for village residents
-
Individual and focus group meetings
-
Open door policy at the project site offices.
A grievance management process was also instituted to ensure all community concerns were documented, reviewed, necessary actions taken, and timely feedback provided to affected community members.
The AGM further engaged additional community liaison officers to enhance the frequency and quality of interactions, particularly with the immediate communities, and also to build trusting relationships with stakeholders even before commencement of the Project.
A stakeholder engagement and Action Plan was developed, with broad stakeholder groups and committees established in the communities, to keep members of the communities fully updated on the project and to deepen their relationship with Asanko Gold, thereby building a strong linkage with the local population. This approach ensured effective information flow between the Company and the catchment communities and provided the platform for building strong and collaborative working relationships with project stakeholders.
|
Asanko Gold Inc. NI 43-101 Technical Report on Asanko Gold Mine, Ghana |
The composition of the committees and stakeholder groups that continue to be engaged, is shown in Table 20-2.
Table 20-2 Stakeholder groups and committee membership
|
No |
Stakeholder group |
Membership |
|
1 |
Community consultative committee (CCC) |
40 |
|
2 |
Traditional authority council |
30 |
|
2 |
Assemblymen and unit committee reps |
25 |
|
3 |
Women consultative committee (WCC) |
28 |
|
4 |
Asanko Gold community development committee (OCDC) |
50 (Community based) |
|
5 |
Crop rates review committee (CRRC) |
25 |
|
6 |
Youth associations |
Community based |
|
7 |
Resettlement negotiation committee |
17 |
|
8 |
District assembly and heads of government institutions |
15 |
|
9 |
Small scale miners and opinion leaders |
10 |
|
10 |
Religious clergies and imams |
25 |
|
11 |
Social responsibility forum (SRF) |
50 |
Source: Asanko Gold, 2017
The above stakeholder groups and committees met with the AGM's representatives on a monthly basis to either receive updates on the project, deliberate on matters of mutual concern, as well as to present their concerns and grievances with the aim of working with the Company to amicably resolve any issues or concerns. In 2018, AGM held 240 meetings with key local and regional stakeholders. AGM signed the Esaase Social Responsibility Forum Agreement (SRF) in Q4 2018. The Esaase SRF will provide a governance framework between Asanko Gold and local stakeholder groups for the management of stakeholder expectations and community development in the area. The implementation of the Esaase SRF commenced in 2019.
In guiding these stakeholder interactions, Asanko Gold developed a well-defined communications plan for the development of the expanded project with key discussion items as follows:
- Project development activities
- Planned mining activities and any associated changes
- Rehabilitation works and post-closure land use requirements of stakeholders
- Development of partnerships with stakeholders for community development
- Proposals for company sponsored livelihood and agricultural land improvement programs
- Determination and review of crop compensation and deprivation of land use rates
- Sustainable development and community assistance projects
- Social responsibility forum update.
20.3.3 Governmental stakeholders
On the governmental and regulatory side, engagement sessions were held with the various regulators and government departments to discuss the project (both technical and social aspects) with a view to obtaining the necessary regulatory consents and licences required to pave way for implementation.
To this end, the following governmental stakeholders were fully informed, their opinions and inputs sought and actively updated on the project with formal notifications, submissions and applications made as required. These were the:
- Ministry of Lands and Natural Resources
- Minerals Commission
- Inspectorate division of the Minerals Commission
- Ministry of Environment, Science, Technology and Innovation
- Environmental Protection Agency (EPA)
|
Asanko Gold Inc. NI 43-101 Technical Report on Asanko Gold Mine, Ghana |
- Water Resources Commission
- Forestry Commission
- Ashanti Regional Coordinating Council
- Amansie West district assembly
- Ministry of food and agriculture - Amansie West district
- Ghana Health service - Amansie West district
- Land Valuation Board - Ashanti region.
The relevant consents, regulatory permits and approvals have since been obtained from all the governmental and regulatory bodies.
20.3.4 Industry group stakeholder
Asanko Gold Ghana is a duly registered and active member of the Ghana Chamber of Mines, which is the umbrella body that represents the interests of mining companies in the country. The Chamber enhances collaboration among its members and plays an advocacy role for the industry in its engagement with the Government of Ghana on policy issues that impact mining in the country.
20.4 Environmental and social baseline
The Project area falls within the wet semi-equatorial climatic zone of Ghana. It is characterised by an annual double maxima rainfall pattern occurring from March to July and from September to mid-November. The movement of air masses, which differ in air moisture and relative stability rather than temperature, determines the climate of the Project Area.
The following is noted:
- Rainfall, temperature and wind speed has been discussed in Section 5.4
- Air quality. Generally, emissions into the atmosphere within the Obotan project area are localized resulting from anthropogenic activities such as logging, slash and burn farming activities, unauthorised mining activities (galamsey), domestic fires used for cooking, vehicular traffic, and dust emanating from the unsealed roads. Also, dust levels are generally higher during December to April due to exposure of the dust laden Harmattan winds, as compared with the southern air masses that bring cool and moist weather during the rainy seasons. The mass concentration values for Esaase obtained for total suspended particles or TSP (dust) for all the communities were below the EPA Guidance level of 150 micrograms per cubic metre of air (µg/m3) for residential areas. The value obtained at the Administration area was below the EPA guideline of 230 µg/m3 for industrial environment
The PM10 particulate levels obtained at the village camp, Nkran, Kurofofrom, Kyenkyenase and Besease were below Ghana EPA guideline of 70 µg/m3. The value obtained at the administration (barracks), Kwankyiabo and Abore were slightly above EPA guidelines
- Noise. The average daytime noise levels obtained at the communities within the vicinity of the concession sites were below the Ghana EPA guidance level of 55 dB for residential. The daytime noise levels ranged from 63.7 dB to 34.7 dB. Commercial activities, social activities, vehicular movements and noise from animals are mostly the sources of noise generation. The night time noise levels are mostly below the EPA guidance level of 48 dB. Noise generated from mining activities in the Project area is derived from plant and heavy equipment operations as well as hard rock drilling and blasting within the active pits and waste dumps area
|
Asanko Gold Inc. NI 43-101 Technical Report on Asanko Gold Mine, Ghana |
- Ground water. The primary geologic units that transmit groundwater (i.e., aquifer) in the study area include: (1) alluvium - unconsolidated deposits of clay, silt, sand, and gravel along the primary drainages; (2) transition zone or saprock - located between weathered saprolite and fresh bedrock; and (3) fresh bedrock - unweathered bedrock consisting of sedimentary and metasedimentary rocks. The saprolite unit is weathered bedrock comprised of clay, silt and sand, and is up to about 20 m thick. Saprolite has low permeability and is not considered an aquifer. Alluvium is of limited extent and generally is up to 5 m thick in the drainage bottoms, with the exception of the Saddle Area, where approximately 35 m of gravel was encountered. Many areas of alluvium have been reworked along the Bonte-Gyeni River valley bottom due to alluvial mining activities. The Transition zone (saprock) typically is present between depths of about 20 m to 50 m below ground surface. Saprock is the primary aquifer in the Project area that supplies water to community wells (i.e. hand pump wells).
Surface water
The Esaase resource area is located in the headwaters of the Bonte River, which becomes the Gyeni River before joining the much larger Offin River that drains from the southwest. The Bonte-Gyeni River system has a total catchment area of about 128 km2, and the Offin River has a catchment area of approximately 3,475 km2 where the Bonte-Gyeni River joins the Offin River. The Bonte-Gyeni River joins the Offin River about 600 m downstream of the old pump station, which was the location of previous water abstraction to support previous alluvial mining in the Bonte-Gyeni River valley.
The local communities rely primarily on community boreholes for their water supplies, while surface water is used on a limited basis for washing needs. Flow in the Bonte-Gyeni River system is largely dependent on local seasonal rainfall, with very little or no dry season baseflow.
Previous small-scale alluvial mining and on-going galamsey mining along the main Bonte-Gyeni River valley bottom has created depressions (ponds) in the topography. While these disturbances cause erosion and increased sediment load to the Bonte-Gyeni River system, many of the ponds also trap and settle suspended sediment in the river system.
The primary catchment associated with the Obotan area are Adubia and the Dwiri which has the Twiwa as its main tributary. Smaller stream and associated catchments are also present. The Dwiri has a catchment area of 29.3 km2 of which 82% is found on the concession. The sub-catchment of its main tributary, the Twiwa, is 10.5 km. The two streams are 6.5 km and 5.5 km long respectively. The Obotan mining project activities and facilities are located within the Adubea catchment.
The Bonte River flow is gauged at the Mpatoam Weir, located close to the downstream boundary of the Esaase Concession, near where the river enters the Jeni Concession. a staff gauge was installed on the lower Gyeni River at the Adobewora Bridge. AGM conducts daily water level measurements and monthly flow gauging at this site to develop a rating curve for water level height versus flow rate. Two staff gauges were installed on the Offin River at the old pump station (catchment area of 3,347 km2) in April 2010; one staff gauge is for low flows and the other gauge is for high flows. Water levels at the gauges are visually measured and recorded daily and flow gauging conducted monthly. Flow in the Bonte-Gyeni River is largely dependent on local seasonal rainfall, with very little dry season baseflow.
Water quality
Surface water quality baseline monitoring commenced in March 2009 at Esaase with 14 monitoring sites and subsequently reviewed up to 31 sites, most of which are located on the Bonte-Gyeni River and its tributaries. Quarterly samples submitted to the certified laboratory are analysed for many constituents within the categories of physical parameters, common ions, nutrients, and metals (total and dissolved). Surface water quality is generally consistent throughout the study area, including the Bonte-Gyeni River system and the Offin River. Mean electrical conductivity (EC) is approximately 0.25 milliSiemens per cm (mS/cm). Total dissolved solids (TDS) is generally higher in the Bonte-Gyeni River system (mean of 198 mg/ℓ) than for the Offin River (mean of 145 mg/ℓ). Mean pH for surface water samples is 7.2, and mean alkalinity is about 85 mg/ℓ. Sulphate in surface water samples ranges from 1 to 110 mg/ℓ, with a mean of approximately 7.7 mg/ℓ; and the mean value for chloride is approximately 15.62 mg/ℓ.
|
Asanko Gold Inc. NI 43-101 Technical Report on Asanko Gold Mine, Ghana |
Surface water in the study area is characterised by high turbidity and total suspended sediment (TSS) during significant rain events. Turbidity values have been in the range of less than 1 to greater than 1,000 nephelometric turbidity units (NTU), and TSS is from 1 to 30,200 mg/ℓ. The median TSS value for all surface water samples is approximately 292 mg/ℓ. The high turbidity and TSS values are primarily a result of erosion of disturbed areas associated with small-scale mining in the Gyetwi and Gyeni river valleys and galamsey mining activities along the Bonte-Gyeni River valley bottom. Erosion from farming, settlements, and AGM's exploration activities are lesser contributors.
AGM started monitoring water quality in the and around the Obotan concession in 2011 as part of the baseline data for the Obotan Project, although regional data earlier than this time is also available. Approximately 27 surface water sampling sites and 17 ground water sampling sites are sampled on different frequencies as per the monitoring programme. Eight of the ground water samples are collected from community supply holes. For the Obotan area the pH of the surface water samples ranged from 5.60 at the Nkran Pit Pipeline to 7.7 at SCS 02. The mean pH for the surface water is 6.38. The waters are slightly acidic. Seven of the surface water locations met the lowest best applicable industry standards (BAIS) limit of 6.0, giving a compliance of 78% for pH. Two locations, EduPT and NPPL, were not compliant in terms of pH. Iron concentrations ranged between 0.066 mg/ℓ (AduUP) and 10.61 mg/ℓ (AduGaKm). Manganese (Mn) levels ranged from 0.068 mg/ℓ (AduUP) to 0.868 mg/ℓ (SCS 04). Two locations exceeded the BAIS for Mn (0.4 mg/ℓ), giving 78% compliance. With the exception of two locations- SW 10 and OffinKg - all locations recorded Zn levels that were below detection limits of 0.002 mg/ℓ. The levels of Cu, Pb, Cd and Hg were generally very low in all samples and all locations recorded concentrations that were below the detection limits of 0.002 mg/ℓ and hence below the respective BAIS. Thus, 100% compliance was achieved for Cu, Pb, Cd and Hg at all locations. Arsenic concentrations in the Bonte-Gyeni River system are in the range of less than 0.001 to 0.424 mg/ℓ (total) and 0.374 mg/ℓ (dissolved). Arsenic ranges from 0.001 to 0.424 mg/ℓ (total) and from less than 0.001 to 0.374 mg/ℓ (dissolved) in the Offin River.
The pH of the community borehole samples ranged from 4.54 (AbCB) to 7.16 (NCB). The pH of the monitoring borehole samples ranged from 5.02 (OEMB 04) to 6.69 (OEMB 07). Four out of a total of nine monitoring borehole locations did not meet the lowest GEPA MPL of 6.0, giving a compliance percentage of 56% for pH. The waters range from being acidic to slightly acidic.
Flora and fauna
The AGM is located in the moist semi-deciduous vegetation zone, a region within the high forest area of Ghana with vegetation characterized by both evergreen and semi-deciduous trees in a vertically stratified multi-storey forest.
A total of 240 vascular plant species belonging to 164 genera and 62 families were recorded in the study area. The Leguminosae family, (including the three subfamilies of Caesalpinoideae, Mimosoideae and Papilionoideae) was the most species rich family with 45 species recorded. The remaining with 10 or more species are as follows: Euphorbiaceae (15), Rubiaceae (18), Apocynaceae (12), Graminae (12) and Moraceae (13). In contrast, 12 families had only one species record. Alchornea cordifolia has the highest frequency of distribution and was recorded in all the samples. Eight other species of high frequency of distribution are Albizia zygia, Chromolaena odorata, Funtumia Africana, Millettia zechiana, Secamone afzelii, Sterculia tragacantha, Griffonia simplicifolia and Baphia nitida were recorded in 80% or more of the samples enumerated.
A total of 142 species of birds from 43 avian families were recorded from the four study sites. The highest number of 100 species was recorded in Abore concession followed by the Adubia concession with 90 species.
A total of 16 amphibian species comprising 10 genera of anurans were recorded. The Chao 2 and Jackknife 1 richness estimators predicted 16 (± 1) and 18(± 1) species of amphibians respectively to occur throughout the study sites. This means the sampling was nearly complete as 84% to 94% of all the amphibian species occurring in the study sites were recorded.
|
Asanko Gold Inc. NI 43-101 Technical Report on Asanko Gold Mine, Ghana |
Abore and Adubia study sites both recorded a high of ten species each followed by Nkran site with eight species. Two of the species recorded; Maxwell's Duiker and the Black Duiker are both listed as Near Threatened (lower risk), on the IUCN Red List of Threatened species whereas one species, Demidoff's galago, is listed on Schedule I of the Wildlife Conservation Regulation (WCR) as wholly protected in Ghana. Small mammal species richness and abundance at the study area, in general, was low. A total of fifteen (15) fish specimen were found in the two sampling locations i.e., ADP and NKP. These specimens were classed into two species (Oreochromis niloticus and Tilapia zillii) all belonging to one family (Cichlidae).
The aquatic flora and benthic studies were undertaken at the same stations. Thirty-five sampling stations were sampled; however, five out of the 35 were not sampled as they were dry at the time of the study. For the estimation of benthic fauna occurrence, composition, density, diversity, richness and evenness of the area, a total of 18 stations were selected out of the remaining 30 stations. Some of the species found were Digitaria horizontalis, Cyperus distans, Scleria verucosa, Acroceras zizaniodes, Fuirena umbellate, Poligonium lanigerum, among others.
Soils
The soils of the Esaase study area belong to five major soil associations namely; Nzima-Bekwai/Oda, Mim-Oda, Kobeda/Amuni/Bekwai, Birim/Awaham-Chichiwere and Nyanao-Opimo (Adu, 1992).
The topsoils are medium textured whereas the sub soils grades from medium to heavy textured. Bulk density of topsoils range from 1.1-1.6 mg/cm3 compared to a range of 1.5-1.9 mg/cm3 for the subsoils. Root penetration is therefore not affected as far as bulk density is concerned, and this is manifested in the visual observation and interpretation of roots in the various horizons of the soils. Topsoil aggregate stability ranged from 2.2-6.9 mm in Nzima series, and 5.7-6.3 mm in Bekwai series. Mim, Opimo and Kokofu series recorded between 3.4-8.0 mm in their topsoil. Sub soil aggregate stability for Nzima series range from 2.5-8.9 mm and 2.8-7.8 mm in Bekwai series. Mim, Opimo and Kokofu series recorded 2.7-8.7 mm in their sub soils. The soils of the Obotan area fall within the Bekwai and Nzema Oda classification. The soils of the Bekwai series are found on the summits and some upper slope sites of the hills of the area. They are generally deep to very deep (over 20 cm), humus, well drained, red in colour, loam to clay loam, gravelly and concretionary, with well-developed sub angular blocky structure and clay cutans within sub-soils. The soils are acidic throughout the profile. The soils of the Nzema Oda series are heavy-textured soils developed on alluvial deposits along streams of the area. The soils are poorly drained and are subjected to flooding during the wet seasons and are greyish in colour with prominent yellowish orange mottles. The soils are deep, acidic with clay loam to clay textures but are structureless in the sub-soils. Few quartz gravels and stones may be encountered at the base of the profile.
Archaeological survey
The study area evaluated for cultural and archaeological resources covered all six concessions directly associated with or adjoining the Project, namely the Esaase, Jeni River, Mpatoam, Mepom, Dawohodo and Sky Gold concessions. Archaeological sites and other cultural resources surveyed include historic gold mining areas, historic sites and/or settlements, shrines, and cemeteries. The survey identified 48 sites of cultural significance. Of the 48 sites identified, 28 are prehistoric and historic, including sites of religious significance. Historic gold mining sites are often characterised by numerous pits on average about 1+ m in size (referred to locally as nkron). Some of these areas are also characterised by house ruins and other evidence of historic settlement.
For the remaining concessions including the Obotan resource area a survey was undertaken in 2012. At the end of the field survey, 37 physical cultural resource sites were identified within the study area. Of the 37 sites identified, four are old cemeteries; 11 are present-day or active cemeteries; eight are present-day shrines; three are ancient gold mining sites; nine are historic archaeological sites; and one is a historic archaeological site and a present-day cemetery. The shrine sites are of religious significance as they are connected to the world-view or belief system of the communities who own them.
|
Asanko Gold Inc. NI 43-101 Technical Report on Asanko Gold Mine, Ghana |
Socio-economic environment
The area has many ethnic groups. Apart from the indigenous Ashanti people who constitute about 80% of the population, the remaining is a mixture of Northerners, Ewes, Gas, Krobos and other tribes. The major driving force for the immigrants was the search for farmlands and galamsey work.
The major land uses are farming, mining and residential facilities. Land is solely owned by the Traditional Authorities and families. Farming and small-scale illegal mining (galamsey) remain basic sources of employment and income in the communities. Major food crops grown in these communities are plantain, cassava and maize. Major vegetables grown are pepper, okro, tomatoes and garden eggs. Farm animals include cows, poultry, sheep, goats and pigs. The major cash crops include cocoa and palm oil.
The educational institutions for the communities within the project footprint comprise of kindergarten (KG), primary (P), junior high schools (JHS) and a senior high school (SHS).
The following health facilities serve the health needs of the fives zones of communities within the project footprint: Manso Nkran CHPS Compound popularly referred to as the Obotan clinic, Keniago health centre, Manso Adubia health centre and Manso Abore health centre. The closest hospital in the area is St Martin's hospital at Agroyesum; it plays a very important role in health care delivery in the area. One local clinic, the Catholic health services mother of God clinic (MOG) located in Esaase, provides basic health care services to communities within the study area. The MOG sees approximately 1,000 patients per month. A small private maternity clinic is located in Mpatoam. This clinic reportedly sees several hundred patients per month.
In 2018 AGM implemented the three-year program with Health Partners International Canada (HPIC) focused on maternal and child health within the Amansie West and South districts. The plan included the training of a number of health personnel in pharmaceutical supply chain management and the renovation of a centralized distribution centre at the district health directorate.
The major sources of drinking water are boreholes fitted with hand pumps. Most of the communities are battling with maintenance of their boreholes and most of them complain of inadequate water supply.
20.5 Environmental and social impacts identified
Environmental and social impacts associated with the establishment and operation of the Obotan Mine was assessed in the 2013 ESIA and subsequent addendums to the ESIA. The impacts associated with Phase 1 are discussed below.
Dust and noise
Past air quality and noise modelling as well as monitoring information indicate that the project is resulting in dust and noise impacts, with exceedances identified in some areas. The PM10 particulate levels obtained at the village (camp), Nkran, Kurofofrom, Kyenkyenase and Besease were below Ghana EPA guideline of 70 μg/m3. The value obtained at the administration (barracks), Kwankyiabo and Abore were slightly above EPA guidelines. The dust generation from human and vehicular movement, vehicular emissions and biomass burning for cooking and farm preparations are the major contributors to ambient dust levels in the communities. The illegal gold mining (galamsey) activities mostly carried out in the immediate terrestrial environment to the communities could also be a source of increased dust levels. AGM is implementing additional mitigation measures to ensure that dust and noise levels are within the adopted guidelines. These include increased watering of roads, dust suppression at materials handling areas, maintenance of the fleet and the use of berms and vegetation as noise barriers.
The project activities resulted in changes to surface water and groundwater quality and quantity. Changes in topography resulting from mining activities (open pit and WRDs), and construction of the TSFs, plant site, and other associated project facilities progressively modified watershed characteristics of some small, seasonal tributaries of the Bonte River. Tributary drainage lines that are affected by project infrastructure are ephemeral and contain water seasonally during the rainy season. Groundwater resources in the area are affected through open pit dewatering as well as seeps through the lined TSFs and WRDs.
|
Asanko Gold Inc. NI 43-101 Technical Report on Asanko Gold Mine, Ghana |
Project activities including site preparation activities of the various Project sites (starter pits, waste rock dumps, TSF, process water dam, processing plant, mine service area and accommodation upgrade) resulted in land clearing and associated erosion and potentially increase the level of suspended solids mainly in the Offin River and some of its tributaries. Impacts of the proposed project on the groundwater resources of the area is expected to be localised.
AGM is currently implementing the preventative approach to environmental management with the primary objective of avoiding negative environmental impacts from the operational activities, whilst maximising positive benefits. Where inevitable, AGM seeks to minimize such negative impacts through appropriate mitigation measures. This approach fulfils the aspirations of the corporate policy on the environment, environmental performance management systems, and various impact-specific environmental action plans.
The AGM environmental management system (EMS) is based on the International Standards Organization (ISO) 14001 (2004) standard. The standard incorporates the "Plan, do, check, and act" (PDCA) methodology which involves key activities as following:
- Plan: Establish the objectives and processes necessary to deliver results in accordance with the organization's environmental policy
- Do: Implement the processes
- Check: Monitor and measure processes against environmental policy, objectives, targets, legal and other requirements, and report the results
- Act: Take actions to continually improve performance of the environmental management system.
The EMP outlines anticipated mitigation measures to be developed to monitor environmental impacts associated with the Project. The EMP addresses the following aspects:
- Corporate commitment and HSE policies
- Environmental management structure
- Financial allocations
- Project overview
- Existing natural environment
- Existing socio-economic environment
- Environmental impacts and mitigation measures
- Environmental Action Plans
- Monitoring programme
- Reclamation and decommissioning
- Emergency response plan
- Auditing and review
- Community relations and resettlement.
|
Asanko Gold Inc. NI 43-101 Technical Report on Asanko Gold Mine, Ghana |
Dust impacts will be mitigated as follows:
-
Dust suppression will be carried out by water spraying at the process plant site and contractors' yard. The haul and public access roads will also be watered. Watering will be undertaken using the water bowsers that are part of the construction contractor's vehicle fleet. This measure should be sufficient to prevent the formation of high quantities of dust considered to be a nuisance to human health or vegetation. Bio-degradation dust suppressants (i.e. molasses) option will also be considered as part of the dust suppression measures
-
Specific measures have been taken to prevent over-speeding of vehicles when driving through or near communities on their way to the site as well as on the site itself
-
An automatic water sprinkler has been installed on the crusher and along the conveyor belts to suppress dust
-
Non-point sources of airborne particulate will be dust arising from movement of vehicles on access and haul roads and blasting activities. Water is sprinkled on the haul and access roads in regular intervals.
Noise from hauling of construction material will create a temporary and intermittent increase in road traffic and associated noise levels around the pits, waste rock dumps and the process plant site area. Noise suppression will be undertaken and employees are supplied with the required personal protective equipment. The measured peak particle velocity for blasting will be managed to not exceeds 0.8 mm/s at sensitive receptors.
Specific instructions have been issued to contractors to avoid as much as practicable transportation of material at night and over-speeding of vehicles when driving through or near communities.
Waste
The management of potentially acid generating (PAG) material is implemented to limit the effect on the receiving environment. The objective of the mine waste rock management plan is to ensure that mine waste rock and overburden, including mine facilities such as waste rock piles, tailings impoundment, open pits etc. are managed in a manner that eliminates offsite contamination, and leave the mine in a condition that brings about the least environmental and financial risk, and the most potentially useful land use, to future users.
The following management measures are used:
-
Early consultation with traditional landowners, community and regulators to identify and agree the next land use
-
LOM plans are routinely reviewed to ensure pit shell optimisation and, therefore minimise waste rock generation
-
Waste rock materials are classified to ensure optimal handling and management and enabling reuse of rock/soil materials as appropriate
-
Pit and waste dumps designed to optimise materials sequencing, handling, and movement i.e. where possible in the context of the LOM plans, rock materials are directly backfilled to completed pit voids
-
Where surface waste dumps are required, greenfield land-take is minimised wherever possible
-
Surface waste rock dumps are engineered
-
Oxide materials are demarcated to enable stockpiling for later reuse
-
Explore opportunities for beneficial reuse of waste rock materials i.e. blast hole stemming, road sheeting, TSF embankment construction, etc., to avoid unnecessary borrow pit creation.
The main objective is to suitably manage and dispose of wastes generated at the Obotan operations to ensure that waste is minimized, managed and disposed of in a way that does not compromise the health and safety of personnel, local communities, adversely impact on the environment and as well meet regulatory requirements.
The various type of waste identified, and the associated method of disposal are presented in Table 20-3.
|
Asanko Gold Inc. NI 43-101 Technical Report on Asanko Gold Mine, Ghana |
Table 20-3 Waste types and their management and disposal
|
Waste type |
Management and disposal |
|
Household and domestic waste |
This material is disposed of into a landfill designed for non-hazardous solid waste constructed on a well-drained and accessible site. |
|
Non-toxic industrial waste |
This category of waste includes heavy and light equipment tyres, worn metallic parts and fittings and packaging material for non-toxic products (plastics containers, papers, wood, etc.). Disposal of materials is considered only after all other options of reduction, reuse and recycling have been eliminated. Waste belonging to this category is buried in the non-hazardous solid waste landfill. |
|
Waste oils and oil filters |
Waste oil management is the responsibility of the fuel/oil supplier which ensures that used oils will be stored in 200 litre drums and sent to a recycling facility available in Ghana. Oil filters and other small oil containers will be collected separately, well drained and flattened and sent to a registered scrap dealer for recycling. |
|
Medical waste |
Waste at the small clinic will be segregated into office waste and nursing station waste. The latter include items such as swabs, tissues, bandages, capsule packaging and sharps (needles, scalpels, etc). Sharps waste (are placed in an approved safety container for recycling. The other waste is collected daily and placed in yellow plastic bags marked with black biohazard symbol. Container and bags are incinerated on a scheduled basis in a purpose-built incinerator. |
|
Hazardous industrial waste |
This category of waste consists of obsolete chemicals, assay laboratory waste, plastic liners and wooden crates. These wastes are stored in a designated safety area prior to collection by the accredited suppliers for proper disposal. |
|
Mining waste |
Waste rock from mining operations is placed in areas identified as suitable for the establishment of WRD facilities and are located in close proximity to the resource areas. Tailings material from the plant is deposited on the expanded TSF. Cyanide in the CIL tailings is detoxified using a three-phase hybrid cyanide destruction process. Weak acid dissociable cyanide (WAD) concentration is reduced in a single tank by means of SMBS and air. The SO2 /air process is used for cyanide destruction. |
Water
The surface water management system consists of a clean water diversion system to control the uncontaminated run-off from the higher lying natural environment, and a dirty storm water system to capture the contaminated storm water from plant, operational and processing areas. These operate as separate systems.
Water in the dirty water system is either harvested for use or routed through sediment control structures prior to discharge to the environment. Under normal circumstances as well as storm events that are within the design specification of the facilities, water only discharged to the environment if it meets EPA sector specific effluent guidelines for mining. No incidences of non-conformity with both the EPA and national or IFC standards were recorded in 2018.
The TSF and associated expansion has the following design characteristics associated with storm water management:
-
Storm water capacity: 1 in 100-year recurrence interval ,72-hour storm event
-
Emergency spillway: 1 in 100-year recurrence interval storm event.
A new water treatment plant will be provided as part of the Phase 2 expansion. The water treatment plant will be designed to treat water to a maximum dissolved arsenic level of 0.04 mg/ℓ, at a maximum throughput of 200 m3/h. Once the required contact time has elapsed, the solution will be allowed to settle, and the treated water will be decanted and released to the environment. Spent media will be dewatered and drummed, prior to disposal at the TSF.
20.6 Environmental and social monitoring
Monitoring information is assessed against the Ghana EPA guidelines (January 2001) and international best practice guidelines for the mining industry, including:
-
IFC Environmental, Health & Safety Guidelines - Mining (December 2007)
-
IFC Performance Standards on Social and Environmental Sustainability (July 2006)
-
"Equator Principles III" 2013
|
Asanko Gold Inc. NI 43-101 Technical Report on Asanko Gold Mine, Ghana |
- The Government of Ghana and EPA's Environmental Performance Rating and Disclosure Methodology for Mining Companies (AKOBEN Programme). AGM will be aiming to achieve Gold status under this programme.
AGM is monitoring and reporting on any environmental incidents that may occur on or offsite as a result of its operations. Environmental incidents are classified into five different levels of severity. Asanko Gold has not recorded any level three incidents (e.g. spills that have impact outside the mine boundary) or above in its corporate history. During 2018 AGM recorded 17 level two incidents, which included spills of effluents or pollutants within the boundary of the operation. AGM also recorded 22 level one incidents (i.e. very minor, localized incidents) in 2018. Asanko Gold did not incur any fines for environmental non-compliance in 2019.
Surface and groundwater
AGM maintains an extensive programme for the regular monitoring of surface and groundwater quality. Compliance sampling is conducted on a monthly basis and results are analysed externally to determine compliance with regulatory requirements. Control and reference sampling are typically conducted on a quarterly basis. As per International Cyanide Management Code (ICMC) requirements, weekly sampling is conducted at cyanide facility areas for free, WAD, and total cyanide levels. Pit water quality is also monitored on a monthly basis with additional monitoring conducted prior to any necessary discharges.
A total of 30 surface water locations, 18 environmental and 10 community boreholes are currently being monitored in the Obotan project area. The size of data for the operational period commencing January 2016 is small, hence no analysis has yet been undertaken.
Multiple locations within the TSF surrounds are monitored on a daily basis to enable detection of any potential discharges. Supernatant and seepage water within the TSF are monitored monthly. A number of piezometers have been installed on the embankments of the TSF to monitor pore pressure levels within the embankment structures. The piezometers are typically monitored monthly to enable observation of both seasonal and operational changes in water levels.
Surface water monitoring points required during construction, operation and closure for the Esaase Project include downstream of pits discharge points, waste rock dumps and stockpiles as well as locations around any other facility such as workshops and fuel bays. It is proposed that sampling downstream of pits and waste rock dumps is phased to align with mining development, operation and closure. Monitoring will continue for up to three years post closure. Sites with increased risk of exposure to adverse impacts of operations will be sampled more frequently than those with a low risk of exposure.
Field analyses will be undertaken for pH, conductivity, turbidity, TDS and dissolved oxygen on a weekly basis by Asanko Gold Ghana environmental staff. Monthly suite parameters will be sent to an independent laboratory. The prime purpose of weekly sampling is to determine if unknown changes are occurring that would need to be quickly rectified.
The following parameters are recommended for analysis at an independent laboratory. Surface water parameters upstream and downstream of the TSF, process plant, pits and waste rock dumps:
-
Physico-chemical: pH, dissolved oxygen (DO), conductivity, TDS, total suspended solids (TSS), apparent colour, true colour, turbidity, oil and grease, alkalinity and hardness (CaCO3)
-
Nutrients and other chemical analysis: sodium (Na), potassium (K), sulphate (S), chloride (Cl), nitrate (NO3-), nitrite (NO2-), phosphate (PO4), calcium (Ca), magnesium (Mg), chemical oxygen demand (COD), and biological oxygen demand (BOD)
-
Cyanide: free, WAD and total cyanide (CN)
-
Microbiological: total plate count for total coliforms and faecal coliforms
-
Metals (total or dissolved): Iron (Fe), manganese (Mn), copper (Cu), zinc (Zn) lead (Pb), mercury (Hg), chrome (Cr), nickel (Ni), arsenic (As), cadmium (Cd) aluminium (Al) and selenium (Se).
Potable water sources in all the communities monitored during the baseline groundwater was monitored on a monthly basis. Community potable water parameters that are monitored, have been discussed above.
|
Asanko Gold Inc. NI 43-101 Technical Report on Asanko Gold Mine, Ghana |
Comprehensive sediment was collected from beneath the surface water indirectly, using a remotely activated device (Eckman grab) as part of the baseline data gathering for the EIS in April 2012 and in March 2015. Sediment quality will be monitored during the development, operational and closure phases.
Dust and noise
Dust is managed in terms of a dust management plan and dust levels are monitored on-site and in the community via a series of monitoring stations including ten in the communities nearest to the mine. Stations are monitored fortnightly and the results submitted to the Ghanaian EPA. The monitoring stations also assess levels of nitrogen oxides and sulphur oxides (NOX and SOX). AGM did not report on its greenhouse gases (GHG) emissions for the 2018 reporting period. Noise monitoring is undertaken across a number of affected communities and is compared to the day and night time guidelines. Exceedances were recorded for the 2018 reporting period and an action plan is being implemented.
Aquatic environment
Appropriate drainage control measures to minimise soil erosion will be put in place during preparation of each site. These measures will include:
-
Construction of settling ponds at appropriate locations downstream of Project facilities such as the waste rock dumps, the process plant and the mine services area
-
Vetiver grass will be planted on the crests and slopes of waste rock dumps and on exposed surfaces to prevent sedimentation due to erosion
-
Land clearance will be progressive and as required for the development of a particular area
-
Drainage will be constructed to ensure effective drainage around the perimeter of the pits, haul roads and access roads
-
Early revegetation of disturbed areas will be undertaken as much as practicable using topsoil and/or subsoil stockpiled during the preparation phase
-
The vegetation and swamps along the various water courses (riparian flora) will be protected as much as possible.
Asanko Gold Ghana will ensure that all boreholes within the mine host communities will be maintained in good working condition. Further, Asanko Gold Ghana will prevent impact of its operation on the water quality of the area streams by ensuring that effluent discharges from operations meet the EPA sector specific effluent quality guidelines before they are discharged in the external environment. Management practices will be implemented to avoid or limit any occurrence of accidental spillages which may result in a deterioration of the aquatic environment.
Ecological environment
Although post mining land uses are likely to be agriculturally oriented, a terrestrial fauna survey will be undertaken during the closure phase to assess habitat regeneration as well as compliance with the reclamation and closure plan. Fresh water environment will be sampled on a biannual basis for the first two years of operations.
-
Land clearing will be progressive and as required for the development of a particular area. Any timber and wood resulting from clearing activities, will be properly managed
-
Asanko Gold Ghana will implement a land reclamation programme as part of its overall environmental management strategy and this will start at an early stage of the Project (erosion control procedures during construction period)
-
Topsoil and overburden will be appropriately stockpiled and later re-spread in order to assist vegetation establishment on waste rock dumps, TSF and other disturbed areas during operations as feasible and on closure.
A favourable condition will be created at the reclamation stage to allow fauna to return.
Acid rock drainage (ARD) monitoring
|
Asanko Gold Inc. NI 43-101 Technical Report on Asanko Gold Mine, Ghana |
Sampling and assessment of rock types/lithologies from the operations is carried out routinely to understand acid base accounting, rock mineralogy and potential for ARD development. Routine ARD monitoring is conducted in-house with additional analyses conducted by external laboratories, as required.
Tailing storage facility (TSF)
A monitoring programme for the TSF is currently in place to monitor for potential problems which may arise during operations. This programme will continue to be reviewed, evaluated, and updated as information becomes available and the facility performance is understood. Additional groundwater monitoring stations will be installed downstream of the TSF to support routine observation of water quality (WQ) and early detection of changes in groundwater quality, both during operation and after decommissioning. Two monitoring stations are required as a minimum for installation to the East and North or NE of the TSF.
Socio-economic
Community development is undertaken through the "Asanko Gold Opportunity Cycle" that provides a framework for leveraging our presence to meaningfully and beneficially impact our local community stakeholders. AGM established a set of criteria to guide our support of community development projects, which must meet one or more of the following criteria:
-
Project outcomes must make a material difference to members of our local communities
-
Initiatives must be owned by the community and sustainable after the mine life
-
Projects must be designed in such a manner as to maximize community participation and management post-completion
-
Projects must be aligned with the district development plans and not be duplicated.
AGM has formed a community consultative committee (CCC) which comprise of representatives from the mine, the district assembly, the ministry of food and agriculture, national disaster management organisation, district police, traditional councils, chiefs of all the communities, assemblymen and farmers groups. The committee assisted in putting in place a CSR agreement between the mine and the local mining communities including cost estimates to meet the agreement.
AGM monitors the outcomes of social development initiatives using the following metrics:
-
Employment
-
Local community development and investment
-
Land acquisition and resettlement
-
Vocational training
-
Complaints and grievances.
Various committees have been formed to draft and update the necessary policies and guidelines that bind the mines and its local communities in terms of goals and objectives to be achieved.
Selected monitoring indicators for social project are:
-
Increase in student enrolments in schools that the Company works with
-
Increase in the standard of education in the school the Company works with, measured by an increase in the students' examination results
-
The increase in employment of women through income generating projects
-
General increase in health through the provision of clean potable water and malaria prevention workshops in the community, measured by a decrease in attendances at local medical clinics
-
The purpose of monitoring and evaluation is to provide all stakeholders with timely, concise, indicative information on whether compensation, resettlement and other impact mitigation measures are in conformity with the objective to achieve sustainable restoration and improvement in the welfare of the affected people, or there is the need for some adjustments to be made. Thus, the monitoring and evaluation will, among other things, ensure that:
|
Asanko Gold Inc. NI 43-101 Technical Report on Asanko Gold Mine, Ghana |
- All the provisions presented in the RAP regarding compensation and resettlement are followed
- Provide for the timely release of funds for the RAP implementation and that funds are used for their intended purposes
- Monitor the progress of RAP implementation process
- Identify and track any problems resulting from the implementation
- Gather relevant information on the impact of the RAP on livelihoods of project affected persons and make modifications where necessary to the RAP implementation procedures.
|
Asanko Gold Inc. NI 43-101 Technical Report on Asanko Gold Mine, Ghana |
21 CAPITAL AND OPERATING COSTS
21.1 Capital costs
21.1.1 Capital cost summary
A capital cost summary is shown in Table 21-1.
Table 21-1 Capital estimate summary
|
Item |
Value (US$ M) |
|
Sustaining capital |
|
|
General plant sustaining capex |
26.7 |
|
TSF lifts |
57.3 |
|
Total sustaining capital |
84.0 |
|
Development capital |
|
|
Resettlement action plan |
38.7 |
|
Esaase haul road |
33.6 |
|
Esaase infrastructure (mining and non-mining) |
22.1 |
|
Mining (pre-production costs) |
10.8 |
|
Total development capital |
105.2 |
|
Closure costs |
60.2 |
|
Total capital |
249.3 |
The capital cost estimate excludes stripping costs of US$278.2 million. These costs are included as part of all-in sustaining costs (refer to Table 21-2).
21.1.2 Compilation of capital estimate
The detailed capital estimate is supported by a Basis of Estimate. The basis confirms the following:
- How the capital estimates were compiled
- Sources of input information
- Benchmarking and accuracy assessment for the capital estimate
- Exclusions, assumptions and qualifications.
Wood Mining South Africa (Pty) Ltd (Wood), DRA Projects (DRA) and Knight Piésold provided the estimating input.
21.1.3 Project Scope of Work
Overview
The Obotan plant commenced production in early 2016. The plant was erected close to the Nkran ore deposit and several satellite orebodies. It currently has a throughput capacity of 5.4 Mtpa ore.
In 2018, development of the Esaase ore body, situated 28 km away from the Obotan plant, commenced. Oxide ore is currently transported from Esaase to Obotan via a haul road at a maximum rate of 180 kt per month (~2.2 Mtpa). The balance of the ore is sourced from Nkran and the nearby satellite deposits.
Over time, the Nkran deposit will deplete and additional ore is proposed to be sourced from Esaase. The scope of this LOM Study provides for upgrade of the haul road to transport up to 5.4 Mtpa of 'Fresh' ore from Esaase to Obotan and the associated provision or upgrade of existing facilities at Esaase.
New infrastructure required
The new infrastructure required to support the LOM includes:
- Upgrades to the haul road to address the production increase to 5.4 Mtpa
|
Asanko Gold Inc. NI 43-101 Technical Report on Asanko Gold Mine, Ghana |
- Additional and brought forward lifts for the TSF at Obotan
- Minor upgrades at Esaase. These upgrades include:
- Potable and sewage water treatment plants, fire system, pollution control infrastructure, sediment control structures, camp upgrade, power distribution, public road diversion, river/public road crossings and pit dewatering wells
- Esaase pit water buffer dam
- Esaase RAP project which includes relocation of approximately 131 dwellings
- Water treatment plants (at both Obotan and Esaase).
Relatively little new infrastructure is required for the LOM as:
- Mining is currently undertaken at Nkran and Esaase
- Road haulage is currently used to transport up to 2.2 Mtpa ore from Esaase to the Obotan plant
- The Obotan plant currently processes ~5.4 Mtpa.
21.1.4 General qualifications
The base date for the capex estimate is Q4 2019 and the base currency is US dollars.
21.1.5 Estimating system and format
The detailed capital estimate was prepared using MS Excel 2016 format making use of a flat data base structure. The estimate was developed as a fully detailed estimate, together with a summary sheet. The detailed estimate includes a Work Breakdown Structure (WBS) which aligns to the estimate summary.
21.2 Operating costs
21.2.1 Operating philosophy
Cash operating costs are defined as the direct operating costs and includes contract mining and Owner's Team mining cost excluding capitalised stripping cost, ore transport and handling, processing and general and administrative (G&A).
The AGM is an operating entity and a significant proportion of the operating cost build-up used for the LOM Study is based on an existing cost data base. Where required, additional data was generated from first principles - utilising directly applicable project experience.
The operating costs for AGM include the following components:
- Mining - waste
- Mining - ore
- Ore transport and handling
- Processing cost
- G&A cost.
The LOM Study (addressed in Section 16.5) considers the optimisation of mining and metallurgical processing (via the Obotan process plant) at a throughput capacity of 5.4 Mtpa. Mining is completed in just over seven years, and as the plant is already producing, no ramp-up phase is included in the mine plan. Gold production is targeted at 220 to 250 koz/a.
A blending program will be followed throughout the LOM that considers grade-bins, ore-types and the Bond-work-index (BI). To manage mill throughput, the proportion of oxide in the feed is constrained to between 20-50% of the overall feed, and the average BWI limited to 13 kWh/t. Buffer stockpiles will include Oxide (OX), Transitional (TR) and Fresh (FR) material, located in close proximity to the primary crusher. An estimated 25% of the plant feed tonnage will be directly fed into the crusher, with the remaining 75% requiring re-handle using a front-end loader (CAT 992 or equivalent) and CAT 777D haul truck.
|
Asanko Gold Inc. NI 43-101 Technical Report on Asanko Gold Mine, Ghana |
The plant operates at capacity for most of the LOM except for half a year in 2025, when higher grade is being processed (thus meeting the gold production target with fewer processed tonnes).
The Nkran ore deposit is located within close proximity to the process plant at Obotan, whilst ore from Esaase (South and Main Pit), Akwasiso, Adubiaso, Abore and Asuadai is transported by haul road 28 km, 5 km, 5 km, 13.4 km and 14.2 km respectively. Oxide ore from Esaase is currently transported to Obotan at a maximum rate of 2.2 Mtpa. The scope of the LOM Study includes the upgrade of the road to facilitate the transport of up to 5.4 Mtpa Fresh ore from the Esaase pit.
A contractor mining approach is envisaged in the long term for Asanko Gold:
- PW Mining will complete both current operations at Nkran cut 2 and the remainder of their BCM contracts at Esaase (expected to be June 2020)
- Akwasiso will be mined by Rocksure from January 2020 until completed
- A tender process will commence in Q1 2020, aimed at achieving the best economic contractor approach from Q3 2020 (this may mean one or more contractors)
- The mining contracts are based on a wet rate - diesel being supplied by AGM from an on-site diesel farm at an agreed rate and charged back to the mining contractor
- Explosives are delivered and managed by an explosives contractor to different magazines and supplied on a "down-the-hole contract" basis. Management responsibility of this function is currently by the mining contractor - this will revert to Asanko Gold in the future.
21.2.2 Operating cost summary and basis
The operating cost estimate for the LOM is summarised in Table 21-2 below. The summary corresponds to a total of 304.4 Mt mined, and 53.4 Mt ore feed to the process plant.
Table 21-2 Operating cost summary
|
Opex component |
Value (US$ M) |
Unit value (US$/oz) |
|
Mining cost |
783.23 |
371 |
|
Ore transport and handling |
224.05 |
106 |
|
Processing cost |
596.74 |
283 |
|
G&A |
262.50 |
124 |
|
Cash operating costs |
1,866.52 |
884 |
|
Royalties |
156.59 |
74 |
|
Refining costs |
8.44 |
4 |
|
Sustaining capital |
83.96 |
40 |
|
Sustaining capital stripping |
278.22 |
132 |
|
All-in sustaining costs |
2,393.72 |
1,135 |
Cost driver contributors and basis for the mining operating costs include the following:
- Diesoline pricing based on a rate of US$1.05/ℓ
- ROM stockpile re-handling cost based on a rate of US$0.91/t
- Overland hauling based on a rate of US$0.25/t per km. A cost of US$6.50/t is applicable for road haulage delivery of ore from Esaase to the process plant at Obotan. The upgrade of the haul road targets a reduction in this cost.
Cost driver contributors and basis for the process plant operating costs include the following:
- The labour cost is based on the 2020 operating cost budget for the Obotan Mine
- Power cost is based on the current price paid by Obotan to the Ghanaian utility of US$0.135/ kWh. Mill operating power takes into account the blend bond ball mill work index (BBWi) and actual installed major equipment power.
- Reagents costs are based on breakdown and consumptions aligned to current AGM unit cost data
|
Asanko Gold Inc. NI 43-101 Technical Report on Asanko Gold Mine, Ghana |
- Grinding media consumptions and mill liners are based on Asanko Gold plant consumption rates and wear. Costs are based on actual site unit cost data
- Plant maintenance cost encompasses the periodic hiring of specialized crews for mill liner replacement and other general plant maintenance, as derived from the actual plant cost data. This also includes the TSF maintenance cost.
|
Asanko Gold Inc. NI 43-101 Technical Report on Asanko Gold Mine, Ghana |
22 ECONOMIC ANALYSIS
Ernst and Young Advisory Services (Pty) Ltd (EY) constructed a discounted cash flow (DCF) model based on the results of the LOM plan. The DCF model is based on techno-economic input assumptions that were derived for mining, processing and infrastructure direct / indirect costs (including Owner's Team costs). The DCF model assesses the post-tax real cash flows for the Project.
Table 22-1 Responsible party for economic aspects
|
Aspects |
Responsible party |
Comments |
|
Mining cost |
CSA Global and Snowden |
- |
|
General and admin |
Asanko Gold |
Owner's Team costs |
|
Infrastructure |
DRA Global & Wood |
- |
|
Processing design and costing |
DRA Global |
- |
The results of the economic evaluation would be an indicator of the Net Present Value (NPV) of the Project given the quality and quantity of information provided by the contributing specialists and the quality of the estimates made on some inputs of the respective models.
22.1 Capex summary
A summary of capital costs is shown in Table 22-2, with capex scheduling in Figure 22-1.
Table 22-2 Total capital costs
| Item | Value (US$ M) |
||
| Sustaining capital | |||
| General plant sustaining capex | 26.7 | ||
| TSF lifts | 57.3 | ||
| Total sustaining capital | 84.0 | ||
| Development capital | |||
| Resettlement action plan | 38.7 | ||
| Esaase haul road | 33.6 | ||
| Esaase infrastructure (mining and non-mining) | 22.1 | ||
| Mining (pre-production costs) | 10.8 | ||
| Total development capital | 105.2 | ||
| Closure costs | 60.2 | ||
| Total capital | 249.3 | ||
The capital cost estimate excludes stripping costs of US$ 278.2 million. These costs are included as part of all-in sustaining costs (refer to Table 21-2).
|
Asanko Gold Inc. NI 43-101 Technical Report on Asanko Gold Mine, Ghana |
Figure 22-1 LOM capex scheduling
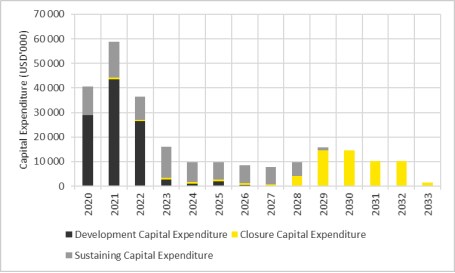
22.2 Principal assumptions
The principle assumptions employed in the economic analysis of the Project are presented in Table 22-3. The DCF model assumes that both revenue and costs, as well as royalty and taxes, are incurred in US$, therefore, no exchange rate assumptions are necessary. For the purposes of the economic analysis, a discount rate of 5%, as directed by Asanko Gold, and a realised gold price of US$1,400/oz. was applied.
Table 22-3 Principal assumptions
|
Techno-economic assumptions |
Unit measure |
Value |
|
Total tonnes mined |
Mt |
304.3 |
|
Total Obotan ore tonnes mined |
Mt |
17.4 |
|
Total Esaase ore tonnes mined |
Mt |
33.7 |
|
Total Obotan waste tonnes mined |
Mt |
121.3 |
|
Total Esaase waste tonnes mined |
Mt |
131.9 |
|
Obotan stripping ratio |
t:t |
6.98 |
|
Esaase stripping ratio |
t:t |
3.92 |
|
Ore processed |
Mt |
53.4 |
|
Esaase ore grade |
g/t |
1.34 |
|
Obotan ore grade |
g/t |
1.52 |
|
Recovery |
% |
88.6% |
|
Total gold recovered |
Moz |
2.11 |
|
Opening capital allowance tax shield |
US$ M |
393 |
|
Opening tax loss carried forward |
US$ M |
93 |
|
Corporate tax rate |
% |
35% |
|
Obotan royalty rate |
% |
5.0% |
|
Esaase royalty rate |
% |
5.5% |
|
Long-term gold price |
US$/oz |
1,400 |
|
Discount rate |
% |
5.0% |
|
Development capex |
US$ M |
105 |
|
Sustaining capex |
US$ M |
84 |
|
Closure capex |
US$ M |
60 |
|
All-in sustaining cost |
US$/oz |
1,135 |
|
Asanko Gold Inc. NI 43-101 Technical Report on Asanko Gold Mine, Ghana |
22.2.1 Commodity prices
A realised gold price assumption of US$1,400/oz was used as a basis for the economic assessment. The gold price assumption does not account for any discounts applicable to the offtake agreements into which Asanko Gold has entered.
22.2.2 Exchange rate
The DCF model assumes that both revenue and costs, as well as royalty and taxes, are incurred in US$, therefore, no exchange rate assumptions were necessary.
22.2.3 Discount rate
For the economic analysis, a real discount rate of 5%, as directed by Asanko Gold, was applied.
22.2.4 DCF cashflow extract
The annual cashflow for the Project is presented in Table 22-4.
|
Asanko Gold Inc. NI 43-101 Technical Report on Asanko Gold Mine, Ghana |
Table 22-4 Project cashflow extract
|
Description |
Units |
Total/ Average |
2020 |
2021 |
2022 |
2023 |
2024 |
2025 |
2026 |
2027 |
2028 |
2029 |
2030 |
2031 |
2032 |
2033 |
|
Ore mined |
kt |
51,069 |
5,977 |
7,881 |
8,855 |
7,685 |
7,336 |
5,763 |
5,335 |
2,236 |
- |
- |
- |
- |
- |
- |
|
Waste mined |
kt |
253,249 |
27,823 |
27,996 |
50,524 |
52,315 |
51,634 |
27,803 |
13,339 |
1,815 |
0 |
0 |
- |
- |
- |
- |
|
Stripping ratio |
# |
5.0 |
4.7 |
3.6 |
5.7 |
6.8 |
7.0 |
4.8 |
2.5 |
0.8 |
- |
- |
- |
- |
- |
- |
|
Grade |
g/t |
1.41 |
1.38 |
1.38 |
1.24 |
1.34 |
1.43 |
1.56 |
1.60 |
1.68 |
- |
- |
- |
- |
- |
- |
|
Ore processed |
kt |
53,394 |
5,652 |
5,084 |
5,400 |
5,400 |
5,400 |
5,018 |
4,944 |
5,400 |
5,400 |
5,696 |
- |
- |
- |
- |
|
Processing recovery |
% |
88.6% |
91.4% |
91.9% |
88.5% |
87.8% |
86.1% |
91.0% |
93.4% |
89.6% |
79.1% |
76.7% |
0.0% |
0.0% |
0.0% |
0.0% |
|
|
|
|
|
|
|
|
|
|
|
|
|
|
|
|
|
|
|
Gold produced |
koz |
2,110 |
241 |
243 |
247 |
249 |
251 |
251 |
247 |
181 |
106 |
94 |
- |
- |
- |
- |
|
Gold price |
US$/oz |
1,400 |
1,400 |
1,400 |
1,400 |
1,400 |
1,400 |
1,400 |
1,400 |
1,400 |
1,400 |
1,400 |
1,400 |
1,400 |
1,400 |
1,400 |
|
Revenue |
US$'000 |
2,953,809 |
331,227 |
339,686 |
345,716 |
348,139, |
351,125 |
351,462 |
346,191 |
253,665 |
148,813, |
137,784 |
- |
- |
- |
- |
|
|
|
|
|
|
|
|
|
|
|
|
|
|
|
|
|
|
|
Mining costs |
US$'000 |
(783,227) |
(97,374) |
(97,683) |
(107,058) |
(104,221) |
(100,458) |
(138,952) |
(78,422) |
(35,748) |
(14,011) |
(9,300) |
- |
- |
- |
- |
|
Ore transport & handling |
US$'000 |
(224,049) |
(12,572) |
(25,792) |
(32,342) |
(28,277) |
(32,430) |
(14,236) |
(4,385) |
(15,239) |
(22,135) |
(36,643) |
- |
- |
- |
- |
|
Processing costs |
US$'000 |
(596,742) |
(62,058) |
(56,572) |
(58,618) |
(60,336) |
(60,896) |
(58,769) |
(58,539) |
(60,884) |
(60,339) |
(59,732) |
- |
- |
- |
- |
|
General & administration |
US$'000 |
(262,500) |
(30,000) |
(30,000) |
(30,000) |
(30,000) |
(30,000) |
(30,000) |
(30,000) |
(30,000) |
(15,000) |
(7,500) |
- |
- |
- |
- |
|
Cash operating costs |
US$'000 |
(1,866,519) |
(202,003) |
(210,047) |
(228,018) |
(222,834) |
(223,784) |
(241,956) |
(171,345) |
(141,870) |
(111,485) |
(113,175) |
- |
- |
- |
- |
|
|
|
|
|
|
|
|
|
|
|
|
|
|
|
|
|
|
|
Royalties |
US$'000 |
(156,592) |
(17,128) |
(18,383) |
(18,854) |
(18,697) |
(19,207) |
(18,293) |
(17,442) |
(13,108) |
(7,935) |
(7,545) |
- |
- |
- |
- |
|
Refining costs |
US$'000 |
(8,439) |
(946) |
(971) |
(988) |
(995) |
(1,003) |
(1,004) |
(989) |
(725) |
(425) |
(394) |
- |
- |
- |
- |
|
Total operating costs |
US$'000 |
(2,031,550) |
(220,078) |
(229,400) |
(247,860) |
(242,526) |
(243,994) |
(261,254) |
(189,776) |
(155,703) |
(119,846) |
(121,114) |
- |
- |
- |
- |
|
|
|
|
|
|
|
|
|
|
|
|
|
|
|
|
|
|
|
Sustaining capital expenditure |
US$'000 |
(83,958) |
(11,556) |
(14,445) |
(9,447) |
(12,491) |
(7,998) |
(6,999) |
(7,295) |
(7,050) |
(5,676) |
(1,000) |
- |
- |
- |
- |
|
Stripping costs |
US$'000 |
(278,216) |
(20,251) |
(10,812) |
(52,035) |
(87,304) |
(106,508) |
- |
(1,305) |
- |
- |
- |
|
|
|
|
|
All-in sustaining costs |
US$'000 |
(2,393,724) |
(251,885) |
(254,657) |
(309,341) |
(342,322) |
(358,500) |
(268,253) |
(198,376) |
(162,753) |
(125,522) |
(122,114) |
- |
- |
- |
- |
|
|
|
|
|
|
|
|
|
|
|
|
|
|
|
|
|
|
|
Development capital expenditure |
US$'000 |
(105,124) |
(28,943) |
(43,611) |
(26,407) |
(2,763) |
(950) |
(1,950) |
(500) |
- |
- |
- |
- |
- |
- |
- |
|
Closure capital expenditure |
US$'000 |
(60,218) |
- |
(658) |
(660) |
(689) |
(717) |
(778) |
(809) |
(850) |
(4,035) |
(14,693) |
(14,693) |
(10,102) |
(10,102) |
(1,433) |
|
Working capital |
US$'000 |
(17,500) |
(1,098) |
1,206 |
2,983 |
750 |
1,104 |
(7,367) |
(5,784) |
(1,092) |
(907) |
(66) |
(7,229) |
- |
- |
- |
|
Tax payable |
US$'000 |
(30,821) |
- |
- |
- |
- |
- |
- |
- |
- |
(24,784) |
(6,037) |
- |
- |
- |
- |
|
Free cash flow after tax |
US$'000 |
346,423 |
49,300 |
41,967 |
12,291 |
3,116 |
(7,938) |
73,114 |
140,723 |
88,970 |
(6,436) |
(5,125) |
(21,922) |
(10,102) |
(10,102) |
(1,433) |
|
|
|
|
|
|
|
|
|
|
|
|
|
|
|
|
|
|
|
NPV |
US$'000 |
291,277 |
|
|
|
|
|
|
|
|
|
|
|
|
|
|
|
|
|
|
|
|
|
|
|
|
|
|
|
|
|
|
|
|
|
Cash operating costs |
US$/oz |
884 |
840 |
866 |
923 |
896 |
892 |
964 |
693 |
783 |
1,049 |
1,199 |
|
|
|
|
|
All-in sustaining costs |
US$/oz |
1,135 |
1,047 |
1,050 |
1,253 |
1,377 |
1,429 |
1,069 |
802 |
898 |
1,181 |
1,294 |
|
|
|
|
|
Asanko Gold Inc. NI 43-101 Technical Report on Asanko Gold Mine, Ghana |
22.2.5 NPV
Net Present Value (NPV), is typically used as an indicator of project performance and for evaluation of a project's return relative to the cost of capital. As the AGM is an operating mine, the NPV is considered to be the most appropriate indicator of economic performance for this mineral asset. The NPV at a 5% real discount rate, as directed by Asanko Gold, is shown in Table 22-5. An NPV sensitivity at different discount rates and price assumptions is presented in Table 22-7 below.
Table 22-5 Project NPV results (in US$ M)
|
Project metric |
Real discount rate applied, 5% |
|
NPV |
291 |
22.3 Taxes, royalties and other government levies
22.3.1 Taxes
While the general corporate income tax (CIT) in Ghana is 25%, mining companies are required to pay a CIT of 35%. Depreciation of depreciable assets of a business is not a permissible deduction in deriving taxable profits. In its stead, capital allowances at prescribed statutory rates for mining companies currently marked at 20% straight line. Tax losses in Ghana are carried forward for up to 5 years, to the extent they are not utilised within 5 years, they expire. CIT, capital allowance calculations and tax loss expiry have been applied into the DCF model logic.
22.3.2 Royalties
The current fiscal regime in Ghana requires mining companies to pay a 5% Net Smelter Return (NSR) royalty to the Government of Ghana. In addition, the Adubea mining concession is subject to an additional 0.5% NSR royalty to the original concession owner. The Esaase mining lease is also subject to an additional 0.5% NSR royalty to the Bonte Liquidation Committee (BLC). The Akwasiso pit on the Abirem mining lease is also subject to an additional 2% NSR royalty payable to the original concession owner.
22.3.3 Other government levies
In accordance with the Mining Code, the Government of Ghana own a 10% free carried interest in Asanko Gold Ghana. Any distribution in the form of a dividend paid by Asanko Gold Ghana to its shareholders would be distributed in proportion to their ownership (45% Asanko Gold Inc, 45% Gold Fields Inc, 10% Government of Ghana. For the purposes of valuation of the Asanko Gold Mine, distributions are not considered.
22.4 Sensitivity analysis
The DCF was subjected to a sensitivity and scenario analysis in order to assess the effect of changes in significant cost and revenue drivers on the NPV. The results of the sensitivity analysis against the respective scenarios are summarised in Figure 22-2, after the sensitivities represented in Table 22-6 were applied. Differences in the results of the scenario analysis and further sensitivities may be due to rounding and/or non-linear relationships modelled.
|
Asanko Gold Inc. NI 43-101 Technical Report on Asanko Gold Mine, Ghana |
Table 22-6 Sensitivity factors applied
|
Description |
Sensitivity |
Units |
Up Case |
Down Case |
|
Commodity price |
10% |
US$/oz |
1,260 |
1,540 |
|
Operating costs |
10% |
US$ 000 |
1,680 |
2,053 |
|
Grades |
0.1 g/t |
g/t |
1.48 |
1.28 |
|
Recovery |
2% differential |
% |
90.6 |
86.6 |
|
Discount rate |
1% differential |
% |
4 |
6 |
|
Capital costs |
10% |
US$ M |
224.4 |
274.2 |
Figure 22-2 Sensitivity analysis of key parameters
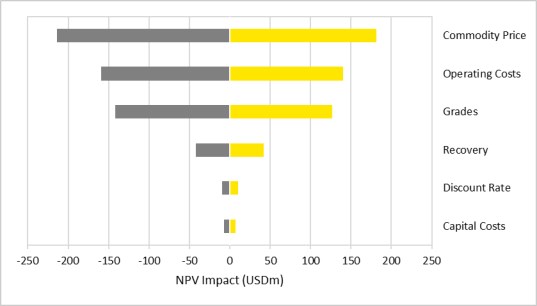
EY investigated the sensitivity of the Project NPV to different input parameters, namely commodity pricing, operating costs, grade, discount rate, plant recovery and capital costs associated with the Project. From this analysis, the NPV generated from the DCF models proved to be most sensitive to changes in parameters affecting revenue, most notably commodity pricing. Following commodity pricing next most influential parameters are operating costs and grade; while capital costs the Project NPV was least sensitive to NPV.
In assessing the combined impact of commodity price and discount rate on the value of the Project, these two variables were varied concurrently and the results of their combined sensitivity analysis is shown in Table 22-7.
|
Asanko Gold Inc. NI 43-101 Technical Report on Asanko Gold Mine, Ghana |
Table 22-7 Commodity price and discount rate sensitivity analysis (NPV in US$ M)
|
Realised gold price (US$/oz) |
Discount rate |
|||
|
5.0% |
7.5% |
10.0% |
12.5% |
|
|
1,200 |
(24) |
(25) |
(26) |
(27) |
|
1,300 |
144 |
130 |
118 |
107 |
|
1,400 |
291 |
268 |
248 |
230 |
|
1,500 |
423 |
393 |
366 |
343 |
|
1,600 |
546 |
510 |
478 |
450 |
The economic analysis shows that the gold price would need to decrease below US$1,215/oz for the NPV of the Project to be negative at a real discount rate of 5% (or a gold price of US$1,219/oz at a real discount rate of 10%). The spot gold price was US$1,521/oz at 31 December 2019 and the three-year average trailing gold price was US$1,307/oz. The median long-term real gold price of a number of independent brokers reviewed by EY is US$1,400/oz. Considering the spot, three-year average and long-term median broker forecasts gold prices, the economics of the Project are considered to be robust, with the Project able to endure a considerable price reduction before proving to be uneconomical.
|
Asanko Gold Inc. NI 43-101 Technical Report on Asanko Gold Mine, Ghana |
23 ADJACENT PROPERTIES
Properties adjacent to the Asanko Gold AGM area and tenements are shown below in Figure 23-1. The AGM properties are shown in bright red and are named. The property listing is shown in Table 23-1. These properties are all located within the Kumasi basin, and share similar underlying deformed siliciclastic metasediments as the primary rock type, with a range of syn- to late tectonic granite intrusives mainly to the east of the AGM tenements. None of these adjacent properties host mineral resources that are in alignment with a Reporting Code such as JORC, SAMREC or CIM.
Table 23-1 Adjacent property listing
|
Tenement /PL number |
Tenement owner |
|
137 |
Tropical Minerals Co. Ltd |
|
91 |
Moseaso Co. Ltd |
|
155 |
Joam Enterprise Ltd |
|
169 |
Rock and Rivers |
|
234 |
Triple Key Co. Ltd |
|
150 |
Romex |
|
138 |
U & N Ltd |
|
145 |
Westminister |
|
257 |
Star Gold Ltd |
Source: Asanko Gold, 2019
|
Asanko Gold Inc. NI 43-101 Technical Report on Asanko Gold Mine, Ghana |
Figure 23-1 AGM tenements and adjacent properties

Source: Asanko Gold, 2019
|
Asanko Gold Inc. NI 43-101 Technical Report on Asanko Gold Mine, Ghana |
24 OTHER RELEVANT DATA AND INFORMATION
24.1 Project Execution Plan (PEP)
The Project is to be executed as a brown field project and will involve the engineering, detailed design, procurement, construction and commissioning of haul road, Esaase infrastructure, Esaase-Obotan haul road, Obotan arsenic water treatment plant and the partial relocation of the Esaase village. The Project construction portion is intended to be executed by Asanko Gold in conjunction with specialist consultants.
The Project approval process involves the submission of the necessary Approvals for Expenditure (AFEs) for signature to the Asanko Gold Board. Final approval for elements of scope for the project is through the JV Technical Committee (JV Tech) and JV Management Committee (JV Mancom). Most contracts will be based on the FIDIC Red Book (1999) or FIDIC Green Book (1999) for all building and engineering works.
Appointed contractors will perform construction operations, under the overall direction of the Asanko Project Manager, through the appointed Construction Manager. The work as defined within the scope of the Project will be performed in accordance with the approved safety procedures, construction drawings, the project programme and the budget.
The high-level schedule for the Asanko Gold LOM Study is shown in Figure 24-1. The schedule considers a time line up to end Q4 of 2021 and confirms the following:
- The time line for the follow up (detailed design) on the LOM Study (to be completed in 2020)
- Areas of scope that will be completed during the time line of the follow up phase
- Critical activities are listed:
- Follow up metallurgical testwork (preg-robbing/ OC assessment). This will include a short stint campaign of Esaase Fresh material through the process plant at Obotan
- Planning/ implementation of additional lifts for the TSF (the LOM Study confirms a strategy of an additional lift to the TSF once per annum)
- On-going stakeholder engagement around the environmental permit (transport of material from Esaase to Obotan), as well as influences around the project footprint and RAP projects
- Confirmation of planned initial closure expenditure.
- Confirmation of high-level timing for Esaase/ Obotan surface infrastructure
- Upgrades to the haul road to address the production increase to 5.4 Mtpa ore to be transported from Esaase to Obotan.
|
Asanko Gold Inc. NI 43-101 Technical Report on Asanko Gold Mine, Ghana |
Figure 24-1 High level execution schedule
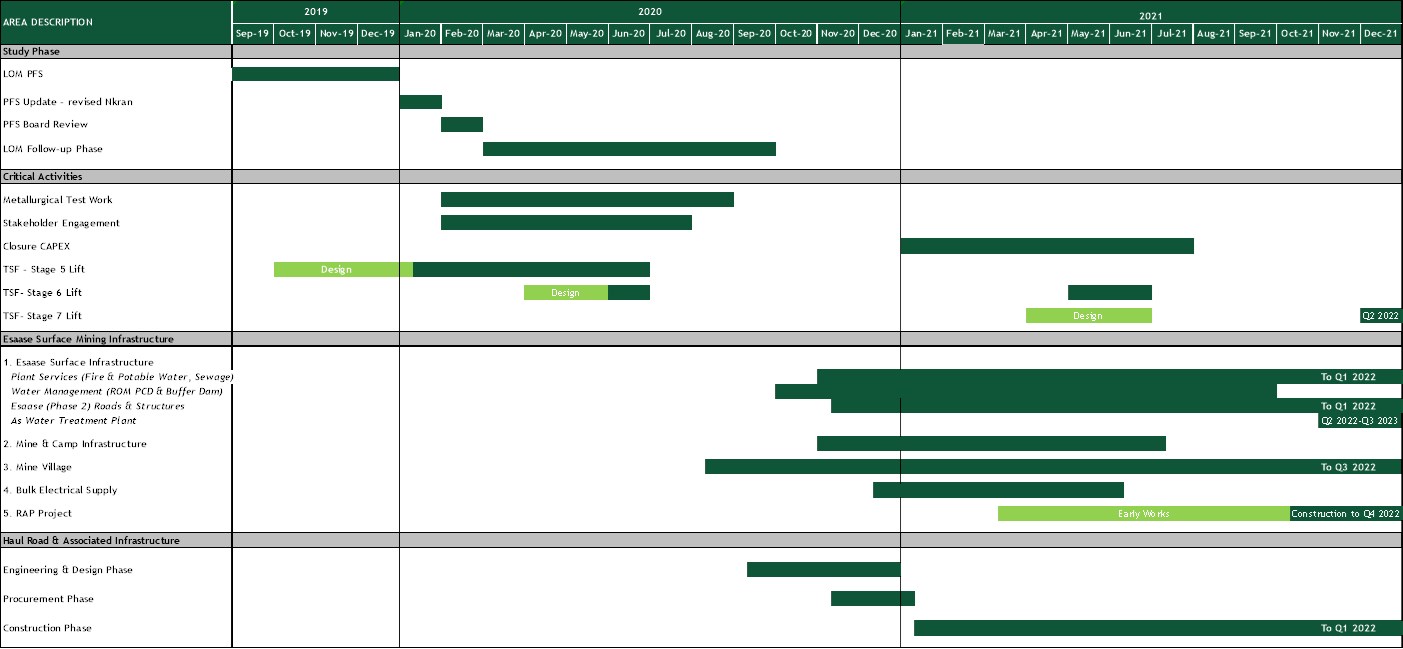
|
Asanko Gold Inc. NI 43-101 Technical Report on Asanko Gold Mine, Ghana |
24.2 Security
24.2.1 Obotan Project Site
No further security measures are required at the Obotan project site.
24.2.2 Esaase
Security measures similar to those at Obotan mining operations area will be implemented at Esaase. Areas to be fenced include the Esaase mine camp, contractor's laydown area, mine services area, explosives magazine, water treatment plants and sediment control dam (for safety purposes). As there is no ore being processed at Esaase, the security is limited to restricting access to active mining areas.
24.3 Logistics
Fully developed logistics and supply chain management processes and procedures are already in place at the Asanko Gold Mine.
24.3.1 Site location
The Esaase site is located approximately 36 km to the south west of Kumasi. The Obotan Mine site is approximately 57 km south west of Kumasi. By road, Esaase is 50 km from Kumasi whilst Obotan Mine is approximately 77 km away (Figure 4-1 and Figure 4-2).
24.3.2 Ports
Ghana has two main ports, Tema and Takoradi. Seaborne freight will be delivered through Tema and then trucked to site (Takoradi is mainly for high volume export items). The port of Tema is between 323 km and 350 km from the Esaase site and between 320 km to 350 km from the Obotan site. The port of Takoradi is between 285 km and 310 km from the Esaase site and between 255 km and 275 km from the Obotan site. With regards to Tema being the port of choice, Tema is generally used for inbound goods, whilst Takoradi is used mainly for high volume export items such as cocoa, bauxite, manganese, etc.
24.3.3 Logistics costs
Logistics costs for the Project have been estimated based on a percentage of the supply cost calculated from a similar referenced project in West Africa.
24.3.4 Insurance
The LOM capex cost basis is that Asanko Gold will provide the marine insurance and goods in transit insurance (GIT) for all shipments during the course of the LOM.
24.3.5 Transport of staff to site
There is an existing bus service for Asanko Gold staff to transport employees to and from Obotan Mine and Esaase.
Expat staff will fly into Accra and then fly on to site. The alternative is to fly from Accra to Kumasi and then travel by road from Kumasi to site (approximately 2 hours). The roads from Accra to site are generally in relatively poor condition and will be avoided if possible.
24.3.6 Transport on site
Asanko Gold owned vehicles are used by the Owner's Team. Contractors supply their own vehicles and to arrange the necessary transport for their staff from the surrounding communities.
|
Asanko Gold Inc. NI 43-101 Technical Report on Asanko Gold Mine, Ghana |
24.4 Tailings storage facility (TSF) and mine residue
Knight Piésold Ghana Limited (KP or Knight Piésold) designed and provided construction management supervision for the existing operational tailing storage facility at the Asanko Gold Mine. Ongoing engineering and the LOM design are summarised in the following sections.
24.4.1 Tailings Storage Facility (TSF) design
The TSF will consist of a multi-zoned downstream raised perimeter embankment, ultimately comprising a total footprint area of 411 ha (basin area 330 ha) for the Stage 15 TSF (the LOM Study has confirmed expansion only to Stage 13). The current TSF basin will be expanded laterally beyond the existing east embankment to incorporate the current water dam basin which is situated (upstream of the TSF).
The TSF will operate with the current configuration for Stage 5 operations (with a corresponding, downstream vertical raise to the existing confining embankments). Stage 6 considers the lateral extension noted above (including full basin and liner development as necessary) which will provide approximately one year of tailings storage without further raising or depositing into the previously developed footprint. Tailings will then be deposited from the eastern extents of the basin to fill the expanded TSF basin. Subsequent to Stage 6 construction, the TSF will be raised as a single cell as required during the operation via downstream methods. The Stage 5 East Embankment will be abandoned and allowed to overtop. The design summary is provided below (Table 24-1).
Table 24-1 TSF design summary for LOM development
|
Parameter |
Unit |
Value |
|
Capacity |
Mt |
78.1 |
|
LOM design embankment crest limit |
m |
206.5 |
|
Height of LOM critical embankment |
m |
56.5 |
|
Total volume of embankments |
Mm3 |
18.0 |
|
Total crest length of embankments |
m |
7,625.0 |
|
Total footprint of embankments (base area) |
ha |
107.4 |
|
TSF basin area |
ha |
330.0 |
Note: Annual tailings throughput provided by Asanko Gold Ghana
Source: Knight Piésold, 2019
The TSF embankments are designed with 2.5H:1V upstream slopes to support HDPE geomembrane liner installation. Downstream slopes of embankments vary from 2H:1V to 3.5H:1V through the raise constructions to the TSF, with the slope becoming gentle as the development approaches the current LOM crest limit. A 10 m wide buttress that serves as a downstream access is provided for the highest embankment (west embankment) during each stage raise. While the design intent of the buttress is not for stability, it does provide improved safety factors and contribute to overall dam safety. Each stage embankment is to have a minimum 8 m crest width. The embankments shall have cut-off walls, constructed from plastic clays/silts along the upstream toes. The cut-off walls shall be constructed into competent low permeability in-situ foundation material to mitigate seepage beneath the embankments. The need for the HDPE geomembrane liner will be re-evaluated during continued development of the facility. Should suitable low permeable soils be found in sufficient quantity, the facility may transition to a Compacted Soil Liner (CSL) or a combination of CSL and HDPE geomembrane lining system, with necessary regulatory review and approval.
The design will utilise the existing basin under-drainage system, comprising a network of collector and finger drains. The under-drainage system drains by gravity to a collection sump located at the lowest point in the TSF. Solution recovered from the under-drainage system will be released to the top of the tailings mass via submersible pump, reporting to the supernatant pond. Upstream of the planned Stage 5 TSF east embankment 1, the expanded TSF basin (incorporating the current water dam) under-drainage system will be developed to serve the same purpose as the existing system, with slurry water reporting to a temporary sump and riser pipe at the TSF east embankment 1 downstream toe. Groundwater collection system developed within the basin located east of the existing TSF will operate over the LOM.
|
Asanko Gold Inc. NI 43-101 Technical Report on Asanko Gold Mine, Ghana |
The TSF basin area will be cleared, grubbed and topsoil stripped and unsuitable material removed from the valley base. Existing unsuitable stockpiles will be removed, as necessary, from the TSF footprint. A 200 mm thick compacted soil liner will be constructed over the entire TSF basin area, comprising either reworked in-situ material, or imported Zone A material; Zone A material is low permeability material (hydraulic barrier). A 1.5 mm smooth HDPE geomembrane liner will be installed over the entire basin area, overlying the CSL. Should the facility transition to CSL, the thickness of Zone A will increase for compliance with local regulatory requirement (L.I. 2182) or permit specific requirements.
Supernatant water will be recovered from the TSF via submersible pumps mounted on a floating barge (design by others), and two decant towers (to be installed during Stage 5 and Stage 6 raises). The floating barge shall be deployed until Stage 8 when the decant towers become fully operational. Decant water shall returned to the plant for re-use in the process operations. An additional floating barge will be required temporarily to permit supernatant water recovery to process operations during initial deposition of tailings into the water storage dam (WSD) basin. The decant towers will be raised over the LOM, as determined necessary, beyond Stage 6 for continued operation. A floating barge system will remain in operation as necessary, likely through Stage 8, as the two facilities merge, and pond management can be readily maintained via the decant system. The barge shall remain available for additional use, should it be required.
A downstream seepage collection system will be maintained at the west embankment, to allow collection of any seepage and rain precipitates into a sump for monitoring.
An operational emergency spillway has been incorporated in the design and will be available at all times during TSF operation. The emergency spillway shall require design, as needed, to support full water shedding from the decommissioned storage basin depending on adopted closure approach. Closure design consideration and design are outside the Knight Piésold current work scope.
Sections of existing tailings discharge pipeline trench, referred to as the tailings and decant return pipeline trench (TDRT), and the adjoining access road leading from the plant site to the TSF will be utilised for various stages of the LOM expansions until such time when they become unusable. New TDRTs shall be constructed as needed during each stage expansion.
Seepage assessment conducted with the assumption that the installed HDPE barrier is not effective estimated seepage from the TSF installed with an operational underdrainage at approximately 1.5 ℓ/s. This yields an equivalent basin permeability of the order 1 x 10⁻¹⁰ m/s (considerably better than the 1 x 10⁻⁸ m/s limit specified in the Ghana Mining Regulations).
Stability analysis conducted on the critical embankments of the TSF indicate the impounding walls would mobilize adequate Factors of Safety (FoS) against anticipated destabilizing loads or stress conditions. The FoS realized satisfied the minimum limits recommended in the current Ghana Mining Regulations (L.I. 2182) and Australian National Committee On Large Dams (ANCOLD) guidelines for TSF design/operations. The TSF scope for the LOM Study considered deposition onto the TSF for a period of 10 years. The final Stage 15 TSF expansion footprint is shown in Figure 24-2. The LOM mining schedule has confirmed that expansion to Stage 13 will be required.
|
Asanko Gold Inc. NI 43-101 Technical Report on Asanko Gold Mine, Ghana |
Figure 24-2 Stage 15 TSF expansion
|
|
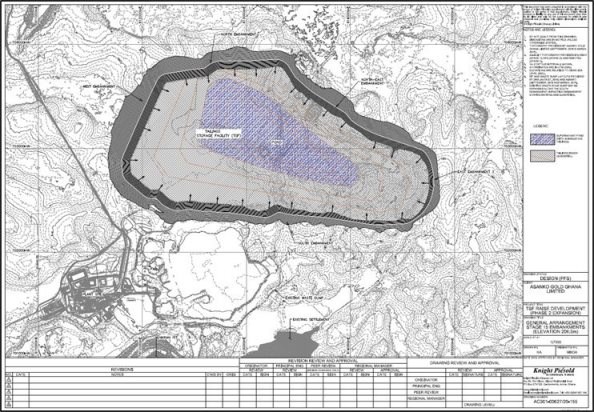
Source: Knight Piésold, 2019
24.4.2 Monitoring
A monitoring programme for the TSF is currently in place to monitor for potential problems which may arise during operations. This programme will continue to be reviewed, evaluated, and updated as information becomes available and the facility performance is understood.
Additional groundwater monitoring stations will be installed downstream of the TSF to support routine observation of WQ and early detection of changes in groundwater quality, both during operation and after decommissioning. Two monitoring stations are required as a minimum for installation to the east and north or NE of the TSF.
Vibrating wire piezometers (VWPs) and open standpipe piezometers (OSPs) will be installed in the TSF embankments as determined appropriate to monitor pore water pressures within the embankment to confirm that facility performance is consistent with design intent with regards to continued slope stability. The piezometers will be monitored at regular intervals and changes in water level noted and discussed with the design engineer.
Survey pins and prisms will be installed at regular intervals along the embankment crests per the requirements of the Ghanaian regulations and to international best practice guidelines to monitor potential deformations in the impounding walls in support of remediation and overall dam safety.
The TSF will undergo quarterly operational audits and annual technical audits by a suitably qualified geotechnical engineer as part of the continuous monitoring efforts to support TSF safety. The audits will observe that the facility is operating in a safe and efficient manner.
Alternative monitoring methods, instruments, and technologies will be reviewed regularly, and as appropriate, may be integrated into the TSF monitoring and surveillance system.
|
Asanko Gold Inc. NI 43-101 Technical Report on Asanko Gold Mine, Ghana |
24.4.3 Water management strategy
Management of water is central to the design and operation of the TSF, and historically the TSF has been a major component of the site wide water balance. The design approach that has been followed for the expansion of the TSF incorporates the following:
-
Each stage raise of the TSF has sufficient capacity to accommodate design storm events and anticipated rainfall sequence, meeting or exceeding Ghanaian regulatory requirements and best practice guidelines such as those provided in ANCOLD
-
Each stage raise has sufficient freeboard above operating pond level and design storm event in compliance with Ghanaian regulation (LI 2182) and best practice guidelines as provided by ANCOLD
The underlying principles regarding the water balance are as follows:
-
The Esaase mining operation has a stand-alone water balance (28 km ore haulage to the metallurgical process plant). The TSF water balance is integrally linked to the Nkran pit (and other nearby satellite pit operations (Akwasiso and Adubiaso)).
-
Recycle water shortfalls from the TSF are anticipated yearly. Make-up water is thus to be sourced from the nearby pit dewatering operations. Maximum annual total make-up water in the order 2.5 Mm3 is anticipated during Year 7 (Stage 7) under average climatic conditions, largely influenced by reduction in run-off water inflow
-
Make-up water demand of the order 3.0 Mm3 is anticipated during a 1 in 100-year dry rainfall sequence in Year 7 (Stage 7)
-
Recycle water shortfalls are also anticipated in Years 8 and 9 under average and dry conditions.
The existing water balance for the AGM reflects current site operations, climatic changes and mine pit development/operations. The intention is to re-assess the water balance on an on-going basis as TSF expansion phases are designed and implemented. The following will be the main consideration for any updates:
-
TSF Groundwater and underdrainage pump rates
-
Characteristic settling and consolidation properties of tailings from ore bodies to be included in milling operations (determined by the LOM mining schedule)
-
Tailings solid content or tailings percent solids (current and/or projected)
-
Current and projected process water demand
-
Current sources and planned sources of process make-up water to include pump rates, groundwater inflow rates etc
-
Pit development schedules and post mining plans (especially for Adubiaso and other Satellite Pits such as Akwasiso).
Water balance outputs for the LOM study made allowance for a 'basic' (initial) update, followed by a more detailed assessment of possible changes to assumptions around the existing water balance. This detailed assessment would align to the Stage 6 design, due for implementation in 2020.
24.4.4 Rehabilitation
Closure and rehabilitation of the TSF has been evaluated and designed by ABS Africa.
24.4.5 Geotechnical investigation
Several site investigations have been completed in support of design of the TSF. This includes the most recent site investigation completed during Q3 2019 in support of the planned Stage 5 raise. These investigations included site reconnaissance, desktop review of existing geotechnical investigations and regional information, site knowledge, and in-situ investigations with corresponding in-situ testing and sampling as well as geotechnical laboratory testing of recovered materials. The geotechnical site investigations for the existing and planned TSF was completed to assess:
-
Foundation and excavation conditions for the TSF
-
Availability and suitability of construction materials on site
|
Asanko Gold Inc. NI 43-101 Technical Report on Asanko Gold Mine, Ghana |
- Availability of sufficient quantity and quality of low permeability materials to transition from use of HDPE geomembrane to CSL within the basin.
The following key conclusions were based on the site investigation findings:
-
The TSF location remains suitable for the proposed LOM expansions
-
Low permeability materials (residual laterites) can be obtained from local borrows within the TSF area for embankment fill construction
-
Structural fill for the TSF embankments can be sourced from active open pit operations or from waste rock dumps within the proximity of the construction zones. Other structural fill materials, including natural gravels and saprolites (extremely to distinctly weathered rocks), can be sourced from near surface materials within the TSF area
-
In-situ soils in the TSF basin are generally suitable for construction of low permeable CSL or HDPE geomembrane liner prepared subgrade required as part of hydraulic barrier construction
-
Due to the high constituent fines and plasticity of observed near surface residual soils in the TSF, they may prove problematic for construction plant movement on wetting. Construction fleet may experience slip, slide and glide risks during reworking of the naturally occurring construction materials due to their plasticity
-
Drainage and filter materials required for inclusion in the TSF permanent works can be sourced from locals borrows. Suitable mine waste rocks may also be crushed to the drainage/filter materials' specifications and stockpiled for use within economical hauls of the TSF construction
-
Removal of unsuitable materials within the expanded embankment footprint and TSF basin would be required. Based on available geotechnical investigation data and previous construction experiences, the thickness of unsuitable materials to be removed is anticipated to range from 1.0 m to 3.0 m
-
An approximate average topsoil depth of 300 mm is anticipated over large areas of the expanded TSF.
The underlisted observations from the previous raise constructions of the TSF (Stage 1 through Stage 4) are considered essential information that would impact future TSF expansions general. They provide pertinent information that should guide construction decisions (unsuitable materials' dump location, existing unsuitable material stockpiles removal needs, topsoil dump development etc).
-
Several unsuitable materials (saturated soft vegetation laden soils) stockpiles were created within the expanded footprint of the TSF during initial construction stage of the facility (Stage 1) to accelerate construction and reduce Stage 1 construction cost. These stockpiles will require relocation, as needed, during future stage raise constructions to the facility. This relocation may be by mining fleet or contractor as convenient; however, suitable stockpile development should be confirmed with the design engineer
-
Superficial, in-situ materials within the valley floors are largely unsuitable requiring removal prior to construction of embankment fills and basin lining systems within the TSF (either CSL or HDPE geomembrane prepared subgrade). Following removal of the unsuitable materials, the remaining in-situ materials were largely identified as unsuitable for CSL construction and/or subgrade for HDPE geomembrane deployment. The materials would be tested, and where confirmed to be unsuitable for CSL construction and/or subgrade for HDPE geomembrane deployment; a cover constructed from suitable materials will be provided
-
Superficial in-situ material on the hill side slopes bordering the valley areas were identified as suitable for inclusion in low permeable (Zone A) constructions. These materials where cleared of vegetation and topsoil, could be used in stabilization of the valley floors and CSL construction. The materials may also be utilised for embankment fill construction.
24.4.6 Tailings physical characteristics
Tailings physical testing of representative samples (of oxide and primary tailings) for the Nkran ore body was completed by Knight Piésold in 2012 and in 2015. Tests were also conducted on the Esaase ore body.
|
Asanko Gold Inc. NI 43-101 Technical Report on Asanko Gold Mine, Ghana |
For the Esaase tailings, supernatant water release is expected be approximately 53% and 47% slurry liquor for oxide and primary tailings respectively. Tailings water release to the underdrainage system may reach up to 20% depending on the design/operations of drainage system and basin treatment.
For the Nkran tailings, supernatant water release is expected to vary between 47% and 42% of the slurry water for oxide and primary tailings respectively. Underdrainage release will typically average approximately 5% to 10%, depending on design/operations of the underdrainage collection and basin treatment, as well as tailings cover thickness over the collection system.
The dry densities of tailings to be deposited into the facility were estimated from laboratory testing of representative samples. Assuming the TSF is efficiently operated typical achievable densities ranging from 1.40 t/m³ to 1.50 t/m³ may be realized.
24.4.7 Tailings geochemical characteristics
Geochemistry testing of representative samples (of oxide and primary tailings) for the Nkran ore body was completed by Genalysis in 2012.
Both oxide and primary Nkran tailings samples were classified as non-acid forming (NAF). The samples had a moderate number of elemental enrichments, with arsenic and mercury classed as highly enriched in both samples. Boron was found to be highly enriched in the oxide sample. Several metals were found to be present at elevated levels. As such, a cover system should be constructed at closure of the facility to mitigate the risk of tailings release into the external environment.
The Nkran supernatant water quality (WQ) was compared with reference water quality standards (WQS) for release from mining operations, livestock and wildlife drinking water. Both samples were found to exceed the guideline concentrations for arsenic, and the primary sample was found to exceed the guideline values for total dissolved salts, cyanide total, cyanide WAD, iron and sulphate; with the oxide sample exceeding the guideline values for fluoride and molybdenum.
Geochemical testing of three samples of tailings from the Esaase ore body was conducted by Environmental Geochemistry International (EGi). The tests conducted by EGi included both static testing and column leaching. The results of the static acid-base accounting testing indicate that the samples are all NAF. The only element which was found to be significantly enriched was arsenic. The column leaching indicates that the leachate from the columns remained alkaline with a low salinity, and that the majority of highly soluble arsenic was removed in the processing stage at high pH with limited ongoing leaching of arsenic.
Based on the proposed environmental control measures (i.e. CSL and/or HDPE geomembrane liner and underdrainage system), seepage from the facility should not impact adversely surface water and/or groundwater aquifer. However, as a precaution the TSF should be fenced, as practical, to prevent access by terrestrial animals.
24.5 Mine closure
A conceptual reclamation and closure plan for the expanded AGM was developed as part of the LOM Study. An estimate of the required financial provision to ensure that the plan can be implemented was required and the information used in the formulation of the conceptual closure and costs was sourced from the LOM Study design of the mine and associated infrastructure.
|
Asanko Gold Inc. NI 43-101 Technical Report on Asanko Gold Mine, Ghana |
In the planning and implementation stages of a mining project the focus of rehabilitation and closure planning is to ensure that:
-
The proposed post closure land use(s) for the site are defined and agreed with the regulatory authorities
-
The nature, scale and cost of the works required to return the site to a condition consistent with the requirements of the post closure land use(s) are defined and understood
-
The necessary financial provisions are made for closure of the mine and that these are included in the assessment of the project viability
-
A plan is developed for the implementation of the rehabilitation and closure works so as to ensure that the process proceeds concurrently with mining operations as far as possible
-
The build-up in rehabilitation and closure liabilities is limited so as to mitigate as far as possible the impacts of premature, or unplanned closure.
Rehabilitation and closure of areas disturbed in mining and related operations will be considered to be complete when:
-
All structures, equipment and infrastructure not consistent with the post closure land use have been decommissioned, demolished and removed from site
-
Ownership of all remaining infrastructure and services required to support the proposed post closure land use have been formally transferred to the local authority responsible for the administration of the area
-
The area has been made safe for all post closure land users and livestock
-
All surface disturbances and remaining landforms are structurally and ecologically stable and have sustainable soil and vegetation covers
-
Surface water management structures are in place and are free of damage due to erosion
-
All surface and groundwater discharges from the site satisfy agreed target water quality objectives.
The conceptual rehabilitation and closure plan and associated estimate of closure costs for the mine has been formulated to ensure that the completion criteria as defined above are achieved. The main components of the final closure and restoration plan will include:
-
Open pits
-
Waste rock and tailings joint disposal locations
-
Process plant facilities
-
Waste yard facilities
-
Fuel tanks yard facilities
-
Water and effluents treatment facilities
-
Ancillary facilities
-
Camps, workshops, and offices
-
Transport and service roads (internal)
-
Municipal solid waste dump
-
Borrow pit.
The review and updating of the quantum for closure for the 2019 LOM Study was based on the measured works as per the status of developments on site as well as the information and layout drawings provided as part of the 2019 LOM Study. Based on the site observations as well as information made available the quantum is estimated to be US$60.2 million.
24.6 Risk
The risk assessment process for the LOM Study included a facilitated workshop where many of the significant contributing stakeholders were present.
The risk assessment objectives were as follows:
|
Asanko Gold Inc. NI 43-101 Technical Report on Asanko Gold Mine, Ghana |
-
Involve all stakeholders and rely on their understanding of the Project and their experience, to identify risks appropriate to the Project
-
Determine a risk profile for the Project moving into the following stage and assist in making key decisions
-
Identify risk with a focus on key risks that could significantly impact on the successful delivery of the Project
-
Develop a risk control strategy and plan to manage the identified risks.
Identified high risks, after controls were put in place, are the following:
-
Over land hauling capacity - currently not tested if 5.4 Mt could be hauled on the road from Esaase to Obotan
-
Poor safety as construction is undertaken during operation (while the haul road is being used)
-
Environmental closure liabilities.
In addition, the following risks are worth noting:
-
The haul road design (width of the road) and capex methodology must be reviewed
-
Geotechnical risk associated with pit design - stability will be assessed/ confirmed as mining continues
-
There is potential for extended construction period - increased cost, delayed production due to the influence of the rainy season
-
OC content inherent to mineralised zones within the Esaase ore body - geometallurgical modelling and metallurgical testwork will be on-going
-
Construction materials availability for construction of the TSF must be quantified relative to the final proposed mining schedule.
|
Asanko Gold Inc. NI 43-101 Technical Report on Asanko Gold Mine, Ghana |
25 INTERPRETATION AND CONCLUSIONS
The QP's involved in the compilation of this report have submitted valuable inputs to the risks and recommendations regarding the LOM operations envisaged for the AGM and relevant to their independent sections. These comments are reported below and will form the basis of ongoing operational strategies considered by AGM Management and Board members during the LOM period as reported.
25.1 Project risks
A risk assessment has been conducted as part of the study to generate a risk register for on-going risk management with respect to the Project.
Identified high risks, after controls were put in place, are the following:
-
Over land hauling capacity - Currently not tested if 5.4 Mtpa could be hauled on the road from Esaase to Obotan. Capital estimates to upgrade and improve the current haul road need to be rigorously tested
-
Safety challenges that may arise as construction is undertaken during operation (while the haul road is being used)
-
Environmental closure liabilities.
25.2 Geology and Mineral Resources
Mineral Resource Estimates are reported for six deposits which have all be updated since the previous NI 43-101 report. CSA Global updated the MREs for Nkran, Esaase and Akwasiso. MRE models for Abore, Adubiaso and Asuadai were updated by Asanko JV technical team under supervision of the CSA Global QP.
Nkran
The MRE model for Nkran was constructed using an IK process to define mineralisation volume, followed by OK and LUC gold grade estimation and SMU grade estimation techniques. The model included refinements to the previous geology interpretation and significant validation of the IK selection factors due to the interpretation made possible from a large data base of production grade control drilling available from mining operations from May 2017 to present. Importantly, the IK selection parameters were subsequently guided and adjusted based on improved geology domain inputs and drill hole spacing. No new exploration data was available for the update.
Esaase
The MRE model for Esaase has undergone significant rework since the previous filing in 2017. Extensive re-interpretation of the geology and mineralisation domains, additional infill exploration drilling, bulk density analysis review and studies related to the presence OC within identified lithological units and structural domains and geometallurgical investigations into the possibility of gold preg robbing in the CIL plant. Geology and mineralisation volumes were created as 3D shells using LeapfrogTM software. Gold grade and SMU estimates were generated using a combination of Datamine StudioRMTM and ISATISTM software. OK, UC and LUC were the primary estimation processes. Near surface mining of the oxide material commenced in November 2018. A high level of focus has been encouraged, from the early stages of open pit mining operations, on continued detailed investigation and interpretation of geological and structural mapping, grade control drilling, OC evaluation and sampling and subsequent resource modelling.
|
Asanko Gold Inc. NI 43-101 Technical Report on Asanko Gold Mine, Ghana |
Akwasiso
The Akwasiso deposit was extensively mined during the period November 2017 to March 2019 by Asanko Gold. Using mapping and grade control data obtained during mining, the lateral and below pit extensions of the Akwasiso deposit were re-interpreted and the MRE updated. Additional in-fill drilling was also used in the re-interpretation. The gold grade and SMU estimates were generated using a combination of Datamine StudioRMTM and ISATISTM software. OK, UC and LUC were the primary estimation processes.
Abore, Adubiaso and Asuadai
All three deposits were updated using conditional simulation gold grade estimation methods. Grade control data available from historical mining of Abore and Asuadai was used to adjust the simulation parameters. No new sampling or geological data was available for the updates. All the deposits have been extensively mined by artisanal mining activity in the top 20 to 30 m of the deposits. No depletion surveys were available so the surface areas were classified as Inferred Mineral Resources and thus excluded from the Mineral Reserves.
The CSA Global QP has spent significant time on site at Asanko Gold since September 2016 and is familiar with both the exploration and mining of the 6 deposits. The QP has reviewed the sample data base, QAQC procedures and results, drill core, geological interpretations, mining, mapping, grade control and reconciliation where applicable. The QP is satisfied that above information if suitable for the reported MREs.
25.3 Mining and Reserves
The Nkran pit has been in production since February 2015 with a well-established mining contractor - PW Mining. PW Mining are also currently the contractor mining the Esaase pit which commenced operations in December 2018. The LOM Study is predicated on PW Mining continuing to mine the major pits of Nkran and Esaase, thereby materially de-risking mining deliverables.
In addition, MRevs have been calculated based on standard and conventional mining methodologies as described in Section 15.
25.4 Processing
Over the LOM of the Obotan Complex, in particular the Nkran pit (3.5 years), the plant has achieved consistent recoveries exceeding 93.4%, notwithstanding the treatment of a blended ore comprising Oxides, Transition and Fresh and despite some mineralised lithologies with recorded preg-robbing characteristics.
No material changes to the current plant throughput capacities and infrastructure are required over the LOM.
25.4.1 Process flowsheet
The front-end of the Asanko Gold plant will remain unchanged as an SABC milling circuit processing blended Fresh and Oxide ores from Nkran and Esaase that will be primary crushed at the Obotan plant site. Top size control of the SAG Mill feed will be undertaken with open circuit cone crushing.
The gravity and CIL circuit also remain unchanged and the operation will continue with two elutions per day with the existing electro-winning circuit.
25.4.2 Mill throughput
The throughput capacity of the SABC circuit will be maintained at 5.4 Mtpa initially with a blend of Nkran Fresh and Oxide ores from the Obotan Satellite Pits and some current Oxide ore from Esaase. The Nkran Fresh ore and Obotan Feedstocks will eventually be depleted and replaced with Esaase Fresh and Oxide ores maintaining a throughput rate of 5.4 Mtpa. The Nkran Fresh ore BBWi at 16.3 kWh/t is comparatively harder than the Esaase Fresh at 13.6 kWh/t BBWi. The Esaase ore blend will entail less secondary crusher top size control of the SAG Mill feed with a lower ball charge operation for the SAG mill.
|
Asanko Gold Inc. NI 43-101 Technical Report on Asanko Gold Mine, Ghana |
25.4.3 Recovery
Plant operating data from 2017 till 2019 has been assessed to establish a head grade versus residue grade correlation for blended processing of Nkran Fresh ore and ore from the Obotan Satellite Pits. The calculated LOM recovery for Nkran Fresh ore is 93.6% and the calculated Satellite Pits recovery ranges from 92.6% to 93.3% after a recovery discount of 0.5% for gold losses from carbon fines and soluble gold loss in the CIL.
Esaase Oxide ore recovery has been calculated on a fixed residue value resulting in LOM recoveries of 91.7% to 93.1%, similar to the Obotan Satellite ore. Esaase Fresh and Transition ores have been split into four stratigraphic units that contained varying levels of OC from which recovery relationships were developed to model the recoveries for each of the four stratigraphic units against the LOM head grade. The resultant calculated LOM recovery for Esaase Main was 85.7% and for Esaase South 86.9% which includes the Esaase Oxide ore recovery and is discounted for operational gold losses.
The overall LOM recovery for Nkran Fresh, Obotan Satellite Pits, Esaase Fresh, Transition and Oxide ore recovery is 88.6% and is discounted for operational gold losses.
25.5 Infrastructure
Infrastructure upgrade requirements for the overall Project have been both scoped and the timeline identified for execution. The following is noted in terms of key project infrastructure:
-
Mining is undertaken at Nkran and Esaase as key contributors to the LOM mining schedule
-
Road haulage is currently used to transport up to 2.2 Mtpa ore from Esaase to the Obotan plant - the existing road will be upgraded to accommodate a hauling capacity of 5.4 Mtpa
-
The Obotan process plant currently processes 5.4 Mtpa, and the TSF expansion strategy is geared to match this tonnage throughput.
25.6 Economic analysis outcomes
The economic analysis shows that the gold price would need to decrease below US$1,215/oz for the Project NPV to be negative at a real discount rate of 5% (or US$1,219/oz at a real discount rate of 10%). The spot gold price was US$1,521/oz at 31 December 2019 and the three-year average trailing gold price was US$1,307/oz. The median long-term real gold price of a number of independent brokers reviewed by EY is US$1,400/oz. Considering the spot, three-year average and long-term median broker forecasts gold prices, the economics of Project are considered to be robust, with the Project being able to endure a considerable gold price reduction before proving to be uneconomical.
|
Asanko Gold Inc. NI 43-101 Technical Report on Asanko Gold Mine, Ghana |
26 RECOMMENDATIONS AND CONCLUSIONS
In recognition of Asanko Gold's ongoing commitment to Mineral Resource and Mineral Reserve development, metal production, and cost control, whilst maintaining a high standard of social benefit and environmental compliance, the authors of this technical report recommended the following:
- Geology and Resources
- Nkran
- Continue to review RC sampling QAQC especially field duplicate precision of high grade nuggety samples. If significant high-grade bias >10% is detected, alternate sampling and assay methods should be investigated
- Continue to monitor the primary mineralisation controls by interpretation of grade control data and pit mapping, with primary focus on the Western Bounding Shear, the Western Sandstone, Granite contacts and Central Sandstone
- Review the IK controls used to estimate the mineralisation volumes used for the gold grade estimation
- Ensure production grade control models are constructed using the updated geology interpretation discussed above.
- Esaase
- Continue to monitor and analyse any drill sampling bias between RC and other drilling methods. If the bias exceeds 2% to 3% an investigation to improve RC drill sampling will be required
- With mining having commenced, it is essential that detailed structural and lithological mapping and analysis is applied continuously. Early mapping observations indicate strong visual correlation between vein type, vein orientation and vein density with gold grade continuity. Identification of additional shear structures including thrusting and folding plus N-S dilational zones are critical in production grade control modelling and will provide important data for subsequent MRE improvement and update
- Continuous structural pit mapping is required to improve the understanding and interpretation of the potential 'preg-robbing' carbon zones
- Use of close spaced production grade control data will ensure improvements in variogram structure and ranges
- Review of the IK methodology used in LeapfrogTM for mineralisation volume estimates is required. Alternate methods using Datamine StudioRMTM block model IK processes or conditional simulation are recommended once adequate production grade control data is available for bench marking studies.
- Nkran
- Akwasiso
- Ongoing review of QAQC control on RC samples assayed used bottle roll is required to control the existing 12% under reporting bias
- Continue analysis of pit mapping and grade control data to improve the interpretation of the MRE grade domains
- In-situ dry bulk density sampling and analysis is required as a routine part of production grade control. Limited BD data is available for Akwasiso, especially in the Oxide and Transitional zones.
- Abore, Asuadai and Adubiaso
- Survey void pick-up of artisanal mining workings is required to estimate depletion zones from artisanal mining activity
- Review of upper surface mineral resource classification once artisanal mining depletion activity is better understood.
- Environmental and social
- The ongoing risk of ore depletion by artisanal miners will need to be closely monitored and managed
- Regular local stakeholder engagement particularly on the Tetrem Village resettlement which is currently in progress.
|
Asanko Gold Inc. NI 43-101 Technical Report on Asanko Gold Mine, Ghana |
- Ongoing environmental and social monitoring - the 2019 LOM Study has resulted in some changes from the project description presented in earlier impact assessment studies and will require updating to align the impact assessment and associated mitigation measures with the revised LOM plan.
- Geotechnical risk/pit slope stability
- Additional slope depressurisation measures for the Nkran Cut 2 and Cut 3 slopes
- Update surface water management plans to prevent water ingress into the pits
- Detailed and continuous movement monitoring of the failed sector in Nkran Cut 2
- Continued adherence to SRK geotechnical design recommendations.
- Mining production throughput
- Ongoing maintenance and management and timeous capital upgrade of the 28 km haul road from Esaase to align with the LOM production schedule
- Improved tonnage and grade reconciliation and short-term planning at Esaase is expected as mining progresses resulting in better understanding of the mineralisation controls and continuous improvement of the Asanko Gold MRM business processes.
- Process plant
- It is recommended that further OC mapping is undertaken on the available drill cores and composites that represent the four stratigraphic units. These stratigraphic composites must be subjected to gravity/CIL testwork to establish a more comprehensive geometallurgical model of the Esaase Fresh and Transition ores
- An OC testwork campaign should be planned to develop processing parameters using kerosene to mitigate the effect of preg-robbing of the high OC content on process recovery in the Cobra ore domain.
|
Asanko Gold Inc. NI 43-101 Technical Report on Asanko Gold Mine, Ghana |
27 REFERENCES
Primary documents associated with this Technical Report, by discipline, are referenced below.
Geology
|
Agyei-Duodu, J., Loh, G. K., Boamah, K. O., Baba, M., Hirdes, W., Toloczyki, M., & Davis, D. W., 2009 |
Geological Survey Department of Ghana (GSD) Report. Geological Map of Ghana 1:1,000,000, Accra Ghana. |
|
Asanko Gold, 2019 |
Diagrams, reports, tabulations and correspondence received from the Asanko Gold Inc Owners Team, over the period September to December 2019 |
|
Asiedu, D.K., Asamoah Sakayi, P., Banoeng Yakubo, B., Dampare, S.B., Osae, S., Manu, J., and Nyarko, B.J.B., 2004 |
Geochemistry of Paleoproterozoic metasedimentary rocks from the Birim diamondiferous field, southern Ghana: Implications for provenance and crustal evolution at the Archean-Proterozoic boundary. Geochemical Journal vol 38, pp. 215-228 |
|
Brinkley, M., 2001 |
Resolute Mining, Annual Report 2000, published in 2001, 42pp. |
|
CIM, 2010 |
CIM Definition Standards - For Mineral Resources and Mineral Reserves. Prepared by the CIM Standing Committee on Reserve Definitions. Adopted by CIM Council on 27 November 2010 |
|
CIM, 2014 |
CIM Definition Standards - For Mineral Resources and Mineral Reserves. Prepared by the CIM Standing Committee on Reserve Definitions. Adopted by CIM Council on 10 May 2014 |
|
CJM, 2014 |
Asanko Gold Mine, Ghana 43-101 Technical Report, 2014 |
|
CSA Global, 2019 |
CSA Global Report for the Asanko Gold NI 43-101 Technical Report (2019), prepared by various CSA Global employees, submitted February 2020. |
|
Coffey Mining, 2011 |
Coffey Mining November 2011 Esaase NI 43-101 Technical Report |
|
Davis, D.W., Hirdes, W., Shaltegger, E., and Nunoo, 1994 |
U-Pb age constraints on deposition and provenance of Birimian and gold-bearing Tarkwaian sediments in Ghana, West Africa, Precambrian Research, v.67, pp.89-107 |
|
Dusci, M., & Davies, J., 2014 |
Geological Model Handover Reports for Abore Deposit, Asuadai Deposit and Dynamite Hill Deposit, and Nkran 3D Geological Model and Constraints on Mineralisation, over the 2014 period, for Asanko Gold Inc, on behalf of HMM Consulting. |
|
Eisenlohr, B.N., 1989 |
The structural geology of Birimian and Tarkwaian rocks of southwest Ghana. Rep. Arch. BGR, 66pp |
|
Gleeson, P., 2012 |
SRK Technical Report Obotan Gold Project Mineral Resource Estimation - Update March 2012- Obotan Project, Ghana, 272 pp |
|
Gleeson, P., 2011 |
SRK Report on Sampling Procedures and Protocols - Obotan Project, Ghana |
|
Gold Fields, 2019 |
Diagrams, reports, tabulations and correspondence received from the Gold Fields Owners Team, over the period September to December 2019 |
|
Griffis, R. A., Baring, K., Agezo, F. L. and Akosah, F. K., 2002 |
Gold deposits of Ghana; pp 154-159 and 194 - 200 |
|
Isaaks, E. H. and Srivastava, R. M., 1989 |
An Introduction to Applied Geostatistics, Oxford University Press, New York |
|
JORC Code, 2012 |
The Australasian Code for Reporting of Exploration Results, Mineral Resources and Ore Reserves. Prepared by the Joint Ore Reserves Committee of The Australasian Institute of Mining and Metallurgy, Australian Institute of Geoscientists and Minerals Council of Australia (JORC), 2012 edition |
|
Journel, A.G., and Kyriakidis, P.C., 2004 |
Evaluation of Mineral Reserves, A Simulation Approach, Applied Geostatistics, 232 pp, ISBN: 9780195166941, May 2004 |
|
Junner, N. R., 1932 |
The geology of the Obuasi goldfield, Gold Coast Geological Survey Memoir 2, Accra, 66 pp |
|
Asanko Gold Inc. NI 43-101 Technical Report on Asanko Gold Mine, Ghana |
|
Junner, N. R., 1935 |
Gold in the Gold Coast, Gold Coast Geological Survey Memoir 4, Accra, 67 p; |
|
Leube, A., Taylor, P., Moorbath, S., Hirdes, W., 1990 |
Early Proterozoic crustal evolution in the Birimian of Ghana: constraints from geochrono-logy and isotope geochemistry; Precambrian Research, Volume 56, Issues 1-2, April 1992, Pages 97-111 |
|
McCuaig, C. and Williams, P., 2002 |
Review of structural controls on mineralisation and regional prospectivity of the Obotan project, Ghana, report compiled by SRK Consulting for Resolute-Amansie Limited, 53 pp |
|
Milesi, J.P., Ledru, P., Feybesse, J.L., Dommanget, A. and Marcoux, E., 1992 |
Early Proterozoic Ore Deposits and Tectonics of the Birimian Orogenic Belt, West Africa. Precambrian Research, 58, 305-344, published 1992 |
|
Minxcon, 2012 |
Esaase NI 43-101 Technical Report, November 2012 |
|
Resolute-Adansi, 1995 |
Resolute Mining's Nkran Project Resource -Reserve Report |
|
Siddorn, J and Lee, C, 2005 |
Structural Geology of the Ashanti II Concessions, Southwest Ghana, report compiled by SRK Consulting for PMI Ventures Ltd., 78 pp |
|
Spiers, R, 2011 |
Technical Report: Obotan Mineral Resources Estimation and Ashanti II Gold Projects, Ghana, amended and restated Technical Report submitted by PMI Gold Corporation to the TSX, and lodged on SEDAR, 226 pp |
Geotechnical and Mining
|
Haines, A. and Terbrugge, P. J., 1991 |
Preliminary estimation of rock slope stability using rock mass classification systems. 7th International Conference on Rock Mechanics Proceedings, Volume 2, pp 887 - 892. Aachen, Germany |
|
Hellman and Schofield, 2010 |
Available NI 43-101 report reflecting the project status earlier in the Adansi Gold resource drilling project |
|
Laubscher, D.H., 1990 |
A geomechanics classification system for the rating of rock mass in mine design. Journal of the South African Institute of Mining and metallurgy, Vol 90, No 10, pp 257-273 |
|
Knight Piésold Consulting, 2011 |
Obotan Gold Project - Preliminary Groundwater Assessment |
|
Read, J., 2009 |
Guidelines for Open Pit Slope Design. (Ed: Read, J and Stacey, P) CSIRO Publishing, Australia 496pp |
|
Rocscience, 2002a |
Dips Version 5.0 User's Manual. Rocscience Inc. Toronto |
|
Rocscience, 2002b |
Slide© Version 5.0 User's Manual. Rocscience Inc., Toronto |
|
SEMS, 2011 |
SEMS Technical Services (SEMS), Mining scoping study, Obotan Gold Project Ashanti Region Ghana |
|
SRK, 2004 |
Williams and McCuaig - available data presents a structural assessment of gold mineralisation. Some information on major geological structures can be inferred from the referenced mapping |
|
SRK, 2005 |
Final Appraisal of the Ashanti II Deeps Gold Project Concessions, Ghana West Africa - report providing an assessment of the project Fair Market Value |
|
SRK, 2011 |
Gleeson - available data presents status of geological studies following a site visit early in 2011 |
|
SRK, 2012 |
Obotan Gold Project - Mining Geotechnics Feasibility Study Summary Report, June 2012 |
|
SRK, 2019 |
Various geotechnical reports, including design parameters, over the 2019 period, on the Asanko Gold Mine for Asanko Gold Inc, 2019 |
|
Stephenson, P.R., Allman, A., Carville, D.P., Stoker, P.T., Mokos, P., Tyrell, J., and Burrow, T., 2006, Stephenson et al., 2006 |
Mineral Resource Classification - It's Time to Shoot the "Spotted Dog": 6th International Mining Geology Conference, 6 p |
Processing
|
Asanko Gold Inc. NI 43-101 Technical Report on Asanko Gold Mine, Ghana |
|
Adansi PMI/GREng, ALS, Nkran, 2012 |
Comminution Parameters, Gravity Concentration, Flotation, Cyanidation, Cyanide Destruction |
|
Adansi PMI/GREng, IMO, Nkran, 2013 |
Flotation |
|
Adansi PMI/GREng, Metallurgy, Dynamite Hill, 2014 |
Comminution Parameters, Gravity Concentration, Flotation, Cyanidation, Cyanide Destruction |
|
ALS, 2014 |
Metallurgical Testwork Conducted upon samples from the Esaase Gold Project for DRA Mineral Projects /Asanko Gold Inc, ALS Metallurgy, report No. A15168, March 2014 |
|
ALS, 2017 |
Metallurgical Testwork (Phase 2) Conducted upon samples from the Esaase & Obotan Gold Project for DRA Mineral Projects /Asanko Gold Inc, ALS Metallurgy, report No. A16645, July 2016 (Revised March 2017) |
|
Amdel, 1999 |
Comminution Tests, Obotan Project", Amdel Ltd, Job No. N036C099, April 1999 |
|
Amdel, 2013 |
Pre-Feasibility Testwork for the Esaase Gold Project for DRA Mineral Projects, Amdel Pty Ltd, Project No. 3486, including Addendum to Report, May 2013 |
|
Ammtec, 1999 |
Metallurgical Testwork conducted upon Primary Ore Samples from the Nkran Gold Deposit for Resolute Limited, Ammtec Ltd, Report No. A6701, May 1999 |
|
Ammtec, 2001 |
Ammtec Ltd, Report No. A7594, March 2001 |
|
Ammtec, 2012 |
ALS Ammtec Report No A13906, Metallurgical Testwork conducted upon Obotan Ore Samples for Adansi Gold Company (Gh) /GR Engineering Services, February 2012 |
|
Asanko/DRA, SGS, Nkran, Dynamite Hill, Adubiaso, Abore, 2015 |
Variability: Gravity Concentration, Cyanidation undertaken in 2015 |
|
Asanko/DRA, Amdel, Esaase Oxide Trans and Fresh, 2012 - 2013 |
Comminution - Grindmill, Gravity Concentration, Flotation, Flotation Concentrate CIL, Gravity Tails CIL completed over the 2012 to 2013 period |
|
Asanko/DRA, ALS, Esaase Oxide Trans and Fresh, 2013 - 2014 |
Gravity Concentration, Flotation, Flotation Concentrate CIL, Variability - Flotation + CIL, Cyanide Destruction, Arsenic Precipitation, over the 2013 to 2014 period |
|
Asanko/DRA, FLS Knelson, Esaase Oxide Trans and Fresh, 2012 |
GRG test work and modelling completed in 2012 |
|
Asanko/DRA, Metso, Esaase, 2013 |
SMD Regrind Test undertaken in 2013 |
|
Asanko/DRA, DRA Tech, Esaase Oxide and Fresh, 2013 |
Bulk Solids Handling undertaken in 2013 |
|
Asanko/DRA, ALS, Esaase Oxide, Trans + Fresh Nkran Fresh, 2014 - 2015 |
Comminution Parameters, Gravity Concentration, Gravity + Flotation, Gravity + CIL, Rheology, undertaken over the 2014 to 2015 period |
|
Asanko/DRA, ALS, 2016 |
Gravity Concentration, Gravity + Flotation + Leach, Gravity + CIL, Carbon Adsorption |
|
DRA, 2015 |
Asanko Gold Project Phase 2 Pre-feasibility Study, DRA 2015 |
|
DRA, 2017 |
AGM Expansion Project FS report JGHDP0221-RPT-007, DRA 2017 |
|
GRES, 2012 |
Obotan Gold Project Pre-feasibility Study, GRES, 11831 0184, February 2012 |
|
IMO, 2014 |
Obotan Gold Project, Gold Flotation Testwork and Interpretation, Project 5498, May 2014 |
|
Keegan/Lycopodium, Amdel, Esaase Oxide Trans and Fresh, 2010 - 2011 |
Phase III (PFS), Gravity Concentration, Cyanidation, Flotation, Variability - Gravity + CIL, Cyanide Destruction over the 2010 and 2011 periods |
|
Keegan/Lycopodium, Terra Mineralogy Services, Esaase Oxide Trans and Fresh, 2010 |
Mineralogy studies completed in 2010 |
|
Asanko Gold Inc. NI 43-101 Technical Report on Asanko Gold Mine, Ghana |
|
Keegan/Lycopodium, Amdel OMC, Esaase Oxide Trans and Fresh, 2010 - 2011 |
Comminution Test Work and Modelling undertaken over the period 2010 to 2011 |
|
Keegan/Lycopodium, Knelson, Esaase Oxide Trans and Fresh, 2010 |
GRG test work and modelling undertaken in 2010 |
|
Keegan/Lycopodium, Outotec, Esaase Oxide Trans and Fresh, 2010 |
Thickening studies undertaken in 2010 |
|
Keegan/Lycopodium, Amdel, Esaase Oxide Trans and Fresh, 2011 - 2012 |
Enhanced gravity (Spirals), Cyanidation, Variability - Enhanced gravity + CIL, completed over the period 2011 to 2012 |
|
Keegan/Lycopodium Asanko/DRA, EGI, 2011 2015 |
Geochem & Groundwater studies undertaken over the 2011 to 2015 period |
|
Lycopodium, 1995 |
Obotan Gold Project Feasibility Study, Lycopodium Pty Ltd, Job No. 895, July 1995 |
|
Oretest, 1997a |
Metallurgical Testwork on Composite Samples from Ghana, Oretest Pty Ltd, Job No. 7051 4 February 1997 |
|
Oretest, 1997b |
Metallurgical Testwork on Composite Samples from Ghana - Batch 2, Ore test Pty Ltd, Job No. 7145, 3 December 1997 |
|
Oretest, 1998 |
Metallurgical Testwork on Composite Samples from the Nkran Gold Deposit in Ghana, Oretest Pty Ltd, Job No. 7690, July 17th, 1998 |
|
Oretest |
Adubiaso Metallurgical Testwork, Oretest Pty Ltd, Job No. 7942 |
|
Metallurgy, 2014 |
Metallurgy Pty Ltd, Dynamite Hill Gold Project Testwork Report, Project M072, March 2014 |
|
Resolute, Nkran Adubiaso, 1995 - 2001 |
Comminution Parameters, Gravity Concentration, Cyanidation, Diagnostic Leach, Carbon Loading, Settling & Rheology |
|
SGS, 2015 |
SGS South Africa Pty Ltd, Gravity Separation and Cyanidation Testwork on Ten Composite Samples from the Obotan Project, Metallurgical Report No 14/522 (Amended), January 2015 |
Legal and title
Kimathi and Partners, July 2014. Title Report for the Asanko Gold Mine. Internal Asanko Gold document.
Infrastructure
Knight Piésold Consulting - Asanko LOM TSF Upgrade November 2019
Phoenix Mine Planning - Asanko Esaase Haul Road Optimisation Report November 2019
DRA Global - Asanko Haul Road Upgrade Engineering Design Report November 2019
HR Wallingford, 2015. SuDS Manual (C753), CIRIA (led by HR Wallingford), November 2015; Preliminary rainfall runoff management for developments.
Mining One Consulting, 2014. Review of slope design for Obotan Project, July 2014.
Thompson, R, 2018. Mining Haul Roads, Theory and Practice, 11 December 2018, 315pp.
African Environmental Research & Consulting Company (AERC) reports, over the period 2013 to 2016, including an ESIA Report, baseline reports and scoping report.
|
Asanko Gold Inc. NI 43-101 Technical Report on Asanko Gold Mine, Ghana |
28 DATES AND SIGNATURE
Each QP certificate in Section 29 contains a date and signature for each QP, with regards the NI 43-101 Technical Report on the expansion of the Asanko Gold Mine, Ghana.
|
Asanko Gold Inc. NI 43-101 Technical Report on Asanko Gold Mine, Ghana |
29 CERTIFICATE OF QUALIFIED PERSON
David Michael Begg
CERTIFICATE of AUTHOR
This Certificate of Author has been prepared to meet the requirements of National Instrument 43-101 Standards of Disclosure for Minerals Projects as published 30 June 2011, Part 8.1.
a. Name, Address, Occupation
David Michael Begg
11 Sputnik Crescent, Fourways, Johannesburg, RSA, 2198,
Senior Vice President Technical Services for Asanko Gold Inc.
b. Title and Effective Date of Technical Report
NI 43-101 Technical Report for the Asanko Gold Mine, Ghana (Amended and Restated).
Amended and Restated: May 29, 2020 (Information as at February 15, 2020)
Effective date: 31 December 2019.
c. Qualifications
Honours Degree in Geology from University of Cape Town (UCT) (BSc Hons Geology).
Registered with the Geological Society for South Africa (GSSA).
Registered with the South African Council of Natural Scientists (SACNASP)
I have over 25 years' gold experience in operational mining, senior mine management, project planning and execution, technical due diligence and mineral resource and reserve estimation.
I have read the definition of "qualified person" set out by National Instrument 43-101 and certify that, by reason of my education, affiliation with a professional association (as defined in NI 43-101) and past relevant work experience.
I am a "Qualified Person" for the purposes of the Instrument.
d. Site Inspection
I have visited the Project on many occasions over the last 18 months of employment with Asanko Gold Inc.
Date for most recent visit to site: 12th - 15th February 2020
e. Responsibilities
I am responsible for Sections 1.1 to 1.4, 1.10, 1.11, 1.14 and 1.15, 2 to 6, 7.1, 7.2, 9, 18, 21.1, 23, 24.2, 24.3, 25 and 26 in this Technical Report.
f. Independence
I am currently employed by Asanko Gold Inc. as Senior Vice President - Technical Services (since May 2018 to date).
g. Prior Involvement
I have been actively involved with the Asanko Gold Mine in the last 18 months.
h. Compliance with NI 43-101
I have read National Instrument 43-101 and Form 43-101F1 and the Technical Report has been prepared in compliance with same.
i. Disclosure
As of the effective date of the Technical Report, to the best of my knowledge, information and belief, the Technical Report contains all scientific and technical information that is required to be disclosed to make the Technical Report not misleading.
| "David Michael Begg" | June 9, 2020 | |
|
David Michael Begg BSc (Hons) Geology. GSSA, SACNASP |
Date |
|
Asanko Gold Inc. NI 43-101 Technical Report on Asanko Gold Mine, Ghana |
Malcolm Titley
CERTIFICATE of AUTHOR
This Certificate of Author has been prepared to meet the requirements of National Instrument 43-101 Standards of Disclosure for Minerals Projects as published 30 June 2011, Part 8.1.
a. Name, Address, Occupation
Malcolm Titley
46 Barttelot Road, Horsham, England, RH12 1DQ
Geologist - Associate Principal Consultant CSA Global (UK) Limited
b. Title and Effective Date of Technical Report
NI 43-101 Technical Report for the Asanko Gold Mine, Ghana (Amended and Restated).
Amended and Restated: May 29, 2020 (Information as at February 15, 2020)
Effective date: 31 December 2019.
c. Qualifications
BSc Geology and Chemistry, University of Cape Town, South Africa, 1979
Member AIG and AusIMM
38 years of experience in the mining industry, over 20 years directly employed in mining operations with 18 years consulting. Over 20 years gold mining and consulting with emphasis of feasibility studies, resource estimation, grade control and production management.
I am a "Qualified Person" for the purposes of the Instrument.
d. Site Inspection
Regular site visits since September 2016 (on average 1 visit per quarter, minimum of 7 days per visit). Relevant deposits visited: Nkran, Esaase, Akwasiso, Adubiaso, Abore and Asuadai.
Reviewed: Sample database; QAQC; drill core; site surface geology and available drill collars; production reconciliation data for Nkran, Esaase and Akwasiso; third party MRE's and in-house MRE preparation work.
Dates for most recent visit to site: 16th to 23rd January 2020.
e. Responsibilities
I am responsible for Sections 1.5, 1.14, 1.15, 7.3, 8, 10, 11, 12, 14, 25.2 and 26, relating to all deposits reported in this Technical Report.
f. Independence
I am independent of Asanko Gold Inc. in accordance with the application of Section 1.5 of National Instrument 43-101. I am a consultant to Asanko Gold Ghana through my independent company Maja Mining Limited providing Business Improvement support since September 2016 in mine geology and mine production.
g. Prior Involvement
I was QP for the December 2017 Nkran, Akwasiso and Dynamite Hill deposits Mineral Resource Estimate.
h. Compliance with NI 43-101
I have read National Instrument 43-101 and Form 43-101F1 and the Technical Report has been prepared in compliance with same.
i. Disclosure
As of the effective date of the Technical Report, to the best of my knowledge, information and belief, the Technical Report contains all scientific and technical information that is required to be disclosed to make the Technical Report not misleading.
| "Malcolm Titley" | June 9, 2020 | |
|
Malcolm Titley BSc Geology and Chemistry MAIG; MAusIMM |
Date |
|
Asanko Gold Inc. NI 43-101 Technical Report on Asanko Gold Mine, Ghana |
Jonathan Hudson
CERTIFICATE of AUTHOR
This Certificate of Author has been prepared to meet the requirements of National Instrument 43-101 Standards of Disclosure for Minerals Projects as published 30 June 2011, Part 8.1.
a. Name, Address, Occupation
Jon Hudson
54 Northcliff Drive, Northcliff, Johannesburg, RSA, 2195
Associate Mining Engineer CSA Global (UK) Limited
b. Title and Effective Date of Technical Report
NI 43-101 Technical Report for the Asanko Gold Mine, Ghana (Amended and Restated).
Amended and Restated: May 29, 2020 (Information as at February 15, 2020)
Effective date: 31 December 2019.
c. Qualifications
Honours Degree in Mining Engineering from Newcastle in the UK (B.Eng. (Hons)).
Registered as a Professional Engineer (Pr. Eng.) with the Engineering Council for South Africa (ECSA).
Fellow of the Southern African Institute of Mining and Metallurgy (FSAIMM).
MBA from Wits Business School, Johannesburg, RSA
I have over 28 years' experience in operational mining engineering, project planning and execution, technical due diligence and mineral reserve estimation which includes over 16 years' gold mining experience.
I have read the definition of "qualified person" set out by National Instrument 43-101 and certify that, by reason of my education, affiliation with a professional association (as defined in NI 43-101) and past relevant work experience, I fulfil the requirements to be a "Qualified Person" for the purposes of the Instrument.
d. Site Inspection
I have visited the Project site from 7 -11 April 2019
e. Responsibilities
I am responsible for Sections 1.6, 1.7, 1.11, 1.12, 1.14, 1.15, 15, 16 (excl. 15.2.3 & 16.2), 25.3 and 26.
f. Independence
I am independent of Asanko Gold Inc. in accordance with the application of Section 1.5 of National Instrument 43-101.
g. Prior Involvement
I have no prior involvement working for Asanko
h. Compliance with NI 43-101
I have read National Instrument 43-101 and Form 43-101F1 and the Technical Report has been prepared in compliance with same.
i. Disclosure
As of the effective date of the Technical Report, to the best of my knowledge, information and belief, the Technical Report contains all scientific and technical information that is required to be disclosed to make the Technical Report not misleading.
| "Jonathan Hudson" | June 9, 2020 | |
|
Jonathan Hudson B.Eng. (Hons), FSAIMM |
Date |
|
Asanko Gold Inc. NI 43-101 Technical Report on Asanko Gold Mine, Ghana |
Glenn Bezuidenhout
CERTIFICATE of AUTHOR
This Certificate of Author has been prepared to meet the requirements of National Instrument 43-101 Standards of Disclosure for Minerals Projects as published 30 June 2011, Part 8.1.
a. Name, Address, Occupation
Glenn Bezuidenhout
Senior Vice President of DRA Projects SA (Pty) Limited
DRA Minerals Park, 3 Inyanga Close, Sunninghill, 2157, South Africa
b. Title and Effective Date of Technical Report
NI 43-101 Technical Report for the Asanko Gold Mine, Ghana (Amended and Restated).
Amended and Restated: May 29, 2020 (Information as at February 15, 2020)
Effective date: 31 December 2019.
c. Qualifications
I graduated from Witwatersrand Technicon (Johannesburg, South Africa), with a National Diploma (Extractive Metallurgy) in 1979, and I have carried out my profession continuously since then. I am a Fellow member in good standing of the South African Institute of Mining and Metallurgy (FSAIMM), with SAIMM membership number 705704. My relevant experience includes 25 years engineering involvement in 18 mineral processing and mining projects and 13 years of plant operations experience. The most recent gold project that I have completed was New Liberty Gold for Aureus in 2015. I have read the definition of "qualified person" set out in NI 43-101 ("the Instrument") and certify that by reason of my education, affiliation with a professional association and past relevant work experience, I am a "Qualified Person" for the purposes of the Instrument.
d. Site Inspection
I have not visited the Project site. However, DRA Projects designed and commissioned the phase 1 process plant and I possess sufficient knowledge and understanding of the metallurgical process to not necessitate a site visit.
e. Responsibilities
I am responsible for Sections 1.8, 1.12, 1.14, 1.15, 13, 17, 21.2, 25.4 and 26 (process plant).
f. Independence
I am independent of Asanko Gold Inc. in accordance with the application of Section 1.5 of National Instrument 43-101.
g. Prior Involvement
I have had prior involvement with the property - the 2017 Feasibility Study for Asanko Gold Inc and associated NI 43-101 Technical Report.
h. Compliance with NI 43-101
I have read National Instrument 43-101 and Form 43-101F1 and the Technical Report has been prepared in compliance with same.
i. Disclosure
As of the effective date of the Technical Report, to the best of my knowledge, information and belief, the Technical Report contains all scientific and technical information that is required to be disclosed to make the Technical Report not misleading.
| "Glenn Bezuidenhout" | June 9, 2020 | |
|
Glenn Bezuidenhout |
Date |
|
Asanko Gold Inc. NI 43-101 Technical Report on Asanko Gold Mine, Ghana |
Jeffrey Coffin
CERTIFICATE of AUTHOR
This Certificate of Author has been prepared to meet the requirements of National Instrument 43-101 Standards of Disclosure for Minerals Projects as published 30 June 2011, Part 8.1.
a. Name, Address, Occupation
Jeffrey G Coffin, Ph.D., P.E.
No. 20 Second Close
Airport Residential, Accra, Ghana
Knight Piésold, Regional Manager, West Africa
b. Title and Effective Date of Technical Report
NI 43-101 Technical Report for the Asanko Gold Mine, Ghana (Amended and Restated).
Amended and Restated: May 29, 2020 (Information as at February 15, 2020)
Effective date: 31 December 2019.
c. Qualifications
I have 14 years' experience in the mining sector as a geotechnical engineer. Most recently as Knight Piésold's Regional Manager for West African operations performing Engineer of Record (EoR) responsibilities for 5 mine sites within Ghana, including the Asanko Gold Mine. Prior to this, experience included lead geotechnical engineer, designer, and/or Knight Piésold's internal third-party technical reviewer for multiple TSFs as part of Knight Piésold's US practice. Facilities are located in the USA, Canada, Peru, Chile, Ghana, Colombia, Saudi Arabia, and Brazil.
14 years' experience in the mining sector as a geotechnical engineer.
Ph.D. Geotechnical Engineering, University of Colorado, USA
M.S. Civil Engineering, University of Colorado, USA
B.S. Civil Engineering, University of Colorado, USA
Professional Engineer (P.E.) USA # PE0049966
I am a "Qualified Person" for the purposes of the Instrument.
d. Site Inspection
Semi-annual site inspections in 2018 and 2019 for dam safety audits at the Asanko TSF. Regular ad-hoc inspections throughout 2019 as part of Life of Mine Study and NI43-101 support.
Dates for most recent visit to site: 8 July 2019
e. Responsibilities
Engineer of Record for the Asanko TSF. Review and complete engineering analyses conducted in support of Life of Mine designs for the Asanko TSF. Sign-off and approval of all reporting documents for Knight Piésold Ghana Ltd for the NI43-101 and study (sections 1.11, 24.4 and 21.1 (TSF lift Capex)).
f. Independence
I am independent of Asanko Gold Inc. in accordance with the application of Section 1.5 of National Instrument 43-101.
g. Prior Involvement
Participated in the TSF Stage 4 design, Stage 4 construction (CQA), Stage 5 design, Life of Mine alternatives assessment, Life of Mine planning in support of the NI43-101 (Knight Piésold report: AC301-00627_20 Asanko LoM TSF PFS Update).
h. Compliance with NI 43-101
I have read National Instrument 43-101 and Form 43-101F1 and the Technical Report has been prepared in compliance with same.
i. Disclosure
As of the effective date of the Technical Report, to the best of my knowledge, information and belief, the Technical Report contains all scientific and technical information that is required to be disclosed to make the Technical Report not misleading.
| "Jeffrey Coffin" | June 9, 2020 | |
|
Jeffrey G Coffin |
Date |
|
Asanko Gold Inc. NI 43-101 Technical Report on Asanko Gold Mine, Ghana |
Desmond Mossop
CERTIFICATE of AUTHOR
This Certificate of Author has been prepared to meet the requirements of National Instrument 43-101 Standards of Disclosure for Minerals Projects as published 30 June 2011, Part 8.1.
a. Name, Address, Occupation
Desmond Hancke Mossop, B.Tech., N.Dip., COMREC, Pr.Sci.Nat. (SACNASP) of Johannesburg, Gauteng Province, South Africa do hereby certify that: I am a Partner and Principal Engineering Geologist, Mining Geotechnics, with SRK (South Africa) (Pty) Ltd. (265 Oxford Road, Illovo, Johannesburg, 2196, South Africa)
b. Title and Effective Date of Technical Report
NI 43-101 Technical Report for the Asanko Gold Mine, Ghana (Amended and Restated).
Amended and Restated: May 29, 2020 (Information as at February 15, 2020)
Effective date: 31 December 2019.
c. Qualifications
I graduated from the Tshwane University of Technology (N.Dip.: Geology) in Tshwane (Pretoria), South Africa in 1995 and 1997 (B.Tech.: Eng. Geol.) and have practiced my profession continuously since graduation. I am registered with the South African Chamber of Mines with a Rock Engineering Certificate (COMREC) in Surface Mining (Certificate # 596). I am a member in good standing of the Geological Society of South Africa (Member # 969029), and the South African National Institute of Rock Engineering (Member # M200). I am registered with the South African Council for Natural Scientific Professions (SACNASP) as a professional Earth Scientist in the practice of Rock Mechanical Sciences (Registration # 400172/07)
I am a "Qualified Person" for the purposes of the Instrument.
d. Site Inspection
I have visited the Asanko Gold Mine operations in Obotan, Ghana on a regular basis since September 2016, with the most recent visit being in January 2020
e. Responsibilities
I am responsible for mining geotechnical assessments relating to the document including Sections 1.14, 1.15, 15.2.3, 16.2 and 26 of this Technical Report.
f. Independence
I am independent of Asanko Gold Inc. in accordance with the application of Section 1.5 of National Instrument 43-101.
g. Prior Involvement
I have been involved in providing the Asanko Gold Mine with geotechnical consulting services since September 2016, with no prior involvement before this date;
h. Compliance with NI 43-101
I have read National Instrument 43-101 and Form 43-101F1 and the Technical Report has been prepared in compliance with same.
i. Disclosure
As of the effective date of the Technical Report, to the best of my knowledge, information and belief, the Technical Report contains all scientific and technical information that is required to be disclosed to make the Technical Report not misleading.
| "Desmond Mossop" | June 9, 2020 | |
|
Desmond Mossop |
Date |
|
Asanko Gold Inc. NI 43-101 Technical Report on Asanko Gold Mine, Ghana |
Jeffrey Stevens
CERTIFICATE of AUTHOR
This Certificate of Author has been prepared to meet the requirements of National Instrument 43-101 Standards of Disclosure for Minerals Projects as published 30 June 2011, Part 8.1.
a. Name, Address, Occupation
Jeffrey Peter Stevens
Studies & Project Manager
Wood Mining South Africa (Pty) Ltd
Building No. 2, Silver Stream Business Park
10 Muswell Road South, Bryanston, Johannesburg, 2021
b. Title and Effective Date of Technical Report
NI 43-101 Technical Report for the Asanko Gold Mine, Ghana (Amended and Restated).
Amended and Restated: May 29, 2020 (Information as at February 15, 2020)
Effective date: 31 December 2019.
c. Qualifications
National Diploma Extractive Metallurgy (1985)
BSc (Chem. Eng.) (1989)
Professional Engineer, Engineering Council of South Africa (1992)
Member of South African Institute of Mining and Metallurgy
Member of Institution of Chemical Engineers
Over 30 years' experience in the metallurgical/chemical industry in a variety of processes including gold, uranium, base metals, ferrochrome and platinum group metals. Management and successful delivery of feasibility studies through to completion of execution. Experience has included both the implementation and peer review of a significant number of feasibility studies including the compilation, co-ordination of compilation and review of capital and operating cost estimates.
I am a "Qualified Person" for the purposes of the Instrument.
d. Site Inspection
No site inspection was conducted
e. Responsibilities
Overall project management of the updated Life of Mine (LOM) Study of the Asanko Gold Mine (AGM). Responsibilities included co-ordination and review of the compilation of overall capital and operating cost estimates, project execution outputs, and risk management. Specifically, sections 1.11, 1.12, 1.14, 1.15, 21.1, 21.2, 24.1, 24.6, 25.1 and 26 of the Technical Report.
f. Independence
I am independent of Asanko Gold Inc. in accordance with the application of Section 1.5 of National Instrument 43-101.
g. Prior Involvement
I have no prior involvement working for Asanko.
h. Compliance with NI 43-101
I have read National Instrument 43-101 and Form 43-101F1 and the Technical Report has been prepared in compliance with same.
i. Disclosure
As of the effective date of the Technical Report, to the best of my knowledge, information and belief, the Technical Report contains all scientific and technical information that is required to be disclosed to make the Technical Report not misleading.
| "Jeffrey Stevens" | June 9, 2020 | |
|
Jeffrey Stevens Pr.Eng. |
Date |
|
Asanko Gold Inc. NI 43-101 Technical Report on Asanko Gold Mine, Ghana |
Fanie Coetzee
CERTIFICATE of AUTHOR
This Certificate of Author has been prepared to meet the requirements of National Instrument 43-101 Standards of Disclosure for Minerals Projects as published 30 June 2011, Part 8.1.
a. Name, Address, Occupation
Fanie Coetzee
Block C Suite 2, Carlswald Close Office Park, c/o New & 7th Roads, Carlswald, 1685, JHB South Africa
Environmental Scientist
b. Title and Effective Date of Technical Report
NI 43-101 Technical Report for the Asanko Gold Mine, Ghana (Amended and Restated).
Amended and Restated: May 29, 2020 (Information as at February 15, 2020)
Effective date: 31 December 2019.
c. Qualifications
B.Sc Hons Environmental Management (1997) North West University, South Africa.
Registered with the South African Council for Natural Scientific Professions as an Environmental Scientist (registration number 40044/04).
I am the Director of ABS Africa and have been involved as an environmental scientist in the mining, infrastructure and energy industries since 1997. My experienced covers the fields of sustainability and environmental management, with exposure to various projects and operations in the mining, infrastructure and energy sectors in South Africa, Zambia, Tanzania, Mali, Guinea, Ghana, Sudan, Botswana, Mozambique, Namibia, Armenia and Burkina Faso. My experience includes assessment of socio-economic aspects relating to projects and existing operations in Africa where a diverse range of cultures and socio-economic circumstances exist.
I am a 'Qualified Person" for the purposes of the Instrument.
d. Site Inspection
A site inspection undertaken 8th to 10th October 2019.
e. Responsibilities
I am responsible for environmental and social development aspects relating to the document including relevant parts of the Executive Summary and Conclusions and Recommendations as well as Reclamation and Closure Cost Estimate. This includes specifically Sections 1.9, 1.11, 1.14, 1.15, 20, 21.1, 24.5, 25.1 and 26 of this Technical Report.
f. Independence
I am independent of Asanko Gold Inc. in accordance with the application of Section 1.5 of National Instrument 43-101.
g. Prior Involvement
I was involved in the Environmental and Social Impact Assessment and Pre-Feasibility Study (PFS) (2011 to 2013) and the Asset Retirement Obligation (ARO) Assessment (2016 and 2019)
h. Compliance with NI 43-101
I have read National Instrument 43-101 and Form 43-101F1 and the Technical Report has been prepared in compliance with same.
i. Disclosure
As of the effective date of the Technical Report, to the best of my knowledge, information and belief, the Technical Report contains all scientific and technical information that is required to be disclosed to make the Technical Report not misleading.
| "Fanie Coetzee" | June 9, 2020 | |
|
Fanie Coetzee Pr.Sci.Nat |
Date |
|
Asanko Gold Inc. NI 43-101 Technical Report on Asanko Gold Mine, Ghana |
Godknows Njowa
CERTIFICATE of AUTHOR
This Certificate of Author has been prepared to meet the requirements of National Instrument 43-101 Standards of Disclosure for Minerals Projects as published 30 June 2011, Part 8.1.
a. Name, Address, Occupation
Dr Godknows Njowa
Executive Director
Ernst & Young Advisory Services Limited
102 Rivonia Road, Sandton, Gauteng, South Africa
b. Title and Effective Date of Technical Report
NI 43-101 Technical Report for the Asanko Gold Mine, Ghana (Amended and Restated).
Amended and Restated: May 29, 2020 (Information as at February 15, 2020)
Effective date: 31 December 2019.
c. Qualifications
PhD. Mining Engineering
Professional Qualification: Corporate Governance and Financial Accounting (CIS)
M.Sc Mining Engineering specialising in Mineral Resources Management (Cum Laude)
Certificate: Securities Investment Analysis;
Postgraduate Certificate Mining Tax Law Certificate
Doctorate in Mineral Asset Valuation and Financial Reporting
Professional Engineer Engineering Council of South Africa
Member Australian Institute of Mining and Metallurgy;
Member South African Institute of Mining and Metallurgy
My relevant experience for the purpose of the Technical Report is:
- Mineral Reserve estimation, economic analysis and preparation of NI 43-101 Technical Reports.
- Mineral Asset valuation, evaluation, due diligence, corporate review and audit on exploration projects and mining operations worldwide.
- Senior Manager, with Venmyn Deloitte, responsible for economic analysis, financial evaluation, financial modelling and reporting for gold, rare Earths projects in the Africa and Kazakhstan
- Economic analysis for impairment testing for Gold mining operations worldwide.
I am a "Qualified Person" for the purposes of the Instrument.
d. Site Inspection
A site visit was carried out to AGM from 11th to 13th of November 2019.
e. Responsibilities
I am responsible for financial modelling assessment relating to the document (Sections 1.13, 19, 22 and 25.6).
f. Independence
I am independent of Asanko Gold Inc. in accordance with the application of Section 1.5 of National Instrument 43-101.
g. Prior Involvement
Godknows was involved in preparing and signing off on the economic analysis of the "Asanko Gold Mine Definitive Feasibility Study, National Instrument 43-101 Technical Report" in 2017
h. Compliance with NI 43-101
I have read National Instrument 43-101 and Form 43-101F1 and the Technical Report has been prepared in compliance with same.
i. Disclosure
As of the effective date of the Technical Report, to the best of my knowledge, information and belief, the Technical Report contains all scientific and technical information that is required to be disclosed to make the Technical Report not misleading.
| "Godknows Njowa" | June 9, 2020 | |
|
Godknows Njowa PhD Mining Engineering, Pr.Eng. Ernst & Young Advisory Services (Pty) Ltd |
Date |