UNITED STATES
SECURITIES AND EXCHANGE COMMISSION
Washington, D.C. 20549
FORM
QUARTERLY REPORT PURSUANT TO SECTION 13 OR 15(d) OF THE SECURITIES EXCHANGE ACT OF 1934 |
For the quarterly period ended
OR
TRANSITION REPORT PURSUANT TO SECTION 13 OR 15(d) OF THE SECURITIES EXCHANGE ACT OF 1934 |
For the transition period from to
Commission file number:
(Exact Name of Registrant as Specified in Its Charter)
(
(Registrant’s telephone number, including area code)
Securities registered pursuant to Section 12(b) of the Act:
Title of each class: |
| Trading Symbol |
| Name of each exchange on which registered: |
Indicate by check mark whether the registrant (1) has filed all reports required to be filed by Section 13 or 15(d) of the Securities Exchange Act of 1934 during the preceding 12 months (or for such shorter period that the registrant was required to file such reports), and (2) has been subject to such filing requirements for the past 90 days.
Indicate by check mark whether the registrant has submitted electronically every Interactive Data File required to be submitted pursuant to Rule 405 of Regulation S-T (§232.405 of this chapter) during the preceding 12 months (or for such shorter period that the registrant was required to submit such files).
Indicate by check mark whether the registrant is a large accelerated filer, an accelerated filer, a non-accelerated filer, a smaller reporting company, or an emerging growth company. See the definitions of “large accelerated filer,” “accelerated filer,” “smaller reporting company,” and “emerging growth company” in Rule 12b-2 of the Exchange Act.
☒ | Accelerated Filer | ◻ | Non-accelerated Filer | ◻ | |
Smaller Reporting Company | Emerging Growth Company |
If an emerging growth company, indicate by check mark if the registrant has elected not to use the extended transition period for complying with any new or revised financial accounting standards provided pursuant to Section 13(a) of the Exchange Act. ◻
Indicate by check mark whether the registrant is a shell company (as defined in Rule 12b-2 of the Exchange Act). Yes
Indicate the number of shares outstanding of each of the registrant’s classes of common stock, as of the latest practicable date:
Class |
| July 26, 2024 |
TABLE OF CONTENTS
2
CERTAIN DEFINED TERMS
Throughout this document, unless otherwise specified or the context so requires:
● | “Cboe,” “we,” “us,” “our” or “the Company” refers to Cboe Global Markets, Inc. and its subsidiaries. |
● | “ADV” means average daily volume. |
● | “ADNV” means average daily notional value. |
● | “AFM” refers to the Netherlands Authority for the Financial Markets. |
● | “ATS” refers to an alternative trading system. |
● | “Bats Global Markets” and “Bats” refer to our wholly-owned subsidiary Bats Global Markets, Inc., now known as Cboe Bats, LLC, and its subsidiaries. |
● | “BIDS Trading” refers to BIDS Trading, L.P., a wholly-owned subsidiary of Cboe Global Markets, Inc. The ATS operated by BIDS Trading is not a registered national securities exchange or a facility thereof. |
● | “BYX” refers to Cboe BYX Exchange, Inc., a wholly-owned subsidiary of Cboe Global Markets, Inc. |
● | “BZX” refers to Cboe BZX Exchange, Inc., a wholly-owned subsidiary of Cboe Global Markets, Inc. |
● | “C2” refers to Cboe C2 Exchange, Inc., a wholly-owned subsidiary of Cboe Global Markets, Inc. |
● | “Cboe Asia Pacific” refers to Cboe Asia Pacific Holdings Limited (formerly known as Chi-X Asia Pacific Holdings Limited), a wholly-owned subsidiary of Cboe Global Markets, Inc. |
● | “Cboe Australia” refers to Cboe Australia Pty Ltd. (formerly known as Chi-X Australia Pty. Ltd.), a wholly-owned subsidiary of Cboe Global Markets, Inc. |
● | “Cboe Canada” refers to the former Aequitas Innovations, Inc. and Neo Exchange Inc. (commonly referred to as “NEO Exchange”), which were wholly-owned subsidiaries of Cboe Global Markets, Inc. |
● | “Cboe Canada Inc.” is a wholly-owned subsidiary of Cboe Global Markets, Inc. and a recognized Canadian securities exchange. As of January 1, 2024, the Cboe Canada and MATCHNow entities have been amalgamated into Cboe Canada Inc. |
● | “Cboe Chi-X Europe” refers to Cboe Chi-X Europe Limited, a wholly-owned subsidiary of Cboe Global Markets, Inc. |
● | “Cboe Clear Digital” refers to Cboe Clear Digital, LLC (formerly known as Eris Clearing, LLC), a wholly-owned subsidiary of Cboe Global Markets, Inc. |
● | “Cboe Clear Europe” refers to Cboe Clear Europe N.V. (formerly known as European Central Counterparty N.V., formerly defined as “EuroCCP”), a wholly-owned subsidiary of Cboe Global Markets, Inc. |
● | “Cboe Digital” refers to Cboe Digital Intermediate Holdings, LLC (formerly known as Eris Digital Holdings, LLC) and its subsidiaries. Prior to rebranding under the Cboe Digital name, Eris Digital Holdings, LLC and its subsidiaries operated under the “ErisX” name. |
● | “Cboe Digital Exchange” refers to Cboe Digital Exchange, LLC, a wholly-owned subsidiary of Cboe Global Markets, Inc. |
● | “Cboe Europe Equities and Derivatives” refers to the combined businesses of Cboe Europe and Cboe NL. |
● | “Cboe Europe” refers to Cboe Europe Limited, a wholly-owned subsidiary of Cboe Global Markets, Inc., the UK operator of our Multilateral Trading Facility (“MTF”), our Regulated Market (“RM”), and our Approved Publication Arrangement (“APA”) under its Recognized Investment Exchange (“RIE”) status. |
● | “Cboe Fixed Income” refers to Cboe Fixed Income Markets, LLC, a wholly-owned subsidiary of Cboe Global Markets, Inc. |
● | “Cboe FX” refers to Cboe FX Markets, LLC, a wholly-owned subsidiary of Cboe Global Markets, Inc. |
● | “Cboe Japan” refers to Cboe Japan Ltd. (formerly known as Chi-X Japan Ltd.), a wholly-owned subsidiary of Cboe Global Markets, Inc. |
● | “Cboe NL” refers to Cboe Europe BV, a wholly-owned subsidiary of Cboe Global Markets, Inc., the Netherlands operator of our MTF, RM, and APA. |
● | “Cboe Options” refers to Cboe Exchange, Inc., a wholly-owned subsidiary of Cboe Global Markets, Inc. |
● | “Cboe SEF” refers to Cboe SEF, LLC, a wholly-owned subsidiary of Cboe Global Markets, Inc. |
● | “Cboe Trading” refers to Cboe Trading, Inc., a wholly-owned subsidiary of Cboe Global Markets, Inc. |
● | “CFE” refers to Cboe Futures Exchange, LLC, a wholly-owned subsidiary of Cboe Global Markets, Inc. |
● | “CFTC” refers to the U.S. Commodity Futures Trading Commission. |
● | “CSD Br” refers to CSD Central de Serviços de Registro e Depósito aos Mercados Financeiro e de Capitais S.A., a Brazilian trade repository. |
● | “CIRO” refers to the Canadian Investment Regulatory Organization. |
● | “EDGA” refers to Cboe EDGA Exchange, Inc., a wholly-owned subsidiary of Cboe Global Markets, Inc. |
● | “EDGX” refers to Cboe EDGX Exchange, Inc., a wholly-owned subsidiary of Cboe Global Markets, Inc. |
● | “ESMA” refers to the European Securities and Markets Authority. |
● | “Exchanges” refers to Cboe Options, C2, BZX, BYX, EDGX, and EDGA. |
3
● | “FASB” refers to the Financial Accounting Standards Board. |
● | “FCA” refers to the UK Financial Conduct Authority. |
● | “FINRA” refers to the Financial Industry Regulatory Authority. |
● | “GAAP” refers to Generally Accepted Accounting Principles in the United States. |
● | “MATCHNow” refers to the former TriAct Canada Marketplace LP, a wholly-owned subsidiary of Cboe Global Markets, Inc., which was the operator of a Canadian ATS (known as “MATCHNow”). |
● | “Merger” refers to our acquisition of Bats Global Markets, completed on February 28, 2017. |
● | “OCC” refers to The Options Clearing Corporation. |
● | “OPRA” refers to Options Price Reporting Authority, LLC. |
● | “SEC” refers to the U.S. Securities and Exchange Commission. |
● | “SPX” refers to our S&P 500 Index exchange-traded options products. |
● | “TPH” refers to either a Trading Permit Holder or a Trading Privilege Holder. |
● | “VIX futures” or “VIX options” refers, as applicable, to our Cboe Volatility Index exchange-traded options and futures products. |
4
TRADEMARK AND OTHER INFORMATION
Cboe®, Cboe Global Markets®, Cboe Volatility Index®, Cboe Clear®, Cboe Datashop®, Cboe Digital®, Cboe LIS®, Bats®, BIDS Trading®, BYX®, BZX®, CFE®, EDGA®, EDGX®, ErisX®, EuroCCP®, Hybrid®, LiveVol®, MATCHNow®, NANO®, Options Institute®, Silexx®, The Exchange for the World StageSM, VIX®, VIX1D®, and XSP® are registered trademarks, and Cboe Futures ExchangeSM, Cboe BIDS EuropeSM, C2SM, f(t)optionsSM, Cboe HanweckSM, Nanos by CboeSM, and Trade AlertSM are service marks of Cboe Global Markets, Inc. and its subsidiaries. Standard & Poor's®, S&P®, S&P 100®, S&P 500® and SPX® are registered trademarks and DSPXSM is a service mark of Standard & Poor's Financial Services LLC and have been licensed for use by Cboe Exchange, Inc. Dow Jones®, Dow Jones Industrial Average®, DJIA® and Dow Jones Indices are registered trademarks or service marks of Dow Jones Trademark Holdings, LLC, used under license. Russell® and the Russell index names are registered trademarks of Frank Russell Company, used under license. FTSE® and the FTSE indices are trademarks and service marks of FTSE International Limited, used under license. All other trademarks and service marks are the property of their respective owners.
MSCI and the MSCI index names are service marks of MSCI Inc. (“MSCI”) or its affiliates and have been licensed for use by us. Any derivative indices and any financial products based on the derivative indices (“MCSI-Based Products”) are not sponsored, guaranteed or endorsed by MSCI, its affiliates or any other party involved in, or related to, making or compiling such MSCI index. Neither MSCI, its affiliates nor any other party involved in, or related to, making or compiling any MSCI index makes any representations regarding the advisability of investing in such MSCI-Based Products; makes any warranty, express or implied; or bears any liability as to the results to be obtained by any person or any entity from the use of any such MSCI index or any data included therein. No purchaser, seller or holder of any MSCI-Based Product, or any other person or entity, should use or refer to any MSCI trade name, trademark or service mark to sponsor, endorse, market or promote any security without first contacting MSCI to determine whether MSCI’s permission is required.
This Quarterly Report on Form 10-Q includes market share and industry data that we obtained from industry publications and surveys, reports of governmental agencies and internal company surveys. Industry publications and surveys generally state that the information they contain has been obtained from sources believed to be reliable, but we cannot assure you that this information is accurate or complete. We have not independently verified any of the data from third-party sources nor have we ascertained the underlying economic assumptions relied upon therein. Statements as to our market position are based on the most currently available market data. While we are not aware of any misstatements regarding industry data presented herein, our estimates involve risks and uncertainties and are subject to change based on various factors. Please refer to the “Risk Factors” in Part II, Item 1A of this Quarterly Report on Form 10-Q and our other filings with the SEC.
5
FORWARD-LOOKING STATEMENTS
This Quarterly Report on Form 10-Q contains forward-looking statements within the meaning of the Private Securities Litigation Reform Act of 1995 that involve a number of risks and uncertainties. You can identify these statements by forward-looking words such as “may,” “might,” “should,” “expect,” “plan,” “anticipate,” “believe,” “estimate,” “predict,” “potential” or “continue,” and the negative of these terms and other comparable terminology. All statements that reflect our expectations, assumptions or projections about the future other than statements of historical fact are forward-looking statements, including statements in “Management’s Discussion and Analysis of Financial Condition and Results of Operations.” These forward-looking statements, which are subject to known and unknown risks, uncertainties and assumptions about us, may include projections of our future financial performance based on our growth strategies and anticipated trends in our business. These statements are only predictions based on our current expectations and projections about future events. There are important factors that could cause our actual results, level of activity, performance or achievements to differ materially from those expressed or implied by the forward-looking statements. In particular, you should consider the risks and uncertainties described under “Risk Factors” in this Quarterly Report and other filings with the SEC.
While we believe we have identified material risks, these risks and uncertainties are not exhaustive. Moreover, we operate in a very competitive and rapidly changing environment. New risks and uncertainties emerge from time to time, and it is not possible to predict all risks and uncertainties, nor can we assess the impact of all factors on our business or the extent to which any factor, or combination of factors, may cause actual results to differ materially from those contained in any forward-looking statements.
Some factors that could cause actual results to differ include:
● | the loss of our right to exclusively list and trade certain index options and futures products; |
● | economic, political and market conditions; |
● | compliance with legal and regulatory obligations; |
● | price competition and consolidation in our industry; |
● | decreases in trading or clearing volumes, market data fees or a shift in the mix of products traded on our exchanges; |
● | legislative or regulatory changes or changes in tax regimes; |
● | our ability to protect our systems and communication networks from security vulnerabilities and breaches; |
● | our ability to attract and retain skilled management and other personnel; |
● | increasing competition by foreign and domestic entities; |
● | our dependence on and exposure to risk from third parties; |
● | global expansion of operations; |
● | factors that impact the quality and integrity of our and other applicable indices; |
● | our ability to manage our growth and strategic acquisitions or alliances effectively; |
● | our ability to operate our business without violating the intellectual property rights of others and the costs associated with protecting our intellectual property rights; |
● | our ability to minimize the risks, including our credit, counterparty, investment, and default risks, associated with operating a European clearinghouse; |
● | our ability to accommodate trading and clearing volume and transaction traffic, including significant increases, without failure or degradation of performance of our systems; |
● | misconduct by those who use our markets or our products or for whom we clear transactions; |
● | challenges to our use of open source software code; |
● | our ability to meet our compliance obligations, including managing potential conflicts between our regulatory responsibilities and our for-profit status; |
● | our ability to maintain BIDS Trading as an independently managed and operated trading venue, separate from and not integrated with our registered national securities exchanges; |
● | damage to our reputation; |
● | the ability of our compliance and risk management methods to effectively monitor and manage our risks; |
● | restrictions imposed by our debt obligations and our ability to make payments on or refinance our debt obligations; |
● | our ability to maintain an investment grade credit rating; |
● | impairment of our goodwill, long-lived assets, investments or intangible assets; |
● | the impacts of pandemics; |
● | the accuracy of our estimates and expectations; |
6
● | litigation risks and other liabilities; and |
● | risks relating to digital assets, including winding down the Cboe Digital spot market and transitioning digital asset futures contracts to CFE, operating a digital asset futures clearinghouse, cybercrime, changes in digital asset regulation, and fluctuations in digital asset prices. |
For a detailed discussion of these and other factors that might affect our performance, see Part II, Item 1A of this Report. We do not undertake, and expressly disclaim, any duty to update any forward-looking statement whether as a result of new information, future events or otherwise, except as required by law. We caution you not to place undue reliance on the forward-looking statements, which speak only as of the date of this filing.
7
PART I—FINANCIAL INFORMATION
Item 1. Financial Statements.
Cboe Global Markets, Inc. and Subsidiaries
Condensed Consolidated Balance Sheets
(unaudited)
(in millions, except par value data and share amounts)
| June 30, |
| December 31, | |||
2024 | 2023 | |||||
Assets | ||||||
Current assets: | ||||||
Cash and cash equivalents | $ | | $ | | ||
Financial investments | | | ||||
Accounts receivable, net of $ | | | ||||
Margin deposits, clearing funds, and interoperability funds | | | ||||
Digital assets - safeguarded assets | | | ||||
Income taxes receivable |
| |
| | ||
Other current assets |
| |
| | ||
Total current assets |
| |
| | ||
Investments |
| |
| | ||
Property and equipment, net | | | ||||
Property held for sale | — | | ||||
Operating lease right of use assets | | | ||||
Goodwill | | | ||||
Intangible assets, net | | | ||||
Other assets, net |
| |
| | ||
Total assets | $ | | $ | | ||
Liabilities and Stockholders’ Equity | ||||||
Current liabilities: | ||||||
Accounts payable and accrued liabilities | $ | | $ | | ||
Section 31 fees payable | | | ||||
Deferred revenue | | | ||||
Margin deposits, clearing funds, and interoperability funds | | | ||||
Digital assets - safeguarded liabilities | | | ||||
Income taxes payable | — |
| | |||
Current portion of contingent consideration liabilities |
| |
| | ||
Total current liabilities |
| |
| | ||
Long-term debt |
| | | |||
Non-current unrecognized tax benefits |
| | | |||
Deferred income taxes |
| | | |||
Non-current operating lease liabilities | | | ||||
Other non-current liabilities | |
| | |||
Total liabilities | | | ||||
Commitments and contingencies | ||||||
Stockholders’ equity: | ||||||
Preferred stock, $ | ||||||
Common stock, $ |
| |
| | ||
Common stock in treasury, at cost, |
| ( |
| ( | ||
Additional paid-in capital |
| |
| | ||
Retained earnings |
| |
| | ||
Accumulated other comprehensive loss, net |
| ( |
| ( | ||
Total stockholders’ equity |
| |
| | ||
Total liabilities and stockholders’ equity | $ | | $ | |
See accompanying notes to condensed consolidated financial statements.
8
Cboe Global Markets, Inc. and Subsidiaries
Condensed Consolidated Statements of Income
(unaudited)
(in millions, except per share data)
Three Months Ended | Six Months Ended | ||||||||||||
June 30, | June 30, | ||||||||||||
| 2024 |
| 2023 |
| 2024 |
| 2023 | ||||||
Revenues: | |||||||||||||
Cash and spot markets | $ | | $ | | $ | | $ | | |||||
Data and access solutions | | | | | |||||||||
Derivatives markets | | | | | |||||||||
Total revenues |
| |
| |
| |
| | |||||
Cost of revenues: | |||||||||||||
Liquidity payments |
| |
| |
| |
| | |||||
Routing and clearing | | | | | |||||||||
Section 31 fees | | | | | |||||||||
Royalty fees and other cost of revenues |
| |
| |
| |
| | |||||
Total cost of revenues |
| |
| |
| |
| | |||||
Revenues less cost of revenues |
| |
| |
| |
| | |||||
Operating expenses: | |||||||||||||
Compensation and benefits |
| |
| |
| |
| | |||||
Depreciation and amortization |
| |
| |
| |
| | |||||
Technology support services |
| |
| |
| |
| | |||||
Professional fees and outside services |
| |
| |
| |
| | |||||
Travel and promotional expenses |
| |
| |
| |
| | |||||
Facilities costs |
| |
| |
| |
| | |||||
Acquisition-related costs |
| |
| |
| |
| | |||||
Impairment of intangible assets | | — | | — | |||||||||
Other expenses | | | | | |||||||||
Total operating expenses |
| |
| |
| |
| | |||||
Operating income |
| |
| |
| |
| | |||||
Non-operating (expenses) income: | |||||||||||||
Interest expense | ( | ( | ( | ( | |||||||||
Interest income |
| |
| |
| |
| | |||||
Earnings on investments | | | | | |||||||||
Other (expense) income, net |
| ( |
| |
| ( |
| | |||||
Income before income tax provision |
| |
| |
| |
| | |||||
Income tax provision |
| |
| |
| |
| | |||||
Net income | | | | | |||||||||
Net income allocated to participating securities | ( | ( | ( | ( | |||||||||
Net income allocated to common stockholders | $ | | $ | | $ | | $ | | |||||
Basic earnings per share | $ | | $ | | $ | | $ | | |||||
Diluted earnings per share | $ | | $ | | $ | | $ | | |||||
Basic weighted average shares outstanding | | | | | |||||||||
Diluted weighted average shares outstanding | | | | |
See accompanying notes to condensed consolidated financial statements.
9
Cboe Global Markets, Inc. and Subsidiaries
Condensed Consolidated Statements of Comprehensive Income
(unaudited)
(in millions)
| Three Months Ended | Six Months Ended |
| ||||||||||
June 30, | June 30, | ||||||||||||
| 2024 |
| 2023 | 2024 |
| 2023 |
| ||||||
Net income | $ | | $ | | $ | | $ | | |||||
Other comprehensive (loss) income, net of income tax: | |||||||||||||
Foreign currency translation adjustments |
| ( | |
| ( | | |||||||
Unrealized holding losses on financial investments |
| ( |
| ( |
| ( |
| ( | |||||
Post-retirement benefit obligations | — | — | | ( | |||||||||
Comprehensive income | | | | | |||||||||
Comprehensive income allocated to participating securities | ( | ( | ( | ( | |||||||||
Comprehensive income allocated to common stockholders, net of income tax | $ | | $ | | $ | | $ | |
See accompanying notes to condensed consolidated financial statements.
10
Cboe Global Markets, Inc. and Subsidiaries
Condensed Consolidated Statements of Changes in Stockholders’ Equity
Three and Six months ended June 30, 2024 and June 30, 2023
(unaudited)
(in millions, except per share amounts)
Accumulated | |||||||||||||||||||||
Additional | other | Total | |||||||||||||||||||
Preferred | Common | Treasury | paid-in | Retained | comprehensive | stockholders’ | |||||||||||||||
| Stock |
| Stock |
| Stock |
| capital |
| earnings |
| loss, net |
| equity | ||||||||
Balance at December 31, 2023 | $ | — | $ | | $ | ( | $ | | $ | | $ | ( | $ | | |||||||
Cash dividends on common stock of $ | — | — | — | — | ( | — | ( | ||||||||||||||
Stock-based compensation | — | — | — | | — | — | | ||||||||||||||
Repurchases of common stock from employee stock plans | — | — | ( | — | — | — | ( | ||||||||||||||
Purchase of common stock | — | — | ( | — | — | — | ( | ||||||||||||||
Shares issued under employee stock purchase plan | — | — | — | | — | — | | ||||||||||||||
Net income | — | — | — | — | | — | | ||||||||||||||
Other comprehensive loss | — | — | — | — | — | ( | ( | ||||||||||||||
Balance at March 31, 2024 | $ | — | $ | | $ | ( | $ | | $ | | $ | ( | $ | | |||||||
Cash dividends on common stock of $ | — | — | — | — | ( | — | ( | ||||||||||||||
Stock-based compensation | — | — | — | | — | — | | ||||||||||||||
Repurchases of common stock from employee stock plans | — | — | ( | — | — | — | ( | ||||||||||||||
Purchase of common stock | — | — | ( | — | — | — | ( | ||||||||||||||
Shares issued under employee stock purchase plan | — | — | — | | — | — | | ||||||||||||||
Net income | — | — | — | — | | — | | ||||||||||||||
Other comprehensive loss | — | — | — | — | — | ( | ( | ||||||||||||||
Balance at June 30, 2024 | $ | — | $ | | $ | ( | $ | | $ | | $ | ( | $ | | |||||||
Accumulated | |||||||||||||||||||||
Additional | other | Total | |||||||||||||||||||
Preferred | Common | Treasury | paid-in | Retained | comprehensive | stockholders’ | |||||||||||||||
| Stock |
| Stock |
| Stock |
| capital |
| earnings |
| loss, net |
| equity | ||||||||
Balance at December 31, 2022 | $ | — | $ | | $ | ( | $ | | $ | | $ | ( | $ | | |||||||
Cash dividends on common stock of $ | — | — | — | — | ( | — | ( | ||||||||||||||
Stock-based compensation | — | — | — | | — | — | | ||||||||||||||
Repurchases of common stock from employee stock plans | — | — | ( | — | — | — | ( | ||||||||||||||
Purchase of common stock | — | — | ( | — | — | — | ( | ||||||||||||||
Shares issued under employee stock purchase plan | — | — | — | | — | — | | ||||||||||||||
Net income | — | — | — | — | | — | | ||||||||||||||
Other comprehensive income | — | — | — | — | — | | | ||||||||||||||
Balance at March 31, 2023 | $ | — | $ | | $ | ( | $ | | $ | | $ | ( | $ | | |||||||
Cash dividends on common stock of $ | — | — | — | — | ( | — | ( | ||||||||||||||
Stock-based compensation | — | — | — | | — | — | | ||||||||||||||
Repurchases of common stock from employee stock plans | — | — | ( | — | — | — | ( | ||||||||||||||
Purchase of common stock | — | — | ( | — | — | — | ( | ||||||||||||||
Shares issued under employee stock purchase plan | — | — | — | | — | — | | ||||||||||||||
Net income | — | — | — | — | | — | | ||||||||||||||
Other comprehensive income | — | — | — | — | — | | | ||||||||||||||
Balance at June 30, 2023 | $ | — | $ | | $ | ( | $ | | $ | | $ | ( | $ | |
See accompanying notes to condensed consolidated financial statements.
11
Cboe Global Markets, Inc. and Subsidiaries
Condensed Consolidated Statements of Cash Flows
(unaudited)
(in millions)
| Six Months Ended | |||||
June 30, | ||||||
2024 |
| 2023 | ||||
Cash flows from operating activities: | ||||||
Net income | $ | | $ | | ||
Adjustments to reconcile net income to net cash from operating activities: | ||||||
Depreciation and amortization |
| |
| | ||
Amortization of debt issuance cost and debt discount | | | ||||
Loss on settlement of contingent consideration | | — | ||||
Unrealized gain on available-for-sale financial investments | ( | ( | ||||
Provision for accounts receivable credit losses | | | ||||
Benefit for deferred income taxes | ( | ( | ||||
Stock-based compensation expense | | | ||||
Impairment of intangible assets | | — | ||||
Impairment of minority investment | | — | ||||
Impairment of property and equipment | | — | ||||
Gain from Cboe Digital non-recourse notes and warrants wind down | ( | — | ||||
Gain on sale of property held for sale | ( | — | ||||
Gain on lease termination | ( | — | ||||
Expenses from Cboe Digital wind down | | — | ||||
Pyth tokens revenue | ( | — | ||||
Equity earnings on investments | ( | ( | ||||
Changes in assets and liabilities: | ||||||
Accounts receivable | ( | | ||||
Restricted cash and cash equivalents and customer bank deposits (included in margin deposits, clearing funds, and interoperability funds) | | | ||||
Income taxes receivable | | | ||||
Other current assets | | ( | ||||
Other assets | ( | ( | ||||
Accounts payable and accrued liabilities | ( | ( | ||||
Section 31 fees payable | | ( | ||||
Deferred revenue | | | ||||
Income taxes payable | ( | ( | ||||
Unrecognized tax benefits | | | ||||
Other liabilities | | ( | ||||
Net cash provided by operating activities |
| | | |||
Cash flows from investing activities: |
| |||||
Purchases of available-for-sale financial investments |
| ( | ( | |||
Proceeds from maturities of available-for-sale financial investments | | | ||||
Proceeds from sale of intangible assets | — | | ||||
Proceeds from sale of property held for sale | | — | ||||
Proceeds from sale of property and equipment | | — | ||||
Proceeds from insurance | | — | ||||
Contributions to investments | ( | ( | ||||
Purchases of property and equipment and leasehold improvements |
| ( | ( | |||
Net cash used in investing activities |
| ( | ( | |||
Cash flows used in financing activities: |
| |||||
Principal payments of current portion of long-term debt | — | ( | ||||
Cash dividends on common stock |
| ( | ( | |||
Repurchases of common stock from employee stock plans |
| ( | ( | |||
Payments of contingent consideration related to acquisitions | ( | ( | ||||
Shares issued under employee stock purchase plan | ( | ( | ||||
Payments for Cboe Digital non-recourse notes and warrants wind down | ( | — | ||||
Purchase of common stock |
| ( | ( | |||
Net cash used in financing activities | ( | ( | ||||
Effect of foreign currency exchange rates on cash, cash equivalents, and restricted cash and cash equivalents | ( | | ||||
Increase in cash, cash equivalents, and restricted cash and cash equivalents | | | ||||
Cash, cash equivalents, and restricted cash and cash equivalents: | ||||||
Beginning of period | | | ||||
End of period | $ | | $ | | ||
Reconciliation of cash, cash equivalents, and restricted cash and cash equivalents: | ||||||
Cash and cash equivalents | | | ||||
Restricted cash and cash equivalents (included in margin deposits, clearing funds, and interoperability funds) | | | ||||
Restricted cash and cash equivalents (included in other current assets) | | | ||||
Customer bank deposits (included in margin deposits, clearing funds, and interoperability funds) | | | ||||
Total | $ | | $ | | ||
Supplemental disclosure of cash transactions: | ||||||
Cash paid for income taxes, net of refunds | $ | | $ | | ||
Cash paid for interest | | | ||||
Supplemental disclosure of noncash investing activities: | ||||||
Note receivable from sale of property held for sale | $ | | $ | — | ||
Additions of intangible assets | | — | ||||
Supplemental disclosure of noncash financing activities: | ||||||
Unsettled purchases of common stock | $ | ( | $ | — | ||
Cboe Digital non-recourse notes and warrants asset | | — | ||||
Cboe Digital non-recourse notes and warrants liability | ( | — |
See accompanying notes to condensed consolidated financial statements.
12
Cboe Global Markets, Inc. and Subsidiaries
Notes to Condensed Consolidated Financial Statements (unaudited)
1. ORGANIZATION AND BASIS OF PRESENTATION
Cboe Global Markets, Inc., the world’s leading derivatives and securities exchange network, delivers cutting-edge trading, clearing and investment solutions to people around the world. Cboe provides trading solutions and products in multiple asset classes, including equities, derivatives, and FX, across North America, Europe, and Asia Pacific. Above all, the Company is committed to building a trusted, inclusive global marketplace that enables people to pursue a sustainable financial future.
Cboe’s subsidiaries include the largest options exchange and the third largest stock exchange operator in the U.S. In addition, the Company operates Cboe Europe, one of the largest stock exchanges by value traded in Europe, and owns Cboe Clear Europe, a leading pan-European equities and derivatives clearinghouse, BIDS Holdings, which owns a leading block-trading ATS by volume in the U.S., and provides block-trading services with Cboe market operators in Europe, Canada, Australia, and Japan, Cboe Australia, an operator of trading venues in Australia, Cboe Japan, an operator of trading venues in Japan, Cboe Digital Exchange, LLC, an operator of a regulated futures exchange, Cboe Clear Digital, an operator of a regulated clearinghouse, and Cboe Canada Inc., a recognized Canadian securities exchange. Cboe subsidiaries also serve collectively as a leading market globally for exchange-traded products (“ETPs”) listings and trading.
On April 25, 2024, the Company announced plans to refocus the digital asset business to leverage its core strengths in derivatives, technology, and product innovation. On May 31, 2024, the Company halted trading on Cboe Digital Exchange, LLC’s (“Cboe Digital Exchange”) spot market (“Cboe Digital spot market”), the Company’s spot digital asset trading platform, in-line with the Company’s plans to wind down the spot digital asset trading market by the third quarter of 2024. In addition, the company plans to transition its cash-settled Bitcoin and Ether futures contracts, currently available for trading on the Cboe Digital Exchange, to CFE in the first half of 2025, pending regulatory review. The Company plans to align Cboe Clear Digital with Cboe Clear Europe, under unified leadership, and expects to continue to facilitate the clearing of cash-settled Bitcoin and Ether futures contracts.
The Company is headquartered in Chicago with offices in Amsterdam, Belfast, Hong Kong, Kansas City, London, Manila, New York, San Francisco, Sarasota Springs, Singapore, Sydney, Tokyo, and Toronto.
Basis of Presentation
These interim unaudited condensed consolidated financial statements have been prepared in accordance with GAAP as established by FASB for interim financial information and with the instructions to Form 10-Q and should be read in conjunction with the consolidated financial statements and notes thereto contained in the Company’s Annual Report on Form 10-K for the year ended December 31, 2023. The results of operations for interim periods are not necessarily indicative of the results of operations for the full year.
The preparation of condensed consolidated financial statements in conformity with GAAP requires management to make estimates and assumptions that affect the reported amounts of assets and liabilities, disclosures of contingent assets and liabilities, and reported amounts of revenues and expenses. On an ongoing basis, management evaluates its estimates based upon historical experience, observance of trends, information available from outside sources and various other assumptions that management believes to be reasonable under the circumstances. Actual results may differ from these estimates under different conditions or assumptions.
In the opinion of management, all adjustments (consisting of normal recurring adjustments) considered necessary for a fair presentation of financial position, results of operations and cash flows at the dates and for the periods presented have been included.
Segment Information
The Company operates
13
Update to Significant Accounting Policies
There have been no new or material changes to the significant accounting policies discussed for the Company for the periods presented, that are of significance, or potential significance, to the Company.
Recent Accounting Pronouncements – Adopted
There were no applicable material accounting pronouncements that have been adopted during the three and six month periods ended June 30, 2024.
Recent Accounting Pronouncements - Issued, not yet Adopted
In November 2023, the FASB issued ASU 2023-07, Segment Reporting (Topic 280): Improvements to Reportable Segment Disclosures. This ASU improves reportable segment disclosure requirements, primarily through enhanced disclosures about significant segment expenses. For public entities, the update is effective for fiscal years beginning after December 15, 2023, and interim periods within fiscal years beginning after December 15, 2024. The Company expects to adopt the update for the consolidated financial statements issued for the year ending December 31, 2024 and does not anticipate a material impact to the consolidated financial statements.
In December 2023, the FASB issued ASU 2023-08, Intangibles – Goodwill and Other – Crypto Assets (Subtopic 350-60): Accounting for and Disclosure of Crypto Assets. This ASU addresses the accounting and disclosure requirements for certain crypto assets and requires entities to subsequently measure certain crypto assets at fair value, with changes in fair value recorded in earnings in each reporting period. In addition, entities are required to provide additional disclosures about the holdings of certain crypto assets. For public entities, the update is effective for fiscal years and interim periods within those fiscal years, beginning after December 15, 2024. The Company expects to adopt the update for the condensed consolidated financial statements issued in the first quarter of 2025 and does not anticipate a material impact to the condensed consolidated financial statements.
In December 2023, the FASB issued ASU 2023-09, Income Taxes (Topic 740): Improvements to Income Tax Disclosures. This ASU addresses investor requests for more transparency about income tax information through improvements to income tax disclosures primarily related to the rate reconciliation and income taxes paid information. For public entities, the update is effective for fiscal years beginning after December 15, 2024. The Company expects to adopt the update for the consolidated financial statements issued for the year ending December 31, 2025 and does not anticipate a material impact to the consolidated financial statements.
On March 6, 2024, the SEC adopted new climate disclosure rules, which requires companies to publish information that describes the climate-related risks that are reasonably likely to have a material impact on a company’s business or consolidated financial statements. The final rules would require companies to disclose material climate-related risks, activities to mitigate or adapt to such risks, information about the companies’ board of directors’ oversight of climate-related risks and management’s role in managing climate-related risks, and information on any climate-related targets or goals that are material to the companies’ business, results of operations or financial condition. On March 15, 2024, the U.S. Court of Appeals for the Fifth Circuit granted an administrative stay of the SEC’s final Climate Disclosure Rules, in response to legal challenges unaffiliated with the Company. The Company expects to review any updates regarding the Court stay and update the financial statements and disclosures accordingly based on the outcome of the ongoing legal proceedings related to these rules.
There were no other recent applicable material accounting pronouncements that have been issued, but not yet adopted as of June 30, 2024.
2. REVENUE RECOGNITION
The Company presents three financial statement revenue captions within its condensed consolidated statements of income that reflect the Company’s diversified products, expansive geographical reach, and overall business strategy. Below is a summary of the Company’s financial statement revenue captions:
Revenues
● | Cash and spot markets – includes associated transaction and clearing fees, the portion of market data fees relating to associated U.S. tape plan market data fees, associated regulatory fees, and associated other revenue from Cboe’s North American Equities, Europe and Asia Pacific, Global FX, and Digital segments. |
14
● | Data and access solutions – includes access and capacity fees, proprietary market data fees, and associated other revenue across Cboe’s |
● | Derivatives markets – includes associated transaction and clearing fees, the portion of market data fees relating to associated U.S. tape plan market data fees, associated regulatory fees, and associated other revenue from Cboe’s Options, Futures, Europe and Asia Pacific, and Digital segments. |
The Company’s main types of revenue contracts consist of the following, which are disaggregated from the condensed consolidated statements of income.
● | Transaction and clearing fees – Transaction fees represent fees charged by the Company for meeting the point-in-time performance obligation of executing a trade on its markets. These fees can be variable based on trade volume tiered discounts; however, as all tiered discounts are calculated monthly, the actual discount is recorded on a monthly basis. Transaction fees are recognized across all segments. Clearing fees, which include settlement fees, represent fees charged by the Company for meeting the point-in-time performance obligation for transactions cleared and settled by Cboe Clear Europe and Cboe Clear Digital, the derivatives clearing organization for Cboe Digital. Clearing fees can be variable based on trade volume tiered discounts; however, as all tiered discounts are calculated monthly, the actual discount is recorded on a monthly basis. Clearing fees are recognized in the Europe and Asia Pacific and Digital segments. Transaction and clearing fees, as well as any tiered volume discounts, are calculated and billed monthly in accordance with the Company’s published fee schedules. |
● | Access and capacity fees – Access and capacity fees represent fees assessed for the opportunity to trade, including fees for trading-related functionality across all segments, terminal and other equipment rights, maintenance services, trading floor space and telecommunications services. Facilities, systems services and other fees are generally monthly fee-based. These fees are billed monthly in accordance with the Company’s published fee schedules and recognized on a monthly basis when the performance obligations are met. All access and capacity fees associated with the trading floor are recognized over time in the Options segment, as the performance obligations are met. |
● | Market data fees – Market data fees represent the fees received by the Company from the U.S. tape plans and fees charged to customers for proprietary market data. Fees from the U.S. tape plans are collected monthly based on published fee schedules and distributed quarterly to the Exchanges based on a known formula. A contract for proprietary market data is entered into and charged on a monthly basis in accordance with the Company’s published fee schedules as the service is provided. Proprietary market data also includes revenue from various licensing agreements. Both types of market data are satisfied over time, and revenue is recognized on a monthly basis as the customer receives and consumes the benefit as the Company provides the data to meet its performance obligation. U.S. tape plan market data is recognized in the North American Equities and Options segments. Proprietary market data fees are recognized across all segments. |
● | Regulatory fees – There are |
● | Other revenue – Other revenue primarily includes interest income on investments (including from investments of interoperability fund deposits) from clearing operations, all fees related to the trade reporting facility operated in the Europe and Asia Pacific segment, listing fees, and revenue associated with advertisements through the Company’s websites. |
15
All revenue recognized in the condensed consolidated statements of income is considered to be revenue from contracts with customers, with the exception of interest income from clearing operations.
Cash | Data and | |||||||||||
and Spot | Access | Derivatives | ||||||||||
| Markets |
| Solutions |
| Markets |
| Total | |||||
Three Months Ended June 30, 2024 | ||||||||||||
Transaction and clearing fees | $ | | $ | — | $ | | $ | | ||||
Access and capacity fees | — | | — | | ||||||||
Market data fees | | | | | ||||||||
Regulatory fees | | — | | | ||||||||
Other revenue | | | | | ||||||||
$ | | $ | | $ | | $ | | |||||
Cash | Data and | |||||||||||
and Spot | Access | Derivatives | ||||||||||
Markets |
| Solutions |
| Markets |
| Total | ||||||
Three Months Ended June 30, 2023 | ||||||||||||
Transaction and clearing fees | $ | | $ | — | $ | | $ | | ||||
Access and capacity fees | — | | — | | ||||||||
Market data fees | | | | | ||||||||
Regulatory fees | | — | | | ||||||||
Other revenue | | | | | ||||||||
$ | | $ | | $ | | $ | |
Cash | Data and | |||||||||||
and Spot | Access | Derivatives | ||||||||||
Markets |
| Solutions |
| Markets |
| Total | ||||||
Six Months Ended June 30, 2024 | ||||||||||||
Transaction and clearing fees | $ | | $ | — | $ | | $ | | ||||
Access and capacity fees | — | | — | | ||||||||
Market data fees | | | | | ||||||||
Regulatory fees | | — | | | ||||||||
Other revenue | | | | | ||||||||
$ | | $ | | $ | | $ | | |||||
Cash | Data and | |||||||||||
and Spot | Access | Derivatives | ||||||||||
Markets | Solutions | Markets | Total | |||||||||
Six Months Ended June 30, 2023 | ||||||||||||
Transaction and clearing fees | $ | | $ | — | $ | | $ | | ||||
Access and capacity fees | — | | — | | ||||||||
Market data fees | | | | | ||||||||
Regulatory fees | | — | | | ||||||||
Other revenue | | | | | ||||||||
$ | | $ | | $ | | $ | |
16
The following table depicts the disaggregation of revenue according to segment (in millions):
North | Europe | ||||||||||||||||||||
American | and Asia | Global | |||||||||||||||||||
| Options |
| Equities |
| Pacific |
| Futures |
| FX |
| Digital |
| Total | ||||||||
Three Months Ended June 30, 2024 | |||||||||||||||||||||
Transaction and clearing fees | $ | | $ | | $ | | $ | | $ | | $ | | $ | | |||||||
Access and capacity fees | | | | | | — | | ||||||||||||||
Market data fees | | | | | | — | | ||||||||||||||
Regulatory fees | | | — | | — | — | | ||||||||||||||
Other revenue | | | | — | | — | | ||||||||||||||
$ | | $ | | $ | | $ | | $ | | $ | | $ | | ||||||||
Timing of revenue recognition | |||||||||||||||||||||
Services transferred at a point in time | $ | | $ | | $ | | $ | | $ | | $ | | $ | | |||||||
Services transferred over time | | | | | | — | | ||||||||||||||
$ | | $ | | $ | | $ | | $ | | $ | | $ | | ||||||||
Three Months Ended June 30, 2023 | |||||||||||||||||||||
Transaction and clearing fees | $ | | $ | | $ | | $ | | $ | | $ | ( | $ | | |||||||
Access and capacity fees | | | | | | | | ||||||||||||||
Market data fees | | | | | | — | | ||||||||||||||
Regulatory fees | | | — | | — | — | | ||||||||||||||
Other revenue | | | | — | | — | | ||||||||||||||
$ | | $ | | $ | | $ | | $ | | $ | ( | $ | | ||||||||
Timing of revenue recognition | |||||||||||||||||||||
Services transferred at a point in time | $ | | $ | | $ | | $ | | $ | | $ | ( | $ | | |||||||
Services transferred over time | | | | | | | | ||||||||||||||
$ | | $ | | $ | | $ | | $ | | $ | ( | $ | |
North | Europe | ||||||||||||||||||||
American | and Asia | Global | |||||||||||||||||||
| Options |
| Equities |
| Pacific |
| Futures |
| FX |
| Digital |
| Total | ||||||||
Six Months Ended June 30, 2024 | |||||||||||||||||||||
Transaction and clearing fees | $ | | $ | | $ | | $ | | $ | | $ | ( | $ | | |||||||
Access and capacity fees | | | | | | | | ||||||||||||||
Market data fees | | | | | | — | | ||||||||||||||
Regulatory fees | | | — | | — | — | | ||||||||||||||
Other revenue | | | | — | | — | | ||||||||||||||
$ | | $ | | $ | | $ | | $ | | $ | ( | $ | | ||||||||
Timing of revenue recognition | |||||||||||||||||||||
Services transferred at a point in time | $ | | $ | | $ | | $ | | $ | | $ | ( | $ | | |||||||
Services transferred over time | | | | | | | | ||||||||||||||
$ | | $ | | $ | | $ | | $ | | $ | ( | $ | | ||||||||
Six Months Ended June 30, 2023 | |||||||||||||||||||||
Transaction and clearing fees | $ | | $ | | $ | | $ | | $ | | $ | ( | $ | | |||||||
Access and capacity fees | | | | | | | | ||||||||||||||
Market data fees | | | | | | — | | ||||||||||||||
Regulatory fees | | | — | | — | — | | ||||||||||||||
Other revenue | | | | — | | — | | ||||||||||||||
$ | | $ | | $ | | $ | | $ | | $ | ( | $ | | ||||||||
Timing of revenue recognition | |||||||||||||||||||||
Services transferred at a point in time | $ | | $ | | $ | | $ | | $ | | $ | ( | $ | | |||||||
Services transferred over time | | | | | | | | ||||||||||||||
$ | | $ | | $ | | $ | | $ | | $ | ( | $ | |
17
Contract liabilities as of June 30, 2024 primarily represent prepayments of transaction fees and certain access and capacity and market data fees to the Exchanges.
| Balance at |
| Cash |
| Revenue |
| Balance at | |||||
Liquidity provider sliding scale (1) | $ | — | $ | | $ | ( | $ | | ||||
Other, net | | | ( | | ||||||||
Total deferred revenue | $ | | $ | | $ | ( | $ | |
(1) | Liquidity providers are eligible to participate in the sliding scale program, which involves prepayment of transaction fees, and to receive reduced fees based on the achievement of certain volume thresholds within a calendar month. These transaction fees are amortized and recorded ratably as the transactions occur over the period. |
3. ACQUISITIONS
Acquisition-related costs relate to acquisitions and other strategic opportunities. The Company expensed $
The Company expensed $
4. INVESTMENTS
As of June 30, 2024 and December 31, 2023, the Company’s investments were comprised of the following (in millions):
June 30, | December 31, | |||||
| 2024 |
| 2023 | |||
Equity method investments: | ||||||
Investment in 7Ridge Investments 3 LP | $ | | $ | | ||
Total equity method investments | | | ||||
Other equity investments: | ||||||
Investment in Eris Innovations Holdings, LLC | | | ||||
Investment in Globacap Technology Limited | — | | ||||
Investment in CSD Br | | | ||||
Investment in Coin Metrics Inc. | | | ||||
Investment in Cboe Vest Financial Group, Inc. | | | ||||
Investment in OCC | | | ||||
Other equity investments |
| |
| | ||
Total other equity investments | | | ||||
Total investments | $ | | $ | |
Equity Method Investments
The Company’s investment in 7Ridge Investments 3 LP (“7Ridge Fund”), represents a nonconsolidated variable interest entity (“VIE”). The Company has determined that consolidation of the VIE is not required as the Company is not the primary beneficiary of the 7Ridge Fund, as it does not have controlling financial interest and lacks the ability to unilaterally remove the general partner, 7Ridge Investments 3 GP Limited, direct material strategic decisions, or dissolve the entity (i.e., the Company does not have unilateral substantive “kick-out” or “liquidation” rights).
The Company’s interest in the 7Ridge Fund is equal to the carrying value of the investment as of June 30, 2024, or $
18
7Ridge Fund’s profit or loss, including gains or losses arising from the fair value measurement of the investment held by the 7Ridge Fund, booked against the investment account. The carrying value of the investment is included in investments within the condensed consolidated balance sheets. The Company’s maximum loss exposure, in the unlikely event that all of the VIE’s assets become worthless, is limited to the carrying value of Company’s investment.
The Company holds an exit option to acquire Trading Technologies International Inc. (“Trading Technologies”), which is wholly owned by the 7Ridge Fund, that becomes exercisable on the earlier of (i) December 21, 2026 or (ii) the satisfaction by the general partner of 7Ridge Fund of certain performance goals set forth in the investment agreements. The exit option can be exercised individually or jointly by the limited partners of 7Ridge Fund. If the exit option is not exercised by the limited partners, the general partner of 7Ridge Fund may market Trading Technologies for sale to a third party. If Trading Technologies is sold to a third party, the general partner of the 7Ridge Fund would be entitled to receive a variable portion of the sales proceeds determined based upon the satisfaction of certain contractual performance goals. As of June 30, 2024 the exit option was not exercisable.
Other Equity Investments
The carrying value of other equity investments is included in investments in the condensed consolidated balance sheets. The Company accounts for these investments using the measurement alternative given the absence of readily determinable fair values for the respective investments and due to the Company’s inability to exercise significant influence over the investments based upon the respective ownership interests held.
In the second quarter of 2024, the Company recorded an impairment charge of $
5. PROPERTY AND EQUIPMENT, NET
Property and equipment, net consisted of the following as of June 30, 2024 and December 31, 2023 (in millions):
June 30, | December 31, | |||||
| 2024 |
| 2023 | |||
Construction in progress | $ | | $ | | ||
Furniture and equipment |
| |
| | ||
Total property and equipment |
| |
| | ||
Less accumulated depreciation |
| ( |
| ( | ||
Property and equipment, net | $ | | $ | |
Depreciation expense using the straight-line method was $
The sale of the Company’s former headquarters including the associated land, building, and certain furniture and equipment of the former headquarters location (“the Property”) was completed on June 28, 2024. In connection with the sale, the Company provided seller financing to the purchaser of the Property (“the Purchaser”) in the form of a secured promissory note for a portion of the purchase price of the Property. The total purchase price of the Property was $
The $
6. CREDIT LOSSES
Current expected credit losses are estimated for accounts receivable and certain notes receivable.
19
Accounts receivable represent amounts due from the Company’s member firms. The allowance for accounts receivable credit losses is calculated using an aging schedule.
The allowance for notes receivable credit losses is associated with notes receivable included within other assets, net on the condensed consolidated balance sheets and relates to promissory notes to fund the implementation and operation of the consolidated audit trail (“CAT”), a portion of which notes are expected to be repaid by Consolidated Audit Trail, LLC (“CATLLC”). CAT involves the creation of an audit trail that is required by Rule 613 under the Securities Exchange Act of 1934 (“Rule 613”), and it strives to enhance regulators’ ability to monitor trading activity in the U.S. national securities markets through a phased implementation. CATLLC is a national market system plan that was created by self-regulatory organizations that include the Cboe U.S. national securities exchanges, the other U.S. national securities exchanges and FINRA (who collectively are referred to as the “SROs” or “Plan Participants”) to implement and operate the CAT. The funding of the CAT’s implementation and operations is ultimately expected to be provided by Plan Participants and by broker-dealers (who are referred to as “Industry Members”). However, to date the funding of the CAT has been provided solely by the Plan Participants in exchange for promissory notes.
On September 6, 2023, the SEC issued an order approving an amendment to the CAT national market system plan to implement a revised funding model (“CAT Funding Model”) for CATLLC to fund the CAT. The approved CAT Funding Model contemplates two categories of CAT fees calculated based on the “executed equivalent shares” of transactions in eligible securities: (i) CAT fees assessed by CATLLC to Industry Members who are CAT Executing Brokers (the brokers responsible for executing each side of the transaction) to recover a portion of historical CAT costs previously paid to CATLLC by the Plan Participants; and (ii) CAT fees assessed by CATLLC to CAT Executing Brokers and Plan Participants to fund a portion of prospective CAT costs. To date, the funding of the CAT has solely been provided by the Plan Participants in exchange for promissory notes. The funds generated from the assessment of CAT fees to recover a portion of historical CAT costs will be used by CATLLC to repay a portion of the promissory notes to the Plan Participants.
The Plan Participants submitted fee filings during the first week of January 2024 with the SEC to implement the applicable transaction-based fee rates that are to be assessed by CATLLC to CAT Executing Brokers to recover a portion of historical CAT costs incurred prior to 2022. On January 17, 2024, the SEC issued orders suspending each Plan Participant’s fee filing and instituting proceedings to determine whether to approve or disapprove the fees, which orders were published in the Federal Register on February 13, 2024. SEC action on the fee filings is still pending as of the date of this filing.
Additional CAT fees related to a portion of other historical CAT costs and to prospective CAT costs are planned to be introduced at a later time through separate fee filings submitted by the Plan Participants. Once the CAT fee related to ongoing prospective CAT costs becomes effective through fee filings submitted by the Plan Participants, it is anticipated the Plan Participants will no longer continue to fund CATLLC in exchange for promissory notes.
Until the fees for historical CAT costs that are associated with the promissory notes are collected from CAT Executing Brokers and remitted by CATLLC to the Plan Participants, and until the CAT fee assessed by CATLLC to CAT Executing Brokers and Plan Participants to fund prospective CAT costs is implemented, the Plan Participants may continue to incur additional significant costs, including additional promissory notes to fund CAT. Additionally, portions of promissory notes related to the funding of the implementation and operation of the CAT may not be collectible, including if the SEC finds that the Plan Participants did not satisfy any of the financial accountability milestones. The allowance for notes receivable credit losses associated with the CAT is calculated using a methodology that is primarily based on the structure of the notes and various potential outcomes under the CAT Funding Model. See Note 21 (“Commitments, Contingencies, and Guarantees”) for more information.
The following represents the changes in allowance for credit losses during the six months ended June 30, 2024 (in millions):
Allowance for | Allowance for | Total | |||||||
Balance at December 31, 2023 | $ | | $ | | $ | | |||
Current period provision for expected credit losses | — | | | ||||||
Write-offs charged against the allowance | — | ( | ( | ||||||
Recoveries collected | — | — | — | ||||||
Balance at June 30, 2024 | $ | | $ | | $ | |
20
7. OTHER ASSETS, NET
Other assets, net consisted of the following as of June 30, 2024 and December 31, 2023 (in millions):
June 30, | December 31, | |||||
| 2024 |
| 2023 | |||
Software development work in progress | $ | | $ | | ||
Data processing software | | | ||||
Less accumulated depreciation and amortization |
| ( |
| ( | ||
Data processing software, net |
| |
| | ||
Other assets (1) | | | ||||
Other assets, net | $ | | $ | |
(1) | At June 30, 2024, the majority of the balance included notes receivable, net of allowance, and long-term prepaid assets. At December 31, 2023, the majority of the balance included notes receivable, net of allowance, a contra-revenue asset, and long-term prepaid assets. As of June 30, 2024 and December 31, 2023, the notes receivable, net balance was $ |
Amortization expense related to data processing software was $
8. GOODWILL, INTANGIBLE ASSETS, NET, AND DIGITAL ASSETS HELD
The following table presents the details of goodwill by segment (in millions):
North American | Europe and | |||||||||||||||||
| Options |
| Equities |
| Asia Pacific |
| Global FX |
| Digital |
| Total | |||||||
Balance as of December 31, 2023 | $ | | $ | | $ | | $ | | $ | — | $ | | ||||||
Changes in foreign currency exchange rates |
| — |
| ( |
| ( |
| — |
| — |
| ( | ||||||
Balance as of June 30, 2024 | $ | | $ | | $ | | $ | | $ | — | $ | |
Goodwill has been allocated to specific reporting units for purposes of impairment testing - Options, North American Equities, Europe and Asia Pacific, and Global FX.
The following table presents the details of the intangible assets by segment (in millions):
North American | Europe and | |||||||||||||||||
| Options |
| Equities |
| Asia Pacific |
| Global FX |
| Digital |
| Total | |||||||
Balance as of December 31, 2023 | $ | | $ | | $ | | $ | | $ | | $ | | ||||||
Additions | — |
| |
| — |
| — |
| — | | ||||||||
Amortization |
| ( |
| ( |
| ( | ( | ( |
| ( | ||||||||
Changes in foreign currency exchange rates |
| — |
| ( | ( |
| — |
| — |
| ( | |||||||
Impairment |
| — |
| — | — |
| — |
| ( |
| ( | |||||||
Balance as of June 30, 2024 | $ | | $ | | $ | | $ | | $ | | $ | |
Following the April 2024 announcement of the Cboe Digital spot market wind down and unwinding of the minority ownership structure in the holding company parent of the Cboe Digital entities, the Company performed an interim impairment test for the intangible assets recognized in the Digital reporting unit as the announcement was considered a
21
potential indication of impairment. The Company concluded that the carrying value of the trading registrations and licenses and technology exceeded their estimated fair value, as their projected future cash flows, subsequent to the decision to wind down the business, did not support their valuation, and recorded an impairment charge of $
For the three months ended June 30, 2024 and 2023, amortization expense was $
The following tables present the categories of intangible assets by segment as of June 30, 2024 and December 31, 2023 (in millions, except as stated):
June 30, 2024 | Weighted | ||||||||||||||||
North | Europe | Average | |||||||||||||||
American | and Asia | Amortization | |||||||||||||||
| Options |
| Equities |
| Pacific |
| Global FX |
| Digital |
| Period (in years) | ||||||
Trading registrations and licenses | $ | | $ | | $ | | $ | — | $ | — | Indefinite | ||||||
Customer relationships |
| |
| |
| |
| |
| — | |||||||
Market data customer relationships |
| |
| |
| |
| |
| — | |||||||
Technology |
| |
| |
| |
| |
| — | |||||||
Trademarks and tradenames |
| |
| |
| |
| |
| — | |||||||
Digital assets held | — | | — | — | | Indefinite | |||||||||||
Accumulated amortization |
| ( |
| ( |
| ( |
| ( |
| — | |||||||
$ | | $ | | $ | | $ | | $ | |
December 31, 2023 | Weighted | ||||||||||||||||
North | Europe | Average | |||||||||||||||
American | and Asia | Amortization | |||||||||||||||
| Options |
| Equities |
| Pacific |
| Global FX |
| Digital |
| Period (in years) | ||||||
Trading registrations and licenses | $ | | $ | | $ | | $ | — | $ | | Indefinite | ||||||
Customer relationships |
| | | | | — | |||||||||||
Market data customer relationships |
| | | | | — | |||||||||||
Technology |
| | | | | | |||||||||||
Trademarks and tradenames |
| | | | | — | |||||||||||
Digital assets held | — | — | — | — | | Indefinite | |||||||||||
Accumulated amortization |
| ( | ( | ( | ( | ( | |||||||||||
$ | | $ | | $ | | $ | | $ | |
Cboe Digital holds customer digital assets in customer accounts, referred to as wallets, either through a licensed trust company, third-party custodian or in separate and distinct wallets managed by Cboe Digital. Cboe Digital, together with its third-party custodian, secures customers’ digital assets and protects them from loss or theft. Customer digital assets are held in omnibus wallets for the benefit of customers of Cboe Digital and Cboe Digital maintains the records of the amount and type of digital asset owned by each of its customers in omnibus wallets. The amount of customer digital assets held by Cboe Digital is reflected within digital assets – safeguarded assets and digital assets – safeguarded liabilities in the condensed consolidated balance sheets. In addition, Cboe Digital maintains an immaterial amount of its own digital assets to facilitate customer trading.
In October 2022, the Company, through its wholly-owned subsidiary Cboe NL, entered into a Data Provider Agreement with Pyth Data Association (“Pyth”) to create a data feed and begin publishing limited derived equities market data for certain symbols from
22
9. ACCOUNTS PAYABLE AND ACCRUED LIABILITIES
Accounts payable and accrued liabilities consisted of the following as of June 30, 2024 and December 31, 2023 (in millions):
| June 30, | December 31, | ||||
2024 |
| 2023 | ||||
Compensation and benefit-related liabilities | $ | | $ | | ||
Royalties | | | ||||
Accrued liabilities |
| | | |||
Current operating lease liabilities | | | ||||
Rebates payable | | | ||||
Marketing fee payable |
| | | |||
Current unrecognized tax benefits | | | ||||
Accounts payable |
| | | |||
Total accounts payable and accrued liabilities | $ | | $ | |
10. DEBT
The Company’s debt consisted of the following as of June 30, 2024 and December 31, 2023 (in millions):
| June 30, | December 31, | ||||
2024 |
| 2023 | ||||
$ | $ | | $ | | ||
$ | | | ||||
$ | | | ||||
Revolving Credit Agreement | — | — | ||||
Cboe Clear Europe Credit Facility | — | — | ||||
Total debt | $ | | $ | |
Senior Notes
On January 12, 2017, the Company entered into an indenture (the “Indenture”), by and between the Company and Computershare Trust Company, N.A. (as successor to Wells Fargo Bank, National Association), as trustee, in connection with the issuance of $
On December 15, 2020, the Company issued $
On March 16, 2022, the Company issued $
23
The Senior Notes are unsecured obligations of the Company and rank equally with all of the Company’s other existing and future unsecured, senior indebtedness, but are effectively junior to the Company’s secured indebtedness, to the extent of the value of the assets securing such indebtedness, and will be structurally subordinated to the secured and unsecured indebtedness of the Company’s subsidiaries.
The Company has the option to redeem some or all of the Senior Notes, at any time in whole or from time to time in part, at the redemption prices set forth in the applicable Officer’s Certificate. The Company may also be required to offer to repurchase the Senior Notes upon the occurrence of a Change of Control Triggering Event (as such term is defined in the applicable Officer’s Certificate) at a repurchase price equal to
Indenture
Under the Indenture, the Company may issue debt securities, which includes the Senior Notes, at any time and from time to time, in one or more series without limitation on the aggregate principal amount. The Indenture governing the Senior Notes contains customary restrictions, including a limitation that restricts the Company’s ability and the ability of certain of the Company’s subsidiaries to create or incur secured debt. Such Indenture also limits certain sale and leaseback transactions and contains customary events of default. At June 30, 2024, the Company was in compliance with these covenants.
Revolving Credit Agreement
On February 25, 2022, the Company entered into a Second Amended and Restated Credit Agreement (the “Revolving Credit Agreement”), which amended and restated the prior revolving credit agreement.
The Revolving Credit Agreement provides for a senior unsecured $
Funds borrowed under the Revolving Credit Agreement may be used to fund working capital and for other general corporate purposes, including the making of any acquisitions the Company may pursue in the ordinary course of its business. As of June 30, 2024,
Loans under the Revolving Credit Agreement will bear interest, at the Company’s option, at either (i) the Relevant Rate (defined herein) plus a margin (based on the Company’s public debt ratings) ranging from
Subject to certain conditions stated in the Revolving Credit Agreement, the Company and any subsidiaries designated as additional borrowers may borrow, prepay and reborrow amounts under the Revolving Credit Facility at any time during the term of the Revolving Credit Agreement. The Revolving Credit Agreement will terminate and all amounts owing thereunder will be due and payable on February 25, 2027, unless the commitments are terminated earlier, either at the request of the Company or, if an event of default occurs, by the lenders (or automatically in the case of certain bankruptcy-related events). The Revolving Credit Agreement contains customary representations, warranties, and affirmative and negative covenants for facilities of its type, including financial covenants, events of default and indemnification provisions in favor of the lenders. The negative covenants include restrictions regarding the incurrence of liens, the incurrence of indebtedness by the Company’s subsidiaries and fundamental changes, subject to certain exceptions in each case. The financial covenants require the Company to meet a quarterly financial test with respect to a minimum consolidated interest coverage ratio of not less than
24
not greater than
Cboe Clear Europe Credit Facility
On July 1, 2020, Cboe Clear Europe, as borrower, the Company, as guarantor, entered into a Facility Agreement (as subsequently amended and restated, the “Facility” or “Cboe Clear Europe Credit Facility”) with Bank of America Merrill Lynch International Designated Activity Company, as co-ordinator, facility agent, lender, sole lead arranger and sole bookrunner, Citibank N.A., as security agent, and certain other lenders named therein. The Facility was amended and restated, on July 1, 2021, June 30, 2022, June 29, 2023, and June 28, 2024, as described below.
The Facility provides for a €
Borrowings under the Facility are secured by cash, eligible government bonds and eligible equity assets deposited by Cboe Clear Europe into secured accounts. In addition, Cboe Clear Europe must ensure that at all times the aggregate of (a) each clearing participant’s contribution to the relevant clearing fund, (b) each clearing participant’s margin amount and (c) any cash equities purchased using the proceeds of the assets described in (a) and (b), less the amount of any such clearing participant contribution, margin amount or cash equities which have been transferred to (or secured in favor of) any provider of settlement or custody services to Cboe Clear Europe, is not less than €
Borrowings under the Facility’s revolving loans and non-U.S. dollar swingline loans bear interest at the relevant floating base rate plus a margin of
Subject to certain conditions stated in the Facility, Cboe Clear Europe may borrow, prepay and reborrow amounts under the Facility at any time during the term of the Facility. The Facility will terminate and all amounts owing thereunder will be due and payable on June 27, 2025, unless the commitments are terminated earlier, either at the request of Cboe Clear Europe or, if an event of default occurs, by the Lenders (or automatically in the case of certain bankruptcy-related events).
The Facility contains customary representations, warranties and covenants for facilities of its type, including events of default of the Company and Cboe Clear Europe and indemnification provisions in favor of the Lenders. In particular, the covenants include restrictions regarding the incurrence of liens by Cboe Clear Europe and its subsidiaries, and an event of default will be triggered if Cboe Clear Europe ceases its business, subject to certain exceptions in each case. There is also a requirement for the net worth of (a) the Company to be no less than $
As of June 30, 2024,
25
Notes Payments and Contractual Interest
The future expected repayments related to the Senior Notes as of June 30, 2024 are as follows (in millions):
Remainder of 2024 |
| $ | — |
2025 | — | ||
2026 | — | ||
2027 | | ||
2028 | — | ||
Thereafter | | ||
Principal amounts repayable | | ||
Debt issuance costs | ( | ||
Unamortized discounts on notes | ( | ||
Total debt outstanding | $ | |
Interest expense recognized on the Term Loan Credit Agreement (the “Term Loan Agreement”), the Senior Notes, and the Revolving Credit Agreement is included in interest expense in the condensed consolidated statements of income. As of December 31, 2023 the Term Loan Agreement matured and was repaid in full and therefore the Company no longer incurs interest expense related to the Term Loan Agreement. The Company is also obligated to pay commitment fees under the terms of the Revolving Credit Agreement and Facility, which are also included in interest expense.
Components of interest expense, net recognized in the condensed consolidated statements of income for the three and six months ended June 30, 2024 and 2023 are as follows (in millions):
Three Months Ended | Six Months Ended | |||||||||||
June 30, | June 30, | |||||||||||
| 2024 |
| 2023 |
| 2024 |
| 2023 | |||||
Components of interest expense: | ||||||||||||
Contractual interest | $ | | $ | | $ | | $ | | ||||
Amortization of debt discount and issuance costs |
| |
| |
| |
| | ||||
Interest expense | $ | | $ | | $ | | $ | | ||||
Interest income | ( | ( | ( | ( | ||||||||
Interest expense, net | $ | | $ | | $ | | $ | |
11. ACCUMULATED OTHER COMPREHENSIVE LOSS, NET
The following represents the changes in accumulated other comprehensive loss, net by component (in millions):
Foreign | Total Accumulated | |||||||||||
Currency |
| Unrealized | Other | |||||||||
Translation |
| Investment | Post-Retirement | Comprehensive | ||||||||
| Adjustment |
| Loss |
| Benefits |
| Loss, Net | |||||
Balance at December 31, 2023 | $ | ( | $ | ( | $ | ( | $ | ( | ||||
Other comprehensive (loss) income |
| ( | ( | | ( | |||||||
Balance at June 30, 2024 | $ | ( | $ | ( | $ | | $ | ( |
12. CLEARING OPERATIONS
Cboe operates
Cboe Clear Europe
Cboe Clear Europe is a European equities central counterparty that provides post-trade services to stock exchanges, MTFs, over-the-counter (“OTC”) equities trades and an equity derivatives exchange. Cboe Clear Europe clears equities from
26
Europe becomes the buyer for every seller and the seller for every buyer, thereby protecting clearing participants from counterparty risk and allowing the settlement of trades in the event of a clearing participant default.
Cboe Clear Europe only assumes the guarantor role if it has an equal and offsetting claim against a clearing participant. For the period ended June 30, 2024, there have been no events of default for which a liability is required to be recognized in accordance with GAAP.
Cboe Clear Europe Clearing Participant Deposits
Cboe Clear Europe generally requires all clearing participants to deposit collateral to help mitigate Cboe Clear Europe’s exposure to credit risk in the event that a clearing participant fails to meet a financial or contractual obligation.
Margin Deposits
Margin deposits, which are predominately in the form of cash and cash equivalents, are deposits made by each clearing participant to Cboe Clear Europe to cover some or all of the credit risk of its failure to fulfill its obligations in the trade. Cboe Clear Europe maintains and manages all cash deposits related to margin deposits. Substantially all risks and rewards of cash and cash equivalents margin deposit ownership, including net interest income, belong to Cboe Clear Europe and are recorded in cash and spot markets on the condensed consolidated statements of income. In the event of a default, Cboe Clear Europe can access the defaulting participant’s margin deposits to cover the defaulting participant’s losses. For more information, see “Default and Liquidity Waterfalls” below.
Clearing Funds
The clearing fund mutualizes the risk of default among all clearing participants. Depending on their membership, clearing participants contribute to the cash-equity and/or derivatives segment of the clearing fund. Although the entire clearing fund is available to cover potential losses in the event that the margin deposits and the clearing fund deposits of a defaulting clearing participant are inadequate to fulfill that clearing participant’s outstanding financial obligations, the clearing fund first uses the product class segment of the Clearing Fund in which the defaulting participants was active (see “Default and Liquidity Waterfalls” below). In the event of a default, Cboe Clear Europe is generally required to liquidate the defaulting clearing participant’s open positions. To the extent that the positions remain open, Cboe Clear Europe is required to assume the defaulting clearing participant’s obligations related to the open positions. Clearing participants are required to make contributions to the clearing fund that are proportional to their risk exposure in the form of cash or non-cash contributions, which generally consist of highly liquid securities.
Interoperability Fund
For the cash equity business line, Cboe Clear Europe has entered into interoperable arrangements with
Effective August 14, 2023, Cboe Clear Europe enacted changes to its rules, and is able to invest the cash collateral received in the form of interoperability fund deposits from clearing participants in certain investments, typically securities issued by pre-approved sovereign issuers and reverse repurchase agreements with overnight maturities. When investments are made in accordance with Cboe Clear Europe’s Investment Policy, Cboe Clear Europe receives the amount of investment earnings and pays clearing participants those earnings minus a set basis point cost of collateral. As Cboe Clear Europe is able to direct the investment of the cash interoperability fund deposits received from the clearing participants within the program parameters and receives an economic benefit from those investments, these amounts are included in the margin deposits, clearing funds, and interoperability funds captions in the condensed consolidated balance sheets and the related interest income and expense is recorded in other revenue and other cost of revenue, respectively, on the condensed consolidated statements of income.
27
Cboe Clear Europe Default and Liquidity Waterfalls
The default waterfall is the priority order in which the capital resources are expected to be utilized in the event of a default where the defaulting clearing participant’s collateral would not be sufficient to cover the cost to liquidate its portfolio. If a default occurs and the defaulting clearing participant’s collateral, including margin deposits and clearing fund deposits, are depleted, then additional capital is utilized in the following order:
● | Cboe Clear Europe’s dedicated own resources: The Cboe Clear Europe default waterfall first utilizes its dedicated own resources in |
● | Clearing fund: Second, the Cboe Clear Europe default waterfall utilizes traditional CCP risk mutualization, in the event that default losses fully exhaust Cboe Clear Europe’s dedicated own resources amount, whereby contributions applicable to a particular product class are applied first to any loss attributable to that product class. |
● | Pro rata contributions: Third, if the default losses caused cannot be covered by the first two layers, the non-defaulting clearing participants shall on demand make additional payments to Cboe Clear Europe on a pro rata basis in proportion to the amount of their clearing fund contributions to cover any such remaining losses, which is limited to an amount equal to twice their clearing fund contribution as established under Cboe Clear Europe’s rules and regulations. In this scenario, contributions applicable to a particular product class are first applied to any losses attributable to that product class. |
In addition to the default waterfall, the liquidity waterfall is the priority order in which the liquidity resources are expected to be utilized for Cboe Clear Europe’s ordinary course business operations and in situations when additional liquidity resources and liquidity measures may be activated in case of a potential liquidity shortfall. Liquidity, intraday or overnight, is mainly required for securities settlement. In ordinary course business circumstances, liquidity resources include the collateral directly deposited with Cboe Clear Europe, FX swap arrangements, and reverse repurchase agreements, as well as the use of the Facility.
Cboe Clear Digital
Cboe Clear Digital is a digital asset derivatives clearinghouse and central counterparty that provides clearing and settlement of digital asset trades. Cboe Clear Digital is registered as a Derivatives Clearing Organization (“DCO”) regulated by the U.S. Commodity Futures Trading Commission (“CFTC”) and is registered with the U.S. Treasury Financial Crimes Enforcement Network (“FinCEN”) as a money services business (“MSB”). Cboe Clear Digital is in the process of surrendering money transmitter licenses that were necessary for engagement with the Cboe Digital spot market. Before the surrendering process was initiated, Cboe Clear Digital was authorized by license or not subject to licensing to conduct MSB services in 50 U.S. jurisdictions. Cboe Clear Digital performs a guarantee function whereby Cboe Clear Digital helps to ensure that the obligations of the transactions it clears are fulfilled. Cboe Clear Digital attempts to mitigate this risk by performing internal compliance and due diligence procedures as well as implementing internal risk controls. Cboe Clear Digital's due diligence procedures include review of the personal and corporate information, financial position of the member participant, and monitoring of Cboe Clear Digital's risk exposure thresholds. A clearing member is required to deposit collateral, which are in the form of cash and digital assets for spot products and cash for futures products to cover some or all of the credit risk of its failure to fulfill its obligations. As of June 30, 2024, Cboe Clear Digital does not expect a material loss concerning credit risk on any member participant.
Cboe Clear Digital Clearing Participant Deposits
Customer Bank Deposits
Cboe Clear Digital holds cash on behalf of its customers for the purposes of supporting clearing transactions. Customer cash may be invested in approved investments and any interest or gain received, or loss incurred on invested funds is recorded in the condensed consolidated statements of income. For the three and six months ended June 30, 2024, interest on invested funds totaled $
28
related to the clearing activity on the condensed consolidated balance sheets in margin deposits, clearing funds, and interoperability funds, with a corresponding liability.
Digital Assets - Safeguarded Assets
The Company holds digital assets on behalf of its customers. In accordance with the SEC issued Staff Accounting Bulletin 121 (“SAB 121”), the Company includes customer digital assets on the condensed consolidated balance sheets in digital assets - safeguarded assets, with a corresponding offset in digital assets - safeguarded liabilities. Digital assets – safeguarded assets totaled $
The following depicts the Company’s valuation of digital assets – safeguarded assets and safeguarded liabilities as of June 30, 2024 and December 31, 2023:
June 30, 2024 | |||||||||
Digital Asset |
| Number of Units |
| Valuation per Unit |
| Fair Value (in millions) | |||
Bitcoin ("BTC") | | $ | | $ | | ||||
Ethereum ("ETH") | | | | ||||||
Litecoin ("LTC") | | | | ||||||
Bitcoin Cash ("BCH") | | | — | ||||||
USD Coin ("USDC") | | | — | ||||||
Total | $ | |
December 31, 2023 | |||||||||
Digital Asset |
| Number of Units |
| Valuation per Unit |
| Fair Value (in millions) | |||
Bitcoin ("BTC") | | $ | | $ | | ||||
Ethereum ("ETH") | | | | ||||||
Litecoin ("LTC") | | | | ||||||
Bitcoin Cash ("BCH") | | | | ||||||
USD Coin ("USDC") | | | | ||||||
Total | $ | |
29
Margin Deposits, Clearing Funds, and Interoperability Funds
The details of margin deposits, clearing funds, and interoperability funds as of June 30, 2024 and December 31, 2023, are as follows (in millions):
June 30, 2024 | ||||||||||||
| Margin Deposits |
| Clearing Funds |
| Interoperability Funds |
| Total | |||||
Cboe Clear Europe central bank account | $ | | $ | | $ | | $ | | ||||
Cboe Clear Europe reverse repurchase and other | | — | | | ||||||||
Cboe Clear Digital customer bank deposits | | — | — | | ||||||||
Total cash margin deposits, clearing funds, and interoperability funds | $ | | $ | | $ | | $ | | ||||
June 30, 2024 | ||||||||||||
Margin Deposits |
| Clearing Funds |
| Interoperability Funds |
| Total | ||||||
Cboe Clear Europe non-cash contributions (1) | $ | | $ | | $ | | $ | |
December 31, 2023 | ||||||||||||
| Margin Deposits |
| Clearing Funds |
| Interoperability Funds |
| Total | |||||
Cboe Clear Europe central bank account | $ | | $ | | $ | | $ | | ||||
Cboe Clear Europe reverse repurchase and other | | | | | ||||||||
Cboe Clear Digital customer bank deposits | | — | — | | ||||||||
Total cash margin deposits, clearing funds, and interoperability funds | $ | | $ | | $ | | $ | | ||||
December 31, 2023 | ||||||||||||
Margin Deposits |
| Clearing Funds |
| Interoperability Funds |
| Total | ||||||
Cboe Clear Europe non-cash contributions (1) | $ | | $ | | $ | | $ | |
(1) | These amounts are not reflected in the condensed consolidated balance sheets, as Cboe Clear Europe does not have the ability to sell or repledge the amounts absent a clearing participant default. |
13. FAIR VALUE MEASUREMENT
Fair value is the price that would be received upon the sale of an asset or paid upon the transfer of a liability in an orderly transaction between market participants at the measurement date and in the principal or most advantageous market for that asset or liability. The fair value should be calculated based on assumptions that market participants would use in pricing the asset or liability, not on assumptions specific to the entity. In addition, the fair value of liabilities should include consideration of non-performance risk, including the Company’s own credit risk.
The Company applied FASB Accounting Standards Codification (“ASC”) 820 — Fair Value Measurement, which provides guidance for using fair value to measure assets and liabilities by defining fair value and establishing the framework for measuring fair value. ASC 820 applies to financial and nonfinancial instruments that are measured and reported on a fair value basis. The three-level hierarchy of fair value measurements is based on whether the inputs to those measurements are observable or unobservable. Observable inputs reflect market data obtained from independent sources, while unobservable inputs reflect the Company’s market assumptions. The fair value hierarchy requires the use of observable market data when available and consists of the following levels:
● | Level 1—Unadjusted inputs based on quoted markets for identical assets or liabilities. |
● | Level 2—Observable inputs, either direct or indirect, not including Level 1 measurements, corroborated by market data or based upon quoted prices in non-active markets. |
30
● | Level 3—Unobservable inputs that reflect management’s best assumptions of what market participants would use in valuing the asset or liability. |
The Company has included a tabular disclosure for financial assets and liabilities that are measured at fair value on a recurring basis in the condensed consolidated balance sheets as of June 30, 2024 and December 31, 2023, respectively.
Assets and Liabilities Measured at Fair Value on a Recurring Basis
The following tables present the Company’s fair value hierarchy for those assets and liabilities measured at fair value on a recurring basis as of June 30, 2024 and December 31, 2023 (in millions):
June 30, 2024 | ||||||||||||
| Total |
| Level 1 |
| Level 2 |
| Level 3 | |||||
Assets: | ||||||||||||
U.S. Treasury securities (1) | $ | | $ | | $ | — | $ | — | ||||
Marketable securities (1): | ||||||||||||
Mutual funds | | | — | — | ||||||||
Money market funds |
| |
| |
| — |
| — | ||||
Digital assets - safeguarded assets | | — | | — | ||||||||
Note receivable - building sale (2) | | — | — | | ||||||||
Total assets | $ | | $ | | $ | | $ | | ||||
Liabilities: | ||||||||||||
Contingent consideration liabilities | $ | | $ | — | $ | — | $ | | ||||
Digital assets - safeguarded liabilities | | — | | — | ||||||||
Total liabilities | $ | | $ | — | $ | | $ | |
December 31, 2023 | ||||||||||||
| Total |
| Level 1 |
| Level 2 |
| Level 3 | |||||
Assets: | ||||||||||||
U.S. Treasury securities (1) | $ | | $ | | $ | — | $ | — | ||||
Marketable securities (1): | ||||||||||||
Mutual funds | | | — | — | ||||||||
Money market funds | | | — | — | ||||||||
Digital assets - safeguarded assets | | — | | — | ||||||||
Total assets | $ | | $ | | $ | | $ | — | ||||
Liabilities: | ||||||||||||
Contingent consideration liabilities | $ | | $ | — | $ | — | $ | | ||||
Digital assets - safeguarded liabilities | | — | | — | ||||||||
Cboe Digital restricted common units liability (3) | | — | — | | ||||||||
Cboe Digital warrant liability (3) | | — | — | | ||||||||
Total liabilities | $ | | $ | — | $ | | $ | |
(1) | These amounts are reflected within financial investments in the condensed consolidated balance sheets. |
(2) | This amount is reflected within other assets, net in the condensed consolidated balance sheets. |
(3) | These amounts are reflected within other non-current liabilities in the condensed consolidated balance sheets. |
The following is a description of the Company’s valuation methodologies used for instruments measured at fair value on a recurring basis:
Financial Investments
Financial investments consist of highly liquid U.S. Treasury securities, and marketable securities held in a trust for the Company’s non-qualified retirement and benefit plans, also referred to as deferred compensation plan assets. The deferred compensation plan assets have an equal and offsetting deferred compensation plan liability based on the value of the deferred compensation plan assets. These securities are valued by obtaining feeds from a number of live data sources, including active market makers and inter-dealer brokers and therefore categorized as Level 1. No material adjustments were made to the carrying value of financial investments for the period ended June 30, 2024. See Note 15 (“Employee Benefit Plans”) for more information.
31
Digital Assets – Safeguarded Assets and Liabilities
Digital assets – safeguarded assets and liabilities represents the Company’s holdings of Bitcoin, Ethereum, Litecoin, Bitcoin Cash, and USD Coin on behalf of the Company’s customers. The Company valued digital assets – safeguarded assets and digital assets – safeguarded liabilities by using the closing prices at 4:00pm Central Time on the CoinDesk Indices Price Index as of June 30, 2024 for the underlying digital assets held on behalf of the Company’s customers. See Note 12 (“Clearing Operations”) for additional details regarding digital assets held on behalf of customers.
Contingent Consideration Liabilities
In connection with the acquisitions of Cboe Asia Pacific and Cboe Canada, the Company entered into contingent consideration arrangements with the sellers. The total fair value of the liabilities at June 30, 2024 was $
Note Receivable – Building Sale
The Company provided seller financing in the form of a secured promissory note for a portion of the purchase price of the Property sale completed on June 28, 2024. See Note 5 (“Property and Equipment, Net”) for more information. The Company has elected the fair value option available under ASC 825 for this note and subsequent changes in fair value are reported in other (expense) income, net on the condensed consolidated statements of income. The fair value was calculated using the initial projected amortization schedule, credit risk assumptions, and implied interest rates for similar instruments. These inputs are considered Level 3 in the fair value hierarchy. The note is within other assets, net on the condensed consolidated balance sheet as of June 30, 2024. The fair value option was not elected for other notes receivable described in Note 7 (“Other Assets, Net”) due to uncertain payment terms and credit and legal risks as described in Note 6 (“Credit Losses”). The note receivable related to the building sale was not 90 days or more past due or in non-accrual status as of June 30, 2024.
Assets and Liabilities Measured at Fair Value on a Nonrecurring Basis
Certain assets, such as goodwill and intangible assets, are measured at fair value on a non-recurring basis. For goodwill, the process involves using a market approach and income approach (using discounted estimated cash flows) to determine the fair value of each reporting unit on a stand-alone basis. That fair value is compared to the carrying value of the reporting unit, including its recorded goodwill. In connection with the annual impairment evaluation of goodwill and indefinite lived intangibles, impairment is considered to have occurred if the fair value of the reporting unit is lower than the carrying value of the reporting unit. For equity method investments and intangible assets, other than digital assets held, the process also involves using a discounted cash flow method to determine the fair value of each asset. Impairment is considered to have occurred if the fair value of the asset is lower than its carrying value. These measurements are considered Level 3 and these assets are recognized at fair value if they are deemed to be impaired.
Equity investments without readily determinable fair values that are valued using the measurement alternative are measured at fair value on a non-recurring basis. Other than the impairment charge recorded on the Company’s minority investment in Globacap Technology Limited, no observable transactions or impairments impacted the measurements of the investments accounted for as other equity investments. See Note 4 (“Investments”) for more information. These measurements are considered Level 3 and these assets are recognized at fair value if they are deemed to be impaired.
32
Fair Value of Assets and Liabilities
The following tables present the Company’s fair value hierarchy for certain assets and liabilities held by the Company as of June 30, 2024 and December 31, 2023 (in millions):
June 30, 2024 | ||||||||||||
| Total |
| Level 1 |
| Level 2 |
| Level 3 | |||||
Assets: | ||||||||||||
U.S. Treasury securities (1) | $ | | $ | | $ | — | $ | — | ||||
Deferred compensation plan assets (1) | | | — | — | ||||||||
Digital assets - safeguarded assets | | — | | — | ||||||||
Note receivable - building sale (2) | | — | — | | ||||||||
Total assets | $ | | $ | | $ | | $ | | ||||
Liabilities: | ||||||||||||
Contingent consideration liabilities | $ | | $ | — | $ | — | $ | | ||||
Deferred compensation plan liabilities (4) | | | — | — | ||||||||
Digital assets - safeguarded liabilities | | — | | — | ||||||||
Debt (5) |
| |
| — |
| | — | |||||
Total liabilities | $ | | $ | | $ | | $ | |
December 31, 2023 | ||||||||||||
| Total |
| Level 1 |
| Level 2 |
| Level 3 | |||||
Assets: | ||||||||||||
U.S. Treasury securities (1) | $ | | $ | | $ | — | $ | — | ||||
Deferred compensation plan assets (1) |
| |
| |
| — |
| — | ||||
Digital assets - safeguarded assets | | — | | — | ||||||||
Digital assets held (3,5) | | | — | — | ||||||||
Total assets | $ | | $ | | $ | | $ | — | ||||
Liabilities: | ||||||||||||
Contingent consideration liabilities | $ | | $ | — | $ | — | $ | | ||||
Deferred compensation plan liabilities (4) | | | — | — | ||||||||
Digital assets - safeguarded liabilities | | — | | — | ||||||||
Cboe Digital restricted common units liability (4) | | — | — | | ||||||||
Cboe Digital warrant liability (4) | | — | — | | ||||||||
Debt (5) |
| |
| — |
| |
| — | ||||
Total liabilities | $ | | $ | | $ | | $ | |
(1) | These amounts are reflected within financial investments in the condensed consolidated balance sheets. |
(2) | This amount is reflected within other assets, net in the condensed consolidated balance sheets. |
(3) | These amounts are reflected within intangible assets, net in the condensed consolidated balance sheets. |
(4) | These amounts are reflected within other non-current liabilities in the condensed consolidated balance sheets. |
(5) | These balances are presented at fair value in this table, but are carried at their historical value within the condensed consolidated balance sheets. |
Certain financial assets and liabilities, including cash and cash equivalents, accounts receivable, income tax receivable, accounts payable and Section 31 fees payable, and notes receivable are not measured at fair value on a recurring basis, but the carrying values approximate fair value due to their liquid or short-term nature.
Debt
The debt balance consists of fixed rate Senior Notes. The fair values of the Senior Notes are classified as Level 2 under the fair value hierarchy and are estimated using prevailing market quotes.
33
At June 30, 2024 and December 31, 2023, the fair values of the Company’s debt obligations were as follows (in millions):
Fair Value | |||||
June 30, 2024 | December 31, 2023 | ||||
$ | | $ | | ||
| | ||||
| |
Information on Level 3 Financial Assets and Liabilities
The following table sets forth a summary of changes in the fair value of the Company’s Level 3 financial assets and liabilities during the three and six months ended June 30, 2024 (in millions):
Level 3 Financial Assets and Liabilities for the Three Months Ended June 30, 2024 | |||||||||||||||||||||
Balance at | Realized (Losses) | Foreign | Balance at | ||||||||||||||||||
Beginning of | Gains during | Currency | End of | ||||||||||||||||||
| Period |
| Period |
| Adjustments |
| Additions |
| Settlements | Translation |
| Period | |||||||||
Assets: | |||||||||||||||||||||
Note receivable - building sale | $ | — | $ | ( | $ | — | $ | | $ | — | $ | — | $ | | |||||||
Total assets | $ | — | $ | ( | $ | — | $ | | $ | — | $ | — | $ | | |||||||
Balance at | Realized Losses | Foreign | Balance at | ||||||||||||||||||
Beginning of | (Gains) during | Currency | End of | ||||||||||||||||||
Period |
| Period |
| Adjustments |
| Additions |
| Settlements | Translation |
| Period | ||||||||||
Liabilities: | |||||||||||||||||||||
Contingent consideration liabilities |
| $ | | $ | | $ | — | $ | — |
| $ | ( | $ | — | $ | | |||||
Cboe Digital restricted common units liability | | ( | ( | — | ( | — | — | ||||||||||||||
Cboe Digital warrant liability |
| | ( | ( | — |
| ( | — |
| — | |||||||||||
Total liabilities | $ | | $ | | $ | ( | $ | — | $ | ( | $ | — | $ | |
Level 3 Financial Assets and Liabilities for the Six Months Ended June 30, 2024 | |||||||||||||||||||||
Balance at | Realized (Losses) | Foreign | Balance at | ||||||||||||||||||
Beginning of | Gains during | Currency | End of | ||||||||||||||||||
| Period |
| Period |
| Adjustments |
| Additions |
| Settlements | Translation |
| Period | |||||||||
Assets: | |||||||||||||||||||||
Note receivable - building sale | $ | — | $ | ( | $ | — | $ | | $ | — | $ | — | $ | | |||||||
Total assets | $ | — | $ | ( | $ | — | $ | | $ | — | $ | — | $ | | |||||||
Balance at | Realized Losses | Foreign | Balance at | ||||||||||||||||||
Beginning of | (Gains) during | Currency | End of | ||||||||||||||||||
Period |
| Period |
| Adjustments |
| Additions |
| Settlements | Translation |
| Period | ||||||||||
Liabilities: | |||||||||||||||||||||
Contingent consideration liabilities |
| $ | | $ | | $ | — | $ | — |
| $ | ( | $ | — | $ | | |||||
Cboe Digital restricted common units liability | | ( | ( | — | ( | — | — | ||||||||||||||
Cboe Digital warrant liability |
| | ( | ( | — |
| ( | — |
| — | |||||||||||
Total liabilities | $ | | $ | | $ | ( | $ | — | $ | ( | $ | — | $ | |
14. SEGMENT REPORTING
The Company operates
34
segment-level assets or income and expenses below operating income (loss) as key performance metrics; therefore, such information is not presented below. The Company has aggregated all of its corporate costs, as well as other business ventures, within the Corporate Items and Eliminations totals based on the decision that those activities should not be used to evaluate the operating performance of the segments; however, operating expenses that relate to activities of a specific segment have been allocated to that segment.
Options. The Options segment includes options on market indices (“index options”), as well as on the stocks of individual corporations (“equity options”), and on ETPs, such as exchange-traded funds (“ETFs”) and exchange-traded notes (“ETNs”), which are “multi-listed” options and listed on a non-exclusive basis. These options are eligible to trade, as applicable, on Cboe Options, C2, BZX, EDGX, and/or other U.S. national security exchanges. Cboe Options is the Company’s primary options market and offers trading in listed options through a single system that integrates electronic trading and traditional open outcry trading on the Cboe Options trading floor in Chicago. C2 Options, BZX Options, and EDGX Options are all-electronic options exchanges, and typically operate with different market models and fee structures than Cboe Options. The Options segment also includes applicable market data fees revenues generated from the consolidated tape plans, the licensing of proprietary options market data, index licensing, routing services, and access and capacity services.
North American Equities. The North American Equities segment includes U.S. equities and ETP transaction services that occur on fully electronic exchanges owned and operated by BZX, BYX, EDGX, and EDGA, equities transactions that occur on the BIDS Trading platform in the U.S. and Canada, and Canadian equities and other transaction services that occur on or through Cboe Canada Inc.’s order books. The North American Equities segment also includes listing services on Cboe Canada Inc., corporate and ETP listings on BZX, applicable market data fees revenues generated from the consolidated tape plans, the licensing of proprietary equities market data, routing services, and access and capacity services.
Europe and Asia Pacific. The Europe and Asia Pacific segment includes the pan-European listed equities and derivatives transaction services, ETPs, exchange-traded commodities, and international depository receipts that are hosted on MTFs operated by Cboe Europe Equities (Cboe Europe and Cboe NL equities exchanges) and Cboe Europe Derivatives (“CEDX”). It also includes the ETP listings business on RMs and clearing activities of Cboe Clear Europe, as well as the equities transaction services of Cboe Australia and Cboe Japan, operators of trading venues in Australia and Japan, respectively, along with equities transactions that occur on the BIDS Trading platform in Australia and Japan. Cboe Europe operates lit and dark books, a periodic auctions book, and Cboe BIDS Europe, a Large-in-Scale (“LIS”) trading negotiation facility predominately for UK and Swiss symbols. Cboe NL, based in Amsterdam, operates similar business functionality to that offered by Cboe Europe, and provides for trading only in European Economic Area (“EEA”) symbols. Cboe Europe Derivatives, a pan-European derivatives platform, offers futures and options based on Cboe Europe equity indices, and single stock options. This segment also includes Cboe Europe, Cboe NL, CEDX, Cboe Australia and Cboe Japan revenue generated from the licensing of proprietary market data and from access and capacity services.
Futures. The Futures segment includes transaction services provided by CFE, a fully electronic futures exchange, which includes offerings for trading of VIX futures, and other futures products, the licensing of proprietary market data, as well as access and capacity services. On April 25, 2024, the Company announced plans to transition its cash-settled Bitcoin and Ether futures contracts, currently available for trading on the Cboe Digital Exchange, to CFE in the first half of 2025, pending regulatory review.
Global FX. The Global FX segment includes institutional FX trading services that occur on the Cboe FX fully electronic trading platform, non-deliverable forward FX transactions (“NDFs”) offered for execution on Cboe SEF, as well as revenue generated from the licensing of proprietary market data and from access and capacity services. The segment includes transaction services for U.S. government securities executed on the Cboe Fixed Income fully electronic trading platform.
Digital. The Digital segment includes a U.S.-based spot digital asset trading market, regulated futures exchange, and a regulated clearinghouse, as well as revenue generated from the licensing of proprietary market data and from access and capacity services. In-line with the Company’s plans to wind down the spot digital asset trading market by the third quarter of 2024, on May 31, 2024, the Company halted trading on the Cboe Digital spot market. The Company plans to transition its cash-settled Bitcoin and Ether futures contracts, currently available for trading on the Cboe Digital Exchange, to CFE in the first half of 2025, pending regulatory review. The Company intends to continue to present Digital as a distinct reportable business segment through at least the year ending December 31, 2024.
35
Summarized financial data of reportable segments was as follows (in millions):
| North |
| Europe |
|
|
|
| Corporate |
| |||||||||||||||
American | and Asia | Items and | ||||||||||||||||||||||
| Options |
| Equities |
| Pacific |
| Futures |
| Global FX |
| Digital |
| Eliminations |
| Total | |||||||||
Three Months Ended June 30, 2024 | ||||||||||||||||||||||||
Revenues | $ | | $ | | $ | | $ | | $ | | $ | | $ | — | $ | | ||||||||
Operating income (loss) |
| | | | | | ( | ( | | |||||||||||||||
Three Months Ended June 30, 2023 | ||||||||||||||||||||||||
Revenues | $ | | $ | | $ | | $ | | $ | | $ | ( | $ | — | $ | | ||||||||
Operating income (loss) |
| | | | | | ( | | | |||||||||||||||
| North |
| Europe |
|
|
|
| Corporate |
| |||||||||||||||
American | and Asia | Items and | ||||||||||||||||||||||
| Options |
| Equities |
| Pacific |
| Futures |
| Global FX |
| Digital |
| Eliminations |
| Total | |||||||||
Six Months Ended June 30, 2024 | ||||||||||||||||||||||||
Revenues | $ | | $ | | $ | | $ | | $ | | $ | ( | $ | — | $ | | ||||||||
Operating income (loss) | | | | | | ( | ( | | ||||||||||||||||
Six Months Ended June 30, 2023 | ||||||||||||||||||||||||
Revenues | $ | | $ | | $ | | $ | | $ | | $ | ( | $ | — | $ | | ||||||||
Operating income (loss) | | | | | | ( | ( | |
Geographical Information
The following summarizes revenues less cost of revenues based on primary jurisdiction (in millions):
United States | Non-U.S. | Total | ||||||
Revenues less cost of revenues: | ||||||||
Three months ended June 30, 2024 | $ | | $ | | $ | | ||
Three months ended June 30, 2023 | | | |
United States | Non-U.S. | Total | ||||||
Revenues less cost of revenues: | ||||||||
Six months ended June 30, 2024 | $ | | $ | | $ | | ||
Six months ended June 30, 2023 | | | |
15. EMPLOYEE BENEFIT PLANS
Eligible U.S. employees are eligible to participate in the Cboe Options SMART Plan (“SMART Plan”). The SMART Plan is a defined contribution plan, which is qualified under Internal Revenue Code Section 401(k). In addition, eligible employees may participate in the Supplemental Employee Retirement Plan and the Deferred Compensation Plan, which are defined contribution plans that are non-qualified under the Internal Revenue Code. The non-qualified plans assets, held in a trust, are subject to the claims of general creditors of the Company and totaled $
Eligible employees outside of the U.S., which includes employees of Cboe Europe, Cboe NL, Cboe Clear Europe, BIDS, Cboe Asia Pacific, and Cboe Canada Inc. are eligible to participate in various employee-selected stakeholder contribution plans or plans covered by local jurisdictions or by applicable laws. The Company’s contribution amounted to $
Effective January 1, 2023, Directors may contribute a percentage of their cash and equity compensation to cash and equity deferred compensation plans that are maintained by the Company and defer income taxes thereon.
36
16. REGULATORY CAPITAL
As broker-dealers registered with the SEC, Cboe Trading, BIDS Trading, and Cboe Fixed Income are subject to the SEC’s Uniform Net Capital Rule (“Rule 15c3-1”), which requires the maintenance of minimum net capital, as defined therein. The SEC’s requirement also provides that equity capital may not be withdrawn or a cash dividend paid if certain minimum net capital requirements are not met. Cboe Trading, BIDS Trading, and Cboe Fixed Income compute the net capital requirements under the basic method provided for in Rule 15c3-1. As of June 30, 2024, Cboe Trading and BIDS Trading were required to maintain net capital equal to the greater of
As entities regulated by the FCA, Cboe Europe is subject to the Financial Resource Requirement (“FRR”) and Cboe Chi-X Europe is subject to the Capital Resources Requirement (“CRR”). As a RIE, Cboe Europe computes its FRR in accordance with its Financial Risk Assessment, as agreed by the FCA. In accordance with the Markets in Financial Instruments Directive of the FCA requirements, Cboe Chi-X Europe computes its CRR as the greater of the base requirement of $
On March 8, 2019, Cboe NL received approval from the Dutch Ministry of Finance to operate a RM, a MTF, and an approved publication arrangement in the Netherlands. As a RM, Cboe NL is subject to minimum capital requirements, as established by the Dutch Ministry of Finance in the license dated March 8, 2019.
Cboe Clear Europe was granted authorization under European Market Infrastructure Regulation (“EMIR”) by the National Competent Authority, DNB. Cboe Clear Europe is required by the EMIR, to maintain a minimum amount of capital to reflect an estimate of the capital required to wind down or restructure the activities of the clearinghouse, cover operational, legal and business risks and to reserve capital to meet credit, counterparty and market risks not covered by the clearing participants’ collateral and clearing funds.
As a designated contract market regulated by the CFTC, CFE is required to meet
As a swap execution facility regulated by the CFTC, Cboe SEF is required to meet
As a designated contract organization regulated by the CFTC, Cboe Digital Exchange is required to meet
As a derivatives clearing organization regulated by the CFTC, Cboe Clear Digital is required to meet
Cboe Canada Inc. is regulated by the Ontario Securities Commission (“OSC”). Cboe Canada Inc. is required to maintain sufficient financial resources for the proper performance of its functions and to meet its responsibilities. Cboe Canada Inc. must calculate the following financial ratios monthly: (i) current ratio, (ii) a debt to cash flow ratio, and (iii) a financial leverage ratio. Cboe Canada Inc. must report the monthly calculations to the OSC on a quarterly basis.
Cboe Australia is regulated by the Australian Securities and Investments Commission (“ASIC”). Cboe Australia is required to maintain sufficient financial resources to operate the market properly in accordance with Section 794A(d) of the Corporations Act, which Cboe Australia satisfies by maintaining a prudent cash reserve, which must be equal to at least six months of its projected operating expenses.
37
Cboe Japan is regulated by the Japanese Financial Services Agency (“JFSA”) and the Japan Securities Dealers Association (“JSDA”). Cboe Japan is required to maintain a minimum level of regulatory capital ratio of
The following table presents the Company’s subsidiaries with regulatory capital requirements discussed above, as well as the actual and minimum regulatory capital requirements of the subsidiary as of June 30, 2024 (in millions):
Minimum | ||||||||
Subsidiary | Regulatory Authority | Actual | Requirement | |||||
Cboe Trading | FINRA/SEC | $ | $ | |||||
BIDS Trading | FINRA/SEC | |||||||
Cboe Fixed Income | FINRA/SEC | |||||||
Cboe Europe | FCA | |||||||
Cboe Chi-X Europe | FCA | |||||||
Cboe NL | Dutch Authority for Financial Markets | |||||||
Cboe Clear Europe | DNB | |||||||
CFE | CFTC | |||||||
Cboe SEF | CFTC | |||||||
Cboe Digital Exchange | CFTC | |||||||
Cboe Clear Digital | CFTC | |||||||
Cboe Australia | ASIC | |||||||
Cboe Japan | JFSA |
17. STOCK-BASED COMPENSATION
Stock-based compensation is based on the fair value of the award on the date of grant, which is recognized over the related service period, net of actual forfeitures. The service period is the period over which the related service is performed, which is generally the same as the vesting period. Vesting may be accelerated for certain officers and employees as a result of attaining certain age and service-based requirements in the Company’s long-term incentive plan and award agreements.
Stock-based compensation expense relating to employee awards is included in compensation and benefits and acquisition-related costs in the condensed consolidated statements of income. The Company recognized stock-based compensation expense related to employee awards of $
The activity in the Company’s restricted stock, consisting of restricted stock units (“RSUs”), and performance-based restricted stock units (“PSUs”) for the six months ended June 30, 2024 was as follows:
RSUs
The following table summarizes RSU activity during the six months ended June 30, 2024:
Weighted | |||||
Number of | average grant | ||||
| Shares |
| date fair value | ||
Nonvested stock at December 31, 2023 |
| | $ | | |
Granted |
| | | ||
Vested |
| ( | | ||
Forfeited |
| ( | | ||
Nonvested stock at June 30, 2024 |
| | $ | |
38
RSUs entitle the holder to
RSUs granted to non-employee members of the Board of Directors have a
The RSUs have no voting rights but entitle the holder to receive dividend equivalents.
During the six months ended June 30, 2024, to satisfy employees’ tax obligations upon the vesting of restricted stock, the Company purchased
PSUs
The following table summarizes restricted stock units contingent upon achievement of performance conditions, also known as PSUs, activity during the six months ended June 30, 2024:
Weighted | |||||
Number of | average grant | ||||
| Shares |
| date fair value | ||
Nonvested stock at December 31, 2023 |
| | $ | | |
Granted |
| | | ||
Vested |
| ( | | ||
Forfeited |
| — | — | ||
Nonvested stock at June 30, 2024 |
| | $ | |
PSUs include awards related to earnings per share during the performance period as well as awards related to total shareholder return during the performance period. The Company used the Monte Carlo valuation model method to estimate the fair value of the total shareholder return PSUs which incorporated the following assumptions for awards granted in February 2024: risk-free interest rate (
During the six months ended June 30, 2024, to satisfy employees’ tax obligations upon the vesting of performance stock, the Company purchased
As of June 30, 2024, there were $
39
Employee Stock Purchase Plan
In May 2018, the Company’s stockholders approved an Employee Stock Purchase Plan, (“ESPP”), under which a total of
The Company records compensation expense over the offering period related to the discount that is given to employees, which totaled $
Cboe Digital Restricted Common Units
On November 18, 2022, Cboe Digital Holdings entered into minority interest purchase agreements with certain digital asset industry participants, pursuant to which Cboe Digital Holdings agreed to issue
As of March 31, 2024,
In connection with winding down the Cboe Digital spot market, on June 12, 2024, the Company entered into Unit Repurchase Agreements with holders of Cboe Digital Restricted Common Units to repurchase its outstanding Restricted Common Units in exchange for forgiveness of the related promissory note. Certain former investor members also received a cash payment in addition to the forgiveness of their promissory note. The former Cboe Digital investor who paid for their Restricted Common Units in cash also received an additional payment equal to the amount they paid for their Restricted Common Units. As a result, all Cboe Digital Restricted Common Units were forfeited as of June 30, 2024. The Company paid $
Vesting of Restricted Common Units was based on certain conditions relating to the participation and performance of the former Cboe Digital investor members on the Cboe Digital platforms, generally over a
The cost associated with the options was recognized as contra-revenue, net of actual forfeitures and based on the continued probability of the satisfaction of performance conditions ratably over the vesting period. The wind down of the Cboe Digital spot market resulted in a forfeiture of all Cboe Digital Restricted Common Units and a reversal of contra-revenue previously recorded. Cash payments to former investor members attributable to the Restricted Common Units (other than payments to the former investor member to refund their cash payment for the Restricted Common Units) were recorded as contra-revenue. As a result, $
40
Any impact to other (expense) income, net for changes in the fair value of the Cboe Digital Restricted Common Units was reversed.
Changes in the fair value of the options, subsequent to the grant date, were recognized in other (expense) income, net in the condensed consolidated statements of income in the period in which the fair value of the options changed. The Company used a Black Scholes pricing model to estimate the fair value of the in-substance stock options which incorporated the following assumptions as of December 31, 2023: risk-free interest rate range (
Prior to the execution of Unit Repurchase Agreements, certain former Cboe Digital investor members were able to earn additional Incentive Program Units. The Incentive Program Units were subject to the same terms and conditions as the other Restricted Common Units and were similarly liability-classified awards. Cboe Digital authorized a maximum of
The wind down of the Cboe Digital spot market resulted in a forfeiture of all earned Incentive Program Units and a reversal of contra-revenue previously recorded. Cash payments to former investor members attributable to the Incentive Program Units were recorded as contra-revenue. The Company paid $
Cboe Digital Warrants Units
On November 18, 2022, Cboe Digital Holdings entered into a Warrant Agreement with a former investor member to acquire up to
The vesting of the Warrant Units was based upon the achievement of certain conditions relating to the service provided by the former investor member over a
In connection with winding down the spot digital asset trading market, this former investor member agreed to settle their outstanding Warrant Units for a one-time cash payment as a part of their Unit Repurchase Agreement. Unvested Warrant Units were forfeited. The Company paid $
The cost associated with the Warrant Units was recognized as contra-revenue ratably throughout the expected life of the Warrant before exercise. Changes in the fair value of the Warrant Units, subsequent to the grant date, were recognized in other (expense) income, net in the condensed consolidated statements of income in the period in which the fair value of the Warrant Units changed. The Company used a Black Scholes pricing model to estimate the fair value of the Warrant Units which incorporated the following assumptions as of December 31, 2023: risk-free interest rate (
18. EQUITY
Common Stock
The Company’s common stock is listed on Cboe BZX under the trading symbol CBOE. As of June 30, 2024,
41
Company’s common stock were authorized, $
Common Stock in Treasury, at Cost
The Company accounts for the purchase of treasury stock under the cost method with the shares of stock repurchased reflected as a reduction to Cboe stockholders’ equity and included in common stock in treasury, at cost in the condensed consolidated balance sheets. Shares repurchased under the Company’s share repurchase program are retired or they are available to be redistributed. When treasury shares are redistributed, they are recorded at the average cost of the treasury shares acquired. When treasury shares are retired, they are removed from the common stock in treasury balance. The Company held
Share Repurchase Program
In 2011, the Board of Directors approved an initial authorization for the Company to repurchase shares of its outstanding common stock of $
The table below shows the repurchased shares of common stock under the Company’s share repurchase program during the period presented as follows:
Three Months Ended | ||||||
| 2024 |
| 2023 | |||
Number of shares of common stock repurchased |
| | | |||
Average price paid per share |
| $ | | $ | | |
Total purchase price (in millions) |
| $ | | $ | |
Since inception of the program through June 30, 2024, the Company has repurchased
As of June 30, 2024 and 2023, the Company had $
Purchase of Common Stock from Employees
The Company purchased
Preferred Stock
The Company has authorized the issuance of
Dividends
During the three months ended June 30, 2024, the Company declared and paid cash dividends per share of $
42
Each share of common stock, including RSUs and PSUs, is entitled to receive dividend and dividend equivalents, respectively, if, as and when declared by the Board of Directors of the Company. The Company’s expectation is to continue to pay dividends. The decision to pay a dividend, however, remains within the discretion of the Company’s Board of Directors and may be affected by various factors, including earnings, financial condition, capital requirements, level of indebtedness and other considerations the Board of Directors deems relevant. Future debt obligations and statutory provisions, among other things, may limit, or in some cases prohibit, the Company’s ability to pay dividends.
As a holding company, the Company’s ability to declare and continue to pay dividends in the future with respect to its common stock will also be dependent upon the ability of its subsidiaries to pay dividends to it under applicable corporate law.
19. INCOME TAXES
The Company records income tax expense during interim periods based on the best estimate of the full year’s tax rate as adjusted for discrete items, if any, that are taken into account in the relevant interim period. Each quarter, the Company updates its estimate of the annual effective tax rate and any change in the estimated rate is recorded on a cumulative basis. The effective tax rate from continuing operations was
The higher effective tax rate for the three months ended June 30, 2024 compared to the same period in 2023 is primarily due to the valuation allowance associated with the impairment of the Globacap Technology Limited investment. The lower effective tax rate for the six months ended June 30, 2024 compared to the same period in 2023 is primarily due to the excess tax benefits from the vesting of equity awards that occurred during the first quarter of 2024.
20. EARNINGS PER SHARE
The computation of basic net income per common share is calculated by reducing net income for the period by dividends paid or declared and undistributed net income for the period that are allocated to participating securities to arrive at net income allocated to common stockholders. Net income allocated to common stockholders is divided by the weighted average number of common shares outstanding during the period to determine net income per share allocated to common stockholders.
The computation of diluted net income per share is calculated by dividing net income allocated to common stockholders by the sum of the weighted average number of common shares outstanding plus all additional common shares that would have been outstanding if the potentially dilutive common shares had been issued. The dilutive effect is calculated using the more dilutive of the two-class or treasury stock method.
43
The following table sets forth the computation of basic and diluted earnings per share for the three and six months ended June 30, 2024 and 2023 (in millions, except per share data):
Three Months Ended | Six Months Ended | |||||||||||
| 2024 |
| 2023 |
| 2024 |
| 2023 | |||||
Basic earnings per share numerator: | ||||||||||||
Net income | $ | | $ | | $ | | $ | | ||||
Net income allocated to participating securities |
| ( |
| ( |
| ( |
| ( | ||||
Net income allocated to common stockholders | $ | | $ | | $ | | $ | | ||||
Basic earnings per share denominator: | ||||||||||||
Weighted average shares outstanding | | | | | ||||||||
Basic earnings per share | $ | | $ | | $ | | $ | | ||||
Diluted earnings per share numerator: | ||||||||||||
Net income | $ | | $ | | $ | | $ | | ||||
Net income allocated to participating securities |
| ( |
| ( |
| ( |
| ( | ||||
Net income allocated to common stockholders | $ | | $ | | $ | | $ | | ||||
Diluted earnings per share denominator: | ||||||||||||
Weighted average shares outstanding | | | | | ||||||||
Dilutive common shares issued under stock program | | | | | ||||||||
Total dilutive weighted average shares | | | | | ||||||||
Diluted earnings per share | $ | | $ | | $ | | $ | |
For the periods presented, the Company did
21. COMMITMENTS, CONTINGENCIES, AND GUARANTEES
Legal Proceedings
As of June 30, 2024, the Company was subject to the various legal proceedings and claims discussed below, as well as certain other legal proceedings and claims that have not been fully resolved and that have arisen in the ordinary course of business.
The Company reviews its legal proceedings and claims, regulatory reviews and inspections and other legal proceedings on an ongoing basis and follows appropriate accounting guidance when making accrual and disclosure decisions. The Company establishes accruals for those contingencies where the incurrence of a loss is probable and can be reasonably estimated, and the Company discloses the amount accrued and the amount of a reasonably possible loss in excess of the amount accrued, if such disclosure is necessary for the condensed consolidated financial statements to not be misleading. The Company does not record liabilities when the likelihood that the liability has been incurred is probable, but the amount cannot be reasonably estimated, or when the liability is believed to be only reasonably possible or remote. The Company’s assessment of whether a loss is remote, reasonably possible, or probable is based on its assessment of the ultimate outcome of the matter following all appeals.
As of June 30, 2024, the Company does not believe that there is a reasonable possibility that any material loss exceeding the amounts already recognized for these legal proceedings and claims, regulatory reviews, inspections or other legal proceedings, if any, has been incurred. While the consequences of certain unresolved proceedings are not presently determinable, the outcome of any proceeding is inherently uncertain and an adverse outcome from certain matters could have a material effect on the financial position, results of operations, or cash flows of the Company in any given reporting period.
CAT Funding Model Order Litigation
On September 6, 2023, the SEC issued an order approving an amendment to the CAT National Market System Plan to implement a revised funding model for CATLLC to fund the CAT (“CAT Funding Model Order”). The approved CAT Funding Model contemplates two categories of CAT fees calculated based on the “executed equivalent shares” of transactions in eligible securities: (i) CAT fees assessed by CATLLC to Industry Members who are CAT Executing
44
Brokers to recover a portion of historical CAT costs previously paid to CATLLC by the Plan Participants; and (ii) CAT fees assessed by CATLLC to CAT Executing Brokers and Plan Participants to fund prospective CAT costs.
On October 17, 2023, the American Securities Association (“ASA”) and Citadel Securities, LLC (“Citadel”) filed a Petition for Review of the CAT Funding Model Order in the U.S. Court of Appeals for the 11th Circuit (“11th Circuit”). On November 16, 2023, the Cboe U.S. national securities exchanges, the NYSE U.S. national securities exchanges, the Nasdaq U.S. national securities exchanges and CATLLC filed motions to intervene on behalf of the SEC. On January 17, 2024, the 11th Circuit granted each of the motions to intervene on behalf of the SEC and established a briefing schedule. Briefing concluded in the second quarter of 2024 and the 11th Circuit is expected to schedule oral argument to occur in the second half of 2024. This challenge or any other challenge to the CAT Funding Model Order and/or Plan Participant(s) fee filings may significantly delay efforts to implement the CAT fees. As a result, the Plan Participants may continue to incur additional significant costs, and/or it may result in them not being able to collect on the promissory notes related to the funding of the implementation and operation of the CAT. The Company believes the appeal is without merit and intends to vigorously litigate the matter.
CAT Putative Class Action
A putative class action was filed on April 16, 2024 captioned Erik A. Davidson, John Restivo and National Center for Public Policy Research vs. Gary Gensler, SEC and CATLLC. Cboe and the Plan Participants are not parties to this litigation. The complaint alleges, among other things, that the SEC engaged in unlawful agency action and violated multiple provisions of the U.S. Constitution when it promulgated Rule 613 in 2012 mandating the creation and funding of the CAT. This challenge or any other challenge to the constitutionality of the CAT may delay CATLLC’s assessment of CAT fees to recover a portion of CAT costs. As a result, the Plan Participants may continue to incur additional significant costs, and/or it may result in them not being able to collect on the promissory notes related to the funding of the implementation and operation of the CAT.
Citadel Petition for Review of SEC Temporary Conditional Exemptive Order
On July 17, 2024, Citadel filed a Petition for Review (“PFR”) of the SEC’s May 20, 2024 Order Granting A Temporary Conditional Exemption Pursuant to Section 36(a)(1) of the Securities Exchange Act of 1934 (“Exchange Act”) and Rule 608(e) of Regulation NMS Under the Exchange Act, Relating to the Reporting of Responses to Requests for Quotes and Other Solicitation Responses Provided in a Standard Electronic Format, as Required by Section 6.4(d) of the NMS Plan Governing the CAT (“CAT RFQ Exemptive Order”) in the 11th Circuit. The PFR does not identify any requested relief. On July 19, 2024, Citadel filed an Unopposed Motion to Hold Petition in Abeyance (“Motion”) and requested that the 11th Circuit hold the PFR in abeyance pending the final disposition of the CAT Funding Model Order Litigation (described above), which is also before the 11th Circuit. CATLLC and the Plan Participants are not parties to this litigation. Motions to Intervene are expected to be due on August 16, 2024 and the Cboe U.S. national securities exchanges are evaluating whether to file motions to intervene. This challenge or any other challenge to SEC Orders concerning the CAT may delay the CATLLC’s implementation of CAT fees to recover a portion of CAT costs. As a result, the Plan Participants may continue to incur additional significant costs, and/or it may result in them not being able to collect on the promissory notes related to the funding of the implementation and operation of the CAT.
Other
As self-regulatory organizations under the jurisdiction of the SEC, Cboe Options, C2, BZX, BYX, EDGX and EDGA are subject to routine reviews and inspections by the SEC. As a designated contract market under the jurisdiction of the CFTC, CFE, and Cboe Digital Exchange are subject to routine rule enforcement reviews and examinations by the CFTC. As a derivatives clearing organization under the jurisdiction of the CFTC, Cboe Clear Digital is also subject to routine audits and examinations by state regulators. Cboe SEF, LLC is a swap execution facility registered with the CFTC and subject to routine rule enforcement reviews and examinations by the CFTC. Cboe Trading, BIDS Trading and Cboe Fixed Income are subject to reviews and inspections by FINRA. The Company has from time to time received inquiries and investigative requests from the SEC’s Division of Examinations and the CFTC’s Division of Market Oversight as well as the SEC Division of Enforcement and CFTC Division of Enforcement seeking information about the Company’s compliance with its obligations as a self-regulatory organization under the federal securities laws and Commodity Exchange Act as well as members’ compliance with the federal securities laws and Commodity Exchange Act.
In addition, Cboe Europe, Cboe Chi-X Europe, Cboe Clear Europe, Cboe NL, Cboe Australia, Cboe Japan, and Cboe Canada Inc. may be subject to routine reviews, audits, examinations, investigations, or inspections, as applicable, by their respective regulators, and while they have not been the subject of any litigation or regulatory investigation in the past that
45
resulted in a material impact on the Company’s financial position, results of operations, liquidity or capital resources, there is always the possibility of such action in the future. As Cboe Europe and Cboe Chi-X Europe are domiciled in the UK, it is likely that any action would be taken in the UK courts in relation to litigation or by the FCA in relation to any regulatory enforcement action. As Cboe Clear Europe is domiciled in the Netherlands, it is likely that any action would be taken in the Dutch courts in relation to litigation or by the DNB or Dutch Authority for Financial Markets in relation to any regulatory enforcement action. For Cboe NL, also domiciled in the Netherlands, it is likely that any actions would be taken in the Dutch courts in relation to litigation or Dutch Authority for Financial Markets in relation to any regulatory enforcement action. As Cboe Australia is domiciled in Australia, it is likely that any action would be taken in the Australian courts in relation to litigation or by the ASIC, in relation to any regulatory enforcement action. As Cboe Japan is domiciled in Japan, it is likely that any action would be taken in the Japanese courts in relation to litigation or by the JFSA or the JSDA in relation to any regulatory enforcement action. As Cboe Canada Inc. is domiciled in Canada, it is likely that any action would be taken in the Canadian courts in relation to litigation or by the OSC and/or CIRO in relation to any regulatory enforcement action.
Cboe Digital has committed to securely store all digital assets it holds on behalf of users. As such, Cboe Digital may be liable to its users for losses arising from theft or loss of user private keys. Cboe Digital has no reason to believe it will incur any expense associated with such potential liability because (i) it has no known or historical experience of claims to use as a basis of measurement, (ii) it accounts for and continually verifies the amount of digital assets within its control, and (iii) it has established security around custodial private keys to minimize the risk of theft or loss. There were no loss events impacting safeguarded assets caused by the theft or loss of digital asset user private keys as of June 30, 2024.
The Company is also currently a party to various other legal and regulatory proceedings in addition to those already mentioned. Management does not believe that the likely outcome of any of these other reviews, inspections, investigations or other legal proceedings is expected to have a material impact on the Company’s financial position, results of operations, liquidity or capital resources.
See also Note 6 (“Credit Losses”) for information on promissory notes related to the CAT.
Contractual Obligations
The Company has contractual obligations related to licensing agreements with various licensors, some of which included fixed fees and/or variable fees calculated using agreed upon contracted rates and reported cleared volumes. Certain licensing agreements contain annual minimum fee requirements that total between $
See Note 12 (“Clearing Operations”) for information on the clearinghouse exposure guarantees for Cboe Clear Europe and Cboe Clear Digital.
See Note 22 (“Leases”) for information on lease obligations.
22. LEASES
The Company currently leases office space, data centers, remote network operations centers, and equipment under non-cancelable operating leases with third parties as of
In May 2024, the Company entered into an agreement to amend its lease agreement for its Lenexa, Kansas office space. As part of the agreement, the lease term was reduced and now ends on September 30, 2025. In consideration for the reduction in lease term, the Company agreed to pay a reduction fee totaling $
46
(expense) income, net in the condensed consolidated statements of income. The $
The following table presents the supplemental balance sheet information related to leases as of June 30, 2024 and December 31, 2023, respectively (in millions):
June 30, | December 31, | ||||
2024 | 2023 | ||||
Operating lease right of use assets | $ | | $ | | |
Total leased assets | $ | | $ | | |
|
| ||||
$ | | $ | | ||
Non-current operating lease liabilities | | | |||
Total leased liabilities | $ | | $ | |
(1) | These amounts are reflected within accounts payable and accrued liabilities in the condensed consolidated balance sheets. |
The following table presents operating lease costs and other information as of and for the three and six months ended June 30, 2024 and 2023, respectively (in millions, except as stated):
Three Months Ended | Six Months Ended | ||||||||||||||
2024 | 2023 | 2024 | 2023 | ||||||||||||
Operating lease costs (1) | $ | | $ | | $ | | $ | | |||||||
Lease term and discount rate information: | |||||||||||||||
Weighted average remaining lease term (years) | |||||||||||||||
Weighted average discount rate | | % | | % | |||||||||||
Supplemental cash flow information and non-cash activity: | |||||||||||||||
Cash paid for amounts included in the measurement of lease liabilities | $ | | $ | | $ | | $ | | |||||||
Right of use assets obtained in exchange for lease liabilities | | ( | | | |||||||||||
Reduction in lease liability due to remeasurement | ( | — | ( | — |
(1) | Includes short-term lease and variable lease costs, which are immaterial. |
The maturities of the lease liabilities are as follows as of June 30, 2024 (in millions):
June 30, | |||
| 2024 | ||
Remainder of 2024 | $ | | |
2025 | | ||
2026 | | ||
2027 | | ||
2028 | | ||
After 2028 |
| | |
Total lease payments | $ | | |
Less: Interest | ( | ||
Present value of lease liabilities | $ | |
23. SUBSEQUENT EVENTS
On July 1, 2024, the Company liquidated all digital assets held by Cboe Digital for customers. As a result, after July 1, 2024, the Company
longer held any digital assets – safeguarded assets or on the condensed consolidated balance sheets.47
Subsequent to the three months ended June 30, 2024, from July 1, 2024 through July 31, 2024, the Company repurchased
There have been no other subsequent events that would require disclosure in, or adjustment to, the condensed consolidated financial statements as of and for the six months ended June 30, 2024.
48
Item 2. Management’s Discussion and Analysis of Financial Condition and Results of Operations
The following discussion should be read in conjunction with the accompanying unaudited condensed consolidated financial statements and the notes thereto, included in Item 1 in this Quarterly Report on Form 10-Q, and the audited consolidated financial statements in the Company’s Annual Report on Form 10-K for the year ended December 31, 2023, and as contained in that report, the information under the heading “Management’s Discussion and Analysis of Financial Condition and Results of Operations.” This discussion contains forward-looking information. Please see “Forward-Looking Statements” for a discussion of the uncertainties, risks and assumptions associated with these statements.
Overview
Cboe Global Markets, Inc., the world’s leading derivatives and securities exchange network, delivers cutting-edge trading, clearing and investment solutions to people around the world. Cboe provides trading solutions and products in multiple asset classes, including equities, derivatives, and FX, across North America, Europe, and Asia Pacific. Above all, the Company is committed to building a trusted, inclusive global marketplace that enables people to pursue a sustainable financial future.
Cboe’s subsidiaries include the largest options exchange and the third largest stock exchange operator in the U.S. In addition, the Company operates Cboe Europe, one of the largest stock exchanges by value traded in Europe, and owns Cboe Clear Europe, a leading pan-European equities and derivatives clearinghouse, BIDS Holdings, which owns a leading block-trading ATS by volume in the U.S., and provides block-trading services with Cboe market operators in Europe, Canada, Australia, and Japan, Cboe Australia, an operator of trading venues in Australia, Cboe Japan, an operator of trading venues in Japan, Cboe Digital Exchange, LLC, an operator of a regulated futures exchange, Cboe Clear Digital, an operator of a regulated clearinghouse, and Cboe Canada Inc., a recognized Canadian securities exchange. Cboe subsidiaries also serve collectively as a leading market globally for exchange-traded products (“ETPs”) listings and trading.
On April 25, 2024, the Company announced plans to refocus the digital asset business to leverage its core strengths in derivatives, technology, and product innovation. On May 31, 2024, the Company halted trading on Cboe Digital Exchange, LLC’s (“Cboe Digital Exchange”) spot market (“Cboe Digital spot market”), the Company’s spot digital asset trading platform, in-line with the Company’s plans to wind down the spot digital asset trading market by the third quarter of 2024. In addition, the company plans to transition its cash-settled Bitcoin and Ether futures contracts, currently available for trading on the Cboe Digital Exchange, to CFE in the first half of 2025, pending regulatory review. The Company plans to align Cboe Clear Digital with Cboe Clear Europe, under unified leadership, and expects to continue to facilitate the clearing of cash-settled Bitcoin and Ether futures contracts.
The Company is headquartered in Chicago with offices in Amsterdam, Belfast, Hong Kong, Kansas City, London, Manila, New York, San Francisco, Sarasota Springs, Singapore, Sydney, Tokyo, and Toronto.
Recent Developments
Pyth Tokens Unlocking
In October 2022, the Company, through its wholly-owned subsidiary Cboe NL entered into a Data Provider Agreement with Pyth Data Association (“Pyth”) to create a data feed and begin publishing limited derived equities market data for certain symbols from one of its four U.S. equities exchanges on the Pyth Network, a decentralized financial market data distribution platform for aggregated data. In exchange, Pyth granted Cboe NL 16,666,666 restricted PYTH tokens which unlock annually over a four-year period in equal tranches; the first 25% tranche of PYTH tokens unlocked in May 2024. The PYTH tokens, which are included within intangible assets, net in the condensed consolidated balance sheets, are carried at their historical value of $0.06 per token and are reviewed each reporting period for potential impairment. In May 2024, the Company recorded $1.0 million in market data fees revenue on the condensed consolidated statements of income, which represents the historical value of the grant of 16,666,666 restricted PYTH tokens earned for satisfying the performance obligations outlined in the Data Provider Agreement.
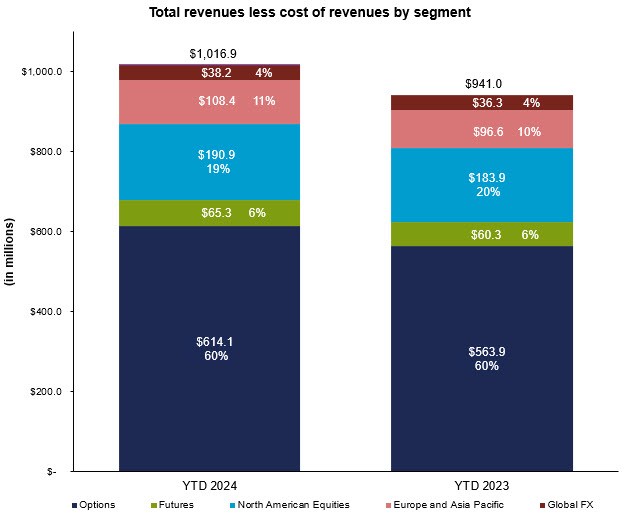
Business Segments
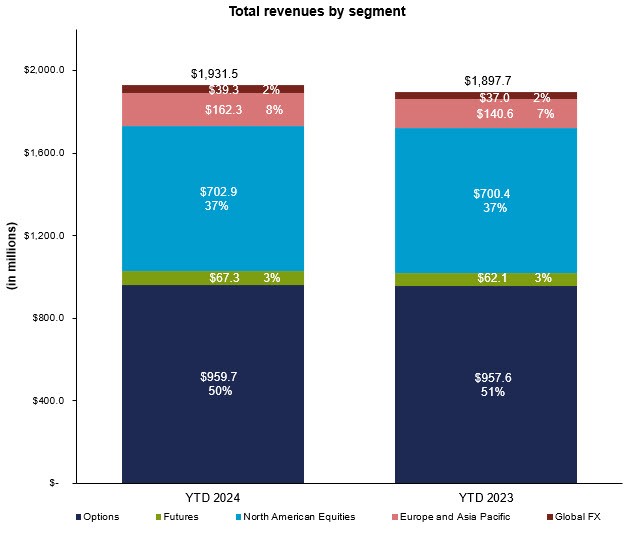
The Company operates six reportable business segments: Options, North American Equities, Europe and Asia Pacific, Futures, Global FX, and Digital, which is reflective of how the Company's chief operating decision-maker reviews and operates the business, as discussed in Note 1 (“Organization and Basis of Presentation”). Segment performance is primarily evaluated based on operating income (loss). The Company’s chief operating decision-maker does not use
49
segment-level assets or income and expenses below operating income (loss) as key performance metrics; therefore, such information is not presented below. The Company has aggregated all of its corporate costs, as well as other business ventures, within the Corporate Items and Eliminations totals based on the decision that those activities should not be used to evaluate the operating performance of the segments; however, operating expenses that relate to activities of a specific segment have been allocated to that segment.
Options. The Options segment includes options on market indices (“index options”), as well as on the stocks of individual corporations (“equity options”) and on ETPs such as exchange-traded funds (“ETFs”) and exchange-traded notes (“ETNs”), which are “multi-listed” options and listed on a non-exclusive basis. These options are eligible to trade, as applicable, on Cboe Options, C2, BZX, EDGX, and/or other U.S. national security exchanges. Cboe Options is the Company’s primary options market and offers trading in listed options through a single system that integrates electronic trading and traditional open outcry trading on the Cboe Options trading floor in Chicago. C2 Options, BZX Options, and EDGX Options are all-electronic options exchanges, and typically operate with different market models and fee structures than Cboe Options. The Options segment also includes applicable market data fees revenues generated from the consolidated tape plans, the licensing of proprietary options market data, index licensing, routing services, and access and capacity services.
North American Equities. The North American Equities segment includes U.S. equities and ETP transaction services that occur on fully electronic exchanges owned and operated by BZX, BYX, EDGX, and EDGA, equities transactions that occur on the BIDS Trading platform in the U.S. and Canada, and Canadian equities and other transaction services that occur on or through Cboe Canada Inc.’s order books. The North American Equities segment also includes listing services on Cboe Canada Inc., corporate and ETP listings on BZX, applicable market data fees revenues generated from the consolidated tape plans, the licensing of proprietary equities market data, routing services, and access and capacity services.
Europe and Asia Pacific. The Europe and Asia Pacific segment includes the pan-European listed equities and derivatives transaction services, ETPs, exchange-traded commodities, and international depository receipts that are hosted on MTFs operated by Cboe Europe Equities (Cboe Europe and Cboe NL equities exchanges) and Cboe Europe Derivatives (“CEDX”). It also includes the ETP listings business on RMs and clearing activities of Cboe Clear Europe, as well as the equities transaction services of Cboe Australia and Cboe Japan, operators of trading venues in Australia and Japan, respectively, along with equities transactions that occur on the BIDS Trading platform in Australia and Japan. Cboe Europe operates lit and dark books, a periodic auctions book, and Cboe BIDS Europe, a Large-in-Scale (“LIS”) trading negotiation facility predominately for UK and Swiss symbols. Cboe NL, based in Amsterdam, operates similar business functionality to that offered by Cboe Europe, and provides for trading only in European Economic Area (“EEA”) symbols. Cboe Europe Derivatives, a pan-European derivatives platform, offers futures and options based on Cboe Europe equity indices, and single stock options. This segment also includes Cboe Europe, Cboe NL, CEDX, Cboe Australia and Cboe Japan revenue generated from the licensing of proprietary market data and from access and capacity services.
Futures. The Futures segment includes transaction services provided by CFE, a fully electronic futures exchange, which includes offerings for trading of VIX futures, and other futures products, the licensing of proprietary market data, as well as access and capacity services. On April 25, 2024, the Company announced plans to transition its cash-settled Bitcoin and Ether futures contracts, currently available for trading on the Cboe Digital Exchange, to CFE in the first half of 2025, pending regulatory review.
Global FX. The Global FX segment includes institutional FX trading services that occur on the Cboe FX fully electronic trading platform, non-deliverable forward FX transactions (“NDFs”) offered for execution on Cboe SEF, as well as revenue generated from the licensing of proprietary market data and from access and capacity services. The segment includes transaction services for U.S. government securities executed on the Cboe Fixed Income fully electronic trading platform.
Digital. The Digital segment includes a U.S.-based spot digital asset trading market, regulated futures exchange, and a regulated clearinghouse, as well as revenue generated from the licensing of proprietary market data and from access and capacity services. In-line with the Company’s plans to wind down the spot digital asset trading market by the third quarter of 2024, on May 31, 2024, the Company halted trading on the Cboe Digital spot market. The Company plans to transition its cash-settled Bitcoin and Ether futures contracts, currently available for trading on the Cboe Digital Exchange, to CFE in the first half of 2025, pending regulatory review. The Company intends to continue to present Digital as a distinct reportable business segment through at least the year ending December 31, 2024.
50
General Factors Affecting Results of Operations
In broad terms, our business performance is impacted by a number of drivers, including macroeconomic events affecting the risk and return of financial assets, investor sentiment, the regulatory environment for capital markets, geopolitical events, tax policies, central bank policies and changing technology, particularly in the financial services industry. We believe our future revenues and net income will continue to be influenced by a number of domestic and international economic trends, including:
● | trading volumes on our proprietary products such as VIX options and futures and SPX options; |
● | trading volumes in listed equity securities, options, futures, and ETPs in North America, Europe, and Asia Pacific, clearing volumes in listed equity securities and ETPs in Europe, volumes in listed equity options, volumes in digital assets, and volumes in institutional FX trading; |
● | the demand for and pricing structure of the U.S. tape plan market data distributed by the Securities Information Processors (“SIPs”), which determines the pool size of the industry market data fees we receive based on our market share; |
● | consolidation and expansion of our customers and competitors in the industry; |
● | the demand for information about, or access to, our markets and products, which is dependent on the products we trade, our importance as a liquidity center, quality and integrity of our proprietary indices, and the quality and pricing of our data and access and capacity services; |
● | continuing pressure in transaction fee pricing due to intense competition in the North American, European, and Asia Pacific markets; |
● | significant fluctuations in foreign currency translation rates or weakened value of currencies; and |
● | regulatory changes and obligations relating to market structure, digital assets and increased capital requirements, and those which affect certain types of instruments, transactions, products, pricing structures, capital market participants or reporting or compliance requirements. |
A number of significant structural, political and monetary issues, global conflicts continue to confront the global economy, and instability could continue, resulting in an increased or subdued level of inflation, market volatility, potential recessions, supply chain constraints and costs, changes in trading volumes, greater uncertainty, inflationary increases in our expenses, and increased costs and uncertainties related to CAT and the ability to collect on the promissory notes related to the funding of CAT may have an adverse effect on our financial results.
Components of Revenues
Cash and Spot Markets
Revenue aggregated into cash and spot markets includes associated transaction and clearing fees, the portion of market data fees relating to associated U.S. tape plan market data fees, associated regulatory fees, and associated other revenue from the Company’s North American Equities, Europe and Asia Pacific, Global FX, and Digital segments.
Data and Access Solutions
Revenue aggregated into data and access solutions includes access and capacity fees, proprietary market data fees, and associated other revenue across the Company’s six segments.
Derivatives Markets
Includes associated transaction and clearing fees, the portion of market data fees relating to associated U.S. tape plan market data fees, associated regulatory fees, and associated other fees from the Company’s Options, Futures, Europe and Asia Pacific, and Digital segments.
Components of Cost of Revenues
Liquidity Payments
Liquidity payments are primarily correlated to the volume of securities traded on our markets. As stated above, we record the liquidity rebates paid to market participants providing liquidity, in the case of Cboe Options, C2, BZX, EDGX, and Cboe Europe Equities and Derivatives, and Cboe Digital, as cost of revenue. BYX and EDGA offer a pricing model
51
where we rebate liquidity takers for executing against an order resting on our book, which is also recorded as a cost of revenues.
Routing and Clearing
Various rules require that U.S. options and equities trade executions occur at the National Best Bid and Offer displayed by any exchange. Linkage order routing consists of the cost incurred to provide a service whereby Cboe equities and options exchanges deliver orders to other execution venues when there is a potential for obtaining a better execution price or when instructed to directly route an order to another venue by the order provider. The service affords exchange order flow providers an opportunity to obtain the best available execution price and may also result in cost benefits to those clients. Such an offering improves our competitive position and provides an opportunity to attract orders which would otherwise bypass our exchanges. We utilize third-party brokers or our broker-dealer, Cboe Trading, to facilitate such delivery. Also included within routing and clearing are the Order Management System (“OMS”) and Execution Management System (“EMS”) fees incurred for U.S. Equities Off-Exchange order execution, as well as settlement costs incurred for the settlement process executed by Cboe Clear Europe and Cboe Clear Digital.
Section 31 Fees
Exchanges under the authority of the SEC (Cboe Options, C2, BZX, BYX, EDGX, and EDGA as well as CFE to the extent that CFE offers trading in security futures products) are assessed fees pursuant to the Exchange Act designed to recover the costs to the U.S. government of supervision and regulation of securities markets and securities professionals. We treat these fees as a pass-through charge to customers executing eligible listed equities and listed equity options trades. Accordingly, we recognize the amount that we are charged under Section 31 as a cost of revenues and the corresponding amount that we charge our customers as regulatory transaction fees revenue. Since the regulatory transaction fees recorded in revenues are equal to the Section 31 fees recorded in cost of revenues, there is no impact on our operating income. Cboe Trading, Cboe Europe, Cboe NL, BIDS, Cboe FX, Cboe Australia, Cboe Japan, Cboe Digital, and Cboe Canada Inc. are not U.S. national securities exchanges, and accordingly are not charged Section 31 fees.
Royalty Fees and Other Cost of Revenues
Royalty fees primarily consist of license fees paid by us for the use of underlying indices in our proprietary products usually based on contracts traded. The Company has licenses with the owners of the S&P 500 Index, S&P 100 Index and certain other S&P indices, FTSE Russell indices, the DJIA, MSCI, and certain other index products. This category also includes fees related to the dissemination of market data related to S&P indices and other products through Cboe Global Indices Feed (“CGIF”).
Other cost of revenues primarily consists of interest expense from clearing operations, electronic access permit fees and other miscellaneous costs associated with other revenue.
Components of Operating Expenses
Compensation and Benefits
Compensation and benefits represent our largest expense category and tend to be driven by our staffing requirements, financial performance, and the general dynamics of the employment market. Stock-based compensation is a non-cash expense related to employee equity awards. Stock-based compensation can vary depending on the quantity and fair value of the award on the date of grant and the related service period.
Depreciation and Amortization
Depreciation and amortization expense results from the depreciation of long-lived assets purchased, the amortization of purchased and internally developed software, and the amortization of intangible assets.
Technology Support Services
Technology support services consists primarily of costs related to the maintenance of computer equipment supporting our system architecture, circuits supporting our wide area network, support for production software, operating system license and support fees, fees paid to information vendors for displaying data and off-site system hosting fees.
52
Professional Fees and Outside Services
Professional fees and outside services consist primarily of consulting services, which include supplemental staff activities primarily related to systems development and maintenance, legal, regulatory and audit, and tax advisory services, as well as compensation paid to non-employee directors, including stock-based compensation and deferred compensation.
Travel and Promotional Expenses
Travel and promotional expenses primarily consist of advertising, costs for special events, sponsorship of industry conferences, options education seminars and travel-related expenses.
Facilities Costs
Facilities costs primarily consist of expenses related to owned and leased properties including rent, maintenance, utilities, real estate taxes and telecommunications costs.
Acquisition-Related Costs
Acquisition-related costs relate to acquisitions and other strategic opportunities. The acquisition-related costs include fees for investment banking advisors, lawyers, accountants, tax advisors, public relations firms, severance and retention costs, and other external costs directly related to mergers and acquisitions.
Impairment of Intangible Assets
Impairment of intangible assets consists of charges to impair intangible assets if the carrying value exceeds the fair value.
Other Expenses
Other expenses represents costs necessary to support our operations that are not already included in the above categories, including, but not limited to, changes in contingent consideration.
Non-Operating (Expenses) Income
Income and expenses incurred through activities outside of our core operations are considered non-operating and are classified as other (expenses) income. These activities primarily include interest earned on the investing of excess cash, commitment fees and interest expense related to outstanding debt facilities, income and unrealized gains and losses related to investments held in a trust for the Company’s non-qualified retirement and benefit plans, including non-employee director deferred compensation, realized gains and losses related to the Company’s previously held minority investments, income earned related to the Company’s minority investments, equity earnings or losses from our investments in other business ventures, impairment of the Company’s investments, investment establishment costs associated with new business ventures, and gains/losses related to the dissolution of the Cboe Digital syndication.
Financial Summary
The following are summaries of changes in financial performance and include certain non-GAAP financial measures. Management uses these non-GAAP measures internally in conjunction with GAAP measures to help evaluate our performance and to help make financial and operational decisions. These non-GAAP financial measures assist management in comparing our performance on a consistent basis for purposes of business decision making by removing the impact of certain items management believes do not reflect our underlying operations.
We believe our presentation of these measures provides investors with greater transparency into financial measures used by management and is useful to investors for period-to-period comparisons of our ongoing operating performance.
These non-GAAP financial measures are not presented in accordance with, or as an alternative to, GAAP financial measures and may be calculated differently from non-GAAP measures used by other companies, which reduces their usefulness as comparative measures. We encourage analysts, investors and other interested parties to use these non-
53
GAAP measures as supplemental information to the GAAP financial measures included herein, including our condensed consolidated financial statements, to enhance their analysis and understanding of our performance and in making comparisons. Please see the footnotes below for definitions, additional information, and reconciliations from the closest GAAP measure.
The following summarizes changes in financial performance for the three and six months ended June 30, 2024, compared to the three and six months ended June 30, 2023. “YTD” represents the six month periods ended June 30, 2024 and 2023, respectively:
(1) | These are Non-GAAP figures for which reconciliations are provided below (in millions, except percentages, earnings per share, and as noted below). |
Three Months Ended June 30, | Increase/ | Percent |
| Six Months Ended June 30, | Increase/ | Percent |
| |||||||||||||||||
| 2024 |
| 2023 |
| (Decrease) |
| Change |
|
| 2024 |
| 2023 |
| (Decrease) |
| Change |
| |||||||
Total revenues | $ | 974.0 | $ | 907.8 | $ | 66.2 | 7 | % | $ | 1,931.2 | $ | 1,896.0 | $ | 35.2 | 2 | % | ||||||||
Total cost of revenues |
| 460.2 | 440.7 |
| 19.5 |
| 4 | % |
| 915.3 | 957.5 |
| (42.2) |
| (4) | % | ||||||||
Revenues less cost of revenues |
| 513.8 | 467.1 |
| 46.7 |
| 10 | % |
| 1,015.9 | 938.5 |
| 77.4 |
| 8 | % | ||||||||
Total operating expenses |
| 303.7 |
| 222.3 |
| 81.4 |
| 37 | % |
| 523.4 |
| 445.8 |
| 77.6 |
| 17 | % | ||||||
Operating income |
| 210.1 |
| 244.8 |
| (34.7) |
| (14) | % |
| 492.5 |
| 492.7 |
| (0.2) |
| (0) | % | ||||||
Income before income tax provision |
| 203.0 |
| 241.8 |
| (38.8) |
| (16) | % |
| 495.1 |
| 490.0 |
| 5.1 |
| 1 | % | ||||||
Income tax provision |
| 62.6 |
| 74.0 |
| (11.4) |
| (15) | % |
| 145.2 |
| 148.8 |
| (3.6) |
| (2) | % | ||||||
Net income | $ | 140.4 | $ | 167.8 | $ | (27.4) |
| (16) | % | $ | 349.9 | $ | 341.2 | $ | 8.7 |
| 3 | % | ||||||
Basic earnings per share | $ | 1.33 | $ | 1.58 | $ | (0.25) | (16) | % | $ | 3.30 | $ | 3.21 | $ | 0.09 | 3 | % | ||||||||
Diluted earnings per share | 1.33 | 1.57 | (0.24) | (15) | % | 3.29 | 3.20 | 0.09 | 3 | % | ||||||||||||||
EBITDA (1) | 242.3 | 294.7 | (52.4) |
| (18) | % | 579.4 | 598.6 | (19.2) |
| (3) | % | ||||||||||||
EBITDA margin (2) |
| 47.2 | % |
| 63.1 | % |
| (15.9) | % | * |
| 57.0 | % |
| 63.8 | % |
| (6.8) | % | * | ||||
Adjusted EBITDA (1) | $ | 340.7 | $ | 293.3 | $ | 47.4 |
| 16 | % | $ | 678.0 | $ | 603.6 | $ | 74.4 |
| 12 | % | ||||||
Adjusted EBITDA margin (3) |
| 66.3 | % |
| 62.8 | % |
| 3.5 | % | * |
| 66.7 | % |
| 64.3 | % |
| 2.4 | % | * | ||||
Adjusted earnings (4) | $ | 226.2 | $ | 188.7 | $ | 37.5 |
| 20 | % | $ | 453.9 | $ | 390.4 | $ | 63.5 |
| 16 | % | ||||||
Adjusted earnings margin (4) |
| 44.0 | % |
| 40.4 | % |
| 3.6 | % | * |
| 44.7 | % |
| 41.6 | % |
| 3.1 | % | * | ||||
Diluted weighted average shares outstanding | 105.4 | 106.1 | (0.7) | (1) | % | 105.8 | 106.1 | (0.3) | (0) | % | ||||||||||||||
Adjusted diluted earnings per share (5) | $ | 2.15 | $ | 1.78 | $ | 0.37 |
| 21 | % | $ | 4.30 | $ | 3.68 | $ | 0.62 |
| 17 | % |
* | Not meaningful |
54
(1) | EBITDA is defined as income before interest, income taxes, depreciation and amortization. Adjusted EBITDA is defined as EBITDA before acquisition-related costs, change in contingent consideration, impairment of intangible assets, impairment of investments, costs related to the Cboe Digital wind down, gains or losses on sale of property held for sale, gains or losses on the Cboe Digital non-recourse notes and warrants wind down, and income from investments. EBITDA and adjusted EBITDA do not represent, and should not be considered as, alternatives to net income as determined in accordance with GAAP. We have presented EBITDA and adjusted EBITDA because we consider them important supplemental measures of our performance and believe that they are frequently used by analysts, investors and other interested parties in the evaluation of companies. In addition, we use adjusted EBITDA as a measure of operating performance for preparation of our forecasts and evaluating our leverage ratio for the debt to earnings covenant included in our outstanding credit facility. Other companies may calculate EBITDA and adjusted EBITDA differently than we do. EBITDA and adjusted EBITDA have limitations as analytical tools, and you should not consider them in isolation or as substitutes for analysis of our results as reported under GAAP. |
(2) | EBITDA margin represents EBITDA divided by revenues less cost of revenues. |
(3) | Adjusted EBITDA margin represents adjusted EBITDA divided by revenues less cost of revenues. |
(4) | Adjusted earnings is defined as net income adjusted for amortization of acquired intangible assets, acquisition-related costs, change in contingent consideration, impairment of investments, costs related to the Cboe Digital wind down, impairment of intangible assets, gains or losses on the Cboe Digital non-recourse notes and warrants wind down, income from investments, certain tax reserve changes, and net income or loss allocated to participating securities, net of the income tax effects of these adjustments. Adjusted earnings does not represent, and should not be considered as, an alternative to net income or loss, as determined in accordance with GAAP. We have presented adjusted earnings because we consider it an important supplemental measure of our performance and we use it as the basis for monitoring our own core operating financial performance relative to other operators of exchanges. We also believe that it is frequently used by analysts, investors and other interested parties in the evaluation of companies. We believe that investors may find this non-GAAP measure useful in evaluating our performance compared to that of peer companies in our industry. Other companies may calculate adjusted earnings differently than we do. Adjusted earnings has limitations as an analytical tool, and you should not consider it in isolation or as a substitute for analysis of our results as reported under GAAP. |
(5) | Adjusted diluted earnings per share represents adjusted earnings divided by diluted weighted average shares outstanding. |
55
The following is a reconciliation of net income allocated to common stockholders to EBITDA and adjusted EBITDA (in millions) for the three months ended June 30, 2024 and 2023, respectively:
Three Months Ended June 30, | ||||||||||||||||||||||||
2024 | ||||||||||||||||||||||||
| Options |
| North American Equities |
| Europe and Asia Pacific |
| Futures |
| Global FX |
| Digital |
| Corporate |
| Total | |||||||||
Net income (loss) allocated to common stockholders | $ | 215.4 | $ | 44.8 | $ | 9.9 | $ | 26.2 | $ | 9.2 | $ | (87.7) | $ | (78.1) | $ | 139.7 | ||||||||
Interest expense (income), net | — | (0.5) | 0.9 | — | — | (1.1) | 8.9 | 8.2 | ||||||||||||||||
Income tax provision (benefit) |
| — |
| 0.9 |
| (1.9) |
| — |
| — |
| — |
| 63.6 |
| 62.6 | ||||||||
Depreciation and amortization |
| 6.4 |
| 14.3 |
| 6.6 |
| 0.6 |
| 3.2 |
| 0.7 |
| — |
| 31.8 | ||||||||
EBITDA |
| 221.8 |
| 59.5 |
| 15.5 |
| 26.8 |
| 12.4 |
| (88.1) |
| (5.6) |
| 242.3 | ||||||||
Acquisition-related costs |
| — |
| — |
| 0.1 |
| — |
| — |
| 0.1 |
| 0.4 |
| 0.6 | ||||||||
Change in contingent consideration | — | — | — | — | — | — | 3.0 | 3.0 | ||||||||||||||||
Impairment of intangible assets | — | — | — | — | — | 81.0 | — | 81.0 | ||||||||||||||||
Impairment of investment | — | — | — | — | — | — | 16.0 | 16.0 | ||||||||||||||||
Costs related to Cboe Digital wind down | — | — | — | — | — | 0.8 | — | 0.8 | ||||||||||||||||
Gain on sale of property held for sale | (1.0) | — | — | — | — | — | — | (1.0) | ||||||||||||||||
Gain on Cboe Digital non-recourse notes and warrants wind down | — | — | — | — | — | (2.0) | — | (2.0) | ||||||||||||||||
Adjusted EBITDA | $ | 220.8 | $ | 59.5 | $ | 15.6 | $ | 26.8 | $ | 12.4 | $ | (8.2) | $ | 13.8 | $ | 340.7 | ||||||||
Three Months Ended June 30, | ||||||||||||||||||||||||
2023 | ||||||||||||||||||||||||
| Options |
| North American Equities |
| Europe and Asia Pacific |
| Futures |
| Global FX |
| Digital |
| Corporate |
| Total | |||||||||
Net income (loss) allocated to common stockholders | $ | 202.7 | $ | 22.4 | $ | 4.9 | $ | 18.3 | $ | 4.9 | $ | (10.5) | $ | (75.7) | $ | 167.0 | ||||||||
Interest expense (income), net | — | (0.3) | 1.1 | — | (0.1) | (0.4) | 13.6 | 13.9 | ||||||||||||||||
Income tax provision (benefit) |
| — |
| 0.5 |
| (1.1) |
| — |
| — |
| — |
| 74.6 |
| 74.0 | ||||||||
Depreciation and amortization |
| 6.8 |
| 17.6 |
| 8.1 |
| 0.6 |
| 4.9 |
| 1.8 |
| — |
| 39.8 | ||||||||
EBITDA |
| 209.5 |
| 40.2 |
| 13.0 |
| 18.9 |
| 9.7 |
| (9.1) |
| 12.5 |
| 294.7 | ||||||||
Acquisition-related costs |
| — |
| 0.5 |
| 0.2 |
| — |
| — |
| 0.2 |
| (0.2) |
| 0.7 | ||||||||
Income from investment | — | — | — | — | — | — | (2.1) | (2.1) | ||||||||||||||||
Adjusted EBITDA | $ | 209.5 | $ | 40.7 | $ | 13.2 | $ | 18.9 | $ | 9.7 | $ | (8.9) | $ | 10.2 | $ | 293.3 |
56
The following is a reconciliation of net income allocated to common stockholders to EBITDA and adjusted EBITDA (in millions) for the six months ended June 30, 2024 and 2023, respectively:
Six Months Ended June 30, | ||||||||||||||||||||||||
2024 | ||||||||||||||||||||||||
| Options |
| North American Equities |
| Europe and Asia Pacific |
| Futures |
| Global FX |
| Digital |
| Corporate |
| Total | |||||||||
Net income (loss) allocated to common stockholders | $ | 430.9 | $ | 82.1 | $ | 18.4 | $ | 48.2 | $ | 15.7 | $ | (96.3) | $ | (151.0) | $ | 348.0 | ||||||||
Interest expense (income), net |
| (0.1) |
| (0.8) |
| 2.1 |
| — |
| — |
| (2.2) |
| 18.1 |
| 17.1 | ||||||||
Income tax provision (benefit) |
| — |
| 1.7 |
| (1.6) |
| — |
| — |
| — |
| 145.1 |
| 145.2 | ||||||||
Depreciation and amortization |
| 13.5 |
| 30.1 |
| 14.5 |
| 1.2 |
| 7.3 |
| 2.5 |
| — |
| 69.1 | ||||||||
EBITDA |
| 444.3 |
| 113.1 |
| 33.4 |
| 49.4 |
| 23.0 |
| (96.0) |
| 12.2 |
| 579.4 | ||||||||
Acquisition-related costs |
| — |
| 0.2 |
| 0.3 |
| — |
| — |
| 0.2 |
| 0.5 |
| 1.2 | ||||||||
Change in contingent consideration | — | — | — | — | — | — | 3.0 | 3.0 | ||||||||||||||||
Impairment of intangible assets | — | — | — | — | — | 81.0 | — | 81.0 | ||||||||||||||||
Impairment of investment | — | — | — | — | — | — | 16.0 | 16.0 | ||||||||||||||||
Costs related to Cboe Digital wind down | — | — | — | — | — | 0.8 | — | 0.8 | ||||||||||||||||
Gain on sale of property held for sale | (1.0) | — | — | — | — | — | — | (1.0) | ||||||||||||||||
Gain on Cboe Digital non-recourse notes and warrants wind down | — | — | — | — | — | (2.4) | — | (2.4) | ||||||||||||||||
Adjusted EBITDA | $ | 443.3 | $ | 113.3 | $ | 33.7 | $ | 49.4 | $ | 23.0 | $ | (16.4) | $ | 31.7 | $ | 678.0 | ||||||||
Six Months Ended June 30, | ||||||||||||||||||||||||
2023 | ||||||||||||||||||||||||
| Options |
| North American Equities |
| Europe and Asia Pacific |
| Futures |
| Global FX |
| Digital |
| Corporate |
| Total | |||||||||
Net income (loss) allocated to common stockholders | $ | 402.7 | $ | 49.3 | $ | 14.5 | $ | 39.1 | $ | 9.3 | $ | (20.7) | $ | (154.6) | $ | 339.6 | ||||||||
Interest expense (income), net | — | (0.6) | 2.6 | — | (0.1) | (0.6) | 27.7 | 29.0 | ||||||||||||||||
Income tax provision (benefit) |
| — |
| 2.2 |
| (0.9) |
| — |
| 0.3 |
| (1.0) |
| 148.2 |
| 148.8 | ||||||||
Depreciation and amortization |
| 13.6 |
| 36.2 |
| 16.5 |
| 1.2 |
| 10.1 |
| 3.6 |
| — |
| 81.2 | ||||||||
EBITDA |
| 416.3 |
| 87.1 |
| 32.7 |
| 40.3 |
| 19.6 |
| (18.7) |
| 21.3 |
| 598.6 | ||||||||
Acquisition-related costs | — | 0.9 | 0.9 | — | — | 0.8 | 4.5 | 7.1 | ||||||||||||||||
Income from investment | — | — | — | — | — | — | (2.1) | (2.1) | ||||||||||||||||
Adjusted EBITDA | $ | 416.3 | $ | 88.0 | $ | 33.6 | $ | 40.3 | $ | 19.6 | $ | (17.9) | $ | 23.7 | $ | 603.6 |
57
The following is a reconciliation of net income allocated to common stockholders to adjusted earnings (in millions):
Three Months Ended | Six Months Ended | |||||||||||
June 30, | June 30, | |||||||||||
| 2024 |
| 2023 |
| 2024 |
| 2023 | |||||
Net income allocated to common stockholders | $ | 139.7 | $ | 167.0 | $ | 348.0 | $ | 339.6 | ||||
Amortization of acquired intangible assets |
| 21.2 |
| 29.3 |
| 47.4 |
| 60.2 | ||||
Acquisition-related costs |
| 0.6 |
| 0.7 |
| 1.2 |
| 7.1 | ||||
Change in contingent consideration | 3.0 | — | 3.0 | — | ||||||||
Impairment of investment | 16.0 | — | 16.0 | — | ||||||||
Costs related to Cboe Digital wind down | 0.8 | — | 0.8 | — | ||||||||
Impairment of intangible assets | 81.0 | — | 81.0 | — | ||||||||
Gain on Cboe Digital non-recourse notes and warrants wind down | (2.0) | — | (2.4) | — | ||||||||
Gain on sale of property held for sale | (1.0) | — | (1.0) | — | ||||||||
Income from investment | — | (2.1) | — | (2.1) | ||||||||
Tax effect of adjustments | (32.7) | (6.8) | (39.6) | (16.3) | ||||||||
Increase of tax reserves | (4.0) | 0.7 | (4.0) | 2.2 | ||||||||
Valuation allowances | 4.1 | — | 4.1 | — | ||||||||
Net income allocated to participating securities | (0.5) | (0.1) | (0.6) | (0.3) | ||||||||
Adjusted earnings | $ | 226.2 | $ | 188.7 | $ | 453.9 | $ | 390.4 |
58
The following summarizes changes in certain operational and financial metrics for the six months ended June 30, 2024, compared to the six months ended June 30, 2023:
59
The following summarizes changes in certain operational and financial metrics for the six months ended June 30, 2024, compared to the six months ended June 30, 2023 (continued from previous page):
60
The following table includes operational and financial metrics for our Options, North American Equities, Europe and Asia Pacific, Futures, and Global FX segments. The following summarizes changes in certain operational and financial metrics for the three and six months ended June 30, 2024 compared to the three and six months ended June 30, 2023:
Three Months Ended June 30, | Increase/ | Percent | Six Months Ended June 30, | Increase/ | Percent | |||||||||||||||||||
| 2024 |
| 2023 |
| (Decrease) |
| Change |
| 2024 |
| 2023 |
| (Decrease) |
| Change | |||||||||
(in millions, except percentages, trading days, and as noted below) | (in millions, except percentages, trading days, and as noted below) | |||||||||||||||||||||||
Options: |
|
|
|
|
|
|
|
|
|
|
|
|
|
|
|
|
|
|
|
|
|
| ||
Average daily volume (ADV) (in millions of contracts): |
|
|
|
|
|
|
|
|
|
|
|
|
|
|
|
| ||||||||
Market ADV | 46.1 | 43.0 | 3.1 |
| 7 | % |
| 46.8 | 44.5 | 2.3 |
| 5 | % | |||||||||||
Total touched contracts (1) |
| 14.4 | 14.3 | 0.1 |
| 1 | % |
| 14.6 | 14.5 | 0.1 |
| 1 | % | ||||||||||
Multi-listed contract ADV | 10.4 | 10.6 | (0.2) | (2) | % | 10.6 | 10.8 | (0.2) | (3) | % | ||||||||||||||
Index contract ADV |
| 4.0 | 3.7 | 0.3 |
| 9 | % |
| 4.1 | 3.6 | 0.5 |
| 11 | % | ||||||||||
Number of trading days | 63 | 62 | 1 |
| 2 | % | 124 | 124 | — |
| — | % | ||||||||||||
Total Options revenue per contract (RPC) (2) | $ | 0.295 | $ | 0.271 | $ | 0.024 |
| 9 | % | $ | 0.297 | $ | 0.269 | $ | 0.028 |
| 11 | % | ||||||
Multi-listed options RPC (2) | $ | 0.062 | $ | 0.061 | $ | 0.001 |
| 1 | % | $ | 0.063 | $ | 0.063 | $ | — |
| 1 | % | ||||||
Index options RPC (2) | $ | 0.898 | $ | 0.877 | $ | 0.021 |
| 2 | % | $ | 0.906 | $ | 0.883 | $ | 0.023 |
| 3 | % | ||||||
Total Options market share | 31.2 | % | 33.3 | % | (2.1) | % | * | 31.2 | % | 32.5 | % | (1.3) | % | * | ||||||||||
Multi-listed options market share | 24.6 | % | 27.1 | % | (2.5) | % | * | 24.7 | % | 26.5 | % | (1.8) | % | * | ||||||||||
North American Equities: |
|
|
|
|
|
|
|
|
|
|
|
| ||||||||||||
U.S. Equities: | ||||||||||||||||||||||||
U.S. Equities - Exchange: | ||||||||||||||||||||||||
ADV: |
|
|
|
|
|
|
|
|
|
|
|
| ||||||||||||
Total touched shares (in billions) (1) |
| 1.4 |
| 1.4 |
| — |
| (1) | % |
| 1.5 |
| 1.5 |
| — |
| (1) | % | ||||||
Market ADV (in billions) |
| 11.8 |
| 10.7 |
| 1.1 |
| 9 | % |
| 11.8 |
| 11.3 |
| 0.5 |
| 4 | % | ||||||
Market share | 11.4 | % | 12.7 | % | (1.3) | % | * | 12.1 | % | 12.7 | % | (0.6) | % | * | ||||||||||
U.S. Equities - Exchange (net capture per one hundred touched shares) (3) | $ | 0.027 | $ | 0.021 | $ | 0.006 |
| 30 | % | $ | 0.023 | $ | 0.020 | $ | 0.003 |
| 15 | % | ||||||
U.S. ETPs: launches (number of launches) | 49 |
| 25 | 24 |
| 96 | % |
| 98 | 41 |
| 57 |
| 139 | % | |||||||||
U.S. ETPs: listings (number of listings) | 744 |
| 619 | 125 |
| 20 | % |
| 744 | 619 |
| 125 |
| 20 | % | |||||||||
U.S. Equities - Off-Exchange: | ||||||||||||||||||||||||
ADV: |
|
|
|
|
|
|
|
|
|
|
|
| ||||||||||||
Total touched shares (in millions) (1) |
| 74.7 |
| 78.7 |
| (4.0) |
| (5) | % |
| 78.3 |
| 84.1 |
| (5.8) |
| (7) | % | ||||||
U.S. Equities - Off-Exchange (net capture per one hundred touched shares) (4) | $ | 0.136 | $ | 0.122 | $ | 0.014 |
| 12 | % | $ | 0.134 | $ | 0.117 | $ | 0.017 |
| 14 | % | ||||||
Trading days | 63 | 62 | 1 | 2 | % | 124 | 124 | — | — | % | ||||||||||||||
Canadian Equities: | ||||||||||||||||||||||||
ADV (matched shares, in millions) (5) | 150.6 | 124.2 | 26.4 | 21 | % | 148.5 | 137.5 | 11.0 | 8 | % | ||||||||||||||
Trading days | 64 | 63 | 1 | 2 | % | 126 | 126 | — | — | % | ||||||||||||||
Net capture (per 10,000 touched shares, in Canadian dollars) (6) | $ | 4.046 | $ | 4.055 | $ | (0.009) | (0) | % | $ | 4.023 | $ | 4.046 | $ | (0.023) | (1) | % | ||||||||
Europe and Asia Pacific: |
|
|
|
|
|
|
|
|
|
|
|
|
|
| ||||||||||
European Equities: | ||||||||||||||||||||||||
ADNV: |
|
|
|
|
|
|
|
|
|
| ||||||||||||||
Matched ADNV (Euros - in billions) (7) | € | 9.6 | € | 9.2 | € | 0.4 | 4 | % | € | 9.7 | € | 10.3 | € | (0.6) | (6) | % | ||||||||
Market ADNV (in billions) | € | 42.6 | € | 38.7 | € | 3.9 | 10 | % | € | 42.2 | € | 42.3 | € | (0.1) | (0) | % | ||||||||
Trading days |
| 64 |
| 63 |
| 1 | 2 | % |
| 127 |
| 128 | (1) | (1) | % | |||||||||
Market share | 22.5 | % | 23.8 | % | (1.3) | % | * | 23.1 | % | 24.4 | % | (1.3) | % | * | ||||||||||
Net capture (per matched notional value (bps), in Euros) (8) | € | 0.251 | € | 0.230 | € | 0.021 | 9 | % | € | 0.250 | € | 0.221 | € | 0.029 | 13 | % | ||||||||
Cboe Clear Europe: | ||||||||||||||||||||||||
Trades cleared (9) | 299.0 | 275.5 | 23.5 | 9 | % | 593.3 | 634.9 | (41.6) | (7) | % | ||||||||||||||
Fee per trade cleared (10) | € | 0.008 | € | 0.009 | € | (0.001) | (8) | % | € | 0.008 | € | 0.008 | € | — | (5) | % | ||||||||
European equities market share cleared (11) | 36.5 | % | 33.8 | % | 2.7 | % | * | 35.7 | % | 34.0 | % | 1.7 | % | * | ||||||||||
Net settlement volume (12) | 2.8 | 2.4 | 0.4 | 15 | % | 5.3 | 5.1 | 0.2 | 4 | % | ||||||||||||||
Net fee per settlement (13) | € | 1.038 | € | 0.887 | € | 0.151 | 17 | % | € | 1.054 | € | 0.922 | € | 0.132 | 14 | % | ||||||||
Australian Equities: | ||||||||||||||||||||||||
ADNV (AUD - in billions) | $ | 0.8 | $ | 0.7 | $ | 0.1 | 12 | % | $ | 0.8 | $ | 0.7 | $ | 0.1 | 6 | % | ||||||||
Trading days | 62 | 61 | 1 | 2 | % | 124 | 124 | — | — | % | ||||||||||||||
Market share - Continuous | 20.8 | % | 18.2 | % | 2.6 | % | * | 20.6 | % | 18.3 | % | 2.3 | % | * | ||||||||||
Net capture (per matched notional value (bps), in Australian Dollars) (14) | $ | 0.155 | $ | 0.160 | $ | (0.005) | (3) | % | $ | 0.155 | $ | 0.160 | $ | (0.005) | (3) | % | ||||||||
Japanese Equities: | ||||||||||||||||||||||||
ADNV (JPY - in billions) | ¥ | 315.2 | ¥ | 184.3 | ¥ | 130.9 | 71 | % | ¥ | 315.5 | ¥ | 183.8 | ¥ | 131.7 | 72 | % | ||||||||
Trading days | 62 | 62 | — | — | % | 120 | 122 | (2) | (2) | % | ||||||||||||||
Market share - Lit Continuous | 5.5 | % | 4.1 | % | 1.4 | % | * | 5.2 | % | 4.4 | % | 0.8 | % | * | ||||||||||
Net capture (per matched notional value (bps), in Yen) (15) | ¥ | 0.229 | ¥ | 0.256 | ¥ | (0.027) | (11) | % | ¥ | 0.228 | ¥ | 0.250 | ¥ | (0.022) | (9) | % | ||||||||
Futures: | ||||||||||||||||||||||||
ADV (in thousands) | 253.6 | 197.4 | 56.2 | 28 | % | 237.1 | 214.6 | 22.5 | 10 | % | ||||||||||||||
Trading days | 63 | 62 | 1 | 2 | % | 124 | 124 | — | — | % | ||||||||||||||
Revenue per contract | $ | 1.757 | $ | 1.826 | $ | (0.069) | (4) | % | $ | 1.754 | $ | 1.771 | $ | (0.017) | (1) | % | ||||||||
Global FX: |
|
|
|
|
|
|
|
|
|
| ||||||||||||||
ADNV ($ - in billions) | $ | 47.7 | $ | 42.5 | $ | 5.2 | 12 | % | $ | 46.5 | $ | 43.7 | $ | 2.8 | 6 | % | ||||||||
Market share | 20.2 | % | 19.5 | % | 0.7 | % | * | 20.2 | % | 19.2 | % | 1.0 | % | * | ||||||||||
Trading days |
| 65 |
| 65 |
| — | — | % |
| 129 |
| 130 | (1) | (1) | % | |||||||||
Net capture (per one million dollars traded) (16) | $ | 2.69 | $ | 2.66 | $ | 0.03 | 1 | % | $ | 2.66 | $ | 2.65 | $ | 0.01 | 0 | % | ||||||||
Average British pound/U.S. dollar exchange rate | $ | 1.262 | $ | 1.252 | $ | 0.010 | 1 | % | $ | 1.265 | $ | 1.233 | $ | 0.032 | 3 | % | ||||||||
Average Canadian dollar/U.S. dollar exchange rate | $ | 0.731 | $ | 0.744 | $ | (0.013) | (2) | % | $ | 0.736 | $ | 0.742 | $ | (0.006) | (1) | % | ||||||||
Average Euro/U.S. dollar exchange rate | $ | 1.076 | $ | 1.089 | $ | (0.013) | (1) | % | $ | 1.081 | $ | 1.081 | $ | — | (0) | % | ||||||||
Average Euro/British pound exchange rate | £ | 0.853 | £ | 0.870 | £ | (0.017) | (2) | % | £ | 0.855 | £ | 0.877 | £ | (0.022) | (3) | % | ||||||||
Average Australian dollar/U.S. dollar exchange rate | $ | 0.659 | $ | 0.668 | $ | (0.009) | (1) | % | $ | 0.658 | $ | 0.676 | $ | (0.018) | (3) | % | ||||||||
Average Japanese Yen/U.S. dollar exchange rate | $ | 0.006 | $ | 0.007 | $ | (0.001) | (8) | % | $ | 0.007 | $ | 0.007 | $ | — | (6) | % |
*Not meaningful
*The Digital segment is not included as results were not material for the three and six months ended June 30, 2024 and 2023.
Note, the percent change listed represents the change in the unrounded metrics figures.
61
(1) | Touched volume represents the total number of shares of equity securities and ETFs internally matched on our exchanges or routed to and executed on an external market center. |
(2) | Average revenue per contract, for options and futures, represents total net transaction fees recognized for the period divided by total contracts traded during the period. |
(3) | Net capture per one hundred touched shares refers to transaction fees less liquidity payments and routing and clearing costs divided by the product of one-hundredth ADV of touched shares on BZX, BYX, EDGX, and EDGA and the number of trading days. |
(4) | Net capture per one hundred touched shares refers to transaction fees less order and execution management system (OMS/EMS) fees and clearing costs divided by the product of one-hundredth ADV of touched shares on BIDS Trading and the number of trading days for the period. |
(5) | Matched volume represents the total number of shares of equity securities and ETFs activity executed on our exchanges. |
(6) | Net capture per 10,000 touched shares refers to transaction fees divided by the product of one-ten thousandth ADV of shares for Cboe Canada Inc. and the number of trading days. |
(7) | Matched ADNV represents the average daily notional value of shares or contracts executed on our exchanges. |
(8) | Net capture per matched notional value refers to transaction fees less liquidity payments in British pounds divided by the product of ADNV in British pounds of shares matched on Cboe Europe Equities and the number of trading days. |
(9) | Trades cleared refers to the total number of non-interoperable trades cleared. |
(10) | Fee per trade cleared refers to clearing fees divided by number of non-interoperable trades cleared. |
(11) | European Equities market share cleared represents Cboe Clear Europe’s client volume cleared divided by the total volume of the publicly reported European venues. |
(12) | Net settlement volume refers to the total number of settlements executed after netting. |
(13) | Net fee per settlement refers to settlement fees less direct costs incurred to settle divided by the number of settlements executed after netting. |
(14) | Net capture per matched notional value refers to transaction fees less liquidity payments in Australian dollars divided by the product of ADNV in Australian dollars of shares matched on Cboe Australia and the number of Australian Equities trading days. |
(15) | Net capture per matched notional value refers to transaction fees less liquidity payments in Japanese Yen divided by the product of ADNV in Japanese Yen of shares matched on Cboe Japan and the number of Japanese Equities trading days. |
(16) | Net capture per one million dollars traded refers to net transaction fees less liquidity payments, if any, divided by the Spot and SEF products of one-thousandth of ADNV traded on the Cboe FX Markets and the number of trading days, divided by two, which represents the buyer and seller that are both charged on the transaction. |
62
Revenues
Total revenues for the three months ended June 30, 2024 increased $66.2 million, or 7%, compared to the same period in 2023 primarily due to increases in cash and spot markets and derivatives markets revenue, driven by an increase in the Section 31 fee rate following a rate change in May 2024, coupled with an increase in other revenue attributable to Cboe Clear Europe and an increase in volumes traded on the Cboe futures exchange. Total revenues for the six months ended June 30, 2024 increased $35.2 million, or 2%, compared to the same period in 2023 primarily due to an increase in cash and spot markets revenue, driven by an increase in other revenue attributable to Cboe Clear Europe, coupled with an increase in access and capacity fees and proprietary market data across segments, partially offset by a decrease in industry market data fees in the North American Equities and Options segments.
The following summarizes changes in revenues for the three and six months ended June 30, 2024 compared to the three and six months ended June 30, 2023 (in millions, except percentages):
Three Months Ended |
| Six Months Ended |
| |||||||||||||||||||||
June 30, | Increase/ | Percent |
| June 30, | Increase/ | Percent |
| |||||||||||||||||
| 2024 |
| 2023 |
| (Decrease) |
| Change |
|
| 2024 |
| 2023 |
| (Decrease) |
| Change |
| |||||||
Cash and spot markets | $ | 386.4 | $ | 341.3 | $ | 45.1 | 13 | % | $ | 767.3 | $ | 748.3 | $ | 19.0 | 3 | % | ||||||||
Data and access solutions | 142.1 | 135.3 | 6.8 | 5 | % | 282.3 | 264.7 | 17.6 | 7 | % | ||||||||||||||
Derivatives markets | 445.5 | 431.2 | 14.3 | 3 | % | 881.6 | 883.0 | (1.4) | (0) | % | ||||||||||||||
Total revenues | $ | 974.0 | $ | 907.8 | $ | 66.2 | 7 | % | $ | 1,931.2 | $ | 1,896.0 | $ | 35.2 | 2 | % |
Cash and Spot Markets
Cash and spot markets revenue increased for the three months ended June 30, 2024 compared to the same period in 2023 primarily due to increases in regulatory fees and other revenue. Regulatory fees increased primarily due to a 109% increase in the Section 31 fee rate, from an average rate of $8.00 per million dollars of covered sales for the three months ended June 30, 2023 to an average rate of $16.70 per million dollars of covered sales for the three months ended June 30, 2024. Other revenue increased primarily due to an increase in interest income attributable to Cboe Clear Europe as a result of the changing interest rate environment, coupled with additional interest earned in accordance with its investment policy. See Note 12 (“Clearing Operations”) for additional information.
Cash and spot markets revenue increased for the six months ended June 30, 2024 compared to the same period in 2023 primarily due to increases in other revenue and regulatory fees, partially offset by a decrease in industry market data fees. Other revenue increased primarily due to an increase in interest income attributable to Cboe Clear Europe as a result of the changing interest rate environment, coupled with additional interest earned in accordance with its investment policy. See Note 12 (“Clearing Operations”) for additional information. Regulatory fees increased primarily due to an increase in notional volumes on the U.S. Equities exchanges, partially offset by a 3% decrease in the Section 31 fee rate, from an average rate of $12.71 per million dollars of covered sales for the six months ended June 30, 2023 to an average rate of $12.35 per million dollars of covered sales for the six months ended June 30, 2024. Industry market data fees decreased primarily due a decrease in U.S. tape plan revenue driven by a 1% decline in market share on the U.S. Equities exchanges.
Data and Access Solutions
Data and access solutions revenue increased for the three months ended June 30, 2024 compared to the same period in 2023 primarily due to increases in access and capacity fees and proprietary market data fees. Access and capacity fees increased primarily due to increased physical and logical port fees in the North American Equities, Options, and Europe and Asia Pacific segments, both driven by increases in pricing. Proprietary market data fees increased primarily due to increases in proprietary market data fees in the North American Equities, Options, and Futures segments.
Data and access solutions revenue increased for the six months ended June 30, 2024 compared to the same period in 2023 primarily due to increases in access and capacity fees, proprietary market data fees, and licensing revenue within the Options segment. Access and capacity fees increased primarily due to increased physical and logical port fees in the Options, North American Equities, and Europe and Asia Pacific segments, both driven by increases in pricing and subscribers. Proprietary market data fees increased primarily due to increases in proprietary market data fees in the Options, North American Equities, and Europe and Asia Pacific segments.
63
Derivatives Markets
Derivatives markets revenue increased for the three months ended June 30, 2024 compared to the same period in 2023 primarily due to increases in transaction and clearing fees and regulatory fees. Transaction and clearing fees increased primarily due to a 28% increase in futures ADV, coupled with a 9% increase in index options ADV, partially offset by a 2% decrease in multi-listed options ADV and a decrease in routed trades on the Cboe options exchanges. Regulatory fees increased primarily due to a 109% increase in the Section 31 fee rate, from an average rate of $8.00 per million dollars of covered sales for the three months ended June 30, 2023 to an average rate of $16.70 per million dollars of covered sales for the three months ended June 30, 2024, partially offset by a decrease in options regulatory fees (“ORF”).
Derivatives markets revenue decreased slightly for the six months ended June 30, 2024 compared to the same period in 2023 primarily due to a decrease in industry market data fees attributable to a decrease in Options Price Reporting Authority (“OPRA”) revenue in the Options segment as a result of a decline in market share on the Cboe options exchanges.
64
Cost of Revenues
The following tables reconcile the disaggregated cost of revenues captions presented on the condensed consolidated statements of income to the net revenue captions presented on the condensed consolidated statements of income for the three and six months ended June 30, 2024 and 2023, respectively (in millions):
Three Months Ended June 30, | ||||||||||||
2024 | ||||||||||||
Cash and | Data and | Derivatives | Total | |||||||||
Liquidity payments | $ | 192.0 | $ | — | $ | 115.0 | $ | 307.0 | ||||
Routing and clearing fees | 12.6 | — | 4.0 | 16.6 | ||||||||
Section 31 fees | 63.1 | — | 14.6 | 77.7 | ||||||||
Royalty fees and other cost of revenues | 15.0 | 2.5 | 41.4 | 58.9 | ||||||||
Total cost of revenues | $ | 282.7 | $ | 2.5 | $ | 175.0 | $ | 460.2 | ||||
Three Months Ended June 30, | ||||||||||||
2023 | ||||||||||||
Cash and | Data and | Derivatives | Total | |||||||||
Liquidity payments | $ | 201.0 | $ | — | $ | 136.4 | $ | 337.4 | ||||
Routing and clearing fees | 12.7 | — | 8.1 | 20.8 | ||||||||
Section 31 fees | 28.7 | — | 5.8 | 34.5 | ||||||||
Royalty fees and other cost of revenues | 8.6 | 2.3 | 37.1 | 48.0 | ||||||||
Total cost of revenues | $ | 251.0 | $ | 2.3 | $ | 187.4 | $ | 440.7 | ||||
Six Months Ended June 30, | ||||||||||||
2024 | ||||||||||||
Cash and | Data and | Derivatives | Total | |||||||||
Liquidity payments | $ | 414.9 | $ | — | $ | 230.9 | $ | 645.8 | ||||
Routing and clearing fees | 24.4 | — | 8.2 | 32.6 | ||||||||
Section 31 fees | 97.8 | — | 22.0 | 119.8 | ||||||||
Royalty fees and other cost of revenues | 29.2 | 5.0 | 82.9 | 117.1 | ||||||||
Total cost of revenues | $ | 566.3 | $ | 5.0 | $ | 344.0 | $ | 915.3 | ||||
Six Months Ended June 30, | ||||||||||||
2023 | ||||||||||||
Cash and | Data and | Derivatives | Total | |||||||||
Liquidity payments | $ | 428.0 | $ | — | $ | 281.2 | $ | 709.2 | ||||
Routing and clearing fees | 27.0 | — | 17.8 | 44.8 | ||||||||
Section 31 fees | 90.1 | — | 19.3 | 109.4 | ||||||||
Royalty fees and other cost of revenues | 15.7 | 4.5 | 73.9 | 94.1 | ||||||||
Total cost of revenues | $ | 560.8 | $ | 4.5 | $ | 392.2 | $ | 957.5 |
Total cost of revenues increased for the three months ended June 30, 2024 compared to the same period in 2023 primarily due to increased cash and spot markets cost of revenues, driven by an increase in the Section 31 fee rate and an increase in operating interest expense attributable to Cboe Clear Europe, partially offset by a decrease in derivatives markets cost of revenues, driven by a decrease in liquidity payments on the Cboe options exchanges.
Total cost of revenues decreased for the six months ended June 30, 2024 compared to the same period in 2023 primarily due to decreased derivatives markets cost of revenues, driven by a decrease in liquidity payments on the Cboe options exchanges, partially offset by an increase in cash and spot markets cost of revenue, driven by an increase in Section 31 fees.
65
The following summarizes changes in the disaggregated cost of revenues for the three and six months ended June 30, 2024 compared to the three and six months ended June 30, 2023 (in millions, except percentages):
Three Months Ended |
| Six Months Ended |
| |||||||||||||||||||||
June 30, | Increase/ | Percent |
| June 30, | Increase/ | Percent |
| |||||||||||||||||
| 2024 |
| 2023 |
| (Decrease) |
| Change |
|
| 2024 |
| 2023 |
| (Decrease) |
| Change |
| |||||||
Liquidity payments | $ | 307.0 | $ | 337.4 | $ | (30.4) | (9) | % | $ | 645.8 | $ | 709.2 | $ | (63.4) | (9) | % | ||||||||
Routing and clearing |
| 16.6 |
| 20.8 |
| (4.2) | (20) | % |
| 32.6 |
| 44.8 |
| (12.2) | (27) | % | ||||||||
Section 31 fees | 77.7 | 34.5 | 43.2 | 125 | % | 119.8 | 109.4 | 10.4 | 10 | % | ||||||||||||||
Royalty fees and other cost of revenues | 58.9 | 48.0 | 10.9 | 23 | % | 117.1 | 94.1 | 23.0 | 24 | % | ||||||||||||||
Total cost of revenues | $ | 460.2 | $ | 440.7 | $ | 19.5 | 4 | % | $ | 915.3 | $ | 957.5 | $ | (42.2) | (4) | % |
Liquidity Payments
Liquidity payments decreased for the three and six months ended June 30, 2024 compared to the same periods in 2023 primarily due to a decrease in liquidity payments within the Options segment as a result of pricing changes made in the second half of 2023 to improve overall net capture, coupled with a decrease in liquidity payments within the North American Equities segment as a result of pricing changes made in the first half of 2024 to improve overall net capture.
Routing and Clearing
Routing and clearing fees decreased for the three months ended June 30, 2024 compared to the same period in 2023 primarily due to a decrease in routed trades on the Cboe options exchanges. Routing and clearing fees decreased for the six months ended June 30, 2024 compared to the same period in 2023 primarily due to a decrease in routed trades on the Cboe options exchanges, coupled with a decrease in routed shares on the U.S Equities exchanges.
Section 31 Fees
Section 31 fees increased for the three months ended June 30, 2024 compared to the same period in 2023 primarily due to a 109% increase in the Section 31 fee rate, from an average rate of $8.00 per million dollars of covered sales for the three months ended June 30, 2023 to an average rate of $16.70 per million dollars of covered sales for the three months ended June 30, 2024. Section 31 fees increased for the six months ended June 30, 2024 compared to the same period in 2023 primarily due to an increase in notional volumes, partially offset by a 3% decrease in the Section 31 fee rate, from an average rate of $12.71 per million dollars of covered sales for the six months ended June 30, 2023 to an average rate of $12.35 per million dollars of covered sales for the six months ended June 30, 2024.
Royalty Fees and Other Cost of Revenues
Royalty fees and other cost of revenues increased for the three and six months ended June 30, 2024 compared to the same periods in 2023 primarily due to an increase in operating interest expense attributable to Cboe Clear Europe as a result of the changing interest rate environment and additional interest expense in accordance with its investment policy, coupled with an increase in trading volumes of licensed products in the Options segment. See Note 12 (“Clearing Operations”) for additional information on Cboe Clear Europe’s investment policy.
Revenues Less Cost of Revenues
Revenues less cost of revenues increased $46.7 million, or 10%, and $77.4 million, or 8%, for the three and six months ended June 30, 2024, respectively, compared to the same periods in 2023 primarily due to increases in derivatives markets revenues less cost of revenues driven by an increase in volumes traded on the Cboe options exchanges, coupled with an increase in RPC and net capture on the Options, U.S. Equities and European Equities exchanges, as applicable, increase in access and capacity fees and proprietary market data across segments, and an increase in net other revenue attributable to Cboe Clear Europe.
66
The following summarizes the components of revenues less cost of revenues for the three and six months ended June 30, 2024 compared to the three and six months ended June 30, 2023 (in millions, except percentages):
Three Months Ended | Six Months Ended | |||||||||||||||||||||||
June 30, | Increase/ | Percent | June 30, | Increase/ | Percent | |||||||||||||||||||
| 2024 |
| 2023 |
| (Decrease) |
| Change |
|
| 2024 |
| 2023 |
| (Decrease) |
| Change |
| |||||||
Cash and spot markets | $ | 103.7 | $ | 90.3 | $ | 13.4 | 15 | % | $ | 201.0 | $ | 187.5 | $ | 13.5 | 7 | % | ||||||||
Data and access solutions |
| 139.6 |
| 133.0 | 6.6 | 5 | % |
| 277.3 |
| 260.2 | 17.1 | 7 | % | ||||||||||
Derivatives markets |
| 270.5 |
| 243.8 | 26.7 | 11 | % |
| 537.6 |
| 490.8 | 46.8 | 10 | % | ||||||||||
Total revenues less cost of revenues | $ | 513.8 | $ | 467.1 | $ | 46.7 | 10 | % | $ | 1,015.9 | $ | 938.5 | $ | 77.4 | 8 | % |
Cash and Spot Markets
Cash and spot markets revenues less cost of revenues increased for the three months ended June 30, 2024 compared to the same period in 2023 primarily due to increases in transaction and clearing fees less liquidity payments and routing and clearing costs (“net transaction and clearing fees”) in the North American Equities, Europe and Asia Pacific, and Global FX segments, coupled with an increase in net other revenue, partially offset by a decrease in industry market data fees. Net transaction and clearing fees increased primarily due to a 30% increase in U.S. Equities net capture, a 9% increase in European Equities net capture, a 17% increase in net fee per settlement by Cboe Clear Europe, and a 12% increase in Global FX ADNV, partially offset by a 1% decrease in total touched shares on the U.S. Equities exchanges. Net other revenue increased primarily due to an increase in operating interest income attributable to Cboe Clear Europe as a result of the changing interest rate environment and additional interest income in accordance with its investment policy. See Note 12 (“Clearing Operations”) for additional information on Cboe Clear Europe’s investment policy. Industry market data fees decreased primarily due a decrease in U.S. tape plan revenue driven by a 1% decline in market share on the U.S. Equities exchanges.
Cash and spot markets revenues less cost of revenues increased for the six months ended June 30, 2024 compared to the same period in 2023 primarily due to increases in net transaction and clearing fees in the North American Equities, Europe and Asia Pacific, and Global FX segments, coupled with an increase in net other revenue, partially offset by a decrease in industry market data fees. Net transaction and clearing fees increased primarily due to a 15% increase in U.S. Equities net capture, a 13% increase in European Equities net capture, a 6% increase in Global FX ADNV, and a 72% increase in Japanese Equities ADNV. Net other revenue increased primarily due to an increase in operating interest income attributable to Cboe Clear Europe as a result of the changing interest rate environment and additional interest income in accordance with its investment policy. See Note 12 (“Clearing Operations”) for additional information on Cboe Clear Europe’s investment policy. Industry market data fees decreased primarily due a decrease in U.S. tape plan revenue driven by a 1% decline in market share on the U.S. Equities exchanges.
Data and Access Solutions
Data and access solutions revenue increased for the three months ended June 30, 2024 compared to the same period in 2023 primarily due to increases in access and capacity fees and proprietary market data fees. Access and capacity fees increased primarily due to increased physical and logical port fees in the North American Equities, Options, and Europe and Asia Pacific segments, both driven by increases in pricing. Proprietary market data fees increased primarily due to increases in proprietary market data fees in the North American Equities, Options, and Futures segments.
Data and access solutions revenue increased for the six months ended June 30, 2024 compared to the same period in 2023 primarily due to increases in access and capacity fees, proprietary market data fees, and licensing revenue within the Options segment. Access and capacity fees increased primarily due to increased physical and logical port fees in the Options, North American Equities, and Europe and Asia Pacific segments, both driven by increases in pricing and subscribers. Proprietary market data fees increased primarily due to increases in proprietary market data fees in the Options, North American Equities, and Europe and Asia Pacific segments.
Derivatives Markets
Derivatives markets revenues less cost of revenues increased for the three months ended June 30, 2024 compared to the same period in 2023 primarily due to an increase in net transaction and clearing fees driven by a 9% increase in index options ADV, a 2% increase in index options RPC, and a 28% increase in futures ADV, partially offset by an increase in royalty fees due to an increase in trading volumes of licensed products in the Options segment.
67
Derivatives markets revenues less cost of revenues increased for the six months ended June 30, 2024 compared to the same period in 2023 primarily due to an increase in net transaction and clearing fees driven by an 11% increase in index options ADV, a 3% increase in index options RPC, and a 10% increase in futures ADV, partially offset by an increase in royalty fees due to an increase in trading volumes of licensed products in the Options segment.
Operating Expenses
Total operating expenses for the three and six months ended June 30, 2024 compared to the same periods in 2023 increased $81.4 million, or 37%, and $77.6 million, or 17%, respectively, primarily due to the impairment of intangible assets charge recorded to the Digital segment in the second quarter of 2024.
The following summarizes changes in operating expenses for the three and six months ended June 30, 2024 compared to the three and six months ended June 30, 2023 (in millions, except percentages):
Three Months Ended |
| Six Months Ended |
| |||||||||||||||||||||
June 30, | Increase/ | Percent |
| June 30, | Increase/ | Percent |
| |||||||||||||||||
| 2024 |
| 2023 |
| (Decrease) |
| Change |
|
| 2024 |
| 2023 |
| (Decrease) |
| Change |
| |||||||
Compensation and benefits | $ | 116.1 | $ | 106.5 | $ | 9.6 | 9 | % | $ | 231.4 | $ | 216.9 | $ | 14.5 | 7 | % | ||||||||
Depreciation and amortization |
| 31.8 |
| 39.8 |
| (8.0) | (20) | % |
| 69.1 |
| 81.2 |
| (12.1) | (15) | % | ||||||||
Technology support services |
| 24.6 |
| 28.3 |
| (3.7) | (13) | % |
| 48.8 |
| 50.5 |
| (1.7) | (3) | % | ||||||||
Professional fees and outside services |
| 25.8 |
| 20.4 |
| 5.4 | 26 | % |
| 47.3 |
| 44.3 |
| 3.0 | 7 | % | ||||||||
Travel and promotional expenses |
| 9.3 |
| 13.5 |
| (4.2) | (31) | % |
| 16.8 |
| 19.7 |
| (2.9) | (15) | % | ||||||||
Facilities costs |
| 6.1 |
| 6.2 |
| (0.1) | (2) | % |
| 12.6 |
| 13.8 |
| (1.2) | (9) | % | ||||||||
Acquisition-related costs |
| 0.6 |
| 0.7 |
| (0.1) | (14) | % |
| 1.2 |
| 7.1 |
| (5.9) | (83) | % | ||||||||
Impairment of intangible assets | 81.0 | — | 81.0 | * | % | 81.0 | — | 81.0 | * | % | ||||||||||||||
Other expenses |
| 8.4 |
| 6.9 |
| 1.5 | 22 | % |
| 15.2 |
| 12.3 |
| 2.9 | 24 | % | ||||||||
Total operating expenses | $ | 303.7 | $ | 222.3 | $ | 81.4 | 37 | % | $ | 523.4 | $ | 445.8 | $ | 77.6 | 17 | % |
*Not meaningful
Compensation and Benefits
Compensation and benefits increased for the three and six months ended June 30, 2024 compared to the same periods in 2023 primarily due to increases in salaries, bonuses, and payroll taxes of $8.1 million and $18.1 million, respectively, driven by increased headcount, increases in bonuses from strong Company performance year to date, and merit increases. For the six months ended June 30, 2024, the increase in compensation and benefits was partially offset by a $4.8 million decrease in equity compensation compared to the same period in 2023 due to a change in the vesting requirements for new equity award agreements, which provide for additional vesting requirements after an applicable retirement date. See Note 17 (“Stock-Based Compensation”) for additional information.
Depreciation and Amortization
Depreciation and amortization decreased for the three and six months ended June 30, 2024 compared to the same periods in 2023 due to a decline in amortization under the discounted cash flow method for the intangibles acquired in the Merger.
Technology Support Services
Technology support services decreased for the three and six months ended June 30, 2024 compared to the same periods in 2023 due to decreases in hardware maintenance and purchases, partially offset by increases in software maintenance, market data services, and software licenses and subscriptions.
Professional Fees and Outside Services
Professional fees and outside services increased for the three and six months ended June 30, 2024 compared to the same periods in 2023 primarily due to increases in consulting fees, contract services, and legal fees, partially offset by a
68
decrease in recruiting fees. For the six months ended June 30, 2024, the increase in professional fees and outside services was partially offset by a decrease in regulatory costs related to CAT fees compared to the same period in 2023.
Travel and Promotional Expenses
Travel and promotional expenses decreased for the three and six months ended June 30, 2024 compared to the same periods in 2023 primarily due to decreases in marketing and advertising expenses driven by the Company’s rebranding, advertising campaigns and sponsorships, and special events in the prior year.
Facilities Costs
Facilities costs decreased for the three and six months ended June 30, 2024 compared to the same periods in 2023 primarily due to a decrease in accrued real estate taxes.
Acquisition-Related Costs
Acquisition-related costs decreased for the three and six months ended June 30, 2024 compared to the same periods in 2023 primarily due to a decrease in professional fees and retention-related compensation costs associated with prior acquisitions.
Impairment of Intangible Assets
Impairment of intangible assets increased for the three and six months ended June 30, 2024 compared to the same periods in 2023 due to the impairment of intangible assets recognized in the Digital segment.
Other Expenses
Other expenses increased for the three and six months ended June 30, 2024 compared to the same periods in 2023 primarily due to an increase in contingent consideration related to prior acquisitions. For the three months ended June 30, 2024, the increase in other expenses was partially offset by a decrease in bad debt expense provisions compared to the same period in 2023.
Operating Income
As a result of the items above, operating income for the three months ended June 30, 2024 was $210.1 million, compared to operating income of $244.8 million for the three months ended June 30, 2023, a decrease of $34.7 million.
As a result of the items above, operating income for the six months ended June 30, 2024 was $492.5 million, compared to operating income of $492.7 million for the six months ended June 30, 2023, a decrease of $0.2 million.
Interest Expense
Interest expense decreased for the three and six months ended June 30, 2024 compared to the same periods in 2023 primarily due to repayments on the Term Loan in 2023, which was paid off in the fourth quarter of 2023.
Interest Income
Interest income increased for the three and six months ended June 30, 2024 compared to the same periods in 2023 primarily due to increases in interest rates in 2024.
69
Earnings on Investments
Earnings on investments increased for the three and six months ended June 30, 2024 compared to the same periods in 2023 primarily due to increases of $5.3 million, and $3.7 million, respectively, in the equity earnings on the Company’s investment in 7Ridge Fund (which owns Trading Technologies) recorded in 2024 compared to the same periods in 2023, partially offset by an increase in non-qualified deferred compensation.
Other (Expense) Income, Net
Net other expense decreased for the three and six months ended June 30, 2024 compared to the same periods in 2023 primarily due to a $16.0 million impairment recorded on the Company’s minority investment in Globacap Technology Limited (“Globacap”) recorded in the second quarter of 2024, coupled with $2.1 million in dividend income from the Company’s minority ownership of Vest Financial Group, Inc. (“Vest”) recorded in the second quarter of 2023, which did not recur in the three months ended June 30, 2024. For the six months ended June 30, 2024, the decrease in net other expense was partially offset by $4.1 million in dividend income from Vest recorded in the first quarter of 2024.
Income Before Income Tax Provision
As a result of the above, income before income tax provision for the three months ended June 30, 2024 was $203.0 million, compared to income before income tax provision of $241.8 million for the three months ended June 30, 2023, a decrease of $38.8 million.
As a result of the above, income before income tax provision for the six months ended June 30, 2024 was $495.1 million, compared to income before income tax provision of $490.0 million for the six months ended June 30, 2023, an increase of $5.1 million.
Income Tax Provision
The effective tax rate from continuing operations was 30.8% and 30.6% for the three months ended June 30, 2024 and 2023, respectively, and 29.3% and 30.4% for the six months ended June 30, 2024 and 2023, respectively.
The higher effective tax rate for the three months ended June 30, 2024 compared to the same period in 2023 is primarily due to the valuation allowance associated with the impairment of the Globacap investment. The lower effective tax rate for the six months ended June 30, 2024 compared to the same period in 2023 is primarily due to the excess tax benefits from the vesting of equity awards that occurred during the first quarter of 2024.
Net Income
As a result of the items above, net income for the three months ended June 30, 2024 was $140.4 million, compared to net income of $167.8 million for the three months ended June 30, 2023, a decrease of $27.4 million.
As a result of the items above, net income for the six months ended June 30, 2024 was $349.9 million, compared to net income of $341.2 million for the six months ended June 30, 2023, an increase of $8.7 million.
70
Segment Operating Results
We report results from our six segments: Options, North American Equities, Europe and Asia Pacific, Futures, Global FX, and Digital. Segment performance is primarily based on operating income. We have aggregated all corporate costs, as well as other business ventures, within Corporate Items and Eliminations as those activities should not be used to evaluate a segment’s operating performance. All operating expenses that relate to activities of a specific segment have been allocated to that segment. Operating expenses increased or decreased in certain segments for the three and six months ended June 30, 2024 compared to the three and six months ended June 30, 2023 primarily due to changes in the allocation of shared-service expenses.
The following summarizes our total revenues by segment (in millions, except percentages):
Note, the chart excludes Digital revenues of $(0.3) million and $(1.7) million for the six months ended June 30, 2024 and 2023, respectively.
Percentage | Percentage of |
| ||||||||||||||||||||||||
of Total | Total |
| ||||||||||||||||||||||||
Revenues | Revenues |
| ||||||||||||||||||||||||
Three Months Ended | Three Months Ended | Six Months Ended | Six Months Ended |
| ||||||||||||||||||||||
June 30, | Percent | June 30, | June 30, | Percent | June 30, |
| ||||||||||||||||||||
| 2024 | 2023 | Change | 2024 | 2023 | 2024 | 2023 | Change | 2024 | 2023 |
| |||||||||||||||
Options | $ | 482.3 | $ | 471.5 | 2 | % | 50 | % | 52 | % | $ | 959.7 | $ | 957.6 | 0 | % | 50 | % | 51 | % | ||||||
North American Equities |
| 353.3 |
| 320.6 | 10 | % | 36 | % | 35 | % |
| 702.9 |
| 700.4 | 0 | % | 37 | % | 37 | % | ||||||
Europe and Asia Pacific |
| 81.6 |
| 68.3 | 19 | % | 8 | % | 8 | % |
| 162.3 |
| 140.6 | 15 | % | 8 | % | 7 | % | ||||||
Futures |
| 35.9 |
| 30.0 | 20 | % | 4 | % | 3 | % |
| 67.3 |
| 62.1 | 8 | % | 3 | % | 3 | % | ||||||
Global FX | 20.5 | 18.2 | 13 | % | 2 | % | 2 | % | 39.3 | 37.0 | 6 | % | 2 | % | 2 | % | ||||||||||
Digital | 0.4 | (0.8) | 150 | % | * | % | * | % | (0.3) | (1.7) | 82 | % | * | % | * | % | ||||||||||
Total revenues | $ | 974.0 | $ | 907.8 | 7 | % | 100 | % | 100 | % | $ | 1,931.2 | $ | 1,896.0 | 2 | % | 100 | % | 100 | % |
* | Not meaningful |
71
The following summarizes our revenues less cost of revenues by segment (in millions, except percentages):
Note, the chart excludes Digital revenues less cost of revenues of $(1.0) million and $(2.5) million for the six months ended June 30, 2024 and 2023, respectively.
Percentage of |
| Percentage of |
| |||||||||||||||||||||||
Total Revenues |
| Total Revenues |
| |||||||||||||||||||||||
Less Cost of Revenues |
| Less Cost of Revenues |
| |||||||||||||||||||||||
Three Months Ended | Three Months Ended |
| Six Months Ended | Six Months Ended |
| |||||||||||||||||||||
June 30, | Percent | June 30, |
| June 30, | Percent | June 30, |
| |||||||||||||||||||
| 2024 |
| 2023 |
| Change |
| 2024 |
| 2023 |
|
| 2024 |
| 2023 |
| Change |
| 2024 |
| 2023 |
| |||||
Options | $ | 306.7 | $ | 283.2 | 8 | % | 60 | % | 61 | % | $ | 614.1 | $ | 563.9 | 9 | % | 60 | % | 60 | % | ||||||
North American Equities |
| 98.3 |
| 90.8 | 8 | % | 19 | % | 19 | % |
| 190.9 |
| 183.9 | 4 | % | 19 | % | 20 | % | ||||||
Europe and Asia Pacific |
| 54.3 |
| 47.3 | 15 | % | 10 | % | 10 | % |
| 108.4 |
| 96.6 | 12 | % | 11 | % | 10 | % | ||||||
Futures |
| 34.8 |
| 29.2 | 19 | % | 7 | % | 6 | % |
| 65.3 |
| 60.3 | 8 | % | 6 | % | 6 | % | ||||||
Global FX | 19.8 | 17.8 | 11 | % | 4 | % | 4 | % | 38.2 | 36.3 | 5 | % | 4 | % | 4 | % | ||||||||||
Digital | (0.1) | (1.2) | 92 | % | * | % | * | % | (1.0) | (2.5) | 60 | % | * | % | * | % | ||||||||||
Total revenues less cost of revenues | $ | 513.8 | $ | 467.1 | 10 | % | 100 | % | 100 | % | $ | 1,015.9 | $ | 938.5 | 8 | % | 100 | % | 100 | % |
* | Not meaningful |
72
Options
The following summarizes revenues less cost of revenues, operating expenses, operating income, EBITDA, and EBITDA margin for our Options segment (in millions, except percentages):
Percentage |
| Percentage |
| |||||||||||||||||||||||||||||||
of Total |
| of Total |
| |||||||||||||||||||||||||||||||
Revenues |
| Revenues |
| |||||||||||||||||||||||||||||||
Three Months Ended | Three Months Ended |
| Six Months Ended | Six Months Ended |
| |||||||||||||||||||||||||||||
June 30, | Percent | June 30, |
| June 30, | Percent | June 30, |
| |||||||||||||||||||||||||||
| 2024 |
|
| 2023 |
|
| Change |
|
| 2024 |
|
| 2023 |
|
| 2024 |
|
| 2023 |
|
| Change |
|
| 2024 |
|
| 2023 | ||||||
Revenues less cost of revenues | $ | 306.7 | $ | 283.2 |
| 8 | % | 64 | % | 60 | % | $ | 614.1 | $ | 563.9 |
| 9 | % | 64 | % | 59 | % | ||||||||||||
Operating expenses |
| 91.1 |
| 79.5 |
| 15 | % | 19 | % | 17 | % |
| 181.7 |
| 159.2 |
| 14 | % | 19 | % | 17 | % | ||||||||||||
Operating income | $ | 215.6 | $ | 203.7 |
| 6 | % | 45 | % | 43 | % | $ | 432.4 | $ | 404.7 |
| 7 | % | 45 | % | 42 | % | ||||||||||||
EBITDA (1) | $ | 221.8 | $ | 209.5 |
| 6 | % | 46 | % | 44 | % | $ | 444.3 | $ | 416.3 |
| 7 | % | 46 | % | 43 | % | ||||||||||||
EBITDA margin (2) |
| 72.3 | % |
| 74.0 | % | * | * | * |
| 72.3 | % |
| 73.8 | % | * | * | * |
* | Not meaningful |
(1) | See footnote (1) to the table under “Financial Summary” above for a reconciliation of net income to EBITDA, and management’s reasons for using such non-GAAP measures. |
(2) | EBITDA margin represents EBITDA divided by revenues less cost of revenues. |
Revenues less cost of revenues increased $23.5 million for the three months ended June 30, 2024 compared to the three months ended June 30, 2023 primarily due to an increase in net transaction and clearing fees driven by a 9% increase in index options ADV, a 2% increase in index options RPC, an increase in proprietary market data revenue, and an increase in physical port fees, partially offset by an increase in royalty fees due to an increase in trading volumes of licensed products. For the three months ended June 30, 2024, operating income for the Options segment increased $11.9 million compared to the three months ended June 30, 2023 primarily due to an increase in revenues less cost of revenues, partially offset by an increase in operating expenses. Operating expenses increased $11.6 million for the three months ended June 30, 2024 compared to the three months ended June 30, 2023 primarily due to increases in compensation and benefits and professional fees and outside services.
Revenues less cost of revenues increased $50.2 million for the six months ended June 30, 2024 compared to the six months ended June 30, 2023 primarily due to an increase in net transaction and clearing fees driven by an 11% increase in index options ADV, a 3% increase in index options RPC, an increase in physical and logical port fees, and an increase in proprietary market data revenue, partially offset by an increase in royalty fees due to an increase in trading volumes of licensed products. For the six months ended June 30, 2024, operating income for the Options segment increased $27.7 million compared to the six months ended June 30, 2023 primarily due to an increase in revenues less cost of revenues, partially offset by an increase in operating expenses. Operating expenses increased $22.5 million for the six months ended June 30, 2024 compared to the six months ended June 30, 2023 primarily due to increases in compensation and benefits, technology support services, and professional and outside services.
North American Equities
The following summarizes revenues less cost of revenues, operating expenses, operating income, EBITDA, and EBITDA margin for our North American Equities segment (in millions, except percentages):
Percentage |
| Percentage |
| |||||||||||||||||||||||||||||||
of Total |
| of Total |
| |||||||||||||||||||||||||||||||
Revenues |
| Revenues |
| |||||||||||||||||||||||||||||||
Three Months Ended | Three Months Ended |
| Six Months Ended | Six Months Ended |
| |||||||||||||||||||||||||||||
June 30, | Percent | June 30, |
| June 30, | Percent | June 30, |
| |||||||||||||||||||||||||||
| 2024 |
|
| 2023 |
|
| Change |
|
| 2024 |
|
| 2023 |
|
| 2024 |
|
| 2023 |
|
| Change |
|
| 2024 |
|
| 2023 |
| |||||
Revenues less cost of revenues | $ | 98.3 | $ | 90.8 |
| 8 | % | 28 | % | 28 | % | $ | 190.9 | $ | 183.9 |
| 4 | % | 27 | % | 26 | % | ||||||||||||
Operating expenses |
| 53.0 |
| 68.0 |
| (22) | % | 15 | % | 21 | % |
| 107.6 |
| 132.7 |
| (19) | % | 15 | % | 19 | % | ||||||||||||
Operating income | $ | 45.3 | $ | 22.8 |
| 99 | % | 13 | % | 7 | % | $ | 83.3 | $ | 51.2 |
| 63 | % | 12 | % | 7 | % | ||||||||||||
EBITDA (1) | $ | 59.5 | $ | 40.2 |
| 48 | % | 17 | % | 13 | % | $ | 113.1 | $ | 87.1 |
| 30 | % | 16 | % | 12 | % | ||||||||||||
EBITDA margin (2) |
| 60.5 | % |
| 44.3 | % | * | * | * |
| 59.2 | % |
| 47.4 | % | * | * | * |
* | Not meaningful |
(1) | See footnote (1) to the table under “Financial Summary” above for a reconciliation of net income to EBITDA, and management’s reasons for using such non-GAAP measures. |
(2) | EBITDA margin represents EBITDA divided by revenues less cost of revenues. |
73
Revenues less cost of revenues increased $7.5 million for the three months ended June 30, 2024 compared to the three months ended June 30, 2023 primarily due to an increase in net transaction and clearing fees driven by a 30% increase in U.S. Equities net capture, an increase in proprietary market data revenue, and an increase in physical port fees, partially offset by a decrease in industry market data fees driven by a decrease in U.S. tape plan revenue as a result of a 1% decline in market share on the U.S. Equities exchanges. For the three months ended June 30, 2024, operating income for the North American Equities segment increased $22.5 million compared to the three months ended June 30, 2023 primarily due to a decrease in operating expenses, coupled with an increase in revenues less cost of revenues. Operating expenses decreased $15.0 million for the three months ended June 30, 2024 compared to the three months ended June 30, 2023 due to decreases in technology support services, depreciation and amortization, compensation and benefits, and travel and promotional expenses.
Revenues less cost of revenues increased $7.0 million for the six months ended June 30, 2024 compared to the six months ended June 30, 2023 primarily due to an increase in net transaction and clearing fees driven by a 15% increase in U.S. Equities net capture, an increase in physical port fees, and an increase in proprietary market data revenue, partially offset by a decrease in industry market data fees driven by a decrease in U.S. tape plan revenue as a result of a 1% decline in market share on the U.S. Equities exchanges. For the six months ended June 30, 2024, operating income for the North American Equities segment increased $32.1 million compared to the six months ended June 30, 2023 due to a decrease in operating expenses, coupled with an increase in revenues less cost of revenues. Operating expenses decreased $25.1 million for the six months ended June 30, 2024 compared to the six months ended June 30, 2023 primarily due to decreases in compensation and benefits, depreciation and amortization, technology support services, and professional fees and outside services.
Europe and Asia Pacific
The following summarizes revenues less cost of revenues, operating expenses, operating income, EBITDA, and EBITDA margin for our Europe and Asia Pacific segment (in millions, except percentages):
Percentage |
| Percentage |
| |||||||||||||||||||||||||||||||
of Total |
| of Total |
| |||||||||||||||||||||||||||||||
Revenues |
| Revenues |
| |||||||||||||||||||||||||||||||
Three Months Ended | Three Months Ended |
| Six Months Ended | Six Months Ended |
| |||||||||||||||||||||||||||||
June 30, | Percent | June 30, |
| June 30, | Percent | June 30, |
| |||||||||||||||||||||||||||
| 2024 |
|
| 2023 |
|
| Change |
|
| 2024 |
|
| 2023 |
|
| 2024 |
|
| 2023 |
|
| Change |
|
| 2024 |
|
| 2023 |
| |||||
Revenues less cost of revenues | $ | 54.3 | $ | 47.3 |
| 15 | % | 67 | % | 69 | % | $ | 108.4 | $ | 96.6 |
| 12 | % | 67 | % | 69 | % | ||||||||||||
Operating expenses |
| 45.1 |
| 41.8 |
| 8 | % | 55 | % | 61 | % |
| 89.0 |
| 79.8 |
| 12 | % | 55 | % | 57 | % | ||||||||||||
Operating income | $ | 9.2 | $ | 5.5 |
| 67 | % | 11 | % | 8 | % | $ | 19.4 | $ | 16.8 |
| 15 | % | 12 | % | 12 | % | ||||||||||||
EBITDA (1) | $ | 15.5 | $ | 13.0 |
| 19 | % | 19 | % | 19 | % | $ | 33.4 | $ | 32.7 |
| 2 | % | 21 | % | 23 | % | ||||||||||||
EBITDA margin (2) |
| 28.5 | % |
| 27.5 | % | * | * | * |
| 30.8 | % |
| 33.9 | % | * | * | * |
*Not meaningful
(1) | See footnote (1) to the table under “Financial Summary” above for a reconciliation of net income to EBITDA, and management’s reasons for using such non-GAAP measures. |
(2) | EBITDA margin represents EBITDA divided by revenues less cost of revenues. |
Revenues less cost of revenues increased $7.0 million for the three months ended June 30, 2024 compared to the three months ended June 30, 2023 primarily due to an increase in net transaction and clearing fees driven by a 9% increase in European Equities net capture, a 17% increase in net fee per settlement by Cboe Clear Europe, and a 71% increase in Japanese Equities ADNV, coupled with an increase in operating interest income attributable to Cboe Clear Europe. For the three months ended June 30, 2024, operating income for the Europe and Asia Pacific segment increased $3.7 million compared to the three months ended June 30, 2023 primarily due to an increase in revenues less cost of revenues, partially offset by an increase in operating expenses. Operating expenses increased $3.3 million for the three months ended June 30, 2024 compared to the three months ended June 30, 2023 primarily due to increases in compensation and benefits and professional fees and outside services.
Revenues less cost of revenues increased $11.8 million for the six months ended June 30, 2024 compared to the six months ended June 30, 2023 primarily due to an increase in operating interest income attributable to Cboe Clear Europe, an increase in proprietary market data fees, and an increase in logical and physical port fees. For the six months ended June 30, 2024, operating income for the Europe and Asia Pacific segment increased $2.6 million compared to the six months ended June 30, 2023 primarily due to an increase in revenues less cost of revenues, partially offset by an increase in operating expenses. Operating expenses increased $9.2 million for the six months ended June 30, 2024 compared to the six months ended June 30, 2023 primarily due to increases in compensation and benefits, professional fees and outside services, and technology support services, partially offset by a decrease in depreciation and amortization.
74
Futures
The following summarizes revenues less cost of revenues, operating expenses, operating income, EBITDA, and EBITDA margin for our Futures segment (in millions, except percentages):
Percentage |
| Percentage |
| |||||||||||||||||||||||||||||||
of Total |
| of Total |
| |||||||||||||||||||||||||||||||
Revenues |
| Revenues |
| |||||||||||||||||||||||||||||||
Three Months Ended | Three Months Ended |
| Six Months Ended | Six Months Ended |
| |||||||||||||||||||||||||||||
June 30, | Percent | June 30, |
| June 30, | Percent | June 30, |
| |||||||||||||||||||||||||||
| 2024 |
|
| 2023 |
|
| Change |
|
| 2024 |
|
| 2023 |
|
| 2024 |
|
| 2023 |
|
| Change |
|
| 2024 |
|
| 2023 | ||||||
Revenues less cost of revenues | $ | 34.8 | $ | 29.2 |
| 19 | % | 97 | % | 97 | % | $ | 65.3 | $ | 60.3 |
| 8 | % | 97 | % | 97 | % | ||||||||||||
Operating expenses |
| 8.5 |
| 10.8 |
| (21) | % | 24 | % | 36 | % |
| 16.9 |
| 21.0 |
| (20) | % | 25 | % | 34 | % | ||||||||||||
Operating income | $ | 26.3 | $ | 18.4 |
| 43 | % | 73 | % | 61 | % | $ | 48.4 | $ | 39.3 |
| 23 | % | 72 | % | 63 | % | ||||||||||||
EBITDA (1) | $ | 26.8 | $ | 18.9 |
| 42 | % | 75 | % | 63 | % | $ | 49.4 | $ | 40.3 |
| 23 | % | 73 | % | 65 | % | ||||||||||||
EBITDA margin (2) |
| 77.0 | % |
| 64.7 | % | * | * | * |
| 75.7 | % |
| 66.8 | % | * | * | * |
* | Not meaningful |
(1) | See footnote (1) to the table under “Financial Summary” above for a reconciliation of net income to EBITDA, and management’s reasons for using such non-GAAP measures. |
(2) | EBITDA margin represents EBITDA divided by revenues less cost of revenues. |
Revenues less cost of revenues increased $5.6 million for the three months ended June 30, 2024 compared to the three months ended June 30, 2023 primarily due to an increase in net transaction and clearing fees as a result of a 28% increase in ADV, partially offset by a 4% decrease in RPC. For the three months ended June 30, 2024, operating income for the Futures segment increased $7.9 million compared to the three months ended June 30, 2023 primarily due to an increase in revenues less cost of revenues, coupled with a decrease in operating expenses. Operating expenses decreased $2.3 million for the three months ended June 30, 2024 compared to the three months ended June 30, 2023 primarily due to decreases in technology support services, compensation and benefits, and travel and promotional expenses.
Revenues less cost of revenues increased $5.0 million for the six months ended June 30, 2024 compared to the six months ended June 30, 2023 primarily due to an increase in net transaction and clearing fees as a result of a 10% increase in ADV, partially offset by a 1% decrease in RPC. For the six months ended June 30, 2024, operating income for the Futures segment increased $9.1 million compared to the six months ended June 30, 2023 primarily due to an increase in revenues less cost of revenues, coupled with a decrease in operating expenses. Operating expenses decreased $4.1 million for the six months ended June 30, 2024 compared to the six months ended June 30, 2023 primarily due to decreases in compensation and benefits and technology support services.
Global FX
The following summarizes revenues less cost of revenues, operating expenses, operating income, EBITDA, and EBITDA margin for our Global FX segment (in millions, except percentages):
Percentage |
| Percentage |
| ||||||||||||||||||||||||||||||
of Total |
| of Total |
| ||||||||||||||||||||||||||||||
Revenues |
| Revenues |
| ||||||||||||||||||||||||||||||
Three Months Ended | Three Months Ended |
| Six Months Ended | Six Months Ended |
| ||||||||||||||||||||||||||||
June 30, | Percent | June 30, |
| June 30, | Percent | June 30, |
| ||||||||||||||||||||||||||
| 2024 |
|
| 2023 |
| Change |
|
| 2024 |
|
| 2023 |
|
| 2024 |
|
| 2023 |
|
| Change |
|
| 2024 |
|
| 2023 |
| |||||
Revenues less cost of revenues | $ | 19.8 | $ | 17.8 |
| 11 | % | 97 | % | 98 | % | $ | 38.2 | $ | 36.3 |
| 5 | % | 97 | % | 98 | % | |||||||||||
Operating expenses |
| 10.6 |
| 12.8 |
| (17) | % | 52 | % | 70 | % |
| 22.4 |
| 26.6 |
| (16) | % | 57 | % | 72 | % | |||||||||||
Operating income | $ | 9.2 | $ | 5.0 |
| 84 | % | 45 | % | 27 | % | $ | 15.8 | $ | 9.7 |
| 63 | % | 40 | % | 26 | % | |||||||||||
EBITDA (1) | $ | 12.4 | $ | 9.7 |
| 28 | % | 60 | % | 53 | % | $ | 23.0 | $ | 19.6 |
| 17 | % | 59 | % | 53 | % | |||||||||||
EBITDA margin (2) |
| 62.6 | % |
| 54.5 | % | * | * | * |
| 60.2 | % |
| 54.0 | % | * | * | * |
* | Not meaningful |
(1) | See footnote (1) to the table under “Financial Summary” above for a reconciliation of net income to EBITDA, and management’s reasons for using such non-GAAP measures. |
(2) | EBITDA margin represents EBITDA divided by revenues less cost of revenues. |
Revenues less cost of revenues increased $2.0 million for the three months ended June 30, 2024 compared to the three months ended June 30, 2023 primarily due to an increase in net transaction and clearing fees driven by a 12% increase in ADNV. For the three months ended June 30, 2024, operating income for the Global FX segment increased $4.2 million compared to the three months ended June 30, 2023 primarily due to a decrease in operating expenses, coupled with an increase in revenues less cost of revenues. Operating expenses decreased $2.2 million for the three
75
months ended June 30, 2024 compared to the three months ended June 30, 2023 primarily due to decreases in depreciation and amortization and technology support services.
Revenues less cost of revenues increased $1.9 million for the six months ended June 30, 2024 compared to the six months ended June 30, 2023 primarily due to an increase in net transaction and clearing fees driven by a 6% increase in ADNV, coupled with an increase in logical port fees. For the six months ended June 30, 2024, operating income for the Global FX segment increased $6.1 million compared to the six months ended June 30, 2023 primarily due to a decrease in operating expenses, coupled with an increase in revenues less cost of revenues. Operating expenses decreased $4.2 million for the six months ended June 30, 2024 compared to the six months ended June 30, 2023 primarily due to decreases in depreciation and amortization and technology support services.
Digital
The following summarizes revenues less cost of revenues, operating expenses, operating loss, EBITDA, and EBITDA margin for our Digital segment (in millions, except percentages):
Percentage |
| Percentage |
| ||||||||||||||||||||||||||||||
of Total |
| of Total |
| ||||||||||||||||||||||||||||||
Revenues |
| Revenues |
| ||||||||||||||||||||||||||||||
Three Months Ended | Three Months Ended |
| Six Months Ended | Six Months Ended |
| ||||||||||||||||||||||||||||
June 30, | Percent | June 30, |
| June 30, | Percent | June 30, |
| ||||||||||||||||||||||||||
| 2024 |
| 2023 |
| Change |
|
| 2024 |
|
| 2023 |
| 2024 |
|
| 2023 |
|
| Change |
|
| 2024 |
|
| 2023 |
| |||||||
Revenues less cost of revenues | $ | (0.1) | $ | (1.2) |
| 92 | % | (25) | % | * | % | $ | (1.0) | $ | (2.5) |
| 60 | % | 333 | % | * | % | |||||||||||
Operating expenses | 90.2 |
| 9.8 | * | % | * | % | * | % |
| 99.5 |
| 19.9 | * | % | * | % | * | % | ||||||||||||||
Operating loss | $ | (90.3) | $ | (11.0) |
| * | % | * | % | * | % | $ | (100.5) | $ | (22.4) |
| * | % | * | % | * | % | |||||||||||
EBITDA (1) | $ | (88.1) | $ | (9.1) |
| * | % | * | % | * | % | $ | (96.0) | $ | (18.7) |
| * | % | * | % | * | % | |||||||||||
EBITDA margin (2) |
| * | % |
| * | % | * | * | * |
| * | % |
| * | % | * | * | * |
* | Not meaningful |
(1) See footnote (1) to the table under “Financial Summary” above for a reconciliation of net income to EBITDA, and management’s reasons for using such non-GAAP measures.
(2) EBITDA margin represents EBITDA divided by revenues less cost of revenues.
Revenues less cost of revenues increased $1.1 million for the three months ended June 30, 2024 compared to the three months ended June 30, 2023 primarily due to an increase in net transaction and clearing fees driven by the reversal of $1.0 million of contra-revenue recorded as part of the syndication wind down. For the three months ended June 30, 2024, operating loss for the Digital segment increased $79.3 million compared to the three months ended June 30, 2023 primarily due to the impairment of intangible assets of $81.0 million related to the Cboe Digital spot market wind down in the three months ended June 30, 2024. Operating expenses increased $80.4 million for the three months ended June 30, 2024 compared to the three months ended June 30, 2023 due to the impairment of intangible assets.
Revenues less cost of revenues increased $1.5 million for the six months ended June 30, 2024 compared to the six months ended June 30, 2023 primarily due to an increase in net transaction and clearing fees driven by the reversal of $1.0 million of contra-revenue recorded as part of the syndication wind down, coupled with an increase in Digital spot ADNV. For the six months ended June 30, 2024, operating loss for the Digital segment increased $78.1 million compared to the six months ended June 30, 2023 primarily due to the impairment of intangible assets of $81.0 million related to the Cboe Digital spot market wind down. Operating expenses increased $79.6 million for the six months ended June 30, 2024 compared to the six months ended June 30, 2023 primarily due to the impairment of intangible assets.
76
Liquidity and Capital Resources
Below are charts that reflect elements of our capital allocation:
We expect our cash on hand at June 30, 2024 and other available resources, including cash generated from operations, to be sufficient to continue to meet our cash requirements for the foreseeable future. In the near term, we expect that our cash from operations and availability under the Revolving Credit Facility and potentially participating in future financing transactions to obtain additional capital will meet our cash needs to fund our operations, capital expenditures, interest payments on debt, any dividends, potential strategic acquisitions, and opportunities for common stock repurchases under the previously announced program. See Note 10 (“Debt”) of the condensed consolidated financial statements for further information.
Cboe Clear Europe also has a €1.20 billion committed syndicated multicurrency revolving and swingline credit facility agreement with Cboe Clear Europe as borrower and the Company as guarantor of scheduled interest and fees on borrowings (but not the principal amount of any borrowings) (the “Facility”). The Facility is available to be drawn by Cboe Clear Europe towards (a) financing unsettled amounts in connection with the settlement of transactions in securities and other items processed through Cboe Clear Europe’s clearing system and (b) financing any other liability or liquidity requirement of Cboe Clear Europe incurred in the operation of its clearing system. Borrowings under the Facility are secured by cash, eligible bonds and eligible equity assets deposited by Cboe Clear Europe into secured accounts. As a result, should the Facility be drawn by Cboe Clear Europe it could potentially impact Cboe Clear Europe’s liquidity, and we can give no assurance that this Facility will be sufficient to meet all of such obligations or sufficiently mitigate Cboe Clear Europe’s liquidity risk to meet its payment obligations when due. Additionally, a default of the Facility may allow lenders, under certain circumstances, to accelerate any related drawn amounts and may result in the acceleration of the Company’s other outstanding debt to which a cross-acceleration or cross-default provision applies, which may limit the Company’s liquidity, business and financing activities. The facility is expected to terminate on June 27, 2025 and we may not be able to enter into a replacement facility on commercially reasonable terms, or at all. Please refer to Note 10 ("Debt") for further information.
Our long-term cash needs will depend on many factors, including an introduction of new products, enhancements of current products, capital needs of our subsidiaries, the geographic mix of our business and any potential acquisitions. We believe our cash from operations and the availability under our Revolving Credit Facility will meet any long-term needs unless a significant acquisition or acquisitions are identified, in which case we expect that we would be able to borrow the necessary funds and/or issue additional shares of our common stock to complete such acquisition(s).
Cash and cash equivalents include cash in banks and all non-restricted, highly liquid investments, including short-term repurchase agreements, with original maturities of three months or less at the time of purchase. Cash and cash
77
equivalents as of June 30, 2024 increased $71.4 million from December 31, 2023 primarily due to inflows from the results of operations, partially offset by the increase in share repurchases, the increase in cash dividends, the change in accounts payable and accrued liabilities, the change in accounts receivable, the change in purchases of available-for-sale financial investments, and the increase in repurchases of common stock from employee stock plans. See “Cash Flow” below for further discussion.
Our cash and cash equivalents held outside of the United States in various foreign subsidiaries totaled $264.7 million as of June 30, 2024. The remaining balance was held in the United States and totaled $349.9 million as of June 30, 2024. The majority of cash held outside the United States is available for repatriation, but under current law, could subject us to additional United States income taxes, less applicable foreign tax credits.
Our financial investments include deferred compensation plan assets, as well as investments with original or acquired maturities longer than three months, but that mature in less than one year from the balance sheet date and are recorded at fair value. As of June 30, 2024 and December 31, 2023, financial investments primarily consisted of U.S. Treasury securities and deferred compensation plan assets.
Cash Flow
The following table summarizes our cash flow data for the six months ended June 30, 2024 and 2023, respectively (in millions):
Six Months Ended | ||||||
June 30, | ||||||
| 2024 |
| 2023 | |||
Net cash provided by operating activities | $ | 2,389.5 | $ | 527.7 | ||
Net cash used in investing activities |
| (50.4) |
| (42.8) | ||
Net cash used in financing activities |
| (346.2) |
| (348.7) | ||
Effect of foreign currency exchange rate changes on cash, cash equivalents, and restricted cash and cash equivalents |
| (41.4) |
| 20.3 | ||
Increase in cash, cash equivalents, and restricted cash and cash equivalents | $ | 1,951.5 | $ | 156.5 | ||
As of June 30, | ||||||
| 2024 |
| 2023 | |||
Reconciliation of cash, cash equivalents, and restricted cash and cash equivalents: | ||||||
Cash and cash equivalents | $ | 614.6 | $ | 413.6 | ||
Restricted cash and cash equivalents (included in margin deposits, clearing funds, and interoperability funds) | 2,723.8 | 699.6 | ||||
Restricted cash and cash equivalents (included in other current assets) | 5.2 | 4.0 | ||||
Customer bank deposits (included in margin deposits, clearing funds, and interoperability funds) | 5.0 | 19.2 | ||||
Total | $ | 3,348.6 | $ | 1,136.4 |
Net Cash Flows Provided by Operating Activities
During the six months ended June 30, 2024, net cash provided by operating activities was $2,039.6 million higher than net income. The variance is primarily attributable to the change in restricted cash and cash equivalents, driven by margin deposits, clearing funds, and interoperability funds related to Cboe Clear Europe of $1,923.2 million, impairment of intangible assets of $81.0 million, depreciation and amortization of $69.1 million, and Section 31 fees payable of $68.7 million, partially offset by the change in accounts payable and accrued liabilities of $113.3 million for the six months ended June 30, 2024.
Net cash flows provided by operating activities were $2,389.5 million and $527.7 million for the six months ended June 30, 2024 and 2023, respectively. The change in net cash flows provided by operating activities was primarily due to the change in restricted cash and cash equivalents and customer bank deposits driven by margin deposits, clearing funds, and interoperability funds related to Cboe Clear Europe, the change in Section 31 fees payable, the change in impairment of intangible assets, and the change in income taxes receivable, partially offset by the change in accounts
78
payable and accrued liabilities and the change in accounts receivable for the six months ended June 30, 2024 compared to the six months ended June 30, 2023.
Net Cash Flows Used in Investing Activities
Net cash flows used in investing activities were $50.4 million and $42.8 million for the six months ended June 30, 2024 and 2023, respectively. The variance is primarily due to the change in proceeds from maturities of available-for-sale financial investments, partially offset by the change in purchases of available-for-sale financial investments, and the change in contributions to investments for the six months ended June 30, 2024 compared to the six months ended June 30, 2023.
Net Cash Flows Used in Financing Activities
Net cash flows used in financing activities were $346.2 million and $348.7 million for the six months ended June 30, 2024 and 2023, respectively. The variance is primarily attributable to the decrease in principal payments of current portion of long-term debt, partially offset by the increase in purchases of common stock, the increase in repurchases of common stock from employee stock plans, and the increase in cash dividends on common stock for the six months ended June 30, 2024 compared to the six months ended June 30, 2023.
Financial Assets
The following summarizes our financial assets, excluding margin deposits, clearing funds, and interoperability funds as of June 30, 2024 and December 31, 2023 (in millions):
| June 30, | December 31, | ||||
2024 | 2023 | |||||
Cash and cash equivalents | $ | 614.6 | $ | 543.2 | ||
Financial investments |
| 83.7 |
| 57.5 | ||
Less deferred compensation plan assets | (36.6) | (36.7) | ||||
Less cash collected for Section 31 fees | (67.2) | (30.5) | ||||
Adjusted cash (1) | $ | 594.5 | $ | 533.5 |
(1) | Adjusted cash is a non-GAAP measure and represents cash and cash equivalents plus financial investments, minus deferred compensation plan assets and cash collected for Section 31 fees. We have presented adjusted cash because we consider it an important supplemental measure of our liquidity and believe that it is frequently used by analysts, investors and other interested parties in the evaluation of companies. |
Debt
The following summarizes our debt obligations as of June 30, 2024 and December 31, 2023 (in millions):
| June 30, | December 31, | ||||
2024 | 2023 | |||||
3.650% Senior Notes | $ | 650.0 | $ | 650.0 | ||
1.625% Senior Notes | 500.0 | 500.0 | ||||
3.000% Senior Notes | 300.0 | 300.0 | ||||
Revolving Credit Agreement | — | — | ||||
Cboe Clear Europe Credit Facility | — | — | ||||
Less unamortized discount and debt issuance costs | (9.9) | (10.8) | ||||
Total debt | $ | 1,440.1 | $ | 1,439.2 |
As of June 30, 2024 and December 31, 2023, the Company was in compliance with the covenants of our debt agreements.
In addition to the debt outstanding, as of June 30, 2024, we had an additional $400.0 million available through our revolving credit facility, with the ability to borrow another $200.0 million by increasing the commitments under the facility, subject to the agreement of the applicable lenders. Together with adjusted cash, we had approximately $1.0 billion available to fund our operations, capital expenditures, potential acquisitions, debt repayments and any dividends, net of
79
minimum regulatory capital requirements of $171.2 million as of June 30, 2024, which are subject to potential applicable regulatory restrictions and approvals and potential associated tax costs.
Dividends
The Company’s expectation is to continue to pay dividends. The decision to pay a dividend, however, remains within the discretion of the Company's Board of Directors and may be affected by various factors, including our earnings, financial condition, capital requirements, level of indebtedness and other considerations our Board of Directors deems relevant. Future debt obligations and statutory provisions, among other things, may limit, or in some cases prohibit, our ability to pay dividends.
Share Repurchase Program
In 2011, the Board of Directors approved an initial authorization for the Company to repurchase shares of its outstanding common stock of $100 million and subsequently approved additional authorizations for a total authorization of $1.8 billion. The program permits the Company to purchase shares through a variety of methods, including in the open market or through privately negotiated transactions, in accordance with applicable securities laws. It does not obligate the Company to make any repurchases at any specific time or situation. Share repurchases are repurchased to the Company’s Treasury stock and ultimately retired or they are available to be redistributed.
The Company repurchased 514,239 shares of its common stock under its share repurchase program during the three months ended June 30, 2024 at an average cost per share of $175.76, for a total value of $90.4 million. Since inception of the program through June 30, 2024, the Company has repurchased 20,614,013 shares of common stock at an average cost per share of $77.40, totaling $1.6 billion.
As of June 30, 2024, the Company had $204.4 million of availability remaining under its existing share repurchase authorizations.
Commercial Commitments and Contractual Obligations
As of June 30, 2024, our commercial commitments and contractual obligations included operating leases, data and telecommunications agreements, equipment leases, our long-term debt outstanding, contingent considerations, software development activities and other obligations. See Note 21 (“Commitments, Contingencies, and Guarantees”) to the condensed consolidated financial statements for a discussion of commitments and contingencies, Note 10 (“Debt”) for a discussion of the guarantees regarding outstanding debt, Note 12 (“Clearing Operations”) for information on Cboe Clear Europe and Cboe Digital’s clearinghouse exposure guarantees, and Note 22 (“Leases”) for discussion on operating leases and equipment leases.
Guarantees
We use Wedbush and Morgan Stanley to clear our routed equities transactions for our U.S. Equities exchanges. Wedbush and Morgan Stanley guarantee the trade until one day after the trade date, after which time the National Securities Clearing Corporation (“NSCC”) provides a guarantee. The BIDS Trading ATS platform delivers matched trades to BofA Securities, Inc. (“BOA”), which delivers the matched trades to the NSCC. BOA guarantees the trade until one day after the trade date, after which time the NSCC provides a guarantee. In the case of failure to perform on the part of Wedbush or Morgan Stanley on routed transactions for our U.S. Equities exchanges, we provide the guarantee to the counterparty to the trader. In the case of failure to perform on the part of BOA on transactions for the BIDS Trading ATS platform, BIDS has obligations to the counterparties to satisfy the trades. OCC acts as a central counterparty on all transactions in listed equity options in our Options segment, and as such, guarantees clearance and settlement of all of our options transactions. We believe that any potential requirement for us to make payments under these guarantees is remote and accordingly, have not recorded any liability in the condensed consolidated financial statements for these guarantees. Similarly, with respect to trades in U.S. listed equity options and futures occurring on Cboe Options, C2, BZX, EDGX, and CFE, we deliver matched trades of our customers to the OCC, which acts as a central counterparty on all transactions occurring on these exchanges and, as such, guarantees clearance and settlement of all of those matched options and futures trades. With respect to U.S. government securities transactions executed on Cboe Fixed Income, we use Mirae Asset Securities (USA) Inc. to deliver matched trades to the Fixed Income Clearing Corporation (FICC) Government Securities Division (GSD), which acts as a central counterparty on all transactions occurring on Cboe Fixed Income and, as such, guarantees clearance and settlement of all of those matched trades. With respect to Canadian equities, we deliver matched trades of our customers to The Canadian Depository for Securities, which acts as a central
80
counterparty on all transactions occurring on Cboe Canada Inc. and, as such, guarantees clearance and settlement of all of our matched Canadian equities trades. With respect to trades in options and futures occurring on Cboe Europe Derivatives, we deliver matched trades of our customers to Cboe Clear Europe, which acts as a central counterparty on all transactions occurring on Cboe Europe Derivatives and, as such, guarantees clearance and settlement of all of those matched options and futures trades. With respect to Australian equities and derivatives, we deliver matched trades of our customers to ASX Clear Pty Ltd and ASX Settlement Pty Ltd. ASX Clear Pty Ltd acts as a central counterparty on all transactions occurring on Cboe Australia and, as such, guarantees clearance and settlement on all of our matched trades in Australia. With respect to Japanese equities, we deliver matched trades of our customers to the Japanese Securities Clearing Corporation, which acts as a central counterparty on all transactions occurring on Cboe Japan and, as such, guarantees clearance and settlement on all of our matched trades in Japan. With respect to trades in digital assets occurring on Cboe Digital Exchange, we deliver matched trades of our customers to Cboe Clear Digital, which acts as a central counterparty on all transactions occurring on Cboe Digital Exchange and, as such, guarantees clearance and settlement of all of those matched spot and futures trades.
Critical Accounting Estimates
The preparation of condensed consolidated financial statements in conformity with U.S. GAAP requires our management to make estimates and assumptions that affect the reported amounts of assets and liabilities, disclosure of the amounts of contingent assets and liabilities at the date of the financial statements and the reported amounts of revenues and expenses during the reporting period. Actual results could differ materially from those estimates. On an ongoing basis, the Company evaluates its estimates, including those related to areas that require a significant level of judgment or are otherwise subject to an inherent degree of uncertainty. The Company bases its estimates on historical experience, observance of trends in particular areas, information available from outside sources and various other assumptions that are believed to be reasonable under the circumstances. Information from these sources form the basis for making judgments about the carrying values of assets and liabilities that may not be readily apparent from other sources.
In the six months ended June 30, 2024, there were no significant changes to our critical accounting estimates from those disclosed in the “Management’s Discussion and Analysis of Financial Condition and Results of Operations” in our 2023 Annual Report on Form 10-K, with the exception of Goodwill and Other Intangible Assets, as described below.
Goodwill and Other Intangible Assets
Description
Our various acquisitions, including the acquisition of Cboe Digital resulted in the recording of goodwill and other intangible assets. In accordance with ASC 350—Intangibles—Goodwill and Other, we test the carrying values of goodwill and indefinite-lived intangible assets for impairment at least annually, or more frequently when events or changes in circumstances signal indicators of impairment are present.
Judgments and Uncertainties
The estimated fair values of our reporting units are based on the market approach and the income approach (using discounted estimated future cash flows). The estimated fair values of indefinite-lived intangibles used the income approach. The estimated fair value of these intangibles are expected to be updated, with the exception of indefinite-lived intangibles recorded as a result of the Cboe Digital acquisition, which were valued using the cost approach. The discounted estimated future cash flow analysis requires judgments about the discount rate, forecasted revenue growth rate, and operating expenses, that are inherent in these fair value estimates over the estimated remaining operating period. Additionally, the analysis contains uncertainty surrounding future events. As such, actual results may differ from these estimates and lead to a revaluation of our goodwill and indefinite-lived intangible assets.
Effect if Actual Results Differ from Assumptions
If updated estimates indicate that the fair value of goodwill or any indefinite-lived intangibles is less than the carrying value of the asset, an impairment charge is expected to be recorded in the condensed consolidated statements of income in the period of the change in estimate, which could result in a material change to the condensed consolidated financial statements. However, due to the results of our impairment analyses completed in 2023, in which all reporting units estimated fair value exceeded their carrying value, we do not consider our goodwill and indefinite-lived intangibles to have
81
a significant risk of impairment, except as previously identified in our 2023 Annual Report on Form 10-K and as noted below.
Following the April 2024 announcement of the Cboe Digital spot market wind down and unwinding of the minority ownership structure in the holding company parent of the Cboe Digital entities, the Company performed an interim impairment test for the intangible assets recognized in the Digital reporting unit as the announcement was considered a potential indication of impairment. The Company concluded that the carrying value of the trading registrations and licenses and technology intangible assets exceeded their estimated fair value, as their projected future cash flows did not support its valuation and recorded an intangible assets impairment charge of $81.0 million in the condensed consolidated statements of income for the three and six months ended June 30, 2024.
Item 3. Quantitative and Qualitative Disclosures about Market Risk
As a result of our operating activities, we are exposed to market risks such as foreign currency exchange rate risk, equity risk, credit risk, interest rate risk, and liquidity risk. We have implemented policies and procedures to measure, manage and monitor and report risk exposures, which are reviewed regularly by management and our Board of Directors.
Foreign Currency Exchange Rate Risk
Our operations in Europe, Canada and Asia Pacific are subject to increased currency translation risk as revenues and expenses are denominated in foreign currencies, primarily the Euro, British pound, Canadian dollar, Australian dollar, and Japanese Yen. We also have de minimis exposure to other foreign currencies, including the Singapore dollar and Philippine Peso.
For the three and six months ended June 30, 2024, our primary exposure to foreign-denominated revenues less cost of revenues and expenses is presented by foreign currency in the following table (in millions, except percentages):
Three Months Ended | Six Months Ended | |||||||||||||||||||||||
June 30, 2024 | June 30, 2024 | |||||||||||||||||||||||
British | Canadian | British | Canadian | |||||||||||||||||||||
| Euros (1) | Pounds (1) |
| Dollars (1) |
| Euros (1) | Pounds (1) |
| Dollars (1) | |||||||||||||||
Foreign denominated % of: | ||||||||||||||||||||||||
Revenues less cost of revenues | 5.8 | % | 2.9 | % | 1.5 | % | 5.8 | % | 2.9 | % | 1.5 | % | ||||||||||||
Operating expenses | 6.0 | % | 6.5 | % | 3.1 | % | 6.7 | % | 7.6 | % | 3.8 | % | ||||||||||||
Impact of 10% adverse currency fluctuation on: | ||||||||||||||||||||||||
Revenues less cost of revenues | $ | 3.0 | $ | 1.5 | $ | 0.7 | $ | 5.9 | $ | 3.0 | $ | 1.5 | ||||||||||||
Operating expenses | 1.8 | 2.0 | 0.9 | 3.5 | 4.0 | 2.0 |
(1) | An average foreign exchange rate to the U.S. dollar for the period was used. See Item 2 (“Management’s Discussion and Analysis of Financial Condition and Results of Operations”) for the table summarizing the changes in certain operational and financial metrics for more information. |
Equity Risk
Our investment in European, Canadian, and Asia Pacific operations is exposed to volatility in currency exchange rates through translation of our net assets or equity to U.S. dollars. The assets and liabilities of our European businesses are denominated in British pounds or Euros. The assets and liabilities of our Canadian businesses are denominated in Canadian dollars. The assets and liabilities of our Asia Pacific businesses are denominated in Australian dollars, Japanese Yen, Singapore dollars, Hong Kong dollars, or Philippine Pesos. Fluctuations in currency exchange rates may create volatility in our reported results as we are required to translate foreign currency reported statements of financial condition and operational results into U.S. dollars for consolidated reporting. The translation of these non-U.S. dollar statements of financial condition into U.S. dollars for consolidated reporting results in a cumulative translation adjustment, which is recorded in accumulated other comprehensive loss, net within stockholders' equity on our condensed consolidated balance sheet.
82
Our primary exposure to this equity risk as of June 30, 2024 is presented by foreign currency in the following table (in millions):
British | Canadian | ||||||||
| Euros (1) | Pounds (1) | Dollars (1) | ||||||
Net equity investment in Cboe Europe Equities and Derivatives, Cboe Clear Europe, and Cboe Canada Inc. |
| $ | 204.2 | $ | 642.7 | $ | 523.8 | ||
Impact on consolidated equity of a 10% adverse currency fluctuation |
| 20.4 | 64.3 | 52.4 |
(1) | Converted to U.S. dollars using the foreign exchange rate of Euros per U.S. dollar, British pounds per U.S. dollar, and Canadian dollars per U.S. dollar, respectively, as of June 30, 2024. |
Credit Risk
We are exposed to credit risk from third parties, including customers, counterparties and clearing agents. These parties may default on their obligations due to bankruptcy, lack of liquidity, operational failure or other reasons. We limit our exposure to credit risk by considering such risk when selecting the counterparties with which we make investments and execute agreements.
We do not have counterparty credit risk with respect to trades matched on our exchanges in the U.S., Canada, and Europe. With respect to listed equities, we deliver matched trades of our customers to the NSCC without taking on counterparty risk for those trades. NSCC acts as a central counterparty on all equity transactions occurring on BZX, BYX, EDGX and EDGA and, as such, guarantees clearance and settlement of all of our matched equity trades. Similarly, with respect to U.S. listed equity options and futures, we deliver matched trades of our customers to the OCC, which acts as a central counterparty on all transactions occurring on Cboe Options, C2, BZX, EDGX and CFE and, as such, guarantees clearance and settlement of all of our matched options and futures trades. With respect to U.S. government securities transactions, we deliver matched trades to FICC’s GSD without taking on counterparty risk for those trades. FICC GSD acts as a central counterparty on all U.S. government securities transactions occurring on Cboe Fixed Income and, as such, guarantees clearance and settlement of all of those matched trades. With respect to Canadian equities, we deliver matched trades of our customers to The Canadian Depository for Securities, which acts as a central counterparty on all transactions occurring on Cboe Canada Inc. and, as such, guarantees clearance and settlement of all of our matched Canadian equities trades. The BIDS Trading ATS platform delivers matched trades to BOA, which delivers the matched trades to the NSCC. BOA guarantees the trade until one day after the trade date, after which time the NSCC provides a guarantee. Thus, BIDS Trading is potentially exposed to credit risk to the counterparty between the trade date and one day after the trade date in the event BOA fails. With respect to Australian equities and derivatives, we deliver matched trades of our customers to ASX Clear Pty Ltd and ASX Settlement Pty Ltd. ASX Clear Pty Ltd acts as a central counterparty on all transactions occurring on Cboe Australia and, as such, guarantees clearance and settlement on all of our matched trades in Australia. With respect to Japanese equities, we deliver matched trades of our customers to the Japanese Securities Clearing Corporation, which acts as a central counterparty on all transactions occurring on Cboe Japan and, as such, guarantees clearance and settlement on all of our matched trades in Japan.
With respect to orders Cboe Trading routes to other markets for execution on behalf of our customers, Cboe Trading is exposed to some counterparty credit risk in the case of failure to perform on the part of our clearing firms, Morgan Stanley or Wedbush. Morgan Stanley and Wedbush guarantee trades until one day after the trade date, after which time NSCC provides a guarantee. The BIDS Trading ATS platform delivers matched trades to BOA, which delivers the matched trades to the NSCC. Thus, Cboe Trading is potentially exposed to credit risk to the counterparty to a trade routed to another market center between the trade date and one day after the trade date in the event that Morgan Stanley or Wedbush fails. The BIDS Trading ATS platform is potentially exposed to counterparty credit risk on equities trades between the trade date and one day after the trade date in the event that BOA fails. We believe that any potential requirement for us to make payments under these guarantees is remote and accordingly, have not recorded any liability in the condensed consolidated financial statements for these guarantees.
Historically, we have not incurred any liability due to a customer’s failure to satisfy its contractual obligations as counterparty to a system trade. Credit difficulties or insolvency, or the perceived possibility of credit difficulties or insolvency, of one or more larger or more visible market participants could also result in market-wide credit difficulties or other market disruptions.
We do not have counterparty credit risk with respect to institutional spot FX trades occurring on our platform because Cboe FX is not a counterparty to any FX transactions. All transactions occurring on our platform occur bilaterally between two banks or prime brokers as counterparties to the trade. While Cboe FX does not have direct counterparty risk, Cboe
83
FX may suffer a decrease in transaction volume if a bank or prime broker experiences an event that causes other prime brokers to decrease or revoke the credit available to the prime broker experiencing the event. Therefore, Cboe FX may have risk that is related to the credit of the banks and prime brokers that trade FX on the Cboe FX platform.
We also have credit risk related to transaction fees that are billed in arrears to customers on a monthly basis. Our potential exposure to credit losses on these transactions is represented by the receivable balances in our balance sheet. Our customers are financial institutions whose ability to satisfy their contractual obligations may be impacted by volatile securities markets.
The Company is exposed to further credit and investment risk through our clearing operations. Cboe Clear Europe holds material amounts of clearing participant collateral, both cash and non-cash deposits, which are held or invested primarily to provide security of capital while minimizing credit risk as well as liquidity and market risks. Cboe Digital holds amounts of clearing participant collateral including cash and digital assets, which are held primarily to provide security of capital while minimizing credit risk as well as custody, valuation and market risks. The following is a summary of the risks associated with these deposits and how these risks are mitigated:
● | Credit Risk - The credit risk is predominantly in the event a clearing participant fails to meet a financial or contractual obligation and related to custodians and settlement banks. Cboe Clear Europe attempts to mitigate this risk through minimum participant requirements for clearing participants and monitoring their financial health. To cover potential loss to Cboe Clear Europe in the event of a clearing participant default, collateral is required from clearing participants. Besides potential defaults of clearing participants, the main credit risk faced by the clearinghouse is exposure to clearing participants when a trade fails to settle. To help mitigate this risk, a fail fee is charged to discourage late settlements. This fee covers Cboe Clear Europe’s costs but also acts as a deterrent as required by applicable settlement efficiency regulation. Cboe Clear Digital sets minimum financial requirements on custodian institutions and any clearing member that may expose the clearinghouse to credit risk. The financial strength of custodians and such clearing members are monitored routinely. Furthermore, Cboe Digital requires clearing members to post collateral (full or margined, depending on the product eligible for clearing) or other forms of financial guarantee and their trading activities are subject to pre-trade checks enforced by Cboe Digital Exchange and administered by Cboe Clear Digital. On June 5, 2023, the CFTC approved an amended order of registration for Cboe Clear Digital to clear digital asset futures on a margined basis for futures commission merchants. The new products launched January 11, 2024. As of June 30, 2024, Cboe Digital does not expect a material loss concerning credit risk on any member participant, custodian, or settlement bank. |
● | Liquidity Risk - Liquidity risk is the risk Cboe Clear Europe may not be able to meet its payment obligations in the right currency, in the right place and at the right time. To help mitigate this risk, Cboe Clear Europe monitors its liquidity requirements closely and maintains funds and assets in a manner which attempt to minimize the risk of loss or delay in the access by the clearinghouse to such funds and assets. For example, holding funds with a central bank where possible or making only short-term investments serves to help reduce liquidity risks. Liquidity is mainly required for securities settlement. The payment and settlement obligations generally stem from the function of Cboe Clear Europe as a cash equity clearinghouse: shares are bought and sold by clearing participants on a trading platform or OTC, and netted to settle two days later. During the settlement the actual payment for and delivery of the shares take place, this process requires intraday liquidity. If counterparties, which receive shares against payment, are unable to settle, an overnight liquidity need arises. The overnight liquidity is typically very short term, and is usually limited to a few days. Cboe Clear Digital monitors its liquidity requirements closely and maintains funds and assets in a manner which attempt to minimize the risk of loss or delay in the access by the clearinghouse to such funds and assets. For example, only allowing highly liquid USD denominated assets to be posted as collateral. Cboe Clear Digital may not be able to meet its payment obligations in a timely manner in the event of delay in payment or default by a clearing member. |
Cboe Clear Europe entered into a €1.20 billion committed syndicated multicurrency revolving and swingline credit facility that is available to be drawn by Cboe Clear Europe towards (a) financing unsettled amounts in connection with the settlement of transactions in securities and other items processed through Cboe Clear Europe’s clearing system and (b) financing any other liability or liquidity requirement of Cboe Clear Europe incurred in the operation of its clearing system, however we can give no assurance that this facility will be sufficient to meet all such obligations or sufficiently mitigate Cboe Clear Europe’s liquidity risk to meet its payment obligations when due.
● | Custody Risk – Cboe Digital holds customer digital clearing assets through accounts with third-party custodians and, in the case of hot and warm wallets, through self-custody. Cboe Digital’s custody strategy is designed to |
84
maximize liquidity and efficient access to assets by making those assets readily available. Cboe Digital monitors its cash and the digital asset balances it maintains with custodians. Digital assets require control of one or more unique public and private keys relating to the local or online digital wallet in which the digital assets are held. The networks require one or more private keys relating to a digital wallet to authorize a spending transaction. If private keys are lost or destroyed, this could prevent the ability to transfer the corresponding digital asset. Security breaches, computer malware, and computer hacking attacks have been a prevalent concern in digital asset markets. Cboe Digital has committed to securely store digital assets it holds on behalf of users. As such, Cboe Digital may be liable to its users for losses arising from theft or loss of user private keys. Cboe Digital has no reason to believe it will incur any expense associated with such potential liability because (i) it has no known or historical experience of claims to use as a basis of measurement, (ii) it accounts for and continually verifies the amount of digital assets within its control, and (iii) it has established security around custodial private keys to minimize the risk of theft or loss. |
● | Valuation Risk - Cboe Digital is exposed to risk with respect to digital asset prices and valuations which are largely based on the supply and demand for those digital assets in financial markets. Cboe Digital’s valuation governance framework includes numerous controls and other procedural safeguards that are intended to maximize the quality of fair value measurements. New products and valuation techniques are reviewed and approved by senior management. Cboe Digital’s valuation process for digital assets are fair value estimates that are also validated by the finance control function independently. Independent price verification is performed by finance control through benchmarking fair value estimates with observable market prices or other independent sources. Reasonably designed controls and governance framework are in place and are intended to help ensure quality third-party pricing sources were used. |
● | Market Risk – Cboe Clear Europe is also exposed to market risk in the event that a clearing participant defaults and the market prices of the securities in its open positions have moved adversely so the clearinghouse can only close out the participant’s obligations at a loss. To help mitigate market risk, Cboe Clear Europe collects collateral on an end of day and intraday basis from clearing participants to cover for the probable loss during normal market conditions, together with contributions to the clearing fund to cover losses if a default occurred during extreme but plausible market conditions. Adverse movements in exchange rates affecting the value of obligations and collateral are factored into the calculation of the amount of collateral to be collected. To help ensure an orderly market, Cboe Digital maintains digital assets to support its clearing operations which may be subject to significant changes in value and therefore exposed to market risk with the fluctuation in market prices. Cboe Digital monitors this risk on a daily, weekly and monthly basis. The business model is such that Cboe Digital earns digital assets and at times may accumulate positions that are subject to market risk. Customer positions do have market risk based on daily activity and settlement prices. Cboe Clear Digital is also exposed to market risk in the event that a clearing participant defaults and the market prices of the securities in its open positions have moved adversely so the clearinghouse can only close out the participant’s obligations at a loss or the clearing participant has already realized trading losses in excess of the collateral at the time of default or the combination of the two. Cboe Clear Digital collects collateral on an end of day and intraday basis from clearing participants that are clearing margin eligible futures contracts. Cboe Clear Digital only allows collateral in USD at this time. Cboe Clear Digital maintains pre-funded resources to cover probable losses during normal market conditions due to default of clearing participants. Cboe Clear Digital clearing members clearing spot digital assets mostly operate on a fully funded basis. Cboe Clear Digital may allow certain well-qualified members to trade in the spot market without fully funding their accounts. Cboe Clear Digital collects collateral from such members to cover probable losses under extreme but plausible market conditions as determined by Cboe Clear Digital. The adequacy of such collateral is routinely reviewed. |
● | Investment Risk – Cboe Clear Europe as of June 30, 2024 held $2,723.8 million of clearing member margin deposits, clearing funds, and interoperability funds which are held or invested primarily to provide security of capital while minimizing credit, market and liquidity risks. Effective August 14, 2023, Cboe Clear Europe enacted changes in its rules, and is able to invest the cash collateral received in the form of interoperability fund deposits from clearing participants in certain investments, typically securities issued by pre-approved sovereign issuers and reverse repurchase agreements with overnight maturities. When investments are made in accordance with the policy, Cboe Clear Europe receives the amount of investment earnings and pays the clearing participants those earnings minus a set basis point cost of collateral. Cboe Clear Europe is able to direct the investment of the cash interoperability fund deposits received from the clearing participants within the program parameters and receive an economic benefit from those investments. See Note 12 (“Clearing Operations”) for more information. In the event that a sovereign government or reverse repurchase agreement counterparty defaults, the value we hold as collateral might not be sufficient to cover our capital requirements in the event of defaults. While Cboe Clear Europe seeks to achieve a reasonable rate of return which may generate interest income for clearing |
85
participants, Cboe Clear Europe is primarily concerned with preservation of capital and managing the risks associated with these deposits. As Cboe Clear Europe passes on interest revenues (minus costs) to the clearing members, this could include negative or reduced yield due to market conditions. While Cboe Clear Europe has policies and procedures that strive to help ensure that clearing participant collateral is protected, Cboe Clear Europe cannot absolutely assure that these measures and safeguards will be sufficient to protect margin deposits, clearing funds, and interoperability funds from a default or that we will not be materially and adversely affected in the event of a significant default. |
On a regular basis, we review and evaluate changes in the status of our counterparties’ creditworthiness. Credit losses such as those described above could adversely affect our condensed consolidated financial position and results of operations. Any such effects to date have been minimal.
Interest Rate Risk
We have exposure to market risk for changes in interest rates relating to our cash and cash equivalents, financial investments, and indebtedness. As of June 30, 2024 and 2023, our cash and cash equivalents and financial investments were $698.3 million and $517.3 million, respectively, of which $264.7 million and $227.2 million is held outside of the United States in various foreign subsidiaries in 2024 and 2023, respectively. The remaining cash and cash equivalents and financial investments are denominated in U.S. dollars. We do not use our investment portfolio for trading or other speculative purposes. Due to the nature of these investments, we have not been exposed to, nor do we anticipate being exposed to, material risks due to changes in interest rates, assuming no change in the amount or composition of our cash and cash equivalents and financial investments.
As of June 30, 2024, we had $1,440.1 million in outstanding debt, all of which relates to our Senior Notes, which bear interest at fixed interest rates. Changes in interest rates will have no impact on the interest we pay on fixed-rate obligations. We are also exposed to changes in interest rates as a result of borrowings under our Revolving Credit Agreement and the Cboe Clear Europe Credit Facility, as these facilities bear interest at fluctuating rates. As of June 30, 2024, there were no outstanding borrowings under our Revolving Credit Agreement or Cboe Clear Europe Credit Facility, respectively. See Note 10 (“Debt”) to the condensed consolidated financial statements for a discussion of debt agreements.
Liquidity Risk
We are exposed to liquidity risk under certain circumstances in relation to the cross-acceleration and cross-default provisions within the Revolving Credit Agreement as a result of the Company, as guarantor, entering into the Cboe Clear Europe Credit Facility. A default of the Facility may allow lenders to accelerate any related drawn amounts and may result in the acceleration of the Company’s other outstanding debt to which a cross-acceleration or cross-default provision applies, which may limit the Company’s liquidity, business and financing activities. See Note 10 (“Debt”) to the condensed consolidated financial statements for a discussion of debt agreements.
Item 4. Controls and Procedures
86
PART II—OTHER INFORMATION
Item 1. Legal Proceedings.
Cboe incorporates herein by reference the discussion set forth in Note 21 (“Commitments, Contingencies, and Guarantees”) of the condensed consolidated financial statements included herein.
Item 1A. Risk Factors.
There have been no material updates during the period covered by this Form 10-Q to the Risk Factors as set forth in Item 1A. of our Annual Report on Form 10-K for the year ended December 31, 2023, and Quarterly Report on Form 10-Q for the quarter ended March 31, 2024. These risks and uncertainties, however, are not the only risks and uncertainties that we face. Additional risks and uncertainties not currently known to us or that we currently deem to be immaterial may also significantly impact us. Any risks and uncertainties may materially and adversely affect our business, financial condition or results of operations, liquidity and cash flows.
Item 2. Unregistered Sales of Equity Securities and Use of Proceeds.
Share repurchase program
In 2011, the Board of Directors approved an initial authorization for the Company to repurchase shares of its outstanding common stock of $100 million and subsequently approved additional authorizations for a total authorization of $1.8 billion. The program permits the Company to purchase shares, through a variety of methods, including in the open market or through privately negotiated transactions, in accordance with applicable securities laws. It does not obligate the Company to make any repurchases at any specific time or situation. The Company repurchased 514,239 shares of its common stock under its share repurchase program during the three months ended June 30, 2024 at an average cost per share of $175.76, for a total value of $90.4 million and had $204.4 million of availability remaining under its existing share repurchase authorizations as of June 30, 2024.
The table below shows the purchases of equity securities by the Company which settled during the three months ended June 30, 2024, reflecting the purchase of common stock under the Company's share repurchase program:
Total Number of | Approximate Dollar | |||||||||
Shares Purchased | Value of Shares that May | |||||||||
as Part of Publicly | Yet Be Purchased Under | |||||||||
Total Number of | Average Price | Announced Plans | the Plans or Programs | |||||||
Period |
| Shares Purchased |
| Paid per Share |
| or Programs |
| (in millions) | ||
April 1 to April 30, 2024 | 152,383 | $ | 179.54 | 152,383 | $ | 267.4 | ||||
May 1 to May 31, 2024 | 125,191 | 180.81 | 125,191 | 244.8 | ||||||
June 1 to June 30, 2024 | 236,665 | 170.65 | 236,665 | 204.4 | ||||||
Total | 514,239 | $ | 175.76 | 514,239 |
Purchase of common stock from employees
The table below reflects the acquisition of common stock by the Company in the three months ended June 30, 2024 that were not part of the publicly announced share repurchase authorization. These shares consisted of shares retained to cover payroll withholding taxes in connection with the vesting of restricted stock unit awards and performance share awards.
Period |
| Total Number of Shares Purchased |
| Average Price Paid per Share | |
April 1 to April 30, 2024 | 5,565 | $ | 182.51 | ||
May 1 to May 31, 2024 | 3,340 | 182.88 | |||
June 1 to June 30, 2024 | 168 | 180.74 | |||
Total | 9,073 | $ | 182.61 |
Use of proceeds
None.
87
Item 3. Defaults upon Senior Securities.
None.
Item 4. Mine Safety Disclosures.
Not applicable.
Item 5. Other Information.
Securities Trading Plans of Executive Officers and Directors
During the period from March 31, 2024, to June 30, 2024, our executive officers and directors adopted or terminated contracts, instructions or written plans for the purchase or sale of our securities as noted below:
Name and Title | Date of Adoption | Scheduled | Aggregate Number of Securities | |||
Sale of up to |
(1) | The trading plan may also expire on such earlier date as all transactions under the trading plan are completed. |
(2) | Intended to satisfy the affirmative defense of Rule (c). |
88
Item 6. Exhibits.
Exhibit No. |
| Description |
10.1 | ||
10.2 | ||
31.1 | Certification of Chief Executive Officer pursuant to Rule 13a-14 (Filed herewith). | |
31.2 | Certification of Chief Financial Officer pursuant to Rule 13a-14 (Filed herewith). | |
32.1 | ||
32.2 | ||
101.INS | XBRL Instance Document (Filed herewith). — The instance document does not appear in the Interactive Data File because its XBRL tags are embedded within the Inline XBRL document. | |
101.SCH | XBRL Taxonomy Extension Schema Document (Filed herewith). | |
101.CAL | XBRL Taxonomy Extension Calculation Linkbase Document (Filed herewith). | |
101.DEF | XBRL Taxonomy Extension Definition Linkbase (Filed herewith). | |
101.LAB | XBRL Taxonomy Extension Label Linkbase Document (Filed herewith). | |
101.PRE | XBRL Taxonomy Extension Presentation Linkbase Document (Filed herewith). | |
104 | Cover Page Interactive Data File (embedded as Inline XBRL document). |
+ Certain confidential portions (as indicated therein) of this exhibit have been omitted.
89
SIGNATURES
Pursuant to the requirements of the Securities Exchange Act of 1934, the registrant has duly caused this report to be signed on its behalf by the undersigned, thereunto duly authorized.
CBOE GLOBAL MARKETS, INC. | ||
Registrant | ||
By: | /s/ Fredric J. Tomczyk | |
Fredric J. Tomczyk | ||
Chief Executive Officer | ||
Date: August 2, 2024 | ||
By: | /s/ Jill M. Griebenow | |
Jill M. Griebenow | ||
Executive Vice President, Chief Financial Officer | ||
Date: August 2, 2024 |
90