Item 2. Management’s Discussion and Analysis of Financial Condition and Results of Operations
The following discussion should be read in conjunction with the accompanying unaudited condensed consolidated financial statements and the notes thereto, included in Item 1 in this Quarterly Report on Form 10-Q, and the audited consolidated financial statements in the Company’s Annual Report on Form 10-K for the year ended December 31, 2023, and as contained in that report, the information under the heading “Management’s Discussion and Analysis of Financial Condition and Results of Operations.” This discussion contains forward-looking information. Please see “Forward-Looking Statements” for a discussion of the uncertainties, risks and assumptions associated with these statements.
Overview
Cboe Global Markets, Inc., the world’s leading derivatives and securities exchange network, delivers cutting-edge trading, clearing and investment solutions to people around the world. Cboe provides trading solutions and products in multiple asset classes, including equities, derivatives, FX, and digital assets, across North America, Europe, and Asia Pacific. Above all, the Company is committed to building a trusted, inclusive global marketplace that enables people to pursue a sustainable financial future.
Cboe’s subsidiaries include the largest options exchange and the third largest stock exchange operator in the U.S. In addition, the Company operates Cboe Europe, one of the largest stock exchanges by value traded in Europe, and owns Cboe Clear Europe, a leading pan-European equities and derivatives clearinghouse, BIDS Holdings, which owns a leading block-trading ATS by volume in the U.S., and provides block-trading services with Cboe market operators in Europe, Canada, Australia, and Japan, Cboe Australia, an operator of trading venues in Australia, Cboe Japan, an operator of trading venues in Japan, Cboe Digital, an operator of a U.S. based digital asset spot market and a regulated futures exchange, Cboe Clear Digital, an operator of a regulated clearinghouse, and Cboe Canada Inc., a recognized Canadian securities exchange. Cboe subsidiaries also serve collectively as a leading market globally for exchange-traded products (“ETPs”) listings and trading.
The Company is headquartered in Chicago with offices in Amsterdam, Belfast, Hong Kong, Kansas City, London, Manila, New York, San Francisco, Sarasota Springs, Singapore, Sydney, Tokyo, and Toronto.
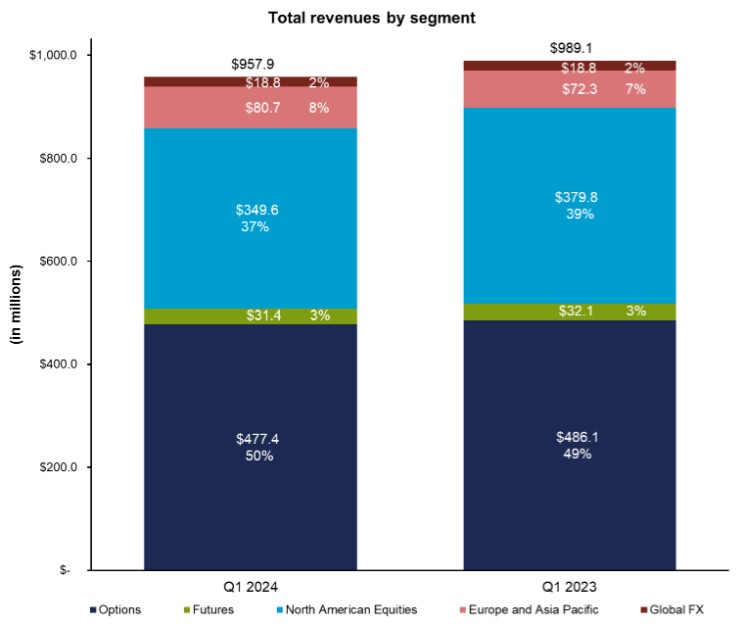
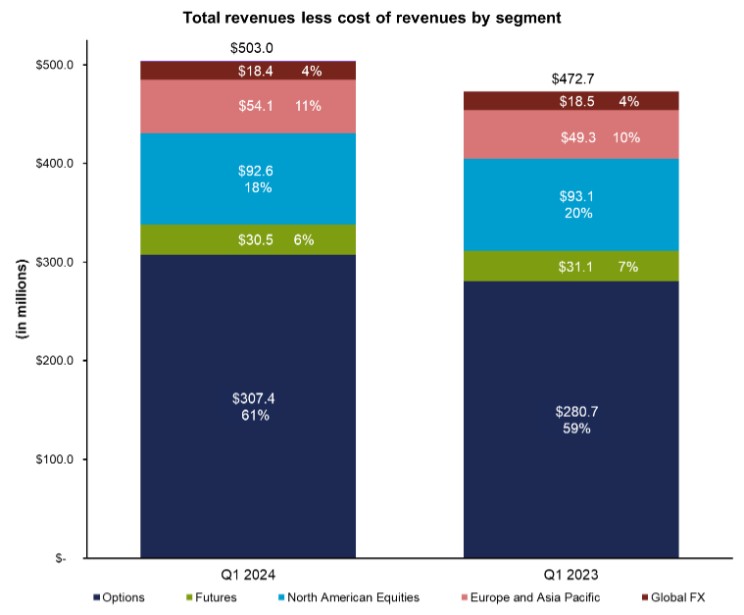
Business Segments
The Company operates six reportable business segments: Options, North American Equities, Europe and Asia Pacific, Futures, Global FX, and Digital, which is reflective of how the Company's chief operating decision-maker reviews and operates the business, as discussed in Note 1 (“Organization and Basis of Presentation”). Segment performance is primarily evaluated based on operating income (loss). The Company’s chief operating decision-maker does not use segment-level assets or income and expenses below operating income (loss) as key performance metrics; therefore, such information is not presented below. The Company has aggregated all of its corporate costs, as well as other business ventures, within the Corporate Items and Eliminations totals based on the decision that those activities should not be used to evaluate the operating performance of the segments; however, operating expenses that relate to activities of a specific segment have been allocated to that segment.
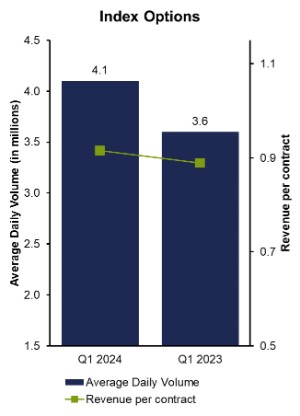
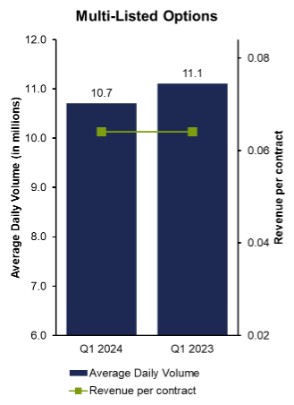
Options. The Options segment includes options on market indices (“index options”), as well as on the stocks of individual corporations (“equity options”) and on ETPs such as exchange-traded funds (“ETFs”) and exchange-traded notes (“ETNs”), which are “multi-listed” options and listed on a non-exclusive basis. These options are eligible to trade, as applicable, on Cboe Options, C2, BZX, EDGX, and/or other U.S. national security exchanges. Cboe Options is the Company’s primary options market and offers trading in listed options through a single system that integrates electronic trading and traditional open outcry trading on the Cboe Options trading floor in Chicago. C2 Options, BZX Options, and EDGX Options are all-electronic options exchanges, and typically operate with different market models and fee structures than Cboe Options. The Options segment also includes applicable market data fees revenues generated from the consolidated tape plans, the licensing of proprietary options market data, index licensing, routing services, and access and capacity services.
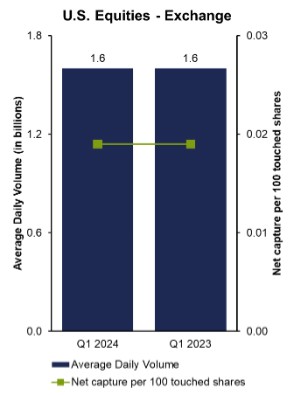
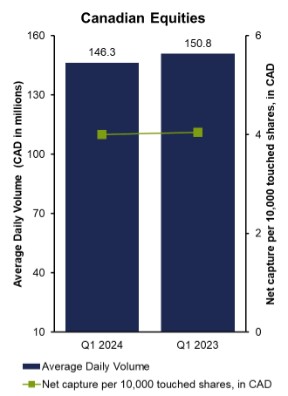
North American Equities. The North American Equities segment includes U.S. equities and ETP transaction services that occur on fully electronic exchanges owned and operated by BZX, BYX, EDGX, and EDGA, equities transactions that occur on the BIDS Trading platform in the U.S. and Canada, and Canadian equities and other transaction services that occur on or through Cboe Canada Inc.’s order books. The North American Equities segment also includes listing services on Cboe Canada Inc., corporate and ETP listings on BZX, applicable market data fees revenues