UNITED STATES
SECURITIES AND EXCHANGE COMMISSION
Washington, D.C. 20549
___________________
FORM 10-K
___________________
ý | ANNUAL REPORT PURSUANT TO SECTION 13 OR 15(d) OF THE SECURITIES EXCHANGE ACT OF 1934 |
For the fiscal year ended December 31, 2017
¨ | TRANSITION REPORT PURSUANT TO SECTION 13 OR 15 (d) OF THE SECURITIES EXCHANGE ACT OF 1934 |
Commission file number: 001-33530
Green Brick Partners, Inc. |
(Exact name of registrant as specified in its charter)
Delaware | 20-5952523 | |
(State or other jurisdiction of incorporation) | (IRS Employer Identification Number) | |
2805 Dallas Pkwy, Ste 400 Plano, Texas 75093 | (469) 573-6755 | |
(Address of principal executive offices, including Zip Code) | (Registrant’s telephone number, including area code) | |
Securities registered pursuant to Section 12(b) of the Act:
Title of Each Class | Name of Each Exchange on Which Registered | |
Common Stock, par value $0.01 per share | The Nasdaq Stock Market LLC | |
Preferred Stock Purchase Rights | The Nasdaq Stock Market LLC | |
Securities registered pursuant to Section 12(g) of the Act: None
Indicate by check mark if the registrant is a well-known seasoned issuer, as defined in Rule 405 of the Securities Act. Yes ¨ No ý
Indicate by check mark if the registrant is not required to file reports pursuant to Section 13 or Section 15(d) of the Exchange Act. Yes ¨ No ý
Indicate by check mark whether the registrant (1) has filed all reports required to be filed by Section 13 or 15(d) of the Securities Exchange Act of 1934 during the preceding 12 months (or for such shorter period that the registrant was required to file such reports), and (2) has been subject to such filing requirements for the past 90 days. Yes ý No ¨
Indicate by check mark whether the registrant has submitted electronically and posted on its corporate Web site, if any, every Interactive Data File required to be submitted and posted pursuant to Rule 405 of Regulation S-T (§232.405 of this chapter) during the preceding 12 months (or for such shorter period that the registrant was required to submit and post such files).Yes ý No ¨
Indicate by check mark if disclosure of delinquent filers pursuant to Item 405 of Regulation S-K (§229.405 of this chapter) is not contained herein, and will not be contained, to the best of registrant’s knowledge, in definitive proxy or information statements incorporated by reference in Part III of this Form 10-K or any amendment to this Form 10-K. ý
Indicate by check mark whether the registrant is a large accelerated filer, an accelerated filer, a non-accelerated filer, or a smaller reporting company. See definitions of “large accelerated filer,” “accelerated filer,” and “smaller reporting company” in Rule 12b-2 of the Exchange Act. (Check one):
Large accelerated filer ¨ Accelerated filer ý Non-accelerated filer ¨ Smaller reporting company ¨
Indicate by check mark whether the registrant is a shell company (as defined in Rule 12b-2 of the Act). Yes ¨ No ý
The aggregate market value of voting stock held by non-affiliates of the Registrant was $261,560,754 as of June 30, 2017 (based upon the closing sale price on The Nasdaq Capital Market for such date). For this purpose, all shares held by directors, executive officers and stockholders beneficially owning ten percent or more of the registrant’s common stock have been treated as held by affiliates. This determination of affiliate status is not necessarily a conclusive determination for other purposes.
The number of shares of the Registrant’s common stock outstanding as of March 7, 2018 was 50,598,901.
DOCUMENTS INCORPORATED BY REFERENCE
None.
TABLE OF CONTENTS
Item 1. | |||
Item 1A. | |||
Item 1B. | |||
Item 2. | |||
Item 3. | |||
Item 4. | |||
Item 5. | |||
Item 6. | |||
Item 7. | |||
Item 7A. | |||
Item 8. | |||
Item 9. | |||
Item 9A. | |||
Item 9B. | |||
Item 10. | |||
Item 11. | |||
Item 12. | |||
Item 13. | |||
Item 14. | |||
Item 15. | |||
FORWARD-LOOKING STATEMENTS
This Annual Report on Form 10-K includes statements and information that may constitute forward-looking statements within the meaning of Section 27A of the Securities Act of 1933, as amended, which we refer to as the “Securities Act,” and Section 21E of the Securities Exchange Act of 1934, as amended, which we refer to as the “Exchange Act.” Statements that are “forward-looking statements,” include any projections of earnings, revenue or other financial items, any statements of the plans, strategies or objectives of management for future operations, any statements concerning proposed new projects or other developments, any statements regarding future economic conditions or performance, any statements of management’s beliefs, goals, strategies, intentions and objectives, any statements concerning potential acquisitions, and any statements of assumptions underlying any of the foregoing. Words such as “may,” “will,” “should,” “could,” “would,” “predicts,” “potential,” “continue,” “expects,” “anticipates,” “future,” “outlook,” “strategy,” “positioned,” “intends,” “plans,” “believes,” “projects,” “estimates” and similar expressions, as well as statements in the future tense, identify forward-looking statements.
These statements are necessarily subjective and involve known and unknown risks, uncertainties and other important factors that could cause our actual results, performance or achievements, or industry results, to differ materially from any future results, performance or achievements described in or implied by such statements. Actual results may differ materially from expected results described in our forward-looking statements, including with respect to correct measurement and identification of factors affecting our business or the extent of their likely impact, the accuracy and completeness of the publicly available information with respect to the factors upon which our business strategy is based or the success of our business. In addition, even if results are consistent with the forward-looking statements contained in this Annual Report on Form 10-K, those results may not be indicative of results or developments in subsequent periods. Furthermore, industry forecasts are likely to be inaccurate, especially over long periods of time and in industries particularly sensitive to market conditions such as homebuilding and builder finance.
Forward-looking statements should not be read as a guarantee of future performance or results, and will not necessarily be accurate indications of whether, or the times by which, our performance or results may be achieved. Forward-looking statements are based on information available at the time those statements are made and management’s belief as of that time with respect to future events, and are subject to risks and uncertainties that could cause actual performance or results to differ materially from those expressed in or suggested by the forward-looking statements. Important factors that could cause such differences include, but are not limited to:
• | cyclicality in the homebuilding industry and adverse changes in general economic conditions; |
• | fluctuations and cycles in value of, and demand for, real estate investments; |
• | significant inflation or deflation; |
• | the unavailability of subcontractors; |
• | labor and raw material shortages and price fluctuations; |
• | the failure to recruit, retain and develop highly skilled and competent employees; |
• | an inability to acquire undeveloped land, partially-finished developed lots and finished lots suitable for residential homebuilding at reasonable prices; |
• | an inability to develop communities successfully or within expected timeframes; |
• | an inability to sell properties in response to changing economic, financial and investment conditions; |
• | risks related to participating in the homebuilding business through controlled homebuilding subsidiaries; |
• | risks relating to buy-sell provisions in the operating agreements governing two builder subsidiaries; |
• | risks related to geographic concentration; |
• | risks related to government regulation; |
• | the interpretation of or changes to tax, labor and environmental laws; |
• | the timing of receipt of regulatory approvals and of the opening of projects; |
• | fluctuations in the market value of land, building lots and housing inventories; |
• | volatility of mortgage interest rates; |
• | the unavailability of mortgage financing; |
• | the number of foreclosures in our markets; |
• | interest rate increases or adverse changes in federal lending programs; |
• | increases in unemployment or underemployment; |
• | any limitation on, or reduction or elimination of, tax benefits associated with owning a home; |
• | the occurrence of severe weather or natural disasters; |
• | high cancellation rates; |
• | competition in the homebuilding, land development and financial services industries; |
• | risks related to future growth through strategic investments, joint ventures, partnerships and/or acquisitions; |
• | risks related to holding noncontrolling interests in strategic investments, joint ventures, partnerships and/or acquisitions; |
• | the inability to obtain suitable bonding for the development of housing projects; |
• | difficulty in obtaining sufficient capital; |
• | risks related to environmental laws and regulations; |
• | the occurrence of a major health and safety incident; |
• | poor relations with the residents of our communities; |
• | information technology failures and data security breaches; |
• | product liability claims, litigation and warranty claims; |
• | the seasonality of the homebuilding industry; |
• | utility and resource shortages or rate fluctuations; |
• | the failure of employees or other representatives to comply with applicable regulations and guidelines; |
• | future litigation, arbitration or other claims; |
• | uninsured losses or losses in excess of insurance limits; |
• | cost and availability of insurance and surety bonds; |
• | volatility and uncertainty in the credit markets and broader financial markets; |
• | availability, terms and deployment of capital including with respect to acquisitions, joint ventures and other strategic actions; |
• | our debt and related service obligations; |
• | required accounting changes; |
• | an inability to maintain effective internal control over financial reporting; and |
• | other risks and uncertainties inherent in our business, including those described in Item 1A. “Risk Factors.” |
Should one or more of the risks or uncertainties described above or elsewhere in this Annual Report on Form 10-K occur, or should underlying assumptions prove incorrect, our actual results and plans could differ materially from those expressed in any forward-looking statements. Readers are cautioned not to place undue reliance on any such forward-looking statements, which speak only as of the date they are made. Except as required by law, we disclaim all responsibility to publicly update any information contained in a forward-looking statement.
All forward-looking statements attributable to us or to persons acting on our behalf, including any such forward-looking statements made subsequent to the publication of this Annual Report on Form 10-K, are expressly qualified in their entirety by this cautionary statement.
PART I
ITEM 1. BUSINESS
References
Unless the context otherwise requires, references to the “Company”, “Green Brick”, “we”, “us” or “our” refer to the consolidated company, which has been renamed Green Brick Partners, Inc. and its subsidiaries, resulting from the acquisition by BioFuel Energy Corp. and its then consolidated subsidiaries (“BioFuel”) of JBGL Builder Finance LLC and its consolidated subsidiaries and affiliated companies (collectively “Builder Finance”), and JBGL Capital Companies (“Capital”), a combined group of commonly managed limited liability companies and partnerships (collectively with Builder Finance, “JBGL”) by means of a reverse recapitalization transaction on October 27, 2014.
General
Green Brick Partners, Inc. (formerly named BioFuel Energy Corp.) was incorporated as a Delaware corporation on April 11, 2006, to invest solely in BioFuel Energy, LLC, a limited liability company organized on January 25, 2006, to build and operate ethanol production facilities in the midwestern United States. On November 22, 2013, the Company disposed of its ethanol plants and all related assets. Following the disposition of these production facilities, we were a public shell company with no substantial operations.
On June 10, 2014, the Company entered into a definitive transaction agreement with the owners of JBGL, which provided that we would acquire JBGL for $275.0 million, payable in cash and shares of our common stock (the “Transaction”). JBGL is a real estate operator involved in the purchase and development of land for residential use, construction lending and home building operations. The Transaction was completed on October 27, 2014. Pursuant to the terms of the Transaction, we paid the $275.0 million purchase price with approximately $191.8 million in cash and the remainder in 11,108,500 shares of our common stock valued at approximately $7.49 per share.
The cash portion of the purchase price was primarily funded from the proceeds of a $70.0 million rights offering conducted by the Company (the $70.0 million includes proceeds from purchases of shares of common stock by certain funds and accounts managed by Greenlight Capital, Inc. and its affiliates (“Greenlight”) and Third Point LLC and its affiliates (“Third Point”)) and $150.0 million of debt financing provided by Greenlight pursuant to a loan agreement, with the lenders from time to time party thereto, which provided for a five year term loan facility (the “Term Loan Facility”). In 2015, the Term Loan Facility was repaid in full.
For financial reporting purposes, the Transaction was deemed to be a capital transaction in substance and recorded as a reverse recapitalization of JBGL whereby JBGL is deemed to be the continuing, surviving entity for accounting purposes, but through reorganization, is deemed to have adopted the capital structure of BioFuel. Because the acquisition was considered a reverse recapitalization for accounting purposes, the combined historical financial statements of JBGL became our historical financial statements and from the completion of the acquisition on October 27, 2014, the financial statements have been prepared on a consolidated basis. The assets and liabilities of BioFuel were brought forward at their book value and no goodwill was recognized in connection with the Transaction. As a result of the Transaction, Green Brick changed its business direction and is now a diversified homebuilding and land development company.
On July 1, 2015, we completed an underwritten public offering of 17 million shares of our common stock at a price of $10.00 per share and granted to the underwriters a 30-day option to purchase up to an aggregate of 841,500 additional shares of common stock to cover over-allotments (the “Equity Offering”). On July 23, 2015, the underwriters exercised the option and purchased 444,897 additional shares. All of the shares were sold by us pursuant to an effective shelf registration statement previously filed with the Securities and Exchange Commission (the “SEC”).
The Equity Offering resulted in net proceeds of approximately $170.0 million, after deducting underwriting discounts and offering expenses. On July 1, 2015, we used approximately $154.9 million of the net proceeds from the Equity Offering to repay all of the outstanding principal, interest and a prepayment premium under the Term Loan Facility. Upon repayment, the Term Loan Facility was terminated and all security interests in, and all liens held by Greenlight with respect to, the assets of Green Brick securing the amounts owed under the Term Loan Facility were terminated and released. We used the remaining net proceeds for working capital and general corporate purposes.
Equity Issuance in Connection with the Acquisition of an Unconsolidated Entity
On August 15, 2017, the Company, JBGL Ownership LLC, a Delaware limited liability company and a wholly owned subsidiary of the Company (“JBGL”), and GB Challenger, LLC, a newly formed Texas limited liability company (the
1
“Challenger Subsidiary”) entered into a Membership Interest Purchase and Contribution Agreement (the “Challenger Agreement”) with The Challenger Group, Inc., a Wyoming corporation (“TCGI”), TCG Holdings, LLC, a Wyoming limited liability company (“TCG”), GTG Holdings, LLC, a Wyoming limited liability company (“GTG” and together with TCGI and TCG, the “Challenger Entities”) and Brian R. Bahr (“Bahr”), resulting in the Company, through its interest in JBGL, and the Challenger Entities owning a 49.9% and 50.1% ownership interest, respectively, in the Challenger Subsidiary, and the Challenger Subsidiary owning all of the membership and ownership interests in the subsidiaries of the Challenger Entities named in the Challenger Agreement (“Challenger Homebuilder Subsidiaries”). As consideration for such interests, the Company agreed to issue to the Challenger Entities, or their designees, 1,497,000 shares of its common stock, par value $0.01 per share, in a private placement, with 20,000 shares of its common stock held back pending satisfactory resolution of indemnification claims (“Holdback Shares”). The Company expects to issue the Holdback Shares during the second quarter of 2018; therefore, $0.2 million has been recorded in additional paid-in capital on the consolidated balance sheet as of December 31, 2017. The Challenger Entities, at their discretion, may offer to sell and transfer an additional 20.1% or, in certain circumstances, all of the Challenger Entities’ interest in the Challenger Subsidiary (“Additional Membership Interests”) to the Company on or after the third anniversary of the Challenger Agreement. The Company is not required to purchase the Additional Membership Interests. The Company incurred approximately $0.3 million in related acquisition costs which are included in the cost basis of investment in unconsolidated entity.
The Challenger Entities operate homebuilding operations under the name Challenger Homes. Challenger Homes constructs townhouses, single family homes and luxury patio homes, and is headquartered in Colorado Springs, Colorado. The Company partnered with Challenger Homes in order to expand its business with partners who are complementary to its current builder partner group and to gain a presence in the Colorado Springs market.
The Challenger Entities, together with the Company will direct the operations of the Challenger Homebuilder Subsidiaries through the Challenger Subsidiary, with the Company holding a noncontrolling interest. We hold two of the five board of managers (the “Managers”) seats of the Challenger Subsidiary. The Challenger Subsidiary’s six officers, employees of the Challenger Entities, were designated by the Managers for the purpose of managing the day to day operations. We do not have a controlling financial interest in the Challenger Subsidiary as we have less than 50% of the voting interests in the Challenger Subsidiary. Our investment in the Challenger Subsidiary is treated as an unconsolidated investment under the equity method of accounting, carried at cost, as adjusted for our share of income or losses and reduced for distributions received, and included in investment in unconsolidated entity in our consolidated balance sheets.
Our Company
We are a diversified homebuilding and land development company. We acquire and develop land, provide land and construction financing to our controlled builders and participate in the profits of our controlled builders. Our core markets are in the high growth U.S. metropolitan areas of Dallas, Texas and Atlanta, Georgia. We also own a noncontrolling interest in Challenger Homes in Colorado Springs, Colorado. We are engaged in all aspects of the homebuilding process, including land acquisition and the development, entitlements, design, construction, marketing and sales and the creation of brand images at our residential neighborhoods and master planned communities. We believe we offer higher quality homes with more distinctive designs and floor plans than those built by our competitors at comparable prices. Our communities are located in premium locations in our core markets and we seek to enhance homebuyer satisfaction by utilizing high-quality materials, offering a broad range of customization options and building well-crafted energy-efficient homes. We seek to maximize value over the long term and operate our business to mitigate risks in the event of a downturn by controlling costs and quickly reacting to regional and local market trends.
We are a leading lot developer in the Dallas and Atlanta markets and believe that our strict operating discipline provides us with a competitive advantage in seeking to maximize returns while minimizing risk. We currently own or control over 6,200 home sites in premium locations in the Dallas and Atlanta markets. We consider premium locations to be lot supply constrained with high housing demand where much of the surrounding land has already been developed. We are strategically positioned to either build new homes on our lots through our controlled builders or to sell finished lots to large unaffiliated homebuilders.
We sell finished lots or option lots from third-party developers to our controlled builders for their homebuilding operations and provide them with construction financing and strategic planning. Our controlled builders provide us with their local knowledge and relationships. We support our controlled builders by financing their purchases of land from us at an unlevered internal rate of return (“IRR”) of at least 20% and by providing construction financing at approximately a 13.8% or a 16.5% interest rate. Our income is further enhanced by our 50% equity interest in the profits of our controlled builders. In addition, the land we sell to third-party homebuilders also typically generates an unlevered IRR targeted at 20% or greater.
2
References to our “controlled builders” refer to our homebuilding subsidiaries in which we own a 50% equity interest and a 51% voting interest. In addition, we have the ability to appoint 2 of the 3 members of the board of managers of each controlled builder; therefore we are able to exercise control over the operations of each controlled builder.
Controlled Builders | Year Formed | Market | Products Offered | Prices Ranges | ||||
The Providence Group of Georgia L.L.C. (“TPG”) | 2011 | Atlanta | Townhomes | $310,000 to $650,000 | ||||
Single family | $440,000 to $1.1 million | |||||||
CB JENI Homes DFW LLC (“CB JENI”) | 2012 | Dallas | Townhomes | $250,000 to $430,000 | ||||
Single family | $320,000 to $700,000 | |||||||
Centre Living Homes, LLC (“Centre Living”) | 2012 | Dallas | Townhomes | $320,000 to $1.5 million | ||||
Southgate Homes DFW LLC (“Southgate”) | 2013 | Dallas | Luxury homes | $550,000 to $1.3 million | ||||
During the first quarter of 2015, we formed Green Brick Title, LLC (“Green Brick Title”), our wholly-owned title company. Green Brick Title’s core business includes providing title insurance and closing and settlement services for our homebuyers. Green Brick Title had insignificant operations during the years ended December 31, 2017, 2016 and 2015.
The following chart sets forth the number of new homes delivered by our controlled builders, the home sales revenue, the average sales price of homes delivered and the amount of lot sales revenue generated during the years ended December 31, 2017, 2016 and 2015.
Years Ended December 31, | Increase (Decrease) | Years Ended December 31, | Increase (Decrease) | |||||||||||||||||||||||||||
2017 | 2016 | Amount | % | 2016 | 2015 | Amount | % | |||||||||||||||||||||||
New homes delivered | 990 | 844 | 146 | 17.3 | % | 844 | 655 | 189 | 28.9 | % | ||||||||||||||||||||
Home sales revenue ($ in thousands) | $ | 435,644 | $ | 365,164 | $ | 70,480 | 19.3 | % | $ | 365,164 | $ | 254,267 | $ | 110,897 | 43.6 | % | ||||||||||||||
Average sales price of home delivered | $ | 440,044 | $ | 432,659 | $ | 7,385 | 1.7 | % | $ | 432,659 | $ | 388,194 | $ | 44,465 | 11.5 | % | ||||||||||||||
Lot sales revenue ($ in thousands) | $ | 18,730 | $ | 15,164 | $ | 3,566 | 23.5 | % | $ | 15,164 | $ | 36,878 | $ | (21,714 | ) | (58.9 | )% | |||||||||||||
Our backlog reflects the number and value of homes for which we have entered into sales contracts with customers but not yet delivered. With the exception of a normal cancellation rate, we expect all of the backlog as of December 31, 2017 to be filled during 2018. The following chart sets forth the backlog related to our builder operations segment during the years ended December 31, 2017, 2016 and 2015.
Years Ended December 31, | Increase (Decrease) | Years Ended December 31, | Increase (Decrease) | |||||||||||||||||||||||||
2017 | 2016 | Amount | % | 2016 | 2015 | Amount | % | |||||||||||||||||||||
Backlog ($ in thousands) | $ | 151,463 | $ | 108,030 | $ | 43,433 | 40.2% | $ | 108,030 | $ | 88,136 | $ | 19,894 | 22.6% | ||||||||||||||
Our Competitive Strengths
Our business is characterized by the following competitive strengths:
Optionality Provided by Our Combined Land Development and Homebuilding Structure
We are a diversified homebuilding and land development company. We are strategically positioned to either build and sell new homes on lots through our controlled builders or develop land and sell finished lots to large unaffiliated homebuilders. While our business plan has increasingly focused on building new homes on our owned and controlled lots, we proactively monitor market conditions to opportunistically sell a minority of our finished lots to large unaffiliated homebuilders if we believe that doing so will maximize our returns or lower our risk.
3
Experienced Management Team
Our management team is comprised of homebuilding and finance veterans that collectively have decades of experience and local knowledge of our core markets. Our founder and Chief Executive Officer, James R. Brickman has over 40 years of experience in real estate development and home building. Richard A. Costello, our Chief Financial Officer, joined the Company in 2015 and provides oversight of all financial reporting, lending relationships, audit supervision, cash management, and investor relations. Mr. Costello has over 25 years of financial and operational experience in all aspects of real estate management. Jed Dolson, President of Texas Region (formerly Head of Land Acquisition and Development), joined JBGL as an employee in 2013 and is responsible for land entitlement and development activities, including overseeing our land development operations in Dallas. Summer Loveland, our Chief Accounting Officer, joined the Company in 2017 and is responsible for the oversight of financial reporting, internal audit, treasury functions, and information technology. Our management team has a proven record of running profitable businesses and making prudent investment decisions. We believe that our experienced management team is well positioned to design and execute the development of complex, master planned residential communities.
Focus on Operations in Housing Markets with a Favorable Growth Outlook and Strong Demand Fundamentals
We currently operate in the Dallas and Atlanta markets, which we believe are among the most desirable homebuilding markets in the nation. We also operate in Colorado Springs through our noncontrolling interest in Challenger Homes. We believe our core markets exhibit attractive residential real estate investment characteristics, such as growing economies, improving levels of employment and population growth relative to national averages, favorable migration patterns, general housing affordability, and desirable lifestyle and weather characteristics.
Among the 12 largest metropolitan areas in the country, the Dallas metropolitan area ranked first in both the rate of job growth and the number of jobs from November 2016 to November 2017 (Source: US Bureau of Labor Statistics, November 2017). The Atlanta metropolitan area ranked second in the rate of job growth and third in the number of jobs added from September 2016 to September 2017 (Source: US Bureau of Labor Statistics, September 2017).
We believe that increasing demand and supply constraints in our core markets create favorable conditions for our future growth.
Attractive Land Positions in Our Core Markets
We believe that we have strategically well-located land and lot positions within our core markets. We believe we have acquired our land and lot positions at attractive prices, providing us with significant opportunity for a healthy return on our investment. We expect the demand for housing in our core markets to continue to improve, due to rising consumer confidence, high affordability metrics, and a reduction in home inventory levels.
We seek to acquire land with convenient access to Dallas and Atlanta metropolitan areas which have diverse economic and employment bases and demographics that we believe will support long-term growth. For example, Capital currently owns, controls or is developing approximately 3,500 home sites under the brand Green Brick Communities in the Dallas market. Builder Finance owns or controls approximately 2,700 home sites in the Dallas and Atlanta markets.
We believe that our attractive inventory of home sites will enable us to capture the benefits of expected increases in home sales volume and home prices as the demand for new homes increases.
Land Sourcing and Evaluation Capabilities
We believe that our extensive experience and strong reputation of our management team combined with our long-standing relationships with other market participants provide us with a competitive advantage in efficiently sourcing, purchasing and entitling land. We are actively involved in every step of the land entitlement, home design and construction process with our controlled builders. Our management team has developed significant collaborative relationships over decades with land sellers, developers, contractors, lenders, brokers and investors throughout the Dallas and Atlanta markets. Our deep and wide-ranging knowledge of the Dallas and Atlanta markets and our ability to quickly and efficiently identify, acquire and develop land in desirable locations and on favorable terms are key to our success.
Disciplined Investment Approach
We seek to maximize value over the long-term and operate our business to mitigate risks in the event of a downturn by controlling costs and focusing on regional and local market trends.
4
Our management team has gained significant operating expertise through varied economic cycles. The perspective gained from these experiences has helped shape our investment approach. We believe that our management team has learned to effectively evaluate housing trends in our markets, and to react quickly and rationally to market changes. For example, we made significant land investments during the downturn at prices that we view as favorable. Our cycle-tested management approach balances strategic planning with local day-to-day decision-making responsibilities freeing up our controlled builders to concentrate on growing our homebuilding business rather than focusing on obtaining capital to fund their operations. We believe that our strict operating discipline provides us with a competitive advantage in seeking to maximize returns while minimizing risk.
Business Strategy
We believe we are well-positioned for growth in our core Dallas and Atlanta markets through the disciplined execution of the following elements of our strategy:
Combine Land Acquisition and Development Expertise with Homebuilding Operations to Maximize Profitability
Our ability to identify, acquire and develop land in desirable locations and on favorable terms is critical to our success. We evaluate land opportunities based on how we expect such opportunities will contribute to overall profitability and returns, rather than how they might drive volume on a market basis. We believe our expertise in land development and planning enables us to create desirable communities that meet or exceed our target homebuyer’s expectations, while selling homes at competitive prices. Our strategy of holding land inventory provides us with a multi-year supply of lots for future homebuilding. We focus on the development of entitled parcels in communities where we can generally sell all lots and homes within 24 to 60 months from the start of sales. This focus allows us to limit exposure to land development and market cycle risk while pursuing favorable returns on our investments. We seek to minimize our exposure to land risk through disciplined management of entitlements, the use of land and lot options and other flexible land acquisition arrangements.
Maximize Benefits of Diversified Homebuilding and Land Development Structure
Our diversified homebuilding and land development structure provides the flexibility to monetize the value of our land assets either by building and selling homes through our controlled builders or developing land and selling finished lots to large unaffiliated homebuilders. When evaluating our land assets, we consider the potential contribution of each asset to our overall performance, taking into account the timeframe over which we may monetize the asset. While we currently expect the majority of our land to be utilized by our controlled homebuilders, we believe our land development and homebuilding strategy provides us with increased flexibility to seek to maximize risk-adjusted returns as market conditions warrant.
Increase Long-Term Value by Investing in Infrastructure
In our communities, we typically make enhanced investment in infrastructure, including landscaping and amenity centers, and enforce higher construction standards through our controlled builders. We believe this creates greater long-term value for us and for our controlled builders, homebuyers, shareholders and the communities in which we build.
Drive Revenue by Opening New Communities from Existing Land Supplies
We have strategically invested in new land in a number of prime neighborhoods in our core markets. We currently own or control over 6,200 home sites in the Dallas and Atlanta markets. We expect these land purchases to provide us with the opportunity for continued revenue growth and strong gross margin performance. We continue to identify development opportunities that should allow us to profit from lot sales, construction interest and our 50% equity interest in the profits of our controlled builders.
Increase Market Positions in Dallas and Atlanta
We believe that there are significant opportunities to profitably expand in our core Dallas and Atlanta markets. We continually review the allocation of our investments in these markets taking into account demographic trends and the likely impact on our operating results. We use the results of these reviews to reallocate our investments to those areas where we believe we can maximize our profitability and return on capital. We seek to use our local relationships with land sellers, brokers and investors to pursue the purchase of additional land parcels in our core markets. While our primary growth strategy focuses on increasing our market position in our existing markets, we may, on an opportunistic basis, explore expansion into attractive new markets.
5
Superior Design, Broad Product Range and Enhanced Homebuying Experience
Within each of our core markets, we partner our expertise with our controlled builders to design attractive neighborhoods and homes to appeal to a wide variety of potential homebuyers. One of our core operating philosophies is to create a culture which provides a positive, memorable experience for our homebuyers through active engagement in the building process. At higher price points, we provide our homebuyers with customization options to suit their specific needs and tastes. We engineer our homes for energy efficiency to reduce the impact on the environment and result in lower energy costs for our homebuyers. In consultation with nationally and locally recognized architecture firms, interior and exterior consultants and homeowner focus groups, we research and design a diversified range of products for various levels and price points. Our homebuilding projects include townhomes, single family homes and luxury custom homes. We believe we can adapt quickly to changing market conditions and optimize performance and returns while strategically reducing portfolio risk because of our diversified product strategy.
Pursue Further Growth Through the Prudent Use of Leverage
As of December 31, 2017, our debt to total capitalization ratio is approximately 22%. It is our intent to prudently employ leverage to continue to invest in our land acquisition, development and homebuilding businesses. We intend to target a total capitalization ratio of approximately 35% to 40%, which we expect will provide us with significant additional growth capital.
Pursue Acquisitions of Additional Homebuilders
We intend to pursue the acquisition of additional homebuilders in our core and new markets. Our preference is to continue to acquire controlling interests in homebuilders with existing management continuing to own a significant ownership stake. We will seek to acquire and then retain management teams which have the strong local relationships with land owners and have a positive reputation for building well-crafted homes in their markets. We expect that our ability to provide capital discipline and strategic oversight will complement the local skills, relationships and reputations of our future homebuilder partners.
Our Homebuilding Neighborhoods
Our homebuilding neighborhoods usually take approximately 24 to 60 months to complete from the start of sales, although certain neighborhoods may take longer to complete. The following table presents neighborhood information relating to each of our controlled builders as of December 31, 2017, as well as current neighborhoods under development. Our backlog reflects the number and value of homes for which we have entered into sales contracts with customers but not yet delivered.
Neighborhoods | Year of First Delivery(1) | Total Number of Home Sites(2) | Cumulative Homes Closed as of December 31, 2017 | Backlog at December 31, 2017 | Homes Still to be Closed as of December 31, 2017 | Sales Price Range (in thousands) | Home Size Range (sq. ft.) | |||||||||||
Texas | ||||||||||||||||||
CB JENI Viridian | 2013 | 278 | 203 | 9 | 66 | $250 - $310 | 1,500 - 2,300 | |||||||||||
CB JENI Mustang Park | 2014 | 177 | 158 | 8 | 11 | $300 - $380 | 1,500 - 2,300 | |||||||||||
CB JENI Canals at Grand Park | 2015 | 94 | 57 | 7 | 30 | $320 - $430 | 1,700 - 2,300 | |||||||||||
CB JENI Raiford Crossing | 2015 | 53 | 53 | — | — | $270 - $370 | 1,700 - 2,600 | |||||||||||
CB JENI Hometown | 2016 | 96 | 34 | — | 62 | $270 - $320 | 1,700 - 2,300 | |||||||||||
CB JENI Stacy Crossing | 2016 | 145 | 77 | 11 | 57 | $270 - $360 | 1,500 - 2,300 | |||||||||||
CB JENI Stonegate | 2016 | 79 | 28 | 4 | 47 | $260 - $310 | 1,500 - 2,000 | |||||||||||
CB JENI Los Rios | 2016 | 98 | 73 | 5 | 20 | $250 - $320 | 1,400 - 2,100 | |||||||||||
CB JENI McKinney Ranch | 2016 | 71 | 51 | 8 | 12 | $250 - $310 | 1,500 - 2,000 | |||||||||||
CB JENI Heritage Creekside | 2017 | 105 | 2 | 15 | 88 | $310 - $350 | 1,900 - 2,100 | |||||||||||
CB JENI Montgomery Ridge | 2017 | 32 | — | 4 | 28 | $300 - $380 | 1,700 - 2,600 | |||||||||||
CB JENI Sloan Creek | 2017 | 36 | 29 | — | 7 | $260 - $360 | 1,400 - 2,100 | |||||||||||
CB JENI Frisco Springs | 2018 | 154 | — | — | 154 | TBD | TBD | |||||||||||
CB JENI/Normandy Southgate | 2018 | 150 | — | — | 150 | TBD | TBD | |||||||||||
CB JENI Vista del Lago | 2018 | 148 | — | — | 148 | TBD | TBD | |||||||||||
CB JENI Sunset Pointe | 2018 | 115 | — | — | 115 | TBD | TBD | |||||||||||
CB JENI Iron Horse | 2018 | 92 | — | — | 92 | $240 - $260 | 1,500 - 2,000 | |||||||||||
CB JENI Ridgeview Townhomes | 2018 | 91 | — | — | 91 | TBD | TBD | |||||||||||
CB JENI Fairview Apple’s Crossing | 2018 | 87 | — | — | 87 | TBD | TBD | |||||||||||
CB JENI Samoe | 2018 | 83 | — | — | 83 | $250 - $290 | 1,500 - 2,000 | |||||||||||
6
Neighborhoods | Year of First Delivery(1) | Total Number of Home Sites(2) | Cumulative Homes Closed as of December 31, 2017 | Backlog at December 31, 2017 | Homes Still to be Closed as of December 31, 2017 | Sales Price Range (in thousands) | Home Size Range (sq. ft.) | |||||||||||
CB JENI Terraces at Las Colinas | 2018 | 79 | — | — | 79 | $320 - $370 | 1,500 - 2,000 | |||||||||||
CB JENI Reserves on Parker | 2018 | 63 | — | — | 63 | $300 - $340 | 1,800 - 2,300 | |||||||||||
CB JENI Meridian at Southgate | 2018 | 47 | — | — | 47 | $250 - $275 | 1,500 - 1,800 | |||||||||||
CB JENI Riverset | 2019 | 88 | — | — | 88 | $220 - $260 | 1,500 - 2,000 | |||||||||||
Normandy Cypress Meadows | 2014 | 139 | 98 | 15 | 26 | $490 - $700 | 2,700 - 4,400 | |||||||||||
Normandy Viridian | 2014 | 66 | 47 | 6 | 13 | $375 - $700 | 2,200 - 4,400 | |||||||||||
Normandy Mustang Park | 2015 | 83 | 72 | 8 | 3 | TBD | TBD | |||||||||||
Normandy Cottonwood Crossing | 2015 | 48 | 48 | — | — | $300 - $460 | 1,800 - 3,450 | |||||||||||
Normandy Lakeside | 2015 | 76 | 76 | — | — | $410 - $700 | 2,200 - 4,400 | |||||||||||
Normandy Twin Creeks | 2016 | 72 | 50 | — | 22 | $350 - $500 | 1,800 - 3,450 | |||||||||||
Normandy Watters Branch | 2017 | 48 | 1 | 10 | 37 | $390 - $530 | 2,000 - 4,000 | |||||||||||
Normandy Reserves on Parker Ranch | 2018 | 106 | — | — | 106 | $340 - $400 | 1,700 - 2,900 | |||||||||||
Normandy Southaven | 2018 | 105 | — | — | 105 | TBD | TBD | |||||||||||
Normandy Fairview Apple’s Crossing | 2018 | 95 | — | — | 95 | TBD | TBD | |||||||||||
Normandy Shaddock Estates | 2018 | 92 | — | — | 92 | $530 - $650 | 2,600 - 4,500 | |||||||||||
Normandy Spicewood | 2018 | 82 | — | 7 | 75 | $350 - $380 | 2,200 - 2,600 | |||||||||||
Normandy Edgewood | 2018 | 46 | — | — | 46 | $320 - $360 | 2,200 - 2,700 | |||||||||||
Normandy Park Vista | 2019 | 332 | — | — | 332 | TBD | TBD | |||||||||||
Southgate | 2013 | 54 | 54 | — | — | $640 - $870 | 3,300 - 4,660 | |||||||||||
Southgate Canals at Grand Park | 2015 | 41 | 27 | 9 | 5 | $775 - $865 | 3,934 - 4,571 | |||||||||||
Southgate Bethany Mews | 2016 | 4 | 4 | — | — | $770 - $790 | 3,900 - 3,925 | |||||||||||
Southgate Twin Creeks | 2016 | 91 | 6 | 1 | 84 | $490 - $950 | 1,800 - 3,944 | |||||||||||
Southgate Angel Field West | 2016 | 62 | 36 | 11 | 15 | $560 - $760 | 3,400 - 4,500 | |||||||||||
Southgate Bluffs at Austin Waters | 2016 | 69 | 46 | 20 | 3 | $560 - $880 | 3,100 - 4,400 | |||||||||||
Southgate Homestead | 2017 | 30 | 1 | 4 | 25 | $550 - $609 | 3,406 - 3,840 | |||||||||||
Southgate Oaks of Argyle | 2017 | 10 | — | 2 | 8 | $559 - $679 | 3,238 - 4,242 | |||||||||||
Southgate Edgewood | 2018 | 98 | — | — | 98 | TBD | TBD | |||||||||||
Southgate Garilen | 2018 | 70 | — | — | 70 | $569 - $789 | 2,629 - 4,398 | |||||||||||
Southgate Stoney Creek | 2018 | 50 | — | — | 50 | $599 - $699 | 3,453 - 4,425 | |||||||||||
Southgate Brockdale Estates | 2018 | 43 | — | — | 43 | TBD | TBD | |||||||||||
Southgate North | 2018 | 40 | — | — | 40 | TBD | TBD | |||||||||||
Southgate 5T Ranch | 2018 | 35 | — | 1 | 34 | $559 - $678 | 3,238 - 4,241 | |||||||||||
Southgate Parker/Southgate Ranch | 2018 | 32 | — | — | 32 | TBD | TBD | |||||||||||
Centre Living Homes Residences at Cityline | 2017 | 32 | 3 | 1 | 28 | $525 - $650 | 2,700 - 3,300 | |||||||||||
Centre Living Homes Live Oak Landings | 2017 | 26 | 2 | 4 | 20 | $425 - $475 | 1,450 - 1,850 | |||||||||||
Centre Living Homes Ross Avenue Heights | 2017 | 18 | 2 | — | 16 | $575 - $600 | 2,400 | |||||||||||
Centre Living Homes Caddo Center | 2017 | 10 | — | — | 10 | $320 - $350 | 1,400 | |||||||||||
Centre Living Homes Westside Manor | 2017 | 7 | 4 | — | 3 | $1,100 - $1,500 | 3,000 - 4,000 | |||||||||||
Centre Living Homes Fort Worth Avenue | 2018 | 56 | — | — | 56 | $425 - $475 | 2,000 - 2,400 | |||||||||||
Centre Living Homes Swiss & Haskell | 2018 | 29 | — | — | 29 | $400 - $550 | 1,500 - 2,900 | |||||||||||
Centre Living Homes Roseland Avenue | 2018 | 16 | — | — | 16 | $410 - $425 | 1,500 - 1,800 | |||||||||||
Centre Living Homes Polk Avenue | 2018 | 13 | — | — | 13 | $450 - $600 | 2,200 - 3,000 | |||||||||||
Centre Living Homes Scurry Street | 2018 | 10 | — | — | 10 | $400 - $425 | 1,600 - 1,700 | |||||||||||
Centre Living Homes Bluffview | 2019 | 33 | — | — | 33 | $500 - $600 | 2,100 - 3,000 | |||||||||||
Centre Living Homes Bayonne | 2019 | 30 | — | — | 30 | $425 - $500 | 2,000 - 2,400 | |||||||||||
Centre Living Homes Canty | 2019 | 23 | — | — | 23 | $425 - $500 | 1,800 - 2,400 | |||||||||||
Centre Living Homes Neely/Crawford | 2019 | 16 | — | — | 16 | $425 - $500 | 1,800 - 2,400 | |||||||||||
Centre Living Homes Ervay | 2019 | 15 | — | — | 15 | $425 - $500 | 1,600 - 2,000 | |||||||||||
Centre Living Homes Tyler | 2019 | 13 | — | — | 13 | $400 - $450 | 1,800 - 2,400 | |||||||||||
7
Neighborhoods | Year of First Delivery(1) | Total Number of Home Sites(2) | Cumulative Homes Closed as of December 31, 2017 | Backlog at December 31, 2017 | Homes Still to be Closed as of December 31, 2017 | Sales Price Range (in thousands) | Home Size Range (sq. ft.) | |||||||||||
Future Developments at Twin Creeks | 2018 | 465 | — | — | 465 | $490 - $950 | 1,800 - 3,450 | |||||||||||
Texas Total | 5,392 | 1,342 | 170 | 3,880 | ||||||||||||||
Georgia | ||||||||||||||||||
The Providence Group Custom Homes | 2012 | 50 | 50 | — | — | $800 - $850 | 3,800 - 4,200 | |||||||||||
The Providence Group & Associates | 2013 | 14 | 14 | — | — | $690 - $730 | 3,700 - 4,400 | |||||||||||
TPG Homes at Ruth’s Farm | 2014 | 33 | 26 | — | 7 | $645 - $845 | 3,700 - 4,200 | |||||||||||
TPG Homes at Seven Norcross | 2014 | 44 | 44 | — | — | $300 - $465 | 2,000 - 3,000 | |||||||||||
TPG Homes at Bellmoore Park | 2015 | 618 | 129 | 30 | 459 | $440 - $900 | 2,300 - 4,600 | |||||||||||
TPG Homes – Highpointe at Vinings | 2015 | 84 | 57 | 3 | 24 | $580 - $750 | 2,800 - 4,500 | |||||||||||
TPG Homes at Traditions | 2015 | 154 | 73 | 8 | 73 | $495 - $700 | 2,300 - 4,300 | |||||||||||
TPG Homes at The Reserve at Providence | 2015 | 23 | 13 | — | 10 | $950 - $1,100 | 3,700 - 5,800 | |||||||||||
TPG Homes at East Village | 2015 | 62 | 54 | 3 | 5 | $335 - $385 | 2,000 - 2,300 | |||||||||||
TPG Homes at Rivers Edge | 2015 | 130 | 130 | — | — | $280 - $425 | 2,000 - 2,800 | |||||||||||
TPG Homes at Central Park at Deerfield Township | 2016 | 283 | 51 | 18 | 214 | $440 - $625 | 2,000 - 4,200 | |||||||||||
TPG Homes at Brookmere | 2016 | 194 | 75 | 11 | 108 | $330 - $675 | 2,000 - 4,600 | |||||||||||
TPG Homes at Townes at Chastain | 2016 | 162 | 52 | 9 | 101 | $440 - $650 | 2,200 - 2,800 | |||||||||||
TPG Homes at Glens Sugarloaf | 2016 | 92 | 36 | 7 | 49 | $330 - $400 | 2,000 - 2,700 | |||||||||||
TPG Homes at Roswell Towneship | 2016 | 92 | 35 | 12 | 45 | $370 - $450 | 2,000 - 2,300 | |||||||||||
TPG Homes at Dunwoody Township | 2016 | 40 | 26 | 4 | 10 | $480 - $505 | 2,300 - 2,500 | |||||||||||
TPG Homes at Cogburn | 2016 | 19 | 16 | 1 | 2 | $540 - $650 | 3,200 - 4,300 | |||||||||||
TPG Homes at Suwanee Station | 2017 | 70 | 16 | 9 | 45 | $310 - $350 | 2,000 | |||||||||||
TPG Homes at East of Main | 2017 | 83 | 31 | 14 | 38 | $500 - $900 | 2,200 - 3,400 | |||||||||||
TPG Homes at Cresslyn | 2017 | 49 | 10 | 5 | 34 | $380 - $495 | 2,000 - 2,700 | |||||||||||
TPG Homes at Stringer Road | 2018 | 195 | — | — | 195 | $380 - $650 | 1,800 - 4,200 | |||||||||||
TPG Homes at Grant Circle | 2018 | 150 | — | — | 150 | TBD | 1,400 - 2,300 | |||||||||||
TPG Homes at Woodstock | 2018 | 57 | — | — | 57 | $425 - $600 | 2,070 - 2,600 | |||||||||||
TPG Homes at Chelsea Walk | 2018 | 49 | — | 6 | 43 | $475 - $620 | 2,000 - 2,800 | |||||||||||
TPG Homes at Orion Drive | 2018 | 41 | — | — | 41 | TBD | 1,975 - 2,070 | |||||||||||
TPG Homes at Tiffany Square | 2018 | 22 | — | — | 22 | $650 - $800 | 3,000 - 3,200 | |||||||||||
TPG Homes at Cricket Lane | 2018 | 20 | — | — | 20 | TBD | 3,000 - 3,200 | |||||||||||
TPG Homes at Westside Village | 2018 | 19 | — | — | 19 | TBD | 1,975 - 2,070 | |||||||||||
Georgia Total | 2,849 | 938 | 140 | 1,771 | ||||||||||||||
Total Homes | 8,241 | 2,280 | 310 | 5,651 | ||||||||||||||
(1) | Years subsequent to 2017 are anticipated. |
(2) | Number of homes in each neighborhood is subject to change due to changes in zoning, building design, construction, and similar matters, including local regulations which impose restrictive zoning and density requirements in order to limit the number of homes that can eventually be built within the boundaries of a particular locality. |
8
Neighborhood Sales by Market
The following table sets forth homes delivered and sales revenue for our controlled builders’ operations and lots delivered and sales revenue from third-party homebuilders for our land development operations by market for the years ended December 31, 2017, 2016 and 2015.
Year Ended December 31, | |||||||||||||||||||||
2017 | 2016 | 2015 | |||||||||||||||||||
Neighborhoods | Home Sales | Homes Delivered | Home Sales | Homes Delivered | Home Sales | Homes Delivered | |||||||||||||||
($ in thousands) | |||||||||||||||||||||
Homes | |||||||||||||||||||||
Texas | |||||||||||||||||||||
CB JENI Berkshire Place | $ | — | — | $ | 5,770 | 22 | $ | 12,752 | 52 | ||||||||||||
CB JENI Brick Row Townhomes | $ | — | — | $ | 5,414 | 17 | $ | 6,030 | 20 | ||||||||||||
CB JENI Canals at Grand Park | $ | 1,770 | 5 | $ | 16,393 | 47 | $ | 1,581 | 5 | ||||||||||||
CB JENI Heritage Creekside | $ | 652 | 2 | $ | — | — | $ | — | — | ||||||||||||
CB JENI Hometown | $ | 5,160 | 17 | $ | 4,873 | 17 | $ | — | — | ||||||||||||
CB JENI Los Rios | $ | 14,375 | 50 | $ | 6,260 | 23 | $ | — | — | ||||||||||||
CB JENI McKinney Ranch | $ | 11,541 | 43 | $ | 1,995 | 8 | $ | — | — | ||||||||||||
CB JENI Mustang Park | $ | 15,187 | 45 | $ | 17,371 | 56 | $ | 14,950 | 54 | ||||||||||||
CB JENI Pecan Park | $ | — | — | $ | — | — | $ | 4,583 | 20 | ||||||||||||
CB JENI Raiford Crossing | $ | 1,580 | 5 | $ | 13,419 | 43 | $ | 1,497 | 5 | ||||||||||||
CB JENI Sloan Creek | $ | 8,875 | 29 | $ | — | — | $ | — | — | ||||||||||||
CB JENI Stacy Crossing | $ | 17,238 | 55 | $ | 6,573 | 22 | $ | — | — | ||||||||||||
CB JENI Stonegate | $ | 7,936 | 28 | $ | — | — | $ | — | — | ||||||||||||
CB JENI Viridian | $ | 19,061 | 72 | $ | 5,237 | 21 | $ | 9,900 | 42 | ||||||||||||
Normandy Alto Vista Irving | $ | — | — | $ | — | — | $ | 6,307 | 12 | ||||||||||||
Normandy Cottonwood Crossing | $ | 3,682 | 10 | $ | 12,542 | 36 | $ | 676 | 2 | ||||||||||||
Normandy Cypress Meadows | $ | 18,640 | 32 | $ | 19,240 | 34 | $ | 15,700 | 28 | ||||||||||||
Normandy Lake Vista Coppell | $ | — | — | $ | — | — | $ | 2,582 | 6 | ||||||||||||
Normandy Lakeside | $ | 490 | 1 | $ | 13,513 | 27 | $ | 15,765 | 28 | ||||||||||||
Normandy Mustang Park | $ | 18,526 | 35 | $ | 16,436 | 34 | $ | 1,307 | 3 | ||||||||||||
Normandy Pecan Park | $ | — | — | $ | — | — | $ | 8,968 | 22 | ||||||||||||
Normandy Twin Creeks | $ | 11,299 | 27 | $ | 9,558 | 23 | $ | — | — | ||||||||||||
Normandy Viridan | $ | 3,794 | 11 | $ | 2,533 | 7 | $ | 7,951 | 27 | ||||||||||||
Normandy Watters Branch | $ | 394 | 1 | $ | — | — | $ | — | — | ||||||||||||
Southgate | $ | 3,488 | 4 | $ | 14,623 | 20 | $ | 9,409 | 13 | ||||||||||||
Southgate Angel Field West | $ | 13,915 | 20 | $ | 10,155 | 15 | $ | — | — | ||||||||||||
Southgate Bethany Mews | $ | 1,300 | 2 | $ | — | — | $ | — | — | ||||||||||||
Southgate Bluffs at Austin Waters | $ | 14,462 | 20 | $ | 7,479 | 11 | $ | — | — | ||||||||||||
Southgate Canals at Grand Park | $ | 16,850 | 19 | $ | 6,251 | 8 | $ | — | — | ||||||||||||
Southgate Homestead | $ | 578 | 1 | $ | — | — | $ | — | — | ||||||||||||
Southgate Twin Creeks | $ | 2,298 | 4 | $ | 1,193 | 2 | $ | — | — | ||||||||||||
Centre Living | $ | — | — | $ | 4,645 | 8 | $ | 2,021 | 2 | ||||||||||||
Centre Living Homes Live Oak Landings | $ | 850 | 2 | $ | — | — | $ | — | — | ||||||||||||
Centre Living Homes Residences at Cityline | $ | 1,645 | 3 | $ | — | — | $ | — | — | ||||||||||||
Centre Living Homes Ross Avenue Heights | $ | 967 | 2 | $ | — | — | $ | — | — | ||||||||||||
Centre Living Homes Westside Manor | $ | 4,334 | 4 | $ | — | — | $ | — | — | ||||||||||||
Texas Total | $ | 220,887 | 549 | $ | 201,473 | 501 | $ | 121,979 | 341 | ||||||||||||
9
Year Ended December 31, | |||||||||||||||||||||
2017 | 2016 | 2015 | |||||||||||||||||||
Neighborhoods | Home Sales | Homes Delivered | Home Sales | Homes Delivered | Home Sales | Homes Delivered | |||||||||||||||
($ in thousands) | |||||||||||||||||||||
Homes | |||||||||||||||||||||
Georgia | |||||||||||||||||||||
Providence Luxury Homes | $ | — | — | $ | 1,640 | 1 | $ | 3,183 | 4 | ||||||||||||
The Providence Group & Associates | $ | — | — | $ | 2,750 | 4 | $ | 1,871 | 3 | ||||||||||||
The Providence Group Custom Homes | $ | 2,241 | 3 | $ | 2,469 | 5 | $ | 34,308 | 58 | ||||||||||||
TPG Homes | $ | — | — | $ | — | — | $ | 27,479 | 74 | ||||||||||||
TPG Homes at Bellmoore Park | $ | 39,515 | 62 | $ | 29,414 | 49 | $ | 11,070 | 18 | ||||||||||||
TPG Homes at Bluffs at Lennox | $ | — | — | $ | 8,332 | 15 | $ | — | — | ||||||||||||
TPG Homes at Brookmere | $ | 19,240 | 48 | $ | 11,333 | 27 | $ | — | — | ||||||||||||
TPG Homes at Byers Landing | $ | — | — | $ | 429 | 1 | $ | — | — | ||||||||||||
TPG Homes at Central Park at Deerfield Township | $ | 16,071 | 32 | $ | 9,682 | 19 | $ | — | — | ||||||||||||
TPG Homes at Cogburn | $ | 5,302 | 9 | $ | 4,351 | 7 | $ | — | — | ||||||||||||
TPG Homes at Crabapple | $ | — | — | $ | — | — | $ | 849 | 2 | ||||||||||||
TPG Homes at Cresslyn | $ | 4,094 | 10 | $ | — | — | $ | — | — | ||||||||||||
TPG Homes at Dunwoody Township | $ | 11,314 | 25 | $ | 466 | 1 | $ | — | — | ||||||||||||
TPG Homes at East of Main | $ | 19,983 | 31 | $ | — | — | $ | — | — | ||||||||||||
TPG Homes at East Village | $ | 5,912 | 17 | $ | 9,911 | 29 | $ | — | — | ||||||||||||
TPG Homes at Highlands | $ | — | — | $ | — | — | $ | 2,650 | 9 | ||||||||||||
TPG Homes at Jamestown | $ | — | — | $ | — | — | $ | 9,917 | 34 | ||||||||||||
TPG Homes at Nesbitt Reserve | $ | — | — | $ | 440 | 1 | $ | — | — | ||||||||||||
TPG Homes at Rivers Edge | $ | 12,761 | 37 | $ | 19,978 | 61 | $ | — | — | ||||||||||||
TPG Homes at Roswell Towneship | $ | 11,131 | 27 | $ | 3,025 | 8 | $ | — | — | ||||||||||||
TPG Homes at Ruth’s Farm | $ | — | — | $ | 7,463 | 10 | $ | 10,332 | 14 | ||||||||||||
TPG Homes at Seven Norcross | $ | 1,687 | 4 | $ | 8,516 | 23 | $ | — | — | ||||||||||||
TPG Homes at Sugarloaf (Glens) | $ | 8,533 | 24 | $ | 4,129 | 12 | $ | — | — | ||||||||||||
TPG Homes at Suwanee Station | $ | 5,102 | 16 | $ | — | — | $ | — | — | ||||||||||||
TPG Homes at The Reserve at Providence | $ | 3,625 | 4 | $ | 1,191 | 1 | $ | — | — | ||||||||||||
TPG Homes at Three Bridges | $ | — | — | $ | — | — | $ | 15,508 | 53 | ||||||||||||
TPG Homes at Townes at Chastain | $ | 23,532 | 49 | $ | 1,459 | 3 | $ | — | — | ||||||||||||
TPG Homes at Traditions | $ | 11,551 | 22 | $ | 16,878 | 33 | $ | — | — | ||||||||||||
TPG Homes at Whitfield Parc | $ | — | — | $ | 1,017 | 3 | $ | 15,121 | 45 | ||||||||||||
TPG Homes – Highpointe at Vinings | $ | 13,163 | 21 | $ | 18,818 | 30 | $ | — | — | ||||||||||||
Georgia Total | $ | 214,757 | 441 | $ | 163,691 | 343 | $ | 132,288 | 314 | ||||||||||||
Total Homes | $ | 435,644 | 990 | $ | 365,164 | 844 | $ | 254,267 | 655 | ||||||||||||
(1) | Lots owned and developed to build homes sold to a third-party developer. |
10
Year Ended December 31, | |||||||||||||||||||||
2017 | 2016 | 2015 | |||||||||||||||||||
Neighborhoods | Lot Sales | Lots Delivered | Lot Sales | Lots Delivered | Lot Sales | Lots Delivered | |||||||||||||||
($ in thousands) | |||||||||||||||||||||
Lots | |||||||||||||||||||||
Texas | |||||||||||||||||||||
Angel Field | $ | 173 | 1 | $ | 167 | 1 | $ | — | — | ||||||||||||
Austin Waters | $ | 168 | 1 | $ | — | — | $ | — | — | ||||||||||||
Bethany Mews | $ | — | — | $ | — | — | $ | 265 | 1 | ||||||||||||
Chateau du Lac | $ | 950 | 3 | $ | 1,440 | 5 | $ | 1,770 | 6 | ||||||||||||
Cypress Meadows | $ | 4,775 | 34 | $ | 4,953 | 37 | $ | 4,772 | 37 | ||||||||||||
Hamilton Hills | $ | — | — | $ | — | — | $ | — | — | ||||||||||||
Hardin Lake | $ | — | — | $ | — | — | $ | 1,505 | 20 | ||||||||||||
Hawthorne Estates | $ | — | — | $ | — | — | $ | 644 | 6 | ||||||||||||
Heritage Creekside | $ | 1,260 | 10 | $ | — | — | $ | — | — | ||||||||||||
Inwood Hills | $ | — | — | $ | — | — | $ | — | — | ||||||||||||
Lakeside | $ | — | — | $ | 215 | 1 | $ | 6,164 | 61 | ||||||||||||
Mustang Park | $ | — | — | $ | 1,986 | 20 | $ | 7,439 | 76 | ||||||||||||
Sunset Place | $ | 871 | 1 | $ | — | — | $ | — | — | ||||||||||||
The Landings | $ | — | — | $ | 4,329 | 39 | $ | 8,539 | 81 | ||||||||||||
Twin Creeks | $ | 9,731 | 89 | $ | 761 | 8 | $ | 5,780 | 48 | ||||||||||||
Westside Circle | $ | — | — | $ | 350 | 1 | $ | — | — | ||||||||||||
Texas Total | $ | 17,928 | 139 | $ | 14,201 | 112 | $ | 36,878 | 336 | ||||||||||||
Georgia | |||||||||||||||||||||
Arbor Cove | $ | 615 | 4 | $ | — | — | $ | — | — | ||||||||||||
Reserve at Providence | $ | — | — | $ | 250 | 1 | $ | — | — | ||||||||||||
Ruth’s Farm | $ | 187 | 1 | $ | 713 | 4 | $ | — | — | ||||||||||||
Georgia Total | $ | 802 | 5 | $ | 963 | 5 | $ | — | — | ||||||||||||
Lots Total | $ | 18,730 | 144 | $ | 15,164 | 117 | $ | 36,878 | 336 | ||||||||||||
Company Total (Homes and Lots) | $ | 454,374 | 1,134 | $ | 380,328 | 961 | $ | 291,145 | 991 | ||||||||||||
11
Owned and Controlled Lots
The following table presents the lots we owned or controlled (including lot option contracts) as of December 31, 2017 and 2016 by market. Owned lots are those for which we hold title, while controlled lots are those for which we have the contractual right to acquire title but we do not currently own. With respect to controlled lots, we generally enter into lot option contracts where an earnest money deposit of up to 20% of the total purchase price of the lots is deposited with the seller. The earnest money deposit is applied to the purchase price of the lots within the lot option contract. Certain of our lot option contracts require an escalation in lot price from zero to six percent per year. The length of the lot option contract is generally based upon the number of lots being purchased and the agreed upon lot takedown schedule, which determines the number and frequency of lot purchases. Lot option contracts typically require two to four lot purchases per month.
December 31, | |||||
2017 | 2016 | ||||
Lots Owned(1) | |||||
Texas | 3,196 | 2,998 | |||
Georgia | 1,299 | 1,237 | |||
Total | 4,495 | 4,235 | |||
Lots Controlled(1) | |||||
Texas | 1,390 | 554 | |||
Georgia | 334 | 400 | |||
Total | 1,724 | 954 | |||
Total Lots Owned and Controlled(2) | 6,219 | 5,189 | |||
(1) | The “land use” assumptions used in the above table may change over time. |
(2) | Total lots excludes homes under construction. |
Acquisition Process
Our ability to identify, evaluate and acquire land in desirable locations and on favorable terms is critical to our success. We evaluate land opportunities based on risk-adjusted returns and employ a rigorous due diligence process to identify risks, which we then seek to mitigate if we pursue the property.
We often purchase land parcels from large, long-term landowners who sell portions of their land to benefit from our experience in planning and executing complex land development projects. We also purchase land from large real estate developers who recognize the benefit of working with an experienced and reputable developer and homebuilder. Additionally, we acquire land from owners who want to leverage our expertise in land entitlement so that the owners may later sell all or part of their land to us after entitlement. We also acquire land from other developers who want our controlled builders to build homes in their neighborhoods.
We identify attractive properties that are typically located in existing prime neighborhood locations. We consider the existing and future supply of developable land before working to acquire the best-valued properties. Analysis includes consideration of development costs in addition to land costs. We have found that the prime quality infill locations have limited supply competition that may result in smaller value declines in down markets.
After contracting for a property, we perform due diligence to evaluate any environmental or geotechnical issues that may exist. We often seek to secure entitlements such as zoning or plat approval during this period. After title has been reviewed and approved, the property is acquired. We manage and oversee all land development with our in-house staff.
Homebuilding, Marketing and Sales Process
TPG builds townhomes and single family homes in the Atlanta market. TPG’s townhomes range from 1,400 to 2,800 square feet and range in price from $310,000 to $650,000. TPG’s single family homes range from 2,000 to 5,800 square feet and range in price from $440,000 to $1.1 million. TPG has received numerous industry awards, including the Gold OBIE Award for Best Single Family Home Detached Home Design in 2017 and the Master Planned Community of the Year by the Greater Atlanta Home Builders Association in 2016.
12
In the Dallas market, our controlled builders construct townhomes, single family homes and luxury homes. CB JENI builds townhomes with 1,400 to 2,600 square feet and prices ranging from $250,000 to $430,000. CB JENI has received numerous industry awards, including the McSAM award for Best Architectural Design Townhome Plan by the Dallas Builders Association in 2017 and the McSAM award for Master Planned Community of the Year Under 600 Acres by the Dallas Builders Association in 2017. Normandy constructs single family homes with over 1,700 square feet and prices between $320,000 and $700,000. Normandy has received numerous industry awards, including McSAM award for Best Interior Merchandising in 2017 and Home of the Year by the Dallas Builders Association in 2016. Southgate builds luxury homes with up to 4,500 square feet and prices between $550,000 and $1.3 million. Southgate also acts as a contractor on homes up to $1.6 million. Southgate has received numerous industry awards, including the McSAM award for Community of the Year by the Dallas Builders Association in 2017. Centre Living builds homes and luxury townhomes, in premier centrally located neighborhoods in the Dallas market, ranging from 1,400 to 4,000 square feet and prices from $320,000 to more than $1.5 million. Centre Living has received several industry awards, including the McSAM award for Best Architectural Design above $800,000 and between $500,000 and $600,000 by the Dallas Builders Association in 2017.
We offer a preferred lender referral program to provide lending options to homebuyers in need of financing. We offer homeowners a comprehensive warranty on each home. Homes are generally covered by a ten-year warranty for structural concerns, one year for defects and products used, two years for electrical, plumbing and HVAC parts and labor.
We sell our homes through our own sales representatives and also through independent real estate brokers. Our in-house sales force typically works from sales offices located in model homes near or in each community. Sales representatives assist potential buyers by providing them with basic floor plans, price information, development and construction timetables, tours of model homes, and the selection of customization and upgrade options. Sales personnel are trained by us and generally have had prior experience selling new homes in the local market. Our personnel, along with subcontracted marketing and design consultants, carefully design the exterior and interior of each home to appeal to the lifestyles of targeted homebuyers. Additionally, we advertise through the use of model homes, Internet, newspapers, billboards, publications, brochures, and newsletters.
Seasonality
The homebuilding industry experiences seasonal fluctuations in quarterly operating results and capital requirements. We typically experience the highest new home order activity in spring and summer, although this activity is also highly dependent on the number of active selling communities, timing of new community openings and other market factors. Since it typically takes five to nine months to construct a new home, we deliver more homes in the second half of the year as spring and summer home orders are delivered. Because of this seasonality, home starts, construction costs and related cash outflows have historically been highest in the second and third quarters, and the majority of cash receipts from home deliveries occur during the third and fourth quarters. We expect this seasonal pattern to continue over the long-term, although it may be affected by volatility in the homebuilding industry.
Segments
Prior to the fourth quarter of 2016, the Company’s operations were organized into two reportable segments: builder operations and land development. Builder operations consisted of two operating segments: Texas and Georgia. In accordance with Accounting Standards Codification (“ASC”) 280, Segment Reporting (“ASC 280”), in determining our reportable segments, we considered similar economic and other characteristics, including geography, product types, production processes, average selling prices, gross profits, suppliers, land acquisition results, and underlying demand and supply.
In accordance with ASC 280, an operating segment is defined as a component of an enterprise for which discrete financial information is available and is reviewed regularly by the Chief Operating Decision Maker (“CODM”), or decision-making group, to evaluate performance and make operating decisions. Prior to 2016, the Company identified its CODM as four key executives—the Chief Executive Officer, Chief Financial Officer, Chief Operating Officer and President of Texas Region (formerly, the Head of Land Acquisition and Development). As a result of the departure of the Chief Operating Officer, the management structure and CODM changed during 2016. During the fourth quarter of 2016, the Company re-evaluated its reportable segments under ASC 280.
Beginning in the fourth quarter of 2016, the Company identified its CODM as three key executives—the Chief Executive Officer, Chief Financial Officer and President of Texas Region. In determining the most appropriate reportable segments, the CODM considers similar economic and other characteristics, including geography, class of customers, product types and production processes. The discrete financial information that is regularly reviewed by the current CODM group is different than in the past. As such, the builder operations reportable segment has consisted of three operating segments since the fourth quarter of 2016: Texas, Georgia, and corporate and other. The operations of the Company’s controlled builders were aggregated
13
into the Texas and Georgia operating segments based on similar (1) economic characteristics; (2) housing products; (3) class of homebuyer; (4) regulatory environments; and (5) methods used to construct and sell homes.
Corporate operations is a non-operating segment that develops and implements strategic initiatives and supports the Company’s builder operations and land development segments by centralizing certain administrative functions such as finance, treasury, information technology and human resources. The majority of corporate personnel and resources are primarily dedicated to activities relating to the builder operations segment. Therefore, any unallocated corporate expenses are included in the corporate and other operating segment, within the builder operations segment which accounts for 95.9%, 96.1% and 87.3% of total revenues, for the years ended December 31, 2017, 2016 and 2015, respectively.
The Company uses the equity method of accounting for its investment in Challenger Subsidiary over which it exercises significant influence but does not have a controlling interest. The Challenger Subsidiary constructs townhouses, single family homes and luxury patio homes, and is headquartered in Colorado Springs, Colorado. While the operations of the Challenger Subsidiary meet the criteria for an operating segment within the builder operations segment, such operations did not meet the quantitative thresholds, as discussed in ASC 280, to be separately reported and disclosed. As such, Challenger Subsidiary’s results are included within the corporate and other operating segment, within the builder operations segment.
While the operations of Green Brick Title are not economically similar to either builder operations or land development, the results of such operations did not meet the quantitative thresholds to be separately reported and disclosed. As such, Green Brick Title’s results are included within the builder operations segment within the corporate and other operating segment.
All 2015 segment information has been restated to conform with the 2016 and 2017 presentation. The changes in the reportable segments have no effect on the consolidated balance sheets, statements of income or cash flows for the periods presented. Financial information about our segments appears in Note 13, “Segment Information,” of the notes to consolidated financial statements included in this Annual Report on Form 10-K.
Raw Materials
Typically, all the raw materials and most of the components used in our business are readily available in the United States. Most are standard items carried by major suppliers. However, a rapid increase in the number of homes started could cause shortages in the availability of such materials or in the price of services, thereby leading to delays in the delivery of homes. We continue to monitor the supply markets to achieve the best prices available. See “Risk Factors — Labor and raw material shortages and price fluctuations could delay or increase the cost of land development and home construction, which could materially and adversely affect our business.”
Corporate Organization and Structure
We carry out our business generally through a number of project-specific, wholly-owned limited liability company subsidiaries. Our homebuilding operations business is conducted primarily through Builder Finance, and the land development operations conducts its business under the brand Green Brick Communities.
Government Regulation and Environmental Matters
Our developments are subject to numerous local, state, federal and other statutes, ordinances, rules and regulations concerning zoning, development, building design, construction and similar matters that impose restrictive zoning and density requirements, the result of which is to limit the number of homes that can be built within the boundaries of a particular area. Projects that are not entitled may be subjected to periodic delays, changes in use, less intensive development or elimination of development in certain specific areas due to government regulations. We may also be subject to periodic delays or may be precluded entirely from developing in certain communities due to building moratoriums or “slow-growth” or “no-growth” initiatives that could be implemented in the future. Local governments also have broad discretion regarding the imposition of development and service fees for projects in their jurisdiction. Projects for which we have received land use and development entitlements or approvals may still require a variety of other governmental approvals and permits during the development process and can also be impacted adversely by unforeseen health, safety and welfare issues, which can further delay these projects or prevent their development.
We are also subject to a variety of local, state, federal and other statutes, ordinances, rules and regulations concerning the environment. The particular environmental laws that apply to any given homebuilding site vary according to multiple factors, including the site’s location, its environmental conditions and the present and former uses of the site, as well as adjoining properties. Environmental laws and conditions may result in delays, may cause us to incur substantial compliance and other costs, and can prohibit or severely restrict homebuilding and land development activity in environmentally sensitive regions or
14
areas. In addition, in those cases where an endangered or threatened species is involved, environmental rules and regulations can result in the restriction or elimination of development in identified environmentally sensitive areas. From time to time, the United States Environmental Protection Agency and similar federal or state agencies review homebuilders’ compliance with environmental laws and may levy fines and penalties for failure to comply strictly with applicable environmental laws or impose additional requirements for future compliance as a result of past failures. Any such actions taken may increase our costs. Further, we expect that increasingly stringent requirements will be imposed on homebuilders and land developers in the future. Environmental regulations can also have an adverse impact on the availability and price of certain raw materials such as lumber.
Under various environmental laws, current or former owners of real estate, as well as certain other categories of parties, may be required to investigate and clean up hazardous or toxic substances or petroleum product releases, and may be held liable to a governmental entity or to third parties for related damages, including for bodily injury, and for investigation and clean-up costs incurred by such parties in connection with the contamination. Please see the “Risk Factors” section elsewhere in this Annual Report on Form 10-K.
Competition
Competition in the homebuilding industry is intense, and there are relatively low barriers to entry. Homebuilders compete for, among other things, homebuyers, desirable land parcels, financing, raw materials and skilled labor. Increased competition could hurt our business, as it could prevent us from acquiring attractive land parcels on which to build homes or make such acquisitions more expensive, hinder our market share expansion, and lead to pricing pressures on our homes that may adversely impact our revenues and margins. If we are unable to successfully compete, our business, prospects, liquidity, financial condition and results of operations could be materially and adversely affected. Our competitors may independently develop land and construct housing units that are superior or substantially similar to our products. Furthermore, a number of our primary competitors are significantly larger, have a longer operating history and may have greater resources or lower cost of capital; accordingly, they may be able to compete more effectively in one or more of the markets in which we operate. Many of these competitors also have longstanding relationships with subcontractors and suppliers in the markets in which we operate. We also compete for sales with individual resales of existing homes and with available rental housing.
Employees
As of December 31, 2017, we had approximately 260 employees, including those of our controlled builders. Although none of our employees are covered by collective bargaining agreements, certain of the subcontractors engaged by us or our affiliates are represented by labor unions or are subject to collective bargaining arrangements. We believe that our relations with our employees and subcontractors are favorable.
Offices and Available Information
Our principal executive offices are located at 2805 Dallas Parkway, Ste 400, Plano, Texas 75093. Our telephone number is (469) 573-6755. Our website address is www.greenbrickpartners.com. Our Annual Reports on Form 10-K, Quarterly Reports on Form 10-Q, Current Reports on Form 8-K and amendments to those reports filed or furnished pursuant to Section 13 or 15(d) of the Exchange Act are available free of charge through our website as soon as reasonably practicable after they are electronically filed with, or furnished to, the SEC. Our website and the information contained or incorporated therein are not intended to be incorporated into this Annual Report on Form 10-K.
Executive Officers of the Registrant
The following table sets forth certain information regarding our executive officers as of March 12, 2018:
Name | Age | Position |
James R. Brickman | 66 | Chief Executive Officer and Director |
Richard A. Costello | 59 | Chief Financial Officer |
Jed Dolson | 40 | President of Texas Region |
Summer Loveland | 46 | Chief Accounting Officer |
James R. Brickman - Mr. Brickman has been our Chief Executive Officer and one of our directors since October 2014. Mr. Brickman was the founding manager and advisor of Capital since 2008 and Builder Finance since 2010. Mr. Brickman is responsible for all major investment decisions, capital allocation, strategic planning, and relationships with our controlled builders and lead investor. Prior to forming JBGL in 2008, Mr. Brickman was a manager of various joint ventures and limited partnerships that developed/built low and high-rise office buildings, multifamily and condominium homes, single family
15
homes, entitled land, and supervised a property management company. He previously also served as Chairman and CEO of Princeton Homes Ltd. and Princeton Realty Corporation that developed land, constructed single family custom homes, and managed apartments it built. Mr. Brickman has over 40 years of experience in nearly all phases of real estate construction, development, and real estate finance property management. He received a B.B.A. and M.B.A. from Southern Methodist University.
Richard A. Costello - Mr. Costello has been our Chief Financial Officer since April 2015. From January 2015 until his appointment as Chief Financial Officer, Mr. Costello served as our Vice President of Finance. Mr. Costello has over 25 years of financial and operational experience in all aspects of real estate management. Since 2007, Mr. Costello has been a private investor. Previously, he worked for 16 years at GL Homes of Florida, one of the largest private developers and homebuilders in Florida. There he served as Chief Financial Officer and Chief Operating Officer as well as in other senior financial management roles. Prior to joining GL Homes, Mr. Costello worked for six years as AVP-Finance of Paragon Group, a regional commercial real estate developer, and for four years as an auditor for KPMG LLP. Mr. Costello received a B.S. in Accounting from the University of Central Florida and his M.B.A. from Kellogg School of Northwestern University.
Jed Dolson - Mr. Dolson has been the President of Texas Region of the Company since October 2017. Prior to that time, he was Head of Land Acquisition and Development from September 2013. From March 2010 to September 2013, Mr. Dolson served as a managing member of Pecos One LLC, a consulting firm that provided services to JBGL. Prior to joining the Company, Mr. Dolson worked for three years at Jones & Boyd Engineering and later he served five years as Director of Development for a local private residential developer. Mr. Dolson received a B.S. degree in Civil Engineering from Texas A&M University and a M.S. in Civil Engineering from Stanford University.
Summer Loveland - Ms. Loveland has been our Chief Accounting Officer since November 2017. Ms. Loveland has over 20 years of accounting and financial reporting experience in the financial services industry. Prior to joining the Company, Ms. Loveland served as Chief Financial Officer of the Dallas Police and Fire Pension System from November 2013 to November 2017 and previously worked in the audit practice of KPMG LLP for 15 years. Ms. Loveland received a B.B.A. in Accounting from Texas A&M University and an M.B.A from Southern Methodist University and is a licensed Certified Public Accountant in Texas and California.
16
ITEM 1A. RISK FACTORS
Set forth below are the risks that we believe are material to our investors. Any of these risks could significantly and adversely affect our business, prospects, financial condition and results of operations. You should carefully consider the risks described below, together with the other information included in this Annual Report on Form 10-K, including the information contained under the caption “Forward-Looking Statements”.
Risks Related to Ownership of Our Common Stock
The price of our common stock may continue to be volatile.
The trading price of our common stock is highly volatile and could be subject to future fluctuations in response to a number of factors beyond our control. In recent years the stock market has experienced significant price and volume fluctuations. These fluctuations may be unrelated to the operating performance of particular companies. These broad market fluctuations may cause declines in the market price of our common stock. The price of our common stock could fluctuate based upon factors that have little or nothing to do with our company or its performance, and those fluctuations could materially reduce our common stock price. If we fail to meet expectations related to future growth, profitability or other market expectations, our stock price may decline significantly, which could have a material adverse impact on investor confidence and our stock price.
Certain large stockholders own a significant percentage of our shares and exert significant influence over us. Their interests may not coincide with ours and they may make decisions with which we may disagree.
Greenlight Capital, Inc. and its affiliates (“Greenlight”), Third Point LLC and its affiliates (“Third Point”), and James R. Brickman beneficially own approximately 47.7%, 16.2% and 3.6%, respectively, of the voting power of the Company. These large stockholders, acting together, could determine substantially all matters requiring stockholder approval, including the election of directors and approval of significant corporate transactions, such as a sale or other change of control transaction. In addition, this concentration of ownership may delay or prevent a change in control of our company and make some transactions more difficult or impossible without the support of these stockholders. The interests of these stockholders may not always coincide with our interests as a company or the interests of other stockholders. Accordingly, these stockholders could cause us to enter into transactions or agreements that you would not approve or make decisions with which you may disagree.
We do not intend to pay dividends on our common stock for the foreseeable future.
We have not paid any dividends since our inception and do not anticipate paying any cash dividends on our common stock in the foreseeable future. Any payment of future dividends will be at the discretion of our Board of Directors and will depend upon, among other things, our earnings, financial condition, capital requirements, levels of indebtedness, statutory and contractual restrictions applying to the payment of dividends or contained in our financing instruments and other considerations that the Board of Directors deems relevant. Investors must rely on sales of their common stock after price appreciation, which may never occur, as the only way to realize a return on their investment. Investors seeking cash dividends should not purchase our common stock.
Certain large stockholders’ shares may be sold into the market in the future, which could cause the market price of our common stock to decrease significantly.
We believe that all or a significant portion of our common stock beneficially owned by Greenlight, Third Point and Mr. Brickman are “restricted securities” within the meaning of the federal securities laws because they were acquired from us on a private, non-registered basis. We have entered into registration rights agreements with each of these parties, however, that give these parties the right to require us to register the resale of their shares under certain circumstances. If these holders sell substantial amounts of these shares, the price of our common stock could decline. In addition, the sale of these shares could impair our ability to raise capital through the sale of additional equity securities.
Risks Related to Our Tax Asset and Organizational Structure
Our ability to use net operating loss carryforwards to offset future taxable income for U.S. federal income tax purposes may be limited.
As of December 31, 2017, we reported federal net operating loss carryforwards of approximately $67.0 million, which will begin to expire, if not used, beginning with the year ending December 31, 2029.
17
For accounting purposes, a valuation allowance is required to reduce our potential deferred tax assets if it is determined that it is more-likely-than-not that all or some portion of such assets will not be realized due to the lack of sufficient taxable income. Based on the availability of historical financial results, projections of pre-tax book income and the assessment of available positive and negative information, management believes, on a more-likely-than-not basis, that the deferred tax assets will be realized. However, on December 22, 2017, the U.S. government enacted comprehensive tax legislation commonly referred to as the Tax Cuts and Jobs Act (the “Tax Act”). Among other changes (discussed further below), the Tax Act lowered the corporate income tax rate from 35% to 21% effective January 1, 2018. Having considered the impacts of the Tax Act, management continues to believe on a more-likely-than-not basis that the deferred tax assets will be realized with the exception of Minnesota and Nebraska state net operating loss carryforwards. Accordingly, a valuation allowance has been recorded with respect to the ability to use the Minnesota and Nebraska state net operating losses (“NOL”) in an amount of $1.3 million.
Our ability to utilize our tax attributes, such as NOL carryforwards and tax credits (“Tax Attributes”), will be subject to significant limitation for federal income tax purposes if we undergo an “ownership change” as defined in Section 382 of the Internal Revenue Code of 1986, as amended (the “Code”). For this purpose, an ownership change generally occurs, as of any “testing date” (as defined under Section 382 of the Code), if our “5-percent shareholders” have collectively increased their ownership in our common stock by more than 50 percentage points over their lowest percentage ownership at any time during the relevant testing period, which generally begins the later of either January 1, 2008 or three years preceding the relevant testing date. In general, our 5-percent shareholders would include any (i) individual who owns 5% or more (directly, indirectly or constructively) of our common stock and (ii) “public groups” who own our common stock (even in certain cases if they own less than 5% of our common stock) or stock in higher tier entities who own 5% or more (directly, indirectly or constructively) of our common stock. A “public group” generally consists of a group of persons each of whom owns (directly, indirectly or constructively) less than 5% of our common stock. An ownership change may therefore occur following substantial changes in the direct or indirect ownership of our outstanding stock by one or more 5-percent shareholders over this period.
If we were to experience an ownership change, Section 382 of the Code imposes an annual limitation on the amount of our post-change taxable income that may be offset by our pre-change Tax Attributes. The limitation imposed by Section 382 of the Code for any post-change year is generally determined by multiplying the value of our common stock immediately before the ownership change by the applicable long-term tax-exempt rate. Any unused annual limitation may, subject to certain limits, be carried over to later years.
To reduce the likelihood of an ownership change, our Board of Directors has implemented the Section 382 rights agreement, and our Amended and Restated Certificate of Incorporation (“Charter”) contains customary transfer and ownership limitations regarding preservation of our NOLs.
Our ability to utilize our Tax Attributes to reduce taxable income in future years may be limited for various reasons, including if our projected future taxable income is insufficient to recognize the full benefit of such Tax Attributes prior to their expiration and/or if the Internal Revenue Service (“IRS”) successfully asserts that a transaction or transactions were concluded with the principal purpose of securing future tax benefits. There can be no assurance that we will have sufficient taxable income or that the IRS will not successfully challenge the use of our Tax Attributes to enable us to utilize the Tax Attributes in full before they expire.
We cannot predict the impact of recently enacted U.S. tax reform legislation on any future generated NOLs, business or financial condition.
The Tax Act makes major changes to the Code, and includes a number of provisions that affect the taxation of corporations, such as, among other things, lowering the corporate income tax rate from 35% to 21%, modifying the rules regarding limitations on certain deductions for executive compensation, introducing a capital investment deduction in certain circumstances, placing certain limitations on the interest deduction, modifying the rules regarding the usability of certain net operating losses arising in taxable years ending after December 31, 2017, and the migration from a worldwide system of taxation to a modified territorial system with corresponding measures to prevent base erosion. With respect to purchasing homes, among the possible changes that could make such purchasing less attractive are (i) limitations on the ability of homebuyers to deduct property taxes, (ii) limitations on the ability of homebuyers to deduct mortgage interest, and (iii) limitations on the ability of homebuyers to deduct state and local income taxes. Because at this time the overall impact of the Tax Act is uncertain, the ultimate effect of the Tax Act on our business and financial condition is uncertain and could be adverse.
18
Provisions in our charter documents may delay or prevent our acquisition by a third-party or may reduce the value of your investment.
Some provisions in our Charter and bylaws may be deemed to have an anti-takeover effect and may delay, defer or prevent a tender offer or takeover attempt that a stockholder may deem to be in his or her best interest. For example, our Board of Directors may determine the rights, preferences, privileges and restrictions of unissued series of preferred stock without any vote or action by our stockholders. In addition, stockholders must provide advance notice to nominate directors or to propose business to be considered at a meeting of stockholders and may not take action by written consent. Additionally, both our Section 382 rights agreement and our Charter contain transfer restrictions intended to prevent future acquisitions of our common stock that would limit our ability to use the NOLs. The existence of these provisions could also limit the price that investors may be willing to pay in the future for shares of our common stock.
Risks Related to our Business and Industry
The homebuilding industry is cyclical. A severe downturn in the industry, such as the one experienced in 2006 through 2011, could adversely affect our business, results of operations and stockholders’ equity.
The residential homebuilding industry is cyclical and is highly sensitive to changes in general economic conditions such as levels of employment, consumer confidence and income, availability of financing for acquisitions, construction and permanent mortgages, interest rate levels, inflation and demand for housing. The U.S. housing market has been negatively impacted by declining consumer confidence, restrictive mortgage standards and large supplies of foreclosures, resales and new homes, among other factors. When combined with a prolonged economic downturn, high unemployment levels, increases in the rate of inflation and uncertainty in the U.S. economy, these conditions have contributed to decreased demand for housing, declining sales prices and increasing pricing pressure. While national data indicates that the overall demand for new homes improved during the year, in the event that the current recovery stalls or reverses and these economic and business trends continue or decline further, we could experience declines in the market value of our inventory and demand for our lots, homes and construction loans, which could have a material adverse effect on our business, prospects, liquidity, financial condition and results of operations.
Our operating performance is subject to risks associated with the real estate industry.
Real estate investments are subject to various risks and fluctuations and cycles in value and demand, many of which are beyond our control. Certain events may decrease cash available for operations, as well as the value of our real estate assets. These events include, but are not limited to:
• | adverse changes in international, national or local economic and demographic conditions; |
• | adverse changes in financial conditions of buyers and sellers of properties, particularly residential homes and land suitable for development of residential homes; |
• | competition from other real estate investors with significant capital, including other real estate operating companies and developers and institutional investment funds; |
• | fluctuations in interest rates, which could adversely affect the ability of homebuyers to obtain financing on favorable terms or at all; |
• | unanticipated increases in expenses, including, without limitation, insurance costs, development costs, real estate assessments and other taxes and costs of compliance with laws, regulations and governmental policies; and |
• | changes in enforcement of laws, regulations and governmental policies, including, without limitation, health, safety, environmental, zoning and tax laws. |
In addition, periods of economic slowdown or recession, rising interest rates or declining demand for real estate, or the public perception that any of these events may occur, could result in a general decline in the purchase of homes or an increased incidence of home order cancellations. If we cannot successfully implement our business strategy, our business, prospects, liquidity, financial condition and results of operations will be adversely affected.
Further, acts of war, any outbreak or escalation of hostilities between the United States and any foreign power or acts of terrorism may cause disruption to the U.S. economy, or the local economies of the markets in which we operate, cause shortages of building materials, increase costs associated with obtaining building materials, result in building code changes that could increase costs of construction, affect job growth and consumer confidence or cause economic changes that we cannot anticipate, all of which could reduce demand for our lots, homes and construction loans and adversely impact our business, prospects, liquidity, financial condition and results of operations.
19
Our business and financial results could be adversely affected by significant inflation or deflation.
Inflation can adversely affect our homebuilding operations by increasing costs of land, financing, materials, labor and construction. While we attempt to pass on cost increases to homebuyers through increased prices, in a weak housing market, we may not be able to offset cost increases with higher selling prices. In addition, significant inflation is often accompanied by higher interest rates, which have a negative impact on housing demand. In a highly inflationary environment, depending on industry and other economic conditions, we may be precluded from raising home prices enough to keep up with the rate of inflation, which could reduce our profit margins. Moreover, with inflation, the costs of capital increase and the purchasing power of our cash resources could decline. Current or future efforts by the government to stimulate the economy may increase the risk of significant inflation and its adverse impact on our business or financial results.
Alternatively, a significant period of deflation could cause a decrease in overall spending and borrowing levels. This could lead to a further deterioration in economic conditions, including an increase in the rate of unemployment. Deflation could also cause the value of our inventory to decline or reduce the value of existing homes below the related mortgage loan balance, which could potentially increase the supply of existing homes and have a negative impact on our results of operations.
We are dependent on the continued availability and satisfactory performance of subcontractors which, if unavailable, could have a material adverse effect on our business.
We conduct our land development and construction operations only as a general contractor. Virtually all land development and construction work is performed by unaffiliated third-party subcontractors. As a consequence, the timing and quality of the development of our land and the construction of our homes depends on the availability and skill of our subcontractors. There may not be sufficient availability of and satisfactory performance by these unaffiliated third-party subcontractors in the markets in which we operate. In addition, inadequate subcontractor resources could have a material adverse effect on our business.
We have recently experienced labor shortages and increased labor costs in both the Dallas and Atlanta markets. These labor shortages have resulted in higher wages for subcontractors, construction workers frequently moving between jobs for higher pay, increased prices and delays in projects.
Labor and raw material shortages and price fluctuations could delay or increase the cost of land development and home construction, which could materially and adversely affect our business.
The residential construction industry experiences labor and raw material shortages from time to time, including shortages in qualified tradespeople and supplies such as insulation, drywall, cement, steel and lumber. These labor and raw material shortages can be more severe during periods of strong demand for housing if either of the regions in which we operate experiences a natural disaster that has a significant impact on existing residential and commercial structures. The cost of labor and raw materials may also be adversely affected during periods of shortage or high inflation. Shortages and price increases could cause delays in, and increase our costs of, land development and home construction, which in turn could have a material adverse effect on our business, prospects, liquidity, financial condition and results of operations.
Failure to recruit, retain and develop highly skilled, competent employees may have a material adverse effect on our business and results of operations.
Key employees, including management team members at both the corporate and homebuilder subsidiary levels, are fundamental to our ability to obtain, generate and manage opportunities. If any of the management team members were to cease employment with us, our results of operations could suffer. Our ability to retain our management team or to attract suitable replacements should any members of its management team leave is dependent on the competitive nature of the employment market. The loss of services from key management team members or a limitation in their availability could materially and adversely impact our business, prospects, liquidity, financial condition and results of operations. Further, such a loss could be negatively perceived in the capital markets. In addition, we do not maintain key person insurance in respect of any member of our named executive officers.
In addition, key employees working in the land development, homebuilding and construction industries are highly sought after. Experienced employees in the homebuilding, land acquisition and construction industries are fundamental to our ability to generate, obtain and manage opportunities. In particular, local knowledge and relationships are critical to our ability to source attractive land acquisition opportunities. Failure to attract and retain such personnel or to ensure that their experience and knowledge is not lost when they leave the business through retirement, redundancy or otherwise may adversely affect the standards of our service and may have an adverse impact on our business, financial conditions and results of operations.
20
Our long-term success depends on our ability to acquire undeveloped land, partially-finished developed lots and finished lots suitable for residential homebuilding at reasonable prices, in accordance with our land investment criteria.
The homebuilding industry is highly competitive for suitable land and the risk inherent in purchasing and developing land increases as consumer demand for housing increases. The availability of finished and partially-finished developed lots and undeveloped land for purchase that meet our investment criteria depends on a number of factors outside our control, including land availability in general, competition with other homebuilders and land buyers, inflation in land prices, zoning, allowable housing density, the ability to obtain building permits and other regulatory requirements. Should suitable land or lots become more difficult to locate or obtain, the number of lots we may be able to develop and sell could decrease, the number of homes we may be able to build and sell could be reduced and the cost of land could increase, perhaps substantially, which could adversely impact our results of operations.
As competition for suitable land increases, the cost of acquiring both finished and undeveloped lots and the cost of developing owned land could rise and the availability of suitable land at acceptable prices may decline, which could adversely impact our financial results. The availability of suitable land assets could also affect the success of our land acquisition strategy, which may impact our ability to increase the number of active selling communities, to grow our revenues and margins and to achieve or maintain profitability.
If we are unable to develop communities successfully or within expected timeframes, our results of operations could be adversely affected.
Before a community generates any revenue, time and material expenditures are required to acquire and prepare land, entitle and finish lots, obtain development approvals, pay taxes and construct significant portions of project infrastructure, amenities, model homes and sales facilities. It can take several years from the time that we acquire control of a property to the time that we make our first home sale on the site. Delays in the development of communities expose us to the risk of changes in market conditions for homes. A decline in our ability to develop and market our communities successfully and to generate positive cash flow from these operations in a timely manner could have a material adverse effect on our business and results of operations and on our ability to service our debt and to meet our working capital requirements.
Because real estate investments are relatively illiquid, our ability to promptly sell one or more properties for reasonable prices in response to changing economic, financial and investment conditions may be limited and we may be forced to hold non-income producing properties for extended periods of time.
Real estate investments are relatively difficult to sell quickly. As a result, our ability to promptly sell one or more properties in response to changing economic, financial and investment conditions is limited and we may be forced to hold non-income producing assets for an extended period of time. We cannot predict whether we will be able to sell any property for the price or on the terms that we set or whether any price or other terms offered by a prospective purchaser would be acceptable to us. We also cannot predict the length of time needed to find a willing purchaser and to close the sale of a property.
We depend on the success of our controlled builders.
Historically, we have participated in the homebuilding business through subsidiaries in which we own a 50% equity interest and a 51% voting interest, which we refer to as our “controlled builders.” In addition, we have the ability to appoint two of the three board managers of each controlled builder and we are able to exercise control over the operations of each controlled builder. We have entered into arrangements with these controlled builders in order to take advantage of the local knowledge and relationships of the controlled builders, acquire attractive land positions and brand images, manage our risk profile and leverage our capital base. Even though the co-investors in our controlled builders are subject to certain non-competition provisions, the viability of our participation in the homebuilding business depends on our ability to maintain good relationships with our controlled builders. Our controlled builders are focused on maximizing the value of their operations and working with a partner that can help them be successful. The effectiveness of our management, the value of our expertise and the rapport we maintain with our controlled builders are important factors for new builders considering doing business with us and may affect our ability to attract homebuyers, subcontractors, employees or others upon whom our business, financial condition and results of operations ultimately depend. Further, our relationships with our controlled builders generate additional business opportunities that support our growth. If we are unable to maintain good relationships with our controlled builders, we may be unable to fully take advantage of existing agreements or expand our relationships with these controlled builders. Additionally, our opportunities for developing new relationships with additional builders may be adversely impacted.
We sell lots to our controlled builders for their homebuilding operations and provide them loans to finance home construction. If our controlled builders fail to successfully execute their business strategies for any reason, they may be unable
21
to purchase lots from us, repay outstanding construction finance loans made by us or borrow from us in the future, any of which could negatively impact our business, financial condition and results of operations.
Our controlled builders’ interests may not be wholly aligned with ours or those of our investors.
Our controlled builders are separate and distinct entities from us. We own a 50% equity interest and a 51% voting interest in our controlled builders. In addition, we have the ability to appoint two of the three board managers of each controlled builder and we are able to exercise control over the operations of each controlled builder. No action can be approved by the board of managers without the approval from at least one individual we have appointed at each controlled builder. However, the officers of our controlled builders are primarily focused on maximizing the value of the controlled builders’ operations rather than our operations which could influence their business decisions, including but not limited to decision-making which they believe to be in their best interests. As a result of the foregoing, their business interests may not be fully aligned with ours and those of our investors, which could lead to actions and results that are not in our, or in our investors’, best interests.
If we are required to either repurchase or sell a substantial portion of the equity interest in our controlled homebuilding subsidiaries, our capital resources and financial condition could be adversely affected.
The operating agreements governing our controlled homebuilding subsidiaries contain buy-sell provisions that may be triggered in certain circumstances. In the event that a buy-sell event occurs, our builder will have the right to initiate a buy-sell process, which may happen at an inconvenient time for us. In the event the buy-sell provisions are exercised at a time when we lack sufficient capital to purchase the remaining equity interest, we may elect to sell our equity interest in the entity. If we are forced to sell our equity interest, we will no longer benefit from the future operations of the applicable entity. If a buy-sell provision is exercised and we elect to purchase the interest in an entity that we do not already own, we may be obligated to expend significant capital in order to complete such acquisition, which may result in our being unable to pursue other investments or opportunities. If either of these events occurs, our revenue and net income could decline or we may not have sufficient capital necessary to implement our growth strategy.
Our geographic concentration could materially and adversely affect us if the homebuilding industry in our current markets should decline.
Our business strategy is focused on the development of land, the issuance of construction finance loans and the design, construction and sale of single family detached and attached homes in the Dallas and Atlanta markets. We also own a noncontrolling interest in Challenger Homes which constructs townhouses, single family homes and luxury patio homes in Colorado Springs. In Dallas, we principally operate in the counties of Dallas, Collin and Denton. In Atlanta, we principally operate in the counties of Fulton, Gwinnett, Cobb, Forsyth, Cherokee and Dekalb. To the extent housing demand and population growth slow in our core markets, our favorable growth outlook may not be realized. Furthermore, we may be unable to compete effectively with the resale home market in our core markets. Because our operations are concentrated in these areas, a prolonged economic downturn in one or more of these areas could have a material adverse effect on our business, prospects, liquidity, financial condition and results of operations, and a disproportionately greater impact on us than other homebuilders with more diversified operations. Further, slower rates of population growth or population declines in the Dallas or Atlanta markets, especially as compared to the high population growth rates in prior years, could affect the demand for housing, causing home prices in these markets to fall and adversely affect our business, financial condition and results of operations.
Our developments are subject to extensive government regulation, which could cause us to incur significant liabilities or restrict our business activities.
Our developments are subject to numerous local, state, federal and other statutes, ordinances, rules and regulations concerning zoning, development, building design, construction and similar matters that impose restrictive zoning and density requirements, the result of which is to limit the number and type of homes that can be built within the boundaries of a particular area. Projects that are not entitled may be subjected to periodic delays, changes in use, less intensive development or elimination of development in certain specific areas due to government regulations. We may also be subject to periodic delays or may be precluded entirely from developing in certain communities due to building moratoriums or “slow-growth” or “no-growth” initiatives that could be implemented in the future. Local governments also have broad discretion regarding the imposition of development and service fees for projects in their jurisdiction. Projects for which we have received land use and development entitlements or approvals may still require a variety of other governmental approvals and permits during the development process and can also be impacted adversely by unforeseen health, safety and welfare issues, which can further delay these projects or prevent their development. As a result, lot and home sales could decline and costs could increase, which could have a material adverse effect on our business, prospects, liquidity, financial condition and results of operations.
22
If the market value of our land and homes drops significantly, our profits would decrease.
The market value of land, building lots and housing inventories can fluctuate significantly as a result of changing market conditions, and the measures we employ to manage inventory risk may not be adequate to insulate our operations from a severe drop in inventory values. We acquire land for replacement of land inventory and expansion within our current markets, and may in the future acquire land for expansion into new markets. If housing demand decreases below what we anticipated when we acquired our inventory, we may not be able to generate profits consistent with those we have generated in the past and we may not be able to recover our costs when we sell lots and homes. When market conditions are such that land values are not appreciating, option arrangements previously entered into may become less desirable, at which time we may elect to forego deposits and pre-acquisition costs and terminate such arrangements. In the face of adverse market conditions, we may have substantial inventory carrying costs, may have to write down our inventory to its fair value in accordance with generally accepted accounting principles and/or may have to sell land or homes at a loss. Any material write-downs of assets, or sales at a loss, could have a material adverse effect on our business, prospects, liquidity, financial condition and results of operations.
The terms and availability of mortgage financing can affect consumer demand for homes and the ability of homebuyers to complete the purchase of a home. Because most of our homebuyers, and the homebuyers of those third-party entities to whom we sell lots, finance the purchase of their homes, unfavorable terms in, or the unavailability of, mortgage financing could materially and adversely affect us.
Our business depends on the ability of our homebuyers, as well as the ability of those who buy homes from the third-party homebuilding entities to which we sell lots (our “homebuilding customers”), to obtain financing for the purchase of their homes. Many of these homebuyers must sell their existing homes in order to buy a home from us or our homebuilding customers. Periodically, lenders, investors, regulators and other third parties may question the adequacy of lending standards and other credit requirements for various loan programs available to borrowers. This may lead to tightened credit requirements and an increase in indemnity claims for mortgages, as has occurred in the past. For example, deterioration in credit quality among subprime and other nonconforming loans previously caused most lenders to eliminate subprime mortgages and most other loan products that do not conform to Federal National Mortgage Association (“Fannie Mae”), Federal Home Loan Mortgage Corporation (“Freddie Mac”), Federal Housing Administration (the “FHA”) or Veterans Administration (the “VA”) standards. Fewer loan products and tighter loan qualifications, in turn, may make it more difficult for a borrower to finance the purchase of a new home or the purchase of an existing home from a potential “move-up” buyer who wishes to purchase a home from us or our homebuilding customers. If potential buyers of our or our homebuilding customers’ homes, or the buyers of those potential buyers’ existing homes, cannot obtain suitable financing, our business, prospects, liquidity, financial condition and results of operations could be materially and adversely affected.
Interest rate increases or changes in federal lending programs or other regulations could lower demand for our lots, homes and construction finance loans, which could materially and adversely affect our business and results of operations.
Rising interest rates, decreased availability of mortgage financing or of certain mortgage programs, higher down payment requirements or increased monthly mortgage costs may lead to reduced demand for our homes, lots and construction loans. Increased interest rates can also hinder our ability to realize our backlog because certain of our home purchase contracts provide homebuyers with a financing contingency. Financing contingencies allow homebuyers to cancel their home purchase contracts in the event that they cannot arrange for adequate financing. As a result, rising interest rates can decrease our home sales and mortgage originations. Any of these factors could have a material adverse effect on our business, prospects, liquidity, financial condition and results of operations.
In addition, as a result of the turbulence in the credit markets and mortgage finance industry, the federal government has taken on a significant role in supporting mortgage lending through its conservatorship of Fannie Mae and Freddie Mac, both of which purchase home mortgages and mortgage-backed securities originated by mortgage lenders, and its insurance of mortgages originated by lenders through the FHA and the VA. The availability and affordability of mortgage loans, including consumer interest rates for such loans, could be adversely affected by a curtailment or cessation of the federal government’s mortgage-related programs or policies. The FHA may continue to impose stricter loan qualification standards, raise minimum down payment requirements, impose higher mortgage insurance premiums and other costs and/or limit the number of mortgages it insures. Due to growing federal budget deficits, the U.S. Treasury may not be able to continue supporting the mortgage-related activities of Fannie Mae, Freddie Mac, the FHA and the VA at present levels, or it may revise significantly the federal government’s participation in and support of the residential mortgage market. Because the availability of Fannie Mae, Freddie Mac, FHA- and VA-backed mortgage financing is an important factor in marketing and selling many of our homes, any limitations, restrictions or changes in the availability of such government-backed financing could reduce our home sales, which could have a material adverse effect on our business, prospects, liquidity, financial condition and results of operations.
23
Any increase in unemployment or underemployment may lead to an increase in the number of loan delinquencies and property repossessions, which would have an adverse impact on our business.
The unemployment rate in the United States was 4.1% as of December 2017, according to the U.S. Bureau of Labor Statistics (“BLS”). In addition, the labor force participation rate reported by the BLS has been declining, from 66.2% in January 2008 to 62.7% in December 2017, potentially reflecting an increased number of “discouraged workers” who have left the labor force. People who are not employed, are underemployed, who have left the labor force or are concerned about the loss of their jobs are less likely to purchase new homes, may be forced to try to sell the homes they own and may face difficulties in making required mortgage payments. Therefore, any increase in unemployment or underemployment may lead to an increase in the number of loan delinquencies and property repossessions and have an adverse impact on us both by reducing demand for our homes, lots and construction loans and by increasing the supply of homes for sale.
Any limitation on, or reduction or elimination of, tax benefits associated with owning a home would have an adverse effect on the demand for our homes, lots and construction loans, which could be material to our business.
As previously discussed, the Tax Act makes major changes to the Code that, in part, may affect demand for new homes. Among the possible changes that could make purchasing homes less attractive are (i) limitations on the ability of homebuyers to deduct property taxes, (ii) limitations on the ability of homebuyers to deduct mortgage interest, and (iii) limitations on the ability of homebuyers to deduct state and local income taxes. Due to such changes, the after-tax cost of owning a new home could increase for many of our potential homebuyers and the potential homebuyers of our homebuilding customers. Because at this time the overall impact of the Tax Act is uncertain, the ultimate effect of the Tax Act on our business and financial condition and the homebuilding industry in general is uncertain and could be adverse.
The occurrence of severe weather or natural disasters could increase our operating expenses and reduce our revenues and cash flows.
The climates and geology of the states in which we and Challenger Homes operate, Georgia, Texas, and Colorado, present increased risks of severe weather and natural disasters. The occurrence of severe weather conditions or natural disasters can delay new home deliveries and lot development, reduce the availability of materials and/or negatively impact the demand for new homes in affected areas. For example, the winter of 2014 - 2015 brought severe weather conditions in the states in which we operate, including extreme rain in Atlanta and Dallas and abnormally low temperatures and icy conditions in the Dallas region, which hindered land development and delayed home construction.
Further, to the extent that hurricanes, severe storms, earthquakes, tornadoes, droughts, floods, wildfires or other natural disasters or similar events occur, our homes under construction or our building lots could be damaged or destroyed, which may result in losses exceeding our insurance coverage. Any of these events could increase our operating expenses, impair our cash flows and reduce our revenues.
High cancellation rates may negatively impact our business.
Our backlog reflects the number and value of homes for which we have entered into non-contingent sales contracts with homebuyers but not yet delivered. Although these sales contracts typically require a cash deposit and do not allow for the sale to be contingent on the sale of the homebuyer’s existing home, a homebuyer may in certain circumstances cancel the contract and receive a complete or partial refund of the deposit as a result of local laws or contract provisions. If home prices decline, the national or local homebuilding environment or general economy weakens, our neighboring competitors reduce their sales prices (or increase their sales incentives), interest rates increase or the availability of mortgage financing tightens, homebuyers may have an incentive to cancel their contracts with us, even where they might be entitled to no refund or only a partial refund. Significant cancellations could have a material adverse effect on our business as a result of lost sales revenue and the accumulation of unsold housing inventory.
We may not be able to compete effectively against competitors in the homebuilding, land development and financial services industries.
Competition in the land development and homebuilding industries is intense, and there are relatively low barriers to entry. Land developers and homebuilders compete for, among other things, homebuyers, desirable land parcels, financing, raw materials and skilled labor. Increased competition could hurt our business, as it could prevent us from acquiring attractive land parcels for development and resale or homebuilding (or make such acquisitions more expensive), hinder our market share expansion and lead to pricing pressures that adversely impact its margins and revenues. If we are unable to compete successfully, our business, prospects, liquidity, financial condition and results of operations could be materially and adversely affected. Our competitors may independently develop land and construct housing units that are superior or substantially similar to our products. Furthermore, a number of our primary competitors are significantly larger, have a longer operating history and
24
may have greater resources or lower cost of capital than us. Accordingly, they may be able to compete more effectively in one or more of the markets in which we operate. Many of these competitors also have longstanding relationships with subcontractors and suppliers in the markets in which we operate. Our homebuilding business also competes for sales with individual resales of existing homes and with available rental housing.
Our construction financing business competes with other lenders, including national, regional and local banks and other financial institutions, some of which have greater access to capital or different lending criteria and may be able to offer more attractive financing to potential homebuyers.
Any strategic investments, joint ventures, and/or partnerships that we make could be adversely affected by our lack of sole decision making authority and conflicts of interest and disputes between us and our partners or co-venturers.
On August 15, 2017, we entered the Colorado market with the acquisition of a 49.9% interest in GB Challenger, LLC, a newly formed Texas limited liability company (the “Challenger Subsidiary”), which holds all of the equity interests in certain homebuilders operating under the name Challenger Homes. Challenger Homes builds townhouses, single family homes and luxury patio homes in Colorado Springs, Colorado. The existing investors in Challenger Homes, together with the Company, will direct the operations of Challenger Homes with the Company holding a noncontrolling interest. We hold two of the five board of managers (the “Managers”) seats of the Challenger Subsidiary. The Challenger Subsidiary’s six officers, employees of the existing investors in Challenger Homes, were designated by the Managers for the purpose of managing the day to day operations.
In the future we may continue to co-invest with third parties through partnerships, joint ventures or other entities, acquiring noncontrolling interests in or sharing responsibility for managing the affairs of such entities, including homebuilding, land acquisition and/or community development. If we do not have a controlling interest in these entities, we would not be in a position to exercise sole decision-making authority regarding their homebuilding, land acquisition and/or community development activities, and our investment may be illiquid due to our lack of control. Partners or co-venturers may have different economic, financial and industry positions from us which could influence their business decisions, including but not limited to strategic decision-making which they believe to be in their best interests. As a result of the foregoing, their business interests and strategies may conflict with or not be fully aligned with ours and those of our investors, which could lead to actions and results that are not in our, or in our investors’, best interests. Disputes between us and partners or co-venturers may result in litigation or arbitration that would increase our expenses and prevent our officers and/or directors from focusing their time and effort on our business. In addition, we may in certain circumstances be liable for the actions of our partners or co-venturers.
Our future growth may include additional strategic investments, joint ventures, partnerships and/or acquisitions of companies that may not be as successful as we anticipate and could disrupt our ongoing businesses and adversely affect our operations.
Our investments in our homebuilding subsidiaries have contributed to our historical growth and similar investments may be a component of our growth strategy in the future. We may make additional strategic investments, enter into new joint venture or partnership arrangements or acquire businesses, some of which may be significant. These endeavors may involve significant risks and uncertainties, including distraction of management from current operations, significant start-up costs, insufficient revenues to offset expenses associated with these new investments and inadequate return of capital on these investments, any of which may adversely affect our financial condition and results of operations. Our failure to successfully identify and manage future investments, joint ventures, partnerships or acquisitions could harm our results of operations.
We may be unable to obtain suitable bonding for the development of our housing projects.
We are often required to provide bonds to governmental authorities and others to ensure the completion of our projects. Depending on market conditions, surety providers may be reluctant to issue new bonds and may request credit enhancements (such as cash deposits or letters of credit) in order to maintain existing bonds or to issue new bonds. If we are unable to obtain required bonds for our future projects, or if we are required to provide credit enhancements with respect to our current or future bonds, our business, prospects, liquidity, financial condition and results of operations could be materially and adversely affected.
Difficulty in obtaining sufficient capital could result in an inability to acquire land for our developments or increased costs and delays in the completion of development projects.
The homebuilding industry is capital-intensive and requires significant up-front expenditures to acquire land parcels and begin development. Land acquisition, development and construction activities may be adversely affected by any shortage or
25
increased cost of financing or the unwillingness of third parties to engage in partnerships, joint ventures or other alternative arrangements.
We currently have access to a senior secured revolving credit facility with aggregate lending commitments of up to $75.0 million and a senior unsecured revolving credit facility with aggregate lending commitments of up to $130.0 million. As of December 31, 2017, we have $43.0 million of available borrowing capacity under the senior secured revolving credit facility and $55.0 million of available borrowing capacity under the senior unsecured revolving credit facility. Subject to certain terms and conditions, we may, prior to the termination of the senior unsecured revolving credit facility, increase the amount of such revolving credit facility up to a maximum aggregate amount of $200.0 million. We cannot assure you that we will be able to increase the unsecured revolving credit facility or extend its maturity or arrange another facility on acceptable terms or at all.
Furthermore, in the future, we may seek additional capital in the form of equity or debt financing from a variety of potential sources, including additional bank financings and/or securities offerings. The availability of borrowed funds, especially for land acquisition and construction financing, may be greatly reduced nationally, and the lending community may require increased amounts of equity to be invested in a project by borrowers in connection with both new loans and the extension of existing loans. The credit and capital markets are subject to volatility. If we are required to seek additional financing to fund our operations, volatility in these markets may restrict our flexibility to access such financing. If we are not successful in obtaining sufficient capital to fund our planned capital and other expenditures, we may be unable to acquire land for our housing developments and/or to develop the housing. Any difficulty in obtaining sufficient capital for planned development expenditures could also cause project delays and any such delay could result in cost increases. Any one or more of the foregoing events could have a material adverse effect on our business, prospects, liquidity, financial condition and results of operations.
We are subject to environmental laws and regulations, which may increase our costs, limit the areas in which we can build homes and develop land and delay completion of our projects.
We are subject to a variety of local, state, federal and other statutes, ordinances, rules and regulations concerning the environment. The particular environmental laws that apply to any given homebuilding or development site vary according to multiple factors, including the site’s location, its environmental conditions and the present and former uses of the site, as well as adjoining properties. Environmental laws and conditions may result in delays, may cause us to incur substantial compliance and other costs and can prohibit or severely restrict homebuilding and land development activity in environmentally sensitive regions or areas. In addition, in those cases where an endangered or threatened species is involved, environmental rules and regulations can result in the restriction or elimination of development in identified environmentally sensitive areas. From time to time, the United States Environmental Protection Agency and similar federal or state agencies review homebuilders’ compliance with environmental laws and may levy fines and penalties for failure to comply strictly with applicable environmental laws or impose additional requirements for future compliance as a result of past failures. Any such actions taken with respect to us may increase our costs. Further, we expect that increasingly stringent requirements will be imposed on homebuilders and land developers in the future. Environmental regulations can also have an adverse impact on the availability and price of certain raw materials such as lumber.
Under various environmental laws, current or former owners of real estate, as well as certain other categories of parties, may be required to investigate and clean up hazardous or toxic substances or petroleum product releases, and may be held liable to a governmental entity or to third parties for related damages, including for bodily injury, and for investigation and clean-up costs incurred by such parties in connection with the contamination.
A major health and safety incident relating to our business could be costly in terms of potential liabilities and reputational damage.
Building sites are inherently dangerous, and operating in the land development and homebuilding industries poses certain inherent health and safety risks. Due to health and safety regulatory requirements and the number of projects we work on, health and safety performance is critical to the success of all areas of our business. Any failure in health and safety performance may result in penalties for non-compliance with relevant regulatory requirements, and a failure that results in a major or significant health and safety incident is likely to be costly in terms of potential liabilities incurred as a result. Such a failure could generate significant negative publicity and have a corresponding impact on our reputation, our relationships with relevant regulatory agencies or governmental authorities and our ability to attract employees, subcontractors and homebuyers, which in turn could have a material adverse effect on our business, financial condition and results of operations.
26
Poor relations with the residents of our communities, or with local real estate agents, could negatively impact our home sales, which could cause our revenues or results of operations to decline.
Residents of communities we develop rely on us to resolve issues or disputes that may arise in connection with the operation or development of their communities. Efforts made by us to resolve these issues or disputes could be deemed unsatisfactory by the affected residents and subsequent actions by these residents could adversely affect sales or our reputation. In addition, we could be required to make material expenditures related to the settlement of such issues or disputes or to modify its community development plans, which could adversely affect our results of operations.
Most of our potential homebuyers engage local real estate agents that are unaffiliated with us in connection with their search for a new home. If we do not maintain good relations with, and a good reputation among, these real estate agents, the agents may not encourage potential homebuyers to consider, or may actively discourage homebuyers from considering, our communities, which could adversely affect our results of operations.
Information technology failures and data security breaches could harm our business.
We use information technology and other computer resources to carry out important operational and marketing activities, as well as to maintain our business records, including information provided by our homebuyers. Many of these resources are provided to us and/or maintained on our behalf by third-party service providers pursuant to agreements that specify certain security and service level standards. Our ability to conduct our business may be impaired if these resources are compromised, degraded, damaged or fail, whether due to a virus or other harmful circumstance, intentional penetration or disruption of our information technology resources by a third-party, natural disaster, hardware or software corruption or failure or error (including a failure of security controls incorporated into or applied to such hardware or software), telecommunications system failure, service provider error or failure, intentional or unintentional personnel actions (including the failure to follow our security protocols) or lost connectivity to networked resources. A significant and extended disruption in the functioning of these resources could damage our reputation and cause us to lose homebuyers, sales and revenue.
Product liability claims and litigation and warranty claims that arise in the ordinary course of business may be costly, which could adversely affect our business.
As a homebuilder, we are subject to construction defect and home warranty claims arising in the ordinary course of business. These claims are common in the homebuilding industry and can be costly. In addition, the costs of insuring against construction defect and product liability claims are high, and the amount of coverage offered by insurance companies is currently limited. This coverage may be further restricted and become more costly. If the limits or coverages of our current and former insurance programs prove inadequate, or we are not able to obtain adequate, or reasonably priced, insurance against these types of claims in the future, or the amounts currently provided for future warranty or insurance claims are inadequate, we may experience losses that could negatively impact our financial results.
Our business is seasonal in nature, so our quarterly results of operations may fluctuate.
The homebuilding industry experiences seasonal fluctuations in quarterly results of operations and capital requirements. We typically experience the highest new home order activity in spring and summer, although this activity is also highly dependent on the number of active selling communities, timing of new community openings and other market factors. Since it typically takes five to nine months to construct a new home, we deliver more homes in the second half of the year as spring and summer home orders convert to home deliveries. Because of this seasonality, home starts, construction costs and related cash outflows have historically been highest in the second and third quarters, and the majority of cash receipts from home deliveries occurs during the second half of the year. We expect this seasonal pattern to continue over the long-term, although we may also be affected by volatility in the homebuilding industry.
Additionally, weather-related problems may occur in the late winter and early spring, delaying starts or closings or increasing costs and reducing profitability. In addition, delays in opening new communities or new sections of existing communities could have an adverse impact on home sales and revenues. Expenses are not incurred and recognized evenly throughout the year. Because of these factors, our quarterly results of operations may be uneven and may be marked by lower revenues and earnings in some quarters than in others.
Utility and resource shortages or rate fluctuations could have an adverse effect on our operations.
The markets in which we operate may in the future be subject to utility and resource shortages, including significant changes to the availability of electricity and water. Shortages of natural resources in our markets, particularly of water, may make it more difficult for us to obtain regulatory approval of new developments. We may experience material fluctuations in utility and resource costs across our markets, and we may incur additional costs and may not be able to complete construction
27
on a timely basis if such fluctuations arise. Our lumber inventory is particularly sensitive to these shortages. Furthermore, these shortages and rate fluctuations may adversely affect the regional economies in which we operate, which may reduce demand for our homes, lots and construction loans and negatively affect our business and results of operations.
Our business and financial results could be adversely affected by the failure of persons who act on our behalf to comply with applicable regulations and guidelines.
Although we expect all of our employees, officers and directors to comply at all times with all applicable laws, rules and regulations, there may be instances in which subcontractors or others through whom we do business engage in practices that do not comply with applicable regulations or guidelines. Should we learn of practices relating to homes we build, lots we develop or financing we provide that do not comply with applicable regulations or guidelines, we would move actively to stop the non-complying practices as soon as possible and would take disciplinary action with regard to employees who were aware of the practices and did not take steps to address them, including in some instances terminating their employment. However, regardless of the steps we take after we learn of practices that do not comply with applicable regulations or guidelines, we can in some instances be subject to fines or other governmental penalties, and our reputation can be injured, due to the practices having taken place.
We may become subject to litigation, which could materially and adversely affect us.
In the future, we may become subject to litigation, including claims relating to our operations and otherwise in the ordinary course of business. Some of these claims may result in significant defense costs and potentially significant judgments against us, some of which are not, or cannot be, insured against. We generally intend to vigorously defend ourselves. However, we cannot be certain of the ultimate outcomes of any claims that may arise in the future. Resolution of these types of matters may result in us having to pay significant fines, judgments, or settlements, which, if uninsured, or if the fines, judgments and settlements exceed insured levels, could adversely impact our earnings and cash flows, thereby materially and adversely affecting us. Certain litigation or the resolution of certain litigation may affect the availability or cost of some of our insurance coverage, which could materially and adversely impact us, expose us to increased risks that would be uninsured, and materially and adversely impact our ability to attract directors and officers.
We may suffer uninsured losses or suffer material losses in excess of insurance limits.
We could suffer physical damage to property and liabilities resulting in losses that may not be fully recoverable by insurance. In addition, certain types of risks, such as personal injury claims, may be, or may become in the future, either uninsurable or not economically insurable, or may not be currently or in the future covered by our insurance policies or otherwise be subject to significant deductibles or limits. Should an uninsured loss or a loss in excess of insured limits occur or be subject to deductibles, we could sustain financial loss or lose capital invested in the affected property as well as anticipated future income from that property. In addition, we could be liable to repair damage or meet liabilities caused by risks that are uninsured or subject to deductibles. We may be liable for any debt or other financial obligations related to affected property. Material losses or liabilities in excess of insurance proceeds may occur in the future.
The ongoing requirements of being a public company may strain our resources and distract our management, which could make it difficult to manage our business.
As a public company with listed equity securities, we are required to comply with various regulatory and reporting requirements, including the reporting requirements of the Exchange Act and the requirements of the Sarbanes-Oxley Act of 2002 (as amended, the “Sarbanes-Oxley Act”). These requirements may place a strain on our systems and resources. The Exchange Act requires that we file annual, quarterly and current reports with respect to our business and financial condition. The Sarbanes-Oxley Act requires that we maintain effective disclosure controls and procedures and internal controls over financial reporting. Complying with these reporting and other regulatory requirements has been and will continue to be time-consuming and may result in increased costs and could have a negative effect on our business, financial condition and results of operations. To maintain and improve the effectiveness of our disclosure controls and procedures, we may need to commit significant resources and hire additional staff and provide additional management oversight. Since the consummation of the Transaction, we have implemented additional procedures and processes for the purpose of addressing the standards and requirements applicable to public companies. Sustaining our growth also may require us to commit additional management, operational and financial resources to identify new professionals to join us and to maintain appropriate operations and financial systems to adequately support expansion. These activities may divert management’s attention from other business concerns, which could have a material adverse effect on our business, financial condition and results of operations.
28
ITEM 1B. UNRESOLVED STAFF COMMENTS
None.
ITEM 2. PROPERTIES
We lease our principal executive office in Plano, Texas. Our homebuilding division offices are located in leased space in the markets where we conduct business. We believe that such properties are suitable and adequate to meet the needs of our businesses.
Our properties are described in Item 1. “Business” under the headings “Our Homebuilding Neighborhoods” and “Owned and Controlled Lots”, which information is incorporated herein by reference.
ITEM 3. LEGAL PROCEEDINGS
We are not involved in any material litigation nor, to our knowledge, is any material litigation threatened against the Company.
ITEM 4. MINE SAFETY DISCLOSURES
Not Applicable.
29
PART II
ITEM 5. MARKET FOR REGISTRANT’S COMMON EQUITY, RELATED STOCKHOLDER MATTERS AND ISSUER PURCHASES OF EQUITY SECURITIES
Market Information
Our common stock trades on The Nasdaq Capital Market maintained by The Nasdaq Stock Market LLC under the symbol “GRBK”. The following table sets forth the high and low closing prices for our common stock as reported on The Nasdaq Capital Market for the quarterly periods indicated. These prices do not include retail markups, markdowns or commissions.
Year ended December 31, 2017 | High | Low | ||||||
First Quarter | $ | 10.30 | $ | 8.90 | ||||
Second Quarter | $ | 11.45 | $ | 9.70 | ||||
Third Quarter | $ | 11.90 | $ | 8.90 | ||||
Fourth Quarter | $ | 12.05 | $ | 9.80 | ||||
Year ended December 31, 2016 | ||||||||
First Quarter | $ | 7.77 | $ | 4.99 | ||||
Second Quarter | $ | 7.80 | $ | 6.67 | ||||
Third Quarter | $ | 8.39 | $ | 6.79 | ||||
Fourth Quarter | $ | 10.40 | $ | 7.65 | ||||
Holders of Record
On March 7, 2018, there were approximately 32 stockholders of record of our common stock. We believe the number of beneficial owners of our common stock is substantially greater than the number of record holders because a large portion of our outstanding common stock is held of record in broker “street names” for the benefit of individual investors. As of March 7, 2018, there were 50,598,901 common shares outstanding.
Dividends
We have not paid any dividends since our inception and do not anticipate declaring or paying any cash dividends on our common stock in the foreseeable future. We currently anticipate that we will retain all of our available cash for general corporate purposes. Payment of future dividends, if any, will be at the discretion of our Board of Directors and will depend on many factors, including general economic and business conditions, our strategic plans, our financial results and condition, legal requirements and other factors as our Board of Directors deems relevant.
30
Performance Graph
The following graph compares our five-year cumulative total return, assuming $100 was invested on December 31, 2012, on our common stock with the cumulative total returns of the Russell 2000 Index and the Nasdaq Composite Index for the periods ended December 31. The pre-Transaction prices of our common stock were adjusted for the $70.0 million rights offering which included a registered offering by the Company of transferable rights to the public holders of its common stock, as of September 15, 2014, to purchase additional shares of common stock.
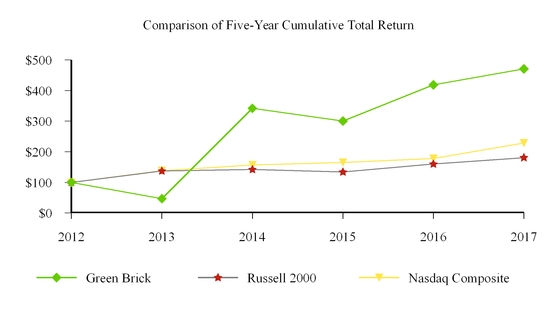
2012 | 2013 | 2014 | 2015 | 2016 | 2017 | ||||||
Green Brick Partners | $100.00 | $46.67 | $341.67 | $300.00 | $418.75 | $470.83 | |||||
Russell 2000 Index | $100.00 | $137.00 | $141.84 | $133.74 | $159.78 | $180.79 | |||||
Nasdaq Composite Index | $100.00 | $138.32 | $156.85 | $164.85 | $178.28 | $228.63 | |||||
The above graph is based on our common stock and index prices calculated as of the last trading day before January 1 of the year-end periods presented. The closing price of our common stock on the Nasdaq Capital Market was $11.30 per share on December 31, 2017 and $10.05 per share on December 31, 2016. The performance of our common stock depicted in the graph above represents our past performance as an ethanol producer from December 31, 2012 to November 21, 2013, as a shell company with no substantial operations from November 22, 2013 to October 26, 2014, and as a real estate company since October 27, 2014. As a result, the performance of our common stock depicted in the graph above is not indicative of future performance or the historical performance of our current real estate business.
The information in the graph and table above is not “soliciting material,” is not deemed “filed” with the Securities and Exchange Commission (the “SEC”) and is not to be incorporated by reference in any of our filings under the Securities Act of 1933, as amended, or the Securities Exchange Act of 1934, as amended, whether made before or after the date of this Annual Report on Form 10-K, except to the extent that we specifically incorporate such information by reference.
31
ITEM 6. SELECTED FINANCIAL DATA
The following table sets forth selected historical financial information regarding our business and should be read in conjunction with Item 7. “Management’s Discussion and Analysis of Financial Condition and Results of Operations” and our consolidated financial statements and the related notes included elsewhere in this Annual Report on Form 10-K.
As described in Note 1 to our consolidated financial statements included elsewhere in this Annual Report on Form 10-K, BioFuel Energy Corp. acquired JBGL Builder Finance LLC and its consolidated subsidiaries and affiliated companies (collectively “Builder Finance”), and JBGL Capital Companies (“Capital”), a combined group of commonly managed limited liability companies and partnerships (collectively with Builder Finance, “JBGL”), on October 27, 2014. Because the acquisition was considered a reverse recapitalization for accounting purposes, the combined historical financial statements of JBGL became our historical financial statements and from the completion of the acquisition on October 27, 2014, the financial statements have been prepared on a consolidated basis. Share and per share amounts have been retroactively restated to the earliest periods presented to reflect the transaction.
As of December 31, | |||||||||||||||||||
2017 | 2016 | 2015 | 2014 | 2013 | |||||||||||||||
(in thousands) | |||||||||||||||||||
Assets | |||||||||||||||||||
Cash | $ | 36,684 | $ | 35,157 | $ | 21,207 | $ | 22,976 | $ | 16,683 | |||||||||
Inventory | 495,655 | 410,297 | 344,132 | 275,141 | 228,777 | ||||||||||||||
Notes receivable, net | — | — | — | — | 7,556 | ||||||||||||||
Deferred income tax assets, net | 31,211 | 67,598 | 80,663 | 89,197 | — | ||||||||||||||
Other | 48,680 | 27,932 | 27,874 | 13,011 | 15,392 | ||||||||||||||
Total assets | $ | 612,230 | $ | 540,984 | $ | 473,876 | $ | 400,325 | $ | 268,408 | |||||||||
Liabilities and stockholders’ equity | |||||||||||||||||||
Borrowings on lines of credit | $ | 107,000 | $ | 75,000 | $ | 47,500 | $ | 14,061 | $ | 17,208 | |||||||||
Notes payable | 9,926 | 10,948 | 10,158 | 12,151 | 26,595 | ||||||||||||||
Term loan facility | — | — | — | 150,000 | — | ||||||||||||||
Other | 62,266 | 53,551 | 44,363 | 42,516 | 25,786 | ||||||||||||||
Total liabilities | 179,192 | 139,499 | 102,021 | 218,728 | 69,589 | ||||||||||||||
Total stockholders’ equity | 433,038 | 401,485 | 371,855 | 181,597 | 198,819 | ||||||||||||||
Total liabilities and stockholders’ equity | $ | 612,230 | $ | 540,984 | $ | 473,876 | $ | 400,325 | $ | 268,408 | |||||||||
For the Years Ended December 31, | |||||||||||||||||||
2017 | 2016 | 2015 | 2014 | 2013 | |||||||||||||||
(in thousands, except per share data) | |||||||||||||||||||
Sale of residential units | $ | 435,644 | $ | 365,164 | $ | 254,267 | $ | 200,650 | $ | 168,591 | |||||||||
Sale of land and lots | 18,730 | 15,164 | 36,878 | 45,452 | 33,735 | ||||||||||||||
Total revenues | 454,374 | 380,328 | 291,145 | 246,102 | 202,326 | ||||||||||||||
Cost of residential units | 342,065 | 283,454 | 201,768 | 153,799 | 125,424 | ||||||||||||||
Cost of land and lots | 13,856 | 10,499 | 27,125 | 34,082 | 21,513 | ||||||||||||||
Total cost of sales | 355,921 | 293,953 | 228,893 | 187,881 | 146,937 | ||||||||||||||
Total gross profit | 98,453 | 86,375 | 62,252 | 58,221 | 55,389 | ||||||||||||||
Salary expense and management fees expense - related party | 21,823 | 21,871 | 16,272 | 12,694 | 8,968 | ||||||||||||||
Selling, general and administrative expense | 17,193 | 16,758 | 13,704 | 9,840 | 6,406 | ||||||||||||||
Operating profit | 59,437 | 47,746 | 32,276 | 35,687 | 40,015 | ||||||||||||||
Interest expense | — | — | 281 | 1,393 | 315 | ||||||||||||||
Equity in income of unconsolidated entity | 2,746 | — | — | — | — | ||||||||||||||
Other income, net | 2,054 | 2,808 | 2,721 | 1,915 | 4,943 | ||||||||||||||
Income before taxes | 64,237 | 50,554 | 34,716 | 36,209 | 44,643 | ||||||||||||||
Income tax provision (benefit) | 39,031 | 15,381 | 9,171 | (24,853 | ) | 327 | |||||||||||||
Net income | 25,206 | 35,173 | 25,545 | 61,062 | 44,316 | ||||||||||||||
Less: net income attributable to noncontrolling interests | 10,236 | 11,417 | 10,220 | 11,036 | 12,309 | ||||||||||||||
Net income attributable to Green Brick Partners, Inc. | $ | 14,970 | $ | 23,756 | $ | 15,325 | $ | 50,026 | $ | 32,007 | |||||||||
Net income attributable to Green Brick Partners, Inc. per common share: | |||||||||||||||||||
Basic | $0.30 | $0.49 | $0.38 | $3.40 | $2.88 | ||||||||||||||
Diluted | $0.30 | $0.49 | $0.38 | $3.40 | $2.88 | ||||||||||||||
Weighted average common shares used in the calculation of net income attributable to Green Brick Partners, Inc. per common share: | |||||||||||||||||||
Basic | 49,597 | 48,879 | 40,068 | 14,712 | 11,109 | ||||||||||||||
Diluted | 49,683 | 48,886 | 40,099 | 14,712 | 11,109 | ||||||||||||||
Change in Classification
Certain indirect project costs previously classified as salary expense and selling, general and administrative expense have been classified as cost of residential units for the years ended December 31, 2015, 2014 and 2013 to properly present cost of residential units, salary expense, and selling, general and administrative expense. See Note 2 to our consolidated financial statements included elsewhere in this Annual Report on Form 10-K for further discussion.
32
ITEM 7. MANAGEMENT’S DISCUSSION AND ANALYSIS OF FINANCIAL CONDITION AND RESULTS OF OPERATIONS
The following discussion should be read in conjunction with our financial statements and the accompanying notes included in this Annual Report on Form 10-K. This discussion contains forward-looking statements that involve risks and uncertainties. Our actual results could differ materially from the results discussed in or implied by any of the forward-looking statements as a result of various factors, including those listed elsewhere in this Annual Report on Form 10-K. See “Risk Factors” and “Forward-Looking Statements” above.
Reverse Recapitalization
On June 10, 2014, we entered into a definitive transaction agreement with the owners of JBGL Builder Finance LLC and its consolidated subsidiaries and affiliated companies (collectively “Builder Finance”), and JBGL Capital Companies (“Capital”), a combined group of commonly managed limited liability companies and partnerships (collectively with Builder Finance, “JBGL”), which provided that we would acquire JBGL for $275.0 million, payable in cash and shares of our common stock (the “Transaction”). JBGL is a real estate operator involved in the purchase and development of land for residential use, construction lending and homebuilding operations. The Transaction was completed on October 27, 2014. Pursuant to the terms of the Transaction, we paid the $275.0 million purchase price with approximately $191.8 million in cash and the remainder in 11,108,500 shares of our common stock valued at approximately $7.49 per share.
The cash portion of the purchase price was primarily funded from the proceeds of a $70.0 million rights offering conducted by the Company (the $70.0 million includes proceeds from purchases of shares of common stock by certain funds and accounts managed by Greenlight Capital, Inc. and its affiliates (“Greenlight”) and Third Point LLC and its affiliates (“Third Point”)) and $150.0 million of debt financing provided by Greenlight pursuant to a loan agreement, with the lenders from time to time party thereto, which provided for a five year term loan facility (the “Term Loan Facility”).
For financial reporting purposes, the Transaction was deemed to be a capital transaction in substance and recorded as a reverse recapitalization of JBGL whereby JBGL is deemed to be the continuing, surviving entity for accounting purposes, but through reorganization, is deemed to have adopted the capital structure of BioFuel. Because the acquisition was considered a reverse recapitalization for accounting purposes, the combined historical financial statements of JBGL became our historical financial statements and, from the completion of the acquisition on October 27, 2014, the financial statements have been prepared on a consolidated basis. The assets and liabilities of BioFuel were brought forward at their book value and no goodwill was recognized in connection with the Transaction.
As a result of the Transaction, Green Brick changed its business direction and is now a diversified homebuilding and land development company. The financial statements set forth in this Annual Report on Form 10-K for all periods prior to the reverse recapitalization are the historical financial statements of JBGL, and have been retroactively restated to give effect to the Transaction.
Equity Offering
On July 1, 2015, we completed an underwritten public offering of 17 million shares of our common stock at a price of $10.00 per share and granted to the underwriters a 30-day option to purchase up to an aggregate of 841,500 additional shares of common stock to cover over-allotments (the “Equity Offering”). On July 23, 2015, the underwriters exercised the option and purchased 444,897 additional shares. All of the shares were sold by us pursuant to an effective shelf registration statement previously filed with the SEC.
The Equity Offering resulted in net proceeds of approximately $170.0 million, after deducting underwriting discounts and offering expenses. On July 1, 2015, we used approximately $154.9 million of the net proceeds from the Equity Offering to repay all of the outstanding principal, interest and a prepayment premium under the Term Loan Facility. Upon repayment, the Term Loan Facility was terminated, and all security interests in, and all liens held by Greenlight with respect to, the assets of Green Brick securing the amounts owed under the Term Loan Facility were terminated and released. We used the remaining net proceeds for working capital and general corporate purposes.
Equity Issuance in Connection with the Acquisition of an Unconsolidated Entity
On August 15, 2017, the Company, JBGL Ownership LLC, a Delaware limited liability company and a wholly owned subsidiary of the Company (“JBGL”), and GB Challenger, LLC, a newly formed Texas limited liability company (the “Challenger Subsidiary”) entered into a Membership Interest Purchase and Contribution Agreement (the “Challenger Agreement”) with The Challenger Group, Inc., a Wyoming corporation (“TCGI”), TCG Holdings, LLC, a Wyoming limited
33
liability company (“TCG”), GTG Holdings, LLC, a Wyoming limited liability company (“GTG” and together with TCGI and TCG, the “Challenger Entities”) and Brian R. Bahr (“Bahr”), resulting in the Company, through its interest in JBGL, and the Challenger Entities owning a 49.9% and 50.1% ownership interest, respectively, in the Challenger Subsidiary, and the Challenger Subsidiary owning all of the membership and ownership interests in the subsidiaries of the Challenger Entities named in the Challenger Agreement (“Challenger Homebuilder Subsidiaries”). As consideration for such interests, the Company agreed to issue to the Challenger Entities, or their designees, 1,497,000 shares of its common stock, par value $0.01 per share, in a private placement, with 20,000 shares of its common stock held back pending satisfactory resolution of indemnification claims (“Holdback Shares”). The Company expects to issue the Holdback Shares during the second quarter of 2018; therefore, $0.2 million has been recorded in additional paid-in capital on the consolidated balance sheet as of December 31, 2017. The Challenger Entities, at their discretion, may offer to sell and transfer an additional 20.1% or, in certain circumstances, all of the Challenger Entities’ interest in the Challenger Subsidiary (“Additional Membership Interests”) to the Company on or after the third anniversary of the Challenger Agreement. The Company is not required to purchase the Additional Membership Interests. The Company incurred approximately $0.3 million in related acquisition costs which are included in the cost basis of investment in unconsolidated entity.
The Challenger Entities operate homebuilding operations under the name Challenger Homes. Challenger Homes constructs townhouses, single family homes and luxury patio homes, and is headquartered in Colorado Springs, Colorado. The Company partnered with Challenger Homes in order to expand its business with partners who are complementary to its current builder partner group and to gain a presence in the Colorado Springs market.
The Challenger Entities, together with the Company will direct the operations of the Challenger Homebuilder Subsidiaries through the Challenger Subsidiary, with the Company holding a noncontrolling interest. We hold two of the five board of managers (the “Managers”) seats of the Challenger Subsidiary. The Challenger Subsidiary’s six officers, employees of the Challenger Entities, were designated by the Managers for the purpose of managing the day to day operations. We do not have a controlling financial interest in the Challenger Subsidiary as we have less than 50% of the voting interests in the Challenger Subsidiary. Our investment in the Challenger Subsidiary is treated as an unconsolidated investment under the equity method of accounting, carried at cost, as adjusted for our share of income or losses and reduced for distributions received, and included in investment in unconsolidated entity in our consolidated balance sheets.
Overview of the Business
We are a diversified homebuilding and land development company. We acquire and develop land, provide land and construction financing to our controlled builders and participate in the profits of our controlled builders. Our core markets are in the high growth U.S. metropolitan areas of Dallas, Texas and Atlanta, Georgia. We also own a noncontrolling interest in Challenger Homes in Colorado Springs, Colorado. We are engaged in all aspects of the homebuilding process, including land acquisition and the development, entitlements, design, construction, marketing and sales and the creation of brand images at our residential neighborhoods and master planned communities. We believe we offer higher quality homes with more distinctive designs and floor plans than those built by our competitors at comparable prices. Our communities are located in premium locations in our core markets and we seek to enhance homebuyer satisfaction by utilizing high-quality materials, offering a broad range of customization options and building well-crafted energy-efficient homes. We seek to maximize value over the long term and operate our business to mitigate risks in the event of a downturn by controlling costs and quickly reacting to regional and local market trends.
We are a leading lot developer in the Dallas and Atlanta markets and believe that our strict operating discipline provides us with a competitive advantage in seeking to maximize returns while minimizing risk. We currently own or control over 6,200 home sites in premium locations in the Dallas and Atlanta markets. We consider premium locations to be lot supply constrained with high housing demand and where much of the surrounding land has already been developed. We are strategically positioned to either build new homes on our lots through our controlled builders or to sell finished lots to large unaffiliated homebuilders.
We sell finished lots or option lots from third-party developers to our controlled builders for their homebuilding operations and provide them with construction financing and strategic planning. Our controlled builders provide us with their local knowledge and relationships. We support our controlled builders by financing their purchases of land from us at an unlevered internal rate of return (“IRR”) of at least 20% and by providing construction financing at approximately a 13.8% or a 16.5% interest rate. Our income is further enhanced by our 50% equity interest in the profits of our controlled builders. In addition, the land we sell to third-party homebuilders also typically generates an unlevered IRR of 20% or greater.
34
References to our “controlled builders” refer to our homebuilding subsidiaries in which we own a 50% equity interest and a 51% voting interest. In addition, we have the ability to appoint 2 of the 3 members of the board of managers of each controlled builder; therefore we are able to exercise control over the operations of each controlled builder.
Controlled Builders | Year Formed | Market | Products Offered | Prices Ranges | ||||
The Providence Group of Georgia L.L.C. (“TPG”) | 2011 | Atlanta | Townhomes | $310,000 to $650,000 | ||||
Single family | $440,000 to $1.1 million | |||||||
CB JENI Homes DFW LLC (“CB JENI”) | 2012 | Dallas | Townhomes | $250,000 to $430,000 | ||||
Single family | $320,000 to $700,000 | |||||||
Centre Living Homes, LLC (“Centre Living”) | 2012 | Dallas | Townhomes | $320,000 to $1.5 million | ||||
Southgate Homes DFW LLC (“Southgate”) | 2013 | Dallas | Luxury homes | $550,000 to $1.3 million | ||||
During the first quarter of 2015, we formed Green Brick Title, LLC (“Green Brick Title”), our wholly-owned title company. Green Brick Title’s core business includes providing title insurance and closing and settlement services for our homebuyers. Green Brick Title had insignificant operations during the years ended December 31, 2017, 2016 and 2015.
Segments
Prior to the fourth quarter of 2016, the Company’s operations were organized into two reportable segments: builder operations and land development. Builder operations consisted of two operating segments: Texas and Georgia. In accordance with Accounting Standards Codification (“ASC”) 280, Segment Reporting (“ASC 280”), in determining our reportable segments, we considered similar economic and other characteristics, including geography, product types, production processes, average selling prices, gross profits, suppliers, land acquisition results, and underlying demand and supply.
In accordance with ASC 280, an operating segment is defined as a component of an enterprise for which discrete financial information is available and is reviewed regularly by the Chief Operating Decision Maker (“CODM”), or decision-making group, to evaluate performance and make operating decisions. Prior to 2016, the Company identified its CODM as four key executives—the Chief Executive Officer, Chief Financial Officer, Chief Operating Officer and President of Texas Region (formerly, the Head of Land Acquisition and Development). As a result of the departure of the Chief Operating Officer, the management structure and CODM changed during 2016. During the fourth quarter of 2016, the Company re-evaluated its reportable segments under ASC 280.
Beginning in the fourth quarter of 2016, the Company identified its CODM as three key executives—the Chief Executive Officer, Chief Financial Officer and President of Texas Region. In determining the most appropriate reportable segments, the CODM considers similar economic and other characteristics, including geography, class of customers, product types and production processes. The discrete financial information that is regularly reviewed by the current CODM group is different than in the past. As such, the builder operations reportable segment has consisted of three operating segments since the fourth quarter of 2016: Texas, Georgia, and corporate and other. The operations of the Company’s controlled builders were aggregated into the Texas and Georgia operating segments based on similar (1) economic characteristics; (2) housing products; (3) class of homebuyer; (4) regulatory environments; and (5) methods used to construct and sell homes.
Corporate operations is a non-operating segment that develops and implements strategic initiatives and supports the Company’s builder operations and land development segments by centralizing certain administrative functions such as finance, treasury, information technology and human resources. The majority of corporate personnel and resources are primarily dedicated to activities relating to the builder operations segment. Therefore, any unallocated corporate expenses are included in the corporate and other operating segment, within the builder operations segment which accounts for 95.9%, 96.1% and 87.3% of total revenues, for the years ended December 31, 2017, 2016 and 2015, respectively.
The Company uses the equity method of accounting for its investment in Challenger Subsidiary over which it exercises significant influence but does not have a controlling interest. The Challenger Subsidiary constructs townhouses, single family homes and luxury patio homes, and is headquartered in Colorado Springs, Colorado. While the operations of the Challenger Subsidiary meet the criteria for an operating segment within the builder operations segment, such operations did not meet the quantitative thresholds, as discussed in ASC 280, to be separately reported and disclosed. As such, Challenger Subsidiary’s results are included within the builder operations segment, within the corporate and other operating segment.
35
While the operations of Green Brick Title are not economically similar to either builder operations or land development, the results of such operations did not meet the quantitative thresholds to be separately reported and disclosed. As such, Green Brick Title’s results are included within the corporate and other operating segment, within the builder operations segment.
All 2015 segment information has been restated to conform with the 2016 and 2017 presentation. The changes in the reportable segments have no effect on the consolidated balance sheets, statements of income or cash flows for the periods presented. Financial information about our segments appears in Note 13, “Segment Information,” of the notes to consolidated financial statements included in this Annual Report on Form 10-K.
Definitions
In the following discussion, “backlog” refers to homes under sales contracts that have not yet closed at the end of the relevant period, “cancellation rate” refers to sales contracts canceled divided by sales contracts executed during the relevant period, “net new home orders” refers to new home sales contracts reduced by the number of sales contracts canceled during the relevant period, and “overall absorption rate” refers to the rate at which net new home orders are contracted per selling community during the relevant period. Sales contracts relating to homes in backlog may be canceled by the prospective purchaser for a number of reasons, such as the prospective purchaser’s inability to obtain suitable mortgage financing. Upon a cancellation, the escrow deposit may be returned to the prospective purchaser (other than with respect to certain design-related deposits, which we retain). Accordingly, backlog may not be indicative of our future revenue.
Overview and Outlook
The following are our key operating metrics for the year ended December 31, 2017 as compared to the year ended December 31, 2016: home deliveries increased by 17.3%, home sales revenue increased by 19.3%, average sales price increased by 1.7%, backlog units increased by 30.8%, backlog units value increased by 40.2%, average sales price of homes in backlog increased by 7.2% and net new home orders increased by 20.8%. The increase in the average sales price of homes in backlog is the result of changes in product mix of homes contracted for sale during the period and local market appreciation. During the year ended December 31, 2017, homes in the Dallas and Atlanta markets appreciated by 6.9% and 5.4%, respectively (Source: S&P/Case-Shiller 20-City Composite Home Price Index, December 2017). During the year ended December 31, 2017, the housing market continued to show signs of improvement, which we believe is driven by a continued increase in consumer confidence, lower interest rates, high affordability metrics, and a reduction in home inventory levels.
The following are our key operating metrics for the year ended December 31, 2016 as compared to the same period in 2015: home deliveries increased by 28.9%, home sales revenue increased by 43.6%, average sales price increased by 11.5%, backlog units increased by 17.9%, backlog units value increased by 22.6%, average sales price of homes in backlog increased by 4.0% and net new home orders increased by 36.0%. The increase in the average sales price of homes in backlog is the result of changes in product mix of homes contracted for sale during the period and local market appreciation.
Our two primary markets, Dallas and Atlanta, have shown significant housing market recovery. We believe the housing market recovery is sustainable, and that we operate in two of the most desirable housing markets in the nation. Among the 12 largest metropolitan areas in the country, the Dallas metropolitan area ranked first in both the rate of job growth and the number of jobs from November 2016 to November 2017 (Source: US Bureau of Labor Statistics, November 2017). The Atlanta metropolitan area ranked second in the rate of job growth and third in the number of jobs added from September 2016 to September 2017 (Source: US Bureau of Labor Statistics, September 2017). We believe that increasing demand and supply constraints in our target markets create favorable conditions for our future growth.
Basis of Presentation
The accompanying consolidated financial statements have been prepared in accordance with United States generally accepted accounting principles (“GAAP”) as set forth in the Financial Accounting Standards Board’s (“FASB”) ASC and applicable regulations of the SEC. Our operating results for the year ended December 31, 2017 are not necessarily indicative of the results that may be expected for any future periods.
The consolidated financial statements and notes thereto include the accounts of the Company and its subsidiaries. All intercompany accounts and transactions have been eliminated in consolidation.
36
Results of Operations
Land Development
During the year ended December 31, 2017, our land development segment revenue increased $3.6 million, or 23.5%, to $18.7 million for the year ended December 31, 2017 from $15.2 million for the year ended December 31, 2016. The increase was comprised of $3.5 million due to a 23.1% increase in finished inventory lots delivered to 144 for the year ended December 31, 2017 from 117 for the year ended December 31, 2016, and an increase of $0.1 million related to an increase in the average sales price per lot of $130,067 per lot for the year ended December 31, 2017 from $129,603 per lot for the year ended December 31, 2016.
During the year ended December 31, 2016, our land development segment revenue decreased $21.7 million, or 58.9%, from $36.9 million for the year ended December 31, 2015 to $15.2 million for the year ended December 31, 2016. The decrease was comprised of $24.0 million due to a 65.2% decrease in finished inventory lots delivered from 336 for the year ended December 31, 2015 to 117 for the year ended December 31, 2016, partially offset by an increase of $2.3 million related to an increase in the average sales price per lot of $129,603 per lot for the year ended December 31, 2016 from $109,756 per lot for the year ended December 31, 2015. The decrease in finished inventory lots delivered was a result of a decrease in third-party lot sales driven by an increase in intercompany lot sales to our controlled builders where revenue is not recognized until the home closes. While there is a time lag related to intercompany lot sales, we believe this is advantageous because we were able to realize improved margins on the sale of completed homes and intercompany sales benefit our controlled builders.
Builder Operations
During the year ended December 31, 2017, our builder operations segment delivered 990 homes, with an average sales price of $440,044, compared to 844 homes with an average sales price of $432,659 during 2016. During the year ended December 31, 2017, our builder operations segment generated approximately $435.6 million in revenue compared to $365.2 million during 2016. For the year ended December 31, 2017, net new home orders totaled 1,063, a 20.8% increase from 2016. As of December 31, 2017, our builder operations segment had a backlog of 310 sold but unclosed homes, a 30.8% increase from 2016, with a total value of approximately $151.5 million, an increase of $43.4 million, or 40.2%, from December 31, 2016.
During the year ended December 31, 2016, our builder operations segment delivered 844 homes, with an average sales price of $432,659, compared to 655 homes with an average sales price of $388,194 during 2015. During the year ended December 31, 2016, our builder operations segment generated approximately $365.2 million in revenue compared to $254.3 million during 2015. For the year ended December 31, 2016, net new home orders totaled 880, a 36.0% increase from 2015. As of December 31, 2016, our builder operations segment had a backlog of 237 sold but unclosed homes, a 17.9% increase from 2015, with a total value of approximately $108.0 million, an increase of $19.9 million, or 22.6%, from December 31, 2015.
The increase in the average sales price of homes in backlog is the result of changes in product mix related to higher priced single family homes over lower priced townhomes closed during the period and local market appreciation. The average sales price of homes may increase or decrease depending on the mix of homes delivered and sold during such period and local market conditions. These changes in the average sales price of homes are part of our natural business cycle.
Revenues
We primarily generate revenue through (a) the sale of lots from our land development segment to public builders and large private builders, and (b) the closing and delivery of homes through our builder operations segment. We recognize revenue on homes and lots when completed and title to, and possession of, the property have been transferred to the purchaser. All customer deposits are treated as liabilities.
Cost of Sales
Lot acquisition, materials, other direct costs, interest and other indirect costs related to the acquisition, development, and construction of lots and homes are capitalized until the homes are complete, after which they are expensed. Direct and indirect costs of developing residential lots are allocated based on the relative sales price of the lots. Capitalized costs of residential lots and homes are charged to earnings when the related revenue is recognized.
Salary Expense
Salary expense represents salaries, benefits and share-based compensation, and are recorded in the period incurred.
37
Selling, General and Administrative Expense
Selling, general and administrative expense represents property taxes, depreciation, amortization, advertising and marketing, rent, and other administrative items, and is recorded in the period incurred.
Interest Expense
Interest expense consists primarily of interest costs incurred on our debt that are not capitalized and amortization of related debt issuance costs. We capitalize interest costs incurred to inventory during active development and other qualifying activities. All interest costs were capitalized during the years ended December 31, 2017 and December 31, 2016, respectively.
Equity in Income of Unconsolidated Entity
Equity in income of unconsolidated entity represents our share of net earnings or losses of an unconsolidated entity accounted for using the equity method.
Other Income, Net
Other income, net primarily consists of net revenue from contracts where we are the general contractor and where our customers, and not our Company, own the land and improvements (“mechanics lien contracts”), net revenue from third parties for title and settlement services, and interest earned. We recognize revenue on our mechanics lien contracts on the percentage of completion method.
Income Tax Provision
We account for income taxes using the asset and liability method, under which deferred tax assets and liabilities are recognized for the future tax consequences attributable to temporary differences between financial statement carrying amounts of existing assets and liabilities and their respective tax bases and operating losses and tax credit carryforwards. Deferred tax assets and liabilities are measured using enacted tax rates expected to apply to taxable income in the years in which those temporary differences are expected to be recovered or settled. The effect on deferred tax assets and liabilities of a change in tax rates is recognized in income in the period that includes the enactment date. We regularly review historical and anticipated future pre-tax results of operations to determine whether we expect to be able to realize the benefit of our deferred tax assets. A valuation allowance is required to reduce the potential deferred tax asset when it is considered more-likely-than-not that all or some portion of the potential deferred tax asset will not be realized due to the lack of sufficient taxable income.
We establish reserves for uncertain tax positions that reflect our best estimate of deductions and credits that may not be sustained on a more-likely-than-not basis. We recognize interest and penalties related to uncertain tax positions in income tax provision on the consolidated statements of income. Accrued interest and penalties are included in the related tax liability account within accrued expenses on the consolidated balance sheets. In accordance with ASC 740, Income Taxes, the Company recognizes the effect of income tax positions only if those positions have a more-likely-than-not chance of being sustained by the Company. Recognized income tax positions are measured at the largest amount that is greater than 50% likely of being realized. Changes in recognition or measurement are reflected in the period in which the change in judgment occurs.
As of December 31, 2017, in consideration of all available positive and negative evidence, including tax planning, management concluded that it was more-likely-than-not that all of our net deferred tax assets will be realized in accordance with GAAP, except for Minnesota and Nebraska state income tax net operating loss carryforwards, for which a valuation allowance in the amount of $1.3 million has been recorded.
38
Consolidated Financial Data
The consolidated historical financial data presented below reflects our land development and builder operations segments, and is not necessarily indicative of the results to be expected for any future period.
For the Years Ended December 31, | |||||||||||
2017 | 2016 | 2015 | |||||||||
(in thousands, except per share data) | |||||||||||
Sale of residential units | $ | 435,644 | $ | 365,164 | $ | 254,267 | |||||
Sale of land and lots | 18,730 | 15,164 | 36,878 | ||||||||
Total revenues | 454,374 | 380,328 | 291,145 | ||||||||
Cost of residential units | 342,065 | 283,454 | 201,768 | ||||||||
Cost of land and lots | 13,856 | 10,499 | 27,125 | ||||||||
Total cost of sales | 355,921 | 293,953 | 228,893 | ||||||||
Total gross profit | 98,453 | 86,375 | 62,252 | ||||||||
Salary expense | 21,823 | 21,871 | 16,272 | ||||||||
Selling, general and administrative expense | 17,193 | 16,758 | 13,704 | ||||||||
Operating profit | 59,437 | 47,746 | 32,276 | ||||||||
Interest expense | — | — | 281 | ||||||||
Equity in income of unconsolidated entity | 2,746 | — | — | ||||||||
Other income, net | 2,054 | 2,808 | 2,721 | ||||||||
Income before taxes | 64,237 | 50,554 | 34,716 | ||||||||
Income tax provision | 39,031 | 15,381 | 9,171 | ||||||||
Net income | 25,206 | 35,173 | 25,545 | ||||||||
Less: net income attributable to noncontrolling interests | 10,236 | 11,417 | 10,220 | ||||||||
Net income attributable to Green Brick Partners, Inc. | $ | 14,970 | $ | 23,756 | $ | 15,325 | |||||
Net income attributable to Green Brick Partners, Inc. per common share: | |||||||||||
Basic | $0.30 | $0.49 | $0.38 | ||||||||
Diluted | $0.30 | $0.49 | $0.38 | ||||||||
Weighted average common shares used in the calculation of net income attributable to Green Brick Partners, Inc. per common share: | |||||||||||
Basic | 49,597 | 48,879 | 40,068 | ||||||||
Diluted | 49,683 | 48,886 | 40,099 | ||||||||
Change in Classification
Certain indirect project costs previously classified as salary expense and selling, general and administrative expense have been classified as cost of residential units for the year ended December 31, 2015 to properly present cost of residential units, salary expense, and selling, general and administrative expense. See Note 2 to our consolidated financial statements included elsewhere in this Annual Report on Form 10-K for further discussion.
39
Year Ended December 31, 2017 Compared to the Year Ended December 31, 2016
Net New Home Orders and Backlog
The table below represents new home orders and backlog related to our builder operations segment.
Years Ended December 31, | Increase (Decrease) | |||||||||||||
New Home Orders and Backlog | 2017 | 2016 | Change | % | ||||||||||
Net new home orders | 1,063 | 880 | 183 | 20.8% | ||||||||||
Number of cancellations | 188 | 135 | 53 | 39.3% | ||||||||||
Cancellation rate | 15.0 | % | 13.3 | % | 1.7 | % | 12.8% | |||||||
Average selling communities | 54 | 47 | 7 | 14.9% | ||||||||||
Selling communities at end of period | 55 | 50 | 5 | 10.0% | ||||||||||
Backlog ($ in thousands) | $ | 151,463 | $ | 108,030 | $ | 43,433 | 40.2% | |||||||
Backlog (units) | 310 | 237 | 73 | 30.8% | ||||||||||
Average sales price of backlog | $ | 488,590 | $ | 455,823 | $ | 32,767 | 7.2% | |||||||
Net new home orders for the year ended December 31, 2017 increased by 183 homes, or 20.8%, to 1,063 for the year ended December 31, 2017 from 880 for the year ended December 31, 2016. Our overall absorption rate for the year ended December 31, 2017 was an average of 19.6 per selling community (1.6 monthly), compared to an average of 18.6 per selling community (1.5 monthly) for the year ended December 31, 2016.
Our cancellation rate was approximately 15.0% for the year ended December 31, 2017, compared to 13.3% for the year ended December 31, 2016. Management believes a cancellation rate in the range of 15% to 20% is representative of an industry average cancellation rate. On average, our cancellation rate is on the lower end of the industry average, which we believe is due to our target buyer demographics, which generally does not include first time homebuyers.
Backlog units increased by 73 homes, or 30.8%, to 310 as of December 31, 2017 from 237 as of December 31, 2016. The dollar value of backlog units increased $43.4 million, or 40.2%, to $151.5 million as of December 31, 2017 from $108.0 million as of December 31, 2016. The increase in value of backlog units reflects an increase in the number of homes in backlog and an increase in the average sales price of homes in backlog. Our average sales price of homes in backlog increased $32,767, or 7.2%, to $488,590 for the year ended December 31, 2017, compared to $455,823 for the year ended December 31, 2016. The increase in the average sales price of homes in backlog is the result of changes in product mix related to higher priced single family homes over lower priced townhomes contracted for sale during the period and local market appreciation. The average sales price of homes may fluctuate depending on the mix of homes delivered and sold during a period. The change in the average sales price of homes is part of our natural business cycle and the result of changes in product mix.
New Homes Delivered and Home Sales Revenue
The table below represents home sales revenue and new homes delivered related to our builder operations segment.
Years Ended December 31, | Increase (Decrease) | |||||||||||||
New Homes Delivered and Home Sales Revenue | 2017 | 2016 | Change | % | ||||||||||
New homes delivered | 990 | 844 | 146 | 17.3% | ||||||||||
Home sales revenue ($ in thousands) | $ | 435,644 | $ | 365,164 | $ | 70,480 | 19.3% | |||||||
Average sales price of homes delivered | $ | 440,044 | $ | 432,659 | $ | 7,385 | 1.7% | |||||||
New home deliveries (excluding existing completed homes sold, but not yet closed) for the year ended December 31, 2017 for our builder operations segment was 990, compared to new home deliveries of 844 for the year ended December 31, 2016, resulting in an increase of 146 homes, or 17.3%. The increase in new home deliveries was primarily attributable to a 14.9% increase in the average selling communities to 54 from 47.
Home sales revenue increased $70.5 million, or 19.3%, to $435.6 million for the year ended December 31, 2017, from $365.2 million for the year ended December 31, 2016. The increase in revenue was comprised of (a) $63.2 million due to a 17.3% increase in homes delivered to 990 for the year ended December 31, 2017, from 844 for the year ended December 31, 2016, and (b) $7.3 million resulting from a 1.7% increase in average sales price to $440,044 for the year ended December 31, 2017, from $432,659 for the year ended December 31, 2016.
40
Homebuilding
The table below represents cost of home sales and gross margin related to our builder operations segment.
Years Ended December 31, | ||||||||||||||
Homebuilding ($ in thousands) | 2017 | % | 2016 | % | ||||||||||
Home sales revenue | $ | 435,644 | 100.0 | % | $ | 365,164 | 100.0 | % | ||||||
Cost of home sales | 342,065 | 78.5 | % | 283,454 | 77.6 | % | ||||||||
Homebuilding gross margin | $ | 93,579 | 21.5 | % | $ | 81,710 | 22.4 | % | ||||||
Cost of home sales for the year ended December 31, 2017 was $342.1 million, compared to cost of home sales of $283.5 million for the year ended December 31, 2016, resulting in an increase of $58.6 million, or 20.7%, primarily due to the 17.3% increase in the number of homes delivered. Homebuilding gross margin percentage for the year ended December 31, 2017 for builder operations was 21.5%, compared to a gross margin percentage of 22.4% for the year ended December 31, 2016. The increase in the dollar amount of homebuilding gross margin is largely due to the opening of new communities during the year ended December 31, 2017.
Salary Expense
The table below represents salary expense, related to our land development and builder operations segments.
($ in thousands) | Years Ended December 31, | As Percentage of Relevant Revenue | ||||||||||||
2017 | 2016 | 2017 | 2016 | |||||||||||
Land development | $ | 341 | $ | 324 | 1.8 | % | 2.1 | % | ||||||
Builder operations | $ | 21,482 | $ | 21,547 | 4.9 | % | 5.9 | % | ||||||
Land Development
Salary expense for the year ended December 31, 2017 for land development remained flat at $0.3 million compared to the year ended December 31, 2016.
Builder Operations
Salary expense for the year ended December 31, 2017 for builder operations remained flat at $21.5 million, compared to the year ended December 31, 2016.
Selling, General and Administrative Expense
The table below represents selling, general and administrative expenses related to our land development and builder operations segments.
($ in thousands) | Years Ended December 31, | As Percentage of Relevant Revenue | ||||||||||||
2017 | 2016 | 2017 | 2016 | |||||||||||
Land development | $ | 801 | $ | 1,039 | 4.3 | % | 6.9 | % | ||||||
Builder operations | $ | 16,392 | $ | 15,719 | 3.8 | % | 4.3 | % | ||||||
Land Development
Selling, general and administrative expense for the year ended December 31, 2017 for land development was $0.8 million, compared to $1.0 million for the year ended December 31, 2016, a decrease of 22.9%. The decrease is primarily the result of a decrease in property tax expense due to a decrease in the number of finished lots in inventory as of December 31, 2017.
Builder Operations
Selling, general and administrative expense for the year ended December 31, 2017 for builder operations was $16.4 million, compared to $15.7 million for the year ended December 31, 2016, an increase of 4.3%. The increase was primarily attributable to increases in expenditures to support the growth in our builder operations business. Builder operations expenditures include community costs, such as non-capitalized property taxes, rent expenses, professional fees, and advertising
41
and marketing expenses. The average selling community count was 54 for the year ended December 31, 2017 compared to 47 for the year ended December 31, 2016. Selling, general and administrative expense as a percentage of related revenue decreased 11.6% for the year ended December 31, 2017, as a result of internal cost efficiencies, as many of our selling, general and administrative expenses did not increase as we increased home sales through organic growth.
Equity in Income of Unconsolidated Entity
Equity in income of unconsolidated entity increased to $2.7 million, or 100%, for the year ended December 31, 2017, compared to the year ended December 31, 2016, due to our purchase of 49.9% of the membership and ownership interests in the Challenger Subsidiary which acquired all of the membership and ownership interests in the Challenger Homebuilder Subsidiaries in August 2017.
Other Income, Net
Other income, net, decreased to $2.1 million for the year ended December 31, 2017, compared to $2.8 million for the year ended December 31, 2016. The decrease was due primarily to a decrease in income from homes built on third-party lots of $0.8 million.
Income Tax Provision
Income tax provision increased $23.7 million, or 153.8%, to $39.0 million for the year ended December 31, 2017, from an expense of $15.4 million for the year ended December 31, 2016. The increase is due to multiple factors including an increase in pre-tax income, a change in the federal statutory tax rate and a decrease in noncontrolled earnings. We remeasured our deferred tax assets due to the change in federal statutory tax rate according to the Tax Act, as defined below, which resulted in additional tax expense of $19.0 million.
As of December 31, 2017, we have federal net operating loss carryforwards of approximately $67.0 million, which will begin to expire beginning with the year ending December 31, 2029. Our ability to utilize our net operating loss carryforwards depends on the amount of taxable income we generate in future periods. Based on our historical taxable income results through December 31, 2017, as well as forecasted income, management expects that the Company will generate sufficient taxable income to utilize all of the federal net operating loss carryforwards before they expire. The Company also has approximately $20.2 million of gross state net operating loss carryforwards in Minnesota and Nebraska with varying periods of expiration which the Company believes on a more-likely-than-not basis will not be utilized. The Company has approximately $0.2 million of gross Colorado state net operating loss carryforwards which will begin to expire beginning with the year ending December 31, 2028. Management expects that the Company will generate sufficient Colorado taxable income to utilize all of the Colorado state net operating loss carryforwards before they expire. The Transaction had no effect on the state net operating loss carryforward amount, the related valuation allowance or income tax expense. The Company maintains a gross deferred income tax asset in the amount of $1.3 million for the Minnesota and Nebraska state net operating loss carryforwards and a related valuation allowance in the amount of $1.3 million. In the Company’s assessment of the need for a valuation allowance, both positive and negative information was considered, including any available income tax planning.
As of December 31, 2017, we had deferred tax assets of $31.2 million, which was net of a valuation allowance in the amount of $1.3 million relating to Minnesota and Nebraska state net operating loss carryforwards. The deferred tax assets primarily consist of $14.1 million for federal net operating loss carryforwards and $13.4 million for basis in partnerships. We evaluate the appropriateness of a valuation allowance in future periods based on the consideration of all available evidence, including the generation of taxable income, using the more-likely-than-not standard. A valuation allowance is required to reduce our deferred tax assets if it is determined that it is more-likely-than-not that all or some portion of such assets will not be realized due to the lack of sufficient taxable income. As of December 31, 2017, management concluded that it was more-likely-than-not that the net deferred tax assets, except for the Minnesota and Nebraska state net operating loss carryforwards noted above, will be realized.
On December 22, 2017, the U.S. government enacted comprehensive tax legislation commonly referred to as the Tax Cuts and Jobs Act (the “Tax Act”). The Tax Act, among other things, reduces the U.S. federal corporate tax rate from 35% to 21% effective January 1, 2018 and imposes significant limitations on certain corporate deductions and credits. The Tax Act places future limitations on the usage of net operating loss carryforwards generated in the year ended December 31, 2018 and after. The Tax Act is comprehensive containing several other provisions, some of which will not materially impact the Company. The estimates of the Tax Act may be adjusted in future periods as required. Future implementation guidance from the Internal Revenue Service, clarifications of state tax law or the completion of the Company’s 2017 tax return filings could all affect the estimated financial statement impact of the Tax Act. The SEC staff issued Staff Accounting Bulletin 118 that allows for a measurement period of up to one year after the enactment date of the Tax Act to finalize the recording of the related tax
42
impacts. The Company does not believe potential adjustments in future periods would materially impact the Company’s financial condition or results of operations.
Year Ended December 31, 2016 Compared to the Year Ended December 31, 2015
Net New Home Orders and Backlog
The table below represents new home orders and backlog related to our builder operations segment.
Years Ended December 31, | Increase (Decrease) | |||||||||||||
New Home Orders & Backlog | 2016 | 2015 | Change | % | ||||||||||
Net new home orders | 880 | 647 | 233 | 36.0% | ||||||||||
Number of cancellations | 135 | 108 | 27 | 25.0% | ||||||||||
Cancellation rate | 13.3 | % | 14.3 | % | (1.0 | )% | (7.0)% | |||||||
Average selling communities | 47 | 41 | 6 | 14.6% | ||||||||||
Selling communities at end of period | 50 | 43 | 7 | 16.3% | ||||||||||
Backlog ($ in thousands) | $ | 108,030 | $ | 88,136 | $ | 19,894 | 22.6% | |||||||
Backlog (units) | 237 | 201 | 36 | 17.9% | ||||||||||
Average sales price of backlog | $ | 455,823 | $ | 438,488 | $ | 17,335 | 4.0% | |||||||
Net new home orders for the year ended December 31, 2016 increased by 233 homes, or 36.0%, to 880 for the year ended December 31, 2016 from 647 for the year ended December 31, 2015. Our overall absorption rate for the year ended December 31, 2016 was an average of 18.6 per selling community (1.5 monthly), compared to an average of 15.7 per selling community (1.3 monthly) for the year ended December 31, 2015.
Our cancellation rate was approximately 13.3% for the year ended December 31, 2016, compared to 14.3% for the year ended December 31, 2015. Management believes a cancellation rate in the range of 15% to 20% is representative of an industry average cancellation rate. Nevertheless, on average, our cancellation rate is on the lower end of the industry average, which we believe is due to our target buyer demographics, which generally does not include first time homebuyers.
Backlog units increased by 36 homes, or 17.9%, to 237 as of December 31, 2016 from 201 as of December 31, 2015. The dollar value of backlog units increased $19.9 million, or 22.6%, to $108.0 million as of December 31, 2016 from $88.1 million as of December 31, 2015. The increase in value of backlog units reflects an increase in the average sales price of homes in backlog. Our average sales price of homes in backlog increased $17,335, or 4.0%, to $455,823 for the year ended December 31, 2016, compared to $438,488 for the year ended December 31, 2015. The increase in the average sales price of homes in backlog is the result of changes in product mix related to higher priced single family homes over lower priced townhomes contracted for sale during the period and local market appreciation. The average sales price of homes may fluctuate depending on the mix of homes delivered and sold during a period. The change in the average sales price of homes is part of our natural business cycle.
New Homes Delivered and Home Sales Revenue
The table below represents home sales revenue and new homes delivered related to our builder operations segment.
Years Ended December 31, | Increase (Decrease) | |||||||||||||
New Homes Delivered and Home Sales Revenue | 2016 | 2015 | Change | % | ||||||||||
New homes delivered | 844 | 655 | 189 | 28.9% | ||||||||||
Home sales revenue ($ in thousands) | $ | 365,164 | $ | 254,267 | $ | 110,897 | 43.6% | |||||||
Average sales price of homes delivered | $ | 432,659 | $ | 388,194 | $ | 44,465 | 11.5% | |||||||
New home deliveries (excluding existing completed homes sold, but not yet closed) for the year ended December 31, 2016 for our builder operations segment was 844, compared to new home deliveries of 655 for the year ended December 31, 2015, resulting in an increase of 189 homes, or 28.9%. The increase in new home deliveries was primarily attributable to a 14.6% increase in the average selling communities to 47 from 41.
Home sales revenue increased $110.9 million, or 43.6%, to $365.2 million for the year ended December 31, 2016, from $254.3 million for the year ended December 31, 2015. The increase in revenue was comprised of (a) $73.4 million due to a
43
28.9% increase in homes delivered to 844 for the year ended December 31, 2016, from 655 for the year ended December 31, 2015 and (b) $37.5 million resulting from an increase in average sales price of $44,465 per home to $432,659 for the year ended December 31, 2016, from $388,194 for the year ended December 31, 2015. The increase in the average sales price of homes was the result of changes to the mix of homes delivered resulting in an increase in the number of single family homes delivered at higher price points compared to townhomes and local market appreciation.
Homebuilding
The table below represents cost of home sales and gross margin related to our builder operations segment.
Years Ended December 31, | ||||||||||||||
Homebuilding ($ in thousands) | 2016 | % | 2015 | % | ||||||||||
Home sales revenue | $ | 365,164 | 100.0 | % | $ | 254,267 | 100.0 | % | ||||||
Cost of home sales | 283,454 | 77.6 | % | 201,768 | 79.4 | % | ||||||||
Homebuilding gross margin | $ | 81,710 | 22.4 | % | $ | 52,499 | 20.6 | % | ||||||
Cost of home sales for the year ended December 31, 2016 was $283.5 million, compared to cost of home sales of $201.8 million for the year ended December 31, 2015, resulting in an increase of $81.7 million, or 40.5%, primarily due to the 28.9% increase in the number of homes delivered. Homebuilding gross margin percentage for the year ended December 31, 2016 for builder operations was 22.4%, compared to a gross margin percentage of 20.6% for the year ended December 31, 2015. The increase in homebuilding gross margin is largely due to the opening of new communities during the year ended December 31, 2016. The increase in gross margin percentage is due primarily to the consistent increase in profitability of lot sales to our controlled builders, where revenue is not recognized until the home closes, and lower amortization of capitalized interest during the year ended December 31, 2016.
Salary Expense
The table below represents salary expense, related to our land development and builder operations segments.
($ in thousands) | Years Ended December 31, | As Percentage of Relevant Revenue | ||||||||||||
2016 | 2015 | 2016 | 2015 | |||||||||||
Land development | $ | 324 | $ | 809 | 2.1 | % | 2.2 | % | ||||||
Builder operations | $ | 21,547 | $ | 15,463 | 5.9 | % | 6.1 | % | ||||||
Land Development
Salary expense for the year ended December 31, 2016 for land development was $0.3 million compared to $0.8 million for the year ended December 31, 2015, a decrease of 60.0%. The decrease is primarily the result of a decrease in the average employee headcount of one for the year ended December 31, 2016 due to an employee who changed roles and was reported under land development during the year ended December 31, 2015 compared to builder operations during the year ended December 31, 2016.
Builder Operations
Salary expense for the year ended December 31, 2016 for builder operations was $21.5 million, compared to $15.5 million for the year ended December 31, 2015, an increase of 39.3%. The increase was primarily the result of an increase in salaries driven by an increase in the average employee headcount of 22 and the associated costs of benefits to support the growth in our builder operations segment. Salary expense as a percentage of related revenue decreased for the year ended December 31, 2016, as a result of internal cost efficiencies, as many of our salary and benefits expense did not increase on a percentage basis as we scaled up our business through organic growth.
44
Selling, General and Administrative Expense
The table below represents selling, general and administrative expenses related to our land development and builder operations segments.
($ in thousands) | Years Ended December 31, | As Percentage of Relevant Revenue | ||||||||||||
2016 | 2015 | 2016 | 2015 | |||||||||||
Land development | $ | 1,039 | $ | 1,470 | 6.9 | % | 4.0 | % | ||||||
Builder operations | $ | 15,719 | $ | 12,234 | 4.3 | % | 4.8 | % | ||||||
Land Development
Selling, general and administrative expense for the year ended December 31, 2016 for land development was $1.0 million, compared to $1.5 million for the year ended December 31, 2015, a decrease of 29.3%. The decrease is primarily the result of a decrease in property tax expense. Selling, general and administrative expense as a percentage of related revenue increased for the year ended December 31, 2016, as a result of a decrease in third-party lot sales driven by an increase in intercompany lot sales to our controlled builders where revenue is not recognized until the home closes.
Builder Operations
Selling, general and administrative expense for the year ended December 31, 2016 for builder operations was $15.7 million, compared to $12.2 million for the year ended December 31, 2015, an increase of 28.5%. The increase was primarily attributable to an increase in expenditures to support the growth in our builder operations business. Builder operations expenditures include community costs, such as, non-capitalized property taxes, rent expenses, professional fees, and advertising and marketing expenses. The average selling community count was 47 for the year ended December 31, 2016 compared to 41 for the year ended December 31, 2015. Selling, general and administrative expense as a percentage of related revenue decreased for the year ended December 31, 2016, as a result of internal cost efficiencies, as many of our selling, general and administrative expense did not increase on a percentage basis as we scaled up our business through organic growth.
Interest Expense
Interest expense decreased $0.3 million, or 100.0%, to $0.0 million for the year ended December 31, 2016, compared to $0.3 million for the year ended December 31, 2015. The decrease was due primarily to an increase in the amount of capitalized interest during the year ended December 31, 2016.
Other Income, Net
Other income, net, increased slightly to $2.8 million for the year ended December 31, 2016, compared to $2.7 million for the year ended December 31, 2015.
Income Tax Provision
Income tax provision increased $6.2 million, or 67.7%, to $15.4 million for the year ended December 31, 2016, from an expense of $9.2 million for the year ended December 31, 2015. The increase in income tax provision is due primarily to an increase in pre-tax book income.
As of December 31, 2016, we have federal net operating loss carryforwards of approximately $116.6 million, which will begin to expire beginning with the year ending December 31, 2029. Our ability to utilize our net operating loss carryforwards depends on the amount of taxable income we generate in future periods. Based on our historical taxable income results through December 31, 2016, as well as forecasted income, management expects that the Company will generate sufficient taxable income to utilize all of the federal net operating loss carryforwards before they expire. The Company also has approximately $21.3 million of gross state net operating loss carryforwards having varying periods of expiration which the Company believes on a more-likely-than-not basis will not be utilized. The state loss carryforwards and related $1.1 million tax-effected valuation allowance were previously recorded by BioFuel. The Transaction had no effect on the state loss carryforward amount, the related valuation allowance or income tax expense. The Company maintains a deferred income tax asset in the amount of $1.1 million for the state loss carryforwards and a related valuation allowance in the amount of $1.1 million. In the Company’s assessment of the need for a valuation allowance, both positive and negative information was considered, including any available income tax planning.
45
As of December 31, 2016, we had deferred tax assets of $67.6 million, which was net of a valuation allowance in the amount of $1.1 million relating to state loss carryforwards. The deferred tax assets are primarily related to $40.8 million for federal net operating loss carryforwards and $22.9 million for basis in partnerships. We evaluate the appropriateness of a valuation allowance in future periods based on the consideration of all available evidence, including the generation of taxable income, using the more-likely-than-not standard. A valuation allowance is required to reduce our deferred tax assets if it is determined that it is more-likely-than-not that all or some portion of such assets will not be realized due to the lack of sufficient taxable income. As of December 31, 2016, management concluded that it was more-likely-than-not that the net deferred tax assets, except for the state loss carryforwards noted above, will be realized.
Lots Owned and Controlled
The table below represents the lots we owned or controlled (including lot option contracts) as of December 31, 2017, 2016 and 2015 by market. Owned lots are those for which we hold title, while controlled lots are those for which we have the contractual right to acquire title but do not currently own.
December 31, | ||||||||
2017 | 2016 | 2015 | ||||||
Lots Owned(1) | ||||||||
Texas | 3,196 | 2,998 | 2,659 | |||||
Georgia | 1,299 | 1,237 | 991 | |||||
Total | 4,495 | 4,235 | 3,650 | |||||
Lots Controlled(1) | ||||||||
Texas | 1,390 | 554 | 326 | |||||
Georgia | 334 | 400 | 758 | |||||
Total | 1,724 | 954 | 1,084 | |||||
Total Lots Owned and Controlled(2) | 6,219 | 5,189 | 4,734 | |||||
(1) | The “land use” assumptions used in the above table may change over time. |
(2) | Total lots excludes homes under construction. |
Liquidity and Capital Resources Overview
As of December 31, 2017 and 2016, we had $36.7 million and $35.2 million of cash, respectively. Management believes that we have a prudent cash management strategy, including with respect to cash outlays for land and inventory acquisition and development. We intend to generate cash from the sale of inventory, and intend to redeploy the net cash generated from the sale of inventory to acquire and develop lots that represent opportunities to generate desired margins. We may also use cash to make additional investments in acquisitions, joint ventures, or other strategic activities.
Our principal uses of capital for the year ended December 31, 2017 were operating expenses, land purchases, land development, home construction and the payment of routine liabilities. We used funds generated by operations and available borrowings to meet our short-term working capital requirements. We remain focused on generating positive margins in our builder operations segment and acquiring desirable land positions in order to maintain a strong balance sheet and remain poised for growth.
Cash flows for each of our communities depend on their stage in the development cycle, and can differ substantially from reported earnings. Early stages of development or expansion require significant cash outlays for land acquisitions, entitlements and other approvals, and construction of model homes, roads, utilities, general landscaping and other amenities. Because these costs are a component of our inventory and are not recognized in our statement of income until a home closes, we incur significant cash outlays prior to recognition of earnings. In the later stages of community development, cash inflows may significantly exceed earnings reported for financial statement purposes, as the cash outflow associated with home construction and land development was previously incurred. We are actively acquiring and developing lots in our primary markets in order to maintain and grow our lot supply.
On August 31, 2016, we entered into a First Amendment to the Unsecured Revolving Credit Facility (as defined below), which added Flagstar Bank, FSB (“Flagstar Bank”) as a lender under the Credit Agreement (as defined below), with an initial commitment of $20.0 million, which increased the aggregate lending commitments available under the Unsecured Revolving Credit Facility from $40.0 million to $60.0 million. The First Amendment also increased the maximum amount of the
46
Unsecured Revolving Credit Facility to a maximum aggregate amount of $110.0 million. On December 1, 2016, we entered into a Second Amendment to the Unsecured Revolving Credit Facility, which extended the termination date to December 14, 2019 and pursuant to which Citibank, N.A. increased its commitment from $25.0 million to $35.0 million which increased the aggregate lending commitments available under the Unsecured Revolving Credit Facility from $60.0 million to $70.0 million. On March 6, 2017, Flagstar Bank increased its commitment under the Unsecured Revolving Credit Facility from $20.0 million to $35.0 million, which increased the aggregate lending commitments available under the Unsecured Revolving Credit Facility from $70.0 million to $85.0 million. On September 1, 2017, we entered into a Third Amendment to the Unsecured Revolving Credit Facility, which increased Flagstar Bank’s commitment from $35.0 million to $70.0 million and Credit Suisse’s commitment from $15.0 million to $25.0 million which in turn, increased the aggregate lending commitments available under the Unsecured Revolving Credit Facility from $85.0 million to $130.0 million. The Third Amendment also increased the maximum amount of the Unsecured Revolving Credit Facility from $110.0 million to a maximum aggregate amount of $200.0 million. On December 1, 2017, we entered into a Fourth Amendment to the Unsecured Revolving Credit Facility, which extended the termination date with respect to commitments under the Unsecured Revolving Credit Facility from December 14, 2019 to December 14, 2020.
On October 27, 2017, we amended the Credit Facility (as defined below) to increase the commitment amount from $50.0 million to $75.0 million.
Our debt to total capitalization ratio was approximately 22% as of December 31, 2017. It is our intent to prudently employ leverage to continue to invest in our land acquisition, development and homebuilding businesses. We intend to target a debt to total capitalization ratio of approximately 35% to 40%, which we expect will provide us with significant additional growth capital.
Revolving Credit Facilities
As of December 31, 2017, we had the following lines of credit (“LOC”):
On July 30, 2015, we entered into a revolving credit facility (the “Credit Facility”) with Inwood National Bank, which initially provided for up to $50.0 million. Amounts outstanding under the Credit Facility are secured by mortgages on real property and security interests in certain personal property (to the extent that such personal property is connected with the use and enjoyment of the real property) that is owned by certain of our subsidiaries. Outstanding borrowings under the Credit Facility bear interest payable monthly at a floating rate per annum equal to the rate announced by Bank of America, N.A., from time to time, as its “Prime Rate” (the “Index”) with such adjustments to the interest rate being made on the effective date of any change in the Index. Notwithstanding the foregoing, the interest may not, at any time, be less than 4% per annum or more than the lesser amount of 18% and the highest maximum rate allowed by applicable law. The entire unpaid principal balance and any accrued but unpaid interest is due and payable on the maturity date. As of December 31, 2017, the interest rate on outstanding borrowings under the Credit Facility was 4.5% per annum.
On May 3, 2016, we amended the Credit Facility. The amended Credit Facility is subject to a borrowing base limitation equal to the sum of 50% of the total value of land and 65% of the total value of lots owned by certain of our subsidiaries, each as determined by an independent appraiser, with the value of land being restricted from being more than 65% of the borrowing base. Beginning on August 1, 2017, a non-usage fee equal to 0.25% of the average unfunded amount of the commitment amount over a trailing 12 month period is due on or before August 1st of each year during the term of the amended Credit Facility. The maturity date was extended to May 1, 2019. The costs of $0.1 million associated with the amendment were deferred and are included in other assets, net in our consolidated balance sheets. We are amortizing these debt issuance costs to interest expense over the term of the Credit Facility using the straight-line method.
During the year ended December 31, 2017, we amended the Credit Facility several times for the purposes of adding additional land holdings as collateral to the Credit Facility agreement. On October 27, 2017, we amended the Credit Facility to increase the commitment amount from $50.0 million to $75.0 million. This amendment temporarily waived the borrowing base through March 31, 2018, after which the borrowing base is reinstated. During the temporary borrowing base waiver, the Credit Facility is governed by a loan-to-value ratio not to exceed 70%. The commitment amount on the non-usage fee increased from $50.0 million to $75.0 million.
Under the terms of the amended Credit Facility, we are required, among other things, to maintain minimum multiples of net worth in excess of the outstanding Credit Facility balance, minimum interest coverage and maximum leverage.
On December 15, 2015, we entered into a credit agreement (the “Credit Agreement”) with the lenders named therein, and Citibank, N.A., as administrative agent, providing for a senior, unsecured revolving credit facility with aggregate lending
47
commitments of up to $40.0 million (the “Unsecured Revolving Credit Facility”). Before the First Amendment (as defined and discussed below) increased the maximum amount of the Unsecured Revolving Credit Facility, we could, at our option and subject to certain terms and conditions, prior to the termination date, increase the amount of the Unsecured Revolving Credit Facility up to a maximum aggregate amount of $75.0 million. Before the Second Amendment (as defined and discussed below), commitments under the Unsecured Revolving Credit Facility were available until the period ending December 14, 2018. Citibank, N.A. and Credit Suisse AG, Cayman Islands Branch (“Credit Suisse”) initially committed to provide $25.0 million and $15.0 million, respectively.
The Unsecured Revolving Credit Facility provides for interest rate options on advances at rates equal to either: (a) in the case of base rate advances, the highest of (i) Citibank’s base rate, (ii) the federal funds rate plus 0.5%, and (iii) the one-month LIBOR plus 1.0%, in each case plus 1.5%; or (b) in the case of Eurodollar rate advances, the reserve adjusted LIBOR plus 2.5%. Interest on amounts borrowed under the Unsecured Revolving Credit Facility is payable in arrears quarterly on the last day of each March, June, September and December during such periods. As of December 31, 2017, the interest rate on outstanding borrowings under the Unsecured Revolving Credit Facility was 4.0% per annum.
We pay the lenders a commitment fee on the amount of the unused commitments on a quarterly basis at a rate per annum equal to 0.45%.
Outstanding borrowings under the Unsecured Revolving Credit Facility are subject to, among other things, a borrowing base. The borrowing base limitation is equal to the sum of: 100% of unrestricted cash (in excess of $15.0 million); 85% of the book value of model homes, construction in progress homes, sold completed homes and speculative homes (subject to certain limitations on the age and number of speculative homes and model homes); 65% of the book value of finished lots and land under development; and 50% of the book value of entitled land (subject to certain limitations on the value of entitled land and land under development as a percentage of the borrowing base).
On August 31, 2016, we entered into a First Amendment to the Credit Agreement (the “First Amendment”), with Flagstar Bank, the lenders named therein, and Citibank, N.A., as administrative agent, which amended the Credit Agreement. The First Amendment added Flagstar Bank as a lender under the Credit Agreement, with an initial commitment of $20.0 million, which increased the aggregate lending commitments available under the Unsecured Revolving Credit Facility from $40.0 million to $60.0 million. The First Amendment also increased the maximum amount of the Unsecured Revolving Credit Facility to a maximum aggregate amount of $110.0 million.
On December 1, 2016, we entered into a Second Amendment to the Credit Agreement (the “Second Amendment”), with the lenders named therein, and Citibank, N.A., as administrative agent, which further amended the Credit Agreement. The Second Amendment, among other things, extended the termination date with respect to commitments under the Unsecured Revolving Credit Facility from December 14, 2018 to December 14, 2019. The Second Amendment became effective upon the payment of an upfront fee of 0.15% of the aggregate amount of any extended commitments on December 15, 2016. Additionally, Citibank, N.A. increased its commitment under the Unsecured Revolving Credit Facility from $25.0 million to $35.0 million which increased the aggregate lending commitments available under the Unsecured Revolving Credit Facility from $60.0 million to $70.0 million.
On March 6, 2017, Flagstar Bank increased its commitment under the Unsecured Revolving Credit Facility from $20.0 million to $35.0 million, which increased the aggregate lending commitments available under the Unsecured Revolving Credit Facility from $70.0 million to $85.0 million. The costs of $0.1 million associated with this increase in commitment were deferred and are included in other assets, net in our consolidated balance sheets. We are amortizing these debt issuance costs to interest expense over the term of the Unsecured Revolving Credit Facility using the straight-line method.
On September 1, 2017, we entered into a Third Amendment to the Credit Agreement (the “Third Amendment”), with Flagstar Bank, the lenders named therein, and Citibank, N.A., as administrative agent, which amended the Credit Agreement. Pursuant to the Third Amendment, Flagstar Bank increased its commitment from $35.0 million to $70.0 million and Credit Suisse increased its commitment from $15.0 million to $25.0 million, which increased the aggregate lending commitments available under the Unsecured Revolving Credit Facility from $85.0 million to $130.0 million. The Third Amendment also increased the maximum amount of the Unsecured Revolving Credit Facility from $110.0 million to a maximum aggregate amount of $200.0 million. Further increases are available at our option, prior to the termination date, subject to certain terms and conditions. In addition, the Third Amendment appoints Flagstar in the roles as the sole lead arranger and administrative agent under the Credit Agreement. The costs of $0.4 million associated with the Third Amendment were deferred and are included in other assets, net in our consolidated balance sheets. We are amortizing these debt issuance costs to interest expense over the term of the Unsecured Revolving Credit Facility using the straight-line method.
48
On December 1, 2017, we entered into a Fourth Amendment to the Credit Agreement (the “Fourth Amendment”), with the lenders named therein, and Flagstar Bank, as administrative agent, which amended the Credit Agreement. The Fourth Amendment extended the termination date with respect to commitments under the Unsecured Revolving Credit Facility from December 14, 2019 to December 14, 2020. The extension became effective upon the payment of an upfront fee of 0.15% of the aggregate amount of any extended commitments on December 15, 2017.
On March 12, 2018, the Company, Flagstar Bank, as administrative agent, and JPMorgan Chase Bank, N.A. (“JPMorgan”) executed a new lender supplement to add JPMorgan as a lender under the Credit Agreement, with an initial commitment of $30.0 million, which increased the aggregate lending commitments available under the Unsecured Revolving Credit Facility from $130.0 million to $160.0 million. The increased borrowing capacity will be effective March 27, 2018.
Under the terms of the Unsecured Revolving Credit Facility, we are required, among other things, to maintain compliance with various covenants, including financial covenants relating to a maximum Leverage Ratio, a minimum Interest Coverage Ratio, and a minimum Consolidated Tangible Net Worth, each as defined therein. Our compliance with these financial covenants is measured by calculations and metrics that are specifically defined or described by the terms of the Unsecured Revolving Credit Facility.
We were in compliance with the covenants under the line of credit agreements described above as of December 31, 2017.
Notes Payable
On December 13, 2013, a subsidiary of JBGL signed a promissory note with Briar Ridge Investments, LTD for $9.0 million maturing on December 13, 2017, bearing interest at 6.0% per annum and collateralized by land purchased in Allen, Texas. In December 2016, this note was extended through December 31, 2018.
On November 30, 2016, a subsidiary of JBGL signed a promissory note for $1.2 million maturing on December 1, 2018, bearing interest at 3.0% per annum and collateralized by land located in Allen, Texas.
Cash Flows
The following summarizes our primary sources and uses of cash in the periods presented:
Cash Flows — Year Ended December 31, 2017 to Year Ended December 31, 2016
The following summarizes our primary sources and uses of cash for the year ended December 31, 2017 as compared to the year ended December 31, 2016:
• | Operating activities. Net cash used in operating activities for the year ended December 31, 2017 was $18.8 million, compared to $5.2 million during the year ended December 31, 2016. The change was primarily attributable to changes in working capital associated with (i) inventory, as inventory increased by 20.8% for the year ended December 31, 2017, compared to a 19.2% increase in inventory for the year ended December 31, 2016, (ii) an increase in accrued expenses of $4.2 million for the year ended December 31, 2017 compared to an increase of $8.6 million for the year ended December 31, 2016, due to an increase in accrued job costs on land and home closings and management bonuses, (iii) an increase in earnest money deposits of $3.9 million for the year ended December 31, 2017 compared to $0.3 million for the year ended December 31, 2016, due to an increase in the land option contracts entered into during 2017 compared to 2016, (iv) an increase in other assets of $1.7 million for the year ended December 31, 2017 compared to a decrease of $1.3 million for the year ended December 31, 2016, due to an increase in pursuit costs and prepaid expenses in 2017, and (v) an increase in accounts payable of $7.2 million for the year ended December 31, 2017 compared to an increase of $1.6 million for the year ended December 31, 2016, due to an an increase in development spending for the year ended December 31, 2017. |
• | Investing activities. Net cash used in investing activities for the year ended December 31, 2017 of $0.4 million remained flat compared to the year ended December 31, 2016. |
• | Financing activities. Net cash provided by financing activities for the year ended December 31, 2017 was $19.9 million, compared to $21.5 million during the year ended December 31, 2016. The decrease was primarily due to (i) an increase in repayments of notes payable and lines of credit of $20.2 million and (ii) a net increase in distributions to noncontrolling interests and contributions from noncontrolling interests of $3.6 million, partially offset by (iii) an increase in line of credit borrowings and proceeds from notes payable of $22.8 million for the year ended December 31, 2017. |
49
Cash Flows — Year Ended December 31, 2016 to Year Ended December 31, 2015
The following summarizes our primary sources and uses of cash for the year ended December 31, 2016 as compared to the year ended December 31, 2015:
• | Operating activities. Net cash used in operating activities for the year ended December 31, 2016 was $5.2 million, compared to net cash used of $45.4 million during the year ended December 31, 2015. The change was primarily attributable to changes in working capital associated with (i) an increase in accrued expenses of $8.6 million for the year ended December 31, 2016 compared to a decrease of $3.5 million for the year ended December 31, 2015, due to an increase in accrued job costs on land and home closings, and management bonuses being paid subsequent to the year ended December 31, 2016, (ii) an increase in earnest money deposits of $0.3 million for the year ended December 31, 2016 compared to $11.2 million for the year ended December 31, 2015, due to an increase in the land option contracts entered into during 2015 compared to 2016, (iii) an increase in customer and builder deposits of $7.2 million for the year ended December 31, 2016 compared to a decrease of $2.8 million for the year ended December 31, 2015, due to the increase in sales volume during the year ended December 31, 2016 and (iv) a decrease in other assets of $1.3 million for the year ended December 31, 2016 compared to an increase of $1.9 million for the year ended December 31, 2015, due to a decrease in prepaid development costs during the year ended December 31, 2016. |
• | Investing activities. Net cash used in investing activities for the year ended December 31, 2016 was $0.5 million, compared to net cash provided of $2.5 million during the year ended December 31, 2015. The change was primarily due to a decrease in proceeds from investment in direct financing leases of $2.8 million since there was no investment in direct financing lease activity during the year ended December 31, 2016. |
• | Financing activities. Net cash provided by financing activities for the year ended December 31, 2016 was $21.5 million, compared to net cash provided of $43.8 million during the year ended December 31, 2015. The change was primarily due to (i) a decrease in cash received of $19.9 million from net proceeds from equity offerings less the repayment of the Term Loan Facility, and (ii) a net decrease in lines of credit and notes payable borrowings of $28.3 million for the year ended December 31, 2016 compared to a $31.4 million reduction in lines of credit and notes payable borrowings for the year ended December 31, 2015. |
Off-Balance Sheet Arrangements and Contractual Obligations
In the ordinary course of business, we enter into land purchase contracts with third-party developers in order to procure lots for the construction of our homes. We are subject to customary obligations associated with entering into contracts for the purchase of land and improved lots. These purchase contracts typically require a cash deposit, and the purchase of properties under these contracts is generally contingent upon satisfaction of certain requirements, including obtaining applicable property and development entitlement. We also utilize option contracts with lot sellers as a method of acquiring lots in staged takedowns, which are the schedules that dictate when lots must be purchased to help manage the financial and market risk associated with land holdings, and to reduce the use of funds from our corporate financing sources. Lot option contracts generally require us to pay a non-refundable deposit for the right to acquire lots over a specified period of time at pre-determined prices. We generally have the right at our discretion to terminate our obligations under both purchase contracts and option contracts by forfeiting the cash deposit with no further financial responsibility to the land seller.
Our utilization of lot option contracts is dependent on, among other things, the availability of land sellers willing to enter into these arrangements, the availability of capital to finance the development of optioned lots, general housing market conditions and local market dynamics. Options may be more difficult to procure from land sellers in strong housing markets and are more prevalent in certain geographic regions.
During the ordinary course of business, certain regulatory agencies and municipalities require us to post letters of credit. Such letters of credit are issued by financial institutions and commit the issuer to pay specified amounts to the holder of the letter of credit if the holder demonstrates that we have failed to perform under the relevant contract. If this were to occur, we would be required to reimburse the issuer of the letter of credit. The expiration dates of the letters of credit coincide with the expected completion date of the related projects. If the obligations related to a project are ongoing, the letters of credit are automatically extended, without amendment, for one year. As of December 31, 2017 and December 31, 2016, letters of credit outstanding was $0.2 million and $0.0 million, respectively. We do not believe that it is likely that any material claims will be made under a letter of credit in the foreseeable future.
50
Contractual Obligations Table
The following table summarizes our contractual obligations as of December 31, 2017.
Payments Due by Period (in thousands) | ||||||||||||||||||||
Contractual Obligations | Total | Less Than 1 Year | 1 - 3 Years | 3 - 5 Years | Years 5 and Beyond | |||||||||||||||
Debt obligations(1) | $ | 116,926 | $ | 9,926 | $ | 107,000 | $ | — | $ | — | ||||||||||
Operating leases | 4,494 | 877 | 1,829 | 1,345 | 443 | |||||||||||||||
Purchase obligations(2) | 206,993 | 137,548 | 63,680 | 5,765 | — | |||||||||||||||
Total | $ | 328,413 | $ | 148,351 | $ | 172,509 | $ | 7,110 | $ | 443 | ||||||||||
(1) | Represents principal due on our lines of credit and notes payable. |
(2) | Represents the full contractual amount, including escalators, on our commitments to purchase land and lots, for which there may be existing deposits that net against such amount. If we do not purchase the land or lots under contract, we may forfeit our deposit related to the land or lots. |
Inflation
Homebuilding operations can be adversely impacted by inflation, primarily from higher land prices, and increased costs of financing, labor, materials and construction. In addition, inflation can lead to higher mortgage rates, which can significantly affect the affordability of mortgage financing to homebuyers. While we attempt to pass on cost increases to customers through increased prices, when weak housing market conditions exist, we may be unable to offset cost increases with higher selling prices.
Seasonality
The homebuilding industry experiences seasonal fluctuations in quarterly operating results and capital requirements. We typically experience the highest new home order activity in spring and summer, although this activity is also highly dependent on the number of active selling communities, timing of new community openings and other market factors. Since it typically takes five to nine months to construct a new home, we deliver more homes in the second half of the year as spring and summer home orders lead to home deliveries. Because of this seasonality, home starts, construction costs and related cash outflows have historically been highest in the second and third quarters, and the majority of cash receipts from home deliveries occur during the second half of the year. We expect this seasonal pattern to continue over the long-term, although it may be affected by volatility in the homebuilding industry.
Significant Accounting Policies
Our financial statements have been prepared in accordance with GAAP. The preparation of these financial statements requires management to make estimates and judgments that affect the reported amounts of assets and liabilities at the date of the financial statements and the reported amounts of costs and expenses during the reporting period. On an ongoing basis, management evaluates estimates and judgments, including those which impact our most critical accounting policies. Management bases estimates and judgments on historical experience and on various other factors that we believe to be reasonable under the circumstances. Actual results may differ from estimates under different assumptions or conditions. Management believes that the following accounting policies are among the most important to the portrayal of our financial condition and results of operations and require among the most difficult, subjective or complex judgments.
Principles of Consolidation
We evaluated our wholly-owned subsidiaries and controlled builders under ASC 810, Consolidation (“ASC 810”) and concluded that each controlled builder is a variable interest entity (“VIE”). We own a 50% equity interest and have 51% of the voting interest in each controlled builder. In addition, we hold two of the three board seats for each controlled builder and are able to exercise control over the operations of each controlled builder. We account for our controlled builders under the variable interest model and are the primary beneficiary of each controlled builder in accordance with ASC 810. Therefore, the financial statements of our controlled builders are consolidated in our consolidated financial statements following the variable interest model. All intercompany balances and transactions have been eliminated in consolidation.
51
We use the equity method of accounting for our investment in an unconsolidated entity over which we exercise significant influence but do not have a controlling interest. Under the equity method, our share of the unconsolidated entity’s earnings or losses, if any, is included in the consolidated statements of income.
Generally, we form subsidiaries for each selling community and/or homebuilding project in which we invest.
Investment in Unconsolidated Entity
In accordance with ASC 323, Investments - Equity Method and Joint Ventures (“ASC 323”), we use the equity method of accounting for our investment in an unconsolidated entity over which we exercise significant influence but do not have a controlling interest. The equity method of accounting requires the investment to be initially recorded at cost and subsequently adjusted for our share of equity in the unconsolidated entity’s earnings or losses. We evaluate the carrying amount of the investment in unconsolidated entity for impairment in accordance with ASC 323. If we determine that a loss in the value of the investment is other than temporary, we write down the investment to its estimated fair value. Any such losses are recorded to equity in income of unconsolidated entity in our consolidated statements of income. Due to uncertainties in the estimation process and the significant volatility in demand for new housing, actual results could differ significantly from such estimates. During the year ended December 31, 2017, we did not identify indicators of impairment for our investment in unconsolidated entity.
Variable Interest Entities and Noncontrolling Interests
We account for VIEs in accordance with ASC 810. In accordance with ASC 810, an entity is a VIE when: (a) the equity investment at risk in the entity is not sufficient to permit the entity to finance its activities without additional subordinated financial support provided by other parties, including the equity holders; (b) the entity’s equity holders as a group either (i) lack the direct or indirect ability to make decisions about the entity, (ii) are not obligated to absorb expected losses of the entity or (iii) do not have the right to receive expected residual returns of the entity; or (c) the entity’s equity holders have voting rights that are not proportionate to their economic interests, and the activities of the entity involve or are conducted on behalf of the equity holder with disproportionately few voting rights. If an entity is deemed to be a VIE pursuant to ASC 810, the enterprise that has both (i) the power to direct the activities of the VIE that most significantly impacts the entity’s economic performance and (ii) the obligation to absorb the expected losses of the entity or right to receive benefits from the entity that could be potentially significant to the VIE is considered the primary beneficiary and must consolidate the VIE. In accordance with ASC 810, we perform ongoing reassessments of whether we are the primary beneficiary of a VIE.
We own 50% equity interests in several controlled builders deemed to be VIEs under ASC 810 for which we are considered the primary beneficiary. Our controlled builders are engaged in all aspects of the homebuilding process in residential neighborhoods and master planned communities in premium locations in the Dallas and Atlanta markets. We sell finished lots or option lots from third-party developers to our controlled builders for their homebuilding operations and provide them with construction financing and strategic planning. The board of managers of each of the controlled builders has the power to direct the activities that significantly impact the controlled builder’s economic performance. Pursuant to our agreements with each controlled builder, we have the ability to appoint 2 of the 3 members of the board of managers of each controlled builder’s board of managers. A majority of the board of managers constitutes a quorum to transact business. No action can be approved by the board of managers without the approval from at least one individual whom we have appointed at each controlled builder. We have the ability to control the activities of each controlled builder that most significantly impact the controlled builder’s economic performance. Such activities include, but are not limited to, involvement in the day to day capital and operating decisions, the ability to determine the budget and plan, the ability to control financing decisions, and the ability to acquire additional land or dispose of land. In addition, we have the right to receive the expected residual returns and obligation to absorb the expected losses of each controlled builder through the pro rata profits and losses we are allocated based on our ownership interest. Therefore, the financial statements of our controlled builders are consolidated in the our consolidated financial statements following the variable interest model. The noncontrolling interests attributable to the 50% minority interests owned by our controlled builders are included as noncontrolling interests in our consolidated financial statements.
Our controlled builders’ creditors have no recourse against us. The assets of two of our consolidated controlled builders can only be used to settle obligations of those controlled builders. The assets of our VIEs that can be used only to settle obligations of the VIEs as of December 31, 2017 totaled $52.2 million, of which $0.9 million was cash and $47.8 million was inventory. The assets of our VIEs that could be used only to settle obligations of the VIEs as of December 31, 2016 totaled $24.6 million, of which $0.9 million was cash and $22.1 million was inventory.
52
Revenue Recognition
In accordance with ASC 360-20, Real Estate Sales, we recognize revenue from sales of residential units, land and lots when a sale is consummated. Consummation occurs when the following criteria are met: (a) the parties are bound by the terms of the contract; (b) all net consideration has been exchanged; (c) any permanent financing for which the seller is responsible has been arranged; (d) continuing investment is adequate to demonstrate a commitment to pay for the home, land or lot; and (e) all conditions precedent to closing have been performed. Typically, these criteria are met at closing, at which time we recognize revenue under the full accrual method, which allows full recognition of the gain on the sale of the home, land or lot.
We recognize sales incentives, such as cash discounts and incentives on options and option upgrades as a reduction of sales revenue at the time the home is closed and revenue is recognized. We record seller-paid financing and other closing costs within cost of sales of residential units at the time the home is closed and revenue is recognized. From time to time, we receive vendor rebates for certain materials that are utilized in the construction of homes. In accordance with ASC 605-50, Customer Payments and Incentives, the Company recognizes these rebates as a reduction of cost of sales of residential units at the later of (a) the home closing (when revenue is recognized), or (b) when such amounts are reasonably estimable.
We also serve as the general contractor for certain custom homes where the customers, and not us, own the underlying land and improvements. We recognize revenue for these mechanics lien contracts on the percentage of completion method, where progress toward completion is measured by relating the actual cost of work performed to date to the current estimated total cost of the respective contracts. During the years ended December 31, 2017, 2016 and 2015, we recognized revenue of $4.4 million, $12.5 million and $7.7 million, respectively, and incurred costs of $3.8 million, $11.1 million and $5.9 million, respectively, associated with mechanics lien contracts, which is presented net in other income, net on the consolidated statements of income.
Inventory and Cost of Sales
Inventory consists primarily of land in the process of development, developed lots, completed homes, model homes, raw land scheduled for development, and land not owned under option contracts in Texas and Georgia. Inventory is valued at cost unless the carrying value is determined to not be recoverable in which case the affected inventory is written down to fair value. Cost includes any related pre-acquisition costs that are directly identifiable with a specific property so long as those pre-acquisition costs are anticipated to be recoverable at the sale of the property.
Residential lots held for sale and lots held for development include the initial cost of acquiring the land as well as certain costs capitalized related to developing the land into individual residential lots including direct overhead, interest and real estate taxes.
Land, development and other project costs, including direct overhead, interest and property taxes incurred during development and home construction, are capitalized. Land development and other common costs that benefit an entire community are allocated to individual homes and lots based on relative sales value. The costs of completed lots are transferred to work in process when home construction begins. Home construction costs and related carrying charges (principally interest and real estate taxes) are allocated to the cost of individual homes using the specific identification method.
Inventory costs for completed homes are expensed as cost of sales as homes are sold. Changes to estimated total development costs subsequent to initial home closings in a community are generally allocated to the unsold homes in the community on a pro-rata basis. The life cycle of a community generally ranges from two to six years, commencing with the acquisition of land, continuing through the land development phase, and concluding with the construction, sale, and delivery of homes. We recognize costs as incurred on our mechanics lien contracts.
Impairment of Inventory
In accordance with the ASC 360, Property, Plant, and Equipment, we evaluate our inventory for indicators of impairment by individual community and development during each reporting period.
For our builder operations segment, during each reporting period, community gross margins are reviewed by management. In the event that inventory in an individual community is moving at a slower than anticipated absorption pace or the average sales prices or margins within an individual community are trending downward and are anticipated to continue to trend downward over the life of the community, we will further investigate these communities and evaluate them for impairment.
For our land development segment, we perform a quarterly review for indicators of impairment for each project which involves projecting future lot sales based on executed contracts and comparing these revenues to projected costs. In determining the allocation of costs to a particular land parcel, we rely on project budgets which are based on a variety of
53
assumptions, including assumptions about development schedules and future costs to be incurred. It is common that actual results differ from budgeted amounts for various reasons, including delays, increases in costs that have not been committed, unforeseen issues encountered during project development that fall outside the scope of existing contracts, or items that ultimately cost more or less than the budgeted amount. We apply procedures to maintain best estimates in our budgets, including assessing and revising project budgets on a periodic basis, obtaining commitments from subcontractors and vendors for future costs to be incurred and utilizing the most recent information available to estimate costs.
Each reporting period, we review our real estate assets to determine whether the estimated remaining future cash flows of the development are more or less than the asset’s carrying value. The estimated cash flows are determined by projecting the remaining sales revenue from lot sales based on the contractual lot takedowns remaining or historical/projected home sales/delivery absorptions for homebuilding operations and then comparing that to the remaining projected expenditures for development or home construction. Remaining projected expenditures are based on the most current pricing/bids received from subcontractors for current phases or homes under development. For future phases of land development, management uses its best judgment to project potential cost increases. When projecting sales revenue, management does not assume improvement in market conditions.
If the estimated cash flows are more than the asset’s carrying value, no impairment adjustment is required. However, if the estimated cash flows are less than the asset’s carrying value, the asset is deemed impaired and will be written down to fair value. These impairment evaluations require us to make estimates and assumptions regarding future conditions, including the timing and amounts of development costs and sales prices of real estate assets, to determine if expected future cash flows will be sufficient to recover the asset’s carrying value.
Fair value is determined based on estimated future cash flows discounted for inherent risks associated with real estate assets. These discounted cash flows are impacted by expected risk based on estimated land development activities, construction and delivery timelines, market risk of price erosion, uncertainty of development or construction cost increases, and other risks specific to the asset or market conditions where the asset is located when the assessment is made. These factors are specific to each community and may vary among communities.
When estimating cash flows of a community, we make various assumptions, including: (i) expected sales prices and sales incentives to be offered, including the number of homes available, pricing and incentives being offered by us or other builders in other communities, and future sales price adjustments based on market and economic trends; (ii) expected sales pace and cancellation rates based on local housing market conditions, competition and historical trends; (iii) costs expended to date and expected to be incurred including, but not limited to, land and land development costs, home construction costs, interest costs, indirect construction and overhead costs, and selling and marketing costs; (iv) alternative product offerings that may be offered that could have an impact on sales pace, sales price and/or building costs; and (v) alternative uses for the property. Many assumptions are interdependent and a change in one may require a corresponding change to other assumptions. For example, increasing or decreasing sales absorption rates has a direct impact on the estimated per unit sales price of a home, the level of time-sensitive costs (such as indirect construction, overhead and carrying costs), and selling and marketing costs (such as model home maintenance costs and advertising costs). Due to uncertainties in the estimation process, the significant volatility in demand for new housing and the long life cycle of many communities, actual results could differ significantly from such estimates.
For the year ended December 31, 2017, we recorded impairment of approximately $0.1 million related to real estate inventory in our builder operations segment. We did not note any indicators of impairment for any projects, and no impairment adjustments related to real estate inventory were recorded for the years ended December 31, 2016 and 2015.
Earnest Money Deposits
In the ordinary course of business, we enter into land and lot option contracts in order to procure land for the construction of homes in the future. Pursuant to these option contracts, we generally provide a deposit to the seller as consideration for the right to purchase land at different times in the future, usually at predetermined prices. Such contracts enable us to defer acquiring portions of properties owned by third parties or unconsolidated entities until we have determined whether and when to exercise its option, which reduces our financial risk associated with long-term land holdings. Option deposits and pre-acquisition costs (such as environmental testing, surveys, engineering, and entitlement costs) are capitalized if the costs are directly identifiable with the land under option and acquisition of the property is probable. Such costs are reflected in other assets and are reclassified to inventory upon taking title to the land. We write off deposits and pre-acquisition costs if it becomes probable that we will not go forward with the project or recover the capitalized costs. Such decisions take into consideration changes in local market conditions, the timing of required land takedowns, the availability and best use of necessary incremental capital, and other factors. As of December 31, 2017, the Company had land option contracts with
54
potential purchase payments through 2021. Deposits and pre-acquisition costs written off related to option contracts we abandoned totaled $0.2 million, $0.2 million and $0.2 million for the years ended December 31, 2017, 2016 and 2015, respectively.
Under ASC 810, a non-refundable deposit paid to an entity is deemed to be a variable interest that will absorb some or all of the entity’s expected losses if they occur and, as such, our land and lot option contracts are considered variable interests. Our option contract deposits, along with any related pre-acquisition costs, generally represent our maximum exposure to the land seller if we elect not to purchase the optioned property. Therefore, whenever we enter into an option or purchase contract with an entity and make a non-refundable deposit, a VIE assessment is performed. However, we generally have little control or influence over the operations of these VIEs due to our lack of an equity interest in them. Additionally, creditors of the VIE typically have no material recourse against us, and we do not provide financial or other support to these VIEs other than as stipulated in the option contracts. In accordance with ASC 810, we perform ongoing reassessments of whether we are the primary beneficiary of a VIE. We were not required to consolidate any land or lot option VIEs as of December 31, 2017 or December 31, 2016.
Share-Based Compensation
We measure and account for share-based awards in accordance with ASC 718, Compensation - Stock Compensation. We expense share-based payment awards made to employees and directors, including stock options and restricted stock awards. Share-based compensation expense associated with stock options and restricted stock awards with vesting contingent upon the achievement of service conditions is recognized on a straight-line basis, net of estimated forfeitures, over the requisite service period over which the awards are expected to vest. We estimate the value of stock options with vesting contingent upon the achievement of service conditions as of the date the award was granted using the Black-Scholes option pricing model. The Black-Scholes option-pricing model requires the use of certain input variables, such as expected volatility, risk-free interest rate and expected award life.
Income Taxes
The Company accounts for income taxes using the asset and liability method, under which deferred tax assets and liabilities are recognized for the future tax consequences attributable to temporary differences between financial statement carrying amounts of existing assets and liabilities and their respective tax bases and operating loss and tax credit carryforwards. Deferred tax assets and liabilities are measured using enacted tax rates expected to apply to taxable income in the years in which those temporary differences are expected to be recovered or settled. The effect on deferred tax assets and liabilities of a change in tax rates is recognized in income in the period that includes the enactment date. The Company regularly reviews historical and anticipated future pre-tax results of operations to determine whether the Company is expected to be able to realize the benefit of its deferred tax assets. A valuation allowance is required to reduce the potential deferred tax asset when it is more-likely-than-not that all or some portion of the potential deferred tax asset will not be realized due to the lack of sufficient taxable income.
The Company establishes reserves for uncertain tax positions that reflect management’s best estimate of deductions and credits that may not be sustained on a more-likely-than-not basis. Recognized income tax positions are measured at the largest amount that is greater than 50% likely of being realized. Changes in recognition or measurement are reflected in the period in which the change in judgment occurs. The Company recognizes interest and penalties related to uncertain tax positions in income tax provision on the consolidated statements of income. Accrued interest and penalties are included in the related tax liability account within accrued expenses on the consolidated balance sheets.
On December 22, 2017, the U.S. government enacted comprehensive tax legislation commonly referred to as the Tax Cuts and Jobs Act (the “Tax Act”). The Tax Act, among other things, reduces the U.S. federal corporate tax rate from 35% to 21% effective January 1, 2018 and imposes significant limitations on certain corporate deductions and credits. The Tax Act places future limitations on the usage of net operating loss carryforwards generated in the year ended December 31, 2018 and after. The Tax Act is comprehensive containing several other provisions, some of which will not materially impact the Company. The estimates of the Tax Act may be adjusted in future periods as required. Future implementation guidance from the Internal Revenue Service, clarifications of state tax law or the completion of the Company’s 2017 tax return filings could all affect the estimated financial statement impact of the Tax Act. The SEC staff issued Staff Accounting Bulletin 118 that allows for a measurement period of up to one year after the enactment date of the Tax Act to finalize the recording of the related tax impacts. The Company does not believe potential adjustments in future periods would materially impact the Company’s financial condition or results of operations. The Company remeasured its deferred tax assets due to the change in federal statutory tax rate which resulted in additional tax expense of $19.0 million.
55
Fair Value Measurements
We have adopted and implemented the provisions of ASC 820-10, Fair Value Measurements, with respect to fair value measurements of: (a) all elected financial assets and liabilities; and (b) any nonfinancial assets and liabilities that are recognized or disclosed in the consolidated financial statements at fair value on a recurring basis (at least annually). Under ASC 820-10, fair value is defined as an exit price, or the amount that would be received to sell an asset or paid to transfer a liability in an orderly transaction between market participants as of the measurement date. These provisions establish a three-tiered fair value hierarchy that prioritizes inputs to valuation techniques used in fair value calculations. The three levels of input are defined as follows:
Level 1 — | unadjusted quoted prices for identical assets or liabilities in active markets accessible by us; |
Level 2 — | inputs that are observable in the marketplace other than those classified as Level 1; and |
Level 3 — | inputs that are unobservable in the marketplace and significant to the valuation. |
Entities are encouraged to maximize the use of observable inputs and minimize the use of unobservable inputs. If a financial instrument uses inputs that fall in different levels of the hierarchy, the instrument will be categorized based upon the lowest level of input that is significant to the fair value calculation.
Our valuation methods may produce a fair value calculation that may not be indicative of net realizable value or reflective of future fair values. Furthermore, while we believe our valuation methods are appropriate and consistent with other market participants, the use of different methodologies or assumptions to determine the fair value of certain financial instruments could result in a different fair value measurement at the reporting date.
Recent Accounting Pronouncements
See Note 2 to our consolidated financial statements included elsewhere in this Annual Report on Form 10-K for recent accounting pronouncements.
Related Party Transactions
See Note 9 to our consolidated financial statements included elsewhere in this Annual Report on Form 10-K for a description of our transactions with related parties.
ITEM 7A. QUANTITATIVE AND QUALITATIVE DISCLOSURES ABOUT MARKET RISK
Our operations are interest rate sensitive. Because overall housing demand is adversely affected by increases in interest rates, a significant increase in mortgage interest rates may negatively affect the ability of homebuyers to secure adequate financing. Higher interest rates could adversely affect our revenues, gross margins and net income.
Our lines of credit have variable interest rates which are subject to minimum interest rates. An increase in interest rates could cause the cost of those lines to increase. As of December 31, 2017, we had $107.0 million outstanding on these lines of credit.
The following table presents our debt obligations, principal cash flows by maturity, weighted average interest rates and estimated fair market value of debt for the year ended December 31, 2017 (amounts in thousands):
Year of Maturity | Fair Value at December 31, 2017 | |||||||||||||||||||
2018 | 2019 | 2020 | Total | |||||||||||||||||
Lines of Credit | ||||||||||||||||||||
Variable debt | $ | — | $ | 32,000 | $ | 75,000 | $ | 107,000 | $ | 107,000 | ||||||||||
Weighted average interest rate | — | % | 4.5 | % | 4.0 | % | — | % | n/a | |||||||||||
Notes payable | ||||||||||||||||||||
Fixed debt | $ | 9,926 | $ | — | $ | — | $ | 9,926 | $ | 9,926 | ||||||||||
Weighted average interest rate | 5.7 | % | — | % | — | % | — | % | n/a | |||||||||||
56
Based upon the amount of lines of credit as of December 31, 2017, and holding the notes payables balance constant, a 1% increase in interest rates would increase the interest incurred by us by approximately $1.1 million per year, which may be capitalized pursuant to our interest capitalization policy.
We do not enter into, or intend to enter into, swaps, forward or option contracts on interest rates or commodities or other types of derivative financial instruments for trading, hedging or speculative purposes.
Many of the statements contained in this section are forward-looking and should be read in conjunction with the disclosures under the heading “Forward-Looking Statements.”
ITEM 8. FINANCIAL STATEMENTS AND SUPPLEMENTARY DATA
We incorporate the information required for this item by reference to the financial statements listed in Item 15(a) of Part IV of this Annual Report on Form 10-K.
ITEM 9. CHANGES IN AND DISAGREEMENTS WITH ACCOUNTANTS ON ACCOUNTING AND FINANCIAL DISCLOSURE
None.
ITEM 9A. CONTROLS AND PROCEDURES
Evaluation of Disclosure Controls and Procedures
The Company has established disclosure controls and procedures that are designed to ensure that information required to be disclosed in reports filed or submitted under the Securities Exchange Act of 1934, as amended (the “Exchange Act”), is recorded, processed, summarized and reported within the time periods specified in the rules and forms of the SEC and, as such, is accumulated and communicated to the Company’s management, including our Chief Executive Officer (“CEO”) and Chief Financial Officer (“CFO”), as appropriate to allow timely decisions regarding required disclosure. Management, together with our CEO and CFO, evaluated the effectiveness of the Company’s disclosure controls and procedures, as defined in Rule 13a-15(e) of the Exchange Act, as of December 31, 2017. Based on our evaluation, the CEO and CFO concluded that our disclosure controls and procedures were effective as of December 31, 2017.
Management’s Report on Internal Control over Financial Reporting
The Company’s management is responsible for establishing and maintaining adequate internal control over financial reporting, as such term is defined in Exchange Act Rule 13a-15(f). Internal control over financial reporting is a process designed to provide reasonable assurance regarding the reliability of financial reporting and the preparation of financial statements for external purposes in accordance with GAAP. Because of its inherent limitations, internal control over financial reporting may not prevent or detect misstatements. Also, projections of any evaluation of effectiveness to future periods are subject to the risk that controls may become inadequate because of changes in conditions, or that the degree of compliance with the policies or procedures may deteriorate.
Under the supervision and with the participation of our management, including the CEO and CFO, we conducted an evaluation of the effectiveness of our internal control over financial reporting as of December 31, 2017 based upon Internal Control-Integrated Framework (2013) issued by the Committee of Sponsoring Organizations of the Treadway Commission. Based on this evaluation, our management concluded that our internal control over financial reporting was effective as of December 31, 2017.
RSM US LLP, the Company’s independent registered public accounting firm, has audited our consolidated financial statements included in this report and has issued an attestation report on the Company’s internal control over financial reporting, which is included herein.
Changes in Internal Control over Financial Reporting
During the quarter ended December 31, 2017, there were no changes in our internal controls that have materially affected or are reasonably likely to have a material effect on our internal control over financial reporting.
57
REPORT OF INDEPENDENT REGISTERED PUBLIC ACCOUNTING FIRM
To the Stockholders and the Board of Directors of Green Brick Partners, Inc.
Opinion on the Internal Control Over Financial Reporting
We have audited Green Brick Partners, Inc. and subsidiaries' (the Company) internal control over financial reporting as of December 31, 2017, based on criteria established in Internal Control - Integrated Framework issued by the Committee of Sponsoring Organizations of the Treadway Commission in 2013. In our opinion, the Company maintained, in all material respects, effective internal control over financial reporting as of December 31, 2017, based on criteria established in Internal Control - Integrated Framework issued by the Committee of Sponsoring Organizations of the Treadway Commission in 2013.
We have also audited, in accordance with the standards of the Public Company Accounting Oversight Board (United States) (PCAOB), the consolidated financial statements of the Company and our report dated March 12, 2018 expressed an unqualified opinion.
Basis for Opinion
The Company’s management is responsible for maintaining effective internal control over financial reporting and for its assessment of the effectiveness of internal control over financial reporting in the accompanying Management’s Report on Internal Control over Financial Reporting. Our responsibility is to express an opinion on the Company’s internal control over financial reporting based on our audit. We are a public accounting firm registered with the PCAOB and are required to be independent with respect to the Company in accordance with U.S. federal securities laws and the applicable rules and regulations of the Securities and Exchange Commission and the PCAOB.
We conducted our audit in accordance with the standards of the PCAOB. Those standards require that we plan and perform the audit to obtain reasonable assurance about whether effective internal control over financial reporting was maintained in all material respects. Our audit included obtaining an understanding of internal control over financial reporting, assessing the risk that a material weakness exists, and testing and evaluating the design and operating effectiveness of internal control based on the assessed risk. Our audit also included performing such other procedures as we considered necessary in the circumstances. We believe that our audit provides a reasonable basis for our opinion.
Definition and Limitations of Internal Control Over Financial Reporting
A company's internal control over financial reporting is a process designed to provide reasonable assurance regarding the reliability of financial reporting and the preparation of financial statements for external purposes in accordance with generally accepted accounting principles. A company's internal control over financial reporting includes those policies and procedures that (1) pertain to the maintenance of records that, in reasonable detail, accurately and fairly reflect the transactions and dispositions of the assets of the company; (2) provide reasonable assurance that transactions are recorded as necessary to permit preparation of financial statements in accordance with generally accepted accounting principles, and that receipts and expenditures of the company are being made only in accordance with authorizations of management and directors of the company; and (3) provide reasonable assurance regarding prevention or timely detection of unauthorized acquisition, use or disposition of the company's assets that could have a material effect on the financial statements.
Because of its inherent limitations, internal control over financial reporting may not prevent or detect misstatements. Also, projections of any evaluation of effectiveness to future periods are subject to the risk that controls may become inadequate because of changes in conditions, or that the degree of compliance with the policies or procedures may deteriorate.
/s/ RSM US LLP
Dallas, Texas
March 12, 2018
58
ITEM 9B. OTHER INFORMATION
On March 5, 2018, the Compensation Committee established qualitative and quantitative measures to be used in determining annual bonuses for Mr. Costello and Ms. Loveland with respect to 2018. The quantitative measure for each such named executive officer (“NEO”) for 2018 is attainment of specified levels of pre-tax income. Unlike for 2017, which only provided for payout at two levels depending on actual performance, the quantitative portion of the bonus, if any, for 2018 will be paid at 25%, 50%, 75% or 100% of the target amount of the quantitative portion of the bonus depending on whether any of the specified levels of pre-tax income are attained. None of the quantitative portion of the bonus will be paid if a threshold level of pre-tax income is not attained.The qualitative portion of the bonus, if any, will be based on the attainment of certain pre-established individual performance goals similar to those established for 2017. These goals were set at challenging levels that are reasonably attainable if the Company and the NEO meet their performance objectives. The structure and performance goals of Messrs. Brickman’s and Dolson’s bonuses with respect to 2018 remain subject to further review by the Compensation Committee.
59
PART III
ITEM 10. DIRECTORS, EXECUTIVE OFFICERS AND CORPORATE GOVERNANCE
Information regarding our executive officers is reported in Part I of this Annual Report on Form 10-K.
The following table sets forth certain information regarding our Board of Directors as of March 12, 2018:
Name | Age | Position |
Elizabeth K. Blake | 66 | Director |
Harry Brandler | 46 | Director |
James R. Brickman | 66 | Chief Executive Officer and Director |
David Einhorn | 49 | Chairman of the Board |
John R. Farris | 45 | Director |
Kathleen Olsen | 46 | Director |
Richard S. Press | 79 | Director |
Elizabeth K. Blake has been one of our directors since September 2007. Before retiring, Ms. Blake served as Senior Vice President - Advocacy, Government Affairs & General Counsel of Habitat for Humanity International Inc. from 2006 to 2014. Ms. Blake served on the Board of Patina Oil & Gas Corporation from 1998 through its sale to Noble Energy in 2005. From March 2003 to 2005, Ms. Blake was the Executive Vice President - Corporate Affairs, General Counsel and Corporate Secretary for US Airways Group, Inc. From April 2002 through December 2002, Ms. Blake served as Senior Vice President and General Counsel of Trizec Properties, Inc., a public real estate investment trust. Ms. Blake served as Vice President and General Counsel of General Electric Power Systems from 1998 to 2002. From 1996 to 1998, Ms. Blake served as Vice President and Chief of Staff of Cinergy Corp. Ms. Blake received a Bachelor of Arts degree with honors from Smith College and her Juris Doctor from Columbia Law School, where she was a Harlan Fiske Stone Scholar. Ms. Blake was awarded an Honorary Doctorate of Technical Letters by Cincinnati Technical College and an Honorary Doctorate of Letters from the College of Mt. St. Joseph. From 1982 to 1984, she was an associate with Frost & Jacobs, a law firm in Cincinnati, Ohio and a partner from 1984 to 1996. From 1977 to 1982, she was with the law firm of Davis Polk & Wardwell in New York. She is past Chair of the Ohio Board of Regents. Ms. Blake provides the Board with extensive executive, managerial and leadership and corporate governance and risk management experience, her experience as a director of public, private and non-profit corporations and her knowledge of the homebuilding industry.
Harry Brandler has been one of our directors since October 2014. Since December 2001, Mr. Brandler has served as the Chief Financial Officer of Greenlight Capital, Inc. Prior to joining Greenlight Capital, Inc., from 2000 to 2001, Mr. Brandler served as Chief Financial Officer of Wheatley Partners, a venture capital firm, where he oversaw the firm’s back office operations and restructured the firm’s marketing, client relations and technology. From 1996 to 2000, Mr. Brandler served as a Manager at Goldstein, Golub & Kessler, where he provided audit, tax and consulting services to investment partnerships and other financial organizations and where he was promoted to Manager in January 1999. Mr. Brandler received a B.S. in Accounting from New York University in 1993. Mr. Brandler was admitted as a Certified Public Accountant in New York in 1996. Mr. Brandler provides substantial knowledge and experience in the areas of finance, accounting and management.
James R. Brickman has been one of our directors since October 2014, was the founding manager and advisor of each of JBGL Capital LP since 2008 and JBGL Builder Finance LLC since 2010, and is our Chief Executive Officer. Prior to forming JBGL in 2008, Mr. Brickman was a manager of various joint ventures and limited partnerships that developed/built low and high-rise office buildings, multifamily and condominium homes, single family homes, entitled land, and supervised a property management company. He previously also served as Chairman and CEO of Princeton Homes Ltd. and Princeton Realty Corporation that developed land, constructed single family custom homes and managed apartments it built. Mr. Brickman has over 38 years’ experience in nearly all phases of real estate construction, development, and real estate finance property management. He received a B.B.A. and M.B.A. from Southern Methodist University. Mr. Brickman provides substantial experience in residential land development, the homebuilding industry and management, as well as intimate knowledge of the Company’s business and operations.
David Einhorn has been one of our directors since May 2006. From 1996, Mr. Einhorn has been the President of Greenlight Capital, Inc., which along with its affiliates is investment advisor to our principal stockholders. Mr. Einhorn serves as Chairman of Greenlight Capital Re, Ltd. (NASDAQ:GLRE). Mr. Einhorn received a Bachelor of Arts degree in Government from Cornell University. Mr. Einhorn provides the Board with crucial investment expertise and business experience.
60
John R. Farris has been one of our directors since October 2014. Since 2007, Mr. Farris has been the founder and President of Commonwealth Economics, LLC. Prior to forming Commonwealth Economics, LLC, from 2006 to 2007, Mr. Farris served as Secretary of the Finance and Administration Cabinet for the Commonwealth of Kentucky. From 2008 to 2012, Mr. Farris served as an adjunct Professor of Economics and Finance at Centre College in Danville, Kentucky. Mr. Farris previously worked at the Center for Economics Research at the Research Triangle Institute, the World Bank and the International Finance Corporation. He currently serves on the board of directors for Kentucky Employers Mutual Insurance and the Kentucky Retirement System and previously served on the board of directors for Farmers Capital Bank Corporation (NASDAQ: FFKT). Mr. Farris received a B.S. from Centre College in 1995 and a M.P.A. from Princeton University in 1999. Mr. Farris brings to the Board a wealth of knowledge and experience in economics and finance and his experience with other boards.
Kathleen Olsen has been one of our directors since October 2014. Since 2011, Ms. Olsen has been a private investor. From 1999 through 2011, Ms. Olsen served as Chief Financial Officer of Eminence Capital, LLC, a long/short global equity fund. From 1993 to 1999, Ms. Olsen served as audit manager, specializing in investment partnerships, at Anchin, Block & Anchin LLP, a public accounting firm located in New York City. Ms. Olsen received a Bachelor of Science degree with honors from the State University of New York at Albany. Ms. Olsen is a Certified Public Accountant and a member of the American Institute of Certified Public Accountants and New York State Society of Certified Public Accountants. Ms. Olsen has extensive knowledge of accounting and a background in finance which enables her to make valuable and important contributions to the Board.
Richard S. Press has been one of our directors since October 2014. Before retiring, Mr. Press was a Senior Vice President at Wellington Management from 1994 to 2006, where he started and built the firm’s insurance asset management practice. Prior to that, Mr. Press was a Senior Vice President of Stein Roe & Farnham from 1982 to 1994 and Scudder Stevens and Clark from 1964 to 1982. Mr. Press has been a board member of Millwall Holdings PLC and Millwall Football Club, London since 2010; and has served as a member of the Board of Overseers of Beth Israel Deaconess Medical Center (Boston) since 2007. Previously he served on various committees of the Controlled Risk Insurance Company and the Risk Management Foundation from 2006 to 2017; served as a board member of the Housing Authority Insurance Group from 2008 to December 2014; and served as a board member and chairman of each of Transatlantic Holdings (NYSE: TRH) from August 2006 to March 2012 and Pomeroy IT Solutions (NASDAQ: PMRY) from July 2007 to November 2009. He was a founding member of the Board of Governors and the Advisory Board of the National Pediatric Multiple Sclerosis Center, Stony Brook University and Medical School, New York (2001 - 2013). Mr. Press currently serves as chairman of the Anesthesia Associates of Massachusetts and has been a member of its board since December 2015 and in 2017 was elected a board member of GMPCI Insurance, Ltd., a wholly-owned subsidiary of AAM. Mr Press earned a B.A. in Economics from Brown University in 1960; and after serving in the US Army, he received his M.B.A. from Harvard Business School in 1964. Mr. Press strengthens the Board with his extensive background in finance and public company board and committee experience.
Code of Business Conduct and Ethics
The Company has adopted a Code of Business Conduct and Ethics that applies to our directors and to all of our employees, including the Chief Executive Officer and the Chief Financial Officer. This Code of Business Conduct and Ethics is posted on our website at www.greenbrickpartners.com. Any waivers of, or amendments to, our Code of Business Conduct and Ethics will be posted on our website and reported as required by the SEC.
Audit Committee
Currently, the Audit Committee is comprised of Ms. Olsen and Messrs. Farris and Press. Ms. Olsen serves as Chair of the Audit Committee. Each member of our Audit Committee has been determined by the Board to be an independent director according to the rules and regulations of the SEC and the NASDAQ Listing Rules, and Ms. Olsen has been determined by the Board to be an “audit committee financial expert” as such term is defined in the rules and regulations of the SEC.
The Audit Committee has responsibility for, among other things:
• | retaining, compensating, overseeing and terminating any registered public accounting firm in connection with the preparation or issuance of an audit report, and approving all audit services and any permissible non-audit services provided by the independent registered public accounting firm; |
• | receiving direct reports from any registered public accounting firm engaged to prepare or issue an audit report; |
• | reviewing and discussing annual audited and quarterly unaudited financial statements with management and the independent registered public accounting firm; |
61
• | reviewing with the independent registered public accounting firm any audit problems and management’s response; |
• | discussing earnings releases, financial information and earnings guidance provided to analysts and rating agencies; |
• | periodically meeting separately with management, internal auditors and the independent registered public accounting firm; |
• | establishing procedures to receive, retain and treat complaints regarding accounting, internal accounting controls or auditing matters and the confidential anonymous submission by employees of concerns regarding questionable accounting or auditing matters; |
• | obtaining and reviewing, at least annually, an independent registered public accounting firm report describing the independent registered public accounting firm internal quality-control procedures and any material issues raised by the most recent internal quality-control review of the independent registered public accounting firm or any inquiry by governmental authorities; |
• | approving and recommending to the Board the hiring of any employees or former employees of the independent registered public accounting firm; |
• | retaining independent counsel and other outside advisors, including experts in the area of accounting, as it determines necessary to carry out its duties; and |
• | reporting regularly to the full Board with respect to any issues raised by the foregoing. |
The Audit Committee met a total of seven (7) times in fiscal year 2017. The Board has adopted a written charter for the Audit Committee, as amended from time to time, which is available in the Governance section of our website at www.greenbrickpartners.com.
Compensation Committee
Currently, the Compensation Committee is comprised of Mr. Press and Mses. Olsen and Blake. Mr. Press serves as Chair of the Compensation Committee.
The Compensation Committee has responsibility for, among other things:
• | reviewing key employee compensation policies, plans and programs; |
• | reviewing and approving the compensation of the Chief Executive Officer and other executive officers of the Company and its subsidiaries; |
• | reviewing and approving any employment contracts or similar arrangements between the Company and any executive officer of the Company; |
• | reviewing and consulting with the Chairman and Chief Executive Officer of the Company concerning performance of individual executives and related matters; and |
• | administering the Company’s stock plans, incentive compensation plans and other similar plans that the Board may from time to time adopt and exercising all the powers, duties and responsibilities of the Board with respect to the plans. |
The Compensation Committee met a total of nine (9) times in fiscal year 2017. The Board has adopted a written charter for the Compensation Committee, as amended from time to time, which is available in the Governance section of our website at www.greenbrickpartners.com.
Governance and Nominating Committee
Currently, the Governance and Nominating Committee is comprised of Mses. Blake and Olsen and Mr. Farris. Ms. Blake serves as Chair of the Governance and Nominating Committee.
62
The Governance and Nominating Committee has responsibility for, among other things:
• | recommending to the Board proposed nominees for election to the Board by the stockholders at annual meetings, including an annual review as to the re-nominations of incumbents and proposed nominees for election by the Board to fill vacancies that occur between stockholder meetings; |
• | reviewing and approving or ratifying related party transactions under the Company’s Related Party Policy; |
• | making recommendations to the Board regarding corporate governance matters and practices; and |
• | assisting the Board and its other committees that oversee specific risk related issues and serving as a resource to management by overseeing the Company’s enterprise risk management function, including risks related to information technology security. |
The Governance and Nominating Committee met a total of four (4) times in fiscal year 2017. The Board has adopted a written charter for the Governance and Nominating Committee, as amended from time to time, which is available in the Governance section of our website at www.greenbrickpartners.com.
Directors are nominated by the Governance and Nominating Committee of the Board, or by the entire Board acting as such. Stockholders can suggest qualified candidates for director by giving written notice to our Secretary at Green Brick Partners, Inc., 2805 Dallas Parkway, Suite 400, Plano, TX 75093. The notice should include the name and qualifications of the candidate and any supporting material the stockholder feels is appropriate. In considering any candidate proposed by a stockholder, the Governance and Nominating Committee will reach a conclusion based on the Board’s established criteria. The Governance and Nominating Committee may seek additional information regarding the candidate. After full consideration, the stockholder proponent will be notified of the decision of the Governance and Nominating Committee.
Although there are no minimum qualifications for nominees, the charter of the Governance and Nominating Committee requires that the Governance and Nominating Committee select nominees to become directors based on an assessment of the fulfillment of necessary independence requirements for the composition of the Board; the highest ethical standards and integrity; a willingness to act on and be accountable for Board decisions; an ability to provide wise, informed and thoughtful counsel to top management on a range of issues; and individual backgrounds that provide a diverse portfolio of experience and knowledge commensurate with the Company’s needs. Although no formal policy exists, the Governance and Nominating Committee seeks to promote through the nomination process an appropriate diversity of experience, expertise, perspective, age, gender and ethnicity, and includes such diversity considerations when appropriate in connection with potential nominees. A stockholder who wishes to nominate a person for the election of directors must ensure that the nomination complies with our Bylaw provisions on making stockholder nominations at an annual meeting.
SECTION 16(a) BENEFICIAL OWNERSHIP REPORTING COMPLIANCE
Section 16(a) of the Exchange Act requires that our directors and executive officers, and persons who own more than 10% of a registered class of our equity securities, file reports of ownership and changes in ownership of our securities with the SEC and the NASDAQ. Based on our records and written representations from reporting persons, we believe that all reports for directors and executive officers that were required to be filed were filed in 2017 on a timely basis.
ITEM 11. EXECUTIVE COMPENSATION
Compensation Discussion and Analysis
Overview
This Compensation Discussion and Analysis describes the policies and objectives underlying the Company’s compensation program for its named executive officers, who are identified in the table below (collectively, the “NEOs”), during 2017. This section also presents a series of tables containing specific information about the compensation awarded to, earned by or paid to the Company’s NEOs.
63
For the year ended December 31, 2017, the Company’s NEOs were:
Named Executive Officers | Title | |
James R. Brickman | Chief Executive Officer | |
Richard A. Costello | Chief Financial Officer | |
Jed Dolson | President of Texas Region | |
Summer Loveland | Chief Accounting Officer | |
Mr. Brickman is an NEO based on his position as the Company’s Chief Executive Officer and Mr. Costello is an NEO based on his position as the Company’s Chief Financial Officer. Mr. Dolson and Ms. Loveland are NEOs by reason of being two of the Company’s most highly compensated executive officers other than its Chief Executive Officer and Chief Financial Officer who were serving as executive officers as of December 31, 2017.
“Say on Pay” Vote
At our 2017 annual meeting of stockholders held on May 24, 2017, our stockholders were asked to consider and vote on a resolution approving the compensation of our NEOs on an advisory basis, commonly referred to as “say on pay.” A substantial majority of our stockholders approved the compensation of our NEOs, with approximately 99.68% of the votes cast in favor of that say on pay resolution. While we are pleased with our strong stockholder support, we will continue to actively evaluate our executive compensation program.
Our stockholders were also asked to vote on how often the Company is to seek advisory approval of the compensation of our named executive officers, as required every six years by the Dodd-Frank Act, Section 14A of the Exchange Act and SEC rules. The Board recommended that these advisory votes be held every three years, instead of every year. The stockholders approved the change with approximately 90.18% of the votes cast in favor of the resolution.
Executive Summary
The Company believes that its success in achieving strategic objectives will depend in large part on its ability to attract and retain exceptional executive talent and to align the interests of all executives with investor success. The Company has established an approach to executive remuneration that it believes will help achieve these objectives.
In determining aggregate compensation levels for the NEOs, the Company uses the following approach:
• | providing cash compensation opportunities to executive officers that, in the aggregate, reflect general industry practice; |
• | rewarding superior overall Company and individual performance using annual bonuses and special bonuses in certain cases, when appropriate; and |
• | allowing individual pay levels to vary considerably with individual executive responsibilities, capabilities and performance. |
In connection with the consummation of the Transaction, each of Messrs. Brickman and Dolson entered into an employment agreement with the Company, as further described below. Each of these NEO’s employment agreements sets forth the primary components of his compensation.
In connection with Mr. Costello’s commencement of employment with the Company, effective January 15, 2015, Mr. Costello entered into an employment agreement with the Company, as further described below.
In connection with his promotion to the newly created position of President of Texas Region and the expiration of his prior employment agreement, Mr. Dolson entered into a new employment agreement with the Company, made as of October 27, 2017, as further described below.
On November 14, 2017, the Company appointed Ms. Loveland as its new Chief Accounting Officer, a position that was created in connection with the Company’s move toward companywide systems standardization of accounting and operational processes. In connection with Ms. Loveland’s commencement of employment with the Company, effective as of November 14, 2017, Ms. Loveland entered into an employment agreement with the Company, as further described below.
64
Executive Compensation Philosophy and Objectives
The intent of the Company’s executive compensation philosophy is to ensure that the total compensation paid to its executive officers, including the Company’s NEOs, is fair, reasonable and competitive.
The philosophy behind the Company’s executive compensation program has been to:
• | Support an environment that rewards performance and value creation for the Company’s investors; and |
• | Integrate its incentive compensation program with the Company’s short-and long-term success. |
Compensation for the Company’s NEOs has been designed to provide rewards commensurate with each of the Company’s NEO’s contributions. The Company’s executive compensation strategy has been designed to:
• | Attract and retain highly qualified executives; |
• | Provide executives with compensation that is competitive within the industry in which it operates; |
• | Establish compensation packages that take into consideration the executive’s role, qualifications, experience, responsibilities, leadership potential, individual goals and performance; and |
• | Align executive compensation to support the Company’s objectives. |
Role of Executive Officers in Compensation Decisions
In connection with the consummation of the Transaction and the integration of JBGL with the Company, the Compensation Committee became responsible for reviewing and approving executive salaries, incentive arrangements, and goals and objectives relevant to the performance of the Company’s NEOs. Furthermore, the Compensation Committee is also responsible for overseeing all other aspects of executive compensation including executive benefits and perquisites, post-employment benefits and employment agreements. In addition, no less than annually, the Compensation Committee appraises the performance of the Company’s NEOs in light of these goals and objectives and sets compensation levels based on this evaluation.
The Company’s Chief Executive Officer provides recommendations to the Compensation Committee regarding the compensation for the Company’s NEOs other than the Chief Executive Officer. However, the Compensation Committee has final approval over all compensation decisions for all NEOs. The Chief Executive Officer is not permitted to attend the portion of any meetings of the Compensation Committee at which the Chief Executive Officer’s performance or compensation is discussed, unless specifically invited by the Compensation Committee.
Use of Consultants
To date, the Company has not retained or otherwise used the services of a compensation consultant. The Compensation Committee may engage a compensation consultant in the future as it deems appropriate and necessary.
Elements of the Company’s Executive Compensation Program
The primary elements of the Company’s executive compensation program for the NEOs for the year ended December 31, 2017 were:
• | base salaries; |
• | annual bonus opportunities; |
• | equity-based compensation; and |
• | limited perquisites and other personal benefits. |
Further specifics with regard to each element of compensation are discussed in the sections below.
Base Salary
During 2017, the Company paid the NEOs a base salary as fixed compensation for their time, efforts and commitments throughout the year. Base salary ranges for these NEOs were determined for each executive based on position and scope of responsibility. Salary levels are typically reviewed annually as part of the Company’s performance review process as well as upon a promotion or other change in job responsibility. The Company considered, among other performance standards, the
65
NEO’s contributions in assisting the Company in meeting its financial targets, improving operational efficiencies, creating and executing a clear strategy, and leading and overseeing significant company driven projects.
Effective as of October 27, 2017, the Compensation Committee approved an increase of Mr. Dolson’s base salary from $400,000 to $550,000 in connection with his promotion to the position of President of Texas Region. Other than the increase to Mr. Dolson’s base salary in connection with his promotion, the Compensation Committee determined that no additional increases to base salary were warranted.
The 2017 base salaries as in effect on the last day of the 2017 fiscal year for each of the Company’s NEOs, as set forth in the NEOs’ employment agreements, is shown in the table below:
Named Executive Officers | 2017 Fiscal Year End Base Salary ($) | ||
James R. Brickman | 1,400,000 | ||
Richard A. Costello | 400,000 | ||
Jed Dolson | 550,000 | ||
Summer Loveland | 300,000 | ||
Annual Bonus Opportunities
The Company’s executives are eligible to receive annual bonuses in order to reward exceptional performance. The annual bonus gives the Company the flexibility to take into consideration the different quantitative and qualitative measures over the fiscal year in determining the eligible executive’s bonus. In determining annual bonus amounts, the Company considers Company and individual performance. The annual bonus is determined in the sole discretion of the Compensation Committee. The Compensation Committee sets the performance goals for the annual bonus for each year at the beginning of the year, pursuant to the Company’s annual bonus plan. Goals are set at challenging levels that are reasonably attainable if the Company and the NEO meet their performance objectives. We have historically paid a portion of annual bonuses in shares of common stock to align the interests of our NEOs with our stockholders.
Each of Messrs. Brickman, Costello, and Dolson is subject to an employment agreement, which sets forth each such NEO’s target bonus as reflected in the following table. As a result of Ms. Loveland commencing employment with us in November 2017, she was not entitled to receive a bonus in respect of 2017.
Named Executive Officers | 2017 Target Bonus (% of Base Salary as in effect on December 31, 2017) | 2017 Target Bonus ($) | ||||
James R. Brickman | 100 | % | 1,400,000 | |||
Richard A. Costello | 100 | % | 400,000 | |||
Jed Dolson | 95.74 | % | 526,575 | |||
Pursuant to the terms of his employment agreement, with respect to the 2017 fiscal year, Mr. Dolson was eligible to receive a bonus contingent upon the achievement of qualitative and quantitative performance goals (based on EBITDA targets of the Company, land development and the number of builders and volume of assets under his supervision) established by the Board and assessed solely at the discretion of the Board with a target amount determined as follows: (i) the target amount that relates to Mr. Dolson’s employment with the Company from January 1, 2017 through October 26, 2017 is equal to $400,000 and (ii) the target amount that relates to Mr. Dolson’s employment with the Company from October 27, 2017 through December 31, 2017 is equal to $1,100,000.
66
Following the end of the 2017 fiscal year, the Compensation Committee reviewed 2017 performance against the established qualitative and quantitative performance goals for 2017 and, based on such performance, on March 5, 2018, approved 2017 bonuses for Messrs. Brickman, Costello and Dolson as reflected in the table below.
Named Executive Officers | 2017 Actual Bonus ($) | ||
James R. Brickman | 1,400,000 | ||
Richard A. Costello | 300,000 | ||
Jed Dolson | 526,575 | ||
In determining to award annual bonuses to Messrs. Brickman, Costello and Dolson for 2017, the Compensation Committee considered the Company’s and such NEOs’ achievements in 2017. For 2017, with respect to the quantitative measure, the Company performance goal was based on attaining a specified level of adjusted pre-tax income. With respect to the qualitative measures, each such NEO was assigned individual performance goals for 2017 based on his position/title.
The 2017 bonuses will be paid to Messrs. Brickman, Costello and Dolson by March 30, 2018 as follows: 50% of each such NEO’s bonus will be paid in cash and the remaining 50% will be paid in shares of common stock.
While Mr. Dolson was eligible to receive a special bonus under the terms of his new employment agreement, which bonus was provided for in connection with his revenue generating role, no such bonus was awarded to him in respect of 2017.
Equity-Based Compensation
Green Brick Partners, Inc. 2014 Omnibus Equity Incentive Plan
In connection with the consummation of the Transaction, the Company adopted the Green Brick Partners, Inc. 2014 Omnibus Equity Incentive Plan (the “2014 Equity Plan”), pursuant to which employees of the Company, including the NEOs, are eligible to receive equity-based compensation awards. A description of the 2014 Equity Plan is included below immediately following the Grants of Plan- Based Awards table.
James R. Brickman Stock Options
In connection with the consummation of the Transaction on October 27, 2014, the Company entered into a stock option agreement with Mr. Brickman, pursuant to which Mr. Brickman received a one-time award of stock options to purchase 500,000 shares of common stock. The stock option has a per share exercise price equal to $7.4861, which is based on the weighted average price of the common stock for the five trading days immediately prior to the date of grant. Subject to Mr. Brickman’s continued employment, the stock option will vest and become exercisable in five substantially equal installments on each of the first five anniversaries of the date of grant. In the event that Mr. Brickman’s employment is terminated by the Company without cause, any unvested portion of the stock option will vest and become exercisable as of the date of such termination. The stock options granted to Mr. Brickman were not granted under the 2014 Equity Plan but are subject to the terms of the 2014 Equity Plan and the stock option agreement.
Jed Dolson One-Time Award
In connection with the consummation of the Transaction, the Company granted Mr. Dolson a one-time award of $1,250,000, payable in a combination of cash and shares of common stock, in exchange for the cancellation of certain unvested Class B membership interests in JBGL Builder Finance LLC previously granted to him by JBGL Builder Finance LLC in 2013 with the intent of being profits interests (“Profits Interests”). This award vested and was paid in four substantially equal installments beginning on the date the Transaction was consummated and each of the next three anniversaries thereof, subject to continued employment on each anniversary date.
Going forward, the Compensation Committee anticipates that any equity-based compensation issued to the Company’s executives, including its NEOs, will be granted pursuant to the 2014 Equity Plan.
Stock Bonus Awards
In 2016, the Compensation Committee conducted a survey of senior executive compensation practices of five (5) public companies in the home construction industry with market capitalizations and total revenue below $1 billion for fiscal years 2015 and 2014. The Compensation Committee compared the total compensation provided to the chief executive officer, chief financial officer and chief operating officer or real estate development head at these peers companies to the total compensation
67
provided to the Company’s NEOs over the same periods. After reviewing the total compensation provided to the top executives at the Company’s competitors, the Compensation Committee determined that a discretionary stock bonus award would be an appropriate means to supplement current executive compensation to maintain total compensation which is competitive within the industry in which the Company operates. On January 2, 2017, the Company granted discretionary stock bonuses under the 2014 Equity Plan to each of Messrs. Brickman, Costello and Dolson, pursuant to which the Company issued 32,085, 8,556, and 17,112 shares of common stock to the respective recipients. The shares were fully vested upon issuance.
Employment Agreements
As discussed above, the Company has entered into employment agreements with each of its NEOs. Each of the employment agreements with the Company’s NEOs is described below immediately following the Grants of Plan-Based Awards table.
Limited Perquisites and Other Personal Benefits
The Company’s NEOs participate in the same benefit programs as the rest of its general employee population. These benefits include health insurance coverage, short-and long-term disability insurance, and life insurance, among others. In addition, the Company’s senior executives, including the NEOs, are eligible for certain perquisites, which do not constitute a significant portion of their total compensation package. In 2017, these additional perquisites included an $850 monthly car and cell phone allowance for Mr. Dolson.
2018 Compensation Actions
Costello Employment Agreement
On January 3, 2018, in connection with the expiration of Mr. Costello’s prior employment agreement, the Company entered into a new employment agreement with him, effective January 15, 2018. The employment agreement extends Mr. Costello’s employment as the Chief Financial Officer for an additional one year, subject to possible further extensions thereafter. The employment agreement establishes Mr. Costello’s annual base salary at $400,000. He is also eligible to receive an annual bonus for the fiscal year ending December 31, 2018, with a target amount equal to 100% of his annual base salary contingent upon achievement of performance goals, such as EBITDA targets, approved by the Compensation Committee. Any annual bonus will be awarded under the 2014 Equity Plan and/or Company annual bonus plan and may be paid partially in cash and partially in equity, as determined by the Compensation Committee in its sole discretion.
In the event that Mr. Costello’s employment is terminated by the Company without Cause (as defined in the employment agreement), other than due to death or Disability (as defined in the employment agreement), or Mr. Costello resigns for Good Reason (as defined in the employment agreement), subject to Mr. Costello’s execution of a release of claims in a form reasonably determined by the Company, the Company will provide Mr. Costello with severance in an amount equal to $400,000, which amount is payable in a lump sum cash payment, and a pro-rated bonus for the year in which termination occurs, which amount is payable in the year immediately following the year in which the termination occurs when the bonus would have otherwise been paid in accordance with the terms of the applicable plan (the “Pro-Rated Bonus”). If Mr. Costello’s employment terminates by reason of the expiration of the term of employment, Mr. Costello will be entitled to receive the Pro-Rated Bonus, subject to the execution of a release of claims in a form reasonably determined by the Company. The Company may require repayment of any bonus and equity-based compensation paid by the Company in a prior Company fiscal year if the Company is required to restate financial results with respect to such fiscal year due to material non-compliance with applicable financial reporting requirements. Mr. Costello is subject to a (i) 12-month post-termination non-competition covenant relating to competitors of the Company, (ii) 12-month post-termination non-solicitation covenant in respect of employees, consultants, vendors, customers and similar business relationships of the Company and (iii) perpetual confidentiality and non-disparagement covenants.
2018 Bonuses
On March 5, 2018, the Compensation Committee established qualitative and quantitative measures to be used in determining annual bonuses for Mr. Costello and Ms. Loveland with respect to 2018. The quantitative measure for each such NEO for 2018 is attainment of specified levels of pre-tax income. Unlike for 2017, which only provided for payout at two levels depending on actual performance, the quantitative portion of the bonus, if any, for 2018 will be paid at 25%, 50%, 75% or 100% of the target amount of the quantitative portion of the bonus depending on whether any of the specified levels of pre-tax income are attained. None of the quantitative portion of the bonus will be paid if a threshold level of pre-tax income is not attained. The qualitative portion of the bonus, if any, will be based on the attainment of certain pre-established individual performance goals similar to those established for 2017. These goals were set at challenging levels that are reasonably
68
attainable if the Company and the NEO meet their performance objectives. The structure and performance goals of Messrs. Brickman’s and Dolson’s bonuses with respect to 2018 remain subject to further review by the Compensation Committee.
Tax and Accounting Considerations
In designing the Company’s compensation program, the Compensation Committee considers all factors that may have an impact on our financial performance, including tax and accounting rules and regulations, including under Section 162(m) of the Code. Section 162(m) of the Code limits the deduction for a publicly held corporation for otherwise deductible compensation paid to any “covered employee” to $1,000,000 per year. This limit does not apply to “qualified performance-based compensation” within the meaning of Section 162(m) of the Code. Pursuant to the Tax Act, as of January 1, 2018, the qualified performance-based compensation was eliminated and the definition of “covered employee” was expanded to include the chief financial officer of a company subject to Section 162(m) of the Code. The Tax Act includes a transition rule under which the changes to Section 162(m) of the Code will not apply to compensation payable pursuant to a written binding contract that was in effect on November 2, 2017, and is not materially modified after that date. The Company intends to rely on this transition rule, to the extent permitted. Because of ambiguities and uncertainties as to the application and interpretation of Section 162(m) of the Code and the regulations issued thereunder, including the uncertain scope of the transition rule under the Tax Act, no assurance can be given that compensation intended to satisfy the requirements for exemption from Section 162(m) of the Code in fact will. In addition, given the loss of the qualified performance-based compensation exception, non-grandfathered compensation may result in non-deductible compensation amounts. There may have been (and may in the future be) cases where the Compensation Committee elected (or elects) to award compensation that was not (or will not be) deductible, if the Compensation Committee considered such compensation to be consistent with its philosophy and in the best interests of the Company and its stockholders. We are accounting for stock-based payments in accordance with the requirements of ASC 718.
COMPENSATION COMMITTEE REPORT
The Compensation Committee has reviewed and discussed with management the Compensation Discussion and Analysis section above, and based on such review and discussion, has recommended to the Board that the Compensation Discussion and Analysis be included in this Annual Report.
Respectfully Submitted, | |
Richard S. Press (Chair) | |
Kathleen Olsen | |
Elizabeth K. Blake | |
69
Summary Compensation Table
The following table summarizes the total compensation awarded to, earned by, or paid to each of the Company’s NEOs during the fiscal years ended December 31, 2017, December 31, 2016 and December 31, 2015, to the extent applicable.
Name and Principal Position | Year | Salary ($)(1) | Bonus ($) | Stock Awards ($)(2) | Option Awards ($) | Non-Equity Incentive Plan Compensation ($) | All Other Compensation ($)(3) | Total ($) | |||||||||||||||
James R. Brickman, | |||||||||||||||||||||||
Chief Executive Officer | 2017 | 1,400,000 | — | 1,079,204 | — | 700,000 | 10,621 | 3,189,825 | |||||||||||||||
2016 | 1,400,000 | — | 343,542 | — | 700,000 | 10,359 | 2,453,901 | ||||||||||||||||
2015 | 1,400,000 | — | — | — | 350,000 | 8,140 | 1,758,140 | ||||||||||||||||
Richard A. Costello, | |||||||||||||||||||||||
Chief Financial Officer | 2017 | 400,000 | — | 302,198 | — | 150,000 | 15,339 | 867,537 | |||||||||||||||
2016 | 400,000 | — | 73,613 | — | 200,000 | 6,666 | 680,279 | ||||||||||||||||
2015 | 288,846 | — | — | — | 75,000 | 6,315 | 370,161 | ||||||||||||||||
Jed Dolson, | |||||||||||||||||||||||
President of Texas Region | 2017 | 426,731 | — | 545,146 | — | 263,288 | 190,048 | 1,425,213 | |||||||||||||||
2016 | 400,000 | — | 229,861 | — | 200,000 | 181,075 | 1,010,936 | ||||||||||||||||
2015 | 300,000 | — | 156,250 | — | 75,000 | 174,353 | 705,603 | ||||||||||||||||
Summer Loveland, | |||||||||||||||||||||||
Chief Accounting Officer | 2017 | 39,808 | — | — | — | — | 1,069 | 40,877 | |||||||||||||||
(1) | Mr. Costello’s base salary in fiscal year 2015 was pro-rated based on the number of days he was employed by the Company in fiscal year 2015, which commenced on January 15, 2015. Mr. Dolson’s base salary was increased in October 2017 from $400,000 to $550,000. Ms. Loveland’s annual base salary in fiscal year 2017 was pro-rated based on the number of days she was employed by the Company in fiscal year 2017, which commenced on November 14, 2017. |
(2) | The amounts in this column represent the aggregate grant date fair value of the common stock issued to Messrs. Brickman, Costello and Dolson in accordance with ASC 718. Messrs. Brickman, Costello and Dolson were awarded discretionary stock bonuses on January 2, 2017, as described above, and the remaining 50% of their annual bonuses for each year were paid in shares of common stock in the immediately following year and are reported in this table in the year in which they were granted. Mr. Dolson received additional shares of common stock in satisfaction of 50% of the payment due to him in 2017, 2016 and 2015 in respect of the cancellation of his Profits Interests, as described in footnote 5 below. |
(3) | The table below includes items of All Other Compensation paid to the NEOs in 2017. |
70
All Other Compensation
Name | Medical, Dental and Vision Insurance Premiums ($) | HSA Employer Contribution ($) | 401(k) Employer Match ($) | Life Insurance Premiums, AD&D and Disability Premiums ($) | Car and Cell Phone Allowance ($) | Profits Interests Cancellation Award ($)(4) | Total ($) | ||||||||||||||
James R. Brickman | 7,345 | 2,000 | — | 1,276 | — | — | 10,621 | ||||||||||||||
Richard A. Costello | 4,929 | 958 | 8,100 | 1,352 | — | — | 15,339 | ||||||||||||||
Jed Dolson | 11,975 | 2,000 | 8,100 | 1,523 | 10,200 | 156,250 | 190,048 | ||||||||||||||
Summer Loveland | 803 | 167 | — | 99 | — | — | 1,069 | ||||||||||||||
(4) | Mr. Dolson received a one-time award of $1,250,000 in respect of the cancellation of his Profits Interests, which was payable in four equal installments on October 27, 2014 and each of the next three anniversaries thereof. In 2017, 50% of the amount due to Mr. Dolson was paid in the form of cash and the remaining 50% was paid in shares of common stock. |
2017 Grants of Plan-Based Awards
The following table sets forth certain information for plan-based awards granted to each of the Company’s NEOs (other than Ms. Loveland) for the fiscal year ended December 31, 2017. As discussed above, as a result of Ms. Loveland commencing employment with us in November 2017, she was not entitled to receive a bonus in respect of 2017.
Estimated Possible Payouts Under Non-Equity Incentive Plan Awards(1) | All Other Stock Awards: | Grant Date Fair Value of | ||||||||||||
Named Executive Officers | Grant Date | Approval Date | Threshold ($) | Target ($) | Number of Shares (#)(2) | Stock and Option Awards ($)(3) | ||||||||
James R. Brickman | 350,000 | 700,000 | ||||||||||||
1/2/2017 | 12/6/2016 | 32,085 | 322,454 | |||||||||||
3/28/2017 | 3/6/2017 | 75,675 | 756,750 | |||||||||||
Richard A. Costello | 100,000 | 200,000 | ||||||||||||
1/2/2017 | 12/6/2016 | 8,556 | 85,988 | |||||||||||
3/28/2017 | 3/6/2017 | 21,621 | 216,210 | |||||||||||
Jed Dolson | 131,644 | 263,288 | ||||||||||||
1/2/2017 | 12/6/2016 | 17,112 | 171,976 | |||||||||||
3/28/2017 | 3/6/2017 | 21,621 | 216,210 | |||||||||||
11/8/2017 | 10/2/2017 | 14,400 | 156,960 | |||||||||||
(1) | 50% of annual bonuses in respect of 2017 will be paid in cash under the Company’s annual bonus plan and 50% of annual bonuses in respect of 2017 will be paid in stock under the Company’s 2014 Equity Plan. The amounts shown represent the portion payable in cash. Any portion paid in stock will be reported in the “Stock Awards” column and in the Grants of Plan-Based Awards table, in each case, in the year of grant. The threshold amount represents 50% of the quantitative bonus, which represents 25% of the annual bonus opportunity that would be paid in cash if the threshold level of adjusted pre-tax income is attained by the Company. The target amount represents 50% of the target bonus opportunity that would be paid in cash if the adjusted pre-tax income and individual qualitative performance goals are attained or exceeded. |
(2) | On January 2, 2017, Messrs. Brickman, Costello and Dolson, were granted 32,085, 8,556, and 17,112 shares of fully vested common stock, respectively, to supplement current executive compensation and to maintain total compensation which is competitive within the industry in which the Company operates. On March 28, 2017, Messrs. Brickman, Costello and Dolson were granted 75,675, 21,621 and 21,261 shares of common stock, respectively, under the 2014 Equity Plan in satisfaction of 50% of the 2016 annual bonuses. On November 8, 2017, Mr. Dolson was also granted 14,400 shares of fully vested common stock in satisfaction of 50% of the amount due to him in 2017 in respect of the cancellation of his Profits Interests. |
(3) | Reflects the grant date fair value of the shares of the common stock awarded to Messrs. Brickman, Costello and Dolson, as calculated in accordance with ASC 718. |
71
Narrative Accompanying Summary Compensation Table and Grants of Plan-Based Awards Table
Employment Agreements
The Company has entered into an employment agreement with each of its NEOs, as described below.
James R. Brickman
In connection with the consummation of the Transaction on October 27, 2014, Mr. Brickman entered into an employment agreement with the Company (the “Brickman Employment Agreement”), pursuant to which Mr. Brickman serves as the Chief Executive Officer of the Company and as a member of the Board. The initial term of the Brickman Employment Agreement is five years. Mr. Brickman’s annual base salary is $1.4 million. He is eligible to receive an annual bonus with a target award equal to 100% of his base salary contingent upon the achievement of performance goals, such as EBITDA targets, approved by the Board. The bonus may be payable partially in cash and partially in equity, as determined by the Board. In addition, Mr. Brickman received a one-time award of 500,000 stock options, which award vests in five substantially equal installments on each of the first five anniversaries of the date of grant. The specific terms and conditions relating to Mr. Brickman’s stock options are set forth in an award agreement between the Company and Mr. Brickman, as discussed below.
Richard A. Costello
Mr. Costello entered into an employment agreement with the Company (the “Costello Employment Agreement”), effective January 15, 2015, pursuant to which Mr. Costello serves as the Chief Financial Officer of the Company. The initial term of the Costello Employment Agreement was three years. Mr. Costello’s annual base salary is $400,000. He is eligible to receive an annual bonus with a target award equal to 100% of his base salary contingent upon the achievement of performance goals, such as EBITDA targets, approved by the Board. The bonus may be payable partially in cash and partially in equity, as determined by the Board.
Jed Dolson
In connection with Mr. Dolson’s promotion and the expiration of his prior employment agreement, the Company entered into a new employment agreement (the “Dolson Employment Agreement”) with Mr. Dolson, effective as of October 27, 2017. The term of the Dolson Employment Agreement is three years, subject to further extensions thereafter, and the terms of the Dolson Employment Agreement are largely consistent with the expired agreement. The Dolson Employment Agreement increases Mr. Dolson’s annual base salary to $550,000. He is also eligible to receive an annual bonus for the fiscal year ending December 31, 2017 and each subsequent year covered by the Employment Agreement. Starting with the fiscal year ending December 31, 2018, the annual bonus will be awarded under the 2014 Equity Plan, with a target award equal to 200% of his base salary and will be based upon and subject to the achievement of annual performance goals established under the 2014 Equity Plan within the first 90 days of each fiscal year during the employment period. The bonus may be payable partially in cash and partially in equity, as determined by the Board. Under the Dolson Employment Agreement, Mr. Dolson may also become eligible for a special bonus in connection with his performance, payable partially in cash and partially in equity, or a combination thereof, as determined by the Board. The special bonus may be subject to a vesting and/or payment schedule, as determined by the Board. Mr. Dolson also continues to be eligible to receive a car, cell phone and toll road allowance.
Summer Loveland
In connection with Ms. Loveland’s appointment, the Company entered into an employment agreement (the “Loveland Employment Agreement”) with Ms. Loveland, effective as of November 14, 2017. The initial term of the Loveland Employment Agreement is three years, subject to further extensions thereafter. The Loveland Employment Agreement sets Ms. Loveland’s annual base salary at $300,000. She is also eligible to receive an annual bonus for the fiscal year ending December 31, 2018 and each subsequent year covered by the Loveland Employment Agreement. Starting with the fiscal year ending December 31, 2018, the annual bonus will be awarded under the Company’s annual bonus plan, and will have a target award equal to $100,000 contingent upon the achievement of performance goals, including, but not limited to, Company profitability and satisfaction of individual performance goals, established by the Board.
72
James R. Brickman Stock Options
In connection with the consummation of the Transaction on October 27, 2014, the Company entered into a stock option agreement with Mr. Brickman, pursuant to which Mr. Brickman received a one-time award of stock options to purchase 500,000 shares of common stock. The stock option award has a per share exercise price equal to $7.4861, which is based on the weighted average price of the Company’s common stock for the five trading days immediately prior to the date of grant. Subject to Mr. Brickman’s continued employment, the stock option award will vest and become exercisable in five substantially equal installments on each of the first five anniversaries of the date of grant. However, in the event that Mr. Brickman’s employment is terminated by the Company without Cause (as defined in the 2014 Equity Plan), any unvested portion of the stock option award will vest and become exercisable as of the date of such termination. The stock options granted to Mr. Brickman were not granted under the 2014 Equity Plan but are subject to the terms of the 2014 Equity Plan and the stock option agreement.
2017 Discretionary Stock Bonus Awards
After reviewing the total compensation provided to the top executives at the Company’s competitors, as discussed above, in January 2017, the Compensation Committee determined that a discretionary stock bonus award would be an appropriate means to supplement current executive compensation to maintain total compensation which is competitive within the industry in which the Company operates.
On January 2, 2017, the Company granted discretionary stock bonus awards under the 2014 Equity Plan to each of Messrs. Brickman, Costello and Dolson, pursuant to which the Company issued 32,085, 8,556, and 17,112 shares of common stock to the respective recipients. The shares were fully vested upon issuance.
Green Brick Partners, Inc. 2014 Omnibus Equity Incentive Plan
In connection with the consummation of the Transaction, the Company adopted the 2014 Equity Plan, as described below.
Purpose. The purpose of the 2014 Equity Plan is to provide a means for the Company and its affiliates to attract and retain key personnel and to provide a means whereby current and prospective directors, officers, employees, consultants and advisors can acquire and maintain an equity interest in the Company, or be paid incentive compensation, which may (but need not) be measured by reference to the value of the Company’s common stock, thereby strengthening their commitment to the welfare of the Company and aligning their interests with those of the Company’s stockholders. The 2014 Equity Plan will terminate automatically on October 17, 2024. No awards will be granted under the 2014 Equity Plan after that date, but awards granted prior to that date may extend beyond that date.
Awards. Under the 2014 Equity Plan, awards of stock options, including both incentive stock options and nonqualified stock options, stock appreciation rights, restricted stock and restricted stock units, other stock-based awards and performance compensation awards may be granted. The maximum number of shares of the Company’s common stock that is authorized and reserved for issuance under the 2014 Equity Plan is 2,350,956, subject to adjustment for certain corporate events or changes in the Company’s capital structure.
Eligibility. In general, the Company’s employees, consultants and directors and those of the Company’s affiliates, as well as those reasonably expected to become the Company’s employees, consultants and directors, or those of the Company’s affiliates, are eligible for awards under the 2014 Equity Plan, provided that incentive stock options may be granted only to employees. A written agreement between the Company and each participant will evidence the terms of each award granted under the 2014 Equity Plan.
Shares Subject to the 2014 Equity Plan. The shares that may be issued pursuant to awards are shares of common stock and the maximum aggregate amount of common stock which may be issued upon exercise of all awards under the 2014 Equity Plan, including incentive stock options, may not exceed 2,350,956, subject to adjustment to reflect certain corporate transactions or changes in the Company’s capital structure. If any award under the 2014 Equity Plan expires or otherwise terminates, in whole or in part, without having been exercised in full, the common stock withheld from issuance under that award will become available for future issuance under the plan. If shares issued under the 2014 Equity Plan are reacquired by the Company pursuant to the terms of any forfeiture provision, those shares will become available for future awards under the plan. Awards that can only be settled in cash will not be treated as shares of common stock granted for purposes of the 2014 Equity Plan. The maximum amount that can be paid to any single participant in any one calendar year pursuant to a cash bonus award under the 2014 Equity Plan is $2,000,000.
73
Administration. The Compensation Committee administers the 2014 Equity Plan. Among other responsibilities, the Compensation Committee will select participants from among the eligible individuals, determine the number of shares of common stock that will be subject to each award and determine the terms and conditions of each award, including exercise price, methods of payment and vesting schedules. In general, the Board may amend, alter, suspend, discontinue, or terminate the 2014 Equity Plan or any portion thereof at any time.
Adjustments in Capitalization. In general, in the event of (i) any dividend or other distribution (whether in the form of cash, stock or other securities or property), stock splits, reverse stock splits, recapitalizations, reorganizations, mergers, consolidations, combinations, exchanges or other similar corporate transaction or event (including, without limitation, a “change in control” (as defined in the 2014 Equity Plan)) that affects the common stock or (ii) certain unusual or nonrecurring events (including, without limitation, a change in control), appropriate equitable adjustments or substitutions (as determined by the Compensation Committee) will be made to the various limits under, and the terms of, the 2014 Equity Plan and the awards granted thereunder, including the maximum number of shares of common stock reserved under the 2014 Equity Plan, the price or kind of other securities or other consideration subject to awards or any applicable performance measures (e.g., performance criteria), to the extent necessary to preserve the economic intent of the award. In addition, the Compensation Committee may cancel outstanding awards and cause participants to receive, in cash, stock, other securities or property, or a combination thereof, the value of the awards.
Change in Control. In the event of a change in control, the Compensation Committee may generally provide for one or more of the following: (i) that all options and stock appreciation rights subject to an award will become fully vested and immediately exercisable, (ii) that any restricted period imposed upon restricted awards will expire immediately and (iii) that participants will receive partial or full payment for outstanding performance awards.
Nontransferability. In general, each award granted under the 2014 Equity Plan may be exercisable only by a participant during the participant’s lifetime or, if permissible under applicable law, by the participant’s legal guardian or representative. Except in very limited circumstances, no award may be assigned, alienated, pledged, attached, sold or otherwise transferred or encumbered by a participant other than by will or by the laws of descent and distribution, and any such purported assignment, alienation, pledge, attachment, sale, transfer or encumbrance will be void and unenforceable against us. However, the designation of a beneficiary will not constitute an assignment, alienation, pledge, attachment, sale, transfer or encumbrance.
No Rights as a Stockholder. In general, except as otherwise provided in the 2014 Equity Plan or any award agreement thereunder, no person who receives an award under the plan will be entitled to the privileges of a stockholder until the shares covered by such award have been issued or delivered to that person.
Outstanding Equity Awards at Fiscal Year End
The following table sets forth the outstanding equity awards for the Company’s NEOs as of December 31, 2017.
Option Awards | ||||||||||||
Named Executive Officer | Number of Shares Underlying Unexercised Options Exercisable (#)(1) | Number of Shares Underlying Unexercised Options Unexercisable (#)(1) | Option Exercise Price ($/Sh) | Option Expiration Date | ||||||||
James R. Brickman | 300,000 | 200,000 | $7.49 | 10/27/2024 | ||||||||
Richard A. Costello | — | — | — | — | ||||||||
Jed Dolson | — | — | — | — | ||||||||
Summer Loveland | — | — | — | — | ||||||||
(1) | On October 27, 2014, Mr. Brickman was granted stock options to purchase 500,000 shares of the Company’s common stock, which vest and become exercisable in five substantially equal installments on each of the first five anniversaries of the date of grant. |
74
Option Exercises and Stock Vested
The following table sets forth the outstanding equity awards for the Company’s NEOs as of December 31, 2017.
Option Exercises and Stock Vested | ||||||||||||
Option Awards | Stock Awards | |||||||||||
Named Executive Officers | Number of Shares Acquired on Exercise (#) | Value Realized on Exercise ($) | Number of Shares Acquired on Vesting (#)(1) | Value Realized on Vesting ($)(2) | ||||||||
James R. Brickman | — | — | 107,760 | 1,079,204 | ||||||||
Richard A. Costello | — | — | 30,177 | 302,198 | ||||||||
Jed Dolson | — | — | 53,133 | 545,146 | ||||||||
Summer Loveland | — | — | — | — | ||||||||
(1) | On January 2, 2017, Messrs. Brickman, Costello and Dolson were granted 32,085, 8,556, and 17,112 shares of common stock, respectively, to supplement current executive compensation and to maintain total compensation which is competitive within the industry in which the Company operates. On March 28, 2017, Messrs. Brickman, Costello and Dolson were granted 75,675, 21,621, and 21,261 shares of common stock, respectively, in satisfaction of 50% of the 2016 annual bonuses. On November 8, 2017, Mr. Dolson was also granted 14,400 shares of common stock in satisfaction of 50% of the amount due to him in 2017 in respect of the cancellation of his Profits Interests. |
(2) | Reflects the grant date fair value of the shares of the Company’s common stock awarded to Messrs. Brickman, Costello and Dolson, as calculated in accordance with ASC 718. |
Pension Benefits and Nonqualified Deferred Compensation
The Company does not provide defined benefit pension benefits or non-qualified deferred compensation.
Potential Payments Upon Termination of Employment or Change in Control
The Company’s NEOs are eligible for severance as set forth in their respective employment agreements and Mr. Brickman is entitled to accelerated vesting of his stock options under certain circumstances, in each case, as described in the following narrative and illustrated in the accompanying table below.
Brickman Employment Agreement
In the event that Mr. Brickman’s employment is terminated by the Company without Cause (as defined in the Brickman Employment Agreement) or Mr. Brickman resigns for Good Reason (as defined in the Brickman Employment Agreement), subject to Mr. Brickman’s execution of a release of claims in a form reasonably determined by the Company, the Company will provide Mr. Brickman with severance in an amount equal to two times (x) his base salary plus (y) his target bonus. Mr. Brickman will not be entitled to severance upon the expiration of the term of employment. The Company may require repayment of any bonus and equity-based compensation paid by the Company in a prior Company fiscal year if the Company is required to restate financial results with respect to such fiscal year due to material non-compliance with applicable financial reporting requirements. Mr. Brickman is subject to a (i) 12-month post-termination non-competition covenant relating to competitors of the Company, (ii) 12-month post-termination non-solicitation covenant in respect of employees, consultants, vendors, customers and similar business relationships of the Company and (iii) perpetual confidentiality and non-disparagement covenants.
Costello Employment Agreement
In the event that Mr. Costello’s employment is terminated by the Company without Cause (as defined in the Costello Employment Agreement) or Mr. Costello resigns for Good Reason (as defined in the Costello Employment Agreement), subject to Mr. Costello’s execution of a release of claims in a form reasonably determined by the Company, the Company will provide Mr. Costello with severance in an amount equal to one and one half times the sum of (x) his base salary and (y) his
annual bonus for the year preceding the year of termination. Mr. Costello will not be entitled to severance upon the expiration of the term of employment. The Company may require repayment of any bonus and equity-based compensation paid by the Company in a prior Company fiscal year if the Company is required to restate financial results with respect to such fiscal year due to material non-compliance with applicable financial reporting requirements. Mr. Costello is subject to a (i) 12-month post-termination non-competition covenant relating to competitors of the Company, (ii) 12-month post-termination non-solicitation covenant in respect of employees, consultants, vendors, customers and similar business relationships of the Company and (iii) perpetual confidentiality and non-disparagement covenants.
75
Dolson Employment Agreement
In the event that Mr. Dolson’s employment is terminated by the Company without Cause (as defined in the Dolson Employment Agreement) or Mr. Dolson resigns for Good Reason (as defined in the Dolson Employment Agreement), subject to Mr. Dolson’s execution of a release of claims in a form reasonably determined by the Company, the Company will provide Mr. Dolson with severance in an amount equal to one and one half times the sum of (x) his base salary and (y) his annual bonus for the year preceding the year of termination. Mr. Dolson will not be entitled to severance upon the expiration of the term of employment. The Company may require repayment of any bonus and equity-based compensation paid by the Company in a prior Company fiscal year if the Company is required to restate financial results with respect to such fiscal year due to material non-compliance with applicable financial reporting requirements. Mr. Dolson is subject to a (i) 12-month post-termination non-competition covenant relating to competitors of the Company, (ii) 12-month post-termination non-solicitation covenant in respect of employees, consultants, vendors, customers and similar business relationships of the Company and (iii) perpetual confidentiality and non-disparagement covenants.
Loveland Employment Agreement
In the event that Ms. Loveland’s employment is terminated by the Company without Cause (as defined in the Loveland Employment Agreement) or Ms. Loveland resigns for Good Reason (as defined in the Employment Agreement), subject to Ms. Loveland’s execution of a release of claims in a form reasonably determined by the Company, the Company will provide Ms. Loveland with severance in an amount equal to $300,000. The Company may require repayment of any profit-sharing compensation paid by the Company in a prior Company fiscal year if the Company is required to restate financial results with respect to such fiscal year due to material non-compliance with applicable financial reporting requirements. Ms. Loveland is subject to a (i) 12-month post-termination non-solicitation covenant in respect of employees, consultants, vendors, customers and similar business relationships of the Company and (ii) perpetual confidentiality and non-disparagement covenants.
James R. Brickman Stock Options
In the event that Mr. Brickman’s employment is terminated by the Company without Cause (as defined in the 2014 Equity Plan), any unvested portion of the stock option will vest and become exercisable as of the date of such termination.
Assuming a termination of employment occurred as of December 31, 2017, each of Messrs. Brickman, Costello and Dolson and Ms. Loveland would be entitled to receive the payment and benefits set forth in the following table.
James R. Brickman | Richard A. Costello | Jed Dolson | Summer Loveland | |||||
Termination by the Company without Cause/Resignation by Executive for Good Reason | • A cash severance payment equal to $5,600,000, calculated as two times (2x) the sum (i) base salary ($1,400,000) plus (ii) target bonus ($1,400,000). • Full acceleration of outstanding unvested stock options on a termination without Cause only.(1) | • A cash severance payment equal to $1,200,000, calculated as one and one-half times (1.5x) the sum (i) base salary ($400,000) plus (ii) bonus for prior year ($400,000). | • A cash severance payment equal to $1,425,000, calculated as one and one-half times (1.5x) the sum (i) base salary ($550,000) plus (ii) bonus for prior year ($400,000)). | • A cash severance payment equal to $300,000 | ||||
Termination by the Company for Cause/Resignation by Executive without Good Reason | Accrued Obligations only. | Accrued Obligations only. | Accrued Obligations only. | Accrued Obligations only. | ||||
Death/Disability | Accrued Obligations only. | Accrued Obligations only. | Accrued Obligations only. | Accrued Obligations only. | ||||
Expiration of Term | Accrued Obligations only. | Accrued Obligations only. | Accrued Obligations only. | Accrued Obligations only. | ||||
(1) | Based on the closing price per share of the Company’s common stock as of December 29, 2017, the last business day of the year, equal to $11.30, the acceleration of Mr. Brickman’s unvested stock options would be worth $762,000. |
76
2017 Pay Ratio
As required by Section 953(b) of the Dodd-Frank Wall Street Reform and Consumer Protection Act, and Item 402(u) of Regulation S-K, we are providing the following information about the relationship of the annual total compensation of our employees and the annual total compensation of Mr. Brickman, our Chief Executive Officer (our “CEO”):
For 2017, our last completed fiscal year:
• | the median of the annual total compensation of all our employees (other than our CEO) was $103,042; and |
• | the annual total compensation of our CEO was $3,189,825. |
Based on this information, for 2017, the ratio of the annual total compensation of Mr. Brickman, our CEO, to the median of the annual total compensation of all employees was 31 to 1.
We selected December 31, 2017 (the “determination date”), which is within the last three months of 2017, as the date upon which we would identify the “median employee.”
We identified the median employee by examining the total earnings, as reported on the Form W-2 for 2017, of each individual other than the CEO who was employed by us on the determination date. We included all employees, whether employed on a full-time, part-time, or seasonal basis. We did not make any assumptions, adjustments, or estimates with respect to total Form W-2 earnings, and we did not annualize the compensation for any full-time employees that were not employed by us for all of 2017. We believe the use of total Form W-2 earnings for all employees is a consistently applied compensation measure because we do not widely distribute annual equity awards to employees.
Once we identified our median employee, we combined all of the elements of such employee’s compensation for 2017 in accordance with the requirements of Item 402(c)(2)(x) of Regulation S-K, resulting in annual total compensation of $103,042. These elements included the median employee’s base salary or wages, the annual bonus earned by the median employee with respect to the 2017 fiscal year, Company paid medical, dental and vision insurance, the Company’s health savings account contribution and the Company’s 401(k) matching contributions.
Compensation Committee Interlocks and Insider Participation
None of our executive officers serve as a member of our Compensation Committee. None of our executive officers serves on the board of directors or compensation committee of a company that has an executive officer that serves on our Board or the Compensation Committee.
Director Compensation Information
For 2017, members of the Company’s Board received compensation in the forms of annual cash retainers and meetings fees as set forth in the following table:
Fees Earned or Paid in Cash ($) | Stock Awards ($)(1) | Total ($) | ||||
David Einhorn | 50,000 | — | 50,000 | |||
James R. Brickman(2) | — | — | — | |||
Elizabeth K. Blake | 30,136 | 147,836 | 177,972 | |||
Harry Brandler | 50,000 | — | 50,000 | |||
John R. Farris | 68,818 | 103,484 | 172,302 | |||
Kathleen Olsen | 81,310 | 68,983 | 150,293 | |||
Richard S. Press | 90,726 | 68,983 | 159,709 | |||
(1) | On May 24, 2017, the Company awarded restricted shares of the Company’s common stock to certain directors pursuant to the 2014 Equity Plan. The restricted stock awards become fully vested on the earlier to occur of (i) the first anniversary of the grant date, or (ii) the date of the Company’s 2018 annual meeting of stockholders. The grant date fair value of the restricted stock awards is included in the table in accordance with ASC 718. |
(2) | As an employee of the Company, Mr. Brickman does not receive any additional compensation for his service as a director. |
77
In connection with the completion of the Transaction, the Company instituted a new compensation program for its directors, pursuant to which directors who are also full-time officers or employees of the Company receive no additional compensation for serving as directors. For 2016, all non-employee directors received an annual retainer payable in cash equal to $50,000. In addition, other than Mr. Einhorn and Mr. Brandler, each non-employee director received restricted stock with an aggregate grant date value equal to $50,000, which vested on the first anniversary of the grant date, subject to the director’s continued service, or, if earlier, upon such director’s death. In addition, the Chairman of the Audit Committee received an additional annual retainer equal to $10,000, which was payable in cash. Mr. Brickman does not receive any additional compensation for his service as a director. In 2015, the Company’s director compensation program was modified to permit the directors to elect to receive all or a portion of their cash retainer fees in shares of restricted stock in lieu of cash. To the extent a director elects to receive restricted stock in lieu of cash, such restricted stock will vest on the earlier of the first anniversary of the grant date or the date of the Company’s next annual meeting of stockholders following the grant date, provided that the director is then serving on the Board.
In October 2016, the Board increased the annual retainer for independent directors to $140,000 and increased the annual retainers for the chairs of the Audit Committee, Compensation Committee and the Governance and Nominating Committee to $20,000, $10,000 and $10,000, respectively. The increases became effective as of October 18, 2016, with additional retainer fees for the period from October 18, 2016 through the date of a director’s reelection at the 2017 annual meeting of stockholders to be paid in cash. For periods commencing on or after the 2017 annual meeting of stockholders, the general retainer was allocated 50% to cash and 50% to shares of restricted stock (with each independent director having the option to elect all or a portion of such cash compensation to be in the form of shares of restricted stock) and the committee chair retainers were payable in cash (with each independent director having the option to elect all or a portion of such cash compensation to be in the form of shares of restricted stock).
ITEM 12. SECURITY OWNERSHIP OF CERTAIN BENEFICIAL OWNERS AND MANAGEMENT AND RELATED STOCKHOLDER MATTERS
The following tables set forth information with respect to the beneficial ownership of Green Brick’s common stock as of March 7, 2018, by:
• | each person who is known by the Company to beneficially own 5% or more of the outstanding shares of common stock; |
• | each member of the Board who beneficially owns any shares of common stock; |
• | each of the Company’s named executive officers; and |
• | all members of the Board and the Company’s executive officers as a group. |
Beneficial ownership is determined in accordance with the SEC rules and includes voting or investment power with respect to the securities. Unless otherwise indicated and subject to applicable community property laws, to the Company’s knowledge, each stockholder named in the following table possesses sole voting and investment power over the shares listed, except for those jointly owned with that person’s spouse.
78
Unless otherwise indicated, the address for all beneficial owners is c/o Green Brick Partners, Inc., 2805 Dallas Parkway, Suite 400, Plano, Texas 75093. At the close of business on March 7, 2018, there were 50,598,901 shares of common stock outstanding. Each share of common stock is entitled to one vote. The percentage of voting shares outstanding was determined based on 50,598,901 shares outstanding on March 7, 2018.
Beneficial Owner | Number of Shares of Common Stock | Total Number of Shares Beneficially Owned | Percentage of Common Stock Outstanding | ||||||
Greenlight Capital, Inc. and its affiliates(1) 2 Grand Central Tower 140 East 45th Street, 24th floor New York, NY 10017 | 24,127,590 | 24,127,590 | 47.7 | % | |||||
Third Point Funds and its affiliates(2) 390 Park Avenue, 18th floor New York, NY10022 | 8,211,267 | 8,211,267 | 16.2 | % | |||||
James R. Brickman(3) | 1,590,706 | 1,800,142 | 3.6 | % | |||||
Richard A. Costello | 26,514 | 26,514 | * | ||||||
Jed Dolson | 74,583 | 74,583 | * | ||||||
Summer Loveland | — | — | — | ||||||
David Einhorn(1) | 8,922 | 8,922 | * | ||||||
Elizabeth K. Blake | 110,546 | 110,546 | * | ||||||
Harry Brandler | — | — | — | ||||||
John R. Farris | 56,788 | 56,788 | * | ||||||
Kathleen Olsen | 45,282 | 45,282 | * | ||||||
Richard S. Press | 39,222 | 39,222 | * | ||||||
All Directors and Executive Officers as a group, 10 persons(4) | 26,071,231 | 26,280,667 | 51.9 | % | |||||
* Less than 1%
(1) | Greenlight Capital, Inc. is the investment manager for Greenlight Capital Qualified, L.P., Greenlight Capital, L.P. and Greenlight Capital Offshore Partners, and as such has voting and dispositive power over 5,739,103 shares of common stock held by Greenlight Capital Qualified, L.P., 1,290,810 shares of common stock held by Greenlight Capital, L.P., and 10,161,908 shares of common stock held by Greenlight Capital Offshore Partners. DME Advisors, LP (“DME Advisors”) is the investment manager for Greenlight Reinsurance, Ltd., and as such has voting and dispositive power over 3,466,793 shares of common stock held by Greenlight Reinsurance, Ltd. DME Capital Management, LP (“DME Management”) is the investment manager for Greenlight Capital (Gold), LP, and Greenlight Capital Offshore Master (Gold), Ltd., and as such has voting and dispositive power over 1,741,395 shares of common stock held by Greenlight Capital (Gold), LP and 1,718,659 shares of common stock held by Greenlight Capital Offshore Master (Gold), Ltd. DME Advisors GP, LLC (“DME GP”) is the general partner of DME Advisors and DME Management, and as such has voting and dispositive power over 6,926,847 shares of common stock. David Einhorn, one of our directors, is the principal of Greenlight Capital, Inc., DME Advisors, DME Management and DME GP, and as such has voting and dispositive power over 24,127,590 shares of common stock held by these affiliates of Greenlight Capital, Inc. Mr. Einhorn disclaims beneficial ownership of these shares, except to the extent of any pecuniary interest therein. Also includes 8,922 shares held by Mr. Einhorn. |
(2) | Includes 8,083,022 shares held of record by Third Point Offshore Master Fund LP, Third Point Partners LP, Third Point Partners Qualified LP, Third Point Ultra Master Fund LP and Third Point Reinsurance Company Ltd., which are investment funds managed by Third Point LLC, and 128,245 shares held by Daniel S. Loeb, who has the power to vote and dispose of the shares held by him and the investment funds managed by Third Point LLC. |
(3) | Mr. Brickman may be deemed to indirectly beneficially own (i) 100,968 shares of common stock directly held by the Roger E. Brickman GST Marital Trust (the “Marital Trust“) by virtue of his position as a co-trustee of the Marital Trust, (ii) 15,000 shares of common stock directly held by the Brickman Living Trust (the “Living Trust“) by virtue of his position as the trustee of the Living Trust, and (iii) 93,468 shares of common stock directly held by the L. Loraine Brickman Revocable Trust (the “Revocable Trust”) by virtue of his position as a co-trustee of the Revocable Trust. Mr. Brickman disclaims beneficial ownership of the shares of common stock of the Company directly held by the Marital Trust, the Living Trust and the Revocable Trust, except to the extent of his pecuniary interest therein. |
79
(4) | Includes shares held by Greenlight Capital, Inc., and its affiliates described in Note 1, which are controlled by one of our directors, David Einhorn. |
Equity Compensation Plan Information
The following table provides information about our common stock that may be issued as of December 31, 2017 under the 2014 Equity Plan, which is our only existing equity compensation plan.
Plan Category | Number of securities to be issued upon exercise of outstanding options, warrants and rights (a) | Weighted-average exercise price of outstanding options, warrants and rights (b) | Number of securities remaining available for future issuance under equity compensation plans (excluding securities reflected in column (a)) (c) | |||
Equity compensation plans approved by security holders | — | — | 1,956,979 | |||
Equity compensation plans not approved by security holders | — | — | — | |||
Total | — | — | 1,956,979 | |||
ITEM 13. CERTAIN RELATIONSHIPS AND RELATED TRANSACTIONS, AND DIRECTOR INDEPENDENCE
Review and Approval or Ratification of Transactions with Related Persons
The Company has adopted a written policy for the review, approval and ratification of transactions with related persons. The policy covers related party transactions between us and any of our senior managers and directors or their respective affiliates, director nominees, 5% or greater security holders or family members of any of the foregoing. Related party transactions covered by this policy are reviewed by our Governance and Nominating Committee to determine whether the transaction is in our best interests and the best interests of our stockholders. As a result, approval of related party business will be denied if, among other factors, it is determined that the proposed transaction is not fair and reasonable and on terms no less favorable to the Company than could be obtained in a comparable arms-length transaction with an unrelated third party.
Transactions with Related Persons
Since January 1, 2017, the Company had related party transactions through the normal course of business. These transactions include the following:
In 2012, we formed Centre Living Homes, LLC (“Centre Living”), a builder that focuses on a limited number of homes and luxury townhomes each year in the Dallas, Texas market. Trevor Brickman, the son of Green Brick’s Chief Executive Officer, is the President of Centre Living. Effective as of January 1, 2015, Centre Living’s operating agreement was amended and restated to the same general terms as with our other builders, such that Green Brick’s ownership interest in Centre Living is 50% and Trevor Brickman’s ownership interest is 50% for future operations beginning January 1, 2015. Subsequent to this amendment, Green Brick has 51% voting control over the operations of Centre Living. In June 2016, the Company sold one developed lot to Trevor Brickman for $0.4 million, of which $0.3 million was included in the cost of land and lots. In September 2016, Trevor Brickman entered into an agreement with Centre Living to construct a home on the developed lot. In accordance with the Company’s employee discount policy, the contract price resulted in a margin of approximately 13%. The home was completed in 2017 and the Company incurred $0.6 million in costs to construct the home. During 2017, compensation paid to Trevor Brickman totaled approximately $160,000.
In September 2015, the Company purchased 11 lots from an entity affiliated with the president of The Providence Group of Georgia L.L.C. (“TPG”), one of its controlled builders. The lots are part of a 19-home community, The Parc at Cogburn in Atlanta. The total paid for the lots in 2015 was $1.8 million. Under the option agreement in place, the Company purchased $0.3 million in lots during the year ended December 31, 2016. The Company purchased $1.0 million in lots during the six months ended June 30, 2017. The Company purchased all 19 lots as of June 30, 2017.
During March 2016, the Company purchased undeveloped land for an eventual 83 lot community, Academy Street in Atlanta. Simultaneously, the Company entered into a partnership agreement with an entity affiliated with the president of TPG to develop the community for sale of the lots to TPG under GRBK Academy LLC. Contributions and profits are 80% for the Company and 20% for the affiliated entity. The total contributions paid during the year ended December 31, 2017 were $0.5 million, of which $0.4 million was paid by the Company.
80
During March 2016, the Company purchased undeveloped land for an eventual 73 unit townhome community, Suwanee Station in Atlanta. Simultaneously, the Company entered into a partnership agreement with an entity affiliated with the president of TPG to develop the community for sale of the lots to TPG under GRBK Suwanee Station LLC. Contributions and profits are 50% for the Company and 50% for the affiliated entity. Total capital contributions are estimated at $3.4 million, of which 50% will be contributed by the Company. The total contributions paid in 2016 were $1.8 million, of which $0.9 million was paid by the Company. The total contributions paid during the year ended December 31, 2017 were $0.7 million, of which $0.4 million was paid by the Company.
In June 2016, the Company purchased 14 lots from an entity affiliated with the president of TPG. The lots are part of a 40-unit townhome community, Dunwoody Towneship. No deposits were paid by the Company related to these lots. The total paid for the 14 lots in 2016 was $1.8 million. The Company purchased the remaining 26 lots during the year ended December 31, 2017 for $3.3 million.
In February 2017, Richard A. Costello paid a $110,000 deposit to Centre Living for the purchase of a townhome. During the fourth quarter of 2017, Mr. Costello closed on the townhome for approximately $495,000. In accordance with the Company’s employee discount policy, the contract price resulted in a margin of approximately 13%.
In February 2017, Jed Dolson paid a $110,000 deposit to Centre Living for the purchase of a townhome. During the fourth quarter of 2017, as allowed for in the Company’s employee discount policy, Mr. Dolson assigned his rights to purchase the townhome to his sister-in-law. The townhome was sold in the fourth quarter of 2017 for approximately $472,000. In accordance with the Company’s employee discount policy, the contract price resulted in a margin of approximately 13%.
Director Independence
Under NASDAQ listing standards, independent directors are required to constitute a majority of the Board. Our Board makes a formal determination each year as to which of our directors and director nominees are independent. The Board has determined that the following directors or director nominees are independent within the meaning of the NASDAQ listing standards and the applicable SEC rules and regulations: Elizabeth K. Blake, John R. Farris, Kathleen Olsen and Richard S. Press.
In making its determination regarding the independence of Ms. Olsen and Mr. Press, the Board considered that each of these individuals has invested in limited partnership interests in funds managed by Greenlight Capital Inc. or its affiliates. We refer to these funds as the Greenlight Funds. However, because none of these directors has received any compensation from the Greenlight Funds, the Board has determined that such interests would not interfere with the exercise of independent judgment in carrying out the responsibilities of such directors.
81
ITEM 14. PRINCIPAL ACCOUNTING FEES AND SERVICES
Independent Registered Public Accounting Firm Fees
Fees for professional services provided by RSM US LLP for the fiscal years ended 2017 and 2016, including related expenses, are as follows:
2017 | 2016 | ||||||
Audit fees(1) | $ | 700,671 | $ | 879,958 | |||
Audit-related fees | — | — | |||||
Tax fees | — | — | |||||
All other fees | — | — | |||||
Total fees | $ | 700,671 | $ | 879,958 | |||
(1) | Audit fees for 2017 include professional services rendered by RSM US LLP for the audit of the Company’s consolidated financial statements included in the Company’s Annual Report on Form 10-K, review of the Company’s condensed consolidated financial statements included in the Company’s Quarterly Reports on Form 10-Q, and audit of the Company’s internal control over financial reporting. Audit fees for 2016 include professional services rendered by RSM US LLP for the audit of the Company’s consolidated financial statements included in the Company’s Annual Report on Form 10-K, review of the Company’s condensed consolidated financial statements included in the Company’s third quarter Quarterly Report on Form 10-Q, and audit of the Company’s internal control over financial reporting. |
Fees for professional services provided by our former independent registered public accounting firm, Grant Thornton, for for the fiscal years ended 2017 and 2016, including related expenses, are as follows:
2017 | 2016 | ||||||
Audit fees(1) | $ | 79,500 | $ | 410,040 | |||
Audit-related fees | — | — | |||||
Tax fees | — | — | |||||
All other fees | — | — | |||||
Total fees | $ | 79,500 | $ | 410,040 | |||
(1) | Audit fees for 2017 include professional services rendered by Grant Thornton LLP related to a consent and successor auditor services for the Company’s consolidated financial statements for the year ended December 31, 2015. Audit fees for 2016 include professional services rendered by Grant Thornton for the audit of the Company’s consolidated financial statements included in the Company’s 2015 Annual Report on Form 10-K, review of the Company’s condensed consolidated financial statements included in the Company’s first and second quarters Quarterly Reports on Form 10-Q, and successor auditor services, such as, the reissuance of opinion in the Company’s 2016 Annual Report on Form 10-K. |
Audit Committee Approval of Audit and Non-Audit Services
The Audit Committee pre-approves all audit, audit-related and permitted non-audit services provided by the independent registered public accounting firm, including the fees and terms for those services. The Audit Committee has adopted a policy and procedures governing the pre-approval process for audit, audit-related and permitted non-audit services. The Audit Committee pre-approves audit and audit-related services in accordance with its review and approval of the engagement letter and annual service plan with the independent registered public accounting firm. Tax consultation and compliance services are considered by the Audit Committee on a project-by-project basis. Non-audit and other services will be considered by the Audit Committee for pre-approval based on business purpose, reasonableness of estimated fees and the potential impact on the firm’s independence.
82
PART IV
ITEM 15. EXHIBITS AND FINANCIAL STATEMENT SCHEDULES
(a)(1) Financial Statements
Green Brick Partners, Inc. - Consolidated Financial Statements | |
(a)(2) Financial Statement Schedules. Financial statements schedules are omitted because they are not required or applicable or the required information is included in the consolidated financial statements or notes thereto. | |
83
GREEN BRICK PARTNERS, INC.
INDEX TO THE CONSOLIDATED FINANCIAL STATEMENTS
Green Brick Partners, Inc. - Consolidated Financial Statements | |
84
REPORT OF INDEPENDENT REGISTERED PUBLIC ACCOUNTING FIRM
To the Stockholders and the Board of Directors of Green Brick Partners, Inc.
Opinion on the Financial Statements
We have audited the accompanying consolidated balance sheets of Green Brick Partners, Inc. and subsidiaries (the Company) as of December 31, 2017 and 2016, the related consolidated statements of income, stockholders' equity and cash flows for the years ended December 31, 2017 and 2016, and the related notes to the consolidated financial statements (collectively, the financial statements). In our opinion, the financial statements present fairly, in all material respects, the financial position of the Company as of December 31, 2017 and 2016, and the results of their operations and their cash flows for the years then ended, in conformity with accounting principles generally accepted in the United States of America.
We have also audited, in accordance with the standards of the Public Company Accounting Oversight Board (United States) (PCAOB), the Company's internal control over financial reporting as of December 31, 2017, based on criteria established in Internal Control - Integrated Framework issued by the Committee of Sponsoring Organizations of the Treadway Commission in 2013, and our report dated March 12, 2018 expressed an unqualified opinion on the effectiveness of the Company's internal control over financial reporting.
Basis for Opinion
These financial statements are the responsibility of the Company’s management. Our responsibility is to express an opinion on the Company’s financial statements based on our audits. We are a public accounting firm registered with the PCAOB and are required to be independent with respect to the Company in accordance with U.S. federal securities laws and the applicable rules and regulations of the Securities and Exchange Commission and the PCAOB.
We conducted our audits in accordance with the standards of the PCAOB. Those standards require that we plan and perform the audits to obtain reasonable assurance about whether the financial statements are free of material misstatement, whether due to error or fraud. Our audits included performing procedures to assess the risks of material misstatement of the financial statements, whether due to error or fraud, and performing procedures that respond to those risks. Such procedures included examining, on a test basis, evidence regarding the amounts and disclosures in the financial statements. Our audits also included evaluating the accounting principles used and significant estimates made by management, as well as evaluating the overall presentation of the financial statements. We believe that our audits provide a reasonable basis for our opinion.
/s/ RSM US LLP
We have served as the Company's auditor since 2016.
Dallas, Texas
March 12, 2018
85
REPORT OF INDEPENDENT REGISTERED PUBLIC ACCOUNTING FIRM
Board of Directors and Stockholders
Green Brick Partners, Inc.
We have audited the accompanying consolidated balance sheet of Green Brick Partners, Inc. (a Delaware corporation) and subsidiaries (the “Company”) as of December 31, 2015 (not presented herein), and the related consolidated statements of income, changes in stockholders’ equity, and cash flows for the year then ended. These financial statements are the responsibility of the Company’s management. Our responsibility is to express an opinion on these financial statements based on our audit.
We conducted our audit in accordance with the standards of the Public Company Accounting Oversight Board (United States). Those standards require that we plan and perform the audit to obtain reasonable assurance about whether the financial statements are free of material misstatement. An audit also includes examining, on a test basis, evidence supporting the amounts and disclosures in the financial statements. An audit also includes assessing the accounting principles used and significant estimates made by management, as well as evaluating the overall financial statement presentation. We believe that our audit provides a reasonable basis for our opinion.
In our opinion, the consolidated financial statements referred to above present fairly, in all material respects, the financial position of Green Brick Partners, Inc. and subsidiaries as of December 31, 2015 (not presented herein), and the results of their operations and their cash flows for the year then ended in conformity with accounting principles generally accepted in the United States of America.
/s/ GRANT THORNTON LLP
Dallas, Texas
March 30, 2016 (except for the effects of the change in classification described in Note 2 - Change in Classification and the changes in presentation of segment information described in Note 2 - Segment Information and in Note 13, as to which the date is March 13, 2017)
86
GREEN BRICK PARTNERS, INC.
CONSOLIDATED BALANCE SHEETS
(In thousands, except share data)
As of December 31, | |||||||
2017 | 2016 | ||||||
Assets | |||||||
Cash | $ | 36,684 | $ | 35,157 | |||
Restricted cash | 3,605 | 4,445 | |||||
Accounts receivable | 1,605 | 2,448 | |||||
Inventory | 495,655 | 410,297 | |||||
Investment in unconsolidated entity | 16,878 | — | |||||
Property and equipment, net | 804 | 892 | |||||
Earnest money deposits | 22,038 | 18,143 | |||||
Deferred income tax assets, net | 31,211 | 67,598 | |||||
Other assets, net | 3,750 | 2,004 | |||||
Total assets | $ | 612,230 | $ | 540,984 | |||
Liabilities and stockholders’ equity | |||||||
Accounts payable | $ | 22,354 | $ | 15,113 | |||
Accrued expenses | 18,465 | 14,290 | |||||
Customer and builder deposits | 21,447 | 14,088 | |||||
Obligations related to land not owned under option contracts | — | 10,060 | |||||
Borrowings on lines of credit | 107,000 | 75,000 | |||||
Notes payable | 9,926 | 10,948 | |||||
Total liabilities | 179,192 | 139,499 | |||||
Commitments and contingencies | — | — | |||||
Stockholders’ equity | |||||||
Green Brick Partners, Inc. stockholders’ equity | |||||||
Preferred stock, $0.01 par value: 5,000,000 shares authorized; none issued and outstanding, respectively | — | — | |||||
Common shares, $0.01 par value: 100,000,000 shares authorized; 50,598,901 and 48,955,909 issued and outstanding as of December 31, 2017 and 2016, respectively | 506 | 490 | |||||
Additional paid-in capital | 289,938 | 273,149 | |||||
Retained earnings | 125,903 | 110,933 | |||||
Total Green Brick Partners, Inc. stockholders’ equity | 416,347 | 384,572 | |||||
Noncontrolling interests | 16,691 | 16,913 | |||||
Total stockholders’ equity | 433,038 | 401,485 | |||||
Total liabilities and stockholders’ equity | $ | 612,230 | $ | 540,984 | |||
The accompanying notes are an integral part of these consolidated financial statements.
87
GREEN BRICK PARTNERS, INC.
CONSOLIDATED STATEMENTS OF INCOME
(In thousands, except per share data)
For the Year Ended December 31, | |||||||||||
2017 | 2016 | 2015 | |||||||||
Sale of residential units | $ | 435,644 | $ | 365,164 | $ | 254,267 | |||||
Sale of land and lots | 18,730 | 15,164 | 36,878 | ||||||||
Total revenues | 454,374 | 380,328 | 291,145 | ||||||||
Cost of residential units | 342,065 | 283,454 | 201,768 | ||||||||
Cost of land and lots | 13,856 | 10,499 | 27,125 | ||||||||
Total cost of sales | 355,921 | 293,953 | 228,893 | ||||||||
Total gross profit | 98,453 | 86,375 | 62,252 | ||||||||
Salary expense | 21,823 | 21,871 | 16,272 | ||||||||
Selling, general and administrative expense | 17,193 | 16,758 | 13,704 | ||||||||
Operating profit | 59,437 | 47,746 | 32,276 | ||||||||
Interest expense | — | — | 281 | ||||||||
Equity in income of unconsolidated entity | 2,746 | — | — | ||||||||
Other income, net | 2,054 | 2,808 | 2,721 | ||||||||
Income before taxes | 64,237 | 50,554 | 34,716 | ||||||||
Income tax provision | 39,031 | 15,381 | 9,171 | ||||||||
Net income | 25,206 | 35,173 | 25,545 | ||||||||
Less: net income attributable to noncontrolling interests | 10,236 | 11,417 | 10,220 | ||||||||
Net income attributable to Green Brick Partners, Inc. | $ | 14,970 | $ | 23,756 | $ | 15,325 | |||||
Net income attributable to Green Brick Partners, Inc. per common share: | |||||||||||
Basic | $0.30 | $0.49 | $0.38 | ||||||||
Diluted | $0.30 | $0.49 | $0.38 | ||||||||
Weighted average common shares used in the calculation of net income attributable to Green Brick Partners, Inc. per common share: | |||||||||||
Basic | 49,597 | 48,879 | 40,068 | ||||||||
Diluted | 49,683 | 48,886 | 40,099 | ||||||||
The accompanying notes are an integral part of these consolidated financial statements.
88
GREEN BRICK PARTNERS, INC.
CONSOLIDATED STATEMENTS OF CHANGES IN STOCKHOLDERS’ EQUITY
(In thousands, except share data)
Common Stock | Additional Paid-in Capital | Retained Earnings | Total Green Brick Partners, Inc. Stockholders’ Equity | Noncontrolling Interests | Total Stockholders’ Equity | |||||||||||||||||||||
Shares | Amount | |||||||||||||||||||||||||
Balance as of December 31, 2014 | 31,346,084 | $ | 313 | $ | 101,626 | $ | 69,919 | $ | 171,858 | $ | 9,739 | $ | 181,597 | |||||||||||||
Share-based compensation | — | — | 383 | — | 383 | — | 383 | |||||||||||||||||||
Issuance of common stock under 2014 Equity Plan | 42,342 | — | — | — | — | — | — | |||||||||||||||||||
Amortization of deferred share-based compensation | — | — | 91 | — | 91 | — | 91 | |||||||||||||||||||
Issuance of common stock in connection with secondary offering, net of issuance costs | 17,444,897 | 175 | 169,767 | — | 169,942 | — | 169,942 | |||||||||||||||||||
Contributions | — | — | — | — | — | 87 | 87 | |||||||||||||||||||
Distributions | — | — | — | — | — | (7,723 | ) | (7,723 | ) | |||||||||||||||||
Out-of-period adjustment | — | — | — | 1,933 | 1,933 | — | 1,933 | |||||||||||||||||||
Net income | — | — | — | 15,325 | 15,325 | 10,220 | 25,545 | |||||||||||||||||||
Balance as of December 31, 2015 | 48,833,323 | $ | 488 | $ | 271,867 | $ | 87,177 | $ | 359,532 | $ | 12,323 | $ | 371,855 | |||||||||||||
Share-based compensation | — | — | 361 | — | 361 | — | 361 | |||||||||||||||||||
Issuance of common stock under 2014 Equity Plan | 122,586 | 2 | 647 | — | 649 | — | 649 | |||||||||||||||||||
Amortization of deferred share-based compensation | — | — | 274 | — | 274 | — | 274 | |||||||||||||||||||
Contributions | — | — | — | — | — | 2,928 | 2,928 | |||||||||||||||||||
Distributions | — | — | — | — | — | (9,755 | ) | (9,755 | ) | |||||||||||||||||
Net income | — | — | — | 23,756 | 23,756 | 11,417 | 35,173 | |||||||||||||||||||
Balance as of December 31, 2016 | 48,955,909 | $ | 490 | $ | 273,149 | $ | 110,933 | $ | 384,572 | $ | 16,913 | $ | 401,485 | |||||||||||||
Share-based compensation | — | — | 289 | — | 289 | — | 289 | |||||||||||||||||||
Issuance of common stock under 2014 Equity Plan | 229,049 | 2 | 1,924 | — | 1,926 | — | 1,926 | |||||||||||||||||||
Amortization of deferred share-based compensation | — | — | 356 | — | 356 | — | 356 | |||||||||||||||||||
Withholdings of taxes from vesting of restricted stock awards | (63,057 | ) | (1 | ) | (585 | ) | — | (586 | ) | — | (586 | ) | ||||||||||||||
Common stock issued in connection with the investment in unconsolidated entity | 1,477,000 | 15 | 14,607 | — | 14,622 | — | 14,622 | |||||||||||||||||||
Common stock issuable in connection with the investment in unconsolidated entity | — | — | 198 | — | 198 | — | 198 | |||||||||||||||||||
Contributions | — | — | — | — | — | 438 | 438 | |||||||||||||||||||
Distributions | — | — | — | — | — | (10,896 | ) | (10,896 | ) | |||||||||||||||||
Net income | — | — | — | 14,970 | 14,970 | 10,236 | 25,206 | |||||||||||||||||||
Balance as of December 31, 2017 | 50,598,901 | $ | 506 | $ | 289,938 | $ | 125,903 | $ | 416,347 | $ | 16,691 | $ | 433,038 | |||||||||||||
The accompanying notes are an integral part of these consolidated financial statements.
89
GREEN BRICK PARTNERS, INC.
CONSOLIDATED STATEMENTS OF CASH FLOWS
(In thousands)
For the Year Ended December 31, | |||||||||||
2017 | 2016 | 2015 | |||||||||
Cash flows from operating activities: | |||||||||||
Net income | $ | 25,206 | $ | 35,173 | $ | 25,545 | |||||
Adjustment to reconcile net income to net cash used in operating activities: | |||||||||||
Depreciation and amortization expense | 325 | 286 | 865 | ||||||||
Share-based compensation | 2,571 | 1,284 | 474 | ||||||||
Deferred income taxes, net | 36,299 | 13,147 | 8,352 | ||||||||
Equity in income of unconsolidated entity | (2,746 | ) | — | — | |||||||
Cash distributions of income from unconsolidated entity | 974 | — | — | ||||||||
Changes in operating assets and liabilities | |||||||||||
Decrease (increase) in accounts receivable | 843 | 866 | (2,566 | ) | |||||||
Increase in inventory | (95,418 | ) | (74,281 | ) | (58,728 | ) | |||||
Increase in earnest money deposits | (3,895 | ) | (298 | ) | (11,169 | ) | |||||
(Increase) decrease in other assets | (1,746 | ) | 1,341 | (1,887 | ) | ||||||
Increase (decrease) in accounts payable | 7,241 | 1,583 | (21 | ) | |||||||
Increase (decrease) in accrued expenses | 4,175 | 8,571 | (3,465 | ) | |||||||
Increase (decrease) in customer and builder deposits | 7,359 | 7,150 | (2,814 | ) | |||||||
Net cash used in operating activities | (18,812 | ) | (5,178 | ) | (45,414 | ) | |||||
Cash flows from investing activities: | |||||||||||
Proceeds from sale of investment in direct financing leases | — | — | 2,768 | ||||||||
Acquisition of investment in unconsolidated entity | (286 | ) | — | — | |||||||
Acquisition of property and equipment | (149 | ) | (458 | ) | (307 | ) | |||||
Net cash (used in) provided by investing activities | (435 | ) | (458 | ) | 2,461 | ||||||
Cash flows from financing activities: | |||||||||||
Borrowings from lines of credit | 88,500 | 63,000 | 86,000 | ||||||||
Proceeds from notes payable | — | 2,660 | 3,206 | ||||||||
Repayments of lines of credit | (56,500 | ) | (35,500 | ) | (52,561 | ) | |||||
Repayments of notes payable | (1,022 | ) | (1,870 | ) | (5,199 | ) | |||||
Repayment of term loan facility | — | — | (150,000 | ) | |||||||
Proceeds from equity offering, net of issuance costs | — | — | 169,942 | ||||||||
Withholdings of taxes from vesting of restricted stock awards | (586 | ) | — | — | |||||||
Contributions from noncontrolling interests | 438 | 2,928 | 87 | ||||||||
Distributions to noncontrolling interests | (10,896 | ) | (9,755 | ) | (7,723 | ) | |||||
Net cash provided by financing activities | 19,934 | 21,463 | 43,752 | ||||||||
Net increase in cash and restricted cash | 687 | 15,827 | 799 | ||||||||
Cash and restricted cash at beginning of period | 39,602 | 23,775 | 22,976 | ||||||||
Cash and restricted cash at end of period | $ | 40,289 | $ | 39,602 | $ | 23,775 | |||||
Supplemental disclosure of cash flow information: | |||||||||||
Cash paid for interest, net of capitalized interest | $ | — | $ | — | $ | 2,764 | |||||
Cash paid for taxes | $ | 2,941 | $ | 1,503 | $ | 1,339 | |||||
Supplemental disclosure of noncash investing and financing activities: | |||||||||||
Decrease (increase) in land not owned under option contracts | $ | — | $ | 6,921 | $ | (8,935 | ) | ||||
Accrued debt issuance costs | $ | — | $ | — | $ | 52 | |||||
Out-of-period equity adjustment | $ | — | $ | — | $ | 1,933 | |||||
Equity issuance related to investment in unconsolidated entity | $ | 14,622 | $ | — | $ | — | |||||
The accompanying notes are an integral part of these consolidated financial statements.
90
GREEN BRICK PARTNERS, INC.
NOTES TO CONSOLIDATED FINANCIAL STATEMENTS
1. ORGANIZATION AND BASIS OF PRESENTATION
References to the “Company”, “Green Brick”, “we”, “us” or “our” refer to the combined company, which was renamed Green Brick Partners, Inc. and its subsidiaries, resulting from the acquisition by BioFuel Energy Corp. and its then consolidated subsidiaries (“BioFuel”) of JBGL Builder Finance LLC and its consolidated subsidiaries and affiliated companies (collectively, “Builder Finance”), and JBGL Capital Companies (“Capital”), a combined group of commonly managed limited liability companies and partnerships (collectively with Builder Finance, “JBGL”) by means of a reverse recapitalization transaction on October 27, 2014.
Green Brick Partners, Inc. (formerly named BioFuel Energy Corp.) was incorporated as a Delaware corporation on April 11, 2006, to invest solely in BioFuel Energy, LLC, a limited liability company organized on January 25, 2006, to build and operate ethanol production facilities in the Midwestern United States. On November 22, 2013, the Company disposed of its ethanol plants and all related assets. Following the disposition of these production facilities, we were a public shell company with no substantial operations.
On June 10, 2014, the Company entered into a definitive transaction agreement with the owners of JBGL, which provided that we would acquire JBGL for $275.0 million, payable in cash and shares of our common stock (the “Transaction”). JBGL is a real estate operator involved in the purchase and development of land for residential use, construction lending and home building operations. The Transaction was completed on October 27, 2014 (the “Transaction Date”). Pursuant to the terms of the Transaction, we paid the $275.0 million purchase price with approximately $191.8 million in cash and the remainder in 11,108,500 shares of our common stock valued at approximately $7.49 per share.
The cash portion of the purchase price was primarily funded from the proceeds of a $70.0 million rights offering conducted by the Company (the $70.0 million includes proceeds from purchases of shares of common stock by certain funds and accounts managed by Greenlight Capital, Inc. and its affiliates (“Greenlight”) and Third Point LLC and its affiliates (“Third Point”)) and $150.0 million of debt financing provided by Greenlight pursuant to a loan agreement, with the lenders from time to time party thereto (the “Loan Agreement”), which provided for a five year term loan facility (the “Term Loan Facility”). In 2015, the Term Loan Facility was repaid in full.
At the time the Transaction was completed, BioFuel was a non-operating public shell company with nominal operations and assets consisting of cash, deferred tax assets, and nominal other nonoperating assets. As a result of the Transaction, the owners and management of JBGL gained effective operating control of the combined company. As of the Transaction Date, BioFuel did not meet the definition of a business for accounting purposes.
For financial reporting purposes, the Transaction was deemed to be a capital transaction in substance and recorded as a reverse recapitalization of JBGL whereby JBGL is deemed to be the continuing, surviving entity for accounting purposes, but through reorganization, is deemed to have adopted the capital structure of BioFuel. Because the acquisition was considered a reverse recapitalization for accounting purposes, the combined historical financial statements of JBGL became our historical financial statements and from the completion of the acquisition on October 27, 2014, the financial statements have been prepared on a consolidated basis. The assets and liabilities of BioFuel were brought forward at their book value and no goodwill was recognized in connection with the Transaction.
As a result of the Transaction, Green Brick changed its business direction and is now a diversified homebuilding and land development company. We are a diversified homebuilding and land development company. We acquire and develop land, provide land and construction financing to our controlled builders and participate in the profits of our controlled builders. Our core markets are in the high growth U.S. metropolitan areas of Dallas, Texas and Atlanta, Georgia. We also own a noncontrolling interest in Challenger Homes (as discussed in Note 3) in Colorado Springs, Colorado. We are engaged in all aspects of the homebuilding process, including land acquisition and development, entitlements, design, construction, marketing and sales and the creation of brand images at our residential neighborhoods and master planned communities.
Equity Offering
On July 1, 2015, the Company completed an underwritten public offering of 17 million shares of its common stock at a price of $10.00 per share and granted to the underwriters a 30-day option to purchase up to an aggregate of 841,500 additional shares of common stock to cover over-allotments (the “Equity Offering”). On July 23, 2015, the underwriters exercised the
91
option and purchased 444,897 additional shares. All of the shares were sold by the Company pursuant to an effective shelf registration statement previously filed with the SEC.
The Equity Offering resulted in net proceeds of approximately $170.0 million, after deducting underwriting discounts and offering expenses. On July 1, 2015, Green Brick used approximately $154.9 million of the net proceeds from the Equity Offering to repay all of the outstanding principal, interest and a prepayment premium under the Term Loan Facility. Upon repayment, the Term Loan Facility was terminated and all security interests in, and all liens held by Greenlight with respect to, the assets of Green Brick securing the amounts owed under the Term Loan Facility were terminated and released. Green Brick used the remaining net proceeds for working capital and general corporate purposes.
Basis of Presentation
The accompanying consolidated financial statements have been prepared in accordance with United States generally accepted accounting principles (“GAAP”) as set forth in the Financial Accounting Standards Board’s (“FASB”) Accounting Standards Codification (“ASC”) and applicable regulations of the Securities and Exchange Commission (“SEC”).
Principles of Consolidation
The Company evaluated its wholly-owned subsidiaries and controlled builders under ASC 810, Consolidation (“ASC 810”) and concluded that each controlled builder is a variable interest entity (“VIE”). The Company owns a 50% equity interest and has 51% of the voting interest in each controlled builder. In addition, the Company holds two of the three board seats for each controlled builder and is able to exercise control over the operations of each controlled builder. The Company accounts for its controlled builders under the variable interest model and is the primary beneficiary of each controlled builder in accordance with ASC 810. Therefore, the financial statements of the controlled builders are consolidated in the consolidated financial statements following the variable interest model (see Note 2). All intercompany balances and transactions have been eliminated in consolidation.
The Company uses the equity method of accounting for its investment in an unconsolidated entity over which it exercises significant influence but does not have a controlling interest. Under the equity method, the Company’s share of the unconsolidated entity’s earnings or losses, if any, is included in the consolidated statements of income.
Generally, the Company forms subsidiaries for each selling community and or homebuilding project in which it invests.
2. SIGNIFICANT ACCOUNTING POLICIES
Use of Estimates
The preparation of the consolidated financial statements in conformity with GAAP requires management of the Company to make estimates and assumptions that affect the amounts reported in the consolidated financial statements and accompanying notes, including the reported amounts of assets and liabilities and disclosure of contingent assets and liabilities at the date of the consolidated financial statements and the reported amounts of revenue and expenses during the reporting periods. Actual results could differ from those estimates.
Cash
The cash balances of the Company are held with multiple financial institutions. At times, cash balances at certain banks and financial institutions may exceed insurable amounts. The Company believes it mitigates this risk by monitoring the financial stability of institutions holding material cash balances. The Company has not experienced any losses in such accounts and believes that the risk of loss is minimal.
Restricted Cash
Restricted cash primarily relates to cash held in escrow to fund future development costs and refundable customer deposits held in escrow.
Accounts Receivable and Allowance for Doubtful Accounts
Accounts receivable primarily consist of amounts collectible from manufacturing rebates earned by our homebuilders during the normal course of business. As of December 31, 2017 and 2016, all amounts are considered fully collectible and no allowance for doubtful accounts is recorded. The allowance for doubtful accounts is estimated based on our historical losses, the existing economic conditions, and the financial stability of our customers. Receivables are written-off in the period that they are deemed uncollectible.
92
Inventory and Cost of Sales
Inventory consists of land in the process of development, undeveloped land, developed lots, completed homes, model homes, raw land scheduled for development, and land not owned under option contracts in Texas and Georgia. Inventory is valued at cost unless the carrying value is determined to be not recoverable in which case the affected inventory is written down to fair value. Cost includes any related pre-acquisition costs that are directly identifiable with a specific property so long as those pre-acquisition costs are anticipated to be recoverable at the sale of the property.
Residential lots held for sale and lots held for development include the initial cost of acquiring the land as well as certain costs capitalized related to developing the land into individual residential lots including direct overhead, interest and real estate taxes.
Land, development and other project costs, including direct overhead, interest and property taxes incurred during development and home construction, are capitalized. Land development and other common costs that benefit an entire community are allocated to individual lots or homes based on relative sales value. The costs of completed lots are transferred to work in process when home construction begins. Home construction costs and related carrying charges (principally interest and real estate taxes) are allocated to the cost of individual homes using the specific identification method.
Inventory costs for completed homes are expensed as cost of sales as homes are sold. Changes to estimated total development costs subsequent to initial home closings in a community are generally allocated to the unsold homes in the community on a pro-rata basis. The life cycle of a community generally ranges from two to six years, commencing with the acquisition of land, continuing through the land development phase, construction, and concluding with the sale and delivery of homes. We recognize costs as incurred on our mechanics lien contracts.
As of December 31, | |||||||
2017 | 2016 | ||||||
Completed home inventory and residential lots held for sale | $ | 106,043 | $ | 127,679 | |||
Work in process and land under development | 389,612 | 269,255 | |||||
Undeveloped land | — | 4,070 | |||||
Land not owned under option contracts | — | 9,293 | |||||
Total inventory | $ | 495,655 | $ | 410,297 | |||
Impairment of Inventory
In accordance with the ASC 360, Property, Plant, and Equipment, we evaluate our inventory for indicators of impairment by individual community and development during each reporting period.
For our builder operations segment, during each reporting period, community gross margins are reviewed by management. In the event that inventory in an individual community is moving at a slower than anticipated absorption pace or the average sales prices or margins within an individual community are trending downward and are anticipated to continue to trend downward over the life of the community, the Company will further investigate these communities and evaluate them for impairment.
For our land development segment, we perform a quarterly review for indicators of impairment for each project which involves projecting future lot sales based on executed contracts and comparing these revenues to projected costs. In determining the allocation of costs to a particular land parcel, we rely on project budgets which are based on a variety of assumptions, including assumptions about development schedules and future costs to be incurred. It is common that actual results differ from budgeted amounts for various reasons, including delays, increases in costs that have not been committed, unforeseen issues encountered during project development that fall outside the scope of existing contracts, or items that ultimately cost more or less than the budgeted amount. We apply procedures to maintain best estimates in our budgets, including assessing and revising project budgets on a periodic basis, obtaining commitments from subcontractors and vendors for future costs to be incurred and utilizing the most recent information available to estimate costs.
Each reporting period, the Company reviews our real estate assets to determine whether the estimated remaining future cash flows of the development are more or less than the asset’s carrying value. The estimated cash flows are determined by projecting the remaining sales revenue from lot sales based on the contractual lot takedowns remaining or historical/projected home sales/delivery absorptions for homebuilding operations and then comparing that to the remaining projected expenditures
93
for development or home construction. Remaining projected expenditures are based on the most current pricing/bids received from subcontractors for current phases or homes under development. For future phases of land development, management uses its best judgment to project potential cost increases. When projecting sales revenue, management does not assume improvement in market conditions.
If the estimated cash flows are more than the asset’s carrying value, no impairment adjustment is required. However, if the estimated cash flows are less than the asset’s carrying value, the asset is deemed impaired and will be written down to fair value. These impairment evaluations require us to make estimates and assumptions regarding future conditions, including the timing and amounts of development costs and sales prices of real estate assets, to determine if expected future cash flows will be sufficient to recover the asset’s carrying value.
Fair value is determined based on estimated future cash flows discounted for inherent risks associated with real estate assets. These discounted cash flows are impacted by expected risk based on estimated land development activities, construction and delivery timelines, market risk of price erosion, uncertainty of development or construction cost increases, and other risks specific to the asset or market conditions where the asset is located when the assessment is made. These factors are specific to each community and may vary among communities.
When estimating cash flows of a community, the Company makes various assumptions, including: (i) expected sales prices and sales incentives to be offered, including the number of homes available, pricing and incentives being offered by us or other builders in other communities, and future sales price adjustments based on market and economic trends; (ii) expected sales pace and cancellation rates based on local housing market conditions, competition and historical trends; (iii) costs expended to date and expected to be incurred including, but not limited to, land and land development costs, home construction costs, interest costs, indirect construction and overhead costs, and selling and marketing costs; (iv) alternative product offerings that may be offered that could have an impact on sales pace, sales price and/or building costs; and (v) alternative uses for the property. Many assumptions are interdependent and a change in one may require a corresponding change to other assumptions. For example, increasing or decreasing sales absorption rates has a direct impact on the estimated per unit sales price of a home, the level of time-sensitive costs (such as indirect construction, overhead and carrying costs), and selling and marketing costs (such as model home maintenance costs and advertising costs). Due to uncertainties in the estimation process, the significant volatility in demand for new housing and the long life cycle of many communities, actual results could differ significantly from such estimates.
For the year ended December 31, 2017, the Company recorded impairment of approximately $0.1 million related to real estate inventory in our builder operations segment. The Company did not note any indicators of impairment for any projects, and no impairment adjustments related to real estate inventory were recorded for the years ended December 31, 2016 and 2015.
Investment in Unconsolidated Entity
In accordance with ASC 323, Investments - Equity Method and Joint Ventures (“ASC 323”), the Company uses the equity method of accounting for its investment in an unconsolidated entity over which it exercises significant influence but does not have a controlling interest. The equity method of accounting requires the investment to be initially recorded at cost and subsequently adjusted for the Company’s share of equity in the unconsolidated entity’s earnings or losses. The Company evaluates the carrying amount of the investment in unconsolidated entity for impairment in accordance with ASC 323. If the Company determines that a loss in the value of the investment is other than temporary, the Company writes down the investment to its estimated fair value. Any such losses are recorded to equity in income of unconsolidated entity in the Company’s consolidated statements of income. Due to uncertainties in the estimation process and the significant volatility in demand for new housing, actual results could differ significantly from such estimates. During the year ended December 31, 2017, the Company did not identify indicators of impairment for its investment in unconsolidated entity.
The Company has made an election to classify distributions received from the unconsolidated entity using the nature of the distribution approach. Distributions received are classified based on the nature of the activities of the investee that generated the distribution. All such distributions for the period ended December 31, 2017 are cash inflows from operating activities.
Variable Interest Entities and Noncontrolling Interests
The Company accounts for VIEs in accordance with ASC 810. In accordance with ASC 810, an entity is a VIE when: (a) the equity investment at risk in the entity is not sufficient to permit the entity to finance its activities without additional subordinated financial support provided by other parties, including the equity holders; (b) the entity’s equity holders as a group either (i) lack the direct or indirect ability to make decisions about the entity, (ii) are not obligated to absorb expected losses of the entity or (iii) do not have the right to receive expected residual returns of the entity; or (c) the entity’s equity holders have
94
voting rights that are not proportionate to their economic interests, and the activities of the entity involve or are conducted on behalf of the equity holder with disproportionately few voting rights. If an entity is deemed to be a VIE pursuant to ASC 810, the enterprise that has both (i) the power to direct the activities of the VIE that most significantly impacts the entity’s economic performance and (ii) the obligation to absorb the expected losses of the entity or right to receive benefits from the entity that could be potentially significant to the VIE is considered the primary beneficiary and must consolidate the VIE. In accordance with ASC 810, the Company performs ongoing reassessments of whether it is the primary beneficiary of a VIE.
The Company owns 50% equity interests in several controlled builders deemed to be VIEs under ASC 810 for which the Company is considered the primary beneficiary. Our controlled builders are engaged in all aspects of the homebuilding process in residential neighborhoods and master planned communities in premium locations in the Dallas and Atlanta markets. We sell finished lots or option lots from third-party developers to our controlled builders for their homebuilding operations and provide them with construction financing and strategic planning. The board of managers of each of the controlled builders has the power to direct the activities that significantly impact the controlled builder’s economic performance. Pursuant to the Company’s agreements with each controlled builder, it has the ability to appoint two of the three members of the board of managers of each controlled builder’s board of managers. A majority of the board of managers constitutes a quorum to transact business. No action can be approved by the board of managers without the approval from at least one individual whom the Company has appointed at each controlled builder. The Company has the ability to control the activities of each controlled builder that most significantly impact the controlled builder’s economic performance. Such activities include, but are not limited to, involvement in the day to day capital and operating decisions, the ability to determine the budget and plan, the ability to control financing decisions, and the ability to acquire additional land or dispose of land. In addition, the Company has the right to receive the expected residual returns and obligation to absorb the expected losses of each controlled builder through the pro rata profits and losses we are allocated based on our ownership interest. Therefore, the financial statements of the controlled builders are consolidated in the Company’s consolidated financial statements following the variable interest model. The noncontrolling interests attributable to the 50% minority interests owned by our controlled builders are included as noncontrolling interests in the Company’s consolidated financial statements.
Our controlled builders’ creditors have no recourse against us. The assets of two of our consolidated controlled builders can only be used to settle obligations of those controlled builders. The assets of our VIEs that can be used only to settle obligations of the VIEs as of December 31, 2017 totaled $52.2 million, of which $0.9 million was cash and $47.8 million was inventory. The assets of our VIEs that could be used only to settle obligations of the VIEs as of December 31, 2016 totaled $24.6 million, of which $0.9 million was cash and $22.1 million was inventory.
Capitalization of Interest
The Company capitalizes interest costs incurred to inventory during active development and other qualifying activities. Interest capitalized as cost of inventory is charged to cost of sales as related homes, land and/or lots are closed. Interest incurred on undeveloped land is directly expensed and included in interest expense in our consolidated statements of income.
Interest costs incurred, capitalized and expensed were as follows (in thousands):
2017 | 2016 | 2015 | |||||||||
Interest capitalized at beginning of year | $ | 9,417 | $ | 9,085 | $ | 3,713 | |||||
Interest incurred | 4,456 | 3,218 | 9,625 | ||||||||
Interest charged to cost of sales | (3,399 | ) | (2,886 | ) | (3,972 | ) | |||||
Interest charged to interest expense | — | — | (281 | ) | |||||||
Interest capitalized at end of year | $ | 10,474 | $ | 9,417 | $ | 9,085 | |||||
Earnest Money Deposits
In the ordinary course of business, the Company enters into land and lot option contracts in order to procure land for the construction of homes in the future. Pursuant to these option contracts, the Company generally provides a deposit to the seller as consideration for the right to purchase land at different times in the future, usually at predetermined prices. Such contracts enable the Company to defer acquiring portions of properties owned by third parties or unconsolidated entities until the Company has determined whether and when to exercise its option, which reduces the Company’s financial risk associated with long-term land holdings. Option deposits and pre-acquisition costs (such as environmental testing, surveys, engineering, and entitlement costs) are capitalized if the costs are directly identifiable with the land under option and acquisition of the property is probable. Such costs are reflected in earnest money deposits and are reclassified to inventory upon taking title to the land. The Company writes off deposits and pre-acquisition costs if it becomes probable that the Company will not go forward with the project or recover the capitalized costs. Such decisions take into consideration changes in local market conditions, the
95
timing of required land takedowns, the availability and best use of necessary incremental capital, and other factors. As of December 31, 2017, the Company had land option contracts with potential purchase payments through 2021. Deposits and pre-acquisition costs written off related to option contracts we abandoned totaled $0.2 million, $0.2 million and $0.2 million for the years ended December 31, 2017, 2016 and 2015, respectively.
Under ASC 810, a non-refundable deposit paid to an entity is deemed to be a variable interest that will absorb some or all of the entity’s expected losses if they occur and, as such, the Company’s land and lot option contracts are considered variable interests. The Company’s option contract deposits along with any related pre-acquisition costs represent the Company’s maximum exposure to the land seller if the Company elects not to purchase the optioned property. Therefore, whenever the Company enters into an option or purchase contract with an entity and makes a non-refundable deposit, a VIE assessment is performed. However, the Company generally has little control or power to direct the activities that most significantly impact the VIE’s economic performance due to the Company’s lack of an equity interest in them. Additionally, creditors of the VIE typically have no material recourse against the Company, and the Company does not provide financial or other support to these VIEs other than as stipulated in the option contracts. In accordance with ASC 810, the Company performs ongoing reassessments of whether the Company is the primary beneficiary of a VIE. The Company was not required to consolidate any land or lot option VIEs as of December 31, 2017 or 2016.
Sales with Option to Repurchase
The Company sold land and then entered into land option contracts to repurchase the land from the buyers. In accordance with ASC 360, Property, Plant, and Equipment, these transactions are considered a financing arrangement rather than a sale. As a result, the Company recorded $9.3 million as of December 31, 2016 as land not owned under option contracts with a corresponding liability reflected as obligations related to land not owned under option contracts on the consolidated balance sheets. We purchased all of the lots under the option contracts during 2017.
Investment in Direct Financing Leases
Through December 31, 2014, the Company entered into a series of direct finance leases for a portfolio of model homes. The Company leased these model homes to the entity from which it acquired the homes. The lessee had the option to repurchase the model homes at a predetermined price. The direct financing leases bore interest at rates from 10% to 12%. The lease payments were recorded as interest income on direct financing leases in the consolidated statements of income. All direct financing leases were sold in 2015.
Property and Equipment, Net
Property and equipment are stated at cost less accumulated depreciation. Repairs and maintenance are expensed as incurred. Depreciation is computed over the estimated useful lives of the assets using the straight-line method. The estimated useful lives of assets range from three to ten years.
Customer and Builder Deposits
The Company typically requires customers to submit a deposit for home purchases and for builders to submit a deposit in connection with their construction loan agreements. The deposits serve as a guarantee to performance under home purchase and building contracts. Cash received as customer deposits, if held in escrow, is shown as restricted cash on the consolidated balance sheets.
Warranties
The Company accrues an estimate of its exposure to warranty claims based on both current and historical home sales data and warranty costs incurred. The Company offers homeowners a comprehensive third-party warranty on each home. Homes are generally covered by a ten-year warranty for qualified and defined structural defects, one year for defects and products used, and two years for electrical, plumbing and HVAC parts and labor. Warranty accruals are included within accrued expenses on the consolidated balance sheets.
Net Income Attributable to Green Brick Partners, Inc. per Share
The Company’s restricted stock awards have the right to receive forfeitable dividends on an equal basis with common stock and therefore are not considered participating securities that must be included in the calculation of net income per share using the two-class method. Basic earnings per share is computed by dividing net income by the weighted average number of common shares outstanding during each period, adjusted for non-vested shares of restricted stock awards during each period.
96
Diluted earnings per share is calculated using the treasury stock method and includes the effect of all dilutive securities, including stock options and restricted stock awards.
The computation of basic and diluted net income attributable to Green Brick Partners, Inc. per share using the treasury stock method is as follows (in thousands, except per share amounts):
Years End December 31, | |||||||||||
2017 | 2016 | 2015 | |||||||||
Net income attributable to Green Brick Partners, Inc. per share | |||||||||||
Net income attributable to Green Brick Partners, Inc. | $ | 14,970 | $ | 23,756 | $ | 15,325 | |||||
Weighted average number of shares outstanding —basic | 49,597 | 48,879 | 40,068 | ||||||||
Basic net income attributable to Green Brick Partners, Inc. per share | $ | 0.30 | $ | 0.49 | $ | 0.38 | |||||
Weighted average number of shares outstanding —basic | 49,597 | 48,879 | 40,068 | ||||||||
Dilutive effect of stock options and restricted stock awards | 86 | 7 | 30 | ||||||||
Weighted average number of shares outstanding —diluted | 49,683 | 48,886 | 40,099 | ||||||||
Diluted net income attributable to Green Brick Partners, Inc. per share | $ | 0.30 | $ | 0.49 | $ | 0.38 | |||||
The following securities that could potentially dilute earnings per share in the future are not included in the determination of diluted net income attributable to Green Brick Partners, Inc. per common share (in thousands):
Years End December 31, | ||||||||
2017 | 2016 | 2015 | ||||||
Antidilutive options to purchase common stock | — | 144 | 62 | |||||
Revenue Recognition
In accordance with ASC 360-20, Real Estate Sales, the Company recognizes revenue from sales of residential units, land and lots when a sale is consummated. Consummation occurs when the following criteria are met: (a) the parties are bound by the terms of the contract; (b) all net consideration has been exchanged; (c) any permanent financing for which the seller is responsible has been arranged; (d) continuing investment is adequate to demonstrate a commitment to pay for the home, land or lot; and (e) all conditions precedent to closing have been performed. Typically, these criteria are met at closing, at which time the Company recognizes revenue under the full accrual method, which allows full recognition of the gain on the sale of the home, land or lot.
The Company recognizes sales incentives, such as cash discounts and incentives on options and option upgrades as a reduction of sales revenue at the time the home is closed and revenue is recognized. The Company records seller-paid financing and other closing costs within cost of sales of residential units at the time the home is closed and revenue is recognized. From time to time, the Company receives vendor rebates for certain materials that are utilized in the construction of homes. In accordance with ASC 605-50, Customer Payments and Incentives, the Company recognizes these rebates as a reduction of cost of sales of residential units at the later of (a) the home closing (when revenue is recognized), or (b) when such amounts are reasonably estimable.
The Company also serves as the general contractor for certain custom homes where the customers, and not the Company, own the underlying land and improvements. The Company recognizes revenue for these mechanics lien contracts on the percentage of completion method, where progress toward completion is measured by relating the actual cost of work performed to date to the current estimated total cost of the respective contracts. During the years ended December 31, 2017, 2016 and 2015, we recognized revenue of $4.4 million, $12.5 million and $7.7 million, respectively, and incurred costs of $3.8 million, $11.1 million and $5.9 million, respectively, associated with mechanics lien contracts, which is presented net in other income, net on the consolidated statements of income.
97
Cost Recognition
Lot acquisition, materials, direct costs, interest and indirect costs related to the acquisition, development, and construction of lots and homes are capitalized. Direct and indirect costs of developing residential lots are allocated evenly to all applicable lots. Capitalized costs of residential lots are charged to earnings when the related revenue is recognized. Non-capitalizable costs in connection with developed lots and completed homes and other selling and administrative costs are charged to earnings when incurred.
Advertising Expense
The Company expenses advertising as incurred. Advertising costs are included in selling, general and administrative expense in the consolidated statements of income. Advertising expense for the years ended December 31, 2017, 2016 and 2015 totaled $0.8 million, $0.7 million and $0.5 million, respectively.
Debt Issuance Costs
Debt issuance costs of $1.2 million and $0.8 million as of December 31, 2017 and December 31, 2016, represent costs incurred related to the revolving and unsecured credit facilities, including amendments thereto, and are included as part of other assets, net on the consolidated balance sheets. These costs are amortized straight-line and included in interest expense over the term of the related debt facility.
Share-Based Compensation
The Company measures and accounts for share-based awards in accordance with ASC 718, Compensation - Stock Compensation. The Company expenses share-based payment awards made to employees and directors, including stock options and restricted stock awards. Share-based compensation expense associated with stock options and restricted stock awards with vesting contingent upon the achievement of service conditions is recognized on a straight-line basis, net of estimated forfeitures, over the requisite service period over which the awards are expected to vest. The Company estimates the value of stock options with vesting contingent upon the achievement of service conditions as of the date the award was granted using the Black-Scholes option pricing model. The Black-Scholes option pricing model requires the use of certain input variables, such as expected volatility, risk-free interest rate and expected award life.
Income Taxes
The Company accounts for income taxes using the asset and liability method, under which deferred tax assets and liabilities are recognized for the future tax consequences attributable to temporary differences between financial statement carrying amounts of existing assets and liabilities and their respective tax bases, operating losses and tax credit carryforwards. Deferred tax assets and liabilities are measured using enacted tax rates expected to apply to taxable income in years in which temporary differences are expected to be recovered or settled. The effect on deferred tax assets and liabilities of a change in tax rates is recognized in income in the period that includes the enactment date. The Company regularly reviews historical and anticipated future pre-tax results of operations to determine whether we will be able to realize the benefit of deferred tax assets. A valuation allowance is required to reduce the deferred tax asset when it is more-likely-than-not that all or some portion of the deferred tax asset will not be realized due to the lack of sufficient taxable income.
The Company establishes reserves for uncertain tax positions that reflect its best estimate of deductions and credits that may not be sustained on a more-likely-than-not basis. The Company recognizes interest and penalties related to uncertain tax positions in income tax provision on the consolidated statements of income. Accrued interest and penalties are included in the related tax liability account within accrued expenses on the consolidated balance sheets.
As of December 31, 2017, we had deferred tax assets of $31.2 million, which was net of a valuation allowance in the amount of $1.3 million relating to Minnesota and Nebraska state net operating loss carryforwards. The deferred tax assets primarily consist of $14.1 million for federal net operating loss carryforwards and $13.4 million for basis in partnerships. For accounting purposes, a valuation allowance is required to reduce a deferred tax asset if it is determined that it is more-likely-than-not that all or some portion of the deferred tax asset will not be realized due to the lack of sufficient taxable income or other limitation on the Company’s ability to utilize the loss carryforward. Prior to the Transaction, BioFuel had recorded a valuation allowance against the full value of the deferred tax assets related to federal and state net operating losses due to a history of operating losses. The valuation allowance attributable to deferred tax assets other than the state loss carryforwards recorded by BioFuel prior to the Transaction Date was reversed through equity on the Transaction Date.
The net operating loss carryforwards will begin to expire beginning with the year ending December 31, 2029. The Company’s ability to utilize its net operating loss carryforwards will depend on the amount of taxable income that the Company
98
generates in future periods. Based on our 2017, 2016, and 2015 taxable income results and forecast projections of taxable income, Company management expects that the Company should generate sufficient taxable income to utilize substantially all of the net operating loss carryforwards before they expire. The Company will continue to evaluate the appropriateness of a valuation allowance in future periods based on the consideration of all available evidence, including the generation of taxable income, using the more-likely-than-not standard.
On December 22, 2017, the U.S. government enacted comprehensive tax legislation commonly referred to as the Tax Cuts and Jobs Act (the “Tax Act”). The Tax Act, among other things, reduces the U.S. federal corporate tax rate from 35% to 21% effective January 1, 2018 and imposes significant limitations on certain corporate deductions and credits. The Tax Act places future limitations on the usage of net operating loss carryforwards generated in the year ended December 31, 2018 and after. The Tax Act is comprehensive containing several other provisions, some of which will not materially impact the Company. The estimates of the Tax Act may be adjusted in future periods as required. Future implementation guidance from the Internal Revenue Service, clarifications of state tax law or the completion of the Company’s 2017 tax return filings could all affect the estimated financial statement impact of the Tax Act. The SEC staff issued Staff Accounting Bulletin 118 that allows for a measurement period of up to one year after the enactment date of the Tax Act to finalize the recording of the related tax impacts. The Company does not believe potential adjustments in future periods would materially impact the Company’s financial condition or results of operations. The Company remeasured its deferred tax assets due to the change in federal statutory tax rate which resulted in additional tax expense of $19.0 million.
Fair Value Measurements
The Company has adopted and implemented the provisions of ASC 820-10, Fair Value Measurements, with respect to fair value measurements of: (a) all elected financial assets and liabilities; and (b) any nonfinancial assets and liabilities that are recognized or disclosed in the consolidated financial statements at fair value on a recurring basis (at least annually). Under ASC 820-10, fair value is defined as an exit price, or the amount that would be received to sell an asset or paid to transfer a liability in an orderly transaction between market participants as of the measurement date. These provisions establish a three-tiered fair value hierarchy that prioritizes inputs to valuation techniques used in fair value calculations. The three levels of input are defined as follows:
Level 1 — | unadjusted quoted prices for identical assets or liabilities in active markets accessible by the Company; |
Level 2 — | inputs that are observable in the marketplace other than those classified as Level 1; and |
Level 3 — | inputs that are unobservable in the marketplace and significant to the valuation. |
Entities are encouraged to maximize the use of observable inputs and minimize the use of unobservable inputs. If a financial instrument uses inputs that fall in different levels of the hierarchy, the instrument will be categorized based upon the lowest level of input that is significant to the fair value calculation.
Our valuation methods may produce a fair value calculation that may not be indicative of net realizable value or reflective of future fair values. Furthermore, while we believe our valuation methods are appropriate and consistent with other market participants, the use of different methodologies or assumptions to determine the fair value of certain financial instruments could result in a different fair value measurement at the reporting date.
Segment Information
Prior to the fourth quarter of 2016, the Company’s operations were organized into two reportable segments: builder operations and land development. Builder operations consisted of two operating segments: Texas and Georgia. In accordance with ASC 280, Segment Reporting (“ASC 280”), in determining the most appropriate reportable segments, we considered similar economic and other characteristics, including geography, product types, production processes, average selling prices, gross profits, suppliers, land acquisition results, and underlying demand and supply.
In accordance with ASC 280, an operating segment is defined as a component of an enterprise for which discrete financial information is available and is reviewed regularly by the Chief Operating Decision Maker (“CODM”), or decision-making group, to evaluate performance and make operating decisions. Prior to 2016, the Company identified its CODM as four key executives—the Chief Executive Officer, Chief Financial Officer, Chief Operating Officer and President of Texas Region (formerly, Head of Land Acquisition and Development). As a result of the departure of the Chief Operating Officer, the management structure and CODM changed during 2016. During the fourth quarter of 2016, the Company re-evaluated its reportable segments under ASC 280.
99
Beginning in the fourth quarter of 2016, the Company identified its CODM as three key executives—the Chief Executive Officer, Chief Financial Officer and President of Texas Region. In determining the most appropriate reportable segments, the CODM considers similar economic and other characteristics, including geography, class of customers, product types and production processes. The discrete financial information that is regularly reviewed by the current CODM group is different than in the past. As such, the builder operations reportable segment has consisted of three operating segments since the fourth quarter of 2016: Texas, Georgia, and corporate and other. The operations of the Company’s controlled builders were aggregated into the Texas and Georgia operating segments based on similar (1) economic characteristics; (2) housing products; (3) class of homebuyer; (4) regulatory environments; and (5) methods used to construct and sell homes.
Corporate operations is a non-operating segment that develops and implements strategic initiatives and supports the Company’s builder operations and land development segments by centralizing certain administrative functions such as finance, treasury, information technology and human resources. The majority of corporate personnel and resources are primarily dedicated to activities relating to the builder operations segment. Therefore, any unallocated corporate expenses are included in the corporate and other operating segment, within the builder operations segment which accounts for 95.9%, 96.1% and 87.3% of total revenues, for the years ended December 31, 2017, 2016 and 2015, respectively.
The Company uses the equity method of accounting for its investment in an unconsolidated entity (Challenger Subsidiary, as defined in Note 3) over which it exercises significant influence but does not have a controlling interest. The Challenger Subsidiary constructs townhouses, single family homes and luxury patio homes, and is headquartered in Colorado Springs, Colorado. While the operations of the Challenger Subsidiary meet the criteria for an operating segment within the builder operations segment, such operations did not meet the quantitative thresholds, as discussed in ASC 280, to be separately reported and disclosed. As such, Challenger Subsidiary’s results are included within the corporate and other operating segment, within the builder operations segment.
While the operations of Green Brick Title are not economically similar to either builder operations or land development, the results of such operations did not meet the quantitative thresholds to be separately reported and disclosed. As such, Green Brick Title’s results are included within the builder operations segment within the corporate and other operating segment.
All 2015 segment information has been restated to conform with the 2016 and 2017 presentation. The changes in the reportable segments have no effect on the consolidated balance sheets, statements of income or cash flows for the periods presented.
Out-of-Period Adjustment
During the fourth quarter ended December 31, 2015, the Company recorded an out-of-period adjustment associated with a $1.9 million overaccrual of distributions payable recorded during the fourth quarter ended December 31, 2014. As a result, as of December 31, 2014, accrued expenses was overstated and retained earnings were understated by $1.9 million. After evaluating the quantitative and qualitative aspects of the out-of-period adjustment, management has determined that the adjustment is not material to the current year or any prior period financial statements.
Change in Classification
During the fourth quarter ended December 31, 2016, management determined that certain indirect project costs related to field superintendents’ salaries and benefits, and field expenses, such as field truck, phone and travel expenses, previously classified as salary expense and selling, general and administrative expense should be classified as cost of residential units to properly present cost of residential units, salary expense, and selling, general and administrative expense. We determined that the change in classification is not material to any prior period financial statements. Accordingly, we changed the classification of salary expense of $4.4 million, and selling, general and administrative expense of $0.8 million for the year ended December 31, 2015, to cost of residential units. There was no impact to net income during the prior periods as a result of the change in classification.
Recent Accounting Pronouncements
In May 2014, FASB issued Accounting Standards Update (“ASU”) 2014-09, Revenue from Contracts with Customers, which requires an entity to recognize the amount of revenue to which it expects to be entitled for the transfer of promised goods or services to customers. The standard will replace most existing revenue recognition guidance in GAAP when it becomes effective. In August 2015, FASB issued ASU 2015-14, Revenue from Contracts with Customers (Topic 606): Deferral of the Effective Date, which delayed the effective date of ASU 2014-09 by one year. Subsequent to the issuance of ASU 2014-09, FASB issued several amendments in 2016 to the original standard including ASU 2016-08, Revenue from Contracts with Customers (Topic 606): Principal versus Agent Considerations (Reporting Revenue Gross versus Net), ASU 2016-10, Revenue
100
from Contracts with Customers (Topic 606): Identifying Performance Obligations and Licensing and ASU 2016-12, Revenue from Contracts with Customers (Topic 606): Narrow Scope Improvements and Practical Expedients. These amendments do not change the core principle of the guidance stated in ASU 2014-09. Rather, they are intended to clarify and improve understanding of certain topics included in ASU 2014-09. The Company has evaluated how the adoption of ASU 2014-09 will impact our current revenue recognition policies by applying the five-step approach to each revenue stream (builder operations and land development). No material changes resulting from this pending adoption were identified. As a result, we expect the timing of our revenue recognition to remain substantially unchanged. The Company expects its revenue recognition disclosures to significantly expand under the new standard, specifically related to the quantitative and qualitative information about performance obligations, information about contract balances, changes in contract assets and liabilities and disaggregation of revenue.
The adoption of ASU 2014-09 will not require significant changes to the Company’s internal controls and procedures over financial reporting and disclosures. However, we will make enhancements to existing internal controls and procedures to ensure compliance with the new standard. ASU 2014-09 and the related amendments are effective for the Company beginning on January 1, 2018. The Company will adopt the standard using the modified retrospective approach, under which the cumulative effect of the initial application of the new standard will be recognized as an adjustment to the opening balance of retained earnings in the first quarter of 2018. The cumulative effect of the initial application of the new standard is not expected to have a material effect on the Company’s consolidated financial statements.
In November 2015, FASB issued ASU 2015-17, Income Taxes (Topic 740): Balance Sheet Classification of Deferred Taxes, as part of its simplification initiative. The standard amends the existing guidance to require that deferred income tax liabilities and assets be classified as noncurrent in a classified balance sheet, and eliminates the prior guidance which required an entity to separate deferred tax liabilities and assets into a current amount and a noncurrent amount in a classified balance sheet. The standard was effective for the Company beginning on January 1, 2017. The adoption of this standard did not have a material effect on the Company’s consolidated financial statements and related disclosures.
In February 2016, FASB issued ASU 2016-02, Leases, which requires an entity that leases assets to classify the leases as either finance or operating leases and to record assets and liabilities for the rights and obligations created by long-term leases, regardless of the lease classification. The lease classification will determine whether the lease expense is recognized based on an effective interest rate method or on a straight-line basis over the term of the lease. This standard is effective for the Company beginning on January 1, 2019 and must be adopted using a modified retrospective approach. The Company does not expect that the adoption of this standard will have a material effect on its consolidated financial statements and related disclosures.
In March 2016, FASB issued ASU 2016-09, Compensation - Stock Compensation (Topic 718): Improvements to Employee Share-Based Payment Accounting, which simplifies several aspects related to the accounting for share-based payment transactions, including the accounting for income taxes, statutory tax withholding requirements and classification on the statement of cash flows. This standard was effective for the Company beginning on January 1, 2017. The adoption of this standard did not have a material effect on the Company’s consolidated financial statements and related disclosures.
In August 2016, FASB issued ASU 2016-15, Statement of Cash Flows (Topic 230): Classification of Certain Cash Receipts and Cash Payments, which reduces the existing diversity in practice in financial reporting across all industries by clarifying certain existing principles in ASC 230, Statement of Cash Flows, including providing additional guidance on how and what an entity should consider in determining the classification of certain cash receipts and cash payments. This standard is effective for the Company beginning on January 1, 2018. The Company does not expect that the adoption of this standard will have a material effect on its consolidated financial statements and related disclosures.
In November 2016, FASB issued ASU 2016-18, Statement of Cash Flows (Topic 230): Restricted Cash (a consensus of the FASB Emerging Issues Task Force), which requires restricted cash to be included with cash and cash equivalents when reconciling the beginning and ending amounts on the statement of cash flows. This standard is effective for the Company beginning January 1, 2018, and is to be applied using a retrospective transition method. The Company elected to early adopt this standard during January 2017, and the standard was applied retrospectively for all periods presented. As a result of the adoption of this standard, the Company no longer presents the change in restricted cash in the operating activities section of the consolidated statement of cash flows. Prior period amounts have been reclassified to conform to the current period presentation. Such reclassifications had no impact on previously reported operating results or financial position.
In January 2017, FASB issued ASU 2017-01, Business Combinations (Topic 805): Clarifying the Definition of a Business. The standard provides a more robust framework for determining whether transactions should be accounted for as acquisitions or dispositions of assets or businesses. This standard is effective for the Company beginning on January 1, 2018. Early adoption is
101
permitted for transactions which occurred before the issuance date or effective date of the standard if the transactions were not reported in financial statements that have been issued or made available for issuance. The Company does not expect that the adoption of this standard will have a material effect on its consolidated financial statements and related disclosures. Once adopted, the Company will analyze any future acquisitions to determine whether the transaction qualifies as a purchase of a business or an asset.
In May 2017, FASB issued ASU 2017-09, Compensation—Stock Compensation (Topic 718): Scope of Modification Accounting, which amends the scope of modification accounting for share-based payment arrangements. The standard provides guidance on the types of changes to the terms or conditions of share-based payment awards to which an entity would be required to apply modification accounting under ASC 718, Compensation—Stock Compensation. Specifically, an entity would not apply modification accounting if the fair value, vesting conditions, and classification of the awards are the same immediately before and after the modification. This standard is effective for the Company beginning on January 1, 2018. The Company does not expect that the adoption of this standard will have a material effect on its consolidated financial statements and related disclosures.
3. INVESTMENT IN UNCONSOLIDATED ENTITY
On August 15, 2017, the Company, JBGL Ownership LLC, a Delaware limited liability company and a wholly owned subsidiary of the Company (“JBGL”), and GB Challenger, LLC, a newly formed Texas limited liability company (the “Challenger Subsidiary”) entered into a Membership Interest Purchase and Contribution Agreement (the “Challenger Agreement”) with The Challenger Group, Inc., a Wyoming corporation (“TCGI”), TCG Holdings, LLC, a Wyoming limited liability company (“TCG”), GTG Holdings, LLC, a Wyoming limited liability company (“GTG” and together with TCGI and TCG, the “Challenger Entities”) and Brian R. Bahr (“Bahr”), resulting in the Company, through its interest in JBGL, and the Challenger Entities owning a 49.9% and 50.1% ownership interest, respectively, in the Challenger Subsidiary, and the Challenger Subsidiary owning all of the membership and ownership interests in the subsidiaries of the Challenger Entities named in the Challenger Agreement (“Challenger Homebuilder Subsidiaries”). As consideration for such interests, the Company agreed to issue to the Challenger Entities, or their designees, 1,497,000 shares of its common stock, par value $0.01 per share, in a private placement, with 20,000 shares of its common stock held back pending satisfactory resolution of indemnification claims (“Holdback Shares”). The Company expects to issue the Holdback Shares during the second quarter of 2018; therefore, $0.2 million has been recorded in additional paid-in capital on the consolidated balance sheet as of December 31, 2017. The Challenger Entities, at their discretion, may offer to sell and transfer an additional 20.1% or, in certain circumstances, all of the Challenger Entities’ interest in the Challenger Subsidiary (“Additional Membership Interests”) to the Company on or after the third anniversary of the Challenger Agreement. The Company is not required to purchase the Additional Membership Interests. The Company incurred approximately $0.3 million in related acquisition costs which are included in the cost basis of investment in unconsolidated entity.
The Challenger Entities operate homebuilding operations under the name Challenger Homes. Challenger Homes constructs townhouses, single family homes and luxury patio homes, and is headquartered in Colorado Springs, Colorado. The Company partnered with Challenger Homes in order to expand its business with partners who are complementary to its current builder partner group and to gain a presence in the Colorado Springs market.
As a result of the investment in the Challenger Subsidiary on August 15, 2017, the Company issued 1,477,000 unregistered shares of its common stock, par value $0.01 per share (excluding 20,000 Holdback Shares). The issuance of the common stock by the Company was exempt from registration pursuant to Section 4(a)(2) of the Securities Act of 1933, as amended, and the safe harbor provided by Rule 506 promulgated thereunder. The Company relied, in part, upon representations from each of the individuals that they are “accredited investors” as such term is defined in Rule 501 of Regulation D.
102
The Company’s investment in the Challenger Subsidiary at August 15, 2017 of $15.1 million was more than its share of the estimated underlying net assets of the Challenger Subsidiary, resulting in a preliminary difference in basis of approximately $5.1 million, which was attributed to goodwill. The goodwill is reviewed for impairment as part of the investment in unconsolidated entity. The Company’s investment in the Challenger Subsidiary on August 15, 2017 was determined as follows (in thousands, except per share data):
Consideration transferred at closing | |||
Green Brick common stock issued | 1,477 | ||
Price per share of Green Brick common stock(1) | $ | 9.90 | |
Fair value of common stock consideration | $ | 14,622 | |
Acquisition related costs | $ | 241 | |
Total fair value of consideration transferred at closing | $ | 14,863 | |
Potential future consideration | |||
Holdback Shares | 20 | ||
Price per share of Green Brick common stock(1) | $ | 9.90 | |
Total fair value of potential future consideration | $ | 198 | |
Total fair value of consideration | $ | 15,061 | |
(1) | Based upon closing price of the Company’s common stock upon the parties’ execution of the Challenger Agreement. |
The Challenger Entities and the Company will direct the operations of the Challenger Homebuilder Subsidiaries through the Challenger Subsidiary, with the Company as the minority stakeholder. The Company holds two of the five board of managers (the “Managers”) seats of the Challenger Subsidiary. The Challenger Subsidiary’s six officers, employees of the Challenger Entities, were designated by the Managers for the purpose of managing the day to day operations. The Company does not have a controlling financial interest in the Challenger Subsidiary as the Company has less than 50% of the voting interests in the Challenger Subsidiary. The Company’s investment in the Challenger Subsidiary is treated as an unconsolidated investment under the equity method of accounting, carried at cost, as adjusted for the Company’s share of income or losses and reduced for distributions received, and included in investment in unconsolidated entity in the Company’s consolidated balance sheets. The net carrying value of the Company’s investment in the Challenger Subsidiary was $16.9 million as of 2017. For the year ended December 31, 2017, there were no impairments related to our investment in this unconsolidated entity. The Company recognized $2.7 million in equity in income of unconsolidated entity from the date of the acquisition through December 31, 2017.
103
A summary of the condensed financial information of the unconsolidated entity that is accounted for under the equity method is as follows (in thousands):
December 31, 2017 | |||
Cash | $ | 3,981 | |
Accounts receivable | 1,494 | ||
Inventory | 57,841 | ||
Goodwill | 4,615 | ||
Noncompete intangible asset | 202 | ||
Other assets | 5,098 | ||
Total assets | $ | 73,231 | |
Accounts payable | $ | 5,060 | |
Accrued expenses and other liabilities | 2,857 | ||
Notes payable | 36,923 | ||
Equity | 28,391 | ||
Total liabilities and equity | $ | 73,231 | |
For the Five Months Ended December 31, 2017 | |||
Revenues | $ | 58,958 | |
Gross profit | $ | 13,989 | |
Income before taxes | $ | 5,502 | |
4. STOCKHOLDERS’ EQUITY
Common Stock
Pursuant to the Company’s amended and restated certificate of incorporation (“Certificate of Incorporation”), the Company is authorized to issue up to 100,000,000 shares of common stock, par value $0.01 per share. As of December 31, 2017, there were 50,598,901 shares of common stock issued and outstanding.
Preferred Stock
Pursuant to the Company’s Certificate of Incorporation, the Company is authorized to issue up to 5,000,000 shares of preferred stock, par value $0.01 per share. The Board of Directors (“BODs”) has the authority, subject to any limitations imposed by law or NASDAQ rules, without further action by the stockholders, to issue such preferred stock in one or more series and to fix the voting powers (if any), the preferences and relative, participating, optional or other special rights or privileges, if any, of such series and the qualifications, limitations or restrictions thereof. These rights, preferences and privileges may include, but are not limited to, dividend rights, conversion rights, voting rights, terms of redemption, liquidation preferences, sinking fund terms and the number of shares constituting any series or the designation of that series. As of December 31, 2017, there were no shares of preferred stock issued and outstanding.
Share Repurchase Program
In March 2016, the Company’s BODs authorized a share repurchase program of up to 1,000,000 shares of its common stock through 2017. The share repurchase program expired in 2017. No shares were repurchased during the years ended December 31, 2017 and 2016.
Section 382 Transfer Restrictions
If we were to experience an ownership change, Section 382 of the Internal Revenue Code imposes an annual limitation which could impact the utilization of our net operating loss carryforwards. To reduce the likelihood of such an ownership change, our BODs implemented certain transfer restrictions, including Article V of the Company’s Certificate of Incorporation, and a Section 382 rights agreement regarding preservation of our net operating loss carryforwards. On March 27, 2014, the BODs declared a dividend of one preferred share purchase right, with respect to each outstanding share of common stock of the
104
Company, to purchase from the Company one one-thousandth of a share of Series B Junior Participating Preferred Stock, par value $0.01 per share, of the Company at a price of $30.00 per one one-thousandth of a share of preferred stock, subject to adjustment as provided in the Section 382 rights agreement. The dividend was payable to stockholders of record at the close of business on April 7, 2014. As of December 31, 2017, the rights agreement has not been triggered.
5. PROPERTY AND EQUIPMENT
The following is a summary of property and equipment and related accumulated depreciation by major classification as of December 31, 2017 and 2016 (in thousands):
December 31, 2017 | December 31, 2016 | ||||||
Office furniture and equipment | $ | 399 | $ | 333 | |||
Leasehold improvements | 271 | 166 | |||||
Computers and equipment | 903 | 836 | |||||
Field trailers | 10 | 10 | |||||
Design center | 470 | 470 | |||||
2,053 | 1,815 | ||||||
Less: accumulated depreciation | (1,249 | ) | (923 | ) | |||
Total property and equipment, net | $ | 804 | $ | 892 | |||
Depreciation expense for the years ended December 31, 2017, 2016 and 2015 totaled $0.3 million, $0.3 million, and $0.3 million, respectively, and is included in selling, general and administrative expense in our consolidated statements of income.
6. DEBT
Lines of Credit
Lines of credit outstanding as of December 31, 2017 and 2016 consist of the following (in thousands):
December 31, 2017 | December 31, 2016 | ||||||
Revolving credit facility(1) | $ | 32,000 | $ | 15,000 | |||
Unsecured revolving credit facility(2) | 75,000 | 60,000 | |||||
Total lines of credit | $ | 107,000 | $ | 75,000 | |||
(1) | On July 30, 2015, the Company entered into a revolving credit facility (the “Credit Facility”) with Inwood National Bank, which initially provided for up to $50.0 million. Amounts outstanding under the Credit Facility are secured by mortgages on real property and security interests in certain personal property (to the extent that such personal property is connected with the use and enjoyment of the real property) that is owned by certain of the Company’s subsidiaries. Outstanding borrowings under the Credit Facility bear interest payable monthly at a floating rate per annum equal to the rate announced by Bank of America, N.A., from time to time, as its “Prime Rate” (the “Index”) with such adjustments to the interest rate being made on the effective date of any change in the Index. Notwithstanding the foregoing, the interest may not, at any time, be less than 4% per annum or more than the lesser amount of 18% and the highest maximum rate allowed by applicable law. The entire unpaid principal balance and any accrued but unpaid interest is due and payable on the maturity date. As of December 31, 2017, the interest rate on outstanding borrowings under the Credit Facility was 4.5% per annum. |
On May 3, 2016, the Company amended the Credit Facility. The amended Credit Facility is subject to a borrowing base limitation equal to the sum of 50% of the total value of land and 65% of the total value of lots owned by certain of the Company’s subsidiaries, each as determined by an independent appraiser, with the value of land being restricted from being more than 65% of the borrowing base. Beginning on August 1, 2017, a non-usage fee equal to 0.25% of the average unfunded amount of the commitment amount over a trailing 12 month period is due on or before August 1st of each year during the term of the amended Credit Facility. The maturity date was extended to May 1, 2019. The costs of $0.1 million associated with the amendment were deferred and are included in other assets, net in our consolidated balance sheets. The Company is amortizing these debt issuance costs to interest expense over the term of the Credit Facility using the straight-line method.
During the year ended December 31, 2017, the Company amended the Credit Facility several times for the purpose of adding additional land holdings as collateral to the Credit Facility agreement. On October 27, 2017, the Company amended
105
the Credit Facility to increase the commitment amount from $50.0 million to $75.0 million. This amendment temporarily waived the borrowing base through March 31, 2018, after which the borrowing base is reinstated. During the temporary borrowing base waiver, the Credit Facility is governed by a loan-to-value ratio not to exceed 70%. The commitment amount on the non-usage fee increased from $50.0 million to $75.0 million.
Under the terms of the amended Credit Facility, the Company is required, among other things, to maintain minimum multiples of net worth in excess of the outstanding Credit Facility balance, minimum interest coverage and maximum leverage. The Company was in compliance with these financial covenants under the Credit Facility as of December 31, 2017.
(2) | On December 15, 2015, the Company entered into a credit agreement (the “Credit Agreement”) with the lenders named therein, and Citibank, N.A., as administrative agent, providing for a senior, unsecured revolving credit facility with aggregate lending commitments of up to $40.0 million (the “Unsecured Revolving Credit Facility”). Before the First Amendment (as defined and discussed below) increased the maximum amount of the Unsecured Revolving Credit Facility, the Company could, at its option and subject to certain terms and conditions, prior to the termination date, increase the amount of the Unsecured Revolving Credit Facility up to a maximum aggregate amount of $75.0 million. Before the Second Amendment (as defined and discussed below), commitments under the Unsecured Revolving Credit Facility were available until the period ending December 14, 2018. Citibank, N.A. and Credit Suisse AG, Cayman Islands Branch (“Credit Suisse”) initially committed to provide $25.0 million and $15.0 million, respectively. |
The Unsecured Revolving Credit Facility provides for interest rate options on advances at rates equal to either: (a) in the case of base rate advances, the highest of (i) Citibank’s base rate, (ii) the federal funds rate plus 0.5%, and (iii) the one-month LIBOR plus 1.0%, in each case plus 1.5%; or (b) in the case of Eurodollar rate advances, the reserve adjusted LIBOR plus 2.5%. Interest on amounts borrowed under the Unsecured Revolving Credit Facility is payable in arrears quarterly on the last day of each March, June, September and December during such periods. As of December 31, 2017, the interest rate on outstanding borrowings under the Unsecured Revolving Credit Facility was 4.0% per annum.
The Company pays the lenders a commitment fee on the amount of the unused commitments on a quarterly basis at a rate per annum equal to 0.45%.
Outstanding borrowings under the Unsecured Revolving Credit Facility are subject to, among other things, a borrowing base. The borrowing base limitation is equal to the sum of: 100% of unrestricted cash (in excess of $15.0 million); 85% of the book value of model homes, construction in progress homes, sold completed homes and speculative homes (subject to certain limitations on the age and number of speculative homes and model homes); 65% of the book value of finished lots and land under development; and 50% of the book value of entitled land (subject to certain limitations on the value of entitled land and land under development as a percentage of the borrowing base).
On August 31, 2016, the Company entered into a First Amendment to the Credit Agreement (the “First Amendment”), with Flagstar Bank, FSB (“Flagstar Bank”), the lenders named therein, and Citibank, N.A., as administrative agent, which amended the Credit Agreement. The First Amendment added Flagstar Bank as a lender under the Credit Agreement, with an initial commitment of $20.0 million, which increased the aggregate lending commitments available under the Unsecured Revolving Credit Facility from $40.0 million to $60.0 million. The First Amendment also increased the maximum amount of the Unsecured Revolving Credit Facility to a maximum aggregate amount of $110.0 million.
On December 1, 2016, the Company, entered into a Second Amendment to the Credit Agreement (the “Second Amendment”), with the lenders named therein, and Citibank, N.A., as administrative agent, which further amended the Credit Agreement. The Second Amendment, among other things, extended the termination date with respect to commitments under the Unsecured Revolving Credit Facility from December 14, 2018 to December 14, 2019. The Second Amendment became effective upon the payment of an upfront fee of 0.15% of the aggregate amount of any extended commitments on December 15, 2016. Additionally, Citibank, N.A. increased its commitment under the Unsecured Revolving Credit Facility from $25.0 million to $35.0 million, which increased the aggregate lending commitments available under the Unsecured Revolving Credit Facility from $60.0 million to $70.0 million.
On March 6, 2017, Flagstar Bank increased its commitment under the Unsecured Revolving Credit Facility from $20.0 million to $35.0 million, which increased the aggregate lending commitments available under the Unsecured Revolving Credit Facility from $70.0 million to $85.0 million. The costs of $0.1 million associated with this increase in commitment were deferred and are included in other assets, net in the consolidated balance sheets. The Company is amortizing these debt issuance costs to interest expense over the term of the Unsecured Revolving Credit Facility using the straight-line method.
On September 1, 2017, the Company entered into a Third Amendment to the Credit Agreement (the “Third Amendment”), with Flagstar Bank, the lenders named therein, and Citibank, N.A., as administrative agent, which amended the Credit Agreement. Pursuant to the Third Amendment, Flagstar Bank increased its commitment from $35.0 million to $70.0
106
million and Credit Suisse increased its commitment from $15.0 million to $25.0 million, which increased the aggregate lending commitments available under the Unsecured Revolving Credit Facility from $85.0 million to $130.0 million. The Third Amendment also increased the maximum amount of the Unsecured Revolving Credit Facility from $110.0 million to a maximum aggregate amount of $200.0 million. Further increases are available at the Company’s option, prior to the termination date, subject to certain terms and conditions. In addition, the Third Amendment appoints Flagstar in the roles as the sole lead arranger and administrative agent under the Credit Agreement. The costs of $0.4 million associated with the Third Amendment were deferred and are included in other assets, net in the consolidated balance sheets. The Company is amortizing these debt issuance costs to interest expense over the term of the Unsecured Revolving Credit Facility using the straight-line method.
On December 1, 2017, the Company entered into a Fourth Amendment to the Credit Agreement (the “Fourth Amendment”), with the lenders named therein, and Flagstar Bank, as administrative agent, which amended the Credit Agreement. The Fourth Amendment extended the termination date with respect to commitments under the Unsecured Revolving Credit Facility from December 14, 2019 to December 14, 2020. The extension became effective upon the payment of an upfront fee of 0.15% of the aggregate amount of any extended commitments on December 15, 2017.
On March 12, 2018, the Company, Flagstar Bank, as administrative agent, and JPMorgan Chase Bank, N.A. (“JPMorgan”) executed a new lender supplement to add JPMorgan as a lender under the Credit Agreement, with an initial commitment of $30.0 million, which increased the aggregate lending commitments available under the Unsecured Revolving Credit Facility from $130.0 million to $160.0 million. The increased borrowing capacity will be effective March 27, 2018.
Under the terms of the Unsecured Revolving Credit Facility, the Company is required, among other things, to maintain compliance with various covenants, including financial covenants relating to a maximum Leverage Ratio, a minimum Interest Coverage Ratio, and a minimum Consolidated Tangible Net Worth, each as defined therein. The Company’s compliance with these financial covenants is measured by calculations and metrics that are specifically defined or described by the terms of the Unsecured Revolving Credit Facility. The Company was in compliance with these covenants as of December 31, 2017.
Notes Payable
Notes payable outstanding as of December 31, 2017 and 2016 consist of the following (in thousands):
December 31, 2017 | December 31, 2016 | ||||||
Notes payable to unrelated third parties: | |||||||
Briar Ridge Investments, LTD(1) | $ | 9,000 | $ | 9,000 | |||
Wretched Land, LP(2) | — | 713 | |||||
Graham Mortgage Corporation(3) | 926 | 1,235 | |||||
Total notes payable | $ | 9,926 | $ | 10,948 | |||
(1) | On December 13, 2013, a subsidiary of JBGL signed a promissory note for $9.0 million maturing on December 13, 2017, bearing interest at 6.0% collateralized by land purchased in Allen, Texas. Accrued interest as of December 31, 2017 was $0. In December 2016, this note was extended through December 31, 2018. |
(2) | On August 19, 2016, a subsidiary of JBGL signed a promissory note for $1.4 million maturing on January 1, 2017, bearing interest at 2.0% per annum and collateralized by land located in Allen, Texas. A repayment of $0.7 million was made during September 2016. In December 2016, this note was extended through March 1, 2017. The note was paid off on March 1, 2017. |
(3) | On November 30, 2016, a subsidiary of JBGL signed a promissory note for $1.2 million maturing on December 1, 2018, bearing interest at 3.0% per annum and collateralized by land located in Sunnyvale, Texas. |
107
The approximate annual minimum principal payments over the next five years under the debt agreements as of December 31, 2017 are (in thousands):
Line of Credit | Notes Payable | Total | |||||||||
2018 | $ | — | $ | 9,926 | $ | 9,926 | |||||
2019 | 32,000 | — | 32,000 | ||||||||
2020 | 75,000 | — | 75,000 | ||||||||
$ | 107,000 | $ | 9,926 | $ | 116,926 | ||||||
7. SHARE-BASED COMPENSATION
2014 Omnibus Equity Incentive Plan
On October 17, 2014, the Company’s stockholders approved the Green Brick Partners, Inc. 2014 Omnibus Equity Incentive Plan (the “2014 Equity Plan”). The 2014 Equity Plan became effective upon the completion of the Transaction on October 27, 2014. The purpose of the 2014 Equity Plan is to provide a means for the Company to attract and retain key personnel and to provide a means whereby current and prospective directors, officers, employees, consultants and advisors can acquire and maintain an equity interest in the Company, or be paid incentive compensation, which may (but need not) be measured by reference to the value of the Company’s common stock, thereby strengthening their commitment to the welfare of the Company and aligning their interests with those of the Company’s stockholders. The 2014 Equity Plan will terminate automatically on the tenth anniversary of the date it became effective. No awards will be granted under the 2014 Equity Plan after that date, but awards granted prior to that date may extend beyond that date.
Under the 2014 Equity Plan, awards of stock options, including both incentive stock options and nonqualified stock options, stock appreciation rights, restricted stock and restricted stock units, other share-based awards and performance compensation awards, may be granted. The maximum number of shares of the Company’s common stock that is authorized and reserved for issuance under the 2014 Equity Plan is 2,350,956 shares, subject to adjustment for certain corporate events or changes in the Company’s capital structure.
In general, the Company’s employees or those reasonably expected to become the Company’s employees, consultants and directors, are eligible for awards under the 2014 Equity Plan, provided that incentive stock options may be granted only to employees. The Company has four executive officers, six non-employee directors and approximately 260 other employees (including employees of our controlled builders) who are eligible to receive awards under the 2014 Equity Plan. Written agreements between the Company and each participant evidence the terms of each award granted under the 2014 Equity Plan.
If any award under the 2014 Equity Plan expires or otherwise terminates, in whole or in part, without having been exercised in full, the common stock withheld from issuance under that award will become available for future issuance under the plan. If shares issued under the 2014 Equity Plan are reacquired by the Company pursuant to the terms of any forfeiture provision, those shares will become available for future awards under the plan. Awards that can only be settled in cash will not be treated as shares of common stock granted for purposes of the 2014 Equity Plan. The maximum amount that can be paid to any single participant in any one calendar year pursuant to a cash bonus award under the 2014 Equity Plan is $2.0 million. As of December 31, 2017, 1,956,979 shares remain available for future grant of awards under the 2014 Equity Plan.
Share-Based Award Activity
During the year ended December 31, 2017, the Company granted restricted stock awards (“RSAs”) under the 2014 Equity Plan to Named Executive Officers (“NEOs”) and non-employee members of the BODs. The RSAs granted to the NEOs were 100% vested and non-forfeitable on the grant date. The BODs elected to defer up to 100% of their annual retainer fee, chairman fees and meeting fees in the form of common stock. The RSAs granted to the BODs will become fully vested on the earlier of (i) the first anniversary of the date of grant of the shares of restricted common stock or (ii) the date of the Company’s 2018 Annual Meeting of Stockholders. The fair value of the RSAs granted to the NEOs and non-employee members of the BODs were recorded as share-based compensation expense on the grant date and over the vesting period, respectively. The Company withheld 63,057 shares of common stock, at a total cost of $0.6 million, from NEOs to satisfy statutory minimum tax requirements in respect of the RSAs.
108
A summary of share-based awards activity during the year ended December 31, 2017 is as follows:
Number of Shares (in thousands) | Weighted Average Grant Date Fair Value per Share | |||||
Nonvested, December 31, 2016 | 38 | $ | 7.51 | |||
Granted | 229 | $ | 10.11 | |||
Vested | (229 | ) | $ | 9.66 | ||
Forfeited | — | $ | — | |||
Nonvested, December 31, 2017 | 38 | $ | 10.25 | |||
Stock Options
Stock options granted to date were not granted under the 2014 Equity Plan. The stock options outstanding as of December 31, 2017 generally vest and become exercisable in five substantially equal installments on each of the first five anniversaries of the grant date and expire 10 years after the date on which they were granted. Compensation expense related to these options is expensed on a straight-line basis over the five year service period. All of the stock options outstanding as of December 31, 2017 are vested or expected to vest. We utilize the Black-Scholes option pricing model for estimating the grant date fair value of stock options. There were no stock options granted during the years ended December 31, 2017, 2016 and 2015.
A summary of stock option activity during the year ended December 31, 2017 is as follows:
Number of Shares (in thousands) | Weighted Average Exercise Price per Share | Weighted Average Remaining Contractual Term (in years) | Aggregate Intrinsic Value (in thousands) | |||||||||
Options outstanding, December 31, 2016 | 500 | $ | 7.49 | |||||||||
Granted | — | — | ||||||||||
Exercised | — | — | ||||||||||
Forfeited | — | — | ||||||||||
Options outstanding, December 31, 2017 | 500 | $ | 7.49 | 6.82 | $ | 1,905 | ||||||
Options exercisable, December 31, 2017 | 300 | $ | 7.49 | 6.82 | $ | 1,143 | ||||||
A summary of unvested stock option activity during the year ended December 31, 2017 is as follows:
Number of Shares (in thousands) | Weighted Average Per Share Grant Date Fair Value | |||||
Unvested, December 31, 2016 | 300 | $ | 2.88 | |||
Granted | — | $ | — | |||
Vested | (100 | ) | $ | 2.88 | ||
Forfeited | — | $ | — | |||
Unvested, December 31, 2017 | 200 | $ | 2.88 | |||
Share-Based Compensation Expense
Share-based compensation expense was approximately $2.6 million, $1.3 million and $0.5 million for the years ended December 31, 2017, 2016 and 2015 respectively. As of December 31, 2017, the estimated total remaining unamortized share-based compensation expense related to unvested restricted stock awards, net of forfeitures, was $0.2 million which is expected to be recognized over a weighted-average period of 0.4 years. As of December 31, 2017, the estimated total remaining unamortized share-based compensation expense related to stock options, net of forfeitures, was $0.5 million which is expected to be recognized over a weighted-average period of 1.8 years.
8. EMPLOYEE BENEFITS
Prior to 2015, we had a qualifying 401(k) defined contribution plan that covered employees at one of our subsidiaries, The Providence Group of Georgia L.L.C. (“TPG”). During the year ended December 31, 2015, we extended the qualifying 401(k) defined contribution plan to all employees of the Company. Each year, we may make discretionary matching contributions
109
equal to a percentage of the employees’ contributions. The Company contributed $0.5 million of matching contributions to the 401(k) plan during the year ended December 31, 2017. The Company did not contribute any matching contributions to the 401(k) plan during the years ended December 31, 2016 and 2015.
9. RELATED PARTY TRANSACTIONS
During 2017, 2016 and 2015, the Company had related party transactions through the normal course of business. These transactions include the following:
On October 27, 2014, in connection with the Transaction, the Company entered into the Loan Agreement, a guaranty and a pledge and security agreement with certain funds and accounts managed by Greenlight, our largest shareholder. Greenlight beneficially owns approximately 47.7% of the voting power of the Company. The Loan Agreement provides for a five year term loan facility in an aggregate principal amount of $150.0 million which funded part of the Transaction. Certain subsidiaries of the Company guarantee obligations under the Term Loan Facility. The Term Loan Facility bore interest at 9.0% per annum, payable quarterly, from October 27, 2014 through the first anniversary thereof and 10.0% per annum thereafter. On July 1, 2015, we used approximately $154.9 million of the net proceeds from the Equity Offering to repay all of the outstanding principal, interest and a prepayment premium under the Term Loan Facility.
In 2012, we formed Centre Living Homes, LLC (“Centre Living”), a builder that focuses on a limited number of homes and luxury townhomes each year in the Dallas, Texas market. Trevor Brickman, the son of Green Brick’s Chief Executive Officer, is the President of Centre Living. Effective as of January 1, 2015, Centre Living’s operating agreement was amended and restated to the same general terms as with our other builders, such that Green Brick’s ownership interest in Centre Living is 50% and Trevor Brickman’s ownership interest is 50% for future operations beginning January 1, 2015. Subsequent to this amendment, Green Brick has 51% voting control over the operations of Centre Living. As such, 100% of Centre Living’s operations are included within our consolidated financial statements for the years ended December 31, 2017, December 31, 2016 and December 31, 2015. The noncontrolling interest attributable to Centre Living was $0.1 million and $0.3 million as of December 31, 2017 and December 31, 2016, respectively. In June 2016, the Company sold one developed lot to Trevor Brickman for $0.4 million, of which $0.3 million was included in the cost of land and lots. In September 2016, Trevor Brickman entered into an agreement with Centre Living to construct a home on the developed lot. In accordance with the Company’s employee discount policy, the contract price resulted in a margin of approximately 13%. The home was completed in 2017 and the Company incurred $0.6 million in costs to construct the home. As of December 31, 2017 and December 31, 2016, the Company had $0 and $0.1 million, respectively, in accounts receivable due from Trevor Brickman related to the construction of the home.
In September 2015, the Company purchased 11 lots from an entity affiliated with the president of TPG, one of its controlled builders. The lots are part of a 19-home community, The Parc at Cogburn in Atlanta. The total paid for the lots in 2015 was $1.8 million. Under the option agreement in place, the Company purchased $0.3 million in lots during the year ended December 31, 2016. The Company purchased $1.0 million in lots during the six months ended June 30, 2017. The Company purchased all 19 lots as of June 30, 2017.
In November 2015, the Company purchased 12 lots from an entity affiliated with the president of TPG. The lots are part of a 92-unit townhome community, Glens at Sugarloaf in Atlanta. No deposits were paid by the Company in contracting for the lots. The total paid for the lots in 2015 was $1.0 million. During March 2016, the Company purchased the remaining 80 townhome lots within the community at a price of $4.8 million from the affiliated entity.
During March 2016, the Company purchased undeveloped land for an eventual 83 lot community, Academy Street in Atlanta. Simultaneously, the Company entered into a partnership agreement with an entity affiliated with the president of TPG to develop the community for sale of the lots to TPG under GRBK Academy LLC. Contributions and profits are 80% for the Company and 20% for the affiliated entity. The total contributions paid in 2016 were $11.2 million, of which $9.0 million was paid by the Company. The total contributions paid during the year ended December 31, 2017 were $0.5 million, of which $0.4 million was paid by the Company. The Company has 80% ownership in GRBK Academy, LLC and has consolidated the entity’s results of operations and financial condition into its financial statements.
During March 2016, the Company purchased undeveloped land for an eventual 73 unit townhome community, Suwanee Station in Atlanta. Simultaneously, the Company entered into a partnership agreement with an entity affiliated with the president of TPG to develop the community for sale of the lots to TPG under GRBK Suwanee Station LLC. Contributions and profits are 50% for the Company and 50% for the affiliated entity. Total capital contributions are estimated at $3.4 million, of which 50% will be contributed by the Company. The total contributions paid in 2016 were $1.8 million, of which $0.9 million was paid by the Company. The total contributions paid during the year ended December 31, 2017 were $0.7 million, of which
110
$0.4 million was paid by the Company. The Company holds two of the three board seats and is able to exercise control over the operations of GRBK Suwanee Station LLC and therefore has consolidated the entity’s results of operations and financial condition into its financial statements.
In June 2016, the Company purchased 14 lots from an entity affiliated with the president of TPG. The lots are part of a 40-unit townhome community, Dunwoody Towneship. No deposits were paid by the Company related to these lots. The total paid for the 14 lots in 2016 was $1.8 million. The Company purchased the remaining 26 lots during the year ended December 31, 2017 for $3.3 million.
In February 2017, Richard A. Costello paid a $110,000 deposit to Centre Living for the purchase of a townhome. During the fourth quarter of 2017, Mr. Costello closed on the townhome for approximately $495,000. In accordance with the Company’s employee discount policy, the contract price resulted in a margin of approximately 13%.
In February 2017, Jed Dolson paid a $110,000 deposit to Centre Living for the purchase of a townhome. During the fourth quarter of 2017, as allowed for in the Company’s employee discount policy, Mr. Dolson assigned his rights to purchase the townhome to his sister-in-law. The townhome was sold in the fourth quarter of 2017 for approximately $472,000. In accordance with the Company’s employee discount policy, the contract price resulted in a margin of approximately 13%.
10. INCOME TAXES
Provision for Income Taxes
The components of current and deferred income tax expense are as follows (in thousands):
Years Ended December 31, | |||||||||||
2017 | 2016 | 2015 | |||||||||
Current expense: | |||||||||||
Federal | $ | 999 | $ | 158 | $ | — | |||||
State | 1,733 | 2,076 | 819 | ||||||||
Total current expense | 2,732 | 2,234 | 819 | ||||||||
Deferred expense (benefit): | |||||||||||
Federal | 36,569 | 13,146 | 8,412 | ||||||||
State | (270 | ) | 1 | (60 | ) | ||||||
Total deferred expense | 36,299 | 13,147 | 8,352 | ||||||||
Total income tax provision | $ | 39,031 | $ | 15,381 | $ | 9,171 | |||||
The effective income tax rate for 2017 reflects the impact of compliance with the Tax Act, signed into law on December 22, 2017. The Company remeasured its deferred tax assets due to the change in federal statutory tax rate which resulted in additional tax expense of $19.0 million. Future implementation guidance from the Internal Revenue Service, clarifications of state tax law or the completion of the Company’s 2017 tax return filings could all affect the estimated financial statement impact of the Tax Act. The SEC has issued rules that would allow for a measurement period of up to one year after the enactment date of the Tax Act to finalize the recording of the related tax impacts. The Company does not believe potential adjustments in future periods would materially impact the Company’s financial condition or results of operations.
111
Deferred Income Taxes
The primary differences between the financial statement and tax bases of assets and liabilities are as follows (in thousands):
December 31, 2017 | December 31, 2016 | ||||||
Deferred tax assets: | |||||||
Accrued bonuses | $ | 591 | $ | 1,120 | |||
Accrued payroll | 75 | 101 | |||||
Stock-based compensation | 268 | 291 | |||||
Federal net operating loss carryover | 14,078 | 40,800 | |||||
State net operating loss carryover | 1,353 | 1,147 | |||||
Basis in partnerships | 13,377 | 22,922 | |||||
Warranty accrual | 483 | 444 | |||||
Inventory (Section 263A) | 944 | 945 | |||||
Accrued job costs | 178 | 503 | |||||
Reserve to complete | 91 | 345 | |||||
Alternative minimum tax credit carryover | 1,145 | 158 | |||||
Other | 28 | 126 | |||||
Deferred tax assets, gross | 32,611 | 68,902 | |||||
Valuation allowance | (1,346 | ) | (1,147 | ) | |||
Deferred tax assets, net | $ | 31,265 | $ | 67,755 | |||
Deferred tax liabilities: | |||||||
Prepaid insurance | $ | (17 | ) | $ | (43 | ) | |
Other | (37 | ) | (114 | ) | |||
Deferred tax liabilities | $ | (54 | ) | $ | (157 | ) | |
The Company assesses the recoverability of deferred tax assets and the need for a valuation allowance on an ongoing basis. In making this assessment, management considers all available positive and negative evidence and available income tax planning to determine whether it is more-likely-than-not that some portion or all of the deferred tax assets will be realized in future periods. This assessment requires significant judgment and estimates involving current and deferred income taxes, tax attributes relating to the interpretation of various tax laws, historical bases of tax attributes associated with certain assets and limitations surrounding the realization of deferred tax assets.
The Company files a federal corporate income tax return. The operations of JBGL subsequent to the Transaction Date were included in the Company’s federal income tax filing.
As of December 31, 2017, the federal net operating loss carryforward was approximately $67.0 million, which will begin to expire beginning with the year ending December 31, 2029. The U.S. federal statute of limitations remains open for our 2014 and subsequent tax years. Due to the carryover of the federal net operating losses for years 2008 and forward, income tax returns going back to the 2008 tax year are subject to adjustment. The Colorado and Minnesota statutes of limitations remain open for our 2013 and subsequent tax years. The Nebraska statute of limitations remains open for our 2014 and subsequent tax years. Additionally, JBGL’s partnerships file returns in Texas and Georgia. The Georgia statute of limitations remains open for the 2014 and subsequent tax years. Any Georgia adjustments relating to returns filed by the partnerships would be borne by the partners. The Texas statute of limitations remains open for the 2013 and subsequent tax years.
The Company is not presently under examination by the Internal Revenue Service or state tax authority.
112
Effective Tax Rate Reconciliation
The provision for income before income tax provision differs from the amount that would be computed by applying the statutory federal income tax rate of 35% to income before income tax provision as a result of the following (amounts in thousands):
Years Ended December 31, | |||||||||||
2017 | 2016 | 2015 | |||||||||
Tax on pre-tax book income (before reduction for noncontrolling interests) | $ | 22,483 | $ | 17,693 | $ | 12,151 | |||||
Tax effect of noncontrolled earnings post Transaction | (3,630 | ) | (3,996 | ) | (3,577 | ) | |||||
State tax expense, net | 1,213 | 1,153 | 533 | ||||||||
Change in federal statutory tax rate | 19,017 | — | — | ||||||||
Other | (52 | ) | 531 | 64 | |||||||
Total tax expense | $ | 39,031 | $ | 15,381 | $ | 9,171 | |||||
Effective tax rate | 60.8 | % | 30.4 | % | 26.4 | % | |||||
Net Operating Losses and Valuation Allowances
As of December 31, 2017, we have federal net operating loss carryforwards of approximately $67.0 million that will expire beginning with the year ending December 31, 2029. Our ability to utilize our net operating loss carryforwards depends on the amount of taxable income we generate in future periods. Based on our historical taxable income results through December 31, 2017, as well as forecasted income, management expects that the Company will generate sufficient taxable income to utilize all of the federal net operating loss carryforwards before they expire. The Company also has approximately $20.2 million of gross state net operating loss carryforwards in Minnesota and Nebraska with varying periods of expiration which the Company believes on a more-likely-than-not basis will not be utilized. The Company has approximately $0.2 million of gross Colorado state net operating loss carryforwards which will begin to expire beginning with the year ending December 31, 2028. Management expects that the Company will generate sufficient Colorado taxable income to utilize all of the Colorado state net operating loss carryforwards before they expire. The Transaction had no effect on the state net operating loss carryforward amount, the related valuation allowance or income tax expense. The Company maintains a gross deferred income tax asset in the amount of $1.3 million for the Minnesota and Nebraska state net operating loss carryforwards and a related valuation allowance in the amount of $1.3 million. In the Company’s assessment of the need for a valuation allowance, both positive and negative information was considered, including any available income tax planning.
The Company re-assessed the need for a valuation allowance as of December 31, 2017 and concluded, on a more-likely-than-not basis, that the deferred income tax asset related to the Colorado net operating loss carryforward would be realized, giving consideration to the current year and projected operating results of GB Challenger, LLC. As a result of the re-assessment, the Company released the previously recorded valuation allowance against the net deferred income tax assets at December 31, 2017, with an offset reducing deferred state income tax expense.
The rollforward of valuation allowances is as follows (amounts in thousands):
Years Ended December 31, | |||||||
2017 | 2016 | ||||||
Valuation allowance at beginning of the year | $ | 1,147 | $ | 1,161 | |||
Release of Colorado net operating loss valuation allowance | (8 | ) | — | ||||
Change in federal benefit tax rate - deferred | 240 | — | |||||
Expiration of state net operating losses | (33 | ) | (14 | ) | |||
Valuation allowance at end of the year | $ | 1,346 | $ | 1,147 | |||
113
Uncertain Tax Positions
The Company establishes reserves for uncertain tax positions that reflect management’s best estimate of deductions and credits that may not be sustained on a more-likely-than-not basis. In accordance with ASC 740, Income Taxes, the Company recognizes the effect of income tax positions only if those positions have a more-likely-than-not chance of being sustained by the Company. Recognized income tax positions are measured at the largest amount that is considered greater than 50% likely of being realized. Changes in recognition or measurement are reflected in the period in which the change in judgment occurs. A reconciliation of the beginning and ending amount of uncertain tax positions is as follows (in thousands):
Years Ended December 31, | |||||||
2017 | 2016 | ||||||
Uncertain tax positions at beginning of year | $ | 249 | $ | — | |||
Change related to Georgia state income taxes | (249 | ) | 249 | ||||
Uncertain tax positions at end of year | $ | — | $ | 249 | |||
The interest and penalties expense related to uncertain tax positions reflected in the consolidated statements of income for the years ended December 31, 2017, 2016 and 2015 was $0, nil and $0 respectively. The corresponding liabilities in accrued expenses on the consolidated balance sheets were $0 and nil as of December 31, 2017 and 2016, respectively.
11. FAIR VALUE MEASUREMENTS
Fair Value of Financial Instruments
The Company’s financial instruments, none of which are held for trading purposes, include cash, restricted cash, accounts receivable, earnest money deposits, other assets, accounts payable, accrued expenses, customer and builder deposits, obligations related to land not owned under option contracts, borrowings on lines of credit, and notes payable. Per the fair value hierarchy, level 1 financial instruments include: cash, restricted cash, accounts receivable, earnest money deposits, other assets, accounts payable, accrued expenses, and customer and builder deposits due to their short-term nature. Level 2 financial instruments include: borrowings on lines of credit and notes payable. Obligations related to land not owned under option contracts are deemed to be level 3 financial instruments. The fair value for obligations related to land not owned under option contracts was based on the estimated future net cash flows discounted for inherent risk associated with the underlying inventory asset.
Due to the short-term nature, the carrying amounts of notes payable and borrowings on lines of credit approximate fair value. Furthermore, borrowings on lines of credit include floating interest rate terms. The fair value of obligations related to land not owned under option contracts is primarily determined by discounting the estimated future cash flow of each community using various unobservable inputs in our impairment analysis (see Note 2).
The Company estimates that, due to the short-term nature of the underlying financial instruments or the proximity of the underlying transaction to the applicable reporting date, the fair value of all financial instruments does not differ materially from the aggregate carrying values recorded in the consolidated financial statements as of December 31, 2017 and 2016.
Fair Value of Nonfinancial Instruments
Nonfinancial assets and liabilities include items such as inventory which is measured at cost unless the carrying value is determined to be not recoverable in which case the affected instrument is written down to fair value. The fair value of inventory is primarily determined by discounting the estimated future cash flow of each community using various unobservable inputs in our impairment analysis (see Note 2). Per the fair value hierarchy, these items are level 3 nonfinancial instruments. During the years ended December 31, 2017 and December 31, 2016, the Company recorded fair value adjustments of $0.1 million and $0, respectively, to those nonfinancial assets and liabilities measured at fair value on a nonrecurring basis.
12. COMMITMENTS AND CONTINGENCIES
Letters of Credit
During the ordinary course of business, certain regulatory agencies and municipalities require the Company to post letters of credit. Such letters of credit are issued by financial institutions and commit the issuer to pay specified amounts to the holder of the letter of credit if the holder demonstrates that the Company has failed to perform under the relevant contract. If this were to occur, the Company would be required to reimburse the issuer of the letter of credit. The expiration dates of the letters of
114
credit coincide with the expected completion date of the related projects. If the obligations related to a project are ongoing, the letters of credit are automatically extended, without amendment, for one year. As of December 31, 2017 and December 31, 2016, letters of credit outstanding totaled $0.2 million and $0.0 million, respectively. The Company does not believe that it is likely that any material claims will be made under a letter of credit in the foreseeable future.
Warranties
Warranty activity, included in accrued expenses in our consolidated balance sheets, for 2017, 2016 and 2015 consists of the following (in thousands):
2017 | 2016 | 2015 | |||||||||
Beginning balance | $ | 1,210 | $ | 474 | $ | 460 | |||||
Additions | 1,936 | 1,399 | 667 | ||||||||
Charges | (1,063 | ) | (663 | ) | (653 | ) | |||||
Ending balance | $ | 2,083 | $ | 1,210 | $ | 474 | |||||
Commitments
The Company has leases associated with office space in Georgia and Texas which are classified as operating leases. Rent expense under these leases totaled $0.8 million, $0.7 million, and $0.6 million in 2017, 2016 and 2015, respectively and is included in selling, general and administrative expense in the consolidated statements of income.
The approximate annual minimum lease payments over the next five years under operating leases as of December 31, 2017 are (in thousands):
2018 | $ | 877 | |
2019 | 895 | ||
2020 | 934 | ||
2021 | 763 | ||
2022 and thereafter | 1,025 | ||
$ | 4,494 | ||
Land and Lot Option Contracts
In the ordinary course of business, the Company enters into land and lot option contracts in order to procure land for the construction of homes in the future. Earnest money deposits act as security for such option contracts. As of December 31, 2017 and 2016, there were 1,724 and 954 lots under option, respectively, as well as option contracts for land intended to be developed into additional lots. The land and lot option contracts in place as of December 31, 2017 provide for potential land and lots purchase payments in each year through 2021.
If each option contract in place as of December 31, 2017 was exercised, expected purchase payments would be as follows (in thousands):
Total | |||
2018 | $ | 137,548 | |
2019 | 47,588 | ||
2020 | 16,092 | ||
2021 | 5,765 | ||
$ | 206,993 | ||
Legal Matters
Lawsuits, claims and proceedings may be instituted or asserted against us in the normal course of business. The Company is also subject to local, state and federal laws and regulations related to land development activities, house construction standards, sales practices, employment practices and environmental protection. As a result, the Company may be subject to periodic examinations or inquiry by agencies administering these laws and regulations.
115
The Company records a reserve for potential legal claims and regulatory matters when they are probable of occurring and a potential loss is reasonably estimable. The Company accrues for these matters based on facts and circumstances specific to each matter and revises these estimates when necessary.
In view of the inherent difficulty of predicting outcomes of legal claims and related contingencies, the Company generally cannot predict their ultimate resolution, related timing or eventual loss. If evaluations indicate loss contingencies that could be material are not probable, but are reasonably possible, the Company will disclose their nature with an estimate of the possible range of losses or a statement that such loss is not reasonably estimable. We believe that the disposition of legal claims and related contingencies will not have a material adverse effect on our results of operations and liquidity or on our financial condition.
13. SEGMENT INFORMATION
Financial information relating to the Company’s reportable segments is as follows. Operational results of each reportable segment are not necessarily indicative of the results that would have been achieved had the reportable segment been an independent, stand-alone entity during the periods presented. Our segments follow the accounting policies used for our consolidated financial statements as described in Note 2. Evaluation of segment performance is primarily based on a combination of revenues, gross profit (loss), income (loss) before taxes and inventory.
Years End December 31, | |||||||||||
(in thousands) | 2017 | 2016 | 2015 | ||||||||
Revenues:(1) | |||||||||||
Builder Operations | |||||||||||
Texas | $ | 220,887 | $ | 201,473 | $ | 121,979 | |||||
Georgia | 214,757 | 163,942 | 132,288 | ||||||||
Corporate and Other(2) | — | — | — | ||||||||
Land Development | 18,730 | 14,913 | 36,878 | ||||||||
$ | 454,374 | $ | 380,328 | $ | 291,145 | ||||||
Gross profit (loss):(1)(3)(4) | |||||||||||
Builder Operations | |||||||||||
Texas | $ | 53,240 | $ | 50,320 | $ | 29,992 | |||||
Georgia | 49,052 | 37,114 | 31,733 | ||||||||
Corporate and Other(2) | (9,293 | ) | (5,659 | ) | (9,108 | ) | |||||
Land Development | 5,454 | 4,600 | 9,635 | ||||||||
$ | 98,453 | $ | 86,375 | $ | 62,252 | ||||||
Income (loss) before taxes:(4) | |||||||||||
Builder Operations | |||||||||||
Texas | $ | 36,224 | $ | 34,939 | $ | 19,945 | |||||
Georgia | 34,636 | 24,639 | 21,744 | ||||||||
Corporate and Other(2)(5) | (10,943 | ) | (12,635 | ) | (12,091 | ) | |||||
Land Development | 4,320 | 3,611 | 5,118 | ||||||||
$ | 64,237 | $ | 50,554 | $ | 34,716 | ||||||
Inventory:(3) | |||||||||||
Builder Operations | |||||||||||
Texas | $ | 110,872 | $ | 76,878 | $ | 61,403 | |||||
Georgia | 99,613 | 90,859 | 86,707 | ||||||||
Corporate and Other(2)(6) | 12,628 | 9,834 | 7,869 | ||||||||
Land Development | 272,542 | 232,726 | 188,153 | ||||||||
$ | 495,655 | $ | 410,297 | $ | 344,132 | ||||||
116
(1) | Builder operations segment revenue does not equal revenue from the sale of residential units included in the consolidated statements of income in periods when our controlled builders have sales of land or lots. Revenue from such sales is included in builder operations segment revenue as it relates to builder operations, and included in revenue from sale of land and lots in the consolidated statements of income. |
(2) | Corporate and other is comprised principally of general corporate expenses associated with administrative functions such as finance, treasury, information technology and human resources. |
(3) | Due to the change in our segments in 2016, as discussed in Note 2, we reclassified (i) $0.1 million in gross profit from the land development segment to the builder operations segment for the year ended December 31, 2015 and (ii) $63.4 million in inventory from the builder operations segment to the land development segment for the year ended December 31, 2015. |
(4) | Certain indirect project costs previously classified as salary expense and selling, general and administrative expense have been reclassified as cost of residential units for the year ended December 31, 2015 to properly present cost of residential units, salary expense, and selling, general and administrative expense. Therefore, amounts presented differ from the amounts previously reported in our Annual Report on Form 10-K for the year ended December 31, 2015. See Note 2 for further discussion on this change in classification. |
(5) | Results from Green Brick Title and Challenger Subsidiary are included in income (loss) before taxes for the corporate and other operating segment. |
(6) | Corporate and other inventory consists of capitalized overhead and interest related to work in process and land under development. |
14. QUARTERLY FINANCIAL DATA (UNAUDITED)
Summarized unaudited quarterly results of operations for the years ended December 31, 2017 and December 31, 2016 are as follows (in thousands, except per share amounts):
Year ended December 31, 2017 | First Quarter | Second Quarter | Third Quarter | Fourth Quarter | ||||||||||||
Revenues | $ | 99,337 | $ | 104,951 | $ | 113,706 | $ | 136,380 | ||||||||
Gross profit | 21,286 | 22,926 | 25,410 | 28,831 | ||||||||||||
Net income (loss) attributable to Green Brick Partners, Inc.(1) | 6,197 | 7,689 | 9,280 | (8,196 | ) | |||||||||||
Net income (loss) attributable to Green Brick Partners, Inc. per common share:(2) | ||||||||||||||||
Basic | $0.13 | $0.16 | $0.19 | $(0.16) | ||||||||||||
Diluted | $0.13 | $0.16 | $0.19 | $(0.16) | ||||||||||||
Year ended December 31, 2016 | First Quarter | Second Quarter | Third Quarter | Fourth Quarter | ||||||||||||
Revenues | $ | 69,958 | $ | 98,936 | $ | 91,670 | $ | 119,764 | ||||||||
Gross profit | 14,414 | 22,116 | 20,644 | 29,201 | ||||||||||||
Net income attributable to Green Brick Partners, Inc. | 3,094 | 6,743 | 6,243 | 7,676 | ||||||||||||
Net income attributable to Green Brick Partners, Inc. per common share: | ||||||||||||||||
Basic | $0.06 | $0.14 | $0.13 | $0.16 | ||||||||||||
Diluted | $0.06 | $0.14 | $0.13 | $0.16 | ||||||||||||
(1) | Net loss attributable to Green Brick Partners, Inc. in the fourth quarter is due to the remeasurement of our deferred tax assets as a result of the change in federal statutory tax rate which resulted in additional tax expense of $19.0 million. |
(2) | Per share amounts for the four quarters do not add to per share amounts for the year due to rounding differences in quarterly amounts and due to the impact of differences between the quarterly and annual weighted average share calculations. |
117
(a)(3) Exhibits
EXHIBIT INDEX
Number | Description | |
2.1# | ||
3.1 | ||
3.2 | ||
4.1 | ||
4.2 | ||
4.3 | ||
4.4 | ||
4.5 | ||
10.1 | ||
10.2 | ||
10.3 | ||
10.4 | ||
10.5 | ||
10.6 | ||
118
Number | Description | |
10.7 | ||
10.8 | ||
10.9 | ||
10.10 | ||
10.11 | ||
10.12 | ||
10.13 | ||
10.14† | ||
10.15† | ||
10.16† | ||
10.17† | ||
10.18† | ||
10.19† | ||
10.20 | ||
10.21 | ||
10.22 | ||
10.23 | ||
10.24 | ||
10.25 | ||
10.26 | ||
119
Number | Description | |
10.27 | ||
10.28 | ||
10.29 | ||
10.30 | ||
10.31† | ||
10.32 | ||
10.33 | ||
10.34 | ||
10.35 | ||
10.36 | ||
10.37 | ||
10.38 | ||
10.39 | ||
10.40 | ||
10.41 | ||
10.42† | ||
10.43 | ||
10.44 | ||
10.45 | ||
120
Number | Description | |
10.46 | ||
10.47 | ||
10.48 | ||
10.49 | ||
10.50 | ||
21.1* | ||
23.1* | ||
23.2* | ||
31.1* | ||
31.2* | ||
32.1* | ||
32.2* | ||
101.INS* | XBRL Instance Document. | |
101.SCH* | XBRL Taxonomy Extension Schema Document. | |
101.CAL* | XBRL Taxonomy Extension Calculation Linkbase Document. | |
101.DEF* | XBRL Taxonomy Extension Definition Linkbase Document. | |
101.LAB* | XBRL Taxonomy Extension Label Linkbase Document. | |
101.PRE* | XBRL Taxonomy Extension Presentation Linkbase Document. | |
* Filed with this Form 10-K
† Management Contract or Compensatory Plan
# | The Company hereby undertakes to furnish supplementally a copy of any omitted schedule or exhibit to such agreement to the U.S. Securities and Exchange Commission upon request. |
121
SIGNATURES
Pursuant to the requirements of Section 13 or 15(d) of the Securities Exchange Act of 1934, the registrant has duly caused this report to be signed on its behalf by the undersigned, thereunto duly authorized on March 12, 2018.
Green Brick Partners, Inc.
/s/ James R. Brickman | |
By: James R. Brickman | |
Its: Chief Executive Officer | |
Pursuant to the requirements of the Securities Exchange Act of 1934, this report has been signed below by the following persons on behalf of the registrant and in the capacities and on the dates indicated below.
Signature | Title | Date | ||
/s/ James R. Brickman | Chief Executive Officer and Director (Principal Executive Officer) | March 12, 2018 | ||
James R. Brickman | ||||
/s/ Richard A. Costello | Chief Financial Officer (Principal Financial Officer and Principal Accounting Officer) | March 12, 2018 | ||
Richard A. Costello | ||||
/s/ Elizabeth K. Blake | Director | March 12, 2018 | ||
Elizabeth K. Blake | ||||
/s/ Harry Brandler | Director | March 12, 2018 | ||
Harry Brandler | ||||
/s/ David Einhorn | Chairman of the Board | March 12, 2018 | ||
David Einhorn | ||||
/s/ John R. Farris | Director | March 12, 2018 | ||
John R. Farris | ||||
/s/ Kathleen Olsen | Director | March 12, 2018 | ||
Kathleen Olsen | ||||
/s/ Richard S. Press | Director | March 12, 2018 | ||
Richard S. Press | ||||
122