Exhibit 99.1

NORTH AMERICAN ENERGY PARTNERS INC.
ANNUAL INFORMATION FORM
June 10, 2013
NOA
Table of Contents
NOA
Annual Information Form
June 10, 2013
A. EXPLANATORY NOTES
The information in this Annual Information Form (AIF) is stated as at June 10, 2013, unless otherwise indicated. For an explanation of the capitalized terms and expressions and certain defined terms, please refer to the “Glossary of Terms” at the end of this AIF. All references in this AIF to “we”, “us”, “NAEPI” or the “Company”, unless the context otherwise specifies, mean North American Energy Partners Inc. and its Subsidiaries (as defined below). Except where otherwise specifically indicated, all dollar amounts are expressed in Canadian dollars. For additional information and details, readers are referred to the audited consolidated financial statements for the year ended March 31, 2013 and notes there to, as well as the accompanying annual Management’s Discussion and Analysis (“MD&A”) which are available on the Canadian Securities Administrators’ SEDAR System at www.sedar.com, the Securities and Exchange Commission’s website at www.sec.gov and our company website at www.nacg.ca.
Industry Data and Forecasts
This AIF includes industry data and forecasts that we have obtained from publicly available information, various industry publications, other published industry sources and our internal data and estimates. For example, information regarding actual and anticipated production as well as reserves and current and scheduled projects in the Canadian oil sands was obtained from the Energy Resources Conservation Board (“ERCB”) and the Canadian Energy Research Institute. Information regarding historical capital expenditures in the oil sands was obtained from the Canadian Association of Petroleum Producers (“CAPP”).
Industry publications and other published industry sources generally indicate that the information contained therein was obtained from sources believed to be reliable, but do not guarantee the accuracy and completeness of such information. Although we believe that these publications and reports are reliable, we have not independently verified the data. Our internal data, estimates and forecasts are based upon information obtained from our customers, trade and business organizations and other contacts in the markets in which we operate and our management's understanding of industry conditions. Although we believe that such information is reliable, we have not had such information verified by any independent sources. References to barrels of oil related to the oil sands in this document are quoted directly from source documents and refer to both barrels of bitumen and barrels of bitumen that have been upgraded into synthetic crude oil, which is considered synthetic because its original hydrocarbon mark has been altered in the upgrading process. We understand that there is generally some shrinkage of bitumen volumes through the upgrading process. The shrinkage is approximately 11% according to the Canadian National Energy Board. We have not made any estimates or calculations with regard to these volumes and have quoted these volumes as they appeared in the related source documents.
Caution Regarding Forward-Looking Information
Our AIF is intended to enable readers to gain an understanding of our current results and financial position. To do so, we provide material information and analysis about our company and our business at a point in time, in the context of our historical and possible future development. Accordingly, certain sections of this report contain forward-looking information that is based on current plans and expectations. This forward-looking information is affected by risks, assumptions and uncertainties that could have a material impact on future prospects. Please refer to "Forward-Looking Information, Assumptions and Risk Factors" for a discussion of the risks, assumptions and uncertainties related to such information. Readers are cautioned that actual events and results may vary.
Non-GAAP Financial Measures
The body of generally accepted accounting principles applicable to us is commonly referred to as "GAAP". A non-GAAP financial measure is generally defined by the Securities and Exchange Commission (SEC) and by the Canadian securities regulatory authorities as one that purports to measure historical or future financial performance, financial position or cash flows, but excludes or includes amounts that would not be so adjusted in the most comparable GAAP measures. In our MD&A, we use non-GAAP financial measures such as "net income before interest expense, income taxes, depreciation and amortization" (EBITDA) and "Consolidated EBITDA" (as defined in our fourth amended and restated credit agreement, our "credit agreement").
Consolidated EBITDA is defined as EBITDA, excluding the effects of unrealized foreign exchange gain or loss, realized and unrealized gain or loss on derivative financial instruments, non-cash stock-based compensation expense, gain or loss on disposal of plant and equipment, the impairment of goodwill, the amendment related to the
2013 Annual Information Form | 1 |
fiscal 2011 $42.5 million revenue writedown on the Canadian Natural1 overburden removal contract (described in the "Our Business - Significant Business Events" section of our MD&A) and certain other non-cash items included in the calculation of net income.
We believe that EBITDA is a meaningful measure of the performance of our business because it excludes interest, income taxes, depreciation and amortization that are not directly related to the operating performance of our business. Management reviews EBITDA to determine whether plant and equipment are being allocated efficiently. In addition, our credit facility requires us to maintain both a minimum interest coverage ratio and a maximum senior leverage ratio and also identifies limits to our annual capital spend, all of which are calculated using Consolidated EBITDA. Non-compliance with these financial covenants could result in a requirement to immediately repay all amounts outstanding under our credit facility.
As EBITDA and Consolidated EBITDA are non-GAAP financial measures, our computations of EBITDA and Consolidated EBITDA may vary from others in our industry. EBITDA and Consolidated EBITDA should not be considered as alternatives to operating income or net income as measures of operating performance or cash flows as measures of liquidity. EBITDA and Consolidated EBITDA have important limitations as analytical tools and should not be considered in isolation or as substitutes for analysis of our results as reported under US GAAP. For example, EBITDA and Consolidated EBITDA do not:
• reflect our cash expenditures or requirements for capital expenditures or capital commitments or proceeds from capital disposals;
• reflect changes in our cash requirements for our working capital needs;
• reflect the interest expense or the cash requirements necessary to service interest or principal payments on our debt;
• include tax payments or recoveries that represent a reduction or increase in cash available to us; or
• reflect any cash requirements for assets being depreciated and amortized that may have to be replaced in the future.
Consolidated EBITDA excludes unrealized foreign exchange gains and losses and realized and unrealized gains and losses on derivative financial instruments, which, in the case of unrealized losses may ultimately result in a liability that may need to be paid and in the case of realized losses, represents an actual use of cash during the period.
Where relevant, particularly for earnings-based measures, we provide tables in this document that reconcile non-GAAP measures used to amounts reported on the face of the consolidated financial statements.
B. CORPORATE STRUCTURE
North American Energy Partners Inc.
The Company was amalgamated under the Canada Business Corporations Act on November 28, 2006, and was the entity continuing from the amalgamation of NACG Holdings Inc. with its wholly-owned subsidiaries, NACG Preferred Corp. and North American Energy Partners Inc. The amalgamated entity continued under the name North American Energy Partners Inc. (“NAEPI”).
1 Canadian Natural Resources Limited (Canadian Natural), owner and operator of the Horizon Oil Sands mine site.
2 | 2013 Annual Information Form |
NOA
Subsidiaries
NAEPI includes its wholly-owned subsidiaries North American Construction Group Inc. (“NACGI”), North American Fleet Company Ltd., NACG International Inc., NACG Properties Inc. and North American Construction Holdings Inc. ("NACHI") along with the wholly-owned operating subsidiaries of NACHI. The chart below depicts our current corporate structure with respect to each of our direct subsidiaries and indirect subsidiaries (collectively the “Subsidiaries”):
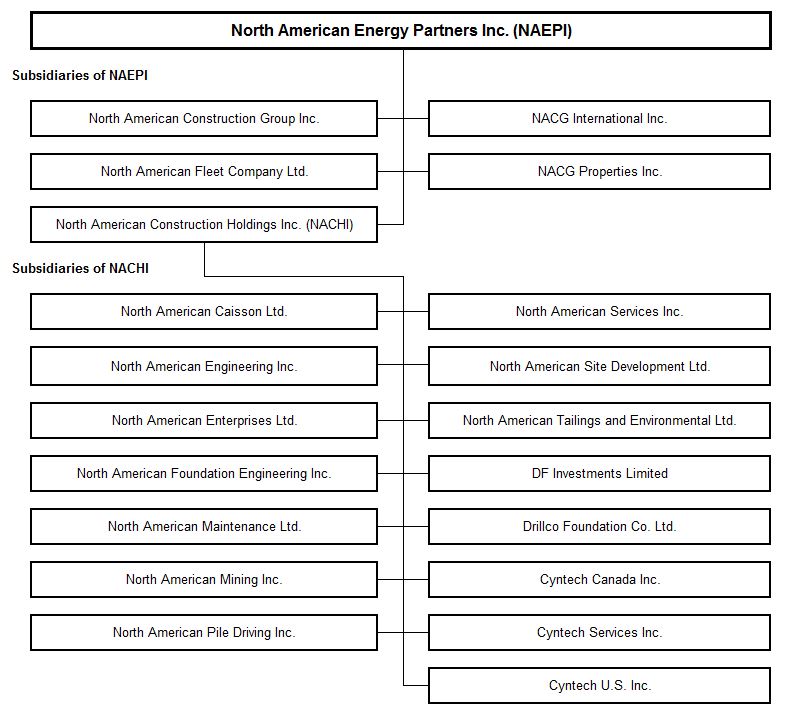
NAEPI and the Subsidiaries are all corporations subsisting under the Business Corporations Act (Alberta), except NACGI, NACG International Inc. and North American Foundation Engineering Inc., which are corporations subsisting under the Canada Business Corporations Act, Drillco Foundation Co. Ltd. and DF Investments Limited, which are corporations subsisting under the Business Corporations Act (Ontario) and Cyntech U.S. Inc., which is a corporation subsisting under the Texas Business Organizations Code.
2013 Annual Information Form | 3 |
C. OUR BUSINESS
Business Overview
We provide a wide range of mining and heavy construction services to customers in the resource development and industrial construction sectors, primarily within Western Canada.
Our core market is the Canadian oil sands, where we provide construction and operations support services through all stages of an oil sands project's lifecycle. We have extensive construction experience in both mining and in situ oil sands projects and we have been providing operations support services to the five producers currently mining bitumen in the oil sands since inception of their respective projects: Syncrude2, Suncor3, Shell4, Imperial Oil5 and Canadian Natural. We focus on building long-term relationships with our customers and in the case of Syncrude and Suncor, these relationships span over 30 years. For a discussion on our revenue by source and revenue by end market refer to the "Our Business - Revenue by Source" and "Our Business - Revenue by End Market" sections of our most recent annual MD&A, which sections are expressly incorporated by reference into this AIF.
We believe that we operate the largest fleet of equipment of any contract resource services provider in the oil sands. Our total fleet (owned, leased and rented) includes approximately 516 pieces of diversified heavy construction equipment supported by over 455 pieces of ancillary equipment. We have a specific capability operating in the harsh climate and difficult terrain of northern Canada, particularly in the Canadian oil sands.t
While our services are primarily focused on the oil sands, we believe that we have demonstrated our ability to successfully apply our oil sands knowledge and technology and put it to work in other resource development projects. We believe we are positioned to respond to the needs of a wide range of other resource developers and we remain committed to continue expanding our operations outside of the Canadian oil sands.t
We believe that our excellent safety record, coupled with our significant oil sands knowledge, experience, long-term customer relationships, equipment capacity, scale of operations and broad service offering, differentiate us from our competition and provide significant value to our customers.t
Operations Overview
Our services are primarily focused on supporting the construction and operation of surface mines, particularly in the oil sands, with a focus on:
•site clearing and access road construction;
•site development and underground utility installation;
•construction and relocation of mine site infrastructure;
•stripping, muskeg removal and overburden removal;
•heavy equipment and labour supply;
•material hauling; and
•mine reclamation and tailings pond construction.
In addition, we provide site development services for plants and refineries, including in situ oil sands facilities.
We maintain our large diversified fleet of heavy equipment and ancillary equipment from our three significant maintenance and repair centers, two based in Fort McMurray, Alberta on our customer's mine sites and one based near Edmonton, Alberta. In addition, we operate running maintenance and repair facilities at each of our customer's oil sands mine sites.
2 Syncrude Canada Ltd. (Syncrude) - operator of the oil sands mining and extraction operations for the Syncrude Project, a joint venture amongst Canadian Oil Sands Limited (37%), Imperial Oil Resources (25%), Suncor Energy Oil and Gas Partnership (12%), Sinopec Oil Sands Partnership (9%), Nexen Oil Sands Partnership (7%), Murphy Oil Company Ltd. (5%) and Mocal Energy Limited (5%).
3 Suncor Energy Inc. (Suncor).
4 Shell Canada Energy (Shell), a division of Shell Canada Limited, which is the operator of the oil sands mining and extraction operations on behalf of Athabasca Oil Sands Project (AOSP), a joint venture amongst Shell Canada Limited (60%), Chevron Canada Limited (20%) and Marathon Oil Corporation (20%).
5 Imperial Oil Resources Limited. (Imperial Oil).
t This paragraph contains forward-looking information. Please refer to "Forward-Looking Information, Assumptions and Risk Factors" for a discussion of the risks and uncertainties related to such information.
4 | 2013 Annual Information Form |
NOA
Competitive Strengths
We believe our competitive strengths are as follows:
Leading market position in contract mining services
We believe we are the largest provider of contract mining services in the Canadian oil sands. We have operated in Western Canada for over 60 years and have participated in every significant oil sands mining project since operators first began developing this resource over 30 years ago. This has given us extensive experience operating in the challenging working conditions created by the harsh climate and difficult terrain of the oil sands and Northern Canada. We have amassed what we believe is the most diverse fleet of any contract services provider in the oil sands. We believe the combination of our significant size, extensive experience and broad service offerings makes us one of only a few companies capable of taking on long-term, large-scale mining and heavy construction projects in the oil sands.t
Large, well-maintained equipment fleet
As of March 31, 2013, we had a heavy equipment fleet of approximately 675 owned, leased and rented units, made up of shovels, excavators, trucks and dozers as well as loaders, graders and scrapers. We believe we have an unmatched, modern fleet of equipment to service our clients' needs. Our fleet includes some of the largest shovels in the world, which are designed for use in some of the largest earthmoving and mining applications globally. Being the only contractor in the oil sands to operate shovels of this size and one of only a few contractors to operate trucks larger than 240 tons capacity gives us a competitive advantage with respect to both skill base and equipment availability. The size and diversity of our fleet provides us with the potential to respond on short notice and provide customized fleet solutions for each specific job.t
A well-maintained fleet is critical in the harsh climatic and environmental conditions we encounter. Our significant maintenance and repair center on one of our customers' oil sands sites is capable of accommodating the largest pieces of equipment in our fleet. Our major repair facility located near Edmonton, Alberta can perform similar major maintenance and repair activities as our facility in the oil sands and provides back-up maintenance and repair requirements for oil sands equipment. In addition, we operate running repair and maintenance facilities on each of our customer's oil sands sites. We believe our combination of onsite and offsite service capabilities increases our efficiency. This, in turn, reduces costs and increases our equipment utilization, thereby enhancing our competitive edge and profitability.t
Broad service offering across a project’s lifecycle
We are considered to be a “first-in, last-out” service provider in the oil sands because we provide services through the entire lifecycle of an oil sands project. Our work typically begins with the initial consulting services provided during the planning phase, including review of constructability, engineering and budgeting. This leads into the construction phase during which we provide a fuller range of services, including clearing, muskeg removal, site preparation, mine infrastructure construction and underground utility installation. As the mine moves into production, we support the preparation of the mine by providing ongoing site maintenance and upgrading, equipment and labour supply, overburden removal and land reclamation. Given the long-term nature of oil sands projects, we believe that our broad service offering has enabled us to establish ongoing relationships with our customers through a continuous supply of services as we transition from one stage of the project to the next.t
Long-term customer relationships
We have established strong, long-term relationships with major oil sands producers and conventional oil and gas producers. Our largest customers are producers mining bitumen in the oil sands and we have worked with each of these customers since they began operations in the oil sands. In the case of Syncrude and Suncor, our relationships date back over 30 years. The longevity of our customer relationships reflects our ability to deliver a strong safety and performance record, a well-maintained, highly capable fleet with specific equipment dedicated to individual customers and a staff of well-trained, experienced supervisors, operators and mechanics. In addition, our practice of maintaining offices and maintenance facilities directly on most of our oil sands customers' sites enhances the relationship. Our proximity and close working relationships typically result in advance notice of projects, enabling us to anticipate our customers' needs and align our resources accordingly.
t This paragraph contains forward-looking information. Please refer to "Forward-Looking Information, Assumptions and Risk Factors" for a discussion of the risks and uncertainties related to such information.
2013 Annual Information Form | 5 |
NOA
Operational flexibility
The combination of our onsite fleets and relationships with multiple oil sands operators makes it possible for us to easily and cost-efficiently transfer equipment and other resources among projects. This keeps us highly responsive to customer needs and is essential in providing operational support services, where lead times are short and the work loads are highly variable. This also serves as a barrier to potential new competitors who may be unable to dedicate a fleet of equipment to the region without the security of a long-term contract. The fact that we work on every major site in the oil sands contributes to our flexibility, enhances the stability of our business model and enables us to continue bidding profitably on new contracts.
Our Strategy
Our strategy is to be an integrated service provider of choice for the developers and operators of resource-based industries in a broad and often challenging range of environments. We will implement this strategy with the following tactics:
• | Enhance safety culture: We are committed to elevating the standard of excellence in health, safety and environmental protection with continuous improvement along with greater accountability and compliance. Our aim is to have zero incidents. |
• | Increase customer satisfaction: We intend to continue strengthening our relationships with new and existing customers to win an increased share of the services outsourced in connection with their projects. |
• | Improve productivity and profitability: We plan to increase productivity and profitability by identifying operating efficiencies, reducing direct and indirect costs and right-sizing our equipment fleet. |
• | Improve cash flow: We expect to manage our profitability, working capital and capital investments to ensure positive cash flow generation. |
• | Strengthen the balance sheet: We intend to continue with our disciplined debt reduction program to increase financial capacity and support future growth. |
• | Increase our presence outside the oil sands: We intend to extend our services to other resource industries across Canada. Canada has significant natural resources and we believe that we have the equipment and the expertise to assist with extracting those resources. |
Significant Business Events
The following is a summary of the significant business events that have influenced our business over the past three years:
• | At the start of fiscal 2013, we established a set of strategic priorities to better serve our customers and restore shareholder confidence and value. These priorities are: |
1. | strengthen our balance sheet and liquidity; |
2. | significantly lower our cost structure; |
3. | improve the risk profile of our business; and |
4. | regain profitability. |
Our tactics to achieve these priorities included the investigation of a possible sale of our piling and pipeline businesses, fleet right-sizing, debt restructuring, organizational restructuring and cost-reduction initiatives. For a discussion of the achievements on our strategic initiatives see the “Significant Business Events” section of our annual MD&A, which section is expressly incorporated by reference into this AIF.
• | Demand for our services has been impacted by a more cautious approach by the oil sands industry to capital spending. In some cases, this has resulted in delayed project approvals and construction start dates. We have also seen our customers take a more disciplined approach to project engineering and construction in an effort to better control costs and we have seem a shift towards phased project construction, resulting in smaller contract awards. We have been successful, however, in securing a significant share of the construction contracts in the sector and maintaining a strong project backlog with awards at new and existing oil sands mines and various in situ projects. Over the past three years we have been awarded construction contracts with major oil sands customers including: |
•contracts for the shear key and MSE wall for the Mildred Lake Mine Relocation Project;
•the initial earthworks contract for the Joslyn North Mine Project;
6 | 2013 Annual Information Form |
NOA
• | the initial site development contract for the BlackGold steam assisted, gravity driven ("SAGD") Project; |
•the initial site development contract for the Kirby SAGD Project; and
•the initial site development contract for the MacKay River SAGD Project.
• | Overall industry demand for operations support services in the oil sands has remained relatively steady over the past three years, although we have seen a decline in our operations support services revenues as a result of increased competition and insourcing of certain services. Despite this, we have been awarded several new multi-year operations support services agreements over the past few years with major oil sands customers including: |
•a four-year master services agreement at the Mildred Lake Mine;
•a five-year master services agreement at the Millennium and Steepbank Mines; and
•a five-year master services agreement at the Kearl Mine
• | In addition to these master services contracts, we reached an agreement in 2012 on amendments to our 10-year overburden removal and tailings dyke construction services contract with Canadian Natural (“the Canadian Natural contract”). The amending agreement included a $34.1 million settlement of past claims under the original contract. The general terms of the original contract related to work scope remained in place; however, these services are now being performed under a revised payment structure that carries less risk to us than the unit-rate structure it replaces. The new payment structure carries a base margin and provides for the opportunity to enhance margins, by meeting mutually agreed upon performance targets. |
• | As part of our evaluation of operations, we made the decision to investigate the possible sale ("Piling Sale") of our piling related assets and liabilities and exit the piling, foundation, pipeline anchor and tank services businesses. On June 10, 2013, we reached an agreement with Keller Group plc (the "Keller Group" or the "Purchaser") to sell our piling assets for consideration of $227.5 million, plus or minus customary working capital adjustments, less approximately $5.0 million for the assumption of capital leases. In addition, we will receive up to $92.5 million in additional proceeds, contingent on the Purchaser achieving prescribed Consolidated EBITDA thresholds from the assets and liabilities sold. Closing costs for the Piling Sale are expected to be approximately $12.5 million.t |
The first part of the contingent proceeds of up to $57.5 million will be earned over the next two years based upon the Purchaser achieving annual results of $45.0 million in Consolidated EBITDA as follows:
• | A maximum of $30.0 million cash paid no later than September 30, 2014, with the full amount being paid in the event that the business earns annualized Consolidated EBITDA (“First Year Consolidated EBITDA”) of $45.0 million or more in the period from closing to June 30, 2014. The amount payable will be $2 for every $1 that First Year Consolidated EBITDA is greater than $30.0 million (with the maximum payment of $30.0 million where First Year Consolidated EBITDA is $45.0 million or greater). |
• | A maximum of $27.5 million cash paid no later than September 30, 2015, with the full amount being paid in the event that the business earns Consolidated EBITDA (“Second Year Consolidated EBITDA”) of $45.0 million or more in the period from July 1, 2014 to June 30, 2015. The amount payable will be $1.833 for every $1 that Second Year Consolidated EBITDA is greater than $30.0 million (with the maximum payment of $27.5 million where Second Year Consolidated EBITDA is $45.0 million or greater) |
The $45.0 million annual Consolidated EBITDA target is comparable to our fiscal 2013 Consolidated EBITDA level for the piling business, thus we anticipate that the Purchaser will achieve a minimum of $45.0 million in Consolidated EBITDA in each year. We further anticipate that the piling business will continue to grow under the management of the Purchaser, thus we expect to realize all of these contingent proceeds.t
t This paragraph contains forward-looking information. Please refer to "Forward-Looking Information, Assumptions and Risk Factors" for a discussion of the risks and uncertainties related to such information.
2013 Annual Information Form | 7 |
The remaining contingent proceeds of up to $35.0 million, equal to $0.5 for every $1 by which cumulative Consolidated EBITDA in the period from closing to June 30, 2016 exceeds $135.0 million (with the maximum payment of $35.0 million where Consolidated EBITDA is $205.0 million or greater), will be calculated and paid as follows:
a. | no later than September 30, 2014, the Purchaser will pay the vendor an amount equal to $0.375 for every $1 by which First Year Consolidated EBITDA exceeds $45.0 million;; |
b. | no later than September 30, 2015, the Purchaser will pay the vendor an amount equal to $0.375 for every $1 by which the aggregate of First Year Consolidated EBITDA and Second Year Consolidated EBITDA exceeds $90.0 million, less any monies paid to the vendor under (a) above; and |
c. | no later than September 30, 2016, the Purchaser will pay the vendor an amount equal to $0.5 for every $1 by which the aggregate of First Year Consolidated EBITDA, Second Year Consolidated EBITDA and Consolidated EBITDA for the period from July 1, 2015 to June 30, 2016 exceeds $135.0 million, less any monies paid to the vendor under (a) and (b) above. |
The $45.0 million annual Consolidated EBITDA target is comparable to our fiscal 2013 Consolidated EBITDA level for the piling business. The cumulative two year $90.0 million target and the cumulative three year $135.0 million target are multiples of the one year target. We anticipate that the Purchaser will continue to grow the piling business, resulting in the payment of some or all of these contingent proceeds.t
These contingent proceeds will be recognized as the Consolidated EBITDA targets are achieved. We have retained the right to verify the Consolidated EBITDA reported by the Purchaser during the period for which the contingent proceeds are being calculated.
The Piling Sale is subject to the Purchaser obtaining final majority shareholder and certain anti-trust approvals. We expect these conditions to be met and the Piling Sale to close in the first half of fiscal 2014.t
The Piling Sale includes all piling related:
• | property, plant and equipment; |
• | intangible assets; |
• | working capital (excluding the outstanding accounts receivable and unbilled revenue on a certain customer contract); and |
• | capital and operating lease commitments. |
We expect to recognize a gain from the sale of assets, net of a $32.9 million reduction in goodwill, related to the piling business. For a discussion on the assets and liabilities held for sale as at March 31, 2013, see "Summary of Consolidated Financial Position", in our most recent MD&A.t
Upon closing the sale of the piling related assets and liabilities, a portion of the net proceeds will be used to repay the outstanding balance of the Term A Facility which, at March 31, 2013, was $17.2 million.t
For all periods presented, piling results are now reported within "Income (loss) from discontinued operations, net of tax" in our Consolidated Statements of Operations and Comprehensive Loss and "Cash provided by (used in) discontinued operations" in our Consolidated Statements of Cash Flows. The assets and liabilities associated with the Piling Sale have been classified as held for sale on our Consolidated Balance Sheet. Prior to the Piling Sale, activity in the piling business was reported as part of the Commercial and Industrial Construction segment.
For a discussion of our results from discontinued operations related to piling activity see "Financial Results - Net Gain (Loss) from Discontinued Operations" in our most recent MD&A.
t This paragraph contains forward-looking information. Please refer to "Forward-Looking Information, Assumptions and Risk Factors" for a discussion of the risks and uncertainties related to such information.
8 | 2013 Annual Information Form |
NOA
D. PROJECTS, COMPETITION AND MAJOR SUPPLIERS
Active Projects
Canadian Natural: Horizon Mine
Canadian Natural completed construction of its Horizon Oil Sands Project and achieved first oil production in early 2009. This oil sands mining project has a targeted production capacity of 110,000 barrels per day (“bbl/d”) from Phase 1. Canadian Natural has plans to ultimately increase total production capacity to 500,000 bbl/d through future expansions. Phase 2 of the mine expansion plan is progressing under a staggered construction scenario and Phase 3 is currently in the planning stages.
We have been working at the Horizon mine since 2005 under a 10-year contract with Canadian Natural to remove approximately 400 million bank cubic meters (“BCM”) of overburden and use 300 million BCM of that material to build a tailings dyke at the site. Our contract was amended in March 2012 and expires June 30, 2015. For further description of the Canadian Natural contract and amendment, see “Significant Business Event - Canadian Natural Contract” in our annual MD&A, which section is expressly incorporated by reference into this AIF.
Shell: Muskeg River Mine and Jackpine Mine
Shell's operations at the Athabasca Oil Sands Project include the Muskeg River Mine, which has a target production capacity of 155,000 bbl/d and the Jackpine Mine, which has a target production capacity of 100,000 bbl/d. Future planned mining expansions, while not imminent, are expected to potentially increase total production capacity to 500,000 bbl/d.t
In June 2009, we were awarded a three-year earthmoving and mine support master services agreement with Shell, which was recently extended to September 2013 with a further extension currently being negotiated. The agreement covers the provision of operations support services including construction, earthmoving and mine support and replaced an expiring two-year master services agreement. This type of work is typically performed under a time-and-materials arrangement and is not reflected in our reported backlog.
Suncor: Steepbank Mine and Millennium Mine
Suncor's current mining operation includes the Steepbank and Millennium mines. Following their merger with Petro-Canada and a strategic alliance with Total, Suncor's mineral assets have expanded to include a 40.8% interest in the Fort Hills oil sands project and a 36.8% interest in the Total-operated Joslyn North Mine project. In July 2011, we were awarded a five-year master services agreement to provide reclamation, overburden removal, civil construction and mine services at Suncor's Steepbank and Millennium oil sands mines.
Syncrude: Base Mine and Aurora Mine
Syncrude's current mining operations include Base Mine (Mildred Lake) and Aurora Mine, which have a current combined production capacity of approximately 350,000 bbl/d. Further planned expansions include the development of a new mine, MLX, on the existing Base Plant lease by 2020 and Aurora South, which is expected to potentially increase total production capacity to 600,000 bbl/d by 2025.t
In November 2010, Syncrude awarded us a new four-year mining service contract, which enables us to execute various types of projects for this customer. Construction work authorizations are issued for each piece of work under both time-and-materials and unit-price arrangements and are generally not reflected in our reported backlog.
In 2012, we completed the shear key foundation as part of the first phase of the "Mildred Lake Mine Relocation" project at Syncrude's Base Mine. We are now working on the second phase of the relocation project, which includes construction of a mechanically stabilized earth (MSE) wall as well as significant corridor, haul road and other heavy civil scopes. We expect to complete this project in late 2013.t
t This paragraph contains forward-looking information. Please refer to "Forward-Looking Information, Assumptions and Risk Factors" for a discussion of the risks and uncertainties related to such information.
2013 Annual Information Form | 9 |
Total E&P Canada6: Joslyn North Mine
The Joslyn North Mine Project is currently in the Front End Engineering Design (FEED) stage and is not expected to commence production until 2018.t
We are currently completing the initial earthworks at the Joslyn North Mine Project, including clearing the site, ditching and establishing access (roads, drainage etc.) in preparation for the planned future construction of the mine and extraction facility. Work under the current contract was awarded in November 2011 and is expected to be completed in December 2013.t
Imperial Oil: Kearl Mine
The Kearl oil sands project is jointly owned between Imperial Oil (operator) and ExxonMobil Canada with an initial target production capacity of approximately 110,000 bbl/d. The project has regulatory approval for up to 345,000 bbl/d of production.
In November 2012, we signed a five-year master services agreement to provide civil mine support services at the Kearl site.
Consumer's Co-operative Refinery Limited7: Tank Farm Project
In July 2009, we were awarded the Consumer's Co-operative Refinery Limited heavy oil upgrader revamp and expansion project in Regina, Saskatchewan. Work continues on this site as we complete tank farm earthworks construction, associated piping and pipelines and other heavy civil works as required by the client under an open services agreement.
Recently Completed Projects
Dover Operating Corp8: The MacKay River Commercial Project
The MacKay River Commercial Project is a SAGD project operated by Dover Operating Corp. Phase one is currently under construction and approved for 35,000 bbl/d of production capacity. This company is planning to eventually take production to 150,000 bbl/d barrels per day at this property.
In November 2011, we were awarded two separate contracts for the MacKay River SAGD project, located 60 kilometers northwest of Ft. McMurray, AB. The contract with Dover Operating Corp covers the plant site grading and gravel work, as well as construction of the water well road and well pads. Construction began in February 2012 and was completed in Fall 2012.
Thompson Creek9: Mt. Milligan Copper / Gold Mine Project
We completed facility construction work at the Mt. Milligan Copper/Gold Project in northern British Columbia in December 2012. The contract covered the erection of more than 7,000 tonnes of structural steel, as well as the installation of cladding and insulated roofing panels for new mill concentrator facilities at the mine.
Competition
The majority of our new business is secured through formal bidding processes in which we are required to compete against other suppliers. Factors that impact success on competitive bids include price, safety, reliability, scale of operations, equipment and labour availability and quality of service.
We have seen a change in our competitive environment and customer behavior in the oil sands over the past three years. As a result of the growing discount in the Alberta crude oil market price per barrel, oil sands operators shifted their focus from controlling schedules to controlling costs which has resulted in some of our customers delaying planned mine development and insourcing mine services activity that would previously have been exclusively outsourced. These cost saving measures by our customers have resulted in a noticeable reduction in tendered operations support services and an increase in competition on oil sands project bids during the year ended March 31, 2013.
6 Total E&P Canada Ltd. (Total), a wholly owned subsidiary of Total SA.
t This paragraph contains forward-looking information. Please refer to "Forward-Looking Information, Assumptions and Risk Factors" for a discussion of the risks and uncertainties related to such information.
7 Consumers Co-operative Refinery Limited (CCRL) is a wholly owned subsidiary of Federation Co-operatives Limited.
8 Dover Operating Corp is a joint venture between Athabasca Oil Corp. and PetroChina Company Limited that was established in June 2010.
9 Thompson Creek Metals Company Inc., owner of the Mt. Milligan Copper / Gold project in central British Columbia.
10 | 2013 Annual Information Form |
NOA
Our principal competitors include Klemke Mining Corporation, Aecon Group Inc., Graham Construction Ltd, Ledcor Construction Limited (“Ledcor”), Peter Kiewit and Sons Co. Ltd., Sureway Construction Ltd. and Thompson Bros (Constr) Ltd. In underground utilities installation, Voice Construction Ltd., Ledcor and IGL Canada, KBR Inc., JV Driver Projects Inc. and PCL Constructors Inc. are our major competitors.
Major Suppliers
We have long-term relationships with the following equipment suppliers: Finning International Inc. (over 45 years), Wajax Corporation (over 20 years), Brandt Tractor Ltd. (over 30 years) and SMS Equipment (over 5 years). Finning is the Caterpillar heavy equipment supplier for Alberta and Caterpillar equipment and makes up the majority of our mining fleet. Wajax is the Hitachi equipment supplier of Excavators and Shovels for both mining and construction, Brandt Tractor is the Alberta supplier for John Deere construction Excavators, SMS Equipment is the Komatsu equipment supplier for Canada and supports a fleet of large mining trucks. In addition to the supply of new equipment, each of these companies is a major supplier for equipment rentals, parts and service labour. We are also actively working with these suppliers to identify cost savings opportunities, including opportunities to reduce our rental fleet and focus on parts management.
We have a Tire Agreement with Bridgestone plus additional allocation from Michelin and Goodyear which have allowed us to maintain tire inventories to keep our fleet fully operational. Tire availability has improved with the change in the global economy however this availability is considered to be short term. Our inventory is such that we do not anticipate a tire shortage.t
E. RESOURCES AND KEY TRENDS
Fleet and Equipment
We operate and maintain a heavy equipment fleet, including dozers, graders, loaders, mining trucks, shovels, compactors, scrapers and excavators. We also maintain a fleet of ancillary vehicles including various service and maintenance vehicles. Overall, the equipment is in good condition, subject to normal wear and tear. Our credit facility is secured by liens on substantially all of our equipment. We lease some of this equipment under lease terms that include purchase options.
We acquire our equipment in three ways: capital expenditures, capital leases and operating leases (for a discussion on our equipment additions see the “Summary of Consolidated Equipment Additions”, section of our annual MD&A, which section is expressly incorporated by reference into this AIF). The following table sets forth our owned and leased heavy equipment fleet (does not include rental equipment) as at March 31, 2013:
Category | Capacity Range | Horsepower Range | Number Owned | Number Leased | |||||||
Heavy Construction and Mining: | |||||||||||
Articulating trucks | 30 to 40 tons | 305 ‑ 406 | 19 | 10 | |||||||
Mining trucks | 40 to 330 tons | 476 ‑ 2,700 | 104 | 46 | |||||||
Shovels | 35‑80 cubic yards | 2,600 ‑ 3,760 | 4 | 2 | |||||||
Excavators | 1 to 29 cubic yards | 90 ‑ 1,944 | 84 | 14 | |||||||
Dozers | 20,741 lbs to 230,100 lbs | 96 - 850 | 71 | 38 | |||||||
Graders | 14 to 24 feet | 150 ‑ 500 | 17 | 8 | |||||||
Loaders | 1.5 to 16 cubic yards | 110‑ 690 | 50 | 2 | |||||||
Packers | 14,175 to 68,796 lbs | 216 ‑3 15 | 6 | — | |||||||
Articulating Water Trucks | 8,000 gallon | 406,000 | 3 | — | |||||||
Scraper Water Wagons | 10,000 gallon | 462,000 | 2 | — | |||||||
Float Trucks | 250 tons | 703,000 | 4 | — | |||||||
Heavy Oil Recovery Barge | 30,000 US gal per hour | 125,000 | 9 | — | |||||||
Tractors | 43,000 lbs | 460,000 | 2 | — | |||||||
Total | 375 | 120 | |||||||||
t This paragraph contains forward-looking information. Please refer to "Forward-Looking Information, Assumptions and Risk Factors" for a discussion of the risks and uncertainties related to such information.
2013 Annual Information Form | 11 |
For the fiscal years ended March 31, 2013, 2012 and 2011 we incurred expenses of $193.8 million, $220.7 million and $234.9 million, respectively, to maintain our equipment.
Facilities
We own and lease a number of buildings and properties for use in our business, the locations of which were chosen for their geographic proximity to our major customers. Our corporate offices are located in Acheson, Alberta. Our primary administrative functions are carried out from offices in Edmonton, Alberta and Acheson, Alberta, where we also have a major equipment maintenance facility. Additional project management and equipment maintenance functions are carried out from leased and owned regional facilities in Fort McMurray, Alberta. The following table describes our primary facilities:
Location | Function | Owned or Leased | Lease Expiration Date | |||
Acheson, Alberta (Corporate Office) | Corporate head office, Administrative office and major equipment repair facility | Leased | 11/30/2017 | |||
Edmonton, Alberta (Mayfield) | Administrative and operations support office | Leased | 3/31/2017 | |||
Fort McMurray, Alberta (Timberlea) | Regional office for mining operations | Leased | 2/28/2022 | |||
Fort McMurray, Alberta (Canadian Natural site) | Site office and maintenance facility | Facility and land provided by customer | Term of CNRL contract (6/30/2014) | |||
Fort McMurray, Alberta (Syncrude Ruth Lake site) | Regional office and maintenance facility for all operations | Building owned, land provided | 8/31/2021 | |||
Credit Facilities
For a description of our credit facilities, see the “Credit Facilities” section of our annual MD&A, which section is expressly incorporated by reference into this AIF.
Variability of Results
A number of factors have the potential to contribute to variations in our quarterly financial results between periods, including:
• | the timing and size of capital projects undertaken by our customers on large oil sands projects; |
• | seasonal weather and ground conditions; |
• | the timing of equipment maintenance and repairs; |
• | claims and change-orders; and |
• | the accounting for unrealized non-cash gains and losses related to foreign exchange and derivative financial instruments. |
For a description of our variability of results, see the “Summary of Quarterly Results” section of our annual MD&A, which section is expressly incorporated by reference into this AIF.
F. LEGAL AND LABOUR MATTERS
Laws and Regulations and Environmental Matters
Many aspects of our operations are subject to various federal, provincial and local laws and regulations, including, among others:
• permit and licensing requirements applicable to contractors in their respective trades;
• building and similar codes and zoning ordinances;
• laws and regulations relating to consumer protection; and
• laws and regulations relating to worker safety and protection of human health.
12 | 2013 Annual Information Form |
NOA
We believe that we have all material required permits and licenses to conduct our operations and are in substantial compliance with applicable regulatory requirements relating to our operations. Our failure to comply with the applicable regulations could result in substantial fines or revocation of our operating permits.t
Our operations are subject to numerous federal, provincial and municipal environmental laws and regulations, including those governing the release of substances, the remediation of contaminated soil and groundwater, vehicle emissions and air and water emissions. Federal, provincial and municipal authorities, such as Alberta Environment, Saskatchewan Environment, the British Columbia Ministry of Environment, Ontario Ministry of the Environment and other governmental agencies, administer these laws and regulations. The requirements of these laws and regulations are becoming increasingly complex and stringent and meeting these requirements can be expensive.
The nature of our operations and our ownership or operation of property exposes us to the risk of claims with respect to environmental matters and there can be no assurance that material costs or liabilities will not be incurred in relation to such claims. For example, some laws can impose strict joint and several liability on past and present owners or operators of facilities at, from or to which a release of hazardous substances has occurred, on parties who generated hazardous substances that were released at such facilities and on parties who arranged for the transportation of hazardous substances to such facilities. If we were found to be a responsible party under these statutes, we could be held liable for all investigative and remedial costs associated with addressing such contamination, even though the releases were caused by a prior owner or operator or third party. We are not currently named as a responsible party for any environmental liabilities on any of the properties on which we currently perform or have performed services. However, our leases typically include covenants that obligate us to comply with all applicable environmental regulations and to remediate any environmental damage caused by us to the leased premises. In addition, claims alleging personal injury or property damage may be brought against us if we cause the release of or any exposure to harmful substances.
Our construction contracts require us to comply with environmental and safety standards set by our customers. These requirements cover such areas as safety training for new hires, equipment use on site, visitor access on site and procedures for dealing with hazardous substances.
Capital expenditures relating to environmental matters during the fiscal years ended March 31, 2011, 2012 and 2013 were not material. We do not currently anticipate any material adverse effect on our business or financial position because of future compliance with applicable environmental laws and regulations. Future events, however, such as changes in existing laws and regulations or their interpretation, more vigorous enforcement policies of regulatory agencies or stricter or different interpretations of existing laws and regulations may require us to make additional expenditures which may or may not be material.t
Legal Proceedings and Regulatory Actions
From time to time, we are a party to litigation and legal proceedings that we consider to be a part of the ordinary course of business. While no assurance can be given, we believe that, taking into account reserves and insurance coverage, none of the litigation or legal proceedings in which we are currently involved or know to be contemplated could reasonably be or could likely be considered important to a reasonable investor in making an investment decision, expected to have a material adverse effect on our business, financial condition or results of operations. We may, however, become involved in material legal proceedings in the future that could have such a material adverse effect.t
Employees and Labour Relations
As at March 31, 2013, we had approximately 390 salaried employees and approximately 1,450 hourly employees in our ongoing operations (approximately 110 salaried employees and approximately 350 hourly employees in our piling discontinued operations). Our hourly workforce fluctuates according to the seasonality of our business and the staging and timing of projects by our customers. The hourly workforce for our ongoing operations typically ranges in size from 1,000 employees to approximately 1,400 employees depending on the time of year and duration of awarded projects. We also utilize the services of subcontractors in our business. Subcontractors perform an estimated 7% to 10% of the work we undertake. As at March 31, 2013, approximately 1,000 of the hourly employees in our ongoing operations are members of various unions and work under collective bargaining agreements.
t This paragraph contains forward-looking information. Please refer to "Forward-Looking Information, Assumptions and Risk Factors" for a discussion of the risks and uncertainties related to such information.
2013 Annual Information Form | 13 |
The majority of our work in our ongoing operations is carried out by employees governed by our mining overburden collective bargaining agreement with the International Union of Operating Engineers (IUOE) Local 955, the primary term of which expires on March 31, 2015. Other collective agreements in effect include the provincial Industrial, Commercial and Institutional (ICI) agreement in Alberta. The provincial collective agreement between the Operating Engineers in Alberta and the Alberta Roadbuilders and Heavy Construction Association (ARBHCA) expires February 28, 2015.
We believe that our relationships with all our employees, both union and non-union, are strong. We have not experienced a strike or lockout.
G. DESCRIPTION OF SECURITIES, RIGHTS PLANS AND AGREEMENTS
Some of the statements contained herein are summaries of the material provisions of our articles of amalgamation relating to dividends, distribution of assets upon dissolution, liquidation or winding up. A copy of our articles of amalgamation can be found on www.sedar.com.
Capital Structure
We are authorized to issue an unlimited number of Voting Common Shares and an unlimited number of Non-Voting Common Shares. As at June 10, 2013, there were 36,251,006 voting Common Shares outstanding. We had no Non-Voting Common Shares outstanding as at June 10, 2013.
Voting Common Shares
Each voting common share has an equal and ratable right to receive dividends to be paid from our assets legally available therefore when, as and if declared by our board of directors.
In the event of our dissolution, liquidation or winding up, the holders of common shares are entitled to share equally and ratably in the assets available for distribution after payments are made to our creditors. Holders of common shares have no pre-emptive rights or other rights to subscribe for our securities. Each common share entitles the holder thereof to one vote in the election of directors and all other matters submitted to a vote of shareholders, and holders of common shares have no rights to cumulate their votes in the election of directors.
Non-Voting Common Shares
Except as prescribed by Canadian law and except in limited circumstances, the non-voting common shares have no voting rights but are otherwise identical to the voting common shares in all respects. The non-voting common shares are convertible into voting common shares on a share-for-share basis at the option of the holder if it transfers, sells or otherwise disposes of the converted voting common shares: (i) in a public offering of our voting common shares; (ii) to a third party that, prior to such sale, controls us; (iii) to a third party that, after such sale, is a beneficial owner of not more than 2% of our outstanding voting shares; (iv) in a transaction that complies with Rule 144 under the Securities Act of 1933, as amended; or (v) in a transaction approved in advance by regulatory bodies.
Options
Other than the exercise of options under the stock option plan, there have been no issuances of shares.
Dividends
We have not declared or paid any dividends on our common shares since our inception, and we do not anticipate declaring or paying any dividends on our common shares for the foreseeable future. We currently intend to retain any future earnings to finance future growth. Any future determination to pay dividends will be at the discretion of our board of directors and will depend on our financial condition, results of operations, capital requirements and other factors the board of directors considers relevant. In addition, our ability to declare and pay dividends is restricted by our governing statute, as well as the terms of our credit agreement and the indenture that governs our Series 1 Debentures (as defined herein).t
t This paragraph contains forward-looking information. Please refer to "Forward-Looking Information, Assumptions and Risk Factors" for a discussion of the risks and uncertainties related to such information.
14 | 2013 Annual Information Form |
NOA
Trading Price and Volume
The following tables summarize the highest trading price, lowest trading price and volume for our common shares on the Toronto Stock Exchange (“TSX”) (in Canadian dollars) and on the New York Stock Exchange (“NYSE”) (in US dollars) on a monthly basis from April 1, 2012 to May 31, 2013:
Toronto Stock Exchange | |||||||||
Date | High ($) | Low ($) | Volume | ||||||
May 2013 | 4.65 | 3.61 | 80,417 | ||||||
April 2013 | 4.69 | 4.00 | 120,755 | ||||||
March 2013 | 4.76 | 4.30 | 95,357 | ||||||
February 2013 | 4.63 | 3.72 | 349,366 | ||||||
January 2013 | 3.95 | 3.32 | 310,994 | ||||||
December 2012 | 3.88 | 3.17 | 143,304 | ||||||
November 2012 | 3.90 | 2.94 | 424,372 | ||||||
October 2012 | 3.26 | 2.76 | 405,636 | ||||||
September 2012 | 3.04 | 2.40 | 149,778 | ||||||
August 2012 | 3.12 | 2.37 | 396,734 | ||||||
July 2012 | 3.01 | 2.56 | 487,944 | ||||||
June 2012 | 3.15 | 2.47 | 606,506 | ||||||
May 2012 | 4.00 | 2.31 | 435,648 | ||||||
April 2012 | 5.03 | 3.85 | 143,430 | ||||||
New York Stock Exchange | |||||||||
Date | High ($) | Low ($) | Volume | ||||||
May 2013 | 4.50 | 3.57 | 1,239,979 | ||||||
April 2013 | 4.63 | 3.95 | 941,195 | ||||||
March 2013 | 4.70 | 4.30 | 1,933,723 | ||||||
February 2013 | 4.52 | 3.71 | 2,632,862 | ||||||
January 2013 | 3.94 | 3.37 | 1,738,401 | ||||||
December 2012 | 3.94 | 3.20 | 1,118,470 | ||||||
November 2012 | 3.84 | 2.92 | 1,017,193 | ||||||
October 2012 | 3.28 | 2.77 | 1,820,835 | ||||||
September 2012 | 3.04 | 2.40 | 1,411,346 | ||||||
August 2012 | 3.13 | 2.38 | 2,609,449 | ||||||
July 2012 | 3.00 | 2.52 | 1,900,925 | ||||||
June 2012 | 3.00 | 2.41 | 3,178,457 | ||||||
May 2012 | 4.06 | 2.23 | 2,314,440 | ||||||
April 2012 | 4.98 | 3.86 | 1,755,320 | ||||||
Shareholder Rights Plan
On October 7, 2011, our Board of Directors adopted a Shareholder Rights Plan Agreement, dated October 7, 2011 (the "Rights Plan") designed to encourage the fair and equal treatment of shareholders in connection with any takeover bid for our outstanding Common Shares. The Rights Plan was included as an exhibit to our Form 8-A, filed with the Securities and Exchange Commission on October 7, 2011. The Rights Plan terminated in accordance with its terms on April 7, 2012.
Registration Rights Agreement
We are party to a registration rights agreement with certain shareholders, including affiliates of each of the significant shareholders, Paribas North America, Inc. and Mr. William Oehmig, one of our directors. The shareholders party to the agreement and their permitted transferees are entitled, subject to certain limitations, to include their common shares in a registration of common shares we initiate under the Securities Act of 1933 (“Securities Act 1933”), as amended. In addition, after the 120th day following our IPO, any one or more
2013 Annual Information Form | 15 |
shareholders party to the agreement has the right to require us to effect the registration of all or any part of such shareholders’ common shares under the Securities Act 1933, referred to as a “demand registration,” so long as the amount of common shares to be registered has an aggregate fair market value of at least US$5.0 million and, at such time, the SEC has ordered or declared effective fewer than four demand registrations initiated by us pursuant to the registration rights agreement. If the aggregate number of common shares that the shareholders party to the agreement request us to include in any registration, together, in the case of a registration we initiate, with the common shares to be included in such registration, exceeds the number which, in the opinion of the managing underwriter, can be sold in such offering without materially affecting the offering price of such shares, the number of shares of each shareholder to be included in such registration will be reduced pro rata based on the aggregate number of shares for which registration was requested. The shareholders party to the agreement have the right to require, after four demand registrations, one registration in which their common shares will not be subject to pro rata reduction with others entitled to registration rights.
We may opt to delay the filing of a registration statement required pursuant to any demand registration for:
• | up to 120 days following a request for a demand registration if: |
• | we have decided to file a registration statement for an underwritten public offering of our common shares, from which we expect to receive net proceeds of at least US$20.0 million; or |
• | we have initiated discussions with underwriters in preparation for a public offering of our common shares from which we expect to receive net proceeds of at least US$20.0 million and the demand registration, in the underwriters’ opinion, would have a material adverse effect on the offering; or |
• | up to 90 days following a request for a demand registration if we are in possession of material information that we reasonably deem advisable not to disclose in a registration statement. |
Our right to delay the filing of a registration statement if we possess information that we deem advisable not to disclose does not obviate any disclosure obligations which we may have under The Securities Exchange Act of 1934 or other applicable laws; it merely permits us to avoid filing a registration statement if our management believes that such a filing would require the disclosure of information which otherwise is not required to be disclosed and the disclosure of which our management believes is premature or otherwise inadvisable.
The registration rights agreement contains customary provisions whereby we and the shareholders party to the agreement covenant to indemnify and contribute to each other with regard to losses caused by the misstatement of any information or the omission of any information required to be provided in a registration statement filed under the Securities Act 1933. The registration rights agreement requires us to pay the expenses associated with any registration other than sales discounts, commissions, transfer taxes and amounts to be borne by underwriters or as otherwise required by law.
9.125% Series 1 Debentures
On April 7, 2010, we closed a private placement of 9.125% Series 1 Debentures (as defined below) due 2017 (the "Series 1 Debentures") for gross proceeds of $225.0 million and net proceeds after commissions and related expenses of $218.1 million as part of a debt restructuring plan. Financing fees of $6.9 million were incurred in connection with the Series 1 Debentures and were recorded as deferred financing costs. A more detailed discussion on the debt restructuring can be found in the “Securities, Rights Plans and Agreements - Long-term debt restructuring” section of our annual MD&A.
The Series 1 Debentures are unsecured senior obligations and rank equally with all other existing and future unsecured senior debt and senior to any subordinated debt that may be issued by us or any of our subsidiaries. The Series 1 Debentures are effectively subordinated to all secured debt to the extent of the value of the collateral.
The Series 1 Debentures are redeemable at the option of us, in whole or in part, at any time on or after: April 7, 2014 at 103.042% of the principal amount; April 7, 2015 at 101.520% of the principal amount; April 7, 2016 and thereafter at 100% of the principal amount; plus, in each case, interest accrued to the redemption date.
If a change of control, as defined in the trust indenture, occurs we will be required to offer to purchase all or a portion of each holder's Series 1 Debentures at a purchase price in cash equal to 101% of the principal amount of the debentures offered for repurchase plus accrued interest to the date of purchase.
The Series 1 Debentures are also subject to covenants limiting our ability and the ability of most or all of our subsidiaries: to incur additional debt; pay dividends or distributions on our common shares or repurchase our common shares; make various investments; create liens on our assets to secure debt; enter into transactions with
16 | 2013 Annual Information Form |
NOA
affiliates; consolidate, merge or transfer all or substantially all of our property and assets and the property and assets of our subsidiaries on a consolidated basis; transfer and sell assets; and enter into sale and leaseback transactions. These covenants are subject to exceptions and qualifications that are detailed in the indenture governing the Series 1 Debentures.
We are also required to meet a financial covenant with respect to our Series 1 Debentures that restricts the amount of additional debt that we and our subsidiaries can incur. Specifically, on a pro forma basis taking such additional debt into account, on a consolidated basis our "Consolidated Fixed Charge Coverage Ratio" must be greater than 2.0 to 1.0. The "Consolidated Fixed Charge Coverage Ratio" is approximately the same calculation as the "Interest Coverage" covenant found in our Credit Facility.
The Series 1 Debentures were rated B- by Standard & Poor's and Caa1 by Moody's (see "Debt Ratings").
Debt Ratings
For a discussion of our debt ratings, see the “Debt Ratings” section of our annual MD&A, which section is expressly incorporated by reference in this AIF.
H. Material Contracts
We are party to the following material contracts, which are contracts other than those entered into in the ordinary course of our business, as the same have been amended from time to time:
• | Indemnity Agreement between NACG Holdings Inc., NACG Preferred Corp., North American Energy Partners Inc., North American Construction Group Inc. and their respective officers and directors. Please refer to the most recently filed Notice of Annual and Special Meeting and Management Information Circular (the "management information circular") for details; |
• | Indenture, dated as of April 7, 2010, among North American Energy Partners Inc., the guarantors named therein and CIBC Mellon Trust Company, as Trustee, and Supplemental Indenture dated as of April 7, 2010, among North American Energy Partners Inc., the guarantors named therein and CIBC Mellon Trust Company, as Trustee. Please refer to “Description of Certain Indebtedness – 9.125% Series 1 Debentures” for details; |
• | Registration Rights Agreement, dated as of November 26, 2003, among NACG Holdings Inc. and the shareholders party thereto. Please refer to “Interest of Management and Others in Material Transactions – Registration Rights Agreement” for details; |
• | Amended and Restated 2004 Share Option Plan dated November 3, 2006. Please refer to the most recently filed management information circular for details; |
• | Directors Deferred Share Unit plan, dated January 1, 2008. Please refer to the most recently filed management information circular for details; |
• | Restricted Share Unit plan dated April 1, 2008. Please refer to the most recently filed management information circular for details; |
• | Overburden Removal and Mining Services Contract, dated November 17, 2004, between Canadian Natural Resources Ltd. and Noramac Ventures Inc., with the latter’s interest having been assigned to North American Construction Group Inc. by an Assignment Agreement dated February 27, 2006, all as amended by an Amending Agreement dated March 19, 2012. Please see “Projects – Active Projects – Canadian Natural: Overburden Removal Project; |
• | Lease dated December 1, 1997, between NAR Group Holdings Ltd., as landlord, and North American Construction Group Inc., as tenant, as renewed by a Renewal Lease Agreement dated December 1, 2002, between Norama Inc. (successor to NAR Group Holdings Ltd.), as landlord, and North American Construction Group Inc., as tenant, as amended by a Lease Amendment and Consent Agreement dated November 26, 2003, between Acheson Properties Ltd. (successor to Norama Inc.), as landlord, and North American Construction Group Inc., as tenant, and as further amended by an Amending Agreement to Lease Amendment and Consent Agreement dated September 29, 2006, between Acheson Properties Ltd., as landlord, and North American Construction Group Inc., as tenant. This lease is for our offices in Acheson, Alberta. Please refer to “Resources and Key Trends—Facilities” for details; and |
• | Fourth Amended and Restated Credit Agreement dated as of April 30, 2010, among North American Energy Partners Inc., Canadian Imperial Bank of Commerce, HSBC Bank Canada, and the lenders party thereto from time to time, as amended by that First Amending Agreement dated June 8, 2011, that Second Amending |
2013 Annual Information Form | 17 |
Agreement dated September 30, 2011, that Third Amending Agreement dated March 27, 2012 and that Fourth Amending Agreement dated September 28, 2012. Please refer to “Liquidity – Credit facilities” in our annual MD&A for details.
I. DIRECTORS AND OFFICERS
Director and Officer Information
Each director is elected for a one-year term or until such person’s successor is duly elected or appointed, unless his office is earlier vacated. Unless otherwise indicated below, the business address of each of our directors and executive officers is Zone 3, Acheson Industrial Area, 2-53016 - Hwy. 60, Acheson, Alberta, T7X 5A7. As at June 10, 2013, the directors and executive officers of the Company, as a group, beneficially owned, directly or indirectly, or exercised control or direction over 1,493,316 common shares of the Company (representing approximately 4.1% of all issued and outstanding common shares).
The following table sets forth information about our directors and executive officers. Ages reflected are as at May 31, 2013.
Name and Municipality of Residence | Age | Position | In Role Since | |||
Martin R. Ferron | 56 | President and Chief Executive Officer | June 7, 2012 | |||
Edmonton, Alberta, Canada | ||||||
David Blackley | 52 | Chief Financial Officer | June 10, 2009 | |||
Sherwood Park, Alberta, Canada | ||||||
Joseph C. Lambert | 48 | Chief Operating Officer | June 1, 2013 | |||
St. Albert, Alberta, Canada | ||||||
Barry W. Palmer | 52 | Vice-President, Heavy Construction and Mining Operations | December 15, 2011 | |||
Morinville, Alberta, Canada | ||||||
Ronald A. McIntosh | 71 | Chairman of the Board | May 20, 2004 | |||
Calgary, Alberta, Canada | ||||||
George R. Brokaw | 45 | Director | June 28, 2006 | |||
New York, NY, United States | ||||||
Carl Giesler Jr. | 41 | Director | April 24, 2012 | |||
Houston, Texas United States | ||||||
William C. Oehmig | 63 | Director | May 20, 2004 | |||
Houston, Texas, United States | ||||||
Allen R. Sello | 73 | Director | January 26, 2006 | |||
West Vancouver, British Columbia, Canada | ||||||
Jay W. Thornton | 56 | Director | June 7, 2012 | |||
Calgary, Alberta, Canada | ||||||
Peter W. Tomsett | 55 | Director | September 19, 2006 | |||
West Vancouver, British Columbia, Canada | ||||||
K. Rick Turner | 55 | Director | November 26, 2003 | |||
Houston, Texas, United States | ||||||
Martin R. Ferron joined us as President and Chief Executive Officer and a Director of the Board on June 7, 2012. Previously, Mr. Ferron was Director, President and CEO of Helix Energy Solutions Inc. (Helix), an NYSE listed international energy services company, at which he successfully refocused the company on improved project execution, asset utilization and profit performance. He also transformed Helix through a combination of measured organic growth, acquisitions and divestures, achieving a compound annual EBITDA growth rate of approximately 38% during his tenure with the company. Prior to joining Helix, Mr. Ferron worked in successively more senior management positions with oil services and construction companies including McDermott Marine Construction, Oceaneering International and Comex Group. He holds a B.Sc. in Civil Engineering from City University, London, a M.Sc. in Marine Technology from Strathclyde University, Glasgow and a MBA from Aberdeen University.
18 | 2013 Annual Information Form |
NOA
David Blackley became Chief Financial Officer on June 11, 2009. Mr. Blackley joined us as Vice-President, Finance on January 14, 2008, bringing extensive experience leading accounting and financial reporting teams and overseeing the design and implementation of internal financial controls and processes. Previously Mr. Blackley served as Vice-President, Finance of Lafarge North America’s Aggregates and Concrete division. A Chartered Accountant, Mr. Blackley holds a Bachelor of Commerce from Rhodes University in South Africa.
Joseph C. Lambert became Chief Operating Officer on June 1, 2013. Mr. Lambert joined us as General Manager of Mining in April 2008 after an extensive career in the mining industry. Mr. Lambert was promoted to Vice President, Oil Sands Operations in September of 2010 and accepted the position of Vice President, Operations Support in January 2012. Prior to that, Mr. Lambert's career began in the gold industry where he spent 17 years in roles of increasing responsibility in engineering and operations both open pit and underground. Mr. Lambert's more recent contracting and oil sands experience included positions as General Manager with Ledcor and Mine Development Manager, Oil Sands with Shell. Mr. Lambert graduated from the South Dakota School of Mines and Technology with a B.S. in Mining Engineering in 1986.
Barry W. Palmer became Vice President, Heavy Construction and Mining Operations on December 15, 2011. Mr. Palmer joined us in 1982 as a Heavy Equipment Operator. Since then Mr. Palmer has advanced through the company holding positions of Operations Foreman, General Foreman, Superintendent, Project Manager, Operations Manager and General Manager of Heavy Construction and Mining. Over the course of his 34 years within the construction industry Mr. Palmer has worked in aggregate, road building, civil and heavy construction and mining. Before joining us, Mr. Palmer worked for PCL and Steels of Canada
Ronald A. McIntosh became Chairman of our Board of Directors on May 20, 2004. From January 2004 until August of 2006, Mr. McIntosh was Chairman of NAV Energy Trust, a Calgary-based oil and natural gas investment fund. Between October 2002 and January 2004, he was President and Chief Executive Officer of Navigo Energy Inc. and was instrumental in the conversion of Navigo into NAV Energy Trust. He was Senior Vice President and Chief Operating Officer of Gulf Canada Resources Limited from December 2001 to July 2002 and Vice President, Exploration and International of Petro-Canada from April 1996 through November 2001. Mr. McIntosh's significant experience in the energy industry includes the former position of Chief Operating Officer of Amerada Hess Canada. Mr. McIntosh is on the Board of Directors of Advantage Oil & Gas Ltd. and Alvopetro Inc., formerly known as Fortress Energy Inc.
George R. Brokaw became one of our Directors on June 28, 2006. Mr. Brokaw is a managing director at Highbridge Principal Strategies L.L.C. He was with Perry Capital L.L.C., an affiliate of Perry Corp., between August 2005 and November 2011, and was serving as a Managing Partner of Perry Corp. at the time of his departure. From January 2003 to May 2005, Mr. Brokaw was Managing Director (Mergers & Acquisitions) of Lazard Frères & Co. LLC, which he joined in 1996. Between 1994 and 1996, Mr. Brokaw was an investment banking associate for Dillon Read & Co. Mr. Brokaw received a Bachelor of Arts degree from Yale University and a Juris Doctorate and Masters of Business Administration from the University of Virginia. He is admitted to practice law in the State of New York.
Carl F. Giesler, Jr. became one of our Directors on April 24, 2012. Mr. Giesler is Managing Director of Investments at Harbinger Group Inc. (“HGI”) and previously served as Vice President and Director of Investments at Harbinger Capital Partners LLC (“Harbinger Capital”), an affiliate of HGI. Prior to joining Harbinger Capital in 2008, Mr. Giesler was a Managing Director at AIG Financial Products Corp. (“AIG FP”), where he held a leadership role in pursuing principal investment opportunities in the oil and gas sector. Prior to joining AIG FP, he worked as an investment banker in Morgan Stanley's Global Energy Group. Mr. Giesler is a CFA charter holder and a graduate of Harvard Law School and the University of Virginia.
William C. Oehmig served as Chairman of our Board of Directors from November 26, 2003 and until passing off this position and assuming the role of Director and chair of the Executive Committee on May 20, 2004. He now serves as chairman of the Risk Committee and on the Compensation Committee. Mr. Oehmig's career began at Texas Commerce Bank in Houston in 1974. Mr. Oehmig worked in banking, mergers and acquisitions, and represented foreign investors in purchasing and managing U.S. companies in the oilfield service, manufacturing, distribution, heavy equipment and real estate sectors until 1984, when he became a Partner with The Sterling Group, a private equity investment firm in Houston, Texas. As of July 1 2012, Mr. Oehmig is now an Advisory Partner to the Sterling Group.
Mr. Oehmig currently serves on the board of Universal Fibers Inc. In the past he has served as Chairman of Royster Clark, Purina Mills, Exopack and Sterling Diagnostic Imaging and has served on the board of several portfolio companies since joining Sterling. Mr. Oehmig serves or has served and Chaired on numerous other corporate non-profit boards. Mr. Oehmig received his Bachelor of Business Administration (B.B.A.) in Economics
2013 Annual Information Form | 19 |
from Transylvania University and his Masters of Business Administration (M.B.A.) from the Owen Graduate School of Management at Vanderbilt University.
Allen R. Sello became one of our Directors on January 26, 2006. His career began at Ford Motor Company of Canada in 1964, where he held finance and marketing management positions, including Treasurer. In 1979, Mr. Sello joined Gulf Canada Limited, at which he held various senior financial positions, including Vice-President and Controller. He was appointed Vice-President, Finance of its successor company Gulf Canada Resources Limited in 1987 and Chief Financial Officer in 1988. Mr. Sello then joined International Forest Products Ltd. in 1996 as Chief Financial Officer. From 1999 until his retirement in 2004 he held the position of Senior Vice-President and Chief Financial Officer for UMA Group Limited. Mr. Sello is a former director of Sterling Shoes Inc., Asamera Minerals Inc., software development companies Infowave Software Inc. and Braintech Inc., and former Chair of the Vancouver Board of Trade Government Budget and Finance Committee. Mr. Sello received his Bachelor of Commerce from the University of Manitoba and his Masters of Business Administration from the University of Toronto.
Jay W. Thornton became one of our Directors on June 7, 2012. Mr. Thornton has over 28 years of oil and gas experience. He spent the first part of his career in various management positions with Shell. Over the past 12 years, he has held various operating and corporate executive positions with Suncor Energy, Canada's largest integrated energy company. He spent four years in Fort McMurray at Suncor's Oil Sands mining operations. His most recent position with Suncor was Executive Vice President of Supply, Trading and Development. Mr. Thornton has held previous board positions with both the Canadian Association of Petroleum Producers (CAAP) and the Canadian Petroleum Products Institute (CPPI). He was a past board member of the YMCA Fort McMurray and is currently a member of the board of US-based mining company, Xinergy Ltd., as well as a member of the board of a private Calgary-based oil and gas company. Mr. Thornton is a graduate of McMaster University with an Honours degree in Economics. He is also a recent graduate of the Institute of Corporate Directors (ICD) Directors Education Program.
Peter W. Tomsett became one of our Directors on September 20, 2006. From September 2004 to January 2006, Mr. Tomsett was President & Chief Executive Officer of Placer Dome Inc. based in Vancouver. He joined the Placer Dome Group in 1986 as a Mining Engineer with the Project Development group in Sydney, Australia. After various project and operating positions, he assumed the role of Executive Vice-President, Asia-Pacific for Placer Dome Inc. in 2001. In 2004, Mr. Tomsett also took on responsibility for Placer Dome Africa which included mines in South Africa and Tanzania. Mr. Tomsett has been a Director of the Minerals Council of Australia, the World Gold Council and the International Council for Mining & Metals. Mr. Tomsett graduated with a Bachelor of Engineering (Honours) in Mining Engineering from the University of New South Wales and also attained a Master of Science (Distinction) in Mineral Production Management from Imperial College, London. Mr. Tomsett is also Chairman of Silver Standard Resources Inc. and a director of Talisman Energy Inc. and African Barrick Gold plc.
K. Rick Turner became one of our Directors on November 26, 2003. Mr. Turner recently retired from the Stephens' family entities. Prior to his retirement, Mr. Turner was a private equity principal of the Stephens Group, LLC, a private, family-owned investment firm, since 1990. Mr. Turner is currently active with several private equity groups, most particularly, Maxim Partners, LLC. Mr. Turner has extensive experience investing in companies focused on oil and gas exploration, energy services, natural gas gathering and processing, and power technology. Prior to joining Stephens in 1983, he was employed by Peat, Marwick, Mitchell and Company. Mr. Turner currently serves as a board member for several private companies and two other publicly held companies: Energy Transfer Equity, L.P., and AmeriGas Propane Inc., general partner of AmeriGas Partners, L.P. He formerly served on the board of Energy Transfer Partners, L.P. for over 10 years. Mr. Turner earned his B.S.B.A. from the University of Arkansas and is a non-practicing Certified Public Accountant.
Corporate Cease Trade Orders, Bankruptcies, Penalties or Sanctions
Ronald A. McIntosh is a director of Alvopetro Inc. (Alvopetro), formerly known as Fortress Energy Inc. On March 2, 2011, the Court of Queen's Bench of Alberta granted an order (the “Order”) under the Companies' Creditors Arrangement Act (Canada) ("CCAA") staying all claims and actions against Alvopetro and its assets and allowing Alvopetro to prepare a plan of arrangement for its creditors if necessary. Alvopetro took such step in order to enable Alvopetro to challenge a reassessment issued by the Canada Revenue Agency (“CRA”). As a result of the reassessment, if Alvopetro had not taken any action, it would have been compelled to immediately remit one half of the reassessment to the CRA and Alvopetro did not have the necessary liquid funds to remit, although Alvopetro had assets in excess of its liabilities with sufficient liquid assets to pay all other liabilities and trade payables. Alvopetro believed that the CRA's position was not sustainable and vigorously disputed the CRA's claim. Alvopetro filed a Notice of Objection to the reassessment and on October 20, 2011 announced that its Notice of Objection was successful, CRA having confirmed there were no taxes payable. As the CRA claim had been vacated and no taxes or penalties were owing Alvopetro no longer
20 | 2013 Annual Information Form |
NOA
required the protection of the Order under the CCAA and on October 28, 2011 the Order was removed. On March 3, 2011 the TSX suspended trading in the securities of Alvopetro due to Alvopetro having been granted a stay under the CCAA. In addition the securities regulatory authorities in Alberta, Ontario and Quebec issued a cease trade order with respect to Alvopetro for failure to file its annual financial statements for the year ended December 31, 2010 by March 31, 2011. The delay in filing was due to Alvopetro being granted the CCAA order on March 2, 2011 and the resulting additional time required by its auditors to deliver their audit opinion. The required financial statements and other continuous disclosure documents were filed on April 29, 2011 and the cease trade order was subsequently removed. On September 1, 2010 Alvopetro closed the sale of substantially all of its oil and gas assets. As a result of the sale Alvopetro was delisted from the TSX on March 30, 2011 as it no longer met minimum listing requirements
William C. Oehmig served as a director of Propex Inc., which voluntarily filed for protection under Chapter 11 of the U.S. Bankruptcy Code on January 18, 2008 in order to allow it to restructure its US operations. Mr. Oehmig also served as director of Panolam Industries Inc., which voluntarily filed a petition under Chapter 11 of the U.S. Bankruptcy Code on November 4, 2009 to implement a Debt Restructuring Plan.
Allen R. Sello served as a director of Sterling Shoes Inc. (“Sterling”) until January 22, 2013. Pursuant to orders of the Supreme Court of British Columbia, including an initial order dated October 21, 2011, Sterling and each of its subsidiaries obtained creditor protection under the Companies' Creditors Arrangement Act (Canada), staying all claims and actions against Sterling and its assets and allowing Sterling to conduct a court-approved asset sale. The Sterling assets have since been sold and the resulting proceeds have been distributed to its creditors.
Interest of Management and Others in Material Transactions
Other than as disclosed in the “Related Parties” section of our annual MD&A, which section is expressly incorporated by reference into this AIF, there are no interests of management or others in material transactions.
J. THE BOARD AND BOARD COMMITTEES
Our board supervises the management of our business as provided by Canadian law. We comply with the listing requirements of the New York Stock Exchange applicable to domestic listed companies, which require that our board of directors be composed of a majority of independent directors. Accordingly, a majority of our board members are independent.
Our board has established the following committees:
Audit Committee
The Audit Committee recommends the appointment of independent public accountants to the board of directors, reviews the quarterly and annual financial statements and related MD&A, press releases, auditor reports and the fees paid to our auditors. The Audit Committee approves quarterly financial statements and recommends annual financial statements for approval to the board of directors. In accordance with Rule 10A-3 under the Securities Exchange Act of 1934, as amended, the listing requirements of the New York Stock Exchange and the requirements of the Canadian Securities regulatory authorities, our board of directors has affirmatively determined that our Audit Committee is composed solely of independent directors. The board of directors has determined that Mr. Allen R. Sello is the audit committee financial expert, as defined by Item 407(d) (5) of the SEC’s Regulation S-K. Our board of directors has adopted a written charter for the Audit Committee that is attached as Exhibit A to this AIF. The Audit Committee is currently composed of Messrs. Giesler, Thornton, Sello and Turner, with Mr. Sello serving as Chairman. Based on their experience (see “Directors and Officers” above), each of the members of the Audit Committee is financially literate. The members of the audit committee have significant exposure to the complexities of financial reporting associated with us and are able to provide due oversight and the necessary governance over our financial reporting.
Our auditors are KPMG LLP. Our Audit Committee pre-approved the engagement of KPMG to perform the audit of our financial statements for the year ended March 31, 2013. The fees we have paid to KPMG for services rendered by them include:
• | Audit Fees – KPMG billed us for $878,005, $1,139,900 and $1,130,800 for audit fees during the years ended March 31, 2013, 2012 and 2011, respectively. Audit fees were incurred for the audit of our annual financial statements, the audit of internal controls over financial reporting, related audit work in connection with registration statements and other filings with various regulatory authorities and the quarterly interim reviews of the consolidated financial statements. |
2013 Annual Information Form | 21 |
• | Audit Related Fees – No audit related fees were incurred for the years ended March 31, 2013, 2012 and 2011, respectively. |
• | Tax Fees – No income tax advisory and compliance services fees were incurred for the years ended March 31, 2013, 2012 and 2011, respectively. |
Human Resources and Compensation Committee
The Human Resources and Compensation Committee is responsible for supervising executive compensation policies for us and our Subsidiaries, administering the employee incentive plans, reviewing officers’ salaries, approving significant changes in executive employee benefits and recommending to the board such other forms of remuneration as it deems appropriate. In accordance with the listing requirements of the New York Stock Exchange applicable to domestic listed companies and applicable Canadian securities laws, our board of directors has affirmatively determined that our Human Resources and Compensation Committee is composed solely of independent directors. Our board of directors has adopted a written charter for the Human Resources and Compensation Committee that is available on our website at www.nacg.ca. The Human Resources and Compensation Committee is currently comprised of Messrs. Giesler, Oehmig, Sello and Tomsett, with Mr. Tomsett serving as Chairman. None of the members of the Human Resources and Compensation Committee is or has been one of our officers or employees, and none of our executive officers served during fiscal 2013 on a board of directors of another entity which has employed any of the members of the Human Resources and Compensation Committee.
Governance Committee
The Governance Committee is responsible for recommending to the board of directors proposed nominees for election to the board of directors by the shareholders at annual meetings and for conducting an annual review as to the re-nominations of incumbents and proposed nominees for election by the board of directors to fill vacancies that occur between shareholder meetings. The Governance Committee also makes recommendations to the board of directors regarding corporate governance matters and practices. In accordance with the listing requirements of the New York Stock Exchange applicable to domestic listed companies and applicable Canadian securities laws, our board of directors has affirmatively determined that our Governance Committee is composed solely of independent directors. Our board of directors has adopted a written charter for the Governance Committee that is available on our website at www.nacg.ca. The Governance Committee is currently comprised of Messrs. McIntosh, Brokaw and Turner, with Mr. McIntosh serving as Chairman.
Health, Safety, Environment and Business Risk Committee
The Health, Safety, Environment and Business Risk Committee (the “HSE&B Risk Committee”) is responsible for monitoring, evaluating, advising and making recommendations on matters relating to the health and safety of our employees, the management of our health, safety and environmental risks, due diligence related to health, safety and environment matters, as well as the integration of health, safety, environment, economics and social responsibility into our business practices. The HSE&B Risk Committee is also responsible for overseeing all of our non-financial risks, approving our risk management policies, monitoring risk management performance, reviewing the risks and related risk mitigation plans within our strategic plan, reviewing and approving tenders and contracts greater than $50 million in expected revenue and any other matter where board guidelines require approval at a level above President & CEO, and reviewing and monitoring all insurance policies including directors and officers insurance coverage. Our board of directors has affirmatively determined that our HSE&B Risk Committee is composed solely of independent directors. Our board of directors has adopted a written charter for the HSE&B Risk Committee that is available on our website at www.nacg.ca. The HSE&B Risk Committee is currently comprised of Messrs. Brokaw, Oehmig, Thornton and Tomsett, with Mr. Oehmig serving as Chairman.
K. FORWARD-LOOKING INFORMATION, ASSUMPTIONS AND RISK FACTORS
Forward-Looking Information
This document contains forward-looking information that is based on expectations and estimates as of the date of this document. Our forward-looking information is information that is subject to known and unknown risks, uncertainties, assumptions and other factors that may cause future actions, conditions or events to differ materially from the anticipated actions, conditions or events expressed or implied by such forward-looking information including those listed in the “Forward-Looking Information, Assumptions and Risk Factors” section of our annual MD&A, which section is expressly incorporated by reference into this AIF. Forward-looking information is information that does not relate strictly to historical or current facts and can be identified by the use of the future tense or other
22 | 2013 Annual Information Form |
NOA
forward-looking words such as “believe”, “expect”, “anticipate”, “intend”, “plan”, “estimate”, “should”, “may”, “could”, “would”, “target”, “objective”, “projection”, “forecast”, “continue”, “strategy”, “intend”, “position” or the negative of those terms or other variations of them or comparable terminology.
Examples of such forward-looking information in this document include, but are not limited to, statements with respect to the following, each of which is subject to significant risks and uncertainties and is based on a number of assumptions that may prove to be incorrect:
1. | Our belief that we operate the largest fleet of equipment of any contract resource services provider in the oil sands. |
2. | Our belief that we have demonstrated our ability to successfully apply our oil sands knowledge and technology and put it to work in other resource development projects. |
3. | Our belief that we are positioned to respond to the needs of a wide range of other resource developers. |
4. | Our belief that our excellent safety record, coupled with our significant oil sands knowledge, experience, long-term customer relationships, equipment capacity, scale of operations and broad service offering, differentiate us from our competition and provide significant value to our customers. |
5. | Our belief that we are the largest provider of contract services in the Canadian oil sands. |
6. | Our belief that the combination of our significant size, extensive experience and broad service offerings makes us one of only a few companies capable of taking on long-term, large-scale mining and heavy construction projects in the oil sands. |
7. | Our belief that we have an unmatched, modern fleet of equipment to service our clients' needs. |
8. | Our belief that our combination of onsite and offsite service capabilities increases our efficiency, reduces our costs and increases our equipment utilization, thereby enhancing our competitive edge and profitability. |
9. | Our belief that our combination of onsite and offsite service capabilities increases our efficiency. This, in turn, reduces costs and increases our equipment utilization, thereby enhancing our competitive edge and profitability. |
10. | Our belief that our broad service offering has enabled us to establish ongoing relationships with our customers through a continuous supply of services as we transition from one stage of the project to the next. |
11. | The anticipated total consideration of approximately $227.5 million, adjusted for customary working capital and the assumption of capital leases, realized for the Piling Sale. |
12. | The anticipated closing costs of $12.5 million related to the Piling Sale. |
13. | The anticipation that the Purchaser will achieve a minimum of $45.0 million in Consolidated EBITDA in each year and the piling business will continue to grow under the management of the Purchaser, thus allowing us to realize all of the contingent proceeds. |
14. | The anticipation that the Purchaser will continue to grow the piling business, resulting in the payment of some or all of the contingent proceeds. |
15. | The expectation that the Purchaser will receive all required approvals to complete the Piling Sale and this sale will close during the first half of fiscal 2014; |
16. | Our expectation that we will recognize a gain from the sale of piling related assets, net of a $32.9 million reduction in goodwill, related to the piling business. |
17. | The expectation that the balance of the Term A Facility will be repaid with the net proceeds from the Piling Sale. |
18. | Future planned mining expansions, while not imminent, are expected to potentially increase total production capacity to 500,000 BPD. |
19. | Future planned expansions of Syncrude’s operations include the development of a new mine, MLX, on the existing Base Plant lease by 2010 and the development of the Aurora South mine, which is expected to potentially increase total production capacity to 600,000 BPD by 2025. |
2013 Annual Information Form | 23 |
20. | Our expectation to transition to the second phase of a mine relocation project at Syncrude’s Base Mine as work on the shear key foundation nears completion in late 2013. |
21. | The Joslyn Mine Project is not expected to commence production until 2018. |
22. | The earthworks contract for the Joslyn North Mine Project is expected to be completed in December 2013. |
23. | The Kearl oil sands project has an initial target production capacity of approximately 110,000 BPD with regulatory approval for up to 345,000 BPD of production. |
24. | We do not anticipate a tire shortfall. |
25. | Our belief that we have all material required permits and licenses to conduct our operations and are in substantial compliance with applicable regulatory requirements relating to our operations. |
26. | We do not currently anticipate any material adverse effect on our business or financial position because of future compliance with applicable environmental laws and regulations; and future events such as changes in existing laws and regulations may require us to make additional expenditures which may or may not be material. |
27. | We believe that, taking into account reserves and insurance coverage, none of the litigation or legal proceedings in which we are currently involved or know to be contemplated could reasonably be expected to have a material adverse effect on our business, financial condition or results of operations or could likely be considered important to a reasonable investor in making an investment decision; however, we may become involved in material legal proceedings in the future that could have such a material adverse effect. |
While we anticipate that subsequent events and developments may cause our views to change, we do not have an intention to update this forward-looking information or the forward-looking information and related risks, assumptions or other information expressly incorporated by reference into this AIF, except as required by applicable securities laws. Such forward-looking information represents our views as of the date of this document and such information should not be relied upon as representing our views as of any date subsequent to the date of this document. We have attempted to identify important factors that could cause actual results, performance or achievements to vary from those current expectations or estimates expressed or implied by the forward-looking information. However, there may be other factors that cause results, performance or achievements not to be as expected or estimated and that could cause actual results, performance or achievements to differ materially from current expectations. There can be no assurance that forward-looking information will prove to be accurate, as actual results and future events could differ materially from those expected or estimated in such statements. Accordingly, readers should not place undue reliance on forward-looking information. These factors are not intended to represent a complete list of the assumptions and factors that could affect us. See “Assumptions” and “Business Risk Factors” below and risk factors highlighted in materials filed with the securities regulatory authorities filed in the United States and Canada from time to time, including, but not limited to, our most recent annual MD&A, which section is expressly incorporated by reference in this AIF .
Assumptions
In addition to those listed in the “Forward-Looking Information, Assumptions and Risk Factors” section of our annual MD&A, which section is expressly incorporated by reference into this AIF, the material factors or assumptions used to develop the above forward-looking statements include, but are not limited to:
1. | We will be awarded work under our current master services agreements. |
2. | The work on the shear key foundations will near completion late in 2013. |
3. | We will be successful in negotiating an extension to our contract with Shell. |
4. | Our tire contracts, allocations and inventory will meet our tire supply needs. |
24 | 2013 Annual Information Form |
NOA
Business Risk Factors
The risks and uncertainties that could cause actual results to differ materially from the information presented in the above forward-looking statements and assumptions include, but are not limited to the risks detailed below.
• | There can be no certainty that all conditions precedent to the Piling Sale will be satisfied. Failure to complete the Piling Sale could negatively impact the market price of the Common Shares. |
The completion of the Piling Sale is subject to a number of conditions precedent, certain of which are outside the control of the Company. There can be no certainty that these conditions will be satisfied or, if satisfied, when they will be satisfied, or that the Piling Sale will be completed. If the Piling Sale is not completed, the market price of the Common Shares may decline to the extent that the market price reflects a market assumption that the Piling Sale will be completed. If the Piling Sale is not completed and the Board decides to pursue another transaction with respect to the piling business, there can be no assurance that another suitable transaction will be executed and that the proceeds to the Company from such other transaction will be equivalent to or more attractive price than the price to be paid pursuant to the Piling Sale.
• | There can be no certainty that any or all of the contingent consideration will be received. Failure to receive the contingent consideration could negatively impact the market price of the Common Shares. |
Under the Purchase Agreement, the Company will receive cash consideration of approximately $227.5 million upon Closing, and up to $92.5 million in proceeds, contingent on the Purchaser achieving prescribed profit targets over the following three years from the piling-related assets sold. The ability to meet such profit targets is dependent on a number of factors, including the successful operation of the piling business during this time and on economic conditions in the industry. There can be no assurance that these profit targets will be met and that the Company will receive any or all of the contingent consideration. If the contingent consideration is not received, the market price of the Common Shares may decline to the extent that the market price reflects a market assumption that the contingent consideration will be received.
• | Short-notice customer communication of reduction in their mine development or support service requirements, in which we are participating, could lead to our inability to secure replacement work for our dormant equipment and could subject us to non-recoverable costs. |
We allocate and mobilize our equipment and hire personnel based on estimated equipment and service plans supplied by our customers. At the start of each new project, we incur significant start-up costs related to the mobilization and maintenance configuration of our heavy equipment along with personnel hiring, orientation, training and housing costs for staff ramp-ups and redeployments. We expect to recover these start-up costs over the planned volumes of the projects we are awarded. Significant reductions in our customer's required equipment and service needs, with short notice, could result in our inability to redeploy our equipment and personnel in a cost effective manner. Our ability to maintain revenues and margins may be adversely affected to the extent these events cause reductions in the utilization of equipment and we can no longer recover our start-up costs over the reduced volume plan of our customers.
• | If we are unable to obtain surety bonds or letters of credit required by some of our customers, our business could be impaired. |
We are at times required to post a bid or performance bond issued by a financial institution, known as a surety, to secure our performance commitments. The surety industry experiences periods of unsettled and volatile markets, usually in the aftermath of substantial loss exposures or corporate bankruptcies with significant surety exposure. Historically, these types of events have caused reinsurers and sureties to re-evaluate their committed levels of underwriting and required returns. If for any reason, whether because of our financial condition, our level of secured debt or general conditions in the surety bond market, our bonding capacity becomes insufficient to satisfy our future bonding requirements, our business and results of operations could be adversely affected.
Some of our customers require letters of credit to secure our performance commitments. Our credit agreement provides for the issuance of letters of credit up to the undrawn balance of our Revolving Facility and at March 31, 2013, we had $3.2 million of issued letters of credit outstanding. One of our major contracts allows the customer to require up to $15.0 million in letters of credit, although at March 31, 2013 there are zero letters of credit issued to this customer. If our capacity to issue letters of credit under our Revolving Facility and our cash on hand is insufficient to satisfy our customer’s requirements, our business and results of operations could be adversely affected.
2013 Annual Information Form | 25 |
• | Lump-sum and unit-price contracts expose us to losses when our estimates of project costs are lower than actual costs. |
Approximately, 49%, 53% and 54% of our revenue for the fiscal years ended March 31, 2013, 2012 and 2011, respectively, was derived from lump-sum and unit-price contracts. Lump-sum and unit-price contracts require us to guarantee the price of the services we provide and thereby expose us to losses if our estimates of project costs are lower than the actual project costs we incur. Our profitability under these contracts is dependent upon our ability to accurately predict the costs associated with our services. The costs we actually incur may be affected by a variety of factors including those that are beyond our control. Factors that may contribute to actual costs exceeding estimated costs and which therefore affect profitability include, without limitation:
• | site conditions differing from those assumed in the original bid; |
• | scope modifications during the execution of the project; |
• | the availability and cost of skilled workers; |
• | the availability and proximity of materials; |
• | unfavourable weather conditions hindering productivity; |
• | inability or failure of our customers to perform their contractual commitments; |
• | equipment availability, productivity and timing differences resulting from project construction not starting on time; and |
• | the general coordination of work inherent in all large projects we undertake. |
When we are unable to accurately estimate and adjust for the costs of lump-sum and unit-price contracts, or when we incur unrecoverable cost overruns, the related projects result in lower margins than anticipated or may incur losses, which could adversely affect our results of operations, financial condition and cash flow.
• | A change in strategy by our customers to reduce outsourcing could adversely affect our results. |
Outsourced Heavy Construction and Mining services constitute a large portion of the work we perform for our customers. The election by one or more of our customers to perform some or all of these services themselves, rather than outsourcing the work to us, could have a material adverse impact on our business and results of operations. Certain customers perform some of this work internally and may choose to expand on the use of internal resources to complete this work if they believe they can perform this work in a more cost effective and efficient manner using their internal resources.
• | Unanticipated short-term shutdowns of our customers' operating facilities may result in temporary cessation or cancellation of projects in which we are participating. |
The majority of our work is generated from the development, expansion and ongoing maintenance of oil sands mining, extraction and upgrading facilities. Unplanned shutdowns of these facilities due to events outside our control or the control of our customers, such as fires, mechanical breakdowns and technology failures, could lead to the temporary shutdown or complete cessation of projects on which we are working. When these events have happened in the past, our business has been adversely affected. Our ability to maintain revenues and margins may be adversely affected to the extent these events cause reductions in the utilization of equipment.
• | An unfavourable resolution to our significant project claims could result in a revenue write down in future periods. |
Included in our revenues is a total of $21.0 million relating to disputed claims or unapproved change orders. Although we believe that we are entitled to such revenue and that we will collect such revenue, if we are not able to resolve these claims and undertake legal action in respect of these claims, there is no guarantee that a court will rule in our favour.
There is also the possibility that we could choose to accept less than the full amount of a claim as a settlement to avoid legal action. In either such case, a resolution or settlement of the claims in an amount less than the amount recognized as claims revenue could lead to a future write down of revenue and profit.
26 | 2013 Annual Information Form |
NOA
• | Our operations are subject to weather-related and environmental factors that may cause delays in our project work. |
Because our operations are primarily located in Northern Alberta (Fort McMurray) we are subject to extreme weather conditions. While our operations are not significantly affected by normal seasonal weather patterns, extreme weather conditions, including heavy rain, snow, spring thaw, and forest fire conditions can cause delays in our project work, which could adversely affect our results of operations.
• | Our ability to maintain planned project margins on projects with longer-term contracts with fixed or indexed price escalators may be hampered by the price escalators not accurately reflecting increases in our costs over the life of the contract. |
Our ability to maintain planned project margins on longer-term contracts with contracted price escalators is dependent on the contracted price escalators accurately reflecting increases in our costs. If the contracted price escalators do not reflect actual increases in our costs, we will experience reduced project margins over the remaining life of these longer-term contracts.
In strong economic times, the cost of labour, equipment, materials and sub-contractors is driven by the market demand for these project inputs. The level of increased demand for project inputs may not have been foreseen at the inception of the longer-term contracts with fixed or indexed price escalators resulting in reduced margins over the remaining life of the longer-term contracts. Certain of these price escalators could be considered derivative financial instruments (see "Significant Accounting Policies - Derivative Financial Instruments" in our audited consolidated financial statements for the year ended March 31, 2013).
• | Our customer base is concentrated, and the loss of or a significant reduction in business from a major customer could adversely affect our financial condition |
Most of our revenue comes from the provision of services to a small number of major oil sands mining companies. Revenue from our five largest customers represented approximately 82%, 85% and 95% of our total revenue for the fiscal years ended March 31, 2013, 2012 and 2011, respectively, and those customers are expected to continue to account for a significant percentage of our revenues in the future. If we lose or experience a significant reduction of business or profit from one or more of our significant customers, we may not be able to replace the lost work or income with work or income from other customers. Our long-term contracts typically allow our customers to unilaterally reduce or eliminate the work that we are to perform under the contract. Our contracts also generally allow the customer to terminate the contract without cause and, in many cases, with minimal or no notice to us. Additionally, certain of these contracts provide for limited compensation following such suspension or termination of operations and we can provide no assurance that we could replace the lost work with work from other customers. The loss of or significant reduction in business with one or more of our major customers, whether as a result of the completion, early termination or suspension of a contract, or failure or inability to pay amounts owed to us, could have a material adverse effect on our business and results of operations.
• | A significant amount of our revenue is generated by providing construction services. |
More than 31% of our revenue for the year ended March 31, 2013 was derived from projects that we consider to be construction services. This revenue primarily relates to site preparation services provided for the construction of extraction, upgrading and other oil sands mining infrastructure projects. There is no guarantee that we will find additional sources for generating construction services revenue in fiscal 2014.
• | Anticipated new major capital projects in the oil sands may not materialize. |
Notwithstanding the National Energy Board's estimates regarding new capital investment and growth in the Canadian oil sands, planned and anticipated capital projects in the oil sands may not materialize. The underlying assumptions on which the capital projects are based are subject to significant uncertainties, and actual capital investments in the oil sands could be significantly less than estimated. Projected investments in new capital projects may be postponed or cancelled for any number of reasons, including among others:
• | technological advancements improve the economic viability of alternative sources of heavy and light crude oil |
• | changes in the perception of the economic viability of these projects; |
• | shortage of pipeline capacity to transport production to major markets; |
• | lack of sufficient governmental infrastructure funding to support growth; |
2013 Annual Information Form | 27 |
• | delays in issuing environmental permits or refusal to grant such permits; |
• | shortage of skilled workers in this remote region of Canada; |
• | cost overruns on announced projects; and |
• | reductions in available credit for customers to fund capital projects. |
• | Our ability to grow our operations in the future may be hampered by our inability to obtain long lead time equipment and tires, which can be in limited supply during strong economic times. |
Our ability to grow our business is, in part, dependent upon obtaining equipment on a timely basis. Due to the long production lead times of suppliers of large mining equipment during strong economic times, we may have to forecast our demand for equipment many months or even years in advance. If we fail to forecast accurately, we could suffer equipment shortages or surpluses, which could have a material adverse impact on our financial condition and results of operations.
In strong economic times, global demand for tires of the size and specifications we require can exceed the available supply. Our inability to procure tires to meet the demands for our existing fleet as well as to meet new demand for our services could have an adverse effect on our ability to grow our business.
• | Reduced availability or increased cost of leasing our equipment fleet could adversely affect our results. |
A portion of our equipment fleet is currently leased from third parties. Other future projects may require us to lease additional equipment. If equipment lessors are unable or unwilling to provide us with reasonable lease terms within our expectations, it will significantly increase the cost of leasing equipment or may result in more restrictive lease terms that require recognition of the lease as a capital lease. We are actively pursuing new lessor relationships to dilute our exposure to the loss of one or more of our lessors.
• | We may not be able to access sufficient funds to finance a growth in our working capital or equipment requirements. |
We have a substantial amount of debt outstanding and significant debt service requirements. As of March 31, 2013, we had outstanding $477.4 million of debt, including $41.8 million of capital leases (debt includes all liabilities with the exception of deferred income taxes). Our substantial indebtedness restricts our flexibility, consequently it:
• | limits our ability to obtain additional financing to fund our working capital, capital expenditures, debt service requirements, potential growth or other purposes; |
• | limits our ability to use operating cash flow in other areas of our business; |
• | limits our ability to post surety bonds required by some of our customers; |
• | places us at a competitive disadvantage compared to competitors with less debt; |
• | increases our vulnerability to, and reduces our flexibility in planning for, adverse changes in economic, industry and competitive conditions; and |
• | increases our vulnerability to increases in interest rates because borrowings under our revolving credit facility and payments under some of our equipment leases are subject to variable interest rates. |
Further, if we do not have sufficient earnings to service our debt, we would need to refinance all or part of our existing debt, sell assets, borrow more money or sell securities, none of which we can guarantee we will be able to achieve on commercially reasonable terms, if at all.
• | Our business is highly competitive and competitors may outbid us on major projects that are awarded based on bid proposals. |
We compete with a broad range of companies in each of our markets. Many of these competitors are substantially larger than we are. In addition, we expect the anticipated growth in the oil sands region will attract new and sometimes larger competitors to enter the region and compete against us for projects. This increased competition may adversely affect our ability to be awarded new business.
Approximately 80% of the major projects that we pursue are awarded to us based on bid proposals, and projects are typically awarded based in large part on price. We often compete for these projects against companies that have substantially greater financial and other resources than we do and therefore can better
28 | 2013 Annual Information Form |
NOA
bear the risk of underpricing projects. We also compete against smaller competitors that may have lower overhead cost structures and may be able to provide their services at lower rates than we can. Our business may be adversely impacted to the extent that we are unable to successfully bid against these companies. The loss of existing customers to our competitors or the failure to win new projects could adversely affect our business and results of operations.
• | An upturn in the Canadian economy, resulting in an increased demand for our services from the Canadian energy industry, could lead to a new shortage of qualified personnel. |
Significant economic growth can result in a shortage of skilled labour and other qualified personnel. New mining projects in the area could make it more difficult for us and our customers to find and hire all the employees needed to work on these projects. If the economy experiences significant growth levels and we are not able to recruit and retain sufficient numbers of employees with the appropriate skills, we may not be able to satisfy an increased demand for our services. This in turn, could have a material adverse effect on our business, financial condition and results of operations. If our customers are not able to recruit and retain enough employees with the appropriate skills, they may be unable to develop projects in the oils sands area.
• | Changes in our customers' perception of oil prices over the long-term could cause our customers to defer, reduce or stop their investment in oil sands capital projects, which would, in turn, reduce our revenue from capital projects from those customers. |
Due to the amount of capital investment required to build an oil sands project, or construct a significant capital expansion to an existing project, investment decisions by oil sands operators are based upon long-term views of the economic viability of the project. Economic viability is dependent upon the anticipated revenues the capital project will produce, the anticipated amount of capital investment required and the anticipated fixed cost of operating the project. The most important consideration is the customer's view of the long-term price of oil which is influenced by many factors, including the condition of developed and developing economies and the resulting demand for oil and gas, the level of supply of oil and gas, the actions of the Organization of Petroleum Exporting Countries, governmental regulation, political conditions in oil producing nations, including those in the Middle East, war or the threat of war in oil producing regions and the availability of fuel from alternate sources. If our customers believe the long-term outlook for the price of oil is not favourable, or believes oil sands projects are not viable for any other reason, they may delay, reduce or cancel plans to construct new oil sands capital projects or capital expansions to existing projects. In the second half of 2009, the market price of oil decreased significantly which led to a slowdown of the world economy and a lower international demand for oil. As a result of those developments, many of our customers decided to temporarily scale back their capital development plans on oil sands projects until there was a clearer picture on the timing of the recovery of the world economy. Recent events related to the increases in the market price of oil and assertions by many of our customers about renewed confidence in the long-term growth in the oil sands has led to new announcements regarding oil sands capital investment. If there had not been signs of recovery of the world economy there would have been continuing delays, reductions or cancellations of major oil sands projects that would adversely affect our prospects for revenues from capital projects and could have an adverse impact on our financial condition and results of operations.
• | Cost overruns by our customers on their projects may cause our customers to terminate future projects or expansions that could adversely affect the amount of work we receive from those customers. |
Oil sands development projects require substantial capital expenditures. In the past, several of our customers' projects have experienced significant cost overruns, affecting their returns. If cost overruns continue to challenge our customers, they could reassess future projects and expansions that could adversely affect the amount of work we receive from our customers.
• | Because most of our customers are Canadian energy companies, a downturn in the Canadian energy industry or a global reduction in the demand for oil and related commodities could result in a decrease in the demand for our services. |
Most of our customers are Canadian energy companies. A downturn in the Canadian energy industry has previously led our customers to slow down or curtail their future capital expansions that, in turn, reduced our revenue from those customers on their capital projects. Another economic downturn in the Canadian energy industry or a global reduction in the demand for oil could have an adverse impact on our financial condition and results of operations. In addition, a reduction in the number of new oil sands capital projects by customers would also likely result in increased competition among oil sands service providers, which could also reduce our ability to successfully bid for new capital projects.
2013 Annual Information Form | 29 |
• | Failure by our customers to obtain required permits and licenses due to complex and stringent environmental protection laws and regulations may affect the demand for our services. |
The development of the oil sands requires our customers to obtain regulatory and other permits and licenses from various governmental licensing bodies. Our customers may not be able to obtain all necessary permits and licenses that may be required for the development of the oil sands on their properties. In such a case, our customers’ projects will not proceed, thereby adversely affecting demand for our services.
• | Insufficient pipeline, upgrading and refining capacity could cause our customers to delay, reduce or cancel plans to construct new oil sands projects or expand existing projects, which would, in turn, reduce our revenue from those customers. |
For our customers to operate successfully in the oil sands, they must be able to transport the bitumen produced to upgrading facilities and transport the upgraded oil to refineries. Some oil sands projects have upgraders at mine site and others transport bitumen to upgraders located elsewhere. While current upgrading and refining capacity capacity is sufficient for current production, current pipeline capacity does not meet the current production levels. If pipeline capacity increases do not materialize to meet the current bitumen transportation shortfall or if future increases in production from new oil sands projects and expansions to existing projects does not result in increased upgrading and pipeline capacity, our customers may be unable to efficiently deliver increased production to market and may therefore delay, reduce or cancel planned capital investment. Such delays of pipeline, upgrading or refining capacity increases as inadequate economics for the sponsors of such projects, shortages of labour or materials, delays in regulatory approvals or any other reason, along with reductions or cancellations of major oil sands projects would adversely affect our prospects and could have a material adverse impact on our financial condition and results of operations.
• | Demand for our services may be adversely impacted by regulations affecting the energy industry. |
Our principal customers are energy companies involved in the development of the oil sands and in natural gas production. The operations of these companies, including their mining operations in the oil sands, are subject to or affected by a wide array of regulations in the jurisdictions where they operate, including regulations directly impacting mining activities and indirectly affecting their businesses, such as applicable environmental laws and climate change laws. As a result of changes in regulations and laws relating to the energy industry, including the mining industry, our customers’ operations could be disrupted or curtailed by governmental authorities or the market for their products could be adversely impacted. The high cost of compliance with applicable regulations or the reduction and demand for our customers’ products may cause customers to discontinue or limit their operations, and may discourage companies from continuing development activities. As a result, demand for our services could be substantially affected by regulations adversely affecting the energy industry.
• | Environmental laws and regulations may expose us to liability arising out of our operations or the operations of our customers. |
Our operations are subject to numerous environmental protection laws and regulations that are complex and stringent. We regularly perform work in and around sensitive environmental areas such as rivers, lakes and forests. Significant fines and penalties may be imposed on us or our customers for noncompliance with environmental laws and regulations, and our contracts generally require us to indemnify our customers for environmental claims suffered by them as a result of our actions. In addition, some environmental laws impose strict, joint and several liability for investigative and remediation costs in relation to releases of harmful substances. These laws may impose liability without regard to negligence or fault. We also may be subject to claims alleging personal injury or property damage if we cause the release of, or any exposure to, harmful substances.
We own or lease, and operate, several properties that have been used for a number of years for the storage and maintenance of equipment and other industrial uses. Fuel may have been spilled, or hydrocarbons or other wastes may have been released on these properties. Any release of substances by us or by third parties who previously operated on these properties may be subject to laws which impose joint and several liability for clean-up, without regard to fault, on specific classes of persons who are considered to be responsible for the release of harmful substances into the environment.
30 | 2013 Annual Information Form |
NOA
• | Lack of sufficient governmental infrastructure to support the growth in the oil sands region could cause our customers to delay, reduce or cancel their future expansions, which would, in turn, reduce our revenue from those customers. |
The development in the oil sands region has put a great strain on the existing governmental infrastructure, necessitating substantial improvements to accommodate growth in the region. The local government having responsibility for a majority of the oil sands region has been exceptionally impacted by this growth and is not currently in a position to provide the necessary additional infrastructure. In an effort to delay further development until infrastructure funding issues are resolved, the local governmental authority has previously intervened in hearings considering applications by major oil sands companies to the Energy Resources Conservation Board (“ERCB”) for approval to expand their operations. Similar action could be taken with respect to any future applications. The ERCB has indicated that it believes that additional infrastructure investment in the oil sands region is needed and that there is a short window of opportunity to make these investments in parallel with continued oil sands development. If the necessary infrastructure is not put in place, future growth of our customers’ operations could be delayed, reduced or cancelled which could in turn adversely affect our prospects and could have a material adverse impact on our financial condition and results of operations.
• | Significant labour disputes could adversely affect our business. |
Substantially all of our hourly employees are subject to collective bargaining agreements to which we are a party or are otherwise subject. Any work stoppage resulting from a strike or lockout could have a material adverse effect on our business, financial condition and results of operations. In addition, our customers employ workers under collective bargaining agreements. Any work stoppage or labour disruption experienced by our key customers could significantly reduce the amount of our services that they need.
• | We may not be able to generate sufficient cash flow to meet our debt service and other obligations due to events beyond our control. |
Our ability to generate sufficient operating cash flow to make scheduled payments on our indebtedness and meet other capital requirements will depend on our future operating and financial performance. Our future performance will be impacted by a range of economic, competitive and business factors that we cannot control, such as general economic and financial conditions in our industry or the economy generally.
A significant reduction in operating cash flows resulting from changes in economic conditions, increased competition, reduced work or other events could increase the need for additional or alternative sources of liquidity and could have a material adverse effect on our business, financial condition, results of operations, prospects and our ability to service our debt and other obligations. If we are unable to service our indebtedness, we will be forced to adopt an alternative strategy that may include actions such as selling assets, restructuring or refinancing our indebtedness, seeking additional equity capital or reducing capital expenditures. We may not be able to affect any of these alternative strategies on satisfactory terms, if at all, or they may not yield sufficient funds to allow us to make required payments on our indebtedness.
• | The terms of our debt agreements may restrict our current and future operations, particularly our ability to respond to changes in our business or take certain actions. |
Our credit agreement and the trust indenture governing our Series 1 Debentures limits, among other things, our ability and the ability of our subsidiaries to:
• | incur or guarantee additional debt, issue certain equity securities or enter into sale and leaseback transactions; |
• | pay dividends or distributions on our shares or repurchase our shares, redeem subordinated debt or make other restricted payments; |
• | incur dividend or other payment restrictions affecting certain of our subsidiaries; |
• | issue equity securities of subsidiaries; |
• | make certain investments or acquisitions; |
• | create liens on our assets; |
• | enter into transactions with affiliates; |
• | consolidate, merge or transfer all or substantially all of our assets; and |
• | transfer or sell assets, including shares of our subsidiaries. |
2013 Annual Information Form | 31 |
Our credit agreement also requires us, and our future credit agreements may require us, to maintain specified financial ratios and satisfy specified financial tests. Our ability to meet these financial ratios and tests can be affected by events beyond our control, and we may be unable to meet those tests.
As a result of these covenants, our ability to respond to changes in business and economic conditions and to obtain additional financing, if needed, may be significantly restricted, and we may be prevented from engaging in transactions that might otherwise be considered beneficial to us. The breach of any of these covenants could result in an event of default under our revolving credit facility or any future credit facilities or under the indenture governing our notes. Under our credit agreement, our failure to pay certain amounts when due to other creditors, including to certain equipment lessors would also result in an event of default. Upon the occurrence of an event of default under our revolving credit facility or future credit facilities, the lenders could elect to stop lending to us or declare all amounts outstanding under such credit facilities to be immediately due and payable. Similarly, upon the occurrence of an event of default under the trust indenture governing our Series 1 Debentures the outstanding principal and accrued interest on the notes may become immediately due and payable. If amounts outstanding under such credit agreements and the trust indenture were to be accelerated, or if we were not able to borrow under our revolving credit facility, we could become insolvent or be forced into insolvency proceedings.
• | Aboriginal peoples may make claims against our customers or their projects regarding the lands on which customer projects are located. |
Aboriginal peoples have claimed aboriginal title and rights to a substantial portion of Western Canada. Any claims that may be asserted against our customers could have an adverse effect on our customers that may, in turn, negatively affect our business.
• | Our projects expose us to potential professional liability, product liability, warranty or other claims. |
We install deep foundations, often in congested and densely populated areas, and provide construction management services for significant projects. Notwithstanding the fact that we generally will not accept liability for consequential damages in our contracts, any catastrophic occurrence in excess of insurance limits at projects where our structures are installed or services are performed could result in significant professional liability, product liability, warranty or other claims against us. Such liabilities could potentially exceed our current insurance coverage and the fees we derive from those services. A partially or completely uninsured claim, if successful and of a significant magnitude, could result in substantial losses.
• | We may not be able to achieve the expected benefits from any future acquisitions, which would adversely affect our financial condition and results of operations. |
We intend to pursue selective acquisitions as a method of expanding our business. However, we may not be able to identify or successfully bid on businesses that we might find attractive. If we do find attractive acquisition opportunities, we might not be able to acquire these businesses at a reasonable price. If we do acquire other businesses, we might not be able to successfully integrate these businesses into our then-existing business. We might not be able to maintain the levels of operating efficiency that acquired companies will have achieved or might achieve separately. Successful integration of acquired operations will depend upon our ability to manage those operations and to eliminate redundant and excess costs. Because of difficulties in combining operations, we may not be able to achieve the cost savings and other size-related benefits that we hoped to achieve through these acquisitions. Any of these factors could harm our financial condition and results of operations.
Risks Factors Related to Our Common Shares
• | If our share price fluctuates, an investor could lose a significant part of their investment. |
There has been significant volatility in the market price and trading volume of equity securities, which is unrelated to the financial performance of the companies issuing the securities. The market price of our common shares is likely to be similarly volatile, and an investor may not be able to resell our shares at or above the price at which the investor acquired the shares due to fluctuations in the market price of our common shares, including changes in price caused by factors unrelated to our operating performance or prospects.
Specific factors that may have a significant effect on the market price for our common shares include:
• | changes in projections as to the level of capital spending in the oil sands region; |
• | changes in stock market analyst recommendations or earnings estimates regarding our common shares, other comparable companies or the construction or oil and gas industries generally; |
32 | 2013 Annual Information Form |
NOA
• | actual or anticipated fluctuations in our operating results or future prospects; |
• | reaction to our public announcements; |
• | strategic actions taken by us or our competitors, such as acquisitions or restructuring; |
• | new laws or regulations or new interpretations of existing laws or regulations applicable to our business and operations; |
• | changes in accounting standards, policies, guidance, interpretations or principles; |
• | adverse conditions in the financial markets or general economic conditions, including those resulting from war, incidents of terrorism and responses to such events; |
• | sales of common shares by us, members of our management team or our existing shareholders; and |
• | the extent of analysts’ interest in following our company. |
• | Future sales or the perception of future sales of a substantial amount of our common shares may depress the price of our common shares. |
Future sales or the perception of the availability for sale of substantial amounts of our common shares could adversely affect the prevailing market price of our common shares and could impair our ability to raise capital through future sales of equity securities at a time and price that we deem appropriate.
• | We may issue additional common shares, which would dilute the percentage ownership interest of our existing shareholders. |
We may issue our common shares or convertible securities from time to time as consideration for future acquisitions and investments. In the event any such acquisition or investment is significant, the number of common shares or convertible securities that we may issue could be significant. We may also grant registration rights covering those shares or convertible securities in connection with any such acquisitions and investments. Any additional capital raised through the sale of our common shares or securities convertible into our common shares will dilute our common shareholders’ percentage ownership in us.
• | Our principal shareholders are in a position to affect our ongoing operations, corporate transactions and other matters, and their interests may conflict with or differ from the interests of our other common shareholders. |
Investment entities controlled by the significant shareholders, collectively hold approximately 32% of our common shares. As a result, the significant shareholders and their affiliates would be able to exert influence over the outcome of most matters submitted to a vote of our shareholders, including the election of members of our board of directors, if they were to act together.
Regardless of whether the significant shareholders maintain a significant interest in our common shares, so long as a designated affiliate of each significant shareholder holds our common shares, such significant shareholder will have certain rights, including the right to obtain copies of financial data and other information regarding us, the right to consult with and advise our management and the right to visit and inspect any of our properties and facilities. See “Interest of Management and Others in Material Transactions – Advisory Agreements”.
For so long as the significant shareholders own a significant percentage of our outstanding common shares, even if less than a majority, the significant shareholders will be able to exercise influence over our business and affairs, including the incurrence of indebtedness by us, the issuance of any additional common shares or other equity securities, the repurchase of common shares and the payment of dividends, if any, and will have the power to influence the outcome of matters submitted to a vote of our shareholders, including election of directors, mergers, consolidations, sales or dispositions of assets, other business combinations and amendments to our articles of incorporation. The interests of the significant shareholders and their affiliates may not coincide with the interests of our other shareholders. In particular, the significant shareholders and their affiliates are in the business of making investments in companies and they may, from time to time, acquire and hold interests in businesses that compete directly or indirectly with us. The significant shareholders and their affiliates may also pursue, for their own account, acquisition opportunities that may be complementary to our business, and as a result, those acquisition opportunities may not be available to us. So long as the significant shareholders and their affiliates continue to own a significant portion of the outstanding common shares, they will continue to be able to influence our decisions.
2013 Annual Information Form | 33 |
• | Fluctuations in the value of the Canadian and US dollars can affect the value of our common shares and future dividends, if any. |
Our operations and our principal executive offices are in Canada. Accordingly, we report our results in Canadian dollars. The value of a US shareholder’s investment in us will fluctuate as the US dollar rises and falls against the Canadian dollar. Also, if we pay dividends in the future, we will pay those dividends in Canadian dollars. Accordingly, if the US dollar rises in value relative to the Canadian dollar, the US dollar value of the dividend payments received by a US common shareholder would be less than they would have been if exchange rates were stable.
• | We currently do not intend to pay dividends on our common shares, and our ability to pay dividends is limited by the indenture that governs our notes, our subsidiaries’ ability to distribute to us and Canadian law. |
We have never paid cash dividends on our common shares. Any future determination to pay cash dividends will be at the discretion of our board of directors and will depend on our results of operations, financial condition, current and anticipated cash needs, contractual restrictions, restrictions imposed by applicable law and other factors that our board of directors considers relevant. Our ability to declare dividends is restricted by the terms of the indenture that governs our notes. See “Description of Securities, Rights Plan and Agreements - Dividends”.
Substantially all of the assets shown on our consolidated balance sheet are held by our subsidiaries. Accordingly, our earnings and cash flow and our ability to pay dividends are largely dependent upon the earnings and cash flows of our subsidiaries and the distribution or other payment of such earnings to us in the form of dividends.
Our ability to pay dividends is also subject to the satisfaction of a statutory solvency test under Canadian law, which requires that there be no reasonable grounds for believing that (i) we are, or would after the payment be, unable to pay our liabilities as they become due or (ii) the realizable value of our assets would, after payment of the dividend, be less than the aggregate of our liabilities and stated capital of all classes.
• | We are a holding company and rely on our subsidiaries for our operating funds, and our subsidiaries have no obligation to supply us with any funds |
We are a holding company with no operations of our own. We conduct our operations through subsidiaries and are dependent upon our subsidiaries for the funds we need to operate. Each of our subsidiaries is a distinct legal entity and has no obligation to transfer funds to us. The ability of our subsidiaries to transfer funds to us could be restricted by the terms of our financings. The payment of dividends to us by our subsidiaries is subject to legal restrictions as well as various business considerations and contractual provisions, which may restrict the payment of dividends and distributions and the transfer of assets to us.
• | Actions against us and some of our directors and officers may not be enforceable under US federal securities laws. |
We are a corporation incorporated under the Canada Business Corporations Act. Consequently, we are and will be governed by all applicable provincial and federal laws of Canada. Several of our directors and officers reside principally in Canada. Because these persons are located outside the United States, it may not be possible for investors to effect service of process within the United States upon those persons. Furthermore, it may not be possible for you to enforce against us or them, in or outside the United States, judgments obtained in US courts, because substantially all of our assets and the assets of these persons are located outside the United States. We have been advised that there is doubt as to the enforceability, in original actions in Canadian courts, of liabilities based upon the US federal securities laws and as to the enforceability in Canadian courts of judgments of US courts obtained in actions based upon the civil liability provisions of the US federal securities laws. Therefore, it may not be possible to enforce those actions against us, our directors and officers or other persons named in this AIF.
Risk Factors Relating to Debt Securities
• | Unsecured nature of the Series 1 Debentures |
Our Series 1 Debentures are direct unsecured obligations of the Company ranking equally and pari passu with all other unsecured and unsubordinated indebtedness of the Company. Our Series 1 Debentures are effectively subordinated to all existing and future secured debt of the Company, to the extent of the assets securing such debt. If the Company is involved in any bankruptcy, dissolution, liquidation, reorganization or other insolvency
34 | 2013 Annual Information Form |
NOA
proceeding, the secured debt holders would be paid before the holders of Series 1 Debentures receive any amounts due under the terms of the trust indenture governing such Series 1 Debentures (the “Debenture Indenture”) to the extent of the assets securing the secured debt. In that event, a holder of our Series 1 Debentures may not be able to recover any principal or interest due to it under the terms of the Debenture Indenture.
• | Unsecured nature of obligations under guarantees |
Our Series 1 Debentures are guaranteed. The obligations under the guarantees are direct unsecured obligations of each of the guarantors ranking equally and pari passu with all other unsecured and unsubordinated indebtedness of the guarantors. The obligations under such guarantees will be effectively subordinated to all existing and future secured debt of the guarantors, to the extent of the assets securing such debt. If the applicable guarantor is involved in any bankruptcy, dissolution, liquidation, reorganization or other insolvency proceeding when the Guarantee is called upon, the secured debt holders would be paid before the holders of any of our Series 1 Debentures receive any amounts due under the Debenture Indenture, pursuant to the guarantee, to the extent of the assets securing the secured debt. In that event, a holder of such Series 1 Debentures may not be able to recover any principal or interest due to it under the Debenture Indenture, pursuant to the guarantee.
• | Lack of liquidity |
There is no public market for our Series 1 Debentures. The market price and value of our Series 1 Debentures may be affected by changes in general market conditions, fluctuations in the market for equity and debt securities, prevailing interest rates and numerous other factors beyond the Company’s control.
• | Credit risk |
The likelihood that purchasers of our Series 1 Debentures will receive payments owing to them under the terms of the Debenture Indenture will depend on the financial health of NAEPI and its creditworthiness.
• | Restrictions on our ability to incur debt |
The terms of our Series 1 Debentures and our credit facility contain restrictions on our ability to raise capital through issuing or incurring additional debt. Failure to raise capital when required could have a material adverse effect on our business, financial condition and results of operations.
• | Change of control |
NAEPI may be required to repurchase all of our outstanding Series 1 Debentures upon the occurrence of a change of control. If a change of control were to occur, NAEPI may lack sufficient funds to pay the purchase price for all tendered Series 1 Debentures. NAEPI’s failure to purchase tendered debentures would constitute an event of default under the Debenture Indenture, which, without consent, might constitute a default under the terms of NAEPI’s other indebtedness.
• | Credit ratings may not reflect all risks of an investment in debt securities and may change |
Credit ratings may not reflect all risks associated with an investment in our Series 1 Debentures. The credit ratings applied to our Series 1 Debentures will be an assessment by the relevant ratings agency of NAEPI’s ability to pay its obligations as of the respective dates the ratings are assigned. Consequently, real or anticipated changes in the credit ratings will generally affect the market value of our Series 1 Debentures. The credit ratings, however, may not reflect the potential impact of risks related to structure, market or other factors discussed herein on the value of our Series 1 Debentures. Credit ratings are intended to provide investors with an independent measure of the credit quality of an issue of securities. The credit ratings accorded to our Series 1 Debentures are not a recommendation to purchase, hold or sell our Series 1 Debentures, because ratings do not comment as to market price or suitability for a particular investor. There is no assurance that the ratings accorded to our Series 1 Debentures will remain in effect for any given period of time or that the ratings will not be revised or withdrawn entirely in the future by the relevant rating agency. Real or anticipated changes in credit ratings on our Series 1 Debentures may affect the market value of our Series 1 Debentures. In addition, real or anticipated changes in credit ratings can affect the cost of or terms on which the Company can issue debentures or incur other debt.
2013 Annual Information Form | 35 |
• | Interest rates |
Prevailing interest rates will affect the market value of our Series 1 Debentures, which may have a fixed interest rate. Assuming all other factors remain unchanged, the market value of fixed rate debt instruments such as our Series 1 Debentures will normally decline during such period as prevailing interest rates for similar debt instruments rise, and increase as prevailing interest rates for comparable debt instruments decline.
• | Exchange rates |
Purchasers should consult their financial and legal advisors as to any specific risks entailed by an investment in securities that are denominated or payable in a currency other than the currency of the country in which they are resident or in which they conduct business (the “home currency”). Our Series 1 Debentures are denominated and payable in Canadian dollars. Depreciation of the currency in which our Series 1 Debentures are payable against a holder’s home currency would result in a decrease in the effective yield of our Series 1 Debentures or in their payout and could result in an overall loss on a home currency basis. Fluctuations in any particular exchange rate that have occurred in the past are not necessarily indicative of fluctuations that may occur.
Quantitative and Qualitative Disclosures about Market Risk
Market risk is the risk that the fair value or future cash flows of a financial instrument will fluctuate because of changes in market prices such as foreign currency exchange rates and interest rates. The level of market risk to which we are exposed at any point in time varies depending on market conditions, expectations of future price or market rate movements and composition of our financial assets and liabilities held, non-trading physical assets and contract portfolios.
To manage the exposure related to changes in market risk, we use various risk management techniques including the use of derivative instruments. Such instruments may be used to establish a fixed price for a commodity, an interest-bearing obligation or a cash flow denominated in a foreign currency.
The sensitivities provided below are hypothetical and should not be considered to be predictive of future performance or indicative of earnings on these contracts.
Foreign exchange risk
Foreign exchange risk refers to the risk that the value of a financial instrument or cash flows associated with the instrument will fluctuate due to changes in foreign exchange rates.
The majority of revenue earned is in Canadian Dollars; however, we conduct business internationally and are subject to currency exposures and volatility because of fluctuations. All international work is conducted in either Canadian Dollars or US Dollars and we minimizes exposure to foreign currency fluctuations by matching revenues and expenses in the same currency.
We regularly transact in foreign currencies when purchasing equipment and spare parts as well as certain general and administrative goods and services. These exposures are generally of a short-term nature and the impact of changes in exchange rates has not been significant in the past. We may fix our exposure in either the Canadian dollar or the US dollar for these short-term transactions, if material.
At March 31, 2013, with other variables unchanged, the impact of a $0.01 increase (decrease) in exchange rates of the Canadian dollar to the US dollar on short-term exposures would not have a significant impact to other comprehensive income.
Interest rate risk
We are exposed to interest rate risk from the possibility that changes in interest rates will affect future cash flows or the fair values of our financial instruments. Amounts outstanding under our amended credit facilities are subject to a floating rate. Our Series 1 Debentures are subject to a fixed rate. Our interest rate risk arises from long-term borrowings issued at fixed rates that create fair value interest rate risk and variable rate borrowings that create cash flow interest rate risk.
In some circumstances, floating rate funding may be used for short-term borrowings and other liquidity requirements. We may use derivative instruments to manage interest rate risk. We manage our interest rate risk exposure by using a mix of fixed and variable rate debt and may use derivative instruments to achieve the desired proportion of variable to fixed-rate debt.
36 | 2013 Annual Information Form |
NOA
At March 31, 2013, we held $45.2 million of floating rate debt pertaining to our Credit Facilities within our credit agreement (March 31, 2012 – $78.8 million). As at March 31, 2013 , holding all other variables constant, a 100 basis point increase (decrease) to interest rates on floating rate debt would result in a $0.5 million increase (decrease) in effective annual interest costs. This assumes that the amount of floating rate debt remains unchanged from that which was held at March 31, 2013.
L. GENERAL MATTERS
Additional Information
Our corporate office is located at Zone 3, Acheson Industrial Area, 2-53016 - Hwy. 60, Acheson, Alberta, T7X 5A7. Our corporate head office telephone and facsimile numbers are 780-960-7171 and 780-960-5599, respectively.
Additional information, including information in respect of (i) the remuneration and indebtedness of the directors and executive officers of the Company; (ii) the principal holders of our securities; and (iii) securities authorized for issuance under equity compensation plans, is contained in our management information circular for our most recent annual meeting of holders of common shares that involved the election of our directors.
Additional information relating to us, including our audited consolidated financial statements for the year ended March 31, 2013 and notes that follow, our most recent MD&A, which is incorporated by reference in this AIF and our most recent management information circular can be found on the Canadian Securities Administrators System for Electronic Document Analysis and Retrieval (SEDAR) database at www.sedar.com, the Securities and Exchange Commission’s Electronic Data Gathering, Analysis and Retrieval (EDGAR) system at www.sec.gov and our Company’s website at www.nacg.ca.
Transfer Agent and Registrar
The transfer agent and registrar of the Company is Computershare Investor Services Inc., 9th Floor, 100 University Avenue, Toronto, Ontario, M5J 2Y1.
Experts
KPMG LLP are the auditors of the Company and have confirmed that they are independent with respect to the Company within the meaning of the Rules of Professional Conduct of Institute of Chartered Accountants of Alberta and within the meaning of the U.S. Securities Act of 1933 and the applicable rules and regulations thereunder adopted by the Securities and Exchange Commission and the Public Company Accounting Oversight Board (United States).
Glossary of Terms
The following are definitions of certain terms commonly used in the Company industry and this AIF.
“bitumen” means the molasses-like substance that comprises the oil in the oil sands.
“upgrader” is a facility that upgrades bitumen into synthetic crude oil. Upgrader plants are typically located close to oil sands production.
“muskeg” means a swamp or bog formed by an accumulation of sphagnum moss, leaves and decayed.
“oil sands” means the grains of sand covered by a thin layer of water and coated by heavy oil, or bitumen.
“overburden” means the layer of rocky, clay-like material that covers the oil sands.
“upgrading” means the conversion of heavy bitumen into a lighter crude oil by increasing the hydrogen to carbon ratio, either through the removal of carbon (coking) or the addition of hydrogen (hydro processing).
2013 Annual Information Form | 37 |
EXHIBIT A
Audit Committee Charter
1. | PURPOSE |
The Board of Directors (the “Board”) of North American Energy Partners Inc. (the “Company”) has established the Audit Committee (the “Committee”) for the purpose of assisting the Board in meeting its oversight responsibilities in relation to: (a) the integrity of the Company’s accounting and financial reporting processes; (b) internal controls over financial reporting; (c) controls and procedures related to disclosure; (d) the internal audit function; (e) the qualifications, independence and performance of the Company’s external auditors; (f) identification and monitoring of financial risks; (g) the processes for monitoring compliance with legal and regulatory requirements (other than those related to health, environment and safety matters); and (h) establishment and monitoring of the Company’s codes of conduct and ethics.
2. | AUTHORITY |
The Committee has the authority to:
(a) | conduct or authorize investigations into any matter within its scope of responsibility; |
(b) | retain and compensate independent counsel, accountants and others to advise the Committee or assist it with respect to its responsibilities; |
(c) | pre-approve all audit services and permitted non-audit services performed by the Company’s external auditors and negotiate the compensation to be paid for such services; |
(d) | resolve any disagreements between management and the Company’s external auditors regarding financial reporting; |
(e) | seek any information it requires from employees of the Company, all of whom will be directed by management to co-operate with the Committee’s requests; |
(f) | meet and communicate directly with the Company’s officers, external auditors, internal auditor, outside counsel and consultants, all as the Committee may deem necessary; |
(g) | direct the Company’s internal auditor to carry out such activities as the Committee may require; |
(h) | access all documents of the Company that the Committee may deem relevant to it in carrying out its responsibilities; and |
(i) | undertake any other activity that may be reasonably necessary in order for the Committee to carry out its responsibilities as set out in this Charter. |
3. | COMPOSITION |
3.1. | The Board will appoint annually, from among its members, the Committee and its Chair. The Committee will consist of at least three and not more than six members. |
3.2. | Each member of the Committee must be “independent” as that term is defined under the requirements of applicable securities laws and the standards of any stock exchange on which the Company’s securities are listed. |
3.3. | Each member of the Committee must be “financially literate” in that he or she has the ability to read and understand a set of financial statements that present a breadth and level of complexity of accounting issues that are generally comparable to that which can reasonably be expected to be raised by the Company’s financial statements. |
3.4. | At least one member of the Committee will be an “audit committee financial expert” who will possess the attributes outlined in Appendix A. |
3.5. | No director currently serving on the Committee will serve on the audit committees of more than two additional public companies. |
4 | MEETINGS |
4.1. | The Committee will meet at least once each fiscal quarter, with authority to convene additional meetings as circumstances require. A meeting may be convened by the Chair, any member of the |
38 | 2013 Annual Information Form |
NOA
Committee, the external auditors, the internal auditor, the chief executive officer of the Company or the chief financial officer of the Company. The Chair will determine the time, place and procedures for calling and conducting Committee meetings, subject to the requirements of the bylaws of the Company, of this Charter and of the Canada Business Corporations Act.
4.2. | A majority of the members of the Committee will constitute a quorum. Members of the Committee may participate in a meeting through any means which permits all parties to communicate adequately with each other. Any members not physically present but participating in the meeting through such means is deemed to be present at the meeting. A quorum, once established, is maintained even if members of the Committee leave before the meeting concludes. |
4.3. | In the event of a tie vote on a resolution, the issue will be forwarded to the full board for a vote. |
4.4. | A resolution signed (including signatures communicated by fax or electronic mail) by all members of the Committee entitled to vote on that resolution is as valid as if it had been passed at a meeting of the Committee. |
4.5. | The Committee may invite such officers, directors and employees of the Company as it may see fit from time to time to attend at meetings and provide information pertinent to any matter being discussed. Any director of the Company is entitled to attend Committee meetings, however, only members of the Committee are eligible to vote or establish a quorum. The external auditors will be entitled to receive notice of every meeting of the Committee and to attend and be heard at the same. The Committee will periodically meet in camera alone and separately with each of the external auditors, the internal auditor and management. |
4.6. | The Chair will ensure that meeting agendas are prepared and provided in advance to members of the Committee, along with appropriate briefing materials. The Committee will keep and approve minutes of each meeting which record the decisions reached by the Committee. Once approved, the minutes will be distributed to Committee members with copies provided to the Board, the chief executive officer of the Company, the chief financial officer of the Company, the external auditors and the internal auditor. |
5. | RESPONSIBILITIES |
The Committee will carry out the following responsibilities:
5.1. | Financial Reporting |
(a) | Review with management and the external auditors any issues of concern with respect to financial reporting, including proposed changes in the selection or application of major accounting policies and the reasons for such changes, any complex or unusual transactions, any issues depending on management’s judgment, proposed changes to or adoption of disclosure practices, and the effects of any recent or proposed regulatory or accounting initiatives or pronouncements, all to the extent that the foregoing may be material to financial reporting. |
(b) | Review with management and the external auditors their qualitative judgments about the appropriateness, not just the acceptability, of accounting principles and accounting disclosure practices used or proposed to be used, particularly the degree of aggressiveness or conservatism of the Company’s accounting principles and underlying estimates. |
(c) | In reviewing with management and the external auditors the results of their year-end audit and quarterly reviews, and management's responses, review any problems or difficulties experienced by the external auditors in performing the audit and reviews, including any restrictions or limitations imposed by management and resolve any disagreements between management and the external auditors regarding these matters. |
(d) | Review with management, the external auditors and legal counsel, as necessary, any litigation, claim or other contingency, including tax assessments, that could have a material effect on the financial position or operating results of the Company, and the manner in which these matters have been disclosed or reflected in the financial statements. |
(e) | Review with management and the external auditors the annual audited financial statements and the related management discussion and analysis (“MD&A”) and press release; make recommendations to the Board with respect to approval thereof before being released to the |
2013 Annual Information Form | 39 |
public, and obtain an explanation from management of all significant variances between comparable reporting periods. Obtain confirmation from management and the external auditors that any GAAP reconciliation complies with the requirements of applicable securities laws.
(f) | Approve the quarterly unaudited financial statements and the related MD&A and press release prior to their release to the public. |
(g) | Review with management and the external auditors any other matter required to be communicated to the Committee by the external auditors under applicable generally accepted auditing standards, applicable law and listing standards. |
5.2. | Internal Controls |
(a) | Review and consider the adequacy and effectiveness of the Company’s internal controls over accounting and financial reporting, including information technology security and control, and any material non-compliance with such controls. |
(b) | Understand the scope of internal audits and the external auditors’ review of internal control over financial reporting and obtain reports on significant findings and recommendations, together with management’s responses. |
(c) | Review management’s internal control report and the related attestation by the external auditors and discuss the same with management, the internal auditor and external auditors. |
(d) | Obtain from the chief financial officer and chief executive officer confirmation that each is prepared to sign all required annual and quarterly certificates under applicable securities law in relation to internal controls over accounting and financial reporting. Review any disclosures made by the chief financial officer and chief executive officer regarding significant deficiencies or material weaknesses in the design or operation of internal controls or any fraud that involves management or other employees who have a significant role in the Company’s internal controls. |
(e) | Consider any special audit steps to be taken in light of any material internal control deficiencies. |
5.3. | Disclosure Controls |
(a) | Review and consider the adequacy and effectiveness of the Company’s disclosure controls and procedures, including any material non-compliance with such controls and procedures. |
(b) | Review and approve the disclosure policy of the Company and periodically assess the adequacy of such policy for completeness and accuracy. |
(c) | Ensure that the Company has satisfactory procedures in place for the review of the Company’s public disclosure of financial information extracted or derived from the Company’s financial statements. |
(d) | Monitor the activities of the Company’s Disclosure Committee. |
(e) | Review and approve, and in some instances recommend approval to the Board, material financial disclosures prior to their public release or filing with securities regulators that are contained within the following documents: |
(i) | any prospectus or offering document; |
(ii) | annual information forms; |
(iii) | all material financial information required by securities regulations (e.g., Forms 6-K, 20-F and F-4) including all exhibits thereto (including the certifications required of the Company’s principal executive officer and principal financial officer); |
(iv) | any correspondence with securities regulators or government financial agencies; and |
(v) | news or press releases containing audited or unaudited financial information, including the type and presentation of information and in particular any pro-forma or non-GAAP information. |
40 | 2013 Annual Information Form |
NOA
(f) | Review and approve, and in some instances recommend approval to the Board, material financial disclosures prior to their public release or filing with securities regulators that relate to related-party transactions or off balance sheet structures. |
5.4. | Internal Audit |
(a) | Review with management, the internal auditor and the external auditors the charter, activities, budget, staffing and organizational structure of the internal audit function. |
(b) | Review management’s proposed appointment, termination or replacement of the internal auditor. |
(c) | Review and approve the annual internal audit plan and scope of work and ensure that the internal audit plan is coordinated with the activities of the external auditors. |
(d) | Review all internal audit reports and management’s responses. |
(e) | Ensure that the internal auditor has direct and open communication with the Committee and that the internal auditor meets at least twice annually with the Committee without the presence of management to discuss any matters that the Committee or the internal auditor believe should be discussed privately, such as problems or difficulties encountered in the course of internal audit work, any unjustified restrictions or limitations imposed on the internal auditor or any other disagreements with management. |
(f) | Review the effectiveness of the internal audit function on an annual basis, including a review of reporting relationships, resources, qualifications of internal audit staff, the internal auditor’s independence from management, the internal auditor’s working relationship with the external auditors and compliance by the internal auditor with the relevant codes and standards of The Institute of Internal Auditors. The internal auditor currently reports functionally to the Chair of the Audit Committee and administratively to the Chief Financial Officer. |
5.5. | External Audit |
(a) | Advise the board with respect to the selection, appointment, retention, compensation and replacement of the external auditors. In the event of a change of external auditors, review all issues and provide documentation to the Board related to the change, including the information to be included in the Notice of Change of Auditors and the planned steps for an orderly transition period. |
(b) | Oversee the work and evaluate the qualifications and performance of the external auditors, in the course of which evaluation the Committee will: |
(i) | annually obtain and review a report by the external auditors describing: (A) the external auditors’ internal quality control procedures; (B) any material issues raised by the most recent internal quality control review, or peer review, of the external auditors or by any inquiry or investigation by government or professional authorities, within the preceding five years, respecting one or more independent audits carried out by the external auditors and any steps taken to deal with such issues; and (C) all relationships between the external auditors and the Company (in order to assess the auditors’ independence); |
(ii) | annually review and evaluate senior members of the external audit team, including their expertise and qualifications and take into consideration the opinions of management and the internal auditor in that regard; and |
(iii) | report all of its findings and conclusions with respect to the external auditors to the Board. |
(c) | Annually review and confirm with management and the external auditors the independence of the external auditors, which review will include but will not be limited to: |
(i) | ensuring receipt at least annually from the external auditors of a formal written statement delineating all relationships between the external auditors and the Company, including non-audit services provided to the Company, and outlining the extent to which the compensation of the audit partners of the external auditors is based upon selling non-audit services; |
2013 Annual Information Form | 41 |
(ii) | considering and discussing with the external auditors any disclosed relationships or services, including non-audit services, that may impact the objectivity and independence of the external auditors; |
(iii) | enquiring into and determining the appropriate resolution of any conflict of interest in respect of the external auditors; |
(iv) | reviewing the timing and process for implementing the rotation of the lead audit partner, the reviewing partner and other partners providing audit services to the Company; |
(v) | considering whether there should be a regular rotation of the audit firm itself; |
(vi) | reviewing and approving the Company’s hiring policies regarding the hiring of partners, employees and former partners and employees of the Company’s existing and former external auditors and ensuring a “cooling off” period of at least one year before any such persons can become employees of the Company in a financial oversight role. |
(d) | Ensure that the external auditors report directly to the Committee and that they are ultimately accountable to the Committee and to the Board as representatives of the shareholders of the Company. |
(e) | Review and approve the annual audit plan prior to the annual audit of the Company’s financial statements being undertaken by the external auditors, including review of the proposed scope and approach of the external auditors and the coordination of effort with internal audit. |
(f) | Ensure that the external auditors have direct and open communication with the Committee and that the external auditors meet regularly with the Committee without the presence of management to discuss any matters that the Committee or the external auditors believe should be discussed privately. |
(g) | Review and approve the basis and amount of the external auditors’ fees with respect to the annual audit and the quarterly reviews. |
(h) | Review and pre-approve all non-audit services to be provided to the Company or its subsidiaries by the external auditors and the engagement fees in respect to such services, provided that the Chair of the Committee, on behalf of the Committee, is authorized to pre-approve any non-audit services and the related engagement fees up to an amount of $20,000 per engagement. At the next Committee meeting, the Chair will report to the Committee any such pre-approval given. |
5.6. | Financial Risk Management |
(a) | Review the Company’s major financial risk exposures and approve the Company’s policies to manage such financial risk. |
(b) | Monitor management of hedging, debt and credit, make recommendations to the Board respecting management of such risks and review the Company’s compliance with the same. |
(c) | Monitor management’s communication and implementation of the Anti-Fraud Policy and review compliance with such Policy by, among other things, receiving reports from management on: |
(i) | any investigations of fraudulent activity; |
(ii) | monitoring activities in relation to fraud risks and controls; and |
(iii) | assessments of fraud risk. |
(d) | Periodically review and approve the adequacy and appropriateness of the Anti-Fraud Policy and management’s implementation of the same. |
5.7. | Code of Conduct and Ethics Reporting |
(a) | Review the policies and procedures established by management for: |
(i) | the receipt, retention and treatment of complaints received by the Company regarding financial reporting, accounting, internal accounting controls or auditing matters; and |
(ii) | the confidential, anonymous submission by employees of the Company of concerns regarding questionable accounting or auditing matters. |
42 | 2013 Annual Information Form |
NOA
(b) | Monitor management’s communication and implementation of the Code of Conduct and Ethics Policy and review compliance with such Policy by, among other things: |
(i) | reviewing on a timely basis serious violations of the Code of Conduct and Ethics Policy; and |
(ii) | reviewing on a summary basis at least quarterly all reported violations of the Code of Conduct and Ethics Policy. |
(c) | Periodically review the adequacy and appropriateness of the Code of Conduct and Ethics Policy and management’s implementation of the same and make recommendations to the Board in that regard. |
5.8. | Legal and Regulatory Compliance |
(a) | Review the effectiveness of the system for monitoring compliance with laws and regulations (other than those related to health, environment and safety matters) and the results of management’s investigation and follow-up (including disciplinary action) of any instances of non-compliance. Review the findings of any examination by regulatory authorities and any external auditors’ observations relating to such matters. |
(b) | Obtain regular updates from management and legal counsel regarding compliance matters, including compliance with applicable financial, tax or securities regulations and the accuracy and timeliness of filings with regulators. |
(c) | Review any litigation, claim or other contingent liability, including any tax reassessment that could have a material effect on the financial statements. |
(d) | Monitor compliance by the Company with all payments and remittances required to be made in accordance with applicable law, where the failure to make such payments could render the directors of the Company personally liable. |
5.9. | Other Responsibilities |
(a) | Regularly report to the Board about Committee activities, issues and related recommendations, including such matters as the Board may from time to time refer or delegate to the Committee. |
(b) | Annually assess the adequacy of this Charter, submit such evaluation to the Governance Committee and recommend any proposed changes to the Governance Committee to bring forward to the Board for approval. |
(c) | Evaluate the performance and effectiveness of the Committee on an annual basis. |
(d) | Provide an open avenue of communication between internal audit, the external auditors and the Board. |
(e) | Perform any other activities consistent with the Committee’s mandate, the Company’s governing laws and the regulations of relevant stock exchanges as he Committee or the Board deems necessary or appropriate. |
6. | GENERAL |
6.1. | While the Committee will have the responsibilities and powers set forth in this Charter, it will not be the responsibility of the Committee to determine whether the Company’s financial statements are complete, accurate or prepared in accordance with generally accepted accounting principles, to manage financial risks or to conduct audits. These are the responsibilities of management and the external auditors in accordance with their respective roles. |
6.2. | The Committee will take reasonable steps to ensure that management establishes and maintains the controls, procedures and processes that comply with all appropriate laws, regulations or policies of the Company. It is not the responsibility of the Committee to conduct investigations or to ensure compliance with laws, regulations or Company policies. |
2013 Annual Information Form | 43 |
Prepared By: | Approved By: | Date of Approval and Issue: | ||
/s/ Jordan Slator | /s/ Allen Sello | December 1, 2011 | ||
Jordan Slator | Allen Sello, Chair | |||
General Counsel | Audit Committee | |||
and Secretary | ||||
Appendix A: Audit Committee Financial Expert
At least one member of the Committee will be an “audit committee financial expert” who will possess the attributes outlined below:
1. | An understanding of generally accepted accounting principles and financial statements; |
2. | The ability to assess the general application of generally accepted accounting principles in connection with the accounting for estimates, accruals and reserves; |
3. | Experience in preparing, auditing, analyzing or evaluating financial statements that present a breadth and level of complexity of accounting issues that are generally comparable to the breadth and complexity of issues that can reasonably be expected to be raised by the Company's financial statements, or experience in actively supervising one or more persons engaged in such activities; |
4. | An understanding of internal control over financial reporting; and |
5. | An understanding of audit committee functions. |
As provided in the rules of the SEC, the designation or identification of a person as an audit committee financial expert does not (a) impose on that person any duties, obligations or liability that are greater than the duties, obligations or liability imposed on that person as a member of the Committee and the Board in the absence of such designation or identification or (b) affect the duties, obligations or liability of any other member of the Committee or the Board.
A member of the Committee may qualify as an audit committee financial expert as a result of his or her:
a) | education and experience as a principal financial officer, principal accounting officer, controller, public accountant or auditor or experience in one or more positions that involve the performance of similar functions; |
b) | experience actively supervising a principal financial officer, principal accounting officer, controller, public accountant, auditor or person performing similar functions; |
c) | experience overseeing or assessing the performance of companies or public accountants with respect to the preparation, auditing or evaluation of financial statements; or |
d) | other relevant experience. |
44 | 2013 Annual Information Form |