
EXHIBIT 99.2 Earnings Release Supplement First Quarter 2024
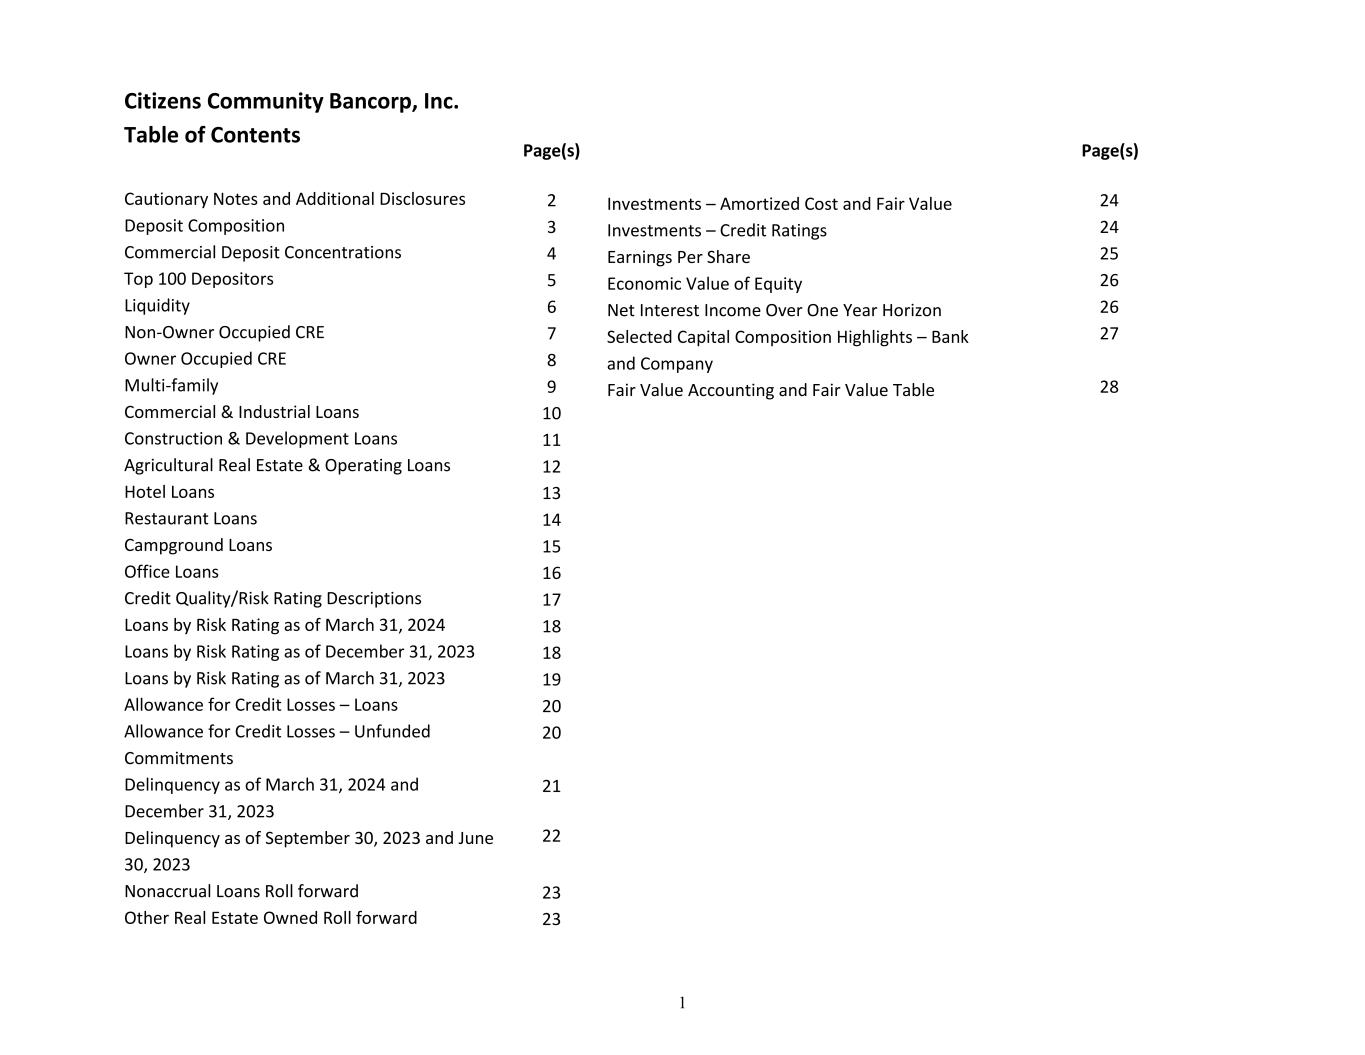
Citizens Community Bancorp, Inc. Table of Contents Cautionary Notes and Additional Disclosures Deposit Composition Commercial Deposit Concentrations Top 100 Depositors Liquidity Non-Owner Occupied CRE Owner Occupied CRE Multi-family Commercial & Industrial Loans Construction & Development Loans Agricultural Real Estate & Operating Loans Hotel Loans Restaurant Loans Campground Loans Office Loans Credit Quality/Risk Rating Descriptions Loans by Risk Rating as of March 31, 2024 Loans by Risk Rating as of December 31, 2023 Loans by Risk Rating as of March 31, 2023 Allowance for Credit Losses – Loans Allowance for Credit Losses – Unfunded Commitments Delinquency as of March 31, 2024 and December 31, 2023 Delinquency as of September 30, 2023 and June 30, 2023 Nonaccrual Loans Roll forward Other Real Estate Owned Roll forward Page(s) 2 3 4 5 6 7 8 9 10 11 12 13 14 15 16 17 18 18 19 20 20 21 22 23 23 Investments – Amortized Cost and Fair Value Investments – Credit Ratings Earnings Per Share Economic Value of Equity Net Interest Income Over One Year Horizon Selected Capital Composition Highlights – Bank and Company Fair Value Accounting and Fair Value Table Page(s) 24 24 25 26 26 27 28 1
Cautionary Notes and Additional Disclosures DATES AND PERIODS PRESENTED In this earnings release financial supplement, unless otherwise noted, “20YY” refers to either the corresponding fiscal year-end date or the corresponding 12-months (i.e. fiscal year) then ended. “MMM-YY” refers to either the corresponding quarter-end date, or the corresponding three-month period then ended. CAUTIONARY NOTE REGARDING FORWARD LOOKING STATEMENTS This earnings release financial supplement may contain certain forward-looking statements within the meaning of Section 27A of the Securities Act of 1933, and Section 21E of the Securities Exchange Act of 1934. These statements include, but are not limited to, descriptions of the financial condition, results of operations, asset and credit quality trends, profitability, projected earnings, future plans, strategies and expectations of Citizens Community Bancorp, Inc. (“CZWI” or the “Company”) and its subsidiary, Citizens Community Federal, National Association (“CCFBank”). The Company intends such forward-looking statements to be covered by the safe harbor provisions for forward-looking statements contained in the Private Securities Litigation Reform Act of 1995 and is including this statement for purposes of complying with those safe harbor provisions. Forward-looking statements, which are based on certain assumptions of the Company, are generally identifiable by use of the words “believe,” “expect,” “estimates,” “intend,” “anticipate,” “estimate,” “project,” “on pace,” “seek,” “target,” “potential,” “focus,” “may,” “preliminary,” “could,” “should” or similar expressions. These forward-looking statements express management’s current expectations or forecasts of future events, and by their nature, are subject to risks and uncertainties. Therefore, there are a number of factors that might cause actual results to differ materially from those in such statements. These uncertainties include: conditions in the financial markets and economic conditions generally; the impact of inflation on our business and our customers; geopolitical tensions, including current or anticipated impact of military conflicts; higher lending risks associated with our commercial and agricultural banking activities; future pandemics (including new variants of COVID-19); cybersecurity risks; adverse impacts on the regional banking industry and the business environment in which it operates; interest rate risk; lending risk; changes in the fair value or ratings downgrades of our securities; the sufficiency of allowance for credit losses; competitive pressures among depository and other financial institutions; disintermediation risk; our ability to maintain our reputation; our ability to maintain or increase our market share; our ability to realize the benefits of net deferred tax assets; our inability to obtain needed liquidity; our ability to raise capital needed to fund growth or meet regulatory requirements; our ability to attract and retain key personnel; our ability to keep pace with technological change; prevalence of fraud and other financial crimes; the possibility that our internal controls and procedures could fail or be circumvented; our ability to successfully execute our acquisition growth strategy; risks posed by acquisitions and other expansion opportunities, including difficulties and delays in integrating the acquired business operations or fully realizing the cost savings and other benefits; restrictions on our ability to pay dividends; the potential volatility of our stock price; accounting standards for credit losses; legislative or regulatory changes or actions, or significant litigation, adversely affecting the Company or Bank; public company reporting obligations; changes in federal or state tax laws; and changes in accounting principles, policies or guidelines and their impact on financial performance. Stockholders, potential investors and other readers are urged to consider these factors carefully in evaluating the forward-looking statements and are cautioned not to place undue reliance on such forward-looking statements. Such uncertainties and other risks that may affect the Company's performance are discussed further in Part I, Item 1A, “Risk Factors,” in the Company’s Form 10-K, for the year ended December 31, 2023, filed with the Securities and Exchange Commission (“SEC”) on March 5, 2024, and the Company's subsequent filings with the SEC. The Company undertakes no obligation to make any revisions to the forward-looking statements contained herein or to update them to reflect events or circumstances occurring after the date hereof. NON-GAAP FINANCIAL MEASURES This earnings release financial supplement contains non-GAAP financial measures. For purposes of Regulation G, a non-GAAP financial measure is a numerical measure of the registrant's historical or future financial performance, financial position or cash flows that excludes amounts, or is subject to adjustments that have the effect of excluding amounts, that are included in the most directly comparable measure calculated and presented in accordance with GAAP in the statement of income, balance sheet or statement of cash flows (or equivalent statements) of the issuer; or includes amounts, or is subject to adjustments that have the effect of including amounts, that are excluded from the most directly comparable measure so calculated and presented. In this regard, GAAP refers to generally accepted accounting principles in the United States. Non-GAAP financial measures referred to herein include net income as adjusted, return on average equity as adjusted, and return on average assets as adjusted. Reconciliations of all non-GAAP financial measures used herein to the comparable GAAP financial measures in the appendix at the end of this presentation. 2
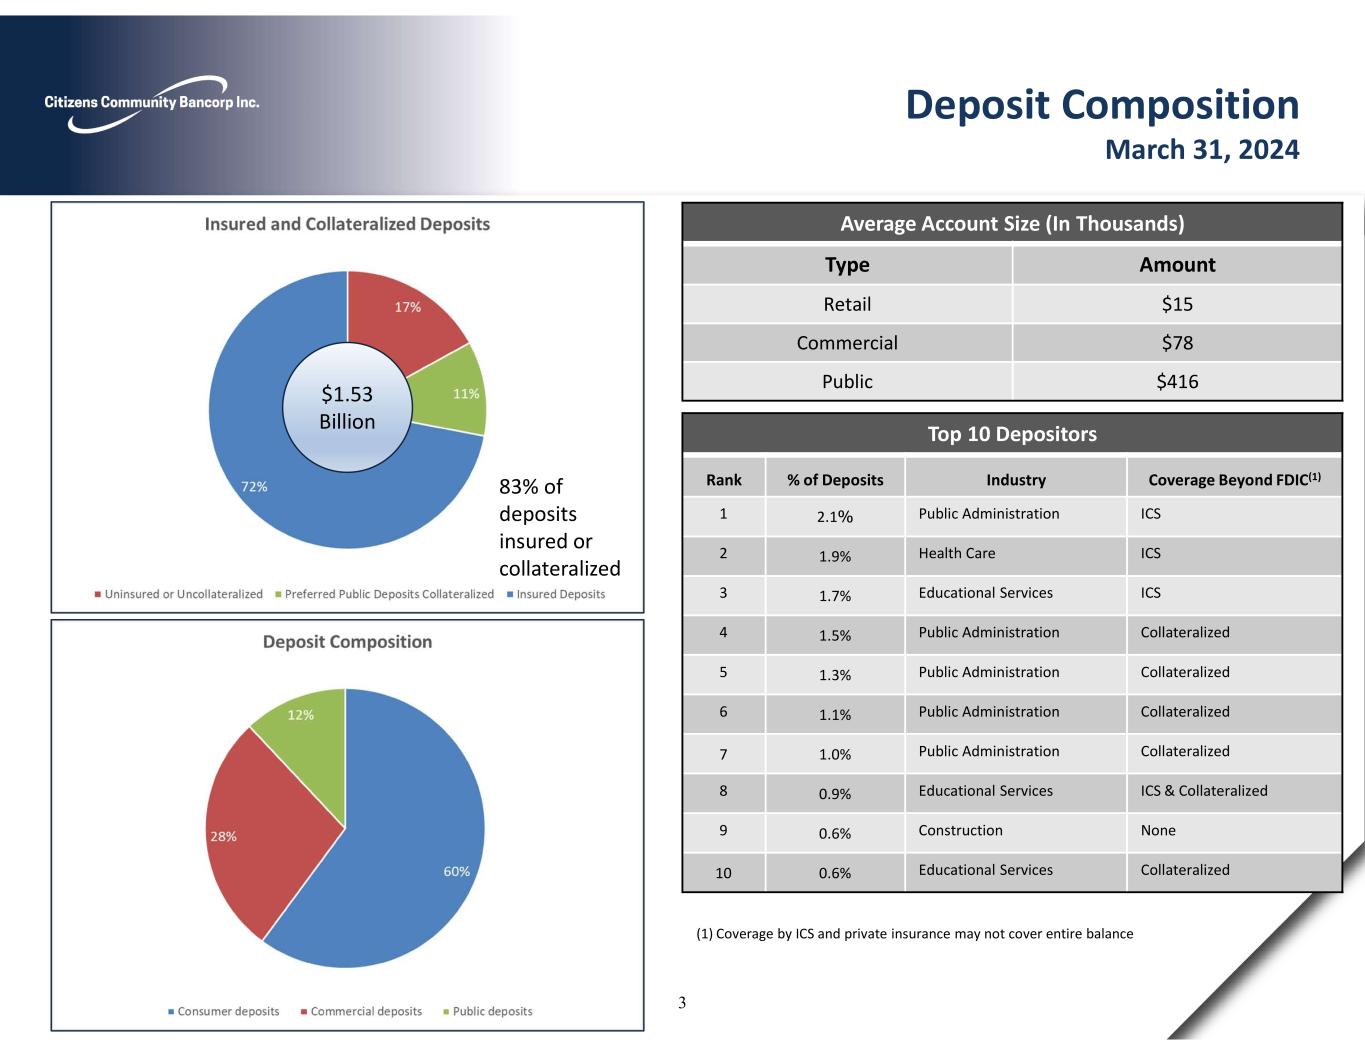
Deposit Composition March 31, 2024 Average Account Size (In Thousands) AmountType $15Retail $78Commercial $416Public$1.53 Billion 83% of deposits insured or collateralized Top 10 Depositors Coverage Beyond FDIC(1)Industry% of DepositsRank ICSPublic Administration2.1%1 ICSHealth Care1.9%2 ICSEducational Services1.7%3 CollateralizedPublic Administration1.5%4 CollateralizedPublic Administration1.3%5 CollateralizedPublic Administration1.1%6 CollateralizedPublic Administration1.0%7 ICS & CollateralizedEducational Services0.9%8 NoneConstruction0.6%9 CollateralizedEducational Services0.6%10 (1) Coverage by ICS and private insurance may not cover entire balance 3
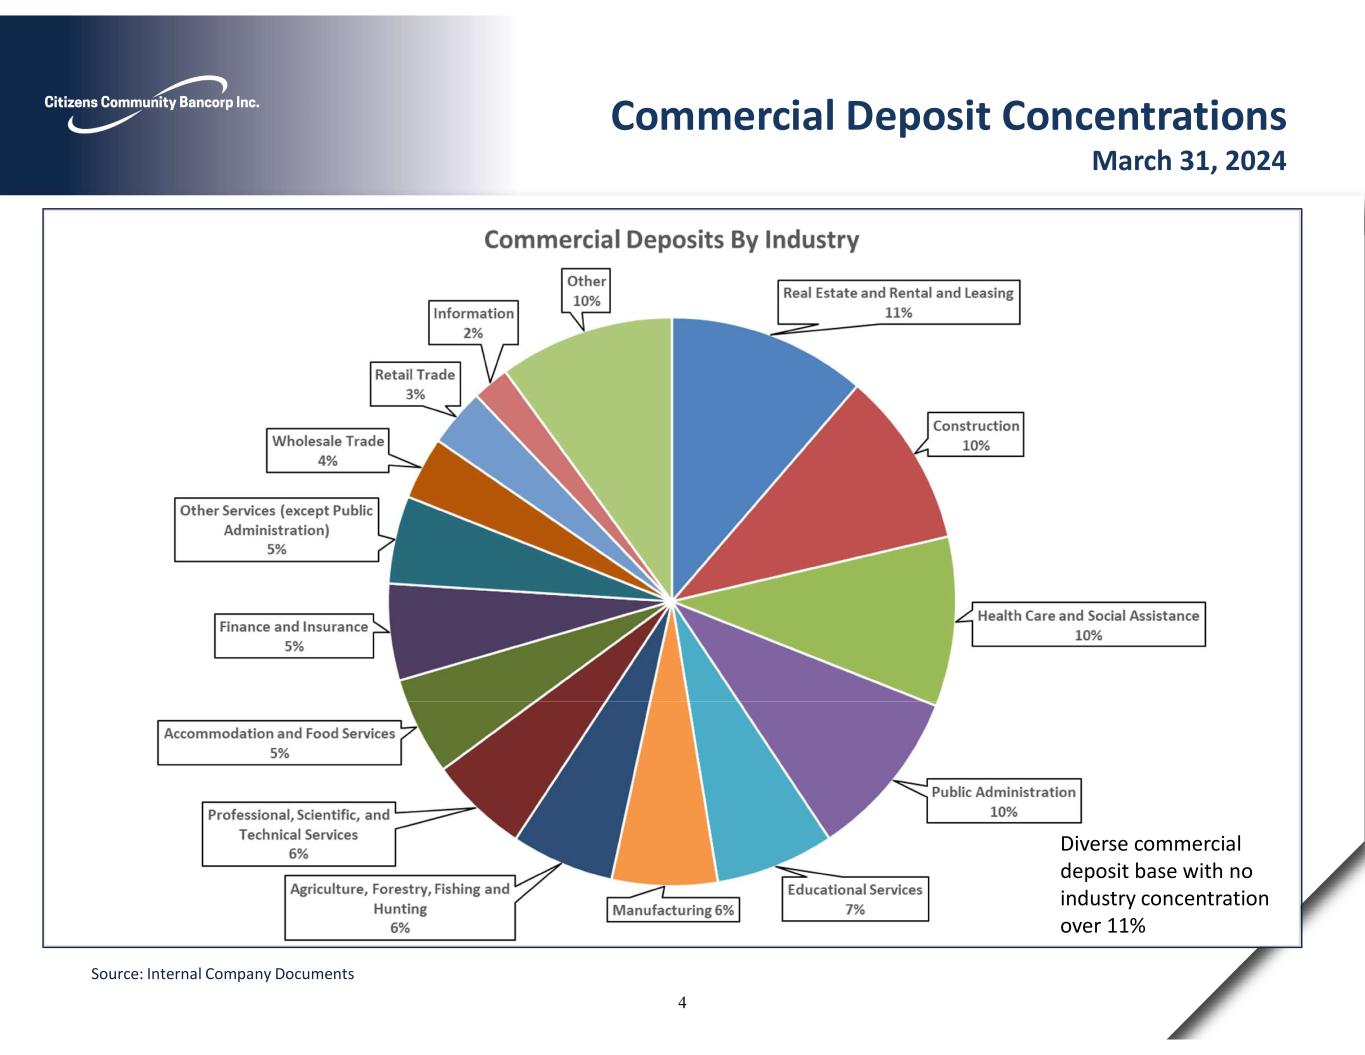
Commercial Deposit Concentrations March 31, 2024 Source: Internal Company Documents Diverse commercial deposit base with no industry concentration over 11% 4
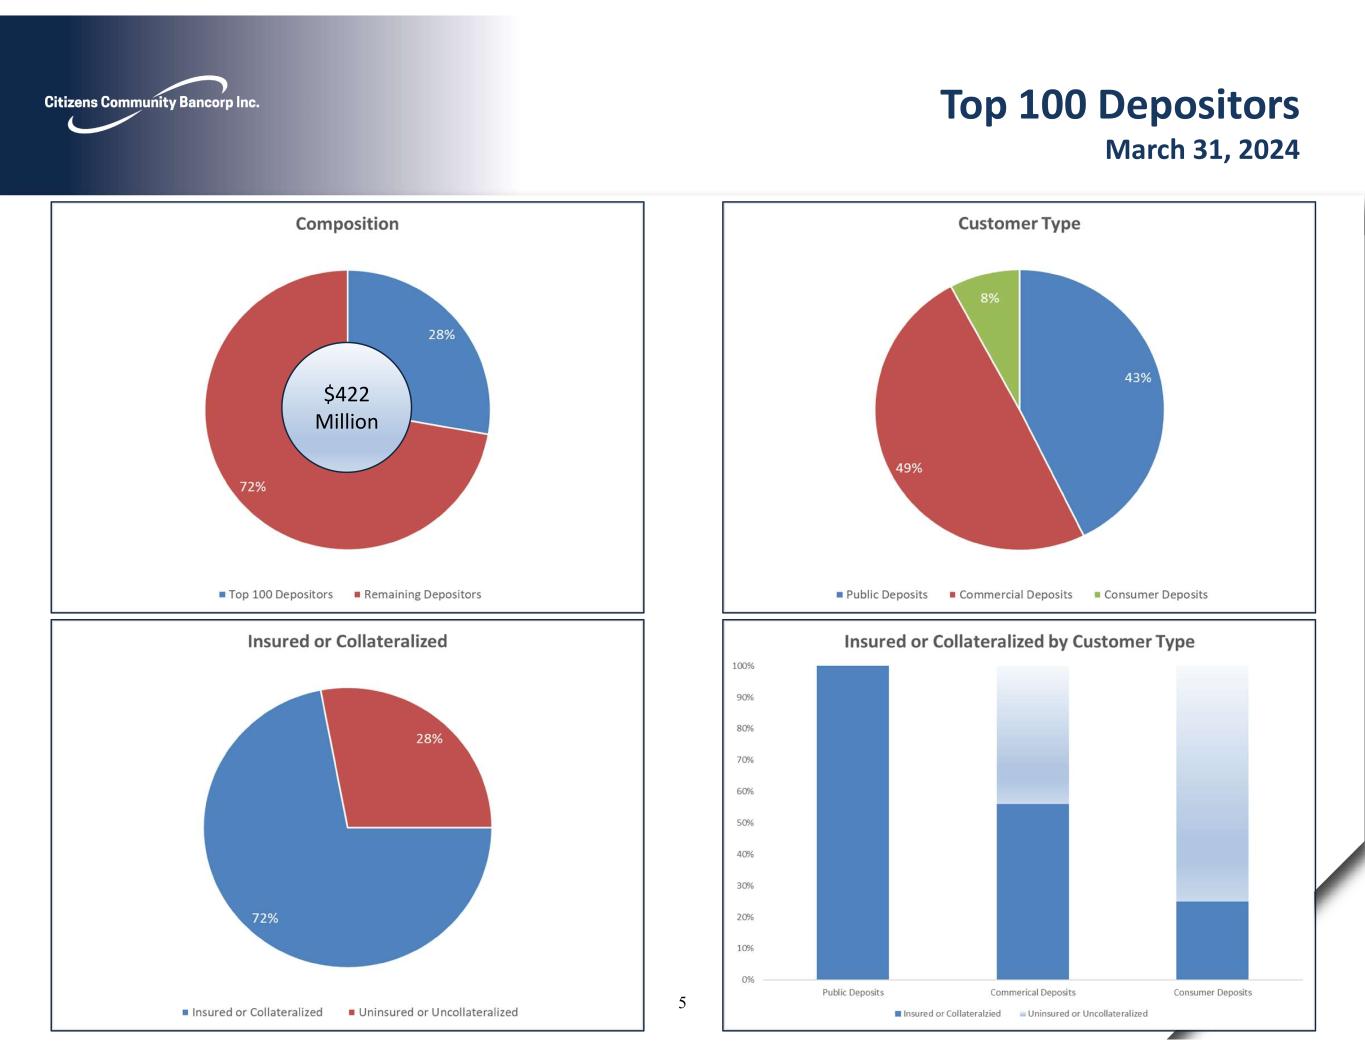
Top 100 Depositors March 31, 2024 $422 Million 5
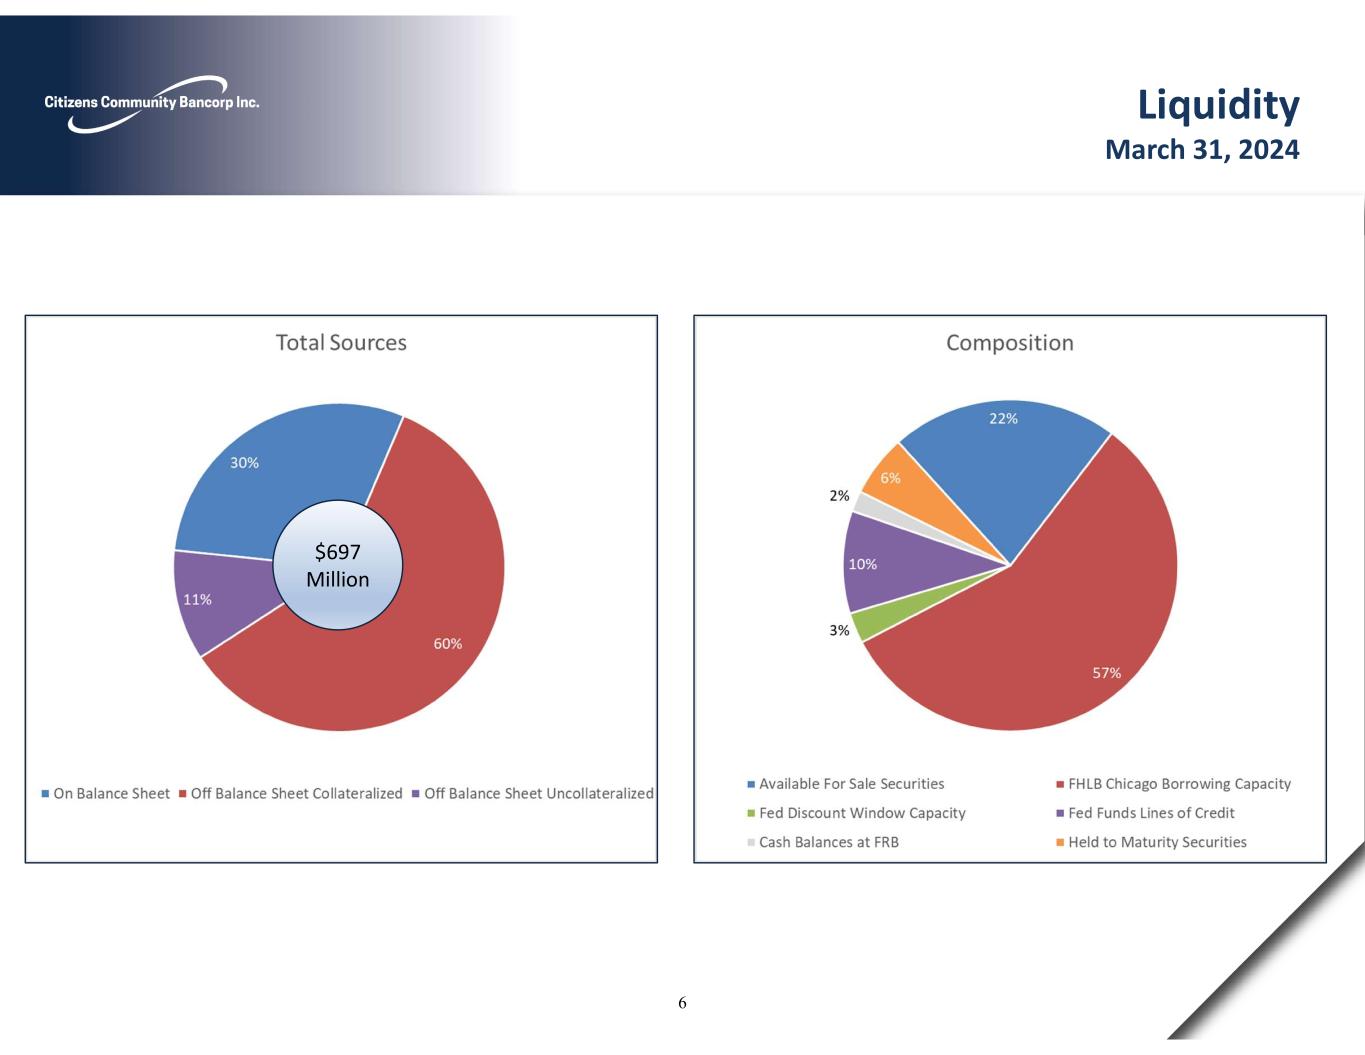
Liquidity March 31, 2024 $697 Million 6
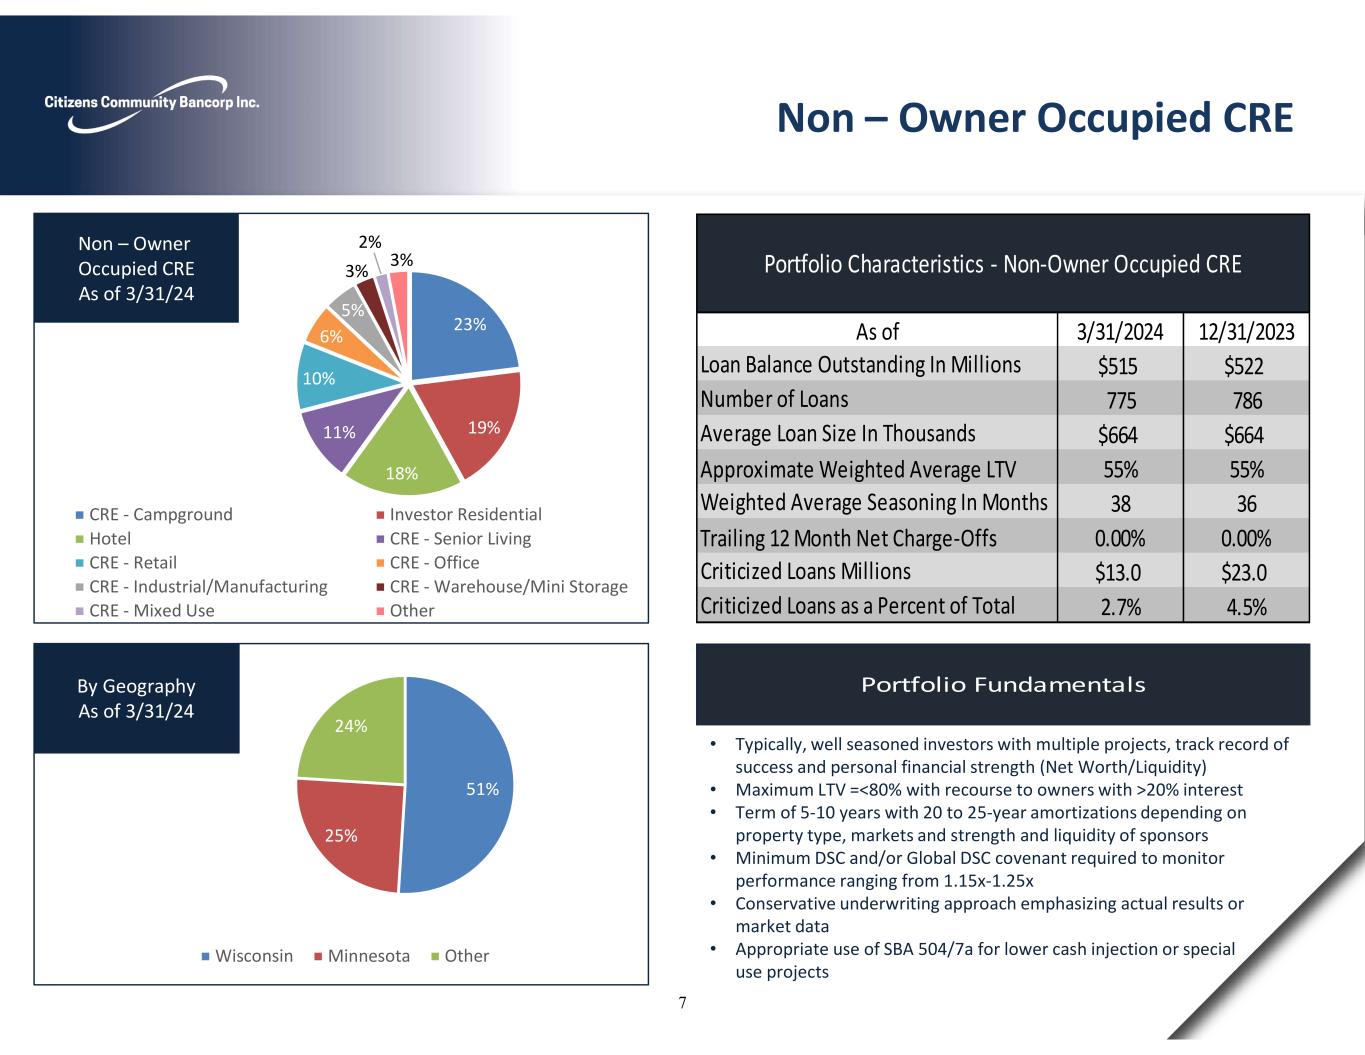
Portfolio Fundamentals 51% 25% 24% Wisconsin Minnesota Other By Geography As of 3/31/24 • Typically, well seasoned investors with multiple projects, track record of success and personal financial strength (Net Worth/Liquidity) • Maximum LTV =<80% with recourse to owners with >20% interest • Term of 5-10 years with 20 to 25-year amortizations depending on property type, markets and strength and liquidity of sponsors • Minimum DSC and/or Global DSC covenant required to monitor performance ranging from 1.15x-1.25x • Conservative underwriting approach emphasizing actual results or market data • Appropriate use of SBA 504/7a for lower cash injection or special use projects Non – Owner Occupied CRE 3/31/2024 12/31/2023 $515 $522 775 786 $664 $664 Approximate Weighted Average LTV 55% 55% 38 36 Trailing 12 Month Net Charge-Offs 0.00% 0.00% $13.0 $23.0 2.7% 4.5% Weighted Average Seasoning In Months Loan Balance Outstanding In Millions Number of Loans Average Loan Size In Thousands Portfolio Characteristics - Non-Owner Occupied CRE As of Criticized Loans Millions Criticized Loans as a Percent of Total 23% 19% 18% 11% 10% 6% 5% 3% 2% 3% CRE - Campground Investor Residential Hotel CRE - Senior Living CRE - Retail CRE - Office CRE - Industrial/Manufacturing CRE - Warehouse/Mini Storage CRE - Mixed Use Other Non – Owner Occupied CRE As of 3/31/24 7
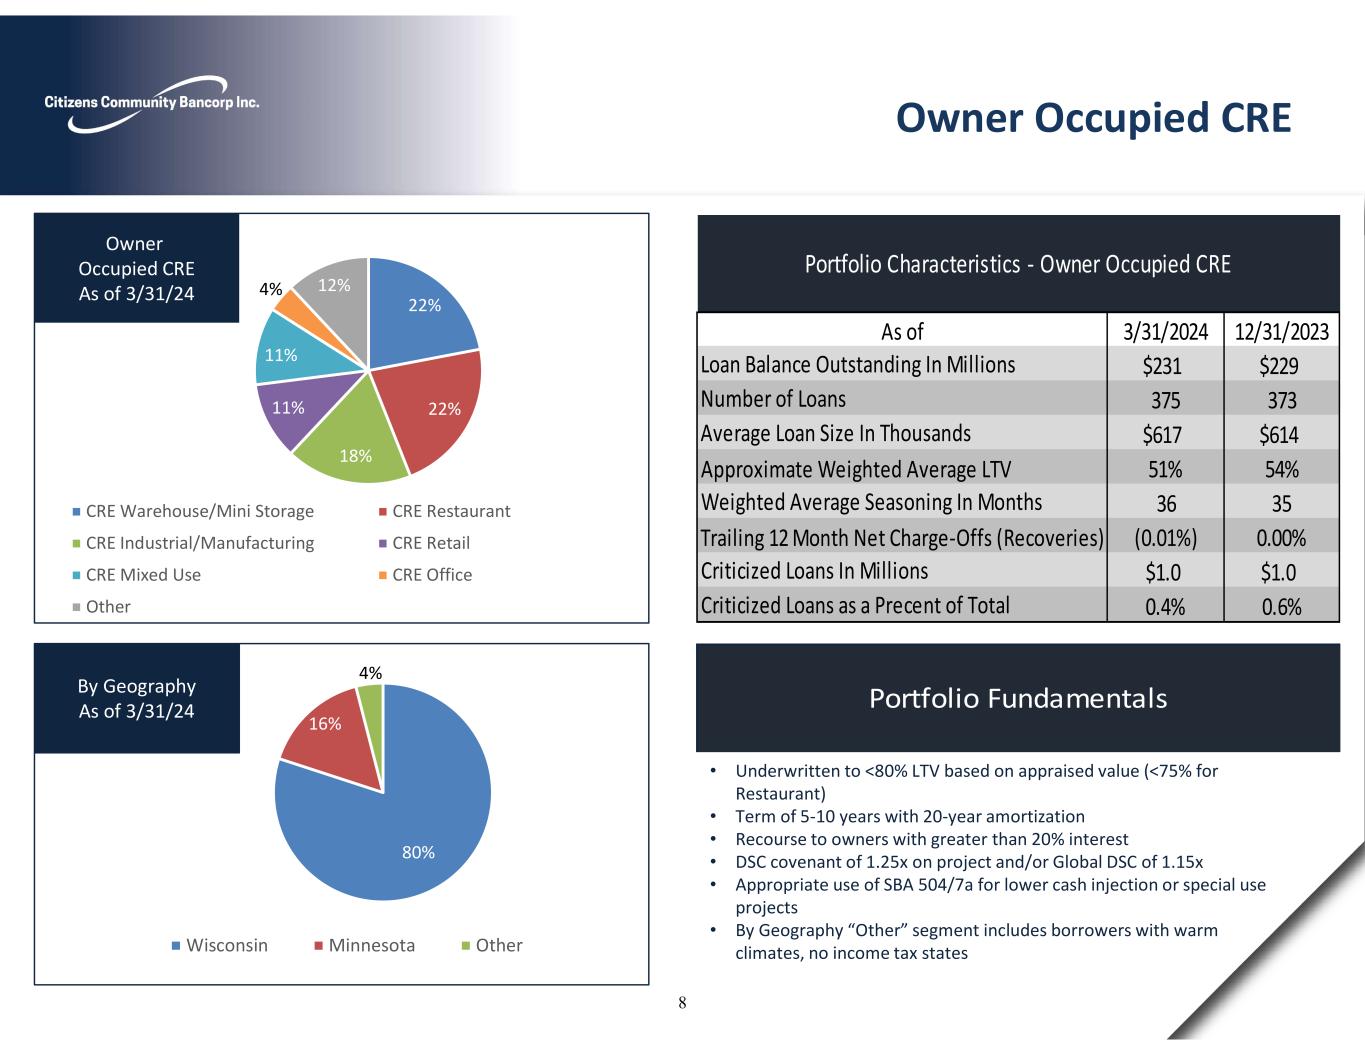
22% 22% 18% 11% 11% 4% 12% CRE Warehouse/Mini Storage CRE Restaurant CRE Industrial/Manufacturing CRE Retail CRE Mixed Use CRE Office Other Owner Occupied CRE As of 3/31/24 Portfolio Fundamentals 80% 16% 4% Wisconsin Minnesota Other By Geography As of 3/31/24 • Underwritten to <80% LTV based on appraised value (<75% for Restaurant) • Term of 5-10 years with 20-year amortization • Recourse to owners with greater than 20% interest • DSC covenant of 1.25x on project and/or Global DSC of 1.15x • Appropriate use of SBA 504/7a for lower cash injection or special use projects • By Geography “Other” segment includes borrowers with warm climates, no income tax states Owner Occupied CRE 3/31/2024 12/31/2023 $231 $229 375 373 $617 $614 Approximate Weighted Average LTV 51% 54% 36 35 Trailing 12 Month Net Charge-Offs (Recoveries) (0.01%) 0.00% $1.0 $1.0 0.4% 0.6%Criticized Loans as a Precent of Total Weighted Average Seasoning In Months Criticized Loans In Millions Portfolio Characteristics - Owner Occupied CRE Loan Balance Outstanding In Millions Number of Loans Average Loan Size In Thousands As of 8
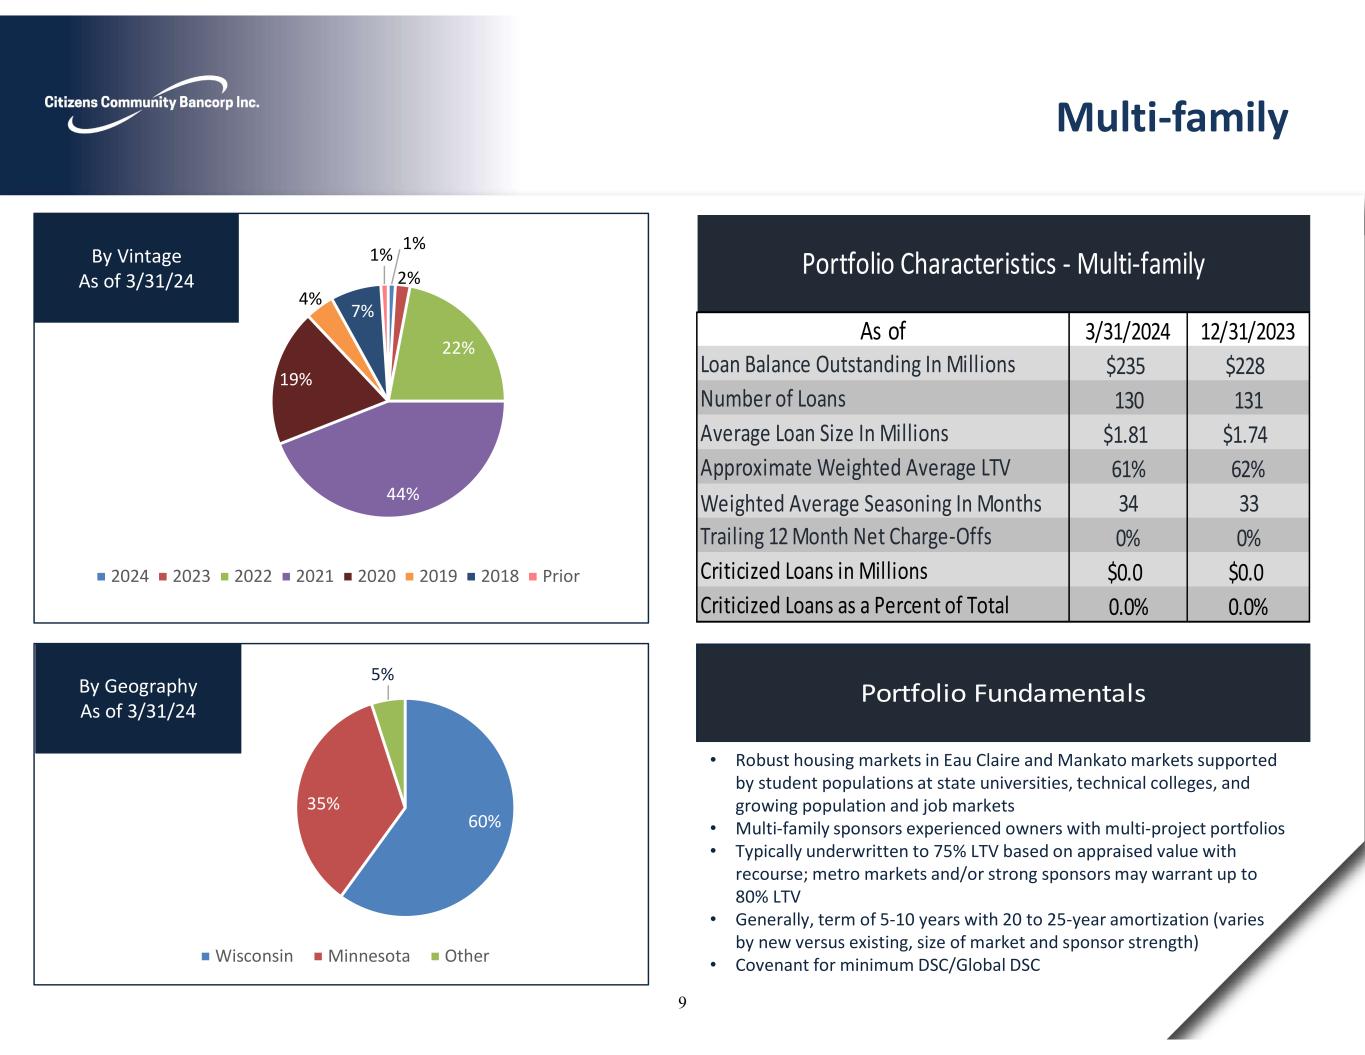
Portfolio Fundamentals 60% 35% 5% Wisconsin Minnesota Other By Geography As of 3/31/24 1% 2% 22% 44% 19% 4% 7% 1% 2024 2023 2022 2021 2020 2019 2018 Prior By Vintage As of 3/31/24 • Robust housing markets in Eau Claire and Mankato markets supported by student populations at state universities, technical colleges, and growing population and job markets • Multi-family sponsors experienced owners with multi-project portfolios • Typically underwritten to 75% LTV based on appraised value with recourse; metro markets and/or strong sponsors may warrant up to 80% LTV • Generally, term of 5-10 years with 20 to 25-year amortization (varies by new versus existing, size of market and sponsor strength) • Covenant for minimum DSC/Global DSC Multi-family 3/31/2024 12/31/2023 $235 $228 130 131 $1.81 $1.74 61% 62% Weighted Average Seasoning In Months 34 33 0% 0% $0.0 $0.0 0.0% 0.0%Criticized Loans as a Percent of Total Approximate Weighted Average LTV Trailing 12 Month Net Charge-Offs Criticized Loans in Millions Portfolio Characteristics - Multi-family Loan Balance Outstanding In Millions Number of Loans Average Loan Size In Millions As of 9

93% 6% 1% Wisconsin Minnesota Other By Geography As of 3/31/24 20% 15% 10% 8%7% 7% 6% 5% 5% 4% 3% 10% Finance and Insurance Manufacturing Transportation and Warehousing Wholesale Trade Construction Public Admin Retail Trade Administrative Support Agriculture Real Estate, Rental and Leasing Education Services Other Commercial & Industrial As of 3/31/24 • Highly diversified, secured loan portfolio underwritten with recourse • Lines of credit reviewed annually and may have borrowing base certificates governing line usage • Fixed asset LTV’s based on age and type of equipment; <5-year amortization • Use of SBA Guaranty Program (Preferred Lender or General Processing) as appropriate • “Retail Trade” segment consists of Farm Supply, Franchised Hardware, Franchised Auto Parts, Franchised and Non-franchised Auto Dealers and Repair Shops, Convenience Stores/Gas Stations Commercial & Industrial Loans 3/31/2024 12/31/2023 $129 $122 649 637 $198 $191 32 28 (0.01%) 0.02% $53 $62 $3.0 $2.0 Criticized Loans as a Precent of Total 2.7% 1.8% Criticized Loans In Millions Weighted Average Seasoning In Months Trailing 12 Month Net Charge-Offs (Recoveries) Committed Line, if collateral In Millions Portfolio Characteristics - Commercial & Industrial Loan Balance In Millions Number of Loans Average Loan Size In Thousands As of Portfolio Fundamentals 10

Portfolio Fundamentals 26% 24%22% 12% 9% 5% 2% Campgrounds Multi-Family 1-4 Family Retail Land Hospitality Other Commercial & Development As of 3/31/24 47% 17% 15% 11% 6% 4% Wisconsin South Dakota Minnesota Utah Tennessee Colorado By Geography As of 3/31/24 • Underwritten to 75-80% LTV based on lesser of cost or appraised value with full recourse • Interest only typically up to 18 months (depending on project complexity and seasonal timing) followed by amortization of 15-25 years (terms vary by property type) • Borrower equity contribution of cash/land value =>15% injected at the beginning of project (cash/land contribution) • Construction loans require 3rd party inspections and title company draws after balancing to sworn construction statement • 1-4 residential construction centered in eastern Twin Cities and Northwest Wisconsin. Generally, 80% LTC /60%-80% of AV. Spec building capped. Progress reporting monthly by individual home Construction & Development Loans 3/31/2024 12/31/2023 Loan Balance Outstanding In Millions $94 $111 Number of Loans 111 117 Average Loan Size In Millions $1.0 $1.0 Approximate Weighted Average LTV 68% 64% Trailing 12 Month Net Charge-Offs 0.00% 0.00% Percent Utilized of Commitments 71% 66% $0.3 $0.3 Criticized Loans as a Percent of Total 0.3% 0.3% Portfolio Characteristics - Construction & Development As of Criticized Loans in Millions 11
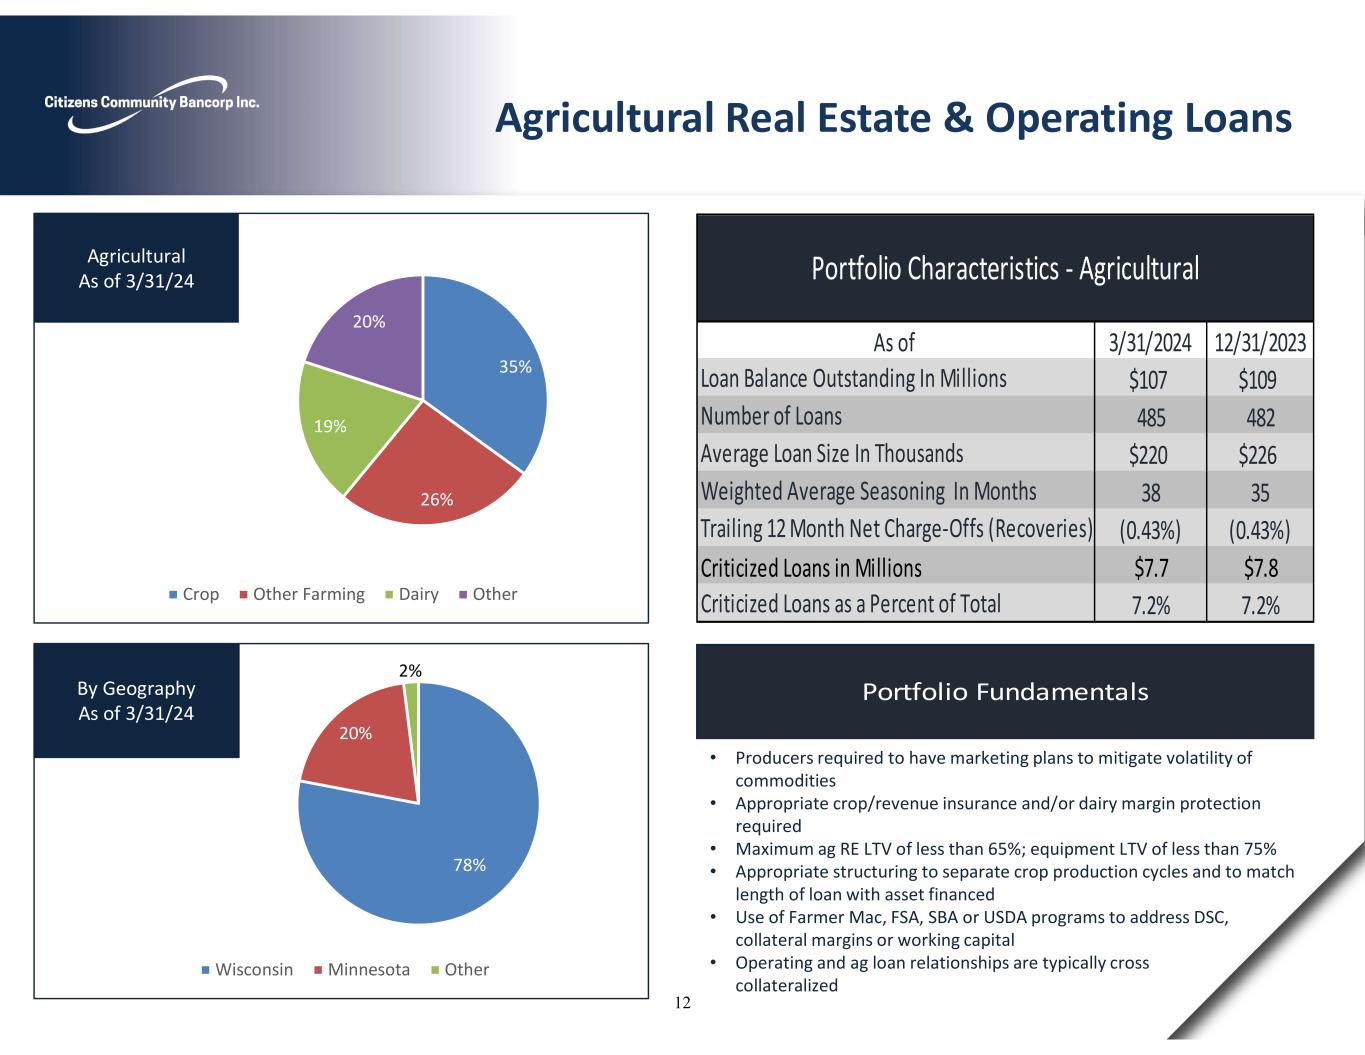
35% 26% 19% 20% Crop Other Farming Dairy Other Agricultural As of 3/31/24 Portfolio Fundamentals 78% 20% 2% Wisconsin Minnesota Other By Geography As of 3/31/24 • Producers required to have marketing plans to mitigate volatility of commodities • Appropriate crop/revenue insurance and/or dairy margin protection required • Maximum ag RE LTV of less than 65%; equipment LTV of less than 75% • Appropriate structuring to separate crop production cycles and to match length of loan with asset financed • Use of Farmer Mac, FSA, SBA or USDA programs to address DSC, collateral margins or working capital • Operating and ag loan relationships are typically cross collateralized Agricultural Real Estate & Operating Loans 3/31/2024 12/31/2023 $107 $109 485 482 $220 $226 38 35 (0.43%) (0.43%) Criticized Loans in Millions $7.7 $7.8 7.2% 7.2%Criticized Loans as a Percent of Total Weighted Average Seasoning In Months Trailing 12 Month Net Charge-Offs (Recoveries) Portfolio Characteristics - Agricultural Loan Balance Outstanding In Millions Number of Loans Average Loan Size In Thousands As of 12

60% 25% 15% Limited Service Full Service Other Hotels As of 3/31/24 Portfolio Fundamentals 42% 38% 16% 4% Minnesota Wisconsin Illinois Colorado By Geography As of 3/31/24 • Mainly experienced multi project hoteliers and guarantors with strong personal financial statements (net worth and liquidity) • Mainly flagged/franchised limited stay properties • Underwriting consistent with management's conservative approach to Investor CRE, emphasizing actual results in underwriting Hotel Loans 3/31/2024 12/31/2023 $95 $97 21 25 $4.5 $3.9 54% 55% (0.04%) 0.00% Criticized Loans in Millions $4.6 $5.2 4.8% 5.4%Criticized Loans as a Precent of Total As of Number of Loans Trailing 12 Month Net Charge Offs (Recoveries) Portfolio Characteristics - Hotels Loan Balance Outstanding In Millions Average Loan Size In Millions Approximate Weighted Average LTV 13

63%17% 11% 4% 3% 2% Culver's - Limited Service Restaurants Bowling Centers Drinking Establishments Other National Limited Services Other Restaurants As of 3/31/24 Portfolio Fundamentals 55% 28% 17% Wisconsin Minnesota Other By Geography As of 3/31/24 • Experienced developers/operators of national Limited /Quick Service brands (Culver’s, Subway, Dairy Queen, McDonalds, Jimmy John’s, A&W) • Underwritten to =<80% LTV with full recourse (depending on sponsor history); 20-year amortization with 5 to 10-year terms • Use of SBA Guaranty Program (Preferred Lender or General Processing) as appropriate • Drinking establishments may have other collateral pledged and tend to be in smaller communities in our footprint • Lessors of RE include investor and owner-occupied structure Restaurant Loans 3/31/2024 12/31/2023 $57 $52 71 74 $801 $709 44% 48% 0.00% 0.00% Criticized Loans In Millions $0.0 $0.6 0.0% 1.2%Criticized Loans as a Percent of Total Portfolio Characteristics - Restaurants As of Trailing 12 Month Net Charge-Offs Loan Balance Outstanding In Millions Number of Loans Average Loan Size In Thousands Approximate Weighted Average LTV 14
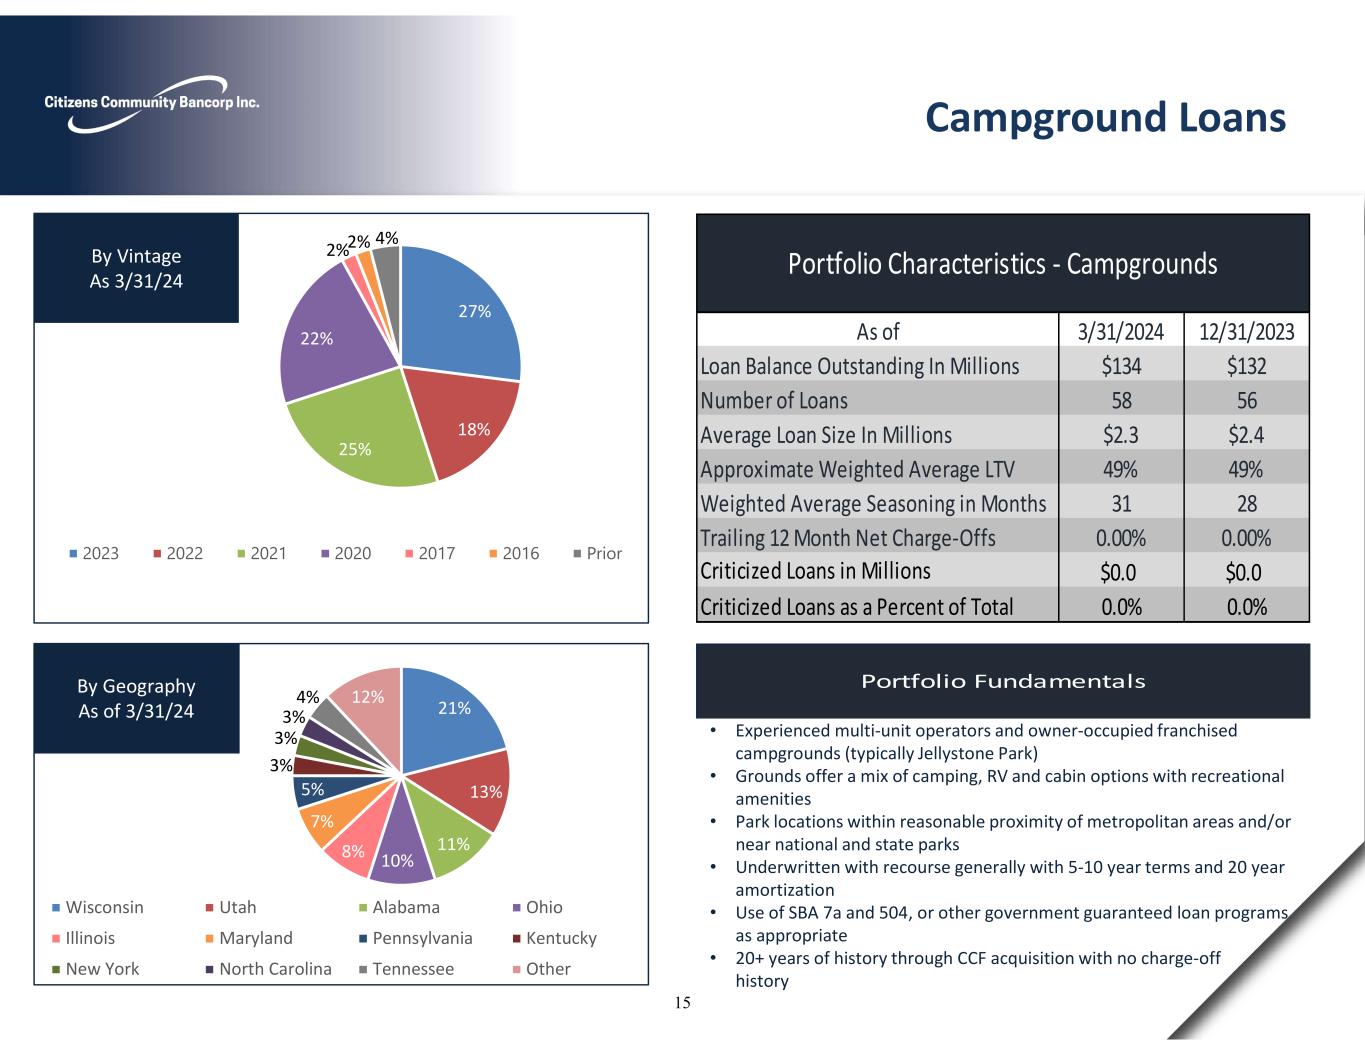
27% 18% 25% 22% 2%2% 4% 2023 2022 2021 2020 2017 2016 Prior By Vintage As 3/31/24 Portfolio Fundamentals 21% 13% 11% 10%8% 7% 5% 3% 3% 3% 4% 12% Wisconsin Utah Alabama Ohio Illinois Maryland Pennsylvania Kentucky New York North Carolina Tennessee Other By Geography As of 3/31/24 • Experienced multi-unit operators and owner-occupied franchised campgrounds (typically Jellystone Park) • Grounds offer a mix of camping, RV and cabin options with recreational amenities • Park locations within reasonable proximity of metropolitan areas and/or near national and state parks • Underwritten with recourse generally with 5-10 year terms and 20 year amortization • Use of SBA 7a and 504, or other government guaranteed loan programs as appropriate • 20+ years of history through CCF acquisition with no charge-off history Campground Loans 3/31/2024 12/31/2023 $134 $132 58 56 $2.3 $2.4 49% 49% 31 28 0.00% 0.00% $0.0 $0.0 Criticized Loans as a Percent of Total 0.0% 0.0% Portfolio Characteristics - Campgrounds As of Weighted Average Seasoning in Months Criticized Loans in Millions Loan Balance Outstanding In Millions Number of Loans Average Loan Size In Millions Approximate Weighted Average LTV Trailing 12 Month Net Charge-Offs 15
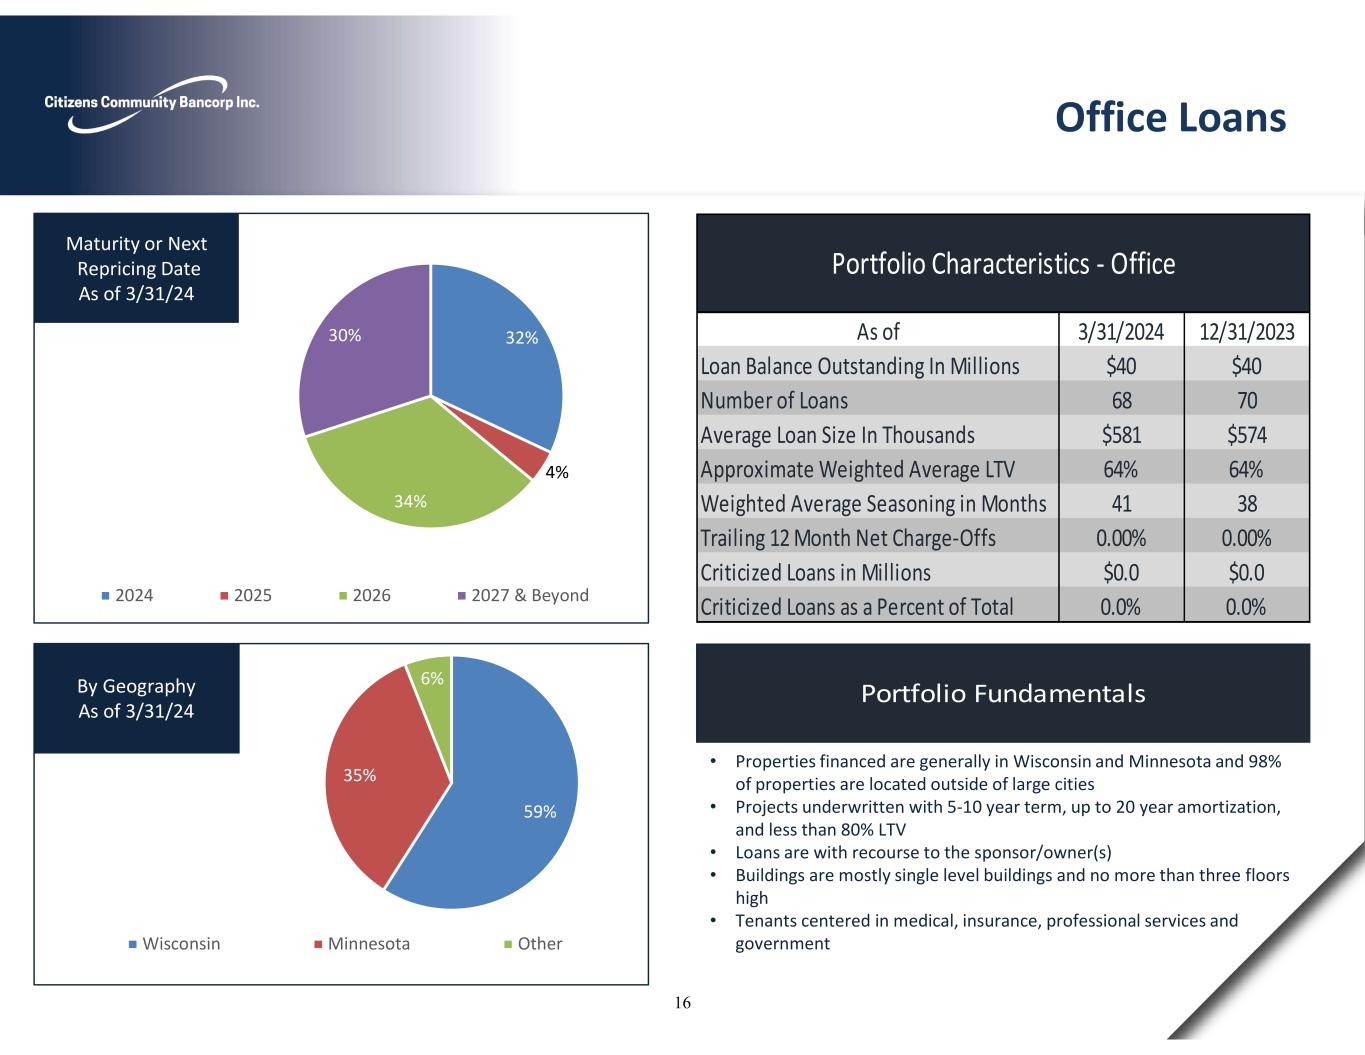
32% 4% 34% 30% 2024 2025 2026 2027 & Beyond Maturity or Next Repricing Date As of 3/31/24 Portfolio Fundamentals 59% 35% 6% Wisconsin Minnesota Other By Geography As of 3/31/24 • Properties financed are generally in Wisconsin and Minnesota and 98% of properties are located outside of large cities • Projects underwritten with 5-10 year term, up to 20 year amortization, and less than 80% LTV • Loans are with recourse to the sponsor/owner(s) • Buildings are mostly single level buildings and no more than three floors high • Tenants centered in medical, insurance, professional services and government Office Loans 3/31/2024 12/31/2023 $40 $40 68 70 $581 $574 64% 64% 41 38 0.00% 0.00% $0.0 $0.0 0.0% 0.0%Criticized Loans as a Percent of Total Portfolio Characteristics - Office As of Weighted Average Seasoning in Months Criticized Loans in Millions Loan Balance Outstanding In Millions Number of Loans Average Loan Size In Thousands Approximate Weighted Average LTV Trailing 12 Month Net Charge-Offs 16
Credit Quality/Risk Ratings: Management utilizes a numeric risk rating system to identify and quantify the Bank’s risk of loss within its loan portfolio. Ratings are initially assigned prior to funding the loan, and may be changed at any time as circumstances warrant. Ratings range from the highest to lowest quality based on factors that include measurements of ability to pay, collateral type and value, borrower stability and management experience. The Bank’s loan portfolio is presented below in accordance with the risk rating framework that has been commonly adopted by the federal banking agencies. The definitions of the various risk rating categories are as follows: 1 through 4 - Pass. A “Pass” loan means that the condition of the borrower and the performance of the loan is satisfactory or better. 5 - Watch. A “Watch” loan has clearly identifiable developing weaknesses that deserve additional attention from management. Weaknesses that are not corrected or mitigated, may jeopardize the ability of the borrower to repay the loan in the future. 6 - Special Mention. A “Special Mention” loan has one or more potential weakness that deserve management’s close attention. If left uncorrected, these potential weaknesses may result in deterioration of the repayment prospects for the loan or in the institution’s credit position in the future. 7 - Substandard. A “Substandard” loan is inadequately protected by the current net worth and paying capacity of the obligor or the collateral pledged, if any. Assets classified as substandard must have a well-defined weakness, or weaknesses, that jeopardize the liquidation of the debt. They are characterized by the distinct possibility that the Bank will sustain some loss if the deficiencies are not corrected. 8 - Doubtful. A “Doubtful” loan has all the weaknesses inherent in a Substandard loan with the added characteristic that the weaknesses make collection or liquidation in full, on the basis of currently existing facts, conditions and values, highly questionable and improbable. 9 - Loss. Loans classified as “Loss” are considered uncollectible, and their continuance as bankable assets is not warranted. This classification does not mean that the loan has absolutely no recovery or salvage value, and a partial recovery may occur in the future. 17
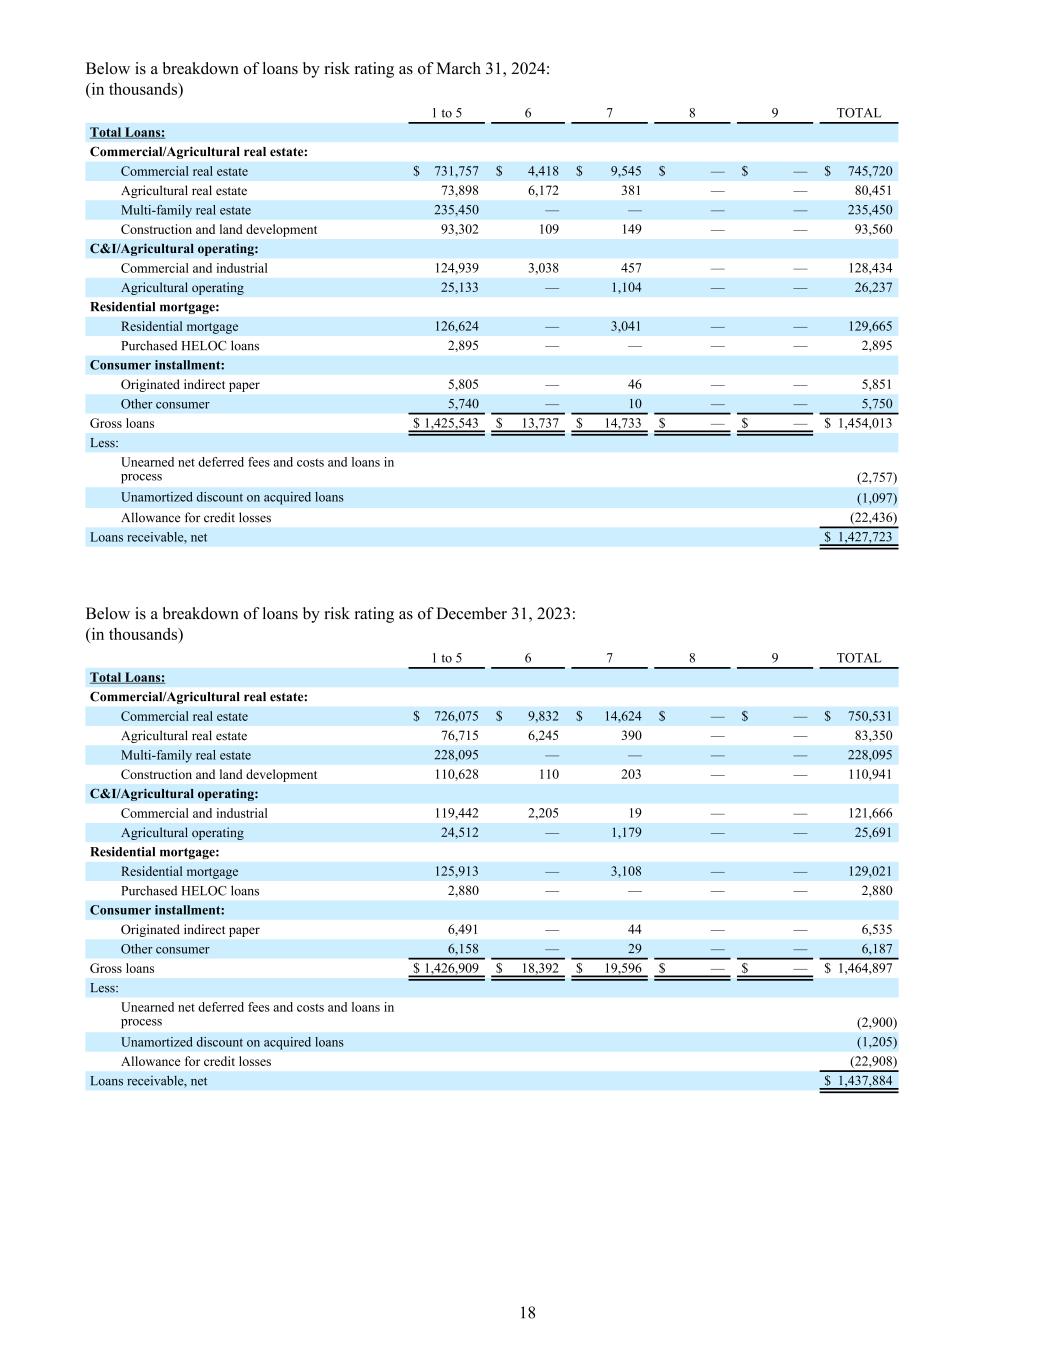
Below is a breakdown of loans by risk rating as of March 31, 2024: (in thousands) 1 to 5 6 7 8 9 TOTAL Total Loans: Commercial/Agricultural real estate: Commercial real estate $ 731,757 $ 4,418 $ 9,545 $ — $ — $ 745,720 Agricultural real estate 73,898 6,172 381 — — 80,451 Multi-family real estate 235,450 — — — — 235,450 Construction and land development 93,302 109 149 — — 93,560 C&I/Agricultural operating: Commercial and industrial 124,939 3,038 457 — — 128,434 Agricultural operating 25,133 — 1,104 — — 26,237 Residential mortgage: Residential mortgage 126,624 — 3,041 — — 129,665 Purchased HELOC loans 2,895 — — — — 2,895 Consumer installment: Originated indirect paper 5,805 — 46 — — 5,851 Other consumer 5,740 — 10 — — 5,750 Gross loans $ 1,425,543 $ 13,737 $ 14,733 $ — $ — $ 1,454,013 Less: Unearned net deferred fees and costs and loans in process (2,757) Unamortized discount on acquired loans (1,097) Allowance for credit losses (22,436) Loans receivable, net $ 1,427,723 Below is a breakdown of loans by risk rating as of December 31, 2023: (in thousands) 1 to 5 6 7 8 9 TOTAL Total Loans: Commercial/Agricultural real estate: Commercial real estate $ 726,075 $ 9,832 $ 14,624 $ — $ — $ 750,531 Agricultural real estate 76,715 6,245 390 — — 83,350 Multi-family real estate 228,095 — — — — 228,095 Construction and land development 110,628 110 203 — — 110,941 C&I/Agricultural operating: Commercial and industrial 119,442 2,205 19 — — 121,666 Agricultural operating 24,512 — 1,179 — — 25,691 Residential mortgage: Residential mortgage 125,913 — 3,108 — — 129,021 Purchased HELOC loans 2,880 — — — — 2,880 Consumer installment: Originated indirect paper 6,491 — 44 — — 6,535 Other consumer 6,158 — 29 — — 6,187 Gross loans $ 1,426,909 $ 18,392 $ 19,596 $ — $ — $ 1,464,897 Less: Unearned net deferred fees and costs and loans in process (2,900) Unamortized discount on acquired loans (1,205) Allowance for credit losses (22,908) Loans receivable, net $ 1,437,884 18
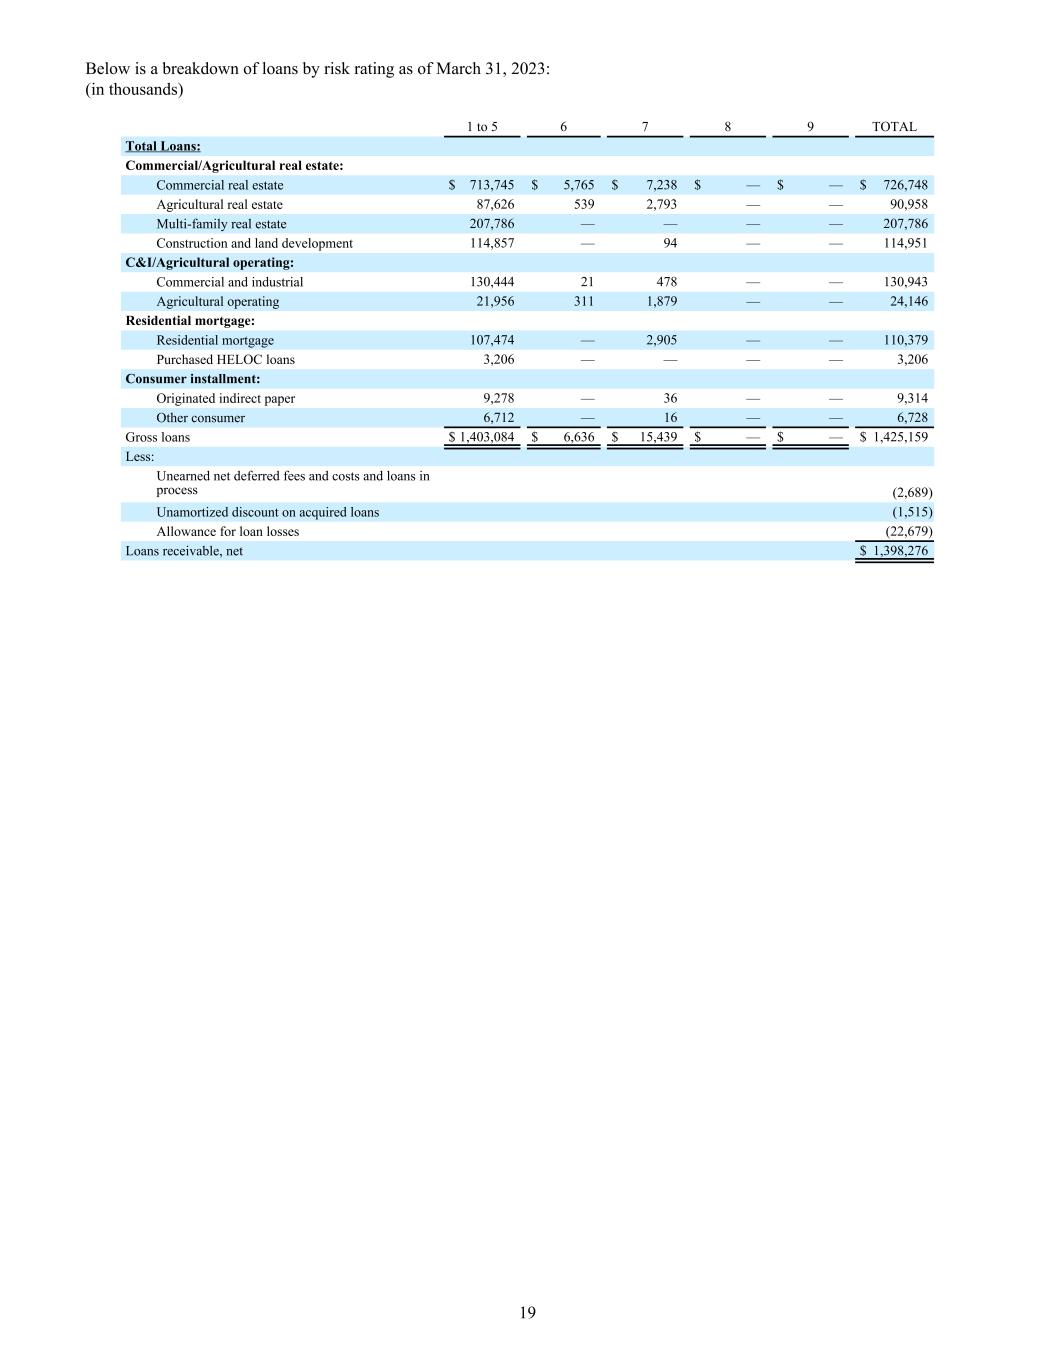
Below is a breakdown of loans by risk rating as of March 31, 2023: (in thousands) 1 to 5 6 7 8 9 TOTAL Total Loans: Commercial/Agricultural real estate: Commercial real estate $ 713,745 $ 5,765 $ 7,238 $ — $ — $ 726,748 Agricultural real estate 87,626 539 2,793 — — 90,958 Multi-family real estate 207,786 — — — — 207,786 Construction and land development 114,857 — 94 — — 114,951 C&I/Agricultural operating: Commercial and industrial 130,444 21 478 — — 130,943 Agricultural operating 21,956 311 1,879 — — 24,146 Residential mortgage: Residential mortgage 107,474 — 2,905 — — 110,379 Purchased HELOC loans 3,206 — — — — 3,206 Consumer installment: Originated indirect paper 9,278 — 36 — — 9,314 Other consumer 6,712 — 16 — — 6,728 Gross loans $ 1,403,084 $ 6,636 $ 15,439 $ — $ — $ 1,425,159 Less: Unearned net deferred fees and costs and loans in process (2,689) Unamortized discount on acquired loans (1,515) Allowance for loan losses (22,679) Loans receivable, net $ 1,398,276 19
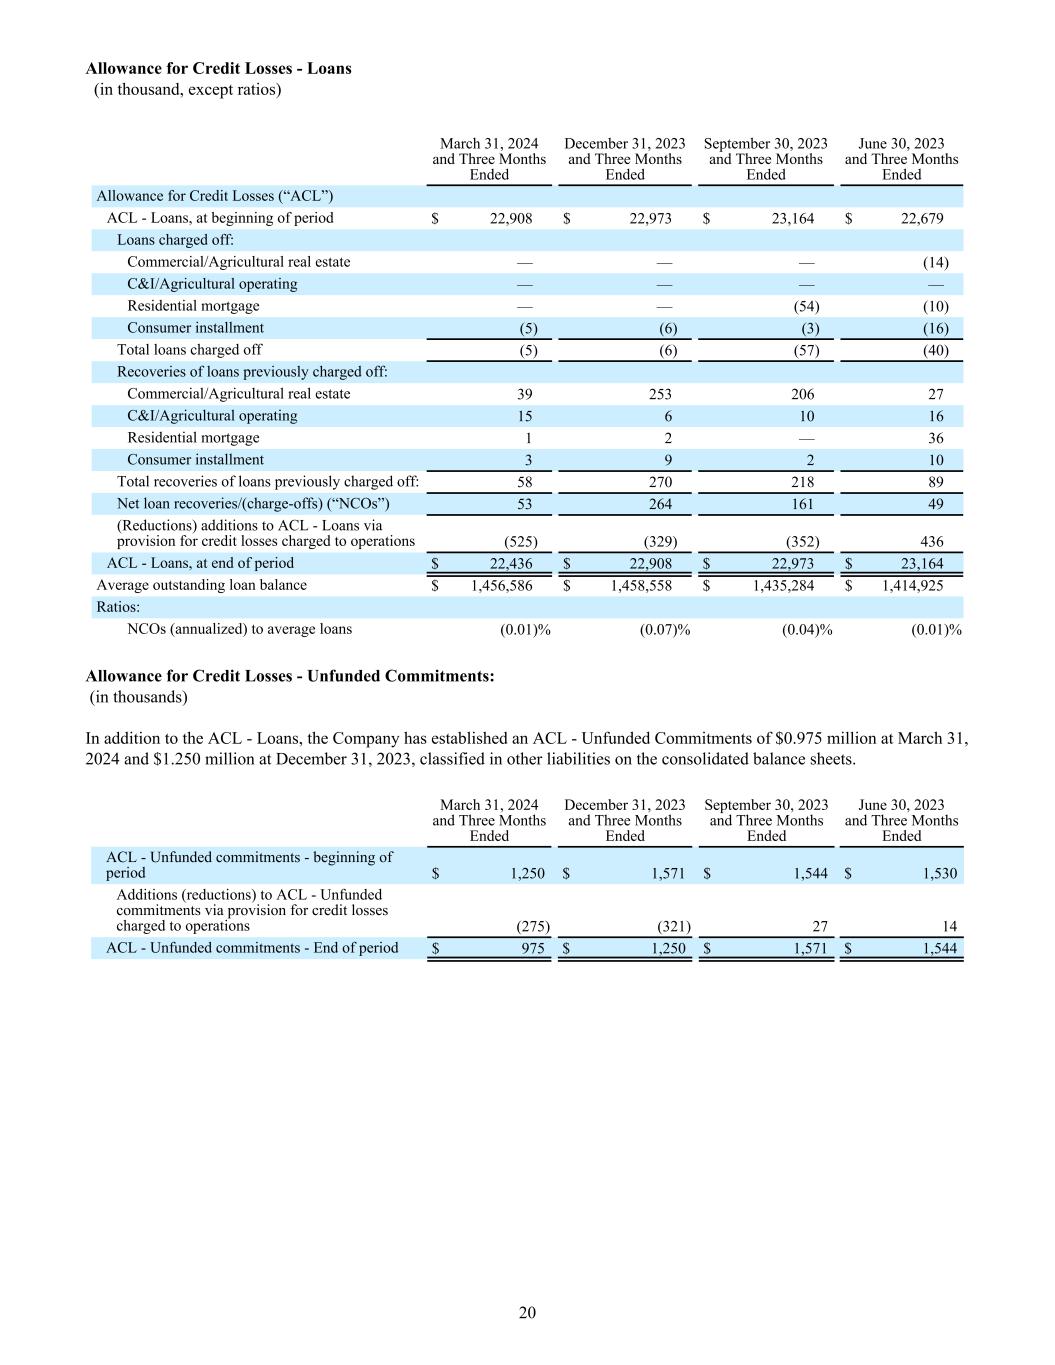
Allowance for Credit Losses - Loans (in thousand, except ratios) March 31, 2024 and Three Months Ended December 31, 2023 and Three Months Ended September 30, 2023 and Three Months Ended June 30, 2023 and Three Months Ended Allowance for Credit Losses (“ACL”) ACL - Loans, at beginning of period $ 22,908 $ 22,973 $ 23,164 $ 22,679 Loans charged off: Commercial/Agricultural real estate — — — (14) C&I/Agricultural operating — — — — Residential mortgage — — (54) (10) Consumer installment (5) (6) (3) (16) Total loans charged off (5) (6) (57) (40) Recoveries of loans previously charged off: Commercial/Agricultural real estate 39 253 206 27 C&I/Agricultural operating 15 6 10 16 Residential mortgage 1 2 — 36 Consumer installment 3 9 2 10 Total recoveries of loans previously charged off: 58 270 218 89 Net loan recoveries/(charge-offs) (“NCOs”) 53 264 161 49 (Reductions) additions to ACL - Loans via provision for credit losses charged to operations (525) (329) (352) 436 ACL - Loans, at end of period $ 22,436 $ 22,908 $ 22,973 $ 23,164 Average outstanding loan balance $ 1,456,586 $ 1,458,558 $ 1,435,284 $ 1,414,925 Ratios: NCOs (annualized) to average loans (0.01) % (0.07) % (0.04) % (0.01) % Allowance for Credit Losses - Unfunded Commitments: (in thousands) In addition to the ACL - Loans, the Company has established an ACL - Unfunded Commitments of $0.975 million at March 31, 2024 and $1.250 million at December 31, 2023, classified in other liabilities on the consolidated balance sheets. March 31, 2024 and Three Months Ended December 31, 2023 and Three Months Ended September 30, 2023 and Three Months Ended June 30, 2023 and Three Months Ended ACL - Unfunded commitments - beginning of period $ 1,250 $ 1,571 $ 1,544 $ 1,530 Additions (reductions) to ACL - Unfunded commitments via provision for credit losses charged to operations (275) (321) 27 14 ACL - Unfunded commitments - End of period $ 975 $ 1,250 $ 1,571 $ 1,544 20
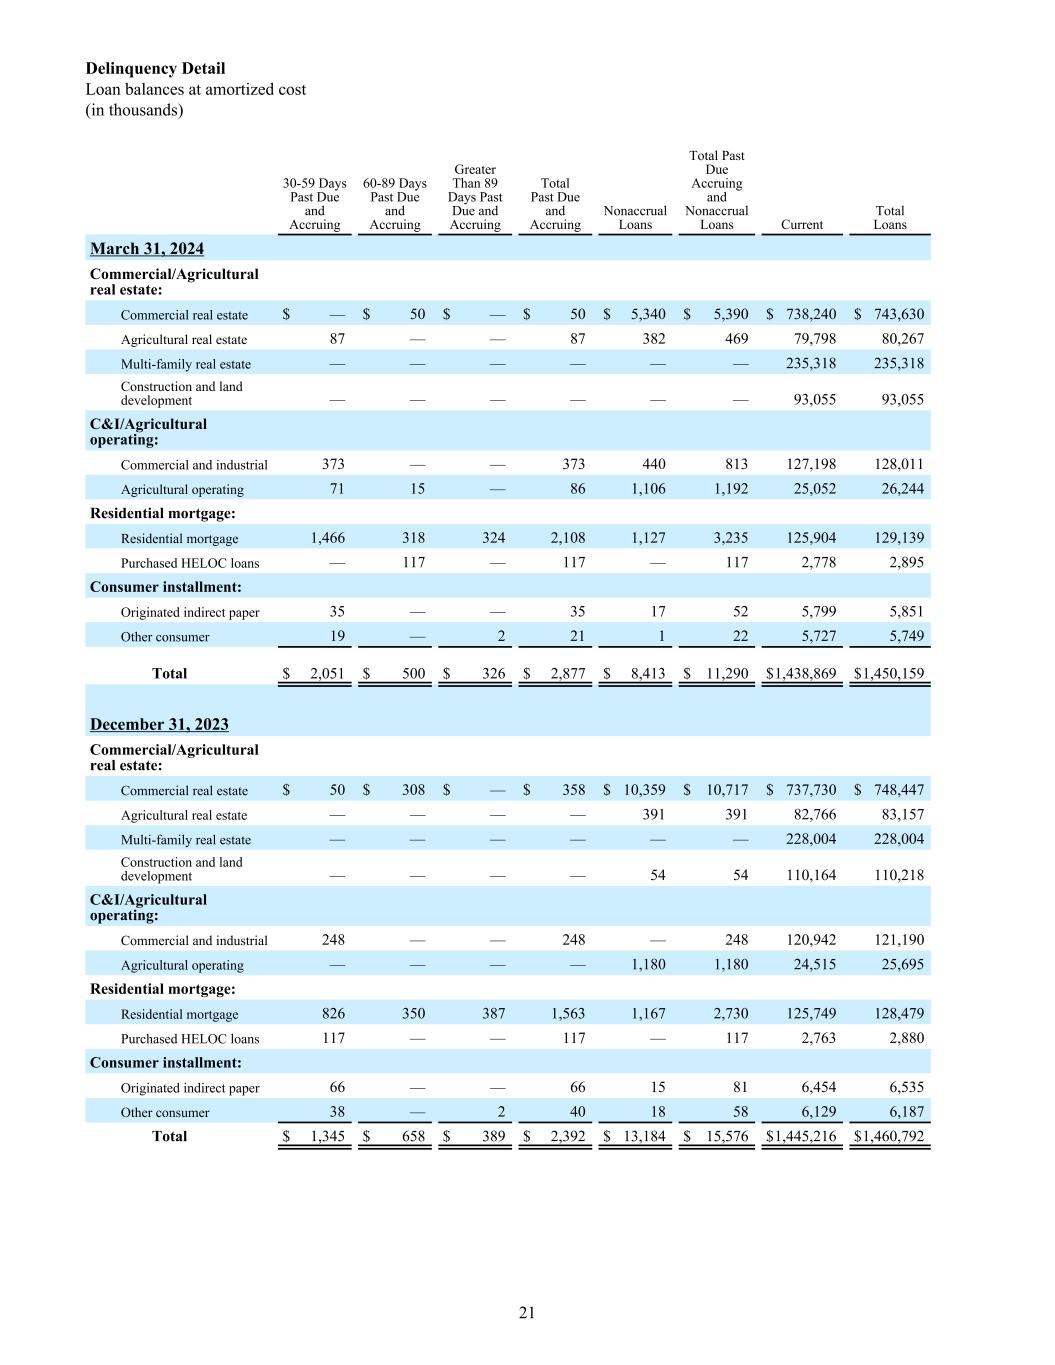
Delinquency Detail Loan balances at amortized cost (in thousands) 30-59 Days Past Due and Accruing 60-89 Days Past Due and Accruing Greater Than 89 Days Past Due and Accruing Total Past Due and Accruing Nonaccrual Loans Total Past Due Accruing and Nonaccrual Loans Current Total Loans March 31, 2024 Commercial/Agricultural real estate: Commercial real estate $ — $ 50 $ — $ 50 $ 5,340 $ 5,390 $ 738,240 $ 743,630 Agricultural real estate 87 — — 87 382 469 79,798 80,267 Multi-family real estate — — — — — — 235,318 235,318 Construction and land development — — — — — — 93,055 93,055 C&I/Agricultural operating: Commercial and industrial 373 — — 373 440 813 127,198 128,011 Agricultural operating 71 15 — 86 1,106 1,192 25,052 26,244 Residential mortgage: Residential mortgage 1,466 318 324 2,108 1,127 3,235 125,904 129,139 Purchased HELOC loans — 117 — 117 — 117 2,778 2,895 Consumer installment: Originated indirect paper 35 — — 35 17 52 5,799 5,851 Other consumer 19 — 2 21 1 22 5,727 5,749 Total $ 2,051 $ 500 $ 326 $ 2,877 $ 8,413 $ 11,290 $ 1,438,869 $ 1,450,159 December 31, 2023 Commercial/Agricultural real estate: Commercial real estate $ 50 $ 308 $ — $ 358 $ 10,359 $ 10,717 $ 737,730 $ 748,447 Agricultural real estate — — — — 391 391 82,766 83,157 Multi-family real estate — — — — — — 228,004 228,004 Construction and land development — — — — 54 54 110,164 110,218 C&I/Agricultural operating: Commercial and industrial 248 — — 248 — 248 120,942 121,190 Agricultural operating — — — — 1,180 1,180 24,515 25,695 Residential mortgage: Residential mortgage 826 350 387 1,563 1,167 2,730 125,749 128,479 Purchased HELOC loans 117 — — 117 — 117 2,763 2,880 Consumer installment: Originated indirect paper 66 — — 66 15 81 6,454 6,535 Other consumer 38 — 2 40 18 58 6,129 6,187 Total $ 1,345 $ 658 $ 389 $ 2,392 $ 13,184 $ 15,576 $ 1,445,216 $ 1,460,792 21
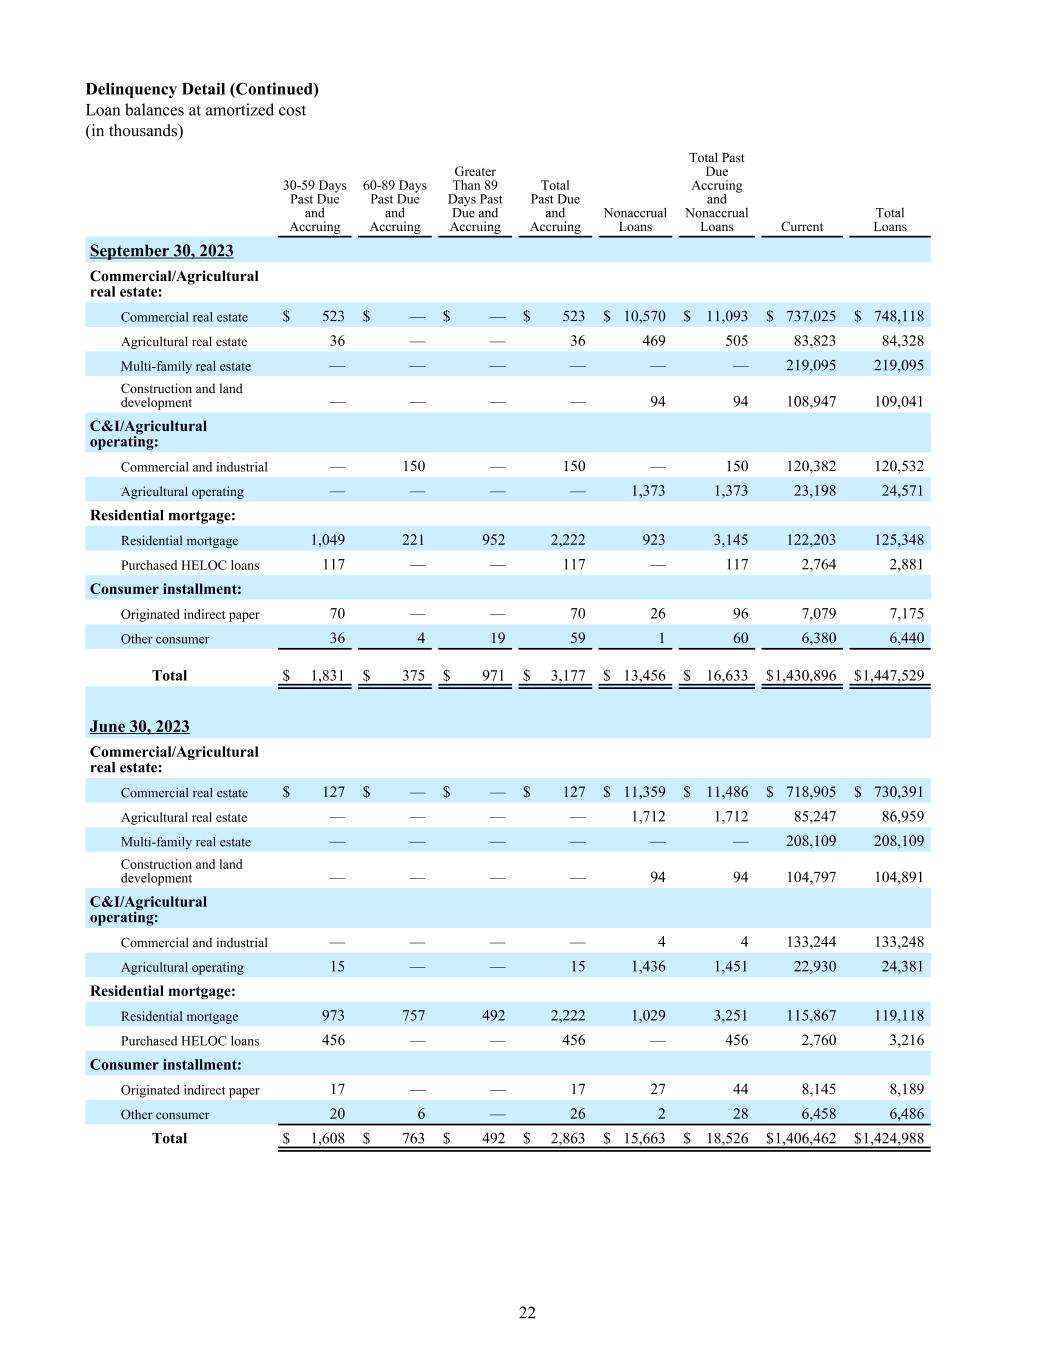
Delinquency Detail (Continued) Loan balances at amortized cost (in thousands) 30-59 Days Past Due and Accruing 60-89 Days Past Due and Accruing Greater Than 89 Days Past Due and Accruing Total Past Due and Accruing Nonaccrual Loans Total Past Due Accruing and Nonaccrual Loans Current Total Loans September 30, 2023 Commercial/Agricultural real estate: Commercial real estate $ 523 $ — $ — $ 523 $ 10,570 $ 11,093 $ 737,025 $ 748,118 Agricultural real estate 36 — — 36 469 505 83,823 84,328 Multi-family real estate — — — — — — 219,095 219,095 Construction and land development — — — — 94 94 108,947 109,041 C&I/Agricultural operating: Commercial and industrial — 150 — 150 — 150 120,382 120,532 Agricultural operating — — — — 1,373 1,373 23,198 24,571 Residential mortgage: Residential mortgage 1,049 221 952 2,222 923 3,145 122,203 125,348 Purchased HELOC loans 117 — — 117 — 117 2,764 2,881 Consumer installment: Originated indirect paper 70 — — 70 26 96 7,079 7,175 Other consumer 36 4 19 59 1 60 6,380 6,440 Total $ 1,831 $ 375 $ 971 $ 3,177 $ 13,456 $ 16,633 $ 1,430,896 $ 1,447,529 June 30, 2023 Commercial/Agricultural real estate: Commercial real estate $ 127 $ — $ — $ 127 $ 11,359 $ 11,486 $ 718,905 $ 730,391 Agricultural real estate — — — — 1,712 1,712 85,247 86,959 Multi-family real estate — — — — — — 208,109 208,109 Construction and land development — — — — 94 94 104,797 104,891 C&I/Agricultural operating: Commercial and industrial — — — — 4 4 133,244 133,248 Agricultural operating 15 — — 15 1,436 1,451 22,930 24,381 Residential mortgage: Residential mortgage 973 757 492 2,222 1,029 3,251 115,867 119,118 Purchased HELOC loans 456 — — 456 — 456 2,760 3,216 Consumer installment: Originated indirect paper 17 — — 17 27 44 8,145 8,189 Other consumer 20 6 — 26 2 28 6,458 6,486 Total $ 1,608 $ 763 $ 492 $ 2,863 $ 15,663 $ 18,526 $ 1,406,462 $ 1,424,988 22

Nonaccrual Loans Roll forward Loan balances at amortized cost (in thousands) Quarter Ended March 31, 2024 December 31, 2023 September 30, 2023 June 30, 2023 March 31, 2023 Balance, beginning of period $ 13,184 $ 13,456 $ 15,663 $ 10,410 $ 11,204 Additions 961 538 33 7,826 154 Charge offs — — (53) (23) (49) Transfers to OREO — (23) — (110) (25) Return to accrual status — — (190) — (252) Payments received (5,767) (781) (1,994) (2,429) (527) Other, net 35 (6) (3) (11) (95) Balance, end of period $ 8,413 $ 13,184 $ 13,456 $ 15,663 $ 10,410 Other Real Estate Owned Roll forward (in thousands) Quarter Ended March 31, 2024 December 31, 2023 September 30, 2023 June 30, 2023 March 31, 2023 Balance, beginning of period $ 1,795 $ 1,046 $ 1,199 $ 1,113 $ 1,265 Loans transferred in 73 23 — 110 25 Real estate transferred in from fixed assets — 724 — — — Real estate transferred in from fixed assets value reduction (27) — — — — Branch properties sales — — — — (130) Sales — — (25) (33) (48) Write-downs — — (128) — — Other, net 4 2 — 9 1 Balance, end of period $ 1,845 $ 1,795 $ 1,046 $ 1,199 $ 1,113 23
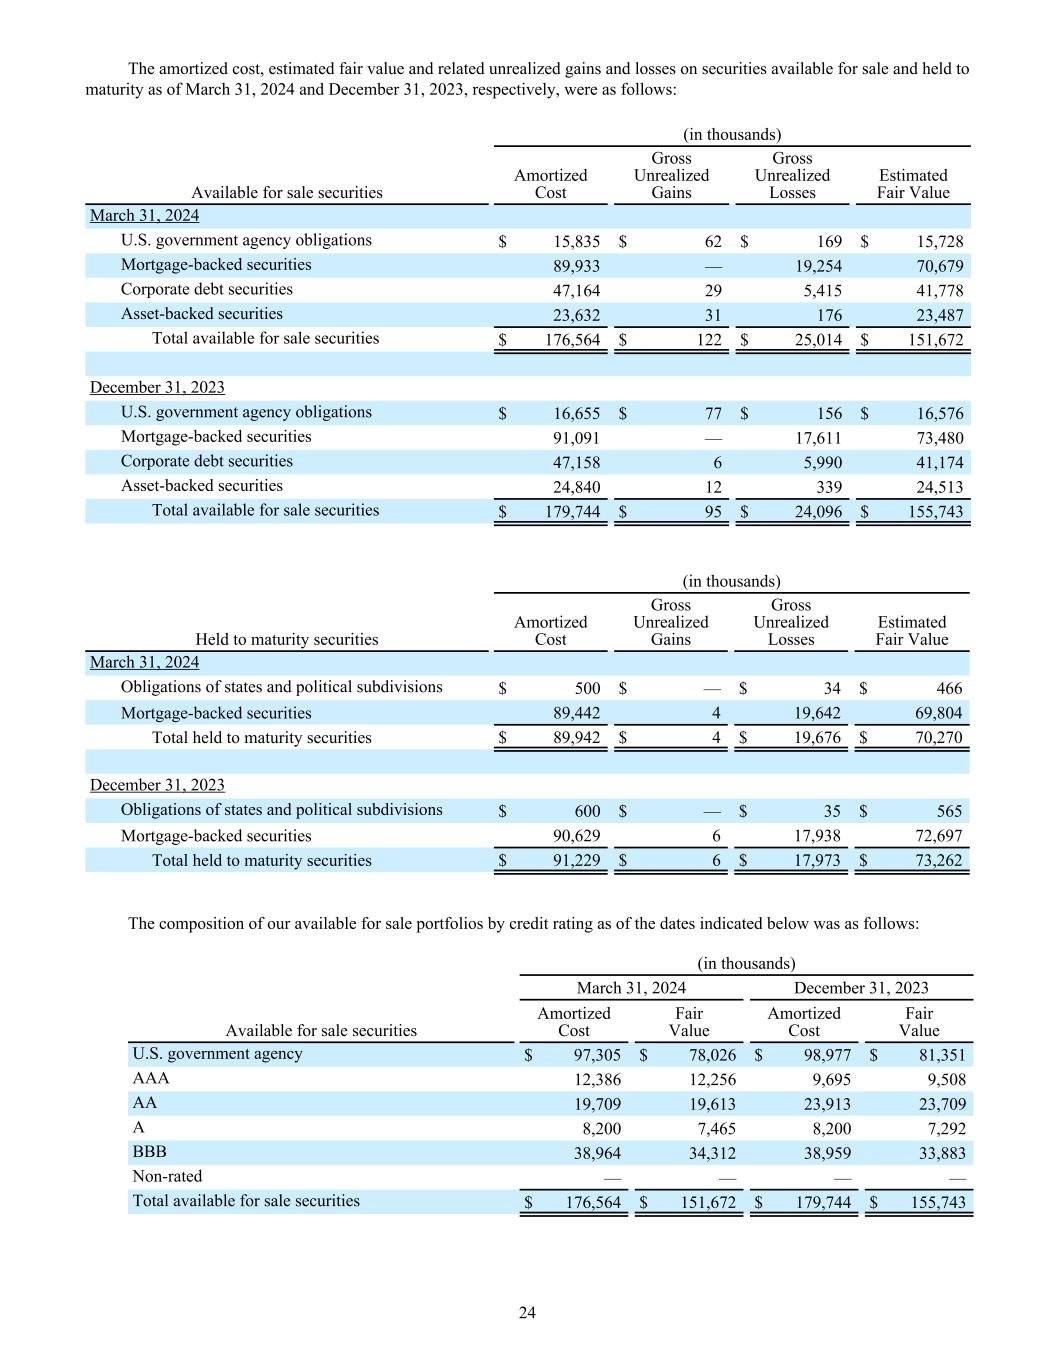
The amortized cost, estimated fair value and related unrealized gains and losses on securities available for sale and held to maturity as of March 31, 2024 and December 31, 2023, respectively, were as follows: (in thousands) Available for sale securities Amortized Cost Gross Unrealized Gains Gross Unrealized Losses Estimated Fair Value March 31, 2024 U.S. government agency obligations $ 15,835 $ 62 $ 169 $ 15,728 Mortgage-backed securities 89,933 — 19,254 70,679 Corporate debt securities 47,164 29 5,415 41,778 Asset-backed securities 23,632 31 176 23,487 Total available for sale securities $ 176,564 $ 122 $ 25,014 $ 151,672 December 31, 2023 U.S. government agency obligations $ 16,655 $ 77 $ 156 $ 16,576 Mortgage-backed securities 91,091 — 17,611 73,480 Corporate debt securities 47,158 6 5,990 41,174 Asset-backed securities 24,840 12 339 24,513 Total available for sale securities $ 179,744 $ 95 $ 24,096 $ 155,743 (in thousands) Held to maturity securities Amortized Cost Gross Unrealized Gains Gross Unrealized Losses Estimated Fair Value March 31, 2024 Obligations of states and political subdivisions $ 500 $ — $ 34 $ 466 Mortgage-backed securities 89,442 4 19,642 69,804 Total held to maturity securities $ 89,942 $ 4 $ 19,676 $ 70,270 December 31, 2023 Obligations of states and political subdivisions $ 600 $ — $ 35 $ 565 Mortgage-backed securities 90,629 6 17,938 72,697 Total held to maturity securities $ 91,229 $ 6 $ 17,973 $ 73,262 The composition of our available for sale portfolios by credit rating as of the dates indicated below was as follows: (in thousands) March 31, 2024 December 31, 2023 Available for sale securities Amortized Cost Fair Value Amortized Cost Fair Value U.S. government agency $ 97,305 $ 78,026 $ 98,977 $ 81,351 AAA 12,386 12,256 9,695 9,508 AA 19,709 19,613 23,913 23,709 A 8,200 7,465 8,200 7,292 BBB 38,964 34,312 38,959 33,883 Non-rated — — — — Total available for sale securities $ 176,564 $ 151,672 $ 179,744 $ 155,743 24
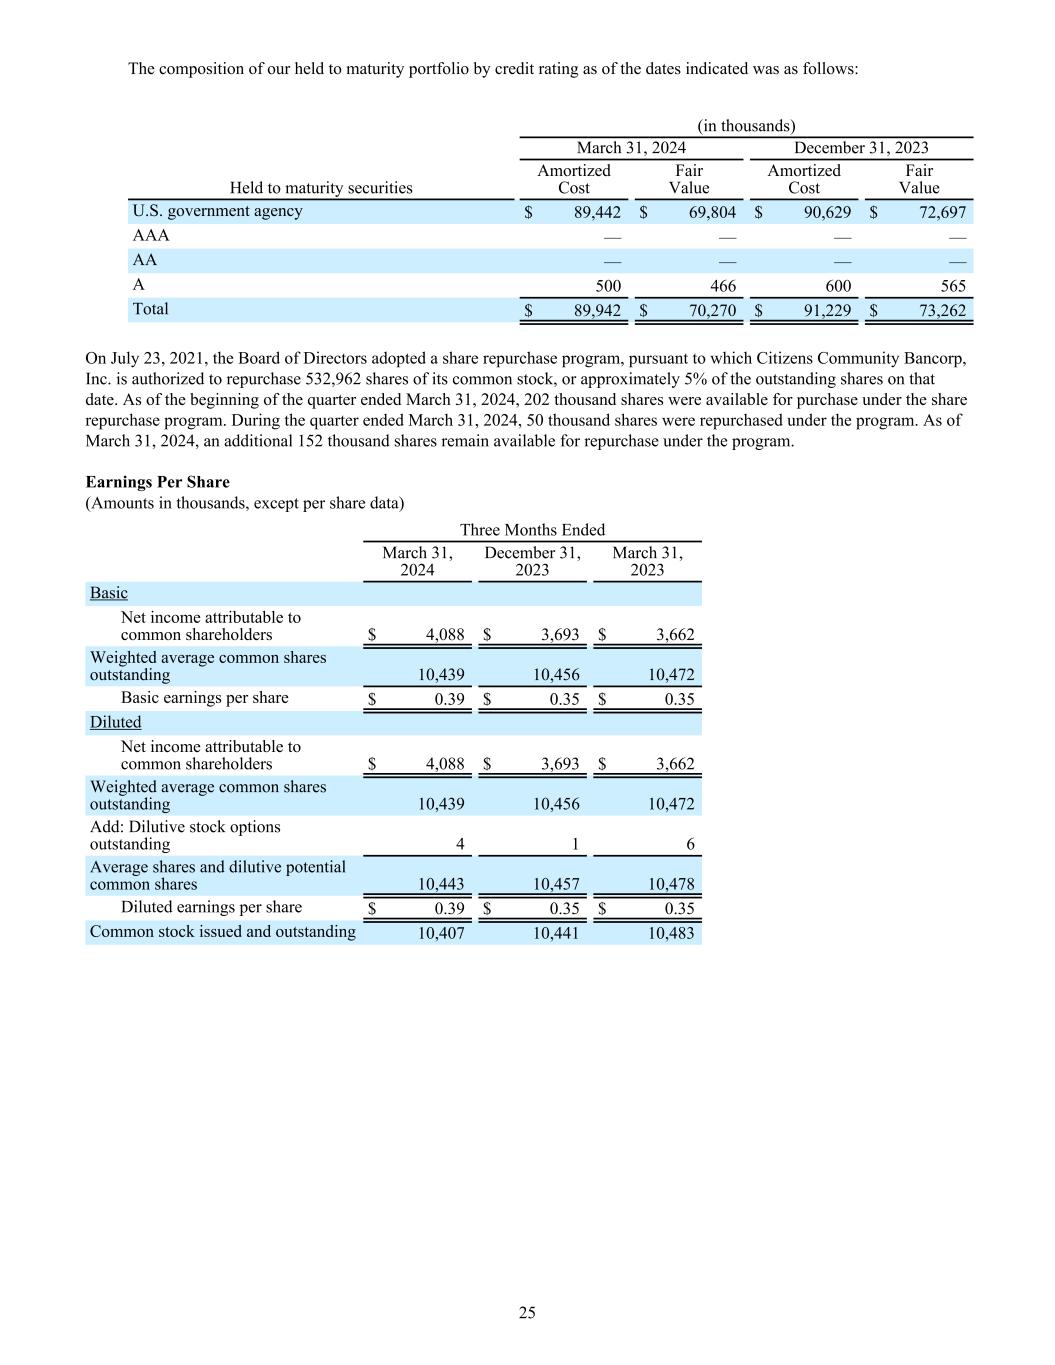
The composition of our held to maturity portfolio by credit rating as of the dates indicated was as follows: (in thousands) March 31, 2024 December 31, 2023 Held to maturity securities Amortized Cost Fair Value Amortized Cost Fair Value U.S. government agency $ 89,442 $ 69,804 $ 90,629 $ 72,697 AAA — — — — AA — — — — A 500 466 600 565 Total $ 89,942 $ 70,270 $ 91,229 $ 73,262 On July 23, 2021, the Board of Directors adopted a share repurchase program, pursuant to which Citizens Community Bancorp, Inc. is authorized to repurchase 532,962 shares of its common stock, or approximately 5% of the outstanding shares on that date. As of the beginning of the quarter ended March 31, 2024, 202 thousand shares were available for purchase under the share repurchase program. During the quarter ended March 31, 2024, 50 thousand shares were repurchased under the program. As of March 31, 2024, an additional 152 thousand shares remain available for repurchase under the program. Earnings Per Share (Amounts in thousands, except per share data) Three Months Ended March 31, 2024 December 31, 2023 March 31, 2023 Basic Net income attributable to common shareholders $ 4,088 $ 3,693 $ 3,662 Weighted average common shares outstanding 10,439 10,456 10,472 Basic earnings per share $ 0.39 $ 0.35 $ 0.35 Diluted Net income attributable to common shareholders $ 4,088 $ 3,693 $ 3,662 Weighted average common shares outstanding 10,439 10,456 10,472 Add: Dilutive stock options outstanding 4 1 6 Average shares and dilutive potential common shares 10,443 10,457 10,478 Diluted earnings per share $ 0.39 $ 0.35 $ 0.35 Common stock issued and outstanding 10,407 10,441 10,483 25
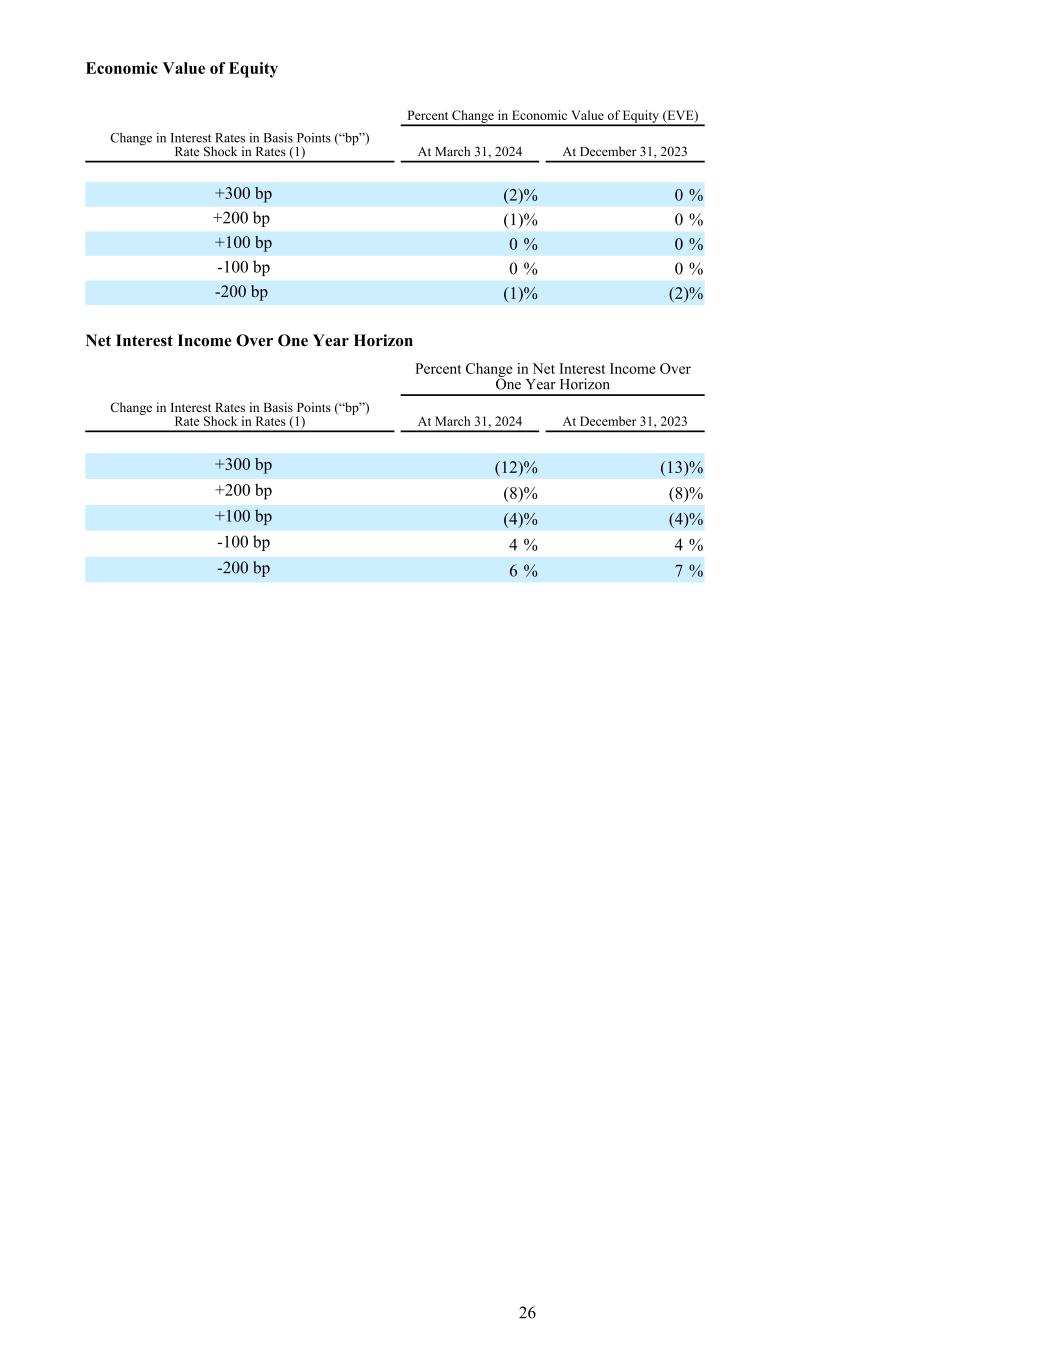
Economic Value of Equity Percent Change in Economic Value of Equity (EVE) Change in Interest Rates in Basis Points (“bp”) Rate Shock in Rates (1) At March 31, 2024 At December 31, 2023 +300 bp (2) % 0 % +200 bp (1) % 0 % +100 bp 0 % 0 % -100 bp 0 % 0 % -200 bp (1) % (2) % Net Interest Income Over One Year Horizon Percent Change in Net Interest Income Over One Year Horizon Change in Interest Rates in Basis Points (“bp”) Rate Shock in Rates (1) At March 31, 2024 At December 31, 2023 +300 bp (12) % (13) % +200 bp (8) % (8) % +100 bp (4) % (4) % -100 bp 4 % 4 % -200 bp 6 % 7 % 26
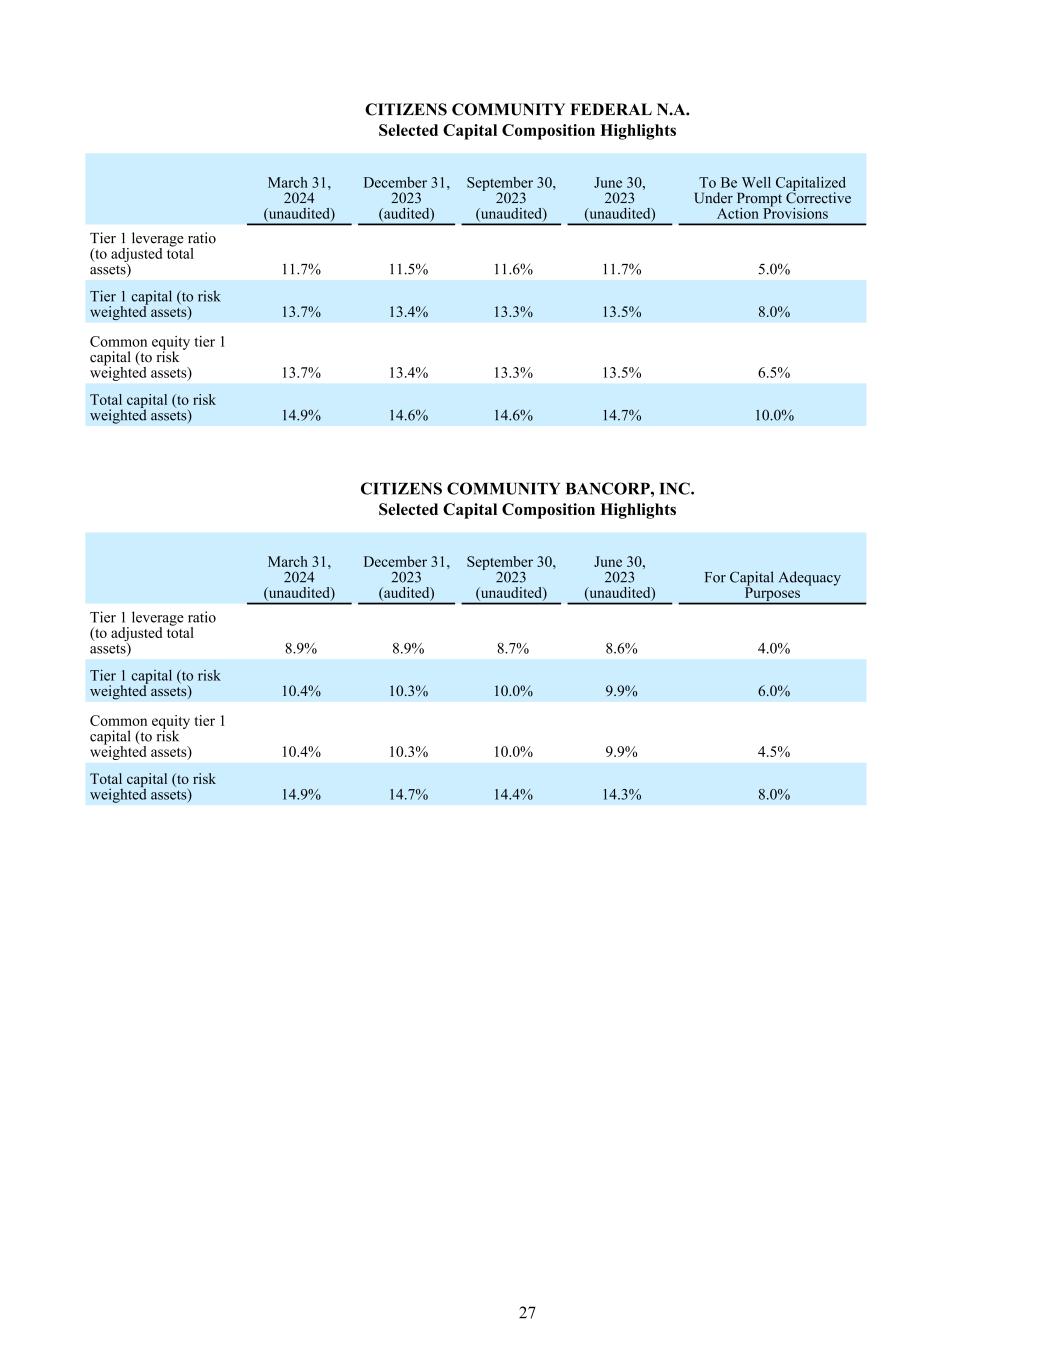
CITIZENS COMMUNITY FEDERAL N.A. Selected Capital Composition Highlights March 31, 2024 (unaudited) December 31, 2023 (audited) September 30, 2023 (unaudited) June 30, 2023 (unaudited) To Be Well Capitalized Under Prompt Corrective Action Provisions Tier 1 leverage ratio (to adjusted total assets) 11.7% 11.5% 11.6% 11.7% 5.0% Tier 1 capital (to risk weighted assets) 13.7% 13.4% 13.3% 13.5% 8.0% Common equity tier 1 capital (to risk weighted assets) 13.7% 13.4% 13.3% 13.5% 6.5% Total capital (to risk weighted assets) 14.9% 14.6% 14.6% 14.7% 10.0% CITIZENS COMMUNITY BANCORP, INC. Selected Capital Composition Highlights March 31, 2024 (unaudited) December 31, 2023 (audited) September 30, 2023 (unaudited) June 30, 2023 (unaudited) For Capital Adequacy Purposes Tier 1 leverage ratio (to adjusted total assets) 8.9% 8.9% 8.7% 8.6% 4.0% Tier 1 capital (to risk weighted assets) 10.4% 10.3% 10.0% 9.9% 6.0% Common equity tier 1 capital (to risk weighted assets) 10.4% 10.3% 10.0% 9.9% 4.5% Total capital (to risk weighted assets) 14.9% 14.7% 14.4% 14.3% 8.0% 27

Fair Value Accounting ASC Topic 820-10, “Fair Value Measurements and Disclosures” establishes a fair value hierarchy which requires an entity to maximize the use of observable inputs and minimize the use of unobservable inputs when measuring fair value. The topic describes three levels of inputs that may be used to measure fair value: Level 1- Quoted prices (unadjusted) for identical assets or liabilities in active markets that the Company has the ability to access as of the measurement date. Level 2- Significant other observable inputs other than Level 1 prices such as quoted prices for similar assets or liabilities; quoted prices in markets that are not active; or other inputs that are observable or can be corroborated by observable market data. Level 3- Significant unobservable inputs that reflect the Company’s assumptions about the factors that market participants would use in pricing an asset or liability. A financial instrument’s categorization within the valuation hierarchy is based upon the lowest level of input within the valuation hierarchy that is significant to the fair value measurement. The fair value of securities available for sale is determined by obtaining market price quotes from independent third parties wherever such quotes are available (Level 1 inputs); or matrix pricing, which is a mathematical technique widely used in the industry to value debt securities without relying exclusively on quoted prices for the specific securities but rather by relying on the securities’ relationship to other benchmark quoted securities (Level 2 inputs). Where such quotes are not available, we utilize independent third party valuation analysis to support our own estimates and judgments in determining fair value (Level 3 inputs). Fair Value Table The table below represents what we would receive to sell an asset or what we would have to pay to transfer a liability in an orderly transaction between market participants at the measurement date. The carrying amount and estimated fair value of the Company’s financial instruments as of the dates indicated below were as follows: March 31, 2024 Valuation Method Used Carrying Amount Estimated Fair Value Financial assets: Cash and cash equivalents (Level I) $ 28,638 $ 28,638 Other interest-bearing deposits (Level II) — — Securities available for sale “AFS” (Level II) 151,672 151,672 Securities held to maturity “HTM” (Level II) 89,942 70,270 Equity investments (Level I) 570 570 Equity investments valued at NAV(1) N/A 2,711 2,711 Other investments (Level II) 13,022 13,022 Loans receivable, net (Level III) 1,427,723 1,355,761 Loans held for sale - Residential mortgage (Level I) — — Loans held for sale - SBA /FSA (Level II) — — Mortgage servicing rights (Level III) 3,774 5,442 Accrued interest receivable (Level I) 6,324 6,324 Financial liabilities: Deposits (Level III) $ 1,527,489 $ 1,526,040 FHLB advances (Level II) 39,500 39,112 Other borrowings (Level II) 67,523 62,998 Accrued interest payable (Level I) 3,711 3,711 (1) Investments valued at NAV are excluded from being reported under the fair value hierarchy but are presented to permit reconciliation with the balance sheet in accordance with ASC 820-10-35-54B. 28