Table of Contents
Filed Pursuant to Rule 424(b)(3)
Registration Nos.
333-227188
333-227188-01
INVESCO DB MULTI-SECTOR COMMODITY TRUST
| Invesco DB Agriculture Fund |
101,372,875 | Common Units of Beneficial Interest |
Invesco DB Multi-Sector Commodity Trust (the “Trust”) is organized in seven separate series as a Delaware statutory trust. The Invesco DB Agriculture Fund (the “Fund”) is a series of the Trust and is offered pursuant to this Prospectus. The Fund issues common units of beneficial interest (“Shares”), which represent units of fractional undivided beneficial interest in and ownership of the Fund. Shares may be purchased from the Fund only by certain eligible financial institutions, called Authorized Participants, and only in one or more blocks of 200,000 Shares (“Baskets”). Baskets are issued on the creation order settlement date as of 2:45 p.m., Eastern time, on the business day immediately following the creation order date at the applicable net asset value (“NAV”) per Share as of the closing time of the NYSE Arca, Inc. (“NYSE Arca”) or the last to close of the exchanges on which the Fund’s futures contracts are traded, whichever is later, on the creation order date. Upon submission of a creation order, the Authorized Participant may request the Managing Owner to agree to a creation order settlement date up to two business days after the creation order date.
The Shares trade on the NYSE Arca under the symbol “DBA.”
Invesco Capital Management LLC serves as the Fund’s managing owner (the “Managing Owner”), commodity pool operator and commodity trading advisor. The Fund trades
exchange-traded futures contracts on the commodities comprising the DBIQ Diversified Agriculture Index Excess Return™ (the “Index”) with a view to tracking the Index over time. The Fund also earns interest income (“Treasury Income”) from United States Treasury securities (“Treasury Securities”) and dividends from its holdings in money market mutual funds (affiliated or otherwise) (“Money Market Income”). The Fund also gains exposure to Treasury Securities through an investment in exchange-traded funds (affiliated or otherwise) (“ETFs”) that track indexes that measure the performance of U.S. Treasury Obligations with a maximum remaining maturity of up to twelve months (“T-Bill ETFs”), and the Fund may receive dividends or distributions of capital gains from those investments (“T-Bill ETF Income”). Additionally, the Fund’s performance reflects the appreciation or depreciation of its investments in Treasury Securities, money market mutual funds and T-Bill ETFs.
The Index, which is comprised of one or more underlying commodities (the “Index Commodities”), is intended to reflect the agricultural sector. The Index Commodities consist of Corn, Soybeans, Wheat, Kansas City Wheat, Sugar, Cocoa, Coffee, Cotton, Live Cattle, Feeder Cattle, and Lean Hogs.
Except when aggregated in Baskets, the Shares are not redeemable securities.
INVESTING IN THE SHARES INVOLVES SIGNIFICANT RISKS.
PLEASE REFER TO “RISK FACTORS” BEGINNING ON PAGE 15.
| • | Futures trading is volatile and even a small movement in market prices could cause large losses. |
| • | The success of the Fund’s trading program depends upon the skill of the Managing Owner and its trading principals. |
| • | You could lose all or substantially all of your investment. |
| • | The Index is concentrated in a small number of commodities. Concentration may result in greater volatility. |
| • | Investors pay fees in connection with their investment in the Shares, including asset-based fees of 0.85% per annum. Additional charges include brokerage fees of approximately 0.04% per annum in the aggregate. |
Authorized Participants may offer to the public, from time-to-time, Shares from any Baskets they create. Shares offered to the public by Authorized Participants will be offered at a per-Share offering price that will vary depending on, among other factors, the trading price of the Shares on the NYSE Arca, the NAV per Share and the supply of and demand for the Shares at the time of sale. Because the Shares will trade at market prices, rather than the NAV of the Fund, Shares may trade at prices greater than NAV (at a premium), at NAV, or less than NAV (at a discount). Authorized Participants will not receive from the Fund, the Managing Owner or any of their affiliates any fee or other compensation in connection with their sale of Shares to the public.
An Authorized Participant may receive commissions or fees from investors who purchase Shares through their commission or fee-based brokerage accounts. In addition, the Managing Owner pays a distribution services fee to Invesco Distributors, Inc. and pays a marketing services fee to Deutsche Investment Management Americas Inc. (“DIMA”) without reimbursement from the Trust or the Fund. For more information regarding items of compensation paid to Financial Industry Regulatory Authority, Inc. (“FINRA”) members, please see the “Plan of Distribution” section on page 95.
These securities have not been approved or disapproved by the U.S. Securities and Exchange Commission (“SEC”) or any state securities commission nor has the SEC or any state securities commission passed upon the accuracy or adequacy of this Prospectus. Any representation to the contrary is a criminal offense. The Fund is not a mutual fund or any other type of investment company within the meaning of the Investment Company Act of 1940, as amended, and is not subject to regulation thereunder.
THE COMMODITY FUTURES TRADING COMMISSION HAS NOT PASSED UPON THE MERITS OF PARTICIPATING IN THIS POOL NOR HAS THE COMMISSION PASSED ON THE ADEQUACY OR ACCURACY OF THIS DISCLOSURE DOCUMENT.
October 10, 2018
Table of Contents
COMMODITY FUTURES TRADING COMMISSION
RISK DISCLOSURE STATEMENT
YOU SHOULD CAREFULLY CONSIDER WHETHER YOUR FINANCIAL CONDITION PERMITS YOU TO PARTICIPATE IN A COMMODITY POOL. IN SO DOING, YOU SHOULD BE AWARE THAT COMMODITY INTEREST TRADING CAN QUICKLY LEAD TO LARGE LOSSES AS WELL AS GAINS. SUCH TRADING LOSSES CAN SHARPLY REDUCE THE NET ASSET VALUE OF THE POOL AND CONSEQUENTLY THE VALUE OF YOUR INTEREST IN THE POOL. IN ADDITION, RESTRICTIONS ON REDEMPTIONS MAY AFFECT YOUR ABILITY TO WITHDRAW YOUR PARTICIPATION IN THE POOL.
FURTHER, COMMODITY POOLS MAY BE SUBJECT TO SUBSTANTIAL CHARGES FOR MANAGEMENT, AND ADVISORY AND BROKERAGE FEES. IT MAY BE NECESSARY FOR THOSE POOLS THAT ARE SUBJECT TO THESE CHARGES TO MAKE SUBSTANTIAL TRADING PROFITS TO AVOID DEPLETION OR EXHAUSTION OF THEIR ASSETS. THIS DISCLOSURE DOCUMENT CONTAINS A COMPLETE DESCRIPTION OF EACH EXPENSE TO BE CHARGED THIS POOL AT PAGE 49 AND A STATEMENT OF THE PERCENTAGE RETURNS NECESSARY TO BREAK EVEN, THAT IS, TO RECOVER THE AMOUNT OF YOUR INITIAL INVESTMENT, AT PAGE 30.
THIS BRIEF STATEMENT CANNOT DISCLOSE ALL THE RISKS AND OTHER FACTORS NECESSARY TO EVALUATE YOUR PARTICIPATION IN THIS COMMODITY POOL. THEREFORE, BEFORE YOU DECIDE TO PARTICIPATE IN THIS COMMODITY POOL, YOU SHOULD CAREFULLY STUDY THIS DISCLOSURE DOCUMENT, INCLUDING A DESCRIPTION OF THE PRINCIPAL RISK FACTORS OF THIS INVESTMENT, AT PAGES 15 THROUGH 29.
YOU SHOULD ALSO BE AWARE THAT THIS COMMODITY POOL MAY TRADE FOREIGN FUTURES OR OPTIONS CONTRACTS. TRANSACTIONS ON MARKETS LOCATED OUTSIDE THE UNITED STATES, INCLUDING MARKETS FORMALLY LINKED TO A UNITED STATES MARKET, MAY BE SUBJECT TO REGULATIONS WHICH OFFER DIFFERENT OR DIMINISHED PROTECTION TO THE POOL AND ITS PARTICIPANTS. FURTHER, UNITED STATES REGULATORY AUTHORITIES MAY BE UNABLE TO COMPEL THE ENFORCEMENT OF THE RULES OF REGULATORY AUTHORITIES OR MARKETS IN NON-UNITED STATES JURISDICTIONS WHERE TRANSACTIONS FOR THE POOL MAY BE EFFECTED.
THIS PROSPECTUS DOES NOT INCLUDE ALL OF THE INFORMATION OR EXHIBITS IN THE REGISTRATION STATEMENT OF THE TRUST OR FUND. YOU CAN READ AND COPY THE ENTIRE REGISTRATION STATEMENT AT THE PUBLIC REFERENCE FACILITIES MAINTAINED BY THE SEC IN WASHINGTON, D.C.
THE FUND FILES QUARTERLY AND ANNUAL REPORTS WITH THE SEC. YOU CAN READ AND COPY THESE REPORTS AT THE SEC PUBLIC REFERENCE FACILITIES IN WASHINGTON, D.C. PLEASE CALL THE SEC AT 1-800-SEC-0330 FOR FURTHER INFORMATION.
THE FILINGS OF THE TRUST AND FUND ARE POSTED AT THE SEC WEBSITE AT HTTP://WWW.SEC.GOV.
REGULATORY NOTICES
NO DEALER, SALESMAN OR ANY OTHER PERSON HAS BEEN AUTHORIZED TO GIVE ANY INFORMATION OR TO MAKE ANY REPRESENTATION NOT CONTAINED IN THIS PROSPECTUS, AND, IF GIVEN OR MADE, SUCH OTHER INFORMATION OR REPRESENTATION MUST NOT BE RELIED UPON AS HAVING BEEN AUTHORIZED BY THE TRUST, THE FUND, THE MANAGING OWNER, THE AUTHORIZED PARTICIPANTS OR ANY OTHER PERSON.
i
Table of Contents
THIS PROSPECTUS DOES NOT CONSTITUTE AN OFFER OR SOLICITATION TO SELL OR A SOLICITATION OF AN OFFER TO BUY, NOR SHALL THERE BE ANY OFFER, SOLICITATION, OR SALE OF THE SHARES IN ANY JURISDICTION IN WHICH SUCH OFFER, SOLICITATION, OR SALE IS NOT AUTHORIZED OR TO ANY PERSON TO WHOM IT IS UNLAWFUL TO MAKE ANY SUCH OFFER, SOLICITATION, OR SALE.
THE BOOKS AND RECORDS OF THE FUND ARE MAINTAINED AS FOLLOWS: ALL MARKETING MATERIALS ARE MAINTAINED AT THE OFFICES OF INVESCO DISTRIBUTORS, INC., 11 GREENWAY PLAZA, SUITE 1000, HOUSTON, TEXAS 77046-1173; TELEPHONE NUMBER (800) 983-0903; BASKET CREATION AND REDEMPTION BOOKS AND RECORDS, ACCOUNTING AND CERTAIN OTHER FINANCIAL BOOKS AND RECORDS (INCLUDING FUND ACCOUNTING RECORDS, LEDGERS WITH RESPECT TO ASSETS, LIABILITIES, CAPITAL, INCOME AND EXPENSES, THE REGISTRAR, TRANSFER JOURNALS AND RELATED DETAILS) AND TRADING AND RELATED DOCUMENTS RECEIVED FROM FUTURES COMMISSION MERCHANTS ARE MAINTAINED BY THE BANK OF NEW YORK MELLON, 2 HANSON PLACE, BROOKLYN, NEW YORK 11217, TELEPHONE NUMBER (718) 315-7500. ALL OTHER BOOKS AND RECORDS OF THE FUND (INCLUDING MINUTE BOOKS AND OTHER GENERAL CORPORATE RECORDS, TRADING RECORDS AND RELATED REPORTS AND OTHER ITEMS RECEIVED FROM THE FUND’S COMMODITY BROKERS) ARE MAINTAINED AT THE FUND’S PRINCIPAL OFFICE, C/O INVESCO CAPITAL MANAGEMENT LLC, 3500 LACEY ROAD, SUITE 700, DOWNERS GROVE, ILLINOIS 60515; TELEPHONE NUMBER (800) 983-0903. SHAREHOLDERS WILL HAVE THE RIGHT, DURING NORMAL BUSINESS HOURS, TO HAVE ACCESS TO AND COPY (UPON PAYMENT OF REASONABLE REPRODUCTION COSTS) SUCH BOOKS AND RECORDS IN PERSON OR BY THEIR AUTHORIZED ATTORNEY OR AGENT. MONTHLY ACCOUNT STATEMENTS FOR THE FUND CONFORMING TO COMMODITY FUTURES TRADING COMMISSION (“CFTC”) AND THE NATIONAL FUTURES ASSOCIATION (“NFA”) REQUIREMENTS ARE POSTED ON THE MANAGING OWNER’S WEBSITE AT HTTP://WWW.INVESCO.COM/ETFs. ADDITIONAL REPORTS MAY BE POSTED ON THE MANAGING OWNER’S WEBSITE IN THE DISCRETION OF THE MANAGING OWNER OR AS REQUIRED BY REGULATORY AUTHORITIES. INFORMATION ON THE MANAGING OWNER’S WEBSITE SHALL NOT BE DEEMED TO BE A PART OF THIS PROSPECTUS OR INCORPORATED BY REFERENCE HEREIN UNLESS OTHERWISE EXPRESSLY STATED. THERE WILL SIMILARLY BE DISTRIBUTED TO SHAREHOLDERS, NOT MORE THAN 90 DAYS AFTER THE CLOSE OF THE FUND’S FISCAL YEAR, CERTIFIED AUDITED FINANCIAL STATEMENTS AND (IN NO EVENT LATER THAN MARCH 15 OF THE IMMEDIATELY FOLLOWING YEAR) THE TAX INFORMATION RELATING TO SHARES OF THE FUND NECESSARY FOR THE PREPARATION OF SHAREHOLDERS’ ANNUAL FEDERAL INCOME TAX RETURNS.
THE DIVISION OF INVESTMENT MANAGEMENT OF THE SECURITIES AND EXCHANGE COMMISSION REQUIRES THAT THE FOLLOWING STATEMENT BE PROMINENTLY SET FORTH HEREIN: “NEITHER INVESCO DB MULTI-SECTOR COMMODITY TRUST NOR ANY SERIES THEREOF IS A MUTUAL FUND OR ANY OTHER TYPE OF INVESTMENT COMPANY WITHIN THE MEANING OF THE INVESTMENT COMPANY ACT OF 1940, AS AMENDED, AND IS NOT SUBJECT TO REGULATION THEREUNDER.”
AUTHORIZED PARTICIPANTS MAY BE REQUIRED TO DELIVER A PROSPECTUS WHEN TRANSACTING IN SHARES. SEE “PLAN OF DISTRIBUTION.”
ii
Table of Contents
| 1 | ||||
| 15 | ||||
| 29 | ||||
| 29 | ||||
| 30 | ||||
| 33 | ||||
| DESCRIPTION OF THE DBIQ DIVERSIFIED AGRICULTURE INDEX EXCESS RETURN™ |
34 | |||
| 49 | ||||
| 49 | ||||
| 51 | ||||
| 51 | ||||
| 55 | ||||
| 61 | ||||
| DESCRIPTION OF THE SHARES; THE FUND; CERTAIN MATERIAL TERMS OF THE TRUST AGREEMENT |
63 | |||
| 72 | ||||
| 72 | ||||
| 73 | ||||
| 73 | ||||
| 75 | ||||
| THE SECURITIES DEPOSITORY; BOOK-ENTRY-ONLY SYSTEM; GLOBAL SECURITY |
75 | |||
| 76 | ||||
| 76 | ||||
| 81 | ||||
| 94 | ||||
| 95 | ||||
| 99 | ||||
| 99 | ||||
| 99 | ||||
| 99 | ||||
| 99 | ||||
PART TWO
STATEMENT OF ADDITIONAL
INFORMATION
| GENERAL INFORMATION RELATING TO INVESCO CAPITAL MANAGEMENT LLC |
103 | |||
| 103 | ||||
| 103 | ||||
| 103 | ||||
| 103 | ||||
| 104 | ||||
| 105 | ||||
iii
Table of Contents
This summary of material information contained or incorporated by reference in this Prospectus is intended for quick reference only and does not contain all of the information that may be important to you. For ease of reference, any references throughout this Prospectus to various actions taken by the Fund are actually actions that the Trust has taken on behalf of the Fund. The remainder of this Prospectus contains more detailed information. You should read the entire Prospectus, including the information incorporated by reference in this Prospectus, before deciding whether to invest in Shares. Please see the section “Incorporation by Reference of Certain Documents” for information on how you can obtain the information that is incorporated by reference in this Prospectus. This Prospectus is dated October 10, 2018.
The Trust and the Fund
Invesco DB Multi-Sector Commodity Trust (the “Trust”) was formed as a Delaware statutory trust, in seven separate series, or funds, on August 3, 2006. Invesco DB Agriculture Fund (the “Fund”) is a series of the Trust. The Fund issues common units of beneficial interest (“Shares”), which represent units of fractional undivided beneficial interest in and ownership of the Fund. The term of the Trust and the Fund is perpetual (unless terminated earlier in certain circumstances). The principal executive offices of the Trust and the Fund are located at c/o Invesco Capital Management LLC, 3500 Lacey Road, Suite 700, Downers Grove, IL 60515, and its telephone number is (800) 983-0903.
As of the date of this Prospectus, the Trust consists of the following seven series — Invesco DB Energy Fund, Invesco DB Oil Fund, Invesco DB Precious Metals Fund, Invesco DB Gold Fund, Invesco DB Silver Fund, Invesco DB Base Metals Fund and Invesco DB Agriculture Fund. This Prospectus is for the Fund only and not for the first six funds listed in the prior sentence (the “Sectors Funds”). The Sectors Funds are not being offered by this Prospectus. Information regarding both the Fund and the Sectors Funds (and any other additional series of the Trust) is available at www.invesco.com/ETFs.
Shares Listed on the NYSE Arca
The Shares are listed on the NYSE Arca under the symbol “DBA.”
Secondary market purchases and sales of Shares are subject to ordinary brokerage commissions and charges.
Purchases and Sales in the Secondary Market on the NYSE Arca
Individual Shares may be purchased and sold only on the NYSE Arca. Because the Shares will trade at market prices, rather than the net asset value (“NAV”) of the Fund, Shares may trade at prices greater than NAV (at a premium), at NAV, or less than NAV (at a discount).
Baskets may be created or redeemed directly with the Fund only by Authorized Participants. It is expected that Baskets will be created when the market price per Share is at a premium to the NAV per Share. Similarly, it is expected that Baskets will be redeemed when the market price per Share is at a discount to the NAV per Share. Retail investors seeking to purchase or sell Shares on any day are expected to effect such transactions in the secondary market, on the NYSE Arca, at the market price per Share.
The market price of the Shares may not be identical to the NAV per Share, but these valuations are expected to be very close. Investors are able to use the intra-day indicative value (“IIV”) per Share to determine if they want to purchase in the secondary market via the NYSE Arca. The IIV per Share is based on the prior day’s final NAV, adjusted four times per minute throughout the trading day to reflect the price changes of the Fund’s holdings. As a result, the IIV provides a continuously updated estimate of the Fund’s NAV per Share.
Retail investors may purchase and sell Shares through traditional brokerage accounts. Purchases or sales of Shares may be subject to brokerage commissions. Investors are encouraged to review the terms of their brokerage accounts for applicable charges.
1
Table of Contents
Pricing Information Available on the NYSE Arca and Other Sources
The following table lists additional NYSE Arca symbols and their meanings with respect to the Fund and the Index:
|
DBA |
Market price per Share on NYSE Arca | |
| DBA.IV |
IIV per Share | |
| DBA.NV |
End of day NAV of the Fund | |
| DBAGIX |
Intra-day Index closing level | |
| DBLCDBAE |
End of day Index closing level as of close of NYSE Arca |
The intra-day data in the above table, including the IIV, is published once every fifteen seconds throughout each trading day.
The Index Sponsor (as defined herein) calculates and publishes the closing level of the Index daily. The Managing Owner publishes the NAV of the Fund and the NAV per Share daily.
All of the foregoing information is published as follows:
The intra-day level of the Index (symbol: DBAGIX) and the IIV per Share (symbol: DBA.IV) (each quoted in U.S. dollars) are published once every fifteen seconds throughout each trading day on the consolidated tape, Reuters and/or Bloomberg and on the Managing Owner’s website at www.invesco.com/ETFs, or any successor thereto.
The current trading price per Share (symbol: DBA) (quoted in U.S. dollars) is published continuously as trades occur throughout each trading day on the consolidated tape, Reuters and/or Bloomberg and on the Managing Owner’s website at www.invesco.com/ETFs, or any successor thereto.
The most recent end-of-day Index closing level (symbol: DBLCDBAE) is published as of the close of business for the NYSE Arca each trading day on the consolidated tape, Reuters and/or Bloomberg and on the Managing Owner’s website at www.invesco.com/ETFs, or any successor thereto.
The most recent end-of-day NAV of the Fund (symbol: DBA.NV) is published as of the close of business on Reuters and/or Bloomberg and on the Managing Owner’s website at www.invesco.com/ETFs, or any successor thereto. In addition, the most recent end-of-day NAV of the Fund (symbol: DBA.NV) is published the following morning on the consolidated tape.
All of the foregoing information with respect to the Index, including the Index’s history, is also published at https://index.db.com.
The Index Sponsor obtains information for inclusion in, or for use in the calculation of, the Index from sources the Index Sponsor considers reliable. None of the Index Sponsor, the Managing Owner, the Fund or any of their respective affiliates accepts responsibility for or guarantees the accuracy and/or completeness of the Index or any data included in the Index.
Information on the Managing Owner’s website shall not be deemed to be a part of this Prospectus or incorporated by reference herein unless otherwise expressly stated.
CUSIP Number
The CUSIP number of the Fund is 46140H106.
Risk Factors
An investment in the Shares is speculative and involves a high degree of risk. The summary risk factors set forth below are intended merely to highlight certain risks of the Fund. The Fund has additional risks that are set forth elsewhere in this Prospectus.
| • | Past performance is not necessarily indicative of future results; all or substantially all of an investment in the Fund could be lost. |
| • | The Fund’s trading of futures contracts takes place in very volatile markets. |
| • | The Fund is subject to fees and expenses in the aggregate amount of approximately 0.89% per annum and will be successful only if its annual returns from futures trading, plus its annual Treasury Income, and any Money |
2
Table of Contents
| Market Income and T-Bill ETF Income, exceed such fees and expenses. |
| • | The Fund is subject to position limits imposed by the Commodity Futures Trading Commission (“CFTC”) and/or futures exchange rules. If the Fund were to reach a position limit, its ability to issue new Baskets or to reinvest income in additional futures contracts may be impaired or limited. This may adversely affect the correlation between the market price of the Shares and the NAV of the Fund, which could result in Shares trading at a premium or discount to NAV of the Fund. |
| • | There can be no assurance that the Fund will achieve profits or avoid losses, significant or otherwise. |
| • | Performance of the Fund may not track the Index during particular periods or over the long term. This tracking error may cause the Fund to outperform or underperform the Index. |
| • | Disruptions in the ability to create or redeem Baskets may adversely affect investors. |
| • | Certain potential conflicts of interest exist between the Managing Owner, the Commodity Broker (as defined herein) and their affiliates and the Fund’s shareholders (“Shareholders”). |
| • | Although the Managing Owner attempts to monitor for conflicts, it is extremely difficult, if not impossible, for the Managing Owner to ensure that the conflicts will not, in fact, result in adverse consequences to the Fund and the Shareholders. |
| • | The Fund’s NAV may not always correspond to the market price of the Shares and, as a result, Baskets may be created or redeemed at a value that differs from the market price of the Shares. |
| • | Shareholders will be subject to taxation on their allocable share of the Fund’s taxable income, whether or not they receive cash distributions. |
The Trustee
Wilmington Trust Company (the “Trustee”), a Delaware trust company, is the sole trustee of the Trust. The Trustee’s duties and liabilities with respect to the offering of the Shares and the management of the Fund are limited to its express obligations under the Fifth Amended and Restated Declaration of Trust and Trust Agreement (the “Trust Agreement”).
Investment Objective
The Fund seeks to track changes, whether positive or negative, in the level of the DBIQ Diversified Agriculture Index Excess Return™ (the “Index”) over time, plus the excess, if any, of the sum of the Fund’s Treasury Income, Money Market Income and T-Bill ETF Income, over the expenses of the Fund. The Fund invests in futures contracts in an attempt to track its Index. The Fund holds Treasury Securities, money market mutual funds and T-Bill ETFs for margin and/or cash management purposes only, and the Fund’s performance reflects the appreciation or depreciation of such securities.
The Shares are designed for investors who want a cost-effective and convenient way to invest in commodity futures on U.S. and non-U.S. markets.
Advantages of investing in the Fund include:
| • | Ease and Flexibility of Investment. The Shares trade on the NYSE Arca and provide institutional and retail investors with indirect access to commodity futures markets. The Shares may be bought and sold on the NYSE Arca like other exchange-listed securities. Retail investors may purchase and sell Shares through traditional brokerage accounts. |
| • | Margin. Shares are eligible for margin accounts. |
| • | Diversification. The Shares may help to diversify a portfolio of investments in stocks, bonds, and related assets to the extent there is low to negative correlation between those asset classes and the performance of the Index. |
| • | Optimum Yield™. A portion of the Index utilizes an Optimum Yield™ methodology, which seeks to minimize the effects of |
3
Table of Contents
| negative roll yield that may be experienced by other commodities indexes. “Negative roll yield” is a term that describes the adverse impact of an upward-sloping price curve for futures contracts, which makes it more expensive to replace expiring contracts with new contracts. |
| • | Transparency. The Shares provide a more direct investment in commodities than mutual funds or ETFs that invest in commodity-linked notes or otherwise gain indirect exposure to commodities, which may have implicit imbedded costs, credit risk and other potentially opaque features. |
Investing in the Fund does not insulate Shareholders from certain risks, including volatility in the spot prices of the commodities comprising the Index (“Index Commodities”). In addition, the Fund seeks to mitigate the adverse consequences of negative roll yield and to maximize the potential benefits of positive roll yield by tracking the Index. However, it may not be successful in doing so.
The Fund pursues its investment objective by investing in a portfolio of exchange-traded futures on the Index Commodities.
The Index is intended to reflect the agricultural sector. The Index Commodities consist of Corn, Soybeans, Wheat, Kansas City Wheat, Sugar, Cocoa, Coffee, Cotton, Live Cattle, Feeder Cattle, and Lean Hogs.
The Fund trades futures contracts on Index Commodities (“Index Contracts”) that are subject to position limits under regulations of the CFTC or futures exchange rules, as applicable. The Managing Owner may determine to invest in other futures contracts if at any time it is impractical or inefficient to gain full or partial exposure to any Index Commodity through the use of Index Contracts. These other futures contracts may or may not be based on an Index Commodity. When they are not, the Managing Owner seeks to select futures contracts that it reasonably believes tend to exhibit trading prices that correlate with an Index Contract.
As the Fund approaches or reaches position limits with respect to an Index Commodity, the Fund may commence investing in Index Contracts that reference other Index Commodities. In those circumstances, the Fund may also trade in futures contracts based on commodities other than Index Commodities that the Managing Owner reasonably believes tend to exhibit trading prices that correlate with an Index Contract.
The Index Sponsor calculates the Index on an excess return basis. The excess return basis calculation reflects the change in market value over time, whether positive or negative, of the applicable underlying commodity futures only.
The Fund also holds United States Treasury Securities (“Treasury Securities”) for deposit with the Fund’s Commodity Broker as margin and Treasury Securities, cash and money market mutual funds (affiliated or otherwise) on deposit with the Custodian (for cash management purposes). Additionally, the Fund gains an exposure to Treasury Securities, with a maximum remaining maturity of up to 12 months, through its holdings of T-Bill ETFs (affiliated or otherwise). Such holdings of T-Bill ETFs are on deposit with the Custodian (for cash management purposes) and may be held by the Fund’s Commodity Broker as margin, to the extent permissible under CFTC rules.
General
The Index is calculated on an excess return, or unfunded basis. The Index is rolled on both an Optimum YieldTM and non-Optimum YieldTM basis. The Optimum YieldTM rolling methodology seeks to maximize the roll benefits in backwardated markets and to minimize the losses from rolling in contangoed markets. The non-Optimum YieldTM portion of the Index is rolled to the next to expire futures contract as provided below under “Contract Selection (Non-OY Single Commodity Indexes only).”
The sponsor of the Index is Deutsche Investment Management Americas Inc. (the “Index Sponsor” or “DIMA”).
Composition of the Index
The Index is designed to be composed of notional amounts of each Index Commodity. The
4
Table of Contents
notional amount of each Index Commodity included in the Index is intended to reflect the changes in market value of each such Index Commodity within the Index. The Closing Level of the Index is calculated on each Index Business Day (as defined below) by the Index Sponsor based on the closing price of the futures contracts for each of the underlying Index Commodities and the notional amounts of such Index Commodities.
Each Index Commodity is assigned a weight (“Index Base Weight”), which is intended to reflect the proportion of such Index Commodity relative to the Index. The Index has been calculated back to a base date (“Base Date”). On the Base Date of January 18, 1989, the closing level of the Index (the “Closing Level”) was 100. The Index is rebalanced annually in November to ensure that each of the Index Commodities is weighted in the same proportion that such Index Commodities were weighted on the Base Date.
The composition of the Index may be adjusted in the event that the Index Sponsor is not able to calculate the closing prices of the Index Commodities.
The Index methodology includes provisions for the replacement of futures contracts as they approach maturity. This replacement takes place over a period of time in order to lessen the impact on the market for the futures contracts being replaced. With respect to each Index Commodity, the Fund employs a rule-based approach when it ‘rolls’ from one futures contract to another. The Index is comprised of OY Single Commodity Indexes and non-OY Single Commodity Indexes. The Index Commodities that underlie the OY Single Commodity Indexes are Corn, Soybeans, Wheat, Kansas City Wheat and Sugar. The Index Commodities that underlie the non-OY Single Commodity Indexes are Cocoa, Coffee, Cotton, Live Cattle, Feeder Cattle and Lean Hogs.
The OY Single Commodity Indexes are rolled to the futures contract which generates the best possible “implied roll yield” under prevailing market conditions. Where there is an upward-sloping price curve for futures contracts, the implied roll yield is expected to be negative. The selection of a new Index Contract in such market conditions is designed to
minimize the impact of negative roll yield. Conversely, where there is a downward-sloping price curve for futures contracts, the implied roll yield is expected to be positive. The selection of a new Index Contract in such market conditions is designed to maximize the impact of positive roll yield. The OY Single Commodity Indexes take the impact of implied roll yield into consideration by selecting, as the replacement for an expiring futures contract, the futures contract with a delivery month within the next thirteen months that generates the most favorable implied roll yield under current market conditions.
The market condition in which the Index is designed to maximize the effect of positive roll yield when entering into new futures contracts is called backwardation. Backwardation exists when prices are higher for contracts with shorter-term expirations than those with longer-term expirations, a condition that is typically associated with commodities that are consumed quickly instead of being held in storage. Rolling in a backwardated market will tend to enhance returns from futures trading.
The market condition in which the Index is designed to mitigate the effect of negative roll yield when entering into new futures contracts is called contango. Contango exists when contract prices are higher in distant delivery months than in nearer delivery months, typically due to costs associated with storing a given physical commodity for a longer period. Rolling in a contangoed market will tend to cause a drag on returns from futures trading.
Each of the non-OY Single Commodity Indexes rolls only to the next to expire futures contract as provided below under “Contract Selection (Non-OY Single Commodity Indexes only).”
The Fund’s returns from futures trading are called excess return, which is the combined return based on the spot prices of the Index Commodities and the roll yield from trading Index Contracts.
Contract Selection (OY Single Commodity Indexes only)
On the first Index Business Day of each month (“Verification Date”), each Index Commodity futures contract will be tested in order to determine whether
5
Table of Contents
to continue including it in the applicable OY Single Commodity Index. If the Index Commodity futures contract requires delivery of the underlying commodity in the next month, known as the Delivery Month, a new Index Commodity futures contract will be selected for inclusion in such OY Single Commodity Index. For example, if the first Index Business Day is May 1 of the current year, and the Delivery Month of the Index Commodity futures contract currently in such OY Single Commodity Index is June of the current year, a new Index Commodity futures contract with a later Delivery Month will be selected.
For each underlying Index Commodity of an OY Single Commodity Index, the new Index Contract selected will be the Index Contract with the best possible “implied roll yield” based on the closing price for each eligible Index Contract. Eligible Index Contracts are any Index Contracts having a Delivery Month (i) no sooner than the month after the Delivery Month of the Index Contract currently in such OY Single Commodity Index, and (ii) no later than the thirteenth month after the Verification Date. For example, if the first Index Business Day is May 1 of the current year and the Delivery Month of an Index Contract currently in an OY Single Commodity Index is June of the current year, the Delivery Month of an eligible new Index Contract must be between July of the current year and June of the following year. The implied roll yield is calculated and the futures contract on the Index Commodity with the best possible implied roll yield is selected. If two futures contracts have the same implied roll yield, the futures contract with the fewest number of months prior to the Delivery Month is selected.
After selection of the replacement futures contract, each OY Single Commodity Index will roll such replacement futures contract as provided in the sub-paragraph “Monthly Index Roll Period with respect to both OY Single Commodity Indexes and Non-OY Single Commodity Indexes.”
[Remainder of page left blank intentionally.]
6
Table of Contents
Contract Selection (Non-OY Single Commodity Indexes only)
On the first Index Business Day of each month, each non-OY Single Commodity Index will select a new futures contract to replace the old futures contract as provided in the following schedule.
| Contract |
Exchange |
Jan | Feb | Mar | Apr | May | Jun | Jul | Aug | Sep | Oct | Nov | Dec | |||||||||||||||||||||||||||||||||||||
| Cocoa |
ICE-US (CC) | H | K | K | N | N | U | U | Z | Z | Z | H | H | |||||||||||||||||||||||||||||||||||||
| Coffee |
ICE-US (KC) | H | K | K | N | N | U | U | Z | Z | Z | H | H | |||||||||||||||||||||||||||||||||||||
| Cotton |
ICE-US (CT) | H | K | K | N | N | Z | Z | Z | Z | Z | H | H | |||||||||||||||||||||||||||||||||||||
| Live Cattle |
CME (LC) | J | J | M | M | Q | Q | V | V | Z | Z | G | G | |||||||||||||||||||||||||||||||||||||
| Feeder Cattle |
CME (FC) | H | J | K | Q | Q | Q | U | V | X | F | F | H | |||||||||||||||||||||||||||||||||||||
| Lean Hogs |
CME (LH) | J | J | M | M | N | Q | V | V | Z | Z | G | G | |||||||||||||||||||||||||||||||||||||
| Month | Month
Letter Code | |
|
January |
F | |
|
February |
G | |
|
March |
H | |
|
April |
J | |
|
May |
K | |
|
June |
M | |
|
July |
N | |
|
August |
Q | |
|
September |
U | |
|
October |
V | |
|
November |
X | |
|
December |
Z |
After selection of the replacement futures contract, each non-OY Single Commodity Index will roll such replacement futures contract as provided in the sub-paragraph “Monthly Index Roll Period with respect to both OY Single Commodity Indexes and Non-OY Single Commodity Indexes.”
[Remainder of page left blank intentionally.]
7
Table of Contents
Monthly Index Roll Period with respect to both OY Single Commodity Indexes and Non-OY Single Commodity Indexes
After the futures contract selection with respect to both OY Single Commodity Indexes and non-OY Single Commodity Indexes, the monthly roll for each Index Commodity subject to a roll in that particular month unwinds the old futures contract and enters a position in the new futures contract. This takes place between the second and sixth Index Business Day of the month.
On each day during the roll period, new notional holdings are calculated. The calculations for the Index Contracts that are leaving the Index and for the new Index Contracts that are being added to the Index are then calculated.
On all days that are not monthly index roll days, the notional holdings of each Index Contract remains constant.
The Index is re-weighted on an annual basis on the sixth Index Business Day of each November. The calculation of the Index is expressed as the weighted average return of the Index Commodities.
Shares Should Track Closely the Value of the Index
The Shares are intended to provide investment results that generally correspond to changes, positive or negative, in the levels of the Index over time.
The value of the Shares is expected to fluctuate in relation to changes in the value of the Fund’s portfolio. The market price of the Shares may not be identical to the NAV per Share, but these two valuations are expected to be very close.
The Fund holds a portfolio of long futures contracts on the Index Commodities which comprise its Index, each of which are traded on various commodity futures markets. The Fund’s portfolio is traded with a view to tracking the Index over time, whether the Index is rising, falling or flat over any particular period. The Fund is not actively managed on the basis of judgments relating to economic, financial and market considerations with a view to obtaining positive results under all market conditions.
The Managing Owner
Invesco Capital Management LLC, a Delaware limited liability company, serves as Managing Owner of the Trust and the Fund. The Managing Owner was formed on February 7, 2003. The Managing Owner is an affiliate of Invesco Ltd. The Managing Owner was formed to be the managing owner of investment vehicles such as ETFs and has been managing non-commodity futures based ETFs since 2003 and a commodity futures based ETF since 2014. The Managing Owner serves as the commodity pool operator and commodity trading advisor of the Trust and the Fund. The Managing Owner is registered as a commodity pool operator and commodity trading advisor with the CFTC and is a member of, and approved as a swap firm by, the National Futures Association (the “NFA”). As a registered commodity pool operator and commodity trading advisor, with respect to both the Trust and the Fund, the Managing Owner must comply with various regulatory requirements under the United States Commodity Exchange Act of 1936, as amended (the “Commodity Exchange Act”) and the rules and regulations of the CFTC and the NFA, including investor protection requirements, antifraud prohibitions, disclosure requirements, and reporting and recordkeeping requirements. The Managing Owner also is subject to periodic inspections and audits by the CFTC and NFA.
The principal office of the Managing Owner is located at 3500 Lacey Road, Suite 700, Downers Grove, IL 60515. The telephone number of the Managing Owner is (800) 983-0903.
The Fund pays the Managing Owner a Management Fee, monthly in arrears, in an amount equal to 0.85% per annum of the daily NAV of the Fund.
The Management Fee is paid in consideration of the Managing Owner’s services related to the management of the Fund’s business and affairs, including the provision of commodity futures trading advisory services.
The Fund may, for margin and/or cash management purposes, invest in money market mutual funds and/or T-Bill ETFs that are managed by affiliates of the Managing Owner. The indirect
8
Table of Contents
portion of the management fees that the Fund may incur through such investments is in addition to the Management Fee paid to the Managing Owner. The Managing Owner has contractually agreed to waive indefinitely the fees that it receives from the Fund in an amount equal to the indirect management fees that the Fund incurs through its investments in affiliated money market mutual funds and/or affiliated T-Bill ETFs. The Managing Owner may terminate this waiver on 60 days notice.
Under the Trust Agreement, Wilmington Trust Company is the trustee of the Fund. The Trustee’s duties and liabilities with respect to the offering of the Shares and the management of the Fund are limited to its express obligations under the Trust Agreement. The Trustee has no duty or liability to supervise or monitor the performance of the Managing Owner, nor does the Trustee have any liability for the acts or omissions of the Managing Owner.
Effective June 4, 2018, the name of the Managing Owner changed from Invesco PowerShares Capital Management LLC to Invesco Capital Management LLC, the name of the Trust changed from PowerShares DB Multi-Sector Commodity Trust to Invesco DB Multi-Sector Commodity Trust, and the name of the Fund changed from PowerShares DB Agriculture Fund to Invesco DB Agriculture Fund.
The Commodity Broker
A variety of executing brokers execute futures transactions on behalf of the Fund. Such executing brokers give-up all such transactions to Morgan Stanley & Co. LLC, a Delaware limited liability company, which serves as the Fund’s clearing broker (the “Commodity Broker”). In its capacity as clearing broker, the Commodity Broker may execute or receive transactions executed by others, clears all of the Fund’s futures transactions and performs certain administrative services for the Fund. The Commodity Broker is registered with the CFTC as a futures commission merchant and is a member of the NFA in such capacity.
The Fund pays the Commodity Broker all brokerage commissions, including applicable exchange fees, NFA fees, give-up fees, pit brokerage
fees and other transaction related fees and expenses charged in connection with trading activities. On average, total charges paid to the Commodity Broker are expected to be less than $7.00 per round-turn trade, although the Commodity Broker’s brokerage commissions and trading fees are determined on a contract-by-contract basis. The Managing Owner estimates the brokerage commissions and fees will be approximately 0.04% of the NAV of the Fund in any year, although the actual amount of brokerage commissions and fees in any year or any part of any year may be greater.
The Administrator, Custodian and Transfer Agent
The Bank of New York Mellon is the administrator (the “Administrator”) and serves as the custodian (the “Custodian”) and the transfer agent (the “Transfer Agent”) of the Fund. The Bank of New York Mellon has entered into a Administration and Accounting Agreement (the “Administration Agreement”), a Global Custody Agreement (the “Custody Agreement”), and a Transfer Agency and Service Agreement, in connection therewith.
Pursuant to the Administration Agreement, the Administrator performs or supervises the performance of services necessary for the operation and administration of the Fund (other than making investment decisions), NAV calculations, accounting and other fund administrative services. Key terms of the Administration Agreement are summarized under the heading “Material Contracts.”
The Administrator’s monthly fees are paid on behalf of the Fund by the Managing Owner out of the Management Fee.
Pursuant to the Transfer Agency and Service Agreement, the Transfer Agent receives a transaction processing fee in connection with receiving and processing orders from Authorized Participants to create or redeem Baskets in the amount of $500 per order. These transaction processing fees are paid directly by the Authorized Participants and not by the Fund.
Invesco Distributors, Inc.
Invesco Distributors, Inc. (“Invesco Distributors”) assists the Managing Owner with
9
Table of Contents
certain functions and duties relating to distribution and marketing, including reviewing and approving marketing materials. Invesco Distributors retains all marketing materials at c/o Invesco Distributors, Inc., 11 Greenway Plaza, Suite 1000, Houston, Texas 77046-1173. Investors may contact Invesco Distributors toll-free in the U.S. at (800) 983-0903. The Fund has entered into a Distribution Services Agreement with Invesco Distributors. Invesco Distributors is affiliated with the Managing Owner.
The Managing Owner, out of the Management Fee, pays Invesco Distributors $25,000 annually ($6,250 per quarter) for performing its duties on behalf of the Fund. Such services may include, among other services, reviewing distribution related legal documents and contracts, consulting on marketing or sales strategy, maintaining certain books and records in respect of the Fund and performing additional marketing and distribution related services as may be agreed upon by Invesco Distributors and the Managing Owner.
Index Sponsor
The Managing Owner, on behalf of the Fund, has appointed DIMA to serve as the Index Sponsor. The Index Sponsor calculates and publishes the daily index levels and the indicative intraday index levels. The Index Sponsor also calculates the IIV per Share throughout each Business Day.
The Managing Owner pays the Index Sponsor a licensing fee and an index services fee out of the Management Fee for performing its duties.
Marketing Agent
The Managing Owner, on behalf of the Fund, has appointed DIMA (the “Marketing Agent”) to assist the Managing Owner by providing support to educate institutional investors about the Deutsche Bank indices and to complete governmental or institutional due diligence questionnaires or requests for proposals related to the Deutsche Bank indices.
The Managing Owner pays the Marketing Agent a marketing services fee out of the Management Fee.
The Marketing Agent will not open or maintain customer accounts or handle orders for the Fund. The
Marketing Agent has no responsibility for the performance of the Fund or the decisions made or actions taken by the Managing Owner.
“800” Number for Investors
Investors may contact the Managing Owner toll free in the U.S. at (800) 983-0903.
Limitation of Liabilities
You cannot lose more than your investment, including any appreciation in your investment, in the Shares. Shareholders are entitled to limitation on liability equivalent to the limitation on liability enjoyed by stockholders of a Delaware business corporation for profit. An investor may be required to return some or all of its capital in the event of a bankruptcy of the Fund.
You will not be subject to the losses or liabilities of any other fund of the Trust in which you have not invested. We have received an opinion of counsel that the Fund is entitled to the benefits of the limitation on inter-series liability provided under the Delaware Statutory Trust Act. Each Share, when purchased in accordance with the Trust Agreement, shall, except as otherwise provided by law, be fully-paid and non-assessable.
The debts, liabilities, obligations, claims and expenses of the Fund will be enforceable against the assets of the Fund only, and not against the assets of the Trust generally or the assets of any other fund of the Trust, and, unless otherwise provided in the Trust Agreement, none of the debts, liabilities, obligations and expenses incurred, contracted for or otherwise existing with respect to the Trust generally or any other series thereof will be enforceable against the assets of the Fund, as the case may be.
Creation and Redemption of Shares
The Fund creates and redeems Shares from time to time, but only in one or more Baskets. A Basket is a block of 200,000 Shares. Baskets may be created or redeemed only by Authorized Participants. Baskets are created and redeemed continuously on the creation order settlement date or redemption order settlement date, as applicable, as of 2:45 p.m., Eastern time, on the business day immediately
10
Table of Contents
following the date on which a valid order to create or redeem a Basket is accepted by the Fund. The creation or redemption will be at the NAV of 200,000 Shares as of the closing time of the NYSE Arca or the last to close of the exchanges on which the Index Commodities are traded, whichever is later, on the date that a valid order to create or redeem a Basket is accepted by the Fund. Upon submission of a creation order or redemption order, the Authorized Participant may request the Managing Owner to agree to a creation order settlement or redemption order settlement date up to two business days after the creation order date or redemption order date.
For purposes of processing both purchase and redemption orders, a “business day” means any day other than a day when banks in New York City are required or permitted to be closed. Except when aggregated in Baskets, the Shares are not redeemable securities. Authorized Participants pay a transaction fee of $500 in connection with each order to create or redeem a Basket and are subject to an additional processing charge for failure to timely deliver such orders. Authorized Participants may sell the Shares included in the Baskets they purchase from the Fund to other investors.
See “Creation and Redemption of Shares” for more details.
Authorized Participants
Baskets may be created or redeemed only by Authorized Participants. Each Authorized Participant must:
(1) be a registered broker-dealer or other securities market participant such as a bank or other financial institution which is not required to register as a broker-dealer to engage in securities transactions;
(2) be a participant in the Depository Trust Company (“DTC”); and
(3) have entered into an agreement with the Fund and the Managing Owner (a “Participant Agreement”). The Participant Agreement sets forth the procedures for the creation and redemption of Baskets and for the delivery of cash required for such creations or redemptions.
A list of the current Authorized Participants can be obtained from the Administrator. See “Creation and Redemption of Shares” for more details.
NAV
NAV means the total assets of the Fund including, but not limited to, all cash and cash equivalents or other debt securities less total liabilities of the Fund, each determined on the basis of generally accepted accounting principles in the United States, consistently applied under the accrual method of accounting.
NAV per Share is the NAV of the Fund divided by the number of outstanding Shares.
See “Description of the Shares; The Fund; Certain Material Terms of the Trust Agreement-NAV” for more details.
Clearance and Settlement
The Shares are evidenced by global certificates that the Fund issues to DTC. The Shares are available only in book-entry form. Shareholders may hold their Shares through DTC, if they are participants in DTC, or indirectly through entities that are participants in DTC.
Segregated Accounts/Treasury Income, Money Market Income and T-Bill ETF Income
The Fund has arranged for the proceeds of the continuous offering of the Shares to be deposited as cash in a segregated account in the name of the Fund at the Custodian (or another eligible financial institution, as applicable) in accordance with CFTC investor protection and segregation requirements. The Fund is credited with 100% of the interest earned on its average net assets on deposit with the Custodian or such other financial institution each week. The Fund’s non-margin assets are generally invested in Treasury Securities, money market mutual funds (affiliated or otherwise), and T-Bill ETFs (affiliated or otherwise).
See “Fees and Expenses” for more details.
[Remainder of page left blank intentionally.]
11
Table of Contents
Fees and Expenses
| Management Fee | The Fund pays the Managing Owner a Management Fee, monthly in arrears, in an amount equal to 0.85% per annum of the daily NAV of the Fund. The Management Fee is paid in consideration of the Managing Owner’s services related to the management of the Fund’s business and affairs, including the provision of commodity futures trading advisory services.
The Fund may, for margin and/or cash management purposes, invest in money market mutual funds and/or T-Bill ETFs that are managed by affiliates of the Managing Owner. The indirect portion of the management fees that the Fund may incur through such investments is in addition to the Management Fee paid to the Managing Owner. The Managing Owner has contractually agreed to waive indefinitely the fees that it receives in an amount equal to the indirect management fees that the Fund incurs through its investments in affiliated money market mutual funds and/or affiliated T-Bill ETFs. The Managing Owner may terminate the fee waiver on 60 days notice. | |
| Offering Expenses | Expenses incurred in connection with the continuous offering of Shares are paid by the Managing Owner. | |
| Brokerage Commissions and Fees | The Fund pays to the Commodity Broker all brokerage commissions, including applicable exchange fees, NFA fees, give-up fees, pit brokerage fees and other transaction related fees and expenses charged in connection with its trading activities. On average, total charges paid to the Commodity Broker are expected to be less than $7.00 per round-turn trade, although the Commodity Broker’s brokerage commissions and trading fees are determined on a contract-by-contract basis. The Managing Owner estimates the brokerage commissions and fees will be approximately 0.04% of the NAV of the Fund in any year, although the actual amount of brokerage commissions and fees in any year or any part of any year may be greater. | |
| Routine Operational, Administrative and Other Ordinary Expenses | The Managing Owner pays all of the routine operational, administrative and other ordinary expenses of the Fund, including, but not limited to, computer services, the fees and expenses of the Trustee, license and service fees paid to DIMA as Marketing Agent and Index Sponsor, legal and accounting fees and expenses, tax preparation expenses, filing fees, and printing, mailing and duplication costs. | |
| Non-Recurring Fees and Expenses | The Fund pays all of the non-recurring and unusual fees and expenses (referred to as extraordinary fees and expenses in the Trust Agreement), if any, as determined by the Managing Owner. Non-recurring and unusual fees and expenses include items such as legal claims and liabilities, litigation costs, indemnification expenses and other expenses that are not currently anticipated obligations of the Fund or of managed futures funds in general. | |
| Management Fee and Expenses to be Paid First out of Treasury Income, Money Market Income and/or T-Bill ETF Income | The Management Fee and the brokerage commissions and fees of the Fund are paid first out of Treasury Income from the Fund’s holdings of Treasury Securities, Money Market Income from the Fund’s holdings of money market mutual funds (affiliated or otherwise) and T-Bill ETF Income from the Fund’s holdings of T-Bill ETFs (affiliated or otherwise), as applicable, on deposit with the Commodity Broker as margin, the Custodian, or otherwise. If the sum of the Treasury Income, the Money Market Income and |
12
Table of Contents
| the T-Bill ETF Income is not sufficient to cover the fees and expenses of the Fund that are payable by the Fund during any period, the excess of such fees and expenses over such Treasury Income, Money Market Income and T-Bill ETF Income, as applicable, will be paid out of income from futures trading, if any, or from sales of the Fund’s holdings in Treasury Securities, money market mutual funds, and/or holdings in T-Bill ETFs. | ||
| Selling Commission | Retail investors may purchase and sell Shares through traditional brokerage accounts. Investors are expected to be charged a commission by their brokers in connection with purchases of Shares that will vary from investor to investor. Investors are encouraged to review the terms of their brokerage accounts for applicable charges. |
13
Table of Contents
Distributions
The Fund will make distributions at the discretion of the Managing Owner. To the extent that the Fund’s actual and projected Treasury Income, the Fund’s actual and projected Money Market Income and the Fund’s actual and projected T-Bill ETF Income, as applicable, exceeds the actual and projected fees and expenses of the Fund, the Managing Owner expects periodically to make distributions of the amount of such excess. The Managing Owner currently does not expect to make distributions with respect to the Fund’s capital gains. Depending on the Fund’s performance for the taxable year and your own tax situation for such year, your income tax liability for the taxable year for your allocable share of the Fund’s net ordinary income or loss and capital gain or loss may exceed any distributions you receive with respect to such year.
Fiscal Year
The fiscal year of the Fund ends on December 31 of each year.
U.S. Federal Income Tax Considerations
Subject to the discussion below in “Material U.S. Federal Income Tax Considerations,” the Fund will be classified as a partnership for U.S. federal income tax purposes. Accordingly, the Fund will generally not incur U.S. federal income tax liability; rather, each beneficial owner of Shares will be required to take into account its allocable share of the Fund’s income, gain, loss, deduction and other items for the Fund’s taxable year ending with or within the owner’s taxable year.
Please refer to the “Material U.S. Federal Income Tax Considerations” section below for information on the potential U.S. federal income tax consequences of the purchase, ownership and disposition of Shares.
Breakeven Amounts
As long as the Fund does not lose at least approximately 1.04% per annum, or $0.18 per annum per Share at $17.58 as the NAV per Share as of July 31, 2018, an investor will break even on an investment during the first twelve months of an investment.
THE SHARES ARE SPECULATIVE AND INVOLVE A HIGH DEGREE OF RISK.
[Remainder of page left blank intentionally.]
14
Table of Contents
You could lose money investing in Shares. You should consider carefully the risks described below before making an investment decision. You should also refer to the other information included in this Prospectus.
MARKET RISKS
NAV May Not Always Correspond to Market Price and, as a Result, Baskets May be Created or Redeemed at a Value that Differs from the Market Price of the Shares.
Shares may trade at, above or below their NAV. The NAV fluctuates with changes in the market value of the Fund’s assets. The trading price of Shares fluctuates in accordance with changes in the NAV, intraday changes in the value of the futures contracts and market supply and demand. The amount of the discount or premium in the trading price of the Shares relative to their NAV may be influenced by non-concurrent trading hours between NYSE Arca (the exchange on which the Shares trade) and the exchanges on which Index Contracts trade. While the Shares are expected to trade on NYSE Arca until 4:00 p.m. (Eastern time), liquidity in the markets for the Index Contracts are expected to be reduced whenever the principal markets for those contracts are closed. As a result, trading spreads, and the resulting premium or discount on Shares, may widen during these gaps in market trading hours.
The NYSE Arca May Halt Trading in the Shares Which Would Adversely Impact Your Ability to Sell Shares.
The Shares are listed for trading on the NYSE Arca under the market symbol DBA. Trading in Shares may be halted due to market conditions or, in light of NYSE Arca rules and procedures, for reasons that, in the view of the NYSE Arca, make trading in Shares inadvisable. In addition, trading is subject to trading halts caused by extraordinary market volatility pursuant to “circuit breaker” rules that require trading to be halted for a specified period based on a specified market decline. If the Fund were no longer to meet the requirements necessary to maintain the listing of its Shares, the Shares would be delisted. In such a scenario, the Fund would be terminated.
The Lack of An Active Trading Market for the Shares May Result in Losses on Your Investment at the Time of Disposition of Your Shares.
Although the Shares are listed and traded on the NYSE Arca, there can be no guarantee that an active trading market for the Shares will be maintained. If you need to sell your Shares at a time when no active market for them exists, the price you receive for your Shares, assuming that you are able to sell them, likely will be lower than the price you would receive if an active market did exist.
Volatility May Cause the Total Loss of Your Investment.
Futures contracts prices have a high degree of volatility and are subject to rapid and substantial changes. Consequently, there is a risk that the value of your investment in the Fund could decrease significantly due to rapid and substantial changes in the prices of futures contracts held by the Fund. The Index’s average annual volatility since inception is 10.19%. Average annual volatility is the average of the Index’s volatility each year since its inception. Yearly volatility is the relative rate at which the price of the Index moves up and down, found by calculating the annualized standard deviation of the daily change in price for each business day in the given year.
In addition, the Fund enters sell orders with the Commodity Broker from time to time, to liquidate Index Contract positions in order to satisfy redemption requests or to pay expenses and liabilities. The Fund is subject to the risk that temporary aberrations or distortions will occur in the market for Index Contracts at the time those orders are executed. The prices received by the Fund from the liquidation of its positions could be adversely affected, which in turn could adversely affect the value of the Shares. Those aberrations or distortions may result from trading activities by other market participants or actions taken by the Commodity Broker, the CFTC, the exchanges or other regulatory authorities. If the Fund’s positions are liquidated at inopportune times or in a manner that temporarily distorts the market or otherwise causes a pricing aberration, the value of the Shares may be adversely affected.
15
Table of Contents
The Fund’s Trading of Index Contracts May Adversely Affect the Price that the Fund Pays for Index Contracts.
The prices that the Fund pays for Index Contracts may be adversely affected by the trading of Index Contracts by other market participants. Transactions by other market participants may be based on their awareness of the Fund’s positions in Index Contracts. If other market participants are able to anticipate the timing of the Fund’s Index Contract transactions, for instance, they may be able to execute transactions in advance of the Fund. If that were to occur, those market participants may receive more favorable pricing for their Index Contract transactions than the Fund does for its own, subsequent Index Contract transactions. If the Fund’s Index Contract positions represent a significant part of the open long interest in those Index Contracts, moreover, other market participants may take that fact into account and trade in a manner that adversely affects the prices that the Fund obtains when trading Index Contracts. The Fund may not be able to counteract adverse pricing effects of its own positions and transactions in Index Contracts.
Withdrawal from Participation by Authorized Participants May Affect the Liquidity of Shares.
If one or more Authorized Participants withdraws from participation, it may become more difficult to create or redeem Baskets, which may reduce the liquidity of the Shares. If it becomes more difficult to create or redeem Baskets, the correlation between the price of the Shares and the NAV may be affected, which may affect the trading market for the Shares. Having fewer participants in the market for the Shares could also adversely affect the ability to arbitrage any price difference between futures contracts and the Shares, which may also affect the trading market and liquidity of the Shares.
Possible Illiquid Markets May Exacerbate Losses.
Futures positions cannot always be liquidated at the desired price. It is difficult to execute a trade at a specific price when there is a relatively small volume of buy and sell orders in a market. A market disruption, such as when foreign governments may take or be subject to political actions which disrupt
the markets in their currencies or major commodities exports, can also make it difficult to liquidate a position.
Illiquidity may cause losses for the Fund. The large size of the positions which the Fund may acquire increases the risk of illiquidity by both making its positions more difficult to liquidate and increasing the losses incurred while trying to do so.
Trading on Futures Exchanges Outside the United States is Not Subject to U.S. Regulation.
Trading on futures exchanges located outside the United States is not regulated by any United States governmental agency and may involve certain risks not applicable to trading on U.S. exchanges, including different or diminished investor protections. If the Fund trades contracts denominated in currencies other than U.S. dollars, the Fund will be exposed to the risk of adverse exchange-rate movements between the dollar and the currencies in which those contracts are denominated.
In addition, trading on non-U.S. exchanges is subject to the risks presented by exchange controls, expropriation, increased tax burdens and exposure to local economic declines and political instability, among other factors. An adverse development with respect to any of these factors could reduce the profit or increase the loss earned on the Fund’s trades on non-U.S. exchanges.
The Effect of Market Disruptions and Government Interventions Are Unpredictable and May Have an Adverse Effect on the Value of Your Shares.
The commodity futures markets may be subject to temporary distortions due to various factors, including lack of liquidity, congestion, disorderly closing periods, manipulation and disruptive conduct, limitations on deliverable supplies, excessive speculation, government regulation and intervention, technical and operational or system failures, nuclear accidents, terrorism, riots and acts of God.
Government intervention has in certain cases been implemented on an “emergency” basis, suddenly and substantially eliminating market participants’ ability to continue to implement certain
16
Table of Contents
strategies or manage the risk of their outstanding positions. These interventions have typically been unclear in scope and application, resulting in confusion and uncertainty which in itself has been materially detrimental to the efficient functioning of the markets as well as previously successful investment strategies.
The financial crisis of 2008-2009 and associated regulatory changes, including the Dodd-Frank Wall Street Reform and Consumer Protection Act (the “Dodd-Frank Act”), are generally considered to have contributed to less credit being available to financial market participants. This is particularly the case for credit extended by banks and other traditional lending sources. The Fund does not borrow from lenders for the purpose of pursuing its investment objective. Nonetheless, restrictions on the availability of credit may adversely affect investors who borrow to purchase Shares and participants in the markets for financial instruments in which the Fund trades, including futures markets. Limitations on the availability of credit, whether in stressed market conditions or otherwise, may have a material adverse effect on investors and financial market participants, which in turn could affect the Fund’s ability to pursue its investment objective. Among other things, fewer prospective investors may adversely affect the Fund’s asset levels, and fewer financial market participants may reduce liquidity and adversely affect pricing for the financial instruments that the Fund seeks to trade.
The Fund may incur major losses in the event of disrupted markets and other extraordinary events in which historical pricing relationships become materially distorted. The risk of loss from pricing distortions is compounded by the fact that in disrupted markets many positions become illiquid, making it difficult or impossible to close out or liquidate positions against which the markets are moving. The large size of the positions which the Fund may acquire increases the risk of illiquidity by both making its positions more difficult to liquidate and increasing the losses incurred while trying to do so.
An Investment in the Shares May Be Adversely Affected by Competition From Other Methods of Investing in Commodities.
The Fund competes with other financial vehicles, including mutual funds, and other
investment companies, ETFs, other index tracking commodity pools, actively traded commodity pools, hedge funds, traditional debt and equity securities issued by companies in the commodities industry, other securities backed by or linked to commodities, and direct investments in the underlying commodities or commodity futures contracts. Market and financial conditions, and other conditions beyond the Managing Owner’s control, may make it more attractive to invest in other financial vehicles or to invest in such commodities directly, which could limit the market for the Shares and therefore reduce the liquidity of the Shares.
The NAV Calculation of the Fund May Be Overstated or Understated Due to the Valuation Method Employed When a Settlement Price is not Available on the Date of NAV Calculation.
Calculating the NAV of the Fund includes, in part, any unrealized profits or losses on open commodity futures contracts. Under normal circumstances, the NAV of the Fund reflects the settlement price of open commodity futures contracts on the date when the NAV is being calculated. However, if a commodity futures contract traded on an exchange could not be liquidated for any reason on such day, the Managing Owner may value such futures contract pursuant to policies the Managing Owner has adopted. In such a situation, there is a risk that the calculation of the NAV of the Fund on such day will not accurately reflect the realizable market value of such commodity futures contract. For example, daily limits are generally triggered in the event of a significant change in market price of a commodity futures contract. Therefore, as a result of the daily limit, the current settlement price is unavailable. Because the Managing Owner may value such futures contract pursuant to policies the Managing Owner has adopted, there is a risk that the resulting calculation of the NAV of the Fund could be understated or overstated, perhaps to a significant degree.
FUTURES RISKS
Fluctuations in the Price of Assets Held by the Fund Could Have a Material Adverse Effect on the Value of an Investment in Shares.
The Shares are designed to reflect as closely as possible the changes, positive or negative, in the level
17
Table of Contents
of the Index, over time, through the Fund’s portfolio of Index Contracts. The value of the Shares relates directly to the value of the portfolio, less the liabilities (including estimated accrued but unpaid expenses) of the Fund. The price of the Index Commodities may fluctuate widely. Several factors may affect the prices of the Index Commodities, including, but not limited to:
| • | Global supply and demand of each of the Index Commodities, which may be influenced by such factors as forward selling by the various commodities producers, purchases made by the commodities’ producers to unwind their hedge positions and production and cost levels in the major markets of each of the Index Commodities; |
| • | Domestic and foreign interest rates and investors’ expectations concerning interest rates; |
| • | Domestic and foreign inflation rates and investors’ expectations concerning inflation rates; |
| • | Investment and trading activities of mutual funds, ETFs, closed-end funds, hedge funds and commodity funds; |
| • | Weather and other environmental conditions; |
| • | Acts of God; and |
| • | Global or regional political, economic or financial events and situations. |
Fewer Representative Commodities May Result in Greater Index Volatility.
The Index Commodities are Corn, Soybeans, Wheat, Kansas City Wheat, Sugar, Cocoa, Coffee, Cotton, Live Cattle, Feeder Cattle, and Lean Hogs. Other commodity indexes may contain a larger number of commodities than the Index. Accordingly, increased volatility in a single Index Commodity is expected to have a greater impact on the Index’s overall volatility than would likely be the case with increased volatility in a single commodity within a more diversified index. Because the Fund tracks the performance of the Index, your investment in the Fund will be exposed to the relatively greater impact on the Index of volatility in a single Index Commodity.
Because the Futures Contracts Have No Intrinsic Value, the Positive Performance of Your Investment Is Wholly Dependent Upon an Equal and Offsetting Loss.
Trading in futures contracts transfers the risk of future price movements from one market participant to another. For every gain in futures trading, there is an equal and offsetting loss rather than an opportunity to participate over time in general economic growth. Accordingly, the prices of stocks, bonds, and other assets could rise significantly, and the economy as a whole could prosper, while the Fund experiences losses as a result of pursuing its investment objective through trading Index Contracts.
The Fund May Not Provide a Diversification Benefit to Investments in Other Asset Classes and May Result in Additional Losses to Your Portfolio.
Historically, commodity futures returns have tended not to be correlated with the returns of other assets such as stocks and bonds. Commodity futures contracts therefore have the potential to help diversify investor portfolios consisting of stocks and bonds, to the extent there is low or negative correlation between commodity futures contracts and other assets held in those portfolios. However, the fact that the Index is not inversely correlated with other assets such as stocks and bonds means that, in seeking to replicate the performance of the Index, the Fund will not necessarily be profitable during unfavorable periods for the stock or bond markets. If the Shares perform in a manner that correlates with the stock or bond markets or otherwise do not perform successfully, the Shares may not provide any diversification from losses in those markets. In such a scenario, the Shares may produce no gains to offset your losses from investments in stocks, bonds, or related assets and may result in additional losses to your portfolio.
The Fund’s Returns from Futures Trading Will Be Affected by Market Conditions When Replacing Expiring Futures Contracts with New Futures Contracts on Index Commodities.
The Fund’s returns from futures trading are called excess return, which is the combined return based on the spot prices of Index Commodities and the roll yield from trading Index Contracts. Market conditions at the time the Fund replaces expiring Index Contracts with
18
Table of Contents
new Index Contracts – i.e., when Index Contracts are “rolled” – will affect the Fund’s roll yield. Those market conditions are referred to as backwardation and contango, which will generally affect the Fund’s roll yield as set forth below:
| • | Rolling in a backwardated market will tend to enhance returns from futures trading. Backwardation exists when prices are higher for contracts with shorter-term expirations than those with longer-term expirations, a condition that is typically associated with commodities that are consumed quickly instead of being put in storage. |
| • | Rolling in a contangoed market will tend to cause a drag on returns from futures trading. Contango exists when contract prices are higher in distant delivery months than in nearer delivery months, typically due to costs associated with storing a given physical commodity for a longer period. |
In seeking to track the performance of the Index, therefore, the Fund will be exposed to the effects of backwardation and contango when it rolls its positions in Index Contracts. A portion of the Index uses the Optimum YieldTM rolling methodology, which seeks to maximize the roll benefits in backwardated markets and to minimize the losses from rolling in contangoed markets. There can be no assurance that these outcomes will be obtained. In addition, the non-Optimum YieldTM portion of the Index is rolled to the next to expire futures contract without regard to whether the market for a given Index Contract is backwardated or in contango. This portion of the Index will be fully exposed to the potential adverse effects of contango, and will likely fail to capitalize fully on the potential benefits of backwardation, when Index Contracts contained therein are rolled. The impact of backwardation and contango may also cause the Fund’s performance to vary from the returns of other price references, including the spot prices of one or more Index Commodities.
INDEX RISKS
The Fund’s Performance May Not Always Replicate the Changes in the Levels of its Index.
It is possible that the Fund’s performance may not fully replicate the changes in levels of the Index
due to disruptions in the markets for the relevant Index Commodities, the imposition of position limits, or due to other extraordinary circumstances. The Managing Owner may determine to invest in other futures contracts if at any time it is impractical or inefficient to gain full or partial exposure to an Index Commodity through the use of Index Contracts. These other futures contracts may or may not be based on an Index Commodity. When they are not, the Managing Owner may seek to select futures contracts that it reasonably believes tend to exhibit trading prices that correlate with an Index Contract.
As the Fund approaches or reaches position limits with respect to an Index Commodity, the Fund may commence investing in Index Contracts that reference other Index Commodities. In those circumstances, the Fund may also trade in futures contracts based on commodities other than Index Commodities that the Managing Owner reasonably believes tend to exhibit trading prices that correlate with an Index Contract. In addition, the Fund may not be able to replicate the changes in levels of the Index because the total return generated by the Fund is reduced by expenses and transaction costs, including those incurred in connection with the Fund’s trading activities, and increased by, as applicable, Treasury Income, Money Market Income and T-Bill ETF Income held for margin and/or cash management purposes. Tracking the Index requires trading of the Fund’s portfolio with a view to tracking the Index over time and is dependent upon the skills of the Managing Owner and its trading principals, among other factors.
The Fund Is Not Actively Managed and Tracks the Index During Periods in Which the Index Is Flat or Declining as Well as When the Index Is Rising.
The Fund is not actively managed on the basis of judgments relating to economic, financial and market conditions with a view to obtaining positive results under all market conditions. Instead, the Managing Owner seeks to cause the NAV to track the performance of the Index during periods in which the Index is flat or declining as well as when the Index is rising. Therefore, if positions in any one or more of the Index Commodities are declining in value, the Fund will not close out such positions, except in connection with a change in the composition or weighting of the Index.
19
Table of Contents
Unusually Long Peak-to-Valley Drawdown Periods With Respect To the Index May Be Reflected in Equally Long Peak-to-Valley Drawdown Periods with Respect to the Performance of the Shares.
“Peak-to-valley drawdown” represents the cumulative percentage decline in month-end NAV per Share due to losses sustained during any period in which the initial month-end NAV per Share is not equaled or exceeded by a subsequent month-end NAV per Share.
Although past Index levels are not necessarily indicative of future Index levels, the peak-to-valley drawdown periods that the Index has experienced have been unusually long and have lasted for multi-year drawdown periods. Please see the chart on page 33 for information regarding worst peak-to-valley drawdown periods with respect to the Index.
Because it is expected that the Fund’s performance will track the change of its underlying Index, the Fund would experience a continuous drawdown during the period that the Index experiences such a drawdown. The value of your Shares will also decrease during such a period.
REGULATORY RISKS
Regulatory and Exchange Position Limits and Other Rules May Restrict the Creation of Baskets and the Operation of the Fund.
Position Limits. CFTC and futures exchange rules impose position limits on market participants, including the Fund, trading in certain commodity futures contracts. These position limits prohibit any person from holding a position of more than a specific number of futures contracts. Generally, position limits in the physical delivery markets are set at a stricter level during the spot month, which is the month when the futures contract matures and becomes deliverable, versus the limits for any other month or for all months combined. Limits are generally applied on an aggregate basis to positions held in accounts that are subject to 10% or greater common ownership or control. There are exemptions from this general aggregation requirement.
The Index is composed of 11 Index Commodities, which are all subject to position limits
imposed by the CFTC and/or the rules of futures exchanges on which Index Contracts are traded. Currently, position limits (i) for corn, oats, wheat, soybean, soybean oil and cotton are determined by the CFTC and (ii) for all other commodities are determined by the futures exchanges.
The CFTC has been seeking to amend its position limits rules for several years. In November 2013, the CFTC proposed for public comment new position limits and aggregation regulations. After a lengthy comment period on this proposal, the CFTC re-proposed in December 2016 position limits for 25 commodity futures and options contracts, as well as for swaps that are economically equivalent to those contracts. In December 2016, the CFTC adopted rule amendments that provide exemptions from the general requirement to aggregate all positions that are held pursuant to 10% or greater common ownership or control.
The ultimate outcome of this rulemaking effort, and the resulting impact on the Fund of any final regulations that impose new or revised position limits, is unknown. It is also possible that one or more futures exchanges may amend its existing position limits rules or adopt new requirements. In addition, the CFTC could separately implement other changes to specific position limits or to the regime as a whole. New or more restrictive position limits could reduce liquidity in the market, which would be likely to have adverse effects on the pricing of commodity futures contracts. Changes in CFTC and/or exchange-level position limits rules therefore could adversely affect the Fund’s ability to pursue its investment objective or achieve favorable performance.
Position Aggregation. In general, a trader is required by CFTC or exchange rules, as applicable, to aggregate all positions in accounts as to which the trader has 10% or greater ownership or control. CFTC and exchange rules provide exemptions from this requirement. For example, a trader is not required to aggregate positions in multiple accounts that it owns or controls if that trader is able to satisfy the requirements of an exemption from aggregation of those accounts, including, where available, the independent account controller exemption.
Failure to comply with the independent account controller exemption or another exemption from the
20
Table of Contents
aggregation requirement could obligate the Managing Owner to aggregate positions in multiple accounts under its control, which could include the Fund and other commodity pools or accounts under the Managing Owner’s control. In such a scenario, the Fund may not be able to obtain exposure to one or more Index Contracts necessary to pursue its investment objective, or it may be required to liquidate existing Index Contract positions in order to comply with a limit. Such an outcome could adversely affect the Fund’s ability to pursue its investment objective or achieve favorable performance.
The CFTC amended its position aggregation rules in December 2016. The CFTC staff subsequently issued time-limited no-action relief from compliance with certain requirements under the amended aggregation rules, including the general requirement to aggregate positions in the same commodity futures contracts traded pursuant to substantially identical trading strategies. This no-action relief expires on August 12, 2019.
Accountability Levels. Exchanges may establish accountability levels applicable to futures contracts instead of position limits. An exchange may order a person who holds or controls a position in excess of a position accountability level not to further increase its position, to comply with any prospective limit that exceeds the size of the position owned or controlled, or to reduce any open position that exceeds the position accountability level if the exchange determines that such action is necessary to maintain an orderly market. Position accountability levels could adversely affect the Fund’s ability to establish and maintain positions in commodity futures contracts to which such levels apply, if the Fund were to trade in such contracts. Such an outcome could adversely affect the Fund’s ability to pursue its investment objective or achieve favorable performance.
Daily Limits. U.S. futures exchanges and some foreign exchanges have regulations that limit the amount of fluctuation in futures contract prices that may occur during a single business day. These limits are generally referred to as “daily price fluctuation limits” or “daily limits,” and the maximum or minimum price of a contract on any given day as a result of these limits is referred to as a “limit price.”
Once a limit price has been reached in a particular contract, it is usually the case that no trades may be made at a different price than specified in the limit. The duration of limit prices generally varies. Limit prices may have the effect of precluding the Fund from trading in a particular contract or requiring the Fund to liquidate contracts at disadvantageous times or prices. Either of those outcomes could adversely affect the Fund’s ability to pursue its investment objective or achieve favorable performance.
Potential Effects of Positions Limits, Accountability Levels, and Daily Limits. The Fund is currently subject to position limits and may be subject to new and more restrictive position limits in the future. If the Fund reached a position limit or accountability level or became subject to a price limit, it would not be able to issue new Baskets or reinvest income in additional commodity futures contracts to the extent these restrictions limit its ability to establish new futures positions, add to existing positions, or otherwise transact in futures. Limiting the size of the Fund, or restricting the Fund’s futures trading, under these requirements could adversely affect the Fund’s ability to pursue its investment objective or achieve favorable performance.
Failure of Futures Commission Merchants or Commodity Brokers to Segregate Assets May Increase Losses; Despite Segregation of Assets, the Fund Remains at Risk of Significant Losses Because the Fund May Only Receive a Pro-Rata Share of the Assets or No Assets at All.
The Commodity Exchange Act requires a futures commission merchant to segregate all funds received from customers from such futures commission merchant’s proprietary assets. If the Commodity Broker fails to segregate customer assets as required, the assets of the Fund might not be fully protected in the event of the Commodity Broker’s bankruptcy. Furthermore, in the event of the Commodity Broker’s bankruptcy, the Fund could be limited to recovering either a pro rata share of all available funds segregated on behalf of the Commodity Broker’s combined customer accounts or the Fund may not recover any assets at all, even though certain property specifically traceable to the Fund was held by the Commodity Broker.
21
Table of Contents
The Commodity Exchange Act requires an approved derivatives clearing organization to segregate all funds and other property received from a clearing member’s customers in connection with U.S. futures and options contracts from any funds held at the clearing organization to support the clearing member’s proprietary trading. Nevertheless, customer funds held at a clearing organization in connection with any futures or options contracts may be held in a commingled omnibus account, which may not identify the name of the clearing member’s individual customers. With respect to futures and options contracts, a clearing organization may use assets of a non-defaulting customer held in an omnibus account at the clearing organization to satisfy payment obligations of a defaulting customer of the clearing member to the clearing organization. In the event of a default of the clearing futures commission merchant’s other clients or the clearing futures commission merchant’s failure to extend its own funds in connection with any such default, a customer may not be able to recover the full amount of assets deposited by the clearing futures commission merchant with the clearing organization on the customer’s behalf.
In the event of a bankruptcy or insolvency of any exchange or a clearing house, the Fund could experience a loss of the funds deposited through the Commodity Broker as margin with the exchange or clearing house, a loss of any unrealized profits on its open positions on the exchange, and the loss of unrealized profits on its closed positions on the exchange.
Regulatory Changes or Actions, Including the Implementation of the Dodd-Frank Act, May Alter the Operations and Profitability of the Fund.
The regulation of commodity interest transactions and markets, including under the Dodd-Frank Act, is a rapidly changing area of law and is subject to ongoing modification by governmental and judicial action. In particular, the Dodd-Frank Act has expanded the regulation of markets, market participants and financial instruments. The regulatory regime under the Dodd-Frank Act has imposed additional compliance and legal burdens on participants in the markets for futures and other commodity interests. For example, under the Dodd-Frank Act new capital and risk requirements have
been imposed on market intermediaries. Those requirements may cause the cost of trading to increase for market participants, like the Fund, that must interact with those intermediaries to carry out their trading activities. These increased costs can detract from the Fund’s performance.
The Fund is Subject to Extensive Regulatory Reporting and Compliance.
The Fund is subject to a comprehensive scheme of regulation under the federal commodity futures trading and securities laws. The Fund could be subject to sanctions for a failure to comply with those requirements, which could adversely affect the Fund’s financial performance (in the case of financial penalties) or ability to pursue its investment objective (in the case of a limitation on its ability to trade).
Because the Shares are publicly traded, the Fund is subject to certain rules and regulations of federal, state and financial market exchange entities charged with the protection of investors and the oversight of companies whose securities are publicly traded. These entities, including the Public Company Accounting Oversight Board (the “PCAOB”), the SEC, the CFTC and NYSE-ARCA, have in recent years issued new requirements and regulations, most notably the Sarbanes-Oxley Act of 2002. From time to time, since the adoption of the Sarbanes-Oxley Act of 2002, these authorities have continued to develop additional regulations or interpretations of existing regulations. The Fund’s ongoing efforts to comply with these regulations and interpretations have resulted in, and are likely to continue resulting in, a diversion of management’s time and attention from revenue-generating activities to compliance related activities.
The Fund is responsible for establishing and maintaining adequate internal control over financial reporting. The Fund’s internal control system is designed to provide reasonable assurance to its management regarding the preparation and fair presentation of published financial statements. All internal control systems, no matter how well designed, have inherent limitations. Therefore, even those systems determined to be effective may provide only reasonable assurance with respect to financial statement preparation and presentation.
22
Table of Contents
Current Discussions between the SEC and PricewaterhouseCoopers LLP regarding PricewaterhouseCoopers LLP’s Independence Could Have Potentially Adverse Consequences for the Fund.
PricewaterhouseCoopers LLP informed the Fund that it has identified an issue related to its independence under Rule 2-01(c)(1)(ii)(A) of Regulation S-X (referred to as the Loan Rule). The Loan Rule prohibits accounting firms, such as PricewaterhouseCoopers LLP, from being deemed independent if they have certain financial relationships with their audit clients or certain affiliates of those clients. The Fund is required under various securities laws to have its financial statements audited by an independent accounting firm.
The Loan Rule specifically provides that an accounting firm would not be independent if it or certain affiliates and covered persons receive a loan from a lender that is a record or beneficial owner of more than ten percent of an audit client’s equity securities (referred to as a “more than ten percent owner”). For purposes of the Loan Rule, audit clients include the Fund as well as all registered investment companies advised by the Managing Owner and its affiliates, including other subsidiaries of the Managing Owner’s parent company, Invesco Ltd. (collectively, the “Invesco Fund Complex”). PricewaterhouseCoopers LLP informed the Fund it and certain affiliates and covered persons have relationships with lenders who hold, as record owner, more than ten percent of the shares of certain funds within the Invesco Fund Complex, which may implicate the Loan Rule.
On June 20, 2016, the SEC Staff issued a “no-action” letter to another mutual fund complex (see Fidelity Management & Research Company et al., No-Action Letter) related to the audit independence issue described above. In that letter, the SEC confirmed that it would not recommend enforcement action against a fund that relied on audit services performed by an audit firm that was not in compliance with the Loan Rule in certain specified circumstances. On May 2, 2018, the SEC proposed amendments to the Loan Rule that, if adopted as proposed, would address many of the issues that led to issuance of the no-action letter. In connection with prior independence determinations,
PricewaterhouseCoopers LLP communicated, as contemplated by the no-action letter, that it believes that it remains objective and impartial and that a reasonable investor possessing all the facts would conclude that PricewaterhouseCoopers LLP is able to exhibit the requisite objectivity and impartiality to report on the Fund’s financial statements as the independent registered public accounting firm. PricewaterhouseCoopers LLP also represented that it has complied with PCAOB Rule 3526(b)(1) and (2), which are conditions to the Funds relying on the no action letter, and affirmed that it is an independent accountant within the meaning of PCAOB Rule 3520. Therefore, the Managing Owner, the Fund and PricewaterhouseCoopers LLP concluded that PricewaterhouseCoopers LLP could continue as the Fund’s independent registered public accounting firm. The Invesco Fund Complex relied upon the no-action letter in reaching this conclusion.
If in the future the independence of PricewaterhouseCoopers LLP is called into question under the Loan Rule by circumstances that are not addressed in the SEC’s no-action letter, the Fund will need to take other action in order for the Fund’s filings with the SEC containing financial statements to be deemed compliant with applicable securities laws. Such additional actions could result in additional costs, impair the ability of the Fund to issue new shares or have other material adverse effects on the Fund. The SEC no-action relief was initially set to expire eighteen (18) months from issuance but has been extended by the SEC without an expiration date, except that the no-action letter will be withdrawn upon the effectiveness of any amendments to the Loan Rule designed to address the concerns expressed in the letter.
TAX RISKS
Shareholders Will Be Subject to Taxation on Their Allocable Share of the Fund’s Taxable Income, Whether or Not They Receive Cash Distributions.
Shareholders will be subject to U.S. federal income taxation and, in some cases, state, local, or foreign income taxation on their allocable share of the Fund’s taxable income, whether or not they receive cash distributions from the Fund. Shareholders may not receive cash distributions equal
23
Table of Contents
to their share of the Fund’s taxable income or even the tax liability that results from such income.
Items of Income, Gain, Loss and Deduction With Respect to Shares Could Be Reallocated if the IRS Does Not Accept the Assumptions or Conventions Used by the Fund in Allocating Such Items.
U.S. federal income tax rules applicable to partnerships are complex and often difficult to apply to publicly traded partnerships. The Fund will apply certain assumptions and conventions in an attempt to comply with applicable rules and to report items of income, gain, loss and deduction to Shareholders in a manner that reflects the Shareholders’ beneficial interest in such tax items, but these assumptions and conventions may not be in compliance with all aspects of the applicable tax requirements. It is possible that the United States Internal Revenue Service (the “IRS”) will successfully assert that the conventions and assumptions used by the Fund do not satisfy the technical requirements of the Internal Revenue Code of 1986, as amended (the “Code”), and/or the Federal Tax Regulations codified under 26 C.F.R., referred to herein as the Treasury Regulations, and could require that items of income, gain, loss and deduction be adjusted or reallocated in a manner that adversely affects one or more Shareholders.
The Tax Cuts and Jobs Act (the “Tax Act”) Makes Significant Changes to U.S. Federal Income Tax Rules.
The Tax Act makes significant changes to the U.S. federal income tax rules for taxation of individuals and corporations, generally effective for taxable years beginning after December 31, 2017. Most of the changes applicable to individuals are temporary and would apply only to taxable years beginning after December 31, 2017 and before January 1, 2026. In particular, for individuals, the Tax Act establishes for taxable years beginning after December 31, 2017 and before January 1, 2026 a 20% deduction for “qualified publicly traded partnership income” within the meaning of Section 199A(e)(5) of the Code. In general, “qualified publicly traded partnership income” for this purpose is an item of income, gain, deduction or loss that is effectively connected with a United States trade or business and includable income for the year,
but does not include certain investment income. It is currently not expected that the Fund’s income will be eligible for such deduction because as discussed below, although the matter is not free from doubt, the Fund believes that the activities directly conducted by the Fund will not result in the Fund being engaged in a trade or business with the United States. Potential investors should consult their tax advisors regarding the availability of such deduction for their allocable share of the Fund’s items of income, gain, deduction and loss.
PROSPECTIVE INVESTORS ARE STRONGLY URGED TO CONSULT THEIR OWN TAX ADVISORS AND COUNSEL WITH RESPECT TO THE POSSIBLE TAX CONSEQUENCES TO THEM OF AN INVESTMENT IN THE SHARES; SUCH TAX CONSEQUENCES MAY DIFFER WITH RESPECT TO DIFFERENT INVESTORS.
OTHER RISKS
An Insolvency Resulting From Another Series of the Trust or the Trust Itself May Have a Material Adverse Effect on the Fund.
This Fund is a series of a Delaware statutory trust. Pursuant to Delaware law, the organization of the Trust provides that the assets and liabilities of this Fund are separate from the assets and liabilities of the other series of the Trust, as well as the Trust itself. Although such organization may, under state law, protect the assets of the Fund in an insolvency action brought by the creditors of one or more of the series of the Trust, this may be insufficient to protect the assets of the Fund from such creditors in an insolvency action in federal court, or in a court in a foreign jurisdiction. Accordingly, an insolvency resulting from one or more of the other series of the Trust or the Trust itself may have a material adverse effect on the Fund.
Disruptions in the Ability to Create and Redeem Baskets May Adversely Affect Investors.
It is generally expected that the public trading price per Share will track the NAV per Share closely over time. The relationship between the public trading price per Share and the NAV per Share depends, to a considerable degree, on the ability of Authorized Participants or their clients or customers
24
Table of Contents
to purchase and redeem Baskets in the ordinary course. If the process for creating or redeeming Shares is impaired for any reason, Authorized Participants and their clients or customers may not be able to purchase and redeem Baskets or, even if possible, may choose not to do so. The inability to purchase and redeem Baskets, or the partial impairment of the ability to purchase and redeem Baskets, could result in Shares trading at a premium or discount to the NAV of the Fund. Such a premium or discount could be significant, depending upon the nature or duration of the impairment.
If the Fund were to issue all Shares registered in this offering, it would not be able to create new Baskets until it registered additional Shares and those additional Shares became available for sale. An inability to create new Baskets could increase the possibility that the trading price per Share would not track closely the NAV per Share. In addition, the Fund may, in its discretion, suspend the creation of Baskets. Suspension of creations may adversely affect how the Shares are traded and could cause Shares to trade at a premium or discount to the NAV of the Fund, perhaps to a significant degree.
The Shares Could Decrease in Value if Unanticipated Operational or Trading Problems Arise.
The mechanisms and procedures governing the creation, redemption and offering of the Shares have been developed specifically for the Fund. Consequently, there may be unanticipated problems with respect to the mechanics of the operations of the Fund and the trading of the Shares that could have a material adverse effect on an investment in the Shares. To the extent that unanticipated operational or trading problems arise, the Managing Owner’s past experience and qualifications may not be suitable for solving those problems.
Historical Performance of the Fund and the Index is Not Indicative of Future Performance.
Past performance of the Fund or the Index is not necessarily indicative of future results. Therefore, past performance of the Fund or the Index should not be relied upon in deciding whether to buy Shares of the Fund.
Fees and Expenses May Deplete the Fund’s Assets if the Fund’s Investment Performance is Not Favorable.
The Fund pays fees and expenses regardless of its investment performance. Such fees and expenses include asset-based fees of 0.85% per annum. Additional charges include brokerage fees of approximately 0.04% per annum in the aggregate and selling commissions. Selling commissions are not included in the Fund’s breakeven calculation. The sum of the Fund’s Treasury Income, Money Market Income and/or T-Bill ETF Income may not exceed its fees and expenses. If such income does not exceed its fees and expenses, in order to break even, the Fund’s futures trading activity will need to have a favorable performance that exceeds the difference between the sum of the Fund’s Treasury Income, Money Market Income and/or T-Bill ETF Income and its fees and expenses. If the Fund’s futures trading performance is not sufficiently favorable, the Fund’s expenses could deplete its assets over time. In such a scenario, the value of your Shares will decrease.
There may be circumstances that could prevent the Fund from being operated in a manner consistent with its investment objective.
There may be circumstances outside the control of the Managing Owner and/or the Fund that make it, for all practical purposes, impossible to re-position the Fund and/or to process a purchase or redemption order. Examples of such circumstances include: natural disasters; public service disruptions or utility problems such as those caused by fires, floods, extreme weather conditions, and power outages resulting in telephone, telecopy, and computer failures; market conditions or activities causing trading halts; systems failures involving computer or other information systems affecting the aforementioned parties, as well as DTC, or any other participant in the purchase process, and similar extraordinary events. While the Managing Owner has established and implemented a disaster recovery plan, circumstances such as those identified above may prevent the Fund from being operated in a manner consistent with its investment objective.
25
Table of Contents
You May Be Adversely Affected by Redemption Orders that Are Subject To Postponement, Suspension or Rejection Under Certain Circumstances.
The Managing Owner may, in its discretion, suspend the right of redemption or postpone the redemption order settlement date, for (1) any period during which an emergency exists as a result of which the redemption distribution is not reasonably practicable, or (2) such other period as the Managing Owner determines to be necessary for the protection of the Shareholders. In addition, the Fund will reject a redemption order if the order is not in proper form as described in the participant agreement with the Authorized Participant, or if the fulfillment of the order, in the opinion of its counsel, might be unlawful. Any such postponement, suspension or rejection could adversely affect a redeeming Authorized Participant. For example, the resulting delay may adversely affect the value of the Authorized Participant’s redemption proceeds if the NAV of the Fund declines during the period of delay. The Fund disclaims any liability for any loss or damage that may result from any such suspension or postponement.
Shareholders Do Not Have the Protections Associated With Ownership of Shares in an Investment Company Registered Under the Investment Company Act of 1940.
The Fund is not registered as an investment company under the Investment Company Act of 1940, as amended. Consequently, Shareholders do not have the legal and regulatory protections provided to the investors in investment companies that are registered as such.
Shareholders Do Not Have the Rights Enjoyed by Investors in Certain Other Vehicles.
As interests in separate series of a Delaware statutory trust, the Shares have none of the statutory rights normally associated with the ownership of shares of a corporation. However, under Delaware law, a beneficial owner of a business trust (such as a Shareholder) may, under certain circumstances, institute legal action on behalf of himself and all other similarly situated beneficial owners to recover damages from a third party where a managing owner
has failed or refused to institute legal action on behalf of himself and all other similarly situated beneficial owners to recover damages from a managing owner for violations of fiduciary duties, or on behalf of a business trust to recover damages from a third party where a managing owner has failed or refused to institute proceedings to recover such damages. The Shares have limited voting and distribution rights (for example, Shareholders do not have the right to elect directors and the Fund is not required to pay regular distributions, although the Fund may pay distributions in the discretion of the Managing Owner).
Various Actual and Potential Conflicts of Interest May Be Detrimental to Shareholders.
The Fund is subject to actual and potential conflicts of interest involving the Managing Owner or any of its affiliates, the Commodity Broker, including its principals and its affiliates, the Index Sponsor and Marketing Agent, and Invesco Distributors. The Managing Owner and its principals, all of whom are engaged in other investment activities, are not required to devote substantially all of their time to the business of the Fund, which also presents the potential for numerous conflicts of interest with the Fund. The Managing Owner and its principals and affiliates are engaged in a broad array of asset management and financial services activities and may engage in activities during the ordinary course of business that cause their interests or those of their other clients to conflict with those of the Fund and its Shareholders.
As a result of these and other relationships, parties involved with the Fund have a financial incentive to act in a manner other than in the best interests of the Fund and the Shareholders. For example, by investing in affiliated money market mutual funds and/or T-Bill ETFs for margin and/or cash management purposes, the Managing Owner may select affiliated money market mutual funds and/or T-Bill ETFs that may pay dividends that are lower than non-affiliated money market mutual funds and/or T-Bill ETFs. In addition, the Managing Owner would have a conflict of interest if it sought to redeem the Fund’s interest in an affiliated money market mutual fund or T-Bill ETF in circumstances where such a redemption would be unfavorable for the affiliated fund. The Managing Owner has not established any formal procedure to resolve conflicts
26
Table of Contents
of interest. Consequently, investors are dependent on the good faith of the respective parties subject to such conflicts to resolve them equitably. Although the Managing Owner attempts to monitor these conflicts, it is extremely difficult, if not impossible, for the Managing Owner to ensure that these conflicts do not, in fact, result in adverse consequences to the Fund and the Shareholders.
The Fund may be subject to certain conflicts with respect to the Commodity Broker, including, but not limited to, conflicts that result from receiving greater amounts of compensation from other clients, or purchasing opposite or competing positions on behalf of third party accounts traded through the Commodity Broker.
Because the Managing Owner and Invesco Distributors are affiliates, the Managing Owner has a disincentive to replace Invesco Distributors. Furthermore, the Managing Owner did not conduct an arm’s length negotiation when it retained Invesco Distributors.
Lack of Independent Advisers Representing Investors.
The Managing Owner has consulted with counsel, accountants and other advisers regarding the operation of the Fund. No counsel has been appointed to represent you in connection with the Fund’s continuous offering of Shares. Accordingly, you should consult your own legal, tax and financial advisers about whether you should invest in the Fund.
Possibility of Termination of the Fund May Adversely Affect Your Portfolio.
It is ultimately within the discretion of the Managing Owner whether it will continue to operate and advise the Fund. The Managing Owner may withdraw from the Fund upon 120 days’ prior written notice to all Shareholders and the Trustee, which would cause the Fund to terminate unless a substitute managing owner was obtained. Shareholders owning 50% or more of the Shares have the power to terminate the Fund. If it is so exercised, investors who may wish to continue to invest in a vehicle that tracks the Fund’s Index will have to find another vehicle, and may not be able to find another vehicle that offers the same features as the Fund. See
“Description of the Shares; The Fund; Certain Material Terms of the Trust Agreement – Termination Events” for a summary of termination events. Such detrimental developments could cause you to liquidate your investments and upset the overall maturity and timing of your investment portfolio. If the registrations with the CFTC or memberships in the NFA of the Managing Owner or the Commodity Broker were revoked or suspended, such entity would no longer be able to provide services to the Fund.
Competing Claims Over Ownership of Intellectual Property Rights Related to the Fund Could Adversely Affect the Fund and an Investment in the Shares.
While the Managing Owner believes that all intellectual property rights needed to operate the Fund in the manner described in this Prospectus are either owned by or licensed to the Managing Owner or have been obtained, third parties may allege or assert ownership of intellectual property rights which may be related to the design, structure and operations of the Fund. To the extent any claims of such ownership are brought or any proceedings are instituted to assert such claims, the issuance of any restraining orders or injunctions, the negotiation, litigation or settlement of such claims, or the ultimate disposition of such claims in a court of law may adversely affect the Fund and an investment in the Shares. For example, such actions could result in expenses or damages payable by the Fund, suspension of activities or the termination of the Fund.
The Value of the Shares Will be Adversely Affected if the Fund is Required to Indemnify the Trustee or the Managing Owner.
Under the Trust Agreement, the Trustee and the Managing Owner have the right to be indemnified for any liability or expense they incur, except for any expenses resulting from gross negligence or willful misconduct. That means the Managing Owner may require the assets of the Fund to be sold in order to cover losses or liability suffered by it or by the Trustee. Any sale of that kind would reduce the NAV of the Fund and, consequently, the value of the Shares.
27
Table of Contents
Although the Shares are Limited Liability Investments, Certain Circumstances such as Bankruptcy of the Fund or Indemnification of the Fund by the Shareholders will Increase a Shareholder’s Liability.
The Shares are limited liability investments; investors may not lose more than the amount that they invest including any appreciation in their investments. However, Shareholders could be required, as a matter of bankruptcy law, to return to the estate of the Fund any distribution they received at a time when the Fund was in fact insolvent or in violation of the Trust Agreement. In addition, Shareholders agree in the Trust Agreement that they will indemnify the Fund for any harm suffered by it as a result of:
| • | Shareholders’ actions unrelated to the business of the Fund, or |
| • | taxes imposed on the Shares by the states or municipalities in which such investors reside. |
The Fund May Lose Money on its Holdings of Money Market Mutual Funds.
The Funds may invest in government money market funds that have chosen to not rely on the ability to impose fees on shareholder redemptions, or liquidity fees, or temporarily to suspend redemption privileges, or gates, if the government money market fund’s weekly liquid assets fall below a certain threshold. Although such government money market funds seek to preserve the value of an investment at $1.00 per share, there is no guarantee that they will be able to do so. As a result, the Funds may lose money by investing in a government money market fund. An investment in a government money market fund is not insured or guaranteed by the Federal Deposit Insurance Corporation (“FDIC”) or any other government agency. The share price of a government money market fund can fall below the $1.00 share price. The Funds cannot rely on or expect a government money market fund’s adviser or its affiliates to enter into support agreements or take other actions to maintain the government money market fund’s $1.00 share price. The credit quality of a government money market fund’s holdings can change rapidly in certain markets, and the default of a single holding could have an adverse impact on the government money market fund’s share price. Due to
fluctuations in interest rates, the market value of securities held by a government money market fund may vary. A government money market fund’s share price can also be negatively affected during periods of high redemption pressures and/or illiquid markets.
Due to the Increased use of Technologies, Intentional and Unintentional Cyber Attacks Pose Operational and Information Security Risks.
With the increased use of technologies such as the Internet and the dependence on computer systems to perform necessary business functions, the Fund is susceptible to operational and information security risks. In general, cyber incidents can result from deliberate attacks or unintentional events. Cyber attacks include, but are not limited to gaining unauthorized access to digital systems for purposes of misappropriating assets or sensitive information, corrupting data, or causing operational disruption.
Cyber attacks may also be carried out in a manner that does not require gaining unauthorized access, such as causing denial-of-service attacks on websites. Cyber security failures or breaches of the Fund’s third party service providers (including, but not limited to, Index Sponsor, the Administrator and transfer agent) or the issuers of the money market mutual funds and T-Bill ETFs in which the Fund invests, have the ability to cause disruptions and impact business operations, potentially resulting in financial losses, the inability of Fund shareholders to transact business, violations of applicable privacy and other laws, regulatory fines, penalties, reputational damage, reimbursement or other compensation costs, and/or additional compliance costs. In addition, substantial costs may be incurred in order to prevent any cyber incidents in the future. The Fund and its shareholders could be negatively impacted as a result.
While the Managing Owner has established business continuity plans and systems to prevent such cyber attacks, there are inherent limitations in such plans and systems including the possibility that certain risks have not been identified. Furthermore, the Fund cannot control the cyber security plans and systems put in place by the Fund’s third party service providers. Cyber attacks may also cause disruptions to the futures exchanges and clearinghouses through which the Fund invests in exchange-traded futures
28
Table of Contents
contracts, resulting in disruptions to the Fund’s investment objectives and resulting in financial losses.
This Prospectus includes forward-looking statements that reflect the Managing Owner’s current expectations about the future results, performance, prospects and opportunities of the Fund. The Managing Owner has tried to identify these forward-looking statements by using words such as “may,” “will,” “expect,” “anticipate,” “believe,” “intend,” “should,” “estimate” or the negative of those terms or similar expressions. These forward-looking statements are based on information currently available to the Managing Owner and are subject to a number of risks, uncertainties and other factors, both known, such as those described in “Risk Factors” and elsewhere in this Prospectus, and unknown, that could cause the actual results, performance, prospects or opportunities of the Fund to differ materially from those expressed in, or implied by, these forward-looking statements.
You should not place undue reliance on any forward-looking statements. Except as expressly required by the federal securities laws, the Managing Owner undertakes no obligation to publicly update or revise any forward-looking statements or the risks, uncertainties or other factors described in this Prospectus, as a result of new information, future events or changed circumstances or for any other reason after the date of this Prospectus.
The Fund seeks to track changes, whether positive or negative, in the level of the Index over time, plus the excess, if any, of the sum of the Fund’s Treasury Income, Money Market Income and T-Bill ETF Income over the expenses of the Fund. The Fund invests in futures contracts in an attempt to track its Index. The Fund holds Treasury Securities, money market mutual funds and T-Bill ETFs for margin and/or cash management purposes only and the Fund’s performance reflects the appreciation or depreciation of such securities.
The Shares are designed for investors who want a cost-effective and convenient way to invest in a diversified index of commodity futures.
Advantages of investing in the Fund include:
| • | Ease and Flexibility of Investment. The Shares trade on the NYSE Arca and provide institutional and retail investors with indirect access to commodity futures markets. The Shares may be bought and sold on the NYSE Arca like other exchange-listed securities. Retail investors may purchase and sell Shares through traditional brokerage accounts. |
| • | Margin. Shares are eligible for margin accounts. |
| • | Diversification. The Shares may help to diversify a portfolio of investments in stocks, bonds, and related assets to the extent there is low to negative correlation between those asset classes and the performance of the Index. |
| • | Optimum Yield™. A portion of the Index utilizes an Optimum Yield™ methodology, which seeks to minimize the effects of negative roll yield that may be experienced by other commodities indexes. “Negative roll yield” is a term that describes the adverse impact of an upward-sloping price curve for futures contracts, which makes it more expensive to replace expiring contracts with new contracts. |
| • | Transparency. The Shares provide a more direct investment in commodities than mutual funds or ETFs that invest in commodity-linked notes or otherwise gain indirect exposure to commodities, which may have implicit imbedded costs, credit risk and other potentially opaque features. |
Investing in the Fund does not insulate Shareholders from certain risks, including price volatility.
The Shares are intended to provide investment results that generally correspond to changes, positive or negative, in the levels of the Index over time. The value of the Shares is expected to fluctuate in relation to changes in the value of its portfolio. The market price of the Shares may not be identical to the NAV per Share, but these two valuations are expected to be very close. See “Risk Factors – NAV May Not Always Correspond to Market Price and, as a Result,
29
Table of Contents
Baskets May be Created or Redeemed at a Value that Differs from the Market Price of the Shares.”
The Fund pursues its investment objective by investing in a portfolio of exchange-traded futures on the Index Commodities. The Index is intended to reflect the agricultural sector. The Index Commodities consist of Corn, Soybeans, Wheat, Kansas City Wheat, Sugar, Cocoa, Coffee, Cotton, Live Cattle, Feeder Cattle and Lean Hogs.
The Fund trades Index Contracts that are subject to position limits under regulations of the CFTC or futures exchange rules, as applicable. As the Fund approaches or reaches position limits with respect to an Index Commodity, the Fund may commence investing in Index Contracts that reference other Index Commodities. In those circumstances, the Fund may also trade in futures contracts based on commodities other than Index Commodities that the Managing Owner reasonably believes tend to exhibit trading prices that correlate with an Index Contract. The Managing Owner may determine to invest in other futures contracts if at any time it is impractical or inefficient to gain full or partial exposure to an Index Commodity through the use of Index Contracts. These other futures contracts may or may not be based on an Index Commodity. When they are not, the Managing Owner seeks to select futures contracts that it reasonably believes tend to exhibit trading prices that correlate with an Index Contract.
Under the Fifth Amended and Restated Declaration of Trust and Trust Agreement of the Trust, as amended (the “Trust Agreement”), the Managing Owner has exclusive management and control of all aspects of the business of the Fund. The Trustee’s duties and liabilities with respect to the offering of the Shares and the management of the Fund are limited to its express obligations under the Trust Agreement. The Trustee will have no duty or liability to supervise or monitor the performance of the Managing Owner, nor will the Trustee have any liability for the acts or omissions of the Managing Owner.
There can be no assurance that the Fund will achieve its investment objective or avoid substantial losses.
Role of Managing Owner
The Managing Owner serves as the commodity pool operator and commodity trading advisor of the Fund.
Specifically, with respect to the Fund, the Managing Owner:
| • | selects the Trustee, Commodity Broker, Administrator, Index Sponsor, Custodian, Transfer Agent, Marketing Agent, distributor and auditor; |
| • | negotiates various agreements and fees; |
| • | performs such other services as the Managing Owner believes that the Fund may from time-to-time require; and |
| • | monitors the performance results of the Fund’s portfolio and reallocates assets within the portfolio with a view to causing the performance of the Fund’s portfolio to track that of the Index over time. |
The Managing Owner is registered as a commodity pool operator and commodity trading advisor with the CFTC and is a member of the NFA. The Managing Owner is an NFA-approved swap firm.
The principal office of the Managing Owner is located at c/o Invesco Capital Management LLC, 3500 Lacey Road, Suite 700, Downers Grove, IL 60515. The telephone number of the Managing Owner is (800) 983-0903.
The estimated amount of all fees and expenses which are anticipated to be incurred by a new investor in Shares during the first twelve months of investment is 0.89% per annum of the NAV of the Fund as of July 31, 2018, or $0.16 per annum per Share at $17.58, including the amount of any commissions charged by the investor’s broker.
The Fund will be successful only if its annual returns from futures trading, plus its annual Treasury Income, Money Market Income and T-Bill ETF Income exceed such fees and expenses of approximately 0.89% per annum. The Fund is
30
Table of Contents
expected to earn Treasury Income equal to 2.00% per annum, based upon the yield of 3-month Treasury Securities as of July 31, 2018, or a maximum of $0.35 per annum per Share at $17.58 as the NAV per Share. The Fund is also expected to earn Money Market Income equal to 2.01% per annum as of July 31, 2018, or a maximum of $0.35 per annum per Share at $17.58 as the NAV per Share. The Fund is also expected to earn T-Bill ETF Income equal to 2.01% per annum as of July 31, 2018, or a maximum of $0.35 per annum per Share at $17.58 as the NAV per Share. Because the Fund holds a portion of its assets in Treasury Securities, the money market mutual funds and T-Bill ETFs, its expected income from each of those holdings will be approximately $0.28, $0.02 and $0.04, respectively, for an aggregate amount of approximately $0.34 per Share at $17.58 as the NAV per Share as of July 31, 2018. Therefore, based upon the difference between the sum of the Treasury Income, the Money Market Income and the T-Bill ETF Income, on the one hand, and the annual fees and expenses, on the other hand, the Fund will break even during the first twelve months of an investment, unless the Fund loses at least approximately 1.04% per annum, or $0.18 per annum per Share at $17.58 as the NAV per Share as of July 31, 2018.
Breakeven Table
The Breakeven Table on the following page indicates the approximate percentage and dollar returns required for the value of an initial $17.58 investment in a Share to equal the amount originally invested twelve months after issuance, based on the NAV per Share as of July 31, 2018.
[Remainder of page left blank intentionally.]
31
Table of Contents
BREAKEVEN TABLE
The Breakeven Table, as presented, is an approximation only. Because a constant NAV per Share has been assumed, the actual capitalization of the Fund does not directly affect the level of its charges as a percentage of its NAV.
| Dollar Amount and Percentage of Expenses
and Interest Income |
||||||
| DBA1 | ||||||
| Expense |
$ | % | ||||
| Management Fee2 |
$ 0.15 | 0.85 % | ||||
| Offering Expense Reimbursement |
$ 0.00 | 0.00 % | ||||
| Brokerage Commissions and Fees3 |
$ 0.01 | 0.04 % | ||||
| Routine Operational, Administrative and Other Ordinary Expenses4,5 |
$ 0.00 | 0.00 % | ||||
| Treasury Income, Money Market Income and T-Bill ETF Income6 |
$ 0.34 | 1.93 % | ||||
| 12-Month Breakeven7,8 |
$ 0.00 | 0.00 % | ||||
| 1. | The breakeven analysis set forth in this table assumes that the Shares have a constant month-end NAV per Share of $17.58, the NAV per Share as of July 31, 2018. See the “Charges” section for an explanation of the expenses included in the Breakeven Table. The Managing Owner pays a marketing services fee to the Marketing Agent and an index services fee to the Index Sponsor. Because the marketing services fee and the index services fee are not paid by the Fund, these fees are not included in the breakeven analysis. |
| 2. | The Managing Owner is responsible for paying the fees and expenses of the Administrator, Invesco Distributors, the Index Sponsor and the Marketing Agent from its own assets. |
| The Fund may, for margin and/or cash management purposes, invest in money market mutual funds and/or T-Bill ETFs that are managed by affiliates of the Managing Owner. The indirect portion of the management fees that the Fund may incur through such investments are in addition to the Management Fee paid to the Managing Owner. The Managing Owner has contractually agreed indefinitely to waive the fees that it receives in an amount equal to the indirect management fees that the Fund incurs through its investments in affiliated money market mutual funds and/or affiliated T-Bill ETFs. The Managing Owner may terminate this waiver on 60 days notice. |
| As of the date of this prospectus, this waiver is approximately less than $0.01 per Share per annum. |
| 3. | The actual amount of brokerage commissions and trading fees to be incurred will vary based upon the trading frequency of the Fund and the specific futures contracts traded. |
| 4. | The Managing Owner is responsible for paying all routine operational, administrative and other ordinary expenses of the Fund. |
| 5. | Authorized Participants pay a transaction fee in the amount of $500 per order to create and redeem Baskets and are subject to an additional processing charge for failure to timely deliver such orders. Because these transaction fees are de minimis in amount, are charged on a transaction-by-transaction basis (and not on a Basket-by-Basket basis), and are borne by the Authorized Participants, they have not been included in the Breakeven Table. |
| 6. | As of July 31, 2018, Treasury Income is estimated to be earned at a rate of 2.00%, Money Market Income is estimated to be earned at a rate of 2.01%, and T-Bill ETF Income is estimated to be earned at a rate of 2.01%. Actual Treasury Income, Money Market Income and T-Bill ETF Income could be higher or lower than the levels shown. |
| 7. | The table indicates that the breakeven amount during the first 12 months of an investment in the Fund is $0.00 and 0% of NAV. These figures reflect that, during those first 12 months, the Fund’s Treasury Income, Money Market Income, and T-Bill ETF Income are expected to exceed the Fund’s fees and expenses. As disclosed earlier in the Fund’s breakeven analysis, the Fund will break even unless it loses at least approximately 1.04% per annum, or $0.18 per annum per Share at $17.58 as the NAV per Share as of July 31, 2018. |
| 8. | You may pay brokerage commissions in connection with purchases of the Shares. Brokerage commissions have not been included in the Breakeven Table because they are borne by investors rather than the Fund and will generally vary from investor to investor. Investors are encouraged to review the terms of their brokerage accounts for applicable charges. |
32
Table of Contents
PERFORMANCE OF INVESCO DB AGRICULTURE FUND (TICKER: DBA), A SERIES OF INVESCO DB MULTI-SECTOR COMMODITY TRUST
Name of Pool: Invesco DB Agriculture Fund
Type of Pool: Public, Exchange-Listed Commodity Pool
Inception of Trading: January 2007
Aggregate Gross Capital Subscriptions as of July 31, 20181: $9,931,835,896
NAV as of July 31, 20182: $625,817,271
NAV per Share as of July 31, 20183: $17.58
Worst Monthly Drawdown4: (8.09)% July 2015
Worst Peak-to-Valley Drawdown5: (56.99)% February 2008 – July 20186
| Monthly Rate of Return |
2018(%) | 2017(%) | 2016(%) | 2015(%) | 2014(%) | 2013(%) | ||||||
| January |
0.48 | 2.20 | (3.10) | (6.77) | 1.61 | (0.39) | ||||||
| February |
1.86 | (1.03) | (0.25) | (0.43) | 10.86 | (5.24) | ||||||
| March |
(2.03) | (2.28) | 3.05 | (3.99) | 3.66 | (1.82) | ||||||
| April |
2.34 | 0.10 | 2.23 | (0.59) | 3.28 | 0.96 | ||||||
| May |
(0.21) | 1.01 | 1.38 | (1.98) | (5.33) | (2.33) | ||||||
| June |
(6.14) | (0.65) | 3.28 | 7.10 | (0.90) | (2.62) | ||||||
| July |
(2.50) | 0.30 | (6.40) | (8.09) | (2.29) | (1.04) | ||||||
| August |
(6.28) | (1.89) | (2.79) | (1.48) | 1.83 | |||||||
| September |
1.55 | (1.04) | 0.10 | (3.42) | 0.96 | |||||||
| October |
2.64 | 2.50 | 1.67 | 0.57 | (0.91) | |||||||
| November |
(1.85) | (2.73) | (3.48) | (0.55) | (0.96) | |||||||
| December |
(1.68) | 0.05 | 0.78 | (2.81) | (2.29) | |||||||
| Compound Rate of Return7 |
(6.29)% | (6.11%) | (3.34)% | (16.75)% | 2.24% | (13.19)% |
PAST PERFORMANCE IS NOT NECESSARILY INDICATIVE OF FUTURE RESULTS.
Footnotes to Performance Information
1. “Aggregate Gross Capital Subscriptions” is the aggregate of all amounts ever contributed to the Fund, including investors who subsequently redeemed their investments.
2. “NAV” is the NAV of the Fund as of July 31, 2018.
3. “NAV per Share” is the NAV of the Fund divided by the total number of Shares outstanding as of July 31, 2018.
4. “Worst Monthly Drawdown” is the largest single month loss sustained during the most recent five calendar years and year to date (if applicable). “Drawdown” as used in this section of the Prospectus means losses experienced by the Fund over the specified period and is calculated on a rate of return basis, i.e., dividing net performance by beginning equity. “Drawdown” is measured on the basis of monthly returns only, and does not reflect intra-month figures. “Month” is the month of the Worst Monthly Drawdown.
5. “Worst Peak-to-Valley Drawdown” is the largest percentage decline in the NAV per Share during the most recent five calendar years (and to the extent applicable, for a period beyond the most recent five calendar years if the starting date of the peak value extends beyond this period). This need not be a continuous decline, but can be a series of positive and negative returns where the negative returns are larger than the positive returns. “Worst Peak-to-Valley Drawdown” represents the greatest percentage decline from any month-end NAV per Share that occurs without such month-end NAV per Share being equaled or exceeded as of a subsequent month-end. For example, if the NAV per Share of the Fund declined by $1 in each of January and February, increased by $1 in March and declined again by $2 in April, a “peak-to-valley drawdown” analysis conducted as of the end of April would consider that “drawdown” to be still continuing and to be $3 in amount, whereas if the NAV per Share had increased by $2 in March, the January-February drawdown would have ended as of the end of February at the $2 level.
6. The Worst Peak-to-Valley Drawdown from February 2008 — July 2018 reflects the total return of the Fund, including the $0.45 per Share distribution made to Shareholders of record as of December 17, 2008. Prior to October 19, 2009, the Fund tracked the Deutsche Bank Liquid Commodity Index-Optimum Yield Agriculture Excess Return™. From October 19, 2009 until January 1, 2011, the Fund tracked the Deutsche Bank Liquid Commodity Index Diversified Agriculture Excess Return™. On January 1, 2011, the Deutsche Bank Liquid Commodity Index Diversified Agriculture Excess Return™ changed its name to the name of the Index. The only difference between the Deutsche Bank Liquid Commodity Index Diversified Agriculture Excess Return™ and the Index is a name change.
7. “Compound Rate of Return” of the Fund is calculated by multiplying on a compound basis each of the monthly rates of return set forth in the chart above and not by adding or averaging such monthly rates of return. For periods of less than one year, the results are year-to-date.
THE FUND’S PERFORMANCE INFORMATION FROM INCEPTION UP TO AND EXCLUDING FEBRUARY 23, 2015 IS A REFLECTION OF THE PERFORMANCE ASSOCIATED WITH THE FUND’S PREDECESSOR MANAGING OWNER. ALL THE PERFORMANCE INFORMATION ON AND AFTER FEBRUARY 23, 2015 REFLECTS THE PERFORMANCE ASSOCIATED WITH THE MANAGING OWNER.
[Remainder of page left blank intentionally.]
33
Table of Contents
DESCRIPTION OF THE DBIQ DIVERSIFIED AGRICULTURE INDEX EXCESS RETURN™
The Invesco DB Agriculture Fund (the “Fund”) is not sponsored or endorsed by Deutsche Bank AG, Deutsche Investment Management Americas Inc. or any subsidiary or affiliate of Deutsche Bank AG or Deutsche Investment Management Americas Inc. (collectively, “Deutsche Bank”). The DBIQ Diversified Agriculture Index Excess Return™ (the “DB Index”) is the exclusive property of Deutsche Investment Management Americas Inc. “DBIQ” and “Optimum Yield” are service marks of Deutsche Bank AG and have been licensed for use for certain purposes by Deutsche Investment Management Americas Inc. Neither Deutsche Bank nor any other party involved in, or related to, making or compiling the DB Index makes any representation or warranty, express or implied, concerning the DB Index, the Fund or the advisability of investing in securities generally. Neither Deutsche Bank nor any other party involved in, or related to, making or compiling the DB Index has any obligation to take the needs of Invesco Capital Management LLC, the sponsor of the Fund, or its clients into consideration in determining, composing or calculating the DB Index. Neither Deutsche Bank nor any other party involved in, or related to, making or compiling the DB Index is responsible for or has participated in the determination of the timing of, prices at, quantities or valuation of the Fund. Neither Deutsche Bank nor any other party involved in, or related to, making or compiling the DB Index has any obligation or liability in connection with the administration or trading of the Fund.
NEITHER DEUTSCHE BANK NOR ANY OTHER PARTY INVOLVED IN, OR RELATED TO, MAKING OR COMPILING THE DB INDEX, WARRANTS OR GUARANTEES THE ACCURACY AND/OR THE COMPLETENESS OF THE DB INDEX OR ANY DATA INCLUDED THEREIN AND SHALL HAVE NO LIABILITY FOR ANY ERRORS, OMISSIONS, OR INTERRUPTIONS THEREIN. NEITHER DEUTSCHE BANK NOR ANY OTHER PARTY INVOLVED IN, OR RELATED TO, MAKING OR COMPILING THE DB INDEX, MAKES ANY WARRANTY, EXPRESS OR IMPLIED, AS TO RESULTS TO BE OBTAINED BY INVESCO CAPITAL MANAGEMENT LLC FROM THE USE OF THE DB INDEX OR ANY DATA INCLUDED THEREIN. NEITHER DEUTSCHE BANK NOR ANY
OTHER PARTY INVOLVED IN, OR RELATED TO, MAKING OR COMPILING THE DB INDEX, MAKES ANY EXPRESS OR IMPLIED WARRANTIES, AND EXPRESSLY DISCLAIMS ALL WARRANTIES, OF MERCHANTABILITY OR FITNESS FOR A PARTICULAR PURPOSE OR USE WITH RESPECT TO THE DB INDEX OR ANY DATA INCLUDED THEREIN. WITHOUT LIMITING ANY OF THE FOREGOING, IN NO EVENT SHALL DEUTSCHE BANK OR ANY OTHER PARTY INVOLVED IN, OR RELATED TO, MAKING OR COMPILING THE DB INDEX HAVE ANY LIABILITY FOR DIRECT, INDIRECT, PUNITIVE, SPECIAL, CONSEQUENTIAL OR ANY OTHER DAMAGES OR LOSSES (INCLUDING LOST PROFITS), EVEN IF NOTIFIED OF THE POSSIBILITY THEREOF. EXCEPT AS EXPRESSLY PROVIDED TO THE CONTRARY, THERE ARE NO THIRD PARTY BENEFICIARIES OF ANY AGREEMENTS OR ARRANGEMENTS BETWEEN DEUTSCHE BANK AND INVESCO CAPITAL MANAGEMENT LLC.
No purchaser, seller or holder of the shares of this Fund, or any other person or entity, should use or refer to any Deutsche Bank trade name, trademark or service mark to sponsor, endorse, market or promote this Fund without first contacting Deutsche Bank to determine whether Deutsche Bank’s permission is required. Under no circumstances may any person or entity claim any affiliation with Deutsche Bank without the written permission of Deutsche Bank.
General
The Index is calculated on an excess return, or unfunded basis. The Index is rolled on both an Optimum Yield™ and non-Optimum Yield™ basis. The Optimum Yield™ rolling methodology is aimed at potentially maximizing the roll benefits in backwardated markets and minimizing the losses from rolling in contangoed markets. The non-Optimum Yield™ portion of the Index is rolled to the next to expire futures contract as provided below under “Contract Selection (Non-OY Single Commodity Indexes only).” The Index is comprised of one or more Index Commodities. Each Index Commodity is assigned an Index Base Weight, which is intended to reflect the proportion of such Index Commodity relative to the Index.
34
Table of Contents
The Index is intended to reflect the agricultural sector.
The Index has been calculated back to the Base Date. On the Base Date of January 18, 1989, the closing level of the Index (“Closing Level”) was 100.
The Index Sponsor is DIMA. The Index Sponsor may from time-to-time subcontract the provision of the calculation and other services described below to one or more third parties.
35
Table of Contents
Overview of DBIQ Diversified Agriculture Index Excess Return™
| Index Commodity | Exchange (Contract Symbol)1 | Base Date | Index Base Weight | |||
|
Corn2 |
CBOT (C) | January 18, 1989 | 12.50% | |||
| Soybeans2 |
CBOT (S) | 12.50% | ||||
|
Wheat2 |
CBOT (W) | 6.25% | ||||
| Kansas City Wheat2 |
KCB (KW) | 6.25% | ||||
|
Sugar2 |
ICE-US (SB) | 12.50% | ||||
|
Cocoa3 |
ICE-US (CC) | 11.11% | ||||
| Coffee3 |
ICE-US (KC) | 11.11% | ||||
| Cotton3 |
ICE-US (CT) | 2.78% | ||||
| Live Cattle3 |
CME (LC) | 12.50% | ||||
| Feeder Cattle3 |
CME (FC) | 4.17% | ||||
| Lean Hogs3 |
CME (LH) | 8.33% |
| 1 | Connotes the exchanges on which the underlying futures contracts are traded with respect to each Single Commodity Index. |
| 2 | Connotes Single Commodity Index rolled on Optimum Yield™ basis. |
| 3 | Connotes non-OY Single Commodity Index. |
Legend:
“CBOT” means the Board of Trade of the City of Chicago Inc., or its successor.
“CME” means the Chicago Mercantile Exchange, Inc., or its successor.
“ICE-US” means ICE Futures U.S., Inc., or its successor.
“KCB” mean the Board of Trade of Kansas City, Missouri, Inc., a part of the CME Group, or its successor.
[Remainder of page left blank intentionally.]
-36-
Table of Contents
Composition of the Index
The Index is designed to be composed of notional amounts of the Index Commodities. The notional amounts of the Index Commodities included in the Index are intended to reflect the changes in market value of each such Index Commodity within the Index.
The Index is rebalanced annually in November to ensure that each of the Index Commodities is weighted in the same proportion that such Index Commodities were weighted on the Base Date.
The composition of the Index may be adjusted in the event that the Index Sponsor is not able to calculate the closing prices of the Index Commodities.
The Index methodology includes provisions for the replacement of futures contracts as they approach maturity. This replacement takes place over a period of time in order to lessen the impact on the market for the futures contracts being replaced. With respect to each Index Commodity, the Fund employs a rule-based approach when it ‘rolls’ from one futures contract to another. The Index is comprised of OY Single Commodity Indexes and non-OY Single Commodity Indexes. The Index Commodities that underlie the OY Single Commodity Indexes are Corn, Soybeans, Wheat, Kansas City Wheat and Sugar. The Index Commodities that underlie the non-OY Single Commodity Indexes are Cocoa, Coffee, Cotton, Live Cattle, Feeder Cattle and Lean Hogs. The OY Single Commodity Indexes are rolled from one contract to another futures contract that is intended to generate the most favorable “implied roll yield” under prevailing market conditions. Where there is an upward-sloping price curve for futures contracts, the implied roll yield is expected to be negative. The selection of a new futures contract on an Index Commodity in such market conditions is designed to minimize the impact of negative roll yield. Conversely, where there is a downward-sloping price curve for futures contracts, the implied roll yield is expected to be positive. The selection of a new futures contract on an Index Commodity in such market conditions is designed to maximize the impact of positive roll yield. The OY Single Commodity Indexes take the impact of implied roll yield into consideration by selecting, as the replacement for an expiring futures contract, the
futures contract with a delivery month within the next thirteen months that generates the most favorable implied roll yield under current market conditions.
The market condition in which the Index is designed to maximize the effect of positive roll yield when entering into new futures contracts is called backwardation. Backwardation exists when prices are higher for contracts with shorter-term expirations than those with longer-term expirations, a condition that is typically associated with commodities that are consumed quickly instead of being put in storage. Rolling in a backwardated market will tend to enhance returns from futures trading.
The market condition in which the Index is designed to mitigate the effect of negative roll yield when entering into new futures contracts is called contango. Contango exists when contract prices are higher in distant delivery months than in nearer delivery months, typically due to costs associated with storing a given physical commodity for a longer period. Rolling in a contangoed market will tend to cause a drag on returns from futures trading.
Each of the non-OY Single Commodity Indexes rolls only to the next to expire futures contract as provided below under “Contract Selection (Non-OY Single Commodity Indexes only)”.
Returns from futures trading are called excess return, which is the combined return based on the spot prices of Index Commodities and the roll yield from trading Index Contracts.
The Managing Owner may determine to invest in other futures contracts if at any time it is impractical or inefficient to gain full or partial exposure to an Index Commodity through the use of Index Contracts. These other futures contracts may or may not be based on an Index Commodity. When they are not, the Managing Owner may seek to select futures contracts that it reasonably believes tend to exhibit trading prices that correlate with an Index Contract. In addition, as the Fund approaches or reaches position limits with respect to an Index Commodity, the Fund may commence investing in Index Contracts that reference other Index Commodities. In those circumstances, the Fund may also trade in futures contracts based on commodities other than Index Commodities that the Managing Owner reasonably believes tend to exhibit trading prices that correlate with an Index Contract.
37
Table of Contents
The Index is calculated in USD on an excess return (unfunded) basis, which means that the Index reflects the return associated with spot prices for Index Commodities and the roll yield associated with trading Index Contracts. The Fund also invests in securities that are expected to generate income, including Treasury Securities, money market mutual funds, and T-Bill ETFs. These securities are held with the Custodian. In addition, Treasury Securities for deposit may be held with the Commodity Broker as margin for the Fund’s futures positions. The Index does not reflect any corresponding income characteristics.
The futures contract price for each Index Commodity will be the exchange closing price for such Index Commodity on a day on which the relevant exchange is open for business (“Index Business Day”). If a weekday is not an Exchange Business Day (as defined in the following sentence) but is an Index Business Day, the exchange closing price from the previous Index Business Day will be used for each Index Commodity. “Exchange Business Day” means, in respect of an Index Commodity, a day that is a trading day for such Index Commodity on the relevant exchange (unless either an Index disruption event or force majeure event has occurred).
Contract Selection (OY Single Commodity Indexes only)
On the Verification Date, each Index Commodity futures contract will be tested in order to determine whether to continue including it in the applicable OY Single Commodity Index. If the Index Commodity futures contract requires delivery of the underlying commodity in the next month, known as the Delivery Month, a new Index Commodity futures contract will be selected for inclusion in such OY Single Commodity Index. For example, if the first Index Business Day is May 1 of the current year, and the Delivery Month of the Index Commodity futures contract currently in such OY Single Commodity Index is June of the current year, a new Index Commodity futures contract with a later Delivery Month will be selected.
For each underlying Index Commodity of an OY Single Commodity Index, the new Index Contract selected will be the Index Contract with the best possible “implied roll yield” based on the closing
price for each eligible Index Contract. Eligible Index Contracts are any Index Contracts having a Delivery Month (i) no sooner than the month after the Delivery Month of the Index Contract currently in such OY Single Commodity Index, and (ii) no later than the thirteenth month after the Verification Date. For example, if the first Index Business Day is May 1 of the current year and the Delivery Month of an Index Contract currently in an OY Single Commodity Index is therefore June of the current year, the Delivery Month of an eligible new Index Contract must be between July of the current year and June of the following year. The implied roll yield is calculated and the futures contract on the Index Commodity with the best possible implied roll yield under the current market conditions is selected. If two futures contracts have the same implied roll yield, the futures contract with the fewest number of months prior to the Delivery Month is selected.
After selection of the replacement futures contract, each OY Single Commodity Index will roll such replacement futures contract as provided in the sub-paragraph “Monthly Index Roll Period with respect to both OY Single Commodity Indexes and Non-OY Single Commodity Indexes.”
[Remainder of page left blank intentionally.]
38
Table of Contents
Contract Selection (Non-OY Single Commodity Indexes only)
On the first Index Business Day of each month, each non-OY Single Commodity Index will select a new futures contract to replace the old futures contract as provided in the following schedule.
|
Contract |
Exchange (Symbol) |
Jan | Feb | Mar | Apr | May | Jun | Jul | Aug | Sep | Oct | Nov | Dec | |||||||||||||||||||||||||||||||||||||
| Cocoa |
ICE-US (CC) | H | K | K | N | N | U | U | Z | Z | Z | H | H | |||||||||||||||||||||||||||||||||||||
| Coffee |
ICE-US (KC) | H | K | K | N | N | U | U | Z | Z | Z | H | H | |||||||||||||||||||||||||||||||||||||
| Cotton |
ICE-US (CT) | H | K | K | N | N | Z | Z | Z | Z | Z | H | H | |||||||||||||||||||||||||||||||||||||
| Live Cattle |
CME (LC) | J | J | M | M | Q | Q | V | V | Z | Z | G | G | |||||||||||||||||||||||||||||||||||||
| Feeder Cattle |
CME (FC) | H | J | K | Q | Q | Q | U | V | X | F | F | H | |||||||||||||||||||||||||||||||||||||
| Lean Hogs |
CME (LH) | J | J | M | M | N | Q | V | V | Z | Z | G | G | |||||||||||||||||||||||||||||||||||||
| Month and Letter Codes | ||
| Month | Letter Code | |
|
January |
F | |
|
February |
G | |
|
March |
H | |
|
April |
J | |
|
May |
K | |
|
June |
M | |
|
July |
N | |
|
August |
Q | |
|
September |
U | |
|
October |
V | |
|
November |
X | |
|
December |
Z | |
After selection of the replacement futures contract, each non-OY Single Commodity Index will roll such replacement futures contract as provided in the sub-paragraph “Monthly Index Roll Period with respect to both OY Single Commodity Indexes and Non-OY Single Commodity Indexes.”
[Remainder of page left blank intentionally.]
39
Table of Contents
Monthly Index Roll Period with respect to both OY Single Commodity Indexes and Non-OY Single Commodity Indexes
After the futures contract selection with respect to both OY Single Commodity Indexes and non-OY Single Commodity Indexes, the monthly roll for each Index Commodity subject to a roll in that particular month unwinds the old futures contract and the new futures contract is established. This takes place between the second and sixth Index Business Day of the month.
On each day during the roll period, new notional holdings are calculated. The calculations for the Index Contracts that are leaving the Index and for the new Index Contracts that are being added to the Index are then calculated. On all days that are not monthly index roll days, the notional holdings of each Index Contract remains constant.
The Index is re-weighted on an annual basis on the sixth Index Business Day of each November. The calculation of the Index is expressed as the weighted average return of the Index Commodities.
Change in the Methodology of the Index
The Index Sponsor employs the methodology described above and its application of such methodology shall be final. The Index Sponsor can change its methodology at any time for any reason, as it deems appropriate.
The Index Sponsor may also make adjustments to the terms of the Index in any manner, including (without limitation) to correct any manifest or proven error or to cure, correct or supplement any defective provision of the Index. The Index Sponsor will publish notice of any such adjustment and the effective date thereof as set forth below.
Publication of Closing Levels and Adjustments
In order to calculate the indicative Index level, the Index Sponsor polls Reuters every 15 seconds to determine the real time price of each underlying futures contract with respect to each Index Commodity of the Index. The Index Sponsor then applies a set of rules to these values to create the indicative level of the Index. These rules are
consistent with the rules that the Index Sponsor applies at the end of each trading day to calculate the closing level of the Index.
The IIV per Share is based on the prior day’s final NAV, adjusted four times per minute throughout the trading day to reflect the continuous price changes of the Fund’s futures positions, which provides a continuously updated estimated NAV per Share.
The Index Sponsor calculates and publishes the closing level of the Index daily. The Managing Owner publishes the NAV of the Fund and the NAV per Share daily. The Index Sponsor also calculates and publishes the intra-day Index level, and the Index Sponsor calculates, and the Managing Owner publishes, the IIV per Share (quoted in U.S. dollars) once every fifteen seconds throughout each trading day.
All of the foregoing information is published as follows:
The intra-day level of the Index (symbol: DBAGIX) and the IIV per Share (symbol: DBA.IV) (each quoted in U.S. dollars) are published once every fifteen seconds throughout each trading day on the consolidated tape, Reuters and/or Bloomberg and on the Managing Owner’s website at www.invesco.com/ETFs, or any successor thereto.
The current trading price per Share (symbol: DBA) (quoted in U.S. dollars) is published continuously as trades occur throughout each trading day on the consolidated tape, Reuters and/or Bloomberg and on the Managing Owner’s website at www.invesco.com/ETFs, or any successor thereto.
The most recent end-of-day Index closing level (symbol: DBLCDBAE) is published as of the close of business for the NYSE Arca each trading day on the consolidated tape, Reuters and/or Bloomberg and on the Managing Owner’s website at www.invesco.com/ETFs, or any successor thereto.
The most recent end-of-day NAV of the Fund (symbol: DBA.NV) is published as of the close of business on Reuters and/or Bloomberg and on the Managing Owner’s website at www.invesco.com/ETFs, or any successor thereto. In addition, the most recent end-of-day NAV of the Fund (symbol:
40
Table of Contents
DBA.NV) is published the following morning on the consolidated tape.
All of the foregoing information with respect to the Index, including the Index’s history, is also published at https://index.db.com.
Any adjustments made to the Index will be published on both https://index.db.com and at www.invesco.com/ETFs, or any successor(s) thereto.
The Index Sponsor obtains information for inclusion in, or for use in the calculation of, the Index from sources the Index Sponsor considers reliable. None of the Index Sponsor, the Managing Owner, the Fund or any of their respective affiliates accepts responsibility for or guarantees the accuracy and/or completeness of the Index or any data included in the Index.
Interruption of Index Calculation
Calculation of the Index may not be possible or feasible under certain events or circumstances, including, without limitation, a systems failure, natural or man-made disaster, act of God, armed conflict, act of terrorism, riot or labor disruption or any similar intervening circumstance, that is beyond the reasonable control of the Index Sponsor and that the Index Sponsor determines affects the Index or any Index Commodity. Upon the occurrence of such an event, the Index Sponsor may, in its discretion, elect one (or more) of the following options:
| • | make such determinations and/or adjustments to the terms of the Index as it considers appropriate to determine any closing level on any such Index Business Day; and/or |
| • | defer publication of the information relating to the Index until the next Index Business Day on which it determines that no force majeure event exists; and/or |
| • | permanently cancel publication of the information relating to the Index. |
Calculation of the Index may also be disrupted by an event that would require the Index Sponsor to calculate the closing price in respect of the relevant Index Commodity on an alternative basis were such event to occur or exist on a day that is a trading day
for futures contracts in such Index Commodity on the relevant exchange. If such an Index disruption event occurs and continues for a period of five successive trading days, the Index Sponsor will, in its discretion, either:
| • | continue to calculate the relevant closing price for a further period of five successive trading days for such Index Commodity on the relevant exchange; or |
| • | if such period extends beyond the five successive trading days, the Index Sponsor may elect to replace the futures contract with respect to such Index Commodity and shall make all necessary adjustments to the methodology and calculation of the Index as it deems appropriate. |
Historical Closing Levels
The Closing Level Tables present closing levels for the Index (“Closing Levels”) since January 2008. The historical data shown with respect to the closing prices of futures contracts on Feeder Cattle (FC), Cotton #2 (CT), Coffee (KC), Cocoa (CC), Live Cattle (LC), Lean Hogs (LH), Corn (C), Wheat (W), Soybeans (S), Sugar #11 (SB) and Kansas City Wheat (KW) originated from Reuters. The Index Sponsor has not independently verified the information extracted from this source.
The Closing Level Tables are also presented for DBIQ Diversified Agriculture Index Total ReturnTM, which has the same components as the Index.
Complete price histories regarding certain futures contracts on the Index Commodities were not available (e.g., due to lack of trading on specific days). In the event that prices on such futures contracts on the Index Commodities were unavailable during a contract selection day, such futures contracts were excluded from the futures contract selection process. The Index Sponsor believes that the incomplete price histories should not have a material impact on the calculation of the Index.
The Index Closing Level is equal to the weighted sum of the market value of the commodity futures contracts of all the respective Index Commodities that comprise the Index. The market value of the commodity futures contracts of an Index Commodity is equal to the number of commodity
41
Table of Contents
futures contracts multiplied by the commodity futures contracts’ closing price. The weight of an Index Commodity is the market value of the commodity futures contracts of the Index Commodity divided by the sum of all market values of all commodity futures contracts of the Index Commodities that comprise an Index, multiplied by 100%.
The Index rules stipulate the holding in each Index Commodity futures contract. Holdings in each Index Commodity change during the Index rebalancing periods as determined by the Optimum Yield™ roll rules and the non-Optimum Yield™ roll rules, as applicable.
Cautionary Statement-Statistical Information
Various statistical information is presented on the following pages, relating to the Closing Levels of the Index, on an annual and cumulative basis, including certain comparisons of the Index to other commodities indices. Changes in Closing Levels of the Index during any particular period or market cycle may be volatile. In addition, the Closing Levels of the Index do not reflect any reduction commensurate with the fees, expenses and other costs incurred by the Fund in connection with pursuing its investment objective. For additional information, see “Risk Factors – Volatility May Cause the Total Loss of Your Investment.”
The Index was established in September 2009 and is independently calculated by the Index Sponsor. The calculation methodology and commodity futures contract selection for the Index has been the same since the Index was established in September 2009, meaning that the same calculation method and contract selection have been used since the Base Date. Accordingly, the Closing Levels of the Index, terms of the Index methodology and Index Commodities, reflect an element of hindsight based on the calculations and selections made at the time the Index was established. See “Risk Factors – Historical Performance of the Fund and the Index is Not Indicative of Future Performance” and “Risk Factors – Fewer Representative Commodities May Result in Greater Index Volatility.”
Information on the Index’s components and its performance over time is included below. No representation is being made that the Index will or is
likely to achieve annual or cumulative closing levels consistent with or similar to those set forth herein. Similarly, no representation is being made that the Fund will generate profits or losses similar to the Index’s past performance or the historical annual or cumulative changes in Index closing levels. The Index’s performance should not be understood as a substitute for information on the Fund’s performance. Please see “PERFORMANCE OF INVESCO DB AGRICULTURE FUND (TICKER: DBA)” for a discussion of the Fund’s performance.
Prior to October 19, 2009, the Fund tracked the Deutsche Bank Liquid Commodity Index-Optimum Yield Agriculture Excess Return™. From October 19, 2009 until January 1, 2011, the Fund tracked the Deutsche Bank Liquid Commodity Index Diversified Agriculture Excess Return™. On January 1, 2011, the Deutsche Bank Liquid Commodity Index Diversified Agriculture Excess Return™ changed its name to the name of the Index. The only difference between the Deutsche Bank Liquid Commodity Index Diversified Agriculture Excess Return™ and the Index is a name change.
[Remainder of page left blank intentionally.]
42
Table of Contents
CLOSING LEVELS TABLES
DBIQ DIVERSIFIED AGRICULTURE INDEX EXCESS RETURN™
| CLOSING LEVEL | INDEX CHANGES | |||||||||||||||
| High1 | Low2 | Annual3 | Since Inception4 | |||||||||||||
|
2008 |
123.53 | 71.21 | -19.22 | % | -17.42 | % | ||||||||||
| 2009 |
87.40 | 72.91 | 4.18 | % | -13.97 | % | ||||||||||
| 2010 |
105.23 | 74.69 | 22.32 | % | 5.23 | % | ||||||||||
| 2011 |
114.93 | 90.14 | -10.68 | % | -6.01 | % | ||||||||||
| 2012 |
100.65 | 84.22 | -2.14 | % | -8.02 | % | ||||||||||
| 2013 |
92.12 | 80.70 | -12.26 | % | -19.30 | % | ||||||||||
| 2014 |
97.66 | 80.26 | 3.30 | % | -16.63 | % | ||||||||||
| 2015 |
84.35 | 68.34 | -15.86 | % | -29.86 | % | ||||||||||
| 2016 |
78.05 | 66.53 | -2.86 | % | -31.86 | % | ||||||||||
| 2017 |
71.26 | 61.95 | -6.06 | % | -35.99 | % | ||||||||||
| 20185 |
67.01 | 58.71 | -6.65 | % | -40.25 | % | ||||||||||
THE PRIOR INDEX LEVELS AND CHANGES TO THE INDEX LEVELS SHOWN ABOVE DO NOT REPRESENT THE FUND’S PERFORMANCE AND ARE NOT INDICATIVE OF THE FUND’S FUTURE PERFORMANCE. THE INDEX DOES NOT REFLECT ANY FEES OR EXPENSES ASSOCIATED WITH OPERATING A FUND OR ACTUAL TRADING.
Please refer to the “Notes” section below.
[Remainder of page left blank intentionally.]
43
Table of Contents
The Index Sponsor also maintains a separate index, DBIQ Diversified Agriculture Index Total Return (“DBIQ Diversified Agriculture TR™”) which the Fund does not track. DBIQ Diversified Agriculture TR™ is calculated on a funded (total return) basis, which reflects the change in market value of the underlying index commodities and interest income from a hypothetical basket of fixed income securities. DBIQ Diversified Agriculture TR™ is included so that investors can evaluate an index with both futures and income components, as the Fund tracks the Index and expects to generate income from positions in Treasury Securities, money market funds, and/or T-Bill ETFs that are maintained for margin and/or cash management purposes.
DBIQ Diversified Agriculture TR™ reflects the change in the market value of the same underlying commodities as the Index. DBIQ Diversified Agriculture TR™ and the Index each reflect those changes on both an optimum yield and non-optimum yield basis. OY Single Commodity Indexes are calculated to reflect the rolling of futures contracts in a manner that seeks to generate the best possible implied roll yield under the current market conditions. Each of the Non-OY Single Commodity Indexes rolls only to the next to expire futures contract as provided below under “Contract Selection (Non-OY Single Commodity Indexes only)”.
CLOSING LEVELS TABLES
DBIQ DIVERSIFIED AGRICULTURE INDEX TOTAL RETURN™
| CLOSING LEVEL | INDEX CHANGES | |||||||||||||||
| High1 | Low2 | Annual3 | Since Inception4 | |||||||||||||
|
2008 |
285.15 | 166.00 | -18.09 | % | 92.50 | % | ||||||||||
| 2009 |
204.74 | 177.70 | 4.91 | % | 101.95 | % | ||||||||||
| 2010 |
245.99 | 175.42 | 21.80 | % | 145.99 | % | ||||||||||
| 2011 |
268.73 | 210.82 | -10.64 | % | 119.81 | % | ||||||||||
| 2012 |
235.53 | 197.03 | -2.06 | % | 115.29 | % | ||||||||||
| 2013 |
215.61 | 189.01 | -12.21 | % | 89.01 | % | ||||||||||
| 2014 |
228.74 | 187.97 | 3.33 | % | 95.30 | % | ||||||||||
| 2015 |
197.61 | 160.15 | -15.82 | % | 64.40 | % | ||||||||||
| 2016 |
183.14 | 155.98 | -2.55 | % | 60.21 | % | ||||||||||
| 2017 |
167.61 | 146.94 | -5.18 | % | 51.92 | % | ||||||||||
| 20185 |
159.47 | 140.63 | -5.69 | % | 43.28 | % | ||||||||||
THE FUND DOES NOT TRACK DBIQ DIVERSIFIED AGRICULTURE INDEX TOTAL RETURN™.
THE PRIOR INDEX LEVELS AND CHANGES TO THE INDEX LEVELS SHOWN ABOVE DO NOT REPRESENT THE FUND’S PERFORMANCE AND ARE NOT INDICATIVE OF THE FUND’S FUTURE PERFORMANCE. THE INDEX SHOWN DOES NOT REFLECT ANY FEES OR EXPENSES ASSOCIATED WITH OPERATING A FUND OR ACTUAL TRADING.
Please refer to the “Notes” section below.
[Remainder of page left blank intentionally.]
44
Table of Contents
The following table presents various measures of performance for the Index (“DBIQ Diversified Agriculture ERTM), DBIQ Diversified Agriculture TRTM, and S&P GSCI Agriculture Index Total Return, which is a broad-based commodity index. The S&P GSCI Agriculture Index Total Return has been included to provide investors with an additional basis for evaluating the Fund.
All statistics based on data from January 18, 1989 to July 31, 2018.
| VARIOUS STATISTICAL MEASURES |
DBIQ Diversified Agriculture TR™ |
DBIQ Diversified Agriculture ER™ |
S&P GSCI Agriculture Index Total Return |
|||||||||
| Annualized Changes to Index Level6 |
1.2 | % | -1.7 | % | -2.5 | % | ||||||
| Average rolling 3 month daily volatility7 |
11.8 | % | 11.8 | % | 16.6 | % | ||||||
| Sharpe Ratio8 |
-0.15 | -0.15 | -0.34 | |||||||||
| % of months with positive change9 |
49 | % | 46 | % | 46 | % | ||||||
| Average monthly positive change10 |
2.9 | % | 2.8 | % | 4.2 | % | ||||||
| Average monthly negative change11 |
-2.5 | % | -2.5 | % | -3.7 | % | ||||||
|
ANNUALIZED INDEX LEVELS12 |
DBIQ Diversified Agriculture TR™ |
DBIQ Diversified Agriculture ER™ |
S&P GSCI Agriculture Index Total Return |
|||||||||
| 1 year |
-10.7 | % | -12.0 | % | -8.7 | % | ||||||
| 3 year |
-5.6 | % | -6.3 | % | -6.7 | % | ||||||
| 5 year |
-5.6 | % | -6.0 | % | -10.2 | % | ||||||
| 7 year |
-7.4 | % | -7.7 | % | -9.7 | % | ||||||
| 10 year |
-5.6 | % | -5.9 | % | -7.7 | % | ||||||
| 15 year |
-0.1 | % | -1.3 | % | -3.3 | % | ||||||
Prior to October 19, 2009, the Fund tracked the Deutsche Bank Liquid Commodity Index-Optimum Yield Agriculture Excess Return™. From October 19, 2009 until January 1, 2011, the Fund tracked the Deutsche Bank Liquid Commodity Index Diversified Agriculture Excess Return™. On January 1, 2011, the Deutsche Bank Liquid Commodity Index Diversified Agriculture Index Excess ReturnTM changed its name to the name of the Index. The only difference between the Deutsche Bank Liquid Commodity Index Diversified Agriculture Index Excess ReturnTM and the Index is a name change.
THE FUND DOES NOT TRACK DBIQ DIVERSIFIED AGRICULTURE TR™ OR THE S&P GSCI AGRICULTURE INDEX TOTAL RETURN. THE VARIOUS STATISTICAL MEASURES AND ANNUALIZED INDEX LEVELS SHOWN ABOVE DO NOT REPRESENT THE FUND’S PERFORMANCE AND ARE NOT INDICATIVE OF THE FUND’S FUTURE PERFORMANCE.
Please refer to the “Notes” section below.
-45-
Table of Contents
The following tables present additional information regarding the Index (DBIQ Diversified Agriculture ERTM), DBIQ Diversified Agriculture TRTM, and S&P GSCI Agriculture Index Total Return, along with information on two additional agricultural indexes.
COMPARISON OF VARIOUS COMMODITIES INDICES13
(January 18, 1989 to July 31, 2018)
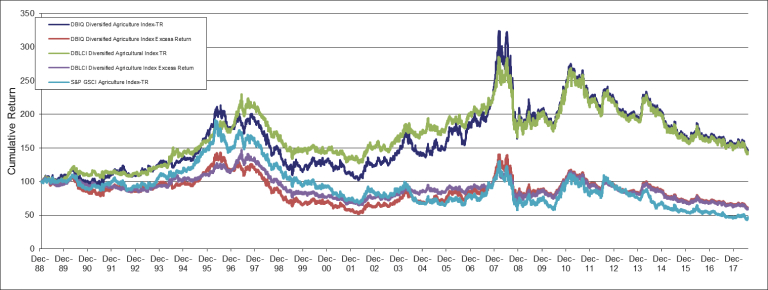
THE FUND TRACKS ONLY ITS OWN INDEX, DBIQ DIVERSIFIED AGRICULTURE INDEX EXCESS RETURN™.
THE PRIOR INDEX LEVELS SHOWN ABOVE DO NOT REPRESENT THE FUND’S PERFORMANCE AND ARE NOT INDICATIVE OF THE FUND’S FUTURE PERFORMANCE. THE INDEXES DO NOT REFLECT ANY FEES OR EXPENSES ASSOCIATED WITH OPERATING A FUND OR ACTUAL TRADING.
Please refer to the “Notes” section below.
-46-
Table of Contents
COMPARISON OF ANNUAL RETURNS OF VARIOUS INDICES13
(January 18, 1989 to July 31, 2018)
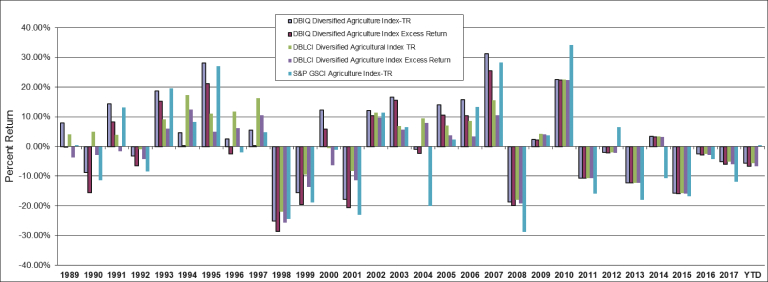
THE FUND TRACKS ONLY ITS OWN INDEX, DBIQ DIVERSIFIED AGRICULTURE INDEX EXCESS RETURN™.
THE PRIOR INDEX LEVELS SHOWN ABOVE DO NOT REPRESENT THE FUND’S PERFORMANCE AND ARE NOT INDICATIVE OF THE FUND’S FUTURE PERFORMANCE. THE INDEXES DO NOT REFLECT ANY FEES OR EXPENSES ASSOCIATED WITH OPERATING A FUND OR ACTUAL TRADING.
Please refer to the “Notes” section below.
-47-
Table of Contents
NOTES:
| 1. | “High” reflects the highest closing level of the Index during the applicable year. |
| 2. | “Low” reflects the lowest closing level of the Index during the applicable year. |
| 3. | “Annual Index Changes” reflect the change to the Index closing level on an annual basis as of December 31 of each applicable year. |
| 4. | “Index Changes Since Inception” reflects the change of the Index level since inception on a compounded annual basis as of December 31 of each applicable year. |
| 5. | Closing levels as of July 31, 2018. |
| 6. | “Annualized Changes to Index Level” reflect the change to the applicable index level on an annual basis as of December 31 of each applicable year. |
| 7. | “Average rolling 3 month daily volatility.” The daily volatility reflects the relative rate at which the price of the applicable index moves up and down, which is found by calculating the annualized standard deviation of the daily change in price. In turn, an average of this value is calculated on a 3 month rolling basis. |
| 8. | “Sharpe Ratio” compares the annualized rate of return minus the annualized risk-free rate of return to the annualized variability – often referred to as the “standard deviation” – of the monthly rates of return. A Sharpe Ratio of 1:1 or higher indicates that, according to the measures used in calculating the ratio, the rate of return achieved by a particular strategy has equaled or exceeded the risks assumed by such strategy. The risk-free rate of return that was used in these calculations was assumed to be 3.03%. |
| 9. | “% of months with positive change” during the period from inception to July 31, 2018. |
| 10. | “Average monthly positive change” during the period from inception to July 31, 2018. |
| 11. | “Average monthly negative change” during the period from inception to July 31, 2018. |
| 12. | “Annualized Index Levels” reflect the change to the level of the applicable index on an annual basis as of December 31 of each the applicable time period (e.g., one year, three, five or seven, ten or fifteen years, as applicable). |
| 13. | Prior to October 19, 2009, the Fund tracked the Deutsche Bank Liquid Commodity Index-Optimum Yield Agriculture Excess Return™. From October 19, 2009 until January 1, 2011, the Fund tracked the Deutsche Bank Liquid Commodity Index Diversified Agriculture Excess Return™. On January 1, 2011, the Deutsche Bank Liquid Commodity Index Diversified Agriculture Index Excess ReturnTM changed its name to the name of the Index. The only difference between the Deutsche Bank Liquid Commodity Index Diversified Agriculture Index Excess ReturnTM and the Index is a name change. |
-48-
Table of Contents
Proceeds of the offering of the Shares are used by the Fund to engage in the trading of Index Contracts with a view to tracking the changes, positive or negative, in the levels of the Index over time. Proceeds of the offering are also used to pay the Fund’s fees, expenses, and other costs. The Fund holds a portfolio of Index Contracts and Treasury Securities for deposit with the Fund’s Commodity Broker as margin and Treasury Securities, cash and money market mutual funds (affiliated or otherwise) on deposit with the Custodian (for margin and/or cash management purposes). In addition, the Fund gains an exposure to Treasury Securities with a maximum remaining maturity of up to twelve months through its holdings of T-Bill ETFs (affiliated or otherwise). Such holdings of T-Bill ETFs are also on deposit with the Custodian (for margin and/or cash management purposes) and may be held by the Fund’s Commodity Broker as margin, to the extent permissible under CFTC rules. Approximately 10% of the Fund’s NAV is required to be posted as collateral with respect to its holdings of Index Contracts as of July 31, 2018. Collateral requirements are initially set by the applicable futures exchanges. The Commodity Broker applies an additional collateral requirement based on a number of factors, including, but not limited to, volatility, concentration, percentage of open interest, and position size with respect to the Index Contracts. For purposes of calculating the approximate percentage of the Fund’s NAV that was posted as collateral, the Fund’s aggregate assets under management reflected the sum of the Fund’s holdings of Treasury Securities, money market mutual funds, T-Bill ETFs, cash and the value of the Index Contracts that have been marked to market as of July 31, 2018.
The Fund trades Index Contracts, with a view to tracking the Index over time. The Index is intended to reflect the agricultural sector. The Index Commodities consist of Corn, Soybeans, Wheat, Kansas City Wheat, Sugar, Cocoa, Coffee, Cotton, Live Cattle, Feeder Cattle and Lean Hogs.
To the extent that the Fund trades in futures contracts on United States exchanges, the assets deposited by the Fund with its Commodity Broker as margin must be segregated pursuant to the regulations of the CFTC. Such segregated funds may be invested only in a limited range of instruments, principally U.S. government obligations.
The Fund may trade in futures contracts on non-U.S. exchanges, for instance, if at any time it is impractical or inefficient to gain full or partial exposure to any Index Commodity through the use of Index Contracts. If the Fund trades futures on non-U.S. futures exchanges, funds deposited to margin positions held on those exchanges will be invested in bank deposits or in instruments of a credit standing generally comparable to those authorized by the CFTC for investment of customer segregated funds. It should be noted, however, that applicable CFTC rules prohibit funds employed in trading on foreign exchanges from being deposited in “customer segregated fund accounts.”
Although the percentages set forth below may vary substantially over time, as of the date of this Prospectus, the Fund estimates:
| i. | up to 10% of the NAV of the Fund will be required to be placed in segregated accounts in the name of the Fund with the Commodity Broker (or another eligible financial institution, as applicable) in the form of cash, money market mutual funds or T-Bill ETFs (affiliated or otherwise) or Treasury Securities to margin positions of all commodities combined. Such funds are segregated pursuant to CFTC rules; and |
| ii. | up to 90% of the NAV of the Fund is maintained in segregated accounts with the Custodian in the name of the Fund in bank deposits, money market mutual funds, T-Bill ETFs or Treasury Securities (or other securities approved by the CFTC for investment of customer funds) for margin and/or cash management purposes when assets of the Fund are not being used to margin positions. |
The Managing Owner is responsible for the cash management activities of the Fund, including investing in Treasury Securities, money market mutual funds (affiliated or otherwise) and T-Bill ETFs (affiliated or otherwise), as applicable.
The Fund receives 100% of its Treasury Income, Money Market Income and T-Bill ETF Income.
See “Breakeven Analysis” for breakeven related information.
49
Table of Contents
Management Fee
The Fund pays the Managing Owner a Management Fee, monthly in arrears, in an amount equal to 0.85% per annum of the daily NAV of the Fund. The Management Fee is paid in consideration of the Managing Owner’s services related to the management of the Fund’s business and affairs, including the provision of commodity futures trading advisory services.
The Fund may, for margin and/or cash management purposes, invest in money market mutual funds and/or T-Bill ETFs that are managed by affiliates of the Managing Owner. The indirect portion of the management fees that the Fund may incur through such investments is in addition to the Management Fee paid to the Managing Owner. The Managing Owner has contractually agreed to waive indefinitely the fees that it receives in an amount equal to the indirect management fees that the Fund incurs through its investments in affiliated money market mutual funds and/or affiliated T-Bill ETFs. The Managing Owner may terminate this waiver on 60 days notice.
Organization and Offering Expenses
Expenses incurred in connection with organizing the Fund and the initial offering of the Shares were paid by the Fund’s predecessor managing owner (the “Predecessor Managing Owner”). Expenses incurred in connection with the continuous offering of Shares from commencement of the Fund’s trading operations up to and excluding February 23, 2015 were also paid by the Predecessor Managing Owner. Expenses incurred in connection with the continuous offering of Shares on and after February 23, 2015 are paid by the Managing Owner. The Managing Owner aggregates the offering expenses related to the Fund and other commodity pools within the Invesco DB fund suite, and allocates the costs associated to each Fund for payment by the Managing Owner on behalf of the Fund. The Managing Owner expects that the expenses incurred in connection with the continuous offering of Shares of the Invesco DB fund suite may be approximately 0.05% of the average of the funds’ NAV during the life of the Fund’s currently effective registration statement. These costs may vary considerably during the life of the Fund’s current registration statement, but the Managing Owner retains the obligation to pay those expenses in lieu of the Fund.
Offering expenses relating to the Fund means those expenses incurred in connection with the continuous offering of the Shares, including, but not limited to, expenses such as:
| • | registration fees, filing fees and taxes; |
| • | costs of preparing, printing (including typesetting), amending, supplementing, mailing and distributing the Registration Statement, the exhibits thereto and this Prospectus; |
| • | the costs of qualifying, printing (including typesetting), amending, supplementing, mailing and distributing sales materials used in connection with the offering and issuance of the Shares; |
| • | travel, telegraph, telephone and other expenses in connection with the offering and issuance of the Shares; and |
| • | accounting, auditing and legal fees (including disbursements related thereto) incurred in connection therewith. |
The Managing Owner will not allocate to the Fund the indirect expenses of the Managing Owner.
Brokerage Commissions and Fees
The Fund pays to the Commodity Broker all brokerage commissions, including applicable exchange fees, NFA fees, give-up fees, pit brokerage fees and other transaction related fees and expenses charged in connection with its trading activities. On average, total charges paid to the Commodity Broker are expected to be less than $7.00 per round-turn trade, although the Commodity Broker’s brokerage commissions and trading fees are determined on a contract-by-contract, or round-turn basis. A round-turn trade is a completed transaction involving both a purchase and a liquidating sale, or a sale followed by a covering purchase. The Managing Owner estimates the brokerage commissions and fees will be approximately 0.04% of the NAV of the Fund in any year, although the actual amount of brokerage commissions and fees in any year or any part of any year may be greater.
Routine Operational, Administrative and Other Ordinary Expenses
The Managing Owner pays all routine operational, administrative and other ordinary
50
Table of Contents
expenses of the Fund. These expenses include, but are not limited to, computer service expenses, the fees and expenses of the Trustee, license and service fees paid to DIMA as Marketing Agent and Index Sponsor, legal and accounting fees and expenses, tax preparation expenses, filing fees, and printing, mailing and duplication costs. The Fund does not reimburse the Managing Owner for the routine operational, administrative and other ordinary expenses of the Fund. The Managing Owner aggregates the routine operational, administrative and other ordinary expenses related to the Fund and the other funds within the Invesco DB fund suite, and allocates the costs associated to each fund. The expenses may vary, but the Managing Owner retains the obligation to pay those expenses in lieu of the Fund. The Managing Owner expects that all of the routine operational, administrative and other ordinary expenses of the Invesco DB fund suite will be approximately 0.36% per annum of the average of the funds’ NAV.
Non-Recurring Fees and Expenses
The Fund pays all non-recurring and unusual fees and expenses (referred to as extraordinary fees and expenses in the Trust Agreement) of the Fund generally, if any, as determined by the Managing Owner. Non-recurring and unusual fees and expenses include items such as legal claims and liabilities, litigation costs, indemnification expenses and other expenses that are not currently anticipated obligations of the Fund or of managed futures funds in general.
Management Fee and Expenses to be Paid First out of Treasury Income, Money Market Income and/or T-Bill ETF Income
The Management Fee and the brokerage commissions and fees of the Fund are paid first out of Treasury Income, Money Market Income and T-Bill ETF Income, as applicable, on deposit with the Commodity Broker as margin, the Custodian, or otherwise. If the sum of the Treasury Income, the Money Market Income and the T-Bill ETF Income, as applicable, is not sufficient to cover the fees and expenses of the Fund that are payable by the Fund during any period, the excess of such fees and expenses over such Treasury Income, Money Market Income and T-Bill ETF Income, as applicable, will be paid out of income from futures trading, if any, or from sales of the Fund’s Treasury Securities and/or holdings in money market mutual funds and/or
holdings in T-Bill ETFs. The Fund holds Treasury Securities, money market mutual funds and T-Bill ETFs for margin and/or cash management purposes only.
Selling Commission
Retail investors may purchase and sell Shares through traditional brokerage accounts. Investors are expected to be charged a commission by their brokers in connection with purchases of Shares that will vary from investor to investor. Investors are encouraged to review the terms of their brokerage accounts for applicable charges.
The offering of baskets is being made in compliance with Conduct Rule 2310 of the Financial Industry Regulatory Authority (“FINRA”). The excess, if any, of the price at which an Authorized Participant sells a Share over the price paid by such Authorized Participant in connection with the creation of such Share in a Basket may, depending on the facts and circumstances, be deemed to be underwriting compensation by the FINRA Corporate Financing Department.
Baskets may be created or redeemed only by Authorized Participants. Each Authorized Participant must (1) be a registered broker-dealer or other securities market participant such as a bank or other financial institution which is not required to register as a broker-dealer to engage in securities transactions, (2) be a participant in DTC, and (3) have entered into a Participant Agreement with the Fund and the Managing Owner. The Participant Agreement sets forth the procedures for the creation and redemption of Baskets and for the delivery of cash required for such creations or redemptions. A list of the current Authorized Participants can be obtained from the Administrator. See “Creation and Redemption of Shares” for more details.
CREATION AND REDEMPTION OF SHARES
The Fund creates and redeems Shares from time to time, but only in one or more Baskets. A Basket is a block of 200,000 Shares. Baskets may be created or redeemed only by Authorized Participants. Except when aggregated in Baskets, the Shares are not redeemable securities. Authorized Participants pay a
51
Table of Contents
transaction fee of $500 in connection with each order to create or redeem a Basket and are subject to an additional processing charge for failure to timely deliver such orders. Authorized Participants may sell the Shares included in the Baskets they purchase from the Fund to other investors.
Authorized Participants are the only persons that may place orders to create and redeem Baskets. Authorized Participants must be (1) registered broker-dealers or other securities market participants, such as banks and other financial institutions, which are not required to register as broker-dealers to engage in securities transactions, and (2) participants in DTC. To become an Authorized Participant, a person must enter into a Participant Agreement with the Fund and the Managing Owner. The Participant Agreement sets forth the procedures for the creation and redemption of Baskets and for the payment of cash required for such creations and redemptions. The Managing Owner may delegate its duties and obligations under the Participant Agreement to Invesco Distributors, the Administrator or the Transfer Agent without consent from any Shareholder or Authorized Participant. The Participant Agreement may be amended by the Managing Owner only with the consent of the Authorized Participant, while the procedures attached thereto may be amended with notice to the Authorized Participant. Shareholder consent is not required in either case. To compensate the Transfer Agent for services in processing the creation and redemption of Baskets, an Authorized Participant is required to pay a transaction fee of $500 per order to create or redeem Baskets. Authorized Participants who purchase Baskets from the Fund receive no fees, commissions or other form of compensation or inducement of any kind from either the Managing Owner or the Fund, and no such person has any obligation or responsibility to the Managing Owner or the Fund to effect any sale or resale of Shares.
Authorized Participants are cautioned that some of their activities may result in their being deemed participants in a distribution in a manner which would render them statutory underwriters and subject them to the prospectus delivery and liability provisions of the Securities Act of 1933 (the “Securities Act”), as described in “Plan of Distribution.”
Authorized Participants may act for their own accounts or as agents for broker-dealers, custodians
and other securities market participants that wish to create or redeem Baskets.
Persons interested in purchasing Baskets should contact the Managing Owner or the Administrator to obtain the contact information for the Authorized Participants. Shareholders who are not Authorized Participants will only be able to redeem their Shares through an Authorized Participant.
Under the Participant Agreements, the Managing Owner has agreed to indemnify the Authorized Participants and certain parties related to the Authorized Participants against certain liabilities as a result of:
| • | any breach by the Managing Owner of any provision of the Participant Agreement; |
| • | any failure on the part of the Managing Owner to perform any obligation of the Managing Owner set forth in the Participant Agreement; |
| • | any failure by the Managing Owner to comply with applicable laws and regulations in connection with the Participant Agreement, except that the Managing Owner will not be required to indemnify a Managing Owner Indemnified Party (as defined in the Participant Agreement) to the extent that such failure was caused by the reasonable reliance on instructions given or representations made by one or more Managing Owner Indemnified Parties or the negligence or willful malfeasance of any Managing Owner Indemnified Party; |
| • | any untrue statement or alleged untrue statement of a material fact contained in the Registration Statement of the Trust as originally filed with the SEC, or in any amendment thereof, or in any prospectus, or in any amendment thereof or supplement thereto, or arising out of or based upon the omission or alleged omission to state therein a material fact required to be stated therein or necessary to make the statements therein not misleading, except those statements in the Registration Statement or the Prospectus based on information furnished in writing by or on behalf of the Authorized Participant expressly for use in the Registration Statement or the Prospectus. |
52
Table of Contents
As provided in the Participant Agreements, in the absence of gross negligence, bad faith or willful misconduct, neither the Managing Owner nor an Authorized Participant will be liable to each other or to any other person, including any party claiming by, through or on behalf of the Authorized Participant, for any losses, liabilities, damages, costs or expenses arising out of any mistake or error in data or other information provided to any of them by each other or any other person or out of any interruption or delay in the electronic means of communications used by them.
The following description of the procedures for the creation and redemption of Baskets is only a summary and an investor should refer to the relevant provisions of the Trust Agreement and the form of Participant Agreement for more detail. The Trust Agreement and the form of Participant Agreement are filed as exhibits to the registration statement of which this Prospectus is a part.
Creation Procedures
On any business day, an Authorized Participant may place an order with the Transfer Agent to create one or more Baskets. For purposes of processing both creation and redemption orders, a “business day” means any day other than a day when banks in New York City are required or permitted to be closed. Creation orders must be placed by 10:00 a.m., Eastern time. The day on which the Transfer Agent receives a valid creation order is the creation order date. The day on which a creation order is settled is the creation order settlement date. As provided below, the creation order settlement date may occur up to two business days after the creation order date. By placing a creation order, and prior to delivery of such Baskets, an Authorized Participant’s DTC account is charged the non-refundable transaction fee due for the creation order.
Baskets are issued on the creation order settlement date as of 2:45 p.m., Eastern time, on the business day immediately following the creation order date at the applicable NAV per Share as of the closing time of the NYSE Arca or the last to close of the exchanges on which its futures contracts are traded, whichever is later, on the creation order date, but only if the required payment has been timely received. Upon submission of a creation order, the Authorized Participant may request the Managing Owner to agree to a creation order settlement date up
to two business days after the creation order date. By placing a creation order, and prior to receipt of the Baskets, an Authorized Participant’s DTC account is charged the non-refundable transaction fee due for the creation order.
Determination of Required Payment
The total payment required to create each Basket is the NAV of 200,000 Shares as of the closing time of the NYSE Arca or the last to close of the exchanges on which the Fund’s futures contracts are traded, whichever is later, on the creation order date.
Because orders to purchase Baskets must be placed by 10:00 a.m., Eastern time, but the total payment required to create a Basket will not be determined until 4:00 p.m., Eastern time, on the date the creation order is received, Authorized Participants will not know the total amount of the payment required to create a Basket at the time they submit the creation order for the Basket. The Fund’s NAV and the total amount of the payment required to create a Basket could rise or fall substantially between the time a creation order is submitted and the time the amount of the purchase price in respect thereof is determined.
Rejection of Creation Orders
The Managing Owner or the Transfer Agent may reject a creation order if:
| • | The Managing Owner or the Transfer Agent determines that the creation order is not in proper form; |
| • | The Managing Owner believes that the acceptance or receipt of the creation order would have adverse tax consequences to the Fund or its Shareholders; |
| • | The acceptance or receipt of the creation order would, in the opinion of counsel to the Managing Owner, be unlawful; or |
| • | Circumstances outside the control of the Managing Owner or the Transfer Agent make it, for all practical purposes, not feasible to process creations of Baskets. |
The Managing Owner will not be liable for the rejection of any creation order.
53
Table of Contents
The Fund also may not be able to create new Baskets at any time if there is an insufficient amount of Shares registered in this offering or if another legal or operational impediment to creating new Baskets arises.
Redemption Procedures
The procedures by which an Authorized Participant can redeem one or more Baskets mirror the procedures for the creation of Baskets. On any business day, an Authorized Participant may place an order with the Transfer Agent to redeem one or more Baskets. Redemption orders must be placed by 10:00 a.m., Eastern time. The day on which the Managing Owner receives a valid redemption order is the redemption order date. The day on which a redemption order is settled is the redemption order settlement date. As provided below, the redemption order settlement date may occur up to two business days after the redemption order date. The redemption procedures allow Authorized Participants to redeem Baskets. Individual Shareholders may not redeem directly from the Fund. Instead, individual Shareholders may only redeem Shares in an amount equal to one or more whole Baskets and only through an Authorized Participant.
By placing a redemption order, an Authorized Participant agrees to deliver the Baskets to be redeemed through DTC’s book-entry system to the Fund not later than the redemption order settlement date as of 2:45 p.m., Eastern time, on the business day immediately following the redemption order date. Upon submission of a redemption order, the Authorized Participant may request the Managing Owner to agree to a redemption order settlement date up to two business days after the redemption order date. By placing a redemption order, and prior to receipt of the redemption proceeds, an Authorized Participant’s DTC account is charged the non-refundable transaction fee due for the redemption order.
Determination of Redemption Proceeds
The redemption proceeds from the Fund consist of the cash redemption amount. The cash redemption amount is equal to the NAV of the number of Basket(s) requested in the Authorized Participant’s redemption order as of the closing time of the NYSE Arca or the last to close of the exchanges on which the Fund’s futures contracts are traded, whichever is
later, on the redemption order date. The Managing Owner will distribute the cash redemption amount at 2:45 p.m., Eastern time, on the redemption order settlement date through DTC to the account of the Authorized Participant as recorded on DTC’s book-entry system.
Delivery of Redemption Proceeds
The redemption proceeds due from the Fund are delivered to the Authorized Participant at 2:45 p.m., Eastern time, on the redemption order settlement date if, by such time, the Fund’s DTC account has been credited with the Baskets to be redeemed. If the Fund’s DTC account has not been credited with all of the Baskets to be redeemed by such time, the redemption distribution is delivered to the extent of whole Baskets received. Any remainder of the redemption distribution is delivered on the next business day to the extent of remaining whole Baskets received if the Transfer Agent receives the fee applicable to the extension of the redemption distribution date which the Managing Owner may, from time-to-time, determine and the remaining Baskets to be redeemed are credited to the Fund’s DTC account by 2:45 p.m., Eastern time, on such next business day. Any further outstanding amount of the redemption order will be cancelled. The Managing Owner is also authorized to deliver the redemption distribution notwithstanding that the Baskets to be redeemed are not credited to the Fund’s DTC account by 2:45 p.m., Eastern time, on the redemption order settlement date if the Authorized Participant has collateralized its obligation to deliver the Baskets through DTC’s book-entry system on such terms as the Managing Owner may determine from time-to-time.
Suspension, Postponement or Rejection of Redemption Orders
The Managing Owner may, in its discretion, suspend the right of redemption, or postpone the redemption order settlement date, for (1) any period during which an emergency exists as a result of which the redemption distribution is not reasonably practicable, or (2) such other period as the Managing Owner determines to be necessary for the protection of the Shareholders. The Managing Owner will not be liable to any person or in any way for any loss or damages that may result from any such suspension or postponement.
54
Table of Contents
The Managing Owner or the Transfer Agent may reject a redemption order if the order is not in proper form as described in the Participant Agreement. The Managing Owner or the Transfer Agent will reject a redemption order if the acceptance or receipt of the order, in the opinion of its counsel, might be unlawful.
Creation and Redemption Transaction Fee
To compensate the Transfer Agent for services in processing the creation and redemption of Baskets, an Authorized Participant is required to pay a transaction fee of $500 per order to create or redeem Baskets. An order may include multiple Baskets. The transaction fee may be reduced, increased or otherwise changed by the Managing Owner. The Managing Owner will notify DTC of any agreement to change the transaction fee and will not implement any increase in the fee for the redemption of Baskets until 30 days after the date of the notice.
Monthly account statements conforming to CFTC and NFA requirements are posted on the Managing Owner’s website at www.invesco.com/ETFs. Additional reports may be posted on the Managing Owner’s website in the discretion of the Managing Owner or as required by regulatory authorities.
A variety of executing brokers execute futures transactions on behalf of the Fund. Executing brokers give-up all such transactions to the Commodity Broker, Morgan Stanley & Co. LLC (“MS&Co.”). MS&Co. is a Delaware limited liability company with its main business office located at 1585 Broadway, New York, New York 10036. Among other registrations and memberships, MS&Co. is registered as a futures commission merchant and is a member of the NFA. In its capacity as clearing broker, MS&Co. may execute or receive transactions executed by others, and clears all of the Fund’s futures transactions and performs certain administrative and custodial services for the Fund.
MS&Co. is a wholly-owned, indirect subsidiary of Morgan Stanley, a Delaware holding company. Morgan Stanley files periodic reports with the SEC as required by the Securities Exchange Act of 1934 (the “Exchange Act”) which include current
descriptions of material litigation and material proceedings and investigations, if any, by governmental and/or regulatory agencies or self-regulatory organizations concerning Morgan Stanley and its subsidiaries, including MS&Co. As a consolidated subsidiary of Morgan Stanley, MS&Co. does not file its own periodic reports with the SEC that contain descriptions of material litigation, proceedings and investigations. As a result, we refer you to the “Legal Proceedings” section of Morgan Stanley’s SEC 10-K filings for 2017, 2016, 2015, 2014 and 2013.
In addition to the matters described in those filings, in the normal course of business, each of Morgan Stanley and MS&Co. has been named, from time to time, as a defendant in various legal actions, including arbitrations, class actions, and other litigation, arising in connection with its activities as a global diversified financial services institution. Certain of the legal actions include claims for substantial compensatory and/or punitive damages or claims for indeterminate amounts of damages. Each of Morgan Stanley and MS&Co. is also involved, from time to time, in investigations and proceedings by governmental and/or regulatory agencies or self-regulatory organizations, certain of which may result in adverse judgments, fines or penalties. The number of these investigations and proceedings has increased in recent years with regard to many financial services institutions, including Morgan Stanley and MS&Co.
Regulatory and Governmental Matters
In the normal course of business, Morgan Stanley receives subpoenas and requests for information from certain federal and state regulatory and governmental entities, including among others various members of the RMBS Working Group of the Financial Fraud Enforcement Task Force, such as the United States Department of Justice, Civil Division and several state Attorney General’s Offices, concerning the origination, financing, purchase, securitization and servicing of subprime and non-subprime residential mortgages and related matters such as residential mortgage backed securities (“RMBS”), collateralized debt obligations (“CDOs”), structured investment vehicles (“SIVs”) and credit default swaps backed by or referencing mortgage pass-through certificates. These matters, some of which are in advanced stages, include, but are not limited to, investigations related to MS&Co.’s
55
Table of Contents
due diligence on the loans that it purchased for securitization, MS&Co.’s communications with ratings agencies, MS&Co.’s disclosures to investors, and MS&Co.’s handling of servicing and foreclosure related issues.
On February 25, 2015, MS&Co. reached an agreement in principle with the United States Department of Justice, Civil Division and the United States Attorney’s Office for the Northern District of California, Civil Division (collectively, the “Civil Division”) to pay $2.6 billion to resolve certain claims that the Civil Division indicated it intended to bring against MS&Co. That settlement was finalized on February 10, 2016.
On April 1, 2016, the California Attorney General’s Office filed an action against MS&Co. in California state court styled California v. Morgan Stanley, et al., on behalf of California investors, including the California Public Employees’ Retirement System and the California Teachers’ Retirement System. The complaint alleges that MS&Co. made misrepresentations and omissions regarding residential mortgage-backed securities and notes issued by the Cheyne SIV, and asserts violations of the California False Claims Act and other state laws and seeks treble damages, civil penalties, disgorgement, and injunctive relief. On September 30, 2016, the court granted MS&Co.’s demurrer, with leave to replead. On October 21, 2016, the California Attorney General filed an amended complaint. On January 25, 2017, the court denied MS&Co.’s demurrer with respect to the amended complaint.
In October 2014, the Illinois Attorney General’s Office (“ILAG”) sent a letter to MS&Co. alleging that MS&Co. knowingly made misrepresentations related to RMBS purchased by certain pension funds affiliated with the State of Illinois and demanding that MS&Co. pay ILAG approximately $88 million. MS&Co. and ILAG reached an agreement to resolve the matter on February 10, 2016.
On January 13, 2015, the New York Attorney General’s Office (“NYAG”), which is also a member of the RMBS Working Group, indicated that it intends to file a lawsuit related to approximately 30 subprime securitizations sponsored by MS&Co. NYAG indicated that the lawsuit would allege that MS&Co. misrepresented or omitted material information related to the due diligence, underwriting
and valuation of the loans in the securitizations and the properties securing them and indicated that its lawsuit would be brought under the Martin Act. MS&Co. and NYAG reached an agreement to resolve the matter on February 10, 2016.
On July 23, 2014, the SEC approved a settlement by MS&Co. and certain affiliates to resolve an investigation related to certain subprime RMBS transactions sponsored and underwritten by those entities in 2007. Pursuant to the settlement, MS&Co. and certain affiliates were charged with violating Sections 17(a)(2) and 17(a)(3) of the Securities Act agreed to pay disgorgement and penalties in an amount of $275 million and neither admitted nor denied the SEC’s findings.
On April 21, 2015, the Chicago Board Options Exchange, Incorporated (“CBOE”) and the CBOE Futures Exchange, LLC (“CFE”) filed statements of charges against MS&Co. in connection with trading by one of MS&Co.’s former traders of EEM options contracts that allegedly disrupted the final settlement price of the November 2012 VXEM futures. CBOE alleged that MS&Co. violated CBOE Rules 4.1, 4.2 and 4.7, Sections 9(a) and 10(b) of the Exchange Act, and Rule 10b-5 thereunder. CFE alleged that MS&Co. violated CFE Rules 608, 609 and 620. The matters were resolved on June 28, 2016, in which there were no findings of fraud, but MS&Co. was jointly and severally liable for a $400,000 fine and $152,664 in disgorgement.
On June 18, 2015, MS&Co. entered into a settlement with the SEC and paid a fine of $500,000 as part of the MCDC Initiative to resolve allegations that MS&Co. failed to form a reasonable basis through adequate due diligence for believing the truthfulness of the assertions by issuers and/or obligors regarding their compliance with previous continuing disclosure undertakings pursuant to Rule 15c2-12 in connection with offerings in which MS&Co. acted as senior or sole underwriter.
On August 6, 2015, MS&Co. consented to and became the subject of an order by the CFTC to resolve allegations that MS&Co. violated CFTC Regulation 22.9(a) by failing to hold sufficient U.S. Dollars in cleared swap segregated accounts in the United States to meet all U.S. Dollar obligations to cleared swaps customers. Specifically, the CFTC found that while MS&Co. at all times held sufficient funds in segregation to cover its obligations to its
56
Table of Contents
customers, on certain days during 2013 and 2014, it held currencies, such as euros, instead of U.S. dollars, to meet its U.S. dollar obligations. In addition, the CFTC found that MS&Co. violated Regulation 166.3 by failing to have in place adequate procedures to ensure that it complied with Regulation 22.9(a). Without admitting or denying the findings or conclusions and without adjudication of any issue of law or fact, MS&Co. accepted and consented to the entry of findings, the imposition of a cease and desist order, a civil monetary penalty of $300,000, and undertakings related to public statements, cooperation, and payment of the monetary penalty.
On December 20, 2016, MS&Co. consented to and became the subject of an order by the SEC in connection with allegations that MS&Co. willfully violated Sections 15(c)(3) and 17(a)(1) of the Securities Exchange Act of 1934 and Rules 15c3-3(e), 17a-5(a), and 17a-5(d) thereunder, by inaccurately calculating its Reserve Account requirement under Rule 15c3-3 by including margin loans to an affiliate in its calculations, which resulted in making inaccurate records and submitting inaccurate reports to the SEC. Without admitting or denying the underlying allegations and without adjudication of any issue of law or fact, MS&Co. consented to a cease and desist order, a censure, and a civil monetary penalty of $7,500,000.
On September 28, 2017, the CFTC issued an order filing and simultaneously settling charges against MS&Co. regarding violations of CFTC Rule 166.3 by failing to diligently supervise the reconciliation of exchange and clearing fees with the amounts it ultimately charged customers for certain transactions on multiple exchanges. The order and settlement required MS&Co. to pay a $500,000 penalty and cease and desist from violating Rule 166.3.
On November 2, 2017, the CFTC issued an order filing and simultaneously settling charges against MS&Co. for non-compliance with applicable rules governing Part 17 Large Trader reports to the CFTC. The order requires MS&Co. to pay a $350,000 penalty and cease and desist from further violations of the Commodity Exchange Act.
Civil Litigation
On July 15, 2010, China Development Industrial Bank (“CDIB”) filed a complaint against MS&Co., styled China Development Industrial Bank v. Morgan
Stanley & Co. Incorporated et al., which is pending in the Supreme Court of the State of New York, New York County (“Supreme Court of NY”). The complaint relates to a $275 million credit default swap referencing the super senior portion of the STACK 2006-1 CDO. The complaint asserts claims for common law fraud, fraudulent inducement and fraudulent concealment and alleges that MS&Co. misrepresented the risks of the STACK 2006-1 CDO to CDIB, and that MS&Co. knew that the assets backing the CDO were of poor quality when it entered into the credit default swap with CDIB. The complaint seeks compensatory damages related to the approximately $228 million that CDIB alleges it has already lost under the credit default swap, rescission of CDIB’s obligation to pay an additional $12 million, punitive damages, equitable relief, fees and costs. On February 28, 2011, the court denied MS&Co.’s motion to dismiss the complaint. On June 27, 2018, MS&Co. filed a motion for summary judgment and spoliation sanctions against CDIB. Based on currently available information, MS&Co. believes it could incur a loss of up to approximately $240 million plus pre- and post-judgment interest, fees and costs.
On October 15, 2010, the Federal Home Loan Bank of Chicago filed a complaint against MS&Co. and other defendants in the Circuit Court of the State of Illinois, styled Federal Home Loan Bank of Chicago v. Bank of America Funding Corporation et al. A corrected amended complaint was filed on April 8, 2011, which alleges that defendants made untrue statements and material omissions in the sale to the plaintiff of a number of mortgage pass-through certificates backed by securitization trusts containing residential mortgage loans and asserts claims under Illinois law. The total amount of certificates allegedly sold to plaintiff by MS&Co. at issue in the action was approximately $203 million. The complaint seeks, among other things, to rescind the plaintiff’s purchase of such certificates. The defendants filed a motion to dismiss the corrected amended complaint on May 27, 2011, which was denied on September 19, 2012. On December 13, 2013, the court entered an order dismissing all claims related to one of the securitizations at issue. On January 18, 2017, the court entered an order dismissing all claims related to an additional securitization at issue. After those dismissals, the remaining amount of certificates allegedly issued by MS&Co. or sold to the plaintiff by MS&Co. was approximately $65 million. At
57
Table of Contents
June 25, 2018, the current unpaid balance of the mortgage pass-through certificates at issue in this action was approximately $37 million and the certificates had not yet incurred actual losses. Based on currently available information, MS&Co. believes it could incur a loss in this action up to the difference between the $37 million unpaid balance of these certificates (plus any losses incurred) and their fair market value at the time of a judgment against MS&Co., plus pre- and post-judgment interest, fees and costs. MS&Co. may be entitled to be indemnified for some of these losses and to an offset for interest received by the plaintiff prior to a judgment.
On April 20, 2011, the Federal Home Loan Bank of Boston filed a complaint against MS&Co. and other defendants in the Superior Court of the Commonwealth of Massachusetts styled Federal Home Loan Bank of Boston v. Ally Financial, Inc. F/K/A GMAC LLC et al. An amended complaint was filed on June 29, 2012 and alleges that the defendants made untrue statements and material omissions in the sale to plaintiff of certain mortgage pass-through certificates backed by securitization trusts containing residential mortgage loans. The total amount of certificates allegedly issued by MS&Co. or sold to the plaintiff by MS&Co. was approximately $385 million. The amended complaint raises claims under the Massachusetts Uniform Securities Act, the Massachusetts Consumer Protection Act and common law and seeks, among other things, to rescind the plaintiff’s purchase of such certificates. On May 26, 2011, the defendants removed the case to the United States District Court for the District of Massachusetts. The defendants’ motions to dismiss the amended complaint were granted in part and denied in part on September 30, 2013. On November 25, 2013, July 16, 2014, and May 19, 2015, respectively, the plaintiff voluntarily dismissed its claims against MS&Co. with respect to three of the securitizations at issue. After these voluntary dismissals, the remaining amount of certificates allegedly issued by MS&Co. or sold to the plaintiff by MS&Co. was approximately $332 million. On February 6, 2017, the action was remanded to the Superior Court of the Commonwealth of Massachusetts. On July 13, 2018, the parties reached an agreement in principle to settle the litigation.
On May 3, 2013, plaintiffs in Deutsche Zentral-Genossenschaftsbank AG et al. v. Morgan Stanley et al. filed a complaint against MS&Co., certain
affiliates, and other defendants in the Supreme Court of NY. The complaint alleges that the defendants made material misrepresentations and omissions in the sale to the plaintiffs of certain mortgage pass-through certificates backed by securitization trusts containing residential mortgage loans. The total amount of certificates allegedly sponsored, underwritten and/or sold by MS&Co. to the plaintiff was approximately $634 million. The complaint alleges causes of action against MS&Co. for common law fraud, fraudulent concealment, aiding and abetting fraud, negligent misrepresentation, and rescission and seeks, among other things, compensatory and punitive damages. On June 26, 2018, the parties entered an agreement to settle the litigation.
On May 17, 2013, a plaintiff in IKB International S.A. in Liquidation, et al. v. Morgan Stanley, et al. filed a complaint against MS&Co. and certain affiliates in the Supreme Court of NY. The complaint alleges that the defendants made material misrepresentations and omissions in the sale to the plaintiff of certain mortgage pass-through certificates backed by securitization trusts containing residential mortgage loans. The total amount of certificates allegedly sponsored, underwritten and/or sold by MS&Co. to the plaintiff was approximately $133 million. The complaint alleges causes of action against MS&Co. for common law fraud, fraudulent concealment, aiding and abetting fraud, and negligent misrepresentation, and seeks, among other things, compensatory and punitive damages. On October 29, 2014, the court granted in part and denied in part MS&Co.’s motion to dismiss. All claims regarding four certificates were dismissed. After these dismissals, the remaining amount of certificates allegedly issued by MS&Co. or sold to the plaintiff by MS&Co. was approximately $116 million. On August 26, 2015, MS&Co. perfected its appeal from the court’s October 29, 2014 decision. On August 11, 2016, the Appellate Division, First Department affirmed the trial court’s decision denying in part MS&Co.’s motion to dismiss the complaint. At June 25, 2018, the current unpaid balance of the mortgage pass-through certificates at issue in this action was approximately $24 million, and the certificates had incurred actual losses of $58 million. Based on currently available information, MS&Co. believes it could incur a loss in this action up to the difference between the $24 million unpaid balance of these certificates (plus any losses incurred) and their fair market value at the time of a judgment against
58
Table of Contents
MS&Co., or upon sale, plus pre- and post-judgment interest, fees and costs. MS&Co. may be entitled to be indemnified for some of these losses and to an offset for interest received by the plaintiff prior to a judgment.
Settled Civil Litigation
On December 23, 2009, the Federal Home Loan Bank of Seattle filed a complaint against MS&Co. and another defendant in the Superior Court of the State of Washington, styled Federal Home Loan Bank of Seattle v. Morgan Stanley & Co. Inc., et al. The amended complaint, filed on September 28, 2010, alleges that defendants made untrue statements and material omissions in the sale to the plaintiff of certain mortgage pass-through certificates backed by securitization trusts containing residential mortgage loans. The total amount of certificates allegedly sold to the plaintiff by MS&Co. was approximately $233 million. The complaint raises claims under the Washington State Securities Act and seeks, among other things, to rescind the plaintiff’s purchase of such certificates. On January 23, 2017, the parties reached an agreement to settle the litigation.
On March 15, 2010, the Federal Home Loan Bank of San Francisco filed a complaint against MS&Co. and other defendants in the Superior Court of the State of California styled Federal Home Loan Bank of San Francisco v. Deutsche Bank Securities Inc. et al. An amended complaint, filed on June 10, 2010, alleges that defendants made untrue statements and material omissions in connection with the sale to plaintiff of certain mortgage pass-through certificates backed by securitization trusts containing residential mortgage loans. The amount of certificates allegedly sold to plaintiff by MS&Co. was approximately $276 million. The complaint raises claims under both the federal securities laws and California law and seeks, among other things, to rescind the plaintiff’s purchase of such certificates. On December 21, 2016, the parties reached an agreement to settle the litigation.
On March 15, 2010, the Federal Home Loan Bank of San Francisco filed a complaint against MS&Co. and other defendants in the Superior Court of the State of California styled Federal Home Loan Bank of San Francisco v. Credit Suisse Securities (USA) LLC, et al. An amended complaint filed on June 10, 2010 alleged that the defendants made untrue statements and material omissions in
connection with the sale to the plaintiff of a number of mortgage pass-through certificates backed by securitization trusts containing residential mortgage loans. The amount of certificates allegedly sold to the plaintiff by MS&Co. was approximately $704 million. The complaint raised claims under both the federal securities laws and California law and sought, among other things, to rescind the plaintiff’s purchase of such certificates. On January 26, 2015, as a result of a settlement with certain other defendants, the plaintiff requested and the court subsequently entered a dismissal with prejudice of certain of the plaintiff’s claims, including all remaining claims against MS&Co.
On July 9, 2010 and February 11, 2011, Cambridge Place Investment Management Inc. filed two separate complaints against MS&Co. and/or its affiliates and other defendants in the Superior Court of the Commonwealth of Massachusetts, both styled Cambridge Place Investment Management Inc. v. Morgan Stanley & Co., Inc., et al. The complaints asserted claims on behalf of certain clients of the plaintiff’s affiliates and allege that the defendants made untrue statements and material omissions in the sale of a number of mortgage pass-through certificates backed by securitization trusts containing residential mortgage loans. The total amount of certificates allegedly issued by MS&Co. and/or its affiliates or sold to the plaintiff’s affiliates’ clients by MS&Co. and/or its affiliates in the two matters was approximately $263 million. On February 11, 2014, the parties entered into an agreement to settle the litigation. On February 20, 2014, the court dismissed the action.
On October 25, 2010, MS&Co., certain affiliates and Pinnacle Performance Limited, a special purpose vehicle (“SPV”), were named as defendants in a purported class action in the United States District Court for the Southern District of New York (“SDNY”), styled Ge Dandong, et al. v. Pinnacle Performance Ltd., et al. On January 31, 2014, the plaintiffs in the action, which related to securities issued by the SPV in Singapore, filed a second amended complaint, which asserted common law claims of fraud, aiding and abetting fraud, fraudulent inducement, aiding and abetting fraudulent inducement, and breach of the implied covenant of good faith and fair dealing. On July 17, 2014, the parties reached an agreement to settle the litigation, which received final court approval on July 2, 2015.
59
Table of Contents
On July 5, 2011, Allstate Insurance Company and certain of its affiliated entities filed a complaint against MS&Co. in the Supreme Court of NY, styled Allstate Insurance Company, et al. v. Morgan Stanley, et al. An amended complaint was filed on September 9, 2011, and alleges that the defendants made untrue statements and material omissions in the sale to the plaintiffs of certain mortgage pass-through certificates backed by securitization trusts containing residential mortgage loans. The total amount of certificates allegedly issued and/or sold to the plaintiffs by MS&Co. was approximately $104 million. The complaint raised common law claims of fraud, fraudulent inducement, aiding and abetting fraud, and negligent misrepresentation and seeks, among other things, compensatory and/or recessionary damages associated with the plaintiffs’ purchases of such certificates. On January 16, 2015, the parties reached an agreement to settle the litigation.
On July 18, 2011, the Western and Southern Life Insurance Company and certain affiliated companies filed a complaint against MS&Co. and other defendants in the Court of Common Pleas in Ohio, styled Western and Southern Life Insurance Company, et al. v. Morgan Stanley Mortgage Capital Inc., et al. An amended complaint was filed on April 2, 2012 and alleges that the defendants made untrue statements and material omissions in the sale to the plaintiffs of certain mortgage pass-through certificates backed by securitization trusts containing residential mortgage loans. The amount of the certificates allegedly sold to plaintiffs by MS&Co. was approximately $153 million. On June 8, 2015, the parties reached an agreement to settle the litigation.
On September 2, 2011, the Federal Housing Finance Agency (“FHFA”), as conservator for Fannie Mae and Freddie Mac, filed 17 complaints against numerous financial services companies, including MS&Co. and certain affiliates. A complaint against MS&Co. and certain affiliates and other defendants was filed in the Supreme Court of NY, styled Federal Housing Finance Agency, as Conservator v. Morgan Stanley et al. The complaint alleges that the defendants made untrue statements and material omissions in connection with the sale to Fannie Mae and Freddie Mac of residential mortgage pass-through certificates with an original unpaid balance of approximately $11 billion. The complaint raised
claims under federal and state securities laws and common law and seeks, among other things, rescission and compensatory and punitive damages. On February 7, 2014, the parties entered into an agreement to settle the litigation. On February 20, 2014, the court dismissed the action.
On April 25, 2012, Metropolitan Life Insurance Company and certain affiliates filed a complaint against MS&Co. and certain affiliates in the Supreme Court of NY, styled Metropolitan Life Insurance Company, et al. v. Morgan Stanley, et al. An amended complaint was filed on June 29, 2012, and alleges that the defendants made untrue statements and material omissions in the sale to the plaintiffs of certain mortgage pass-through certificates backed by securitization trusts containing residential mortgage loans. The total amount of certificates allegedly sponsored, underwritten, and/or sold by MS&Co. was approximately $758 million. The amended complaint raised common law claims of fraud, fraudulent inducement, and aiding and abetting fraud and seeks, among other things, rescission, compensatory, and/or rescissionary damages, as well as punitive damages, associated with the plaintiffs’ purchases of such certificates. On April 11, 2014, the parties entered into a settlement agreement.
On April 25, 2012, The Prudential Insurance Company of America and certain affiliates filed a complaint against MS&Co. and certain affiliates in the Superior Court of the State of New Jersey, styled The Prudential Insurance Company of America, et al. v. Morgan Stanley, et al. On October 16, 2012, the plaintiffs filed an amended complaint. The amended complaint alleged that the defendants made untrue statements and material omissions in connection with the sale to the plaintiffs of certain mortgage pass-through certificates backed by securitization trusts containing residential mortgage loans. The total amount of certificates allegedly sponsored, underwritten and/or sold by MS&Co. was approximately $1.073 billion. The amended complaint raises claims under the New Jersey Uniform Securities Law, as well as common law claims of negligent misrepresentation, fraud, fraudulent inducement, equitable fraud, aiding and abetting fraud, and violations of the New Jersey RICO statute, and includes a claim for treble damages. On January 8, 2016, the parties reached an agreement to settle the litigation.
60
Table of Contents
In re Morgan Stanley Mortgage Pass-Through Certificates Litigation, which had been pending in the SDNY, was a putative class action involving allegations that, among other things, the registration statements and offering documents related to the offerings of certain mortgage pass-through certificates in 2006 and 2007 contained false and misleading information concerning the pools of residential loans that backed these securitizations. On December 18, 2014, the parties’ agreement to settle the litigation received final court approval, and on December 19, 2014, the court entered an order dismissing the action.
On November 4, 2011, the FDIC, as receiver for Franklin Bank S.S.B, filed two complaints against MS&Co. in the District Court of the State of Texas. Each was styled Federal Deposit Insurance Corporation as Receiver for Franklin Bank, S.S.B v. Morgan Stanley & Company LLC F/K/A Morgan Stanley & Co. Inc. and alleged that MS&Co. made untrue statements and material omissions in connection with the sale to the plaintiff of mortgage pass-through certificates backed by securitization trusts containing residential mortgage loans. The amount of certificates allegedly underwritten and sold to the plaintiff by MS&Co. in these cases was approximately $67 million and $35 million, respectively. On July 2, 2015, the parties reached an agreement to settle the litigation.
On February 14, 2013, Bank Hapoalim B.M. filed a complaint against MS&Co. and certain affiliates in the Supreme Court of NY, styled Bank Hapoalim B.M. v. Morgan Stanley et al. The complaint alleges that the defendants made material misrepresentations and omissions in the sale to the plaintiff of certain mortgage pass-through certificates backed by securitization trusts containing residential mortgage loans. The total amount of certificates allegedly sponsored, underwritten and/or sold by MS&Co. to the plaintiff was approximately $141 million. On July 28, 2015, the parties reached an agreement to settle the litigation, and on August 12, 2015, the plaintiff filed a stipulation of discontinuance with prejudice.
On September 23, 2013, the plaintiff in National Credit Union Administration Board v. Morgan Stanley & Co. Inc., et al. filed a complaint against MS&Co. and certain affiliates in the SDNY. The complaint alleged that the defendants made untrue
statements of material fact or omitted to state material facts in the sale to the plaintiff of certain mortgage pass-through certificates issued by securitization trusts containing residential mortgage loans. The total amount of certificates allegedly sponsored, underwritten and/or sold by MS&Co. to the plaintiffs in the matter was approximately $417 million. The complaint alleged violations of federal and various state securities laws and sought, among other things, rescissionary and compensatory damages. On November 23, 2015, the parties reached an agreement to settle the matter.
On September 16, 2014, the Virginia Attorney General’s Office filed a civil lawsuit, styled Commonwealth of Virginia ex rel. Integra REC LLC v. Barclays Capital Inc., et al., against MS&Co. and several other defendants in the Circuit Court of the City of Richmond related to RMBS. The lawsuit alleged that MS&Co. and the other defendants knowingly made misrepresentations and omissions related to the loans backing RMBS purchased by the Virginia Retirement System. The complaint asserts claims under the Virginia Fraud Against Taxpayers Act, as well as common law claims of actual and constructive fraud, and seeks, among other things, treble damages and civil penalties. On January 6, 2016, the parties reached an agreement to settle the litigation. An order dismissing the action with prejudice was entered on January 28, 2016.
Additional or replacement Commodity Brokers may be appointed in respect of the Fund in the future.
General
The Managing Owner has not established formal procedures to resolve all potential conflicts of interest. Consequently, investors may be dependent on the good faith of the respective parties subject to such conflicts to resolve them equitably. Although the Managing Owner attempts to monitor these conflicts, it is extremely difficult, if not impossible, for the Managing Owner to ensure that these conflicts do not, in fact, result in adverse consequences to the Fund and the Shareholders.
61
Table of Contents
Prospective investors should be aware that the Managing Owner presently intends to assert that Shareholders have, by subscribing for Shares, consented to the following conflicts of interest in the event of any proceeding alleging that such conflicts violated any duty owed by the Managing Owner to investors.
The Managing Owner
The Managing Owner has a conflict of interest in allocating its own limited resources among different clients and potential future business ventures, to each of which it owes fiduciary duties. Certain of the professional staff of the Managing Owner may also service other affiliates of the Managing Owner and their respective clients. The Managing Owner may, from time-to-time, have conflicting demands in respect of its obligations to the Fund and to other commodity pools and accounts. It is possible that current or future pools that the Managing Owner operates or advises may generate larger fees than the fees that the Managing Owner receives from the Fund. In such a scenario, the Managing Owner’s principals and employees may receive a greater portion of the compensation from those other mandates. Any such increase in fee income for the Managing Owner or compensation for its principals and employees would create an incentive to expend greater resources on those other mandates than on operating and advising the Fund. The Managing Owner intends to devote, and to cause its professional staff to devote, sufficient time and resources to manage properly the business and affairs of the Fund consistent with its or their respective fiduciary duties to the Fund and others.
The Managing Owner has a conflict of interest in the selection of affiliated money market mutual funds and/or T-Bill ETFs in which the Fund may invest a portion of its cash for margin and/or cash management purposes. The Managing Owner may choose to invest a portion of the Fund’s cash in an affiliated money market mutual fund and/or T-Bill ETF despite the fact that non-affiliated money market mutual funds or T-Bill ETFs may pay a higher dividend and/or make a bigger distribution of capital gains. In addition, the Managing Owner would have a conflict of interest if it sought to redeem the Fund’s interest in an affiliated money market mutual fund or T-Bill ETF in circumstances where such a redemption would be unfavorable for the affiliated fund.
The Trust Agreement provides that in the case of a conflict of interest between the Managing Owner or any of its affiliates, on the one hand, and the Trust or any other person, on the other hand, the Managing Owner shall resolve such conflict of interest, take such action or provide such terms, considering in each case the relative interest of each party (including its own interest) to such conflict, agreement, transaction or situation and the benefits and burdens relating to such interests, any customary or accepted industry practices, and any applicable generally accepted accounting practices or principles. In the absence of bad faith by the Managing Owner, the resolution, action or terms so made, taken or provided by the Managing Owner shall not constitute a breach of the Trust Agreement or any duty or obligation of the Managing Owner.
Invesco Distributors
Because the Managing Owner and Invesco Distributors are affiliates, the Managing Owner has a disincentive to replace Invesco Distributors. Furthermore, the Managing Owner did not conduct an arm’s length negotiation with respect to Invesco Distributors.
The Commodity Broker
The Commodity Broker may have a conflict of interest in its execution of trades for the Fund and for other customers. For example, the Commodity Broker may act from time-to-time as a commodity broker for other accounts with which it is affiliated or in which it or one of its affiliates has a financial interest. The compensation received by the Commodity Broker from such accounts may be more or less than the compensation received for brokerage services provided to the Fund. Customers of the Commodity Broker who maintain commodity trading accounts may pay commissions at negotiated rates which are greater or lesser than the rate paid by the Fund. The Commodity Broker will also benefit from executing orders for other clients, whereas the Fund may be harmed to the extent that the Commodity Broker has fewer resources to allocate to the Fund’s accounts due to the existence of such other clients.
In addition, various accounts traded through the Commodity Broker (and over which their personnel may have discretionary trading authority) may take positions in the futures markets opposite those of the Fund or may compete with the Fund for the same
62
Table of Contents
positions. The Managing Owner employs various methods for reviewing the Commodity Broker’s performance.
The Commodity Broker, its principals and its affiliates may trade in the commodity and foreign exchange markets for their proprietary accounts and for the accounts of their clients. In doing so, they may take positions opposite those held by the Fund, may trade ahead of the Fund, may compete with the Fund for positions in the marketplace and may give preferential treatment to these proprietary and non-proprietary accounts. Such trading may create conflicts of interest in respect of their obligations to the Fund. Records of proprietary trading and trading on behalf of other clients will not be available for inspection by Shareholders.
Certain officers or employees of the Commodity Broker may be members of United States futures exchanges and/or serve on the governing bodies and standing committees of such exchanges, their clearing houses and/or various other industry organizations. In such capacities, these officers or employees may have a fiduciary duty to the exchanges, their clearing houses and/or such various other industry organizations which could compel such employees to act in the best interests of these entities, perhaps to the detriment of the Fund.
The Index Sponsor and the Marketing Agent
DIMA, in its capacity as the Fund’s Index Sponsor and Marketing Agent, has a conflict of interest in allocating its own limited resources among different clients and potential future business ventures. Certain of the professional staff of DIMA may also service other affiliates of DIMA and their respective clients. DIMA, in its capacity as the Fund’s Index Sponsor and Marketing Agent may, from time-to-time, have conflicting demands in respect of its obligations to the Fund and to other clients. It is possible that current or future pools that DIMA may become involved with in similar capacities may generate larger fees, which may cause DIMA to devote resources to other clients that otherwise would have focused on the Fund.
Proprietary Trading/Other Clients
The Managing Owner will not trade proprietary accounts.
The principals of the Managing Owner may trade for their own proprietary accounts (subject to certain internal Invesco Ltd. employee trading policies and procedures) at the same time that they are managing the account of the Fund. As a result, the principals’ own trading activities may result in the principals taking positions in their personal trading accounts that are opposite to those held by the Fund, may trade ahead of the Fund, may compete with the Fund for positions in the marketplace and may give preferential treatment to these proprietary accounts. Records of the principals’ personal trading accounts will not be available for inspection by Shareholders.
DESCRIPTION OF THE SHARES; THE FUND; CERTAIN MATERIAL TERMS OF THE TRUST AGREEMENT
The following summary describes in brief the Shares and certain aspects of the operation of the Trust, the Fund and the respective responsibilities of the Trustee and the Managing Owner concerning the Trust and the material terms of the Trust Agreement. Prospective investors should carefully review the Trust Agreement filed as an exhibit to the registration statement of which this Prospectus is a part and consult with their own advisers concerning the implications of investing in a series of a Delaware statutory trust. Capitalized terms used in this section and not otherwise defined shall have such meanings assigned to them under the Trust Agreement.
Description of the Shares
The Fund issues common units of beneficial interest, or Shares, which represent units of fractional undivided beneficial interest in and ownership of the Fund. The Shares are listed on the NYSE Arca under the symbol “DBA.”
The Shares may be purchased from the Fund or redeemed on a continuous basis, but only by Authorized Participants and only in blocks of 200,000 Shares, or Baskets. Individual Shares may not be purchased from the Fund or redeemed. Shareholders that are not Authorized Participants may not purchase from the Fund or redeem Shares or Baskets.
Principal Office; Location of Records
The Trust was organized under the Delaware Statutory Trust Act in seven separate series as a Delaware statutory trust rather than as separate
63
Table of Contents
statutory trusts in order to achieve certain administrative efficiencies. As of the date of this Prospectus, the Trust consists of the following seven series – Invesco DB Energy Fund, Invesco DB Oil Fund, Invesco DB Precious Metals Fund, Invesco DB Gold Fund, Invesco DB Silver Fund, Invesco DB Base Metals Fund and Invesco DB Agriculture Fund. This Prospectus is for the Fund only. Information regarding the Fund (and any other additional series of the Trust, as applicable) is available at www.invesco.com/ETFs. The Trust is managed by the Managing Owner, whose office is located at 3500 Lacey Road, Suite 700, Downers Grove, IL 60515, telephone: (800) 983-0903.
The books and records of the Fund are maintained as follows: all marketing materials are maintained at the offices of Invesco Distributors, Inc., 11 Greenway Plaza, Suite 1000, Houston, Texas 77046-1173, telephone number (800) 983-0903; Basket creation and redemption books and records, certain financial books and records (including Fund accounting records, ledgers with respect to assets, liabilities, capital, income and expenses, the registrar, transfer journals and related details) and trading and related documents received from futures commission merchants are maintained by The Bank of New York Mellon, 2 Hanson Place, Brooklyn, New York 11217, telephone number (718) 315-7500. All other books and records of the Fund (including minute books and other general corporate records, trading records and related reports and other items received from the Fund’s Commodity Brokers) are maintained at the Fund’s principal office, c/o Invesco Capital Management LLC, 3500 Lacey Road, Suite 700, Downers Grove, IL 60515; telephone number (800) 983-0903.
The books and records of the Fund are available for inspection and copying (upon payment of reasonable reproduction costs) by Shareholders or their representatives for any purposes reasonably related to a Shareholder’s interest as a beneficial owner of such Shares during regular business hours as provided in the Trust Agreement. The Managing Owner will maintain and preserve the books and records of the Fund for a period of not less than six years.
The Fund
Solely for the purposes of this sub-section, the term “Fund” or “Funds” refers to all the series of the
Trust (including the DBA Fund). The term “DBA Fund” refers to the series that is offered pursuant to this Prospectus. The term “Non-DBA Funds” refers to all the remaining series of the Trust, excluding the DBA Fund.
The Trust was formed and is operated in a manner such that the Funds are liable only for obligations attributable to the applicable Funds and the Shareholders are not subject to the losses or liabilities of any of the other Funds. For example, if any creditor or Shareholder in a Non-DBA Fund asserted against the DBA Fund a valid claim with respect to its indebtedness or Shares, the creditor or Shareholder of the Non-DBA Fund would only be able to recover money from that particular Non-DBA Fund and its assets. Accordingly, the debts, liabilities, obligations and expenses (collectively, the “Claims”) incurred, contracted for or otherwise existing solely with respect to a particular Non-DBA Fund are enforceable only against the assets of that Non-DBA Fund and not against the DBA Fund or any other Non-DBA Fund or the Trust generally or any of their respective assets. The assets of any particular Fund include only those funds and other assets that are paid to, held by or distributed to such Fund, including, without limitation, funds delivered to the Trust for the purchase of Shares in such Fund (the “Inter-Series Limitation on Liability”). The Inter-Series Limitation on Liability is expressly provided for under the Delaware Statutory Trust Act, which provides that if certain conditions (as set forth in Section 3804(a)) are met, then the debts of any particular series will be enforceable only against the assets of such series and not against the assets of any other Fund or the Trust generally. The Inter-Series Limitation on Liability applies to all series of the Trust, including those that are not being offered through this Prospectus.
In furtherance of the Inter-Series Limitation on Liability, every party providing services to the Trust, any Fund or the Managing Owner on behalf of the Trust or any Fund has acknowledged and consented in writing to the Inter-Series Limitation on Liability with respect to such party’s Claims.
No special custody arrangements are applicable to any Fund, and the existence of a trustee should not be taken as an indication of any additional level of management or supervision over any Fund. Under the
64
Table of Contents
Trust Agreement, the Managing Owner has exclusive management and control of all aspects of the business of the Fund.
The Trust Agreement gives Shareholders of the DBA Fund voting rights in respect of the business and affairs of the DBA Fund.
The Trustee
Wilmington Trust Company, a Delaware trust company, is the sole Trustee of the Trust and the Fund. The Trustee’s principal offices are located at Rodney Square North, 1100 North Market Street, Wilmington, Delaware 19890-0001. The Trustee is unaffiliated with the Managing Owner. The Trustee’s duties and liabilities with respect to the offering of the Shares and the management of the Trust and the Fund are limited to its express obligations under the Trust Agreement.
The rights and duties of the Trustee, the Managing Owner and the Shareholders are governed by the provisions of the Delaware Statutory Trust Act and by the Trust Agreement.
The Trustee serves as the sole trustee of the Trust in the State of Delaware. The Trustee will accept service of legal process on the Trust and the Fund in the State of Delaware and will make certain filings under the Delaware Statutory Trust Act. The Trustee does not owe any other duties to the Trust, the Managing Owner or the Shareholders. The Trustee is permitted to resign upon at least sixty (60) days’ notice to the Trust, provided, that any such resignation will not be effective until a successor Trustee is appointed by the Managing Owner. The Trust Agreement provides that the Trustee is compensated by the Fund and is indemnified by the Fund against any expenses it incurs relating to or arising out of the formation, operation or termination of the Fund or the execution, delivery and performance of any other agreements to which the Trust is a party or the action or inaction of the Trustee, except to the extent that such expenses result from the gross negligence or willful misconduct of the Trustee. The Managing Owner has the discretion to replace the Trustee.
The Trustee’s liability is limited solely to the express obligations of the Trustee set forth in the Trust Agreement.
The Trustee has no duty or liability to supervise or monitor the performance of the Managing Owner,
nor does the Trustee have any liability for the acts or omissions of the Managing Owner in accordance with the Managing Owner’s instructions. The Shareholders have no voice in the day-to-day management of the business and operations of the Fund and the Trust, other than certain limited voting rights as set forth in the Trust Agreement. In the course of its management of the business and affairs of the Fund and the Trust, the Managing Owner may, in its sole and absolute discretion, appoint an affiliate or affiliates of the Managing Owner as additional managing owners (except where the Managing Owner has been notified by the Shareholders that it is to be replaced as the managing owner) and retain such persons, including affiliates of the Managing Owner, as it deems necessary for the efficient operation of the Fund or the Trust, as appropriate.
The Trustee is not registered in any capacity with the CFTC.
The Managing Owner
Background and Principals
Invesco Capital Management LLC, a Delaware limited liability company, is the Managing Owner of the Trust and the Fund. The Managing Owner was formed on February 7, 2003 for the purpose of serving as the managing owner of investment vehicles such as ETFs. The Managing Owner has managed non-commodity futures based ETFs since 2003 and a commodity futures based ETF since 2014. The Managing Owner serves as both commodity pool operator and commodity trading advisor of the Trust and the Fund. The Managing Owner has been registered with the CFTC as a commodity pool operator since January 1, 2013, a commodity trading advisor since October 1, 2014 and has been a member of the NFA since January 1, 2013. It has been an NFA-approved swap firm since September 8, 2015. Its principal place of business is 3500 Lacey Road, Downers Grove, Illinois 60515, telephone number (800) 983-0903. The Managing Owner is an affiliate of Invesco Ltd. The registration of the Managing Owner with the CFTC and its membership in the NFA must not be taken as an indication that either the CFTC or the NFA has recommended or approved the Managing Owner, the Trust or the Fund.
In its capacity as a commodity pool operator, the Managing Owner operates or solicits funds for
65
Table of Contents
commodity pools; that is, an enterprise in which funds contributed by a number of persons are combined for the purpose of trading futures contracts. In its capacity as a commodity trading advisor, the Managing Owner advises others as to the value of or the advisability of buying or selling futures contracts.
The Managing Owner has served as the managing owner, commodity pool operator, and commodity trading advisor of the Fund since February 23, 2015, which is the date upon which the Managing Owner assumed those responsibilities for the Fund from the Predecessor Managing Owner. Please see the chart on page 33 for information regarding past performance of the Fund.
Effective June 4, 2018, the name of the Managing Owner changed from Invesco PowerShares Capital Management LLC to Invesco Capital Management LLC, the name of the Trust changed from PowerShares DB Multi-Sector Commodity Trust to Invesco DB Multi-Sector Commodity Trust, and the name of the Fund changed from PowerShares DB Agriculture Fund to Invesco DB Agriculture Fund.
Principals
The following principals serve in the below capacities on behalf of the Managing Owner:
| Name |
Capacity | |
| Daniel Draper | Chief Executive Officer, Board of Managers | |
| Peter Hubbard | Vice President and Director of Portfolio Management | |
| David Warren | Chief Administrative Officer, Board of Managers | |
| Annette Lege | Principal | |
| Melanie Zimdars | Chief Compliance Officer | |
| Kelli Gallegos | Principal Financial and Accounting Officer, Investment Pools | |
| John Zerr | Board of Managers | |
| Brian Hartigan | Global Head of ETF Investments | |
Invesco North American Holdings Inc. is also a principal of the Managing Owner.
The Managing Owner is managed by a Board of Managers. The Board of Managers is composed of Messrs. Draper, Warren and Zerr.
The Managing Owner has designated Mr. Hubbard as the trading principal of the Fund.
Daniel Draper (49) has been Chief Executive Officer of the Managing Owner since March 24, 2016. In this role, he has general oversight responsibilities for all of the Managing Owner’s business. Mr. Draper has been a Member of the Board of Managers of the Managing Owner since September 2013. In this role he is responsible for the management of the Managing Owner’s exchange traded fund business with direct functional reporting responsibilities for the Managing Owner’s portfolio management, products, marketing and capital markets teams. In such capacity, Mr. Draper also is responsible for managing the operations of the Invesco Funds. Previously, Mr. Draper was the Global Head of Exchange Traded Funds for Credit Suisse Asset Management (“Credit Suisse”) based in London from March 2010 until June 2013, followed by a three month non-compete period pursuant to his employment terms with Credit Suisse. Credit Suisse is an asset management business of Credit Suisse Group, a financial services company. From January 2007 to March 2010, he was the Global Head of Exchange Traded Funds for Lyxor Asset Management in London, an investment management business unit of Societe Generale Corporate & Investment Banking. Mr. Draper was previously registered as a Significant Influence Functions (“SIF”) person with the UK’s Financial Conduct Authority. He withdrew SIF person status on June 30, 2013 when he left Credit Suisse. Mr. Draper received his MBA from the Kenan-Flagler Business School at the University of North Carolina at Chapel Hill and his BA from the College of William and Mary in Virginia. Mr. Draper is currently registered with FINRA and holds the Series 7, 24 and 63 registrations. Mr. Draper was listed as a principal of the Managing Owner on December 16, 2013.
Peter Hubbard (37) joined the Managing Owner in May 2005 as a portfolio manager and has been Vice President, Director of Portfolio Management since September 2012. In his role, Mr. Hubbard manages a team of eight portfolio managers. His responsibilities include facilitating all portfolio management processes associated with more than 150 equity and fixed income Invesco Funds listed in the United States, Canada and Europe. He is a graduate of Wheaton College with a B.A. degree in Business & Economics. Mr. Hubbard was listed as a
66
Table of Contents
principal and registered as an associated person of the Managing Owner on November 15, 2012 and January 1, 2013, respectively. Mr. Hubbard was registered as a swap associated person of the Managing Owner effective as of September 8, 2015.
David Warren (60) is Chief Administrative Officer, Americas, for Invesco Ltd., a global investment management company affiliated with the Managing Owner. He was appointed to this position in January 2007, and also holds the roles of Director, Executive Vice President and Chief Financial Officer of Invesco Canada Ltd., a Canadian investment management subsidiary of Invesco Ltd., since January 2009. He has been a Member of the Board of Managers and Chief Administrative Officer of the Managing Owner since January 2010, as well. In these capacities, Mr. Warren is responsible for general management support, in addition to executing on various strategic initiatives and overseeing the risk management framework for the business units operating within the Americas division of Invesco Ltd. He obtained a Bachelor’s Degree in Commerce from the University of Toronto as both a CA and certified public accountant (“CPA”) and is a member of the Chartered Professional Accountants of Canada. Mr. Warren was listed as a principal of the Managing Owner on November 21, 2012.
Annette Lege (48) has been a Chief Accounting Officer and Head of Finance and Corporate Services (“FCS”) Business Services for Invesco Ltd. since March 2017. In this role, she is responsible for all aspects of Corporate Accounting including group financial reporting, internal controls and group accounting policies. Ms. Lege also manages Invesco’s Finance operations and shared service centers and has held this role since September 2015. Previously, Ms. Lege was Head of FCS Transformation Office from October 2013 through September 2015, with responsibility for business transformation initiatives taking place across FCS at Invesco. Before assuming that role in October 2013, Ms. Lege held the position of North American Corporate Controller at Invesco from March 2007 to October 2013. Ms. Lege is also a CPA, is licensed by FINRA as a Financial Operations Principal, and is a member of the Texas State Board of Public Accountants. Ms. Lege earned a BBA in accounting from the University of Houston. Ms. Lege was listed as a principal of the Managing Owner on March 30, 2017 and was listed as a principal of Invesco Advisors, Inc. on March 22, 2017.
Melanie H. Zimdars (41) has been Chief Compliance Officer of the Managing Owner since November 2017. In this role she is responsible for all aspects of regulatory compliance for the Managing Owner. Ms. Zimdars has also served as Chief Compliance Officer of Invesco Exchange-Traded Fund Trust, Invesco Exchange-Traded Fund Trust II, Invesco India Exchange-Traded Fund Trust, Invesco Actively Managed Exchange-Traded Fund Trust and Invesco Actively Managed Exchange-Traded Commodity Fund Trust since November 2017. From September 2009 to October 2017, she served as Vice President and Deputy Chief Compliance Officer at ALPS Holdings, Inc. where she was Chief Compliance Officer for six different mutual fund complexes, including active and passive ETFs and open-end and closed-end funds. Through its subsidiary companies, ALPS Holdings, Inc. is a provider of investment products and customized servicing solutions to the financial services industry. Ms. Zimdars received a BS degree from the University of Wisconsin-La Crosse. Ms. Zimdars was listed as a principal of the Managing Owner on February 1, 2018.
Kelli Gallegos (48) has been Principal Financial and Accounting Officer – Investment Pools for the Managing Owner since September 2018. Additionally, since September 2018, Ms. Gallegos has been Principal Financial and Accounting Officer – Investment Pools of Invesco Specialized Products, LLC (sponsor to a suite of currency exchange-traded funds, “ISP”), Head of North America Fund Reporting of Invesco, Ltd. (“Invesco”, a global investment management company), and Vice President and Treasurer of Invesco Exchange Traded Fund Trust, Invesco Exchange-Traded Fund Trust II, Invesco India Exchange-Traded Fund Trust, Invesco Actively Managed Exchange-Traded Fund Trust, Invesco Actively Managed Exchange-Traded Commodity Fund Trust, and Invesco Exchange-Traded Self-Indexed Fund Trusts (each a registered investment company offering series of exchange-traded funds, the “Invesco ETFs”). She also serves as Vice President (since March 2016), Principal Financial Officer (since March 2016) and Assistant Treasurer (since December 2008) for a suite of mutual funds advised by Invesco Advisers, Inc., a registered investment adviser (the “Invesco Funds”). In her roles with the Managing Owner, ISP, Invesco, the Invesco ETFs and the Invesco Funds, Ms. Gallegos has financial and administrative
67
Table of Contents
oversight responsibilities for, and serves as Principal Financial Officer of the Invesco ETFs, the Trust, the Fund and the exchange-traded funds for which ISP serves as sponsor (the “CurrencyShares Trusts”). Previously, she was Director of Fund Financial Services from December 2008 to September 2018, Assistant Treasurer for the Managing Owner from January 2013 to September 2018, Assistant Treasurer of ISP from April 2018 to September 2018, Assistant Treasurer for the Invesco ETFs from September 2014 to September 2018 and Assistant Vice President for the Invesco Funds from December 2008 to March 2016. In such roles, Ms. Gallegos managed the group of personnel responsible for the preparation of fund financial statements and other information necessary for shareholder reports, fund prospectuses, regulatory filings, and for the coordination and oversight of third-party service providers of the Fund, the Invesco ETFs, the Invesco Funds, and the CurrencyShares Trusts. Ms. Gallegos earned a BBA in accounting from Harding University in Searcy, AR. Ms. Gallegos was listed as a pending principal of the Managing Owner on September 21, 2018.
John Zerr (55) has been a Member of the Board of Managers of the Managing Owner since September 2006. Mr. Zerr also serves as Chief Operating Officer of the Americas for Invesco Ltd since February 2018. Prior to his current position, Mr. Zerr served as Managing Director and General Counsel for U.S. Retail of Invesco Management Group, Inc., a registered investment adviser affiliated with the Managing Owner, from March 2006 until February 2018, where he was responsible for overseeing the U.S. Retail Legal Department for Invesco Ltd. and its affiliated companies. Mr. Zerr has also been a Senior Vice President and Secretary of IDI since March 2006 and June 2006, respectively. He also served as a Director of that entity until February 2010. Mr. Zerr has served as Senior Vice President of Invesco Advisers, Inc., a registered investment adviser affiliated with the Managing Owner, since December 2009. Mr. Zerr serves as a Director, Vice President and Secretary of Invesco Investment Services, Inc., a registered transfer agency since May 2007. Mr. Zerr has served as Director, Senior Vice President, General Counsel and Secretary of a number of other Invesco Ltd. wholly-owned subsidiaries which service or serviced portions of Invesco Ltd.’s U.S. Retail business since May 2007 and since June 2010 with respect to certain Van Kampen entities engaged in the asset
management business that were acquired by Invesco Ltd. from Morgan Stanley. In each of the foregoing positions Mr. Zerr is responsible for overseeing legal operations. In such capacity, Mr. Zerr also is responsible for overseeing the legal activities of the Invesco Funds. Mr. Zerr earned a BA degree in economics from Ursinus College. He graduated cum laude with a J.D. from Temple University School of Law. Mr. Zerr was listed as a principal of the Managing Owner on December 6, 2012.
Brian Hartigan (39) joined the Managing Owner in May 2015 as Global Head of ETF Investments. In his role, Mr. Hartigan manages the portfolio management function at the Managing Owner, with the Director of Portfolio Management reporting to him. Previously from June 2010 until May of 2015, Mr. Hartigan was the Head of Portfolio Management and Research for Invesco Capital Markets, Inc., the sponsor of unit investment trusts. In that role, he oversaw portfolio management of Invesco unit trusts. He earned his B.A. from the University of St. Thomas in Minnesota and an MBA in finance from DePaul University. He is a CFA charterholder and a member of the CFA Society of Chicago. Mr. Hartigan was listed as a principal and registered as an associated person of the Managing Owner on February 21, 2018 and May 29, 2018, respectively.
Invesco North American Holdings Inc., which is a wholly owned, indirect subsidiary of Invesco Ltd., has been a principal of the Managing Owner since October, 2006 and has been listed as a principal with NFA since October 26, 2012 in connection with the Managing Owner’s registration with the CFTC.
Ownership or Beneficial Interest in the Fund
As of the date of this Prospectus, the Managing Owner and the principals of the Managing Owner own less than 1% of the Shares.
Management; Voting by Shareholders; Negative Consent
The Shareholders take no part in the management or control, and have no voice in the operations or the business of the Trust or the Fund. Shareholders, voting together as a single series, may, however, remove and replace the Managing Owner as the managing owner of the Trust and the Fund, and may amend the Trust Agreement, except in
68
Table of Contents
certain limited respects, by the affirmative vote of a majority of the outstanding Shares then owned by Shareholders (not including shares held by the Managing Owner and its affiliates). The owners of a majority of the outstanding Shares then owned by Shareholders may also compel dissolution of the Trust and the Fund. The owners of 10% of the outstanding Shares then owned by Shareholders have the right to bring a matter before a vote of the Shareholders. The Managing Owner has no power under the Trust Agreement to restrict any of the Shareholders’ voting rights. Any Shares purchased by the Managing Owner or its affiliates, as well as the Managing Owner’s general interests in the Fund or the Trust, are non-voting.
Any action required or permitted to be taken by Shareholders by vote may be taken without a meeting by written consent setting forth the actions so taken. The written consents will be treated for all purposes as votes at a meeting. If the vote or consent of any Shareholder to any action of the Trust, the Fund or any Shareholder, as contemplated by the Trust Agreement, is solicited by the Managing Owner, the solicitation will be effected by notice to each Shareholder given in the manner provided by the Trust Agreement.
The Trust Agreement permits the approval of actions through the negative consent of Shareholders. As provided in the Trust Agreement, the vote or consent of each Shareholder so solicited will be deemed conclusively to have been cast or granted as requested in the notice of solicitation, whether or not the notice of solicitation is actually received by that Shareholder, unless the Shareholder expresses written objection to the vote or consent by notice given in the manner provided in the Trust Agreement and actually received by the Trust within twenty (20) days after the notice of solicitation is effected. Because the Trust Agreement provides for negative consent (e.g., that Shareholders are deemed to have consented unless they timely object), a Shareholder’s consent will be deemed conclusively to have been granted with respect to any matter for which the Managing Owner may solicit Shareholder consent unless the Shareholder expresses written objection in the manner required by the Trust Agreement and the written objection is actually received by the Trust within twenty (20) days after the notice of solicitation is effected. This means that not responding to the vote or consent solicitation would have the same
effect as responding with affirmative written consent. For example, in the context of a consent solicitation to change the managing owner or any other action, a Shareholder’s lack of a response will have the same effect as if the Shareholder had provided affirmative written consent for the proposed action.
The Managing Owner and all persons dealing with the Trust will be entitled to act in reliance on any vote or consent which is deemed cast or granted pursuant to the negative consent provision and will be fully indemnified by the Trust in so doing. Any action taken or omitted in reliance on this deemed vote or consent of one or more Shareholders will not be void or voidable by reason of timely communication made by or on behalf of all or any of these Shareholders in any manner other than as expressly provided in the Trust Agreement.
The Managing Owner has the unilateral right to amend the Trust Agreement as it applies to the Fund provided that any such amendment is for the benefit of and not adverse to the Shareholders or the Trustee and also in certain unusual circumstances, for example, if doing so is necessary to comply with certain regulatory requirements.
Recognition of the Trust and the Fund in Certain States
A number of states do not have “business trust” statutes such as that under which the Trust has been formed in the State of Delaware. It is possible, although unlikely, that a court in such a state could hold that, due to the absence of any statutory provision to the contrary in such jurisdiction, the Shareholders, although entitled under Delaware law to the same limitation on personal liability as stockholders in a private corporation for profit organized under the laws of the State of Delaware, are not so entitled in such state. To protect Shareholders against any loss of limited liability, the Trust Agreement provides that no written obligation may be undertaken by the Fund unless such obligation is explicitly limited so as not to be enforceable against any Shareholder personally. Furthermore, the Fund itself indemnifies all its Shareholders against any liability that such Shareholders might incur in addition to that of a beneficial owner.
69
Table of Contents
Possible Repayment of Distributions Received by Shareholders; Indemnification by Shareholders
The Shares are limited liability investments; investors may not lose more than the amount that they invest including any appreciation in their investments. However, Shareholders could be required, as a matter of bankruptcy law, to return to the estate of the Fund any distribution they received at a time when the Fund was in fact insolvent or in violation of the Trust Agreement. In addition, Shareholders agree in the Trust Agreement that they will indemnify the Fund for any harm suffered by it as a result of:
| • | Shareholders’ actions unrelated to the business of the Fund; or |
| • | taxes separately imposed on the Fund by any state, local or foreign taxing authority. |
Shares Freely Transferable
The Shares trade on the NYSE Arca and provide institutional and retail investors with direct access to the Fund. The Shares may be bought and sold on the NYSE Arca.
Book-Entry Form
Individual certificates will not be issued for the Shares. Instead, global certificates are deposited by the Trustee with DTC and registered in the name of Cede & Co., as nominee for DTC. The global certificates evidence all of the Shares outstanding at any time. Under the Trust Agreement, Shareholders are limited to (1) participants in DTC such as banks, brokers, dealers and trust companies (“DTC Participants”), (2) those who maintain, either directly or indirectly, a custodial relationship with a DTC Participant (“Indirect Participants”), and (3) those banks, brokers, dealers, trust companies and others who hold interests in the Shares through DTC Participants or Indirect Participants. The Shares are only transferable through the book-entry system of DTC. Shareholders who are not DTC Participants may transfer their Shares through DTC by instructing the DTC Participant holding their Shares (or by instructing the Indirect Participant or other entity through which their Shares are held) to transfer the Shares. Transfers are made in accordance with standard securities industry practice.
Reports to Shareholders
The Managing Owner will furnish you with an annual report of the Fund within 90 calendar days after the end of its fiscal year as required by the rules and regulations of the SEC as well as with those reports required by the CFTC and the NFA, including, but not limited to, annual audited financial statements certified by independent registered public accountants and any other reports required by any other governmental authority that has jurisdiction over the activities of the Trust and the Fund. You also will be provided with appropriate information to permit you to file your U.S. federal and state income tax returns (on a timely basis) with respect to your Shares. Monthly account statements conforming to CFTC and NFA requirements are posted on the Managing Owner’s website at www.invesco.com/ETFs. Additional reports may be posted on the Managing Owner’s website in the discretion of the Managing Owner or as required by applicable regulatory authorities.
The Managing Owner will notify Shareholders of any change in the fees paid by the Trust or of any material changes to the Fund by filing with the SEC a supplement to this Prospectus and a Form 8-K, which will be publicly available at http://www.sec.gov and at the Managing Owner’s website at www.invesco.com/ETFs. Any such notification will include a description of Shareholders’ voting rights.
NAV
NAV means the total assets of the Fund including, but not limited to, all cash and cash equivalents or other debt securities less total liabilities of the Fund, each determined on the basis of generally accepted accounting principles in the United States, consistently applied under the accrual method of accounting. In particular, NAV includes any unrealized profit or loss on open futures positions, and any other credit or debit accruing to the Fund but unpaid or not received by the Fund. All open commodity futures contracts traded on a U.S. exchange are calculated at their then current market value, which are based upon the settlement price for that particular commodity futures contract traded on the applicable U.S. exchange on the date with respect to which NAV is being determined; provided, that if a commodity futures contract or option traded on a U.S. exchange could not be liquidated on such day, due to the operation of daily limits or other rules of
70
Table of Contents
the exchange upon which that position is traded or otherwise, the Managing Owner may value such futures contract or option pursuant to policies the Managing Owner has adopted. The current market value of all open commodity futures contracts traded on a non-U.S. exchange will be based upon the settlement price for that particular commodity futures contract traded on the applicable non-U.S. exchange on the date with respect to which NAV is being determined; provided further, that if a futures contract traded on a non-U.S. exchange could not be liquidated on such day, due to the operation of daily limits (if applicable) or other rules of the exchange upon which that position is traded or otherwise, the Managing Owner may value such futures contract pursuant to policies the Managing Owner has adopted. The current market value of all open forward contracts entered into by the Fund, if any, shall be the mean between the last bid and last asked prices quoted by the bank or financial institution which is a party to the contract on the date with respect to which NAV is being determined; provided, that if such quotations are not available on such date, the mean between the last bid and asked prices on the first subsequent day on which such quotations are available shall be the basis for determining the market value of such forward contract for such day. The Managing Owner may in its discretion (and under extraordinary circumstances, including, but not limited to, periods during which a settlement price of a futures contract is not available due to exchange limit orders or force majeure type events such as systems failure, natural or man-made disaster, act of God, armed conflict, act of terrorism, riot or labor disruption or any similar intervening circumstance) value any asset of the Fund pursuant to such other principles as the Managing Owner deems fair and equitable. Interest earned on the Fund’s commodity brokerage account is accrued at least monthly. The amount of any distribution will be a liability of the Fund from the day when the distribution is declared until it is paid.
NAV per Share is the NAV of the Fund divided by the number of outstanding Shares.
Termination Events
The Trust, or, as the case may be, the Fund, will dissolve at any time upon the happening of any of the following events:
| • | The filing of a certificate of dissolution or revocation of the Managing Owner’s charter |
| (and the expiration of 90 days after the date of notice to the Managing Owner of revocation without a reinstatement of its charter) or upon the withdrawal, removal, adjudication or admission of bankruptcy or insolvency of the Managing Owner, or an event of withdrawal unless (i) at the time there is at least one remaining managing owner and that remaining managing owner carries on the business of the Fund or (ii) within 90 days of such event of withdrawal all the remaining Shareholders agree in writing to continue the business of the Fund and to select, effective as of the date of such event, one or more successor managing owners. If the Trust is terminated as the result of an event of withdrawal and a failure of all remaining Shareholders to continue the business of the Trust and to appoint a successor managing owner as provided above within 120 days of such event of withdrawal, Shareholders holding Shares representing at least a majority (over 50%) of the NAV of the Fund (not including Shares held by the Managing Owner and its affiliates) may elect to continue the business of the Trust by forming a new statutory trust (“Reconstituted Trust”) on the same terms and provisions as set forth in the Trust Agreement (whereupon the Managing Owner and the Trustee shall execute and deliver any documents or instruments as may be necessary to reform the Trust). Any such election must also provide for the election of a managing owner to the Reconstituted Trust. If such an election is made, all Shareholders shall be bound thereby and continue as Shareholders of the reconstituted trust. |
| • | The occurrence of any event which would make unlawful the continued existence of the Trust or the Fund, as the case may be. |
| • | In the event of the suspension, revocation or termination of the Managing Owner’s registration as a commodity pool operator or commodity trading advisor under the Commodity Exchange Act, or membership as a commodity pool operator or trading advisor with the NFA (if, in either case, such registration is required under the |
| Commodity Exchange Act or the rules |
71
Table of Contents
| promulgated thereunder) unless at the time there is at least one remaining managing owner whose registration or membership has not been suspended, revoked or terminated. |
| • | The Trust or the Fund, as the case may be, becomes insolvent or bankrupt. |
| • | The Shareholders holding Shares representing at least a majority (over 50%) of the NAV (which excludes the Shares of the Managing Owner) vote to dissolve the Trust, notice of which is sent to the Managing Owner not less than ninety (90) Business Days prior to the effective date of termination. |
| • | The determination of the Managing Owner that the aggregate net assets of the Fund in relation to the operating expenses of the Fund make it unreasonable or imprudent to continue the business of the Fund, or, in the exercise of its reasonable discretion, the determination by the Managing Owner to dissolve the Trust because the aggregate NAV of the Trust as of the close of business on any business day declines below $10 million. |
| • | The Trust or the Fund is required to be registered as an investment company under the Investment Company Act of 1940, as amended. |
| • | DTC is unable or unwilling to continue to perform its functions, and a comparable replacement is unavailable. |
The Managing Owner has discretionary authority over all distributions made by the Fund. To the extent that the Fund’s actual and projected Treasury Income and the Fund’s actual and projected Money Market Income and the Fund’s actual and projected T-Bill ETF Income exceeds the actual and projected fees and expenses of the Fund, the Managing Owner expects periodically to make distributions of the amount of such excess. The Managing Owner currently does not expect to make distributions with respect to the Fund’s capital gains. Depending on the Fund’s performance for the taxable year and your own tax situation for such year, your income tax liability for the taxable year for your
allocable share of the Fund’s net ordinary income or loss and capital gain or loss may exceed any distributions you receive with respect to such year.
THE ADMINISTRATOR, CUSTODIAN AND TRANSFER AGENT
The Bank of New York Mellon is the administrator of the Fund and has entered into an Administration Agreement in connection therewith. The Bank of New York Mellon serves as the Custodian and has entered into the Custody Agreement in connection therewith. The Bank of New York Mellon serves as the Transfer Agent of the Fund and has entered into a Transfer Agency and Service Agreement in connection therewith.
The Bank of New York Mellon, a banking corporation organized under the laws of the State of New York with trust powers, has an office at 2 Hanson Place, Brooklyn, New York 11217. The Bank of New York Mellon is subject to supervision by the New York State Banking Department and the Board of Governors of the Federal Reserve System. Information regarding the NAV of the Fund, creation and redemption transaction fees and the names of the parties that have executed a Participant Agreement may be obtained from The Bank of New York Mellon by calling the following number: (718) 315-7500. A copy of the Administration Agreement is available for inspection at The Bank of New York Mellon’s office identified above.
The Administrator retains certain financial books and records, including: Fund accounting records, ledgers with respect to assets, liabilities, capital, income and expenses, the registrar, transfer journals and related details and trading and related documents received from futures commission merchants, c/o The Bank of New York Mellon, 2 Hanson Place, Brooklyn, New York 11217, telephone number (718) 315-7500.
A summary of the material terms of the Administration Agreement is disclosed in the “Material Contracts” section.
The Administrator’s monthly fees of up to 0.05% per annum are paid on behalf of the Fund by the Managing Owner out of the Management Fee.
The Administrator and any of its affiliates may from time to time purchase or sell Shares for their
72
Table of Contents
own account, as agent for their customers and for accounts over which they exercise investment discretion.
The Administrator and any successor administrator must be a participant in DTC or such other securities depository as shall then be acting.
The Transfer Agent receives a transaction processing fee in connection with orders from Authorized Participants to create or redeem Baskets in the amount of $500 per order. These transaction processing fees are paid directly by the Authorized Participants and not by the Fund.
The Trust may retain the services of one or more additional service providers to assist with certain tax reporting requirements of the Fund and the Shareholders.
Invesco Distributors assists the Managing Owner with certain functions and duties relating to distribution and marketing, which include the following: consultation with the marketing staff of the Managing Owner and its affiliates with respect to FINRA compliance in connection with marketing efforts; review and filing of marketing materials with FINRA; and consultation with the Managing Owner and its affiliates in connection with marketing and sales strategies. Investors may contact Invesco Distributors toll-free in the U.S. at (800) 983-0903.
Invesco Distributors retains all marketing materials for the Fund, at the offices of Invesco Distributors, Inc., 11 Greenway Plaza, Suite 1000, Houston, Texas 77046-1173; telephone number (800) 983-0903.
The Managing Owner, out of the Management Fee, pays Invesco Distributors $25,000 annually ($6,250 per quarter) for performing its duties on behalf of the Fund. Such services may include, among other services, reviewing distribution related legal documents and contracts, consulting on marketing or sales strategy, maintaining certain books and records in respect of the Fund and performing additional marketing and distribution related services as may be agreed upon by Invesco Distributors and the Managing Owner. Invesco Distributors is affiliated with the Managing Owner.
The Managing Owner, on behalf of the Fund, has appointed DIMA to serve as the Index Sponsor. The Index Sponsor calculates and publishes the daily index levels and the indicative intraday index levels. The Index Sponsor also calculates the IIV per Share throughout each Business Day. The Index Sponsor may subcontract its services from time to time to one or more third parties.
The Managing Owner pays the Index Sponsor a licensing fee and an index services fee out of the Management Fee for performing its duties. These fees constitute a portion of the routine operational, administrative and other ordinary expenses and are paid from out of the Management Fee and are not charged to or reimbursed by the Fund.
Neither the Managing Owner nor any affiliate of the Managing Owner has any rights to influence the selection of the futures contracts underlying the Index.
The Index Sponsor is not affiliated with the Fund or the Managing Owner. The Managing Owner has entered into a license agreement with the Index Sponsor to use the Index.
The Index Sponsor makes no representation regarding the advisability of investing in Shares.
There is no relationship between the Index Sponsor and the Managing Owner or the Fund other than a services agreement and a license by the Index Sponsor to the Managing Owner of certain of the Index Sponsor’s trademarks and trade names, and the Index, for use by the Managing Owner or the Fund. Such trademarks, trade names and the Index have been created and developed by the Index Sponsor without regard to, and independently of, the Managing Owner and the Fund, their businesses, and/or any prospective investor. The Fund and the Managing Owner have arranged with the Index Sponsor to license the Index for possible inclusion in funds which the Managing Owner independently intends to develop and promote. The Index Sponsor is not responsible for and has not participated in the determination of the prices and amount of Shares or the timing of the issuance or sale of Shares or in the determination of any financial calculations relating thereto. The Index Sponsor has no obligation or liability in connection with the administration of the
73
Table of Contents
Fund, or marketing of the Shares. The Index Sponsor does not guarantee the accuracy and/or the completeness of the Index or any data included therein. The Index Sponsor shall have no liability for any errors, omissions, or interruptions therein. The Index Sponsor makes no warranty, express or implied, as to results to be obtained by the Managing Owner, the Fund or owners of Shares, or any other person or entity, from the use of the Index or any data included therein. The Index Sponsor makes no express or implied warranties, and expressly disclaims all warranties of merchantability or fitness for a particular purpose or use with respect to the Index or any data included therein, the Fund, or the Shares. DIMA has entered into a services agreement with the Managing Owner. The agreement between the Managing Owner and DIMA as Index Sponsor relates to the Managing Owner’s sponsorship not only of the Fund but of other commodity pools and ETFs. The agreement is for an initial six year term which commenced on February 26, 2015, with additional one-year renewal terms unless terminated.
Both the Managing Owner and DIMA have the right to terminate on notice subject to payment of a termination fee, both with respect to a given fund and with respect to all funds subject to these agreements. Each party also has the right to terminate for cause, although the Managing Owner’s ability to exercise this right is restricted to a narrow set of circumstances during the initial six-year term. Accordingly, there may be circumstances where the Managing Owner would otherwise believe cause exists to terminate DIMA but where it would have to rely on its right to terminate at will. The termination fee payable by the Managing Owner would be based on anticipated fee payments under these agreements during the remainder of the initial six-year term, and therefore could be sufficiently high as to deter the Managing Owner from exercise of these termination rights. These termination fees would also be triggered by certain other termination rights of DIMA, including in the event of a change of control of the Managing Owner or changes of law affecting the licenses or services to be provided by DIMA. As a consequence of these termination fee rights, DIMA may elect to terminate these licenses and services under certain circumstances where, were these being provided under stand-alone arrangements in respect of the Fund, it might not elect to terminate the business relationship. Termination of the agreements between DIMA and the Managing Owner could
result in disruption to the affairs of the Fund, including the need to adopt new indices and engage a replacement index sponsor.
Without limiting any of the foregoing, in no event shall the Index Sponsor have any liability for any special, punitive, indirect, or consequential damages (including lost profits) resulting from the use of the Index or any data included therein, the Fund, or the Shares, even if notified of the possibility of such damages.
The Index Sponsor shall not be liable to the Managing Owner, the Fund, or the owners of any Shares for any loss or damage, direct or indirect, arising from (i) any inaccuracy or incompleteness in, or delays, interruptions, errors or omissions in the delivery of the Index or any data related thereto, the Index Data, or (ii) any decision made or action taken by any customer or third party in reliance upon the Index Data. The Index Sponsor does not make any warranties, express or implied, to the Managing Owner, the Fund or owners of Shares or anyone else regarding the Index Data, including without limitation, any warranties with respect to the timeliness, sequence, accuracy, completeness, currentness, merchantability, quality, or fitness for a particular purpose or any warranties as to the results to be obtained by the Managing Owner, the Fund or owners of Shares or anyone else in connection with the use of the Index Data. The Index Sponsor shall not be liable to the Managing Owner, the Fund or owners of Shares or anyone else for loss of business revenues, lost profits or any indirect, consequential, special or similar damages whatsoever, whether in contract, tort or otherwise, even if advised of the possibility of such damages.
The Managing Owner does not guarantee the accuracy and/or the completeness of the Index or any Index Data included therein, and the Managing Owner shall have no liability for any errors, omissions, or interruptions therein. The Managing Owner makes no warranty, express or implied, as to results to be obtained by the Fund, owners of the Shares or any other person or entity from the use of the Index or any Index Data included therein. The Managing Owner makes no express or implied warranties, and expressly disclaims all warranties of merchantability or fitness for a particular purpose or use with respect to each Underlying Index or any Index Data included therein. Without limiting any of
74
Table of Contents
the foregoing, in no event shall the Managing Owner have any liability for any special, punitive, direct, indirect or consequential damages (including lost profits) arising out of matters relating to the use of the Index even if notified of the possibility of such damages.
Pursuant to a services agreement, the Managing Owner, on behalf of the Fund, has appointed DIMA as Marketing Agent to assist the Managing Owner by providing support to educate institutional investors about the Deutsche Bank indices and to complete governmental or institutional due diligence questionnaires or requests for proposals related to the Deutsche Bank indices.
The Managing Owner pays the Marketing Agent a marketing services fee out of the Management Fee for performing its duties.
The Marketing Agent will not open or maintain customer accounts or handle orders for the Fund. The Marketing Agent has no responsibility for the performance of the Fund or the decisions made or actions taken by the Managing Owner.
The agreement between the Managing Owner and DIMA as Marketing Agent relates to not only the Fund but to other commodity pools and ETFs. The agreement is for an initial six-year term which commenced on February 26, 2015, with additional one-year renewal terms unless terminated.
“800” Number for Investors
Investors may contact the Managing Owner toll free in the U.S. at (800) 983-0903.
THE SECURITIES DEPOSITORY; BOOK-ENTRY-ONLY SYSTEM; GLOBAL SECURITY
DTC acts as securities depository for the Shares. DTC is a limited-purpose trust company organized under the laws of the State of New York, a member of the Federal Reserve System, a “clearing corporation” within the meaning of the New York Uniform Commercial Code, and a “clearing agency” registered pursuant to the provisions of section 17A of the Exchange Act. DTC was created to hold
securities of DTC Participants and to facilitate the clearance and settlement of transactions in such securities among the DTC Participants through electronic book-entry changes. This eliminates the need for physical movement of securities certificates. DTC Participants include securities brokers and dealers, banks, trust companies, clearing corporations, and certain other organizations, some of whom (and/or their representatives) own DTC. Access to the DTC system is also available to others such as banks, brokers, dealers and trust companies that clear through or maintain a custodial relationship with a DTC Participant, either directly or indirectly. DTC has agreed to administer its book-entry system in accordance with its rules and by-laws and the requirements of law.
Individual certificates will not be issued for the Shares. Instead, global certificates are signed by the Managing Owner on behalf of the Fund, registered in the name of Cede & Co., as nominee for DTC, and deposited with the Trustee on behalf of DTC. The global certificates evidence all of the Shares outstanding at any time. The representations, undertakings and agreements made on the part of the Fund in the global certificates are made and intended for the purpose of binding only the Fund and not the Trustee or the Managing Owner individually.
Upon the settlement date of any creation, transfer or redemption of Shares, DTC credits or debits, on its book-entry registration and transfer system, the amount of the Shares so created, transferred or redeemed to the accounts of the appropriate DTC Participants. The Managing Owner and the Authorized Participants designate the accounts to be credited and charged in the case of creation or redemption of Shares.
Beneficial ownership of the Shares is limited to DTC Participants, Indirect Participants and persons holding interests through DTC Participants and Indirect Participants. Owners of beneficial interests in the Shares is shown on, and the transfer of ownership is effected only through, records maintained by DTC (with respect to DTC Participants), the records of DTC Participants (with respect to Indirect Participants), and the records of Indirect Participants (with respect to Shareholders that are not DTC Participants or Indirect Participants). Shareholders are expected to receive from or through the DTC Participant maintaining the
75
Table of Contents
account through which the Shareholder has purchased their Shares a written confirmation relating to such purchase.
Shareholders that are not DTC Participants may transfer the Shares through DTC by instructing the DTC Participant or Indirect Participant through which the Shareholders hold their Shares to transfer the Shares. Shareholders that are DTC Participants may transfer the Shares by instructing DTC in accordance with the rules of DTC. Transfers are made in accordance with standard securities industry practice.
DTC may decide to discontinue providing its service with respect to Baskets and/or the Shares by giving notice to the Trustee and the Managing Owner. Under such circumstances, the Trustee and the Managing Owner will either find a replacement for DTC to perform its functions at a comparable cost or, if a replacement is unavailable, terminate the Fund.
The rights of the Shareholders generally must be exercised by DTC Participants acting on their behalf in accordance with the rules and procedures of DTC. Because the Shares can only be held in book-entry form through DTC and DTC Participants, investors must rely on DTC, DTC Participants and any other financial intermediary through which they hold the Shares to receive the benefits and exercise the rights described in this section. Investors should consult with their broker or financial institution to find out about procedures and requirements for securities held in book-entry form through DTC.
If the Managing Owner believes that the per Share price in the secondary market for Shares has fallen outside a desirable trading price range, the Managing Owner may direct the Trustee to declare a split or reverse split in the number of Shares outstanding and to make a corresponding change in the number of Shares constituting a Basket.
Brokerage Agreement
The Commodity Broker and the Managing Owner (on behalf of the Fund) entered into a brokerage agreement with respect to the Fund (the
“Brokerage Agreement”). As a result, the Commodity Broker:
| • | acts as the clearing broker; |
| • | acts as custodian of the Fund’s assets in connection with the clearing of transactions; and |
| • | performs such other services for the Fund as the Managing Owner may from time to time request. |
As clearing broker for the Fund, the Commodity Broker receives orders for trades from the Managing Owner.
Confirmations of all executed trades are given to the Fund by the Commodity Broker. The Brokerage Agreement incorporates the Commodity Broker’s standard customer agreements and related documents, which generally include provisions that:
| • | the assets of the Fund held in its account with the Commodity Broker and all contracts and rights to payment thereunder are held as security for the Fund’s obligations to the Commodity Broker; |
| • | the Commodity Broker shall have the right to limit the size of open positions (net or gross) of the Fund with respect to its account at any time only as necessary to comply with the applicable law or applicable position limits and shall promptly notify the Fund of any rejected order; |
| • | the Fund must make all applicable original margin, variation margin, intra-day margin and premium payments to the Commodity Broker; the Commodity Broker may, among other things, close out positions, sell securities or other property held in the Fund’s account, purchase futures or cancel orders at any time upon the default of the Fund under the Brokerage Agreement, without the consent of the Managing Owner on behalf of the Fund; and |
| • | absent a separate written agreement with the Fund with respect to give-up transactions, the Commodity Broker, in its sole discretion, may accept from other brokers contracts executed by such brokers and to be given up to the Commodity Broker for clearance or carrying in any account. |
76
Table of Contents
Administrative functions provided by the Commodity Broker to the Fund include, but are not limited to, preparing and transmitting daily confirmations of transactions and monthly statements of account, calculating balances and margin requirements.
In respect of the transactions effected pursuant to the Brokerage Agreement, the Commodity Broker will charge the Fund a fee for the services it has agreed to perform, including brokerage charges, give-up fees, commissions and services fees as may be agreed upon by the Fund and the Commodity Broker; exchange, clearing house, NFA or other regulatory fees; the amount necessary to hold the Commodity Broker harmless against all taxes and tax-related liabilities of the Fund; any debit balance or deficiency in the Fund’s account; interest on any debit balances or deficiencies in the Fund’s account and on monies advanced to the Fund; and any other agreed upon amounts owed by the Fund to the Commodity Broker in connection with the Fund’s account or transactions therein.
The Brokerage Agreement is terminable by the Fund at any time by written notice to the Commodity Broker, or by the Commodity Broker without penalty upon ten (10) days’ prior written notice.
The Brokerage Agreement provides that except to the extent of its gross negligence, fraud or willful misconduct, the Commodity Broker shall not be liable for any loss, liability or expense incurred by the Fund in connection with or arising out of the Brokerage Agreement, transactions in or for the Fund or any actions taken by the Commodity Broker at the request or direction of the Fund.
Administration Agreement
Pursuant to the Administration Agreement between the Trust, on behalf of itself and on behalf of the Fund, and the Administrator, the Administrator performs or supervises the performance of services necessary for the operation and administration on behalf of the Fund (other than making investment decisions), including NAV calculations, accounting and other fund administrative services.
The Administration Agreement will continue in effect unless terminated on at least 90 days’ prior written notice by either party to the other party. Notwithstanding the foregoing, the Administrator
may terminate the Administration Agreement upon 30 days’ prior written notice if the Fund has materially failed to perform its obligations under the Administration Agreement or upon the termination of the Custody Agreement by the Fund.
The Administrator is both exculpated and indemnified under the Administration Agreement.
Except as otherwise provided in the Administration Agreement, the Administrator will not be liable for any costs, expenses, damages, liabilities or claims (including attorneys’ and accountants’ fees) incurred by the Trust or the Fund, except those costs, expenses, damages, liabilities or claims arising out of the Administrator’s own gross negligence or willful misconduct. In no event will the Administrator be liable to the Trust, the Fund or any third party for special, indirect or consequential damages, or lost profits or loss of business, arising under or in connection with the Administration Agreement, even if previously informed of the possibility of such damages and regardless of the form of action. The Administrator will not be liable for any loss, damage or expense, including counsel fees and other costs and expenses of a defense against any claim or liability, resulting from, arising out of, or in connection with its performance under the Administration Agreement, including its actions or omissions, the incompleteness or inaccuracy of any Proper Instructions (as defined therein), or for delays caused by circumstances beyond the Administrator’s control, unless such loss, damage or expense arises out of the gross negligence or willful misconduct of the Administrator.
The Trust and/or the Fund will indemnify and hold harmless the Administrator from and against any and all costs, expenses, damages, liabilities and claims (including claims asserted by the Trust or the Fund), and reasonable attorneys’ and accountants’ fees relating thereto, which are sustained or incurred or which may be asserted against the Administrator by reason of or as a result of any action taken or omitted to be taken by the Administrator in good faith under the Administration Agreement or in reliance upon (i) any law, act, regulation or interpretation of the same even though the same may thereafter have been altered, changed, amended or repealed, (ii) the registration statement or Prospectus, (iii) any Proper Instructions, or (iv) any opinion of legal counsel for the Fund or arising out of
77
Table of Contents
transactions or other activities of the Fund which occurred prior to the commencement of the Administration Agreement; provided, that neither the Trust nor the Fund will indemnify the Administrator for costs, expenses, damages, liabilities or claims for which the Administrator is liable under the preceding paragraph. This indemnity will be a continuing obligation of the Trust, the Fund and their respective successors and assigns, notwithstanding the termination of the Administration Agreement. Without limiting the generality of the foregoing, the Trust and the Fund will indemnify the Administrator against and save the Administrator harmless from any loss, damage or expense, including counsel fees and other costs and expenses of a defense against any claim or liability, arising from any one or more of the following: (i) errors in records or instructions, explanations, information, specifications or documentation of any kind, as the case may be, supplied to the Administrator by any third-party described in the Administration Agreement or by or on behalf of the Fund; (ii) action or inaction taken or omitted to be taken by the Administrator pursuant to Proper Instructions of the Trust, on behalf of the Fund, or otherwise without gross negligence or willful misconduct; (iii) any action taken or omitted to be taken by the Administrator in good faith in accordance with the advice or opinion of counsel for the Trust or the Fund or its own counsel; (iv) any improper use by the Trust or the Fund or their respective agents, distributor or investment advisor of any valuations or computations supplied by the Administrator pursuant to the Administration Agreement; (v) the method of valuation and the method of computing NAV; or (vi) any valuations or NAV provided by the Fund.
Actions taken or omitted in reliance on Proper Instructions, or upon any information, order, indenture, stock certificate, power of attorney, assignment, affidavit or other instrument believed by the Administrator to be genuine or bearing the signature of a person or persons believed to be authorized to sign, countersign or execute the same, or upon the opinion of legal counsel for the Trust, on behalf of the Fund, or its own counsel, will be conclusively presumed to have been taken or omitted in good faith.
Notwithstanding any other provision contained in the Administration Agreement, the Administrator will have no duty or obligation with respect to,
including, without limitation, any duty or obligation to determine, or advise or notify the Fund of: (a) the taxable nature of any distribution or amount received or deemed received by, or payable to the Fund; (b) the taxable nature or effect on the Fund or its shareholders of any corporate actions, class actions, tax reclaims, tax refunds, or similar events; (c) the taxable nature or taxable amount of any distribution or dividend paid, payable or deemed paid by the Fund to their respective shareholders; or (d) the effect under any federal, state, or foreign income tax laws of the Fund making or not making any distribution or dividend payment, or any election with respect thereto.
Custody Agreement
The Bank of New York Mellon serves as the Custodian. Pursuant to the Custody Agreement, the Custodian serves as custodian of all securities and cash at any time delivered to Custodian by the Fund during the term of the Custody Agreement and has authorized the Custodian to hold its securities in registered form in its name or the name of its nominees. The Custodian has established and will maintain one or more securities accounts and cash accounts for the Fund pursuant to the Custody Agreement. The Custodian will maintain separate and distinct books and records segregating the assets of the Fund.
The Trust, on behalf of the Fund, independently, and the Custodian may terminate the Custody Agreement by giving to the other party a notice in writing specifying the date of such termination, which will be not less than ninety (90) days after the date of such notice. Upon termination thereof, the Fund will pay to the Custodian such compensation as may be due to the Custodian, and will likewise reimburse the Custodian for other amounts payable or reimbursable to the Custodian thereunder. The Custodian will follow such reasonable oral or written instructions concerning the transfer of custody of records, securities and other items as the Trust, on behalf of the Fund, gives; provided, that (a) the Custodian will have no liability for shipping and insurance costs associated therewith, and (b) full payment will have been made to the Custodian of its compensation, costs, expenses and other amounts to which it is entitled thereunder. If any securities or cash remain in any account, the Custodian may deliver to the Trust, on behalf of the Fund, such
78
Table of Contents
securities and cash. Except as otherwise provided herein, all obligations of the parties to each other hereunder will cease upon termination of the Custody Agreement.
The Custodian is both exculpated and indemnified under the Custody Agreement.
Except as otherwise expressly provided in the Custody Agreement, the Custodian will not be liable for any costs, expenses, damages, liabilities or claims, including attorneys’ and accountants’ fees (collectively referred to in this section as “losses”), incurred by or asserted against the Trust or the Fund, except those losses arising out of the gross negligence or willful misconduct of the Custodian. The Custodian will have no liability whatsoever for the action or inaction of any depository. Subject to the Custodian’s delegation of its duties to its affiliates, the Custodian’s responsibility with respect to any securities or cash held by a subcustodian is limited to the failure on the part of the Custodian to exercise reasonable care in the selection or retention of such subcustodian in light of prevailing settlement and securities handling practices, procedures and controls in the relevant market. With respect to any losses incurred by the Trust or the Fund as a result of the acts or the failure to act by any subcustodian (other than an affiliate of the Custodian), the Custodian will take appropriate action to recover such losses from such subcustodian; and the Custodian’s sole responsibility and liability to the Trust or the Fund will be limited to amounts so received from such subcustodian (exclusive of costs and expenses incurred by the Custodian). In no event will the Custodian be liable to the Trust or the Fund or any third-party for special, indirect or consequential damages, or lost profits or loss of business, arising in connection with the Custody Agreement.
The Trust, on behalf of the Fund, as applicable, will indemnify the Custodian and each subcustodian for the amount of any tax that the Custodian, any such subcustodian or any other withholding agent is required under applicable laws (whether by assessment or otherwise) to pay on behalf of, or in respect of income earned by or payments or distributions made to or for the account of the Fund (including any payment of tax required by reason of an earlier failure to withhold). The Custodian will, or will instruct the applicable subcustodian or other
withholding agent to, withhold the amount of any tax which is required to be withheld under applicable law upon collection of any dividend, interest or other distribution made with respect to any security and any proceeds or income from the sale, loan or other transfer of any security. In the event that the Custodian or any subcustodian is required under applicable law to pay any tax on behalf of the Fund, the Custodian is hereby authorized to withdraw cash from any cash account in the amount required to pay such tax and to use such cash, or to remit such cash to the appropriate subcustodian, for the timely payment of such tax in the manner required by applicable law.
The Trust, on its own behalf and on behalf of the Fund, will indemnify the Custodian and hold the Custodian harmless from and against any and all losses sustained or incurred by or asserted against the Custodian by reason of or as a result of any action or inaction, or arising out of the Custodian’s performance under the Custody Agreement, including reasonable fees and expenses of counsel incurred by the Custodian in a successful defense of claims by the Fund; provided however, that the Trust, on its own behalf and on behalf of the Fund, as applicable, will not indemnify the Custodian for those losses arising out of the Custodian’s gross negligence or willful misconduct. This indemnity will be a continuing obligation of the Trust, on its own behalf and on behalf of the Fund, as applicable, their successors and assigns, notwithstanding the termination of the Custody Agreement.
Transfer Agency and Service Agreement
The Bank of New York Mellon serves as the Transfer Agent. Pursuant to the Transfer Agency and Service Agreement between the Trust, the Trust on behalf of the Fund and the Transfer Agent, the Transfer Agent serves as the Fund’s transfer agent, dividend disbursing agent, and agent in connection with certain other activities as provided under the Transfer Agency and Service Agreement.
The term of the Transfer Agency and Service Agreement is one year from the effective date and will automatically renew for additional one year terms unless either party provides written notice of termination at least ninety (90) days prior to the end
79
Table of Contents
of any one year term or, unless earlier terminated as provided below:
| • | Either party terminates prior to the expiration of the initial term in the event the other party breaches any material provision of the Transfer Agency and Service Agreement, including, without limitation in the case of the Trust, on behalf of the Fund, its obligations to compensate the Transfer Agent, provided that the non-breaching party gives written notice of such breach to the breaching party and the breaching party does not cure such violation within ninety (90) days of receipt of such notice. |
| • | The Fund may terminate the Transfer Agency and Service Agreement prior to the expiration of the initial term upon ninety (90) days’ prior written notice in the event that the Managing Owner determines to liquidate the Trust or the Fund and terminate its registration with the SEC other than in connection with a merger or acquisition of the Trust. |
The Transfer Agent will have no responsibility and will not be liable for any loss or damage unless such loss or damage is caused by its own gross negligence or willful misconduct or that of its employees, or its breach of any of its representations. In no event will the Transfer Agent be liable for special, indirect or consequential damages regardless of the form of action and even if the same were foreseeable.
Pursuant to the Transfer Agency and Service Agreement, the Transfer Agent will not be responsible for, and the Trust or the Fund will indemnify and hold the Transfer Agent harmless from and against, any and all losses, damages, costs, charges, counsel fees, payments, expenses and liability, or losses, arising out of or attributable to:
| • | All actions of the Transfer Agent or its agents or subcontractors required to be taken pursuant to the Transfer Agency and Service Agreement, provided that such actions are taken without gross negligence, or willful misconduct. |
| • | The Trust’s or the Fund’s gross negligence or willful misconduct. |
| • | The breach of any representation or warranty of the Trust thereunder. |
| • | The conclusive reliance on or use by the Transfer Agent or its agents or subcontractors of information, records, documents or services which (i) are received by the Transfer Agent or its agents or subcontractors, and (ii) have been prepared, maintained or performed by the Trust, on its own behalf or on behalf of the Fund, or any other person or firm on behalf of the Trust or the Fund including but not limited to any previous transfer agent or registrar. |
| • | The conclusive reliance on, or the carrying out by the Transfer Agent or its agents or subcontractors of any instructions or requests of the Trust, on its own behalf and on behalf of the Fund. |
| • | The offer or sale of Shares in violation of any requirement under the federal securities laws or regulations or the securities laws or regulations of any state that such Shares be registered in such state or in violation of any stop order or other determination or ruling by any federal agency or any state with respect to the offer or sale of such Shares in such state. |
Distribution Services Agreement
Invesco Distributors provides certain distribution services to the Fund. Pursuant to the Distribution Services Agreement, as amended from time to time, between the Trust, with respect to the Fund and Invesco Distributors, Invesco Distributors will assist the Managing Owner with certain functions and duties relating to distribution and marketing including reviewing and approving marketing materials.
The date of the Distribution Services Agreement is the effective date and such Agreement will continue automatically for successive annual periods, provided that such continuance is specifically approved at least annually by the Fund’s Managing Owner. The Distribution Services Agreement is terminable without penalty on sixty days’ written notice by the Fund’s Managing Owner or by Invesco Distributors. The Distribution Services Agreement will automatically terminate in the event of its assignment.
80
Table of Contents
Pursuant to the Distribution Services Agreement, the Fund will indemnify Invesco Distributors as follows:
The Fund indemnifies and holds harmless Invesco Distributors and each of its directors and officers and each person, if any, who controls Invesco Distributors within the meaning of Section 15 of the Securities Act, against any loss, liability, claim, damage or expense (including the reasonable cost of investigating or defending any alleged loss, liability, claim, damage or expense and reasonable counsel fees incurred in connection therewith) by reason of any person acquiring any Shares, based upon the ground that the registration statement, Prospectus, Statement of Additional Information, shareholder reports or other information filed or made public by the Fund (as from time-to-time amended) included an untrue statement of a material fact or omitted to state a material fact required to be stated or necessary in order to make the statements not misleading under the Securities Act or any other statute or the common law. However, the Fund does not agree to indemnify Invesco Distributors or hold it harmless to the extent that the statement or omission was made in reliance upon, and in conformity with, information furnished to the Fund by or on behalf of Invesco Distributors. In no case
| • | is the indemnity of the Fund in favor of Invesco Distributors or any person indemnified to be deemed to protect Invesco Distributors or any person against any liability to the Fund or its security holders to which Invesco Distributors or such person would otherwise be subject by reason of willful misfeasance, bad faith or negligence in the performance of its duties or by reason of its reckless disregard of its obligations and duties under the Distribution Services Agreement; or |
| • | is the Fund to be liable under its indemnity agreement with respect to any claim made against Invesco Distributors or any person indemnified unless Invesco Distributors or such person, as the case may be, will have notified the Fund in writing of the claim promptly after the summons or other first written notification giving information of the nature of the claims will have been |
| served upon Invesco Distributors or any such person (or after Invesco Distributors or such person will have received notice of service on any designated agent). |
However, failure to notify the Fund of any claim will not relieve the Fund from any liability which it may have to any person against whom such action is brought otherwise than on account of its indemnity agreement described herein. The Fund will be entitled to participate at its own expense in the defense, or, if it so elects, to assume the defense of any suit brought to enforce any claims, and if the Fund elects to assume the defense, the defense will be conducted by counsel chosen by the Fund. In the event the Fund elects to assume the defense of any suit and retain counsel, Invesco Distributors, its officers or directors or controlling person(s) or defendant(s) in the suit, will bear the fees and expenses of any additional counsel retained by them. If the Fund does not elect to assume the defense of any suit, it will reimburse Invesco Distributors, its officers or directors or controlling person(s) or defendant(s) in the suit for the reasonable fees and expenses of any counsel retained by them. The Fund agrees to notify Invesco Distributors promptly of the commencement of any litigation or proceeding against it or any of its officers in connection with the issuance or sale of any of the Shares.
MATERIAL U.S. FEDERAL INCOME TAX CONSIDERATIONS
The following discussion describes the material U.S. federal (and certain state and local) income tax considerations associated with the purchase, ownership and disposition of Shares as of the date hereof by U.S. Shareholders (as defined below) and non-U.S. Shareholders (as defined below). Except where noted, this discussion deals only with Shares held as capital assets by Shareholders who acquired Shares by purchase and does not address special situations, such as those of:
| • | dealers in securities, commodities or currencies; |
| • | financial institutions; |
| • | regulated investment companies (“RICs”), other than the status of the Fund as a qualified publicly traded partnership (a “qualified PTP”) within the meaning of the Code; |
81
Table of Contents
| • | real estate investment trusts; |
| • | tax-exempt organizations; |
| • | insurance companies; |
| • | persons holding Shares as a part of a hedging, integrated or conversion transaction or a straddle; |
| • | traders in securities or commodities that elect to use a mark-to-market method of accounting for their securities or commodities holdings; or |
| • | persons liable for federal alternative minimum tax. |
Furthermore, the discussion below is based upon the provisions of the Code, the Treasury Regulations promulgated thereunder, and administrative and judicial interpretations thereof, all as of the date hereof, and such authorities may be repealed, revoked, modified or subject to differing interpretations, possibly on a retroactive basis, so as to result in U.S. federal income tax consequences different from those described below, which may adversely affect the Fund and/or its shareholders.
The recently enacted tax legislation commonly referred to as the Tax Cuts and Jobs Act (the “Tax Act”) makes significant changes to the U.S. federal income tax rules for taxation of individuals and corporations, generally effective for taxable years beginning after December 31, 2017. Most of the changes applicable to individuals are temporary and would apply only to taxable years beginning after December 31, 2017 and before January 1, 2026. The Tax Act makes numerous changes to the tax rules that may affect shareholders and may indirectly affect the Fund. You should consult your tax advisor for specific guidance regarding the impact of the Tax Act on the tax effects of your investment in the Fund.
A “U.S. Shareholder” means a beneficial owner of Shares that is for U.S. federal income tax purposes:
| • | an individual citizen or resident of the United States; |
| • | a corporation (or other entity taxable as a corporation) created or organized in or under the laws of the United States or any state thereof or the District of Columbia; |
| • | an estate the income of which is subject to U.S. federal income taxation regardless of its source; or |
| • | a trust if it (1) is subject to the primary supervision of a court within the United States and one or more U.S. persons have the authority to control all substantial decisions of such trust or (2) has a valid election in effect under applicable Treasury Regulations to be treated as a U.S. person. |
A “non-U.S. Shareholder” means a beneficial owner of Shares that is not a U.S. Shareholder.
If a partnership or other entity or arrangement treated as a partnership for U.S. federal income tax purposes holds Shares, the tax treatment of a partner in such partnership will generally depend upon the status of the partner and the activities of the partnership. If you are a partner in a partnership holding Shares, we urge you to consult your own tax advisor.
No statutory, administrative or judicial authority directly addresses the treatment of Shares or instruments similar to Shares for U.S. federal income tax purposes. As a result, we cannot assure you that the IRS or the courts will agree with the tax consequences described herein. A different treatment from that described below could adversely affect the amount, timing and character of items of income, gain, loss or deduction in respect of an investment in the Shares. If you are considering the purchase of Shares, we urge you to consult your own tax advisor concerning the particular U.S. federal income tax consequences to you of the purchase, ownership and disposition of Shares, as well as any consequences to you arising under the laws of any other taxing jurisdiction.
Status of the Fund
Under current law and assuming full compliance with the terms of the Trust Agreement and applicable law (and other relevant documents), in the opinion of Morgan, Lewis & Bockius LLP, the Fund will be classified as a partnership for U.S. federal income tax purposes. Accordingly, subject to the discussion below regarding publicly traded partnerships, the Fund generally will not be a taxable entity for U.S. federal income tax purposes and will not incur U.S. federal income tax liability.
82
Table of Contents
The opinion of Morgan, Lewis & Bockius LLP, is based on various assumptions relating to the Fund’s organization, operation, assets and activities, including assumptions that the Fund will not invest in any assets except those specifically provided for currently in this Prospectus, and that neither the Trust Agreement nor any other relevant document will be otherwise amended. The opinion of Morgan, Lewis & Bockius LLP further assumes that all factual representations and statements set forth in all relevant documents, records, and instruments are true and correct, all actions described in this Prospectus are completed in a timely fashion and that the Fund will at all times operate in accordance with the method of operation described in the Trust Agreement and this Prospectus, and is conditioned upon factual representations and covenants made by the Fund and the Managing Owner regarding the Fund’s organization, operation, assets, activities and the conduct of the Fund’s operations, and assumes that such representations and covenants are accurate and complete.
Special Rules for Publicly Traded Partnerships
A partnership generally is not a taxable entity and generally incurs no U.S. federal income tax liability. Section 7704 of the Code provides that publicly traded partnerships will, as a general rule, be taxed as corporations. However, an exception exists with respect to publicly traded partnerships of which 90% or more of the gross income during each taxable year consists of “qualifying income” within the meaning of Section 7704(d) of the Code, or the qualifying income exception. Qualifying income includes dividends, interest, capital gains from the sale or other disposition of stocks and debt instruments and, in the case of a partnership (such as the Fund) a principal activity of which is the buying and selling of commodities or futures contracts with respect to commodities, income and gains derived from commodities or futures contracts with respect to commodities. The Fund anticipates that at least 90% of its gross income for each taxable year will constitute qualifying income within the meaning of Section 7704(d) of the Code.
The IRS may assert that the Fund should be treated as a publicly traded partnership taxable as a corporation. No ruling has been or will be sought from the IRS, and the IRS has made no determination
as to the status of the Fund for U.S. federal income tax purposes or whether the Fund’s operations generate “qualifying income” under Section 7704(d) of the Code. Whether the Fund will continue to meet the qualifying income exception is a matter that will be determined by the Fund’s operations and the facts existing at the time of future determinations. However, the Fund’s Managing Owner will use its best efforts to cause the Fund to operate in such manner as is necessary for the Fund to continue to meet the qualifying income exception.
If the Fund were taxable as a corporation in any taxable year, either as a result of a failure to meet the qualifying income exception described above or otherwise, the Fund’s items of income, gain, loss and deduction would be reflected only on the Fund’s tax return rather than being passed through to the Shareholders, and the Fund’s net income would be taxed to it at the income tax rates applicable to domestic corporations, which the Tax Act reduced to 21%. In addition, if the Fund were taxable as a corporation, any distribution made by the Fund to a Shareholder would be treated as taxable dividend income, to the extent of the Fund’s current or accumulated earnings and profits, or, in the absence of current and accumulated earnings and profits, as a nontaxable return of capital to the extent of the Shareholder’s tax basis in its Shares, or as taxable capital gain, after the Shareholder’s tax basis in its Shares is reduced to zero. Taxation of the Fund as a corporation could result in a material reduction in a Shareholder’s cash flow and after-tax return and thus could result in a substantial reduction of the value of the Shares.
The discussion below is based on Morgan, Lewis & Bockius LLP’s opinion that the Fund will be classified as a partnership for U.S. federal income tax purposes that is not subject to corporate income tax for U.S. federal income tax purposes.
U.S. Shareholders
Treatment of Fund Income
A partnership generally does not incur U.S. federal income tax liability. Instead, each partner of a partnership is required to take into account its share of items of income, gain, loss, deduction and other items of the partnership. Accordingly, each Shareholder will be required to include in income its allocable share of the Fund’s income, gain, loss,
83
Table of Contents
deduction and other items for the Fund’s taxable year ending with or within its taxable year. In computing a partner’s U.S. federal income tax liability, the items must be included, regardless of whether cash distributions are made by the partnership. Thus, Shareholders may be required to take into account taxable income without a corresponding current receipt of cash if the Fund generates taxable income but does not make cash distributions in an amount equal to the taxable income, or if the Shareholder is not able to deduct, in whole or in part, the Shareholder’s allocable share of the Fund’s expenses or capital losses. The Fund’s taxable year will end on December 31 unless otherwise required by law. The Fund will use the accrual method of accounting.
In the case of non-corporate shareholders, the Tax Act establishes for taxable years beginning after December 31, 2017 and before January 1, 2026 a 20% deduction for “qualified publicly traded partnership income” within the meaning of new Section 199A(e)(5) of the Code. In general, “qualified publicly traded partnership income” for this purpose is an item of income, gain, deduction or loss that is effectively connected with a United States trade or business and includable income for the year, but does not include certain investment income. It is currently not expected that the Fund’s income will be eligible for such deduction because as discussed below, although the matter is not free from doubt, the Fund believes that the activities directly conducted by the Fund will not result in the Fund being engaged in a trade or business within the United States. Potential investors should consult their tax advisors regarding the availability of such deduction for their allocable share of the Fund’s items of income, gain, deduction and loss.
Shareholders will take into account their respective shares of ordinary income realized by the Fund from accruals of interest on Treasury Securities (“T-Bills”) held in the Fund’s portfolio. The Fund may hold T-Bills or other debt instruments with “acquisition discount” or “original issue discount”, in which case Shareholders will be required to include accrued amounts in taxable income on a current basis even though receipt of those amounts may occur in a subsequent year. The Fund may also acquire debt instruments with “market discount.” Under rules prior to the Tax Act, upon disposition of such obligations, gain will generally be required to be treated as interest income to the extent of the market
discount and Shareholders will be required to include as ordinary income their share of the market discount that accrued during the period the obligations were held by the Fund. Certain changes made in the Tax Act regarding accounting methods may require an earlier accrual of market discount. The effect of these changes are uncertain and shareholders should consult their tax advisors with respect to whether they are required to accrue market discount. Shareholders will take into account their respective shares of any dividends received by the Fund from the Fund’s investments in the money market mutual funds and certain T-Bill ETFs.
It is expected that a substantial portion of the futures on the Index Commodities held by the Fund will constitute Section 1256 Contracts (as defined below). The Code generally applies a “mark-to-market” system of taxing unrealized gains and losses on and otherwise provides for special rules of taxation with respect to futures and other contracts that are Section 1256 Contracts. A Section 1256 Contract includes certain regulated futures contracts. Section 1256 Contracts held by the Fund at the end of a taxable year of the Fund will be treated for U.S. federal income tax purposes as if they were sold by the Fund at their fair market value on the last business day of the taxable year. The net gain or loss, if any, resulting from these deemed sales (known as “marking-to-market”), together with any gain or loss resulting from any actual sales of Section 1256 Contracts (or other termination of the Fund’s obligations under such contracts), must be taken into account by the Fund in computing its taxable income for the year. If a Section 1256 Contract held by the Fund at the end of a taxable year is sold in the following year, the amount of any gain or loss realized on the sale will be adjusted to reflect the gain or loss previously taken into account under the mark-to-market rules.
Capital gains and losses from Section 1256 Contracts generally are characterized as short-term capital gains or losses to the extent of 40% of the gains or losses and as long-term capital gains or losses to the extent of 60% of the gains or losses. Thus, Shareholders will generally take into account their pro rata share of the long-term capital gains and losses and short-term capital gains and losses from Section 1256 Contracts held by the Fund and taken into account by the Fund in computing its taxable income. If a non-corporate taxpayer incurs a net
84
Table of Contents
capital loss for a year, the portion of the loss, if any, which consists of a net loss on Section 1256 Contracts may, at the election of the taxpayer, be carried back three years. A loss carried back to a year by a non-corporate taxpayer may be deducted only to the extent (1) the loss does not exceed the net gain on Section 1256 Contracts for the year and (2) the allowance of the carryback does not increase or produce a net operating loss for the year.
Any Index Contracts held by the Fund that are not classified as Section 1256 Contracts will not be subject to the year-end “mark-to-market” rules of Section 1256, as described above. Accordingly, any long-term or short-term capital gains or losses with respect to such futures held by the Fund that are not classified as Section 1256 Contracts will only be recognized by the Fund when such futures positions are assigned or closed (by offset or otherwise). The applicable holding period for qualification for long-term capital gain or loss treatment for the commodity futures held by the Fund that are not Section 1256 Contracts is more than one year.
Allocation of the Fund’s Profits and Losses
For U.S. federal income tax purposes, a Shareholder’s distributive share of the Fund’s income, gain, loss, deduction and other items will be determined by the Trust Agreement, unless an allocation under such agreement does not have “substantial economic effect,” in which case the allocations will be determined in accordance with the “partners’ interests in the partnership.” Subject to the discussion below under “Monthly Allocation and Revaluation Conventions and Transferor/Transferee Allocations” and “Section 754 Election,” the allocations pursuant to the Trust Agreement should be considered to have substantial economic effect or deemed to be made in accordance with the partners’ interests in the Fund.
If the allocations provided by the Trust Agreement were successfully challenged by the IRS, the amount of income or loss allocated to Shareholders for U.S. federal income tax purposes under the Trust Agreement could be increased or reduced or the character of the income or loss could be modified or both.
As described in more detail below, the U.S. federal income tax rules that apply to partnerships are complex and their application is not always clear.
The rules generally were not written for, and in some respects are difficult to apply to, publicly traded partnerships. The Fund will apply certain assumptions and conventions intended to comply with the intent of the rules and to report income, gain, loss, deduction and credit to Shareholders in a manner that reflects the economic gains and losses, but these assumptions and conventions may not comply with all aspects of the applicable Treasury Regulations. It is possible therefore that the IRS will successfully assert that assumptions made and/or conventions used do not satisfy the technical requirements of the Code or the Treasury Regulations and will require that tax items be adjusted or reallocated in a manner that could adversely impact Shareholders.
Monthly Allocation and Revaluation Conventions and Transferor/Transferee Allocations
In general, the Fund’s taxable income and losses will be determined monthly and will be apportioned among the Shareholders in proportion to the number of Shares owned by each of them as of the close of the last trading day of the preceding month. By investing in Shares, a U.S. Shareholder agrees that, in the absence of an administrative determination or judicial ruling to the contrary, it will report income and loss under the monthly allocation and revaluation conventions described below.
Under the monthly allocation convention, whomever is treated for U.S. federal income tax purposes as holding Shares as of the close of the last trading day of the preceding month will be treated as continuing to hold the Shares until immediately before the close of the last trading day of the following month. With respect to any Shares that were not treated as outstanding as of the close of the last trading day of the preceding month, the first person that is treated as holding such Shares (other than an underwriter or other person holding in a similar capacity) for U.S. federal income tax purposes will be treated as holding such Shares for this purpose as of the close of the last trading day of the preceding month. As a result, a Shareholder who has disposed of Shares prior to the close of the last trading day of a month may be allocated items of income, gain, loss and deduction realized after the date of transfer.
85
Table of Contents
Section 706 of the Code generally requires that items of partnership income and deductions be allocated between transferors and transferees of partnership interests on a daily basis. It is possible that transfers of Shares could be considered to occur for U.S. federal income tax purposes when the transfer is completed without regard to the Fund’s monthly convention for allocating income and deductions. If this were to occur, the Fund’s allocation method might be considered a monthly convention that does not literally comply with that requirement. If the IRS treats transfers of Shares as occurring throughout each month and a monthly convention is not allowed by the Treasury Regulations (or only applies to transfers of less than all of a Shareholder’s Shares) or if the IRS otherwise does not accept the Fund’s convention, the IRS may contend that taxable income or losses of the Fund must be reallocated among the Shareholders. If such a contention was sustained, the Shareholders’ respective tax liabilities would be adjusted to the possible detriment of certain Shareholders. The Managing Owner is authorized to revise the Fund’s methods of allocation between transferors and transferees (as well as among Shareholders whose interests otherwise vary during a taxable period).
In addition, for any month in which a creation or redemption of Shares takes place, the Fund generally will credit or debit, respectively, the “book” capital accounts of the existing Shareholders with any unrealized gain or loss in the Fund’s assets. This will result in the allocation of the Fund’s items of income, gain, loss, deduction and credit to existing Shareholders to account for the difference between the tax basis and fair market value of property owned by the Fund at the time new Shares are issued or old Shares are redeemed, or reverse Section 704(c) allocations. The intended effect of these allocations is to allocate any built-in gain or loss in the Fund’s assets at the time of a creation or redemption of Shares to the investors that economically have earned such gain or loss.
As with the other allocations described above, the Fund generally will use a monthly convention for purposes of the reverse Section 704(c) allocations. More specifically, the Fund generally will credit or debit, respectively, the “book” capital accounts of existing Shareholders with any unrealized gain or loss in the Fund’s assets based on a calculation utilizing the average price of the Shares during the
month in which the creation or redemption transaction takes place, rather than the fair market value of its assets at the time of such creation or redemption, or the revaluation convention. As a result, it is possible that, for U.S. federal income tax purposes, (i) a purchaser of newly issued Shares will be allocated some or all of the unrealized gain in the Fund’s assets at the time it acquires the Shares or (ii) an existing Shareholder will not be allocated its entire share in the unrealized loss in the Fund’s assets at the time of such acquisition. Furthermore, the applicable Treasury Regulations generally require that the “book” capital accounts be adjusted based on the fair market value of partnership property on the date of adjustment and do not explicitly allow the adoption of a monthly revaluation convention.
The Code and applicable Treasury Regulations generally require that items of partnership income and deductions be allocated between transferors and transferees of partnership interests on a daily basis, and that adjustments to “book” capital accounts be made based on the fair market value of partnership property on the date of adjustment. The Code and Treasury Regulations do not contemplate monthly allocation or revaluation conventions. If the IRS does not accept the Fund’s monthly allocation or revaluation convention, the IRS may contend that taxable income or losses of the Fund must be reallocated among the Shareholders. If such a contention were sustained, the Shareholders’ respective tax liabilities would be adjusted to the possible detriment of certain Shareholders. The Managing Owner is authorized to revise the Fund’s allocation and revaluation methods in order to comply with applicable law or to allocate items of partnership income and deductions in a manner that reflects more accurately the Shareholders’ interests in the Fund.
Section 754 Election
The Fund has made the election permitted by Section 754 of the Code. Such an election, once made, is irrevocable without the consent of the IRS. The making of the Section 754 election by the Fund will generally have the effect of requiring a purchaser of Shares to adjust its proportionate share of the basis in the Fund’s assets, or the inside basis, pursuant to Section 743(b) of the Code to fair market value (as reflected in the purchase price for the purchaser’s Shares), as if it had acquired a direct interest in the
86
Table of Contents
Fund’s assets. The Section 743(b) adjustment is attributed solely to a purchaser of Shares and is not added to the bases of the Fund’s assets associated with all of the other Shareholders. Depending on the relationship between a Shareholder’s purchase price for Shares and its unadjusted share of the Fund’s inside basis at the time of the purchase, the Section 754 election may be either advantageous or disadvantageous to the Shareholder as compared to the amount of gain or loss a Shareholder would be allocated absent the Section 754 election.
The calculations under Section 754 of the Code are complex, and there is little legal authority concerning the mechanics of the calculations, particularly in the context of publicly traded partnerships. To help reduce the complexity of those calculations and the resulting administrative costs, the Fund will apply certain conventions in determining and allocating the Section 743 basis adjustments. It is possible that the IRS will successfully assert that some or all of such conventions utilized by the Fund do not satisfy the technical requirements of the Code or the Treasury Regulations and, thus, will require different basis adjustments to be made. If the IRS were to sustain such a position, a Shareholder may have adverse tax consequences.
In order to make the basis adjustments permitted by Section 754, the Fund will be required to obtain information regarding each Shareholder’s secondary market transactions in Shares as well as creations and redemptions of Shares. The Fund will seek the requested information from the record Shareholders, and, by purchasing Shares, each beneficial owner of Shares will be deemed to have consented to the provision of the information by the record owner of the beneficial owner’s Shares. Notwithstanding the foregoing, however, there can be no guarantee that the Fund will be able to obtain such information from record owners or other sources, or that the basis adjustments that the Fund makes based on the information it is able to obtain will be effective in eliminating disparity between a Shareholder’s outside basis in its Shares and its interest in the inside basis in the Fund’s assets.
Treatment of Distributions
Distributions of cash by a partnership are generally not taxable to the distributee to the extent the amount of cash does not exceed the distributee’s
tax basis in its partnership interest. Thus, any cash distributions made by the Fund will be taxable to a Shareholder only to the extent the distributions exceed the Shareholder’s tax basis in the Shares it is treated as owning (see “Tax Basis in Fund Shares” below). Any cash distributions in excess of a Shareholder’s tax basis generally will be considered to be gain from the sale or exchange of the Shares (see “– Disposition of Shares” below).
Creation and Redemption of Shares
Shareholders, other than Authorized Participants (or holders for which an Authorized Participant is acting), generally will not recognize gain or loss as a result of an Authorized Participant’s creation or redemption of a Basket. If the Fund disposes of assets in connection with the redemption of a Basket, however, the disposition may give rise to gain or loss that will be allocated to Shareholders. An Authorized Participant’s creation or redemption of a Basket also may affect a Shareholder’s share of the Fund’s tax basis in its assets, which could affect the amount of gain or loss allocated to the Shareholder on the sale or disposition of portfolio assets by the Fund.
Disposition of Shares
If a U.S. Shareholder transfers Shares and such transfer is a sale or other taxable disposition, the U.S. Shareholder will generally be required to recognize gain or loss measured by the difference between the amount realized on the sale and the U.S. Shareholder’s adjusted tax basis in the Shares sold. The amount realized will include an amount equal to the U.S. Shareholder’s share of the Fund’s liabilities, as well as any proceeds from the sale. The gain or loss recognized will generally be taxable as capital gain or loss. Capital gain of non-corporate U.S. Shareholders is eligible to be taxed at reduced rates where the Shares sold are considered held for more than one year. Capital gain of corporate U.S. Shareholders is taxed at the same rate as ordinary income. Any capital loss recognized by a U.S. Shareholder on a sale of Shares will generally be deductible only against capital gains, except that a non-corporate U.S. Shareholder may also offset up to $3,000 per year of ordinary income with capital losses.
U.S. Shareholders whose Shares are loaned to a “short seller” to cover a short sale of Shares may be considered as having disposed of those Shares. If so,
87
Table of Contents
such Shareholder would no longer be a beneficial owner of those Shares during the period of the loan and may recognize gain or loss from the disposition. As a result, during the period of the loan, (1) any of the Fund’s income, gain, loss, deduction, or other items with respect to those Shares would not be reported by the Shareholder, and (2) any cash distributions received by the Shareholder as to those Shares could be fully taxable, likely as ordinary income. Accordingly, Shareholders who desire to avoid the risk of income recognition from a loan of their Shares to a short seller are urged to modify any applicable brokerage account agreements to prohibit their brokers from borrowing their Shares. These rules, however, should not affect the amount or timing of income, gain, deduction or loss reported by a taxpayer that is a dealer in securities that marks the Shares to market for U.S. federal income tax purposes, or a trader in securities that has elected to use the mark-to-market method of tax accounting with respect to the Shares.
Tax Basis in Fund Shares
A U.S. Shareholder’s initial tax basis in its Shares will equal the sum of (a) the amount of cash paid by the U.S. Shareholder for its Shares and (b) the U.S. Shareholder’s share of the Fund’s liabilities. A U.S. Shareholder’s tax basis in its Shares will be increased by (a) the U.S. Shareholder’s share of the Fund’s taxable income, including capital gain, (b) the U.S. Shareholder’s share of the Fund’s income, if any, that is exempt from tax and (c) any increase in the U.S. Shareholder’s share of the Fund’s liabilities. A U.S. Shareholder’s tax basis in Shares will be decreased (but not below zero) by (a) the amount of any cash distributed (or deemed distributed) to the U.S. Shareholder, (b) the U.S. Shareholder’s share of the Fund’s losses and deductions, (c) the U.S. Shareholder’s share of the Fund’s expenditures that are neither deductible nor properly chargeable to its capital account and (d) any decrease in the U.S. Shareholder’s share of the Fund’s liabilities.
Limitations on Interest Deductions
The deductibility of a non-corporate U.S. Shareholder’s “investment interest expense” is generally limited to the amount of the Shareholder’s “net investment income.” Investment interest expense will generally include interest expense incurred by the Fund, if any, and investment interest expense
incurred by the U.S. Shareholder on any margin account borrowing or other loan incurred to purchase or carry Shares. Net investment income includes gross income from property held for investment and amounts treated as portfolio income, such as dividends and interest, less deductible expenses, other than interest, directly connected with the production of investment income. For this purpose, any long-term capital gain or qualifying dividend income that is taxable at long-term capital gains rates is excluded from net investment income unless the U.S. Shareholder elects to pay tax on such capital gain or dividend income at ordinary income rates.
Organization, Syndication and Other Expenses
In general, for taxable years beginning before January 1, 2018, expenses incurred that are considered “miscellaneous itemized deductions” may be deducted by a U.S. Shareholder that is an individual, estate or trust only to the extent that they exceed 2% of the adjusted gross income of the U.S. Shareholder. The Code imposes additional limitations on the amount of certain itemized deductions allowable to individuals, by reducing the otherwise allowable portion of such deductions by an amount equal to the lesser of:
| • | 3% of the individual’s adjusted gross income in excess of certain threshold amounts; or |
| • | 80% of the amount of certain itemized deductions otherwise allowable for the taxable year. |
Under the Tax Act, “miscellaneous itemized deductions” are not permitted for taxable years beginning after December 31, 2017 and before January 1, 2026.
In addition, these expenses are also not deductible in determining the alternative minimum tax liability of a non-corporate U.S. Shareholder. The Fund will report its expenses on a pro rata basis to the Shareholders, and each U.S. Shareholder will determine separately to what extent they are deductible on the U.S. Shareholder’s tax return. A U.S. Shareholder’s inability to deduct all or a portion of the expenses could result in an amount of taxable income to the U.S. Shareholder with respect to the Fund that exceeds the amount of cash actually distributed to such U.S. Shareholder for the year. It is
88
Table of Contents
anticipated that management fees the Fund will pay will constitute miscellaneous itemized deductions.
Under Section 709(b) of the Code, amounts paid or incurred to organize a partnership may, at the election of the partnership, be treated as deferred expenses, which are allowed as a deduction ratably over a period of 180 months. The Fund has made a Section 709(b) election. Expenditures in connection with the issuance and marketing of Shares (so called “syndication fees”) are not eligible for the 180-month amortization provision and are not deductible.
Passive Activity Income and Loss
Individuals are subject to certain “passive activity loss” rules under Section 469 of the Code. Under these rules, losses from a passive activity generally may not be used to offset income derived from any source other than passive activities. Losses that cannot be currently used under this rule may generally be carried forward. Upon an individual’s disposition of an interest in the passive activity, the individual’s unused passive losses may generally be used to offset other (i.e., non-passive) income. Under current Treasury Regulations, income or loss from the Fund’s investments generally will not constitute income or losses from a passive activity. Therefore, income or loss realized by Shareholders will not be available to offset a U.S. Shareholder’s passive losses or passive income from other sources.
Tax on Net Investment Income
A 3.8% tax will be imposed on some or all of the net investment income of certain individuals with modified adjusted gross income of over $200,000 ($250,000 in the case of joint filers) and the undistributed net investment income of certain estates and trusts. For these purposes, it is expected that all or a substantial portion of a Shareholder’s share of Fund income will be net investment income. In addition, certain Fund expenses may not be deducted in calculating a Shareholder’s net investment income.
Reporting by the Fund to its Shareholders
The Fund will file a partnership tax return. Accordingly, tax information will be provided to Shareholders on Schedule K-1 for each calendar year as soon as practicable after the end of such taxable year but in no event later than March 15. Each Schedule K-1 provided to a Shareholder will set forth
the Shareholder’s share of the Fund’s tax items (i.e., interest income from T-Bills, short-term and long-term capital gain or loss with respect to the futures contracts, Money Market Income, T-Bill ETF Income and investment expenses for the year) in a manner sufficient for a U.S. Shareholder to complete its tax return with respect to its investment in the Shares.
Each Shareholder, by its acquisition of Shares, will be deemed to agree to allow brokers and nominees to provide to the Fund its name and address and the other information and forms as may be reasonably requested by the Fund for purposes of complying with their tax reporting and withholding obligations (and to waive any confidentiality rights with respect to the information and forms for this purpose) and to provide information or forms upon request.
Given the lack of authority addressing structures similar to that of the Fund, it is not certain that the IRS will agree with the manner in which tax reporting by the Fund will be undertaken. Therefore, Shareholders should be aware that future IRS interpretations or revisions to Treasury Regulations could alter the manner in which tax reporting by the Fund and any nominee will be undertaken.
Tax Agent
The beneficial owners who are of a type, as identified by the nominee through whom their Shares are held, that do not ordinarily have U.S. federal tax return filing requirements, collectively, Certain K-1 Unitholders have designated the Managing Owner as their tax agent (the “Tax Agent”) in dealing with the Trust. In light of such designation and pursuant to Treasury Regulation section 1.6031(b)-1T(c), as amended from time to time, the Trust will provide to the Tax Agent Certain K-1 Unitholders’ statements (as such term is defined under Treasury Regulation section 1.6031(b)-1T(a)(3)), as amended from time to time).
Audits and Adjustments to Tax Liability
Pursuant to the governing documents, the Managing Owner has been appointed the “partnership representative” of the Fund, to act on its behalf in connection with IRS audits and related proceedings.
Under the new regime for the U.S. federal income tax audit of partnerships, the partnership
89
Table of Contents
representative’s actions, including the partnership representative’s agreement to adjustments of the Fund’s income in settlement of an IRS audit of the Fund, will bind all Shareholders, and opt-out rights available to certain Shareholders in connection with certain actions of the tax matters partner under the partnership audit rules in effect prior to January 1, 2018 will no longer be available.
The new partnership audit rules are effective for federal income tax returns filed for taxable years of the Fund beginning on or after January 1, 2018, but may apply for returns filed for the 2016 or 2017 taxable years, if elected. For returns filed for taxable years prior to the effective date of the new rules, the existing partnership rules apply.
Under the new rules, Shareholders are not required to receive notice of any audit of a Fund tax return and are not entitled to participate in any such audit, and any adjustment made in a Fund audit will be binding on all of the Shareholders. Any tax arising from an audit of a Fund tax return, as well as any resulting interest and penalties, is generally payable by the Fund in the year in which the determination becomes final unless the Fund elects to send statements (“Adjustment Statements”) to its Shareholders for the audited year informing them of their shares of the adjustments made on audit. If the Fund sends Adjustment Statements, Shareholders are generally required to pay any tax, interest and penalties arising from such adjustments as if the adjustments were made in the audited year and any other affected year, as applicable, but are not required to amend their tax returns for any prior year. In general, if the Fund pays the tax resulting from the adjustment, the amount is determined by applying the highest rate of tax in effect for the audited year to the net adjustment amount, subject to possible reduction, with the approval of the IRS, to account for certain types of income and for tax-exempt Shareholders. Proposed Treasury Regulations provide guidance as to how the tax is paid if a partnership or other flow-through entity receives an Adjustment Statement from a lower-tier partnership in which it holds an interest, but until such Treasury Regulations are finalized the application of the new rules to such tiered structures remains unclear. There are likely to be clarifications and other changes to the new rules, through Treasury regulations, other IRS guidance and possibly legislation. It is also possible that state and local taxing jurisdictions will enact similar provisions.
Shareholders should discuss with their own tax advisors the possible implications of the new rules with respect to an investment in the Fund.
Non-U.S. Shareholders
The Fund intends to conduct its activities in such a manner that a non-U.S. Shareholder who is not otherwise carrying on a trade or business in the United States is not expected to be considered to be engaged in a trade or business in the United States as a result of an investment in the Shares. A non-U.S. Shareholder’s share of the interest income realized by the Fund on its holdings of T-Bills will be exempt from U.S. withholding tax provided the non-U.S. Shareholder certifies on IRS Form W-8BEN or IRS Form W-8BEN-E (or other applicable form) that the Shareholder is not a U.S. person, provides name and address information and otherwise satisfies applicable documentation and certification requirements. In addition, with respect to certain distributions made to non-U.S. Shareholders, no withholding is required and the distributions by the Fund that relate to dividends paid to the Fund by money market mutual funds and T-Bill ETFs that are RICs generally will not be subject to federal income tax if (i) the distributions are properly reported by us as “interest-related dividends” or “short-term capital gain dividends,” (ii) the distributions are derived from sources specified in the Code for such dividends and (iii) certain other requirements are satisfied. No assurance can be given that any of our distributions would be designated as eligible for this exemption.
Non-U.S. Shareholders will not be subject to U.S. federal income tax on gains realized on the sale of Shares or on the non-U.S. Shareholder’s share of the Fund’s capital gains. However, the Tax Act requires the purchaser or transferee of a partnership interest to withhold a 10% tax on the “amount realized” by a Non-U.S. Shareholder on the sale or exchange of Shares. The IRS, however, has temporarily suspended the 10% withholding requirement on sales of certain publicly traded partnership interests by foreign persons until it has a chance to issue Treasury Regulations. The Fund believes that it is a publicly traded partnership for purposes of these rules and is eligible for the temporary suspension of these withholding provisions. It is unclear how this withholding requirement will be instituted in the future and will be governed by yet to be drafted IRS guidance. Non-
90
Table of Contents
U.S. Shareholders, however, should expect that this withholding requirement will be in effect at some point in the near future. A Non-U.S. Shareholder also could be liable for state/local income taxes, and could have corresponding state/local tax filing requirements.
In the case of an individual non-U.S. Shareholder, the non-U.S. Shareholder will be subject to U.S. federal income tax on gains on the sale of Shares or the non-U.S. Shareholder’s distributive share of capital gains if the non-U.S. Shareholder is present in the United States for 183 days or more during a taxable year and certain other conditions are met.
Non-U.S. Shareholders that are individuals will be subject to U.S. federal estate tax on the value of U.S. situs property owned at the time of their death (unless a statutory exemption or tax treaty exemption applies). It is unclear whether partnership interests (such as the Shares) will be considered U.S. situs property. Accordingly, non-U.S. Shareholders may be subject to U.S. federal estate tax on all or part of the value of the Shares owned at the time of their death.
Non-U.S. Shareholders are advised to consult their own tax advisors with respect to the particular tax consequences to them of an investment in the Shares.
Regulated Investment Companies
RICs may invest up to 25% of their assets in qualified PTPs and net income derived from such investments is qualifying income under the income source test applicable to entities seeking to qualify for the special tax treatment available to RICs under the Code. A RIC is not required to look through the underlying partnership assets of a qualified PTP when testing compliance with gross income tests applicable to determining whether an entity qualified as a RIC. A RIC, however, may be required to look through a qualified PTP when testing compliance with the asset diversification tests. A RIC will also be required to look through corporations in which the RIC owns a 20% or more voting stock interest in determining whether a RIC has invested up to 25% of its assets in “qualified PTPs”, including other issuers, when testing compliance with the asset diversification tests applicable to RICs under the Code. The Fund anticipates that it will qualify as a qualified PTP for any taxable year in which the Fund realizes sufficient gross income from its commodity
futures transactions. However, qualification of the Fund as a qualified PTP depends on performance of the Fund for the particular tax year and there is no assurance that it will qualify in a given year or that future results of the Fund will conform to prior experience. In addition, there is, to date, no regulatory guidance on the application of these rules, and it is possible that future guidance may adversely affect qualification of the Fund as a qualified PTP. RIC investors are urged to monitor their investment in the Fund and consult with a tax advisor concerning the impact of such an investment on their compliance with the income source and asset diversification requirements applicable to RICs. The Fund will make available on the Managing Owner’s website periodic tax information designed to enable RIC investors in its Shares to make a determination as to the Fund’s status under the qualified PTP rules.
Tax-Exempt Organizations
An organization that is otherwise exempt from U.S. federal income tax is nonetheless subject to taxation with respect to its “unrelated business taxable income” (“UBTI”). Except as noted below with respect to certain categories of exempt income, UBTI generally includes income or gain derived (either directly or through a partnership) from a trade or business, the conduct of which is substantially unrelated to the exercise or performance of the organization’s exempt purpose or function.
UBTI generally does not include passive investment income, such as dividends, interest and capital gains, whether realized by the organization directly or indirectly through a partnership (such as the Fund) in which it is a partner. This type of income is exempt, subject to the discussion of “unrelated debt-financed income” below, even if it is realized from securities trading activity that constitutes a trade or business.
UBTI includes not only trade or business income or gain as described above, but also “unrelated debt-financed income.” This latter type of income generally consists of (1) income derived by an exempt organization (directly or through a partnership) from income producing property with respect to which there is “acquisition indebtedness” at any time during the taxable year and (2) gains derived by an exempt organization (directly or through a partnership) from the disposition of
91
Table of Contents
property with respect to which there is acquisition indebtedness at any time during the twelve-month period ending with the date of the disposition.
All of the income realized by the Fund is expected to be short-term or long-term capital gain income, interest income or other passive investment income of the type specifically exempt from UBTI as discussed above. The Fund will not borrow funds for the purpose of acquiring or holding any investments or otherwise incur “acquisition indebtedness” with respect to such investments. Therefore, a tax-exempt entity purchasing Shares is not expected to incur any UBTI by reason of its investment in the Shares or upon sale of such Shares provided that such tax-exempt entity does not borrow funds for the purpose of investing in the Shares.
Under the Tax Act, tax-exempt entities are not permitted to offset losses from one trade or business against the income or gain of another trade or business. Certain net losses incurred prior to January 1, 2018 are permitted to offset gain and income created by an unrelated trade or business, if otherwise available.
Certain State and Local Taxation Matters
Prospective Shareholders should consider, in addition to the U.S. federal income tax consequences described, potential state and local tax considerations in investing in the Shares. These considerations arise under various taxing schemes, which include taxes imposed on entities treated as partnerships for U.S. federal income tax purposes, withholding on the distributive share of a nonresident partner, franchise and capital taxes, gross income taxes, net income taxes, value added taxes, and gross receipts taxes.
State and local tax laws often differ from U.S. federal income tax laws with respect to the treatment of specific items of income, gain, loss, deduction and credit for state net income tax purposes. For Shareholders that are taxed as entities for state or local tax income tax purposes, the taxable nexus, income, and apportionment factors of the Fund may flow through to the Shareholder and such flow-through may disproportionately impact the taxability of the Shareholder in one or more jurisdictions relative to that Shareholder’s distributive share from the Fund. For Shareholders that are individuals, the taxable nexus and apportioned income of the Fund will generally flow through to the Shareholder and
the Shareholder’s distributive share of the taxable income or loss of the Fund generally will be required to be included in determining its reportable income for state and local income tax purposes in the jurisdiction in which the Shareholder is a resident.
The Fund may have a taxable nexus with one or more jurisdictions that will subject a Shareholder to tax (and require a Shareholder to file a state and local tax return with the jurisdiction in respect to the Shareholder’s share of the income derived from that business). A prospective Shareholder should consult its tax advisor with respect to the availability of a credit for such tax in the jurisdiction(s) in which the Shareholder is resident.
Tax Shelter Disclosure Rules
There are circumstances under which certain transactions must be disclosed to the IRS in a disclosure statement attached to a taxpayer’s U.S. federal income tax return. (A copy of such statement must also be sent to the IRS Office of Tax Shelter Analysis.) In addition, the Code imposes a requirement on certain “material advisors” to maintain a list of persons participating in such transactions, which list must be furnished to the IRS upon written request. These provisions can apply to transactions not conventionally considered to involve abusive tax planning. Consequently, it is possible that such disclosure could be required by the Fund or the Shareholders (1) if a Shareholder incurs a loss (in each case, in excess of a threshold computed without regard to offsetting gains or other income or limitations) from the disposition (including by way of withdrawal) of Shares, or (2) possibly in other circumstances. Furthermore, the Fund’s material advisors could be required to maintain a list of persons investing in the Fund pursuant to the Code. While the tax shelter disclosure rules generally do not apply to a loss recognized on the disposition of an asset in which the taxpayer has a qualifying basis (generally a basis equal to the amount of cash paid by the taxpayer for such asset), such rules will apply to a taxpayer recognizing a loss with respect to interests in a pass-through entity (such as the Shares) even if its basis in such interests is equal to the amount of cash it paid. In addition, significant penalties may be imposed in connection with a failure to comply with these reporting requirements. U.S. Shareholders are urged to consult their tax advisors regarding the tax shelter disclosure rules and their possible application to them.
92
Table of Contents
U.S. Shareholders should consult their own tax advisors regarding any tax reporting or filing obligations they may have as a result of their acquisition, ownership or disposition of Shares.
Backup Withholding
The Fund is required in certain circumstances to backup withhold on certain payments paid to non-corporate Shareholders that do not furnish the Fund with their correct taxpayer identification number (in the case of individuals, their social security number) and certain certifications, or who are otherwise subject to backup withholding. Backup withholding is not an additional tax. Any amounts withheld from payments made to a Shareholder may be refunded or credited against the Shareholder’s U.S. federal income tax liability, if any, provided that the required information is furnished to the IRS in a timely manner.
Shareholders should be aware that certain aspects of the U.S. federal, state and local income tax treatment regarding the purchase, ownership and disposition of Shares are not clear under existing law. Thus, Shareholders are urged to consult their own tax advisors to determine the tax consequences of ownership of the Shares in their particular circumstances, including the application of U.S. federal, state, local and foreign tax laws.
FATCA
The Foreign Account Tax Compliance Act provisions of the Hiring Incentives to Restore Employment Act (“FATCA”) generally impose a reporting and 30% withholding tax regime with respect to certain items of U.S. source income (including dividends and interest) and gross proceeds from the sale or other disposal of property that can produce U.S. source interest or dividends (“Withholdable Payments”). As a general matter, the rules are designed to require U.S. persons’ direct and indirect ownership of non-U.S. accounts and non-U.S. entities to be reported to the IRS. The 30% withholding tax regime applies if there is a failure to provide required information regarding U.S. ownership. The withholding rules generally apply to Withholdable Payments (other than gross proceeds of the type described above) and, beginning January 1, 2019, payments of gross proceeds of the type described above with respect to a sale or disposition.
The rules may subject a non-U.S. Shareholder’s share of Withholdable Payments received by the
Fund to 30% withholding tax unless such shareholder provides information, representations and waivers of non-U.S. law as may be required to comply with the provisions of the rules, including information regarding certain U.S. direct and indirect owners of such non-U.S. Shareholder. A non-U.S. Shareholder that is treated as a “foreign financial institution” will generally be subject to withholding unless it agrees to report certain information to the IRS regarding its U.S. accountholders and those of its affiliates.
Although the application of the withholding rules to a sale or other disposal of an interest in a partnership is unclear, it is possible that the gross proceeds of the sale or other disposal of an interest in the Fund will be subject to tax under the withholding rules if such proceeds are treated as an indirect disposal of the non-U.S. Shareholder’s interest in assets that can produce U.S. source interest or dividends, unless the selling non-U.S. Shareholder provides appropriate reporting information. Prospective shareholders should consult their own advisors regarding the requirements under FATCA with respect to their own situation.
Euroclear System
Any participant of the Euroclear System that holds Shares in the Euroclear System will be deemed to have represented to and agreed with the Fund and Euroclear Bank as a condition to Shares being in the Euroclear System to furnish to the Euroclear Bank (a) its tax identification number, (b) notice of whether it is (i) a person who is not a United States person, (ii) a foreign government, an international organization or any wholly owned agency or instrumentality of either of the foregoing or (iii) a tax exempt identity, and (c) such other information as the Euroclear Bank may request from time to time in order to comply with its United States tax reporting obligations. If a participant in the Euroclear System fails to provide such information, Euroclear Bank may, among other courses of action, block trades in the Shares and related income distributions of such participant.
PROSPECTIVE INVESTORS ARE URGED TO CONSULT THEIR TAX ADVISORS BEFORE DECIDING WHETHER TO INVEST IN THE SHARES.
93
Table of Contents
PURCHASES BY EMPLOYEE BENEFIT PLANS
Although there can be no assurance that an investment in the Fund, or any other managed futures product, will achieve the investment objectives of an employee benefit plan in making such investment, futures investments have certain features which may be of interest to such a plan. For example, the futures markets are one of the few investment fields in which employee benefit plans can participate in leveraged strategies without being required to pay tax on “unrelated business taxable income.” See “Material U.S. Federal Income Tax Considerations—‘Tax-Exempt Organizations’” below. In addition, because they are not taxpaying entities, employee benefit plans are not subject to paying annual tax on profits (if any) of the Fund.
General
The following section sets forth certain consequences under the Employee Retirement Income Security Act of 1974, as amended (“ERISA”), and the Code, which a fiduciary of an “employee benefit plan” as defined in, and subject to the fiduciary responsibility provisions of, ERISA or of a “plan” as defined in and subject to Section 4975 of the Code who has investment discretion should consider before deciding to invest the plan’s assets in the Fund (such “employee benefit plans” and “plans” being referred to herein as “Plans,” and such fiduciaries with investment discretion being referred to herein as “Plan Fiduciaries”). The following summary is not intended to be complete, but only to address certain questions under ERISA and the Code which are likely to be raised by the Plan Fiduciary’s own counsel.
In general, the terms “employee benefit plan” as defined in ERISA and “plan” as defined in Section 4975 of the Code together refer to any plan or account of various types which provide retirement benefits or welfare benefits to an individual or to an employer’s employees and their beneficiaries. Such plans and accounts include, but are not limited to, corporate pension and profit-sharing plans, “simplified employee pension plans,” Keogh plans for self-employed individuals (including partners), individual retirement accounts described in Section 408 of the Code and medical benefit plans.
Each Plan Fiduciary of an ERISA Plan must give appropriate consideration to the facts and
circumstances that are relevant to an investment in the Fund, including the role that such an investment in the Fund would play in the Plan’s overall investment portfolio. Each such Plan Fiduciary, before deciding to invest in the Fund, must be satisfied that such investment in the Fund is a prudent investment for the Plan, that the investments of the Plan, including the investment in the Fund, are diversified so as to minimize the risk of large losses and that an investment in the Fund complies with the documents of the Plan and related trust.
EACH PLAN FIDUCIARY CONSIDERING ACQUIRING SHARES SHOULD CONSULT WITH ITS OWN LEGAL AND TAX ADVISORS BEFORE DOING SO. AN INVESTMENT IN THE FUND IS SPECULATIVE AND INVOLVES A HIGH DEGREE OF RISK. THE FUND IS NOT INTENDED AS A COMPLETE INVESTMENT PROGRAM.
“Plan Assets”
ERISA and a regulation issued thereunder (the “Plan Asset Rules”) contain rules for determining when an investment by a Plan in an entity will result in the underlying assets of such entity being treated as assets of the Plan for purposes of the fiduciary responsibility and prohibited transaction provisions of ERISA and Section 4975 of the Code (i.e., “plan assets”). Those rules provide that assets of an entity will not be plan assets of a Plan which purchases an interest therein if certain exceptions apply, including (i) an exception applicable if the equity interest purchased is a “publicly-offered security” (the “Publicly-Offered Security Exception”), and (ii) an exception applicable if the investment by all “benefit plan investors” is not “significant” or certain other exceptions apply (the “Insignificant Participation Exception”).
The Publicly-Offered Security Exception applies if the equity interest is a security that is (1) “freely transferable,” (2) part of a class of securities that is “widely held” and (3) either (a) part of a class of securities registered under Section 12(b) or 12(g) of the Exchange Act, or (b) sold to the Plan as part of a public offering pursuant to an effective registration statement under the Securities Act and the class of which such security is a part is registered under the Exchange Act within 120 days (or such later time as may be allowed by the SEC) after the end of the fiscal year of the issuer in which the offering of such
94
Table of Contents
security occurred. The Plan Asset Rules state that the determination of whether a security is “freely transferable” is to be made based on all relevant facts and circumstances. Under the Plan Asset Rules, a class of securities is “widely held” only if it is of a class of securities owned by 100 or more investors independent of the issuer and of each other.
The Shares should be considered to be publicly-offered securities. First, the Shares are being sold only as part of a public offering pursuant to an effective registration statement under the Securities Act, and the Shares were timely registered under the Exchange Act. Second, it appears that the Shares are freely transferable because the Shares may be freely bought and sold on NYSE Arca. Third, the Shares have been owned by at least 100 investors independent of the Fund and of each other from the date the Shares were first sold. Therefore, the underlying assets of the Fund should not be considered to constitute assets of any Plan which purchases Shares.
Ineligible Purchasers
In general, Shares may not be purchased with the assets of a Plan if the Managing Owner, the Commodity Broker, the Administrator, Invesco Distributors, the Marketing Agent, the Trustee, the Index Sponsor, or any of their respective affiliates or any of their respective employees either: (a) has investment discretion with respect to the investment of such plan assets; (b) has authority or responsibility to give “investment advice” as defined by the U.S. Department of Labor regulations with respect to such plan assets, for a fee; or (c) is an employer maintaining or contributing to such Plan. A party that is described in clause (a) or (b) of the preceding sentence is a fiduciary under ERISA and the Code with respect to the Plan, and any such purchase might result in a “prohibited transaction” under ERISA and the Code absent an available exemption from the prohibited transaction rules.
Form 5500 Reporting
Certain ERISA Plans may be required to report certain compensation paid by the Fund to the Fund’s service providers on Schedule C to the Plan’s annual Form 5500. To the extent applicable, any descriptions of such compensation herein are intended to satisfy the disclosure requirements for “eligible indirect compensation” for purposes of the alternative reporting option on Schedule C.
Except as otherwise set forth, the foregoing statements regarding the consequences under ERISA and the Code of an investment in the Fund are based on the provisions of the Code and ERISA as currently in effect, and the existing administrative and judicial interpretations thereunder. No assurance can be given that administrative, judicial or legislative changes will not occur that will not make the foregoing statements incorrect or incomplete.
THE PERSON WITH INVESTMENT DISCRETION SHOULD CONSULT WITH HIS OR HER ATTORNEY AND FINANCIAL ADVISERS AS TO THE PROPRIETY OF AN INVESTMENT IN THE FUND IN LIGHT OF THE CIRCUMSTANCES OF THE PARTICULAR PLAN AND CURRENT TAX LAW.
This section does not address any laws, regulations, or statutes that may apply to prospective investors that are employee benefit plans not subject to ERISA or Section 4975 of the Code, such as U.S. federal, state and local governmental plans and certain church plans (as well as foreign plans). These other laws, regulations or statutes may impose fiduciary responsibility requirements in connection with the investment of plan assets that may be similar to ERISA. Such investors should consult their own professional advisors about these matters.
Authorized Participants
The Fund issues Shares in Baskets to Authorized Participants continuously on the creation order settlement date as of 2:45 p.m., Eastern time, on the business day immediately following the date on which a valid order to create a Basket is accepted by the Fund. The creation or redemption will be at the NAV of 200,000 Shares as of the closing time of the NYSE Arca or the last to close of the exchanges on which the Fund’s futures contracts are traded, whichever is later, on the date that a valid order to create a Basket is accepted by the Fund. Upon submission of a creation order, the Authorized Participant may request the Managing Owner to agree to a creation order settlement date up to two business days after the creation order date.
95
Table of Contents
Authorized Participants may offer to the public, from time to time, Shares from any Baskets they create. Shares offered to the public by Authorized Participants will be offered at a per Share offering price that will vary depending on, among other factors, the trading price of the Shares on the NYSE Arca, the NAV per Share and the supply of and demand for the Shares at the time of the offer. Shares initially comprising the same Basket but offered by Authorized Participants to the public at different times may have different offering prices. The excess, if any, of the price at which an Authorized Participant sells a Share over the price paid by such Authorized Participant in connection with the creation of such Share in a Basket may, depending upon the facts and circumstances, be deemed to be underwriting compensation by the FINRA Corporate Financing Department. Authorized Participants will not receive from the Fund, the Managing Owner or any of their affiliates, any fee or other compensation in connection with their sale of Shares to the public, although investors are expected to be charged a commission by their brokers in connection with purchases of Shares that will vary from investor to investor. Investors are encouraged to review the terms of their brokerage accounts for applicable charges.
The Fund has entered into the Distribution Services Agreement with Invesco Distributors to assist the Managing Owner with certain functions and duties relating to distribution and marketing, including reviewing and approving marketing materials. In consideration for the services provided by Invesco Distributors, the Managing Owner reimburses Invesco Distributors for actual costs associated with the performance of such services, capped at $25,000 annually. See also “Material Contracts – Distribution Services Agreement.”
As of the date of this Prospectus, each of BMO Capital Markets Corp., BNP Paribas Securities Corp, Cantor Fitzgerald & Co., Citadel Securities, LLC, Citigroup Global Markets Inc., Credit Suisse Securities USA LLC, Deutsche Bank Securities Inc., Goldman Sachs & Co. and Goldman Sachs Execution & Clearing L.P., Interactive Brokers LLC, Jefferies LLC, J.P. Morgan Securities Inc., Merrill Lynch Professional Clearing Corp., Morgan Stanley & Co. LLC, Nomura Securities International Inc., RBC Capital Markets, LLC, SG Americas Securities LLC, Timber Hill LLC, UBS Securities
LLC, Virtu Financial BD LLC and Virtu Financial Capital Markets LLC has executed a Participant Agreement and are the only Authorized Participants.
Likelihood of Becoming a Statutory Underwriter
The Fund issues Shares in Baskets to Authorized Participants from time to time in exchange for cash. Because new Shares can be created and issued on an ongoing basis at any point during the life of the Fund, a “distribution,” as such term is used in the Securities Act, may occur at any point. An Authorized Participant, other broker-dealer firm or its client may be deemed a statutory underwriter, and thus may be subject to the prospectus-delivery and liability provisions of the Securities Act, if it purchases a Basket from the Fund, breaks the Basket down into the constituent Shares and sells the Shares to its customers; or if it chooses to couple the creation of a supply of new Shares with an active selling effort involving solicitation of secondary market demand for the Shares. A determination of whether one is an underwriter must take into account all the facts and circumstances pertaining to the activities of the broker-dealer or its client in the particular case, and the examples mentioned above should not be considered a complete description of all the activities that would lead to categorization as an underwriter. Authorized Participants, other broker-dealers and other persons are cautioned that some of their activities may result in their being deemed participants in a distribution, under certain interpretations of applicable law, in a manner which would render them statutory underwriters and subject them to the prospectus-delivery and liability provisions of the Securities Act.
Dealers who are neither Authorized Participants nor “underwriters” but are participating in a distribution (as contrasted to ordinary secondary trading transactions), and thus dealing with Shares that are part of an “unsold allotment” within the meaning of section 4(a)(3)(C) of the Securities Act, would be unable to take advantage of the prospectus delivery exemption provided by section 4(a)(3) of the Securities Act.
[Remainder of page left blank intentionally.]
96
Table of Contents
Summary of Items of Value Paid Pursuant to FINRA Rule 2310
| Nature of Payment | Recipient | Payor | Amount of Payment | Services Provided | ||||
| Selling Commission | Authorized Participants |
Shareholders | No greater than 0.99% of the gross offering proceeds. | Brokering purchases and sales of the Shares and creating and redeeming Baskets. | ||||
| Distribution Services Fee | Invesco Distributors |
Managing Owner | Capped at $25,000 per annum, not to exceed 0.25% of the gross offering proceeds. | Assisting the Managing Owner with certain functions and duties relating to distribution and marketing, including reviewing and approving marketing materials, consulting with FINRA and ensuring compliance with FINRA marketing rules and maintaining certain books and records pertaining to the Trust and the Fund. | ||||
| Marketing Services Fee | Marketing Agent |
Managing Owner | A range from 0.05%—0.345% per annum of the Total Average Net Assets (as defined herein) during each year calculated in U.S. dollars; not to exceed 8.75% of the gross offering proceeds. | Assisting the Managing Owner by providing support to educate institutional investors about the Deutsche Bank indices and to complete governmental or institutional due diligence questionnaires or requests for proposals related to the Deutsche Bank indices. |
For additional details see below.
General
Retail investors may purchase and sell Shares through traditional brokerage accounts. Investors who purchase Shares through a commission/fee-based brokerage account may pay commissions/fees charged by the brokerage account. Investors are encouraged to review the terms of their brokerage accounts for applicable charges.
Investors intending to create or redeem Baskets through Authorized Participants in transactions not involving a broker-dealer registered in such investor’s state of domicile or residence should consult their legal advisor regarding applicable broker-dealer or securities regulatory requirements under the state securities laws prior to such creation or redemption.
The Managing Owner has agreed to indemnify certain parties against certain liabilities, including liabilities under the Securities Act, and to contribute to payments that such parties may be required to make in respect of those liabilities. The Trustee has agreed to reimburse such parties, solely from and to the extent of the Fund’s assets, for indemnification and contribution amounts due from the Managing Owner in respect of such liabilities to the extent the Managing Owner has not paid such amounts when due.
The offering of Baskets is being made in compliance with FINRA Rule 2310. Accordingly, the Authorized Participants will not make any sales to any account over which they have discretionary authority without the prior written approval of a purchaser of Shares. The maximum amount of items
97
Table of Contents
of value to be paid to FINRA Members in connection with the offering of the Shares by the Fund will not exceed 10%.
The Authorized Participants will not charge a commission of greater than 0.99% of the gross offering proceeds of such Shares of the Trust.
The Distribution Services Agreement provides for Invesco Distributors to be paid $25,000 per annum ($6,250 per quarter). The Managing Owner pays these fees to the Distributor out of its own assets.
The Marketing Agent will be paid a marketing services fee by the Managing Owner. For each year ending on or prior to the sixth anniversary of the date of the Services Agreement, the marketing services fee will equal to the sum of: (i) 0.00345 times the lesser of Total Average Net Assets and $6,000,000,000, plus (ii) If such Total Average Net Assets were greater than $6,000,000,000, 0.002625 times the lesser of (A) the excess of such Total Average Net Assets over $6,000,000,000 and (B) $3,000,000,000, plus (iii) If such Total Average Net Assets were greater than $9,000,000,000, 0.000975 times the lesser of (A) the excess of such Total Average Net Assets over $9,000,000,000 and (B) $3,000,000,000, plus (iv) If such Total Average Net Assets were greater than $12,000,000,000, 0.00015 times the excess of such Total Average Net Assets over $12,000,000,000. For each year ending on or after to the sixth anniversary of the date of the Services Agreement, the marketing services fee will equal to 0.0005 times Total Average Net Assets. “Total Average Net Assets” means the sum of the “Average Net Assets” of all “Funds” for such period. “Average Net Assets” means in respect of any Fund, the average of the total NAV of such Fund (determined as described in its prospectus) as of the close of trading on each day of the applicable determination year during which the market on which such Fund is or was listed for trading was open for trading. If a Fund was opened or terminated, or the applicable marketing services from the Marketing Agent were initiated or terminated, in the course of a determination year, the Average Net Assets will continue to be calculated with respect to all trading days in such determination year but with a value of zero for days on which the Fund did not exist or the Marketing Agent’s marketing services had been terminated or not yet initiated. For purposes of this
paragraph only, “Funds” means, collectively, Invesco DB Agriculture Fund, Invesco DB Base Metals Fund, Invesco DB Commodity Index Tracking Fund, Invesco DB Energy Fund, Invesco DB G10 Currency Harvest Fund, Invesco DB Gold Fund, Invesco DB Oil Fund, Invesco DB Precious Metals Fund, Invesco DB Silver Fund, Invesco DB US Dollar Index Bearish Fund, Invesco DB US Dollar Index Bullish Fund, and “New Invesco ETFs”. New Invesco ETF means, in part, any fund that both (i) is formed and sponsored or advised on or after the date of the Services Agreement by the Managing Owner or an affiliate and (ii) meets all of the following criteria: (1) is a vehicle that both (a) is listed, traded or sold in North America, Central America or South America and (b) either (i) has an investment strategy substantially similar to that of a Fund or (ii) satisfies (or would, if sponsored by the Managing Owner, satisfy) all of the criteria set forth in clauses (ii)(1) and (b) herein; (2) is marketed as having a principal investment objective of providing exposure to certain designated commodities or derivatives thereof, whether long, short, or otherwise; and (3) (A) invests, is permitted to invest in, or which has as a principal investment strategy the investment of, more than 51% of its net assets in certain designated commodities, or (B) establishes or maintains, is permitted to establish or maintain, or which has as a principal investment strategy to establish or maintain, exposure to derivatives of certain designated commodities with a gross aggregate notional value greater than 51% of its NAV.
The payments to Invesco Distributors and the Marketing Agent will not, in the aggregate (of the Trust, and not on a Fund by Fund basis), exceed 0.25% and 8.75%, respectively, of the gross offering proceeds of the offering. Invesco Distributors and the Marketing Agent will monitor compensation received in connection with the Trust to determine if the payments described hereunder must be limited, when combined with selling commissions charged and any price spreads realized by other FINRA members, in order to comply with the 10% limitation on total underwriters’ compensation pursuant to FINRA Rule 2310.
The Marketing Agent’s compensation is also subject to the limitations under NASD Rule 2830, which governs the underwriting compensation which may be paid in respect of investment companies.
98
Table of Contents
The Fund’s Shares trade on the NYSE Arca under the symbol “DBA.”
Morgan, Lewis & Bockius LLP has advised the Managing Owner in connection with the Shares being offered hereby. Morgan, Lewis & Bockius LLP also advises the Managing Owner with respect to its responsibilities as managing owner of, and with respect to matters relating to the Trust and the Fund. Morgan, Lewis & Bockius LLP has prepared the sections “Material U.S. Federal Income Tax Considerations” and “Purchases By Employee Benefit Plans” with respect to ERISA. Morgan, Lewis & Bockius LLP has not represented, nor will it represent the Trust or the Fund or the Shareholders in matters relating to the Trust or the Fund and no other counsel has been engaged to act on their behalf. Certain opinions of counsel have been filed with the SEC as exhibits to the Registration Statement of which this Prospectus is a part.
Richards, Layton & Finger, P.A., special Delaware counsel to the Trust, has advised the Trust in connection with the legality of the Shares being offered hereby.
The financial statements of the Fund and management’s assessment of the effectiveness of internal control over financial reporting (which is included in Management’s Report on Internal Control over Financial Reporting) incorporated in this Prospectus by reference to the Annual Report on Form 10-K for the year ended December 31, 2017 have been so incorporated in reliance on the report of PricewaterhouseCoopers LLP, an independent registered public accounting firm, given on the authority of said firm as experts in auditing and accounting.
This Prospectus constitutes part of the Registration Statement filed by the Trust on behalf of the Fund with the SEC in Washington, D.C. As further discussed under “Incorporation by Reference
of Certain Documents,” we have incorporated by reference certain information. This Prospectus does not contain all of the information set forth in such Registration Statement, certain portions of which have been omitted pursuant to the rules and regulations of the SEC, including, without limitation, certain exhibits thereto (for example, the forms of the Participant Agreement and the Customer Agreement). The descriptions contained herein of agreements included as exhibits to the Registration Statement are necessarily summaries; the exhibits themselves may be inspected without charge at the public reference facilities maintained by the SEC in Washington, D.C., and copies of all or part thereof may be obtained from the Commission upon payment of the prescribed fees. The SEC maintains a website that contains reports, proxy and information statements and other information regarding registrants that file electronically with the SEC. The address of such site is http://www.sec.gov.
RECENT FINANCIAL INFORMATION AND ANNUAL REPORTS
The Managing Owner will furnish you with an annual report of the Fund within ninety (90) calendar days after the end of the Fund’s fiscal year as required by the rules and regulations of the CFTC, including, but not limited to, an annual audited financial statement certified by independent registered public accountants and any other reports required by any other governmental authority that has jurisdiction over the activities of the Fund. You also will be provided with appropriate information to permit you to file your U.S. federal and state income tax returns (on a timely basis) with respect to your Shares. Monthly account statements conforming to CFTC and NFA requirements are posted on the Managing Owner’s website at www.invesco.com/ETFs. Additional reports may be posted on the Managing Owner’s website in the discretion of the Managing Owner or as required by regulatory authorities.
INCORPORATION BY REFERENCE OF CERTAIN DOCUMENTS
The SEC allows the Fund to “incorporate by reference” into this Prospectus the information that the Fund files with it, meaning the Fund can disclose
99
Table of Contents
important information to Shareholders by referring Shareholders to those documents already on file with the SEC.
The information the Fund incorporates by reference is an important part of this Prospectus, and later information that the Fund files with the SEC will automatically update and supersede some of this information. The Fund incorporates by reference the documents listed below.
This Prospectus incorporates by reference the following documents, which were previously filed with the SEC, in response to certain disclosures:
| • | The Annual Report on Form 10-K for the fiscal year ended December 31, 2017, filed on February 28, 2018; and |
| • | The Quarterly Reports on Form 10-Q for the quarterly periods ended March 31, 2018 and June 30, 2018, filed on May 8, 2018 and August 8, 2018, respectively; and |
| • | All other reports filed pursuant to Section 13(a) or 15(d) of the Exchange Act since December 31, 2017, except for information furnished under Form 8-K, which is not deemed filed and not incorporated herein by reference. |
Any statement contained in a document that is incorporated by reference will be modified or superseded for all purposes to the extent that a statement contained in this Prospectus (or in any other document that is subsequently filed with the SEC and incorporated by reference) modifies or is contrary to that previous statement. Any statement so modified or superseded will not be deemed a part of this Prospectus except as so modified or superseded.
The Fund will provide to Shareholders a copy of the filings that have been incorporated by reference in this Prospectus upon request, at no cost. Any request may be made by writing or calling the following address or telephone number:
Invesco Capital Management LLC
3500 Lacey Road, Suite 700
Downers Grove, IL 60515
Telephone: (800) 983-0903
These documents may also be accessed through our website at www.invesco.com/ETFs or as described herein under “Additional Information.” The information and other content contained on or linked from our website is not incorporated by reference in this Prospectus and should not be considered a part of this Prospectus.
The Fund files annual, quarterly, current reports and other information with the SEC. These materials are available for copying and reading at the SEC’s Public Reference Room at 100 F Street, N.E., Washington, DC 20549. The public may obtain information on the operation of the Public Reference Room by calling the SEC at 1-800-SEC-0330. The SEC maintains an internet site at http://www.sec.gov that contains reports, proxy and information statements and other information regarding the Fund.
[Remainder of page left blank intentionally.]
100
Table of Contents
PART TWO
STATEMENT OF ADDITIONAL INFORMATION
INVESCO DB MULTI-SECTOR COMMODITY TRUST
Invesco DB Agriculture Fund
Shares of Beneficial Interest
The Shares are speculative securities which involve the risk of loss.
Past performance is not necessarily indicative of future results.
See “Risk Factors” beginning at page 15 in Part One.
THIS PROSPECTUS IS IN TWO PARTS:
A DISCLOSURE DOCUMENT AND A STATEMENT OF ADDITIONAL INFORMATION.
THESE PARTS ARE BOUND TOGETHER, AND BOTH CONTAIN
IMPORTANT INFORMATION. YOU MUST READ THE
STATEMENT OF ADDITIONAL INFORMATION
IN CONJUNCTION WITH THE
DISCLOSURE DOCUMENT.
October 10, 2018
Invesco Capital Management LLC
Managing Owner
101
Table of Contents
PART TWO
STATEMENT OF ADDITIONAL INFORMATION
| GENERAL INFORMATION RELATING TO INVESCO CAPITAL MANAGEMENT LLC |
103 | |||
| 103 | ||||
| 103 | ||||
| 103 | ||||
| 103 | ||||
| 104 | ||||
| 105 | ||||
102
Table of Contents
GENERAL INFORMATION RELATING TO INVESCO CAPITAL MANAGEMENT LLC
Invesco is leading the Intelligent ETF Revolution® through its family of more than 140 domestic and international Invesco ETFs. Invesco ETFs seek to outperform traditional benchmark indexes while providing advisors and investors access to an innovative array of focused investment opportunities. With global franchise assets exceeding $980 billion as of July 31, 2018, Invesco ETFs trade on the NYSE ARCA, NASDAQ and CBOE exchanges.
Invesco Ltd. is a leading independent global investment management firm, dedicated to helping investors worldwide achieve their financial objectives. By delivering the combined power of our distinctive investment management capabilities, Invesco provides a wide range of investment strategies and vehicles to our clients around the world. Operating in more than 20 countries, the firm is listed on the New York Stock Exchange under the symbol IVZ. Additional information is available at www.invesco.com.
Futures contracts are standardized contracts made on United States or foreign exchanges that call for the future delivery of specified quantities of various agricultural and tropical commodities, industrial commodities, currencies, financial instruments or metals at a specified time and place. The contractual obligations, depending upon whether one is a buyer or a seller, may be satisfied either by taking or making, as the case may be, physical delivery of an approved grade of commodity or by making an offsetting sale or purchase of an equivalent but opposite futures contract on the same, or mutually off-setting, exchange prior to the designated date of delivery. As an example of an offsetting transaction where the physical commodity is not delivered, the contractual obligation arising from the sale of one contract of December wheat on a futures exchange may be fulfilled at any time before delivery of the commodity is required by the purchase of one contract of December wheat on the same exchange. The difference between the price at
which the futures contract is sold or purchased and the price paid for the offsetting purchase or sale, after allowance for brokerage commissions, constitutes the profit or loss to the trader. Certain futures contracts, such as those for stock, financial or economic indices approved by the CFTC, or Eurodollar contracts, settle in cash (irrespective of whether any attempt is made to offset such contracts) rather than delivery of any physical commodity.
The two broad classes of persons who trade futures contracts are “hedgers” and “speculators.” Commercial interests, including farmers, that market or process commodities, and financial institutions that market or deal in commodities, including interest rate sensitive instruments, foreign currencies and stocks, and which are exposed to currency, interest rate and stock market risks, may use the futures markets for hedging. Hedging is a protective procedure designed to minimize losses that may occur because of price fluctuations occurring, for example, between the time a processor makes a contract to buy or sell a raw or processed commodity at a certain price and the time he must perform the contract. The futures markets enable the hedger to shift the risk of price fluctuations to the speculator. The speculator risks his capital with the hope of making profits from price fluctuations in futures contracts. Speculators rarely take delivery of commodities, but rather close out their positions by entering into offsetting purchases or sales of futures contracts. Since the speculator may take either a long or short position in the futures markets, it is possible for him to make profits or incur losses regardless of whether prices go up or down.
Futures exchanges provide centralized market facilities for trading futures contracts and options thereon (but not forward contracts). Members of, and trades executed on, a particular exchange are subject to the rules of that exchange. Among the principal exchanges in the United States are the Chicago Board of Trade, the Chicago Mercantile Exchange, the New York Mercantile Exchange, and ICE Futures U.S.
Each futures exchange in the United States has an associated “clearing house.” Once trades between members of an exchange have been confirmed, the
103
Table of Contents
clearing house becomes substituted for each buyer and each seller of contracts traded on the exchange and, in effect, becomes the other party to each trader’s open position in the market. Thereafter, each party to a trade looks only to the clearing house for performance. The clearing house generally establishes a guarantee fund to which all clearing members of the exchange must contribute; this fund acts as an emergency buffer that enables the clearing house, at least to a large degree, to meet its obligations with regard to the “other side” of an insolvent clearing member’s contracts. Furthermore, clearing houses require margin deposits and continuously mark positions to market to provide some assurance that their members will be able to fulfill their contractual obligations. Thus, a central function of the clearing houses is to ensure the integrity of trades. Members effecting futures transactions on an organized exchange typically need not worry about the solvency of the party on the opposite side of the trade but, rather their concerns are the respective solvencies of their commodity broker and the clearing house. The clearing house “guarantee” of performance on open positions does not run to customers. If a member firm goes bankrupt, customers could lose money.
Foreign futures exchanges differ in certain respects from their U.S. counterparts. In contrast to U.S. exchanges, certain foreign exchanges are “principals’ markets,” where trades remain the liability of the traders involved, and the exchange clearing house does not become substituted for any party. See “Risk Factors – Trading on Futures Exchanges Outside the United States is Not Subject to U.S. Regulation.”
Futures exchanges in the United States are subject to regulation under the Commodity Exchange Act by the CFTC, the governmental agency having responsibility for regulation of futures exchanges and trading on those exchanges.
The Commodity Exchange Act and the CFTC also regulate the activities of “commodity trading advisors” and “commodity pool operators” and the CFTC has adopted regulations with respect to certain of such persons’ activities. Pursuant to its authority, the CFTC requires a commodity pool operator (such
as the Managing Owner) to keep accurate, current and orderly records with respect to each pool it operates. The CFTC may suspend the registration of a commodity pool operator if the CFTC finds that the operator has violated the Commodity Exchange Act or regulations thereunder and in certain other circumstances. Suspension, restriction or termination of the Managing Owner’s registration as a commodity pool operator would prevent it, until such time (if any) as such registration were to be reinstated, from managing, and might result in the termination of, the Trust. The Commodity Exchange Act gives the CFTC similar authority with respect to the activities of commodity trading advisors, such as the Managing Owner. If the registration of the Managing Owner as a commodity trading advisor were to be terminated, restricted or suspended, the Managing Owner would be unable, until such time (if any) as such registration were to be reinstated, to render trading advice to the Fund. The Fund is not registered with the CFTC in any capacity.
The Commodity Exchange Act requires all “futures commission merchants,” such as the Commodity Broker, to meet and maintain specified fitness and financial requirements, segregate customer funds from proprietary funds and account separately for all customers’ funds and positions, and to maintain specified book and records open to inspection by the staff of the CFTC.
The Commodity Exchange Act also gives the states certain powers to enforce its provisions and the regulations of the CFTC.
Shareholders are afforded certain rights for reparations under the Commodity Exchange Act. Shareholders may also be able to maintain a private right of action for certain violations of the Commodity Exchange Act. The CFTC has adopted rules implementing the reparation provisions of the Commodity Exchange Act which provide that any person may file a complaint for a reparations award with the CFTC for violation of the Commodity Exchange Act against a floor broker, futures commission merchant, introducing broker, commodity trading advisor, commodity pool operator, and their respective associated persons.
Pursuant to authority in the Commodity Exchange Act, the NFA has been formed and registered with the CFTC as a “registered futures
104
Table of Contents
association.” At the present time, the NFA is the only non-exchange self-regulatory organization for derivatives professionals. NFA members are subject to NFA standards relating to fair trade practices, market integrity, and consumer protection. As the self-regulatory body of the derivatives industry, the NFA promulgates rules governing the conduct of derivatives professionals and disciplines those professionals who do not comply with such standards. The CFTC has delegated to the NFA responsibility for the registration of commodity trading advisors, commodity pool operators, futures commission merchants, introducing brokers, and swap dealers, among others, and their respective associated persons, as applicable, and floor brokers. The Commodity Broker and the Managing Owner are members of the NFA (the Fund is not required to become a member of the NFA).
The CFTC has no authority to regulate trading on foreign futures exchanges and markets but permits direct access to such markets from the United States with respect to foreign boards of trade that are registered as such with the CFTC.
“Initial” or “original” margin is the minimum amount of funds that must be deposited by a futures trader with his commodity broker in order to initiate futures trading or to maintain an open position in futures contracts. “Maintenance” margin is the amount (generally less than initial margin) to which a trader’s account may decline before he must deliver additional margin. A margin deposit is like a cash performance bond. It helps assure the futures trader’s performance of the futures contract that the trader purchases or sells. Futures contracts are customarily bought and sold on margin that represents a very small percentage (ranging upward from less than 2%) of the purchase price of the underlying commodity being traded. Because of such low margins, price fluctuations occurring in the futures markets may create profits and losses that are greater, in relation to the amount invested, than are customary in other forms of investments. The minimum amount of margin required in connection with a particular futures contract is set from time to time by the exchange on which such contract is traded, and may be modified from time to time by the exchange during the term of the contract.
Brokerage firms carrying accounts for traders in futures contracts may not accept lower, and generally require higher, amounts of margin as a matter of policy in order to afford further protection for themselves.
Margin requirements are computed each day by a commodity broker. When the market value of a particular open futures contract position changes to a point where the margin on deposit does not satisfy maintenance margin requirements, a margin call is made by the commodity broker. If the margin call is not met within a reasonable time, the broker may close out the Fund’s position. With respect to the Managing Owner’s trading, only the Managing Owner, and not the Fund or its Shareholders personally, will be subject to margin calls.
P-DBA-PRO-1
[Remainder of page left blank intentionally.]
105