Exhibit
Executive Summary
We own and operate 18.4 million square feet of Class A office properties and 3,563 apartment units (excluding our residential development pipeline) in the premier coastal submarkets of Los Angeles and Honolulu.
| |
• | Financial Results: For the three months ended September 30, 2018 compared to three months ended September 30, 2017: |
| |
◦ | Revenues increased by 7.0% to $223.3 million. Our non-cash revenue declined by about $2 million compared to the second quarter of 2018 and will continue to decline at an accelerated pace (excluding the impact from any future acquisitions). |
| |
◦ | Net income attributable to common stockholders increased by 19.3% to $30.6 million. |
| |
◦ | FFO increased by 10.3% to $100.1 million, or $0.51 per fully diluted share. |
| |
◦ | AFFO increased by 10.3% to $82.5 million. |
| |
◦ | Same property Cash NOI increased by 4.2% to $98.4 million. |
| |
• | Office: We signed 740,000 square feet of office leases during the third quarter. Our total office portfolio leased rate remained relatively flat at 91.4% and our occupancy rate increased by 60 basis points to 89.5%, reflecting our leasing success in the first half of the year. Comparing office leases we signed during the third quarter to the expiring leases covering the same space, straight-line rents increased by 23.6% and starting cash rents increased by 11.1%. |
| |
• | Multifamily: Our multifamily portfolio remains fully leased at 98.8%. With the second building at our Moanalua development fully on-line in Q3, we now have almost 1,800 units in service in Honolulu. Multifamily same property Cash NOI increased by 3.0% to $16.0 million. Residential expenses rose 6.9% compared to last year, reflecting higher payroll and utility costs as well as some timing issues. We expect comparative payroll increases to be much lower in future quarters when the comparison quarter includes the significant payroll adjustment we made late last year in response to minimum wage increases mandated by Los Angeles. |
| |
• | Development and Repositioning Projects: Our two multifamily development projects remain on schedule and on budget. At our Moanalua apartment development in Honolulu, we are more than half way through the delivery of 475 net new residential units and we ended the quarter with a total of 221 new units leased. We expect to complete that project, along with a new fitness center and the upgrade of our existing units, around the end of this year. We are continuing with construction at our 376 unit apartment tower in Brentwood. See page 22 for more information on development. On the repositioning front, we are making investments in a number of our existing properties where we believe that targeted capital will yield significant future returns. We expect to complete several of these repositioning projects in the next few months. |
| |
• | Debt: With the exception of a loan on our development project at Moanalua, our next term loan maturity is approximately three and a half years away in 2022. We also have a large number of unencumbered properties that provide flexibility for future financings. |
| |
• | Dividends: On October 16, 2018, we paid a quarterly cash dividend of $0.25 per common share, or $1.00 per common share on an annualized basis, to our shareholders of record on September 28, 2018. |
| |
• | Guidance: We are increasing and narrowing our 2018 full year guidance for Net Income Per Common Share - Diluted to $0.69 to $0.71 and for FFO to $2.01 to $2.03 per fully diluted share. See page 23 for more information. |
NOTE: See the non-GAAP reconciliations for FFO & AFFO on page 8 and same property NOI on page 10. NOTE: See the "Definitions" section for definitions of certain terms used in this Earnings Package.
Table of Contents
|
| |
COMPANY OVERVIEW |
| |
| |
| |
| |
| |
FINANCIAL RESULTS |
| |
| |
| |
| |
| |
| |
| |
| |
| |
PORTFOLIO DATA |
| |
| |
| |
| |
| |
| |
| |
| |
| |
| |
| |
| |
| |
| |
| |
| |
| |
Forward Looking Statements
This Third Quarter 2018 Earnings Results and Operating Information, which we refer to as our Earnings Package, supplements the information provided in our reports filed with the Securities and Exchange Commission. It contains forward-looking statements within the meaning of Section 27A of the Securities Act of 1933, as amended, and Section 21E of the Securities Exchange Act of 1934, as amended, and we claim the protection of the safe harbor contained in the Private Securities Litigation Reform Act of 1995. Forward-looking statements presented in this Earnings Package, and those that we may make orally or in writing from time to time, are based on our beliefs and assumptions. Our actual results will be affected by known and unknown risks, trends, uncertainties and factors, some of which are beyond our control or ability to predict, including, but not limited to: adverse economic and real estate developments in Southern California and Honolulu; a general downturn in the economy; decreased rental rates or increased tenant incentives and vacancy rates; defaults on, and early terminations and non-renewal of, leases by tenants; increased interest rates and operating costs; failure to generate sufficient cash flows to service our outstanding indebtedness; difficulties in acquiring properties; failure to successfully operate properties; failure to maintain our status as a REIT; possible adverse changes in rent control laws and regulations; environmental uncertainties; risks related to natural disasters; lack of or insufficient insurance; inability to successfully expand into new markets or submarkets; risks associated with property development; conflicts of interest with our officers; changes in real estate and zoning laws and increases in real property tax rates; possible future terrorist attacks; and other risks and uncertainties detailed in our Annual Report on Form 10-K and other documents filed with the Securities and Exchange Commission. Although we believe that our assumptions are reasonable, they are not guarantees of future performance and some will inevitably prove to be incorrect. As a result, our actual future results can be expected to differ from our expectations, and those differences may be material. Accordingly, please use caution in relying on previously reported forward-looking statements to anticipate future results or trends. This Earnings Package and all subsequent written and oral forward-looking statements attributable to us or any person acting on our behalf are expressly qualified in their entirety by the cautionary statements contained or referred to in this section. We do not undertake any obligation to release publicly any revisions to our forward-looking statements.
Corporate Data
as of September 30, 2018
|
| | | | | | | |
| Office Portfolio | |
| | | | | |
| | Consolidated | | Total | |
| Properties | 63 |
| | 71 |
| |
| Rentable square feet (in thousands) | 16,599 |
| | 18,434 |
| |
| Leased rate | 91.5 | % | | 91.4 | % | |
| Occupancy rate | 89.6 | % | | 89.5 | % | |
| | | | | |
| | | | | |
| Multifamily Portfolio | |
| | | | | |
| | | | Consolidated | |
| Properties | | | 10 |
| |
| Units | | | 3,563 |
| |
| Leased rate | | | 98.8 | % | |
| | | | | |
|
| | | | | | |
| Market Capitalization (in thousands, except price per share) | |
| | | | |
| Fully diluted shares outstanding as of September 30, 2018 | | 198,110 |
| |
| Common stock closing price per share (NYSE:DEI) | | $ | 37.72 |
| |
| Equity capitalization | | $ | 7,472,724 |
| |
| | | | |
|
| | | | | | | | | |
| Net Debt (in thousands)(1) | |
| | | | | |
| | Consolidated | | Our Share | |
| | | | | |
| | $ | 4,154,157 |
| | $ | 3,740,405 |
| |
| Less: cash and cash equivalents | (172,362 | ) | | (84,964 | ) | |
| Net debt | $ | 3,981,795 |
| | $ | 3,655,441 |
| |
| | | | | |
|
| | | | | | |
| Leverage Ratio (in thousands, except percentage) | |
| | | | |
| Pro forma enterprise value | | $ | 11,128,164 |
| |
| Our share of net debt to pro forma enterprise value | | 33 | % | |
| | | | |
|
| | | | | |
| AFFO Payout Ratio | |
| | | | |
| Three Months Ended September 30, 2018 | | 60.1 | % | |
| | | | |
_______________________________________
| |
(1) | See page 12 for details and a reconciliation to the consolidated debt on our balance sheet. |
NOTE: See the "Definitions" section for definitions of certain terms used in this Earnings Package.
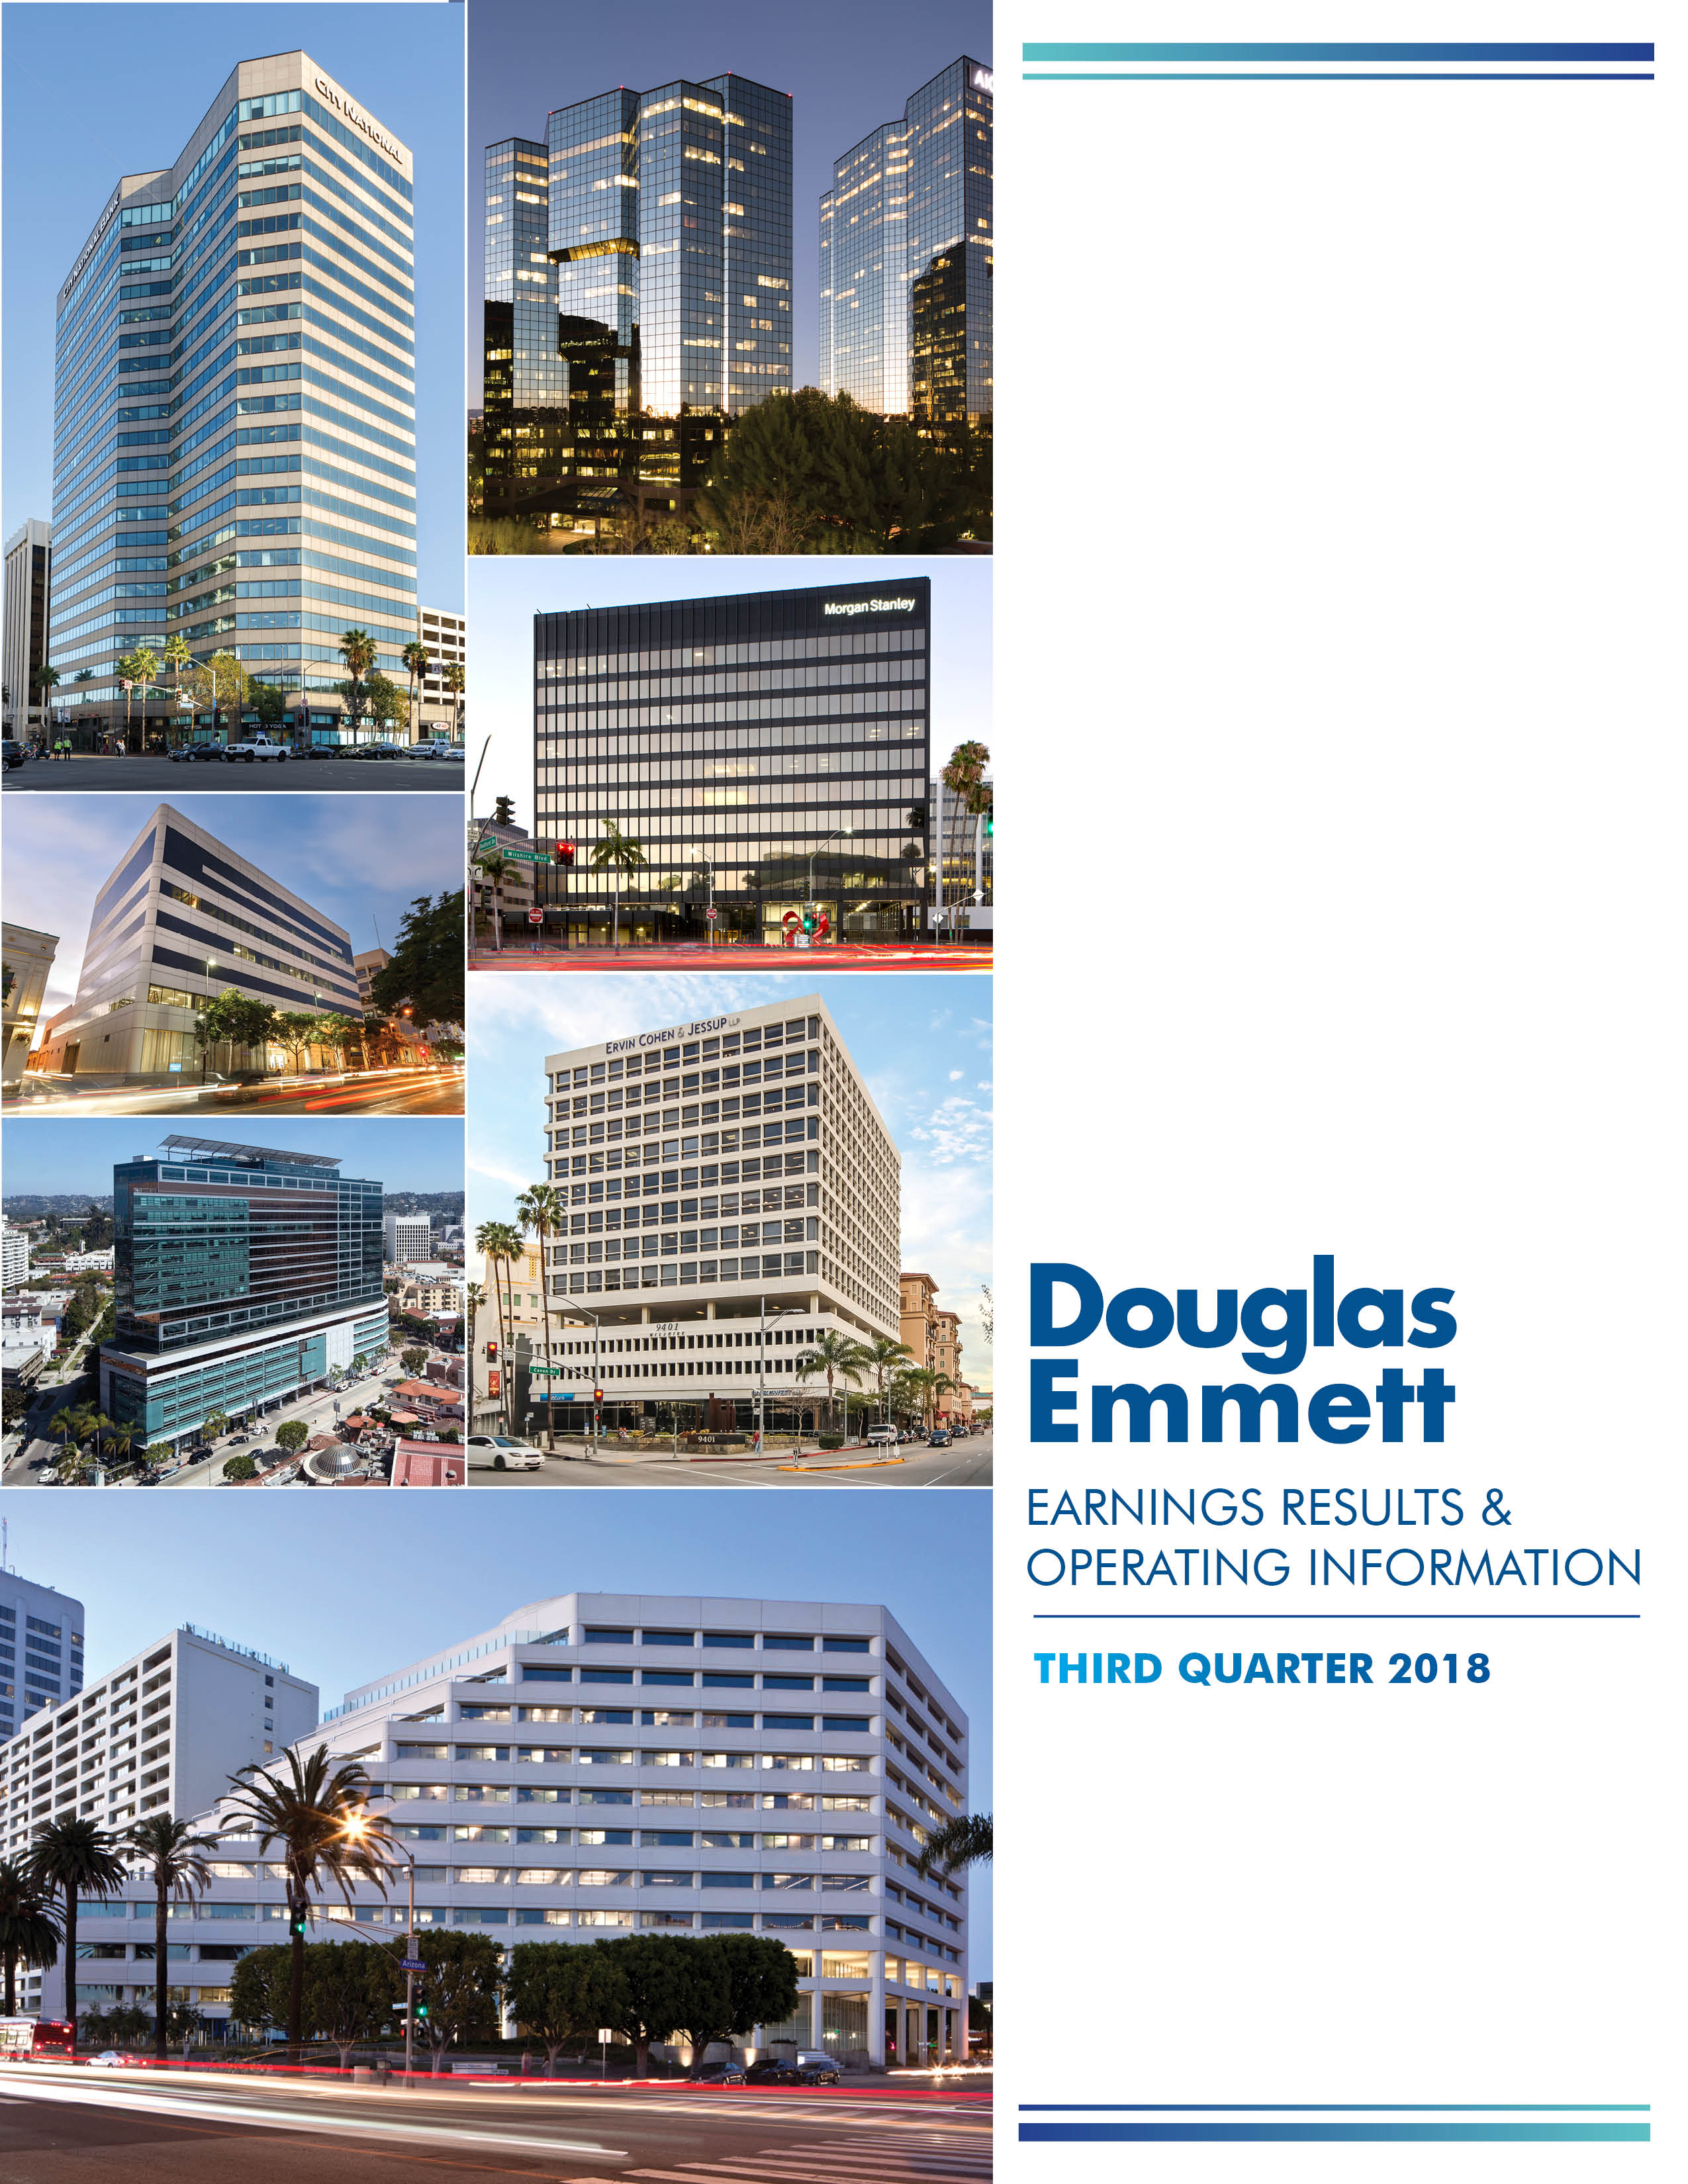
Property Map
as of September 30, 2018
Board of Directors and Executive Officers
as of September 30, 2018
BOARD OF DIRECTORS
___________________________________________________________________________________________________________________________________
|
| |
Dan A. Emmett | Our Executive Chairman of the Board |
Jordan L. Kaplan | Our Chief Executive Officer and President |
Kenneth M. Panzer | Our Chief Operating Officer |
Christopher H. Anderson | Retired Real Estate Executive and Investor |
Leslie E. Bider | Vice Chairman, PinnacleCare |
Dr. David T. Feinberg | President and Chief Executive Officer, Geisinger Health System |
Virginia A. McFerran | Partner, Optum Ventures |
Thomas E. O’Hern | Senior Executive Vice President, CFO & Treasurer, Macerich Company |
William E. Simon, Jr. | Partner, Massey Quick Simon & Co., LLC |
EXECUTIVE OFFICERS
___________________________________________________________________________________________________________________________________
|
| |
Dan A. Emmett | Chairman of the Board |
Jordan L. Kaplan | Chief Executive Officer and President |
Kenneth M. Panzer | Chief Operating Officer |
Mona M. Gisler | Chief Financial Officer |
Kevin A. Crummy | Chief Investment Officer |
CORPORATE OFFICES
1299 Ocean Avenue, Suite 1000, Santa Monica, California 90401
Phone: (310) 255-7700
For more information, please visit our website at www.douglasemmett.com or contact:
Stuart McElhinney, Vice President, Investor Relations
(310) 255-7751
smcelhinney@douglasemmett.com
Consolidated Balance Sheets
(In thousands)
|
| | | | | | | |
| September 30, 2018 | | December 31, 2017 |
| | | |
| Unaudited | | |
Assets | |
| | |
|
Investment in real estate: | |
| | |
|
Land | $ | 1,065,099 |
| | $ | 1,062,345 |
|
Buildings and improvements | 7,995,377 |
| | 7,886,201 |
|
Tenant improvements and lease intangibles | 821,483 |
| | 756,190 |
|
Property under development | 105,567 |
| | 124,472 |
|
Investment in real estate, gross | 9,987,526 |
| | 9,829,208 |
|
Less: accumulated depreciation and amortization | (2,200,403 | ) | | (2,012,752 | ) |
Investment in real estate, net | 7,787,123 |
| | 7,816,456 |
|
Cash and cash equivalents | 172,362 |
| | 176,645 |
|
Tenant receivables, net | 5,040 |
| | 2,980 |
|
Deferred rent receivables, net | 118,736 |
| | 106,021 |
|
Acquired lease intangible assets, net | 3,492 |
| | 4,293 |
|
Interest rate contract assets | 124,751 |
| | 60,069 |
|
Investment in unconsolidated real estate funds | 118,252 |
| | 107,735 |
|
Other assets | 18,023 |
| | 18,442 |
|
Total assets | $ | 8,347,779 |
| | $ | 8,292,641 |
|
| | | |
Liabilities | | | |
|
Secured notes payable and revolving credit facility, net | $ | 4,122,277 |
| | $ | 4,117,390 |
|
Interest payable, accounts payable and deferred revenue | 151,106 |
| | 103,947 |
|
Security deposits | 50,773 |
| | 50,414 |
|
Acquired lease intangible liabilities, net | 57,591 |
| | 75,635 |
|
Interest rate contract liabilities | — |
| | 807 |
|
Dividends payable | 42,491 |
| | 42,399 |
|
Total liabilities | 4,424,238 |
| | 4,390,592 |
|
| | | |
Equity | | | |
|
Douglas Emmett, Inc. stockholders' equity: | | | |
|
Common stock | 1,699 |
| | 1,696 |
|
Additional paid-in capital | 3,277,746 |
| | 3,272,539 |
|
Accumulated other comprehensive income | 94,643 |
| | 43,099 |
|
Accumulated deficit | (917,009 | ) | | (879,810 | ) |
Total Douglas Emmett, Inc. stockholders' equity | 2,457,079 |
| | 2,437,524 |
|
Noncontrolling interests | 1,466,462 |
| | 1,464,525 |
|
Total equity | 3,923,541 |
| | 3,902,049 |
|
Total liabilities and equity | $ | 8,347,779 |
| | $ | 8,292,641 |
|
NOTE: See the "Definitions" section for definitions of certain terms used in this Earnings Package.
Consolidated Operating Results
(Unaudited; in thousands, except per share data)
|
| | | | | | | | | | | | | | | |
| Three Months Ended September 30, | | Nine Months Ended September 30, |
| 2018 | | 2017 | | 2018 | | 2017 |
| | | | | | | |
Revenues | |
| | |
| | |
| | |
|
Office rental | |
| | |
| | |
| | |
|
Rental revenues | $ | 150,316 |
| | $ | 140,993 |
| | $ | 448,248 |
| | $ | 409,674 |
|
Tenant recoveries | 16,364 |
| | 15,854 |
| | 42,071 |
| | 39,705 |
|
Parking and other income | 30,374 |
| | 27,771 |
| | 87,829 |
| | 81,129 |
|
Total office revenues | 197,054 |
| | 184,618 |
| | 578,148 |
| | 530,508 |
|
| | | | | | | |
Multifamily rental | | | | | | | |
Rental revenues | 24,241 |
| | 22,282 |
| | 70,957 |
| | 66,760 |
|
Parking and other income | 2,013 |
| | 1,849 |
| | 5,919 |
| | 5,594 |
|
Total multifamily revenues | 26,254 |
| | 24,131 |
| | 76,876 |
| | 72,354 |
|
| | | | | | | |
Total revenues | 223,308 |
| | 208,749 |
| | 655,024 |
| | 602,862 |
|
| | | | | | | |
Operating Expenses | | | | | | | |
Office expenses | 66,288 |
| | 62,468 |
| | 188,462 |
| | 175,240 |
|
Multifamily expenses | 7,114 |
| | 6,041 |
| | 20,720 |
| | 17,866 |
|
General and administrative | 9,440 |
| | 8,441 |
| | 28,444 |
| | 27,189 |
|
Depreciation and amortization | 74,067 |
| | 69,974 |
| | 219,944 |
| | 206,141 |
|
Total operating expenses | 156,909 |
| | 146,924 |
| | 457,570 |
| | 426,436 |
|
| | | | | | | |
Operating income | 66,399 |
| | 61,825 |
| | 197,454 |
| | 176,426 |
|
| | | | | | | |
Other income | 2,951 |
| | 2,659 |
| | 8,373 |
| | 7,152 |
|
Other expenses | (1,561 | ) | | (1,659 | ) | | (5,380 | ) | | (5,156 | ) |
Income, including depreciation, from unconsolidated funds | 1,348 |
| | 1,137 |
| | 4,522 |
| | 4,427 |
|
Interest expense | (33,721 | ) | | (35,454 | ) | | (99,889 | ) | | (110,408 | ) |
Net income | 35,416 |
| | 28,508 |
| | 105,080 |
| | 72,441 |
|
Less: Net income attributable to noncontrolling interests | (4,855 | ) | | (2,894 | ) | | (14,629 | ) | | (7,534 | ) |
Net income attributable to common stockholders | $ | 30,561 |
| | $ | 25,614 |
| | $ | 90,451 |
| | $ | 64,907 |
|
| | | | | | | |
Net income per common share - basic | $ | 0.18 |
| | $ | 0.15 |
| | $ | 0.53 |
| | $ | 0.41 |
|
Net income per common share - diluted | $ | 0.18 |
| | $ | 0.15 |
| | $ | 0.53 |
| | $ | 0.41 |
|
| | | | | | | |
Weighted average shares of common stock outstanding - basic | 169,926 |
| | 165,471 |
| | 169,815 |
| | 158,000 |
|
Weighted average shares of common stock outstanding - diluted | 169,931 |
| | 165,520 |
| | 169,828 |
| | 158,419 |
|
NOTE: See the "Definitions" section for definitions of certain terms used in this Earnings Package.
Funds From Operations & Adjusted Funds From Operations(1)
(Unaudited; in thousands, except per share data)
|
| | | | | | | | | | | | | | | |
| Three Months Ended September 30, | | Nine Months Ended September 30, |
| 2018 | | 2017 | | 2018 | | 2017 |
Funds From Operations (FFO) | | | | | | | |
Net income attributable to common stockholders | $ | 30,561 |
| | $ | 25,614 |
| | $ | 90,451 |
| | $ | 64,907 |
|
Depreciation and amortization of real estate assets | 74,067 |
| | 69,974 |
| | 219,944 |
| | 206,141 |
|
Net income attributable to noncontrolling interests | 4,855 |
| | 2,894 |
| | 14,629 |
| | 7,534 |
|
Adjustments attributable to unconsolidated funds(2) | 4,233 |
| | 4,084 |
| | 12,382 |
| | 12,140 |
|
Adjustments attributable to consolidated joint ventures(2) | (13,572 | ) | | (11,798 | ) | | (40,484 | ) | | (31,363 | ) |
FFO | $ | 100,144 |
| | $ | 90,768 |
| | $ | 296,922 |
| | $ | 259,359 |
|
| | | | | | | |
Adjusted Funds From Operations (AFFO) | | | | | | | |
FFO | $ | 100,144 |
| | $ | 90,768 |
| | $ | 296,922 |
| | $ | 259,359 |
|
Straight-line rent | (3,524 | ) | | (2,982 | ) | | (12,715 | ) | | (9,012 | ) |
Net accretion of acquired above- and below-market leases | (4,948 | ) | | (4,814 | ) | | (17,243 | ) | | (13,290 | ) |
Loan costs | 1,954 |
| | 2,520 |
| | 6,131 |
| | 7,443 |
|
Recurring capital expenditures, tenant improvements and leasing expenses | (18,128 | ) | | (18,023 | ) | | (65,543 | ) | | (52,219 | ) |
Non-cash compensation expense | 4,924 |
| | 4,450 |
| | 14,906 |
| | 13,463 |
|
Adjustments attributable to unconsolidated funds(2) | (1,454 | ) | | (1,033 | ) | | (5,721 | ) | | (3,545 | ) |
Adjustments attributable to consolidated joint ventures(2) | 3,530 |
| | 3,906 |
| | 12,706 |
| | 10,138 |
|
AFFO | $ | 82,498 |
| | $ | 74,792 |
| | $ | 229,443 |
| | $ | 212,337 |
|
| | | | | | | |
Weighted average shares of common stock outstanding - diluted | 169,931 |
| | 165,520 |
| | 169,828 |
| | 158,419 |
|
Weighted average units in our operating partnership outstanding | 28,145 |
| | 25,534 |
| | 28,157 |
| | 25,780 |
|
Weighted average fully diluted shares outstanding | 198,076 |
| | 191,054 |
| | 197,985 |
| | 184,199 |
|
| | | | | | | |
Net income per common share - diluted | $ | 0.18 |
| | $ | 0.15 |
| | $ | 0.53 |
| | $ | 0.41 |
|
FFO per share - fully diluted | $ | 0.51 |
| | $ | 0.48 |
| | $ | 1.50 |
| | $ | 1.41 |
|
Dividends declared per share | $ | 0.25 |
| | $ | 0.23 |
| | $ | 0.75 |
| | $ | 0.69 |
|
______________________________________________
| |
(1) | Presents the FFO and AFFO attributable to our common stockholders and noncontrolling interests in our Operating Partnership, including our share of our consolidated joint ventures and our unconsolidated Funds. |
| |
(2) | Adjusts for the portion of each other listed adjustment item on our share of the results of our unconsolidated Funds and for each other listed adjustment item that is attributed to the noncontrolling interests in our consolidated joint ventures. |
NOTE: See the "Definitions" section for definitions of certain terms used in this Earnings Package.
Same Property Statistics & Net Operating Income (NOI)
(Unaudited; in thousands, except statistics)
|
| | | | | | | |
| | | | | |
| | As of September 30, | |
| | 2018 | | 2017 | |
| Office Statistics | | | | |
| Number of properties | 47 |
| | 47 |
| |
| Rentable square feet (in thousands) | 11,797 |
| | 11,738 |
| |
| Ending % leased | 91.0 | % | | 91.6 | % | |
| Ending % occupied | 89.6 | % | | 89.7 | % | |
| Quarterly average % occupied | 89.4 | % | | 89.9 | % | |
| | | | | |
| Multifamily Statistics | | | | |
| Number of properties | 9 |
| | 9 |
| |
| Number of units | 2,640 |
| | 2,640 |
| |
| Ending % leased | 99.7 | % | | 98.5 | % | |
| | | | | |
|
| | | | | | | | | | | | |
| | | | | | | |
| | Three Months Ended September 30, | | % Favorable | |
| | 2018 | | 2017 | | (Unfavorable) | |
| Net Operating Income (NOI)(1) | | | | | | |
| Office revenues | $ | 127,809 |
| | $ | 122,401 |
| | 4.4 | % | |
| Office expenses | (43,681 | ) | | (41,775 | ) | | (4.6 | )% | |
| Office NOI | 84,128 |
| | 80,626 |
| | 4.3 | % | |
| | | | | | | |
| Multifamily revenues | 21,274 |
| | 20,463 |
| | 4.0 | % | |
| Multifamily expenses | (5,316 | ) | | (4,972 | ) | | (6.9 | )% | |
| Multifamily NOI | 15,958 |
| | 15,491 |
| | 3.0 | % | |
| | | | | | | |
| Total NOI | $ | 100,086 |
| | $ | 96,117 |
| | 4.1 | % | |
| | | | | | | |
| Cash Net Operating Income (NOI)(1) | | | | | | |
| Office cash revenues | $ | 126,170 |
| | $ | 120,723 |
| | 4.5 | % | |
| Office cash expenses | (43,694 | ) | | (41,788 | ) | | (4.6 | )% | |
| Office cash NOI | 82,476 |
| | 78,935 |
| | 4.5 | % | |
| | | | | | | |
| Multifamily cash revenues | 21,269 |
| | 20,455 |
| | 4.0 | % | |
| Multifamily cash expenses | (5,316 | ) | | (4,972 | ) | | (6.9 | )% | |
| Multifamily cash NOI | 15,953 |
| | 15,483 |
| | 3.0 | % | |
| | | | | | | |
| Total Cash NOI | $ | 98,429 |
| | $ | 94,418 |
| | 4.2 | % | |
| | | | | | | |
_________________________________________________
| |
(1) | See page 10 for a reconciliation to net income attributable to common stockholders. |
NOTE: See the "Definitions" section for definitions of certain terms used in this Earnings Package.
Reconciliation of Same Property NOI to Net Income
(Unaudited and in thousands)
|
| | | | | | | |
| Three Months Ended September 30, |
| 2018 | | 2017 |
| | | |
Same property office cash revenues | $ | 126,170 |
| | $ | 120,723 |
|
Non cash adjustments per definition of NOI | 1,639 |
| | 1,678 |
|
Same property office revenues | 127,809 |
| | 122,401 |
|
| | | |
Same property office cash expenses | (43,694 | ) | | (41,788 | ) |
Non cash adjustments per definition of NOI | 13 |
| | 13 |
|
Same property office expenses | (43,681 | ) | | (41,775 | ) |
| | | |
Office NOI | 84,128 |
| | 80,626 |
|
| | | |
Same property multifamily cash revenues | 21,269 |
| | 20,455 |
|
Non cash adjustments per definition of NOI | 5 |
| | 8 |
|
Same property multifamily revenues | 21,274 |
| | 20,463 |
|
| | | |
Same property multifamily expenses | (5,316 | ) | | (4,972 | ) |
| | | |
Multifamily NOI | 15,958 |
| | 15,491 |
|
| | | |
Same Property NOI | 100,086 |
| | 96,117 |
|
Non-comparable office revenues | 69,245 |
| | 62,217 |
|
Non-comparable office expenses | (22,607 | ) | | (20,693 | ) |
Non-comparable multifamily revenues | 4,980 |
| | 3,668 |
|
Non-comparable multifamily expenses | (1,798 | ) | | (1,069 | ) |
NOI | 149,906 |
| | 140,240 |
|
General and administrative | (9,440 | ) | | (8,441 | ) |
Depreciation and amortization | (74,067 | ) | | (69,974 | ) |
Operating income | 66,399 |
| | 61,825 |
|
Other income | 2,951 |
| | 2,659 |
|
Other expenses | (1,561 | ) | | (1,659 | ) |
Income, including depreciation, from unconsolidated real estate funds | 1,348 |
| | 1,137 |
|
Interest expense | (33,721 | ) | | (35,454 | ) |
Net income | 35,416 |
| | 28,508 |
|
Less: Net income attributable to noncontrolling interests | (4,855 | ) | | (2,894 | ) |
Net income attributable to common stockholders | $ | 30,561 |
| | $ | 25,614 |
|
NOTE: See the "Definitions" section for definitions of certain terms used in this Earnings Package.
Financial Data for Joint Ventures & Funds
(Unaudited, in thousands)
|
| | | | | | | | | | | |
| Three Months Ended September 30, 2018 |
| | | | | |
| Wholly-Owned Properties | | Consolidated Joint Ventures(1) | | Unconsolidated Funds(2) |
| | | | | |
Revenues | $ | 181,050 |
| | $ | 42,258 |
| | $ | 19,970 |
|
Office and multifamily operating expenses | $ | 59,361 |
| | $ | 14,041 |
| | $ | 7,181 |
|
Straight-line rent | $ | 1,812 |
| | $ | 1,712 |
| | $ | 208 |
|
Above/below-market lease revenue | $ | 1,375 |
| | $ | 3,573 |
| | $ | (3 | ) |
Cash NOI attributable to outside interests(3) | $ | — |
| | $ | 15,289 |
| | $ | 4,451 |
|
Our share of cash NOI(4) | $ | 118,502 |
| | $ | 7,643 |
| | $ | 8,133 |
|
| | | | | |
| Nine Months Ended September 30, 2018 |
| | | | | |
| Wholly-Owned Properties | | Consolidated Joint Ventures(1) | | Unconsolidated Funds(2) |
| | | | | |
Revenues | $ | 529,902 |
| | $ | 125,122 |
| | $ | 58,933 |
|
Office and multifamily operating expenses | $ | 169,310 |
| | $ | 39,872 |
| | $ | 20,068 |
|
Straight-line rent | $ | 6,951 |
| | $ | 5,764 |
| | $ | 1,066 |
|
Above/below-market lease revenue | $ | 4,714 |
| | $ | 12,529 |
| | $ | (3 | ) |
Cash NOI attributable to outside interests(3) | $ | — |
| | $ | 44,622 |
| | $ | 13,667 |
|
Our share of cash NOI(4) | $ | 348,927 |
| | $ | 22,335 |
| | $ | 24,135 |
|
______________________________________________________
| |
(1) | Represents stand-alone financial data (with property management fees excluded from operating expenses as a consolidating entry) for three consolidated joint ventures ("JVs") which we manage and in which we own a weighted average interest of approximately 28% based on square footage. The JVs own a combined ten Class A office properties totaling 2.8 million square feet in our submarkets. We are entitled to (i) distributions based on invested capital, (ii) fees for property management and other services, (iii) reimbursement of certain acquisition-related expenses and certain other costs and (iv) in most cases, additional distributions based on Cash NOI. |
| |
(2) | Represents stand-alone financial data (with property management fees excluded from operating expenses as a consolidating entry) for three unconsolidated Funds which we manage and in which we own a weighted average interest of approximately 62% based on square footage. The Funds own a combined eight Class A office properties totaling 1.8 million square feet in our submarkets. We are entitled to (i) priority distributions, (ii) distributions based on invested capital, (iii) a carried interest if the investors’ distributions exceed a hurdle rate, (iv) fees for property management and other services and (v) reimbursement of certain costs. |
| |
(3) | Represents the share of Cash NOI allocable under the applicable agreements to interests other than our fully diluted shares. |
| |
(4) | Represents the share of Cash NOI allocable to our fully diluted shares. |
NOTE: See the "Definitions" section for definitions of certain terms used in this Earnings Package.
|
| | | | | | | | | | | | | | |
| Loans
(As of September 30, 2018, unaudited) | |
| | | | | | | | | | |
| | | | | | | | | | |
| Maturity Date(1) | | Principal Balance (In Thousands) | | Our Share(2) (In Thousands) | | Effective Rate(3) | | Swap Maturity Date | |
| | | | | | | | | | |
| Consolidated Wholly-Owned Subsidiaries | |
| | | | | | | | | | |
| 10/1/2019 | | $ | 145,000 |
| | $ | 145,000 |
| | LIBOR + 1.25% | | N/A | |
| 4/15/2022 | | 340,000 |
| | 340,000 |
| | 2.77% | | 4/1/2020 | |
| 7/27/2022 | | 180,000 |
| | 180,000 |
| | 3.06% | | 7/1/2020 | |
| 11/1/2022 | | 400,000 |
| | 400,000 |
| | 2.64% | | 11/1/2020 | |
| 6/23/2023 | | 360,000 |
| | 360,000 |
| | 2.57% | | 7/1/2021 | |
| 12/23/2023 | | 220,000 |
| | 220,000 |
| | 3.62% | | 12/23/2021 | |
| 1/1/2024 | | 300,000 |
| | 300,000 |
| | 3.46% | | 1/1/2022 | |
| 3/3/2025 | | 335,000 |
| | 335,000 |
| | 3.84% | | 3/1/2023 | |
| 4/1/2025 | | 102,400 |
| | 102,400 |
| | 2.84% | | 3/1/2020 | |
| 12/1/2025 | | 115,000 |
| | 115,000 |
| | 2.76% | | 12/1/2020 | |
| 6/1/2027 | | 550,000 |
| | 550,000 |
| | 3.16% | | 6/1/2022 | |
| 6/1/2038 | (4) | 31,757 |
| | 31,757 |
| | 4.55% | | N/A | |
| 8/21/2020 | (5) | 95,000 |
| | 95,000 |
| | LIBOR + 1.40% | | N/A | |
| Subtotal | | 3,174,157 |
| | 3,174,157 |
| | | | | |
| | | | | | | | | | |
| Consolidated Joint Ventures | |
| | | | | | | | | | |
| 2/28/2023 | | 580,000 |
| | 174,000 |
| | 2.37% | | 3/1/2021 | |
| 12/19/2024 | | 400,000 |
| | 80,000 |
| | 3.47% | | 1/1/2023 | |
| Total Consolidated Loans | (6) | $ | 4,154,157 |
| | $ | 3,428,157 |
| | | | | |
| | | | | | | | | | |
| Unconsolidated Funds | |
| | | | | | | | | | |
| 3/1/2023 | | $ | 110,000 |
| | $ | 26,954 |
| | 2.30% | | 3/1/2021 | |
| 7/1/2024 | | 400,000 |
| | 285,294 |
| | 3.44% | | 7/1/2022 | |
| Total Unconsolidated Loans | | $ | 510,000 |
| | $ | 312,248 |
| | | | | |
| | | | | | | | | | |
| Total Loans | | | | $ | 3,740,405 |
| | | | | |
| | | | | | | | | | |
________________________________________________________________________
Except as noted below, each loan (including our revolving credit facility) is non-recourse and secured by one or more separate collateral pools consisting of one or more properties, and requires interest-only monthly payments with the outstanding principal due upon maturity.
| |
(1) | Maturity dates include the effect of extension options. |
| |
(2) | "Our Share" is a non GAAP measure calculated by multiplying the principal balance by our share of the borrowing entity's equity. |
| |
(3) | Includes the effect of interest rate swaps and excludes the effect of prepaid loan costs. |
| |
(4) | Requires monthly payments of principal and interest. Principal amortization is based upon a 30-year amortization schedule. |
| |
(5) | $400 million revolving credit facility. Unused commitment fees range from 0.15% to 0.20%. |
| |
(6) | Our consolidated debt on the balance sheet of $4.12 billion is calculated by adding $4.0 million of unamortized loan premium and deducting $35.9 million of unamortized deferred loan costs from our total consolidated loans of $4.15 billion. |
|
| | | |
| | | |
| Statistics for Consolidated Loans with interest fixed under the terms of the loan or a swap | |
| | | |
| Principal balance (in billions) | $3.91 | |
| Weighted average remaining life (including extension options) | 5.6 years | |
| Weighted average remaining fixed interest period | 2.9 years | |
| Weighted average annual interest rate | 3.07% | |
| | | |
NOTE: See the "Definitions" section for definitions of certain terms used in this Earnings Package.
Office Portfolio Summary
Total Office Portfolio as of September 30, 2018
|
| | | | | | | | | | | | | | | | |
| | | | | | | | | | | | |
| Submarket | | Number of Properties | | Rentable Square Feet | | Percent of Square Feet of Our Total Portfolio | | Submarket Rentable Square Feet(1) | | Our Market Share in Submarket(2) | |
| | | | | | | | | | | | |
| Beverly Hills(3) | | 11 |
| | 2,193,326 |
| | 11.9 | % | | 7,089,250 | | 27.9 | % | |
| Brentwood | | 15 |
| | 2,063,913 |
| | 11.2 |
| | 3,328,103 | | 62.0 |
| |
| Burbank | | 1 |
| | 456,205 |
| | 2.5 |
| | 7,060,975 | | 6.5 |
| |
| Century City | | 3 |
| | 951,534 |
| | 5.2 |
| | 10,195,143 | | 9.3 |
| |
| Honolulu | | 4 |
| | 1,763,845 |
| | 9.5 |
| | 5,088,599 | | 34.7 |
| |
| Olympic Corridor | | 5 |
| | 1,141,560 |
| | 6.2 |
| | 3,458,794 | | 33.0 |
| |
| Santa Monica | | 11 |
| | 1,426,080 |
| | 7.7 |
| | 9,861,775 | | 14.5 |
| |
| Sherman Oaks/Encino | | 12 |
| | 3,479,316 |
| | 18.9 |
| | 6,528,253 | | 53.3 |
| |
| Warner Center/Woodland Hills | | 3 |
| | 2,830,996 |
| | 15.4 |
| | 7,667,855 | | 36.9 |
| |
| Westwood | | 6 |
| | 2,126,962 |
| | 11.5 |
| | 4,211,981 | | 50.5 |
| |
| Total / Weighted Average | | 71 |
| | 18,433,737 |
| | 100.0 | % | | 64,490,728 | | 28.2 | % | |
| | | | | | | | | | | | |
_______________________________________________________
| |
(1) | Source is the 2018 third quarter CBRE Marketview report. Changes from last quarter are due to adjustments made by CBRE with respect to existing buildings, not new construction, with the exception of a small addition in Santa Monica. |
| |
(2) | Calculated by dividing Rentable Square Feet by the applicable Submarket Rentable Square Feet. |
| |
(3) | Includes a 216,000 square foot property located just outside the Beverly Hills city limits. To calculate our percentage of the submarket, the property is not included in the numerator or the denominator for consistency with third party data. |
NOTE: See the "Definitions" section for definitions of certain terms used in this Earnings Package.
Office Percentage Leased and In-Place Rents
Total Office Portfolio as of September 30, 2018
Annualized Rent by Submarket
|
| | | | | | | | | | | | | | | | |
| | | | | | | | | |
| Submarket | Percent Leased(1) | | Annualized Rent(2) | | Annualized Rent Per Leased Square Foot(2) | | Monthly Rent Per Leased Square Foot(2) | |
| | | | | | | | | |
| Beverly Hills | 96.3 | % | | $ | 100,129,708 |
| | $ | 50.30 |
| | $ | 4.19 |
| |
| Brentwood | 90.6 |
| | 79,362,156 |
| | 43.87 |
| | 3.66 |
| |
| Burbank | 100.0 |
| | 21,819,057 |
| | 47.83 |
| | 3.99 |
| |
| Century City | 92.8 |
| | 39,389,255 |
| | 47.33 |
| | 3.94 |
| |
| Honolulu | 86.4 |
| | 49,523,873 |
| | 33.97 |
| | 2.83 |
| |
| Olympic Corridor | 93.0 |
| | 37,980,360 |
| | 38.13 |
| | 3.18 |
| |
| Santa Monica | 93.9 |
| | 91,240,541 |
| | 70.75 |
| | 5.90 |
| |
| Sherman Oaks/Encino | 91.4 |
| | 110,905,899 |
| | 36.30 |
| | 3.03 |
| |
| Warner Center/Woodland Hills | 86.3 |
| | 68,553,751 |
| | 29.17 |
| | 2.43 |
| |
| Westwood | 93.0 |
| | 90,494,001 |
| | 48.57 |
| | 4.05 |
| |
| Total / Weighted Average | 91.4 | % | | $ | 689,398,602 |
| | 42.82 |
| | 3.57 |
| |
| | | | | | | | | |
| | | | | | | | | |
| | | | | | | | | |
| Recurring Office Capital Expenditures per Rentable Square Foot | | | |
| Three months ended September 30, 2018 | | $ | 0.04 |
| |
| Nine months ended September 30, 2018 | | $ | 0.14 |
| |
| | | | | | | | | |
_______________________________________________________________
| |
(1) | Includes 346,766 square feet with respect to signed leases not yet commenced at September 30, 2018. |
| |
(2) | Excludes signed leases not yet commenced at September 30, 2018. |
NOTE: See the "Definitions" section for definitions of certain terms used in this Earnings Package.
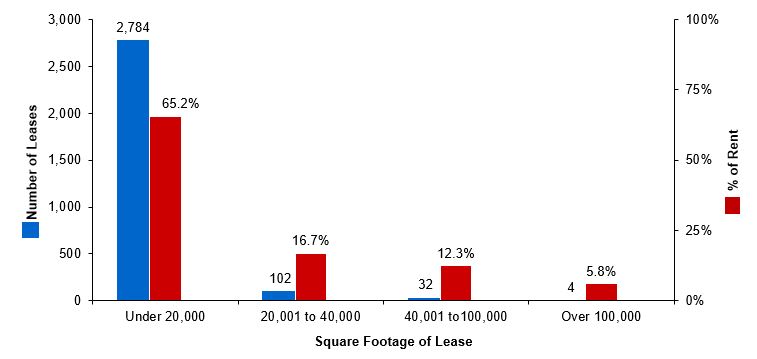
Office Lease Diversification
Total Office Portfolio as of September 30, 2018
|
| | | | | |
| | | | | |
| Portfolio Tenant Size | |
| | Median | | Average | |
| | | | | |
| Square feet | 2,500 | | 5,500 | |
| | | | | |
|
| | | | | | | | | | | | | | | | | | | | | |
| | | | | | | | | | | | | | |
| | | Office Leases | | Rentable Square Feet | | Annualized Rent | |
| Square Feet Under Lease | | Number | | Percent | | Amount | | Percent | | Amount | | Percent | |
| | | | | | | | | | | | | | |
| 2,500 or less | | 1,445 |
| | 49.5 | % | | 1,984,038 |
| | 12.3 | % | | $ | 83,208,056 |
| | 12.1 | % | |
| 2,501-10,000 | | 1,104 |
| | 37.8 |
| | 5,439,687 |
| | 33.8 |
| | 229,917,029 |
| | 33.4 |
| |
| 10,001-20,000 | | 235 |
| | 8.0 |
| | 3,247,091 |
| | 20.2 |
| | 135,938,363 |
| | 19.7 |
| |
| 20,001-40,000 | | 102 |
| | 3.5 |
| | 2,777,620 |
| | 17.3 |
| | 115,350,841 |
| | 16.7 |
| |
| 40,001-100,000 | | 32 |
| | 1.1 |
| | 1,759,465 |
| | 10.9 |
| | 84,707,546 |
| | 12.3 |
| |
| Greater than 100,000 | | 4 |
| | 0.1 |
| | 892,091 |
| | 5.5 |
| | 40,276,767 |
| | 5.8 |
| |
| Total for all leases | | 2,922 |
| | 100.0 | % | | 16,099,992 |
| | 100.0 | % | | $ | 689,398,602 |
| | 100.0 | % | |
| | |
| | |
NOTE: See the "Definitions" section for definitions of certain terms used in this Earnings Package.
Largest Office Tenants
Total Office Portfolio as of September 30, 2018
|
| | | | | | | | | | | | | | | | | | | | | | | |
| | | | | | | | | | | | | | | | |
| Tenants paying 1% or more of our aggregate annualized rent: | |
| | |
| Tenant | | Number of Leases | | Number of Properties | | Lease Expiration(1) | | Total Leased Square Feet | | Percent of Rentable Square Feet | | Annualized Rent | | Percent of Annualized Rent | |
| | | | | | | | | | | | | | | | |
| Time Warner(2) | | 3 |
| | 3 |
| | 2020-2024 | | 468,775 |
| | 2.5 | % | | $ | 22,257,305 |
| | 3.2 | % | |
| UCLA(3) | | 26 |
| | 11 |
| | 2018-2027 | | 287,327 |
| | 1.6 |
| | 14,010,598 |
| | 2.0 |
| |
| William Morris Endeavor(4) | | 1 |
| | 1 |
| | 2027 | | 196,204 |
| | 1.1 |
| | 10,997,983 |
| | 1.6 |
| |
| Morgan Stanley(5) | | 5 |
| | 5 |
| | 2022-2027 | | 145,488 |
| | 0.8 |
| | 8,960,139 |
| | 1.3 |
| |
| Equinox Fitness(6) | | 5 |
| | 5 |
| | 2019-2033 | | 180,087 |
| | 1.0 |
| | 7,426,266 |
| | 1.1 |
| |
| Total | | 40 |
| | 25 |
| | | | 1,277,881 |
| | 7.0 | % | | $ | 63,652,291 |
| | 9.2 | % | |
| | | | | | | | | | | | | | | | |
______________________________________________________
| |
(1) | Expiration dates are per lease (expiration dates do not reflect storage and similar leases). |
| |
(2) | Square footage expires as follows: 2,000 square feet in 2020, 11,000 square feet in 2021, and 456,000 square feet in 2024. |
| |
(3) | Square footage expires as follows: 13,000 square feet in 2018, 13,000 square feet in 2019, 43,000 square feet in 2020, 56,000 square feet in 2021, 55,000 square feet in 2022, 40,000 square feet in 2023, and 67,000 square feet in 2027. Tenant has options to terminate 31,000 square feet in 2020, 15,000 square feet in 2023, and 51,000 square feet in 2025. |
| |
(4) | Tenant has an option to terminate 2,000 square feet in 2020 and 193,000 square feet in 2022. |
| |
(5) | Square footage expires as follows: 15,000 square feet in 2022, 30,000 square feet in 2023, 26,000 square feet in 2025, and 74,000 square feet in 2027. Tenant has options to terminate 30,000 square feet in 2021, 26,000 square feet in 2022, and 16,000 square feet in 2024. |
| |
(6) | Square footage expires as follows: 33,000 square feet in 2019, 42,000 square feet in 2020, 31,000 square feet in 2027, 44,000 square feet in 2028, and 30,000 square feet in 2033. |
NOTE: See the "Definitions" section for definitions of certain terms used in this Earnings Package.
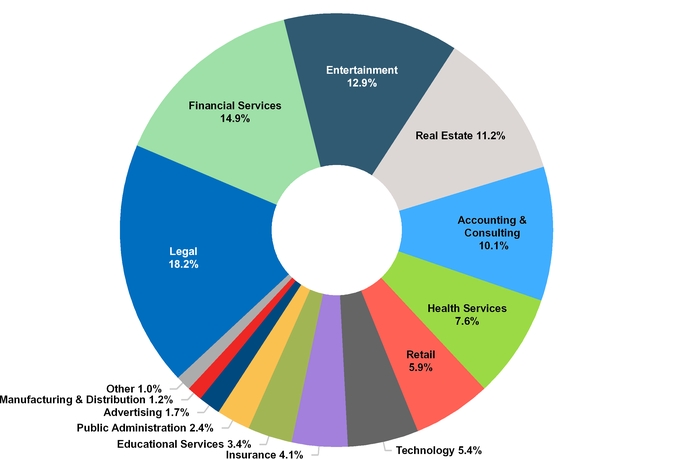
Office Industry Diversification
Total Office Portfolio as of September 30, 2018
Percentage of Annualized Rent by Tenant Industry
|
| | | | | | | | |
| | | | | | |
| Industry | | Number of Leases | | Annualized Rent as a Percent of Total | |
| | | | | | |
| Legal | | 569 |
| | 18.2 | % | |
| Financial Services | | 387 |
| | 14.9 |
| |
| Entertainment | | 205 |
| | 12.9 |
| |
| Real Estate | | 289 |
| | 11.2 |
| |
| Accounting & Consulting | | 361 |
| | 10.1 |
| |
| Health Services | | 377 |
| | 7.6 |
| |
| Retail | | 192 |
| | 5.9 |
| |
| Technology | | 133 |
| | 5.4 |
| |
| Insurance | | 104 |
| | 4.1 |
| |
| Educational Services | | 55 |
| | 3.4 |
| |
| Public Administration | | 92 |
| | 2.4 |
| |
| Advertising | | 59 |
| | 1.7 |
| |
| Manufacturing & Distribution | | 54 |
| | 1.2 |
| |
| Other | | 45 |
| | 1.0 |
| |
| Total | | 2,922 |
| | 100.0 | % | |
| | | | | | |
NOTE: See the "Definitions" section for definitions of certain terms used in this Earnings Package.
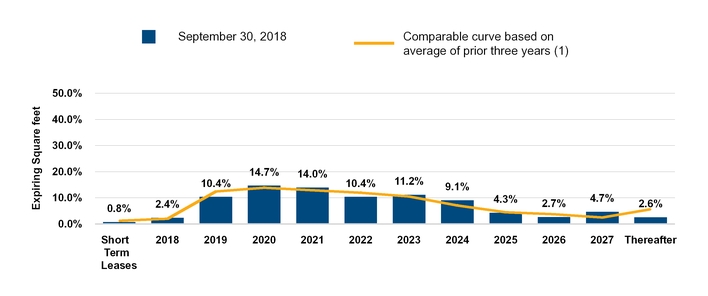
Office Lease Expirations
Total Office Portfolio as of September 30, 2018
(1) Average of the percentage of leases expiring at September 30, 2015, 2016, and 2017 with the same remaining duration as the leases for the labeled year had at September 30, 2018. Acquisitions are included in the comparable average commencing in the quarter after the acquisition.
|
| | | | | | | | | | | | | | | | | | | | | | | | | | |
| | | | | | | | | | | | | | | | |
| Year of Lease Expiration | | Number of Leases | | Rentable Square Feet | | Expiring Square Feet as a Percent of Total | | Annualized Rent at September 30, 2018 | | Annualized Rent as a Percent of Total | | Annualized Rent Per Leased Square Foot(1) | | Annualized Rent Per Leased Square Foot at Expiration(2) | |
| | | | | | | | | | | | | | | | |
| Short Term Leases | | 54 |
| | 145,699 |
| | 0.8 | % | | $ | 5,200,025 |
| | 0.8 | % | | $ | 35.69 |
| | $ | 35.74 |
| |
| 2018 | | 129 |
| | 438,875 |
| | 2.4 |
| | 17,969,201 |
| | 2.6 |
| | 40.94 |
| | 41.08 |
| |
| 2019 | | 551 |
| | 1,920,221 |
| | 10.4 |
| | 76,338,527 |
| | 11.1 |
| | 39.76 |
| | 40.62 |
| |
| 2020 | | 617 |
| | 2,706,387 |
| | 14.7 |
| | 110,946,903 |
| | 16.1 |
| | 40.99 |
| | 43.02 |
| |
| 2021 | | 523 |
| | 2,580,615 |
| | 14.0 |
| | 108,059,154 |
| | 15.7 |
| | 41.87 |
| | 45.28 |
| |
| 2022 | | 365 |
| | 1,936,986 |
| | 10.4 |
| | 79,877,187 |
| | 11.6 |
| | 41.24 |
| | 46.39 |
| |
| 2023 | | 294 |
| | 2,060,597 |
| | 11.2 |
| | 92,862,628 |
| | 13.5 |
| | 45.07 |
| | 52.35 |
| |
| 2024 | | 154 |
| | 1,672,016 |
| | 9.1 |
| | 72,732,550 |
| | 10.5 |
| | 43.50 |
| | 52.54 |
| |
| 2025 | | 94 |
| | 803,346 |
| | 4.3 |
| | 36,497,311 |
| | 5.3 |
| | 45.43 |
| | 56.51 |
| |
| 2026 | | 42 |
| | 492,162 |
| | 2.7 |
| | 23,335,448 |
| | 3.4 |
| | 47.41 |
| | 60.26 |
| |
| 2027 | | 56 |
| | 872,134 |
| | 4.7 |
| | 41,521,076 |
| | 6.0 |
| | 47.61 |
| | 61.50 |
| |
| Thereafter | | 43 |
| | 470,954 |
| | 2.6 |
| | 24,058,592 |
| | 3.4 |
| | 51.08 |
| | 70.36 |
| |
| Subtotal/weighted average | | 2,922 |
| | 16,099,992 |
| | 87.3 | % | | $ | 689,398,602 |
| | 100.0 | % | | 42.82 |
| | 48.57 |
| |
| Signed leases not commenced | | 346,766 |
| | 1.9 |
| | | | | | | | | |
| Available | | 1,584,752 |
| | 8.6 |
| | | | | | | | | |
| Building management use | | 131,299 |
| | 0.7 |
| | | | | | | | | |
| BOMA adjustment(3) | | | | 270,928 |
| | 1.5 |
| | | | | | | | | |
| Total/weighted average | | 2,922 |
| | 18,433,737 |
| | 100.0 | % | | $ | 689,398,602 |
| | 100.0 | % | | $ | 42.82 |
| | $ | 48.57 |
| |
| | | | | | | | | | | | | | | | |
___________________________________________________
| |
(1) | Represents annualized rent at September 30, 2018 divided by leased square feet. |
| |
(2) | Represents annualized rent at expiration divided by leased square feet. |
| |
(3) | Represents the square footage adjustments for leases that do not reflect BOMA remeasurement. |
NOTE: See the "Definitions" section for definitions of certain terms used in this Earnings Package.
Office Lease Expirations - Next Four Quarters
Total Office Portfolio as of September 30, 2018
|
| | | | | | | | | | | | | | |
| | | | | | | | | | |
| | | Q4 2018 | | Q1 2019 | | Q2 2019 | | Q3 2019 | |
| | | | | | | | | | |
| Expiring Square Feet(1) | | 351,897 | | 326,507 | | 547,983 | | 512,453 | |
| Percentage of Portfolio | | 1.9 | % | | 1.8 | % | | 3.0 | % | | 2.8 | % | |
| Expiring Rent per Square Foot(2) | | $40.03 | | $38.98 | | $39.00 | | $42.23 | |
| | | | | | | | | | |
|
| | | | | | | | | | | | | | | |
| | |
| Submarket Data | |
| | |
| Due to the small square footage of leases in each quarter in each submarket, and the varying terms and square footage of the individual leases and the individual buildings involved, the data in this table should only be extrapolated with caution. | |
| | | | | | | | | | |
| | | Q4 2018 | | Q1 2019 | | Q2 2019 | | Q3 2019 | |
| | | | | | | | | | | |
| Beverly Hills | Expiring SF(1) | | 40,891 |
| | 42,696 |
| | 74,185 |
| | 104,243 |
| |
| Expiring rent per SF(2) | | $46.96 | | $43.90 | | $45.28 | | $49.57 | |
| | | | | | | | | | | |
| Brentwood | Expiring SF(1) | | 56,764 |
| | 36,880 |
| | 57,237 |
| | 68,915 |
| |
| Expiring rent per SF(2) | | $44.02 | | $41.77 | | $44.56 | | $45.87 | |
| | | | | | | | | | | |
| Century City | Expiring SF(1) | | 9,295 |
| | 13,725 |
| | 22,258 |
| | 16,230 |
| |
| Expiring rent per SF(2) | | $45.80 | | $46.53 | | $33.20 | | $50.44 | |
| | | | | | | | | | | |
| Honolulu | Expiring SF(1) | | 34,279 |
| | 49,063 |
| | 70,841 |
| | 34,423 |
| |
| Expiring rent per SF(2) | | $38.80 | | $33.54 | | $34.05 | | $34.12 | |
| | | | | | | | | | | |
| Olympic Corridor | Expiring SF(1) | | 18,360 |
| | 19,041 |
| | 47,348 |
| | 43,303 |
| |
| Expiring rent per SF(2) | | $35.50 | | $35.37 | | $38.16 | | $43.54 | |
| | | | | | | | | | | |
| Santa Monica | Expiring SF(1) | | 1,215 |
| | 12,195 |
| | 14,471 |
| | 48,771 |
| |
| Expiring rent per SF(2) | | $49.32 | | $70.27 | | $67.59 | | $46.56 | |
| | | | | | | | | | | |
| Sherman Oaks/Encino | Expiring SF(1) | | 62,647 |
| | 70,631 |
| | 130,765 |
| | 61,773 |
| |
| Expiring rent per SF(2) | | $37.12 | | $35.70 | | $36.85 | | $33.90 | |
| | | | | | | | | | | |
| Warner Center/Woodland Hills | Expiring SF(1) | | 50,897 |
| | 50,513 |
| | 90,861 |
| | 82,606 |
| |
| Expiring rent per SF(2) | | $29.98 | | $29.78 | | $30.23 | | $30.82 | |
| | | | | | | | | | | |
| Westwood | Expiring SF(1) | | 77,549 |
| | 31,763 |
| | 40,017 |
| | 52,189 |
| |
| Expiring rent per SF(2) | | $43.19 | | $46.40 | | $49.04 | | $48.35 | |
| | | | | | | | | | | |
_________________________________________________________________
| |
(1) | Includes leases with an expiration date in the applicable quarter where the space had not been re-leased as of September 30, 2018, other than 145,699 square feet of Short-Term Leases. |
| |
(2) | Includes the impact of rent escalations over the entire term of the expiring lease, and is therefore not directly comparable to starting rents. Fluctuations in this number from quarter to quarter primarily reflects the mix of buildings/submarkets involved, as well as the varying terms and square footage of the individual leases expiring. |
NOTE: See the "Definitions" section for definitions of certain terms used in this Earnings Package.
Office Leasing Activity
Total Office Portfolio during the Three Months ended September 30, 2018
|
| | | |
| | | |
| Net Absorption During Quarter(1) | (0.30)% | |
| | | |
|
| | | | | | | |
| | | | | | | |
| Office Leases Signed During Quarter | Number of leases | | Rentable Square Feet | | Weighted Average Lease Term (months) | |
| | | | | | | |
| New leases | 83 | | 294,000 | | 50 | |
| Renewal leases | 113 | | 445,946 | | 43 | |
| All leases | 196 | | 739,946 | | 46 | |
| | | | | | | |
|
| | | | | | | |
| | | | | | | |
| Change in Annual Rental Rates (Per Square Foot) for Office Leases Executed during the Quarter(2) | |
| | | | | | | |
| | Starting Cash Rent | | Straight-line Rent | | Expiring Cash Rent | |
| | | | | | | |
| Leases signed during the quarter | $42.28 | | $43.70 | | N/A | |
| Prior leases for the same space | $33.89 | | $35.36 | | $38.04 | |
| Percentage change | 24.8% | | 23.6% | | 11.1% | (3) |
| | | | | | | |
|
| | | | | |
| | | | | |
| Average Office Lease Transaction Costs (Per Square Foot) | |
| | | | | |
| | Lease Transaction Costs | | Lease Transaction Costs per Annum | |
| | | | | |
| New leases signed during the quarter | $30.92 | | $7.41 | |
| Renewal leases signed during the quarter | $17.16 | | $4.75 | |
| All leases signed during the quarter | $22.63 | | $5.90 | |
| | | | | |
________________________________________________________________
| |
(1) | Net absorption represents the change in percentage leased between the last day of the current and prior quarter, excluding properties acquired or sold during the current quarter. |
| |
(2) | Represents the average initial stabilized cash and straight-line rents on new and renewed leases signed during the quarter compared to the prior leases for the same space, excluding Short Term Leases, leases where the prior lease was terminated more than a year before signing of the new lease, and leases in acquired buildings where we believe the information about the prior agreement is incomplete or where we believe base rent reflects other off-market inducements to the tenant that are not reflected in the prior lease document. |
| |
(3) | The percentage change for expiring cash rent represents the comparison between the starting cash rent on leases signed during the quarter and the expiring cash rent for the prior leases for the same space. |
NOTE: See the "Definitions" section for definitions of certain terms used in this Earnings Package.
Multifamily Portfolio Summary
as of September 30, 2018
Annualized Rent by Submarket
|
| | | | | | | | | | | | | |
| | | | | | | | |
| Submarket | | Number of Properties | | Number of Units | | Units as a Percent of Total | |
| | | | | | | | |
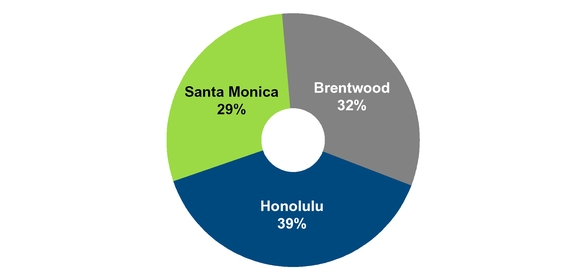
| Brentwood | | 5 | | 950 |
| | 27 | % | |
| Honolulu(1) | | 3 | | 1,793 |
| | 50 |
| |
| Santa Monica | | 2 | | 820 |
| | 23 |
| |
| Total | | 10 | | 3,563 |
| | 100 | % | |
| | | | | | | | |
| Submarket | | Percent Leased | | Annualized Rent(2) | | Monthly Rent Per Leased Unit | |
| | | | | | | | |
| Brentwood | | 99.8 | % | | $ | 31,432,068 |
| | $ | 2,763 |
| |
| Honolulu(1) | | 98.0 |
| | 38,857,020 |
| | 1,850 |
| |
| Santa Monica | | 99.5 |
| | 29,457,144 |
| | 3,012 |
| |
| Total / Weighted Average | | 98.8 | % | | $ | 99,746,232 |
| | $ | 2,366 |
| |
| | | | | | | | |
|
| | | | | |
| | | |
| Recurring Multifamily Capital Expenditures per Unit(3) | | |
| | | |
| Three months ended September 30, 2018 | $ | 172 |
| |
| Nine months ended September 30, 2018 | $ | 562 |
| |
| | | |
________________________________________________________________
| |
(1) | Includes newly developed units just made available for rent. |
| |
(2) | The multifamily portfolio also includes 10,495 square feet of ancillary retail space generating annualized rent of $391,400, which is not included in multifamily annualized rent. |
| |
(3) | Excludes new development units. |
NOTE: See the "Definitions" section for definitions of certain terms used in this Earnings Package.
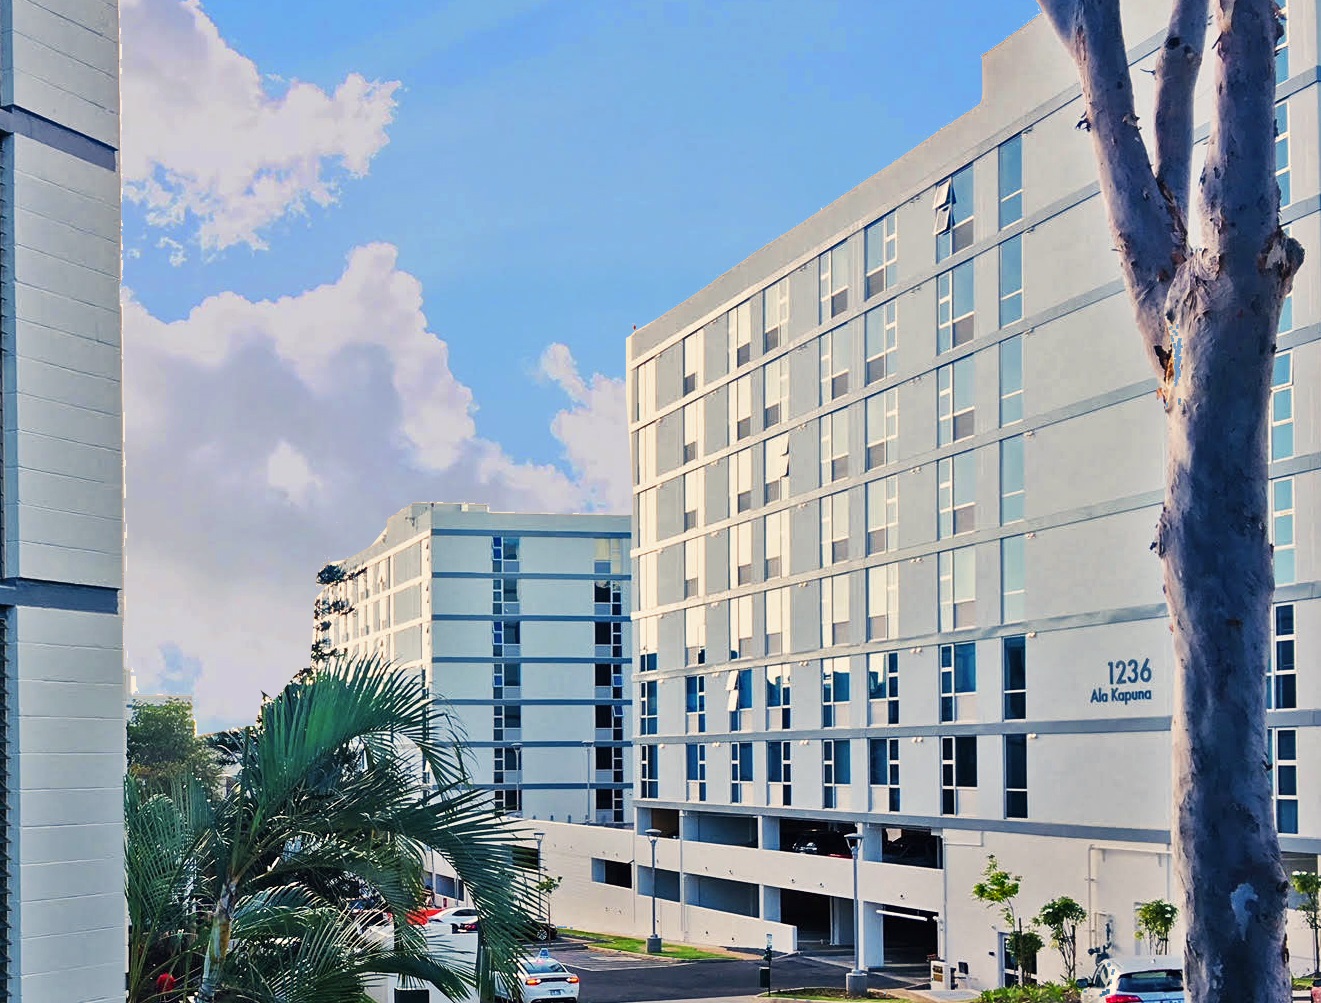
Multifamily Development Projects(1)
|
| | | |
Honolulu, Hawaii |
| Photo of new apartment buildings at our Moanalua Hillside Apartments community |
We are adding 475 units (net of existing units removed) to our 696 unit Moanalua Hillside apartment community located on 28 acres near downtown Honolulu and key military bases. The new units are expected to cost about $120 million, not including the cost of the land which we have owned since 2005. We are also investing additional capital to upgrade the existing units, improve the parking and landscaping, build a new leasing and management office and construct a new recreation and fitness facility with a new pool. Construction continues and as of September 30, 2018 we had leased 221 of our new units. |
|
| | | |
Brentwood, California |
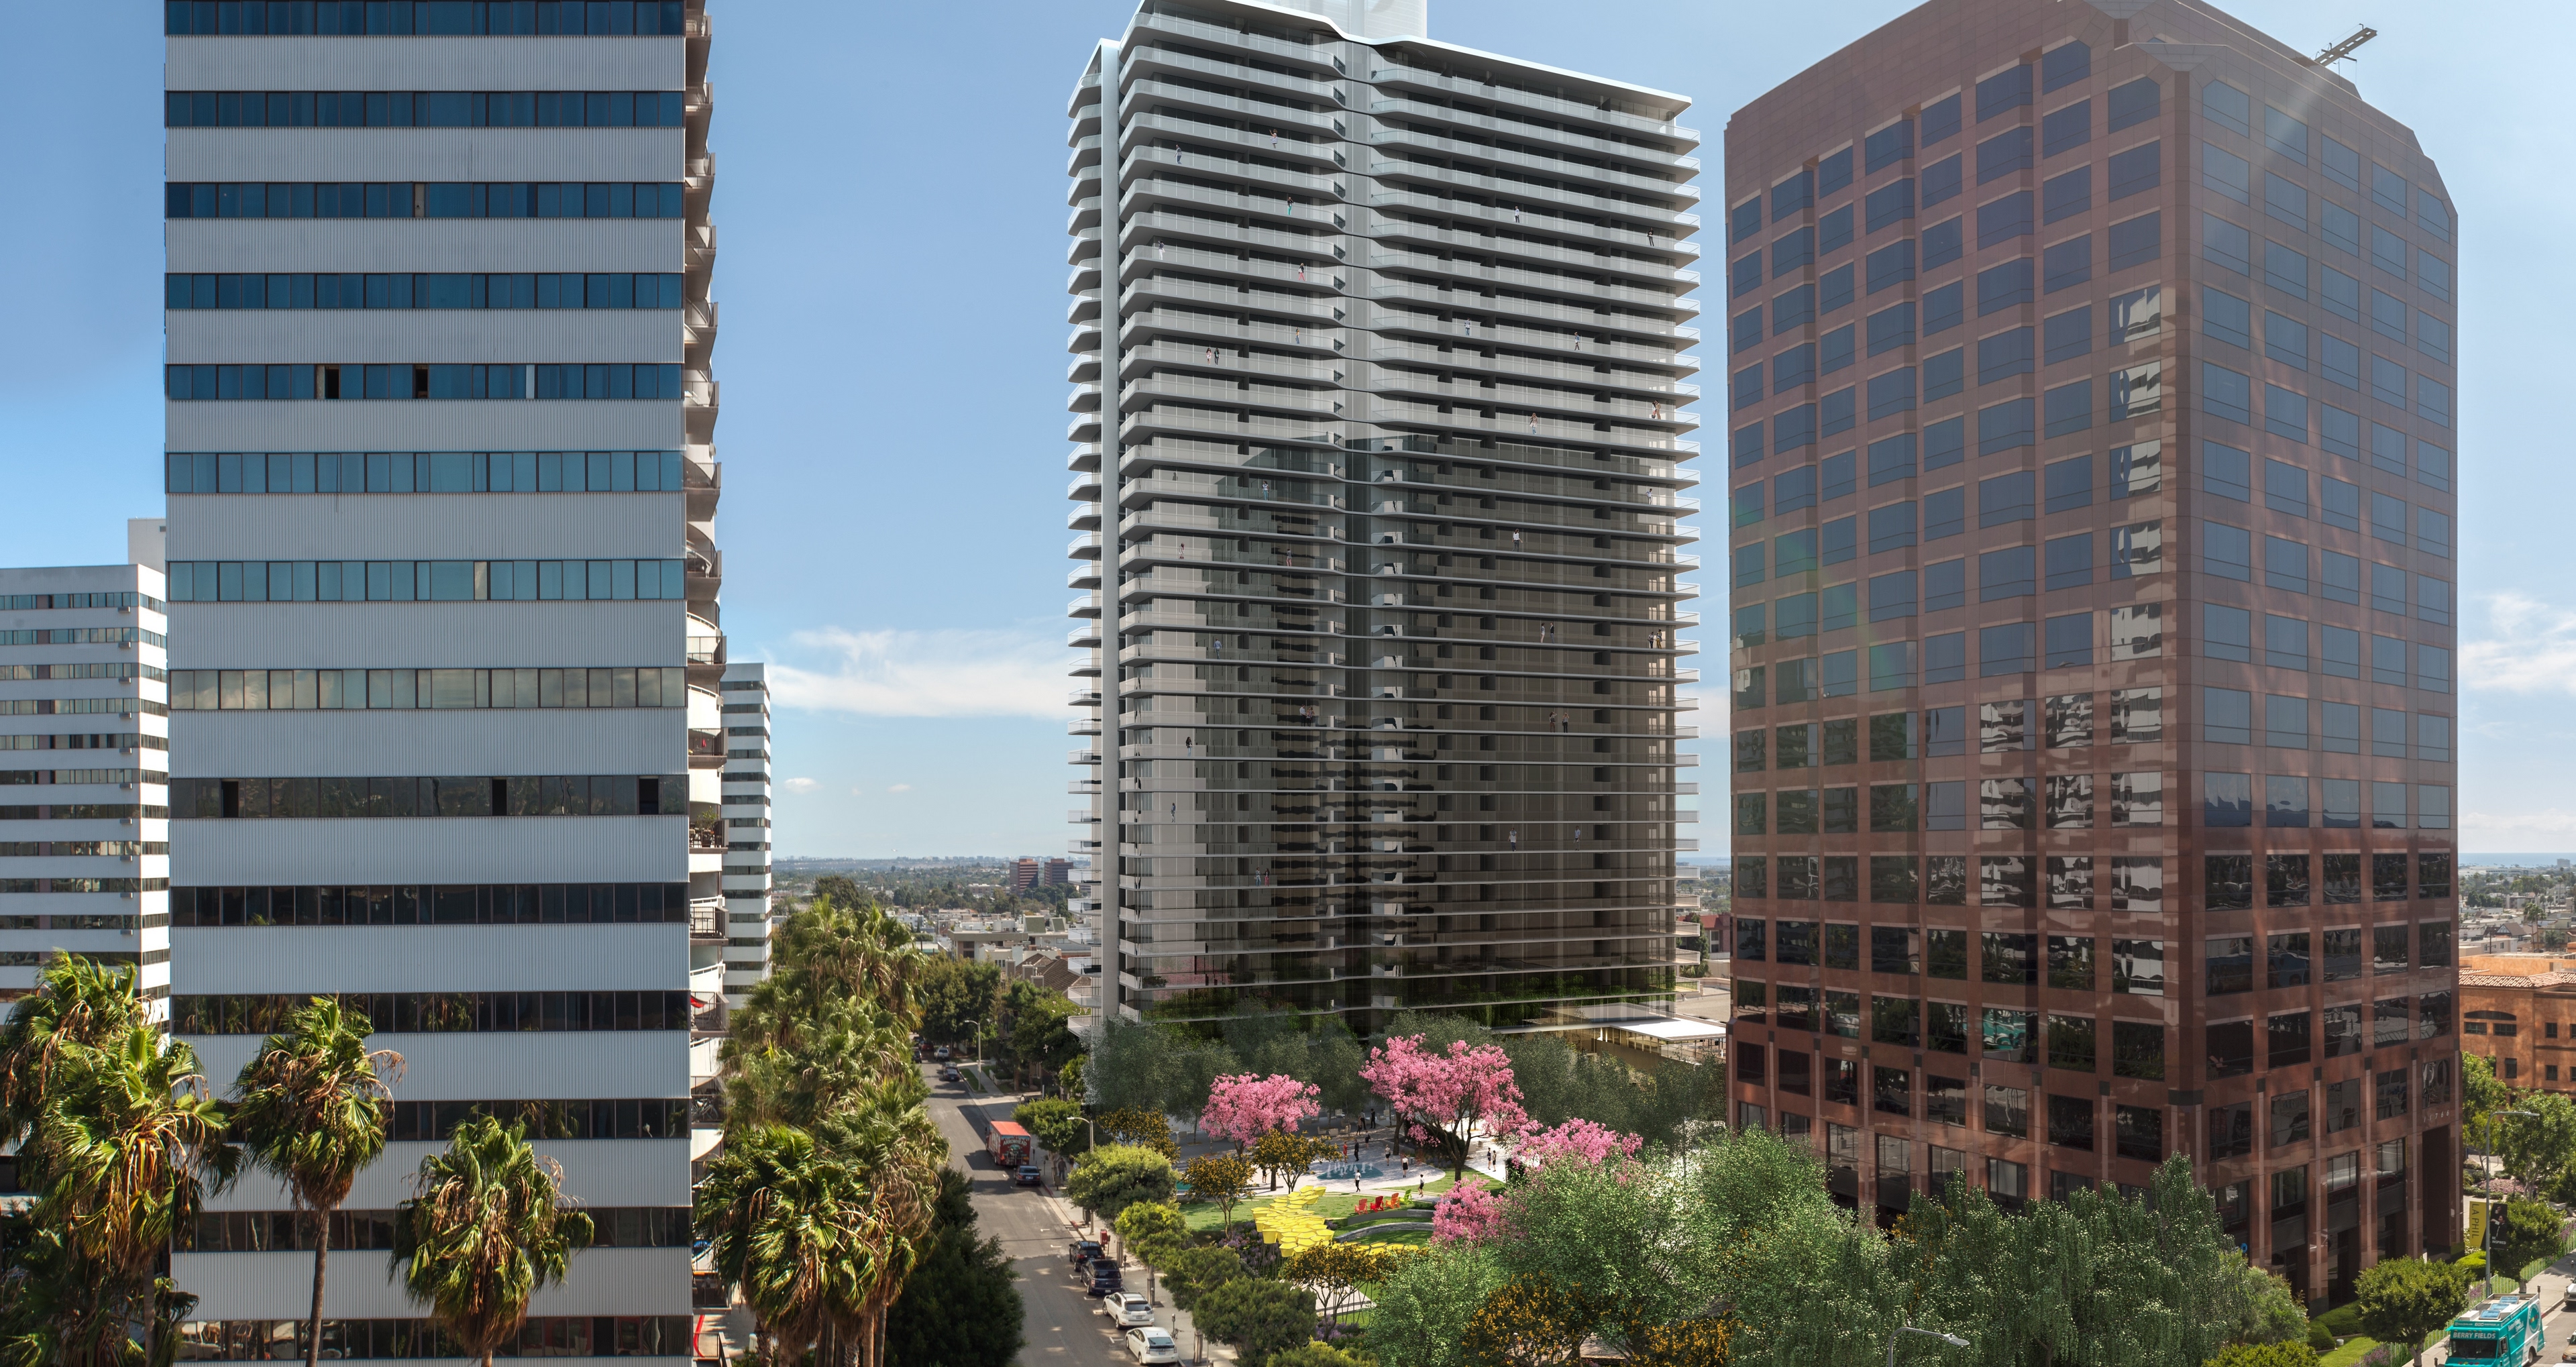
Rendering of our planned new residential tower in Brentwood (center), with a new park in the foreground, and our existing residential and office buildings (left and right, respectively). | |
Our new Brentwood development is the first new residential high-rise development west of the 405 freeway in more than 40 years, offering stunning ocean views and luxury amenities. The 34 story, 376 unit tower is being built on a site that is directly adjacent to our existing office building and a 712 unit residential property that we own. The estimated budget is between $180 million and $200 million, not including the cost of the land which we have owned since 1997. As part of the project, we are investing additional capital to build a one acre park on Wilshire Boulevard that will be available to the public and provide a valuable amenity to our surrounding properties and community. Site work is underway, and we expect construction to take about 3 years. |
______________________________________________
| |
(1) | All figures are estimates, as development in our markets is long and complex and subject to inherent uncertainties. |
NOTE: See the "Definitions" section for definitions of certain terms used in this Earnings Package.
2018 Guidance
|
| |
Metric | Per Share |
Net income per common share - diluted | $0.69 to $0.71 |
FFO per share - fully diluted | $2.01 to $2.03 |
Assumptions
|
| | | |
Metric | Commentary | Assumption Range | Compared to Prior Guidance |
Average Office Occupancy | | 89% to 91% | Unchanged |
Residential Leased Rate | We manage our apartment portfolio to be fully leased (due to rent control in our markets). Our assumption excludes the impact of leasing up newly developed units placed in service during the year. | Essentially fully leased | Unchanged |
Same Property Cash NOI | | Annual increase of 3% to 4% | Increased |
Net Revenue from Above/Below Market Leases | | $20 to $22 million | Unchanged |
Straight-line Revenue | | $17 to $19 million | Unchanged |
G&A | | $37 to $40 million | Unchanged |
Interest Expense | Includes 100% of our consolidated JVs interest expense (not our pro rata share). | $132.5 to $135.5 million | Unchanged |
___________________________________________
Except as disclosed, our guidance does not include the impact of future property acquisitions or dispositions, financings, other possible capital markets activities or impairment charges. The guidance and representative assumptions on this page are forward looking statements, subject to the safe harbor contained at the beginning of this Earnings Package, and reflect our views of current and future market conditions. Ranges represent a set of likely assumptions, but actual results could fall outside the ranges presented. Only a few of our assumptions underlying our guidance are disclosed above, and our actual results will be affected by known and unknown risks, trends, uncertainties and other factors, some of which are beyond our control or ability to predict. Although we believe that the assumptions underlying our guidance are reasonable, they are not guarantees of future performance and some of them will inevitably prove to be incorrect. As a result, our actual future results can be expected to differ from our expectations, and those differences could be material. See page 24 for a reconciliation of our Non-GAAP guidance.
NOTE: See the "Definitions" section for definitions of certain terms used in this Earnings Package.
Reconciliation of our 2018 Non-GAAP Guidance(1)
(Unaudited; in millions, except per share amounts)
Reconciliation of our guided Net income per common share - diluted to FFO per share - fully diluted:
|
| | | | | | | |
Reconciliation of net income attributable to common stockholders to FFO | Low | | High |
|
Net income attributable to common stockholders | $ | 117.3 |
| | $ | 120.7 |
|
Adjustments for depreciation and amortization of real estate assets | 300.0 |
| | 295.0 |
|
Adjustments for noncontrolling interests, consolidated JVs and unconsolidated funds | (19.3 | ) | | (13.8 | ) |
FFO | $ | 398.0 |
| | $ | 401.9 |
|
|
Reconciliation of shares outstanding | High | | Low |
| |
Weighted average shares of common stock outstanding - diluted | 170.0 |
| | 170.0 |
Weighted average units in our operating partnership outstanding | 28.0 |
| | 28.0 |
Weighted average fully diluted shares outstanding | 198.0 |
| | 198.0 |
|
|
Per share | Low | | High |
|
Net income per common share - diluted | $ | 0.69 |
| | $ | 0.71 |
|
FFO per share - fully diluted | $ | 2.01 |
| | $ | 2.03 |
|
_____________________________________________
(1) This reconciliation should be used as an example only, with the numbers presented only as representative assumptions. Ranges represent a set of likely assumptions, but actual results could fall outside the ranges presented. All assumptions are forward looking statements, subject to the safe harbor contained at the beginning of this Earnings Package, and reflect our views of current and future market conditions. Our actual results will be affected by known and unknown risks, trends, uncertainties and other factors, some of which are beyond our control or ability to predict. Although we believe that the assumptions underlying the guidance are reasonable, they are not guarantees of future performance and some of them will inevitably prove to be incorrect. As a result, our actual future results can be expected to differ from our expectations, and those differences could be material.
NOTE: See the "Definitions" section for definitions of certain terms used in this Earnings Package.
Adjusted Funds From Operations (AFFO): We calculate AFFO from FFO by (i) eliminating the impact on FFO of straight-line rent; amortization/accretion of acquired above/below market leases; loan costs such as amortization/accretion of loan premiums/discounts; amortization and hedge ineffectiveness of interest rate contracts; amortization/expense of loan costs; non-cash compensation expense, and (ii) subtracting recurring capital expenditures, tenant improvements and leasing expenses (including adjusting for the effect of such items attributable to consolidated joint ventures and unconsolidated real estate funds, but not for noncontrolling interests included in our calculation of fully diluted equity). Recurring capital expenditures, tenant improvements and leasing expenses are those required to maintain current revenues once a property has been stabilized, generally excluding those for acquired buildings being stabilized, newly developed space and upgrades to improve revenues or operating expenses, as well as those resulting from casualty damage or bringing the property into compliance with governmental requirements. We report AFFO because it is a widely reported measure of the performance of equity Real Estate Investments Trusts (REITs), and is also used by some investors to compare our performance with other REITs. However, the National Association of Real Estate Investment Trusts (NAREIT) has not defined AFFO, and other REITs may use different methodologies for calculating AFFO, and accordingly, our AFFO may not be comparable to the AFFO of other REITs. AFFO is a non-GAAP financial measure for which we believe that net income is the most directly comparable GAAP financial measure. AFFO should be considered only as a supplement to net income as a measure of our performance and should not be used as a measure of our liquidity or cash flow, nor is it indicative of funds available to fund our cash needs, including our ability to pay dividends.
AFFO Payout Ratio: Represents dividends paid within each period divided by the AFFO for that period.
Annualized Rent: Represents annualized cash base rent (i.e. excludes tenant reimbursements, parking and other revenue) before abatements under leases commenced as of the reporting date and expiring after the reporting date (does not include 346,766 square feet with respect to signed leases not yet commenced at September 30, 2018). For our triple net office properties (in Honolulu and two single tenant buildings in Los Angeles), annualized rent is calculated by adding expense reimbursements and estimates of normal building expenses paid by tenants to base rent. Annualized Rent does not include lost rent recovered from insurance and rent for building management use. Annualized Rent does include rent for a health club that we own and operate in Honolulu and our corporate headquarters in Santa Monica.
Average Office Occupancy: Calculated by averaging the Occupancy Rates on the last day of the current and prior quarter and, for reporting periods longer than a quarter, by averaging the Occupancy Rates for all the quarters in the respective reported period.
Consolidated Portfolio: Includes all of the properties included in our consolidated results, including our consolidated joint ventures. We own 100% of our consolidated portfolio except for ten office properties totaling 2.8 million square feet which we own through three consolidated joint ventures and in which we own a weighted average of approximately 28% based on square footage.
Consolidated Net Debt: Represents our consolidated debt, net of cash and cash equivalents, and before adding unamortized loan premium and deducting unamortized deferred loan costs. Cash and cash equivalents are subtracted because they could be used to reduce the debt obligations and unamortized loan premium and deferred loan costs are not adjusted for because they do not require cash settlement. Consolidated Net Debt is a non-GAAP financial measure for which we believe that consolidated debt is the most directly comparable GAAP financial measure. We report Consolidated Net Debt because some investors use it to evaluate and compare our leverage and financial position with that of other REITs. A limitation associated with using Consolidated Net Debt is that it subtracts cash and cash equivalents and may therefore imply that there is less debt than the most comparable GAAP financial measure indicates.
Equity Capitalization: Represents our Fully Diluted Shares multiplied by the closing price of our common stock on September 28, 2018.
Fully Diluted Shares: Represents the sum of our diluted shares outstanding plus the outstanding units in our Operating Partnership.
Funds: Fund X Opportunity Fund, LLC, Douglas Emmett Fund X, LLC and Douglas Emmett Partnership X, LP.
Funds From Operations (FFO): We calculate FFO in accordance with the standards established by NAREIT by excluding gains (or losses) on sales of investments in real estate, real estate depreciation and amortization (other than amortization of deferred loan costs) from our net income (including adjusting for the effect of such items attributable to consolidated joint ventures and unconsolidated real estate funds, but not for noncontrolling interests included in our calculation of fully diluted equity). We report FFO because it is a widely reported measure of the performance of equity REITs, and is also used by some investors to identify trends in occupancy rates, rental rates and operating costs from year to year, and to compare our performance with other REITs. FFO is a non-GAAP financial measure for which we believe that net income is the most directly comparable GAAP financial measure. FFO has limitations as a measure of our performance because it excludes depreciation and amortization of real estate, and captures neither the changes in the value of our properties that result from use or market conditions, nor the level of capital expenditures, tenant improvements and leasing expenses necessary to maintain the operating performance of our properties, all of which have real economic effect and could materially impact our results from operations. FFO should be considered only as a supplement to net income as a measure of our performance and should not be used as a measure of our liquidity or cash flow, nor is it indicative of funds available to fund our cash needs, including our ability to pay dividends. Other REITs may not calculate FFO in accordance with the NAREIT definition and, accordingly, our FFO may not be comparable to the FFO of other REITs.
GAAP: Refers to accounting principles generally accepted in the United States.
Lease Transaction Costs: Represents the weighted average of tenant improvements and leasing expenses for leases signed by us during the quarter, excluding leases substantially negotiated by the seller in the case of acquired properties and excluding leases for tenants relocated due to repositioning projects.
Net Income Per Common Share - Diluted: We calculate Net Income Per Common Share - Diluted by dividing the net income attributable to common stockholders for the period by the weighted average number of common shares and dilutive instruments outstanding during the period using the treasury stock method. We account for unvested LTIP awards that contain nonforfeitable rights to dividends as participating securities and include these securities in the computation using the two-class method.
Net Operating Income (NOI): We calculate NOI as revenue less operating expenses attributable to the properties that we own and operate. We present two forms of NOI:
| |
• | NOI: is calculated by excluding the following from our net income: general and administrative expense, depreciation and amortization expense, other income, other expense, income, including depreciation, from unconsolidated real estate funds, interest expense, gains (or losses) on sales of investments in real estate and net income attributable to noncontrolling interests. |
| |
• | Cash NOI: is calculated by excluding from NOI our straight-line rent and the amortization/accretion of acquired above/below market leases. |
We report NOI because it is a widely recognized measure of the performance of equity REITs, and is used by some investors to identify trends in occupancy rates, rental rates and operating costs and to compare our operating performance with that of other REITs. NOI is a non-GAAP financial measure for which we believe that net income is the most directly comparable GAAP financial measure. NOI has limitations as a measure of our performance because it excludes depreciation and amortization expense, and captures neither the changes in the value of our properties that result from use or market conditions, nor the level of capital expenditures, tenant improvements and leasing expenses necessary to maintain the operating performance of our properties, all of which have real economic effect and could materially impact our results from operations. NOI should be considered only as a supplement to net income as a measure of our performance and should not be used as a measure of our liquidity or cash flow, nor is it indicative of funds available to fund our cash needs, including our ability to pay dividends. Other REITs may not calculate NOI in a similar manner and, accordingly, our NOI may not be comparable to the NOI of other REITs.
Occupancy Rate: The percentage leased, excluding signed leases not yet commenced, as of September 30, 2018. Management space is considered leased and occupied, while space taken out of service during a repositioning is excluded from both the numerator and denominator for calculating percentage leased and occupied.
Operating Partnership: Douglas Emmett Properties, LP
Our Share of Net Debt: We calculate our share of net debt by multiplying the principal balance of our consolidated loans and our unconsolidated Funds loans by our equity interest in the relevant borrower, and subtracting the product of cash and cash equivalents multiplied by our equity interest in the entity that owns the cash or equivalent. We subtract cash and cash equivalents because they could be used to reduce the debt obligations, but do not add unamortized loan premium or subtract unamortized deferred loan costs because they do not require cash settlement. Our share of net debt is a non-GAAP financial measure for which we believe that consolidated debt is the most directly comparable GAAP financial measure. We report our share of net debt because some investors use it to evaluate and compare our leverage and financial position with that of other REITs.
Recurring Capital Expenditures: Building improvements required to maintain revenues once a property has been stabilized, and excludes capital expenditures for (i) acquired buildings being stabilized, (ii) newly developed space, (iii) upgrades to improve revenues or operating expenses, (iv) casualty damage and (v) bringing the property into compliance with governmental requirements.
Rentable Square Feet: Based on the BOMA measurement. At September 30, 2018, total consists of 16,446,758 leased square feet (including 346,766 square feet with respect to signed leases not commenced), 1,584,752 available square feet, 131,299 building management use square feet and 270,928 square feet of BOMA adjustment on leased space.
Same Property NOI: To facilitate a comparison of NOI between reported periods, we report NOI for a subset of our wholly-owned properties referred to as our “same properties”, which are wholly-owned properties that have been owned and operated by us in a consistent manner during the entire span of both periods being compared. We excluded from our same property subset for 2018 properties (i) acquired on or after January 1, 2017; (ii) sold, held for sale, contributed or otherwise removed from our consolidated financial statements on or after January 1, 2017; or (iii) that underwent a major repositioning project that we believed significantly affected its results during the period commencing on or after January 1, 2017. Our same properties for 2018 include all of our wholly-owned properties other than (1) a 146,300 square foot office property in Beverly Hills that we acquired during 2017; (2) a multifamily property in Honolulu where we are adding 475 units (net of existing units removed), (3) a 378,000 square foot office property in Los Angeles on which we expect to commence construction of a residential tower, and (4) four office properties in Los Angeles totaling 1.5 million square feet which are undergoing repositionings or redevelopment.
Short Term Leases: Represents leases that expired on or before the reporting date or had a term of less than one year, including hold over tenancies, month to month leases and other short term occupancies.
Total Portfolio: Includes our Consolidated Portfolio plus eight properties totaling 1.8 million square feet owned by our three unconsolidated real estate Funds, in which we own a weighted average of approximately 62% based on square footage.
"We" and "our" refers to Douglas Emmett, Inc., our Operating Partnership and its subsidiaries, as well as our consolidated JVs and our unconsolidated Funds.