United States
Securities and Exchange Commission
Washington, D.C. 20549
Form N-CSR
Certified Shareholder Report of Registered Management Investment Companies
811-21904
(Investment Company Act File Number)
Federated MDT Series
_______________________________________________________________
(Exact Name of Registrant as Specified in Charter)
Federated Investors Funds
4000 Ericsson Drive
Warrendale, Pennsylvania 15086-7561
(Address of Principal Executive Offices)
(412) 288-1900
(Registrant's Telephone Number)
John W. McGonigle, Esquire
Federated Investors Tower
1001 Liberty Avenue
Pittsburgh, Pennsylvania 15222-3779
(Name and Address of Agent for Service)
(Notices should be sent to the Agent for Service)
Date of Fiscal Year End: 07/31/16
Date of Reporting Period: 07/31/16
Item 1. Reports to Stockholders


| 1 | Please see the footnotes to the line graphs below for definitions of, and further information about, the Russell 3000® Index. |
| 2 | Morningstar has assigned the Fund to the Morningstar Large Cap Value Funds Average peer group, however, the MLBFA is being used for comparison purposes. The Fund invests in both value and growth stocks and therefore the Fund's Adviser believes that the MLBFA is more reflective of the Fund's investment style. Please see the footnotes to the line graphs below for definitions of, and further information about, the MLBFA. |
| 3 | The Russell Top 200® Index measures the performance of the largest cap segment of the U.S. equity universe. The Russell Top 200® Index is a subset of the Russell 3000® Index. It includes approximately 200 of the largest securities based on a combination of their market cap and current index membership and represents approximately 68% of the U.S. market. The Russell Top 200® Index is constructed to provide a comprehensive and unbiased barometer for this very large cap segment and is completely reconstituted annually to ensure new and growing equities are reflected. The Russell Top 200 Index is unmanaged, and it is not possible to invest directly in an index. |
| 4 | The Russell Midcap® Index measures the performance of the mid-cap segment of the U.S. equity universe. The Russell Midcap® Index is a subset of the Russell 1000® Index. It includes approximately 800 of the smallest securities based on a combination of their market cap and current index membership. The Russell Midcap® Index represents approximately 31% of the total market capitalization of the Russell 1000® companies. The Russell Midcap® Index is constructed to provide a comprehensive and unbiased barometer for the mid-cap segment. The Russell Midcap Index is completely reconstituted annually to ensure larger stocks do not distort the performance and characteristics of the true mid-cap opportunity set. The Russell Midcap Index is unmanaged, and it is not possible to invest directly in an index. |
| 5 | Small-cap stocks may be less liquid and subject to greater price volatility than large-cap stocks. |
| 6 | The Russell 2000® Index measures the performance of the small-cap segment of the U.S. equity universe. The Russell 2000® Index is a subset of the Russell 3000® Index representing approximately 10% of the total market capitalization of that index. It includes approximately 2000 of the smallest securities based on a combination of their market cap and current index membership. The Russell 2000® Index is constructed to provide a comprehensive and unbiased small-cap barometer and is completely reconstituted annually to ensure larger stocks do not distort the performance and characteristics of the true small-cap opportunity set. The Russell 2000 Index is unmanaged, and it is not possible to invest directly in an index. |
| 7 | The Russell Microcap® Index measures the performance of the microcap segment of the U.S. equity market. Microcap stocks make up less than 3% of the U.S. equity market (by market cap) and consist of the smallest 1,000 securities in the small-cap Russell 2000® Index, plus the next 1,000 smallest eligible securities by market cap. The Russell Microcap® Index is constructed to provide a comprehensive and unbiased barometer for the microcap segment trading on national exchanges and is completely reconstituted annually to ensure new and growing equities are reflected and companies continue to reflect appropriate capitalization and value characteristics. The Russell Microcap® Index is unmanaged, and it is not possible to invest directly in an index. |
| 8 | The Russell 3000® Value Index measures the performance of the broad value segment of the U.S. equity value universe. It includes those Russell 3000® Index companies with lower price-to-book ratios and lower forecasted growth values. The Russell 3000® Value Index is constructed to provide a comprehensive, unbiased and stable barometer of the broad value market. The Russell 3000® Value Index is completely reconstituted annually to ensure new and growing equities are included and that the represented companies continue to reflect value characteristics. The index is unmanaged, and it is not possible to invest directly in an index. |
| 9 | The Russell 3000® Growth Index measures the performance of the broad growth segment of the U.S. equity universe. It includes those Russell 3000® Index companies with higher price-to-book ratios and higher forecasted growth values. The Russell 3000® Growth Index is constructed to provide a comprehensive, unbiased and stable barometer of the broad growth market. The Russell 3000® Growth Index is completely reconstituted annually to ensure new and growing equities are included and that the represented companies continue to reflect growth characteristics. The index is unmanaged, and it is not possible to invest directly in an index. |
| 10 | The Russell Microcap® Value Index measures the performance of the micro-cap value segment of the U.S. equity universe. It includes those Russell Microcap® Index companies with higher price-to-book ratios and lower forecasted growth values. The Russell Microcap® Value Index is constructed to provide a comprehensive, unbiased and stable barometer of the micro-cap value market. The Russell Microcap Value Index is completely reconstituted annually to ensure new and growing equities are included and that the represented companies continue to reflect value characteristics. The index is unmanaged, and it is not possible to invest directly in an index. |
| 11 | The Russell Microcap® Growth Index measures the performance of the microcap growth segment of the U.S. equity market. It includes Russell Microcap companies that are considered more growth oriented relative to the overall market as defined by Russell's leading style methodology. The Russell Microcap® Growth Index is constructed to provide a comprehensive and unbiased barometer for the microcap growth segment of the market. The Russell Microcap® Growth Index is completely reconstituted annually to ensure larger stocks do not distort performance and characteristics of the microcap opportunity set. The Russell Microcap® Growth Index is unmanaged, and it is not possible to invest directly in an index. |

| ■ | Total returns shown for the Class C Shares include the maximum contingent deferred sales charge of 1.00% as applicable. |
| 1 Year | 5 Years | 10 Years | |
| Class A Shares | -6.09% | 10.93% | 4.60% |
| Class C Shares | -2.41% | 11.30% | 4.36% |
| Class R Shares5 | -1.05% | 11.67% | 4.74% |
| Institutional Shares | -0.34% | 12.50% | 5.48% |
| R3000 | 4.44% | 12.99% | 7.82% |
| MLBFA | 1.94% | 11.44% | 6.80% |
| 1 | Represents a hypothetical investment of $10,000 in the Fund after deducting applicable sales charges: for Class A Shares, the maximum sales charge of 5.50% ($10,000 investment minus $550 sales charge = $9,450); for Class C Shares a 1.00% contingent deferred sales charge would be applied on any redemption less than one year from the purchase date. The Fund's performance assumes the reinvestment of all dividends and distributions. The R3000 has been adjusted to reflect reinvestment of dividends of securities. |
| 2 | The Fund is the successor to the MDT All Cap Core Fund pursuant to a reorganization that took place on December 8, 2006. Prior to that date, the Fund had no investment operations. Accordingly, the performance information shown for periods prior to that date is that of the MDT All Cap Core Fund. |
| 3 | The R3000 measures the performance of the largest 3,000 U.S. companies representing approximately 98% of the investable U.S. equity market. The R3000 is constructed to provide a comprehensive, unbiased, and stable barometer of the broad market and is completely reconstituted annually to ensure new and growing equities are reflected. The index is unmanaged and, unlike the Fund, is not affected by cash flows. It is not possible to invest directly in an index. The R3000 is not adjusted to reflect sales charges, expenses or other fees that the Securities and Exchange Commission requires to be reflected in the Fund's performance. |
| 4 | Morningstar figures represent the average of the total returns reported by all the mutual funds designated by Morningstar as falling into the respective category indicated. They do not reflect sales charges. |
| 5 | Class R Shares commenced operations on December 12, 2006. Performance results shown before that date are for the Fund's Institutional Shares and have been adjusted for the total annual operating expenses applicable to Class R Shares. |
| Industry Composition | Percentage of Total Net Assets |
| Life Insurance | 4.9% |
| Internet Services | 4.3% |
| Regional Banks | 4.1% |
| Department Stores | 4.0% |
| Biotechnology | 3.7% |
| Oil Refiner | 3.5% |
| Property Liability Insurance | 3.3% |
| Money Center Bank | 3.0% |
| Services to Medical Professionals | 3.0% |
| Software Packaged/Custom | 2.9% |
| Medical Supplies | 2.8% |
| Computers—High End | 2.7% |
| Computers—Midrange | 2.5% |
| Ethical Drugs | 2.5% |
| Auto Original Equipment Manufacturers | 2.2% |
| Medical Technology | 2.0% |
| Packaged Foods | 2.0% |
| Computers—Low End | 1.9% |
| Financial Services | 1.8% |
| Commodity Chemicals | 1.7% |
| Electric Utility | 1.7% |
| Grocery Chain | 1.7% |
| AT&T Divestiture | 1.6% |
| Construction Machinery | 1.5% |
| Specialty Retailing | 1.5% |
| Airline—Regional | 1.4% |
| Poultry Products | 1.4% |
| Telephone Utility | 1.4% |
| Semiconductor Manufacturing | 1.3% |
| Cable TV | 1.2% |
| Cosmetics & Toiletries | 1.1% |
| Hospitals | 1.1% |
| Computer Stores | 1.0% |
| Industry Composition | Percentage of Total Net Assets |
| Shipbuilding | 1.0% |
| Other2 | 20.4% |
| Cash Equivalents3 | 1.5% |
| Other Assets and Liabilities—Net4 | 0.4% |
| TOTAL | 100.0% |
| 1 | Except for Cash Equivalents and Other Assets and Liabilities, industry classifications are based upon, and individual portfolio securities are assigned to, the classifications of the Global Industry Classification Standard (GICS) except that the Adviser assigns a classification to securities not classified by the GICS and to securities for which the Adviser does not have access to the classification made by the GICS. |
| 2 | For purposes of this table, industry classifications which constitute less than 1.0% of the Fund's total net assets have been aggregated under the designation “Other”. |
| 3 | Cash Equivalents include any investments in money market mutual funds and/or overnight repurchase agreements. |
| 4 | Assets, other than investments in securities, less liabilities. See Statement of Assets and Liabilities. |
| Shares | Value | ||
| COMMON STOCKS—98.1% | |||
| Agricultural Machinery—0.3% | |||
| 9,100 | AGCO Corp. | $438,256 | |
| Airline - National—0.9% | |||
| 4,639 | 1 | Atlas Air Worldwide Holdings, Inc. | 200,544 |
| 21,800 | 1 | Jet Blue Airways Corp. | 399,594 |
| 14,659 | 1 | United Continental Holdings, Inc. | 687,360 |
| TOTAL | 1,287,498 | ||
| Airline - Regional—1.4% | |||
| 10,759 | Alaska Air Group, Inc. | 723,220 | |
| 35,766 | Southwest Airlines Co. | 1,323,700 | |
| TOTAL | 2,046,920 | ||
| Airlines—0.6% | |||
| 21,847 | Delta Air Lines, Inc. | 846,571 | |
| Apparel—0.6% | |||
| 4,466 | 1 | Iconix Brand Group, Inc. | 32,155 |
| 7,800 | PVH Corp. | 788,268 | |
| TOTAL | 820,423 | ||
| AT&T Divestiture—1.6% | |||
| 40,304 | Verizon Communications, Inc. | 2,233,245 | |
| Auto Manufacturing—0.5% | |||
| 10,855 | Allison Transmission Holdings, Inc. | 312,841 | |
| 35,900 | Ford Motor Co. | 454,494 | |
| TOTAL | 767,335 | ||
| Auto Original Equipment Manufacturers—2.2% | |||
| 18,948 | Lear Corp. | 2,149,651 | |
| 3,562 | 1 | O'Reilly Automotive, Inc. | 1,035,224 |
| TOTAL | 3,184,875 | ||
| Biotechnology—3.7% | |||
| 22,998 | Amgen, Inc. | 3,956,346 | |
| 15,342 | Gilead Sciences, Inc. | 1,219,229 | |
| 3,045 | 1 | Repligen Corp. | 87,087 |
| TOTAL | 5,262,662 | ||
| Broadcasting—0.3% | |||
| 7,909 | CBS Corp., Class B | 413,008 | |
| Building Supply Stores—0.4% | |||
| 1,054 | Home Depot, Inc. | 145,705 |
| Shares | Value | ||
| COMMON STOCKS—continued | |||
| Building Supply Stores—continued | |||
| 5,203 | Lowe's Cos., Inc. | $428,103 | |
| TOTAL | 573,808 | ||
| Cable TV—1.2% | |||
| 36,984 | Viacom, Inc., Class B | 1,681,662 | |
| Capital Markets—0.5% | |||
| 18,565 | Bank of New York Mellon Corp. | 731,461 | |
| Clothing Stores—0.8% | |||
| 9,671 | 1 | Fossil, Inc. | 305,603 |
| 33,449 | Gap (The), Inc. | 862,650 | |
| TOTAL | 1,168,253 | ||
| Commodity Chemicals—1.7% | |||
| 2,018 | Celanese Corp. | 127,982 | |
| 2,011 | Eastman Chemical Co. | 131,177 | |
| 28,095 | LyondellBasell Investment LLC, Class A | 2,114,430 | |
| TOTAL | 2,373,589 | ||
| Computer Networking—0.5% | |||
| 31,818 | Juniper Networks, Inc. | 721,950 | |
| Computer Peripherals—0.4% | |||
| 19,800 | NetApp, Inc. | 521,730 | |
| Computer Services—0.2% | |||
| 3,888 | 1 | Salesforce.com, Inc. | 318,038 |
| Computer Stores—1.0% | |||
| 10,800 | GameStop Corp. | 334,260 | |
| 13,862 | 1 | Tech Data Corp. | 1,080,266 |
| TOTAL | 1,414,526 | ||
| Computers - High End—2.7% | |||
| 23,940 | IBM Corp. | 3,845,243 | |
| Computers - Low End—1.9% | |||
| 25,774 | Apple, Inc. | 2,685,909 | |
| Computers - Midrange—2.5% | |||
| 256,781 | 1 | Hewlett-Packard Co. | 3,597,502 |
| Construction Machinery—1.5% | |||
| 49,196 | Joy Global, Inc. | 1,359,285 | |
| 35,600 | Trinity Industries, Inc. | 826,276 | |
| TOTAL | 2,185,561 | ||
| Consumer Finance—0.3% | |||
| 25,900 | Navient Corp. | 367,780 |
| Shares | Value | ||
| COMMON STOCKS—continued | |||
| Contracting—0.3% | |||
| 8,300 | 1 | Jacobs Engineering Group, Inc. | $444,216 |
| Cosmetics & Toiletries—1.1% | |||
| 21,400 | Avon Products, Inc. | 87,098 | |
| 1,506 | Estee Lauder Cos., Inc., Class A | 139,907 | |
| 3,481 | 1 | Helen of Troy Ltd. | 346,743 |
| 3,697 | 1 | Ulta Salon Cosmetics & Fragrance, Inc. | 965,693 |
| TOTAL | 1,539,441 | ||
| Crude Oil & Gas Production—0.2% | |||
| 22,200 | 1 | Chesapeake Energy Corp. | 120,324 |
| 1,181 | Cimarex Energy Co. | 141,744 | |
| TOTAL | 262,068 | ||
| Dairy Products—0.3% | |||
| 5,515 | Cal-Maine Foods, Inc. | 231,078 | |
| 8,425 | Dean Foods Co. | 155,526 | |
| TOTAL | 386,604 | ||
| Defense Aerospace—0.7% | |||
| 2,959 | General Dynamics Corp. | 434,647 | |
| 11,239 | 1 | Spirit Aerosystems Holdings, Inc., Class A | 487,548 |
| TOTAL | 922,195 | ||
| Department Stores—4.0% | |||
| 5,980 | Dillards, Inc., Class A | 404,727 | |
| 20,551 | Kohl's Corp. | 854,716 | |
| 41,805 | Macy's, Inc. | 1,497,873 | |
| 38,852 | Target Corp. | 2,926,721 | |
| TOTAL | 5,684,037 | ||
| Discount Department Stores—0.2% | |||
| 5,400 | Foot Locker, Inc. | 321,948 | |
| Distillers—0.6% | |||
| 4,757 | Constellation Brands, Inc., Class A | 783,145 | |
| Diversified Oil—0.6% | |||
| 10,472 | Occidental Petroleum Corp. | 782,573 | |
| Electric Utility—1.7% | |||
| 24,600 | AES Corp. | 303,810 | |
| 83,976 | NiSource, Inc. | 2,154,824 | |
| TOTAL | 2,458,634 | ||
| Electrical Equipment—0.4% | |||
| 4,200 | 1 | Sanmina Corp. | 106,428 |
| 3,060 | 1 | WESCO International, Inc. | 170,564 |
| Shares | Value | ||
| COMMON STOCKS—continued | |||
| Electrical Equipment—continued | |||
| 29,400 | Xerox Corp. | $302,820 | |
| TOTAL | 579,812 | ||
| Electronics Stores—0.4% | |||
| 16,800 | Best Buy Co., Inc. | 564,480 | |
| Energy Equipment & Services—0.1% | |||
| 11,813 | Noble Corp. PLC | 87,180 | |
| Entertainment—0.5% | |||
| 43,653 | 1 | MSG Networks, Inc., Class A | 700,631 |
| Ethical Drugs—2.5% | |||
| 74,491 | Pfizer, Inc. | 2,747,973 | |
| 6,195 | 1 | United Therapeutics Corp. | 749,657 |
| TOTAL | 3,497,630 | ||
| Financial Services—1.8% | |||
| 28,700 | Ally Financial, Inc. | 517,748 | |
| 6,354 | Ameriprise Financial, Inc. | 608,967 | |
| 5,086 | Deluxe Corp. | 343,763 | |
| 10,116 | Discover Financial Services | 574,993 | |
| 4,846 | Synchrony Financial | 135,107 | |
| 18,900 | Western Union Co. | 378,000 | |
| TOTAL | 2,558,578 | ||
| Food & Staples Retailing—0.3% | |||
| 4,603 | Walgreens Boots Alliance, Inc. | 364,788 | |
| Grocery Chain—1.7% | |||
| 69,326 | Kroger Co. | 2,370,256 | |
| Health Care Equipment & Supplies—0.1% | |||
| 1,779 | 1 | Inogen, Inc. | 95,603 |
| Home Building—0.1% | |||
| 5,206 | D. R. Horton, Inc. | 171,173 | |
| Home Products—0.4% | |||
| 3,770 | Libbey, Inc. | 70,461 | |
| 7,554 | Tupperware Brands Corp. | 473,485 | |
| TOTAL | 543,946 | ||
| Hospitals—1.1% | |||
| 27,966 | 1 | Community Health Systems, Inc. | 357,126 |
| 15,835 | 1 | HCA, Inc. | 1,221,353 |
| TOTAL | 1,578,479 | ||
| Hotels—0.7% | |||
| 13,361 | Wyndham Worldwide Corp. | 948,898 |
| Shares | Value | ||
| COMMON STOCKS—continued | |||
| Household Appliances—0.3% | |||
| 2,463 | Whirlpool Corp. | $473,783 | |
| Integrated International Oil—0.3% | |||
| 4,821 | Exxon Mobil Corp. | 428,828 | |
| Internet Services—4.3% | |||
| 115,239 | 1 | eBay, Inc. | 3,590,847 |
| 20,698 | 1 | Facebook, Inc., Class A | 2,565,310 |
| TOTAL | 6,156,157 | ||
| Life Insurance—4.9% | |||
| 44,569 | Aflac, Inc. | 3,221,447 | |
| 21,412 | Assured Guaranty Ltd. | 573,627 | |
| 42,688 | Prudential Financial, Inc. | 3,213,980 | |
| TOTAL | 7,009,054 | ||
| Machinery—0.1% | |||
| 6,829 | Kennametal, Inc. | 169,769 | |
| Medical Supplies—2.8% | |||
| 74,279 | Baxter International, Inc. | 3,566,878 | |
| 7,878 | 1 | Hologic, Inc. | 303,224 |
| 1,633 | 1 | Orthofix International NV | 77,404 |
| TOTAL | 3,947,506 | ||
| Medical Technology—2.0% | |||
| 2,873 | 1 | Abiomed, Inc. | 338,928 |
| 21,833 | 1 | Edwards Lifesciences Corp. | 2,500,315 |
| TOTAL | 2,839,243 | ||
| Metal Fabrication—0.1% | |||
| 2,471 | Reliance Steel & Aluminum Co. | 193,825 | |
| Miscellaneous Components—0.3% | |||
| 27,428 | Vishay Intertechnology, Inc. | 365,615 | |
| Miscellaneous Food Products—0.8% | |||
| 7,300 | Fresh Del Monte Produce, Inc. | 415,005 | |
| 5,900 | Ingredion, Inc. | 786,116 | |
| TOTAL | 1,201,121 | ||
| Miscellaneous Machinery—0.8% | |||
| 32,533 | 1 | Colfax Corp. | 955,169 |
| 14,360 | 1 | SPX Corp. | 217,410 |
| TOTAL | 1,172,579 | ||
| Money Center Bank—3.0% | |||
| 19,891 | Bank of America Corp. | 288,221 | |
| 8,281 | Citigroup, Inc. | 362,791 |
| Shares | Value | ||
| COMMON STOCKS—continued | |||
| Money Center Bank—continued | |||
| 55,952 | JPMorgan Chase & Co. | $3,579,249 | |
| TOTAL | 4,230,261 | ||
| Multi-Industry Capital Goods—0.2% | |||
| 1,259 | Acuity Brands, Inc. | 330,399 | |
| Multi-Industry Transportation—0.1% | |||
| 863 | FedEx Corp. | 139,720 | |
| Office Equipment—0.2% | |||
| 14,800 | Pitney Bowes, Inc. | 285,788 | |
| Office Supplies—0.0% | |||
| 2,386 | Ennis Business Forms, Inc. | 41,326 | |
| Offshore Driller—0.1% | |||
| 15,800 | Nabors Industries Ltd. | 142,200 | |
| Oil Refiner—3.5% | |||
| 15,598 | HollyFrontier Corp. | 396,501 | |
| 15,618 | Tesoro Petroleum Corp. | 1,189,311 | |
| 63,739 | Valero Energy Corp. | 3,332,275 | |
| TOTAL | 4,918,087 | ||
| Oil Well Supply—0.6% | |||
| 21,445 | National Oilwell Varco, Inc. | 693,746 | |
| 8,200 | Superior Energy Services, Inc. | 130,954 | |
| TOTAL | 824,700 | ||
| Packaged Foods—2.0% | |||
| 17,980 | Smucker (J.M.) Co. | 2,771,797 | |
| Paper Products—0.2% | |||
| 5,600 | Domtar, Corp. | 220,472 | |
| Poultry Products—1.4% | |||
| 16,900 | Pilgrim's Pride Corp. | 392,925 | |
| 4,000 | Sanderson Farms, Inc. | 350,360 | |
| 17,688 | Tyson Foods, Inc., Class A | 1,301,837 | |
| TOTAL | 2,045,122 | ||
| Printing—0.1% | |||
| 9,700 | Donnelley (R.R.) & Sons Co. | 173,824 | |
| Property Liability Insurance—3.3% | |||
| 5,558 | Everest Re Group Ltd. | 1,050,518 | |
| 30,641 | The Travelers Cos., Inc. | 3,561,097 | |
| TOTAL | 4,611,615 | ||
| Recreational Goods—0.1% | |||
| 4,970 | 1 | Smith & Wesson Holding Corp. | 146,367 |
| Shares | Value | ||
| COMMON STOCKS—continued | |||
| Regional Banks—4.1% | |||
| 29,600 | Fifth Third Bancorp | $561,808 | |
| 17,200 | Huntington Bancshares, Inc. | 163,400 | |
| 30,200 | KeyCorp | 353,340 | |
| 24,479 | PNC Financial Services Group | 2,023,189 | |
| 9,100 | Popular, Inc. | 306,579 | |
| 33,335 | SunTrust Banks, Inc. | 1,409,737 | |
| 21,302 | Wells Fargo & Co. | 1,021,857 | |
| TOTAL | 5,839,910 | ||
| Restaurants—0.4% | |||
| 3,686 | Cracker Barrel Old Country Store, Inc. | 580,213 | |
| Rubber—0.4% | |||
| 19,439 | Goodyear Tire & Rubber Co. | 557,316 | |
| Semiconductor Distribution—0.5% | |||
| 2,931 | 1 | Arrow Electronics, Inc. | 194,882 |
| 10,973 | Avnet, Inc. | 450,991 | |
| TOTAL | 645,873 | ||
| Semiconductor Manufacturing—1.3% | |||
| 51,399 | Intel Corp. | 1,791,769 | |
| Services to Medical Professionals—3.0% | |||
| 4,841 | Aetna, Inc. | 557,732 | |
| 12,514 | Anthem, Inc. | 1,643,589 | |
| 24,463 | 1 | Express Scripts Holding Co. | 1,860,900 |
| 3,753 | 1 | Molina Healthcare, Inc. | 213,208 |
| TOTAL | 4,275,429 | ||
| Shipbuilding—1.0% | |||
| 8,559 | Huntington Ingalls Industries, Inc. | 1,477,112 | |
| Shoes—0.1% | |||
| 8,631 | 1 | Skechers USA, Inc., Class A | 207,317 |
| Soft Drinks—0.8% | |||
| 6,012 | Dr. Pepper Snapple Group, Inc. | 592,242 | |
| 5,062 | PepsiCo, Inc. | 551,353 | |
| TOTAL | 1,143,595 | ||
| Software Packaged/Custom—2.9% | |||
| 19,200 | CA, Inc. | 665,280 | |
| 8,086 | CDW Corp. | 347,132 | |
| 35,403 | 1 | Citrix Systems, Inc. | 3,155,469 |
| TOTAL | 4,167,881 |
| Shares | Value | ||
| COMMON STOCKS—continued | |||
| Specialty Retailing—1.5% | |||
| 8,000 | Abercrombie & Fitch Co., Class A | $165,680 | |
| 16,403 | Bed Bath & Beyond, Inc. | 737,315 | |
| 2,900 | Big Lots, Inc. | 154,222 | |
| 1,700 | Children's Place, Inc./The | 142,086 | |
| 8,480 | GNC Holdings, Inc. | 173,077 | |
| 5,296 | Nordstrom, Inc. | 234,242 | |
| 6,464 | Outerwall, Inc. | 340,394 | |
| 16,300 | Staples, Inc. | 151,427 | |
| 4,151 | Tailored Brands, Inc. | 60,812 | |
| TOTAL | 2,159,255 | ||
| Telecommunication Equipment & Services—0.7% | |||
| 16,930 | Cisco Systems, Inc. | 516,873 | |
| 4,365 | 1 | Dycom Industries, Inc. | 410,528 |
| TOTAL | 927,401 | ||
| Telephone Utility—1.4% | |||
| 62,812 | CenturyLink, Inc. | 1,974,809 | |
| Truck Manufacturing—0.3% | |||
| 6,600 | OshKosh Truck Corp. | 363,594 | |
| Undesignated Consumer Cyclicals—0.7% | |||
| 7,800 | 1 | Avis Budget Group, Inc. | 286,494 |
| 2,100 | DeVry Education Group, Inc. | 46,767 | |
| 5,969 | 1 | Herbalife Ltd. | 405,952 |
| 5,800 | Nu Skin Enterprises, Inc., Class A | 309,720 | |
| TOTAL | 1,048,933 | ||
| TOTAL COMMON STOCKS (IDENTIFIED COST $135,810,510) | 139,133,685 | ||
| INVESTMENT COMPANY—1.5% | |||
| 2,073,572 | 2 | Federated Institutional Prime Value Obligations Fund, Institutional Shares, 0.36%3 (AT NET ASSET VALUE) | 2,073,572 |
| TOTAL INVESTMENTS—99.6% (IDENTIFIED COST $137,884,082)4 | 141,207,257 | ||
| OTHER ASSETS AND LIABILITIES - NET—0.4%5 | 544,021 | ||
| TOTAL NET ASSETS—100% | $141,751,278 |
| 1 | Non-income-producing security. |
| 2 | Affiliated holding. |
| 3 | 7-day net yield. |
| 4 | The cost of investments for federal tax purposes amounts to $137,931,874. |
| 5 | Assets, other than investments in securities, less liabilities. See Statement of Assets and Liabilities. |
| Year Ended July 31 | 2016 | 2015 | 2014 | 2013 | 2012 |
| Net Asset Value, Beginning of Period | $22.10 | $20.47 | $17.26 | $12.73 | $12.48 |
| Income From Investment Operations: | |||||
| Net investment income | 0.191 | 0.111 | 0.081 | 0.091 | 0.061 |
| Net realized and unrealized gain (loss) on investments | (0.33) | 1.55 | 3.23 | 4.49 | 0.19 |
| TOTAL FROM INVESTMENT OPERATIONS | (0.14) | 1.66 | 3.31 | 4.58 | 0.25 |
| Less Distributions: | |||||
| Distributions from net investment income | (0.19) | (0.03) | (0.10) | (0.05) | — |
| Net Asset Value, End of Period | $21.77 | $22.10 | $20.47 | $17.26 | $12.73 |
| Total Return2 | (0.61)% | 8.10% | 19.21% | 36.10% | 2.00% |
| Ratios to Average Net Assets: | |||||
| Net expenses | 1.35% | 1.35% | 1.35% | 1.35% | 1.35% |
| Net investment income | 0.94% | 0.51% | 0.41% | 0.59% | 0.48% |
| Expense waiver/reimbursement3 | 0.03% | 0.00%4 | 0.08% | 0.16% | 0.40% |
| Supplemental Data: | |||||
| Net assets, end of period (000 omitted) | $33,753 | $40,433 | $44,678 | $34,092 | $29,365 |
| Portfolio turnover | 62% | 76% | 31% | 99% | 164% |
| 1 | Per share numbers have been calculated using the average shares method. |
| 2 | Based on net asset value, which does not reflect the sales charge, redemption fee or contingent deferred sales charge, if applicable. |
| 3 | This expense decrease is reflected in both the net expense and the net investment income ratios shown above. |
| 4 | Represents less than 0.01%. |
| Year Ended July 31 | 2016 | 2015 | 2014 | 2013 | 2012 |
| Net Asset Value, Beginning of Period | $21.00 | $19.57 | $16.55 | $12.26 | $12.12 |
| Income From Investment Operations: | |||||
| Net investment income (loss) | 0.031 | (0.05)1 | (0.07)1 | (0.03)1 | (0.04)1 |
| Net realized and unrealized gain (loss) on investments | (0.33) | 1.48 | 3.09 | 4.32 | 0.18 |
| TOTAL FROM INVESTMENT OPERATIONS | (0.30) | 1.43 | 3.02 | 4.29 | 0.14 |
| Less Distributions: | |||||
| Distributions from net investment income | (0.04) | — | — | — | — |
| Net Asset Value, End of Period | $20.66 | $21.00 | $19.57 | $16.55 | $12.26 |
| Total Return2 | (1.43)% | 7.31% | 18.25% | 34.99% | 1.16% |
| Ratios to Average Net Assets: | |||||
| Net expenses | 2.14% | 2.11% | 2.15% | 2.15% | 2.15% |
| Net investment income (loss) | 0.15% | (0.26)% | (0.38)% | (0.21)% | (0.32)% |
| Expense waiver/reimbursement3 | 0.00%4 | 0.00%4 | 0.06% | 0.11% | 0.36% |
| Supplemental Data: | |||||
| Net assets, end of period (000 omitted) | $36,846 | $41,509 | $35,052 | $27,674 | $24,440 |
| Portfolio turnover | 62% | 76% | 31% | 99% | 164% |
| 1 | Per share numbers have been calculated using the average shares method. |
| 2 | Based on net asset value, which does not reflect the sales charge, redemption fee or contingent deferred sales charge, if applicable. |
| 3 | This expense decrease is reflected in both the net expense and the net investment income (loss) ratios shown above. |
| 4 | Represents less than 0.01%. |
| Year Ended July 31 | 2016 | 2015 | 2014 | 2013 | 2012 |
| Net Asset Value, Beginning of Period | $21.80 | $20.25 | $17.09 | $12.62 | $12.44 |
| Income From Investment Operations: | |||||
| Net investment income (loss) | 0.101 | 0.021 | (0.01)1 | 0.021 | (0.00)1,2 |
| Net realized and unrealized gain (loss) on investments | (0.33) | 1.53 | 3.20 | 4.45 | 0.18 |
| TOTAL FROM INVESTMENT OPERATIONS | (0.23) | 1.55 | 3.19 | 4.47 | 0.18 |
| Less Distributions: | |||||
| Distributions from net investment income | (0.11) | — | (0.03) | — | — |
| Net Asset Value, End of Period | $21.46 | $21.80 | $20.25 | $17.09 | $12.62 |
| Total Return3 | (1.05)% | 7.65% | 18.68% | 35.42% | 1.45% |
| Ratios to Average Net Assets: | |||||
| Net expenses | 1.80% | 1.76% | 1.81% | 1.83% | 1.85% |
| Net investment income (loss) | 0.49% | 0.09% | (0.05)% | 0.11% | (0.02)% |
| Expense waiver/reimbursement4 | 0.00%5 | 0.00%5 | 0.00%5 | 0.02% | 0.25% |
| Supplemental Data: | |||||
| Net assets, end of period (000 omitted) | $5,717 | $6,300 | $5,467 | $4,089 | $2,718 |
| Portfolio turnover | 62% | 76% | 31% | 99% | 164% |
| 1 | Per share numbers have been calculated using the average shares method. |
| 2 | Represents less than $0.01. |
| 3 | Based on net asset value. |
| 4 | This expense decrease is reflected in both the net expense and the net investment income (loss) ratios shown above. |
| 5 | Represents less than 0.01%. |
| Year Ended July 31 | 2016 | 2015 | 2014 | 2013 | 2012 |
| Net Asset Value, Beginning of Period | $22.37 | $20.71 | $17.45 | $12.87 | $12.61 |
| Income From Investment Operations: | |||||
| Net investment income | 0.251 | 0.181 | 0.131 | 0.121 | 0.091 |
| Net realized and unrealized gain (loss) on investments | (0.34) | 1.57 | 3.27 | 4.55 | 0.19 |
| TOTAL FROM INVESTMENT OPERATIONS | (0.09) | 1.75 | 3.40 | 4.67 | 0.28 |
| Less Distributions: | |||||
| Distributions from net investment income | (0.26) | (0.09) | (0.14) | (0.09) | (0.02) |
| Net Asset Value, End of Period | $22.02 | $22.37 | $20.71 | $17.45 | $12.87 |
| Total Return2 | (0.34)% | 8.45% | 19.54% | 36.46% | 2.23% |
| Ratios to Average Net Assets: | |||||
| Net expenses | 1.07% | 1.05% | 1.10% | 1.10% | 1.10% |
| Net investment income | 1.22% | 0.80% | 0.65% | 0.84% | 0.73% |
| Expense waiver/reimbursement3 | 0.00%4 | 0.00%4 | 0.00%4 | 0.05% | 0.27% |
| Supplemental Data: | |||||
| Net assets, end of period (000 omitted) | $65,435 | $76,242 | $62,770 | $39,932 | $39,101 |
| Portfolio turnover | 62% | 76% | 31% | 99% | 164% |
| 1 | Per share numbers have been calculated using the average shares method. |
| 2 | Based on net asset value. |
| 3 | This expense decrease is reflected in both the net expense and the net investment income ratios shown above. |
| 4 | Represents less than 0.01%. |
| Assets: | ||
| Total investment in securities, at value including $2,073,572 of investment in an affiliated holding (Note 5) (identified cost $137,884,082) | $141,207,257 | |
| Income receivable | 109,358 | |
| Receivable for investments sold | 3,676,006 | |
| Receivable for shares sold | 212,374 | |
| TOTAL ASSETS | 145,204,995 | |
| Liabilities: | ||
| Payable for investments purchased | $1,646,475 | |
| Payable for shares redeemed | 1,639,577 | |
| Payable to adviser (Note 5) | 8,701 | |
| Payable for administrative fee (Note 5) | 909 | |
| Payable for distribution services fee (Note 5) | 25,407 | |
| Payable for other service fees (Notes 2 and 5) | 18,185 | |
| Accrued expenses (Note 5) | 114,463 | |
| TOTAL LIABILITIES | 3,453,717 | |
| Net assets for 6,571,642 shares outstanding | $141,751,278 | |
| Net Assets Consist of: | ||
| Paid-in capital | $205,715,164 | |
| Net unrealized appreciation of investments | 3,323,175 | |
| Accumulated net realized loss on investments | (67,949,670) | |
| Undistributed net investment income | 662,609 | |
| TOTAL NET ASSETS | $141,751,278 |
| Net Asset Value, Offering Price and Redemption Proceeds Per Share | ||
| Class A Shares: | ||
| Net asset value per share ($33,752,971 ÷ 1,550,504 shares outstanding), no par value, unlimited shares authorized | $21.77 | |
| Offering price per share (100/94.50 of $21.77) | $23.04 | |
| Redemption proceeds per share | $21.77 | |
| Class C Shares: | ||
| Net asset value per share ($36,845,857 ÷ 1,783,053 shares outstanding), no par value, unlimited shares authorized | $20.66 | |
| Offering price per share | $20.66 | |
| Redemption proceeds per share (99.00/100 of $20.66) | $20.45 | |
| Class R Shares: | ||
| Net asset value per share ($5,717,354 ÷ 266,391 shares outstanding), no par value, unlimited shares authorized | $21.46 | |
| Offering price per share | $21.46 | |
| Redemption proceeds per share | $21.46 | |
| Institutional Shares: | ||
| Net asset value per share ($65,435,096 ÷ 2,971,694 shares outstanding), no par value, unlimited shares authorized | $22.02 | |
| Offering price per share | $22.02 | |
| Redemption proceeds per share | $22.02 |
| Investment Income: | |||
| Dividends (including $7,728 received from an affiliated holding (Note 5) and net of foreign taxes withheld of $546) | $3,353,275 | ||
| Expenses: | |||
| Investment adviser fee (Note 5) | $1,094,488 | ||
| Administrative fee (Note 5) | 114,158 | ||
| Custodian fees | 15,932 | ||
| Transfer agent fee (Note 2) | 188,547 | ||
| Directors'/Trustees' fees (Note 5) | 3,048 | ||
| Auditing fees | 24,799 | ||
| Legal fees | 8,235 | ||
| Portfolio accounting fees | 80,037 | ||
| Distribution services fee (Note 5) | 307,115 | ||
| Other service fees (Notes 2 and 5) | 182,917 | ||
| Share registration costs | 54,880 | ||
| Printing and postage | 31,750 | ||
| Miscellaneous (Note 5) | 13,132 | ||
| TOTAL EXPENSES | 2,119,038 | ||
| Reimbursements: | |||
| Reimbursement of investment adviser fee (Note 5) | $(2,984) | ||
| Reimbursement of other operating expenses (Notes 2 and 5) | (8,492) | ||
| TOTAL REIMBURSEMENTS | (11,476) | ||
| Net expenses | 2,107,562 | ||
| Net investment income | 1,245,713 | ||
| Realized and Unrealized Gain (Loss) on Investments: | |||
| Net realized gain on investments | 10,543,935 | ||
| Net change in unrealized appreciation of investments | (14,227,683) | ||
| Net realized and unrealized loss on investments | (3,683,748) | ||
| Change in net assets resulting from operations | $(2,438,035) |
| Year Ended July 31 | 2016 | 2015 |
| Increase (Decrease) in Net Assets | ||
| Operations: | ||
| Net investment income | $1,245,713 | $688,318 |
| Net realized gain on investments | 10,543,935 | 23,954,092 |
| Net change in unrealized appreciation/depreciation of investments | (14,227,683) | (12,475,569) |
| CHANGE IN NET ASSETS RESULTING FROM OPERATIONS | (2,438,035) | 12,166,841 |
| Distributions to Shareholders: | ||
| Distributions from net investment income | ||
| Class A Shares | (331,676) | (54,414) |
| Class C Shares | (74,346) | — |
| Class R Shares | (30,147) | — |
| Institutional Shares | (834,843) | (280,741) |
| CHANGE IN NET ASSETS RESULTING FROM DISTRIBUTIONS TO SHAREHOLDERS | (1,271,012) | (335,155) |
| Share Transactions: | ||
| Proceeds from sale of shares | 16,202,436 | 46,770,875 |
| Net asset value of shares issued to shareholders in payment of distributions declared | 1,208,182 | 324,870 |
| Cost of shares redeemed | (36,433,688) | (42,409,715) |
| CHANGE IN NET ASSETS RESULTING FROM SHARE TRANSACTIONS | (19,023,070) | 4,686,030 |
| Change in net assets | (22,732,117) | 16,517,716 |
| Net Assets: | ||
| Beginning of period | 164,483,395 | 147,965,679 |
| End of period (including undistributed net investment income of $662,609 and $687,908, respectively) | $141,751,278 | $164,483,395 |
| ■ | Equity securities listed on an exchange or traded through a regulated market system are valued at their last reported sale price or official closing price in their principal exchange or market. |
| ■ | Shares of other mutual funds or non-exchange-traded investment companies are valued based upon their reported NAVs. |
| ■ | Fixed-income securities acquired with remaining maturities greater than 60 days are fair valued using price evaluations provided by a pricing service approved by the Board of Trustees (the “Trustees”). |
| ■ | Fixed-income securities and repurchase agreements acquired with remaining maturities of 60 days or less are valued at their cost (adjusted for the accretion of any discount or amortization of any premium), unless the issuer's creditworthiness is impaired or other factors indicate that amortized cost is not an accurate estimate of the investment's fair value, in which case it would be valued in the same manner as a longer-term security. |
| ■ | Derivative contracts listed on exchanges are valued at their reported settlement or closing price, except that options are valued at the mean of closing bid and asked quotations. |
| ■ | Over-the-counter (OTC) derivative contracts are fair valued using price evaluations provided by a pricing service approved by the Trustees. |
| ■ | For securities that are fair valued in accordance with procedures established by and under the general supervision of the Trustees, certain factors may be considered such as: the last traded or purchase price of the security, information obtained by contacting the issuer or dealers, analysis of the issuer's financial statements or other available documents, fundamental analytical data, the nature and duration of restrictions on disposition, the movement of the market in which the security is normally traded, public trading in similar securities or derivative contracts of the issuer or comparable issuers, movement of a relevant index, or other factors including but not limited to industry changes and relevant government actions. |
| Transfer Agent Fees Incurred | Transfer Agent Fees Reimbursed | |
| Class A Shares | $51,922 | $(8,492) |
| Class C Shares | 59,088 | — |
| Class R Shares | 17,831 | — |
| Institutional Shares | 59,706 | — |
| TOTAL | $188,547 | $(8,492) |
| Other Service Fees Incurred | |
| Class A Shares | $90,053 |
| Class C Shares | 92,864 |
| TOTAL | $182,917 |
| Year Ended July 31 | 2016 | 2015 | ||
| Class A Shares: | Shares | Amount | Shares | Amount |
| Shares sold | 219,344 | $4,566,247 | 495,711 | $10,691,452 |
| Shares issued to shareholders in payment of distributions declared | 15,315 | 317,790 | 2,376 | 52,057 |
| Shares redeemed | (513,803) | (10,627,905) | (851,485) | (18,382,289) |
| NET CHANGE RESULTING FROM CLASS A SHARE TRANSACTIONS | (279,144) | $(5,743,868) | (353,398) | $(7,638,780) |
| Year Ended July 31 | 2016 | 2015 | ||
| Class C Shares: | Shares | Amount | Shares | Amount |
| Shares sold | 219,633 | $4,264,493 | 612,017 | $12,394,286 |
| Shares issued to shareholders in payment of distributions declared | 3,342 | 66,135 | — | — |
| Shares redeemed | (416,914) | (8,026,807) | (426,212) | (8,772,133) |
| NET CHANGE RESULTING FROM CLASS C SHARE TRANSACTIONS | (193,939) | $(3,696,179) | 185,805 | $3,622,153 |
| Year Ended July 31 | 2016 | 2015 | ||
| Class R Shares: | Shares | Amount | Shares | Amount |
| Shares sold | 87,503 | $1,760,683 | 127,210 | $2,715,467 |
| Shares issued to shareholders in payment of distributions declared | 1,465 | 30,064 | — | — |
| Shares redeemed | (111,552) | (2,251,362) | (108,214) | (2,323,679) |
| NET CHANGE RESULTING FROM CLASS R SHARE TRANSACTIONS | (22,584) | $(460,615) | 18,996 | $391,788 |
| Year Ended July 31 | 2016 | 2015 | ||
| Institutional Shares: | Shares | Amount | Shares | Amount |
| Shares sold | 269,327 | $5,611,013 | 963,004 | $20,969,670 |
| Shares issued to shareholders in payment of distributions declared | 37,891 | 794,193 | 12,322 | 272,813 |
| Shares redeemed | (744,427) | (15,527,614) | (597,814) | (12,931,614) |
| NET CHANGE RESULTING FROM INSTITUTIONAL SHARE TRANSACTIONS | (437,209) | $(9,122,408) | 377,512 | $8,310,869 |
| NET CHANGE RESULTING FROM TOTAL FUND SHARE TRANSACTIONS | (932,876) | $(19,023,070) | 288,915 | $4,686,030 |
| 2016 | 2015 | |
| Ordinary income | $1,271,012 | $335,155 |
| Undistributed ordinary income | $662,609 |
| Net unrealized appreciation | $3,275,383 |
| Capital loss carryforwards | $(67,901,878) |
| Expiration Year | Short-Term | Long-Term | Total |
| 2017 | $423,018 | NA | $423,018 |
| 2018 | $67,478,860 | NA | $67,478,860 |
| Administrative Fee | Average Daily Net Assets of the Investment Complex |
| 0.150% | on the first $5 billion |
| 0.125% | on the next $5 billion |
| 0.100% | on the next $10 billion |
| 0.075% | on assets in excess of $20 billion |
| Share Class Name | Percentage of Average Daily Net Assets of Class |
| Class A Shares | 0.05% |
| Class C Shares | 0.75% |
| Class R Shares | 0.50% |
| Distribution Services Fees Incurred | |
| Class C Shares | $278,593 |
| Class R Shares | 28,522 |
| TOTAL | $307,115 |
| Federated Institutional Prime Value Obligations Fund, Institutional Shares | |
| Balance of Shares Held 7/31/2015 | 3,340,032 |
| Purchases/Additions | 25,608,639 |
| Sales/Reductions | (26,875,099) |
| Balance of Shares Held 7/31/2016 | 2,073,572 |
| Value | $2,073,572 |
| Dividend Income | $7,728 |
| Purchases | $88,445,672 |
| Sales | $106,815,983 |
September 22, 2016
| Beginning Account Value 2/1/2016 | Ending Account Value 7/31/2016 | Expenses Paid During Period1 | |
| Actual: | |||
| Class A Shares | $1,000 | $1,138.60 | $7.18 |
| Class C Shares | $1,000 | $1,133.90 | $11.41 |
| Class R Shares | $1,000 | $1,136.10 | $9.56 |
| Institutional Shares | $1,000 | $1,140.30 | $5.75 |
| Hypothetical (assuming a 5% return before expenses): | |||
| Class A Shares | $1,000 | $1,018.15 | $6.77 |
| Class C Shares | $1,000 | $1,014.17 | $10.77 |
| Class R Shares | $1,000 | $1,015.91 | $9.02 |
| Institutional Shares | $1,000 | $1,019.49 | $5.42 |
| 1 | Expenses are equal to the Fund's annualized net expense ratios, multiplied by the average account value over the period, multiplied by 182/366 (to reflect the one-half-year period). The annualized net expense ratios are as follows: |
| Class A Shares | 1.35% |
| Class C Shares | 2.15% |
| Class R Shares | 1.80% |
| Institutional Shares | 1.08% |
| Name Birth Date Positions Held with Trust Date Service Began | Principal Occupation(s) for Past Five Years, Other Directorships Held and Previous Position(s) |
| J. Christopher Donahue* Birth Date: April 11, 1949 President and Trustee Indefinite Term Began serving: May 2006 | Principal Occupations: Principal Executive Officer and President of certain of the Funds in the Federated Fund Family; Director or Trustee of the Funds in the Federated Fund Family; President, Chief Executive
Officer and Director, Federated Investors, Inc.; Chairman and Trustee, Federated Investment Management Company; Trustee, Federated Investment Counseling; Chairman and Director, Federated Global Investment Management
Corp.; Chairman, Federated Equity Management Company of Pennsylvania and Passport Research, Ltd. (investment advisory subsidiary of Federated); Trustee, Federated Shareholder Services Company; Director, Federated
Services Company. Previous Positions: President, Federated Investment Counseling; President and Chief Executive Officer, Federated Investment Management Company, Federated Global Investment Management Corp. and Passport Research, Ltd. |
| Name Birth Date Positions Held with Trust Date Service Began | Principal Occupation(s) for Past Five Years, Other Directorships Held and Previous Position(s) |
| John B. Fisher* Birth Date: May 16, 1956 Trustee Indefinite Term Began serving: May 2016 | Principal Occupations: Principal Executive Officer and President of certain of the Funds in the Federated Fund Family; Director or Trustee of certain of the Funds in the Federated Fund Family; Vice President,
Federated Investors, Inc.; President, Director/Trustee and CEO, Federated Advisory Services Company, Federated Equity Management Company of Pennsylvania, Federated Global Investment Management Corp., Federated
Investment Counseling, Federated Investment Management Company; President and CEO of Passport Research, Ltd.; President of some of the Funds in the Federated Fund Complex and Director, Federated Investors Trust
Company. Previous Positions: President and Director of the Institutional Sales Division of Federated Securities Corp.; President and Director of Federated Investment Counseling; Director, Edgewood Securities Corp.; Director, Federated Services Company; Director, Federated Investors, Inc.; Chairman and Director, Southpointe Distribution Services, Inc. and President, Technology, Federated Services Company. |
| * | Reasons for “interested” status: J. Christopher Donahue and John B. Fisher are interested due to their beneficial ownership of shares of Federated Investors, Inc. and due to positions they hold with Federated and its subsidiaries. J. Christopher Donahue is the son of John F. Donahue, Chairman Emeritus of the Federated Funds. |
| Name Birth Date Positions Held with Trust Date Service Began | Principal Occupation(s) for Past Five Years, Other Directorships Held, Previous Position(s) and Qualifications |
| John T. Collins Birth Date: January 24, 1947 Trustee Indefinite Term Began serving: October 2013 | Principal Occupations: Director or Trustee of the Federated Fund Family; Retired. Other Directorships Held: Director, Chair of the Compensation Committee, Audit Committee member, KLX Corp. Qualifications: Mr. Collins has served in several business and financial management roles and directorship positions throughout his career. Mr. Collins previously served as Chairman and CEO, The Collins Group, Inc. (a private equity firm). Mr. Collins serves as Chairman Emeriti, Bentley University. Mr. Collins previously served as Director, FleetBoston Financial Corp.; Director and Audit Committee Member, Bank of America Corp. and Director, Beth Israel Deaconess Medical Center (Harvard University Affiliate Hospital). |
| Name Birth Date Positions Held with Trust Date Service Began | Principal Occupation(s) for Past Five Years, Other Directorships Held, Previous Position(s) and Qualifications |
| G. Thomas Hough Birth Date: February 28, 1955 Trustee Indefinite Term Began serving: August 2015 | Principal Occupations: Director or Trustee of the Federated Fund Family; Retired. Other Directorships Held: Director, Chair of the Audit Committee, Governance Committee, Publix Super Markets, Inc. Qualifications: Mr. Hough has served in accounting, business management and directorship positions throughout his career. Mr. Hough most recently held the position of Americas Vice Chair of Assurance with Ernst & Young LLP. Mr. Hough is an Executive Committee member of the United States Golf Association, he serves on the President's Cabinet and Business School Board of Visitors for the University of Alabama and is on the Business School Board of Visitors for Wake Forest University. |
| Maureen Lally-Green Birth Date: July 5, 1949 Trustee Indefinite Term Began serving: August 2009 | Principal Occupations: Director or Trustee of the Federated Fund Family; Interim Dean of the Duquesne University School of Law; Adjunct Professor of Law, Duquesne University School of Law. Other Directorships Held: Director, CONSOL Energy Inc. Qualifications: Judge Lally-Green has served in various legal and business roles and directorship positions throughout her career. Judge Lally-Green previously served as: Associate General Secretary, Diocese of Pittsburgh; a member of the Superior Court of Pennsylvania; and as a Professor of Law, Duquesne University School of Law. Judge Lally-Green also holds the positions on either a public or not for profit Board of Directors as follows: Member, Pennsylvania State Board of Education (public); Director and Chair, UPMC Mercy Hospital; Regent, St. Vincent Seminary; Director and Vice Chair, Our Campaign for the Church Alive!, Inc.; Director, Saint Vincent College; and Director and Chair, Cardinal Wuerl North Catholic High School, Inc. Judge Lally-Green has held the positions of: Director, Auberle; Director, Ireland Institute of Pittsburgh; Director, Saint Thomas More Society; and Director, Catholic High Schools of the Diocese of Pittsburgh, Inc. |
| Peter E. Madden Birth Date: March 16, 1942 Trustee Indefinite Term Began serving: June 2006 | Principal Occupation: Director or Trustee, and Chair of the Board of Directors or Trustees, of the Federated Fund Family; Retired. Other Directorships Held: None. Qualifications: Mr. Madden has served in several business management, mutual fund services and directorship positions throughout his career. Mr. Madden previously served as President, Chief Operating Officer and Director, State Street Bank and Trust Company (custodian bank) and State Street Corporation (financial services). He was Director, VISA USA and VISA International and Chairman and Director, Massachusetts Bankers Association. Mr. Madden served as Director, Depository Trust Corporation and Director, The Boston Stock Exchange. Mr. Madden also served as a Representative to the Commonwealth of Massachusetts General Court. |
| Name Birth Date Positions Held with Trust Date Service Began | Principal Occupation(s) for Past Five Years, Other Directorships Held, Previous Position(s) and Qualifications |
| Charles F. Mansfield, Jr. Birth Date: April 10, 1945 Trustee Indefinite Term Began serving: June 2006 | Principal Occupations: Director or Trustee of the Federated Fund Family; Management Consultant. Other Directorships Held: None. Qualifications: Mr. Mansfield has served in several banking, business management and educational roles and directorship positions throughout his career. Mr. Mansfield previously served as Chief Executive Officer, PBTC International Bank; Partner, Arthur Young & Company (now Ernst & Young LLP); Chief Financial Officer of Retail Banking Sector, Chase Manhattan Bank; Senior Vice President, HSBC Bank USA (formerly, Marine Midland Bank); Vice President, Citibank; Assistant Professor of Banking and Finance, Frank G. Zarb School of Business, Hofstra University; Executive Vice President DVC Group, Inc. (marketing, communications and technology). |
| Thomas M. O'Neill Birth Date: June 14, 1951 Trustee Indefinite Term Began serving: October 2006 | Principal Occupations: Director or Trustee, Chair of the Audit Committee of the Federated Fund Family; Sole Proprietor, Navigator Management Company (investment and strategic consulting). Other Directorships Held: None. Qualifications: Mr. O'Neill has served in several business, mutual fund and financial management roles and directorship positions throughout his career. Mr. O'Neill serves as Director, Medicines for Humanity and Director, The Golisano Children's Museum of Naples, Florida. Mr. O'Neill previously served as Chief Executive Officer and President, Managing Director and Chief Investment Officer, Fleet Investment Advisors; President and Chief Executive Officer, Aeltus Investment Management, Inc.; General Partner, Hellman, Jordan Management Co., Boston, MA; Chief Investment Officer, The Putnam Companies, Boston, MA; Credit Analyst and Lending Officer, Fleet Bank; Director and Consultant, EZE Castle Software (investment order management software); and Director, Midway Pacific (lumber). |
| P. Jerome Richey Birth Date: February 23, 1949 Trustee Indefinite Term Began serving: October 2013 | Principal Occupations: Director or Trustee of the Federated Fund Family; Management Consultant. Other Directorships Held: None. Qualifications: Mr. Richey has served in several business and legal management roles and directorship positions throughout his career. Mr. Richey most recently held the positions of Senior Vice Chancellor and Chief Legal Officer, University of Pittsburgh. Mr. Richey serves as Board Member, Epilepsy Foundation of Western Pennsylvania and Board member, World Affairs Council of Pittsburgh. Mr. Richey previously served as Chief Legal Officer and Executive Vice President, CONSOL Energy Inc. and Shareholder, Buchanan Ingersoll & Rooney PC (a law firm). |
| Name Birth Date Positions Held with Trust Date Service Began | Principal Occupation(s) for Past Five Years, Other Directorships Held, Previous Position(s) and Qualifications |
| John S. Walsh Birth Date: November 28, 1957 Trustee Indefinite Term Began serving: June 2006 | Principal Occupations: Director or Trustee of the Federated Fund Family; President and Director, Heat Wagon, Inc. (manufacturer of construction temporary heaters); President and Director, Manufacturers
Products, Inc. (distributor of portable construction heaters); President, Portable Heater Parts, a division of Manufacturers Products, Inc. Other Directorships Held: None. Qualifications: Mr. Walsh has served in several business management roles and directorship positions throughout his career. Mr. Walsh previously served as Vice President, Walsh & Kelly, Inc. (paving contractors). |
| Name Birth Date Address Positions Held with Trust Date Service Began | Principal Occupation(s) for Past Five Years and Previous Position(s) |
| John W. McGonigle Birth Date: October 26, 1938 Secretary Officer since: May 2006 | Principal Occupations: Executive Vice President and Secretary of the Federated Fund Family; Vice Chairman, Executive Vice President, Secretary and Director, Federated Investors, Inc. Previous Positions: Trustee, Federated Investment Management Company and Federated Investment Counseling; Director, Federated Global Investment Management Corp., Federated Services Company and Federated Securities Corp. |
| Lori A. Hensler Birth Date: January 6, 1967 TREASURER Officer since: April 2013 | Principal Occupations: Principal Financial Officer and Treasurer of the Federated Fund Family; Senior Vice President, Federated Administrative Services; Financial and Operations Principal for Federated
Securities Corp. and Edgewood Services, Inc.; and Assistant Treasurer, Federated Investors Trust Company. Ms. Hensler has received the Certified Public Accountant designation. Previous Positions: Controller of Federated Investors, Inc.; Senior Vice President and Assistant Treasurer, Federated Investors Management Company; Treasurer, Federated Investors Trust Company; Assistant Treasurer, Federated Administrative Services, Federated Administrative Services, Inc., Federated Securities Corp., Edgewood Services, Inc., Federated Advisory Services Company, Federated Equity Management Company of Pennsylvania, Federated Global Investment Management Corp., Federated Investment Counseling, Federated Investment Management Company, Passport Research, Ltd., and Federated MDTA, LLC; Financial and Operations Principal for Federated Securities Corp., Edgewood Services, Inc. and Southpointe Distribution Services, Inc. |
| Name Birth Date Address Positions Held with Trust Date Service Began | Principal Occupation(s) for Past Five Years and Previous Position(s) |
| Peter J. Germain Birth Date: September 3, 1959 CHIEF LEGAL OFFICER Officer since: June 2006 | Principal Occupations: Mr. Germain is Chief Legal Officer of the Federated Fund Family. He is General Counsel and Vice President, Federated Investors, Inc.; President, Federated Administrative Services and
Federated Administrative Services, Inc.; Vice President, Federated Securities Corp.; Secretary, Federated Private Asset Management, Inc.; and Secretary, Retirement Plan Service Company of America. Mr. Germain joined
Federated in 1984 and is a member of the Pennsylvania Bar Association. Previous Positions: Deputy General Counsel, Special Counsel, Managing Director of Mutual Fund Services, Federated Investors, Inc.; Senior Vice President, Federated Services Company; and Senior Corporate Counsel, Federated Investors, Inc. |
| Stephen F. Auth Birth Date: September 13, 1956 101 Park Avenue 41st Floor New York, NY 10178 CHIEF INVESTMENT OFFICER Officer since: June 2012 | Principal Occupations: Stephen F. Auth is Chief Investment Officer of various Funds in the Federated Fund Family; Executive Vice President, Federated Investment Counseling, Federated Global Investment
Management Corp. and Federated Equity Management Company of Pennsylvania. Previous Positions: Executive Vice President, Federated Investment Management Company and Passport Research, Ltd. (investment advisory subsidiary of Federated); Senior Vice President, Global Portfolio Management Services Division; Senior Vice President, Federated Investment Management Company and Passport Research, Ltd.; Senior Managing Director and Portfolio Manager, Prudential Investments. |
| Stephen Van Meter Birth Date: June 5, 1975 CHIEF COMPLIANCE OFFICER AND SENIOR VICE PRESIDENT Officer since: July 2015 | Principal Occupations: Senior Vice President and Chief Compliance Officer of the Federated Fund Family; Vice President and Chief Compliance Officer of Federated Investors, Inc. and Chief Compliance Officer of
certain of its subsidiaries. Mr. Van Meter joined Federated in October 2011. He holds FINRA licenses under Series 3, 7, 24 and 66. Previous Positions: Mr. Van Meter previously held the position of Compliance Operating Officer, Federated Investors, Inc. Prior to joining Federated, Mr. Van Meter served at the United States Securities and Exchange Commission in the positions of Senior Counsel, Office of Chief Counsel, Division of Investment Management and Senior Counsel, Division of Enforcement. |

4000 Ericsson Drive
Warrendale, PA 15086-7561
or call 1-800-341-7400.
CUSIP 31421R205
CUSIP 31421R304
CUSIP 31421R718
2016 ©Federated Investors, Inc.
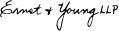
| 1 | The Fund's Blended Index, which reflects 60% of the S&P 500 and 40% of the BAB, is being used for comparison purposes because, although it is not the Fund's broad-based securities market index, the Fund's Adviser believes it is more reflective of the Fund's balanced investment style. |
| 2 | Please see the footnotes to the line graphs below for definitions of, and further information about, the S&P 500 Index, one of the Fund's broad-based securities market indices. The S&P 500's return for the 12-month reporting period was 5.61%. |
| 3 | Please see the footnotes to the line graphs below for definitions of, and further information about, the BAB, one of the Fund's broad-based securities market indices. The BAB's return for the 12-month reporting period was 5.94%. |
| 4 | Please see the footnotes to the line graphs below for definitions of, and further information about, the MA50-70. |
| 5 | The Russell 3000® Index measures the performance of the largest 3,000 U.S. companies representing approximately 98% of the investable U.S. equity market. The Russell 3000® Index is constructed to provide a comprehensive, unbiased and stable barometer of the broad market and is completely reconstituted annually to ensure new and growing equities are reflected. The index is unmanaged, and it is not possible to invest directly in an index. |
| 6 | The Russell Top 200® Index measures the performance of the largest cap segment of the U.S. equity universe. The Russell Top 200® Index is a subset of the Russell 3000® Index. It includes approximately 200 of the largest securities based on a combination of their market cap and current index membership and represents approximately 68% of the U.S. market. The Russell Top 200® Index is constructed to provide a comprehensive and unbiased barometer for this very large cap segment and is completely reconstituted annually to ensure new and growing equities are reflected. The index is unmanaged, and it is not possible to invest directly in an index. |
| 7 | The Russell Midcap® Index measures the performance of the mid-cap segment of the U.S. equity universe. The Russell Midcap® Index is a subset of the Russell 1000® Index. It includes approximately 800 of the smallest securities based on a combination of their market cap and current index membership. The Russell Midcap® Index represents approximately 31% of the total market capitalization of the Russell 1000® companies. The Russell Midcap® Index is constructed to provide a comprehensive and unbiased barometer for the mid-cap segment. The Russell Midcap Index is completely reconstituted annually to ensure larger stocks do not distort the performance and characteristics of the true mid-cap opportunity set. The index is unmanaged, and it is not possible to invest directly in an index. |
| 8 | The Russell 2000® Index measures the performance of the small-cap segment of the U.S. equity universe. The Russell 2000® Index is a subset of the Russell 3000® Index representing approximately 10% of the total market capitalization of that index. It includes approximately 2000 of the smallest securities based on a combination of their market cap and current index membership. The Russell 2000® Index is constructed to provide a comprehensive and unbiased small-cap barometer and is completely reconstituted annually to ensure larger stocks do not distort the performance and characteristics of the true small-cap opportunity set. The index is unmanaged, and it is not possible to invest directly in an index. |
| 9 | The Russell 3000® Value Index measures the performance of the broad value segment of U.S. equity value universe. It includes those Russell 3000® Index companies with lower price-to-book ratios and lower forecasted growth values. The Russell 3000® Value Index is constructed to provide a comprehensive, unbiased and stable barometer of the broad value market. The Russell 3000® Value Index is completely reconstituted annually to ensure new and growing equities are included and that the represented companies continue to reflect value characteristics. The index is unmanaged, and it is not possible to invest directly in an index. |
| 10 | The Russell 3000® Growth Index measures the performance of the broad growth segment of the U.S. equity universe. It includes those Russell 3000® Index companies with higher price-to-book ratios and higher forecasted growth values. The Russell 3000® Growth Index is constructed to provide a comprehensive, unbiased and stable barometer of the broad growth market. The Russell 3000® Growth Index is completely reconstituted annually to ensure new and growing equities are included and that the represented companies continue to reflect growth characteristics. The index is unmanaged, and it is not possible to invest directly in an index. |
| 11 | International investing involves special risks including currency risk, increased volatility of foreign securities, political risks and differences in auditing and other financial standards. |
| 12 | The MSCI EAFE Index is an equity index which captures large- and mid-cap representation across developed markets countries around the world, excluding the US and Canada. The index is unmanaged, and it is not possible to invest directly in an index. |
| 13 | Prices of emerging markets securities can be significantly more volatile than the prices of securities in developed countries, and currency risks and political risks are accentuated in emerging markets. |
| 14 | The MSCI Emerging Markets Index is an unmanaged index consisting of 23 emerging market countries. The index is unmanaged, and it is not possible to invest directly in an index. |
| 15 | The MSCI US REIT Index is a free float-adjusted market capitalization index that is comprised of equity REITs. It represents about 99% of the US REIT universe and securities are classified in the REIT sector according to the Global Industry Classification Standard (GICS®). It however excludes Mortgage REIT and selected Specialized REITs. The index is unmanaged, and it is not possible to invest directly in an index. |
| 16 | Bond prices are sensitive to changes in interest rates, and a rise in interest rates can cause a decline in their prices. |
| 17 | Investments in REITs involve special risks associated with an investment in real estate, such as limited liquidity and interest rate risks. |
| ■ | Total returns shown for Class C Shares include the maximum contingent deferred sales charge of 1.00% as applicable. |
| 1 Year | 5 Years | 10 Years | |
| Class A Shares | -5.85% | 6.44% | 3.92% |
| Class C Shares | -2.08% | 6.86% | 3.73% |
| Class R Shares6 | -0.59% | 7.31% | 4.13% |
| Institutional Shares | -0.07% | 7.93% | 4.77% |
| S&P 500 | 5.61% | 13.38% | 7.75% |
| BAB | 5.94% | 3.57% | 5.06% |
| Blended Index | 6.00% | 9.56% | 6.98% |
| MA50-70 | 1.86% | 6.94% | 5.49% |
| 1 | Represents a hypothetical investment of $10,000 in the Fund after deducting applicable sales charges: for Class A Shares, the maximum sales charge of 5.50% ($10,000 investment minus $550 sales charge = $9,450); for Class C Shares, a 1.00% contingent deferred sales charge would be applied on any redemption less than one year from the purchase date. The Fund's performance assumes the reinvestment of all dividends and distributions. The S&P 500 and BAB and MA50-70 have been adjusted to reflect reinvestment of dividends on securities in the indexes. |
| 2 | The Fund is the successor to the MDT Balanced Fund pursuant to a reorganization that took place on December 8, 2006. Prior to that date, the Fund had no investment operations. Accordingly, the performance information shown for periods prior to that date is that of the MDT Balanced Fund. |
| 3 | The S&P 500 Index, a broad-based securities market index of the Fund, is an unmanaged capitalization-weighted index of 500 stocks designed to measure performance of the broad domestic economy through changes in the aggregate market value of 500 stocks representing all major industries. The S&P 500 is unmanaged and, unlike the Fund, is not affected by cash flows. It is not possible to invest directly in an index. The S& P 500 is not adjusted to reflect sales charges, expenses or other fees that the Securities and Exchange Commission requires to be reflected in the Fund's performance. |
| 4 | The BAB Index, a broad-based securities market index of the Fund, is an unmanaged index composed of securities from the Barclay's Government/Corporate Bond Index, Mortgage-Backed Securities Index and the Asset-Backed Securities Index. Total return comprises price appreciation/depreciation and income as a percentage of the original investment. Indices are rebalanced monthly by market capitalization. The BAB is unmanaged and, unlike the Fund, is not affected by cash flows. It is not possible to invest directly in an index. The BAB is not adjusted to reflect sales charges, expenses or other fees that the Securities and Exchange Commission requires to be reflected in the Fund's performance. |
| 5 | Morningstar figures represent the average of the total returns reported by all the mutual funds designated by Morningstar as falling into the respective category indicated. Morningstar figures do not reflect sales charges. It is not possible to invest directly in an average. |
| 6 | The Fund's Class R Shares commenced operations on December 12, 2006. Performance results shown for the period prior to commencement of operations of the Class R Shares are for the Fund's Institutional Shares and have been adjusted for the total annual operating expenses applicable to Class R Shares. |
| Security Type | Percentage of Total Net Assets |
| Domestic Equity Securities | 48.8% |
| Corporate Debt Securities | 21.4% |
| Mortgage-Backed Securities2 | 8.0% |
| International Equity Securities (including International Exchange-Traded Funds) | 6.7% |
| Collateralized Mortgage Obligations | 3.4% |
| Asset-Backed Securities | 1.9% |
| Trade Finance Agreements | 1.9% |
| Floating Rate Loan | 1.5% |
| U.S. Treasury Securities3 | 1.2% |
| Commercial Mortgage-Backed Securities | 1.0% |
| Foreign Debt Securities | 0.4% |
| Municipal Bond | 0.1% |
| Derivative Contracts4,5 | (0.0)% |
| Other Security Types5,6 | 0.1% |
| Cash Equivalents7 | 6.1% |
| Other Assets and Liabilities—Net8 | (2.5)% |
| TOTAL | 100.0% |
| 1 | See the Fund's Prospectus for a description of the principal types of securities in which the Fund invests. As of the date specified above, the Fund owned shares of one or more affiliated investment companies. For purposes of this table, the affiliated investment company (other than an affiliated money market mutual fund) is not treated as a single portfolio security, but rather the Fund is treated as owning a pro rata portion of each security and each other asset and liability owned by the affiliated investment company. Accordingly, the percentages of total net assets shown in the table will differ from those presented on the Portfolio of Investments. |
| 2 | For purposes of this table, Mortgage-Backed Securities include mortgage-backed securities guaranteed by Government Sponsored Entities and adjustable rate mortgage-backed securities. |
| 3 | Also includes $179,205 held in U.S. Treasuries pledged as collateral to ensure the Fund is able to satisfy the obligations of its outstanding futures contracts. |
| 4 | Based upon net unrealized appreciation (depreciation) or value of the derivative contracts as applicable. Derivative contracts may consist of futures, forwards, options and swaps. The impact of a derivative contract on the Fund's performance may be larger than its unrealized appreciation (depreciation) or value may indicate. In many cases, the notional value or amount of a derivative contract may provide a better indication of the contract's significance to the portfolio. More complete information regarding the Fund's direct investments in derivative contracts, including unrealized appreciation (depreciation), value and notional values or amounts of such contracts, can be found in the table at the end of the Portfolio of Investments included in this Report. |
| 5 | Represents less than 0.1%. |
| 6 | Other Security Types consist of a domestic exchange-traded fund. |
| 7 | Cash Equivalents include any investments in money market mutual funds and/or overnight repurchase agreements. |
| 8 | Assets, other than investments in securities and derivative contracts, less liabilities. See Statement of Assets and Liabilities. |
| Industry Composition | Percentage of Total Net Assets |
| Insurance | 7.9% |
| Technology Hardware Storage & Peripherals | 6.1% |
| Real Estate Investment Trusts | 6.0% |
| Banks | 5.7% |
| Specialty Retail | 5.0% |
| Health Care Providers & Services | 4.6% |
| Food Products | 4.3% |
| Oil Gas & Consumable Fuels | 4.3% |
| Biotechnology | 4.1% |
| Health Care Equipment & Supplies | 4.0% |
| Multiline Retail | 4.0% |
| Internet Software & Services | 3.7% |
| Machinery | 3.0% |
| Diversified Telecommunication Services | 2.9% |
| Software | 2.9% |
| Airlines | 2.3% |
| Electronic Equipment Instruments & Components | 2.3% |
| Food & Staples Retailing | 2.3% |
| Media | 2.1% |
| Auto Components | 2.0% |
| Pharmaceuticals | 1.9% |
| Chemicals | 1.7% |
| Communications Equipment | 1.7% |
| Aerospace & Defense | 1.4% |
| Consumer Finance | 1.3% |
| Multi-Utilities | 1.3% |
| Household Durables | 1.2% |
| Beverages | 1.1% |
| Capital Markets | 1.1% |
| Hotels Restaurants & Leisure | 1.1% |
| Semiconductors & Semiconductor Equipment | 1.0% |
| Other10 | 5.7% |
| TOTAL | 100.0% |
| 9 | Industry classifications are based upon, and individual portfolio securities are assigned to, the classifications of the Global Industry Classification Standard (GICS) except that the Adviser assigns a classification to securities not classified by the GICS and to securities for which the Adviser does not have access to the classification made by the GICS. |
| 10 | For purposes of this table, industry classifications which constitute less than 1.0% of the Fund's equity securities have been aggregated under the designation “Other.” |
| Principal Amount or Shares | Value | ||
| COMMON STOCKS—50.5% | |||
| Aerospace & Defense—0.7% | |||
| 2,557 | General Dynamics Corp. | $375,598 | |
| 1,670 | Huntington Ingalls Industries, Inc. | 288,209 | |
| 6,598 | 1 | Spirit Aerosystems Holdings, Inc., Class A | 286,221 |
| TOTAL | 950,028 | ||
| Air Freight & Logistics—0.2% | |||
| 2,035 | 1 | Atlas Air Worldwide Holdings, Inc. | 87,973 |
| 976 | FedEx Corp. | 158,014 | |
| TOTAL | 245,987 | ||
| Airlines—1.1% | |||
| 4,853 | Alaska Air Group, Inc. | 326,219 | |
| 12,530 | Delta Air Lines, Inc. | 485,538 | |
| 3,004 | 1 | Jet Blue Airways Corp. | 55,063 |
| 14,845 | Southwest Airlines Co. | 549,413 | |
| 3,691 | 1 | United Continental Holdings, Inc. | 173,071 |
| TOTAL | 1,589,304 | ||
| Auto Components—1.0% | |||
| 645 | 1 | Cooper-Standard Holding, Inc. | 56,792 |
| 13,840 | Goodyear Tire & Rubber Co. | 396,793 | |
| 1,454 | Johnson Controls, Inc. | 66,767 | |
| 7,475 | Lear Corp. | 848,039 | |
| TOTAL | 1,368,391 | ||
| Automobiles—0.2% | |||
| 24,635 | Ford Motor Co. | 311,879 | |
| Banks—2.9% | |||
| 11,267 | Bank of America Corp. | 163,259 | |
| 20,900 | Fifth Third Bancorp | 396,682 | |
| 13,300 | Huntington Bancshares, Inc. | 126,350 | |
| 25,470 | JPMorgan Chase & Co. | 1,629,316 | |
| 16,358 | KeyCorp | 191,389 | |
| 9,653 | PNC Financial Services Group | 797,820 | |
| 6,300 | Popular, Inc. | 212,247 | |
| 10,542 | SunTrust Banks, Inc. | 445,821 | |
| TOTAL | 3,962,884 |
| Principal Amount or Shares | Value | ||
| COMMON STOCKS—continued | |||
| Beverages—0.5% | |||
| 987 | Constellation Brands, Inc., Class A | $162,490 | |
| 1,095 | Dr. Pepper Snapple Group, Inc. | 107,869 | |
| 4,296 | PepsiCo, Inc. | 467,920 | |
| TOTAL | 738,279 | ||
| Biotechnology—2.1% | |||
| 10,082 | Amgen, Inc. | 1,734,406 | |
| 8,894 | Gilead Sciences, Inc. | 706,806 | |
| 3,678 | 1 | United Therapeutics Corp. | 445,075 |
| TOTAL | 2,886,287 | ||
| Capital Markets—0.5% | |||
| 3,256 | Ameriprise Financial, Inc. | 312,055 | |
| 11,075 | The Bank of New York Mellon Corp. | 436,355 | |
| TOTAL | 748,410 | ||
| Chemicals—0.8% | |||
| 3,606 | Celanese Corp. | 228,692 | |
| 1,792 | Eastman Chemical Co. | 116,892 | |
| 10,822 | LyondellBasell Industries NV, Class A | 814,464 | |
| TOTAL | 1,160,048 | ||
| Commercial Services—0.4% | |||
| 1,162 | Deluxe Corp. | 78,540 | |
| 7,600 | Donnelley (R.R.) & Sons Co. | 136,192 | |
| 1,032 | Ennis Business Forms, Inc. | 17,874 | |
| 10,000 | Pitney Bowes, Inc. | 193,100 | |
| 989 | Waste Management, Inc. | 65,393 | |
| TOTAL | 491,099 | ||
| Communications Equipment—0.8% | |||
| 12,728 | Cisco Systems, Inc. | 388,586 | |
| 23,286 | Juniper Networks, Inc. | 528,359 | |
| 3,480 | Motorola Solutions, Inc. | 241,443 | |
| TOTAL | 1,158,388 | ||
| Construction & Engineering—0.2% | |||
| 1,991 | 1 | Dycom Industries, Inc. | 187,253 |
| 2,778 | 1 | Jacobs Engineering Group, Inc. | 148,679 |
| TOTAL | 335,932 | ||
| Consumer Finance—0.6% | |||
| 8,000 | Ally Financial, Inc. | 144,320 | |
| 5,387 | Discover Financial Services | 306,197 |
| Principal Amount or Shares | Value | ||
| COMMON STOCKS—continued | |||
| Consumer Finance—continued | |||
| 17,976 | Navient Corp. | $255,259 | |
| 6,104 | Synchrony Financial | 170,180 | |
| TOTAL | 875,956 | ||
| Diversified Consumer Services—0.0% | |||
| 1,500 | DeVry Education Group, Inc. | 33,405 | |
| Diversified Financial Services—0.1% | |||
| 437 | MarketAxess Holdings, Inc. | 70,645 | |
| Diversified Telecommunication Services—1.5% | |||
| 40,241 | CenturyLink, Inc. | 1,265,177 | |
| 13,380 | Verizon Communications | 741,386 | |
| TOTAL | 2,006,563 | ||
| Electric Utility—0.1% | |||
| 859 | NextEra Energy, Inc. | 110,201 | |
| Electrical Equipment—0.2% | |||
| 947 | Acuity Brands, Inc., Holding Company | 248,521 | |
| Electronic Equipment Instruments & Components—1.2% | |||
| 2,726 | Avnet, Inc. | 112,039 | |
| 2,387 | CDW Corp. | 102,474 | |
| 1,900 | 1 | Insight Enterprises, Inc. | 50,540 |
| 7,000 | 1 | Sanmina Corp. | 177,380 |
| 11,300 | 1 | Tech Data Corp. | 880,609 |
| 22,000 | Vishay Intertechnology, Inc. | 293,260 | |
| TOTAL | 1,616,302 | ||
| Energy Equipment & Services—0.3% | |||
| 2,493 | Archrock, Inc. | 22,213 | |
| 9,781 | Ensco PLC | 89,692 | |
| 3,838 | National Oilwell Varco, Inc. | 124,159 | |
| 10,600 | Noble Corp. PLC | 78,228 | |
| 3,698 | Rowan Companies PLC | 56,357 | |
| TOTAL | 370,649 | ||
| Food & Staples Retailing—1.2% | |||
| 36,694 | Kroger Co. | 1,254,568 | |
| 4,852 | Walgreens Boots Alliance, Inc. | 384,521 | |
| TOTAL | 1,639,089 | ||
| Food Products—2.2% | |||
| 2,708 | Cal-Maine Foods, Inc. | 113,465 | |
| 984 | Campbell Soup Co. | 61,274 |
| Principal Amount or Shares | Value | ||
| COMMON STOCKS—continued | |||
| Food Products—continued | |||
| 3,483 | Dean Foods Co. | $64,296 | |
| 4,289 | Fresh Del Monte Produce, Inc. | 243,830 | |
| 2,006 | Ingredion, Inc. | 267,279 | |
| 8,300 | Pilgrims Pride Corp. | 192,975 | |
| 2,100 | Sanderson Farms, Inc. | 183,939 | |
| 8,826 | Smucker (J.M.) Co. | 1,360,616 | |
| 6,731 | Tyson Foods, Inc., Class A | 495,402 | |
| TOTAL | 2,983,076 | ||
| Health Care Equipment & Supplies—2.0% | |||
| 1,081 | 1 | Abiomed, Inc. | 127,526 |
| 31,500 | Baxter International, Inc. | 1,512,630 | |
| 8,568 | 1 | Edwards Lifesciences Corp. | 981,207 |
| 5,137 | 1 | Hologic, Inc. | 197,723 |
| TOTAL | 2,819,086 | ||
| Health Care Providers & Services—2.3% | |||
| 3,287 | Aetna, Inc. | 378,695 | |
| 7,453 | Anthem, Inc. | 978,877 | |
| 15,524 | 1 | Community Health Systems, Inc. | 198,242 |
| 11,231 | 1 | Express Scripts Holding Co. | 854,342 |
| 9,307 | 1 | HCA Holdings, Inc. | 717,849 |
| 465 | UnitedHealth Group, Inc. | 66,588 | |
| TOTAL | 3,194,593 | ||
| Hotels Restaurants & Leisure—0.6% | |||
| 517 | Cracker Barrel Old Country Store, Inc. | 81,381 | |
| 2,333 | McDonald's Corp. | 274,478 | |
| 6,115 | Wyndham Worldwide Corp. | 434,287 | |
| TOTAL | 790,146 | ||
| Household Durables—0.6% | |||
| 2,483 | D.R. Horton, Inc. | 81,641 | |
| 745 | 1 | Helen of Troy Ltd. | 74,209 |
| 835 | Libbey, Inc. | 15,606 | |
| 333 | 1 | Mohawk Industries, Inc. | 69,577 |
| 5,423 | Tupperware Brands Corp. | 339,914 | |
| 1,171 | Whirlpool Corp. | 225,254 | |
| TOTAL | 806,201 | ||
| Independent Power and Renewable Electricity Producers—0.1% | |||
| 15,600 | AES Corp. | 192,660 |
| Principal Amount or Shares | Value | ||
| COMMON STOCKS—continued | |||
| Industrial Conglomerates—0.0% | |||
| 621 | Carlisle Cos., Inc. | $64,143 | |
| Insurance—4.0% | |||
| 22,851 | Aflac, Inc. | 1,651,670 | |
| 13,907 | Assured Guaranty Ltd. | 372,569 | |
| 1,244 | Everest Re Group Ltd. | 235,128 | |
| 213 | 1 | Markel Corp. | 202,084 |
| 18,472 | Prudential Financial | 1,390,757 | |
| 14,182 | The Travelers Cos., Inc. | 1,648,232 | |
| TOTAL | 5,500,440 | ||
| Internet Software & Services—1.9% | |||
| 54,478 | 1 | eBay, Inc. | 1,697,535 |
| 7,397 | 1 | Facebook, Inc. | 916,784 |
| TOTAL | 2,614,319 | ||
| IT Services—0.3% | |||
| 833 | Accenture PLC | 93,971 | |
| 10,000 | Western Union Co. | 200,000 | |
| 14,300 | Xerox Corp. | 147,290 | |
| TOTAL | 441,261 | ||
| Machinery—1.5% | |||
| 2,951 | AGCO Corp. | 142,120 | |
| 9,017 | Allison Transmission Holdings, Inc. | 259,870 | |
| 15,401 | 1 | Colfax Corp. | 452,174 |
| 26,951 | Joy Global, Inc. | 744,656 | |
| 10,666 | 1 | SPX Corp. | 161,483 |
| 15,300 | Trinity Industries, Inc. | 355,113 | |
| TOTAL | 2,115,416 | ||
| Media—1.0% | |||
| 5,186 | CBS Corp., Class B | 270,813 | |
| 28,128 | 1 | MSG Networks, Inc. | 451,454 |
| 852 | Time Warner, Inc. | 65,306 | |
| 14,600 | Viacom, Inc., Class B - New | 663,862 | |
| TOTAL | 1,451,435 | ||
| Multi-Utilities—0.7% | |||
| 35,274 | NiSource, Inc. | 905,131 | |
| Multiline Retail—2.0% | |||
| 2,400 | Big Lots, Inc. | 127,632 | |
| 2,169 | Dillards, Inc., Class A | 146,798 |
| Principal Amount or Shares | Value | ||
| COMMON STOCKS—continued | |||
| Multiline Retail—continued | |||
| 13,170 | Kohl's Corp. | $547,740 | |
| 18,284 | Macy's, Inc. | 655,116 | |
| 17,300 | Target Corp. | 1,303,209 | |
| TOTAL | 2,780,495 | ||
| Oil Gas & Consumable Fuels—2.2% | |||
| 523 | Cimarex Energy Co. | 62,770 | |
| 3,188 | Exxon Mobil Corp. | 283,573 | |
| 8,120 | HollyFrontier Corp. | 206,410 | |
| 3,253 | Kinder Morgan, Inc. | 66,133 | |
| 5,229 | Occidental Petroleum Corp. | 390,763 | |
| 7,397 | Tesoro Petroleum Corp. | 563,282 | |
| 27,767 | Valero Energy Corp. | 1,451,659 | |
| TOTAL | 3,024,590 | ||
| Paper & Forest Products—0.1% | |||
| 3,600 | Domtar Corp. | 141,732 | |
| Personal Products—0.3% | |||
| 9,700 | Avon Products, Inc. | 39,479 | |
| 3,095 | 1 | Herbalife Ltd. | 210,491 |
| 3,147 | Nu Skin Enterprises, Inc. | 168,050 | |
| TOTAL | 418,020 | ||
| Pharmaceuticals—1.0% | |||
| 36,776 | Pfizer, Inc. | 1,356,667 | |
| Real Estate Investment Trusts—3.0% | |||
| 5,500 | American Campus Communities, Inc. | 297,385 | |
| 2,500 | American Tower Corp. | 289,425 | |
| 900 | Avalonbay Communities, Inc. | 167,085 | |
| 13,000 | Blackstone Mortgage Trust, Inc., Class A | 377,130 | |
| 1,500 | Coresite Realty Corp., REIT | 123,795 | |
| 4,000 | CubeSmart, REIT | 118,840 | |
| 2,600 | DCT Industrial Trust, Inc. | 130,572 | |
| 1,600 | Digital Realty Trust, Inc. | 167,136 | |
| 4,500 | Douglas Emmett, Inc. | 171,180 | |
| 2,900 | EastGroup Properties, Inc. | 213,498 | |
| 450 | Equinix, Inc. | 167,791 | |
| 3,100 | Equity Lifestyle Properties, Inc. | 254,944 | |
| 1,300 | Extra Space Storage, Inc. | 111,826 | |
| 2,400 | Mid-American Apartment Communities, Inc. | 254,448 |
| Principal Amount or Shares | Value | ||
| COMMON STOCKS—continued | |||
| Real Estate Investment Trusts—continued | |||
| 28,000 | New Residential Investment Corp. | $382,760 | |
| 6,000 | Retail Opportunity Investments Corp. | 136,980 | |
| 1,300 | Simon Property Group, Inc. | 295,152 | |
| 2,000 | Vornado Realty Trust | 214,800 | |
| 10,250 | Weyerhaeuser Co. | 335,380 | |
| TOTAL | 4,210,127 | ||
| Real Estate Management & Development—0.0% | |||
| 763 | 1 | Altisource Portfolio Solutions S.A. | 17,747 |
| Semiconductors & Semiconductor Equipment—0.5% | |||
| 1,333 | 1 | Advanced Energy Industries, Inc. | 54,280 |
| 18,461 | Intel Corp. | 643,550 | |
| TOTAL | 697,830 | ||
| Software—1.5% | |||
| 12,270 | CA, Inc. | 425,156 | |
| 17,201 | 1 | Citrix Systems, Inc. | 1,533,125 |
| 4,307 | 1 | Nuance Communications, Inc. | 69,213 |
| TOTAL | 2,027,494 | ||
| Specialty Retail—2.5% | |||
| 5,200 | Abercrombie & Fitch Co., Class A | 107,692 | |
| 7,113 | Bed Bath & Beyond, Inc. | 319,730 | |
| 5,221 | Best Buy Co., Inc. | 175,426 | |
| 1,200 | Children's Place, Inc./The | 100,296 | |
| 939 | Foot Locker, Inc. | 55,983 | |
| 4,854 | GNC Holdings, Inc. | 99,070 | |
| 7,400 | GameStop Corp. | 229,030 | |
| 15,027 | Gap (The), Inc. | 387,546 | |
| 3,800 | Guess ?, Inc. | 55,936 | |
| 2,608 | Home Depot, Inc. | 360,530 | |
| 826 | Lowe's Cos., Inc. | 67,963 | |
| 989 | 1 | Murphy USA, Inc. | 75,797 |
| 2,175 | 1 | O'Reilly Automotive, Inc. | 632,120 |
| 826 | Outerwall, Inc. | 43,497 | |
| 2,300 | Rent-A-Center, Inc. | 24,840 | |
| 3,900 | 1 | Sally Beauty Holdings, Inc. | 114,387 |
| 13,300 | Staples, Inc. | 123,557 | |
| 1,917 | 1 | Ulta Salon Cosmetics & Fragrance, Inc. | 500,740 |
| Principal Amount or Shares | Value | ||
| COMMON STOCKS—continued | |||
| Specialty Retail—continued | |||
| 1,135 | 1 | Zumiez, Inc. | $19,272 |
| TOTAL | 3,493,412 | ||
| Technology Hardware Storage & Peripherals—3.1% | |||
| 6,503 | Apple, Inc. | 677,678 | |
| 118,713 | 1 | HP, Inc. | 1,663,169 |
| 10,416 | International Business Machines Corp. | 1,673,018 | |
| 10,850 | NetApp, Inc. | 285,897 | |
| TOTAL | 4,299,762 | ||
| Textiles Apparel & Luxury Goods—0.4% | |||
| 3,861 | 1 | Fossil Group, Inc. | 122,007 |
| 3,200 | PVH Corp. | 323,392 | |
| 7,184 | 1 | Skechers USA, Inc., Class A | 172,560 |
| TOTAL | 617,959 | ||
| Trading Companies & Distributors—0.1% | |||
| 1,176 | 1 | United Rentals, Inc. | 93,692 |
| 321 | W.W. Grainger, Inc. | 70,251 | |
| TOTAL | 163,943 | ||
| TOTAL COMMON STOCKS (IDENTIFIED COST $68,878,392) | 70,045,932 | ||
| ASSET-BACKED SECURITIES—1.0% | |||
| Auto Receivables—0.3% | |||
| $300,000 | BMW Vehicle Trust 2014-1, Class A4, 0.990%, 08/21/2017 | 300,057 | |
| 22,571 | CS First Boston Mortgage Securities Corp. 2002-HE4, Class AF, 5.510%, 08/25/2032 | 26,405 | |
| 25,000 | Santander Drive Auto Receivables Trust 2013-1, Class D, 2.270%, 01/15/2019 | 25,112 | |
| 100,000 | Santander Drive Auto Receivables Trust 2016-2, Class C, 2.660%, 11/15/2021 | 101,644 | |
| TOTAL | 453,218 | ||
| Credit Card—0.6% | |||
| 350,000 | Capital One Multi-Asset Execution Trust 2004-B3, Class B3, 1.211%, 01/18/2022 | 350,082 | |
| 250,000 | Citibank Credit Card Issuance Trust 2014-A2, Class A2, 1.020%, 02/22/2019 | 250,117 | |
| 300,000 | 2,3 | Penarth Master Issuer 2015-1A, Class A1, 0.882%, 03/18/2019 | 299,314 |
| TOTAL | 899,513 |
| Principal Amount or Shares | Value | ||
| ASSET-BACKED SECURITIES—continued | |||
| Other—0.1% | |||
| $100,000 | Navient Student Loan Trust 2014-1, Class A2, 0.797%, 03/27/2023 | $99,543 | |
| TOTAL ASSET-BACKED SECURITIES (IDENTIFIED COST $1,448,837) | 1,452,274 | ||
| COLLATERALIZED MORTGAGE OBLIGATIONS—2.6% | |||
| Commercial Mortgage—2.6% | |||
| 170,000 | Banc of America Commercial Mortgage Trust 2016-UBS10, Class A4, 3.170%, 6/15/2049 | 181,416 | |
| 744 | 4 | Bear Stearns Mortgage Securities, Inc. 1997-6, Class 1A, 6.297%, 3/25/2031 | 763 |
| 200,000 | Citigroup Commercial Mortgage Trust 2013-GC11, Class B, 3.732%, 4/10/2046 | 212,406 | |
| 350,000 | Citigroup Commercial Mortgage Trust 2015-GC33, Class AS, 4.114%, 9/10/2058 | 392,671 | |
| 70,000 | Commercial Mortgage Pass-Through Certificates 2012-CR1, Class AM, 3.912%, 5/15/2045 | 76,839 | |
| 125,000 | Commercial Mortgage Pass-Through Certificates 2012-CR1, Class B, 4.612%, 5/15/2045 | 140,360 | |
| 200,000 | 2,3 | Commercial Mortgage Trust 2013-CR8, Class B, 3.964%, 6/10/2046 | 217,648 |
| 200,000 | Commercial Mortgage Trust 2014-LC17, Class B, 4.490%, 10/10/2047 | 224,445 | |
| 300,000 | Commercial Mortgage Trust 2015-DC1, Class AM, 3.724%, 2/10/2048 | 322,929 | |
| 200,000 | 2,3 | FREMF Mortgage Trust 2013-K25, Class B, 3.743%, 11/25/2045 | 209,210 |
| 2,229 | Federal Home Loan Mortgage Corp. REMIC 1311 K, 7.000%, 7/15/2022 | 2,418 | |
| 4,418 | Federal Home Loan Mortgage Corp. REMIC 1384 D, 7.000%, 9/15/2022 | 4,855 | |
| 7,747 | Federal Home Loan Mortgage Corp. REMIC 2497 JH, 6.000%, 9/15/2032 | 8,861 | |
| 79,777 | Federal Home Loan Mortgage Corp., 2.263%, 4/24/2025 | 82,235 | |
| 300,000 | Federal Home Loan Mortgage Corp., 2.566%, 9/25/2020 | 311,686 | |
| 9,671 | Federal National Mortgage Association REMIC 1993-113 SB, 9.749%, 7/25/2023 | 10,706 | |
| 1,885 | Federal National Mortgage Association REMIC 2003-35 UC, 3.750%, 5/25/2033 | 1,986 | |
| 100,000 | GS Mortgage Securities Corp. II 2012-GCJ7 AS, 4.085%, 5/10/2045 | 109,741 | |
| 135,000 | GS Mortgage Securities Corp. II 2012-GCJ7 B, 4.740%, 5/10/2045 | 151,192 | |
| 7,953 | Government National Mortgage Association REMIC 2002-17 B, 6.000%, 3/20/2032 | 9,015 | |
| 100,000 | Merrill Lynch Mortgage Trust 2008-C1, Class AM, 6.263%, 2/12/2051 | 105,116 | |
| 50,000 | Morgan Stanley Capital I 2007-IQ16, Class AM, 6.052%, 12/12/2049 | 52,142 | |
| 100,000 | Morgan Stanley Capital I 2012-C4, Class AS, 3.773%, 3/15/2045 | 107,522 |
| Principal Amount or Shares | Value | ||
| COLLATERALIZED MORTGAGE OBLIGATIONS—continued | |||
| Commercial Mortgage—continued | |||
| $150,000 | 2,3 | UBS-Barclays Commercial Mortgage Trust 2013-C6, Class B, 3.875%, 4/10/2046 | $160,469 |
| 25,000 | WF-RBS Commercial Mortgage Trust 2012-C6, Class B, 4.697%, 4/15/2045 | 28,059 | |
| 300,000 | WF-RBS Commercial Mortgage Trust 2014-C25, Class AS, 3.984%, 11/15/2047 | 334,203 | |
| 150,000 | WF-RBS Commercial Mortgage Trust 2014-C25, Class B, 4.236%, 11/15/2047 | 164,281 | |
| TOTAL COLLATERALIZED MORTGAGE OBLIGATIONS (IDENTIFIED COST $3,438,595) | 3,623,174 | ||
| CORPORATE BONDS—16.9% | |||
| Basic Industry - Chemicals—0.1% | |||
| 35,000 | 2,3 | Incitec Pivot Finance LLC, Company Guarantee, Series 144A, 6.000%, 12/10/2019 | 37,932 |
| 70,000 | RPM International, Inc., 6.500%, 02/15/2018 | 74,902 | |
| 20,000 | RPM International, Inc., Sr. Unsecd. Note, 6.125%, 10/15/2019 | 22,252 | |
| 22,000 | Rohm & Haas Co., 6.000%, 09/15/2017 | 23,079 | |
| TOTAL | 158,165 | ||
| Basic Industry - Metals & Mining—0.5% | |||
| 100,000 | Alcoa, Inc., 5.870%, 02/23/2022 | 108,250 | |
| 15,000 | Anglogold Ashanti Holdings PLC, Sr. Note, 6.500%, 04/15/2040 | 15,300 | |
| 100,000 | Anglogold Ashanti Holdings PLC, Sr. Unsecd. Note, 5.125%, 08/01/2022 | 103,372 | |
| 62,000 | Carpenter Technology Corp., Sr. Unsecd. Note, 4.450%, 03/01/2023 | 61,229 | |
| 40,000 | Carpenter Technology Corp., Sr. Unsecd. Note, 5.200%, 07/15/2021 | 40,997 | |
| 20,000 | 2,3 | Newcrest Finance Property Ltd., Sr. Unsecd. Note, Series 144A, 4.200%, 10/01/2022 | 20,623 |
| 100,000 | Reliance Steel & Aluminum Co., Sr. Unsecd. Note, 4.500%, 04/15/2023 | 103,944 | |
| 20,000 | Southern Copper Corp., Note, 6.750%, 04/16/2040 | 21,749 | |
| 160,000 | Worthington Industries, Inc., Sr. Unsecd. Note, 6.500%, 04/15/2020 | 175,958 | |
| TOTAL | 651,422 | ||
| Basic Industry - Paper—0.0% | |||
| 10,000 | Plum Creek Timberlands LP, Sr. Unsecd. Note, 3.250%, 03/15/2023 | 10,074 | |
| 20,000 | Plum Creek Timberlands LP, Sr. Unsecd. Note, 4.700%, 03/15/2021 | 21,743 | |
| TOTAL | 31,817 | ||
| Capital Goods - Aerospace & Defense—0.3% | |||
| 211,000 | 2,3 | Embraer Overseas Ltd., Sr. Unsecd. Note, Series 144A, 5.696%, 09/16/2023 | 224,188 |
| 20,000 | Raytheon Co., Sr. Note, 4.400%, 02/15/2020 | 22,167 |
| Principal Amount or Shares | Value | ||
| CORPORATE BONDS—continued | |||
| Capital Goods - Aerospace & Defense—continued | |||
| $10,000 | Rockwell Collins, Inc., Sr. Unsecd. Note, 3.100%, 11/15/2021 | $10,568 | |
| 40,000 | 2,3 | Textron Financial Corp., Jr. Sub. Note, Series 144A, 6.000%, 2/15/2067 | 25,400 |
| 50,000 | Textron, Inc., Sr. Unsecd. Note, 4.000%, 03/15/2026 | 53,504 | |
| 50,000 | Textron, Inc., Sr. Unsecd. Note, 4.300%, 03/01/2024 | 54,143 | |
| TOTAL | 389,970 | ||
| Capital Goods - Building Materials—0.1% | |||
| 80,000 | Masco Corp., Sr. Unsecd. Note, 4.375%, 04/01/2026 | 85,600 | |
| Capital Goods - Construction Machinery—0.0% | |||
| 40,000 | AGCO Corp., Sr. Unsecd. Note, 5.875%, 12/01/2021 | 43,952 | |
| Capital Goods - Diversified Manufacturing—0.3% | |||
| 15,000 | Avery Dennison Corp., Sr. Unsecd. Note, 5.375%, 04/15/2020 | 16,431 | |
| 30,000 | General Electric Capital, Sr. Unsecd. Note, Series GMTN, 3.100%, 01/09/2023 | 32,121 | |
| 200,000 | General Electric Co., Sr. Unsecd. Note, 4.125%, 10/09/2042 | 225,949 | |
| 80,000 | Hubbell, Inc., 5.950%, 06/01/2018 | 86,433 | |
| 50,000 | Pentair, Ltd., Company Guarantee, 5.000%, 05/15/2021 | 53,922 | |
| 15,000 | Thomas & Betts Corp., Sr. Unsecd. Note, 5.625%, 11/15/2021 | 17,473 | |
| 14,000 | Valmont Industries, Inc., Sr. Unsecd. Note, 6.625%, 04/20/2020 | 15,969 | |
| TOTAL | 448,298 | ||
| Capital Goods - Environmental—0.1% | |||
| 85,000 | Republic Services, Inc., Company Guarantee, 5.500%, 9/15/2019 | 95,191 | |
| Capital Goods - Packaging—0.0% | |||
| 45,000 | Packaging Corp. of America, Sr. Unsecd. Note, 3.900%, 06/15/2022 | 48,036 | |
| 10,000 | Rock-Tenn Co., Sr. Unsecd. Note, 4.000%, 03/01/2023 | 10,583 | |
| 10,000 | Rock-Tenn Co., Sr. Unsecd. Note, 4.450%, 03/01/2019 | 10,579 | |
| TOTAL | 69,198 | ||
| Communications - Cable & Satellite—0.3% | |||
| 200,000 | 2,3 | CCO Safari II LLC, Term Loan—1st Lien, Series 144A, 4.908%, 07/23/2025 | 221,301 |
| 90,000 | NBC Universal, Inc., Sr. Unsecd. Note, 5.150%, 04/30/2020 | 102,585 | |
| 30,000 | Time Warner Cable, Inc., Company Guarantee, 8.250%, 04/01/2019 | 34,855 | |
| TOTAL | 358,741 | ||
| Communications - Media & Entertainment—0.7% | |||
| 75,000 | 21st Century Fox America, Inc., 8.000%, 10/17/2016 | 76,054 | |
| 75,000 | 21st Century Fox America, Inc., Sr. Unsecd. Note, 5.400%, 10/01/2043 | 91,548 | |
| 80,000 | Discovery Communications, Sr. Unsecd. Note, 4.900%, 03/11/2026 | 86,640 | |
| 30,000 | Grupo Televisa S.A., Sr. Unsecd. Note, 6.125%, 01/31/2046 | 35,039 |
| Principal Amount or Shares | Value | ||
| CORPORATE BONDS—continued | |||
| Communications - Media & Entertainment—continued | |||
| $30,000 | Interpublic Group of Cos., Inc., Sr. Unsecd. Note, 2.250%, 11/15/2017 | $30,249 | |
| 25,000 | Moody's Corp., Sr. Unsecd. Note, 5.500%, 09/01/2020 | 28,357 | |
| 250,000 | Omnicom Group, Inc., Sr. Unsecd. Note, 3.600%, 04/15/2026 | 266,515 | |
| 20,000 | Omnicom Group, Inc., Sr. Unsecd. Note, 3.625%, 05/01/2022 | 21,504 | |
| 30,000 | Viacom, Inc., 2.500%, 09/01/2018 | 30,445 | |
| 25,000 | Viacom, Inc., Sr. Unsecd. Note, 2.500%, 12/15/2016 | 25,108 | |
| 100,000 | Viacom, Inc., Sr. Unsecd. Note, 3.875%, 04/01/2024 | 102,896 | |
| 150,000 | WPP Finance 2010, Sr. Unsecd. Note, 5.625%, 11/15/2043 | 181,315 | |
| TOTAL | 975,670 | ||
| Communications - Telecom Wireless—0.3% | |||
| 100,000 | American Tower Corp., Sr. Unsecd. Note, 3.400%, 02/15/2019 | 104,792 | |
| 50,000 | American Tower Corp., Sr. Unsecd. Note, 4.500%, 01/15/2018 | 52,274 | |
| 150,000 | Crown Castle International Corp., Sr. Unsecd. Note, 3.700%, 06/15/2026 | 158,372 | |
| 90,000 | Telefonaktiebolaget LM Ericsson, Sr. Unsecd. Note, 4.125%, 05/15/2022 | 97,675 | |
| TOTAL | 413,113 | ||
| Communications - Telecom Wirelines—0.2% | |||
| 10,000 | CenturyLink, Inc., Sr. Unsecd. Note, 7.650%, 3/15/2042 | 9,000 | |
| 90,000 | Verizon Communications, Inc., Sr. Unsecd. Note, 4.150%, 03/15/2024 | 100,444 | |
| 175,000 | Verizon Communications, Inc., Sr. Unsecd. Note, 5.150%, 09/15/2023 | 205,524 | |
| TOTAL | 314,968 | ||
| Consumer Cyclical - Automotive—0.9% | |||
| 175,000 | American Honda Finance Co., Series MTN, 0.843%, 7/14/2017 | 175,063 | |
| 175,000 | American Honda Finance Co., Unsecd. Deb., Series MTN, 2.250%, 8/15/2019 | 180,527 | |
| 10,000 | DaimlerChrysler North America Holding Corp., Company Guarantee, 8.500%, 01/18/2031 | 16,689 | |
| 100,000 | Ford Motor Co., Sr. Unsecd. Note, 4.750%, 01/15/2043 | 110,600 | |
| 200,000 | Ford Motor Credit Co., Sr. Unsecd. Note, 3.336%, 03/18/2021 | 208,930 | |
| 150,000 | General Motors Financial Co., Inc., Sr. Unsecd. Note, 3.100%, 01/15/2019 | 153,438 | |
| 160,000 | General Motors Financial Co., Sr. Unsecd. Note, 3.200%, 07/06/2021 | 162,648 | |
| 10,000 | 2,3 | Harley-Davidson Financial Services, Inc., Sr. Unsecd. Note, Series 144A, 2.700%, 03/15/2017 | 10,084 |
| 100,000 | 2,3 | Hyundai Capital America, Sr. Unsecd. Note, Series 144A, 2.875%, 08/09/2018 | 102,458 |
| 65,000 | 2,3 | RCI Banque SA, Sr. Unsecd. Note, Series 144A, 3.500%, 4/03/2018 | 67,238 |
| TOTAL | 1,187,675 |
| Principal Amount or Shares | Value | ||
| CORPORATE BONDS—continued | |||
| Consumer Cyclical - Leisure—0.2% | |||
| $200,000 | 2 | Football Trust V, Pass Thru Cert., Series 144A, 5.350%, 10/05/2020 | $221,635 |
| Consumer Cyclical - Lodging—0.1% | |||
| 30,000 | Hyatt Hotels Corp., Sr. Unsecd. Note, 3.375%, 07/15/2023 | 31,333 | |
| 110,000 | Hyatt Hotels Corp., Sr. Unsecd. Note, 4.850%, 03/15/2026 | 122,770 | |
| 50,000 | Marriott International, Inc., Sr. Unsecd. Note, 3.000%, 03/01/2019 | 51,742 | |
| TOTAL | 205,845 | ||
| Consumer Cyclical - Retailers—0.9% | |||
| 50,000 | Advance Auto Parts, Inc., 4.500%, 12/01/2023 | 54,398 | |
| 40,000 | AutoZone, Inc., Sr. Unsecd. Note, 3.125%, 04/21/2026 | 41,807 | |
| 250,000 | AutoZone, Inc., Sr. Unsecd. Note, 3.250%, 04/15/2025 | 262,481 | |
| 175,000 | CVS Health Corp., Sr. Unsecd. Note, 2.875%, 06/01/2026 | 180,584 | |
| 160,000 | Dollar General Corp., Sr. Unsecd. Note, 4.150%, 11/01/2025 | 177,691 | |
| 10,000 | O'Reilly Automotive, Inc., Company Guarantee, 4.875%, 01/14/2021 | 11,141 | |
| 80,000 | Under Armour, Inc., Sr. Unsecd. Note, 3.250%, 06/15/2026 | 81,642 | |
| 35,000 | Wal-Mart Stores, Inc., Sr. Unsecd. Note, 3.300%, 04/22/2024 | 38,741 | |
| 300,000 | Wal-Mart Stores, Inc., Sr. Unsecd. Note, 4.300%, 04/22/2044 | 360,476 | |
| TOTAL | 1,208,961 | ||
| Consumer Cyclical - Services—0.1% | |||
| 65,000 | Expedia, Inc., Company Guarantee, 5.950%, 08/15/2020 | 73,157 | |
| 10,000 | University of Southern California, Sr. Unsecd. Note, 5.250%, 10/01/2111 | 13,650 | |
| 70,000 | Visa, Inc., Sr. Unsecd. Note, 3.150%, 12/14/2025 | 75,299 | |
| TOTAL | 162,106 | ||
| Consumer Non-Cyclical - Food/Beverage—0.5% | |||
| 200,000 | 2,3 | Kerry Group Financial Services, Sr. Unsecd. Note, Series 144A, 3.200%, 04/09/2023 | 201,034 |
| 280,000 | 2,3 | Kraft Heinz Foods Co., Sr. Unsecd. Note, Series 144A, 4.375%, 06/01/2046 | 306,157 |
| 50,000 | Mead Johnson Nutrition Co., Sr. Unsecd. Note, 4.125%, 11/15/2025 | 55,105 | |
| 150,000 | PepsiCo, Inc., 2.750%, 4/30/2025 | 157,899 | |
| 30,000 | The Coca-Cola Co., Sr. Unsecd. Note, 1.800%, 9/01/2016 | 30,032 | |
| TOTAL | 750,227 | ||
| Consumer Non-Cyclical - Health Care—0.1% | |||
| 15,000 | Agilent Technologies, Inc., Sr. Unsecd. Note, 3.200%, 10/01/2022 | 15,573 | |
| 10,000 | Laboratory Corp. of America Holdings, Sr. Unsecd. Note, 3.750%, 08/23/2022 | 10,670 | |
| 30,000 | Stryker Corp., Sr. Unsecd. Note, 3.500%, 03/15/2026 | 32,257 |
| Principal Amount or Shares | Value | ||
| CORPORATE BONDS—continued | |||
| Consumer Non-Cyclical - Health Care—continued | |||
| $10,000 | Zimmer Holdings, Inc., Sr. Note, 5.750%, 11/30/2039 | $12,326 | |
| TOTAL | 70,826 | ||
| Consumer Non-Cyclical - Pharmaceuticals—0.3% | |||
| 10,000 | Dentsply International, Inc., Sr. Unsecd. Note, 2.750%, 08/15/2016 | 10,006 | |
| 300,000 | Eli Lilly & Co., 3.700%, 03/01/2045 | 325,570 | |
| 30,000 | Pfizer, Inc., Sr. Unsecd. Note, 6.200%, 03/15/2019 | 33,855 | |
| TOTAL | 369,431 | ||
| Consumer Non-Cyclical - Products—0.2% | |||
| 200,000 | Newell Rubbermaid, Inc., Sr. Unsecd. Note, 4.200%, 04/01/2026 | 218,902 | |
| Consumer Non-Cyclical - Tobacco—0.0% | |||
| 24,000 | Altria Group, Inc., 9.250%, 08/06/2019 | 29,526 | |
| 30,000 | Philip Morris International, Inc., 5.650%, 05/16/2018 | 32,451 | |
| TOTAL | 61,977 | ||
| Energy - Independent—0.4% | |||
| 250,000 | Canadian Natural Resources Ltd., 3.900%, 02/01/2025 | 250,756 | |
| 30,000 | EOG Resources, Inc., Note, 5.625%, 06/01/2019 | 33,039 | |
| 100,000 | Marathon Oil Corp., Sr. Unsecd. Note, 3.850%, 6/01/2025 | 90,943 | |
| 75,000 | XTO Energy, Inc., 6.375%, 06/15/2038 | 108,295 | |
| 60,000 | XTO Energy, Inc., 6.750%, 08/01/2037 | 90,099 | |
| TOTAL | 573,132 | ||
| Energy - Integrated—0.5% | |||
| 30,000 | BP Capital Markets America, Inc., Company Guarantee, 4.200%, 06/15/2018 | 31,487 | |
| 135,000 | BP Capital Markets PLC, 3.119%, 5/04/2026 | 137,981 | |
| 75,000 | Husky Energy, Inc., 4.000%, 04/15/2024 | 77,751 | |
| 100,000 | Husky Oil Ltd., Deb., 7.550%, 11/15/2016 | 100,814 | |
| 90,000 | Petrobras Global Finance BV, Sr. Unsecd. Note, 4.375%, 05/20/2023 | 77,400 | |
| 50,000 | Petrobras International Finance Co., Sr. Unsecd. Note, 5.375%, 1/27/2021 | 47,563 | |
| 25,000 | Petroleos Mexicanos, Sr. Unsecd. Note, 4.875%, 1/18/2024 | 25,500 | |
| 145,000 | Shell International Finance BV, Sr. Unsecd. Note, 4.000%, 05/10/2046 | 149,670 | |
| TOTAL | 648,166 | ||
| Energy - Midstream—0.6% | |||
| 75,000 | Energy Transfer Partners LP, Sr. Unsecd. Note, 4.900%, 02/01/2024 | 77,540 | |
| 100,000 | Energy Transfer Partners, Sr. Unsecd. Note, 4.050%, 3/15/2025 | 98,212 | |
| 170,000 | Enterprise Products Opera, Sr. Unsecd. Note, 3.950%, 02/15/2027 | 179,564 | |
| 10,000 | 2,3 | Florida Gas Transmission Co. LLC, Sr. Unsecd. Note, Series 144A, 5.450%, 07/15/2020 | 10,825 |
| Principal Amount or Shares | Value | ||
| CORPORATE BONDS—continued | |||
| Energy - Midstream—continued | |||
| $150,000 | Kinder Morgan Energy Partners LP, Sr. Unsecd. Note, 5.000%, 03/01/2043 | $143,145 | |
| 100,000 | Kinder Morgan, Inc., 5.050%, 2/15/2046 | 94,756 | |
| 20,000 | 2,3 | Texas Eastern Transmission LP, Sr. Unsecd. Note, Series 144A, 2.800%, 10/15/2022 | 20,059 |
| 200,000 | Williams Partners LP, 5.100%, 09/15/2045 | 180,515 | |
| 40,000 | Williams Partners LP, 5.250%, 03/15/2020 | 42,190 | |
| 30,000 | Williams Partners LP, Sr. Unsecd. Note, 4.125%, 11/15/2020 | 30,389 | |
| TOTAL | 877,195 | ||
| Energy - Oil Field Services—0.1% | |||
| 15,000 | Nabors Industries, Inc., Company Guarantee, 5.000%, 09/15/2020 | 14,133 | |
| 20,000 | Nabors Industries, Inc., Sr. Unsecd. Note, 4.625%, 09/15/2021 | 17,771 | |
| 50,000 | Nabors Industries, Inc., Sr. Unsecd. Note, 5.100%, 09/15/2023 | 45,038 | |
| 15,000 | Noble Holding International Ltd., Company Guarantee, 4.900%, 08/01/2020 | 12,966 | |
| TOTAL | 89,908 | ||
| Energy - Refining—0.2% | |||
| 10,000 | Marathon Petroleum Corp., Sr. Unsecd. Note, 6.500%, 03/01/2041 | 10,796 | |
| 50,000 | Phillips 66, Sr. Unsecd. Note, 4.300%, 04/01/2022 | 54,881 | |
| 30,000 | Valero Energy Corp., 7.500%, 04/15/2032 | 37,034 | |
| 10,000 | Valero Energy Corp., 9.375%, 03/15/2019 | 11,891 | |
| 95,000 | Valero Energy Corp., Sr. Unsecd. Note, 6.625%, 06/15/2037 | 105,703 | |
| TOTAL | 220,305 | ||
| Financial Institution - Banking—4.0% | |||
| 74,000 | American Express Co., 2.650%, 12/02/2022 | 75,843 | |
| 250,000 | American Express Credit Corp., Sr. Unsecd. Note, Series MTN, 2.250%, 05/05/2021 | 255,602 | |
| 50,000 | American Express Credit Corp., Sr. Unsecd. Note, Series MTN, 2.800%, 09/19/2016 | 50,137 | |
| 50,000 | BB&T Corp., Sr. Unsecd. Note, Series MTN, 2.250%, 02/01/2019 | 51,197 | |
| 300,000 | Bank of America Corp., Sr. Unsecd. Note, Series GMTN, 3.500%, 04/19/2026 | 313,913 | |
| 100,000 | Bank of America Corp., Sr. Unsecd. Note, Series MTN, 5.000%, 5/13/2021 | 112,631 | |
| 200,000 | Bank of America Corp., Sub. Note, Series L, 3.950%, 4/21/2025 | 207,036 | |
| 50,000 | Bank of Montreal, Sr. Unsecd. Note, Series MTN, 1.450%, 04/09/2018 | 50,213 | |
| 350,000 | Bank of New York Mellon Corp., Sr. Unsecd. Note, Series MTN, 2.800%, 05/04/2026 | 365,143 | |
| 250,000 | Branch Banking & Trust Co., Sub. Note, 3.800%, 10/30/2026 | 275,579 |
| Principal Amount or Shares | Value | ||
| CORPORATE BONDS—continued | |||
| Financial Institution - Banking—continued | |||
| $120,000 | Capital One Financial Corp., Sr. Sub., 4.200%, 10/29/2025 | $125,398 | |
| 200,000 | Citigroup, Inc., Sr. Unsecd. Note, 2.700%, 03/30/2021 | 204,231 | |
| 250,000 | Citigroup, Inc., Sr. Unsecd. Note, 3.300%, 04/27/2025 | 259,340 | |
| 170,000 | Citigroup, Inc., Sr. Unsecd. Note, 3.400%, 05/01/2026 | 175,617 | |
| 100,000 | Citigroup, Inc., Sub. Note, 4.450%, 09/29/2027 | 105,134 | |
| 25,000 | City National Corp., Sr. Unsecd. Note, 5.250%, 09/15/2020 | 28,437 | |
| 30,000 | Comerica, Inc., 3.800%, 7/22/2026 | 31,532 | |
| 200,000 | Fifth Third Bancorp, Sr. Unsecd. Note, 1.350%, 06/01/2017 | 200,514 | |
| 80,000 | Fifth Third Bancorp, Sr. Unsecd. Note, 2.875%, 7/27/2020 | 83,440 | |
| 275,000 | Goldman Sachs Group, Inc., Sr. Unsecd. Note, 3.625%, 01/22/2023 | 292,092 | |
| 25,000 | Goldman Sachs Group, Inc., Sr. Unsecd. Note, 6.125%, 02/15/2033 | 31,887 | |
| 30,000 | Goldman Sachs Group, Inc., Sr. Unsecd. Note, 6.150%, 04/01/2018 | 32,264 | |
| 150,000 | Goldman Sachs Group, Inc., Sr. Unsecd. Note, 6.250%, 02/01/2041 | 198,470 | |
| 50,000 | HSBC Holdings PLC, Sr. Unsecd. Note, 5.100%, 04/05/2021 | 55,716 | |
| 250,000 | Huntington National Bank, Sr. Unsecd. Note, 2.200%, 04/01/2019 | 253,713 | |
| 400,000 | J.P. Morgan Chase & Co., Sub. Note, 3.375%, 05/01/2023 | 409,465 | |
| 250,000 | Manufacturers & Traders Trust Co., Sr. Unsecd. Note, Series BKNT, 1.015%, 7/25/2017 | 249,798 | |
| 65,000 | Morgan Stanley, Sr. Unsecd. Note, 4.750%, 03/22/2017 | 66,491 | |
| 120,000 | Morgan Stanley, Sr. Unsecd. Note, Series GMTN, 2.500%, 04/21/2021 | 121,554 | |
| 175,000 | Morgan Stanley, Sub. Note, Series MTN, 4.100%, 05/22/2023 | 185,123 | |
| 20,000 | Murray Street Investment Trust I, Sr. Unsecd. Note, 4.647%, 03/09/2017 | 20,395 | |
| 210,000 | Regions Financial Corp., Sr. Unsecd. Note, 3.200%, 02/08/2021 | 217,284 | |
| 130,000 | SunTrust Banks, Inc., Sr. Unsecd. Note, 2.900%, 03/03/2021 | 135,875 | |
| 30,000 | Wachovia Corp., Sr. Unsecd. Note, Series MTN, 5.750%, 2/01/2018 | 32,021 | |
| 85,000 | Wells Fargo & Co., Sub. Note, Series GMTN, 4.900%, 11/17/2045 | 96,641 | |
| 70,000 | Westpac Banking Corp., Sr. Unsecd. Note, 4.875%, 11/19/2019 | 77,483 | |
| 100,000 | Wilmington Trust Corp., Sub. Note, 8.500%, 04/02/2018 | 111,227 | |
| TOTAL | 5,558,436 | ||
| Financial Institution - Broker/Asset Mgr/Exchange—0.2% | |||
| 80,000 | Invesco Finance PLC, Sr. Unsecd. Note, 3.750%, 1/15/2026 | 86,405 | |
| 40,000 | Jefferies Group LLC, Sr. Unsecd. Note, 6.500%, 01/20/2043 | 41,600 | |
| 125,000 | Jefferies Group LLC, Sr. Unsecd. Note, 6.875%, 04/15/2021 | 143,781 | |
| 13,000 | Raymond James Financial, Inc., Sr. Unsecd. Note, 5.625%, 04/01/2024 | 15,097 | |
| TOTAL | 286,883 |
| Principal Amount or Shares | Value | ||
| CORPORATE BONDS—continued | |||
| Financial Institution - Finance Companies—0.1% | |||
| $170,000 | AerCap Ireland Capital Ltd./AerCap Global Aviation Trust, Sr. Unsecd. Note, 3.950%, 02/01/2022 | $178,222 | |
| Financial Institution - Insurance - Health—0.2% | |||
| 170,000 | Aetna, Inc., Sr. Unsecd. Note, 3.200%, 06/15/2026 | 174,709 | |
| 45,000 | UnitedHealth Group, Inc., Sr. Unsecd. Note, 4.750%, 07/15/2045 | 56,301 | |
| 50,000 | Wellpoint, Inc., 5.850%, 01/15/2036 | 62,297 | |
| TOTAL | 293,307 | ||
| Financial Institution - Insurance - Life—0.8% | |||
| 200,000 | Aflac, Inc., Sr. Unsecd. Note, 3.625%, 06/15/2023 | 216,477 | |
| 10,000 | Aflac, Inc., Sr. Unsecd. Note, 6.900%, 12/17/2039 | 14,434 | |
| 25,000 | American International Group, Inc., 4.500%, 07/16/2044 | 25,416 | |
| 35,000 | American International Group, Inc., Sr. Unsecd. Note, 4.125%, 02/15/2024 | 37,723 | |
| 10,000 | Lincoln National Corp., Sr. Unsecd. Note, 4.200%, 03/15/2022 | 10,832 | |
| 275,000 | 2,3 | Mass Mutual Global Funding II, Series 144A, 2.000%, 04/15/2021 | 278,955 |
| 10,000 | MetLife, Inc., Jr. Sub. Note, 10.750%, 8/01/2039 | 16,025 | |
| 250,000 | MetLife, Inc., Sr. Unsecd. Note, 3.600%, 04/10/2024 | 265,784 | |
| 15,000 | 2,3 | Penn Mutual Life Insurance Co., Sr. Note, Series 144A, 7.625%, 06/15/2040 | 20,989 |
| 10,000 | Principal Financial Group, Inc., Sr. Unsecd. Note, 3.125%, 05/15/2023 | 10,238 | |
| 10,000 | Principal Financial Group, Inc., Sr. Unsecd. Note, 3.300%, 09/15/2022 | 10,392 | |
| 150,000 | Prudential Financial, Inc., Sr. Unsecd. Note, Series MTN, 5.625%, 05/12/2041 | 179,840 | |
| 50,000 | Prudential Financial, Inc., Sr. Unsecd. Note, Series MTN, 6.200%, 11/15/2040 | 62,875 | |
| TOTAL | 1,149,980 | ||
| Financial Institution - Insurance - P&C—0.3% | |||
| 1,000 | ACE INA Holdings, Inc., Sr. Note, 5.700%, 02/15/2017 | 1,025 | |
| 80,000 | Berkshire Hathaway, Inc., Sr. Unsecd. Note, 3.125%, 03/15/2026 | 85,284 | |
| 30,000 | CNA Financial Corp., Sr. Unsecd. Note, 7.350%, 11/15/2019 | 34,551 | |
| 20,000 | Chubb Corp., Sr. Note, 5.750%, 05/15/2018 | 21,583 | |
| 100,000 | 2,3 | Liberty Mutual Group, Inc., Series 144A, 4.850%, 8/01/2044 | 106,002 |
| 65,000 | 2,3 | Nationwide Mutual Insurance Co., Sub. Note, Series 144A, 9.375%, 08/15/2039 | 104,418 |
| TOTAL | 352,863 | ||
| Financial Institution - REIT - Apartment—0.0% | |||
| 20,000 | Post Apartment Homes LP, Sr. Unsecd. Note, 3.375%, 12/01/2022 | 20,436 |
| Principal Amount or Shares | Value | ||
| CORPORATE BONDS—continued | |||
| Financial Institution - REIT - Apartment—continued | |||
| $10,000 | UDR, Inc., Company Guarantee, 4.625%, 01/10/2022 | $11,089 | |
| TOTAL | 31,525 | ||
| Financial Institution - REIT - Healthcare—0.1% | |||
| 40,000 | Health Care REIT, Inc., Sr. Unsecd. Note, 6.125%, 04/15/2020 | 45,655 | |
| 50,000 | Healthcare Trust of America, 3.700%, 04/15/2023 | 51,926 | |
| TOTAL | 97,581 | ||
| Financial Institution - REIT - Office—0.1% | |||
| 50,000 | Alexandria Real Estate Equities, Inc., Sr. Unsecd. Note, 3.900%, 06/15/2023 | 52,232 | |
| 50,000 | Alexandria Real Estate Equities, Inc., Sr. Unsecd. Note, 4.600%, 04/01/2022 | 54,329 | |
| 55,000 | Boston Properties LP, Sr. Unsecd. Note, 5.875%, 10/15/2019 | 62,196 | |
| TOTAL | 168,757 | ||
| Financial Institution - REIT - Other—0.2% | |||
| 75,000 | Liberty Property LP, 6.625%, 10/01/2017 | 79,200 | |
| 50,000 | ProLogis LP, Sr. Unsecd. Note, 3.350%, 02/01/2021 | 53,111 | |
| 75,000 | WP Carey, Inc., Sr. Unsecd. Note, 4.600%, 04/01/2024 | 78,151 | |
| TOTAL | 210,462 | ||
| Financial Institution - REIT - Retail—0.1% | |||
| 50,000 | Kimco Realty Corp., Sr. Unsecd. Note, 3.400%, 11/01/2022 | 52,728 | |
| 20,000 | Regency Centers LP, Company Guarantee, 4.800%, 04/15/2021 | 22,083 | |
| 30,000 | Tanger Properties LP, Sr. Unsecd. Note, 6.125%, 06/01/2020 | 34,228 | |
| TOTAL | 109,039 | ||
| Sovereign—0.0% | |||
| 30,000 | Corp Andina De Fomento, Sr. Unsecd. Note, 4.375%, 06/15/2022 | 33,521 | |
| Technology—1.0% | |||
| 45,000 | Apple, Inc., Sr. Unsecd. Note, 1.000%, 05/03/2018 | 45,097 | |
| 30,000 | Apple, Inc., Sr. Unsecd. Note, 2.400%, 05/03/2023 | 30,841 | |
| 100,000 | Apple, Inc., Sr. Unsecd. Note, Series 30 Year, 3.850%, 08/04/2046 | 101,408 | |
| 115,000 | Autodesk, Inc., Sr. Unsecd. Note, 4.375%, 6/15/2025 | 122,175 | |
| 140,000 | Automatic Data Processing, Inc., 3.375%, 9/15/2025 | 153,703 | |
| 20,000 | Corning, Inc., Unsecd. Note, 4.750%, 03/15/2042 | 21,320 | |
| 240,000 | 2,3 | Diamond 1 Finance Corp./Diamond 2 Finance Corp., Term Loan—1st Lien, Series 144A, 6.020%, 06/15/2026 | 257,959 |
| 125,000 | Equifax, Inc., Sr. Unsecd. Note, 2.300%, 06/01/2021 | 126,700 | |
| 100,000 | Fidelity National Information Services, Inc., Sr. Unsecd. Note, 3.500%, 04/15/2023 | 104,782 |
| Principal Amount or Shares | Value | ||
| CORPORATE BONDS—continued | |||
| Technology—continued | |||
| $180,000 | Fidelity National Information Services, Inc., Sr. Unsecd. Note, 5.000%, 10/15/2025 | $208,761 | |
| 70,000 | 2,3 | Hewlett Packard Enterprise Co., Sr. Unsecd. Note, Series 144A, 3.600%, 10/15/2020 | 73,929 |
| 20,000 | Ingram Micro, Inc., Sr. Unsecd. Note, 5.000%, 08/10/2022 | 20,587 | |
| 50,000 | Total System Services, Inc., Sr. Unsecd. Note, 4.800%, 04/01/2026 | 55,714 | |
| 10,000 | Verisk Analytics, Inc., Sr. Unsecd. Note, 4.125%, 09/12/2022 | 10,745 | |
| 25,000 | Verisk Analytics, Inc., Sr. Unsecd. Note, 4.875%, 01/15/2019 | 26,684 | |
| 50,000 | Verisk Analytics, Inc., Sr. Unsecd. Note, 5.500%, 06/15/2045 | 54,178 | |
| 20,000 | Xerox Corp., Sr. Unsecd. Note, 2.950%, 03/15/2017 | 20,109 | |
| TOTAL | 1,434,692 | ||
| Transportation - Airlines—0.1% | |||
| 130,000 | Southwest Airlines Co., Sr. Unsecd. Note, 5.125%, 03/01/2017 | 132,971 | |
| Transportation - Railroads—0.2% | |||
| 50,000 | Burlington Northern Santa Fe Corp., Deb., 5.750%, 05/01/2040 | 67,900 | |
| 30,000 | Kansas City Southern Industries, Inc., Sr. Unsecd. Note, 3.000%, 05/15/2023 | 30,934 | |
| 225,000 | Kansas City Southern Industries, Inc., Sr. Unsecd. Note, 3.125%, 06/01/2026 | 231,133 | |
| TOTAL | 329,967 | ||
| Transportation - Services—0.1% | |||
| 90,000 | 2,3 | Enterprise Rent-A-Car USA Finance Co., Series 144A, 6.375%, 10/15/2017 | 95,173 |
| 50,000 | Ryder System, Inc., Sr. Unsecd. Note, Series MTN, 2.450%, 11/15/2018 | 50,740 | |
| 30,000 | United Parcel Service, Inc., Sr. Unsecd. Note, 3.125%, 01/15/2021 | 32,233 | |
| TOTAL | 178,146 | ||
| Utility - Electric—1.2% | |||
| 5,000 | Consolidated Edison Co., Sr. Unsecd. Note, 6.650%, 04/01/2019 | 5,693 | |
| 70,000 | 2,3 | Electricite de France SA, Note, Series 144A, 5.600%, 01/27/2040 | 84,079 |
| 140,000 | 2,3 | Emera US Finance LP, Sr. Unsecd. Note, Series 144A, 4.750%, 06/15/2046 | 154,940 |
| 170,000 | EverSource Energy, Sr. Unsecd. Note, 3.350%, 03/15/2026 | 181,551 | |
| 200,000 | Exelon Corp., Sr. Unsecd. Note, 3.400%, 04/15/2026 | 210,906 | |
| 100,000 | Exelon Generation Co. LLC, Sr. Unsecd. Note, 4.250%, 06/15/2022 | 107,369 | |
| 10,000 | Great Plains Energy, Inc., Note, 4.850%, 06/01/2021 | 11,010 | |
| 4,756 | 2,3 | Great River Energy, 1st Mtg. Note, Series 144A, 5.829%, 7/01/2017 | 4,913 |
| 70,000 | Indiana Michigan Power Co., Sr. Unsecd. Note, Series K, 4.550%, 03/15/2046 | 81,264 | |
| 110,000 | National Rural Utilities, Sr. Sub., 5.250%, 04/20/2046 | 116,369 |
| Principal Amount or Shares | Value | ||
| CORPORATE BONDS—continued | |||
| Utility - Electric—continued | |||
| $25,000 | National Rural Utilities, Sr. Unsecd. Note, Series MTNC, 8.000%, 3/01/2032 | $38,143 | |
| 50,000 | NextEra Energy Capital Holdings, Inc., Sr. Unsecd. Note, 2.700%, 09/15/2019 | 51,579 | |
| 80,000 | Northern States Power Co., MN, 1st Mtg. Bond, 5.250%, 03/01/2018 | 85,268 | |
| 250,000 | PPL Capital Funding, Inc., Sr. Unsecd. Note, 3.100%, 05/15/2026 | 255,726 | |
| 50,000 | Progress Energy, Inc., 7.050%, 03/15/2019 | 56,832 | |
| 175,000 | Southern Co., Sr. Unsecd. Note, 3.250%, 07/01/2026 | 183,926 | |
| 10,000 | TECO Finance, Inc., Company Guarantee, 5.150%, 03/15/2020 | 11,097 | |
| 40,000 | UIL Holdings Corp., Sr. Unsecd. Note, 4.625%, 10/01/2020 | 43,301 | |
| TOTAL | 1,683,966 | ||
| Utility - Natural Gas—0.2% | |||
| 20,000 | Atmos Energy Corp., 8.500%, 03/15/2019 | 23,444 | |
| 100,000 | Atmos Energy Corp., Sr. Unsecd. Note, 4.125%, 10/15/2044 | 111,371 | |
| 50,000 | Enbridge Energy Partners LP, Sr. Unsecd. Note, 4.200%, 09/15/2021 | 51,597 | |
| 40,000 | Enbridge, Inc., Sr. Note, 5.600%, 04/01/2017 | 40,993 | |
| 65,000 | National Fuel Gas Co., Sr. Unsecd. Note, 3.750%, 03/01/2023 | 64,797 | |
| TOTAL | 292,202 | ||
| TOTAL CORPORATE BONDS (IDENTIFIED COST $22,002,894) | 23,424,916 | ||
| MORTGAGE-BACKED SECURITY—0.0% | |||
| Federal National Mortgage Association—0.0% | |||
| 256 | Federal National Mortgage Association Pool 609554, 7.500%, 10/1/2016 (IDENTIFIED COST $266) | 257 | |
| MUNICIPAL BOND—0.1% | |||
| Municipal Services—0.1% | |||
| 70,000 | Chicago, IL Metropolitan Water Reclamation District, Direct Payment Taxable Limited GO Build America Bonds, 5.720%,
12/01/2038 (IDENTIFIED COST $70,000) | 90,703 | |
| U.S. TREASURY—1.2% | |||
| 435,000 | United States Treasury Bond, 2.500%, 2/15/2046 | 463,944 | |
| 325,000 | United States Treasury Bond, 2.500%, 5/15/2046 | 347,293 | |
| 200,000 | United States Treasury Note, 0.875%, 6/15/2019 | 200,653 | |
| 50,000 | United States Treasury Note, 1.625%, 5/15/2026 | 50,774 | |
| 10,000 | United States Treasury Note, 2.250%, 11/15/2024 | 10,681 | |
| 253,227 | U.S. Treasury Inflation-Protected Note, 0.375%, 7/15/2025 | 261,649 | |
| 159,192 | U.S. Treasury Inflation-Protected Note, Series A-2022, 0.125%, 1/15/2022 | 161,773 |
| Principal Amount or Shares | Value | ||
| U.S. TREASURY—continued | |||
| $177,034 | 5 | U.S. Treasury Inflation-Protected Note, Series D-2024, 0.125%, 7/15/2024 | $179,205 |
| TOTAL U.S. TREASURY (IDENTIFIED COST $1,605,955) | 1,675,972 | ||
| EXCHANGE-TRADED FUNDS—5.0% | |||
| 30,000 | iShares Core MSCI Emerging Markets ETF | 1,319,100 | |
| 96,000 | iShares MSCI EAFE ETF | 5,569,920 | |
| TOTAL EXCHANGE-TRADED FUNDS (IDENTIFIED COST $7,715,046) | 6,889,020 | ||
| INVESTMENT COMPANIES—22.6%6 | |||
| 166,883 | Emerging Markets Core Fund | 1,707,215 | |
| 220,091 | Federated Bank Loan Core Fund | 2,203,112 | |
| 4,202,435 | Federated Institutional Prime Value Obligations Fund, Institutional Shares, 0.36%7 | 4,202,435 | |
| 1,511,148 | Federated Mortgage Core Portfolio | 15,217,257 | |
| 307,620 | Federated Project and Trade Finance Core Fund | 2,867,023 | |
| 826,313 | High Yield Bond Portfolio | 5,147,928 | |
| TOTAL INVESTMENT COMPANIES (IDENTIFIED COST $31,713,415) | 31,344,970 | ||
| TOTAL INVESTMENTS—99.9% (IDENTIFIED COST $136,873,400)8 | 138,547,218 | ||
| OTHER ASSETS AND LIABILITIES - NET—0.1%9 | 184,521 | ||
| TOTAL NET ASSETS—100% | $138,731,739 |
| Description | Number of Contracts | Notional Value | Expiration Date | Unrealized Appreciation (Depreciation) |
| 1United States Treasury Note 2-Year Long Futures | 50 | $10,950,000 | September 2016 | $(2,458) |
| 1United States Treasury Ultra Bond Long Futures | 13 | $2,476,906 | September 2016 | $149,090 |
| 1United States Treasury Note 5-Year Short Futures | 43 | $5,246,672 | September 2016 | $(89,124) |
| 1United States Treasury Note 10-Year Short Futures | 20 | $2,660,937 | September 2016 | $(5,424) |
| NET UNREALIZED APPRECIATION ON FUTURES CONTRACTS | $52,084 | |||
| 1 | Non-income-producing security. |
| 2 | Denotes a restricted security that either: (a) cannot be offered for public sale without first being registered, or being able to take advantage of an exemption from registration, under the Securities Act of 1933; or (b) is subject to a contractual restriction on public sales. At July 31, 2016, these restricted securities amounted to $3,536,932, which represented 2.5% of total net assets. |
| 3 | Denotes a restricted security that may be resold without restriction to “qualified institutional buyers” as defined in Rule 144A under the Securities Act of 1933 and that the Fund has determined to be liquid under criteria established by the Fund's Board of Trustees (the “Trustees”). At July 31, 2016, these liquid restricted securities amounted to $3,315,297, which represented 2.4% of total net assets. |
| 4 | JPMorgan Chase & Co. has fully and unconditionally guaranteed Bear Stearns' outstanding registered debt securities. |
| 5 | All or a portion of this security is pledged as collateral to ensure the Fund is able to satisfy the obligations of its outstanding futures contracts. |
| 6 | Affiliated holdings. |
| 7 | 7-day net yield. |
| 8 | The cost of investments for federal tax purposes amounts to $136,841,125. |
| 9 | Assets, other than investments in securities, less liabilities. See Statement of Assets and Liabilities. |
| Valuation Inputs | ||||
| Level 1— Quoted Prices | Level 2— Other Significant Observable Inputs | Level 3— Significant Unobservable Inputs | Total | |
| Equity Securities: | ||||
| Common Stocks | ||||
| Domestic | $67,621,208 | $— | $— | $67,621,208 |
| International | 2,424,724 | — | — | 2,424,724 |
| Debt Securities: | ||||
| Asset-Backed Securities | — | 1,452,274 | — | 1,452,274 |
| Collateralized Mortgage Obligations | — | 3,623,174 | — | 3,623,174 |
| Corporate Bonds | — | 23,424,916 | — | 23,424,916 |
| Mortgage-Backed Security | — | 257 | — | 257 |
| Municipal Bond | — | 90,703 | — | 90,703 |
| U.S. Treasury | — | 1,675,972 | — | 1,675,972 |
| Exchange-Traded Funds | 6,889,020 | — | — | 6,889,020 |
| Investment Companies1 | 4,202,435 | — | — | 31,344,970 |
| TOTAL SECURITIES | $81,137,387 | $30,267,296 | $— | $138,547,218 |
| Other Financial Instruments:2 | ||||
| Assets | $149,090 | $— | $— | $149,090 |
| Liabilities | (97,006) | — | — | (97,006) |
| TOTAL OTHER FINANCIAL INSTRUMENTS | $52,084 | $— | $— | $52,084 |
| 1 | As permitted by U.S. generally accepted accounting principles (GAAP), Investment Companies valued at $27,142,535 are measured at fair value using the net asset value (NAV) per share practical expedient and have not been categorized in the chart above but are included in the Total column. The amount included herein is intended to permit reconciliation of the fair value classifications to the amounts presented on the Statement of Assets and Liabilities. The price of shares redeemed in Emerging Markets Core Fund, Federated Bank Loan Core Fund, Federated Mortgage Core Portfolio and High Yield Bond Portfolio is the next determined NAV after receipt of a shareholder redemption request. The price of shares redeemed of Federated Project and Trade Finance Core Fund may be determined as of the closing NAV of the fund up to twenty-four days after receipt of a shareholder redemption request. |
| 2 | Other financial instruments include futures contracts. |
| ETF | —Exchange-Traded Fund |
| FREMF | —Freddie Mac Multifamily K-Deals |
| GO | —General Obligation |
| MTN | —Medium Term Note |
| REIT(s) | —Real Estate Investment Trust(s) |
| REMIC | —Real Estate Mortgage Investment Conduit |
| Year Ended July 31 | 2016 | 2015 | 2014 | 2013 | 2012 |
| Net Asset Value, Beginning of Period | $16.83 | $16.07 | $14.35 | $12.20 | $12.17 |
| Income From Investment Operations: | |||||
| Net investment income | 0.241 | 0.201 | 0.171 | 0.141 | 0.171 |
| Net realized and unrealized gain (loss) on investments, futures contracts, swap contracts and foreign currency transactions | (0.31) | 0.74 | 1.70 | 2.19 | 0.02 |
| TOTAL FROM INVESTMENT OPERATIONS | (0.07) | 0.94 | 1.87 | 2.33 | 0.19 |
| Less Distributions: | |||||
| Distributions from net investment income | (0.24) | (0.18) | (0.15) | (0.18) | (0.16) |
| Net Asset Value, End of Period | $16.52 | $16.83 | $16.07 | $14.35 | $12.20 |
| Total Return2 | (0.37)% | 5.89% | 13.06% | 19.28% | 1.65% |
| Ratios to Average Net Assets: | |||||
| Net expenses | 1.30% | 1.30% | 1.30% | 1.30% | 1.30% |
| Net investment income | 1.51% | 1.21% | 1.10% | 1.10% | 1.43% |
| Expense waiver/reimbursement3 | 0.10% | 0.09% | 0.10% | 0.11% | 0.28% |
| Supplemental Data: | |||||
| Net assets, end of period (000 omitted) | $61,245 | $62,555 | $55,634 | $50,340 | $48,774 |
| Portfolio turnover | 98% | 89% | 34% | 105% | 149% |
| 1 | Per share numbers have been calculated using the average shares method. |
| 2 | Based on net asset value, which does not reflect the sales charge, redemption fee or contingent deferred sales charge, if applicable. |
| 3 | This expense decrease is reflected in both the net expense and the net investment income ratios shown above. |
| Year Ended July 31 | 2016 | 2015 | 2014 | 2013 | 2012 |
| Net Asset Value, Beginning of Period | $16.59 | $15.84 | $14.16 | $12.03 | $11.99 |
| Income From Investment Operations: | |||||
| Net investment income | 0.121 | 0.071 | 0.051 | 0.041 | 0.081 |
| Net realized and unrealized gain (loss) on investments, futures contracts, swap contracts and foreign currency transactions | (0.31) | 0.74 | 1.67 | 2.16 | 0.03 |
| TOTAL FROM INVESTMENT OPERATIONS | (0.19) | 0.81 | 1.72 | 2.20 | 0.11 |
| Less Distributions: | |||||
| Distributions from net investment income | (0.10) | (0.06) | (0.04) | (0.07) | (0.07) |
| Net Asset Value, End of Period | $16.30 | $16.59 | $15.84 | $14.16 | $12.03 |
| Total Return2 | (1.10)% | 5.12% | 12.14% | 18.41% | 0.93% |
| Ratios to Average Net Assets: | |||||
| Net expenses | 2.05% | 2.05% | 2.05% | 2.05% | 2.05% |
| Net investment income | 0.76% | 0.45% | 0.34% | 0.36% | 0.68% |
| Expense waiver/reimbursement3 | 0.08% | 0.06% | 0.07% | 0.08% | 0.24% |
| Supplemental Data: | |||||
| Net assets, end of period (000 omitted) | $29,152 | $31,571 | $34,522 | $35,450 | $34,193 |
| Portfolio turnover | 98% | 89% | 34% | 105% | 149% |
| 1 | Per share numbers have been calculated using the average shares method. |
| 2 | Based on net asset value, which does not reflect the sales charge, redemption fee or contingent deferred sales charge, if applicable. |
| 3 | This expense decrease is reflected in both the net expense and the net investment income ratios shown above. |
| Year Ended July 31 | 2016 | 2015 | 2014 | 2013 | 2012 |
| Net Asset Value, Beginning of Period | $16.80 | $16.05 | $14.33 | $12.17 | $12.12 |
| Income From Investment Operations: | |||||
| Net investment income | 0.201 | 0.161 | 0.131 | 0.091 | 0.111 |
| Net realized and unrealized gain (loss) on investments, futures contracts, swap contracts and foreign currency transactions | (0.31) | 0.74 | 1.69 | 2.19 | 0.03 |
| TOTAL FROM INVESTMENT OPERATIONS | (0.11) | 0.90 | 1.82 | 2.28 | 0.14 |
| Less Distributions: | |||||
| Distributions from net investment income | (0.20) | (0.15) | (0.10) | (0.12) | (0.09) |
| Net Asset Value, End of Period | $16.49 | $16.80 | $16.05 | $14.33 | $12.17 |
| Total Return2 | (0.59)% | 5.61% | 12.72% | 18.84% | 1.19% |
| Ratios to Average Net Assets: | |||||
| Net expenses | 1.56% | 1.56% | 1.57% | 1.69% | 1.80% |
| Net investment income | 1.27% | 0.96% | 0.84% | 0.70% | 0.93% |
| Expense waiver/reimbursement3 | 0.04% | 0.03% | 0.05% | 0.06% | 0.22% |
| Supplemental Data: | |||||
| Net assets, end of period (000 omitted) | $577 | $532 | $464 | $417 | $526 |
| Portfolio turnover | 98% | 89% | 34% | 105% | 149% |
| 1 | Per share numbers have been calculated using the average shares method. |
| 2 | Based on net asset value. |
| 3 | This expense decrease is reflected in both the net expense and the net investment income ratios shown above. |
| Year Ended July 31 | 2016 | 2015 | 2014 | 2013 | 2012 |
| Net Asset Value, Beginning of Period | $16.87 | $16.11 | $14.39 | $12.23 | $12.21 |
| Income From Investment Operations: | |||||
| Net investment income | 0.281 | 0.241 | 0.211 | 0.181 | 0.201 |
| Net realized and unrealized gain (loss) on investments, futures contracts, swap contracts and foreign currency transactions | (0.30) | 0.74 | 1.69 | 2.19 | 0.02 |
| TOTAL FROM INVESTMENT OPERATIONS | (0.02) | 0.98 | 1.90 | 2.37 | 0.22 |
| Less Distributions: | |||||
| Distributions from net investment income | (0.28) | (0.22) | (0.18) | (0.21) | (0.20) |
| Net Asset Value, End of Period | $16.57 | $16.87 | $16.11 | $14.39 | $12.23 |
| Total Return2 | (0.07)% | 6.13% | 13.30% | 19.63% | 1.87% |
| Ratios to Average Net Assets: | |||||
| Net expenses | 1.05% | 1.05% | 1.05% | 1.05% | 1.05% |
| Net investment income | 1.76% | 1.46% | 1.35% | 1.35% | 1.69% |
| Expense waiver/reimbursement3 | 0.05% | 0.04% | 0.06% | 0.07% | 0.23% |
| Supplemental Data: | |||||
| Net assets, end of period (000 omitted) | $47,757 | $53,291 | $49,667 | $46,365 | $43,341 |
| Portfolio turnover | 98% | 89% | 34% | 105% | 149% |
| 1 | Per share numbers have been calculated using the average shares method. |
| 2 | Based on net asset value. |
| 3 | This expense decrease is reflected in both the net expense and the net investment income ratios shown above. |
| Assets: | ||
| Total investment in securities, at value including $31,344,970 of investment in affiliated holdings (Note 5) (identified cost $136,873,400) | $138,547,218 | |
| Income receivable | 328,660 | |
| Receivable for investments sold | 1,184,377 | |
| Receivable for shares sold | 66,789 | |
| Receivable for daily variation margin on futures contracts | 7,252 | |
| TOTAL ASSETS | 140,134,296 | |
| Liabilities: | ||
| Payable for investments purchased | $1,170,890 | |
| Payable for shares redeemed | 29,276 | |
| Payable to adviser (Note 5) | 8,376 | |
| Payable for administrative fee (Note 5) | 888 | |
| Payable for auditing fees | 30,600 | |
| Payable for distribution services fee (Note 5) | 18,635 | |
| Payable for other service fees (Notes 2 and 5) | 45,625 | |
| Payable for share registration costs | 37,459 | |
| Accrued expenses (Note 5) | 60,808 | |
| TOTAL LIABILITIES | 1,402,557 | |
| Net assets for 8,412,395 shares outstanding | $138,731,739 | |
| Net Assets Consist of: | ||
| Paid-in capital | $146,900,592 | |
| Net unrealized appreciation of investments and futures contracts | 1,725,902 | |
| Accumulated net realized loss on investments and futures contracts | (11,068,943) | |
| Undistributed net investment income | 1,174,188 | |
| TOTAL NET ASSETS | $138,731,739 |
| Net Asset Value, Offering Price and Redemption Proceeds Per Share | ||
| Class A Shares: | ||
| Net asset value per share ($61,245,423 ÷ 3,706,859 shares outstanding), no par value, unlimited shares authorized | $16.52 | |
| Offering price per share (100/94.50 of $16.52) | $17.48 | |
| Redemption proceeds per share | $16.52 | |
| Class C Shares: | ||
| Net asset value per share ($29,151,900 ÷ 1,788,393 shares outstanding), no par value, unlimited shares authorized | $16.30 | |
| Offering price per share | $16.30 | |
| Redemption proceeds per share (99.00/100 of $16.30) | $16.14 | |
| Class R Shares: | ||
| Net asset value per share ($577,167 ÷ 34,993 shares outstanding), no par value, unlimited shares authorized | $16.49 | |
| Offering price per share | $16.49 | |
| Redemption proceeds per share | $16.49 | |
| Institutional Shares: | ||
| Net asset value per share ($47,757,249 ÷ 2,882,150 shares outstanding), no par value, unlimited shares authorized | $16.57 | |
| Offering price per share | $16.57 | |
| Redemption proceeds per share | $16.57 |
| Investment Income: | |||
| Dividends (including $904,925 received from affiliated holdings (Note 5) and net of foreign taxes withheld of $378) | $2,827,276 | ||
| Interest | 975,076 | ||
| Investment income allocated from an affiliated partnership (Note 5) | 75,273 | ||
| TOTAL INCOME | 3,877,625 | ||
| Expenses: | |||
| Investment adviser fee (Note 5) | $1,037,057 | ||
| Administrative fee (Note 5) | 108,166 | ||
| Custodian fees | 31,486 | ||
| Transfer agent fee (Note 2) | 141,271 | ||
| Directors'/Trustees' fees (Note 5) | 2,762 | ||
| Auditing fees | 30,600 | ||
| Legal fees | 8,236 | ||
| Portfolio accounting fees | 107,065 | ||
| Distribution services fee (Note 5) | 224,162 | ||
| Other service fees (Notes 2 and 5) | 217,537 | ||
| Share registration costs | 59,535 | ||
| Printing and postage | 31,094 | ||
| Miscellaneous (Note 5) | 15,195 | ||
| EXPENSES BEFORE ALLOCATION | 2,014,166 | ||
| Expenses allocated from affiliated partnership (Note 2) | 898 | ||
| TOTAL EXPENSES | 2,015,064 | ||
| Waiver and Reimbursements: | |||
| Waiver/reimbursement of investment adviser fee (Note 5) | $(48,596) | ||
| Reimbursement of other operating expenses (Notes 2 and 5) | (59,945) | ||
| TOTAL WAIVER AND REIMBURSEMENTS | (108,541) | ||
| Net expenses | 1,906,523 | ||
| Net investment income | 1,971,102 |
| Realized and Unrealized Gain (Loss) on Investments and Futures Contracts: | |||
| Net realized gain on investments (including realized gain of $269,626 on sales of investments in affiliated holdings (Note 5)) | $3,350,020 | ||
| Net realized loss on futures contracts | (222,092) | ||
| Net realized loss on investments and foreign currency transactions allocated from an affiliated partnership (Note 5) | (70,479) | ||
| Realized gain distribution from registered investment company shares (Note 5) | 52,801 | ||
| Net change in unrealized appreciation of investments | (6,222,212) | ||
| Net change in unrealized depreciation of futures contracts | 105,179 | ||
| Net realized and unrealized loss on investments and futures contracts | (3,006,783) | ||
| Change in net assets resulting from operations | $(1,035,681) |
| Year Ended July 31 | 2016 | 2015 |
| Increase (Decrease) in Net Assets | ||
| Operations: | ||
| Net investment income | $1,971,102 | $1,631,758 |
| Net realized gain on investments including allocations from an affiliated partnership and futures contracts | 3,110,250 | 18,811,985 |
| Net change in unrealized appreciation/depreciation of investments and futures contracts | (6,117,033) | (12,482,552) |
| CHANGE IN NET ASSETS RESULTING FROM OPERATIONS | (1,035,681) | 7,961,191 |
| Distributions to Shareholders: | ||
| Distributions from net investment income | ||
| Class A Shares | (912,021) | (627,231) |
| Class C Shares | (200,679) | (120,251) |
| Class R Shares | (7,400) | (4,641) |
| Institutional Shares | (830,257) | (724,945) |
| CHANGE IN NET ASSETS RESULTING FROM DISTRIBUTIONS TO SHAREHOLDERS | (1,950,357) | (1,477,068) |
| Share Transactions: | ||
| Proceeds from sale of shares | 17,267,895 | 27,367,111 |
| Net asset value of shares issued to shareholders in payment of distributions declared | 1,804,807 | 1,374,214 |
| Cost of shares redeemed | (25,304,874) | (27,563,013) |
| CHANGE IN NET ASSETS RESULTING FROM SHARE TRANSACTIONS | (6,232,172) | 1,178,312 |
| Change in net assets | (9,218,210) | 7,662,435 |
| Net Assets: | ||
| Beginning of period | 147,949,949 | 140,287,514 |
| End of period (including undistributed net investment income of $1,174,188 and $1,103,078, respectively) | $138,731,739 | $147,949,949 |
| ■ | Equity securities listed on an exchange or traded through a regulated market system are valued at their last reported sale price or official closing price in their principal exchange or market. |
| ■ | Fixed-income securities acquired with remaining maturities greater than 60 days are fair valued using price evaluations provided by a pricing service approved by the Trustees. |
| ■ | Fixed-income securities and repurchase agreements acquired with remaining maturities of 60 days or less are valued at their cost (adjusted for the accretion of any discount or amortization of any premium), unless the issuer's creditworthiness is impaired or other factors indicate that amortized cost is not an accurate estimate of the investment's fair value, in which case it would be valued in the same manner as a longer-term security. |
| ■ | Shares of other mutual funds or non-exchange-traded investment companies are valued based upon their reported NAVs. |
| ■ | Derivative contracts listed on exchanges are valued at their reported settlement or closing price, except that options are valued at the mean of closing bid and asked quotations. |
| ■ | Over-the-counter (OTC) derivative contracts are fair valued using price evaluations provided by a pricing service approved by the Trustees. |
| ■ | For securities that are fair valued in accordance with procedures established by and under the general supervision of the Trustees, certain factors may be considered such as: the last traded or purchase price of the security, information obtained by contacting the issuer or dealers, analysis of the issuer's financial statements or other available documents, fundamental analytical data, the nature and duration of restrictions on disposition, the movement of the market in which the security is normally traded, public trading in similar securities or derivative contracts of the issuer or comparable issuers, movement of a relevant index, or other factors including but not limited to industry changes and relevant government actions. |
| ■ | With respect to securities traded principally in foreign markets, significant trends in U.S. equity markets or in the trading of foreign securities index futures contracts; |
| ■ | Political or other developments affecting the economy or markets in which an issuer conducts its operations or its securities are traded; |
| ■ | Announcements concerning matters such as acquisitions, recapitalizations, litigation developments, or a natural disaster affecting the issuer's operations or regulatory changes or market developments affecting the issuer's industry. |
| Transfer Agent Fees Incurred | Transfer Agent Fees Reimbursed | |
| Class A Shares | $76,976 | $(39,636) |
| Class C Shares | 29,153 | (12,205) |
| Class R Shares | 304 | — |
| Institutional Shares | 34,838 | (8,104) |
| TOTAL | $141,271 | $(59,945) |
| Other Service Fees Incurred | |
| Class A Shares | $144,451 |
| Class C Shares | 73,086 |
| TOTAL | $217,537 |
| Security | Acquisition Date | Cost | Market Value |
| Football Trust V, Pass Thru Cert., Series 144A, 5.350%, 10/05/2020 | 3/24/2010 | $200,000 | $221,635 |
| Fair Value of Derivative Instruments | ||
| Asset | ||
| Statement of Assets and Liabilities Location | Fair Value | |
| Derivatives not accounted for as hedging instruments under ASC Topic 815 | ||
| Interest rate contracts | Receivable for daily variation margin on futures contracts | $52,084* |
| * | Includes cumulative appreciation of futures contracts as reported in the footnotes to the Portfolio of Investments. Only the current day's variation margin is reported within the Statement of Assets and Liabilities. |
| Amount of Realized Gain or (Loss) on Derivatives Recognized in Income | |
| Futures | |
| Interest rate contracts | $(222,092) |
| Change in Unrealized Appreciation or (Depreciation) on Derivatives Recognized in Income | |
| Futures | |
| Interest rate contracts | $105,179 |
| Year Ended July 31 | 2016 | 2015 | ||
| Class A Shares: | Shares | Amount | Shares | Amount |
| Shares sold | 587,548 | $9,377,136 | 877,364 | $14,585,649 |
| Shares issued to shareholders in payment of distribution declared | 51,346 | 816,912 | 33,893 | 561,953 |
| Shares redeemed | (649,638) | (10,261,256) | (656,048) | (10,848,975) |
| NET CHANGE RESULTING FROM CLASS A SHARE TRANSACTIONS | (10,744) | $(67,208) | 255,209 | $4,298,627 |
| Year Ended July 31 | 2016 | 2015 | ||
| Class C Shares: | Shares | Amount | Shares | Amount |
| Shares sold | 302,928 | $4,781,444 | 291,257 | $4,780,270 |
| Shares issued to shareholders in payment of distribution declared | 11,611 | 182,981 | 6,665 | 109,378 |
| Shares redeemed | (429,374) | (6,745,049) | (573,519) | (9,319,128) |
| NET CHANGE RESULTING FROM CLASS C SHARE TRANSACTIONS | (114,835) | $(1,780,624) | (275,597) | $(4,429,480) |
| Year Ended July 31 | 2016 | 2015 | ||
| Class R Shares: | Shares | Amount | Shares | Amount |
| Shares sold | 8,198 | $131,010 | 5,140 | $84,844 |
| Shares issued to shareholders in payment of distribution declared | 402 | 6,380 | 276 | 4,573 |
| Shares redeemed | (5,256) | (82,857) | (2,687) | (44,528) |
| NET CHANGE RESULTING FROM CLASS R SHARE TRANSACTIONS | 3,344 | $54,533 | 2,729 | $44,889 |
| Year Ended July 31 | 2016 | 2015 | ||
| Institutional Shares: | Shares | Amount | Shares | Amount |
| Shares sold | 187,245 | $2,978,562 | 476,302 | $7,916,348 |
| Shares issued to shareholders in payment of distribution declared | 50,127 | 798,534 | 42,067 | 698,310 |
| Shares redeemed | (513,254) | (8,215,712) | (442,803) | (7,350,382) |
| NET CHANGE RESULTING FROM INSTITUTIONAL SHARE TRANSACTIONS | (275,882) | $(4,438,616) | 75,566 | $1,264,276 |
| NET CHANGE RESULTING FROM TOTAL FUND SHARE TRANSACTIONS | (398,117) | $(6,231,915) | 57,907 | $1,178,312 |
| Increase (Decrease) | ||
| Paid-In Capital | Undistributed Net Investment Income (Loss) | Accumulated Net Realized Gain (Loss) |
| $(12) | $50,365 | $(50,353) |
| 2016 | 2015 | |
| Ordinary income | $1,950,357 | $1,477,068 |
| Undistributed ordinary income | $1,174,188 |
| Net unrealized appreciation | $1,706,093 |
| Capital loss carryforwards and deferrals | $(11,049,134) |
| Expiration Year | Short-Term | Long-Term | Total |
| 2018 | $10,992,401 | NA | $10,992,401 |
| Administrative Fee | Average Daily Net Assets of the Investment Complex |
| 0.150% | on the first $5 billion |
| 0.125% | on the next $5 billion |
| 0.100% | on the next $10 billion |
| 0.075% | on assets in excess of $20 billion |
| Share Class Name | Percentage of Average Daily Net Assets of Class |
| Class A Shares | 0.05% |
| Class C Shares | 0.75% |
| Class R Shares | 0.50% |
| Distribution Services Fees Incurred | |
| Class C Shares | $221,391 |
| Class R Shares | 2,771 |
| TOTAL | $224,162 |
| Emerging Markets Fixed Income Core Fund | Emerging Markets Core Fund | Federated Bank Loan Core Fund | Federated Institutional Prime Value Obligations Fund, Institutional Shares | Federated Mortgage Core Portfolio | Federated Project and Trade Finance Core Fund | High Yield Bond Portfolio | Total of Affiliated Trans- actions | |
| Balance of Shares Held 7/31/2015 | 33,683 | — | 117,879 | 5,521,116 | 1,325,624 | 241,956 | 811,201 | 8,051,459 |
| Pur- chases/ Additions | 36,531 | 234,499 | 159,270 | 53,677,933 | 728,696 | 65,664 | 487,907 | 55,390,500 |
| Sales/ Reductions | (70,214) | (67,616) | (57,058) | (54,996,614) | (543,172) | — | (472,795) | (56,207,469) |
| Balance of Shares Held 7/31/2016 | — | 166,883 | 220,091 | 4,202,435 | 1,511,148 | 307,620 | 826,313 | 7,234,490 |
| Value | $— | $1,707,215 | $2,203,112 | $4,202,435 | $15,217,257 | $2,867,023 | $5,147,928 | $31,344,970 |
| Dividend Income/ Allocated Investment Income | $75,273 | $10,610 | $75,055 | $20,539 | $374,152 | $103,572 | $320,997 | $980,198 |
| Allocated Net Realized Gain (Loss) | $(70,479) | $— | $— | $— | $— | $— | $— | $(70,479) |
| Purchases | $116,201,935 |
| Sales | $120,361,289 |
September 22, 2016
| Beginning Account Value 2/1/2016 | Ending Account Value 7/31/2016 | Expenses Paid During Period1 | |
| Actual: | |||
| Class A Shares | $1,000 | $1,091.10 | $6.76 |
| Class C Shares | $1,000 | $1,087.40 | $10.64 |
| Class R Shares | $1,000 | $1,089.90 | $8.11 |
| Institutional Shares | $1,000 | $1,093.00 | $5.46 |
| Hypothetical (assuming a 5% return before expenses): | |||
| Class A Shares | $1,000 | $1,018.40 | $6.52 |
| Class C Shares | $1,000 | $1,014.67 | $10.27 |
| Class R Shares | $1,000 | $1,017.11 | $7.82 |
| Institutional Shares | $1,000 | $1,019.64 | $5.27 |
| 1 | Expenses are equal to the Fund's annualized net expense ratios, multiplied by the average account value over the period, multiplied by 182/366 (to reflect the one-half-year period). The annualized net expense ratios are as follows: |
| Class A Shares | 1.30% |
| Class C Shares | 2.05% |
| Class R Shares | 1.56% |
| Institutional Shares | 1.05% |
| Name Birth Date Positions Held with Trust Date Service Began | Principal Occupation(s) for Past Five Years, Other Directorships Held and Previous Position(s) |
| J. Christopher Donahue* Birth Date: April 11, 1949 President and Trustee Indefinite Term Began serving: May 2006 | Principal Occupations: Principal Executive Officer and President of certain of the Funds in the Federated Fund Family; Director or Trustee of the Funds in the Federated Fund Family; President, Chief Executive
Officer and Director, Federated Investors, Inc.; Chairman and Trustee, Federated Investment Management Company; Trustee, Federated Investment Counseling; Chairman and Director, Federated Global Investment Management
Corp.; Chairman, Federated Equity Management Company of Pennsylvania and Passport Research, Ltd. (investment advisory subsidiary of Federated); Trustee, Federated Shareholder Services Company; Director, Federated
Services Company. Previous Positions: President, Federated Investment Counseling; President and Chief Executive Officer, Federated Investment Management Company, Federated Global Investment Management Corp. and Passport Research, Ltd. |
| Name Birth Date Positions Held with Trust Date Service Began | Principal Occupation(s) for Past Five Years, Other Directorships Held and Previous Position(s) |
| John B. Fisher* Birth Date: May 16, 1956 Trustee Indefinite Term Began serving: May 2016 | Principal Occupations: Principal Executive Officer and President of certain of the Funds in the Federated Fund Family; Director or Trustee of certain of the Funds in the Federated Fund Family; Vice President,
Federated Investors, Inc.; President, Director/Trustee and CEO, Federated Advisory Services Company, Federated Equity Management Company of Pennsylvania, Federated Global Investment Management Corp., Federated
Investment Counseling, Federated Investment Management Company; President and CEO of Passport Research, Ltd.; President of some of the Funds in the Federated Fund Complex and Director, Federated Investors Trust
Company. Previous Positions: President and Director of the Institutional Sales Division of Federated Securities Corp.; President and Director of Federated Investment Counseling; Director, Edgewood Securities Corp.; Director, Federated Services Company; Director, Federated Investors, Inc.; Chairman and Director, Southpointe Distribution Services, Inc. and President, Technology, Federated Services Company. |
| * | Reasons for “interested” status: J. Christopher Donahue and John B. Fisher are interested due to their beneficial ownership of shares of Federated Investors, Inc. and due to positions they hold with Federated and its subsidiaries. J. Christopher Donahue is the son of John F. Donahue, Chairman Emeritus of the Federated Funds. |
| Name Birth Date Positions Held with Trust Date Service Began | Principal Occupation(s) for Past Five Years, Other Directorships Held, Previous Position(s) and Qualifications |
| John T. Collins Birth Date: January 24, 1947 Trustee Indefinite Term Began serving: October 2013 | Principal Occupations: Director or Trustee of the Federated Fund Family; Retired. Other Directorships Held: Director, Chair of the Compensation Committee, Audit Committee member, KLX Corp. Qualifications: Mr. Collins has served in several business and financial management roles and directorship positions throughout his career. Mr. Collins previously served as Chairman and CEO, The Collins Group, Inc. (a private equity firm). Mr. Collins serves as Chairman Emeriti, Bentley University. Mr. Collins previously served as Director, FleetBoston Financial Corp.; Director and Audit Committee Member, Bank of America Corp. and Director, Beth Israel Deaconess Medical Center (Harvard University Affiliate Hospital). |
| Name Birth Date Positions Held with Trust Date Service Began | Principal Occupation(s) for Past Five Years, Other Directorships Held, Previous Position(s) and Qualifications |
| G. Thomas Hough Birth Date: February 28, 1955 Trustee Indefinite Term Began serving: August 2015 | Principal Occupations: Director or Trustee of the Federated Fund Family; Retired. Other Directorships Held: Director, Chair of the Audit Committee, Governance Committee, Publix Super Markets, Inc. Qualifications: Mr. Hough has served in accounting, business management and directorship positions throughout his career. Mr. Hough most recently held the position of Americas Vice Chair of Assurance with Ernst & Young LLP. Mr. Hough is an Executive Committee member of the United States Golf Association, he serves on the President's Cabinet and Business School Board of Visitors for the University of Alabama and is on the Business School Board of Visitors for Wake Forest University. |
| Maureen Lally-Green Birth Date: July 5, 1949 Trustee Indefinite Term Began serving: August 2009 | Principal Occupations: Director or Trustee of the Federated Fund Family; Interim Dean of the Duquesne University School of Law; Adjunct Professor of Law, Duquesne University School of Law. Other Directorships Held: Director, CONSOL Energy Inc. Qualifications: Judge Lally-Green has served in various legal and business roles and directorship positions throughout her career. Judge Lally-Green previously served as: Associate General Secretary, Diocese of Pittsburgh; a member of the Superior Court of Pennsylvania; and as a Professor of Law, Duquesne University School of Law. Judge Lally-Green also holds the positions on either a public or not for profit Board of Directors as follows: Member, Pennsylvania State Board of Education (public); Director and Chair, UPMC Mercy Hospital; Regent, St. Vincent Seminary; Director and Vice Chair, Our Campaign for the Church Alive!, Inc.; Director, Saint Vincent College; and Director and Chair, Cardinal Wuerl North Catholic High School, Inc. Judge Lally-Green has held the positions of: Director, Auberle; Director, Ireland Institute of Pittsburgh; Director, Saint Thomas More Society; and Director, Catholic High Schools of the Diocese of Pittsburgh, Inc. |
| Peter E. Madden Birth Date: March 16, 1942 Trustee Indefinite Term Began serving: June 2006 | Principal Occupation: Director or Trustee, and Chair of the Board of Directors or Trustees, of the Federated Fund Family; Retired. Other Directorships Held: None. Qualifications: Mr. Madden has served in several business management, mutual fund services and directorship positions throughout his career. Mr. Madden previously served as President, Chief Operating Officer and Director, State Street Bank and Trust Company (custodian bank) and State Street Corporation (financial services). He was Director, VISA USA and VISA International and Chairman and Director, Massachusetts Bankers Association. Mr. Madden served as Director, Depository Trust Corporation and Director, The Boston Stock Exchange. Mr. Madden also served as a Representative to the Commonwealth of Massachusetts General Court. |
| Name Birth Date Positions Held with Trust Date Service Began | Principal Occupation(s) for Past Five Years, Other Directorships Held, Previous Position(s) and Qualifications |
| Charles F. Mansfield, Jr. Birth Date: April 10, 1945 Trustee Indefinite Term Began serving: June 2006 | Principal Occupations: Director or Trustee of the Federated Fund Family; Management Consultant. Other Directorships Held: None. Qualifications: Mr. Mansfield has served in several banking, business management and educational roles and directorship positions throughout his career. Mr. Mansfield previously served as Chief Executive Officer, PBTC International Bank; Partner, Arthur Young & Company (now Ernst & Young LLP); Chief Financial Officer of Retail Banking Sector, Chase Manhattan Bank; Senior Vice President, HSBC Bank USA (formerly, Marine Midland Bank); Vice President, Citibank; Assistant Professor of Banking and Finance, Frank G. Zarb School of Business, Hofstra University; Executive Vice President DVC Group, Inc. (marketing, communications and technology). |
| Thomas M. O'Neill Birth Date: June 14, 1951 Trustee Indefinite Term Began serving: October 2006 | Principal Occupations: Director or Trustee, Chair of the Audit Committee of the Federated Fund Family; Sole Proprietor, Navigator Management Company (investment and strategic consulting). Other Directorships Held: None. Qualifications: Mr. O'Neill has served in several business, mutual fund and financial management roles and directorship positions throughout his career. Mr. O'Neill serves as Director, Medicines for Humanity and Director, The Golisano Children's Museum of Naples, Florida. Mr. O'Neill previously served as Chief Executive Officer and President, Managing Director and Chief Investment Officer, Fleet Investment Advisors; President and Chief Executive Officer, Aeltus Investment Management, Inc.; General Partner, Hellman, Jordan Management Co., Boston, MA; Chief Investment Officer, The Putnam Companies, Boston, MA; Credit Analyst and Lending Officer, Fleet Bank; Director and Consultant, EZE Castle Software (investment order management software); and Director, Midway Pacific (lumber). |
| P. Jerome Richey Birth Date: February 23, 1949 Trustee Indefinite Term Began serving: October 2013 | Principal Occupations: Director or Trustee of the Federated Fund Family; Management Consultant. Other Directorships Held: None. Qualifications: Mr. Richey has served in several business and legal management roles and directorship positions throughout his career. Mr. Richey most recently held the positions of Senior Vice Chancellor and Chief Legal Officer, University of Pittsburgh. Mr. Richey serves as Board Member, Epilepsy Foundation of Western Pennsylvania and Board member, World Affairs Council of Pittsburgh. Mr. Richey previously served as Chief Legal Officer and Executive Vice President, CONSOL Energy Inc. and Shareholder, Buchanan Ingersoll & Rooney PC (a law firm). |
| Name Birth Date Positions Held with Trust Date Service Began | Principal Occupation(s) for Past Five Years, Other Directorships Held, Previous Position(s) and Qualifications |
| John S. Walsh Birth Date: November 28, 1957 Trustee Indefinite Term Began serving: June 2006 | Principal Occupations: Director or Trustee of the Federated Fund Family; President and Director, Heat Wagon, Inc. (manufacturer of construction temporary heaters); President and Director, Manufacturers
Products, Inc. (distributor of portable construction heaters); President, Portable Heater Parts, a division of Manufacturers Products, Inc. Other Directorships Held: None. Qualifications: Mr. Walsh has served in several business management roles and directorship positions throughout his career. Mr. Walsh previously served as Vice President, Walsh & Kelly, Inc. (paving contractors). |
| Name Birth Date Address Positions Held with Trust Date Service Began | Principal Occupation(s) for Past Five Years and Previous Position(s) |
| John W. McGonigle Birth Date: October 26, 1938 Secretary Officer since: May 2006 | Principal Occupations: Executive Vice President and Secretary of the Federated Fund Family; Vice Chairman, Executive Vice President, Secretary and Director, Federated Investors, Inc. Previous Positions: Trustee, Federated Investment Management Company and Federated Investment Counseling; Director, Federated Global Investment Management Corp., Federated Services Company and Federated Securities Corp. |
| Lori A. Hensler Birth Date: January 6, 1967 TREASURER Officer since: April 2013 | Principal Occupations: Principal Financial Officer and Treasurer of the Federated Fund Family; Senior Vice President, Federated Administrative Services; Financial and Operations Principal for Federated
Securities Corp. and Edgewood Services, Inc.; and Assistant Treasurer, Federated Investors Trust Company. Ms. Hensler has received the Certified Public Accountant designation. Previous Positions: Controller of Federated Investors, Inc.; Senior Vice President and Assistant Treasurer, Federated Investors Management Company; Treasurer, Federated Investors Trust Company; Assistant Treasurer, Federated Administrative Services, Federated Administrative Services, Inc., Federated Securities Corp., Edgewood Services, Inc., Federated Advisory Services Company, Federated Equity Management Company of Pennsylvania, Federated Global Investment Management Corp., Federated Investment Counseling, Federated Investment Management Company, Passport Research, Ltd., and Federated MDTA, LLC; Financial and Operations Principal for Federated Securities Corp., Edgewood Services, Inc. and Southpointe Distribution Services, Inc. |
| Name Birth Date Address Positions Held with Trust Date Service Began | Principal Occupation(s) for Past Five Years and Previous Position(s) |
| Peter J. Germain Birth Date: September 3, 1959 CHIEF LEGAL OFFICER Officer since: June 2006 | Principal Occupations: Mr. Germain is Chief Legal Officer of the Federated Fund Family. He is General Counsel and Vice President, Federated Investors, Inc.; President, Federated Administrative Services and
Federated Administrative Services, Inc.; Vice President, Federated Securities Corp.; Secretary, Federated Private Asset Management, Inc.; and Secretary, Retirement Plan Service Company of America. Mr. Germain joined
Federated in 1984 and is a member of the Pennsylvania Bar Association. Previous Positions: Deputy General Counsel, Special Counsel, Managing Director of Mutual Fund Services, Federated Investors, Inc.; Senior Vice President, Federated Services Company; and Senior Corporate Counsel, Federated Investors, Inc. |
| Stephen Van Meter Birth Date: June 5, 1975 CHIEF COMPLIANCE OFFICER AND SENIOR VICE PRESIDENT Officer since: July 2015 | Principal Occupations: Senior Vice President and Chief Compliance Officer of the Federated Fund Family; Vice President and Chief Compliance Officer of Federated Investors, Inc. and Chief Compliance Officer of
certain of its subsidiaries. Mr. Van Meter joined Federated in October 2011. He holds FINRA licenses under Series 3, 7, 24 and 66. Previous Positions: Mr. Van Meter previously held the position of Compliance Operating Officer, Federated Investors, Inc. Prior to joining Federated, Mr. Van Meter served at the United States Securities and Exchange Commission in the positions of Senior Counsel, Office of Chief Counsel, Division of Investment Management and Senior Counsel, Division of Enforcement. |
| Stephen F. Auth Birth Date: September 13, 1956 101 Park Avenue 41st Floor New York, NY 10178 CHIEF INVESTMENT OFFICER Officer since: June 2012 | Principal Occupations: Stephen F. Auth is Chief Investment Officer of various Funds in the Federated Fund Family; Executive Vice President, Federated Investment Counseling, Federated Global Investment
Management Corp. and Federated Equity Management Company of Pennsylvania. Previous Positions: Executive Vice President, Federated Investment Management Company and Passport Research, Ltd. (investment advisory subsidiary of Federated); Senior Vice President, Global Portfolio Management Services Division; Senior Vice President, Federated Investment Management Company and Passport Research, Ltd.; Senior Managing Director and Portfolio Manager, Prudential Investments. |
4000 Ericsson Drive
Warrendale, PA 15086-7561
or call 1-800-341-7400.
CUSIP 31421R833
CUSIP 31421R825
CUSIP 31421R692
2016 ©Federated Investors, Inc.
| 1 | Please see the footnotes to the line graphs below for definitions of, and further information about, the R1000G. |
| 2 | Please see the footnotes to the line graphs below for definitions of, and further information about, the MLGFA. |
| 3 | The Russell 3000® Index measures the performance of the largest 3,000 U.S. companies representing approximately 98% of the investable U.S. equity market. The Russell 3000® Index is constructed to provide a comprehensive, unbiased and stable barometer of the broad market, and is completely reconstituted annually to ensure new and growing equities are reflected. The index is unmanaged, and it is not possible to invest directly in an index. |
| 4 | The Russell Top 200® Index measures the performance of the largest cap segment of the U.S. equity universe. The Russell Top 200® Index is a subset of the Russell 3000® Index. It includes approximately 200 of the largest securities based on a combination of their market cap and current index membership and represents approximately 68% of the U.S. market. The Russell Top 200® Index is constructed to provide a comprehensive and unbiased barometer for this very large cap segment and is completely reconstituted annually to ensure new and growing equities are reflected. The index is unmanaged, and it is not possible to invest directly in an index. |
| 5 | The Russell Midcap® Index measures the performance of the mid-cap segment of the U.S. equity universe. The Russell Midcap® Index is a subset of the Russell 1000® Index. It includes approximately 800 of the smallest securities based on a combination of their market cap and current index membership. The Russell Midcap® Index represents approximately 31% of the total market capitalization of the Russell 1000® companies. The Russell Midcap® Index is constructed to provide a comprehensive and unbiased barometer for the mid-cap segment. The Russell Midcap Index is completely reconstituted annually to ensure larger stocks do not distort the performance and characteristics of the true mid-cap opportunity set. The index is unmanaged, and it is not possible to invest directly in an index. |
| 6 | Small-cap stocks may be less liquid and subject to greater price volatility than large-cap stocks. |
| 7 | The Russell 2000® Index measures the performance of the small-cap segment of the U.S. equity universe. The Russell 2000® Index is a subset of the Russell 3000® Index representing approximately 10% of the total market capitalization of that index. It includes approximately 2000 of the smallest securities based on a combination of their market cap and current index membership. The Russell 2000® Index is constructed to provide a comprehensive and unbiased small-cap barometer and is completely reconstituted annually to ensure larger stocks do not distort the performance and characteristics of the true small-cap opportunity set. The index is unmanaged, and it is not possible to invest directly in an index. |
| 8 | The Russell Microcap® Index measures the performance of the microcap segment of the U.S. equity market. Microcap stocks make up less than 3% of the U.S. equity market (by market cap) and consist of the smallest 1,000 securities in the small-cap Russell 2000® Index, plus the next 1,000 smallest eligible securities by market cap. The Russell Microcap® Index is constructed to provide a comprehensive and unbiased barometer for the microcap segment trading on national exchanges and is completely reconstituted annually to ensure new and growing equities are reflected and companies continue to reflect appropriate capitalization and value characteristics. The Russell Microcap® Index is unmanaged, and it is not possible to invest directly in an index. |
| 9 | The Russell 3000® Value Index measures the performance of the broad value segment of U.S. equity value universe. It includes those Russell 3000® Index companies with lower price-to-book ratios and lower forecasted growth values. The Russell 3000® Value Index is constructed to provide a comprehensive, unbiased and stable barometer of the broad value market. The Russell 3000 Value Index is completely reconstituted annually to ensure new and growing equities are included and that the represented companies continue to reflect value characteristics. The index is unmanaged, and it is not possible to invest directly in an index. |
| 10 | The Russell 3000® Growth Index measures the performance of the broad growth segment of the U.S. equity universe. It includes those Russell 3000® Index companies with higher price-to-book ratios and higher forecasted growth values. The Russell 3000® Growth Index is constructed to provide a comprehensive, unbiased and stable barometer of the broad growth market. The Russell 3000 Growth Index is completely reconstituted annually to ensure new and growing equities are included and that the represented companies continue to reflect growth characteristics. The index is unmanaged, and it is not possible to invest directly in an index. |
| 11 | The Russell Microcap® Value Index measures the performance of the micro-cap value segment of the U.S. equity universe. It includes those Russell Microcap® Index companies with higher price-to-book ratios and lower forecasted growth values. The Russell Microcap® Value Index is constructed to provide a comprehensive, unbiased and stable barometer of the micro-cap value market. The Russell Microcap Value Index is completely reconstituted annually to ensure new and growing equities are included and that the represented companies continue to reflect value characteristics. The index is unmanaged, and it is not possible to invest directly in an index. |
| 12 | The Russell Microcap® Growth Index measures the performance of the microcap growth segment of the U.S. equity market. It includes Russell Microcap companies that are considered more growth oriented relative to the overall market as defined by Russell's leading style methodology. The Russell Microcap® Growth Index is constructed to provide a comprehensive and unbiased barometer for the microcap growth segment of the market. The Russell Microcap® Growth Index is completely reconstituted annually to ensure larger stocks do not distort performance and characteristics of the microcap opportunity set. The Russell Microcap® Growth Index is unmanaged, and it is not possible to invest directly in an index. |
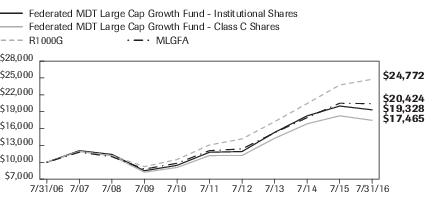
| ■ | Total returns shown for Class C Shares include the maximum contingent deferred sales charge of 1.00% as applicable. |
| 1 Year | 5 Years | 10 Years | |
| Class A Shares | -8.94% | 8.88% | 5.94% |
| Class B Shares5 | -9.07% | 9.02% | 5.93% |
| Class C Shares | -5.24% | 9.29% | 5.73% |
| Institutional Shares | -3.40% | 10.40% | 6.81% |
| R1000G | 4.35% | 13.62% | 9.50% |
| MLGFA | -0.40% | 11.37% | 7.98% |
| 1 | Represents a hypothetical investment of $10,000 in the Fund after deducting applicable sales charges: for Class A Shares, the maximum sales charge of 5.50% ($10,000 investment minus $550 sales charges = $9,450); for Class B Shares, the maximum contingent deferred sales charge is 5.50% on any redemption less than one year from the purchase date; for Class C Shares, a 1.00% contingent deferred sales charge would be applied to any redemption less than one year from the purchase date. The Fund's performance assumes the reinvestment of all dividends and distributions. The R1000G has been adjusted to reflect reinvestment of dividends on securities. |
| 2 | The Fund is the successor to the MDT Large Cap Growth Fund pursuant to a reorganization that took place on December 8, 2006. Prior to that date, the Fund had no investment operations. Accordingly, the performance information shown for the periods prior to that date is that of the MDT Large Cap Growth Fund. |
| 3 | The R1000G measures the performance of the large-cap growth segment of the U.S. equity universe. It includes those Russell 1000® Index companies with higher price-to-book ratios and higher forecasted growth values. The R1000G is constructed to provide a comprehensive and unbiased barometer for the large-cap growth segment. The R1000G is completely reconstituted annually to ensure new and growing equities are included and that the represented companies continue to reflect growth characteristics. The R1000G is unmanaged and, unlike the Fund, is not affected by cash flows. It is not possible to invest directly in an index. The R1000G is not adjusted to reflect sales charges, expenses or other fees that the Securities and Exchange Commission requires to be reflected in the Fund's performance. |
| 4 | Morningstar figures represent the average of the total returns reported by all the mutual funds designated by Morningstar as falling into the respective category indicated. They do not reflect sales charges. |
| 5 | The start of performance date for the Fund was September 15, 2005. Class B Shares of the Fund were offered beginning March 29, 2007. Performance results shown before that date are for the Fund's Institutional Shares and have been adjusted for the maximum contingent deferred sales charge and total annual operating expenses applicable to the Fund's Class B Shares. The Fund's Institutional Shares commenced operations on September 15, 2005. Subject to the expense adjustments described above, the Fund's Class B Shares annual returns would have been substantially similar to those of the Fund's Institutional Shares because Shares of each class are invested in the same portfolio of securities. |
| Industry Composition | Percentage of Total Net Assets |
| Internet Services | 8.1% |
| Software Packaged/Custom | 7.7% |
| Computers—Low End | 4.9% |
| Auto Original Equipment Manufacturers | 4.5% |
| Biotechnology | 4.4% |
| Financial Services | 4.1% |
| Cable TV | 3.9% |
| Services to Medical Professionals | 3.3% |
| Medical Supplies | 3.2% |
| Ethical Drugs | 3.0% |
| Soft Drinks | 2.8% |
| Computers—High End | 2.5% |
| Medical Technology | 2.5% |
| Shipbuilding | 2.5% |
| Hotels and Motels | 2.4% |
| Specialty Retailing | 2.3% |
| Chemicals | 2.2% |
| Grocery Chain | 2.2% |
| Multiline Retail | 2.1% |
| Clothing Stores | 1.9% |
| Cosmetics & Toiletries | 1.7% |
| Airline—Regional | 1.4% |
| Computer Services | 1.3% |
| AT&T Divestiture | 1.2% |
| Distillers | 1.2% |
| Hospitals | 1.2% |
| Life Insurance | 1.2% |
| Broadcasting | 1.1% |
| Property Liability Insurance | 1.0% |
| Other2 | 16.6% |
| Cash Equivalents3 | 1.7% |
| Other Assets and Liabilities—Net4 | (0.1)% |
| TOTAL | 100.0% |
| 1 | Except for Cash Equivalents and Other Assets and Liabilities, industry classifications are based upon, and individual portfolio securities are assigned to, the classifications of the Global Industry Classification Standard (GICS) except that the Adviser assigns a classification to securities not classified by the GICS and to securities for which the Adviser does not have access to the classification made by the GICS. |
| 2 | For purposes of this table, industry classifications which constitute less than 1.0% of the Fund's total net assets have been aggregated under the designation “Other.” |
| 3 | Cash Equivalents include any investments in money market mutual funds and/or overnight repurchase agreements. |
| 4 | Assets, other than investments in securities, less liabilities. See Statement of Assets and Liabilities. |
| Shares | Value | ||
| COMMON STOCKS—98.4% | |||
| Airline - National—0.8% | |||
| 13,961 | 1 | Jet Blue Airways Corp. | $255,905 |
| 8,151 | 1 | United Continental Holdings, Inc. | 382,201 |
| TOTAL | 638,106 | ||
| Airline - Regional—1.4% | |||
| 8,106 | Alaska Air Group, Inc. | 544,885 | |
| 15,047 | Southwest Airlines Co. | 556,890 | |
| TOTAL | 1,101,775 | ||
| Airlines—0.8% | |||
| 15,518 | Delta Air Lines, Inc. | 601,322 | |
| Apparel—0.6% | |||
| 4,531 | PVH Corp. | 457,903 | |
| AT&T Divestiture—1.2% | |||
| 16,978 | Verizon Communications, Inc. | 940,751 | |
| Auto Manufacturing—0.5% | |||
| 3,145 | Allison Transmission Holdings, Inc. | 90,639 | |
| 25,317 | Ford Motor Co. | 320,513 | |
| TOTAL | 411,152 | ||
| Auto Original Equipment Manufacturers—4.5% | |||
| 12,670 | Lear Corp. | 1,437,412 | |
| 6,895 | 1 | O'Reilly Automotive, Inc. | 2,003,894 |
| 1,058 | 1 | Visteon Corp. | 74,155 |
| TOTAL | 3,515,461 | ||
| Auto Rentals—0.3% | |||
| 3,172 | 1 | United Rentals, Inc. | 252,713 |
| Baking—0.3% | |||
| 12,348 | Flowers Foods, Inc. | 227,080 | |
| Biotechnology—4.4% | |||
| 11,675 | Amgen, Inc. | 2,008,450 | |
| 1,030 | 1 | Charles River Laboratories International, Inc. | 90,568 |
| 15,508 | Gilead Sciences, Inc. | 1,232,421 | |
| 3,637 | 1 | Myriad Genetics, Inc. | 112,674 |
| TOTAL | 3,444,113 | ||
| Broadcasting—1.1% | |||
| 1,248 | 1 | AMC Networks, Inc. | 69,089 |
| 10,129 | CBS Corp., Class B | 528,937 |
| Shares | Value | ||
| COMMON STOCKS—continued | |||
| Broadcasting—continued | |||
| 9,100 | 1 | Discovery Communications, Inc., Class A | $228,319 |
| TOTAL | 826,345 | ||
| Building Supply Stores—0.9% | |||
| 8,563 | Lowe's Cos., Inc. | 704,564 | |
| Cable TV—3.9% | |||
| 73,976 | 1 | MSG Networks, Inc., Class A | 1,187,315 |
| 40,416 | Viacom, Inc., Class B | 1,837,715 | |
| TOTAL | 3,025,030 | ||
| Chemicals—2.2% | |||
| 22,442 | LyondellBasell Industries NV, Class A | 1,688,985 | |
| Clothing Stores—1.9% | |||
| 7,887 | 1 | Fossil, Inc. | 249,229 |
| 38,363 | Gap (The), Inc. | 989,382 | |
| 4,310 | 1 | Michael Kors Holdings Ltd. | 222,913 |
| TOTAL | 1,461,524 | ||
| Computer Peripherals—0.6% | |||
| 16,792 | NetApp, Inc. | 442,469 | |
| Computer Services—1.3% | |||
| 12,507 | 1 | Salesforce.com, Inc. | 1,023,073 |
| Computers - High End—2.5% | |||
| 12,325 | IBM Corp. | 1,979,641 | |
| Computers - Low End—4.9% | |||
| 37,006 | Apple, Inc. | 3,856,395 | |
| Contracting—0.1% | |||
| 2,771 | Chicago Bridge & Iron Co., N.V. | 93,688 | |
| Cosmetics & Toiletries—1.7% | |||
| 15,906 | Avon Products, Inc. | 64,737 | |
| 879 | Estee Lauder Cos., Inc., Class A | 81,659 | |
| 5,600 | 1 | Sally Beauty Holdings, Inc. | 164,248 |
| 3,846 | 1 | Ulta Salon Cosmetics & Fragrance, Inc. | 1,004,614 |
| TOTAL | 1,315,258 | ||
| Defense Aerospace—0.8% | |||
| 15,012 | 1 | Spirit Aerosystems Holdings, Inc., Class A | 651,221 |
| Defense Electronics—0.7% | |||
| 2,552 | Grainger (W.W.), Inc. | 558,505 | |
| Department Stores—0.9% | |||
| 2,873 | Dillards, Inc., Class A | 194,444 |
| Shares | Value | ||
| COMMON STOCKS—continued | |||
| Department Stores—continued | |||
| 6,348 | Target Corp. | $478,195 | |
| TOTAL | 672,639 | ||
| Discount Department Stores—0.3% | |||
| 4,592 | Foot Locker, Inc. | 273,775 | |
| Distillers—1.2% | |||
| 5,593 | Constellation Brands, Inc., Class A | 920,776 | |
| Diversified Consumer Services—0.2% | |||
| 3,283 | Block (H&R), Inc. | 78,103 | |
| 2,697 | 1 | ServiceMaster Global Holdings, Inc. | 102,027 |
| TOTAL | 180,130 | ||
| Ethical Drugs—3.0% | |||
| 16,576 | Bristol-Myers Squibb Co. | 1,240,050 | |
| 9,258 | 1 | United Therapeutics Corp. | 1,120,311 |
| TOTAL | 2,360,361 | ||
| Financial Services—4.1% | |||
| 14,400 | Ally Financial, Inc. | 259,776 | |
| 19,726 | Ameriprise Financial, Inc. | 1,890,540 | |
| 3,696 | Total System Services, Inc. | 188,200 | |
| 44,090 | Western Union Co. | 881,800 | |
| TOTAL | 3,220,316 | ||
| Grocery Chain—2.2% | |||
| 49,399 | Kroger Co. | 1,688,952 | |
| Home Building—0.4% | |||
| 8,721 | D. R. Horton, Inc. | 286,746 | |
| Home Products—0.8% | |||
| 9,449 | Tupperware Brands Corp. | 592,263 | |
| Hospitals—1.2% | |||
| 11,708 | 1 | HCA, Inc. | 903,038 |
| Hotels and Motels—2.4% | |||
| 26,887 | Wyndham Worldwide Corp. | 1,909,515 | |
| Internet Services—8.1% | |||
| 2,252 | 1 | Amazon.com, Inc. | 1,708,840 |
| 65,057 | 1 | eBay, Inc. | 2,027,176 |
| 16,798 | 1 | Facebook, Inc. | 2,081,944 |
| 8,891 | IAC Interactive Corp. | 515,323 | |
| TOTAL | 6,333,283 | ||
| Internet Software & Services—0.5% | |||
| 464 | 1 | Alphabet, Inc., Class A | 367,182 |
| Shares | Value | ||
| COMMON STOCKS—continued | |||
| IT Services—0.2% | |||
| 1,392 | Accenture PLC, Class A | $157,032 | |
| Life Insurance—1.2% | |||
| 12,000 | Prudential Financial, Inc. | 903,480 | |
| Medical Supplies—3.2% | |||
| 42,124 | Baxter International, Inc. | 2,022,795 | |
| 12,262 | 1 | Hologic, Inc. | 471,964 |
| TOTAL | 2,494,759 | ||
| Medical Technology—2.5% | |||
| 17,309 | 1 | Edwards Lifesciences Corp. | 1,982,227 |
| Multi-Industry Capital Goods—0.4% | |||
| 8,247 | 1 | HD Supply, Inc. | 298,459 |
| Multiline Retail—2.1% | |||
| 46,431 | Macy's, Inc. | 1,663,623 | |
| Mutual Fund Adviser—0.1% | |||
| 2,300 | Waddell & Reed Financial, Inc., Class A | 41,998 | |
| Office Equipment—0.7% | |||
| 28,428 | Pitney Bowes, Inc. | 548,945 | |
| Packaged Foods—0.5% | |||
| 6,630 | Campbell Soup Co. | 412,850 | |
| Personal & Household—0.4% | |||
| 5,300 | Nu Skin Enterprises, Inc., Class A | 283,020 | |
| Personal Loans—0.5% | |||
| 2,260 | 1 | Credit Acceptance Corp. | 408,314 |
| Pharmaceuticals—0.3% | |||
| 2,969 | 1 | Mallinckrodt PLC | 199,932 |
| Plastic Containers—0.1% | |||
| 2,262 | Sealed Air Corp. | 106,721 | |
| Printing—0.3% | |||
| 11,646 | Donnelley (R.R.) & Sons Co. | 208,696 | |
| Property Liability Insurance—1.0% | |||
| 6,906 | The Travelers Cos., Inc. | 802,615 | |
| Rubber—0.5% | |||
| 14,600 | Goodyear Tire & Rubber Co. | 418,582 | |
| Semiconductor Manufacturing—0.8% | |||
| 18,872 | Intel Corp. | 657,878 | |
| Semiconductors & Semiconductor Equipment—0.4% | |||
| 5,131 | NVIDIA Corp. | 292,980 |
| Shares | Value | ||
| COMMON STOCKS—continued | |||
| Services to Medical Professionals—3.3% | |||
| 23,816 | 1 | Express Scripts Holding Co. | $1,811,683 |
| 5,462 | UnitedHealth Group, Inc. | 782,159 | |
| TOTAL | 2,593,842 | ||
| Shipbuilding—2.5% | |||
| 11,118 | Huntington Ingalls Industries, Inc. | 1,918,744 | |
| Shoes—0.3% | |||
| 9,198 | 1 | Skechers USA, Inc., Class A | 220,936 |
| Soft Drinks—2.8% | |||
| 3,628 | Dr. Pepper Snapple Group, Inc. | 357,394 | |
| 17,007 | PepsiCo, Inc. | 1,852,403 | |
| TOTAL | 2,209,797 | ||
| Software Packaged/Custom—7.7% | |||
| 35,613 | CA, Inc. | 1,233,990 | |
| 6,634 | CDW Corp. | 284,798 | |
| 23,102 | 1 | Citrix Systems, Inc. | 2,059,081 |
| 7,756 | 1 | Electronic Arts, Inc. | 591,938 |
| 1,980 | Intuit, Inc. | 219,760 | |
| 3,125 | Marketaxess Holdings, Inc. | 505,188 | |
| 20,197 | Symantec Corp. | 412,625 | |
| 1,814 | 1 | Ultimate Software Group, Inc. | 379,307 |
| 5,077 | 1 | VMware, Inc., Class A | 370,520 |
| TOTAL | 6,057,207 | ||
| Specialty Retailing—2.3% | |||
| 27,388 | Bed Bath & Beyond, Inc. | 1,231,091 | |
| 5,900 | Big Lots, Inc. | 313,762 | |
| 4,516 | GNC Holdings, Inc. | 92,171 | |
| 1,560 | Nordstrom, Inc. | 68,999 | |
| 698 | Signet Jewelers Ltd. | 61,361 | |
| TOTAL | 1,767,384 | ||
| Technology Hardware Storage & Peripherals—0.2% | |||
| 4,349 | 1 | Teradata Corp. | 123,425 |
| Telecommunication Equipment & Services—0.9% | |||
| 9,988 | Motorola, Inc. | 692,967 | |
| Toys & Games—0.2% | |||
| 1,937 | Hasbro, Inc. | 157,342 | |
| Undesignated Consumer Cyclicals—0.3% | |||
| 3,443 | 1 | Herbalife Ltd. | 234,158 |
| Shares | Value | ||
| COMMON STOCKS—continued | |||
| Undesignated Consumer Cyclicals—continued | |||
| 3,300 | Weight Watchers International, Inc. | $39,369 | |
| TOTAL | 273,527 | ||
| TOTAL COMMON STOCKS (IDENTIFIED COST $73,172,320) | 76,823,332 | ||
| INVESTMENT COMPANY—1.7% | |||
| 1,355,892 | 2 | Federated Institutional Prime Value Obligations Fund, Institutional Shares, 0.36%3 (AT NET ASSET VALUE) | 1,355,892 |
| TOTAL INVESTMENTS—100.1% (IDENTIFIED COST $74,528,212)4 | 78,179,224 | ||
| OTHER ASSETS AND LIABILITIES - NET—(0.1)%5 | (73,035) | ||
| TOTAL NET ASSETS—100% | $78,106,189 |
| 1 | Non-income-producing security. |
| 2 | Affiliated holding. |
| 3 | 7-day net yield. |
| 4 | The cost of investments for federal tax purposes amounts to $74,767,181. |
| 5 | Assets, other than investments in securities, less liabilities. See Statement of Assets and Liabilities. |
| Year Ended July 31 | 2016 | 2015 | 2014 | 2013 | 2012 |
| Net Asset Value, Beginning of Period | $17.64 | $16.15 | $13.58 | $10.59 | $10.50 |
| Income From Investment Operations: | |||||
| Net investment income (loss)1 | 0.04 | 0.02 | 0.03 | 0.04 | (0.02) |
| Net realized and unrealized gain (loss) on investments | (0.70) | 1.47 | 2.54 | 2.95 | 0.11 |
| TOTAL FROM INVESTMENT OPERATIONS | (0.66) | 1.49 | 2.57 | 2.99 | 0.09 |
| Less Distributions: | |||||
| Distributions from net realized gain on investments | (1.80) | — | — | — | — |
| TOTAL DISTRIBUTIONS | (1.80) | — | — | — | — |
| Net Asset Value, End of Period | $15.18 | $17.64 | $16.15 | $13.58 | $10.59 |
| Total Return2 | (3.62)% | 9.23% | 18.92% | 28.23% | 0.86% |
| Ratios to Average Net Assets: | |||||
| Net expenses | 1.50% | 1.50% | 1.50% | 1.50% | 1.50% |
| Net investment income (loss) | 0.28% | 0.13% | 0.17% | 0.34% | (0.23)% |
| Expense waiver/reimbursement3 | 0.07% | 0.03% | 0.11% | 0.27% | 0.78% |
| Supplemental Data: | |||||
| Net assets, end of period (000 omitted) | $45,661 | $55,033 | $54,573 | $49,018 | $40,676 |
| Portfolio turnover | 69% | 91% | 51% | 135% | 258% |
| 1 | Per share numbers have been calculated using the average shares method. |
| 2 | Based on net asset value, which does not reflect the sales charge, redemption fee or contingent deferred sales charge, if applicable. |
| 3 | This expense decrease is reflected in both the net expense and the net investment income (loss) ratios shown above. |
| Year Ended July 31 | 2016 | 2015 | 2014 | 2013 | 2012 |
| Net Asset Value, Beginning of Period | $16.71 | $15.41 | $13.05 | $10.25 | $10.24 |
| Income From Investment Operations: | |||||
| Net investment income (loss)1 | (0.07) | (0.11) | (0.09) | (0.05) | (0.10) |
| Net realized and unrealized gain (loss) on investments | (0.68) | 1.41 | 2.45 | 2.85 | 0.11 |
| TOTAL FROM INVESTMENT OPERATIONS | (0.75) | 1.30 | 2.36 | 2.80 | 0.01 |
| Less Distributions: | |||||
| Distributions from net realized gain on investments | (1.80) | — | — | — | — |
| TOTAL DISTRIBUTIONS | (1.80) | — | — | — | — |
| Net Asset Value, End of Period | $14.16 | $16.71 | $15.41 | $13.05 | $10.25 |
| Total Return2 | (4.41)% | 8.44% | 18.08% | 27.32% | 0.10% |
| Ratios to Average Net Assets: | |||||
| Net expenses | 2.25% | 2.25% | 2.25% | 2.25% | 2.25% |
| Net investment income (loss) | (0.49)% | (0.65)% | (0.59)% | (0.44)% | (0.98)% |
| Expense waiver/reimbursement3 | 0.08% | 0.03% | 0.11% | 0.26% | 0.78% |
| Supplemental Data: | |||||
| Net assets, end of period (000 omitted) | $14,925 | $16,175 | $10,519 | $7,428 | $4,932 |
| Portfolio turnover | 69% | 91% | 51% | 135% | 258% |
| 1 | Per share numbers have been calculated using the average shares method. |
| 2 | Based on net asset value, which does not reflect the sales charge, redemption fee or contingent deferred sales charge, if applicable. |
| 3 | This expense decrease is reflected in both the net expense and the net investment income (loss) ratios shown above. |
| Year Ended July 31 | 2016 | 2015 | 2014 | 2013 | 2012 |
| Net Asset Value, Beginning of Period | $16.34 | $15.07 | $12.76 | $10.03 | $10.02 |
| Income From Investment Operations: | |||||
| Net investment income (loss)1 | (0.06) | (0.10) | (0.08) | (0.05) | (0.09) |
| Net realized and unrealized gain (loss) on investments | (0.67) | 1.37 | 2.39 | 2.78 | 0.10 |
| TOTAL FROM INVESTMENT OPERATIONS | (0.73) | 1.27 | 2.31 | 2.73 | 0.01 |
| Less Distributions: | |||||
| Distributions from net realized gain on investments | (1.80) | — | — | — | — |
| TOTAL DISTRIBUTIONS | (1.80) | — | — | — | — |
| Net Asset Value, End of Period | $13.81 | $16.34 | $15.07 | $12.76 | $10.03 |
| Total Return2 | (4.39)% | 8.43% | 18.10% | 27.22% | 0.10% |
| Ratios to Average Net Assets: | |||||
| Net expenses | 2.25% | 2.25% | 2.25% | 2.25% | 2.25% |
| Net investment income (loss) | (0.46)% | (0.63)% | (0.59)% | (0.43)% | (0.98)% |
| Expense waiver/reimbursement3 | 0.07% | 0.03% | 0.11% | 0.27% | 0.78% |
| Supplemental Data: | |||||
| Net assets, end of period (000 omitted) | $10,052 | $12,904 | $11,991 | $9,830 | $7,001 |
| Portfolio turnover | 69% | 91% | 51% | 135% | 258% |
| 1 | Per share numbers have been calculated using the average shares method. |
| 2 | Based on net asset value, which does not reflect the sales charge, redemption fee or contingent deferred sales charge, if applicable. |
| 3 | This expense decrease is reflected in both the net expense and the net investment income (loss) ratios shown above. |
| Year Ended July 31 | 2016 | 2015 | 2014 | 2013 | 2012 |
| Net Asset Value, Beginning of Period | $18.13 | $16.55 | $13.88 | $10.80 | $10.68 |
| Income From Investment Operations: | |||||
| Net investment income1 | 0.08 | 0.07 | 0.06 | 0.07 | 0.002 |
| Net realized and unrealized gain (loss) on investments | (0.72) | 1.51 | 2.61 | 3.01 | 0.12 |
| TOTAL FROM INVESTMENT OPERATIONS | (0.64) | 1.58 | 2.67 | 3.08 | 0.12 |
| Less Distributions: | |||||
| Distributions from net realized gain on investments | (1.80) | — | — | — | — |
| TOTAL DISTRIBUTIONS | (1.80) | — | — | — | — |
| Net Asset Value, End of Period | $15.69 | $18.13 | $16.55 | $13.88 | $10.80 |
| Total Return3 | (3.40)% | 9.55% | 19.24% | 28.52% | 1.12% |
| Ratios to Average Net Assets: | |||||
| Net expenses | 1.25% | 1.25% | 1.25% | 1.25% | 1.25% |
| Net investment income | 0.52% | 0.37% | 0.40% | 0.58% | 0.02% |
| Expense waiver/reimbursement4 | 0.07% | 0.03% | 0.10% | 0.27% | 0.78% |
| Supplemental Data: | |||||
| Net assets, end of period (000 omitted) | $7,469 | $7,888 | $7,502 | $5,002 | $3,774 |
| Portfolio turnover | 69% | 91% | 51% | 135% | 258% |
| 1 | Per share numbers have been calculated using the average shares method. |
| 2 | Represents less than $0.01. |
| 3 | Based on net asset value. |
| 4 | This expense decrease is reflected in both the net expense and the net investment income ratios shown above. |
| Assets: | ||
| Total investment in securities, at value including $1,355,892 of investment in an affiliated holding (Note 5) (identified cost $74,528,212) | $78,179,224 | |
| Income receivable | 31,142 | |
| Receivable for investments sold | 1,650,471 | |
| Receivable for shares sold | 2,345 | |
| TOTAL ASSETS | 79,863,182 | |
| Liabilities: | ||
| Payable for investments purchased | $1,562,618 | |
| Payable for shares redeemed | 33,174 | |
| Payable to adviser (Note 5) | 4,380 | |
| Payable for administrative fee (Note 5) | 501 | |
| Payable for distribution services fee (Note 5) | 15,535 | |
| Payable for other service fees (Notes 2 and 5) | 26,277 | |
| Payable for share registration costs | 36,080 | |
| Accrued expenses (Note 5) | 78,428 | |
| TOTAL LIABILITIES | 1,756,993 | |
| Net assets for 5,266,856 shares outstanding | $78,106,189 | |
| Net Assets Consist of: | ||
| Paid-in capital | $74,255,671 | |
| Net unrealized appreciation of investments | 3,651,012 | |
| Accumulated net realized gain on investments | 199,506 | |
| TOTAL NET ASSETS | $78,106,189 |
| Net Asset Value, Offering Price and Redemption Proceeds Per Share | ||
| Class A Shares: | ||
| Net asset value per share ($45,660,633 ÷ 3,008,706 shares outstanding), no par value, unlimited shares authorized | $15.18 | |
| Offering price per share (100/94.50 of $15.18) | $16.06 | |
| Redemption proceeds per share | $15.18 | |
| Class B Shares: | ||
| Net asset value per share ($14,925,266 ÷ 1,054,210 shares outstanding), no par value, unlimited shares authorized | $14.16 | |
| Offering price per share | $14.16 | |
| Redemption proceeds per share (94.50/100 of $14.16) | $13.38 | |
| Class C Shares: | ||
| Net asset value per share ($10,051,520 ÷ 727,775 shares outstanding), no par value, unlimited shares authorized | $13.81 | |
| Offering price per share | $13.81 | |
| Redemption proceeds per share (99.00/100 of $13.81) | $13.67 | |
| Institutional Shares: | ||
| Net asset value per share ($7,468,770 ÷ 476,165 shares outstanding), no par value, unlimited shares authorized | $15.69 | |
| Offering price per share | $15.69 | |
| Redemption proceeds per share | $15.69 |
| Investment Income: | |||
| Dividends (including $4,342 received from an affiliated holding (Note 5) and net of foreign taxes withheld of $170) | $1,437,957 | ||
| Expenses: | |||
| Investment adviser fee (Note 5) | $604,695 | ||
| Administrative fee (Note 5) | 63,071 | ||
| Custodian fees | 15,039 | ||
| Transfer agent fee | 179,857 | ||
| Directors'/Trustees' fees (Note 5) | 2,315 | ||
| Auditing fees | 24,800 | ||
| Legal fees | 8,236 | ||
| Portfolio accounting fees | 74,980 | ||
| Distribution services fee (Note 5) | 189,777 | ||
| Other service fees (Notes 2 and 5) | 183,337 | ||
| Share registration costs | 56,534 | ||
| Printing and postage | 31,172 | ||
| Miscellaneous (Note 5) | 11,467 | ||
| TOTAL EXPENSES | 1,445,280 | ||
| Waiver and Reimbursements: | |||
| Waiver/reimbursement of investment adviser fee (Note 5) | $(60,391) | ||
| Reimbursement of other operating expenses (Notes 2 and 5) | (30) | ||
| TOTAL WAIVER AND REIMBURSEMENTS | (60,421) | ||
| Net expenses | 1,384,859 | ||
| Net investment income | 53,098 | ||
| Realized and Unrealized Gain (Loss) on Investments: | |||
| Net realized gain on investments | 199,433 | ||
| Net change in unrealized appreciation of investments | (4,502,195) | ||
| Net realized and unrealized loss on investments | (4,302,762) | ||
| Change in net assets resulting from operations | $(4,249,664) |
| Year Ended July 31 | 2016 | 2015 |
| Increase (Decrease) in Net Assets | ||
| Operations: | ||
| Net investment income (loss) | $53,098 | $(66,686) |
| Net realized gain on investments | 199,433 | 13,523,659 |
| Net change in unrealized appreciation/depreciation of investments | (4,502,195) | (5,876,894) |
| CHANGE IN NET ASSETS RESULTING FROM OPERATIONS | (4,249,664) | 7,580,079 |
| Distributions to Shareholders: | ||
| Distributions from net realized gain on investments | ||
| Class A Shares | (5,502,857) | — |
| Class B Shares | (1,867,474) | — |
| Class C Shares | (1,323,955) | — |
| Institutional Shares | (798,673) | — |
| CHANGE IN NET ASSETS RESULTING FROM DISTRIBUTIONS TO SHAREHOLDERS | (9,492,959) | — |
| Share Transactions: | ||
| Proceeds from sale of shares | 14,463,299 | 19,436,379 |
| Net asset value of shares issued to shareholders in payment of distributions declared | 8,568,103 | — |
| Cost of shares redeemed | (23,183,153) | (19,601,538) |
| CHANGE IN NET ASSETS RESULTING FROM SHARE TRANSACTIONS | (151,751) | (165,159) |
| Change in net assets | (13,894,374) | 7,414,920 |
| Net Assets: | ||
| Beginning of period | 92,000,563 | 84,585,643 |
| End of period (including accumulated net investment income (loss) of $0 and $(61,714), respectively) | $78,106,189 | $92,000,563 |
| ■ | Equity securities listed on an exchange or traded through a regulated market system are valued at their last reported sale price or official closing price in their principal exchange or market. |
| ■ | Shares of other mutual funds or non-exchange-traded investment companies are valued based upon their reported NAVs. |
| ■ | Derivative contracts listed on exchanges are valued at their reported settlement or closing price, except that options are valued at the mean of closing bid and asked quotations. |
| ■ | Over-the-counter (OTC) derivative contracts are fair valued using price evaluations provided by a pricing service approved by the Board of Trustees (the “Trustees”). |
| ■ | Fixed-income securities acquired with remaining maturities greater than 60 days are fair valued using price evaluations provided by a pricing service approved by the Trustees. |
| ■ | Fixed-income securities and repurchase agreements acquired with remaining maturities of 60 days or less are valued at their cost (adjusted for the accretion of any discount or amortization of any premium), unless the issuer's creditworthiness is impaired or other factors indicate that amortized cost is not an accurate estimate of the investment's fair value, in which case it would be valued in the same manner as a longer-term security. |
| ■ | For securities that are fair valued in accordance with procedures established by and under the general supervision of the Trustees, certain factors may be considered such as: the last traded or purchase price of the security, information obtained by contacting the issuer or dealers, analysis of the issuer's financial statements or other available documents, fundamental analytical data, the nature and duration of restrictions on disposition, the movement of the market in which the security is normally traded, public trading in similar securities or derivative contracts of the issuer or comparable issuers, movement of a relevant index, or other factors including but not limited to industry changes and relevant government actions. |
| Other Service Fees Incurred | Other Service Fees Reimbursed | |
| Class A Shares | $120,078 | $— |
| Class B Shares | 36,323 | 30 |
| Class C Shares | 26,936 | — |
| TOTAL | $183,337 | $30 |
| Year Ended July 31 | 2016 | 2015 | ||
| Class A Shares: | Shares | Amount | Shares | Amount |
| Shares sold | 310,533 | $4,754,875 | 437,475 | $7,550,573 |
| Shares issued to shareholders in payment of distributions declared | 332,140 | 4,972,137 | — | — |
| Shares redeemed | (753,019) | (11,160,736) | (697,690) | (11,932,507) |
| NET CHANGE RESULTING FROM CLASS A SHARE TRANSACTIONS | (110,346) | $(1,433,724) | (260,215) | $(4,381,934) |
| Year Ended July 31 | 2016 | 2015 | ||
| Class B Shares: | Shares | Amount | Shares | Amount |
| Shares sold | 332,457 | $4,849,130 | 435,608 | $7,148,957 |
| Shares issued to shareholders in payment of distributions declared | 130,599 | 1,832,304 | — | — |
| Shares redeemed | (377,102) | (5,173,438) | (150,183) | (2,470,360) |
| NET CHANGE RESULTING FROM CLASS B SHARE TRANSACTIONS | 85,954 | $1,507,996 | 285,425 | $4,678,597 |
| Year Ended July 31 | 2016 | 2015 | ||
| Class C Shares: | Shares | Amount | Shares | Amount |
| Shares sold | 166,717 | $2,348,511 | 195,222 | $3,120,016 |
| Shares issued to shareholders in payment of distributions declared | 85,418 | 1,169,370 | — | — |
| Shares redeemed | (314,062) | (4,374,197) | (201,285) | (3,220,353) |
| NET CHANGE RESULTING FROM CLASS C SHARE TRANSACTIONS | (61,927) | $(856,316) | (6,063) | $(100,337) |
| Year Ended July 31 | 2016 | 2015 | ||
| Institutional Shares: | Shares | Amount | Shares | Amount |
| Shares sold | 167,477 | $2,510,783 | 93,199 | $1,616,833 |
| Shares issued to shareholders in payment of distributions declared | 38,466 | 594,292 | — | — |
| Shares redeemed | (164,945) | (2,474,782) | (111,365) | (1,978,318) |
| NET CHANGE RESULTING FROM INSTITUTIONAL SHARE TRANSACTIONS | 40,998 | $630,293 | (18,166) | $(361,485) |
| NET CHANGE RESULTING FROM TOTAL FUND SHARE TRANSACTIONS | (45,321) | $(151,751) | 981 | $(165,159) |
| Increase (Decrease) | ||
| Paid-In Capital | Undistributed Net Investment Income (Loss) | Accumulated Net Realized Gain (Loss) |
| $(658) | $8,616 | $(7,958) |
| 2016 | 2015 | |
| Long-term capital gains | $9,492,959 | $— |
| Undistributed long-term capital gains | $438,475 |
| Net unrealized appreciation | $3,412,043 |
| Administrative Fee | Average Daily Net Assets of the Investment Complex |
| 0.150% | on the first $5 billion |
| 0.125% | on the next $5 billion |
| 0.100% | on the next $10 billion |
| 0.075% | on assets in excess of $20 billion |
| Share Class Name | Percentage of Average Daily Net Assets of Class |
| Class A Shares | 0.05% |
| Class B Shares | 0.75% |
| Class C Shares | 0.75% |
| Distribution Services Fees Incurred | |
| Class B Shares | $108,969 |
| Class C Shares | $80,808 |
| TOTAL | $189,777 |
| Federated Institutional Prime Value Obligations Fund, Institutional Shares | |
| Balance of Shares Held 7/31/2015 | 1,864,649 |
| Purchases/Additions | 16,175,206 |
| Sales/Reductions | (16,683,963) |
| Balance of Shares Held 7/31/2016 | 1,355,892 |
| Value | $1,355,892 |
| Dividend Income | $4,342 |
| Purchases | $54,546,791 |
| Sales | $63,726,318 |
September 22, 2016
| Beginning Account Value 2/1/2016 | Ending Account Value 7/31/2016 | Expenses Paid During Period1 | |
| Actual: | |||
| Class A Shares | $1,000 | $1,108.80 | $7.86 |
| Class B Shares | $1,000 | $1,104.50 | $11.77 |
| Class C Shares | $1,000 | $1,104.80 | $11.77 |
| Institutional Shares | $1,000 | $1,110.40 | $6.56 |
| Hypothetical (assuming a 5% return before expenses): | |||
| Class A Shares | $1,000 | $1,017.40 | $7.52 |
| Class B Shares | $1,000 | $1,013.67 | $11.26 |
| Class C Shares | $1,000 | $1,013.67 | $11.26 |
| Institutional Shares | $1,000 | $1,018.65 | $6.27 |
| 1 | Expenses are equal to the Fund's annualized net expense ratios, multiplied by the average account value over the period, multiplied by 182/366 (to reflect the one-half-year period). The annualized net expense ratios are as follows: |
| Class A Shares | 1.50% |
| Class B Shares | 2.25% |
| Class C Shares | 2.25% |
| Institutional Shares | 1.25% |
| Name Birth Date Positions Held with Trust Date Service Began | Principal Occupation(s) for Past Five Years, Other Directorships Held and Previous Position(s) |
| J. Christopher Donahue* Birth Date: April 11, 1949 President and Trustee Indefinite Term Began serving: May 2006 | Principal Occupations: Principal Executive Officer and President of certain of the Funds in the Federated Fund Family; Director or Trustee of the Funds in the Federated Fund Family; President, Chief Executive
Officer and Director, Federated Investors, Inc.; Chairman and Trustee, Federated Investment Management Company; Trustee, Federated Investment Counseling; Chairman and Director, Federated Global Investment Management
Corp.; Chairman, Federated Equity Management Company of Pennsylvania and Passport Research, Ltd. (investment advisory subsidiary of Federated); Trustee, Federated Shareholder Services Company; Director, Federated
Services Company. Previous Positions: President, Federated Investment Counseling; President and Chief Executive Officer, Federated Investment Management Company, Federated Global Investment Management Corp. and Passport Research, Ltd. |
| Name Birth Date Positions Held with Trust Date Service Began | Principal Occupation(s) for Past Five Years, Other Directorships Held and Previous Position(s) |
| John B. Fisher* Birth Date: May 16, 1956 Trustee Indefinite Term Began serving: May 2016 | Principal Occupations: Principal Executive Officer and President of certain of the Funds in the Federated Fund Family; Director or Trustee of certain of the Funds in the Federated Fund Family; Vice President,
Federated Investors, Inc.; President, Director/Trustee and CEO, Federated Advisory Services Company, Federated Equity Management Company of Pennsylvania, Federated Global Investment Management Corp., Federated
Investment Counseling, Federated Investment Management Company; President and CEO of Passport Research, Ltd.; President of some of the Funds in the Federated Fund Complex and Director, Federated Investors Trust
Company. Previous Positions: President and Director of the Institutional Sales Division of Federated Securities Corp.; President and Director of Federated Investment Counseling; Director, Edgewood Securities Corp.; Director, Federated Services Company; Director, Federated Investors, Inc.; Chairman and Director, Southpointe Distribution Services, Inc. and President, Technology, Federated Services Company. |
| * | Reasons for “interested” status: J. Christopher Donahue and John B. Fisher are interested due to their beneficial ownership of shares of Federated Investors, Inc. and due to positions they hold with Federated and its subsidiaries. J. Christopher Donahue is the son of John F. Donahue, Chairman Emeritus of the Federated Funds. |
| Name Birth Date Positions Held with Trust Date Service Began | Principal Occupation(s) for Past Five Years, Other Directorships Held, Previous Position(s) and Qualifications |
| John T. Collins Birth Date: January 24, 1947 Trustee Indefinite Term Began serving: October 2013 | Principal Occupations: Director or Trustee of the Federated Fund Family; Retired. Other Directorships Held: Director, Chair of the Compensation Committee, Audit Committee member, KLX Corp. Qualifications: Mr. Collins has served in several business and financial management roles and directorship positions throughout his career. Mr. Collins previously served as Chairman and CEO, The Collins Group, Inc. (a private equity firm). Mr. Collins serves as Chairman Emeriti, Bentley University. Mr. Collins previously served as Director, FleetBoston Financial Corp.; Director and Audit Committee Member, Bank of America Corp. and Director, Beth Israel Deaconess Medical Center (Harvard University Affiliate Hospital). |
| Name Birth Date Positions Held with Trust Date Service Began | Principal Occupation(s) for Past Five Years, Other Directorships Held, Previous Position(s) and Qualifications |
| G. Thomas Hough Birth Date: February 28, 1955 Trustee Indefinite Term Began serving: August 2015 | Principal Occupations: Director or Trustee of the Federated Fund Family; Retired. Other Directorships Held: Director, Chair of the Audit Committee, Governance Committee, Publix Super Markets, Inc. Qualifications: Mr. Hough has served in accounting, business management and directorship positions throughout his career. Mr. Hough most recently held the position of Americas Vice Chair of Assurance with Ernst & Young LLP. Mr. Hough is an Executive Committee member of the United States Golf Association, he serves on the President's Cabinet and Business School Board of Visitors for the University of Alabama and is on the Business School Board of Visitors for Wake Forest University. |
| Maureen Lally-Green Birth Date: July 5, 1949 Trustee Indefinite Term Began serving: August 2009 | Principal Occupations: Director or Trustee of the Federated Fund Family; Interim Dean of the Duquesne University School of Law; Adjunct Professor of Law, Duquesne University School of Law. Other Directorships Held: Director, CONSOL Energy Inc. Qualifications: Judge Lally-Green has served in various legal and business roles and directorship positions throughout her career. Judge Lally-Green previously served as: Associate General Secretary, Diocese of Pittsburgh; a member of the Superior Court of Pennsylvania; and as a Professor of Law, Duquesne University School of Law. Judge Lally-Green also holds the positions on either a public or not for profit Board of Directors as follows: Member, Pennsylvania State Board of Education (public); Director and Chair, UPMC Mercy Hospital; Regent, St. Vincent Seminary; Director and Vice Chair, Our Campaign for the Church Alive!, Inc.; Director, Saint Vincent College; and Director and Chair, Cardinal Wuerl North Catholic High School, Inc. Judge Lally-Green has held the positions of: Director, Auberle; Director, Ireland Institute of Pittsburgh; Director, Saint Thomas More Society; and Director, Catholic High Schools of the Diocese of Pittsburgh, Inc. |
| Peter E. Madden Birth Date: March 16, 1942 Trustee Indefinite Term Began serving: June 2006 | Principal Occupation: Director or Trustee, and Chair of the Board of Directors or Trustees, of the Federated Fund Family; Retired. Other Directorships Held: None. Qualifications: Mr. Madden has served in several business management, mutual fund services and directorship positions throughout his career. Mr. Madden previously served as President, Chief Operating Officer and Director, State Street Bank and Trust Company (custodian bank) and State Street Corporation (financial services). He was Director, VISA USA and VISA International and Chairman and Director, Massachusetts Bankers Association. Mr. Madden served as Director, Depository Trust Corporation and Director, The Boston Stock Exchange. Mr. Madden also served as a Representative to the Commonwealth of Massachusetts General Court. |
| Name Birth Date Positions Held with Trust Date Service Began | Principal Occupation(s) for Past Five Years, Other Directorships Held, Previous Position(s) and Qualifications |
| Charles F. Mansfield, Jr. Birth Date: April 10, 1945 Trustee Indefinite Term Began serving: June 2006 | Principal Occupations: Director or Trustee of the Federated Fund Family; Management Consultant. Other Directorships Held: None. Qualifications: Mr. Mansfield has served in several banking, business management and educational roles and directorship positions throughout his career. Mr. Mansfield previously served as Chief Executive Officer, PBTC International Bank; Partner, Arthur Young & Company (now Ernst & Young LLP); Chief Financial Officer of Retail Banking Sector, Chase Manhattan Bank; Senior Vice President, HSBC Bank USA (formerly, Marine Midland Bank); Vice President, Citibank; Assistant Professor of Banking and Finance, Frank G. Zarb School of Business, Hofstra University; Executive Vice President DVC Group, Inc. (marketing, communications and technology). |
| Thomas M. O'Neill Birth Date: June 14, 1951 Trustee Indefinite Term Began serving: October 2006 | Principal Occupations: Director or Trustee, Chair of the Audit Committee of the Federated Fund Family; Sole Proprietor, Navigator Management Company (investment and strategic consulting). Other Directorships Held: None. Qualifications: Mr. O'Neill has served in several business, mutual fund and financial management roles and directorship positions throughout his career. Mr. O'Neill serves as Director, Medicines for Humanity and Director, The Golisano Children's Museum of Naples, Florida. Mr. O'Neill previously served as Chief Executive Officer and President, Managing Director and Chief Investment Officer, Fleet Investment Advisors; President and Chief Executive Officer, Aeltus Investment Management, Inc.; General Partner, Hellman, Jordan Management Co., Boston, MA; Chief Investment Officer, The Putnam Companies, Boston, MA; Credit Analyst and Lending Officer, Fleet Bank; Director and Consultant, EZE Castle Software (investment order management software); and Director, Midway Pacific (lumber). |
| P. Jerome Richey Birth Date: February 23, 1949 Trustee Indefinite Term Began serving: October 2013 | Principal Occupations: Director or Trustee of the Federated Fund Family; Management Consultant. Other Directorships Held: None. Qualifications: Mr. Richey has served in several business and legal management roles and directorship positions throughout his career. Mr. Richey most recently held the positions of Senior Vice Chancellor and Chief Legal Officer, University of Pittsburgh. Mr. Richey serves as Board Member, Epilepsy Foundation of Western Pennsylvania and Board member, World Affairs Council of Pittsburgh. Mr. Richey previously served as Chief Legal Officer and Executive Vice President, CONSOL Energy Inc. and Shareholder, Buchanan Ingersoll & Rooney PC (a law firm). |
| Name Birth Date Positions Held with Trust Date Service Began | Principal Occupation(s) for Past Five Years, Other Directorships Held, Previous Position(s) and Qualifications |
| John S. Walsh Birth Date: November 28, 1957 Trustee Indefinite Term Began serving: June 2006 | Principal Occupations: Director or Trustee of the Federated Fund Family; President and Director, Heat Wagon, Inc. (manufacturer of construction temporary heaters); President and Director, Manufacturers
Products, Inc. (distributor of portable construction heaters); President, Portable Heater Parts, a division of Manufacturers Products, Inc. Other Directorships Held: None. Qualifications: Mr. Walsh has served in several business management roles and directorship positions throughout his career. Mr. Walsh previously served as Vice President, Walsh & Kelly, Inc. (paving contractors). |
| Name Birth Date Address Positions Held with Trust Date Service Began | Principal Occupation(s) for Past Five Years and Previous Position(s) |
| John W. McGonigle Birth Date: October 26, 1938 Secretary Officer since: May 2006 | Principal Occupations: Executive Vice President and Secretary of the Federated Fund Family; Vice Chairman, Executive Vice President, Secretary and Director, Federated Investors, Inc. Previous Positions: Trustee, Federated Investment Management Company and Federated Investment Counseling; Director, Federated Global Investment Management Corp., Federated Services Company and Federated Securities Corp. |
| Lori A. Hensler Birth Date: January 6, 1967 TREASURER Officer since: April 2013 | Principal Occupations: Principal Financial Officer and Treasurer of the Federated Fund Family; Senior Vice President, Federated Administrative Services; Financial and Operations Principal for Federated
Securities Corp. and Edgewood Services, Inc.; and Assistant Treasurer, Federated Investors Trust Company. Ms. Hensler has received the Certified Public Accountant designation. Previous Positions: Controller of Federated Investors, Inc.; Senior Vice President and Assistant Treasurer, Federated Investors Management Company; Treasurer, Federated Investors Trust Company; Assistant Treasurer, Federated Administrative Services, Federated Administrative Services, Inc., Federated Securities Corp., Edgewood Services, Inc., Federated Advisory Services Company, Federated Equity Management Company of Pennsylvania, Federated Global Investment Management Corp., Federated Investment Counseling, Federated Investment Management Company, Passport Research, Ltd., and Federated MDTA, LLC; Financial and Operations Principal for Federated Securities Corp., Edgewood Services, Inc. and Southpointe Distribution Services, Inc. |
| Name Birth Date Address Positions Held with Trust Date Service Began | Principal Occupation(s) for Past Five Years and Previous Position(s) |
| Peter J. Germain Birth Date: September 3, 1959 CHIEF LEGAL OFFICER Officer since: June 2006 | Principal Occupations: Mr. Germain is Chief Legal Officer of the Federated Fund Family. He is General Counsel and Vice President, Federated Investors, Inc.; President, Federated Administrative Services and
Federated Administrative Services, Inc.; Vice President, Federated Securities Corp.; Secretary, Federated Private Asset Management, Inc.; and Secretary, Retirement Plan Service Company of America. Mr. Germain joined
Federated in 1984 and is a member of the Pennsylvania Bar Association. Previous Positions: Deputy General Counsel, Special Counsel, Managing Director of Mutual Fund Services, Federated Investors, Inc.; Senior Vice President, Federated Services Company; and Senior Corporate Counsel, Federated Investors, Inc. |
| Stephen F. Auth Birth Date: September 13, 1956 101 Park Avenue 41st Floor New York, NY 10178 CHIEF INVESTMENT OFFICER Officer since: June 2012 | Principal Occupations: Stephen F. Auth is Chief Investment Officer of various Funds in the Federated Fund Family; Executive Vice President, Federated Investment Counseling, Federated Global Investment
Management Corp. and Federated Equity Management Company of Pennsylvania. Previous Positions: Executive Vice President, Federated Investment Management Company and Passport Research, Ltd. (investment advisory subsidiary of Federated); Senior Vice President, Global Portfolio Management Services Division; Senior Vice President, Federated Investment Management Company and Passport Research, Ltd.; Senior Managing Director and Portfolio Manager, Prudential Investments. |
| Stephen Van Meter Birth Date: June 5, 1975 CHIEF COMPLIANCE OFFICER AND SENIOR VICE PRESIDENT Officer since: July 2015 | Principal Occupations: Senior Vice President and Chief Compliance Officer of the Federated Fund Family; Vice President and Chief Compliance Officer of Federated Investors, Inc. and Chief Compliance Officer of
certain of its subsidiaries. Mr. Van Meter joined Federated in October 2011. He holds FINRA licenses under Series 3, 7, 24 and 66. Previous Positions: Mr. Van Meter previously held the position of Compliance Operating Officer, Federated Investors, Inc. Prior to joining Federated, Mr. Van Meter served at the United States Securities and Exchange Commission in the positions of Senior Counsel, Office of Chief Counsel, Division of Investment Management and Senior Counsel, Division of Enforcement. |
4000 Ericsson Drive
Warrendale, PA 15086-7561
or call 1-800-341-7400.
CUSIP 31421R684
CUSIP 31421R809
CUSIP 31421R882
2016 ©Federated Investors, Inc.
| 1 | The Fund's R6 Class commenced operations on June 29, 2016. For the period prior to the commencement of operations of the R6 class, the R6 class performance information shown is for the Institutional Share class, adjusted to reflect the expenses of the Fund's R6 class for each period for which the Fund's R6 class gross expenses would have exceeded the actual expense paid by the Fund's Institutional Share class. |
| 2 | Please see the footnotes to the line graphs below for definitions of, and further information about, the R2000. |
| 3 | Please see the footnotes to the line graphs below for definitions of, and further information about, the MSBFA. |
| 4 | The Russell 3000® Index measures the performance of the largest 3,000 U.S. companies representing approximately 98% of the investable U.S. equity market. The Russell 3000® Index is constructed to provide a comprehensive, unbiased and stable barometer of the broad market and is completely reconstituted annually to ensure new and growing equities are reflected. The index is unmanaged, and it is not possible to invest directly in an index. |
| 5 | The Russell Top 200® Index measures the performance of the largest cap segment of the U.S. equity universe. The Russell Top 200® Index is a subset of the Russell 3000® Index. It includes approximately 200 of the largest securities based on a combination of their market cap and current index membership and represents approximately 68% of the U.S. market. The Russell Top 200® Index is constructed to provide a comprehensive and unbiased barometer for this very large cap segment and is completely reconstituted annually to ensure new and growing equities are reflected. The index is unmanaged, and it is not possible to invest directly in an index. |
| 6 | The Russell Midcap® Index measures the performance of the mid-cap segment of the U.S. equity universe. The Russell Midcap® Index is a subset of the Russell 1000® Index. It includes approximately 800 of the smallest securities based on a combination of their market cap and current index membership. The Russell Midcap® Index represents approximately 31% of the total market capitalization |
| of the Russell 1000® companies. The Russell Midcap® Index is constructed to provide a comprehensive and unbiased barometer for the mid-cap segment. The Russell Midcap® Index is completely reconstituted annually to ensure larger stocks do not distort the performance and characteristics of the true mid-cap opportunity set. The index is unmanaged, and it is not possible to invest directly in an index. | |
| 7 | Small-cap stocks may be less liquid and subject to greater price volatility than large-cap stocks. |
| 8 | The Russell Microcap® Index measures the performance of the microcap segment of the U.S. equity market. Microcap stocks make up less than 3% of the U.S. equity market (by market cap) and consist of the smallest 1,000 securities in the small-cap Russell 2000® Index, plus the next 1,000 smallest eligible securities by market cap. The Russell Microcap® Index is constructed to provide a comprehensive and unbiased barometer for the microcap segment trading on national exchanges and is completely reconstituted annually to ensure new and growing equities are reflected and companies continue to reflect appropriate capitalization and value characteristics. The Russell Microcap® Index is unmanaged, and it is not possible to invest directly in an index. |
| 9 | The Russell 3000® Value Index measures the performance of the broad value segment of the U.S. equity value universe. It includes those Russell 3000® Index companies with lower price-to-book ratios and lower forecasted growth values. The Russell 3000® Value Index is constructed to provide a comprehensive, unbiased and stable barometer of the broad value market. The Russell 3000® Value Index is completely reconstituted annually to ensure new and growing equities are included and that the represented companies continue to reflect value characteristics. The index is unmanaged, and it is not possible to invest directly in an index. |
| 10 | The Russell 3000® Growth Index measures the performance of the broad growth segment of the U.S. equity universe. It includes those Russell 3000® Index companies with higher price-to-book ratios and higher forecasted growth values. The Russell 3000® Growth Index is constructed to provide a comprehensive, unbiased and stable barometer of the broad growth market. The Russell 3000® Growth Index is completely reconstituted annually to ensure new and growing equities are included and that the represented companies continue to reflect growth characteristics. The index is unmanaged, and it is not possible to invest directly in an index. |
| 11 | The Russell Microcap® Value Index measures the performance of the micro-cap value segment of the U.S. equity universe. It includes those Russell Microcap® Index companies with higher price-to-book ratios and lower forecasted growth values. The Russell Microcap® Value Index is constructed to provide a comprehensive, unbiased and stable barometer of the micro-cap value market. The Russell Microcap Value Index is completely reconstituted annually to ensure new and growing equities are included and that the represented companies continue to reflect value characteristics. The index is unmanaged, and it is not possible to invest directly in an index. |
| 12 | The Russell Microcap® Growth Index measures the performance of the microcap growth segment of the U.S. equity market. It includes Russell Microcap companies that are considered more growth oriented relative to the overall market as defined by Russell's leading style methodology. The Russell Microcap® Growth Index is constructed to provide a comprehensive and unbiased barometer for the microcap growth segment of the market. The Russell Microcap® Growth Index is completely reconstituted annually to ensure larger stocks do not distort performance and characteristics of the microcap opportunity set. The Russell Microcap® Growth Index is unmanaged, and it is not possible to invest directly in an index. |

| ■ | Total returns shown for Class C Shares include the maximum contingent deferred sales charge of 1.00% as applicable. |
| 1 Year | 5 Years | 10 Years | |
| Class A Shares | 1.98% | 11.37% | 4.92% |
| Class C Shares | 6.17% | 11.83% | 4.73% |
| Institutional Shares | 8.24% | 12.96% | 5.76% |
| Class R6 Shares5 | 7.89% | 11.97% | 2.88% |
| R2000 | 0.00% | 10.43% | 7.17% |
| MSBFA | 0.43% | 9.43% | 6.77% |
| 1 | Represents a hypothetical investment of $10,000 in the Fund after deducting applicable sales charges: for Class A Shares, the maximum sales charge of 5.50% ($10,000 investment minus $550 sales charge = $9,450); for Class C Shares, a 1.00% contingent deferred sales charge would be applied on any redemption less than one year from the purchase date. The Fund's performance assumes the reinvestment of all dividends and distributions. The R2000 and MSBFA have been adjusted to reflect reinvestment of dividends on securities. |
| 2 | The Fund is the successor to MDT Small Cap Core Fund pursuant to a reorganization that took place on December 8, 2006. Prior to that date, the Fund had no investment operations. Accordingly, the performance information shown for periods prior to that date is that of the MDT Small Cap Core Fund. |
| 3 | The R2000 measures the performance of the small-cap segment of the U.S. equity universe. The R2000 is a subset of the Russell 3000® Index representing approximately 10% of the total market capitalization of that index. It includes approximately 2000 of the smallest securities based on a combination of their market cap and current index membership. The R2000 is constructed to provide a comprehensive and unbiased small-cap barometer and is completely reconstituted annually to ensure larger stocks do not distort the performance and characteristics of the true small-cap opportunity set. The R2000 is unmanaged and, unlike the Fund, is not affected by cash flows. It is not possible to invest directly in an index. The R2000 is not adjusted to reflect sales charges, expenses or other fees that the Securities and Exchange Commission requires to be reflected in the Fund's performance. |
| 4 | Morningstar figures represent the average of the total returns reported by all the mutual funds designated by Morningstar as falling into the respective category indicated. They do not reflect sales charges. |
| 5 | The Fund's R6 Class commenced operations on June 29, 2016. It is anticipated that this class will have the lowest net expenses of all outstanding share classes. For the period prior to the commencement of operations of the R6 class, the R6 class performance information shown is for the Institutional Share class, adjusted to reflect the expenses of the Fund's R6 class for each period for which the Fund's R6 class gross expenses would have exceeded the actual expense paid by the Fund's Institutional Share class. |
| Industry Composition | Percentage of Total Net Assets |
| Regional Banks | 12.5% |
| Biotechnology | 4.8% |
| Financial Services | 4.1% |
| Semiconductor Manufacturing Equipment | 3.2% |
| Specialty Retailing | 3.1% |
| Miscellaneous Communications | 2.5% |
| Health Care Equipment & Supplies | 2.4% |
| Software Packaged/Custom | 2.4% |
| Entertainment | 2.3% |
| Electronic Equipment Instruments & Components | 2.2% |
| Auto Original Equipment Manufacturers | 2.1% |
| Miscellaneous Machinery | 2.0% |
| Airline—Regional | 1.8% |
| Dairy Products | 1.6% |
| Commodity Chemicals | 1.5% |
| Defense Aerospace | 1.5% |
| Home Products | 1.4% |
| Machinery | 1.4% |
| Mutual Fund Adviser | 1.4% |
| Personal Loans | 1.4% |
| Contracting | 1.3% |
| Internet & Catalog Retail | 1.3% |
| Internet Software & Services | 1.3% |
| Broadcasting | 1.2% |
| Computer Stores | 1.2% |
| Telecommunication Equipment & Services | 1.2% |
| Clothing Stores | 1.1% |
| Medical Supplies | 1.1% |
| Apparel | 1.0% |
| Furniture | 1.0% |
| Property Liability Insurance | 1.0% |
| Recreational Goods | 1.0% |
| Thrifts & Mortgage Finance | 1.0% |
| Truck Manufacturing | 1.0% |
| Industry Composition | Percentage of Total Net Assets |
| Undesignated Consumer Cyclicals | 1.0% |
| Other2 | 26.2% |
| Cash Equivalents3 | 2.0% |
| Other Assets and Liabilities—Net4 | (0.5) % |
| TOTAL | 100.0% |
| 1 | Except for Cash Equivalents and Other Assets and Liabilities, industry classifications are based upon, and individual portfolio securities are assigned to, the classifications of the Global Industry Classification Standard (GICS) except that the Adviser assigns a classification to securities not classified by the GICS and to securities for which the Adviser does not have access to the classification made by the GICS. |
| 2 | For purposes of this table, industry classifications which constitute less than 1.0% of the Fund's total net assets have been aggregated under the designation “Other.” |
| 3 | Cash Equivalents include any investments in money market mutual funds and/or overnight repurchase agreements. |
| 4 | Assets, other than investments in securities, less liabilities. See Statement of Assets and Liabilities. |
| Shares | Value | ||
| COMMON STOCKS—98.5% | |||
| Airline - Regional—1.8% | |||
| 10,170 | 1 | Hawaiian Holdings, Inc. | $463,040 |
| 8,916 | SkyWest, Inc. | 256,513 | |
| TOTAL | 719,553 | ||
| Apparel—1.0% | |||
| 15,155 | 1 | Express, Inc. | 226,719 |
| 10,773 | 1 | Iconix Brand Group, Inc. | 77,565 |
| 5,854 | 1 | Perry Ellis International, Inc. | 125,393 |
| TOTAL | 429,677 | ||
| Auto Original Equipment Manufacturers—2.1% | |||
| 3,267 | 1 | American Axle & Manufacturing Holdings, Inc. | 56,878 |
| 7,192 | 1 | Cooper-Standard Holding, Inc. | 633,256 |
| 3,027 | 1 | Tenneco, Inc. | 171,086 |
| TOTAL | 861,220 | ||
| Biotechnology—4.8% | |||
| 12,771 | 1 | Aegerion Pharmaceuticals, Inc. | 18,390 |
| 3,217 | 1 | Anika Therapeutics, Inc. | 160,593 |
| 13,386 | 1 | BioCryst Pharmaceuticals, Inc. | 48,457 |
| 45,674 | 1 | Celldex Therapeutics, Inc. | 211,014 |
| 3,297 | 1 | Esperion Therapeutics, Inc. | 35,805 |
| 6,094 | 1 | Five Prime Therapeutics, Inc. | 308,905 |
| 25,782 | 1 | INSYS Therapeutics, Inc. | 403,488 |
| 19,520 | 1 | NewLink Genetics Corp. | 206,522 |
| 5,646 | 1 | Osiris Therapeutics, Inc. | 28,230 |
| 148,018 | PDL BioPharma, Inc. | 521,023 | |
| 10,195 | 1 | Zafgen, Inc. | 30,993 |
| TOTAL | 1,973,420 | ||
| Broadcasting—1.2% | |||
| 17,230 | Sinclair Broadcast Group, Inc. | 479,339 | |
| Clothing Stores—1.1% | |||
| 22,811 | American Eagle Outfitters, Inc. | 408,773 | |
| 4,218 | 1 | Francesca's Holdings Corp. | 53,611 |
| TOTAL | 462,384 | ||
| Cogeneration—0.5% | |||
| 9,622 | 1 | Headwaters, Inc. | 191,382 |
| Shares | Value | ||
| COMMON STOCKS—continued | |||
| Commodity Chemicals—1.5% | |||
| 12,053 | Trinseo SA | $600,119 | |
| Computer Networking—0.8% | |||
| 15,230 | Black Box Corp. | 207,889 | |
| 33,310 | 1 | Extreme Networks, Inc. | 129,576 |
| TOTAL | 337,465 | ||
| Computer Peripherals—0.4% | |||
| 1,630 | 1 | Synaptics, Inc. | 84,678 |
| 9,572 | 1 | Zagg, Inc. | 60,591 |
| TOTAL | 145,269 | ||
| Computer Stores—1.2% | |||
| 3,140 | 1 | Insight Enterprises, Inc. | 83,524 |
| 5,160 | 1 | PC Connections, Inc. | 133,180 |
| 3,711 | 1 | Tech Data Corp. | 289,198 |
| TOTAL | 505,902 | ||
| Construction Machinery—0.2% | |||
| 4,641 | 1 | NCI Building System, Inc. | 75,277 |
| Consumer Durables & Apparel—0.5% | |||
| 17,234 | 1 | GoPro, Inc. | 217,838 |
| Consumer Finance—0.6% | |||
| 27,497 | 1 | Enova International, Inc. | 249,948 |
| Contracting—1.3% | |||
| 7,092 | Comfort Systems USA, Inc. | 215,455 | |
| 32,440 | Harsco Corp. | 317,588 | |
| TOTAL | 533,043 | ||
| Crude Oil & Gas Production—0.8% | |||
| 23,002 | CVR Energy, Inc. | 340,430 | |
| Dairy Products—1.6% | |||
| 34,646 | Dean Foods Co. | 639,565 | |
| Defense Aerospace—1.5% | |||
| 4,521 | 1 | Ducommun, Inc. | 87,436 |
| 4,849 | 1 | Esterline Technologies Corp. | 294,965 |
| 4,460 | 1 | MOOG, Inc., Class A | 245,612 |
| TOTAL | 628,013 | ||
| Diversified Leisure—0.5% | |||
| 10,726 | 1 | Isle of Capri Casinos, Inc. | 200,898 |
| Electric & Electronic Original Equipment Manufacturers—0.2% | |||
| 5,487 | General Cable Corp. | 80,823 |
| Shares | Value | ||
| COMMON STOCKS—continued | |||
| Electronic Equipment Instruments & Components—2.2% | |||
| 4,726 | Belden, Inc. | $345,991 | |
| 8,678 | 1 | Fabrinet | 327,681 |
| 9,013 | 1 | Sanmina Corp. | 228,389 |
| TOTAL | 902,061 | ||
| Electronic Instruments—0.4% | |||
| 14,442 | 1 | Ixia | 166,083 |
| Electronic Test/Measuring Equipment—0.2% | |||
| 7,185 | Cohu, Inc. | 75,874 | |
| Energy Equipment & Services—0.3% | |||
| 10,433 | 1 | RigNet, Inc. | 124,674 |
| Entertainment—2.3% | |||
| 59,724 | 1 | MSG Networks, Inc., Class A | 958,570 |
| Financial Services—4.1% | |||
| 16,354 | 1 | Ambac Financial Group, Inc. | 297,316 |
| 8,441 | Deluxe Corp. | 570,527 | |
| 1,200 | First Financial Corp. | 45,960 | |
| 10,744 | MainSource Financial Group, Inc. | 239,269 | |
| 7,603 | Nelnet, Inc., Class A | 307,237 | |
| 7,974 | Union Bankshares Corp. | 214,022 | |
| TOTAL | 1,674,331 | ||
| Food & Staples Retailing—0.5% | |||
| 6,392 | SpartanNash Co. | 201,348 | |
| Food Wholesaling—0.4% | |||
| 5,023 | 1 | Omega Protein Corp. | 113,118 |
| 13,753 | 1 | SUPERVALU, Inc. | 67,115 |
| TOTAL | 180,233 | ||
| Furniture—1.0% | |||
| 11,438 | Ethan Allen Interiors, Inc. | 397,242 | |
| Grocery Chain—0.3% | |||
| 3,648 | Ingles Markets, Inc., Class A | 141,652 | |
| Health Care Equipment & Supplies—2.4% | |||
| 13,357 | LeMaitre Vascular, Inc. | 229,740 | |
| 13,873 | 1 | Masimo Corp. | 734,853 |
| TOTAL | 964,593 | ||
| Health Care Providers & Services—0.4% | |||
| 6,057 | 1 | PharMerica Corp. | 160,874 |
| Home Building—0.2% | |||
| 6,424 | KB HOME | 100,857 |
| Shares | Value | ||
| COMMON STOCKS—continued | |||
| Home Health Care—0.5% | |||
| 13,498 | 1 | Cross Country Healthcare, Inc. | $197,341 |
| Home Products—1.4% | |||
| 31,303 | Libbey, Inc. | 585,053 | |
| Hospitals—0.4% | |||
| 13,039 | 1 | Community Health Systems, Inc. | 166,508 |
| Hotels Restaurants & Leisure—0.7% | |||
| 4,000 | Marriott Vacations Worldwide Corp. | 305,200 | |
| Insurance—0.8% | |||
| 11,321 | Employers Holdings, Inc. | 322,875 | |
| Insurance Brokerage—0.1% | |||
| 3,034 | 1 | eHealth, Inc. | 28,975 |
| International Bank—0.2% | |||
| 2,800 | Preferred Bank Los Angeles, CA | 91,476 | |
| Internet & Catalog Retail—1.3% | |||
| 9,780 | 1 | FTD Companies, Inc. | 247,532 |
| 8,874 | 1 | RetailMeNot, Inc. | 74,098 |
| 14,470 | Travelport Worldwide Ltd. | 195,200 | |
| TOTAL | 516,830 | ||
| Internet Services—0.4% | |||
| 21,830 | EarthLink Network, Inc. | 148,007 | |
| Internet Software & Services—1.3% | |||
| 3,585 | 1 | Care.com, Inc. | 39,399 |
| 27,219 | 1 | Five9, Inc. | 343,232 |
| 3,147 | 1 | Gigamon, Inc. | 147,028 |
| TOTAL | 529,659 | ||
| Machinery—1.4% | |||
| 10,042 | Global Brass & Copper Holdings, Inc. | 284,389 | |
| 55,219 | Manitowoc, Inc. | 307,570 | |
| TOTAL | 591,959 | ||
| Maritime—0.3% | |||
| 28,386 | DHT Maritime, Inc. | 132,279 | |
| Media—Non-Cable - 0.9% | |||
| 10,616 | MDC Partners, Inc., Class A | 135,460 | |
| 4,233 | Nexstar Broadcasting Group, Inc., Class A | 213,978 | |
| TOTAL | 349,438 | ||
| Medical Supplies—1.1% | |||
| 9,786 | 1 | Orthofix International NV | 463,856 |
| Shares | Value | ||
| COMMON STOCKS—continued | |||
| Metals & Mining—0.7% | |||
| 66,105 | 1 | Cloud Peak Energy, Inc. | $225,418 |
| 5,232 | 1 | Ryerson Holding Corp. | 75,550 |
| TOTAL | 300,968 | ||
| Mini-Mill Producer—0.8% | |||
| 19,702 | Commercial Metals Corp. | 325,871 | |
| Miscellaneous Communications—2.5% | |||
| 26,470 | 1 | FairPoint Communications, Inc. | 428,549 |
| 26,415 | West Corp. | 584,036 | |
| TOTAL | 1,012,585 | ||
| Miscellaneous Components—0.9% | |||
| 18,067 | 1 | Nanometrics, Inc. | 362,063 |
| Miscellaneous Machinery—2.0% | |||
| 13,731 | Briggs & Stratton Corp. | 312,106 | |
| 34,517 | 1 | SPX Corp. | 522,587 |
| TOTAL | 834,693 | ||
| Mortgage Banks—0.3% | |||
| 4,723 | 1 | Altisource Portfolio Solutions S.A. | 109,857 |
| Multi-Industry Capital Goods—0.7% | |||
| 6,273 | 1 | DXP Enterprises, Inc. | 104,383 |
| 4,289 | 1 | Lydall, Inc. | 191,632 |
| TOTAL | 296,015 | ||
| Mutual Fund Adviser—1.4% | |||
| 30,758 | Waddell & Reed Financial, Inc., Class A | 561,641 | |
| Office Furniture—0.9% | |||
| 15,045 | Knoll, Inc. | 379,886 | |
| Office Supplies—0.7% | |||
| 23,915 | 1 | Acco Brands Corp. | 268,805 |
| Oil Gas & Consumable Fuels—0.2% | |||
| 12,707 | Teekay Corp. | 78,783 | |
| Oil Refiner—0.1% | |||
| 6,743 | Alon USA Energy, Inc. | 47,673 | |
| Oil Service, Explore & Drill—0.8% | |||
| 39,203 | Archrock, Inc. | 349,299 | |
| Other Communications Equipment—0.9% | |||
| 7,392 | 1 | Netgear, Inc. | 380,171 |
| Personal Loans—1.4% | |||
| 56,346 | 1 | Ezcorp, Inc., Class A | 510,495 |
| Shares | Value | ||
| COMMON STOCKS—continued | |||
| Personal Loans—continued | |||
| 1,734 | 1 | World Acceptance Corp. | $75,359 |
| TOTAL | 585,854 | ||
| Personnel Agency—0.5% | |||
| 5,282 | 1 | AMN Healthcare Services, Inc. | 223,429 |
| Pharmaceuticals—0.5% | |||
| 2,373 | 1 | ANI Pharmaceuticals, Inc. | 143,804 |
| 13,725 | 1 | Tetraphase Pharmaceuticals, Inc. | 55,174 |
| TOTAL | 198,978 | ||
| Photo-Optical Component-Equipment—0.9% | |||
| 3,335 | 1 | Coherent, Inc. | 353,677 |
| Printing—0.5% | |||
| 8,665 | Quad Graphics, Inc. | 219,744 | |
| Property Liability Insurance—1.0% | |||
| 3,791 | HCI Group, Inc. | 114,336 | |
| 7,640 | Heritage Insurance Holdings, Inc. | 94,660 | |
| 9,419 | Universal Insurance Holdings, Inc. | 204,769 | |
| TOTAL | 413,765 | ||
| Recreational Goods—1.0% | |||
| 6,042 | 1 | Scientific Games Holdings Corp. | 64,377 |
| 11,764 | 1 | Smith & Wesson Holding Corp. | 346,450 |
| TOTAL | 410,827 | ||
| Regional Banks—12.5% | |||
| 1,364 | 1st Source Corp. | 45,844 | |
| 9,352 | Bryn Mawr Bank Corp. | 274,294 | |
| 1,719 | CNB Financial Corp. | 31,716 | |
| 5,759 | Cathay Bancorp, Inc. | 172,655 | |
| 26,614 | CenterState Banks of Florida | 443,389 | |
| 4,560 | Central Pacific Financial Corp. | 111,857 | |
| 4,013 | Chemical Financial Corp. | 166,058 | |
| 2,629 | City Holding Co. | 122,774 | |
| 9,017 | Community Trust Bancorp, Inc. | 313,611 | |
| 17,149 | Enterprise Financial Services Corp. | 493,205 | |
| 1,070 | Financial Institutions, Inc. | 28,783 | |
| 19,248 | 1 | First BanCorp | 88,348 |
| 5,502 | First Business Financial Services, Inc. | 130,452 | |
| 10,548 | Flushing Financial Corp. | 235,326 | |
| 4,674 | Great Southern Bancorp, Inc. | 183,221 | |
| 9,195 | Great Western Bancorp, Inc. | 304,998 |
| Shares | Value | ||
| COMMON STOCKS—continued | |||
| Regional Banks—continued | |||
| 7,681 | Heartland Financial USA, Inc. | $282,046 | |
| 1,334 | Iberiabank Corp. | 83,335 | |
| 9,190 | Lakeland Bancorp, Inc. | 109,453 | |
| 8,881 | Mercantile Bancorporation, Inc. | 223,624 | |
| 4,200 | MidSouth Bancorp, Inc. | 44,142 | |
| 18,604 | OFG Bancorp. | 197,389 | |
| 11,878 | Old National Bancorp | 156,315 | |
| 3,460 | Peoples Bancorp, Inc. | 77,677 | |
| 8,193 | QCR Holdings, Inc. | 242,841 | |
| 1,936 | Sandy Spring Bancorp, Inc. | 57,770 | |
| 5,238 | TriCo Bancshares | 136,293 | |
| 3,362 | UMB Financial Corp. | 186,288 | |
| 3,394 | Wintrust Financial Corp. | 179,203 | |
| TOTAL | 5,122,907 | ||
| Rubber—0.9% | |||
| 11,657 | Cooper Tire & Rubber Co. | 384,564 | |
| Savings & Loan—0.6% | |||
| 5,437 | First Defiance Financial Corp. | 226,669 | |
| Securities Brokerage—0.3% | |||
| 3,250 | 1 | Piper Jaffray Cos., Inc. | 134,355 |
| Semiconductor Manufacturing Equipment—3.2% | |||
| 8,219 | 1 | Advanced Energy Industries, Inc. | 334,677 |
| 12,699 | 1 | Alpha & Omega Semiconductor Ltd. | 181,469 |
| 20,444 | Mentor Graphics Corp. | 436,684 | |
| 12,924 | 1 | Photronics, Inc. | 124,846 |
| 6,795 | Tessera Technologies, Inc. | 218,391 | |
| TOTAL | 1,296,067 | ||
| Semiconductors & Semiconductor Equipment—0.5% | |||
| 15,524 | 1 | Advanced Micro Devices, Inc. | 106,495 |
| 6,558 | 1 | NeoPhotonics Corp. | 82,303 |
| TOTAL | 188,798 | ||
| Services to Medical Professionals—0.7% | |||
| 5,037 | 1 | WebMD Health Corp., Class A | 307,307 |
| Software & Services—0.2% | |||
| 5,464 | 1 | 8x8, Inc. | 75,130 |
| Software Packaged/Custom—2.4% | |||
| 4,757 | Ebix, Inc. | 253,643 | |
| 3,841 | 1 | Ellie Mae, Inc. | 353,795 |
| Shares | Value | ||
| COMMON STOCKS—continued | |||
| Software Packaged/Custom—continued | |||
| 1,024 | 1 | Proofpoint, Inc. | $77,691 |
| 8,649 | 1 | Verint Systems, Inc. | 305,050 |
| TOTAL | 990,179 | ||
| Specialty Chemicals—0.4% | |||
| 5,779 | KMG Chemicals, Inc. | 158,865 | |
| Specialty Retailing—3.1% | |||
| 7,920 | 1 | Build-A-Bear Workshop, Inc. | 107,950 |
| 5,064 | GNC Holdings, Inc. | 103,356 | |
| 11,957 | 1 | Office Depot, Inc. | 41,371 |
| 2,738 | Outerwall, Inc. | 144,183 | |
| 33,181 | Pier 1 Imports, Inc. | 169,887 | |
| 12,016 | 1 | Restoration Hardware, Inc. | 370,213 |
| 22,908 | Tailored Brands, Inc. | 335,602 | |
| TOTAL | 1,272,562 | ||
| Technology Hardware Storage & Peripherals—0.1% | |||
| 8,616 | CPI Card Group, Inc. | 40,667 | |
| Telecommunication Equipment & Services—1.2% | |||
| 2,548 | 1 | Dycom Industries, Inc. | 239,640 |
| 5,403 | 1 | Ubiquiti Networks, Inc. | 241,622 |
| TOTAL | 481,262 | ||
| Telecommunication Services—0.5% | |||
| 91,191 | 1 | Intelsat SA | 209,739 |
| Thrifts & Mortgage Finance—1.0% | |||
| 16,301 | Dime Community Bancorp, Inc. | 282,007 | |
| 2,204 | Meta Financial Group, Inc. | 120,537 | |
| TOTAL | 402,544 | ||
| Toys & Games—0.2% | |||
| 7,468 | 1 | JAKKS Pacific, Inc. | 68,855 |
| Truck Manufacturing—1.0% | |||
| 27,272 | 1 | Wabash National Corp. | 394,899 |
| Undesignated Consumer Cyclicals—1.0% | |||
| 7,983 | DeVry Education Group, Inc. | 177,782 | |
| 20,623 | Rent-A-Center, Inc. | 222,728 | |
| TOTAL | 400,510 | ||
| Undesignated Consumer Staples—0.9% | |||
| 10,536 | Medifast, Inc. | 371,078 | |
| TOTAL COMMON STOCKS (IDENTIFIED COST $37,443,473) | 40,390,954 |
| Shares | Value | ||
| INVESTMENT COMPANY—2.0% | |||
| 803,721 | 2 | Federated Institutional Prime Value Obligations Fund, Institutional Shares, 0.36%3 (IDENTIFIED COST $803,721) | $803,721 |
| TOTAL INVESTMENTS—100.5% (IDENTIFIED COST $38,247,194)4 | 41,194,675 | ||
| OTHER ASSETS AND LIABILITIES - NET—(0.5)%5 | (207,802) | ||
| TOTAL NET ASSETS—100% | $40,986,873 |
| 1 | Non-income-producing security. |
| 2 | Affiliated holding. |
| 3 | 7-day net yield. |
| 4 | The cost of investments for federal tax purposes amounts to $38,404,613. |
| 5 | Assets, other than investments in securities, less liabilities. See Statement of Assets and Liabilities. |
| Year Ended July 31 | 2016 | 2015 | 2014 | 2013 | 2012 |
| Net Asset Value, Beginning of Period | $15.66 | $15.07 | $13.70 | $9.52 | $9.88 |
| Income From Investment Operations: | |||||
| Net investment income (loss) | 0.031 | (0.05)1 | (0.12)1 | (0.01)1 | (0.06)1 |
| Net realized and unrealized gain (loss) on investments | 1.02 | 1.57 | 1.49 | 4.19 | (0.30) |
| TOTAL FROM INVESTMENT OPERATIONS | 1.05 | 1.52 | 1.37 | 4.18 | (0.36) |
| Less Distributions: | |||||
| Distributions from net realized gain on investments | (1.63) | (0.93) | — | — | — |
| Net Asset Value, End of Period | $15.08 | $15.66 | $15.07 | $13.70 | $9.52 |
| Total Return2 | 7.90% | 10.22% | 10.00% | 43.91% | (3.64)% |
| Ratios to Average Net Assets: | |||||
| Net expenses | 1.13% | 1.48% | 1.70% | 1.70% | 1.71% |
| Net investment income (loss) | 0.19% | (0.35)% | (0.77)% | (0.05)% | (0.65)% |
| Expense waiver/reimbursement3 | 1.10% | 0.76% | 0.52% | 1.09% | 4.24% |
| Supplemental Data: | |||||
| Net assets, end of period (000 omitted) | $13,035 | $7,160 | $5,346 | $3,694 | $2,550 |
| Portfolio turnover | 189% | 166% | 174% | 184% | 200% |
| 1 | Per share numbers have been calculated using the average shares method. |
| 2 | Based on net asset value, which does not reflect the sales charge, redemption fee or contingent deferred sales charge, if applicable. |
| 3 | This expense decrease is reflected in both the net expense and the net investment income (loss) ratios shown above. |
| Year Ended July 31 | 2016 | 2015 | 2014 | 2013 | 2012 |
| Net Asset Value, Beginning of Period | $14.48 | $14.10 | $12.91 | $9.04 | $9.45 |
| Income From Investment Operations: | |||||
| Net investment income (loss) | (0.07)1 | (0.16)1 | (0.21)1 | (0.09)1 | (0.12)1 |
| Net realized and unrealized gain (loss) on investments | 0.92 | 1.47 | 1.40 | 3.96 | (0.29) |
| TOTAL FROM INVESTMENT OPERATIONS | 0.85 | 1.31 | 1.19 | 3.87 | (0.41) |
| Less Distributions: | |||||
| Distributions from net realized gain on investments | (1.63) | (0.93) | — | — | — |
| Net Asset Value, End of Period | $13.70 | $14.48 | $14.10 | $12.91 | $9.04 |
| Total Return2 | 7.12% | 9.41% | 9.22% | 42.81% | (4.34)% |
| Ratios to Average Net Assets: | |||||
| Net expenses | 1.88% | 2.28% | 2.45% | 2.45% | 2.46% |
| Net investment income (loss) | (0.56)% | (1.11)% | (1.50)% | (0.81)% | (1.41)% |
| Expense waiver/reimbursement3 | 1.11% | 0.72% | 0.54% | 1.11% | 4.24% |
| Supplemental Data: | |||||
| Net assets, end of period (000 omitted) | $3,422 | $3,031 | $3,338 | $2,636 | $2,358 |
| Portfolio turnover | 189% | 166% | 174% | 184% | 200% |
| 1 | Per share numbers have been calculated using the average shares method. |
| 2 | Based on net asset value, which does not reflect the sales charge, redemption fee or contingent deferred sales charge, if applicable. |
| 3 | This expense decrease is reflected in both the net expense and the net investment income (loss) ratios shown above. |
| Year Ended July 31 | 2016 | 2015 | 2014 | 2013 | 2012 |
| Net Asset Value, Beginning of Period | $16.04 | $15.38 | $13.94 | $9.67 | $10.00 |
| Income From Investment Operations: | |||||
| Net investment income (loss) | 0.061 | (0.02)1 | (0.08)1 | 0.031 | (0.04)1 |
| Net realized and unrealized gain (loss) on investments | 1.07 | 1.61 | 1.52 | 4.24 | (0.29) |
| TOTAL FROM INVESTMENT OPERATIONS | 1.13 | 1.59 | 1.44 | 4.27 | (0.33) |
| Less Distributions: | |||||
| Distributions from net realized gain on investments | (1.63) | (0.93) | — | — | — |
| Net Asset Value, End of Period | $15.54 | $16.04 | $15.38 | $13.94 | $9.67 |
| Total Return2 | 8.24% | 10.48% | 10.33% | 44.16% | (3.30)% |
| Ratios to Average Net Assets: | |||||
| Net expenses | 0.88% | 1.26% | 1.45% | 1.45% | 1.46% |
| Net investment income (loss) | 0.43% | (0.11)% | (0.51)% | 0.23% | (0.44)% |
| Expense waiver/reimbursement3 | 1.11% | 0.74% | 0.52% | 1.10% | 3.77% |
| Supplemental Data: | |||||
| Net assets, end of period (000 omitted) | $24,529 | $20,504 | $21,486 | $14,084 | $11,650 |
| Portfolio turnover | 189% | 166% | 174% | 184% | 200% |
| 1 | Per share numbers have been calculated using the average shares method. |
| 2 | Based on net asset value. |
| 3 | This expense decrease is reflected in both the net expense and the net investment income (loss) ratios shown above. |
| Period Ended 7/31/20161 | |
| Net Asset Value, Beginning of Period | $13.88 |
| Income From Investment Operations: | |
| Net investment income (loss) | (0.01)2 |
| Net realized and unrealized gain on investments | 1.67 |
| TOTAL FROM INVESTMENT OPERATIONS | 1.66 |
| Net Asset Value, End of Period | $15.54 |
| Total Return3 | 11.96% |
| Ratios to Average Net Assets: | |
| Net expenses | 0.87%4 |
| Net investment income (loss) | (0.04)%4 |
| Expense waiver/reimbursement5 | 0.97%4 |
| Supplemental Data: | |
| Net assets, end of period (000 omitted) | $06 |
| Portfolio turnover | 189%7 |
| 1 | Reflects operations for the period from June 29, 2016 (date of initial investment) to July 31, 2016. |
| 2 | Per share number has been calculated using the average shares method. |
| 3 | Based on net asset value. Total returns for periods of less than one year are not annualized. |
| 4 | Computed on an annualized basis. |
| 5 | This expense decrease is reflected in both the net expense and the net investment income (loss) ratios shown above. |
| 6 | Represents less than $1,000. |
| 7 | Portfolio turnover is calculated at the Fund level. Percentage indicated was calculated for the year ended July 31, 2016. |
| Assets: | ||
| Total investment in securities, at value including $803,721 of investment in an affiliated holding (Note 5) (identified cost $38,247,194) | $41,194,675 | |
| Income receivable | 19,640 | |
| Receivable for investments sold | 632,603 | |
| Receivable for shares sold | 65,662 | |
| TOTAL ASSETS | 41,912,580 | |
| Liabilities: | ||
| Payable for investments purchased | $610,165 | |
| Payable for shares redeemed | 225,979 | |
| Payable to adviser (Note 5) | 499 | |
| Payable for administrative fee (Note 5) | 264 | |
| Payable for auditing fees | 24,800 | |
| Payable for distribution services fee (Note 5) | 2,093 | |
| Payable for other service fees (Notes 2 and 5) | 7,666 | |
| Payable for share registration costs | 29,440 | |
| Accrued expenses (Note 5) | 24,801 | |
| TOTAL LIABILITIES | 925,707 | |
| Net assets for 2,692,928.205 shares outstanding | $40,986,873 | |
| Net Assets Consist of: | ||
| Paid-in capital | $38,982,273 | |
| Net unrealized appreciation of investments | 2,947,481 | |
| Accumulated net realized loss on investments | (942,881) | |
| TOTAL NET ASSETS | $40,986,873 |
| Net Asset Value, Offering Price and Redemption Proceeds Per Share | ||
| Class A Shares: | ||
| Net asset value per share ($13,035,341 ÷ 864,264 shares outstanding), no par value, unlimited shares authorized | $15.08 | |
| Offering price per share (100/94.50 of $15.08) | $15.96 | |
| Redemption proceeds per share | $15.08 | |
| Class C Shares: | ||
| Net asset value per share ($3,422,304 ÷ 249,811 shares outstanding), no par value, unlimited shares authorized | $13.70 | |
| Offering price per share | $13.70 | |
| Redemption proceeds per share (99.00/100 of $13.70) | $13.56 | |
| Institutional Shares: | ||
| Net asset value per share ($24,529,116 ÷ 1,578,846 shares outstanding), no par value, unlimited shares authorized | $15.54 | |
| Offering price per share | $15.54 | |
| Redemption proceeds per share | $15.54 | |
| Class R6 Shares: | ||
| Net asset value per share ($112 ÷ 7.205 shares outstanding), no par value, unlimited shares authorized | $15.54 | |
| Offering price per share | $15.54 | |
| Redemption proceeds per share | $15.54 |
| Investment Income: | |||
| Dividends (including $2,330 received from an affiliated holding (Note 5) and net of foreign taxes withheld of $1,454) | $420,351 | ||
| Expenses: | |||
| Investment adviser fee (Note 5) | $357,108 | ||
| Administrative fee (Note 5) | 24,921 | ||
| Custodian fees | 23,095 | ||
| Transfer agent fee (Note 2) | 41,847 | ||
| Directors'/Trustees' fees (Note 5) | 1,797 | ||
| Auditing fees | 26,550 | ||
| Legal fees | 8,734 | ||
| Portfolio accounting fees | 65,535 | ||
| Distribution services fee (Note 5) | 22,216 | ||
| Other service fees (Notes 2 and 5) | 29,586 | ||
| Share registration costs | 55,464 | ||
| Printing and postage | 18,620 | ||
| Miscellaneous (Note 5) | 10,434 | ||
| TOTAL EXPENSES | 685,907 | ||
| Waiver and Reimbursements: | |||
| Waiver/reimbursement of investment adviser fee (Note 5) | $(350,146) | ||
| Reimbursements of other operating expenses (Notes 2 and 5) | (2,057) | ||
| TOTAL WAIVER AND REIMBURSEMENTS | (352,203) | ||
| Net expenses | 333,704 | ||
| Net investment income | 86,647 | ||
| Realized and Unrealized Gain on Investments: | |||
| Net realized gain on investments | 238,839 | ||
| Net change in unrealized appreciation of investments | 2,534,704 | ||
| Net realized and unrealized gain on investments | 2,773,543 | ||
| Change in net assets resulting from operations | $2,860,190 |
| Year Ended July 31 | 2016 | 2015 |
| Increase (Decrease) in Net Assets | ||
| Operations: | ||
| Net investment income (loss) | $86,647 | $(79,268) |
| Net realized gain on investments | 238,839 | 3,442,659 |
| Net change in unrealized appreciation/depreciation of investments | 2,534,704 | (418,792) |
| CHANGE IN NET ASSETS RESULTING FROM OPERATIONS | 2,860,190 | 2,944,599 |
| Distributions to Shareholders: | ||
| Distributions from net investment income | ||
| Class A Shares | (24,130) | — |
| Class C Shares | (8,056) | — |
| Institutional Shares | (54,461) | — |
| Distributions from net realized gain on investments | ||
| Class A Shares | (899,981) | (330,893) |
| Class C Shares | (346,517) | (208,105) |
| Institutional Shares | (2,022,825) | (1,153,048) |
| CHANGE IN NET ASSETS RESULTING FROM DISTRIBUTIONS TO SHAREHOLDERS | (3,355,970) | (1,692,046) |
| Share Transactions: | ||
| Proceeds from sale of shares | 18,430,305 | 6,991,073 |
| Net asset value of shares issued to shareholders in payment of distributions declared | 3,230,590 | 1,610,014 |
| Cost of shares redeemed | (10,873,114) | (9,329,278) |
| CHANGE IN NET ASSETS RESULTING FROM SHARE TRANSACTIONS | 10,787,781 | (728,191) |
| Change in net assets | 10,292,001 | 524,362 |
| Net Assets: | ||
| Beginning of period | 30,694,872 | 30,170,510 |
| End of period (including undistributed net investment income of $0 and $0, respectively) | $40,986,873 | $30,694,872 |
| ■ | Equity securities listed on an exchange or traded through a regulated market system are valued at their last reported sale price or official closing price in their principal exchange or market. |
| ■ | Shares of other mutual funds or non-exchange-traded investment companies are valued based upon their reported NAVs. |
| ■ | Fixed-income securities acquired with remaining maturities greater than 60 days are fair valued using price evaluations provided by a pricing service approved by the Fund's Board of Trustees (the “Trustees”). |
| ■ | Fixed-income securities and repurchase agreements acquired with remaining maturities of 60 days or less are valued at their cost (adjusted for the accretion of any discount or amortization of any premium), unless the issuer's creditworthiness is impaired or other factors indicate that amortized cost is not an accurate estimate of the investment's fair value, in which case it would be valued in the same manner as a longer-term security. |
| ■ | Derivative contracts listed on exchanges are valued at their reported settlement or closing price, except that options are valued at the mean of closing bid and asked quotations. |
| ■ | Over-the-counter (OTC) derivative contracts are fair valued using price evaluations provided by a pricing service approved by the Trustees. |
| ■ | For securities that are fair valued in accordance with procedures established by and under the general supervision of the Trustees, certain factors may be considered such as: the last traded or purchase price of the security, information obtained by contacting the issuer or dealers, analysis of the issuer's financial statements or other available documents, fundamental analytical data, the nature and duration of restrictions on disposition, the movement of the market in which the security is normally traded, public trading in similar securities or derivative contracts of the issuer or comparable issuers, movement of a relevant index, or other factors including but not limited to industry changes and relevant government actions. |
| Transfer Agent Fees Incurred | Transfer Agent Fees Reimbursed | |
| Class A Shares | $11,743 | $(831) |
| Class C Shares | 4,081 | (335) |
| Institutional Shares | 26,023 | (876) |
| TOTAL | $41,847 | $(2,042) |
| Other Service Fees Incurred | Other Service Fees Reimbursed | |
| Class A Shares | $22,181 | $(15) |
| Class C Shares | $7,405 | $— |
| TOTAL | $29,586 | $(15) |
| Year Ended July 31 | 2016 | 2015 | ||
| Class A Shares: | Shares | Amount | Shares | Amount |
| Shares sold | 499,161 | $7,058,133 | 195,981 | $3,035,389 |
| Shares issued to shareholders in payment of distributions declared | 67,053 | 904,542 | 20,829 | 317,649 |
| Shares redeemed | (159,177) | (2,155,066) | (114,348) | (1,754,885) |
| NET CHANGE RESULTING FROM CLASS A SHARE TRANSACTIONS | 407,037 | $5,807,609 | 102,462 | $1,598,153 |
| Year Ended July 31 | 2016 | 2015 | ||
| Class C Shares: | Shares | Amount | Shares | Amount |
| Shares sold | 87,018 | $1,153,452 | 42,094 | $604,168 |
| Shares issued to shareholders in payment of distributions declared | 22,980 | 282,655 | 11,327 | 160,392 |
| Shares redeemed | (69,504) | (901,369) | (80,851) | (1,175,191) |
| NET CHANGE RESULTING FROM CLASS C SHARE TRANSACTIONS | 40,494 | $534,738 | (27,430) | $(410,631) |
| Year Ended July 31 | 2016 | 2015 | ||
| Institutional Shares: | Shares | Amount | Shares | Amount |
| Shares sold | 705,662 | $10,218,620 | 212,197 | $3,351,516 |
| Shares issued to shareholders in payment of distributions declared | 147,325 | 2,043,393 | 72,562 | 1,131,973 |
| Shares redeemed | (552,221) | (7,816,679) | (403,797) | (6,399,202) |
| NET CHANGE RESULTING FROM INSTITUTIONAL SHARE TRANSACTIONS | 300,766 | $4,445,334 | (119,038) | $(1,915,713) |
| Period Ended 7/31/20161 | Year Ended 7/31/2015 | |||
| Class R6 Shares: | Shares | Amount | Shares | Amount |
| Shares sold | 7.205 | $100 | — | $— |
| Shares issued to shareholders in payment of distributions declared | — | — | — | — |
| Shares redeemed | (—) | (—) | — | — |
| NET CHANGE RESULTING FROM CLASS R6 SHARE TRANSACTIONS | 7.205 | $100 | — | $— |
| NET CHANGE RESULTING FROM TOTAL FUND SHARE TRANSACTIONS | 748,304.205 | $10,787,781 | (44,006) | $(728,191) |
| 1 | Reflects operations for the period from June 29, 2016 (date of initial investment) to July 31, 2016. |
| Increase (Decrease) | |
| Paid-In Capital | Accumulated Net Realized Gain (Loss) |
| $(2,490,796) | $2,490,796 |
| 2016 | 2015 | |
| Ordinary income1 | $1,744,423 | $3,125 |
| Long-term capital gains | $1,611,547 | $1,688,921 |
| 1 | For tax purposes, short-term capital gain distributions are considered ordinary income distributions. |
| Net unrealized appreciation | $2,790,062 |
| Capital loss carryforwards and deferrals | $(785,462) |
| Expiration Year | Short-Term | Long-Term | Total |
| 2018 | $537,274 | NA | $537,274 |
| Administrative Fee | Average Daily Net Assets of the Investment Complex |
| 0.150% | on the first $5 billion |
| 0.125% | on the next $5 billion |
| 0.100% | on the next $10 billion |
| 0.075% | on assets in excess of $20 billion |
| Share Class Name | Percentage of Average Daily Net Assets of Class |
| Class A Shares | 0.05% |
| Class C Shares | 0.75% |
| Distribution Services Fees Incurred | |
| Class C Shares | $22,216 |
| Federated Institutional Prime Value Obligations Fund, Institutional Shares | |
| Balance of Shares Held 7/31/2015 | 630,062 |
| Purchases/Additions | 16,125,297 |
| Sales/Reductions | (15,951,638) |
| Balance of Shares Held 7/31/2016 | 803,721 |
| Value | $803,271 |
| Dividend Income | $2,330 |
| Purchases | $67,167,841 |
| Sales | $59,642,142 |
September 22, 2016
| Beginning Account Value 2/1/2016 | Ending Account Value 7/31/2016 | Expenses Paid During Period1 | |
| Actual: | |||
| Class A Shares | $1,000 | $1,253.50 | $6.33 |
| Class C Shares | $1,000 | $1,250.00 | $10.52 |
| Institutional Shares | $1,000 | $1,256.30 | $4.94 |
| Class R6 Shares | $1,000 | $1,119.60 | $0.832 |
| Hypothetical (assuming a 5% return before expenses): | |||
| Class A Shares | $1,000 | $1,019.24 | $5.67 |
| Class C Shares | $1,000 | $1,015.51 | $9.42 |
| Institutional Shares | $1,000 | $1,020.49 | $4.42 |
| Class R6 Shares | $1,000 | $1,020.79 | $4.122 |
| 1 | Expenses are equal to the Fund's annualized net expense ratios, multiplied by the average account value over the period, multiplied by 182/366 (to reflect the one-half-year period). The annualized net expense ratios are as follows: |
| Class A Shares | 1.13% |
| Class C Shares | 1.88% |
| Institutional Shares | 0.88% |
| Class R6 Shares | 0.87% |
| 2 | “Actual” expense information for the Fund's Class R6 Shares is for the period from June 29, 2016 (date of initial investment) to July 31, 2016. Actual expenses are equal to the Fund's annualized net expense ratio of 0.87%, multiplied by 33/366 (to reflect the period from initial investment to July 31, 2016). “Hypothetical” expense information for R6 is presented on the basis of the full one-half year period to enable comparison to other funds. It is based on assuming the same net expense ratio and average account value over the period, but it is multiplied by 182/366 (to reflect the full half-year period). |
| Name Birth Date Positions Held with Trust Date Service Began | Principal Occupation(s) for Past Five Years, Other Directorships Held and Previous Position(s) |
| J. Christopher Donahue* Birth Date: April 11, 1949 President and Trustee Indefinite Term Began serving: May 2006 | Principal Occupations: Principal Executive Officer and President of certain of the Funds in the Federated Fund Family; Director or Trustee of the Funds in the Federated Fund Family; President, Chief Executive
Officer and Director, Federated Investors, Inc.; Chairman and Trustee, Federated Investment Management Company; Trustee, Federated Investment Counseling; Chairman and Director, Federated Global Investment Management
Corp.; Chairman, Federated Equity Management Company of Pennsylvania and Passport Research, Ltd. (investment advisory subsidiary of Federated); Trustee, Federated Shareholder Services Company; Director, Federated
Services Company. Previous Positions: President, Federated Investment Counseling; President and Chief Executive Officer, Federated Investment Management Company, Federated Global Investment Management Corp. and Passport Research, Ltd. |
| Name Birth Date Positions Held with Trust Date Service Began | Principal Occupation(s) for Past Five Years, Other Directorships Held and Previous Position(s) |
| John B. Fisher* Birth Date: May 16, 1956 Trustee Indefinite Term Began serving: May 2016 | Principal Occupations: Principal Executive Officer and President of certain of the Funds in the Federated Fund Family; Director or Trustee of certain of the Funds in the Federated Fund Family; Vice President,
Federated Investors, Inc.; President, Director/Trustee and CEO, Federated Advisory Services Company, Federated Equity Management Company of Pennsylvania, Federated Global Investment Management Corp., Federated
Investment Counseling, Federated Investment Management Company; President and CEO of Passport Research, Ltd.; President of some of the Funds in the Federated Fund Complex and Director, Federated Investors Trust
Company. Previous Positions: President and Director of the Institutional Sales Division of Federated Securities Corp.; President and Director of Federated Investment Counseling; Director, Edgewood Securities Corp.; Director, Federated Services Company; Director, Federated Investors, Inc.; Chairman and Director, Southpointe Distribution Services, Inc. and President, Technology, Federated Services Company. |
| * | Reasons for “interested” status: J. Christopher Donahue and John B. Fisher are interested due to their beneficial ownership of shares of Federated Investors, Inc. and due to positions they hold with Federated and its subsidiaries. J. Christopher Donahue is the son of John F. Donahue, Chairman Emeritus of the Federated Funds. |
| Name Birth Date Positions Held with Trust Date Service Began | Principal Occupation(s) for Past Five Years, Other Directorships Held, Previous Position(s) and Qualifications |
| John T. Collins Birth Date: January 24, 1947 Trustee Indefinite Term Began serving: October 2013 | Principal Occupations: Director or Trustee of the Federated Fund Family; Retired. Other Directorships Held: Director, Chair of the Compensation Committee, Audit Committee member, KLX Corp. Qualifications: Mr. Collins has served in several business and financial management roles and directorship positions throughout his career. Mr. Collins previously served as Chairman and CEO, The Collins Group, Inc. (a private equity firm). Mr. Collins serves as Chairman Emeriti, Bentley University. Mr. Collins previously served as Director, FleetBoston Financial Corp.; Director and Audit Committee Member, Bank of America Corp. and Director, Beth Israel Deaconess Medical Center (Harvard University Affiliate Hospital). |
| Name Birth Date Positions Held with Trust Date Service Began | Principal Occupation(s) for Past Five Years, Other Directorships Held, Previous Position(s) and Qualifications |
| G. Thomas Hough Birth Date: February 28, 1955 Trustee Indefinite Term Began serving: August 2015 | Principal Occupations: Director or Trustee of the Federated Fund Family; Retired. Other Directorships Held: Director, Chair of the Audit Committee, Governance Committee, Publix Super Markets, Inc. Qualifications: Mr. Hough has served in accounting, business management and directorship positions throughout his career. Mr. Hough most recently held the position of Americas Vice Chair of Assurance with Ernst & Young LLP. Mr. Hough is an Executive Committee member of the United States Golf Association, he serves on the President's Cabinet and Business School Board of Visitors for the University of Alabama and is on the Business School Board of Visitors for Wake Forest University. |
| Maureen Lally-Green Birth Date: July 5, 1949 Trustee Indefinite Term Began serving: August 2009 | Principal Occupations: Director or Trustee of the Federated Fund Family; Interim Dean of the Duquesne University School of Law; Adjunct Professor of Law, Duquesne University School of Law. Other Directorships Held: Director, CONSOL Energy Inc. Qualifications: Judge Lally-Green has served in various legal and business roles and directorship positions throughout her career. Judge Lally-Green previously served as: Associate General Secretary, Diocese of Pittsburgh; a member of the Superior Court of Pennsylvania; and as a Professor of Law, Duquesne University School of Law. Judge Lally-Green also holds the positions on either a public or not for profit Board of Directors as follows: Member, Pennsylvania State Board of Education (public); Director and Chair, UPMC Mercy Hospital; Regent, St. Vincent Seminary; Director and Vice Chair, Our Campaign for the Church Alive!, Inc.; Director, Saint Vincent College; and Director and Chair, Cardinal Wuerl North Catholic High School, Inc. Judge Lally-Green has held the positions of: Director, Auberle; Director, Ireland Institute of Pittsburgh; Director, Saint Thomas More Society; and Director, Catholic High Schools of the Diocese of Pittsburgh, Inc. |
| Peter E. Madden Birth Date: March 16, 1942 Trustee Indefinite Term Began serving: June 2006 | Principal Occupation: Director or Trustee, and Chair of the Board of Directors or Trustees, of the Federated Fund Family; Retired. Other Directorships Held: None. Qualifications: Mr. Madden has served in several business management, mutual fund services and directorship positions throughout his career. Mr. Madden previously served as President, Chief Operating Officer and Director, State Street Bank and Trust Company (custodian bank) and State Street Corporation (financial services). He was Director, VISA USA and VISA International and Chairman and Director, Massachusetts Bankers Association. Mr. Madden served as Director, Depository Trust Corporation and Director, The Boston Stock Exchange. Mr. Madden also served as a Representative to the Commonwealth of Massachusetts General Court. |
| Name Birth Date Positions Held with Trust Date Service Began | Principal Occupation(s) for Past Five Years, Other Directorships Held, Previous Position(s) and Qualifications |
| Charles F. Mansfield, Jr. Birth Date: April 10, 1945 Trustee Indefinite Term Began serving: June 2006 | Principal Occupations: Director or Trustee of the Federated Fund Family; Management Consultant. Other Directorships Held: None. Qualifications: Mr. Mansfield has served in several banking, business management and educational roles and directorship positions throughout his career. Mr. Mansfield previously served as Chief Executive Officer, PBTC International Bank; Partner, Arthur Young & Company (now Ernst & Young LLP); Chief Financial Officer of Retail Banking Sector, Chase Manhattan Bank; Senior Vice President, HSBC Bank USA (formerly, Marine Midland Bank); Vice President, Citibank; Assistant Professor of Banking and Finance, Frank G. Zarb School of Business, Hofstra University; Executive Vice President DVC Group, Inc. (marketing, communications and technology). |
| Thomas M. O'Neill Birth Date: June 14, 1951 Trustee Indefinite Term Began serving: October 2006 | Principal Occupations: Director or Trustee, Chair of the Audit Committee of the Federated Fund Family; Sole Proprietor, Navigator Management Company (investment and strategic consulting). Other Directorships Held: None. Qualifications: Mr. O'Neill has served in several business, mutual fund and financial management roles and directorship positions throughout his career. Mr. O'Neill serves as Director, Medicines for Humanity and Director, The Golisano Children's Museum of Naples, Florida. Mr. O'Neill previously served as Chief Executive Officer and President, Managing Director and Chief Investment Officer, Fleet Investment Advisors; President and Chief Executive Officer, Aeltus Investment Management, Inc.; General Partner, Hellman, Jordan Management Co., Boston, MA; Chief Investment Officer, The Putnam Companies, Boston, MA; Credit Analyst and Lending Officer, Fleet Bank; Director and Consultant, EZE Castle Software (investment order management software); and Director, Midway Pacific (lumber). |
| P. Jerome Richey Birth Date: February 23, 1949 Trustee Indefinite Term Began serving: October 2013 | Principal Occupations: Director or Trustee of the Federated Fund Family; Management Consultant. Other Directorships Held: None. Qualifications: Mr. Richey has served in several business and legal management roles and directorship positions throughout his career. Mr. Richey most recently held the positions of Senior Vice Chancellor and Chief Legal Officer, University of Pittsburgh. Mr. Richey serves as Board Member, Epilepsy Foundation of Western Pennsylvania and Board member, World Affairs Council of Pittsburgh. Mr. Richey previously served as Chief Legal Officer and Executive Vice President, CONSOL Energy Inc. and Shareholder, Buchanan Ingersoll & Rooney PC (a law firm). |
| Name Birth Date Positions Held with Trust Date Service Began | Principal Occupation(s) for Past Five Years, Other Directorships Held, Previous Position(s) and Qualifications |
| John S. Walsh Birth Date: November 28, 1957 Trustee Indefinite Term Began serving: June 2006 | Principal Occupations: Director or Trustee of the Federated Fund Family; President and Director, Heat Wagon, Inc. (manufacturer of construction temporary heaters); President and Director, Manufacturers
Products, Inc. (distributor of portable construction heaters); President, Portable Heater Parts, a division of Manufacturers Products, Inc. Other Directorships Held: None. Qualifications: Mr. Walsh has served in several business management roles and directorship positions throughout his career. Mr. Walsh previously served as Vice President, Walsh & Kelly, Inc. (paving contractors). |
| Name Birth Date Address Positions Held with Trust Date Service Began | Principal Occupation(s) for Past Five Years and Previous Position(s) |
| John W. McGonigle Birth Date: October 26, 1938 Secretary Officer since: May 2006 | Principal Occupations: Executive Vice President and Secretary of the Federated Fund Family; Vice Chairman, Executive Vice President, Secretary and Director, Federated Investors, Inc. Previous Positions: Trustee, Federated Investment Management Company and Federated Investment Counseling; Director, Federated Global Investment Management Corp., Federated Services Company and Federated Securities Corp. |
| Lori A. Hensler Birth Date: January 6, 1967 TREASURER Officer since: April 2013 | Principal Occupations: Principal Financial Officer and Treasurer of the Federated Fund Family; Senior Vice President, Federated Administrative Services; Financial and Operations Principal for Federated
Securities Corp. and Edgewood Services, Inc.; and Assistant Treasurer, Federated Investors Trust Company. Ms. Hensler has received the Certified Public Accountant designation. Previous Positions: Controller of Federated Investors, Inc.; Senior Vice President and Assistant Treasurer, Federated Investors Management Company; Treasurer, Federated Investors Trust Company; Assistant Treasurer, Federated Administrative Services, Federated Administrative Services, Inc., Federated Securities Corp., Edgewood Services, Inc., Federated Advisory Services Company, Federated Equity Management Company of Pennsylvania, Federated Global Investment Management Corp., Federated Investment Counseling, Federated Investment Management Company, Passport Research, Ltd., and Federated MDTA, LLC; Financial and Operations Principal for Federated Securities Corp., Edgewood Services, Inc. and Southpointe Distribution Services, Inc. |
| Name Birth Date Address Positions Held with Trust Date Service Began | Principal Occupation(s) for Past Five Years and Previous Position(s) |
| Peter J. Germain Birth Date: September 3, 1959 CHIEF LEGAL OFFICER Officer since: June 2006 | Principal Occupations: Mr. Germain is Chief Legal Officer of the Federated Fund Family. He is General Counsel and Vice President, Federated Investors, Inc.; President, Federated Administrative Services and
Federated Administrative Services, Inc.; Vice President, Federated Securities Corp.; Secretary, Federated Private Asset Management, Inc.; and Secretary, Retirement Plan Service Company of America. Mr. Germain joined
Federated in 1984 and is a member of the Pennsylvania Bar Association. Previous Positions: Deputy General Counsel, Special Counsel, Managing Director of Mutual Fund Services, Federated Investors, Inc.; Senior Vice President, Federated Services Company; and Senior Corporate Counsel, Federated Investors, Inc. |
| Stephen Van Meter Birth Date: June 5, 1975 CHIEF COMPLIANCE OFFICER AND SENIOR VICE PRESIDENT Officer since: July 2015 | Principal Occupations: Senior Vice President and Chief Compliance Officer of the Federated Fund Family; Vice President and Chief Compliance Officer of Federated Investors, Inc. and Chief Compliance Officer of
certain of its subsidiaries. Mr. Van Meter joined Federated in October 2011. He holds FINRA licenses under Series 3, 7, 24 and 66. Previous Positions: Mr. Van Meter previously held the position of Compliance Operating Officer, Federated Investors, Inc. Prior to joining Federated, Mr. Van Meter served at the United States Securities and Exchange Commission in the positions of Senior Counsel, Office of Chief Counsel, Division of Investment Management and Senior Counsel, Division of Enforcement. |
| Stephen F. Auth Birth Date: September 13, 1956 101 Park Avenue 41st Floor New York, NY 10178 CHIEF INVESTMENT OFFICER Officer since: June 2012 | Principal Occupations: Stephen F. Auth is Chief Investment Officer of various Funds in the Federated Fund Family; Executive Vice President, Federated Investment Counseling, Federated Global Investment
Management Corp. and Federated Equity Management Company of Pennsylvania. Previous Positions: Executive Vice President, Federated Investment Management Company and Passport Research, Ltd. (investment advisory subsidiary of Federated); Senior Vice President, Global Portfolio Management Services Division; Senior Vice President, Federated Investment Management Company and Passport Research, Ltd.; Senior Managing Director and Portfolio Manager, Prudential Investments. |
4000 Ericsson Drive
Warrendale, PA 15086-7561
or call 1-800-341-7400.
CUSIP 31421R791
CUSIP 31421R783
CUSIP 31421R627
2016 ©Federated Investors, Inc.
| 1 | The Fund's Class R6 Shares commenced operations on June 29, 2016. For the period prior to the commencement of operations of Class R6 Shares, the performance information shown is for the Fund's Institutional Shares adjusted to reflect expenses of the Class R6 Shares for each year for which the gross expenses of Class R6 Shares would have exceeded the actual expenses paid by Institutional Shares. |
| 2 | Please see the footnotes to the line graphs below for definitions of, and further information about, the R2000G. |
| 3 | Please see the footnotes to the line graphs below for definitions of, and further information about, the MSGFA. |
| 4 | The Russell 3000® Index measures the performance of the largest 3,000 U.S. companies representing approximately 98% of the investable U.S. equity market. The Russell 3000® Index is constructed to provide a comprehensive, unbiased, and stable barometer of the broad market and is completely reconstituted annually to ensure new and growing equities are reflected. The index is unmanaged, and it is not possible to invest directly in an index. |
| 5 | The Russell Top 200® Index measures the performance of the largest cap segment of the U.S. equity universe. The Russell Top 200® Index is a subset of the Russell 3000® Index. It includes approximately 200 of the largest securities based on a combination of their market cap and current index membership and represents approximately 68% of the U.S. market. The Russell Top 200® Index is constructed to provide a comprehensive and unbiased barometer for this very large cap segment and is completely reconstituted annually to ensure new and growing equities are reflected. The index is unmanaged, and it is not possible to invest directly in an index. |
| 6 | The Russell Midcap® Index measures the performance of the mid-cap segment of the U.S. equity universe. The Russell Midcap® Index is a subset of the Russell 1000® Index. It includes approximately 800 of the smallest securities based on a combination of their market cap and current index membership. The Russell Midcap® Index represents approximately 31% of the total market capitalization of the Russell 1000® companies. The Russell Midcap® Index is constructed to provide a comprehensive and unbiased barometer for the mid-cap segment. The Russell Midcap® Index is completely reconstituted annually to ensure larger stocks do not distort the performance and characteristics of the true mid-cap opportunity set. The index is unmanaged, and it is not possible to invest directly in an index. |
| 7 | Small-cap stocks may be less liquid and subject to greater price volatility than large-cap stocks. |
| 8 | The Russell 2000® Index measures the performance of the small-cap segment of the U.S. equity universe. The Russell 2000® Index is a subset of the Russell 3000® Index representing approximately 10% of the total market capitalization of that index. It includes approximately 2000 of the smallest securities based on a combination of their market cap and current index membership. The Russell 2000® Index is constructed to provide a comprehensive and unbiased small-cap barometer and is completely reconstituted annually to ensure larger stocks do not distort the performance and characteristics of the true small-cap opportunity set. The index is unmanaged, and it is not possible to invest directly in an index. |
| 9 | The Russell Microcap® Index measures the performance of the microcap segment of the U.S. equity market. Microcap stocks make up less than 3% of the U.S. equity market (by market cap) and consist of the smallest 1,000 securities in the small-cap Russell 2000® Index, plus the next 1,000 smallest eligible securities by market cap. The Russell Microcap® Index is constructed to provide a comprehensive and unbiased barometer for the microcap segment trading on national exchanges and is completely reconstituted annually to ensure new and growing equities are reflected and companies continue to reflect appropriate capitalization and value characteristics. The Russell Microcap® Index is unmanaged, and it is not possible to invest directly in an index. |
| 10 | The Russell 3000® Value Index measures the performance of the broad value segment of the U.S. equity value universe. It includes those Russell 3000® Index companies with lower price-to-book ratios and lower forecasted growth values. The Russell 3000® Value Index is constructed to provide a comprehensive, unbiased and stable barometer of the broad value market. The Russell 3000® Value Index is completely reconstituted annually to ensure new and growing equities are included and that the represented companies continue to reflect value characteristics. The index is unmanaged, and it is not possible to invest directly in an index. |
| 11 | The Russell 3000® Growth Index measures the performance of the broad growth segment of the U.S. equity universe. It includes those Russell 3000® Index companies with higher price-to-book ratios and higher forecasted growth values. The Russell 3000® Growth Index is constructed to provide a comprehensive, unbiased and stable barometer of the broad growth market. The Russell 3000® Growth Index is completely reconstituted annually to ensure new and growing equities are included and that the represented companies continue to reflect growth characteristics. The index is unmanaged, and it is not possible to invest directly in an index. |
| 12 | The Russell Microcap® Value Index measures the performance of the micro-cap value segment of the U.S. equity universe. It includes those Russell Microcap® Index companies with higher price-to-book ratios and lower forecasted growth values. The Russell Microcap® Value Index is constructed to provide a comprehensive, unbiased and stable barometer of the micro-cap value market. The Russell Microcap Value Index is completely reconstituted annually to ensure new and growing equities are included and that the represented companies continue to reflect value characteristics. The index is unmanaged, and it is not possible to invest directly in an index. |
| 13 | The Russell Microcap® Growth Index measures the performance of the microcap growth segment of the U.S. equity market. It includes Russell Microcap companies that are considered more growth oriented relative to the overall market as defined by Russell's leading style methodology. The Russell Microcap® Growth Index is constructed to provide a comprehensive and unbiased barometer for the microcap growth segment of the market. The Russell Microcap® Growth Index is completely reconstituted annually to ensure larger stocks do not distort performance and characteristics of the microcap opportunity set. The Russell Microcap® Growth Index is unmanaged, and it is not possible to invest directly in an index. |
| ■ | Total returns shown for Class C Shares include the maximum contingent deferred sales charge of 1.00% as applicable. |
| 1 Year | 5 Years | 10 Years | |
| Class A Shares | -3.32% | 10.32% | 6.51% |
| Class B Shares | -3.08% | 10.47% | 6.49% |
| Class C Shares | 0.66% | 10.74% | 6.32% |
| Institutional Shares | 2.56% | 11.85% | 7.40% |
| Class R6 Shares5 | 2.39% | 11.68% | 6.58% |
| R2000G | -5.30% | 10.78% | 8.40% |
| MSGFA | -5.12% | 9.32% | 7.66% |
| 1 | Represents a hypothetical investment of $10,000 in the Fund after deducting applicable sales charges: for Class A Shares, the maximum sales charge of 5.50% ($10,000 investment minus $550 sales charges = $9,450); for Class B Shares, the maximum contingent deferred sales charge is 5.50% on any redemption less than one year from the purchase date; for Class C Shares, a 1.00% contingent deferred sales charge would be applied to any redemption less than one year from the purchase date. The Fund's performance assumes the reinvestment of all dividends and distributions. The R2000G and MSGFA have been adjusted to reflect reinvestment of dividends on securities. |
| 2 | The Fund is the successor to the MDT Small Cap Growth Fund pursuant to a reorganization that took place on December 8, 2006. Prior to that date, the Fund had no investment operations. Accordingly, the performance information shown for periods prior to that date is that of the MDT Small Cap Growth Fund. |
| 3 | The R2000G measures the performance of the small-cap growth segment of the U.S. equity universe. It includes those Russell 2000® Index companies with higher price-to-value ratios and higher forecasted growth values. The R2000G is constructed to provide a comprehensive and unbiased barometer for the small-cap growth segment. The R2000G is completely reconstituted annually to ensure larger stocks do not distort the performance and characteristics of the true small-cap opportunity set and that the represented companies continue to reflect growth characteristics. The R2000G is unmanaged and, unlike the Fund, is not affected by cash flows. It is not possible to invest directly in an index. The R2000G is not adjusted to reflect sales charges, expenses or other fees that the Securities and Exchange Commission requires to be reflected in the Fund's performance. |
| 4 | Morningstar figures represent the average of the total returns reported by all the mutual funds designated by Morningstar as falling into the respective category indicated. They do not reflect sales charges. |
| 5 | The Fund's Class R6 Shares commenced operations on June 29, 2016. It is anticipated that this class will have the lowest net expenses of all outstanding share classes. For the period prior to the commencement of operations of Class R6 Shares, the performance information shown is for the Fund's Institutional Shares adjusted to reflect expenses of the Class R6 Shares for each year for which the gross expenses of Class R6 Shares would have exceeded the actual expenses paid by Institutional Shares. |
| Industry Composition | Percentage of Total Net Assets |
| Software Packaged/Custom | 7.2% |
| Biotechnology | 6.7% |
| Specialty Retailing | 5.5% |
| Health Care Equipment & Supplies | 3.8% |
| Specialty Chemicals | 3.3% |
| Internet Services | 2.9% |
| Auto Original Equipment Manufacturers | 2.7% |
| Telecommunication Equipment & Services | 2.7% |
| Services to Medical Professionals | 2.5% |
| Miscellaneous Communications | 2.4% |
| Airline—Regional | 2.3% |
| Office Furniture | 2.3% |
| Financial Services | 2.2% |
| Broadcasting | 2.1% |
| Property Liability Insurance | 2.0% |
| Semiconductor Manufacturing Equipment | 1.9% |
| Professional Services | 1.7% |
| Medical Supplies | 1.6% |
| Contracting | 1.5% |
| Dairy Products | 1.5% |
| Software | 1.5% |
| Home Products | 1.4% |
| Electric & Electronic Original Equipment Manufacturers | 1.3% |
| Electrical Equipment | 1.3% |
| Home Health Care | 1.3% |
| Pharmaceuticals | 1.3% |
| Recreational Goods | 1.3% |
| Truck Manufacturing | 1.3% |
| Clothing Stores | 1.2% |
| Cogeneration | 1.2% |
| Internet Software & Services | 1.2% |
| Personnel Agency | 1.2% |
| Undesignated Consumer Staples | 1.2% |
| Apparel | 1.1% |
| Furniture | 1.1% |
| Health Care Providers & Services | 1.1% |
| IT Services | 1.1% |
| Industry Composition | Percentage of Total Net Assets |
| Photo-Optical Component-Equipment | 1.1% |
| Semiconductor Manufacturing | 1.1% |
| Machinery | 1.0% |
| Other2 | 15.0% |
| Cash Equivalents3 | 2.1% |
| Other Assets and Liabilities—Net4 | (0.2)% |
| TOTAL | 100.0% |
| 1 | Except for Cash Equivalents and Other Assets and Liabilities, industry classifications are based upon, and individual portfolio securities are assigned to, the classifications of the Global Industry Classification Standard (GICS) except that the Adviser assigns a classification to securities not classified by the GICS and to securities for which the Adviser does not have access to the classification made by the GICS. |
| 2 | For purposes of this table, industry classifications which constitute less than 1.0% of the Fund's total net assets have been aggregated under the designation “Other.” |
| 3 | Cash Equivalents include any investments in money market mutual funds and/or overnight repurchase agreements. |
| 4 | Assets, other than investments in securities, less liabilities. See Statement of Assets and Liabilities. |
| Shares | Value | ||
| COMMON STOCKS—98.1% | |||
| Airline - Regional—2.3% | |||
| 5,972 | Allegiant Travel Co. | $774,986 | |
| 23,600 | 1 | Hawaiian Holdings, Inc. | 1,074,508 |
| TOTAL | 1,849,494 | ||
| Apparel—1.1% | |||
| 28,972 | 1 | Express, Inc. | 433,421 |
| 8,162 | Oxford Industries, Inc. | 466,703 | |
| TOTAL | 900,124 | ||
| Auto Original Equipment Manufacturers—2.7% | |||
| 33,393 | 1 | American Axle & Manufacturing Holdings, Inc. | 581,372 |
| 77,507 | 1 | Commercial Vehicle Group, Inc. | 320,879 |
| 9,791 | 1 | Stoneridge, Inc. | 163,314 |
| 18,238 | 1 | Tenneco, Inc. | 1,030,812 |
| TOTAL | 2,096,377 | ||
| Auto Part Replacement—0.2% | |||
| 10,232 | Supreme Industries, Inc. | 171,898 | |
| Biotechnology—6.7% | |||
| 117,234 | 1 | Aegerion Pharmaceuticals, Inc. | 168,818 |
| 9,395 | 1 | Anika Therapeutics, Inc. | 468,998 |
| 4,257 | 1 | Applied Genetic Technologies Corp. | 63,983 |
| 15,852 | 1 | Ariad Pharmaceuticals, Inc. | 150,753 |
| 3,175 | 1 | Cambrex Corp. | 166,402 |
| 104,454 | 1 | Celldex Therapeutics, Inc. | 482,578 |
| 11,828 | 1 | Clovis Oncology, Inc. | 168,904 |
| 11,786 | 1 | Esperion Therapeutics, Inc. | 127,996 |
| 11,939 | 1 | Five Prime Therapeutics, Inc. | 605,188 |
| 52,904 | 1 | INSYS Therapeutics, Inc. | 827,948 |
| 22,740 | 1 | Nektar Therapeutics | 393,175 |
| 62,942 | 1 | NewLink Genetics Corp. | 665,926 |
| 3,541 | 1 | Ophthotech Corp. | 227,474 |
| 18,038 | 1 | Osiris Therapeutics, Inc. | 90,190 |
| 84,022 | PDL BioPharma, Inc. | 295,757 | |
| 12,828 | 1 | Xencor, Inc. | 242,962 |
| 35,482 | 1 | Zafgen, Inc. | 107,865 |
| TOTAL | 5,254,917 |
| Shares | Value | ||
| COMMON STOCKS—continued | |||
| Broadcasting—2.1% | |||
| 9,285 | Nexstar Broadcasting Group, Inc., Class A | $469,357 | |
| 42,527 | Sinclair Broadcast Group, Inc. | 1,183,101 | |
| TOTAL | 1,652,458 | ||
| Building Products—0.7% | |||
| 34,885 | 1 | Ply Gem Holdings, Inc. | 535,834 |
| Clothing Stores—1.2% | |||
| 46,704 | American Eagle Outfitters, Inc. | 836,936 | |
| 7,653 | 1 | Francesca's Holdings Corp. | 97,269 |
| TOTAL | 934,205 | ||
| Cogeneration—1.2% | |||
| 36,869 | 1 | Headwaters, Inc. | 733,324 |
| 86,100 | 1 | Rentech, Inc. | 220,416 |
| TOTAL | 953,740 | ||
| Computer Networking—0.2% | |||
| 6,264 | 1 | Cray, Inc. | 197,692 |
| Computer Peripherals—0.6% | |||
| 6,615 | 1 | Synaptics, Inc. | 343,649 |
| 15,673 | 1 | Zagg, Inc. | 99,210 |
| TOTAL | 442,859 | ||
| Computer Stores—0.2% | |||
| 6,322 | 1 | Insight Enterprises, Inc. | 168,165 |
| Consumer Finance—0.9% | |||
| 80,396 | 1 | Enova International, Inc. | 730,800 |
| Contracting—1.5% | |||
| 21,700 | Comfort Systems USA, Inc. | 659,246 | |
| 53,320 | Harsco Corp. | 522,003 | |
| TOTAL | 1,181,249 | ||
| Dairy Products—1.5% | |||
| 64,365 | Dean Foods Co. | 1,188,178 | |
| Defense Aerospace—0.2% | |||
| 7,587 | 1 | Ducommun, Inc. | 146,733 |
| Diversified Leisure—0.7% | |||
| 28,509 | 1 | Isle of Capri Casinos, Inc. | 533,974 |
| Diversified Telecommunication Services—0.5% | |||
| 27,526 | 1 | 8x8, Inc. | 378,482 |
| Education & Training Services—0.1% | |||
| 3,960 | 1 | American Public Education, Inc. | 113,414 |
| Shares | Value | ||
| COMMON STOCKS—continued | |||
| Electric & Electronic Original Equipment Manufacturers—1.3% | |||
| 17,252 | 1 | Generac Holdings, Inc. | $651,953 |
| 24,540 | General Cable Corp. | 361,474 | |
| TOTAL | 1,013,427 | ||
| Electrical Equipment—1.3% | |||
| 14,244 | Belden, Inc. | 1,042,803 | |
| Electronic Components—0.2% | |||
| 29,628 | 1 | Oclaro, Inc. | 169,768 |
| Electronic Instruments—0.8% | |||
| 55,331 | 1 | Ixia | 636,306 |
| Energy Equipment & Services—0.3% | |||
| 18,230 | 1 | RigNet, Inc. | 217,849 |
| Ethical Drugs—0.5% | |||
| 2,731 | 1 | Ligand Pharmaceuticals, Inc., Class B | 368,357 |
| Financial Services—2.2% | |||
| 20,021 | Deluxe Corp. | 1,353,220 | |
| 26,420 | Liberty Tax, Inc. | 366,181 | |
| TOTAL | 1,719,401 | ||
| Food Products—0.5% | |||
| 27,959 | 1 | Amplify Snack Brands, Inc. | 398,695 |
| Furniture—1.1% | |||
| 7,576 | Bassett Furniture Industries, Inc. | 195,688 | |
| 18,446 | Ethan Allen Interiors, Inc. | 640,630 | |
| TOTAL | 836,318 | ||
| Health Care Equipment & Supplies—3.8% | |||
| 9,978 | 1 | Cardiovascular Systems, Inc. | 195,669 |
| 13,461 | 1 | iRadimed Corp. | 260,605 |
| 129,167 | 1 | Lantheus Holdings, Inc. | 548,960 |
| 31,107 | LeMaitre Vascular, Inc. | 535,040 | |
| 25,030 | 1 | Masimo Corp. | 1,325,839 |
| 36,232 | 1 | RTI Surgical, Inc. | 117,754 |
| TOTAL | 2,983,867 | ||
| Health Care Providers & Services—1.1% | |||
| 18,869 | 1 | PRA Health Sciences, Inc. | 875,144 |
| Home Health Care—1.3% | |||
| 7,043 | 1 | Amedisys, Inc. | 377,153 |
| 42,759 | 1 | Cross Country Healthcare, Inc. | 625,136 |
| TOTAL | 1,002,289 |
| Shares | Value | ||
| COMMON STOCKS—continued | |||
| Home Products—1.4% | |||
| 61,452 | Libbey, Inc. | $1,148,538 | |
| Hotels and Motels—0.5% | |||
| 19,909 | 1 | Boyd Gaming Corp. | 390,415 |
| Insurance Brokerage—0.1% | |||
| 12,716 | 1 | eHealth, Inc. | 121,438 |
| Internet Services—2.9% | |||
| 71,612 | EarthLink Network, Inc. | 485,529 | |
| 23,546 | 1 | Etsy, Inc. | 236,873 |
| 18,430 | j2 Global, Inc. | 1,231,861 | |
| 16,866 | 1 | Web.com Group, Inc. | 318,093 |
| TOTAL | 2,272,356 | ||
| Internet Software & Services—1.2% | |||
| 11,878 | 1 | Apigee Corp. | 147,762 |
| 8,029 | 1 | Brightcove, Inc. | 84,064 |
| 26,772 | 1 | Care.com, Inc. | 294,224 |
| 9,499 | 1 | Cornerstone OnDemand, Inc. | 410,262 |
| TOTAL | 936,312 | ||
| IT Services—1.1% | |||
| 24,988 | Hackett Group, Inc. | 334,589 | |
| 39,685 | Travelport Worldwide Ltd. | 535,351 | |
| TOTAL | 869,940 | ||
| Life Sciences Tools & Services—0.9% | |||
| 15,504 | 1 | INC Research Holdings, Inc. | 690,083 |
| Machinery—1.0% | |||
| 28,693 | Global Brass & Copper Holdings, Inc. | 812,586 | |
| Medical Supplies—1.6% | |||
| 5,158 | 1 | Cutera, Inc. | 55,655 |
| 19,239 | 1 | NuVasive, Inc. | 1,196,666 |
| TOTAL | 1,252,321 | ||
| Medical Technology—0.5% | |||
| 9,159 | 1 | Vascular Solutions, Inc. | 420,123 |
| Miscellaneous Communications—2.4% | |||
| 38,060 | 1 | FairPoint Communications, Inc. | 616,191 |
| 107,732 | 1 | Internap Network Services Corp. | 239,165 |
| 13,357 | Shenandoah Telecommunications Co. | 548,706 | |
| 22,828 | West Corp. | 504,727 | |
| TOTAL | 1,908,789 |
| Shares | Value | ||
| COMMON STOCKS—continued | |||
| Miscellaneous Components—0.8% | |||
| 33,517 | 1 | Nanometrics, Inc. | $671,681 |
| Multi-Industry Capital Goods—0.7% | |||
| 7,258 | 1 | DXP Enterprises, Inc. | 120,773 |
| 9,756 | EnPro Industries, Inc. | 446,337 | |
| TOTAL | 567,110 | ||
| Office Furniture—2.3% | |||
| 38,063 | Knoll, Inc. | 961,091 | |
| 25,487 | Miller Herman, Inc. | 835,209 | |
| TOTAL | 1,796,300 | ||
| Oil Service, Explore & Drill—0.2% | |||
| 10,374 | 1 | PetroQuest Energy, Inc. | 33,508 |
| 33,657 | 1 | Pioneer Energy Services Corp. | 106,020 |
| TOTAL | 139,528 | ||
| Other Communications Equipment—0.7% | |||
| 11,203 | 1 | Netgear, Inc. | 576,170 |
| Paper Products—0.6% | |||
| 65,895 | 1 | Xerium Technologies, Inc. | 490,918 |
| Personal Loans—0.4% | |||
| 8,019 | 1 | World Acceptance Corp. | 348,506 |
| Personnel Agency—1.2% | |||
| 14,522 | 1 | AMN Healthcare Services, Inc. | 614,281 |
| 17,042 | KForce Com, Inc. | 304,370 | |
| TOTAL | 918,651 | ||
| Pharmaceuticals—1.3% | |||
| 5,573 | 1 | ANI Pharmaceuticals, Inc. | 337,724 |
| 39,781 | 1 | Innoviva, Inc. | 511,981 |
| 36,352 | 1 | Tetraphase Pharmaceuticals, Inc. | 146,135 |
| TOTAL | 995,840 | ||
| Photo-Optical Component-Equipment—1.1% | |||
| 7,938 | 1 | Coherent, Inc. | 841,825 |
| Printing—0.2% | |||
| 6,027 | Quad Graphics, Inc. | 152,845 | |
| Professional Services—1.7% | |||
| 6,749 | CEB, Inc. | 405,210 | |
| 9,407 | Insperity, Inc. | 738,355 | |
| 3,274 | 1 | WageWorks, Inc. | 202,366 |
| TOTAL | 1,345,931 |
| Shares | Value | ||
| COMMON STOCKS—continued | |||
| Property Liability Insurance—2.0% | |||
| 23,370 | Employers Holdings, Inc. | $666,512 | |
| 7,143 | HCI Group, Inc. | 215,433 | |
| 14,649 | Heritage Insurance Holdings, Inc. | 181,501 | |
| 22,320 | Universal Insurance Holdings, Inc. | 485,237 | |
| TOTAL | 1,548,683 | ||
| Real Estate Management & Development—0.4% | |||
| 14,475 | 1 | Altisource Portfolio Solutions S.A. | 336,689 |
| Recreational Goods—1.3% | |||
| 24,599 | 1 | Scientific Games Holdings Corp. | 262,103 |
| 27,274 | 1 | Smith & Wesson Holding Corp. | 803,219 |
| TOTAL | 1,065,322 | ||
| Road & Rail—0.2% | |||
| 17,851 | 1 | Roadrunner Transportation Systems, Inc. | 135,132 |
| Semiconductor Manufacturing—1.1% | |||
| 41,565 | 1 | Advanced Micro Devices, Inc. | 285,136 |
| 12,330 | 1 | Cirrus Logic, Inc. | 599,115 |
| TOTAL | 884,251 | ||
| Semiconductor Manufacturing Equipment—1.9% | |||
| 22,057 | 1 | Advanced Energy Industries, Inc. | 898,161 |
| 19,339 | Tessera Technologies, Inc. | 621,555 | |
| TOTAL | 1,519,716 | ||
| Semiconductors & Semiconductor Equipment—0.3% | |||
| 9,402 | 1 | MaxLinear, Inc. | 205,058 |
| Services to Medical Professionals—2.5% | |||
| 19,730 | 1 | Advisory Board Co. | 823,925 |
| 18,766 | 1 | WebMD Health Corp., Class A | 1,144,913 |
| TOTAL | 1,968,838 | ||
| Software—1.5% | |||
| 20,891 | 1 | Mitek Systems, Inc. | 157,727 |
| 6,990 | 1 | Proofpoint, Inc. | 530,331 |
| 2,852 | 1 | Varonis Systems, Inc. | 73,268 |
| 17,988 | 1 | Xactly Corp. | 223,411 |
| 7,254 | 1 | Zendesk, Inc. | 219,361 |
| TOTAL | 1,204,098 | ||
| Software Packaged/Custom—7.2% | |||
| 5,857 | 1 | Barracuda Networks, Inc. | 129,323 |
| 5,863 | 1 | BroadSoft, Inc. | 262,838 |
| 3,635 | CSG Systems International, Inc. | 146,345 |
| Shares | Value | ||
| COMMON STOCKS—continued | |||
| Software Packaged/Custom—continued | |||
| 4,817 | 1 | Commvault Systems, Inc. | $249,232 |
| 14,298 | Ebix, Inc. | 762,369 | |
| 8,367 | 1 | Ellie Mae, Inc. | 770,684 |
| 50,306 | 1 | Five9, Inc. | 634,359 |
| 3,162 | 1 | Fleetmatics Group PLC | 135,839 |
| 4,006 | 1 | Guidewire Software, Inc. | 246,249 |
| 8,602 | 1 | Paycom Software, Inc. | 406,100 |
| 3,467 | 1 | Paylocity Corp. | 154,767 |
| 9,221 | Pegasystems, Inc. | 257,266 | |
| 11,958 | 1 | Perficient, Inc. | 265,707 |
| 2,475 | 1 | Qualys, Inc. | 77,690 |
| 11,252 | 1 | RealPage, Inc. | 282,988 |
| 7,305 | Sapiens International Corp. NV | 93,358 | |
| 3,783 | 1 | Take-Two Interactive Software, Inc. | 152,001 |
| 17,799 | 1 | Verint Systems, Inc. | 627,771 |
| TOTAL | 5,654,886 | ||
| Specialty Chemicals—3.3% | |||
| 21,195 | KMG Chemicals, Inc. | 582,651 | |
| 13,295 | 1 | Koppers Holdings, Inc. | 420,388 |
| 31,898 | Trinseo SA | 1,588,201 | |
| TOTAL | 2,591,240 | ||
| Specialty Retailing—5.5% | |||
| 15,265 | Big Lots, Inc. | 811,793 | |
| 7,589 | 1 | Build-A-Bear Workshop, Inc. | 103,438 |
| 26,320 | GNC Holdings, Inc. | 537,191 | |
| 6,600 | 1 | Kirkland's, Inc. | 100,584 |
| 7,453 | Outerwall, Inc. | 392,475 | |
| 111,263 | Pier 1 Imports, Inc. | 569,667 | |
| 35,274 | 1 | Restoration Hardware, Inc. | 1,086,792 |
| 48,116 | Tailored Brands, Inc. | 704,899 | |
| TOTAL | 4,306,839 | ||
| Technology Hardware Storage & Peripherals—0.3% | |||
| 44,131 | CPI Card Group, Inc. | 208,298 | |
| Telecommunication Equipment & Services—2.7% | |||
| 7,969 | 1 | Dycom Industries, Inc. | 749,484 |
| 9,697 | 1 | Gigamon, Inc. | 453,044 |
| 10,970 | 1 | NeuStar, Inc., Class A | 276,334 |
| 13,827 | 1 | Sonus Networks, Inc. | 119,189 |
| Shares | Value | ||
| COMMON STOCKS—continued | |||
| Telecommunication Equipment & Services—continued | |||
| 12,275 | 1 | Ubiquiti Networks, Inc. | $548,938 |
| TOTAL | 2,146,989 | ||
| Thrifts & Mortgage Finance—0.5% | |||
| 17,809 | 1 | Walker & Dunlop, Inc. | 421,539 |
| Truck Manufacturing—1.3% | |||
| 18,837 | 1 | Accuride Corp. | 25,241 |
| 67,983 | 1 | Wabash National Corp. | 984,394 |
| TOTAL | 1,009,635 | ||
| Undesignated Consumer Cyclicals—0.8% | |||
| 11,522 | 1 | Strayer Education, Inc. | 526,786 |
| 12,510 | Weight Watchers International, Inc. | 149,244 | |
| TOTAL | 676,030 | ||
| Undesignated Consumer Staples—1.2% | |||
| 26,224 | Medifast, Inc. | 923,609 | |
| Undesignated Technology—0.3% | |||
| 53,874 | 1 | American Reprographics Co. | 212,264 |
| TOTAL COMMON STOCKS (IDENTIFIED COST $72,312,811) | 77,382,139 | ||
| INVESTMENT COMPANY—2.1% | |||
| 1,660,718 | 2 | Federated Institutional Prime Value Obligations Fund, Institutional Shares, 0.36%3 (AT NET ASSET VALUE) | 1,660,718 |
| TOTAL INVESTMENTS—100.2% (IDENTIFIED COST $73,973,529)4 | 79,042,857 | ||
| OTHER ASSETS AND LIABILITIES - NET—(0.2)%5 | (158,434) | ||
| TOTAL NET ASSETS—100% | $78,884,423 |
| 1 | Non-income-producing security. |
| 2 | Affiliated holding. |
| 3 | 7-day net yield. |
| 4 | The cost of investments for federal tax purposes amounts to $74,358,469. |
| 5 | Assets, other than investments in securities, less liabilities. See Statement of Assets and Liabilities. |
| Year Ended July 31 | 2016 | 2015 | 2014 | 2013 | 2012 |
| Net Asset Value, Beginning of Period | $20.49 | $17.39 | $16.12 | $11.93 | $12.12 |
| Income From Investment Operations: | |||||
| Net investment income (loss) | (0.06)1 | (0.12)1 | (0.18)1 | (0.07)1 | (0.09)1 |
| Net realized and unrealized gain (loss) on investments | 0.32 | 3.22 | 1.45 | 4.26 | (0.10) |
| TOTAL FROM INVESTMENT OPERATIONS | 0.26 | 3.10 | 1.27 | 4.19 | (0.19) |
| Less Distributions: | |||||
| Distributions from net realized gain on investments | (3.09) | — | — | — | — |
| TOTAL DISTRIBUTIONS | (3.09) | — | — | — | — |
| Net Asset Value, End of Period | $17.66 | $20.49 | $17.39 | $16.12 | $11.93 |
| Total Return2 | 2.30% | 17.83% | 7.88% | 35.12% | (1.57)% |
| Ratios to Average Net Assets: | |||||
| Net expenses | 1.13% | 1.54% | 1.75% | 1.75% | 1.75% |
| Net investment income (loss) | (0.34)% | (0.66)% | (1.05)% | (0.49)% | (0.79)% |
| Expense waiver/reimbursement3 | 1.00% | 0.61% | 0.43% | 0.59% | 1.04% |
| Supplemental Data: | |||||
| Net assets, end of period (000 omitted) | $29,707 | $32,136 | $29,690 | $30,187 | $22,718 |
| Portfolio turnover | 198% | 121% | 61% | 88% | 69% |
| 1 | Per share numbers have been calculated using the average shares method. |
| 2 | Based on net asset value, which does not reflect the sales charge, redemption fee or contingent deferred sales charge, if applicable. |
| 3 | This expense decrease is reflected in both the net expense and the net investment income (loss) ratios shown above. |
| Year Ended July 31 | 2016 | 2015 | 2014 | 2013 | 2012 |
| Net Asset Value, Beginning of Period | $19.51 | $16.69 | $15.58 | $11.62 | $11.90 |
| Income From Investment Operations: | |||||
| Net investment income (loss) | (0.18)1 | (0.25)1 | (0.30)1 | (0.17)1 | (0.17)1 |
| Net realized and unrealized gain (loss) on investments | 0.29 | 3.07 | 1.41 | 4.13 | (0.11) |
| TOTAL FROM INVESTMENT OPERATIONS | 0.11 | 2.82 | 1.11 | 3.96 | (0.28) |
| Less Distributions: | |||||
| Distributions from net realized gain on investments | (3.09) | — | — | — | — |
| TOTAL DISTRIBUTIONS | (3.09) | — | — | — | — |
| Net Asset Value, End of Period | $16.53 | $19.51 | $16.69 | $15.58 | $11.62 |
| Total Return2 | 1.58% | 16.90% | 7.12% | 34.08% | (2.35)% |
| Ratios to Average Net Assets: | |||||
| Net expenses | 1.88% | 2.27% | 2.50% | 2.50% | 2.50% |
| Net investment income (loss) | (1.09)% | (1.38)% | (1.79)% | (1.25)% | (1.55)% |
| Expense waiver/reimbursement3 | 0.99% | 0.63% | 0.43% | 0.59% | 1.06% |
| Supplemental Data: | |||||
| Net assets, end of period (000 omitted) | $1,899 | $2,327 | $1,842 | $2,016 | $1,640 |
| Portfolio turnover | 198% | 121% | 61% | 88% | 69% |
| 1 | Per share numbers have been calculated using the average shares method. |
| 2 | Based on net asset value, which does not reflect the sales charge, redemption fee or contingent deferred sales charge, if applicable. |
| 3 | This expense decrease is reflected in both the net expense and the net investment income (loss) ratios shown above. |
| Year Ended July 31 | 2016 | 2015 | 2014 | 2013 | 2012 |
| Net Asset Value, Beginning of Period | $19.03 | $16.27 | $15.19 | $11.33 | $11.60 |
| Income From Investment Operations: | |||||
| Net investment income (loss) | (0.17)1 | (0.25)1 | (0.30)1 | (0.16)1 | (0.17)1 |
| Net realized and unrealized gain (loss) on investments | 0.26 | 3.01 | 1.38 | 4.02 | (0.10) |
| TOTAL FROM INVESTMENT OPERATIONS | 0.09 | 2.76 | 1.08 | 3.86 | (0.27) |
| Less Distributions: | |||||
| Distributions from net realized gain on investments | (3.09) | — | — | — | — |
| TOTAL DISTRIBUTIONS | (3.09) | — | — | — | — |
| Net Asset Value, End of Period | $16.03 | $19.03 | $16.27 | $15.19 | $11.33 |
| Total Return2 | 1.51% | 16.96% | 7.11% | 34.07% | (2.33)% |
| Ratios to Average Net Assets: | |||||
| Net expenses | 1.88% | 2.31% | 2.50% | 2.50% | 2.50% |
| Net investment income (loss) | (1.09)% | (1.44)% | (1.79)% | (1.24)% | (1.54)% |
| Expense waiver/reimbursement3 | 1.00% | 0.59% | 0.43% | 0.59% | 1.04% |
| Supplemental Data: | |||||
| Net assets, end of period (000 omitted) | $3,941 | $3,571 | $4,608 | $4,912 | $4,223 |
| Portfolio turnover | 198% | 121% | 61% | 88% | 69% |
| 1 | Per share numbers have been calculated using the average shares method. |
| 2 | Based on net asset value, which does not reflect the sales charge, redemption fee or contingent deferred sales charge, if applicable. |
| 3 | This expense decrease is reflected in both the net expense and the net investment income (loss) ratios shown above. |
| Year Ended July 31 | 2016 | 2015 | 2014 | 2013 | 2012 |
| Net Asset Value, Beginning of Period | $21.01 | $17.79 | $16.44 | $12.14 | $12.31 |
| Income From Investment Operations: | |||||
| Net investment income (loss) | (0.02)1 | (0.08)1 | (0.14)1 | (0.03)1 | (0.06)1 |
| Net realized and unrealized gain (loss) on investments | 0.34 | 3.30 | 1.49 | 4.33 | (0.11) |
| TOTAL FROM INVESTMENT OPERATIONS | 0.32 | 3.22 | 1.35 | 4.30 | (0.17) |
| Less Distributions: | |||||
| Distributions from net realized gain on investments | (3.09) | — | — | — | — |
| TOTAL DISTRIBUTIONS | (3.09) | — | — | — | — |
| Net Asset Value, End of Period | $18.24 | $21.01 | $17.79 | $16.44 | $12.14 |
| Total Return2 | 2.56% | 18.10% | 8.21% | 35.42% | (1.38)% |
| Ratios to Average Net Assets: | |||||
| Net expenses | 0.88% | 1.30% | 1.50% | 1.50% | 1.50% |
| Net investment income (loss) | (0.09)% | (0.43)% | (0.80)% | (0.24)% | (0.54)% |
| Expense waiver/reimbursement3 | 0.99% | 0.60% | 0.43% | 0.59% | 1.05% |
| Supplemental Data: | |||||
| Net assets, end of period (000 omitted) | $43,337 | $36,706 | $37,253 | $31,179 | $26,233 |
| Portfolio turnover | 198% | 121% | 61% | 88% | 69% |
| 1 | Per share numbers have been calculated using the average shares method. |
| 2 | Based on net asset value. |
| 3 | This expense decrease is reflected in both the net expense and the net investment income (loss) ratios shown above. |
| Period Ended July 31 | 20161 |
| Net Asset Value, Beginning of Period | $16.25 |
| Income From Investment Operations: | |
| Net investment income (loss) | (0.07)2 |
| Net realized and unrealized gain on investments | 2.06 |
| TOTAL FROM INVESTMENT OPERATIONS | 1.99 |
| Net Asset Value, End of Period | $18.24 |
| Total Return3 | 12.25% |
| Ratios to Average Net Assets: | |
| Net expenses | 0.87%4 |
| Net investment income (loss) | (0.41)%4 |
| Expense waiver/reimbursement5 | 0.66%4 |
| Supplemental Data: | |
| Net assets, end of period (000 omitted) | $06 |
| Portfolio turnover | 198%7 |
| 1 | Reflects operations for the period from June 29, 2016 (date of initial investment) to July 31, 2016. |
| 2 | Per share numbers have been calculated using the average shares method. |
| 3 | Based on net asset value. Total returns for the period of less than one year is not annualized. |
| 4 | Computed on an annualized basis. |
| 5 | This expense decrease is reflected in both the net expense and the net investment income (loss) ratios shown above. |
| 6 | Represents less than $1,000. |
| 7 | Portfolio turnover is calculated at the Fund level. Percentage indicated was calculated for the year ended July 31, 2016. |
| Assets: | ||
| Total investment in securities, at value including $1,660,718 of investment in an affiliated holding (Note 5) (identified cost $73,973,529) | $79,042,857 | |
| Income receivable | 14,834 | |
| Receivable for investments sold | 1,464,968 | |
| Receivable for shares sold | 196,811 | |
| TOTAL ASSETS | 80,719,470 | |
| Liabilities: | ||
| Payable for investments purchased | $1,545,601 | |
| Payable for shares redeemed | 150,390 | |
| Payable to adviser (Note 5) | 871 | |
| Payable for administrative fee (Note 5) | 504 | |
| Payable for distribution services fee (Note 5) | 3,624 | |
| Payable for other service fees (Notes 2 and 5) | 17,432 | |
| Payable for share registration costs | 35,352 | |
| Accrued expenses (Note 5) | 81,273 | |
| TOTAL LIABILITIES | 1,835,047 | |
| Net assets for 4,418,483 shares outstanding | $78,884,423 | |
| Net Assets Consist of: | ||
| Paid-in capital | $72,584,806 | |
| Net unrealized appreciation of investments | 5,069,328 | |
| Accumulated net realized gain on investments | 1,230,289 | |
| TOTAL NET ASSETS | $78,884,423 |
| Net Asset Value, Offering Price and Redemption Proceeds Per Share | ||
| Class A Shares: | ||
| Net asset value per share ($29,706,779 ÷ 1,681,893 shares outstanding), no par value, unlimited shares authorized | $17.66 | |
| Offering price per share (100/94.50 of $17.66) | $18.69 | |
| Redemption proceeds per share | $17.66 | |
| Class B Shares: | ||
| Net asset value per share ($1,898,937 ÷ 114,908 shares outstanding), no par value, unlimited shares authorized | $16.53 | |
| Offering price per share | $16.53 | |
| Redemption proceeds per share (94.50/100 of $16.53) | $15.62 | |
| Class C Shares: | ||
| Net asset value per share ($3,941,234 ÷ 245,844 shares outstanding), no par value, unlimited shares authorized | $16.03 | |
| Offering price per share | $16.03 | |
| Redemption proceeds per share (99.00/100 of $16.03) | $15.87 | |
| Institutional Shares: | ||
| Net asset value per share ($43,337,361 ÷ 2,375,832 shares outstanding), no par value, unlimited shares authorized | $18.24 | |
| Offering price per share | $18.24 | |
| Redemption proceeds per share | $18.24 | |
| Class R6 Shares: | ||
| Net asset value per share ($112.26 ÷ 6.154 shares outstanding), no par value, unlimited shares authorized | $18.24 | |
| Offering price per share | $18.24 | |
| Redemption proceeds per share | $18.24 |
| Investment Income: | |||
| Dividends (including $4,190 received from an affiliated holding (Note 5) and net of foreign taxes withheld of $365) | $581,177 | ||
| Interest | 611 | ||
| TOTAL INCOME | 581,788 | ||
| Expenses: | |||
| Investment adviser fee (Note 5) | $827,152 | ||
| Administrative fee (Note 5) | 57,470 | ||
| Custodian fees | 26,872 | ||
| Transfer agent fee | 237,402 | ||
| Directors'/Trustees' fees (Note 5) | 2,178 | ||
| Auditing fees | 26,550 | ||
| Legal fees | 8,736 | ||
| Portfolio accounting fees | 76,017 | ||
| Distribution services fee (Note 5) | 41,485 | ||
| Other service fees (Notes 2 and 5) | 88,461 | ||
| Share registration costs | 73,945 | ||
| Printing and postage | 34,818 | ||
| Miscellaneous (Note 5) | 11,091 | ||
| TOTAL EXPENSES | 1,512,177 | ||
| Waivers/Reimbursements: | |||
| Waiver/reimbursement of investment adviser fee (Note 5) | $(720,674) | ||
| Reimbursement of other operating expenses (Notes 2 and 5) | (11,441) | ||
| TOTAL WAIVER AND REIMBURSEMENTS | (732,115) | ||
| Net expenses | 780,062 | ||
| Net investment income (loss) | (198,274) | ||
| Realized and Unrealized Gain on Investments: | |||
| Net realized gain on investments | 1,564,302 | ||
| Net change in unrealized appreciation of investments | 706,476 | ||
| Net realized and unrealized gain on investments | 2,270,778 | ||
| Change in net assets resulting from operations | $2,072,504 |
| Year Ended July 31 | 2016 | 2015 |
| Increase (Decrease) in Net Assets | ||
| Operations: | ||
| Net investment income (loss) | $(198,274) | $(436,245) |
| Net realized gain on investments | 1,564,302 | 15,656,300 |
| Net change in unrealized appreciation/depreciation of investments | 706,476 | (3,269,613) |
| CHANGE IN NET ASSETS RESULTING FROM OPERATIONS | 2,072,504 | 11,950,442 |
| Distributions to Shareholders: | ||
| Distributions from net realized gain on investments | ||
| Class A Shares | (5,047,941) | — |
| Class B Shares | (351,767) | — |
| Class C Shares | (643,484) | — |
| Institutional Shares | (6,264,901) | — |
| CHANGE IN NET ASSETS RESULTING FROM DISTRIBUTIONS TO SHAREHOLDERS | (12,308,093) | — |
| Share Transactions: | ||
| Proceeds from sale of shares | 33,756,690 | 16,906,335 |
| Net asset value of shares issued to shareholders in payment of distributions declared | 11,779,980 | — |
| Cost of shares redeemed | (31,157,360) | (27,508,694) |
| CHANGE IN NET ASSETS RESULTING FROM SHARE TRANSACTIONS | 14,379,310 | (10,602,359) |
| Change in net assets | 4,143,721 | 1,348,083 |
| Net Assets: | ||
| Beginning of period | 74,740,702 | 73,392,619 |
| End of period (including accumulated net investment income (loss) of $0 and $(135,739), respectively) | $78,884,423 | $74,740,702 |
| ■ | Equity securities listed on an exchange or traded through a regulated market system are valued at their last reported sale price or official closing price in their principal exchange or market. |
| ■ | Shares of other mutual funds or non-exchange-traded investment companies are valued based upon their reported NAVs. |
| ■ | Fixed-income securities acquired with remaining maturities greater than 60 days are fair valued using price evaluations provided by a pricing service approved by the Fund's Board of Trustees (the “Trustees”). |
| ■ | Fixed-income securities and repurchase agreements acquired with remaining maturities of 60 days or less are valued at their cost (adjusted for the accretion of any discount or amortization of any premium), unless the issuer's creditworthiness is impaired or other factors indicate that amortized cost is not an accurate estimate of the investment's fair value, in which case it would be valued in the same manner as a longer-term security. |
| ■ | Derivative contracts listed on exchanges are valued at their reported settlement or closing price, except that options are valued at the mean of closing bid and asked quotations. |
| ■ | Over-the-counter (OTC) derivative contracts are fair valued using price evaluations provided by a pricing service approved by the Trustees. |
| ■ | For securities that are fair valued in accordance with procedures established by and under the general supervision of the Trustees, certain factors may be considered such as: the last traded or purchase price of the security, information obtained by contacting the issuer or dealers, analysis of the issuer's financial statements or other available documents, fundamental analytical data, the nature and duration of restrictions on disposition, the movement of the market in which the security is normally traded, public trading in similar |
| securities or derivative contracts of the issuer or comparable issuers, movement of a relevant index, or other factors including but not limited to industry changes and relevant government actions. |
| Transfer Agent Fees Incurred | Transfer Agent Fees Reimbursed | |
| Class A Shares | $97,741 | $(5,293) |
| Class B Shares | 6,275 | (156) |
| Class C Shares | 11,692 | (764) |
| Institutional Shares | 121,694 | (5,228) |
| TOTAL | $237,402 | $(11,441) |
| Other Service Fees Incurred | |
| Class A Shares | $74,643 |
| Class B Shares | 4,930 |
| Class C Shares | 8,888 |
| TOTAL | $88,461 |
| Year Ended July 31 | 2016 | 2015 | ||
| Class A Shares: | Shares | Amount | Shares | Amount |
| Shares sold | 465,083 | $7,909,230 | 205,032 | $4,007,524 |
| Shares issued to shareholders in payment of distributions declared | 280,541 | 4,637,343 | ||
| Shares redeemed | (631,816) | (10,489,720) | (343,865) | (6,518,418) |
| NET CHANGE RESULTING FROM CLASS A SHARE TRANSACTIONS | 113,808 | $2,056,853 | (138,833) | $(2,510,894) |
| Year Ended July 31 | 2016 | 2015 | ||
| Class B Shares: | Shares | Amount | Shares | Amount |
| Shares sold | 628 | $9,758 | 36,818 | $665,769 |
| Shares issued to shareholders in payment of distributions declared | 21,942 | 340,760 | — | — |
| Shares redeemed | (26,934) | (420,323) | (27,927) | (501,164) |
| NET CHANGE RESULTING FROM CLASS B SHARE TRANSACTIONS | (4,364) | $(69,805) | 8,891 | $164,605 |
| Year Ended July 31 | 2016 | 2015 | ||
| Class C Shares: | Shares | Amount | Shares | Amount |
| Shares sold | 79,204 | $1,262,101 | 28,731 | $508,470 |
| Shares issued to shareholders in payment of distributions declared | 37,876 | 570,799 | — | — |
| Shares redeemed | (58,895) | (871,702) | (124,257) | (2,140,893) |
| NET CHANGE RESULTING FROM CLASS C SHARE TRANSACTIONS | 58,185 | $961,198 | (95,526) | $(1,632,423) |
| Year Ended July 31 | 2016 | 2015 | ||
| Institutional Shares: | Shares | Amount | Shares | Amount |
| Shares sold | 1,403,762 | $24,575,501 | 616,792 | $11,724,572 |
| Shares issued to shareholders in payment of distributions declared | 365,674 | 6,231,078 | — | — |
| Shares redeemed | (1,140,530) | (19,375,615) | (963,982) | (18,348,219) |
| NET CHANGE RESULTING FROM INSTITUTIONAL SHARE TRANSACTIONS | 628,906 | $11,430,964 | (347,190) | $(6,623,647) |
| Period Ended 7/31/20161 | 2015 | |||
| Class R6 Shares: | Shares | Amount | Shares | Amount |
| Shares sold | 6 | $100 | — | $— |
| Shares issued to shareholders in payment of distributions declared | — | — | — | — |
| Shares redeemed | (—) | (—) | (—) | (—) |
| NET CHANGE RESULTING FROM CLASS R6 SHARE TRANSACTIONS | 6 | $100 | — | $— |
| NET CHANGE RESULTING FROM TOTAL FUND SHARE TRANSACTIONS | 796,541 | $14,379,310 | (572,658) | $(10,602,359) |
| 1 | Reflects operations for the period from June 29, 2016 (date of initial investment) to July 31, 2016. |
| Increase (Decrease) | |
| Undistributed Net Investment Income (Loss) | Accumulated Net Realized Gain (Loss) |
| $334,013 | $(334,013) |
| 2016 | 2015 | |
| Long-term capital gains | $12,308,093 | $0 |
| Ordinary income1 | $568,066 |
| Undistributed long-term capital gains | $1,047,163 |
| Net unrealized appreciation | $4,684,388 |
| 1 | For tax purposes, short-term capital gain distributions are considered ordinary income distributions. |
| Administrative Fee | Average Daily Net Assets of the Investment Complex |
| 0.150% | on the first $5 billion |
| 0.125% | on the next $5 billion |
| 0.100% | on the next $10 billion |
| 0.075% | on assets in excess of $20 billion |
| Share Class Name | Percentage of Average Daily Net Assets of Class |
| Class A Shares | 0.05% |
| Class B Shares | 0.75% |
| Class C Shares | 0.75% |
| Distribution Services Fees Incurred | |
| Class B Shares | $14,790 |
| Class C Shares | 26,695 |
| TOTAL | $41,485 |
| Federated Institutional Prime Value Obligations Fund, Institutional Shares | |
| Balance of Shares Held 7/31/2015 | 1,422,241 |
| Purchases/Additions | 27,435,188 |
| Sales/Reductions | (27,196,711) |
| Balance of Shares Held 7/31/2016 | 1,660,718 |
| Value | $1,660,718 |
| Dividend Income | $4,190 |
| Purchases | $146,439,099 |
| Sales | $143,810,618 |
September 22, 2016
| Beginning Account Value 2/1/2016 | Ending Account Value 7/31/2016 | Expenses Paid During Period1 | |
| Actual: | |||
| Class A Shares | $1,000 | $1,216.30 | $6.23 |
| Class B Shares | $1,000 | $1,212.80 | $10.34 |
| Class C Shares | $1,000 | $1,211.60 | $10.34 |
| Institutional Shares | $1,000 | $1,217.60 | $4.85 |
| R6 Shares | $1,000 | $1,122.50 | $0.832 |
| Hypothetical (assuming a 5% return before expenses): | |||
| Class A Shares | $1,000 | $1,019.24 | $5.67 |
| Class B Shares | $1,000 | $1,015.51 | $9.42 |
| Class C Shares | $1,000 | $1,015.51 | $9.42 |
| Institutional Shares | $1,000 | $1,020.49 | $4.42 |
| R6 Shares | $1,000 | $1,020.54 | $4.372 |
| 1 | Expenses are equal to the Fund's annualized net expense ratios, multiplied by the average account value over the period, multiplied by 182/366 (to reflect the one-half-year period). The annualized net expense ratios are as follows: |
| Class A Shares | 1.13% |
| Class B Shares | 1.88% |
| Class C Shares | 1.88% |
| Institutional Shares | 0.88% |
| R6 Shares | 0.87% |
| 2 | “Actual” expense information for the Fund's R6 Shares is for the period from June 29, 2016 (date of initial investment) to July 31, 2016. Actual expenses are equal to the Fund's annualized net expense ratio of 0.87%, multiplied by 33/366 (to reflect the period from initial investment to July 31, 2016). “Hypothetical” expense information for R6 is presented on the basis of the full one-half year period to enable comparison to other funds. It is based on assuming the same net expense ratio and average account value over the period, but it is multiplied by 182/366 (to reflect the full half-year period). |
| Name Birth Date Positions Held with Trust Date Service Began | Principal Occupation(s) for Past Five Years, Other Directorships Held and Previous Position(s) |
| J. Christopher Donahue* Birth Date: April 11, 1949 President and Trustee Indefinite Term Began serving: June 2006 | Principal Occupations: Principal Executive Officer and President of certain of the Funds in the Federated Fund Family; Director or Trustee of the Funds in the Federated Fund Family; President, Chief Executive
Officer and Director, Federated Investors, Inc.; Chairman and Trustee, Federated Investment Management Company; Trustee, Federated Investment Counseling; Chairman and Director, Federated Global Investment Management
Corp.; Chairman, Federated Equity Management Company of Pennsylvania and Passport Research, Ltd. (investment advisory subsidiary of Federated); Trustee, Federated Shareholder Services Company; Director, Federated
Services Company. Previous Positions: President, Federated Investment Counseling; President and Chief Executive Officer, Federated Investment Management Company, Federated Global Investment Management Corp. and Passport Research, Ltd. |
| Name Birth Date Positions Held with Trust Date Service Began | Principal Occupation(s) for Past Five Years, Other Directorships Held and Previous Position(s) |
| John B. Fisher* Birth Date: May 16, 1956 Trustee Indefinite Term Began serving: May 2016 | Principal Occupations: Principal Executive Officer and President of certain of the Funds in the Federated Fund Family; Director or Trustee of certain of the Funds in the Federated Fund Family; Vice President,
Federated Investors, Inc.; President, Director/Trustee and CEO, Federated Advisory Services Company, Federated Equity Management Company of Pennsylvania, Federated Global Investment Management Corp., Federated
Investment Counseling, Federated Investment Management Company; President and CEO of Passport Research, Ltd.; President of some of the Funds in the Federated Fund Complex and Director, Federated Investors Trust
Company. Previous Positions: President and Director of the Institutional Sales Division of Federated Securities Corp.; President and Director of Federated Investment Counseling; Director, Edgewood Securities Corp.; Director, Federated Services Company; Director, Federated Investors, Inc.; Chairman and Director, Southpointe Distribution Services, Inc. and President, Technology, Federated Services Company. |
| * | Reasons for “interested” status: J. Christopher Donahue and John B. Fisher are interested due to their beneficial ownership of shares of Federated Investors, Inc. and due to positions they hold with Federated and its subsidiaries. J. Christopher Donahue is the son of John F. Donahue, Chairman Emeritus of the Federated Funds. |
| Name Birth Date Positions Held with Trust Date Service Began | Principal Occupation(s) for Past Five Years, Other Directorships Held, Previous Position(s) and Qualifications |
| John T. Collins Birth Date: January 24, 1947 Trustee Indefinite Term Began serving: October 2013 | Principal Occupations: Director or Trustee of the Federated Fund Family; Retired. Other Directorships Held: Director, Chair of the Compensation Committee, Audit Committee member, KLX Corp. Qualifications: Mr. Collins has served in several business and financial management roles and directorship positions throughout his career. Mr. Collins previously served as Chairman and CEO, The Collins Group, Inc. (a private equity firm). Mr. Collins serves as Chairman Emeriti, Bentley University. Mr. Collins previously served as Director, FleetBoston Financial Corp.; Director and Audit Committee Member, Bank of America Corp. and Director, Beth Israel Deaconess Medical Center (Harvard University Affiliate Hospital). |
| Name Birth Date Positions Held with Trust Date Service Began | Principal Occupation(s) for Past Five Years, Other Directorships Held, Previous Position(s) and Qualifications |
| G. Thomas Hough Birth Date: February 28, 1955 Trustee Indefinite Term Began serving: August 2015 | Principal Occupations: Director or Trustee of the Federated Fund Family; Retired. Other Directorships Held: Director, Chair of the Audit Committee, Governance Committee, Publix Super Markets, Inc. Qualifications: Mr. Hough has served in accounting, business management and directorship positions throughout his career. Mr. Hough most recently held the position of Americas Vice Chair of Assurance with Ernst & Young LLP. Mr. Hough is an Executive Committee member of the United States Golf Association, he serves on the President's Cabinet and Business School Board of Visitors for the University of Alabama and is on the Business School Board of Visitors for Wake Forest University. |
| Maureen Lally-Green Birth Date: July 5, 1949 Trustee Indefinite Term Began serving: August 2009 | Principal Occupations: Director or Trustee of the Federated Fund Family; Interim Dean of the Duquesne University School of Law; Adjunct Professor of Law, Duquesne University School of Law. Other Directorships Held: Director, CONSOL Energy Inc. Qualifications: Judge Lally-Green has served in various legal and business roles and directorship positions throughout her career. Judge Lally-Green previously served as: Associate General Secretary, Diocese of Pittsburgh; a member of the Superior Court of Pennsylvania; and as a Professor of Law, Duquesne University School of Law. Judge Lally-Green also holds the positions on either a public or not for profit Board of Directors as follows: Member, Pennsylvania State Board of Education (public); Director and Chair, UPMC Mercy Hospital; Regent, St. Vincent Seminary; Director and Vice Chair, Our Campaign for the Church Alive!, Inc.; Director, Saint Vincent College; and Director and Chair, Cardinal Wuerl North Catholic High School, Inc. Judge Lally-Green has held the positions of: Director, Auberle; Director, Ireland Institute of Pittsburgh; Director, Saint Thomas More Society; and Director, Catholic High Schools of the Diocese of Pittsburgh, Inc. |
| Peter E. Madden Birth Date: March 16, 1942 Trustee Indefinite Term Began serving: June 2006 | Principal Occupation: Director or Trustee, and Chair of the Board of Directors or Trustees, of the Federated Fund Family; Retired. Other Directorships Held: None. Qualifications: Mr. Madden has served in several business management, mutual fund services and directorship positions throughout his career. Mr. Madden previously served as President, Chief Operating Officer and Director, State Street Bank and Trust Company (custodian bank) and State Street Corporation (financial services). He was Director, VISA USA and VISA International and Chairman and Director, Massachusetts Bankers Association. Mr. Madden served as Director, Depository Trust Corporation and Director, The Boston Stock Exchange. Mr. Madden also served as a Representative to the Commonwealth of Massachusetts General Court. |
| Name Birth Date Positions Held with Trust Date Service Began | Principal Occupation(s) for Past Five Years, Other Directorships Held, Previous Position(s) and Qualifications |
| Charles F. Mansfield, Jr. Birth Date: April 10, 1945 Trustee Indefinite Term Began serving: June 2006 | Principal Occupations: Director or Trustee of the Federated Fund Family; Management Consultant. Other Directorships Held: None. Qualifications: Mr. Mansfield has served in several banking, business management and educational roles and directorship positions throughout his career. Mr. Mansfield previously served as Chief Executive Officer, PBTC International Bank; Partner, Arthur Young & Company (now Ernst & Young LLP); Chief Financial Officer of Retail Banking Sector, Chase Manhattan Bank; Senior Vice President, HSBC Bank USA (formerly, Marine Midland Bank); Vice President, Citibank; Assistant Professor of Banking and Finance, Frank G. Zarb School of Business, Hofstra University; Executive Vice President DVC Group, Inc. (marketing, communications and technology). |
| Thomas M. O'Neill Birth Date: June 14, 1951 Trustee Indefinite Term Began serving: October 2006 | Principal Occupations: Director or Trustee, Chair of the Audit Committee of the Federated Fund Family; Sole Proprietor, Navigator Management Company (investment and strategic consulting). Other Directorships Held: None. Qualifications: Mr. O'Neill has served in several business, mutual fund and financial management roles and directorship positions throughout his career. Mr. O'Neill serves as Director, Medicines for Humanity and Director, The Golisano Children's Museum of Naples, Florida. Mr. O'Neill previously served as Chief Executive Officer and President, Managing Director and Chief Investment Officer, Fleet Investment Advisors; President and Chief Executive Officer, Aeltus Investment Management, Inc.; General Partner, Hellman, Jordan Management Co., Boston, MA; Chief Investment Officer, The Putnam Companies, Boston, MA; Credit Analyst and Lending Officer, Fleet Bank; Director and Consultant, EZE Castle Software (investment order management software); and Director, Midway Pacific (lumber). |
| P. Jerome Richey Birth Date: February 23, 1949 Trustee Indefinite Term Began serving: October 2013 | Principal Occupations: Director or Trustee of the Federated Fund Family; Management Consultant. Other Directorships Held: None. Qualifications: Mr. Richey has served in several business and legal management roles and directorship positions throughout his career. Mr. Richey most recently held the positions of Senior Vice Chancellor and Chief Legal Officer, University of Pittsburgh. Mr. Richey serves as Board Member, Epilepsy Foundation of Western Pennsylvania and Board member, World Affairs Council of Pittsburgh. Mr. Richey previously served as Chief Legal Officer and Executive Vice President, CONSOL Energy Inc. and Shareholder, Buchanan Ingersoll & Rooney PC (a law firm). |
| Name Birth Date Positions Held with Trust Date Service Began | Principal Occupation(s) for Past Five Years, Other Directorships Held, Previous Position(s) and Qualifications |
| John S. Walsh Birth Date: November 28, 1957 Trustee Indefinite Term Began serving: June 2006 | Principal Occupations: Director or Trustee of the Federated Fund Family; President and Director, Heat Wagon, Inc. (manufacturer of construction temporary heaters); President and Director, Manufacturers
Products, Inc. (distributor of portable construction heaters); President, Portable Heater Parts, a division of Manufacturers Products, Inc. Other Directorships Held: None. Qualifications: Mr. Walsh has served in several business management roles and directorship positions throughout his career. Mr. Walsh previously served as Vice President, Walsh & Kelly, Inc. (paving contractors). |
| Name Birth Date Address Positions Held with Trust Date Service Began | Principal Occupation(s) for Past Five Years and Previous Position(s) |
| John W. McGonigle Birth Date: October 26, 1938 Secretary Officer since: May 2006 | Principal Occupations: Executive Vice President and Secretary of the Federated Fund Family; Vice Chairman, Executive Vice President, Secretary and Director, Federated Investors, Inc. Previous Positions: Trustee, Federated Investment Management Company and Federated Investment Counseling; Director, Federated Global Investment Management Corp., Federated Services Company and Federated Securities Corp. |
| Lori A. Hensler Birth Date: January 6, 1967 TREASURER Officer since: April 2013 | Principal Occupations: Principal Financial Officer and Treasurer of the Federated Fund Family; Senior Vice President, Federated Administrative Services; Financial and Operations Principal for Federated
Securities Corp. and Edgewood Services, Inc.; and Assistant Treasurer, Federated Investors Trust Company. Ms. Hensler has received the Certified Public Accountant designation. Previous Positions: Controller of Federated Investors, Inc.; Senior Vice President and Assistant Treasurer, Federated Investors Management Company; Treasurer, Federated Investors Trust Company; Assistant Treasurer, Federated Administrative Services, Federated Administrative Services, Inc., Federated Securities Corp., Edgewood Services, Inc., Federated Advisory Services Company, Federated Equity Management Company of Pennsylvania, Federated Global Investment Management Corp., Federated Investment Counseling, Federated Investment Management Company, Passport Research, Ltd., and Federated MDTA, LLC; Financial and Operations Principal for Federated Securities Corp., Edgewood Services, Inc. and Southpointe Distribution Services, Inc. |
| Name Birth Date Address Positions Held with Trust Date Service Began | Principal Occupation(s) for Past Five Years and Previous Position(s) |
| Peter J. Germain Birth Date: September 3, 1959 CHIEF LEGAL OFFICER Officer since: June 2006 | Principal Occupations: Mr. Germain is Chief Legal Officer of the Federated Fund Family. He is General Counsel and Vice President, Federated Investors, Inc.; President, Federated Administrative Services and
Federated Administrative Services, Inc.; Vice President, Federated Securities Corp.; Secretary, Federated Private Asset Management, Inc.; and Secretary, Retirement Plan Service Company of America. Mr. Germain joined
Federated in 1984 and is a member of the Pennsylvania Bar Association. Previous Positions: Deputy General Counsel, Special Counsel, Managing Director of Mutual Fund Services, Federated Investors, Inc.; Senior Vice President, Federated Services Company; and Senior Corporate Counsel, Federated Investors, Inc. |
| Stephen F. Auth Birth Date: September 13, 1956 101 Park Avenue 41st Floor New York, NY 10178 CHIEF INVESTMENT OFFICER Officer since: June 2012 | Principal Occupations: Stephen F. Auth is Chief Investment Officer of various Funds in the Federated Fund Family; Executive Vice President, Federated Investment Counseling, Federated Global Investment
Management Corp. and Federated Equity Management Company of Pennsylvania. Previous Positions: Executive Vice President, Federated Investment Management Company and Passport Research, Ltd. (investment advisory subsidiary of Federated); Senior Vice President, Global Portfolio Management Services Division; Senior Vice President, Federated Investment Management Company and Passport Research, Ltd.; Senior Managing Director and Portfolio Manager, Prudential Investments. |
| Stephen Van Meter Birth Date: June 5, 1975 CHIEF COMPLIANCE OFFICER AND SENIOR VICE PRESIDENT Officer since: July 2015 | Principal Occupations: Senior Vice President and Chief Compliance Officer of the Federated Fund Family; Vice President and Chief Compliance Officer of Federated Investors, Inc. and Chief Compliance Officer of
certain of its subsidiaries. Mr. Van Meter joined Federated in October 2011. He holds FINRA licenses under Series 3, 7, 24 and 66. Previous Positions: Mr. Van Meter previously held the position of Compliance Operating Officer, Federated Investors, Inc. Prior to joining Federated, Mr. Van Meter served at the United States Securities and Exchange Commission in the positions of Senior Counsel, Office of Chief Counsel, Division of Investment Management and Senior Counsel, Division of Enforcement. |
4000 Ericsson Drive
Warrendale, PA 15086-7561
or call 1-800-341-7400.
CUSIP 31421R676
CUSIP 31421R767
CUSIP 31421R759
CUSIP 31421R619
2016 ©Federated Investors, Inc.
Item 2. Code of Ethics
(a) As of the end of the period covered by this report, the registrant has adopted a code of ethics (the "Section 406 Standards for Investment Companies - Ethical Standards for Principal Executive and Financial Officers") that applies to the registrant's Principal Executive Officer and Principal Financial Officer; the registrant's Principal Financial Officer also serves as the Principal Accounting Officer.
(c) There was no amendment to the registrant’s code of ethics described in Item 2(a) above during the period covered by the report.
(d) There was no waiver granted, either actual or implicit, from a provision to the registrant’s code of ethics described in Item 2(a) above during the period covered by the report.
(e) Not Applicable
(f)(3) The registrant hereby undertakes to provide any person, without charge, upon request, a copy of the code of ethics. To request a copy of the code of ethics, contact the registrant at 1-800-341-7400, and ask for a copy of the Section 406 Standards for Investment Companies - Ethical Standards for Principal Executive and Financial Officers.
Item 3. Audit Committee Financial Expert
The registrant's Board has determined that each of the following members of the Board's Audit Committee is an “audit committee financial expert,” and is "independent," for purposes of this Item: John T. Collins, G. Thomas Hough and Thomas M. O'Neill.
Item 4. Principal Accountant Fees and Services
(a) Audit Fees billed to the registrant for the two most recent fiscal years:
Fiscal year ended 2016 - $133,300
Fiscal year ended 2015 – $124,600
(b) Audit-Related Fees billed to the registrant for the two most recent fiscal years:
Fiscal year ended 2016 - $0
Fiscal year ended 2015 – $217
Fiscal year ended 2015- Travel to Audit Committee Meeting.
Amount requiring approval of the registrant’s audit committee pursuant to paragraph (c)(7)(ii) of Rule 2-01 of Regulation S-X, $0 and $87, respectively. Fiscal year ended 2015- Travel expenses for attendance at Audit Committee meeting.
(c) Tax Fees billed to the registrant for the two most recent fiscal years:
Fiscal year ended 2016 - $0
Fiscal year ended 2015 - $0
Amount requiring approval of the registrant’s audit committee pursuant to paragraph (c)(7)(ii) of Rule 2-01 of Regulation S-X, $0 and $0, respectively.
(d) All Other Fees billed to the registrant for the two most recent fiscal years:
Fiscal year ended 2016 - $0
Fiscal year ended 2015 - $0
Amount requiring approval of the registrant’s audit committee pursuant to paragraph (c)(7)(ii) of Rule 2-01 of Regulation S-X, $31,784 and $31,263, respectively. Fiscal year ended 2016- Service fee for analysis of potential Passive Foreign Investment Company holdings. Fiscal year ended 2015- Service fee for analysis of potential Passive Foreign Investment Company holdings.
(e)(1) Audit Committee Policies regarding Pre-approval of Services.
The Audit Committee is required to pre-approve audit and non-audit services performed by the independent auditor in order to assure that the provision of such services do not impair the auditor’s independence. Unless a type of service to be provided by the independent auditor has received general pre-approval, it will require specific pre-approval by the Audit Committee. Any proposed services exceeding pre-approved cost levels will require specific pre-approval by the Audit Committee.
Certain services have the general pre-approval of the Audit Committee. The term of the general pre-approval is 12 months from the date of pre-approval, unless the Audit Committee specifically provides for a different period. The Audit Committee will annually review the services that may be provided by the independent auditor without obtaining specific pre-approval from the Audit Committee and may grant general pre-approval for such services. The Audit Committee will revise the list of general pre-approved services from time to time, based on subsequent determinations. The Audit Committee will not delegate its responsibilities to pre-approve services performed by the independent auditor to management.
The Audit Committee has delegated pre-approval authority to its Chairman. The Chairman will report any pre-approval decisions to the Audit Committee at its next scheduled meeting. The Committee will designate another member with such pre-approval authority when the Chairman is unavailable.
AUDIT SERVICES
The annual Audit services engagement terms and fees will be subject to the specific pre-approval of the Audit Committee. The Audit Committee must approve any changes in terms, conditions and fees resulting from changes in audit scope, registered investment company (RIC) structure or other matters.
In addition to the annual Audit services engagement specifically approved by the Audit Committee, the Audit Committee may grant general pre-approval for other Audit Services, which are those services that only the independent auditor reasonably can provide. The Audit Committee has pre-approved certain Audit services, all other Audit services must be specifically pre-approved by the Audit Committee.
AUDIT-RELATED SERVICES
Audit-related services are assurance and related services that are reasonably related to the performance of the audit or review of the Company’s financial statements or that are traditionally performed by the independent auditor. The Audit Committee believes that the provision of Audit-related services does not impair the independence of the auditor, and has pre-approved certain Audit-related services, all other Audit-related services must be specifically pre-approved by the Audit Committee.
TAX SERVICES
The Audit Committee believes that the independent auditor can provide Tax services to the Company such as tax compliance, tax planning and tax advice without impairing the auditor’s independence. However, the Audit Committee will not permit the retention of the independent auditor in connection with a transaction initially recommended by the independent auditor, the purpose of which may be tax avoidance and the tax treatment of which may not be supported in the Internal Revenue Code and related regulations. The Audit Committee has pre-approved certain Tax services, all Tax services involving large and complex transactions must be specifically pre-approved by the Audit Committee.
ALL OTHER SERVICES
With respect to the provision of services other than audit, review or attest services the pre-approval requirement is waived if:
| (1) | The aggregate amount of all such services provided constitutes no more than five percent of the total amount of revenues paid by the registrant, the registrant’s adviser (not including any sub-adviser whose role is primarily portfolio management and is subcontracted with or overseen by another investment adviser), and any entity controlling, controlled by, or under common control with the investment adviser that provides ongoing services to the registrant to its accountant during the fiscal year in which the services are provided; |
| (2) | Such services were not recognized by the registrant, the registrant’s adviser (not including any sub-adviser whose role is primarily portfolio management and is subcontracted with or overseen by another investment adviser), and any entity controlling, controlled by, or under common control with the investment adviser that provides ongoing services to the registrant at the time of the engagement to be non-audit services; and |
| (3) | Such services are promptly brought to the attention of the Audit Committee of the issuer and approved prior to the completion of the audit by the Audit Committee or by one or more members of the Audit Committee who are members of the board of directors to whom authority to grant such approvals has been delegated by the Audit Committee. |
The Audit Committee may grant general pre-approval to those permissible non-audit services classified as All Other services that it believes are routine and recurring services, and would not impair the independence of the auditor.
The SEC’s rules and relevant guidance should be consulted to determine the precise definitions of prohibited non-audit services and the applicability of exceptions to certain of the prohibitions.
PRE-APPROVAL FEE LEVELS
Pre-approval fee levels for all services to be provided by the independent auditor will be established annually by the Audit Committee. Any proposed services exceeding these levels will require specific pre-approval by the Audit Committee.
PROCEDURES
Requests or applications to provide services that require specific approval by the Audit Committee will be submitted to the Audit Committee by both the independent auditor and the Principal Accounting Officer and/or Internal Auditor, and must include a joint statement as to whether, in their view, the request or application is consistent with the SEC’s rules on auditor independence.
(e)(2) Percentage of services identified in items 4(b) through 4(d) that were approved by the registrants audit committee pursuant to paragraph (c)(7)(i)(C) of Rule 2-01 of Regulation S-X:
4(b)
Fiscal year ended 2016 – 0%
Fiscal year ended 2015 – 0%
Percentage of services provided to the registrants investment adviser and any entity controlling, controlled by, or under common control with the investment adviser that provides ongoing services to the registrant that were approved by the registrants audit committee pursuant to paragraph (c)(7)(i)(C) of Rule 2-01 of Regulation S-X, 0% and 0% respectively.
4(c)
Fiscal year ended 2016 – 0%
Fiscal year ended 2015 – 0%
Percentage of services provided to the registrants investment adviser and any entity controlling, controlled by, or under common control with the investment adviser that provides ongoing services to the registrant that were approved by the registrants audit committee pursuant to paragraph (c)(7)(i)(C) of Rule 2-01 of Regulation S-X, 0% and 0% respectively.
4(d)
Fiscal year ended 2016 – 0%
Fiscal year ended 2015 – 0%
Percentage of services provided to the registrants investment adviser and any entity controlling, controlled by, or under common control with the investment adviser that provides ongoing services to the registrant that were approved by the registrants audit committee pursuant to paragraph (c)(7)(i)(C) of Rule 2-01 of Regulation S-X, 0% and 0% respectively.
| (f) | NA |
| (g) | Non-Audit Fees billed to the registrant, the registrant’s investment adviser, and certain entities controlling, controlled by or under common control with the investment adviser: |
Fiscal year ended 2016 - $79,236
Fiscal year ended 2015 - $69,395
| (h) | The registrant’s Audit Committee has considered that the provision of non-audit services that were rendered to the registrant’s adviser (not including any sub-adviser whose role is primarily portfolio management and is subcontracted with or overseen by another investment adviser), and any entity controlling, controlled by, or under common control with the investment adviser that provides ongoing services to the registrant that were not pre-approved pursuant to paragraph (c)(7)(ii) of Rule 2-01 of Regulation S-X is compatible with maintaining the principal accountant’s independence. |
In its required communications to the Audit Committee of the registrant’s Board, Ernst & Young LLP (“EY”), the registrant’s independent public accountant, informed the Audit Committee that EY and/ or covered person professionals within EY maintain lending relationships with certain owners of greater than 10% of the shares of certain investment companies within the “investment company complex” as defined under Rule 2-01(f)(14) of Regulation S-X, which are affiliates of the registrant. EY has advised the Audit Committee that these lending relationships implicate Rule 2-01(c)(1)(ii)(A) of Regulation S-X (referred to as the “Loan Rule”). The Loan Rule prohibits an independent public accountant, or covered person professionals at such firm, from having a financial relationship (such as a loan) with a lender that is a record or beneficial owner of more than 10% of an audit client’s equity securities. For purposes of the Loan Rule, audit clients include the registrant, as well as all registered investment companies advised by advisory subsidiaries of Federated Investors, Inc., including the registrant’s investment adviser (“Adviser”), for which EY serves as independent public accountant, the Adviser, and their respective affiliates (collectively, the “Federated Fund Complex”).
EY informed the Audit Committee that EY believes that these lending relationships described above do not and will not impair EY’s ability to exercise objective and impartial judgment in connection with the audits of the financial statements for the registrant and a reasonable investor with knowledge of all relevant facts and circumstances would conclude that EY has been and is capable of objective and impartial judgment on all issues encompassed within EY’s audits.
On June 20, 2016, the Division of Investment Management of the Securities and Exchange Commission (“SEC”) issued a no-action letter to another mutual fund complex (see Fidelity Management & Research Company et al., No-Action Letter) related to similar Loan Rule matters as those described above. In that letter, the SEC Staff confirmed that it would not recommend enforcement action against an investment company that relied on the audit services performed by an independent public accountant where the Loan Rule was implicated in certain specified circumstances. In that letter, the SEC staff indicated that it would not recommend enforcement action against the investment company complex if the Loan Rule is implicated provided that: (1) the auditor has complied with PCAOB Rule 3526(b)(1) and 3526(b)(2); (2) the Loan Rule is implicated because of lending relationships; and (3) notwithstanding such lending relationships that implicate the Loan Rule, the auditor has concluded that it is objective and impartial with respect to the issues encompassed within its engagement as auditor of the funds. The circumstances described in the no-action letter are substantially similar to the circumstances that implicated the Loan Rule with respect to EY and the registrant. The relief provided in the SEC no-action letter is effective for 18 months from its June 20, 2016 issuance date.
If it were to be determined that the relief available under the no-action letter was improperly relied upon, or that the independence requirements under the federal securities laws were not otherwise complied with regarding the registrant, for certain periods, any of the registrant’s filings with the SEC which contain financial statements of the registrant for such periods may not comply with applicable federal securities laws, the registrant’s ability to offer shares under its current registration statement may be impacted, and certain financial reporting and/or other covenants with, and representations and warranties to, the registrant’s lender under its committed line of credit may be impacted. Such events could have a material adverse effect on the registrant and the Federated Fund Complex.
Item 5. Audit Committee of Listed Registrants
Not Applicable
Item 6. Schedule of Investments
(a) The registrant’s Schedule of Investments is included as part of the Report to Stockholders filed under Item 1 of this form.
(b) Not Applicable; Fund had no divestments during the reporting period covered since the previous Form N-CSR filing.
Item 7. Disclosure of Proxy Voting Policies and Procedures for Closed-End Management Investment Companies
Not Applicable
Item 8. Portfolio Managers of Closed-End Management Investment Companies
Not Applicable
Item 9. Purchases of Equity Securities by Closed-End Management Investment Company and Affiliated Purchasers
Not Applicable
Item 10. Submission of Matters to a Vote of Security Holders
No Changes to Report
Item 11. Controls and Procedures
(a) The registrant’s President and Treasurer have concluded that the
registrant’s disclosure controls and procedures (as defined in rule 30a-3(c) under the Act) are effective in design and operation and are sufficient to form the basis of the certifications required by Rule 30a-(2) under the Act, based on their evaluation of these disclosure controls and procedures within 90 days of the filing date of this report on Form N-CSR.
(b) There were no changes in the registrant’s internal control over financial reporting (as defined in rule 30a-3(d) under the Act) during the second fiscal quarter of the period covered by this report that have materially affected, or are reasonably likely to materially affect, the registrant’s internal control over financial reporting.
Item 12. Exhibits
(a)(1) Code of Ethics- Not Applicable to this Report.
(a)(2) Certifications of Principal Executive Officer and Principal Financial Officer.
(a)(3) Not Applicable.
(b) Certifications pursuant to 18 U.S.C. Section 1350.
SIGNATURES
Pursuant to the requirements of the Securities Exchange Act of 1934 and the Investment Company Act of 1940, the registrant has duly caused this report to be signed on its behalf by the undersigned, thereunto duly authorized.
Registrant Federated MDT Series
By /S/ Lori A. Hensler
Lori A. Hensler, Principal Financial Officer
Date September 22, 2016
Pursuant to the requirements of the Securities Exchange Act of 1934 and the Investment Company Act of 1940, this report has been signed below by the following persons on behalf of the registrant and in the capacities and on the dates indicated.
By /S/ J. Christopher Donahue
J. Christopher Donahue, Principal Executive Officer
Date September 22, 2016
By /S/ Lori A. Hensler
Lori A. Hensler, Principal Financial Officer
Date September 22, 2016