UNITED STATES
SECURITIES AND EXCHANGE COMMISSION
Washington, D.C. 20549
SECURITIES AND EXCHANGE COMMISSION
Washington, D.C. 20549
FORM N-CSR
CERTIFIED SHAREHOLDER REPORT OF REGISTERED
MANAGEMENT INVESTMENT COMPANIES
Investment Company Act file number 811-21897
Manager Directed Portfolios
(Exact name of registrant as specified in charter)
(Exact name of registrant as specified in charter)
615 East Michigan Street
Milwaukee, WI 53202
(Address of principal executive offices) (Zip code)
(Address of principal executive offices) (Zip code)
Scott M. Ostrowski, President
Manager Directed Portfolios
c/o U.S. Bank Global Fund Services
777 East Wisconsin Avenue, 6th Floor
Milwaukee, WI 53202
(Name and address of agent for service)
(Name and address of agent for service)
(414) 516-3087
Registrant's telephone number, including area code
Date of fiscal year end: October 31, 2023
Date of reporting period: April 30, 2023
Item 1. Reports to Stockholders.
|
(a)
|
|
Hardman Johnston
International Growth Fund
Retail Shares HJIRX
Institutional Shares HJIGX
Semi-Annual Report
April 30, 2023
Hardman Johnston International Growth Fund
Table of Contents
|
Sector Allocation
|
3
|
|
|
Schedule of Investments
|
4
|
|
|
Statement of Assets and Liabilities
|
6
|
|
|
Statement of Operations
|
7
|
|
|
Statements of Changes in Net Assets
|
8
|
|
|
Financial Highlights
|
10
|
|
|
Notes to the Financial Statements
|
12
|
|
|
Expense Example
|
23
|
|
|
Notice to Shareholders
|
25
|
|
|
Statement Regarding Liquidity Risk Management Program
|
26
|
|
|
Approval of Investment Advisory Agreements
|
27
|
|
|
Notice of Privacy Policy & Practices
|
31
|
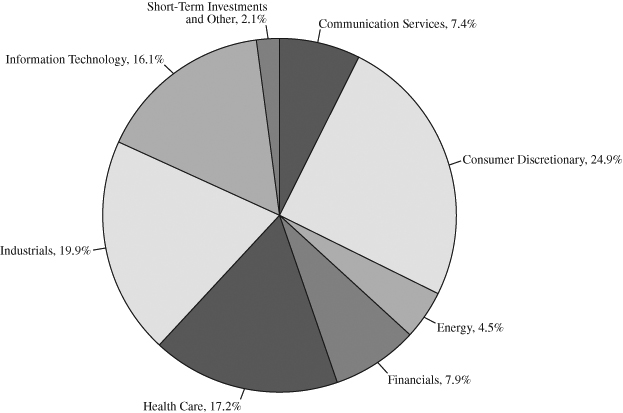
Hardman Johnston International Growth Fund
|
SECTOR ALLOCATION OF PORTFOLIO ASSETS
|
|
at April 30, 2023 (Unaudited)
|
|
COUNTRY ALLOCATION OF PORTFOLIO ASSETS
|
|
at April 30, 2023 (Unaudited)
|
|
China
|
14.9%
|
|
Netherlands
|
14.2%
|
|
United Kingdom
|
11.4%
|
|
France
|
10.6%
|
|
Germany
|
9.2%
|
|
Japan
|
7.5%
|
|
Hong Kong
|
5.2%
|
|
Denmark
|
5.1%
|
|
Taiwan
|
4.6%
|
|
United States
|
4.2%
|
|
India
|
2.7%
|
|
Italy
|
2.6%
|
|
Ireland
|
2.6%
|
|
Spain
|
2.0%
|
|
Norway
|
1.1%
|
|
Short-Term Investments and Other
|
2.1%
|
Percentages represent market value as a percentage of net assets.
3
Hardman Johnston International Growth Fund
|
SCHEDULE OF INVESTMENTS
|
|
at April 30, 2023 (Unaudited)
|
|
Number of
|
||||||||
|
COMMON STOCKS – 97.9%
|
Shares
|
Value
|
||||||
|
Communication Services – 7.4%
|
||||||||
|
Deutsche Telekom AG
|
93,360
|
$
|
2,251,083
|
|||||
|
Sea Ltd. – ADR (a)
|
13,256
|
1,009,709
|
||||||
|
3,260,793
|
||||||||
|
Consumer Discretionary – 24.9%
|
||||||||
|
Alibaba Group Hldg Ltd.
|
10,710
|
907,030
|
||||||
|
Aptiv Plc – ADR (a)
|
6,955
|
715,391
|
||||||
|
JD.com, Inc.
|
24,420
|
435,844
|
||||||
|
Kering
|
1,700
|
1,088,628
|
||||||
|
LVMH Moet Hennessy Louis Vuitton SE
|
1,264
|
1,215,823
|
||||||
|
Meituan (a)
|
96,100
|
1,642,393
|
||||||
|
Melco Resorts & Entertainment Ltd. – ADR (a)
|
117,370
|
1,600,927
|
||||||
|
Mercadolibre, Inc.
|
764
|
976,002
|
||||||
|
Prosus NV
|
31,690
|
2,371,483
|
||||||
|
10,953,521
|
||||||||
|
Energy – 4.5%
|
||||||||
|
TechnipFMC PLC
|
143,720
|
1,967,527
|
||||||
|
1,967,527
|
||||||||
|
Financials – 7.9%
|
||||||||
|
AIA Group Ltd.
|
211,160
|
2,298,915
|
||||||
|
ICICI Bank Ltd. – ADR
|
52,350
|
1,190,963
|
||||||
|
3,489,878
|
||||||||
|
Health Care – 17.2%
|
||||||||
|
Alkermes Plc – ADR (a)
|
39,860
|
1,138,003
|
||||||
|
AstraZeneca PLC
|
15,940
|
2,345,787
|
||||||
|
Genmab A/S (a)
|
5,510
|
2,264,416
|
||||||
|
Grifols SA (a)
|
83,810
|
862,711
|
||||||
|
Wuxi Biologics Cayman, Inc. (a)
|
161,170
|
961,031
|
||||||
|
7,571,947
|
||||||||
|
Industrials – 19.9%
|
||||||||
|
Airbus SE
|
16,915
|
2,368,694
|
||||||
|
Daifuku Co Ltd.
|
59,475
|
1,095,814
|
||||||
|
Prysmian SpA
|
28,275
|
1,157,176
|
||||||
|
Rheinmetall AG
|
6,090
|
1,783,724
|
||||||
|
Safran SA
|
15,215
|
2,366,242
|
||||||
|
8,771,650
|
||||||||
The accompanying notes are an integral part of these financial statements.
4
Hardman Johnston International Growth Fund
|
SCHEDULE OF INVESTMENTS (Continued)
|
|
at April 30, 2023 (Unaudited)
|
|
Number of
|
||||||||
|
COMMON STOCKS – 97.9% (Continued)
|
Shares
|
Value
|
||||||
|
Information Technology – 16.1%
|
||||||||
|
ASML Holding NV
|
2,380
|
$
|
1,510,384
|
|||||
|
Atlassian Corp. (a)
|
5,847
|
863,368
|
||||||
|
Keyence Corp.
|
4,880
|
2,200,667
|
||||||
|
Nordic Semiconductor ASA (a)
|
44,807
|
485,169
|
||||||
|
Taiwan Semiconductor Manufacturing Co Ltd.
|
124,000
|
2,030,574
|
||||||
|
7,090,162
|
||||||||
|
TOTAL COMMON STOCKS
|
||||||||
|
(Cost $40,400,252)
|
43,105,478
|
|||||||
|
SHORT-TERM INVESTMENTS – 2.1%
|
||||||||
|
MONEY MARKET FUNDS – 2.1%
|
||||||||
|
First American Government
|
||||||||
|
Obligations Fund – Class X, 4.73% (b)
|
928,945
|
928,945
|
||||||
|
TOTAL SHORT-TERM INVESTMENTS
|
||||||||
|
(Cost $928,945)
|
928,945
|
|||||||
|
TOTAL INVESTMENTS
|
||||||||
|
(Cost $41,329,197) – 100.0%
|
44,034,423
|
|||||||
|
Other assets in excess of liabilities – 0.0%
|
20,965
|
|||||||
|
TOTAL NET ASSETS – 100.0%
|
$
|
44,055,388
|
||||||
Percentages are stated as a percent of net assets.
ADR – American Depositary Receipt
PLC – Public Limited Company
|
(a)
|
Non-income producing security.
|
|
(b)
|
The rate shown represents the fund’s 7-day yield as of April 30, 2023.
|
The Global Industry Classification Standard (GICS®) was developed by and/or is the exclusive property of MSCI, Inc. and
Standard & Poor’s Financial Services LLC (“S&P”). GICS is a service mark of MSCI and S&P and has been licensed for use by U.S. Bank Global Fund Services.
The accompanying notes are an integral part of these financial statements.
5
Hardman Johnston International Growth Fund
|
STATEMENT OF ASSETS AND LIABILITIES
|
|
at April 30, 2023 (Unaudited)
|
|
Assets:
|
||||
|
Investments, at value (cost of $41,329,197)
|
$
|
44,034,423
|
||
|
Receivables:
|
||||
|
Fund shares sold
|
10,000
|
|||
|
Dividends and interest
|
38,510
|
|||
|
Prepaid expenses
|
42,455
|
|||
|
Total assets
|
44,125,388
|
|||
|
Liabilities:
|
||||
|
Payables:
|
||||
|
Fund shares redeemed
|
1,150
|
|||
|
Administration and fund accounting fees
|
22,574
|
|||
|
Advisory Fees
|
7,124
|
|||
|
Audit Fees
|
5,910
|
|||
|
Custody Fees
|
9,893
|
|||
|
Reports to shareholders
|
5,949
|
|||
|
Compliance Fees
|
5,309
|
|||
|
Transfer agent fees and expenses
|
11,005
|
|||
|
Other accrued expenses
|
1,086
|
|||
|
Total liabilities
|
70,000
|
|||
|
Net assets
|
$
|
44,055,388
|
||
|
Net assets consist of:
|
||||
|
Paid in capital
|
$
|
51,947,479
|
||
|
Total accumulated loss
|
(7,892,091
|
)
|
||
|
Net assets
|
$
|
44,055,388
|
||
|
Institutional Shares:
|
||||
|
Net assets applicable to outstanding Institutional Shares
|
$
|
43,106,237
|
||
|
Shares issued (Unlimited number of beneficial
|
||||
|
interest authorized, $0.01 par value)
|
3,913,868
|
|||
|
Net asset value, offering price and redemption price per share
|
$
|
11.01
|
||
|
Retail Shares:
|
||||
|
Net assets applicable to outstanding Retail Shares
|
$
|
949,151
|
||
|
Shares issued (Unlimited number of beneficial
|
||||
|
interest authorized, $0.01 par value)
|
81,718
|
|||
|
Net asset value, offering price and redemption price per share
|
$
|
11.61
|
||
The accompanying notes are an integral part of these financial statements.
6
Hardman Johnston International Growth Fund
|
STATEMENT OF OPERATIONS
|
|
For the Six Months Ended April 30, 2023 (Unaudited)
|
|
Investment income:
|
||||
|
Dividends (net of foreign taxes withheld of $19,367)
|
$
|
222,761
|
||
|
Interest
|
13,036
|
|||
|
Total investment income
|
235,797
|
|||
|
Expenses:
|
||||
|
Investment advisory fees (Note 4)
|
235,964
|
|||
|
Administration and fund accounting fees (Note 4)
|
65,728
|
|||
|
Transfer agent fees and expenses
|
32,072
|
|||
|
Federal and state registration fees
|
20,840
|
|||
|
Custody fees
|
18,464
|
|||
|
Legal fees
|
11,177
|
|||
|
Audit fees
|
9,412
|
|||
|
Trustees’ fees and expenses
|
8,648
|
|||
|
Compliance expense
|
7,783
|
|||
|
Reports to shareholders
|
1,488
|
|||
|
Distribution fees (Note 5)
|
||||
|
Distribution fees – Retail Shares
|
1,075
|
|||
|
Other
|
6,893
|
|||
|
Total expenses before reimbursement from advisor
|
419,544
|
|||
|
Expense reimbursement from advisor (Note 4)
|
(182,505
|
)
|
||
|
Net expenses
|
237,039
|
|||
|
Net investment loss
|
(1,242
|
)
|
||
|
Realized and unrealized gain (loss) on investments:
|
||||
|
Net realized loss on transactions from:
|
||||
|
Investments
|
(5,997,617
|
)
|
||
|
Foreign currency related transactions
|
(21,941
|
)
|
||
|
Net change in unrealized appreciation on:
|
||||
|
Investments
|
12,740,144
|
|||
|
Foreign currency related transactions
|
5,020,273
|
|||
|
Net realized and unrealized gain on investments
|
11,740,859
|
|||
|
Net increase in net assets resulting from operations
|
$
|
11,739,617
|
||
The accompanying notes are an integral part of these financial statements.
7
Hardman Johnston International Growth Fund
|
STATEMENTS OF CHANGES IN NET ASSETS
|
|
Six Months Ended
|
||||||||
|
April 30, 2023
|
Year Ended
|
|||||||
|
(Unaudited)
|
October 31, 2022
|
|||||||
|
Operations:
|
||||||||
|
Net investment loss
|
$
|
(1,242
|
)
|
$
|
(149,512
|
)
|
||
|
Net realized loss on investments
|
(6,019,558
|
)
|
(4,104,996
|
)
|
||||
|
Net change in unrealized appreciation
|
||||||||
|
(depreciation) on investments
|
17,760,417
|
(23,496,438
|
)
|
|||||
|
Net increase (decrease) in net assets
|
||||||||
|
resulting from operations
|
11,739,617
|
(27,750,946
|
)
|
|||||
|
Distributions to Shareholders From:
|
||||||||
|
Distributed earnings
|
||||||||
|
Investor class shares
|
—
|
(7,565
|
)
|
|||||
|
Institutional shares
|
—
|
(678,739
|
)
|
|||||
|
Total distributions
|
—
|
(686,304
|
)
|
|||||
|
Capital Share Transactions:
|
||||||||
|
Proceeds from shares sold
|
||||||||
|
Retail shares
|
251,495
|
201,718
|
||||||
|
Institutional shares
|
7,176,519
|
23,045,651
|
||||||
|
Proceeds from shares issued to
|
||||||||
|
holders in reinvestment of dividends
|
||||||||
|
Retail shares
|
—
|
7,445
|
||||||
|
Institutional shares
|
—
|
653,292
|
||||||
|
Cost of shares redeemed
|
||||||||
|
Retail Shares
|
(44,824
|
)
|
(65,608
|
)
|
||||
|
Institutional shares
|
(20,900,516
|
)
|
(15,312,108
|
)
|
||||
|
Net increase (decrease) in net assets
|
||||||||
|
from capital share transactions
|
(13,517,326
|
)
|
8,530,390
|
|||||
|
Total decrease in net assets
|
(1,777,709
|
)
|
(19,906,860
|
)
|
||||
|
Net Assets:
|
||||||||
|
Beginning of period
|
45,833,097
|
65,739,957
|
||||||
|
End of period
|
$
|
44,055,388
|
$
|
45,833,097
|
||||
The accompanying notes are an integral part of these financial statements.
8
Hardman Johnston International Growth Fund
|
STATEMENTS OF CHANGES IN NET ASSETS (Continued)
|
|
Six Months Ended
|
||||||||
|
April 30, 2023
|
Year Ended
|
|||||||
|
(Unaudited)
|
October 31, 2022
|
|||||||
|
Changes in Shares Outstanding:
|
||||||||
|
Shares sold
|
||||||||
|
Retail shares
|
22,795
|
18,435
|
||||||
|
Institutional shares
|
666,773
|
2,132,845
|
||||||
|
Proceeds from shares issued to holders
|
||||||||
|
in reinvestment of dividends
|
||||||||
|
Retail shares
|
—
|
524
|
||||||
|
Institutional shares
|
—
|
48,644
|
||||||
|
Shares redeemed
|
||||||||
|
Retail shares
|
(4,063
|
)
|
(5,477
|
)
|
||||
|
Institutional shares
|
(1,933,445
|
)
|
(1,470,326
|
)
|
||||
|
Net increase (decrease) in shares outstanding
|
(1,247,940
|
)
|
724,645
|
|||||
The accompanying notes are an integral part of these financial statements.
9
Hardman Johnston International Growth Fund
|
FINANCIAL HIGHLIGHTS
|
For a capital share outstanding throughout the period
Institutional Shares
|
Six Months
|
Year
|
Year
|
Year
|
Year
|
||||||||||||||||
|
Ended
|
Ended
|
Ended
|
Ended
|
Ended
|
||||||||||||||||
|
April 30, 2023
|
October 31,
|
October 31,
|
October 31,
|
October 31,
|
||||||||||||||||
|
(Unaudited)
|
2022
|
2021
|
2020
|
2019
|
||||||||||||||||
|
Net Asset Value –
|
||||||||||||||||||||
|
Beginning of Period
|
$
|
8.74
|
$
|
14.54
|
$
|
11.11
|
$
|
10.23
|
$
|
9.15
|
||||||||||
|
Income from
|
||||||||||||||||||||
|
Investment Operations:
|
||||||||||||||||||||
|
Net investment
|
||||||||||||||||||||
|
income/(loss)1
|
—
|
(0.03
|
)
|
(0.07
|
)
|
(0.05
|
)
|
0.09
|
||||||||||||
|
Net realized and unrealized
|
||||||||||||||||||||
|
gain (loss) on investments
|
2.27
|
(5.62
|
)
|
3.50
|
1.48
|
0.99
|
||||||||||||||
|
Total from
|
||||||||||||||||||||
|
investment operations
|
2.27
|
(5.65
|
)
|
3.43
|
1.43
|
1.08
|
||||||||||||||
|
Less Distributions:
|
||||||||||||||||||||
|
Dividends from net
|
||||||||||||||||||||
|
investment income
|
—
|
(0.15
|
)
|
—
|
(0.55
|
)
|
—
|
|||||||||||||
|
Total distributions
|
—
|
(0.15
|
)
|
—
|
(0.55
|
)
|
—
|
|||||||||||||
|
Net Asset Value –
|
||||||||||||||||||||
|
End of Period
|
$
|
11.01
|
$
|
8.74
|
$
|
14.54
|
$
|
11.11
|
$
|
10.23
|
||||||||||
|
Total Return
|
25.97
|
%^ |
(39.22
|
)%
|
30.87
|
%
|
14.68
|
%
|
11.80
|
%
|
||||||||||
|
Ratios and Supplemental Data:
|
||||||||||||||||||||
|
Net assets, end of
|
||||||||||||||||||||
|
period (thousands)
|
$
|
43,106
|
$
|
45,252
|
$
|
64,979
|
$
|
17,329
|
$
|
7,069
|
||||||||||
|
Ratio of operating expenses
|
||||||||||||||||||||
|
to average net assets:
|
||||||||||||||||||||
|
Before reimbursements
|
1.78
|
%+
|
1.74
|
%
|
1.88
|
%
|
6.48
|
%
|
4.57
|
%
|
||||||||||
|
After reimbursements
|
1.00
|
%+
|
1.00
|
%
|
1.00
|
%
|
1.00
|
%
|
1.00
|
%
|
||||||||||
|
Ratio of net investment income
|
||||||||||||||||||||
|
to average net assets:
|
||||||||||||||||||||
|
Before reimbursements
|
(0.78
|
)%+
|
(1.02
|
)%
|
(1.36
|
)%
|
(5.94
|
)%
|
(2.63
|
)%
|
||||||||||
|
After reimbursements
|
0.00
|
%+
|
(0.28
|
)%
|
(0.48
|
)%
|
(0.46
|
)%
|
0.94
|
%
|
||||||||||
|
Portfolio turnover rate2
|
26
|
%^ |
32
|
%
|
46
|
%
|
224
|
%
|
81
|
%
|
||||||||||
|
+
|
Annualized
|
|
^
|
Not Annualized
|
|
1
|
The net investment income per share was calculated using the average shares outstanding method.
|
|
2
|
Portfolio turnover was calculated on the basis of the Fund as a whole. The rate presented represents portfolio turnover for the entire fiscal year.
|
The accompanying notes are an integral part of these financial statements.
10
Hardman Johnston International Growth Fund
|
FINANCIAL HIGHLIGHTS
|
For a capital share outstanding throughout the period
Retail Shares
|
Six Months
|
Year
|
Year
|
Year
|
Year
|
||||||||||||||||
|
Ended
|
Ended
|
Ended
|
Ended
|
Ended
|
||||||||||||||||
|
April 30, 2023
|
October 31,
|
October 31,
|
October 31,
|
October 31,
|
||||||||||||||||
|
(Unaudited)
|
2022
|
2021
|
2020
|
2019
|
||||||||||||||||
|
Net Asset Value –
|
||||||||||||||||||||
|
Beginning of Period
|
$
|
9.22
|
$
|
15.38
|
$
|
11.79
|
$
|
10.20
|
$
|
9.15
|
||||||||||
|
Income from
|
||||||||||||||||||||
|
Investment Operations:
|
||||||||||||||||||||
|
Net investment
|
||||||||||||||||||||
|
income/(loss)1
|
(0.01
|
)
|
(0.06
|
)
|
(0.11
|
)
|
(0.08
|
)
|
0.07
|
|||||||||||
|
Net realized and unrealized
|
||||||||||||||||||||
|
gain (loss) on investments
|
2.40
|
(5.95
|
)
|
3.70
|
1.67
|
0.98
|
||||||||||||||
|
Total from
|
||||||||||||||||||||
|
investment operations
|
2.39
|
(6.01
|
)
|
3.59
|
1.59
|
1.05
|
||||||||||||||
|
Less Distributions:
|
||||||||||||||||||||
|
Distributions from
|
||||||||||||||||||||
|
net realized gains
|
—
|
(0.15
|
)
|
—
|
—
|
—
|
||||||||||||||
|
Total distributions
|
—
|
(0.15
|
)
|
—
|
—
|
—
|
||||||||||||||
|
Net Asset Value –
|
||||||||||||||||||||
|
End of Period
|
$
|
11.61
|
$
|
9.22
|
$
|
15.38
|
$
|
11.79
|
$
|
10.20
|
||||||||||
|
Total Return
|
26.03
|
%^ |
(39.42
|
)%
|
30.45
|
%
|
15.59
|
%^ |
11.48
|
%
|
||||||||||
|
Ratios and Supplemental Data:
|
||||||||||||||||||||
|
Net assets, end of
|
||||||||||||||||||||
|
period (thousands)
|
$
|
949
|
$
|
581
|
$
|
761
|
$
|
327
|
$
|
2,479
|
||||||||||
|
Ratio of operating expenses
|
||||||||||||||||||||
|
to average net assets:
|
||||||||||||||||||||
|
Before reimbursements
|
2.03
|
%+
|
1.99
|
%
|
2.18
|
%
|
7.30
|
%+
|
4.88
|
%
|
||||||||||
|
After reimbursements
|
1.25
|
%+
|
1.25
|
%
|
1.25
|
%
|
1.25
|
%+
|
1.25
|
%
|
||||||||||
|
Ratio of net investment
|
||||||||||||||||||||
|
income to average net assets:
|
||||||||||||||||||||
|
Before reimbursements
|
(0.91
|
)%+
|
(1.27
|
)%
|
(1.68
|
)%
|
(6.84
|
)%+
|
(2.87
|
)%
|
||||||||||
|
After reimbursements
|
(0.13
|
)%+
|
(0.53
|
)%
|
(0.75
|
)%
|
(0.79
|
)%+
|
0.76
|
%
|
||||||||||
|
Portfolio turnover rate2
|
26
|
%^ |
32
|
%
|
46
|
%
|
224
|
%^ |
81
|
%
|
||||||||||
|
+
|
Annualized
|
|
^
|
Not Annualized
|
|
1
|
The net investment income/(loss) per share was calculated using the average shares outstanding method.
|
|
2
|
Portfolio turnover was calculated on the basis of the Fund as a whole. The rate presented represents portfolio turnover for the entire fiscal year.
|
The accompanying notes are an integral part of these financial statements.
11
Hardman Johnston International Growth Fund
|
NOTES TO FINANCIAL STATEMENTS
|
|
at April 30, 2023 (Unaudited)
|
NOTE 1 – ORGANIZATION
The Hardman Johnston International Growth Fund (the “Fund”) is a series of Manager Directed Portfolios (the “Trust”). The Trust is registered under the Investment Company Act of
1940, as amended (the “1940 Act”), and was organized as a Delaware statutory trust on April 4, 2006. The Fund is an open-end investment management company and is a non-diversified series of the Trust. The Fund’s Institutional Shares commenced
operations on February 14, 2018. The Fund’s Retail Shares commenced operations on September 17, 2018. Each class of shares differs principally in its respective distribution expenses. Each class of shares has identical rights to earnings, assets
and voting privileges, except for class-specific expenses and exclusive rights to vote on matters affecting only individual classes. Dakota Investments LLC (the “Advisor”) serves as the investment advisor to the Fund. Hardman Johnston Global
Advisors LLC (the “Sub-Advisor”) serves as the sub-advisor to the Fund. Redwood Investments, LLC (“Redwood”) served as the International Growth Fund’s sub-advisor from the Fund’s inception to December 31, 2019. Effective January 1, 2020, Hardman
Johnston replaced Redwood as the International Growth Fund’s sub-advisor. As an investment company, the Fund follows the investment company accounting and reporting guidance of the Financial Accounting Standards Board (“FASB”) Accounting Standard
Codification Topic 946 Financial Services – Investment Companies. The investment objective of the Fund is to seek long term capital appreciation.
NOTE 2 – SIGNIFICANT ACCOUNTING POLICIES
The following is a summary of significant accounting policies consistently followed by the Fund. These policies are in conformity with U.S. generally accepted accounting
principles (“GAAP”).
|
A.
|
Security Valuation: All investments in securities are recorded at their estimated fair value, as described in Note 3.
|
|
|
B.
|
Federal Income Taxes: It is the Fund’s policy to comply with the requirements of Subchapter M of the Internal Revenue Code applicable to regulated
investment companies and to distribute substantially all of its taxable income to its shareholders. Therefore, no federal income or excise tax provisions are required.
|
|
|
The Fund recognizes the tax benefits of uncertain tax positions only where the position is “more likely than not” to be sustained assuming examination by tax authorities. Management has
analyzed the Fund’s tax positions, and has concluded that no liability for unrecognized tax benefits should be recorded related to uncertain tax positions to be taken or expected to be taken on a tax return. The tax returns for the Fund
for the prior three fiscal years are open for examination. The Fund identifies its major tax jurisdictions as U.S. Federal and the state of Delaware.
|
||
|
C.
|
Securities Transactions, Income and Distributions: Securities transactions are accounted for on the trade date. Realized gains and losses on
securities sold are determined on the basis of identified cost. Interest income is recorded on an
|
12
Hardman Johnston International Growth Fund
|
NOTES TO FINANCIAL STATEMENTS (Continued)
|
|
at April 30, 2023 (Unaudited)
|
|
accrual basis. Dividend income and distributions to shareholders are recorded on the ex-dividend date. Discounts and premiums on fixed income securities are amortized using the effective
interest method. Withholding taxes on foreign dividends have been provided for in accordance with the Fund’s understanding of the applicable country’s tax rules and rates.
|
||
|
The Fund distributes substantially all of its net investment income, if any, and net realized capital gains, if any, annually. Distributions from net realized gains for book purposes may
include short-term capital gains. All short-term capital gains are included in ordinary income for tax purposes. The amount of dividends and distributions to shareholders from net investment income and net realized capital gains is
determined in accordance with federal income tax regulations, which differ from GAAP. To the extent these book/tax differences are permanent, such amounts are reclassified within the capital accounts based on their federal tax treatment.
|
||
|
The Fund is charged for those expenses that are directly attributable to it, such as investment advisory, custody and transfer agent fees. Expenses that are not attributable to a Fund are
typically allocated among the funds in the Trust proportionately based on allocation methods approved by the Board of Trustees (the “Board”). Common expenses of the Trust are typically allocated among the funds in the Trust based on a
fund’s respective net assets, or by other equitable means.
|
||
|
D.
|
Use of Estimates: The preparation of financial statements in conformity with GAAP requires management to make estimates and assumptions that affect
the reported amounts of assets and liabilities at the date of the financial statements and the reported amounts of increases and decreases in net assets during the reporting period. Actual results could differ from those estimates.
|
|
|
E.
|
Redemption Fees: The Fund does not charge redemption fees to shareholders.
|
|
|
F.
|
Reclassification of Capital Accounts: GAAP requires that certain components of net assets relating to permanent differences be reclassified between
financial and tax reporting. These reclassifications have no effect on net assets or net asset value per share.
|
|
|
G.
|
Foreign Currency: Values of investments denominated in foreign currencies are converted into U.S. dollars using the spot market rate of exchange at
the time of valuation. Purchases and sales of investments and income are translated into U.S. dollars using the spot market rate of exchange prevailing on the respective dates of such transactions. The Fund does not isolate the portion of
the results of operations resulting from fluctuations in foreign exchange rates on investments from fluctuations resulting from changes in the market prices of securities held. Such fluctuations are included with the net realized and
unrealized gain/loss on investments. Foreign investments present additional risks due to currency fluctuations, economic and political factors, lower liquidity, government regulations, differences in accounting standards, and other
factors.
|
13
Hardman Johnston International Growth Fund
|
NOTES TO FINANCIAL STATEMENTS (Continued)
|
|
at April 30, 2023 (Unaudited)
|
|
H.
|
Events Subsequent to the Fiscal Year End: In preparing the financial statements as of April 30, 2023, and through the date the financial statements
were available to be issued, management considered the impact of subsequent events for potential recognition or disclosure in the financial statements and had concluded that no additional disclosures are necessary.
|
NOTE 3 – SECURITIES VALUATION
The Fund has adopted authoritative fair value accounting standards which establish an authoritative definition of fair value and set out a hierarchy for measuring fair value.
These standards require additional disclosures about the various inputs and valuation techniques used to develop the measurements of fair value, a discussion of changes in valuation techniques and related inputs during the period, and expanded
disclosure of valuation levels for major security types. These inputs are summarized in the three broad levels listed below:
|
Level 1 –
|
Unadjusted, quoted prices in active markets for identical assets or liabilities that the Fund has the ability to access at the date of measurement.
|
|
|
Level 2 –
|
Other significant observable inputs (including, but not limited to, quoted prices in active markets for similar instruments, quoted prices in markets that are not active for identical or
similar instruments, and model-derived valuations in which all significant inputs and significant value drivers are observable in active markets, such as interest rates, prepayment speeds, credit risk curves, default rates, and similar
data).
|
|
|
Level 3 –
|
Significant unobservable inputs for the asset or liability, to the extent relevant observable inputs are not available, representing the Fund’s own assumptions about the assumptions a market
participant would use in valuing the asset or liability, and would be based on the best information available.
|
Following is a description of the valuation techniques applied to the Fund’s major categories of assets and liabilities measured at fair value on a recurring basis.
Equity Securities: Equity securities, including common stocks, preferred stocks, foreign-issued common stocks, exchange-traded funds,
closed-end mutual funds and real estate investment trusts (REITs), that are primarily traded on a national securities exchange shall be valued at the last sale price on the exchange on which they are primarily traded on the day of valuation or, if
there has been no sale on such day, at the mean between the bid and asked prices. Securities primarily traded in the NASDAQ Global Market System for which market quotations are readily available shall be valued using the NASDAQ Official Closing
Price (“NOCP”). If the NOCP is not available, such securities shall be valued at the last sale price on the day of valuation, or if there has been no sale on such day, at the mean between the bid and asked prices. Over-the-counter securities that
are not traded on a listed exchange are valued at the last sale price in the over-the-counter market. Over-the-counter securities which are not traded in the NASDAQ Global Market
14
Hardman Johnston International Growth Fund
|
NOTES TO FINANCIAL STATEMENTS (Continued)
|
|
at April 30, 2023 (Unaudited)
|
System shall be valued at the mean between the bid and asked prices. To the extent these securities are actively traded and valuation adjustments are not applied, they are categorized in Level 1 of
the fair value hierarchy. Securities traded on foreign exchanges generally are not valued at the same time the Fund calculates its net asset value (“NAV”) because most foreign markets close well before such time. The earlier close of most foreign
markets gives rise to the possibility that significant events, including broad market moves, may have occurred in the interim. In certain circumstances, it may be determined that a security needs to be fair valued because it appears that the value
of the security might have been materially affected by an event (a “Significant Event”) occurring after the close of the market in which the security is principally traded, but before the time the Fund calculates its NAV. A Significant Event may
relate to a single issuer or to an entire market sector, or even occurrences not tied directly to the securities markets, such as natural disasters, armed conflicts, or significant government actions.
Registered Investment Companies: Investments in registered investment companies (e.g., mutual funds) are generally priced at the ending
NAV provided by the applicable registered investment company’s service agent and will be classified in Level 1 of the fair value hierarchy.
Short-Term Debt Securities: Debt securities, including short-term debt instruments having a maturity of less than 60 days, are valued at
the evaluated mean price supplied by an approved pricing service. Pricing services may use various valuation methodologies including matrix pricing and other analytical pricing models as well as market transactions and dealer quotations. In the
absence of prices from a pricing service, the securities will be priced in accordance with the procedures adopted by the Board. Short-term securities are generally classified in Level 1 or Level 2 of the fair market hierarchy depending on the
inputs used and market activity levels for specific securities.
In the absence of prices from a pricing service or in the event that market quotations are not readily available, fair value will be determined under the Fund’s valuation
procedures adopted pursuant to Rule 2a-5. Pursuant to those procedures, the Board has appointed the Advisor as the Fund’s valuation designee (the “Valuation Designee”) to perform all fair valuations of the Fund’s portfolio investments, subject to
the Board’s oversight. As the Valuation Designee, the Advisor has established procedures for its fair valuation of the Fund’s portfolio investments. These procedures address, among other things, determining when market quotations are not readily
available or reliable and the methodologies to be used for determining the fair value of investments, as well as the use and oversight of third-party pricing services for fair valuation.
Depending on the relative significance of the valuation inputs, fair valued securities may be classified in either level 2 or level 3 of the fair value hierarchy.
The fair valuation of foreign securities may be determined with the assistance of a pricing service using correlations between the movement of prices of such securities and
indices of domestic securities and other appropriate indicators, such as closing market prices of relevant American Depositary Receipts or futures contracts. The Fund uses ICE
15
Hardman Johnston International Growth Fund
|
NOTES TO FINANCIAL STATEMENTS (Continued)
|
|
at April 30, 2023 (Unaudited)
|
Data Services (“ICE”) as a third-party fair valuation vendor. ICE provides a fair value for foreign securities in the Fund based on certain factors and methodologies applied by ICE in the event that
there is a movement in the U.S. markets that exceeds a specific threshold established by the Valuation Committee. The effect of using fair value pricing is that the Fund’s NAV will reflect the affected portfolio securities’ values as determined by
the Board or its designee instead of being determined by the market. Using a fair value pricing methodology to price a foreign security may result in a value that is different from the foreign security’s most recent closing price and from the
prices used by other investment companies to calculate their NAVs and are generally classified in Level 2 of the fair valuation hierarchy. Because the Fund may invest in foreign securities, the value of the Fund’s portfolio securities may change
on days when you will not be able to purchase or redeem your shares.
The inputs or methodology used for valuing securities are not an indication of the risk associated with investing in those securities. The following is a summary of the fair
valuation hierarchy of the Fund’s securities as of April 30, 2023:
|
Common Stocks
|
Level 1
|
Level 2
|
Level 3
|
Total
|
||||||||||||
|
Communication Services
|
$
|
1,009,709
|
$
|
2,251,083
|
$
|
—
|
$
|
3,260,792
|
||||||||
|
Consumer Discretionary
|
4,199,350
|
6,754,171
|
—
|
10,953,521
|
||||||||||||
|
Energy
|
1,967,527
|
—
|
—
|
1,967,527
|
||||||||||||
|
Financials
|
1,190,963
|
2,298,915
|
—
|
3,489,878
|
||||||||||||
|
Health Care
|
1,138,003
|
6,433,945
|
—
|
7,571,948
|
||||||||||||
|
Industrials
|
—
|
8,771,650
|
—
|
8,771,650
|
||||||||||||
|
Information Technology
|
863,368
|
6,226,794
|
—
|
7,090,162
|
||||||||||||
|
Total Common Stocks
|
10,368,920
|
32,736,558
|
—
|
43,105,478
|
||||||||||||
|
Short-Term Investments
|
928,945
|
—
|
—
|
928,945
|
||||||||||||
|
Total Investments in Securities
|
$
|
11,297,865
|
$
|
32,736,558
|
$
|
—
|
$
|
44,034,423
|
||||||||
NOTE 4 – INVESTMENT ADVISORY FEE AND OTHER TRANSACTIONS WITH AFFILIATES
For the six months ended April 30, 2023, the Advisor provided the Fund with investment management services under an Investment Advisory Agreement. The Advisor furnishes all
investment advice, office space, and facilities, and provides most of the personnel needed by the Fund. As compensation for its services, the Advisor is entitled to a monthly fee at an annual rate of 1.00% of the average daily net assets of the
Fund. For the six months ended April 30, 2023, the Fund incurred $235,964 in advisory fees. The Advisor has hired Hardman Johnston Global Advisors LLC as a sub-advisor to the Fund. The Advisor pays the Sub-Advisor fee for the Fund from its own
assets and these fees are not an additional expense of the Fund.
The Fund is responsible for its own operating expenses. The Advisor has contractually agreed to waive its management fees and/or absorb expenses of the Fund to
16
Hardman Johnston International Growth Fund
|
NOTES TO FINANCIAL STATEMENTS (Continued)
|
|
at April 30, 2023 (Unaudited)
|
ensure that the total annual operating expenses [excluding Acquired Fund Fees and Expenses, taxes, brokerage commissions, interest and extraordinary expenses (collectively, “Excludable Expenses”)] do
not exceed the following amounts of the average daily net assets for each class of shares:
Hardman Johnston International Growth Fund
|
Institutional Shares
|
1.00%
|
||
|
Retail Shares
|
1.25%
|
For the six months ended April 30, 2023, the Advisor reduced its fees and absorbed Fund expenses in the amount of $182,505 for the Fund. The waivers and reimbursements will remain
in effect through February 28, 2024 unless terminated sooner by, or with the consent of, the Board.
The Advisor may request recoupment of previously waived fees and paid expenses in any subsequent month in the three-year period from the date of the management fee reduction and
expense payment if the aggregate amount actually paid by the Fund toward the operating expenses for such fiscal year (taking into account the reimbursement) will not cause the Fund to exceed the lesser of: (1) the expense limitation in place at the
time of the management fee reduction and expense payment; or (2) the expense limitation in place at the time of the reimbursement. Any such reimbursement is also contingent upon Board of Trustees review and approval at the time the reimbursement
is made. Such reimbursement may not be paid prior to the Fund’s payment of current ordinary operating expenses. Cumulative expenses subject to recapture pursuant to the aforementioned conditions expire as follows:
|
10/31/2023
|
10/31/2024
|
10/31/2025
|
4/30/2026
|
Total
|
||
|
$332,022
|
$406,289
|
$387,648
|
$182,505
|
$1,308,464
|
U.S. Bancorp Fund Services, LLC, doing business as U.S. Bank Global Fund Services, LLC (“Fund Services” or the “Administrator”) acts as the Fund’s Administrator under an
Administration Agreement. The Administrator prepares various federal and state regulatory filings, reports and returns for the Fund; prepares reports and materials to be supplied to the Trustees; monitors the activities of the Fund’s custodian,
transfer agent and accountants; coordinates the preparation and payment of the Fund’s expenses and reviews the Fund’s expense accruals. Fund Services also serves as the fund accountant, transfer agent and Chief Compliance Officer to the Fund. U.S.
Bank N.A., an affiliate of Fund Services, serves as the Fund’s custodian. For the six months ended April 30, 2023, the Fund incurred the following expenses for administration, fund accounting, transfer agency and custody fees:
|
Administration & fund accounting
|
$65,728
|
|
Custody
|
$18,464
|
|
Transfer agency
|
$32,072
|
17
Hardman Johnston International Growth Fund
|
NOTES TO FINANCIAL STATEMENTS (Continued)
|
|
at April 30, 2023 (Unaudited)
|
At April 30, 2023, the Fund had payables due to Fund Services for administration, fund accounting and transfer agency fees and to U.S. Bank N.A. for custody fees in the following
amounts:
|
Administration & fund accounting
|
$22,574
|
|
Custody
|
$ 9,893
|
|
Transfer agency
|
$11,005
|
|
Compliance
|
$ 5,309
|
Vigilant Distributors, LLC (the “Distributor”) acts as the Fund’s principal underwriter in a continuous public offering of the Fund’s shares.
Certain officers of the Fund are employees of the Administrator and are not paid any fees by the Fund for serving in such capacities.
NOTE 5 – DISTRIBUTION AGREEMENT AND PLAN
The Fund has adopted a Distribution Plan pursuant to Rule 12b-1 (the “Plan”). The Plan permits the Fund to pay for distribution and related expenses at an annual rate of up to
0.25% of the average daily net assets of the Fund’s Retail Shares. The expenses covered by the Plan may include costs in connection with the promotion and distribution of shares and the provision of personal services to shareholders, including,
but not necessarily limited to, advertising, compensation to underwriters, dealers and selling personnel, the printing and mailing of prospectuses to other than current Fund shareholders, and the printing and mailing of sales literature. Payments
made pursuant to the Plan will represent compensation for distribution and service activities, not reimbursements for specific expenses incurred. For the six months ended April 30, 2023, the Hardman Johnston International Growth Fund incurred
distribution expenses on its Retail Shares of $1,075.
NOTE 6 – SECURITIES TRANSACTIONS
For the six months ended April 30, 2023, the cost of purchases and the proceeds from sales of securities, excluding short-term securities, were as follows:
|
Purchases
|
Sales
|
||
|
International Growth Fund
|
$12,075,271
|
$25,861,431
|
There were no purchases or sales of long-term U.S. Government securities.
18
Hardman Johnston International Growth Fund
|
NOTES TO FINANCIAL STATEMENTS (Continued)
|
|
at April 30, 2023 (Unaudited)
|
NOTE 7 – INCOME TAXES AND DISTRIBUTIONS TO SHAREHOLDERS
As of October 31, 2022, the components of accumulated earnings/(losses) on a tax basis were as follows:
|
Cost of investments(a)
|
$
|
62,714,158
|
||||
|
Gross unrealized appreciation
|
2,076,234
|
|||||
|
Gross unrealized depreciation
|
(18,681,887
|
)
|
||||
|
Net unrealized appreciation
|
(16,605,653
|
)
|
||||
|
Undistributed ordinary income
|
—
|
|||||
|
Undistributed long-term capital gain
|
—
|
|||||
|
Total distributable earnings
|
—
|
|||||
|
Other accumulated gains/(losses)
|
(3,026,055
|
)
|
||||
|
Total accumulated earnings/(losses)
|
$
|
(19,631,708
|
)
|
|
(a)
|
The difference between the book basis and tax basis net unrealized appreciation and cost is attributable primarily to wash sales.
|
As of October 31, 2022, the Fund had long-term tax basis loss carryforwards in the amount of 893,139 and short-term tax basis loss carryforwards in the amount of 2,012,544.
At October 31, 2022, the Fund deferred, on a tax basis, post-October losses of:
|
Capital
|
Ordinary Late Year Loss
|
||
|
$ —
|
$117,723
|
The tax character of distributions paid during the year ended October 31, 2022, and the year ended October 31, 2021, was as follows:
|
Year Ended
|
Year Ended
|
||||||||
|
October 31, 2022
|
October 31, 2021
|
||||||||
|
Ordinary income
|
$
|
—
|
$
|
—
|
|||||
|
Long-term capital gains
|
686,304
|
—
|
|||||||
|
$
|
686,304
|
$
|
—
|
||||||
For the fiscal year ended October 31, 2022, the effect of permanent “book/tax” reclassifications resulted in increases and decreases to components of the Funds’ net assets as
follows:
|
Total Distributable
|
Paid-In
|
||
|
Earnings/(Loss)
|
Capital
|
||
|
$335,204
|
$(335,204)
|
NOTE 8 – PRINCIPAL RISKS
Below are summaries of some, but not all, of the principal risks of investing in the Fund, each of which could adversely affect the Fund’s NAV, market price, yield, and total
return. Further information about investment risks is available in the Fund’s prospectus and Statement of Additional Information.
19
Hardman Johnston International Growth Fund
|
NOTES TO FINANCIAL STATEMENTS (Continued)
|
|
at April 30, 2023 (Unaudited)
|
Equity Market Risk: Equity securities are susceptible to general stock market fluctuations due to economic, market, political and
issuer-specific considerations and to potential volatile increases and decreases in value as market confidence in and perceptions of their issuers change.
Foreign Securities and Currency Risk: Foreign securities are subject to risks relating to political, social and economic developments
abroad and differences between U.S. and foreign regulatory requirements and market practices. Those risks are increased for investments in emerging markets. Securities that are denominated in foreign currencies are subject to further risk that the
value of the foreign currency will fall in relation to the U.S. dollar and/or will be affected by volatile currency markets or actions of U.S. and foreign governments or central banks. Income earned on foreign securities may be subject to foreign
withholding taxes.
Management Risk: The ability of the Fund to meet its investment objective is directly related to the Advisor’s and Sub-Advisor’s
management of the Fund. The value of your investment in the Fund may vary with the effectiveness of the Advisor’s research, analysis and asset allocation among portfolio securities. If the investment strategies do not produce the expected results,
the value of your investment could be diminished or even lost entirely.
General Market Risk; Recent Market Events: The value of the Fund’s shares will fluctuate based on the performance of the Fund’s
investments and other factors affecting the securities markets generally. Certain investments selected for the Fund’s portfolio may be worth less than the price originally paid for them, or less than they were worth at an earlier time. The value of
the Fund’s investments may go up or down, sometimes dramatically and unpredictably, based on current market conditions, such as real or perceived adverse political or economic conditions, inflation, changes in interest rates, lack of liquidity in
the fixed income markets or adverse investor sentiment.
U.S. and international markets have experienced volatility in recent months and years due to a number of economic, political and global macro factors, including the impact of the
coronavirus (COVID-19) global pandemic, which has resulted in a public health crisis, business interruptions, growth concerns in the U.S. and overseas, layoffs, rising unemployment claims, changed travel and social behaviors and reduced consumer
spending. The effects of COVID-19 may lead to a substantial economic downturn or recession in the U.S. and global economies, the recovery from which is uncertain and may last for an extended period of time.
New Fund Risk: There can be no assurance that the Fund will grow to or maintain an economically viable size, in which case the Board may
determine to liquidate the Fund. Liquidation of the Fund can be initiated without shareholder approval by the Board if it determines that liquidation is in the best interest of shareholders. As a result, the timing of the Fund’s liquidation may not
be favorable.
20
Hardman Johnston International Growth Fund
|
NOTES TO FINANCIAL STATEMENTS (Continued)
|
|
at April 30, 2023 (Unaudited)
|
Emerging and Frontier Markets Risk: Countries in emerging markets are generally more volatile and can have relatively unstable
governments, social and legal systems that do not protect shareholders, economies based on only a few industries, and securities markets that trade a small number of issues. Frontier market countries generally have smaller economies and even less
developed capital markets than emerging markets. As a result, the risks of investing in emerging markets are magnified in frontier markets, and include potential for extreme price volatility and illiquidity; government ownership or control of
parts of private sector and of certain companies; trade barriers, exchange controls, managed adjustments in relative currency values and other protectionist measures; and relatively new and unsettled securities laws.
Large Capitalization Risk: Larger, more established companies may be unable to respond quickly to new competitive challenges such as
changes in technology and consumer tastes. Larger companies also may not be able to attain the high growth rates of successful smaller companies.
Medium and Small Capitalization Risk: Investing in medium and small capitalization companies may involve special risks because those
companies may have narrower product lines, more limited financial resources, fewer experienced managers, dependence on a few key employees, and a more limited trading market for their stocks, as compared with larger companies. Securities of medium
and smaller capitalization issuers may be subject to greater price volatility and may decline more significantly in market downturns than securities of larger companies.
NOTE 9 – LINE OF CREDIT
As of April 30, 2023, the Fund had an uncommitted line of credit (the “Line”) with U.S. Bank N.A. The Line is for liquidity in connection with shareholder redemptions and
portfolio timing differences. Borrowings under the Line must be secured by Fund assets. The Fund is able to borrow the lesser of the line limit of $5,000,000, 20% of market value, or 33 1/3% of the unencumbered assets held in the collateral
account. The Line has a maturity date of May 29, 2024 and is reviewed annually by the Board of Trustees. During the six months ended April 30, 2023, the maximum borrowing was $4,412,000 and average borrowing was $385,087. This borrowing resulted in
interest expenses of $4,238 at a weighted average interest rate of 7.46% and is included in the Fund’s Statement of Operations. As of April 30, 2023, the Fund did not have an outstanding loan balance.
NOTE 10 – GUARANTEES AND INDEMNIFICATIONS
In the normal course of business, the Fund enters into contracts that contain a variety of representations and warranties and which provide general indemnifications. The Fund’s
maximum exposure under these arrangements is unknown, as this would involve future claims that may be made against the Fund that have not yet occurred. However, based on experience, the Fund expects the risk of loss to be remote.
21
Hardman Johnston International Growth Fund
|
NOTES TO FINANCIAL STATEMENTS (Continued)
|
|
at April 30, 2023 (Unaudited)
|
NOTE 11 – CONTROL OWNERSHIP
The beneficial ownership, either directly or indirectly, of more than 25% of the voting securities of a fund creates a presumption of control of the fund, under Section 2(a)(9) of
the 1940 Act. As of April 30, 2023, Charles Schwab & Co. Inc. held 63% of the outstanding shares of the Fund. The Fund has no knowledge as to whether all or any portion of the shares owned of record by Charles Schwab & Co. Inc. are also
beneficially owned.
NOTE 12 – CHANGE IN INDEPENDENT REGISTERED PUBLIC ACCOUNTING FIRM
Effective March 6, 2023, BBD LLP (“BBD”) ceased to serve as the independent registered public accounting firm of the Hardman Johnston International Growth Fund, a series of
Manager Directed Portfolios Trust. The Audit Committee of the Board of Directors approved the replacement of BBD as a result of Cohen & Company, Ltd.’s (“Cohen”) acquisition of BBD’s investment management group.
The report of BBD on the financial statements of the Hardman Johnston International Growth Fund as of and for the fiscal years ended 2021, 2022 and prior did not contain an
adverse opinion or a disclaimer of opinion, and were not qualified or modified as to uncertainties, audit scope or accounting principles. During the fiscal years ended 2021, 2022 and prior, as well as during the subsequent interim period through
February 18, 2023: (i) there were no disagreements between the registrant and BBD on any matter of accounting principles or practices, financial statement disclosure, or auditing scope or procedure, which disagreements, if not resolved to the
satisfaction of BBD, would have caused it to make reference to the subject matter of the disagreements in its report on the financial statements of the Hardman Johnston International Growth Fund for such years or interim period; and (ii) there were
no “reportable events,” as defined in Item 304(a)(1)(v) of Regulation S-K under the Securities Exchange Act of 1934, as amended.
The registrant requested that BBD furnish it with a letter addressed to the U.S. Securities and Exchange Commission stating that it agrees with the above statements.
On February 18, 2023, the Audit Committee of the Board of Directors also recommended and approved the appointment of Cohen as the Fund’s independent registered public accounting
firm for the fund’s October 31, 2023 fiscal year.
During the fiscal years ended October 31, 2021, October 31, 2022, and during the subsequent interim period through February 18, 2023, neither the registrant, nor anyone acting on
its behalf, consulted with Cohen on behalf of the Hardman Johnston International Growth Fund regarding the application of accounting principles to a specified transaction (either completed or proposed), the type of audit opinion that might be
rendered on the Hardman Johnston International Growth Fund’s financial statements, or any matter that was either: (i) the subject of a “disagreement,” as defined in Item 304(a)(1)(iv) of Regulation S-K and the instructions thereto; or (ii)
“reportable events,” as defined in Item 304(a)(1)(v) of Regulation S-K.
22
Hardman Johnston International Growth Fund
|
EXPENSE EXAMPLE
|
|
April 30, 2023 (Unaudited)
|
As a shareholder of the Fund, you incur two types of costs: (1) transaction costs including sales charges (loads) and redemption fees, if applicable; and (2) ongoing costs,
including management fees; distribution and/or service (12b-1 fees); and other Fund expenses. This Example is intended to help you understand your ongoing costs (in dollars) of investing in the Fund and to compare these costs with the ongoing costs
of investing in other mutual funds.
The Example is based on an investment of $1,000 invested at the beginning of the period indicated and held for the entire period from November 1, 2022, to April 30, 2023 for the
Institutional and Retail Shares.
Actual Expenses
The information in the table under the heading “Actual” provides information about actual account values and actual expenses. You may use the information in these columns together
with the amount you invested, to estimate the expenses that you paid over the period. Simply divide your account value by $1,000 (for example, an $8,600 account value divided by $1,000 = 8.6), then multiply the result by the number in the row
entitled “Expenses Paid During Period” to estimate the expenses you paid on your account during this period. There are some account fees that are charged to certain types of accounts, such as Individual Retirement Accounts (generally, a $15 fee is
charged to the account annually) that would increase the amount of expenses paid on your account. The example below does not include portfolio trading commissions and related expenses and other extraordinary expenses as determined under generally
accepted accounting principles.
Hypothetical Example for Comparison Purposes
The information in the table under the heading “Hypothetical (5% return before expenses)” provides information about hypothetical account values and hypothetical expenses based on
the Fund’s actual expense ratio and assumed rate of return of 5% per year before expenses, which is not the Fund’s actual return. The hypothetical account values and expenses may not be used to estimate the actual ending account balance or expenses
you paid for the period. You may use this information to compare the ongoing costs of investing in the Fund and other funds. To do so, compare this 5% hypothetical example with the 5% hypothetical examples that appear in the shareholder reports of
the other funds. As noted above, there are some account fees that are charged to certain types of accounts that would increase the amount of expense paid on your account.
Please note that the expenses shown in the table are meant to highlight your ongoing costs only and do not reflect any transaction costs, such as sales charges (loads), redemption
fees, or exchange fees. Therefore, the information under the heading “Hypothetical (5% return before expenses)” is useful in comparing ongoing costs only, and will not help you determine the relative total costs of owning different funds. In
addition, if these transactional costs were included, your costs would have been higher.
23
Hardman Johnston International Growth Fund
|
EXPENSE EXAMPLE (Continued)
|
|
April 30, 2023 (Unaudited)
|
|
Beginning
|
Ending
|
Expenses Paid
|
|
|
Account Value
|
Account Value
|
During Period(1)
|
|
|
11/1/22
|
4/30/23
|
11/1/22 – 4/30/23
|
|
|
Actual
|
|||
|
Institutional Shares
|
$1,000.00
|
$1,259.70
|
$5.60
|
|
Retail Shares
|
$1,000.00
|
$1,260.30
|
$7.01
|
|
Hypothetical (5% return
|
|||
|
before expenses)
|
|||
|
Institutional Shares
|
$1,000.00
|
$1,019.84
|
$5.01
|
|
Retail Shares
|
$1,000.00
|
$1,018.60
|
$6.26
|
|
(1)
|
Expenses are equal to the Institutional and Retail Shares’ annualized expense ratio of 1.00% and 1.25%, respectively, multiplied by the average account value over the period, multiplied by
181/365 (to reflect the period).
|
24
Hardman Johnston International Growth Fund
|
NOTICE TO SHAREHOLDERS
|
|
at April 30, 2023 (Unaudited)
|
How to Obtain a Copy of the Fund’s Proxy Voting Policies
A description of the policies and procedures that the Fund uses to determine how to vote proxies relating to portfolio securities is available without charge, upon request, by
calling 1-833-627-6668 or on the U.S. Securities and Exchange Commission’s (“SEC”) website at http://www.sec.gov.
How to Obtain a Copy of the Fund’s Proxy Voting Records for the most recent 12-Month Period Ended June 30
Information regarding how the Fund voted proxies relating to portfolio securities during the most recent 12-month period ended June 30 is available no later than August 31 without
charge, upon request, by 1-833-627-6668. Furthermore, you can obtain the Fund’s proxy voting records on the SEC’s website at http://www.sec.gov.
Quarterly Filings on Form N-PORT
The Fund files its complete schedule of portfolio holdings with the SEC for the first and third quarters of each fiscal year on Part F of Form N-PORT. The Fund’s Part F of Form
N-PORT is available on the SEC’s website at http://www.sec.gov. Information included in the Fund’s Part F of Form N-PORT is also available, upon request, by calling 1-833-627-6668.
Qualified Dividend Income/Dividends Received Deduction
For the fiscal year ended October 31, 2022 certain dividends paid by the Funds may be subject to a maximum tax rate of 15%, as provided for by the Jobs and Growth Tax Relief
Reconciliation Act of 2003. The percentage of dividends declared from ordinary income designated as qualified dividend income was as follows:
|
Hardman Johnston International Growth Fund
|
0.00%
|
For corporate shareholders, the percent of ordinary income distributions qualifying for the corporate dividends received deduction for the fiscal year ended October 31, 2022 was
as follows:
|
Hardman Johnston International Growth Fund
|
0.00%
|
25
Hardman Johnston International Growth Fund
|
STATEMENT REGARDING LIQUIDITY RISK MANAGEMENT PROGRAM
|
In accordance with Rule 22e-4 under the Investment Company Act of 1940, as amended, the Fund, a series of Manager Directed Portfolios (the “Trust”), has adopted and implemented a
liquidity risk management program tailored specifically to the Fund (the “Program”). The Program seeks to promote effective liquidity risk management for the Fund and to protect Fund shareholders from dilution of their interests. The Board has
designated the Fund’s investment adviser to serve as the administrator of the Program (the “Program Administrator”). Personnel of the Fund’s investment adviser conduct the day-to-day operation of the Program pursuant to policies and procedures
administered by the Program Administrator. The Program Administrator is required to provide a written annual report to the Board and the chief compliance officer of the Trust regarding the adequacy and effectiveness of the Program, and any material
changes to the Program.
Under the Program, the Program Administrator manages the Fund’s liquidity risk, which is the risk that the Fund could not meet shareholder redemption requests without significant
dilution of remaining shareholders’ interests in the Fund. The Program assesses liquidity risk under both normal and reasonably foreseeable stressed market conditions. This risk is managed by monitoring the degree of liquidity of the Fund’s
investments, limiting the amount of the Fund’s illiquid investments, and utilizing various risk management tools and facilities available to the Fund for meeting shareholder redemptions, among other means. The Program Administrator’s process of
determining the degree of liquidity of the Fund’s investments is supported by one or more third-party liquidity assessment vendors.
On November 18, 2022, the Board reviewed the Program Administrator’s assessment of the operation and effectiveness of the Program for the period July 1, 2021, through June 30,
2022 (the “Report”). The Report noted that there were no breaches of the Fund’s restriction on holding illiquid investments exceeding 15% of its net assets during the review period. The Report confirmed that the Fund’s investment strategy was
appropriate for an open-end management investment company. The Report also indicated that no material changes had been made to the Program during the review period. The Program Administrator determined that the Fund is reasonably likely to be able
to meet redemption requests without adversely affecting non-redeeming Fund shareholders through significant dilution. The Program Administrator concluded that the during the review period, the Program was adequately designed and effectively
operating to monitor the liquidity risk to the Fund, taking into account the size of the Fund, the type of business conducted, and other relevant factors.
26
Hardman Johnston International Growth Fund
|
APPROVAL OF INVESTMENT ADVISORY AGREEMENT AND
|
|
INVESTMENT SUB-ADVISORY AGREEMENT
|
|
(Unaudited)
|
The Board of Trustees (the “Board”) of Manager Directed Portfolios (the “Trust”) met on November 18, 2022 to consider the renewal of (i) the Investment Advisory Agreement (the
“Advisory Agreement”) between the Trust, on behalf of the Hardman Johnston International Growth Fund (the “Fund”), a series of the Trust, and the Fund’s investment adviser, Dakota Investments LLC (“Dakota”) and (ii) the Investment Sub-Advisory
Agreement (the “Sub-Advisory Agreement”) between Dakota and Hardman Johnston Global Advisors LLC (“Hardman Johnston”). The Trustees had previously met at a special meeting held on October 18, 2022 to discuss the renewal of the Advisory Agreement
and the Sub-Advisory Agreement. Prior to these meetings, the Trustees requested and received materials to assist them in considering the approval of the Advisory Agreement and the Sub-Advisory Agreement. The materials provided contained information
with respect to the factors enumerated below, including copies of the Advisory Agreement and the Sub-Advisory Agreement, a memorandum prepared by the Trust’s outside legal counsel discussing the Board’s fiduciary obligations and factors relevant to
the renewal of the Advisory Agreement and the Sub-Advisory Agreement, comparative information relating to the performance of the Fund against the Fund’s peer group and benchmark index, Dakota’s and Hardman Johnston’s Form ADV, due diligence
materials provided by Dakota and Hardman Johnston, including information regarding each firm’s compliance program, personnel and financial condition, profitability information, and other pertinent information. The Board also reviewed (i) the
advisory fee payable by the Fund under the Advisory Agreement; (ii) the sub-advisory fee payable by Dakota to Hardman Johnston; (iii) the expense limitation agreement between Dakota and the Trust, on behalf of the Fund; and (iv) comparative fee and
expense information as reported by Morningstar.
The Trustees met with the officers of the Trust and legal counsel to discuss the information provided and also met in executive session with legal counsel to the Independent
Trustees to review their duties in considering the Advisory Agreement and the Sub-Advisory Agreement and the information provided. The Trustees noted that they had met with representatives from Dakota and Hardman Johnston via video conference
earlier in the year to discuss Hardman Johnston’s investment strategy for the Fund, the Fund’s performance, and various business and market updates. The Board also took into account information routinely provided at quarterly meetings throughout
the year regarding the quality of services provided by Dakota and Hardman Johnston, the performance of the Fund, brokerage and trading, Fund expenses, asset flows, compliance issues and related matters.
Based on their evaluation of the information provided as part of the October and November meetings, as well as information provided over the course of the year, the Trustees, all
of whom are not “interested persons” of the Trust, as that term is defined in the Investment Company Act of 1940, as amended (the “Independent Trustees”), approved the continuation of the Advisory Agreement and the Sub-Advisory Agreement,
27
Hardman Johnston International Growth Fund
|
APPROVAL OF INVESTMENT ADVISORY AGREEMENT AND
|
|
INVESTMENT SUB-ADVISORY AGREEMENT (Continued)
|
|
(Unaudited)
|
each for an additional one-year term. Below is a summary of the material factors considered by the Board and the conclusions that formed the basis for the Board’s approval of the Advisory Agreement
and Sub-Advisory Agreement.
1. NATURE, EXTENT AND QUALITY OF SERVICES PROVIDED TO THE FUND
The Trustees considered the nature, extent and quality of services provided by Dakota and Hardman Johnston to the Fund. The Board considered the services provided by Dakota,
including sub-adviser evaluation and oversight, compliance services, shareholder servicing, and Fund marketing. The Trustees noted that Dakota shares ownership with Dakota Funds Group, a marketing firm, and has entered into a servicing agreement
with Dakota Funds Group for the marketing of the Fund. The Board also considered the services provided by Hardman Johnston, including investment and market research, security selection, compliance services and Fund marketing support, as well as
portfolio management, trading, and proxy voting services. The Board considered the Fund’s investment strategy and information regarding each firm’s risk management practices. The Trustees considered that Dakota and Hardman Johnston and their
respective personnel were responsible for the day-to-day management of the Fund, noting the qualifications, experience, and responsibilities of Cassandra Hardman, the Fund’s portfolio manager, and other key personnel at Dakota and Hardman Johnston
and their respective service providers involved in the day-to-day activities of the Fund. The Trustees also noted any services that extended beyond portfolio management, including Hardman Johnston’s brokerage practices. The Trustees considered
additional information provided by Dakota and Hardman Johnston in due diligence questionnaires, including information about each firm’s compliance program and the operation of each firm’s business continuity plan. The Trustees concluded that each
of Dakota and Hardman Johnston had sufficient quality and depth of personnel, resources, investment methods and compliance policies and procedures essential to performing its duties under the Advisory Agreement and the Sub-Advisory Agreement,
respectively, and that the nature, overall quality and extent of services provided to the Fund by each firm were satisfactory.
2. INVESTMENT PERFORMANCE OF THE FUND
The Trustees discussed the performance of the Fund for the year-to-date, one-year, three-year, and since inception periods ended June 30, 2022. In assessing the quality of the
investment supervisory and portfolio management services delivered by Dakota and Hardman Johnston, respectively, the Trustees considered the short-term and longer-term performance of the Fund on both an absolute basis and in comparison to the
Fund’s benchmark index, the MSCI All Country World ex-USA Net Index. The Trustees also compared the Fund’s performance to a peer group of foreign large growth funds (the “Morningstar Peer Group”).
The Trustees noted that the Fund underperformed the MSCI All Country World ex-USA Net Index for the year-to-date and one-year time periods and outperformed the
28
Hardman Johnston International Growth Fund
|
APPROVAL OF INVESTMENT ADVISORY AGREEMENT AND
|
|
INVESTMENT SUB-ADVISORY AGREEMENT (Continued)
|
|
(Unaudited)
|
MSCI All Country World ex-USA Net Index for the three-year and since inception time periods. The Trustees noted that the Fund underperformed the average return of its Morningstar Peer Group for the
one-year period and had outperformed the peer group for the three-year period. The Board considered Dakota’s and Hardman Johnston’s commentary regarding the investment environment and the market conditions that negatively impacted the Fund’s
performance for recent time periods. The Board considered that Dakota does not manage any accounts or composites of other separately managed accounts that are similar to the Fund in terms of investment strategy. The Trustees also considered the
Fund’s performance for the periods under Hardman Johnston’s management relative to Hardman Johnston’s International Equity composite, and noted the performance of the Fund was generally in line with the performance of the separately managed
accounts for the periods in which Hardman Johnston has served as sub-adviser to the Fund.
After considering all of the information, the Trustees concluded that the Fund and its shareholders were likely to benefit from Dakota’s and Hardman Johnston’s continued
management.
3. ADVISORY FEE, COSTS OF SERVICES PROVIDED AND PROFITS REALIZED BY THE ADVISER
The Trustees considered the cost of services provided by Dakota and Dakota’s advisory fee, including a review of comparative fee and expense information. The Trustees considered
the net expense ratio of the Fund relative to the Morningstar Peer Group average, as well as the fee waivers and expense reimbursements previously provided by Dakota. The Trustees also considered Dakota’s and Hardman Johnston’s financial statements
and a profitability analysis prepared by Dakota based on the fees payable under the Advisory Agreement.
The Trustees noted that the Fund’s contractual management fee of 1.00% was higher than the Morningstar Peer Group average. The Trustees further noted that the total net expense
ratio for the Institutional Shares and Retail Shares were higher than the Morningstar Peer Group average. The Board noted that, pursuant to a contractual operating expense limitation agreement between Dakota and the Fund, Dakota has agreed to waive
its management fees and/or reimburse Fund expenses to ensure that total annual fund operating expenses (excluding Rule 12b-1 plan fees, shareholder servicing plan fees and other excludable expenses) do not exceed 1.00% of the Fund’s average daily
net assets, through at least February 28, 2024, unless terminated sooner by, or with the consent of, the Board.
The Trustees concluded that the Fund’s expenses and the management fees paid to Dakota were fair and reasonable in light of the quality of services provided to the Fund. The
Trustees did not consider Dakota’s level of profitability from its relationship with the Fund to be a material factor because the Fund was not yet profitable to Dakota.
29
Hardman Johnston International Growth Fund
|
APPROVAL OF INVESTMENT ADVISORY AGREEMENT AND
|
|
INVESTMENT SUB-ADVISORY AGREEMENT (Continued)
|
|
(Unaudited)
|
The Trustees then considered the sub-advisory fee paid to Hardman Johnston by Dakota for the services provided as the Fund’s sub-adviser, including Dakota’s discussion of the
appropriateness of the sub-advisory fee. The Trustees concluded that the sub-advisory fee paid to Hardman Johnston by Dakota was reasonable. The Trustees also noted that the sub-advisory fee is paid by Dakota, not the Fund.
4. EXTENT OF ECONOMIES OF SCALE AS THE FUND GROWS
The Trustees considered the structure of the Fund’s management fee with respect to potential economies of scale. The Trustees noted that the Fund’s management fee structure did
not contain any breakpoint reductions as the Fund’s assets grow in size but considered that Dakota has been waiving fees or reimbursing expenses since the Fund’s inception and that Dakota pays all ordinary Fund expenses for Institutional Shares
other than its advisory fee. The Trustees concluded that the current fee structure was reasonable given the operating expense limitation agreement in place and the Fund’s current asset size.
Because the sub-advisory fees payable to Hardman Johnston is not paid by the Fund, the Trustees did not consider whether the sub-advisory fees should reflect any potential
economies of scale that might be realized as the Fund’s assets increase.
5. BENEFITS DERIVED FROM THE RELATIONSHIP WITH THE FUND
Based on the information presented, the Trustees did not consider any direct or indirect benefits that could be realized by Dakota from its association with the Fund to be
material factors. The Trustees concluded that the benefits Hardman Johnston may receive, such as soft dollar research, appear to be reasonable and may benefit the Fund.
CONCLUSION
No single factor was determinative of the Board’s decision to approve the continuation of the Advisory Agreement and the Sub-Advisory Agreement; rather, the Board based its
determination on the total mix of information available to it. Based on a consideration of the above factors in their totality, the Trustees, all of whom are Independent Trustees, approved the continuation of the Advisory Agreement and the
Sub-Advisory Agreement, each for an additional one-year term as being in the best interests of the Fund and its shareholders.
30
Hardman Johnston International Growth Fund
|
NOTICE OF PRIVACY POLICY & PRACTICES
|
Protecting the privacy of Fund shareholders is important to us. The following is a description of the practices and policies through which we protect the privacy and security of your non-public
personal information.
We collect non-public personal information about you from the following sources:
• information we receive about you on applications or other forms;
• information you give us orally; and
• information about your transactions with us or others.
The types of non-public personal information we collect and share can include:
• social security number;
• account balances;
• account transactions;
• transaction history;
• wire transfer instructions; and
• checking account information.
What Information We Disclose
We do not disclose any non-public personal information about our shareholders or former shareholders without the shareholder’s authorization, except as permitted by law or in response to inquiries
from governmental authorities. We may share information with affiliated parties and unaffiliated third parties with whom we have contracts for servicing the Fund. We will provide unaffiliated third parties with only the information necessary to
carry out their assigned responsibility.
How We Protect Your Information
All shareholder records will be disposed of in accordance with applicable law. We maintain physical, electronic and procedural safeguards to protect your non-public personal information and require
third parties to treat your non-public personal information with the same high degree of confidentiality.
In the event that you hold shares of the Fund through a financial intermediary, including, but not limited to, a broker-dealer, bank or trust company, the privacy policy of your financial intermediary
would govern how your non-public personal information would be shared with unaffiliated third parties.
If you have any questions or concerns regarding this notice or our Privacy Policy, please contact us at 1-888-893-4491.
31
Investment Advisor
Dakota Investments LLC
925 West Lancaster Avenue, Suite 220
Bryn Mawr, PA 19010
Investment Sub-Advisor
Hardman Johnston Global Advisors LLC
300 Atlantic Street, Suite 601
Stamford, CT 06901
Distributor
Vigilant Distributors, LLC
Gateway Corporate Center, Suite 216
223 Wilmington West Chester Pike
Chadds Ford, PA 19317
Transfer Agent
U.S. Bancorp Fund Services, LLC
615 East Michigan Street
Milwaukee, WI 53202
(833) 627-6668
Custodian
U.S. Bank National Association
Custody Operations
1555 North River Center Drive, Suite 302
Milwaukee, WI 53212
Independent Registered Public Accounting Firm
Cohen & Company, Ltd.
1835 Market Street, Suite 310
Philadelphia, PA 19103
Legal Counsel
Godfrey & Kahn S.C.
833 East Michigan Street, Suite 1800
Milwaukee, WI 53202
This report is intended for shareholders of the Fund and may not be used as sales literature unless preceded or accompanied by a current prospectus.
Past performance results shown in this report should not be considered a representation of future performance. Share price and returns will fluctuate so that shares, when redeemed, may be worth more
or less than their original cost. Statements and other information herein are dated and are subject to change.
|
(b)
|
Not Applicable.
|
Item 2. Code of Ethics.
Not applicable for semi-annual reports.
Item 3. Audit Committee Financial Experts.
Not applicable for semi-annual reports.
Item 4. Principal Accountant Fees and Services.
Not applicable for semi-annual reports.
Item 5. Audit Committee of Listed Registrants.
(a) Not applicable to registrants who are not listed issuers (as defined in Rule 10A-3 under the Securities Exchange Act of 1934).
(b) Not Applicable.
Item 6. Investments.
|
(a)
|
Schedule of Investments is included as part of the report to shareholders filed under Item 1 of this Form.
|
|
(b)
|
Not Applicable.
|
Item 7. Disclosure of Proxy Voting Policies and Procedures for Closed-End Management Investment Companies.
Not applicable to open-end investment companies.
Item 8. Portfolio Managers of Closed-End Management Investment Companies.
Not applicable to open-end investment companies.
Item 9. Purchases of Equity Securities by Closed‑End Management Investment Company and Affiliated Purchasers.
Not applicable to open-end investment companies.
Item 10. Submission of Matters to a Vote of Security Holders.
There have been no material changes to the procedures by which shareholders may recommend nominees to the Registrant’s Board of Trustees.
Item 11. Controls and Procedures.
|
(a)
|
The Registrant’s President/Principal Executive Officer and Treasurer/Principal Financial Officer have reviewed the Registrant's disclosure controls and procedures (as defined in Rule 30a-3(c) under the Investment Company Act of 1940
(the “Act”)) as of a date within 90 days of the filing of this report, as required by Rule 30a-3(b) under the Act and Rules 13a-15(b) or 15d-15(b) under the Securities Exchange Act of 1934. Based on their review, such officers have
concluded that the disclosure controls and procedures are effective in ensuring that information required to be disclosed in this report is appropriately recorded, processed, summarized, and reported and made known to them by others
within the Registrant and by the Registrant’s service provider.
|
|
(b)
|
There were no changes in the Registrant's internal control over financial reporting (as defined in Rule 30a-3(d) under the Act) that occurred during the second fiscal quarter of the period covered by this report that has materially
affected, or is reasonably likely to materially affect, the Registrant's internal control over financial reporting.
|
Item 12. Disclosure of Securities Lending Activities for Closed-End Management Investment Companies.
Not applicable to open-end investment companies.
Item 13. Exhibits.
|
(a)
|
(1) Any code of ethics or amendment thereto, that is subject to the disclosure required by Item 2, to the extent that the registrant intends to satisfy Item 2 requirements through filing an exhibit.
Not applicable.
|
(3) Any written solicitation to purchase securities under Rule 23c‑1 under the Act sent or given during the period covered by the report by or on behalf of the registrant to 10 or
more persons. Not applicable to open-end investment companies.
SIGNATURES
Pursuant to the requirements of the Securities Exchange Act of 1934 and the Investment Company Act of 1940, as amended, the registrant has duly caused this report to be signed on its behalf by the undersigned,
thereunto duly authorized.
(Registrant) Manager Directed Portfolios
By (Signature and Title)* /s/Scott M. Ostrowski
Scott M. Ostrowski, President/
Principal Executive Officer
Date 07/03/2023
Pursuant to the requirements of the Securities Exchange Act of 1934 and the Investment Company Act of 1940, as amended, this report has been signed below by the following persons on behalf of the registrant and in
the capacities and on the dates indicated.
By (Signature and Title)* /s/Scott M. Ostrowski
Scott M. Ostrowski, President/
Principal Executive Officer
Date 07/03/2023
By (Signature and Title)* /s/Ryan Frank
Ryan Frank,
Treasurer/Principal Financial Officer
Date 07/03/2023
* Print the name and title of each signing officer under his or her signature.
