UNITED STATES
SECURITIES AND EXCHANGE COMMISSION
Washington, D.C. 20549
SECURITIES AND EXCHANGE COMMISSION
Washington, D.C. 20549
FORM N-CSR
CERTIFIED SHAREHOLDER REPORT OF REGISTERED
MANAGEMENT INVESTMENT COMPANIES
Investment Company Act file number 811-21897
Manager Directed Portfolios
(Exact name of registrant as specified in charter)
(Exact name of registrant as specified in charter)
615 East Michigan Street
Milwaukee, WI 53202
(Address of principal executive offices) (Zip code)
(Address of principal executive offices) (Zip code)
Douglas J. Neilson, President
Manager Directed Portfolios
c/o U.S. Bancorp Fund Services, LLC
777 East Wisconsin Avenue, 5th Floor
Milwaukee, WI 53202
(Name and address of agent for service)
(Name and address of agent for service)
(414) 287-3101
Registrant's telephone number, including area code
Date of fiscal year end: March 31, 2017
Date of reporting period: March 31, 2017
Item 1. Reports to Stockholders.
Pemberwick Fund
Annual Report
March 31, 2017
Pemberwick Fund
Table of Contents
|
Letter to Shareholders/Commentary
|
3
|
|
Sector Allocation of Portfolio Assets
|
6
|
|
Schedule of Investments
|
7
|
|
Statement of Assets and Liabilities
|
23
|
|
Statements of Operations
|
24
|
|
Statements of Changes in Net Assets
|
25
|
|
Financial Highlights
|
26
|
|
Notes to the Financial Statements
|
27
|
|
Report of Independent Registered Public Accounting Firm
|
37
|
|
Expense Example
|
38
|
|
Notice to Shareholders
|
40
|
|
Trustees and Officers
|
41
|
|
Approval of the Pemberwick Fund’s Investment Advisory Agreement
|
|
|
and Sub-Advisory Agreement
|
43
|
|
Privacy Notice
|
46
|
Pemberwick Fund
We are pleased to present the Pemberwick Fund annual report covering the period from May 1, 2016 through March 31, 2017. Portfolio performance information, market commentary and our outlook for the period ended March 31, 2017 follows. We encourage you to carefully review the enclosed information to stay informed.
PORTFOLIO PERFORMANCE AND MARKET REVIEW:
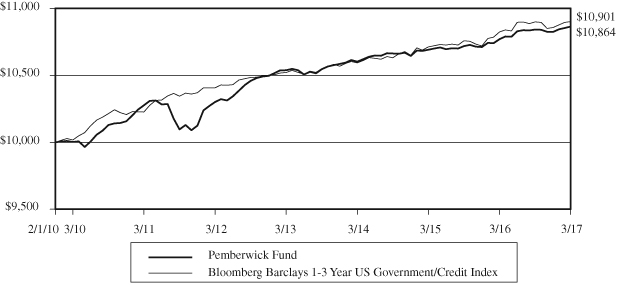
For the eleven months ended March 31, 2017 Pemberwick Fund (“Pemberwick”) generated a periodic total investment return of 0.68%, net of expenses. The Portfolio’s primary benchmark, the Bloomberg Barclays 1-3 Year US Government/Credit Index returned 0.57% during the same period. Since its inception on February 1, 2010 Pemberwick has generated a return net of expenses of 1.16% vs. Pemberwick’s benchmark return of 1.21% for the same period. Pemberwick’s annualized performance for the 1 year and 5 year return were 0.87% and 1.07%, respectively, vs. Pemberwick’s benchmark return of 0.71% and 0.93%, respectively. The benchmark index does not reflect any expenses or transaction costs. Pemberwick generated a return before expenses but after transaction costs of 1.24% for the eleven months ended March 31, 2017 and 1.56% since inception.
Performance data quoted represents past performance; past performance does not guarantee future results. The investment return and principal value of an investment will change so that an investor’s shares, when redeemed, may be worth more or less than their original cost. Current performance of the fund may be lower or higher than the performance quoted. Performance data current to the most recent month end may be obtained by calling 1-888-893-4491. The gross expense ratio of the fund is 0.45%.
During the eleven months ended March 31, 2017, Pemberwick continued its strategy of building a portfolio of investment grade bonds with laddered maturities, therefore generating favorable returns without taking on significant duration or interest rate risk. In addition, Pemberwick has continued to concentrate its investments in investment grade floating and fixed rate bonds issued by financial institutions with assets greater than $200 billion and securities issued by the US Treasury and Agencies. Current yields on bonds issued by said financial institutions, which made up approximately 83% of the Pemberwick portfolio as of March 31, 2017, have been relatively flat year over year. In addition, short term yields in general remained at historically low levels as of March 31, 2017. We are pleased with Pemberwick’s performance given these circumstances.
PORTFOLIO POSITIONING:
Pemberwick Fund continues to be invested primarily in investment grade fixed and floating rate securities issued by financial institutions with assets greater than $200 billion and securities issued by the US Treasury and Agencies. In addition, Pemberwick currently has approximately 3% of its assets invested in short-term securities with maturities of approximately 30 days. Pemberwick’s net assets have increased by approximately 4% during the eleven months ended March 31, 2017: net assets have increased from approximately $177.8 million as of April 30, 2016 to approximately $184.1 million as of March 31, 2017.
3
Pemberwick Fund
This letter is intended to assist shareholders in understanding how the Fund performed during the eleven months ended March 31, 2017 and reflects the views of the investment advisor at the time of this writing. Of course, these views may change and do not guarantee the future performance of the Fund or the markets. Portfolio composition is subject to change. The current and future portfolio holdings of the Fund are subject to investment risk.
Pemberwick Investment Advisors LLC
Must be preceded or accompanied by a prospectus.
The Pemberwick Fund is distributed by Quasar Distributors, LLC.
Mutual fund investing involves risk. Principal loss is possible. Fixed-income securities are or may be subject to interest rate, credit, liquidity, prepayment and extension risks. By concentrating its assets in the banking industry, the Fund is subject to the risk that economic, business, political or other conditions that have a negative effect on the banking industry will negatively impact the Fund to a greater extent than if the Fund’s assets were diversified across different industries or sectors. The municipal market is volatile and can be significantly affected by adverse tax, legislative or political changes and the financial condition of the issuers of municipal securities.
The Bloomberg Barclays 1-3 Year US Government/Credit Index is an unmanaged market index and should not be considered indicative of any Pemberwick investment. It is not possible to invest directly in an index.
Duration is a measure of the sensitivity of the price of a fixed-income investment to a change in interest rates.
Pemberwick Fund changed its fiscal year from April 30 to March 31.
4
Pemberwick Fund
Comparison of the Change in Value of a Hypothetical $10,000 Investment
in the Pemberwick Fund and
Bloomberg Barclays 1-3 Year US Government/Credit Index
(Unaudited)
|
Eleven
|
Annualized
|
||||
|
Total Return Periods
|
Months Ended
|
Since Inception
|
|||
|
Ended March 31, 2017*:
|
3/31/2017
|
1 Year
|
3 Year
|
5 Year
|
(2/1/2010)
|
|
Pemberwick Fund (No Load)
|
0.68%
|
0.87%
|
0.82%
|
1.07%
|
1.16%
|
|
Bloomberg Barclays 1-3 Year
|
|||||
|
US Government/Credit Index
|
0.57%
|
0.71%
|
0.96%
|
0.93%
|
1.21%
|
Total Annual Fund Operating Expenses: 0.45%
Performance data quoted represents past performance; past performance does not guarantee future results. The investment return and principal value of an investment will fluctuate so that an investor’s shares, when redeemed, may be worth more or less than their original cost. Current performance of the Fund may be lower or higher than the performance quoted. Performance data current to the most recent month end may be obtained by calling 1-888-893-4491.
This chart illustrates the performance of a hypothetical $10,000 investment made in the Fund on February 1, 2010, the Fund’s inception date. Returns reflect the reinvestment of dividends and capital gain distributions. The performance data shown reflects a voluntary waiver made by the Adviser. In the absence of fee waivers, returns would be reduced. The performance data and graph do not reflect the deduction of taxes that a shareholder may pay on dividends, capital gain distributions, or redemption of Fund shares.
The Bloomberg Barclays 1-3 Year US Government/Credit Index is an unmanaged market index and should not be considered indicative of any Pemberwick investment. One cannot invest directly in an index.
* Periods greater than one year are average annual returns.
5
Pemberwick Fund
|
SECTOR ALLOCATION OF PORTFOLIO ASSETS
|
|
at March 31, 2017 (Unaudited)
|
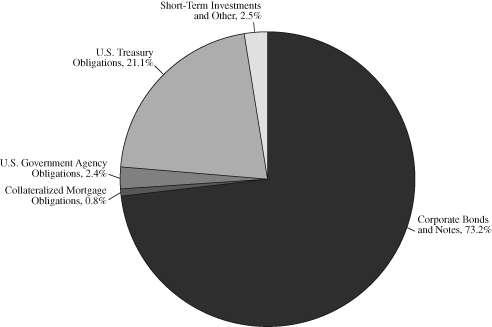
Percentages represent market value as a percentage of net assets.
6
Pemberwick Fund
|
SCHEDULE OF INVESTMENTS
|
|
at March 31, 2017
|
|
Par
|
||||||||
|
CORPORATE BONDS AND NOTES – 73.2%
|
Value
|
Value
|
||||||
|
Basic Materials – 0.0%
|
||||||||
|
Praxair, Inc.
|
||||||||
|
1.050%, 11/07/2017
|
$
|
15,000
|
$
|
14,978
|
||||
|
1.250%, 11/07/2018
|
30,000
|
29,887
|
||||||
|
44,865
|
||||||||
|
Communications – 3.4%
|
||||||||
|
AT&T, Inc.
|
||||||||
|
1.400%, 12/01/2017
|
15,000
|
14,990
|
||||||
|
1.962%, 11/27/2018 (a)
|
2,000,000
|
2,018,762
|
||||||
|
Cisco Systems, Inc.
|
||||||||
|
4.950%, 02/15/2019
|
25,000
|
26,545
|
||||||
|
2.125%, 03/01/2019
|
105,000
|
106,117
|
||||||
|
eBay, Inc.
|
||||||||
|
1.350%, 07/15/2017
|
50,000
|
49,981
|
||||||
|
The Walt Disney Co.
|
||||||||
|
0.875%, 05/30/2017
|
17,000
|
16,996
|
||||||
|
5.875%, 12/15/2017
|
30,000
|
30,923
|
||||||
|
1.650%, 01/08/2019
|
17,000
|
17,037
|
||||||
|
1.364%, 05/30/2019 (a)
|
1,000,000
|
1,005,254
|
||||||
|
Verizon Communications, Inc.
|
||||||||
|
1.918%, 06/17/2019 (a)
|
3,000,000
|
3,022,398
|
||||||
|
6,309,003
|
||||||||
|
Consumer, Cyclical – 2.1%
|
||||||||
|
American Honda Finance Corp.
|
||||||||
|
1.875%, 02/22/2019 (a)
|
500,000
|
506,792
|
||||||
|
Daimler Finance North America LLC
|
||||||||
|
1.375%, 08/01/2017
|
||||||||
|
(Acquired 07/24/2014, Cost $999,165) (b)(e)
|
1,000,000
|
999,939
|
||||||
|
McDonald’s Corp.
|
||||||||
|
5.350%, 03/01/2018
|
10,000
|
10,343
|
||||||
|
PACCAR Financial Corp.
|
||||||||
|
1.400%, 11/17/2017
|
30,000
|
30,009
|
||||||
|
1.300%, 05/10/2019
|
12,000
|
11,902
|
||||||
|
The Home Depot, Inc.
|
||||||||
|
2.000%, 06/15/2019
|
30,000
|
30,239
|
||||||
The accompanying notes are an integral part of these financial statements.
7
Pemberwick Fund
|
SCHEDULE OF INVESTMENTS (Continued)
|
|
at March 31, 2017
|
|
Par
|
||||||||
|
Value
|
Value
|
|||||||
|
Consumer, Cyclical – 2.1% (Continued)
|
||||||||
|
Toyota Motor Credit Corp.
|
||||||||
|
1.375%, 01/10/2018
|
$
|
30,000
|
$
|
29,999
|
||||
|
2.000%, 10/24/2018
|
25,000
|
25,128
|
||||||
|
2.100%, 01/17/2019
|
68,000
|
68,592
|
||||||
|
2.125%, 07/18/2019
|
40,000
|
40,296
|
||||||
|
VF Corp.
|
||||||||
|
5.950%, 11/01/2017
|
35,000
|
35,904
|
||||||
|
Volkswagen International Finance NV
|
||||||||
|
1.600%, 11/20/2017 (Acquired 02/23/2015,
|
||||||||
|
Cost $2,002,446) (b)(e)(f)
|
2,000,000
|
1,998,476
|
||||||
|
Wal-Mart Stores, Inc.
|
||||||||
|
1.000%, 04/21/2017
|
30,000
|
29,995
|
||||||
|
1.125%, 04/11/2018
|
40,000
|
39,934
|
||||||
|
3,857,548
|
||||||||
|
Consumer, Non-cyclical – 4.3%
|
||||||||
|
AbbVie, Inc.
|
||||||||
|
1.800%, 05/14/2018
|
2,000,000
|
2,002,708
|
||||||
|
Amgen, Inc.
|
||||||||
|
1.250%, 05/22/2017
|
1,000,000
|
999,997
|
||||||
|
AstraZeneca PLC
|
||||||||
|
5.900%, 09/15/2017 (f)
|
2,000,000
|
2,039,076
|
||||||
|
Danaher Corp.
|
||||||||
|
2.400%, 09/15/2020
|
25,000
|
25,271
|
||||||
|
Diageo Capital PLC
|
||||||||
|
5.750%, 10/23/2017 (f)
|
2,000,000
|
2,046,828
|
||||||
|
GlaxoSmithKline Capital PLC
|
||||||||
|
1.500%, 05/08/2017 (f)
|
15,000
|
15,005
|
||||||
|
GlaxoSmithKline Capital, Inc.
|
||||||||
|
5.650%, 05/15/2018
|
15,000
|
15,695
|
||||||
|
Johnson & Johnson
|
||||||||
|
1.125%, 03/01/2019
|
30,000
|
29,872
|
||||||
|
2.250%, 03/03/2022
|
60,000
|
60,088
|
||||||
|
Merck & Co., Inc.
|
||||||||
|
1.100%, 01/31/2018
|
488,000
|
487,067
|
||||||
|
1.850%, 02/10/2020
|
14,000
|
14,033
|
||||||
The accompanying notes are an integral part of these financial statements.
8
Pemberwick Fund
|
SCHEDULE OF INVESTMENTS (Continued)
|
|
at March 31, 2017
|
|
Par
|
||||||||
|
Value
|
Value
|
|||||||
|
Consumer, Non-cyclical – 4.3% (Continued)
|
||||||||
|
PepsiCo, Inc.
|
||||||||
|
1.000%, 10/13/2017
|
$
|
30,000
|
$
|
29,960
|
||||
|
1.500%, 02/22/2019
|
15,000
|
15,004
|
||||||
|
2.150%, 10/14/2020
|
60,000
|
60,365
|
||||||
|
The Coca-Cola Co.
|
||||||||
|
1.650%, 03/14/2018
|
30,000
|
30,084
|
||||||
|
1.375%, 05/30/2019
|
20,000
|
19,915
|
||||||
|
The Procter & Gamble Co.
|
||||||||
|
1.700%, 11/03/2021
|
60,000
|
58,919
|
||||||
|
7,949,887
|
||||||||
|
Energy – 2.1%
|
||||||||
|
BP Capital Markets PLC
|
||||||||
|
1.846%, 05/05/2017 (f)
|
3,150,000
|
3,151,572
|
||||||
|
Chevron Corp.
|
||||||||
|
1.104%, 12/05/2017
|
15,000
|
14,976
|
||||||
|
1.365%, 03/02/2018
|
90,000
|
89,961
|
||||||
|
1.718%, 06/24/2018
|
35,000
|
35,119
|
||||||
|
1.790%, 11/16/2018
|
50,000
|
50,153
|
||||||
|
4.950%, 03/03/2019
|
20,000
|
21,218
|
||||||
|
ConocoPhillips Co.
|
||||||||
|
6.650%, 07/15/2018
|
25,000
|
26,573
|
||||||
|
6.000%, 01/15/2020
|
20,000
|
22,134
|
||||||
|
ConocoPhillips Co.
|
||||||||
|
1.500%, 05/15/2018
|
30,000
|
29,948
|
||||||
|
EOG Resources, Inc.
|
||||||||
|
5.625%, 06/01/2019
|
15,000
|
16,125
|
||||||
|
Exxon Mobil Corp
|
||||||||
|
1.305%, 03/06/2018
|
50,000
|
49,967
|
||||||
|
1.819%, 03/15/2019
|
100,000
|
100,569
|
||||||
|
Occidental Petroleum Corp.
|
||||||||
|
1.500%, 02/15/2018
|
60,000
|
59,988
|
||||||
|
Phillips 66
|
||||||||
|
2.950%, 05/01/2017
|
25,000
|
25,029
|
||||||
The accompanying notes are an integral part of these financial statements.
9
Pemberwick Fund
|
SCHEDULE OF INVESTMENTS (Continued)
|
|
at March 31, 2017
|
|
Par
|
||||||||
|
Value
|
Value
|
|||||||
|
Energy – 2.1% (Continued)
|
||||||||
|
Statoil ASA
|
||||||||
|
1.250%, 11/09/2017 (f)
|
$
|
30,000
|
$
|
29,966
|
||||
|
6.700%, 01/15/2018 (f)
|
10,000
|
10,396
|
||||||
|
1.950%, 11/08/2018 (f)
|
10,000
|
10,041
|
||||||
|
5.250%, 04/15/2019 (f)
|
15,000
|
15,992
|
||||||
|
3,759,727
|
||||||||
|
Financial – 54.9%
|
||||||||
|
American Express Bank FSB
|
||||||||
|
1.181%, 06/12/2017 (a)
|
405,000
|
405,114
|
||||||
|
6.000%, 09/13/2017
|
950,000
|
968,939
|
||||||
|
American Express Credit Corp.
|
||||||||
|
1.125%, 06/05/2017
|
2,025,000
|
2,025,130
|
||||||
|
1.814%, 11/05/2018 (a)
|
500,000
|
503,787
|
||||||
|
1.529%, 08/15/2019 (a)
|
3,118,000
|
3,128,604
|
||||||
|
2.250%, 08/15/2019
|
95,000
|
95,773
|
||||||
|
1.609%, 10/30/2019 (a)
|
1,000,000
|
1,002,530
|
||||||
|
Bank of America Corp.
|
||||||||
|
1.700%, 08/25/2017
|
1,055,000
|
1,056,999
|
||||||
|
6.400%, 08/28/2017
|
50,000
|
50,976
|
||||||
|
5.750%, 12/01/2017
|
1,625,000
|
1,668,149
|
||||||
|
2.600%, 01/15/2019
|
2,000,000
|
2,021,554
|
||||||
|
2.650%, 04/01/2019
|
60,000
|
60,720
|
||||||
|
2.445%, 04/19/2021 (a)
|
3,500,000
|
3,607,366
|
||||||
|
2.221%, 10/21/2022 (a)
|
500,000
|
508,236
|
||||||
|
BB&T Corp.
|
||||||||
|
1.802%, 04/01/2022 (a)
|
1,600,000
|
1,602,131
|
||||||
|
Berkshire Hathaway Finance Corp.
|
||||||||
|
1.300%, 05/15/2018
|
8,000
|
7,998
|
||||||
|
5.400%, 05/15/2018
|
60,000
|
62,665
|
||||||
|
Berkshire Hathaway, Inc.
|
||||||||
|
1.550%, 02/09/2018
|
100,000
|
100,081
|
||||||
|
BlackRock, Inc.
|
||||||||
|
5.000%, 12/10/2019
|
75,000
|
81,222
|
||||||
|
Boston Properties LP
|
||||||||
|
3.700%, 11/15/2018
|
15,000
|
15,378
|
||||||
The accompanying notes are an integral part of these financial statements.
10
Pemberwick Fund
|
SCHEDULE OF INVESTMENTS (Continued)
|
|
at March 31, 2017
|
|
Par
|
||||||||
|
Value
|
Value
|
|||||||
|
Financial – 54.9% (Continued)
|
||||||||
|
Capital One Bank USA, N.A.
|
||||||||
|
2.150%, 11/21/2018
|
$
|
1,000,000
|
$
|
1,002,146
|
||||
|
Capital One Financial Corp.
|
||||||||
|
2.056%, 03/09/2022 (a)
|
3,000,000
|
3,003,630
|
||||||
|
Capital One, N.A.
|
||||||||
|
1.500%, 03/22/2018
|
1,000,000
|
997,858
|
||||||
|
2.192%, 08/17/2018 (a)
|
500,000
|
504,991
|
||||||
|
2.400%, 09/05/2019
|
515,000
|
516,862
|
||||||
|
2.189%, 01/30/2023 (a)
|
3,000,000
|
3,016,038
|
||||||
|
Citigroup, Inc.
|
||||||||
|
2.500%, 09/26/2018
|
3,000,000
|
3,027,729
|
||||||
|
2.532%, 03/30/2021 (a)
|
550,000
|
563,476
|
||||||
|
2.225%, 08/02/2021 (a)
|
570,000
|
579,226
|
||||||
|
2.176%, 12/08/2021 (a)
|
5,000,000
|
5,048,040
|
||||||
|
Credit Suisse AG
|
||||||||
|
1.542%, 05/26/2017 (a)(f)
|
1,000,000
|
1,000,671
|
||||||
|
1.729%, 01/29/2018 (a)(f)
|
3,900,000
|
3,916,091
|
||||||
|
1.750%, 01/29/2018 (f)
|
1,000,000
|
1,000,876
|
||||||
|
1.700%, 04/27/2018 (f)
|
1,000,000
|
998,792
|
||||||
|
1.717%, 04/27/2018 (a)(f)
|
1,000,000
|
1,000,935
|
||||||
|
Deutsche Bank AG
|
||||||||
|
6.000%, 09/01/2017 (f)
|
709,000
|
721,417
|
||||||
|
HSBC USA, Inc.
|
||||||||
|
1.500%, 11/13/2017
|
2,000,000
|
2,000,380
|
||||||
|
1.700%, 03/05/2018
|
1,000,000
|
1,000,646
|
||||||
|
1.804%, 08/07/2018 (a)
|
1,000,000
|
1,003,745
|
||||||
|
JPMorgan Chase & Co.
|
||||||||
|
1.588%, 04/25/2018 (a)
|
830,000
|
833,562
|
||||||
|
Morgan Stanley
|
||||||||
|
6.250%, 08/28/2017
|
4,000,000
|
4,077,044
|
||||||
|
2.318%, 04/25/2018 (a)
|
2,725,000
|
2,753,697
|
||||||
|
1.781%, 07/23/2019 (a)
|
1,000,000
|
1,005,866
|
||||||
|
1.842%, 02/14/2020 (a)
|
300,000
|
300,735
|
||||||
|
2.210%, 01/20/2022 (a)
|
400,000
|
404,142
|
||||||
|
National City Bank
|
||||||||
|
1.472%, 06/07/2017 (a)
|
2,075,000
|
2,075,089
|
||||||
The accompanying notes are an integral part of these financial statements.
11
Pemberwick Fund
|
SCHEDULE OF INVESTMENTS (Continued)
|
|
at March 31, 2017
|
|
Par
|
||||||||
|
Value
|
Value
|
|||||||
|
Financial – 54.9% (Continued)
|
||||||||
|
National Rural Utilities Cooperative Finance Corp.
|
||||||||
|
5.450%, 02/01/2018
|
$
|
50,000
|
$
|
51,615
|
||||
|
Novartis Capital Corp.
|
||||||||
|
1.800%, 02/14/2020
|
70,000
|
70,090
|
||||||
|
PNC Bank, N.A.
|
||||||||
|
4.875%, 09/21/2017
|
2,500,000
|
2,536,423
|
||||||
|
State Street Corp.
|
||||||||
|
5.375%, 04/30/2017
|
15,000
|
15,042
|
||||||
|
1.350%, 05/15/2018
|
92,000
|
91,812
|
||||||
|
1.950%, 05/19/2021
|
25,000
|
24,576
|
||||||
|
SunTrust Banks, Inc.
|
||||||||
|
2.350%, 11/01/2018
|
1,456,000
|
1,465,816
|
||||||
|
The Bank of New York Mellon Corp.
|
||||||||
|
2.200%, 03/04/2019
|
59,000
|
59,486
|
||||||
|
4.600%, 01/15/2020
|
30,000
|
32,030
|
||||||
|
2.450%, 11/27/2020
|
35,000
|
35,210
|
||||||
|
The Bank of Nova Scotia
|
||||||||
|
1.300%, 07/21/2017 (f)
|
325,000
|
325,111
|
||||||
|
1.450%, 04/25/2018 (f)
|
2,000,000
|
1,997,012
|
||||||
|
1.853%, 01/15/2019 (a)(f)
|
1,000,000
|
1,009,371
|
||||||
|
1.742%, 03/07/2022 (a)(f)
|
5,900,000
|
5,904,814
|
||||||
|
The Charles Schwab Corp.
|
||||||||
|
2.200%, 07/25/2018
|
40,000
|
40,258
|
||||||
|
The Chubb Corp.
|
||||||||
|
5.750%, 05/15/2018
|
35,000
|
36,625
|
||||||
|
The Goldman Sachs Group, Inc.
|
||||||||
|
6.250%, 09/01/2017
|
950,000
|
968,385
|
||||||
|
6.150%, 04/01/2018
|
30,000
|
31,260
|
||||||
|
7.500%, 02/15/2019
|
2,130,000
|
2,338,446
|
||||||
|
2.300%, 12/13/2019
|
2,000,000
|
2,002,268
|
||||||
|
2.398%, 04/23/2021 (a)
|
1,000,000
|
1,022,568
|
||||||
|
2.209%, 11/15/2021 (a)
|
2,000,000
|
2,023,978
|
||||||
|
2.142%, 04/26/2022 (a)
|
1,141,000
|
1,151,103
|
||||||
|
The Travelers Companies, Inc.
|
||||||||
|
3.900%, 11/01/2020
|
50,000
|
52,963
|
||||||
The accompanying notes are an integral part of these financial statements.
12
Pemberwick Fund
|
SCHEDULE OF INVESTMENTS (Continued)
|
|
at March 31, 2017
|
|
Par
|
||||||||
|
Value
|
Value
|
|||||||
|
Financial – 54.9% (Continued)
|
||||||||
|
UBS AG
|
||||||||
|
1.375%, 08/14/2017 (f)
|
$
|
2,000,000
|
$
|
2,000,666
|
||||
|
1.853%, 03/26/2018 (a)(f)
|
2,750,000
|
2,761,459
|
||||||
|
U.S. Bancorp
|
||||||||
|
2.200%, 04/25/2019 (g)
|
75,000
|
75,615
|
||||||
|
U.S. Bank, N.A.
|
||||||||
|
1.350%, 01/26/2018 (g)
|
2,368,000
|
2,365,409
|
||||||
|
Wachovia Corp.
|
||||||||
|
5.750%, 02/01/2018
|
440,000
|
453,886
|
||||||
|
Wells Fargo & Co.
|
||||||||
|
5.625%, 12/11/2017
|
50,000
|
51,374
|
||||||
|
1.671%, 04/23/2018 (a)
|
127,000
|
127,614
|
||||||
|
1.719%, 01/30/2020 (a)
|
2,000,000
|
2,009,276
|
||||||
|
2.150%, 01/30/2020
|
200,000
|
200,482
|
||||||
|
1.921%, 07/22/2020 (a)
|
1,626,000
|
1,641,149
|
||||||
|
2.600%, 07/22/2020
|
90,000
|
90,921
|
||||||
|
2.440%, 03/04/2021 (a)
|
2,500,000
|
2,565,053
|
||||||
|
4.600%, 04/01/2021
|
60,000
|
64,534
|
||||||
|
2.100%, 07/26/2021
|
50,000
|
49,039
|
||||||
|
Wells Fargo Bank, N.A.
|
||||||||
|
1.781%, 01/22/2018 (a)
|
2,000,000
|
2,010,424
|
||||||
|
101,080,199
|
||||||||
|
Industrial – 3.4%
|
||||||||
|
Caterpillar Financial Services Corp.
|
||||||||
|
1.500%, 02/23/2018
|
20,000
|
19,974
|
||||||
|
1.800%, 11/13/2018
|
25,000
|
25,055
|
||||||
|
2.100%, 06/09/2019
|
15,000
|
15,071
|
||||||
|
2.250%, 12/01/2019
|
20,000
|
20,161
|
||||||
|
Emerson Electric Co.
|
||||||||
|
4.875%, 10/15/2019
|
45,000
|
48,446
|
||||||
|
General Dynamics Corp.
|
||||||||
|
1.000%, 11/15/2017
|
2,030,000
|
2,026,535
|
||||||
The accompanying notes are an integral part of these financial statements.
13
Pemberwick Fund
|
SCHEDULE OF INVESTMENTS (Continued)
|
|
at March 31, 2017
|
|
Par
|
||||||||
|
Value
|
Value
|
|||||||
|
Industrial – 3.4% (Continued)
|
||||||||
|
General Electric Co.
|
||||||||
|
5.625%, 05/01/2018
|
$
|
80,000
|
$
|
83,653
|
||||
|
6.000%, 08/07/2019
|
50,000
|
54,935
|
||||||
|
5.500%, 01/08/2020
|
20,000
|
21,926
|
||||||
|
4.000%, 12/29/2049, Callable 06/15/2022 at $100 (a)(b)
|
1,234,000
|
1,213,947
|
||||||
|
Illinois Tool Works, Inc.
|
||||||||
|
1.950%, 03/01/2019
|
50,000
|
50,361
|
||||||
|
John Deere Capital Corp.
|
||||||||
|
1.550%, 12/15/2017
|
40,000
|
40,044
|
||||||
|
1.600%, 07/13/2018
|
18,000
|
18,023
|
||||||
|
1.750%, 08/10/2018
|
20,000
|
20,056
|
||||||
|
1.579%, 01/08/2019 (a)
|
500,000
|
503,314
|
||||||
|
Precision Castparts Corp.
|
||||||||
|
1.250%, 01/15/2018
|
45,000
|
44,977
|
||||||
|
Stanley Black & Decker, Inc.
|
||||||||
|
2.451%, 11/17/2018
|
1,000,000
|
1,010,752
|
||||||
|
The Boeing Co.
|
||||||||
|
0.950%, 05/15/2018
|
50,000
|
49,849
|
||||||
|
United Parcel Service, Inc.
|
||||||||
|
1.125%, 10/01/2017
|
30,000
|
29,963
|
||||||
|
United Technologies Corp.
|
||||||||
|
1.778%, 05/04/2018 (a)(c)
|
1,000,000
|
999,939
|
||||||
|
6,296,981
|
||||||||
|
Technology – 2.6%
|
||||||||
|
Apple, Inc.
|
||||||||
|
0.900%, 05/12/2017
|
18,000
|
17,998
|
||||||
|
1.000%, 05/03/2018
|
41,000
|
40,881
|
||||||
|
1.873%, 02/22/2019 (a)
|
1,000,000
|
1,015,432
|
||||||
|
1.550%, 02/07/2020
|
10,000
|
9,943
|
||||||
|
1.900%, 02/07/2020
|
45,000
|
45,137
|
||||||
|
2.250%, 02/23/2021
|
13,000
|
13,045
|
||||||
|
1.550%, 08/04/2021
|
97,000
|
94,126
|
||||||
|
HP, Inc.
|
||||||||
|
1.963%, 01/14/2019 (a)
|
1,500,000
|
1,504,740
|
||||||
|
2.750%, 01/14/2019
|
1,500,000
|
1,518,365
|
||||||
The accompanying notes are an integral part of these financial statements.
14
Pemberwick Fund
|
SCHEDULE OF INVESTMENTS (Continued)
|
|
at March 31, 2017
|
|
Par
|
||||||||
|
Value
|
Value
|
|||||||
|
Technology – 2.6% (Continued)
|
||||||||
|
Intel Corp.
|
||||||||
|
3.300%, 10/01/2021
|
$
|
50,000
|
$
|
52,008
|
||||
|
Microsoft Corp.
|
||||||||
|
1.000%, 05/01/2018
|
60,000
|
59,802
|
||||||
|
1.300%, 11/03/2018
|
34,000
|
33,998
|
||||||
|
4.200%, 06/01/2019
|
30,000
|
31,744
|
||||||
|
1.550%, 08/08/2021
|
45,000
|
43,900
|
||||||
|
National Semiconductor Corp.
|
||||||||
|
6.600%, 06/15/2017
|
25,000
|
25,267
|
||||||
|
Oracle Corp.
|
||||||||
|
2.375%, 01/15/2019
|
15,000
|
15,209
|
||||||
|
5.000%, 07/08/2019
|
30,000
|
32,177
|
||||||
|
1.900%, 09/15/2021
|
130,000
|
127,856
|
||||||
|
4,681,628
|
||||||||
|
Utilities – 0.4%
|
||||||||
|
DTE Electric Co.
|
||||||||
|
3.900%, 06/01/2021
|
55,000
|
57,977
|
||||||
|
Duke Energy Carolinas LLC
|
||||||||
|
5.250%, 01/15/2018
|
35,000
|
36,021
|
||||||
|
4.300%, 06/15/2020
|
25,000
|
26,714
|
||||||
|
3.900%, 06/15/2021
|
25,000
|
26,460
|
||||||
|
Duke Energy Florida LLC
|
||||||||
|
5.650%, 06/15/2018
|
25,000
|
26,187
|
||||||
|
Entergy Gulf States Louisiana LLC
|
||||||||
|
3.950%, 10/01/2020
|
50,000
|
52,493
|
||||||
|
Florida Power & Light Co.
|
||||||||
|
5.550%, 11/01/2017
|
35,000
|
35,800
|
||||||
|
Kansas City Power & Light Co.
|
||||||||
|
7.150%, 04/01/2019
|
20,000
|
22,007
|
||||||
|
Kentucky Utilities Co.
|
||||||||
|
3.250%, 11/01/2020
|
30,000
|
30,947
|
||||||
|
MidAmerican Energy Co.
|
||||||||
|
5.300%, 03/15/2018
|
30,000
|
31,067
|
||||||
|
Northern States Power Co.
|
||||||||
|
2.200%, 08/15/2020
|
30,000
|
30,105
|
||||||
The accompanying notes are an integral part of these financial statements.
15
Pemberwick Fund
|
SCHEDULE OF INVESTMENTS (Continued)
|
|
at March 31, 2017
|
|
Par
|
||||||||
|
Value
|
Value
|
|||||||
|
Utilities – 0.4% (Continued)
|
||||||||
|
PacifiCorp
|
||||||||
|
5.650%, 07/15/2018
|
$
|
25,000
|
$
|
26,268
|
||||
|
Public Service Co. of Colorado
|
||||||||
|
3.200%, 11/15/2020
|
30,000
|
31,016
|
||||||
|
Public Service Electric & Gas Co.
|
||||||||
|
1.800%, 06/01/2019
|
25,000
|
24,982
|
||||||
|
2.000%, 08/15/2019
|
75,000
|
75,030
|
||||||
|
San Diego Gas & Electric Co.
|
||||||||
|
3.000%, 08/15/2021
|
30,000
|
30,720
|
||||||
|
Southern California Edison Co.
|
||||||||
|
1.125%, 05/01/2017
|
7,000
|
7,000
|
||||||
|
5.500%, 08/15/2018
|
45,000
|
47,316
|
||||||
|
3.875%, 06/01/2021
|
40,000
|
42,303
|
||||||
|
Wisconsin Electric Power Co.
|
||||||||
|
1.700%, 06/15/2018
|
25,000
|
25,037
|
||||||
|
Wisconsin Power & Light Co.
|
||||||||
|
5.000%, 07/15/2019
|
25,000
|
26,614
|
||||||
|
712,064
|
||||||||
|
TOTAL CORPORATE BONDS AND NOTES
|
||||||||
|
(Cost $134,393,533)
|
134,691,902
|
|||||||
|
COLLATERALIZED
|
||||||||
|
MORTGAGE OBLIGATIONS – 0.8%
|
||||||||
|
Federal Home Loan Mortgage
|
||||||||
|
Corporation REMICS – 0.3%
|
||||||||
|
Series 2542, Class ES
|
||||||||
|
5.000%, 12/15/2017
|
2,521
|
2,560
|
||||||
|
Series 2564, Class HJ
|
||||||||
|
5.000%, 02/15/2018
|
1,989
|
2,023
|
||||||
|
Series 2611, Class UH
|
||||||||
|
4.500%, 05/15/2018
|
4,490
|
4,548
|
||||||
|
Series 2617, Class GR
|
||||||||
|
4.500%, 05/15/2018
|
5,249
|
5,309
|
||||||
|
Series 2617, Class TK
|
||||||||
|
4.500%, 05/15/2018
|
9,067
|
9,183
|
||||||
|
Series 2627, Class MC
|
||||||||
|
4.500%, 06/15/2018
|
9,363
|
9,482
|
||||||
The accompanying notes are an integral part of these financial statements.
16
Pemberwick Fund
|
SCHEDULE OF INVESTMENTS (Continued)
|
|
at March 31, 2017
|
|
Par
|
||||||||
|
Value
|
Value
|
|||||||
|
Federal Home Loan Mortgage
|
||||||||
|
Corporation REMICS – 0.3% (Continued)
|
||||||||
|
Series 2649, Class KA
|
||||||||
|
4.500%, 07/15/2018
|
$
|
6,676
|
$
|
6,757
|
||||
|
Series 2693, Class PE
|
||||||||
|
4.500%, 10/15/2018
|
9,306
|
9,524
|
||||||
|
Series 2746, Class EG
|
||||||||
|
4.500%, 02/15/2019
|
10,475
|
10,722
|
||||||
|
Series 2814, Class GB
|
||||||||
|
5.000%, 06/15/2019
|
1,944
|
1,973
|
||||||
|
Series 2989, Class TG
|
||||||||
|
5.000%, 06/15/2025
|
35,112
|
37,595
|
||||||
|
Series 3002, Class YD
|
||||||||
|
4.500%, 07/15/2025
|
14,233
|
15,189
|
||||||
|
Series 2526, Class FI
|
||||||||
|
1.912%, 02/15/2032 (a)
|
68,684
|
70,406
|
||||||
|
Series 2881, Class AE
|
||||||||
|
5.000%, 08/15/2034
|
11,940
|
12,587
|
||||||
|
Series 2933, Class HD
|
||||||||
|
5.500%, 02/15/2035
|
20,615
|
22,637
|
||||||
|
Series 4305, Class KA
|
||||||||
|
3.000%, 03/15/2038
|
74,453
|
75,822
|
||||||
|
Series 3843, Class GH
|
||||||||
|
3.750%, 10/15/2039
|
51,228
|
53,357
|
||||||
|
Series 3786, Class NA
|
||||||||
|
4.500%, 07/15/2040
|
92,772
|
99,029
|
||||||
|
Series 4305, Class A
|
||||||||
|
3.500%, 06/15/2048
|
113,891
|
118,104
|
||||||
|
566,807
|
||||||||
|
Federal National Mortgage
|
||||||||
|
Association REMICS – 0.3%
|
||||||||
|
Series 2003-92, Class PE
|
||||||||
|
4.500%, 09/25/2018
|
8,342
|
8,543
|
||||||
|
Series 2003-80, Class YE
|
||||||||
|
4.000%, 06/25/2023
|
750
|
750
|
||||||
|
Series 2005-40, Class YG
|
||||||||
|
5.000%, 05/25/2025
|
30,737
|
32,929
|
||||||
The accompanying notes are an integral part of these financial statements.
17
Pemberwick Fund
|
SCHEDULE OF INVESTMENTS (Continued)
|
|
at March 31, 2017
|
|
Par
|
||||||||
|
Value
|
Value
|
|||||||
|
Federal National Mortgage
|
||||||||
|
Association REMICS – 0.3% (Continued)
|
||||||||
|
Series 2011-122, Class A
|
||||||||
|
3.000%, 12/25/2025
|
$
|
62,022
|
$
|
63,018
|
||||
|
Series 2007-27, Class MQ
|
||||||||
|
5.500%, 04/25/2027
|
8,800
|
9,765
|
||||||
|
Series 2005-16, Class PE
|
||||||||
|
5.000%, 03/25/2034
|
340
|
340
|
||||||
|
Series 2005-48, Class AR
|
||||||||
|
5.500%, 02/25/2035
|
16,866
|
17,570
|
||||||
|
Series 2005-62, Class CQ
|
||||||||
|
4.750%, 07/25/2035
|
7,645
|
7,953
|
||||||
|
Series 2005-64, Class PL
|
||||||||
|
5.500%, 07/25/2035
|
49,060
|
54,252
|
||||||
|
Series 2005-68, Class PG
|
||||||||
|
5.500%, 08/25/2035
|
34,726
|
38,517
|
||||||
|
Series 2005-83A, Class LA
|
||||||||
|
5.500%, 10/25/2035
|
19,915
|
22,001
|
||||||
|
Series 2006-57, Class AD
|
||||||||
|
5.750%, 06/25/2036
|
97,144
|
103,789
|
||||||
|
Series 2014-23, Class PA
|
||||||||
|
3.500%, 08/25/2036
|
108,145
|
112,362
|
||||||
|
Series 2007-39, Class NA
|
||||||||
|
4.250%, 01/25/2037
|
4,395
|
4,460
|
||||||
|
Series 2013-83, Class CA
|
||||||||
|
3.500%, 10/25/2037
|
89,794
|
93,287
|
||||||
|
Series 2009-47, Class PA
|
||||||||
|
4.500%, 07/25/2039
|
11,455
|
11,903
|
||||||
|
Series 2011-113, Class NE
|
||||||||
|
4.000%, 03/25/2040
|
32,837
|
33,400
|
||||||
|
614,839
|
||||||||
|
Government National Mortgage Association – 0.2%
|
||||||||
|
Series 2013-88, Class WA
|
||||||||
|
5.009%, 06/20/2030 (a)
|
64,215
|
68,731
|
||||||
|
Series 2002-22, Class GF
|
||||||||
|
6.500%, 03/20/2032
|
39,827
|
46,169
|
||||||
The accompanying notes are an integral part of these financial statements.
18
Pemberwick Fund
|
SCHEDULE OF INVESTMENTS (Continued)
|
|
at March 31, 2017
|
|
Par
|
||||||||
|
Value
|
Value
|
|||||||
|
Government National Mortgage
|
||||||||
|
Association – 0.2% (Continued)
|
||||||||
|
Series 2002-51, Class D
|
||||||||
|
6.000%, 07/20/2032
|
$
|
46,531
|
$
|
51,857
|
||||
|
Series 2008-50, Class NA
|
||||||||
|
5.500%, 03/16/2037
|
9,684
|
10,076
|
||||||
|
Series 2007-11, Class PE
|
||||||||
|
5.500%, 03/20/2037
|
24,663
|
27,647
|
||||||
|
Series 2013-113, Class UB
|
||||||||
|
3.000%, 11/20/2038
|
68,777
|
69,740
|
||||||
|
274,220
|
||||||||
|
TOTAL COLLATERALIZED
|
||||||||
|
MORTGAGE OBLIGATIONS
|
||||||||
|
(Cost $1,442,046)
|
1,455,866
|
|||||||
|
U.S. GOVERNMENT AGENCY OBLIGATIONS – 2.4%
|
||||||||
|
Federal Home Loan Bank – 1.2%
|
||||||||
|
0.875%, 03/19/2018
|
400,000
|
399,111
|
||||||
|
1.250%, 06/08/2018
|
340,000
|
340,322
|
||||||
|
2.000%, 09/14/2018
|
75,000
|
75,835
|
||||||
|
1.750%, 12/14/2018
|
595,000
|
600,018
|
||||||
|
1.250%, 01/16/2019
|
200,000
|
199,823
|
||||||
|
1.000%, 09/26/2019
|
300,000
|
296,804
|
||||||
|
1.875%, 11/29/2021
|
250,000
|
249,270
|
||||||
|
2,161,183
|
||||||||
|
Federal Home Loan Mortgage Corp. – 0.4%
|
||||||||
|
0.875%, 10/12/2018
|
125,000
|
124,330
|
||||||
|
1.500%, 01/17/2020
|
355,000
|
354,540
|
||||||
|
5.500%, 04/01/2021, Gold Pool #G11941
|
22,083
|
23,243
|
||||||
|
5.500%, 11/01/2021, Gold Pool #G12454
|
10,791
|
11,425
|
||||||
|
5.500%, 04/01/2023, Gold Pool #G13145
|
21,219
|
22,658
|
||||||
|
4.000%, 02/01/2026, Gold Pool #J14494
|
53,953
|
56,847
|
||||||
|
4.000%, 06/01/2026, Gold Pool #J15974
|
17,746
|
18,609
|
||||||
|
4.500%, 06/01/2029, Gold Pool #C91251
|
16,186
|
17,358
|
||||||
|
4.500%, 12/01/2029, Gold Pool #C91281
|
32,138
|
34,463
|
||||||
|
4.500%, 04/01/2030, Gold Pool #C91295
|
17,236
|
18,479
|
||||||
|
681,952
|
||||||||
The accompanying notes are an integral part of these financial statements.
19
Pemberwick Fund
|
SCHEDULE OF INVESTMENTS (Continued)
|
|
at March 31, 2017
|
|
Par
|
||||||||
|
Value
|
Value
|
|||||||
|
Federal National Mortgage Association – 0.8%
|
||||||||
|
5.375%, 06/12/2017
|
$
|
550,000
|
$
|
554,800
|
||||
|
1.125%, 07/20/2018
|
390,000
|
389,786
|
||||||
|
1.375%, 10/07/2021
|
210,000
|
204,972
|
||||||
|
2.000%, 01/05/2022
|
150,000
|
150,169
|
||||||
|
6.000%, 09/01/2019, Pool #735439
|
963
|
987
|
||||||
|
5.500%, 06/01/2020, Pool #888601
|
2,827
|
2,900
|
||||||
|
5.000%, 05/01/2023, Pool #254762
|
13,585
|
14,836
|
||||||
|
5.500%, 01/01/2024, Pool #AD0471
|
11,339
|
12,009
|
||||||
|
5.000%, 12/01/2025, Pool #256045
|
27,584
|
30,126
|
||||||
|
5.500%, 05/01/2028, Pool #257204
|
23,073
|
25,624
|
||||||
|
4.000%, 08/01/2029, Pool #MA0142
|
27,665
|
29,231
|
||||||
|
5.500%, 04/01/2037, Pool #AD0249
|
32,809
|
36,763
|
||||||
|
7.000%, 04/01/2037, Pool #888366
|
8,850
|
10,379
|
||||||
|
5.000%, 10/01/2039, Pool #AC3237
|
67,768
|
74,954
|
||||||
|
1,537,536
|
||||||||
|
TOTAL U.S. GOVERNMENT AGENCY OBLIGATIONS
|
||||||||
|
(Cost $4,375,362)
|
4,380,671
|
|||||||
|
U.S. TREASURY OBLIGATIONS – 21.1%
|
||||||||
|
U.S. Treasury Notes – 21.1%
|
||||||||
|
0.750%, 06/30/2017
|
500,000
|
499,895
|
||||||
|
0.625%, 09/30/2017
|
720,000
|
719,044
|
||||||
|
1.875%, 09/30/2017
|
1,350,000
|
1,356,342
|
||||||
|
0.750%, 10/31/2017
|
1,405,000
|
1,403,463
|
||||||
|
1.875%, 10/31/2017
|
790,000
|
794,120
|
||||||
|
0.625%, 11/30/2017
|
1,100,000
|
1,097,444
|
||||||
|
0.750%, 12/31/2017
|
2,000,000
|
1,996,094
|
||||||
|
0.750%, 01/31/2018
|
490,000
|
488,851
|
||||||
|
0.875%, 01/31/2018
|
920,000
|
918,782
|
||||||
|
0.750%, 02/28/2018
|
450,000
|
448,743
|
||||||
|
0.625%, 04/30/2018
|
2,140,000
|
2,129,050
|
||||||
|
1.000%, 05/31/2018
|
1,115,000
|
1,113,476
|
||||||
|
0.875%, 07/15/2018
|
505,000
|
503,304
|
||||||
|
1.375%, 07/31/2018
|
1,200,000
|
1,203,586
|
||||||
The accompanying notes are an integral part of these financial statements.
20
Pemberwick Fund
|
SCHEDULE OF INVESTMENTS (Continued)
|
|
at March 31, 2017
|
|
Par
|
||||||||
|
Value
|
Value
|
|||||||
|
U.S. Treasury Notes – 21.1% (Continued)
|
||||||||
|
1.500%, 08/31/2018
|
$
|
430,000
|
$
|
431,965
|
||||
|
1.250%, 10/31/2018
|
1,915,000
|
1,916,645
|
||||||
|
1.250%, 11/30/2018
|
700,000
|
700,479
|
||||||
|
1.500%, 12/31/2018
|
460,000
|
462,192
|
||||||
|
1.250%, 01/31/2019
|
1,585,000
|
1,585,558
|
||||||
|
1.500%, 01/31/2019
|
1,150,000
|
1,155,436
|
||||||
|
1.375%, 02/28/2019
|
380,000
|
380,920
|
||||||
|
1.500%, 02/28/2019
|
355,000
|
356,692
|
||||||
|
1.625%, 03/31/2019
|
740,000
|
745,232
|
||||||
|
1.625%, 04/30/2019
|
1,695,000
|
1,706,785
|
||||||
|
0.875%, 05/15/2019
|
180,000
|
178,421
|
||||||
|
1.500%, 05/31/2019
|
1,395,000
|
1,400,912
|
||||||
|
1.000%, 06/30/2019
|
380,000
|
377,313
|
||||||
|
1.625%, 06/30/2019
|
200,000
|
201,305
|
||||||
|
0.875%, 07/31/2019
|
755,000
|
747,007
|
||||||
|
1.625%, 07/31/2019
|
180,000
|
181,146
|
||||||
|
1.000%, 08/31/2019
|
815,000
|
807,789
|
||||||
|
1.000%, 09/30/2019
|
740,000
|
732,889
|
||||||
|
1.750%, 09/30/2019
|
300,000
|
302,660
|
||||||
|
1.500%, 10/31/2019
|
200,000
|
200,398
|
||||||
|
1.500%, 11/30/2019
|
410,000
|
410,681
|
||||||
|
1.125%, 12/31/2019
|
640,000
|
634,500
|
||||||
|
1.625%, 12/31/2019
|
220,000
|
221,005
|
||||||
|
1.250%, 01/31/2020
|
850,000
|
844,571
|
||||||
|
1.375%, 01/31/2020
|
250,000
|
249,346
|
||||||
|
1.375%, 02/29/2020
|
380,000
|
378,560
|
||||||
|
1.125%, 03/31/2020
|
300,000
|
296,555
|
||||||
|
1.375%, 04/30/2020
|
1,520,000
|
1,511,926
|
||||||
|
1.500%, 05/31/2020
|
1,460,000
|
1,456,379
|
||||||
|
1.625%, 06/30/2020
|
220,000
|
220,198
|
||||||
|
1.875%, 06/30/2020
|
200,000
|
201,832
|
||||||
|
2.000%, 07/31/2020
|
150,000
|
151,890
|
||||||
|
1.375%, 08/31/2020
|
455,000
|
450,823
|
||||||
|
1.375%, 09/30/2020
|
350,000
|
346,521
|
||||||
|
1.750%, 10/31/2020
|
250,000
|
250,591
|
||||||
|
2.000%, 11/30/2020
|
390,000
|
394,037
|
||||||
|
2.250%, 07/31/2018
|
180,000
|
182,612
|
||||||
The accompanying notes are an integral part of these financial statements.
21
Pemberwick Fund
|
SCHEDULE OF INVESTMENTS (Continued)
|
|
at March 31, 2017
|
|
Par
|
||||||||
|
Value
|
Value
|
|||||||
|
U.S. Treasury Notes – 21.1% (Continued)
|
||||||||
|
1.375%, 01/31/2021
|
$
|
590,000
|
$
|
581,761
|
||||
|
2.125%, 01/31/2021
|
345,000
|
349,764
|
||||||
|
1.250%, 03/31/2021
|
350,000
|
342,774
|
||||||
|
1.375%, 05/31/2021
|
180,000
|
176,804
|
||||||
|
TOTAL U.S. TREASURY OBLIGATIONS
|
||||||||
|
(Cost $38,998,705)
|
38,897,068
|
|||||||
|
SHORT-TERM INVESTMENTS – 2.2%
|
Shares
|
|||||||
|
Fidelity Government Portfolio – Class I, 0.56% (d)
|
4,055,803
|
4,055,803
|
||||||
|
TOTAL SHORT-TERM INVESTMENTS
|
||||||||
|
(Cost $4,055,803)
|
4,055,803
|
|||||||
|
TOTAL INVESTMENTS
|
||||||||
|
(Cost $183,265,449) – 99.7%
|
183,481,310
|
|||||||
|
Other Assets in Excess of Liabilities – 0.3%
|
617,158
|
|||||||
|
TOTAL NET ASSETS – 100.0%
|
$
|
184,098,468
|
||||||
Percentages are stated as a percent of net assets.
PLC – Public Limited Company
REMICS – Real Estate Mortgage Investment Conduits
|
(a)
|
Variable or Floating Rate Security. The rate shown represents the rate at March 31, 2017.
|
|
(b)
|
Security is a perpetual bond and has no definite maturity date.
|
|
(c)
|
Multi-Step Coupon. Rate disclosed is as of March 31, 2017.
|
|
(d)
|
The rate shown represents the Fund’s 7-day yield as of March 31, 2017.
|
|
(e)
|
Restricted security as defined in Rule 144(a) under the Securities Act of 1933 and determined to be liquid. Purchased in private placement transaction; resale to the public may require registration or may extend only to qualified institutional buyers. At March 31, 2017, the market value of these securities total $2,998,415 which represents 1.6% of total net assets.
|
|
(f)
|
U.S. traded security of a foreign issuer or corporation.
|
|
(g)
|
Investment in affiliated security. Quasar Distributors, LLC, which serves as the Fund’s distributor, is a subsidiary of U.S. Bancorp. Details of transactions with this affiliated company for the eleven months ended March 31, 2017 were as follows:
|
|
Change in
|
Net
|
|||||||||||||||||||||||||||||||
|
Unrealized
|
Realized
|
|||||||||||||||||||||||||||||||
|
4/30/2016
|
Amorti-
|
Appreciation
|
Gains
|
Market
|
Interest
|
|||||||||||||||||||||||||||
|
Issuer
|
Value
|
Purchases
|
Sales
|
zation
|
(Depreciation)
|
(Losses)
|
Value
|
Income
|
||||||||||||||||||||||||
|
U.S. Bancorp1
|
$
|
—
|
$
|
76,327
|
$
|
0
|
$
|
(233
|
)
|
$
|
(479
|
)
|
$
|
0
|
$
|
75,615
|
$
|
707
|
||||||||||||||
|
U.S. Bank, N.A.2
|
$
|
2,377,394
|
$
|
0
|
$
|
0
|
$
|
(239
|
)
|
$
|
(11,746
|
)
|
$
|
0
|
$
|
2,365,409
|
$
|
29,364
|
||||||||||||||
|
$
|
(472
|
)
|
$
|
(12,225
|
)
|
$
|
2,441,024
|
$
|
30,071
|
|||||||||||||||||||||||
|
1
|
Par values were $0 and $75,000 at 4/30/16 and 3/31/17, respectively.
|
|
2
|
Par values were $2,368,000 and $2,368,000 at 4/30/16 and 3/31/17, respectively.
|
The accompanying notes are an integral part of these financial statements.
22
Pemberwick Fund
|
STATEMENT OF ASSETS AND LIABILITIES
|
|
at March 31, 2017
|
|
Assets:
|
||||
|
Investments in unaffiliated securities, at value (cost of $180,821,141)
|
$
|
181,040,286
|
||
|
Investments in affiliated securities, at value (cost of $2,444,308)
|
2,441,024
|
|||
|
Total investments, at value (cost of $183,265,449)
|
183,481,310
|
|||
|
Receivables:
|
||||
|
Dividends and interest
|
698,542
|
|||
|
Advisor
|
3,996
|
|||
|
Prepaid expenses and other assets
|
2,570
|
|||
|
Total assets
|
184,186,418
|
|||
|
Liabilities:
|
||||
|
Payables:
|
||||
|
Advisory fee
|
21,677
|
|||
|
Administration and accounting fees
|
26,683
|
|||
|
Reports to shareholders
|
2,387
|
|||
|
Custody fees
|
3,180
|
|||
|
Transfer agent fees and expenses
|
6,755
|
|||
|
Other accrued expenses
|
27,268
|
|||
|
Total liabilities
|
87,950
|
|||
|
Net assets
|
$
|
184,098,468
|
||
|
Net assets consist of:
|
||||
|
Capital stock
|
$
|
184,537,909
|
||
|
Accumulated net realized loss on investments
|
(655,302
|
)
|
||
|
Net unrealized appreciation on investments
|
215,861
|
|||
|
Net assets
|
$
|
184,098,468
|
||
|
Shares issued (Unlimited number of beneficial
|
||||
|
interest authorized, $0.01 par value)
|
18,361,154
|
|||
|
Net asset value, offering price and redemption price per share
|
$
|
10.03
|
||
The accompanying notes are an integral part of these financial statements.
23
Pemberwick Fund
|
STATEMENTS OF OPERATIONS
|
|
Eleven
|
||||||||
|
Months Ended
|
Year Ended
|
|||||||
|
March 31, 2017*
|
April 30, 2016
|
|||||||
|
Investment income:
|
||||||||
|
Interest income from unaffiliated securities
|
$
|
2,019,264
|
$
|
2,154,650
|
||||
|
Interest income from affiliated securities
|
30,071
|
—
|
||||||
|
Total investment income
|
2,049,335
|
2,154,650
|
||||||
|
Expenses:
|
||||||||
|
Advisory fees (Note 4)
|
639,059
|
821,157
|
||||||
|
Administration and accounting fees (Note 4)
|
185,943
|
198,425
|
||||||
|
Transfer agent fees and expenses
|
46,844
|
49,971
|
||||||
|
Federal and state registration fees
|
5,682
|
1,854
|
||||||
|
Audit fees
|
26,855
|
29,426
|
||||||
|
Compliance expense
|
34,038
|
22,900
|
||||||
|
Legal fees
|
24,815
|
26,597
|
||||||
|
Reports to shareholders
|
15,601
|
22,271
|
||||||
|
Trustees’ fees and expenses
|
15,855
|
7,329
|
||||||
|
Custody fees
|
17,256
|
24,989
|
||||||
|
Other
|
10,141
|
11,657
|
||||||
|
Total expenses before reimbursement from advisor
|
1,022,089
|
1,216,576
|
||||||
|
Expense waived (Note 4)
|
(408,525
|
)
|
(574,850
|
)
|
||||
|
Net expenses
|
613,564
|
641,726
|
||||||
|
Net investment income
|
1,435,771
|
1,512,924
|
||||||
|
Realized and unrealized gain (loss) on investments:
|
||||||||
|
Net realized gain on unaffiliated investments
|
$
|
61,360
|
$
|
355,030
|
||||
|
Net change in unrealized appreciation
|
||||||||
|
(depreciation) on unaffiliated investments
|
(391,147
|
)
|
(586,839
|
)
|
||||
|
Net change in unrealized appreciation
|
||||||||
|
(depreciation) on affiliated investments
|
(12,225
|
)
|
—
|
|||||
|
Net realized and unrealized loss on investments
|
(342,012
|
)
|
(231,809
|
)
|
||||
|
Net increase in net assets resulting from operations
|
$
|
1,093,759
|
$
|
1,281,115
|
||||
* Fund changed its fiscal year from April 30 to March 31.
The accompanying notes are an integral part of these financial statements.
24
Pemberwick Fund
|
STATEMENTS OF CHANGES IN NET ASSETS
|
|
Eleven
|
||||||||||||
|
Months Ended
|
Year Ended
|
Year Ended
|
||||||||||
|
March 31, 2017*
|
April 30, 2016
|
April 30, 2015
|
||||||||||
|
Operations:
|
||||||||||||
|
Net investment income
|
$
|
1,435,771
|
$
|
1,512,924
|
$
|
1,567,887
|
||||||
|
Net realized gain on investments
|
61,360
|
355,030
|
100,557
|
|||||||||
|
Net change in unrealized appreciation
|
||||||||||||
|
(depreciation) on investments
|
(403,372
|
)
|
(586,839
|
)
|
(346,071
|
)
|
||||||
|
Net increase in net assets
|
||||||||||||
|
resulting from operations
|
1,093,759
|
1,281,115
|
1,322,373
|
|||||||||
|
Distributions to Shareholders From:
|
||||||||||||
|
Net investment income
|
(1,482,522
|
)
|
(1,543,193
|
)
|
(1,629,122
|
)
|
||||||
|
Total distributions
|
(1,482,522
|
)
|
(1,543,193
|
)
|
(1,629,122
|
)
|
||||||
|
Capital Share Transactions:
|
||||||||||||
|
Proceeds from shares sold
|
52,333,765
|
51,730,683
|
63,908,851
|
|||||||||
|
Proceeds from shares issued to holders
|
||||||||||||
|
in reinvestment of dividends
|
1,483,418
|
1,542,964
|
1,622,818
|
|||||||||
|
Cost of shares redeemed
|
(47,137,981
|
)
|
(45,183,230
|
)
|
(63,133,072
|
)
|
||||||
|
Net increase in net assets from
|
||||||||||||
|
capital share transactions
|
6,679,202
|
8,090,417
|
2,398,597
|
|||||||||
|
Total increase in net assets
|
6,290,439
|
7,828,339
|
2,091,848
|
|||||||||
|
Net Assets:
|
||||||||||||
|
Beginning of period
|
177,808,029
|
169,979,690
|
167,887,842
|
|||||||||
|
End of period
|
$
|
184,098,468
|
$
|
177,808,029
|
$
|
169,979,690
|
||||||
|
Accumulated net investment income (loss)
|
$
|
—
|
$
|
17,190
|
$
|
(573
|
)
|
|||||
|
Changes in Shares Outstanding:
|
||||||||||||
|
Shares sold
|
5,214,316
|
5,157,961
|
6,348,311
|
|||||||||
|
Proceeds from shares issued to holders
|
||||||||||||
|
in reinvestment of dividends
|
147,694
|
153,755
|
161,124
|
|||||||||
|
Shares redeemed
|
(4,694,355
|
)
|
(4,506,685
|
)
|
(6,271,648
|
)
|
||||||
|
Net increase in shares outstanding
|
667,655
|
805,031
|
237,787
|
|||||||||
* Fund changed its fiscal year from April 30 to March 31.
The accompanying notes are an integral part of these financial statements.
25
Pemberwick Fund
|
FINANCIAL HIGHLIGHTS
|
|
For a capital share outstanding throughout each period
|
|
Eleven
|
||||||||||||||||||||||||
|
Months
|
||||||||||||||||||||||||
|
Ended
|
||||||||||||||||||||||||
|
March 31,
|
Year Ended April 30,
|
|||||||||||||||||||||||
|
2017*
|
|
2016
|
2015
|
2014
|
2013
|
2012
|
||||||||||||||||||
|
Net Asset Value –
|
||||||||||||||||||||||||
|
Beginning of Period
|
$
|
10.05
|
$
|
10.06
|
$
|
10.08
|
$
|
10.12
|
$
|
10.03
|
$
|
10.16
|
||||||||||||
|
Income from
|
||||||||||||||||||||||||
|
Investment Operations:
|
||||||||||||||||||||||||
|
Net investment income
|
0.09
|
0.09
|
1
|
0.09
|
1
|
0.10
|
1
|
0.11
|
1
|
0.13
|
1
|
|||||||||||||
|
Net realized and unrealized
|
||||||||||||||||||||||||
|
gain on investments
|
(0.02
|
)
|
(0.01
|
)
|
(0.02
|
)
|
(0.03
|
)
|
0.11
|
(0.12
|
)4
|
|||||||||||||
|
Total from investment operations
|
0.07
|
0.08
|
0.07
|
0.07
|
0.22
|
0.01
|
||||||||||||||||||
|
Less Distributions:
|
||||||||||||||||||||||||
|
Dividends from net
|
||||||||||||||||||||||||
|
investment income
|
(0.09
|
)
|
(0.09
|
)
|
(0.09
|
)
|
(0.11
|
)
|
(0.13
|
)
|
(0.14
|
)
|
||||||||||||
|
Total distributions
|
(0.09
|
)
|
(0.09
|
)
|
(0.09
|
)
|
(0.11
|
)
|
(0.13
|
)
|
(0.14
|
)
|
||||||||||||
|
Net Asset Value – End of Period
|
$
|
10.03
|
$
|
10.05
|
$
|
10.06
|
$
|
10.08
|
$
|
10.12
|
$
|
10.03
|
||||||||||||
|
Total Return2
|
0.68
|
%^ |
0.85
|
%
|
0.74
|
%
|
0.68
|
%
|
2.19
|
%
|
0.12
|
%
|
||||||||||||
|
Ratios and Supplemental Data:
|
||||||||||||||||||||||||
|
Net assets, end of period (thousands)
|
$
|
184,098
|
$
|
177,808
|
$
|
169,980
|
$
|
167,888
|
$
|
119,793
|
$
|
119,521
|
||||||||||||
|
Ratio of operating expenses
|
||||||||||||||||||||||||
|
to average net assets3:
|
||||||||||||||||||||||||
|
Before Reimbursements
|
0.67
|
%+
|
0.74
|
%
|
0.74
|
%
|
0.76
|
%
|
0.80
|
%
|
0.80
|
%
|
||||||||||||
|
After Reimbursements
|
0.40
|
%+
|
0.39
|
%
|
0.39
|
%
|
0.41
|
%
|
0.45
|
%
|
0.45
|
%
|
||||||||||||
|
Ratio of net investment income
|
||||||||||||||||||||||||
|
to average net assets3:
|
||||||||||||||||||||||||
|
Before Reimbursements
|
0.68
|
%+
|
0.57
|
%
|
0.56
|
%
|
0.65
|
%
|
0.75
|
%
|
0.72
|
%
|
||||||||||||
|
After Reimbursements
|
0.95
|
%+
|
0.92
|
%
|
0.91
|
%
|
1.00
|
%
|
1.10
|
%
|
1.07
|
%
|
||||||||||||
|
Portfolio turnover rate
|
17
|
%^ |
45
|
%
|
35
|
%
|
35
|
%
|
28
|
%
|
23
|
%
|
||||||||||||
|
+
|
Annualized
|
|
^
|
Not Annualized
|
|
1
|
The net investment income per share was calculated using the average shares outstanding method.
|
|
2
|
Total investment return is calculated assuming a purchase of shares on the first day and a sale of shares on the last day of each period reported and includes reinvestment of dividends and distributions, if any.
|
|
3
|
During the period, certain fees were waived. If such fee waivers had not occurred, the ratios would have been as indicated (See Note 4).
|
|
4
|
Includes payments by affiliate which equaled $0.03 per share.
|
|
*
|
Fund changed its fiscal year from April 30 to March 31.
|
The accompanying notes are an integral part of these financial statements.
26
Pemberwick Fund
|
NOTES TO FINANCIAL STATEMENTS
|
|
March 31, 2017
|
NOTE 1 – ORGANIZATION
The Pemberwick Fund (the “Pemberwick Fund” or the “Fund”) is a series of Manager Directed Portfolios (the “Trust”). The Trust is registered under the Investment Company Act of 1940, as amended (the “1940 Act”), as a non-diversified open-end investment management company and was organized as a Delaware statutory trust on April 4, 2006. The Pemberwick Fund, a series of FundVantage Trust (the “Predecessor Fund”) was reorganized into a newly created series of the Trust (the “Reorganization”) pursuant to an Agreement and Plan of Reorganization dated November 1, 2016. The Reorganization was approved by the shareholders of the Predecessor Fund at a meeting held on November 17, 2016. The Predecessor Fund transferred all its assets to the Fund in exchange for shares of the Fund and the assumption by the Fund of all the known liabilities of the Predecessor Fund. The Predecessor Fund commenced operations on February 1, 2010. Pemberwick Investment Advisors LLC (“Pemberwick” or the “Advisor”) serves as the investment advisor to the Fund, and J.P. Morgan Investment Management Inc. (“J.P. Morgan” or the “Sub-Advisor”) serves as the sub-advisor to the Fund. Pemberwick and J.P. Morgan also served as the advisor and sub-advisor, respectively, to the Predecessor Fund. The Fund has changed its fiscal year end from April 30 to March 31. The Fund follows the investment company accounting and reporting guidance of the Financial Accounting Standards Board (“FASB”) Accounting Standard Codification Topic 946 “Financial Services – Investment Companies.” The investment objective of the Fund is to seek maximum current income that is consistent with liquidity and stability of principal.
NOTE 2 – SIGNIFICANT ACCOUNTING POLICIES
The following is a summary of significant accounting policies consistently followed by the Fund. These policies are in conformity with U.S. generally accepted accounting principles (“GAAP”).
|
A.
|
Security Valuation: All investments in securities are recorded at their estimated fair value, as described in Note 3.
|
|
|
B.
|
Federal Income Taxes: It is the Fund’s policy to comply with the requirements of Subchapter M of the Internal Revenue Code applicable to regulated investment companies and to distribute substantially all of its taxable income to its shareholders. Therefore, no federal income or excise tax provisions are required.
|
|
|
The Fund recognizes the tax benefits of uncertain tax positions only where the position is “more likely than not” to be sustained assuming examination by tax authorities. Management has analyzed the Fund’s tax positions, and has concluded that no liability for unrecognized tax benefits should be recorded related to uncertain tax positions to be taken or expected to be taken on a tax return. The tax returns for the Fund for the prior three fiscal years are open for examination. The Fund identifies its major tax jurisdictions as U.S. Federal and the state of Delaware.
|
27
Pemberwick Fund
|
NOTES TO FINANCIAL STATEMENTS (Continued)
|
|
March 31, 2017
|
|
C.
|
Securities Transactions, Income and Distributions: Securities transactions are accounted for on the trade date. Realized gains and losses on securities sold are determined on the basis of identified cost. Interest income is recorded on an accrual basis. Dividend income and distributions to shareholders are recorded on the ex-dividend date. Discounts and premiums on fixed income securities are amortized using the effective interest method.
|
|
|
The Fund distributes substantially all of its net investment income, if any, daily, and net realized capital gains, if any, annually. Distributions from net realized gains for book purposes may include short-term capital gains. All short-term capital gains are included in ordinary income for tax purposes. The amount of dividends and distributions to shareholders from net investment income and net realized capital gains is determined in accordance with federal income tax regulations, which differ from GAAP. To the extent these book/tax differences are permanent, such amounts are reclassified within the capital accounts based on their federal tax treatment.
|
||
|
The Fund is charged for those expenses that are directly attributable to it, such as investment advisory, custody and transfer agent fees. Expenses that are not attributable to a Fund are typically allocated among the funds in the Trust proportionately based on allocation methods approved by the Board of Trustees (the “Board”). Common expenses of the Trust are typically allocated among the funds in the Trust based on a fund’s respective net assets, or by other equitable means.
|
||
|
D.
|
Use of Estimates: The preparation of financial statements in conformity with GAAP requires management to make estimates and assumptions that affect the reported amounts of assets and liabilities at the date of the financial statements and the reported amounts of increases and decreases in net assets during the reporting period. Actual results could differ from those estimates.
|
|
|
E.
|
Redemption Fees: The Fund does not charge redemption fees to shareholders.
|
|
|
F.
|
Reclassification of Capital Accounts: GAAP requires that certain components of net assets relating to permanent differences be reclassified between financial and tax reporting. These reclassifications have no effect on net assets or net asset value per share. For the eleven months ended March 31, 2017, the Fund made the following permanent tax adjustments on the Statement of Assets and Liabilities:
|
|
Accumulated
|
Accumulated
|
|
|
Net Investment
|
Net Realized
|
Capital
|
|
Income/(Loss)
|
Gain/(Loss)
|
Stock
|
|
$29,561
|
$(29,239)
|
$(322)
|
|
G.
|
Events Subsequent to the Fiscal Period End: In preparing the financial statements as of March 31, 2017, management considered the impact of subsequent events for potential recognition or disclosure in the financial statements and had concluded that no additional disclosures are necessary.
|
28
Pemberwick Fund
|
NOTES TO FINANCIAL STATEMENTS (Continued)
|
|
March 31, 2017
|
|
H.
|
New Accounting Pronouncement: In October 2016, the U.S. Securities and Exchange Commission adopted new rules and amended existing rules (together, “final rules”) intended to modernize the reporting and disclosure of information by registered investment companies. In part, the final rules amend Regulation S-X and require standardized, enhanced disclosure about derivatives in investment company financial statements, as well as other amendments. The compliance date for the amendments to Regulation S-X is August 1, 2017. Management is currently evaluating the impact that the adoption of the amendments to Regulation S-X will have on the financial statements and related disclosures.
|
NOTE 3 – SECURITIES VALUATION
The Fund has adopted authoritative fair value accounting standards which establish an authoritative definition of fair value and set out a hierarchy for measuring fair value. These standards require additional disclosures about the various inputs and valuation techniques used to develop the measurements of fair value, a discussion of changes in valuation techniques and related inputs during the period, and expanded disclosure of valuation levels for major security types. These inputs are summarized in the three broad levels listed below:
|
Level 1 –
|
Unadjusted quoted prices in active markets for identical assets or liabilities that the Fund has the ability to access.
|
|
|
Level 2 –
|
Observable inputs other than quoted prices included in level 1 that are observable for the asset or liability, either directly or indirectly. These inputs may include quoted prices for the identical instrument on an inactive market, prices for similar instruments, interest rates, prepayment speeds, credit risk, yield curves, default rates and similar data.
|
|
|
Level 3 –
|
Unobservable inputs for the asset or liability, to the extent relevant observable inputs are not available, representing the Fund’s own assumptions about the assumptions a market participant would use in valuing the asset or liability, and would be based on the best information available.
|
Following is a description of the valuation techniques applied to the Fund’s major categories of assets and liabilities measured at fair value on a recurring basis.
Debt Securities: Debt securities, including corporate bonds, asset-backed securities, mortgage-backed securities, municipal bonds, U.S. Treasuries, and U.S. government agency issues, are generally valued at market on the basis of valuations furnished by an independent pricing service that utilizes both dealer-supplied valuations and formula-based techniques. The pricing service may consider recently executed transactions in securities of the issuer or comparable issuers, market price quotations (where observable), bond spreads, and fundamental data relating to the issuer. In addition, the model may incorporate market observable data, such as reported sales or similar securities, broker
29
Pemberwick Fund
|
NOTES TO FINANCIAL STATEMENTS (Continued)
|
|
March 31, 2017
|
quotes, yields, bids, offers, and reference data. Certain securities are valued primarily using dealer quotations. To the extent these securities are actively traded and valuation adjustments are not applied, they are categorized in level 2 of the fair value hierarchy.
Investment Companies: Investments in open-end mutual funds, including money market funds, are generally valued at their net asset value per share. To the extent these securities are actively traded and valuation adjustments are not applied, they would be classified in level 1 of the fair value hierarchy.
Short-Term Debt Securities: Short-term debt securities having a maturity of less than 60 days are valued at the evaluated mean between bid and asked price. To the extent the inputs are observable and timely, these securities would be classified in Level 2 of the fair value hierarchy.
The Board delegated day-to-day valuation issues to a Valuation Committee of the Trust which, as of March 31, 2017, was comprised of representatives from U.S. Bancorp Fund Services, LLC, the Fund’s administrator. The function of the Valuation Committee is to value securities where current and reliable market quotations are not readily available, or the closing price does not represent fair value, by following procedures approved by the Board. These procedures consider many factors, including the type of security, size of holding, trading volume and news events. All actions taken by the Valuation Committee are subsequently reviewed and ratified by the Board.
Depending on the relative significance of the valuation inputs, fair valued securities may be classified in either level 2 or level 3 of the fair value hierarchy.
The inputs or methodology used for valuing securities are not an indication of the risk associated with investing in those securities. The following is a summary of the fair valuation hierarchy of the Fund’s securities as of March 31, 2017:
|
Level 1
|
Level 2
|
Level 3
|
Total
|
|||||||||||||
|
Corporate Bonds and Notes
|
$
|
—
|
$
|
134,691,902
|
$
|
—
|
$
|
134,691,902
|
||||||||
|
Collateralized
|
||||||||||||||||
|
Mortgage Obligations
|
—
|
1,455,866
|
—
|
1,455,866
|
||||||||||||
|
U.S. Government
|
||||||||||||||||
|
Agency Obligations
|
—
|
4,380,671
|
—
|
4,380,671
|
||||||||||||
|
U.S. Treasury Obligations
|
—
|
38,897,068
|
—
|
38,897,068
|
||||||||||||
|
Short-Term Investments
|
4,055,803
|
—
|
—
|
4,055,803
|
||||||||||||
|
Total Investments in Securities
|
$
|
4,055,803
|
$
|
179,425,507
|
$
|
—
|
$
|
183,481,310
|
||||||||
Refer to the Fund’s schedule of investments for a detailed break-out of securities by industry classification. Transfers among levels are recognized at the end of the reporting period. During the eleven months ended March 31, 2017, the Fund recognized no transfers among levels. There were no level 3 securities held in the Fund for the eleven months ended March 31, 2017.
30
Pemberwick Fund
|
NOTES TO FINANCIAL STATEMENTS (Continued)
|
|
March 31, 2017
|
NOTE 4 – INVESTMENT ADVISORY FEE AND OTHER TRANSACTIONS WITH AFFILIATES
For the eleven months ended March 31, 2017, the Advisor provided the Fund with investment management services under an Investment Advisory Agreement. The Advisor furnishes all investment advice, office space, and facilities, and provides most of the personnel needed by the Fund. Effective December 5, 2016, as compensation for its services, the Advisor is entitled to a monthly fee at an annual rate of 0.25% for the Fund based upon the average daily net assets of the Fund. The Board previously approved a new Investment Advisory agreement between the Trust, on behalf of the Fund, and the Advisor, pursuant to which the Advisor has agreed to reduce the Fund’s Advisor fee from 0.50% to 0.25%, effective December 5, 2016. Prior to the reorganization, the Advisor was entitled to receive 0.50%. For the eleven months ended March 31, 2017, the Fund incurred $639,059 in advisory fees. For the year ended April 30, 2016, the Fund incurred $821,157 in advisory fees. Advisory fees payable at March 31, 2017 for the Fund were $21,677. The Advisor has hired J.P. Morgan Investment Management Inc. as a sub-advisor to manage the U.S. Treasuries and agency debt portion of the Fund. The Advisor pays the Sub-Advisor fee for the Pemberwick Fund from its own assets and these fees are not an additional expense of the Fund.
The Fund is responsible for its own operating expenses. The Advisor voluntarily waives 10 basis points of the annual investment advisory fee Pemberwick is entitled to receive from the Fund pursuant to the advisory agreement between Pemberwick and the Fund. Such waiver will continue until Pemberwick notifies the Fund of a change in its voluntary waiver or its discontinuation.
For the eleven months ended March 31, 2017, the Advisor reduced its fees and absorbed Fund expenses in the amount of $408,525 for the Fund. For the year ended April 30, 2016, the Advisor reduced its fees and absorbed Fund expenses in the amount of $574,850.
Beginning December 6, 2016, U.S. Bancorp Fund Services, LLC (“USBFS” or the “Administrator”) acts as the Fund’s Administrator under an Administration Agreement. The Administrator prepares various federal and state regulatory filings, reports and returns for the Fund; prepares reports and materials to be supplied to the Trustees; monitors the activities of the Fund’s custodian, transfer agent and accountants; coordinates the preparation and payment of the Fund’s expenses and reviews the Fund’s expense accruals. BNY Mellon Investment Servicing (US) Inc. (“BNY Mellon”) provided administrative and accounting services to the Fund pursuant to an Accounting and Administrative Services Agreement through December 5, 2016. Effective December 5, 2016, U.S. Bancorp Fund Services, LLC also serves as the fund accountant and transfer agent to the Fund. Vigilant Compliance, LLC serves as the Chief Compliance Officer to the Fund. U.S. Bank N.A., an affiliate of U.S. Bancorp Fund Services, serves
31
Pemberwick Fund
|
NOTES TO FINANCIAL STATEMENTS (Continued)
|
|
March 31, 2017
|
as the Fund’s custodian. The Bank of New York Mellon served as custodian and Chief Compliance Officer through December 5, 2016. For the eleven months ended March 31, 2017 and the year ended April 30, 2016, the Fund incurred the following expenses for administration, fund accounting, transfer agency, custody and Chief Compliance Officer fees:
|
BNY
|
BNY Mellon
|
||||||||||||
|
USBFS
|
Mellon
|
(April 30, 2016)
|
|||||||||||
|
Administration & fund accounting
|
$
|
64,473
|
$
|
121,470
|
$
|
198,425
|
|||||||
|
Custody
|
$
|
7,063
|
$
|
10,193
|
$
|
24,989
|
|||||||
|
Transfer agency
|
$
|
9,027
|
(a)
|
$
|
18,644
|
(a)
|
$
|
49,971
|
|||||
|
Chief Compliance Officer
|
$
|
7,060
|
$
|
26,978
|
$
|
22,900
|
|||||||
|
(a) Does not include out-of-pocket expenses.
|
|||||||||||||
At March 31, 2017, the Fund had payables due to U.S. Bancorp Fund Services, LLC for administration, fund accounting and transfer agency fees and to U.S. Bank N.A. for custody fees in the following amounts:
|
Administration & fund accounting
|
$
|
26,683
|
|||
|
Custody
|
$
|
3,180
|
|||
|
Transfer agency(a)
|
$
|
3,913
|
|||
|
(a) Does not include out-of-pocket expenses.
|
Effective December 5, 2016, Quasar Distributors, LLC (the “Distributor”) acts as the Fund’s principal underwriter in a continuous public offering of the Fund’s shares. The Distributor is an affiliate of the Administrator.
Certain officers of the Fund are employees of the Administrator. A Trustee of the Trust is affiliated with USBFS and U.S. Bank N.A. This same Trustee is an interested person of the Distributor.
NOTE 5 – SECURITIES TRANSACTIONS
For the eleven months ended March 31, 2017 and the year ended April 30, 2016, the cost of purchases and the proceeds from sales of securities, excluding short-term securities, were as follows:
|
Eleven Months Ended
|
Year Ended
|
||
|
March 31, 2017*
|
April 30, 2016
|
||
|
Purchases
|
|||
|
U.S. Government Obligations
|
$18,226,934
|
$16,505,912
|
|
|
Other
|
$58,687,071
|
$56,869,536
|
|
|
Sales
|
|||
|
U.S. Government Obligations
|
$15,525,168
|
$23,491,691
|
|
|
Other
|
$10,481,650
|
$45,831,642
|
|
|
* Fund changed its fiscal year from April 30 to March 31.
|
32
Pemberwick Fund
|
NOTES TO FINANCIAL STATEMENTS (Continued)
|
|
March 31, 2017
|
NOTE 6 – INCOME TAXES AND DISTRIBUTIONS TO SHAREHOLDERS
As of March 31, 2017, the components of accumulated earnings/(losses) on a tax basis were as follows:
|
Cost of investments(a)
|
$
|
183,272,151
|
|||
|
Gross unrealized appreciation
|
445,190
|
||||
|
Gross unrealized depreciation
|
(236,031
|
)
|
|||
|
Net unrealized appreciation
|
209,159
|
||||
|
Undistributed ordinary income
|
—
|
||||
|
Undistributed long-term capital gain
|
—
|
||||
|
Total distributable earnings
|
—
|
||||
|
Other accumulated gains/(losses)
|
(648,600
|
)
|
|||
|
Total accumulated earnings/(losses)
|
$
|
(439,441
|
)
|
|
(a)
|
The difference between the book basis and tax basis net unrealized appreciation and cost is attributable primarily to wash sales.
|
At March 31, 2017, the Fund has tax basis capital losses of $10,862 and $9,955 that expire in 2018 and 2019, respectively, to offset future capital gains. The Fund also has short-term tax basis capital losses of $203,612 with no expiration date and long-term tax basis capital losses of $424,171 with no expiration date.
The tax character of distributions paid during 2017, 2016 and 2015 was as follows:
|
Eleven Months Ended
|
Year Ended
|
Year Ended
|
|||||||||||||
|
March 31, 2017
|
April 30, 2016
|
April 30, 2015
|
|||||||||||||
|
Ordinary income
|
$
|
1,482,522
|
$
|
1,543,193
|
$
|
1,629,122
|
|||||||||
|
Long-term capital gains
|
$
|
—
|
$
|
—
|
$
|
—
|
|||||||||
NOTE 7 – PRINCIPAL RISKS
The following is a list of certain risks that may apply to your investment in the Fund. Further information about investment risks is available in the Fund’s Statement of Additional Information.
Credit Risk: Credit risk is the risk that an issuer will not make timely payments of principal and interest. A credit rating assigned to a particular debt security is essentially the opinion of an NRSRO as to the credit quality of an issuer and may prove to be inaccurate. There is also the risk that a bond issuer may “call,” or repay, its high yielding bonds before their maturity dates.
Concentration Risk: By concentrating its assets in the banking industry, the Fund is subject to the risk that economic, business, political or other conditions that have a negative effect on the banking industry will negatively impact the Fund to a greater extent than if the Fund’s assets were diversified across different industries or sectors.
33
Pemberwick Fund
|
NOTES TO FINANCIAL STATEMENTS (Continued)
|
|
March 31, 2017
|
Deflation Risk: Deflation to the U.S. economy may cause principal to decline and inflation-linked securities could underperform securities whose interest payments are not adjusted for inflation or linked to a measure of inflation.
Fixed Income Market Risks: Fixed-income securities are or may be subject to interest rate, credit, liquidity, prepayment and extension risks. There is also the risk that an issuer may “call,” or repay, its high yielding bonds before their maturity dates. Fixed-income securities subject to prepayment can offer less potential for gains during a declining interest rate environment and similar or greater potential for loss in a rising interest rate environment. Limited trading opportunities for certain fixed-income securities may make it more difficult to sell or buy a security at a favorable price or time.
Interest Rate Risk: Interest rates may go up resulting in a decrease in the value of the securities held by the Fund. Interest rates have been historically low, so the Fund faces a heightened risk that interest rates may rise. Debt securities subject to prepayment can offer less potential for gains during a declining interest rate environment and similar or greater potential for loss in a rising interest rate environment.
Management Risk: The Advisor’s or Sub-Advisor’s judgments about the attractiveness, value and potential appreciation of the Fund’s investments may prove to be incorrect and the investment strategies employed by the Advisor and the Sub-Advisor in selecting investments for the Fund may not result in an increase in the value of your investment or in overall performance equal to other similar investment vehicles having similar investment strategies.
Market Risk: Certain investments selected for the Fund’s portfolio may be worth less than the price originally paid for them, or less than they were worth at an earlier time. The value of the Fund’s investments may go up or down, sometimes dramatically and unpredictably, based on current market conditions, such as real or perceived adverse political or economic conditions, inflation, changes in interest rates, lack of liquidity in the fixed income markets or adverse investor sentiment.
Municipal Securities Risk: The municipal market is volatile and can be significantly affected by adverse tax, legislative or political changes and the financial condition of the issuers of municipal securities. Budgetary constraints of local, state, and federal governments upon which the issuers may be relying for funding may also impact municipal securities. In addition, changes in the financial condition of an individual municipal insurer can affect the overall municipal market, and market conditions may directly impact the liquidity and valuation of municipal securities.
Non-Diversification Risk: Because the Fund is “non-diversified,” it may invest a greater percentage of its assets in the securities of a single issuer. As a result, a decline in the value of an investment in a single issuer could cause the Fund’s overall value to decline to a greater degree than if the Fund held a more diversified portfolio.
34
Pemberwick Fund
|
NOTES TO FINANCIAL STATEMENTS (Continued)
|
|
March 31, 2017
|
Prepayment Risk: In times of declining interest rates, the Fund’s higher yielding securities will be prepaid, and the Fund will have to replace them with securities having a lower yield.
U.S. Government Agencies and Instrumentalities Securities Risk: Securities issued by U.S. Government agencies and instrumentalities have different levels of U.S. Government credit support. Some are backed by the full faith and credit of the U.S. Government, while others are supported by only the discretionary authority of the U.S. Government or only by the credit of the agency or instrumentality. No assurance can be given that the U.S. Government will provide financial support to U.S. Government-sponsored instrumentalities because they are not obligated to do so by law. Guarantees of timely prepayment of principal and interest do not assure that the market prices and yields of the securities are guaranteed nor do they guarantee the net asset value or performance of the Fund, which will vary with changes in interest rates, the Advisor’s success and other market conditions.
NOTE 8 – COMMITMENTS AND CONTINGENCIES
In the normal course of business, the Fund enters into contracts that contain a variety of representations and warranties and which provide general indemnifications. The Fund’s maximum exposure under these arrangements is unknown, as this would involve future claims that may be made against the Fund that have not yet occurred. However, based on experience, the Fund expects the risk of loss to be remote.
NOTE 9 – CONTROL OWNERSHIP
The beneficial ownership, either directly or indirectly of more than 25% of the voting securities of a Fund creates a presumption of control of the Fund, under Section 2(a)(9) of the Investment Company Act of 1940. While no individual shareholder has a position which exceeds 25% of the voting securities of the Fund, there are numerous shareholders who are affiliated with the Advisor. As of March 31, 2017, investors who are affiliated with the Advisor, when aggregated, owned 99% of the voting securities of the Fund.
NOTE 10 – FUND REORGANIZATION AND OTHER INFORMATION
On November 17, 2016 the shareholders of the Predecessor Fund approved the agreement and plan of reorganization providing for the transfer of assets of the Predecessor Fund to the Pemberwick Fund and the assumption of the liabilities of the Predecessor Fund by the Pemberwick Fund. The following table illustrates the specifics of the reorganization:
|
Acquired
|
Shares issued to
|
Acquiring
|
||||
|
Fund
|
Shareholders of
|
Fund
|
Combined
|
Tax Status
|
||
|
Net Assets
|
Acquired Fund
|
Net Assets
|
Net Assets
|
of Transfer
|
||
|
$172,520,816(1)
|
17,199,770
|
—
|
$172,520,816
|
Non-taxable
|
|
(1)
|
Includes accumulated realized losses and unrealized appreciation in the amounts of $(687,423) and $304,572, respectively.
|
35
Pemberwick Fund
|
NOTES TO FINANCIAL STATEMENTS (Continued)
|
|
March 31, 2017
|
In connection with a reorganization of the Fund into the Trust effective December 5, 2016, the Board approved the retention of U.S. Bancorp Fund Services, LLC (“USBFS”), U.S. Bank N.A. (“U.S. Bank”), Quasar Distributors LLC (“Quasar”) and Vigilant Compliance, LLC (“Vigilant”) as new service providers to the Fund. The new service agreements became effective on December 6, 2016. The Fund’s prior service agreements with BNY Mellon were terminated on December 5, 2016.
NOTE 11 – CHANGE IN AUDITOR DISCLOSURE
To facilitate the various series of Manager Directed Portfolios (the “Trust”) having a common independent registered public accounting firm, the decision to dismiss PricewaterhouseCoopers LLP (“PwC”) effective upon its completion of its audit for the fiscal year ended April 30, 2016 was recommended by the Fund’s Audit Committee and approved by the Fund’s Board of Trustees on February 6, 2017.
PwC’s reports on the Fund’s financial statements for the fiscal years ended April 30, 2016 and April 30, 2015 contained no adverse opinion or disclaimer of opinion, nor were they qualified or modified as to uncertainty, audit scope, or accounting principles. During the Fund’s two most recent fiscal years and through March 14, 2017 (i) there were no disagreements with PwC on any matter of accounting principles or practices, financial statement disclosure, or auditing scope or procedure, which disagreements, if not resolved to the satisfaction of PwC, would have caused them to make reference to the subject matter of the disagreements in connection with their reports on the Fund’s financial statements for such years; and (ii) there were no “reportable events” of the kind described in Item 304(a)(1)(v) of Regulation S-K.
The Trust has selected BBD, LLP (“BBD”) to serve as the Fund’s independent registered public accounting firm for the Fund’s fiscal year ended March 31, 2017. The decision to select BBD was recommended by the Trust’s Audit Committee on February 6, 2017 and was approved by the Trust’s Board of Trustees on February 6, 2017. During the Fund’s two most recent fiscal years and through March 14, 2017, neither the Fund, nor anyone on its behalf, consulted with BBD on items which: (i) concerned the application of accounting principles to a specified transaction, either completed or proposed, or the type of audit opinion that might be rendered on the Fund’s financial statements; or (ii) concerned the subject of a disagreement (as defined in paragraph (a)(1)(iv) of said Item 304). The selection of BBD does not reflect any disagreements with or dissatisfaction by the Fund or the Trust’s Board of Trustees with the performance of the Fund’s prior independent registered public accounting firm, PwC.
36
Pemberwick Fund
|
REPORT OF INDEPENDENT REGISTERED PUBLIC ACCOUNTING FIRM
|
To the Board of Trustees of
Manager Directed Portfolios
and the Shareholders of Pemberwick Fund
We have audited the accompanying statement of assets and liabilities of Pemberwick Fund, a series of Manager Directed Portfolios, (the “Fund”) including the schedule of investments, as of March 31, 2017, and the related statements of operations and changes in net assets and the financial highlights for the period May 1, 2016 through March 31, 2017. These financial statements and financial highlights are the responsibility of the Fund’s management. Our responsibility is to express an opinion on these financial statements and financial highlights based on our audit. The statement of operations for the year ended April 30, 2016, the statements of changes in net assets for each of the two years in the period ended April 30, 2016 and the financial highlights for each of the five years in the period ended April 30, 2016 were audited by other auditors, whose report dated June 28, 2016 expressed an unqualified opinion on those financial highlights.
We conducted our audit in accordance with the standards of the Public Company Accounting Oversight Board (United States). Those standards require that we plan and perform the audits to obtain reasonable assurance about whether the financial statements and financial highlights are free of material misstatement. An audit includes examining, on a test basis, evidence supporting the amounts and disclosures in the financial statements. Our procedures included confirmation of securities owned as of March 31, 2017 by correspondence with the custodian. An audit also includes assessing the accounting principles used and significant estimates made by management, as well as evaluating the overall financial statement presentation. We believe that our audit provides a reasonable basis for our opinion.
In our opinion, the financial statements and financial highlights referred to above present fairly, in all material respects, the financial position of Pemberwick Fund as of March 31, 2017, and the results of its operations, the changes in its net assets and its financial highlights for the period May 1, 2016 through March 31, 2017, in conformity with accounting principles generally accepted in the United States of America.

BBD, LLP
Philadelphia, Pennsylvania
May 30, 2017
37
Pemberwick Fund
|
EXPENSE EXAMPLE
|
|
March 31, 2017 (Unaudited)
|
As a shareholder of the Fund, you incur two types of costs: (1) transaction costs including sales charges (loads) and redemption fees, if applicable; and (2) ongoing costs, including management fees; distribution and/or service (12b-1 fees); and other Fund expenses. This Example is intended to help you understand your ongoing costs (in dollars) of investing in the Fund and to compare these costs with the ongoing costs of investing in other mutual funds.
The Example is based on an investment of $1,000 invested at the beginning of the period indicated and held for the entire period from October 1, 2016 to March 31, 2017.
Actual Expenses
The information in the table under the heading “Actual” provides information about actual account values and actual expenses. You may use the information in these columns together with the amount you invested, to estimate the expenses that you paid over the period. Simply divide your account value by $1,000 (for example, an $8,600 account value divided by $1,000 = 8.6), then multiply the result by the number in the row entitled “Expenses Paid During Period” to estimate the expenses you paid on your account during this period. There are some account fees that are charged to certain types of accounts, such as Individual Retirement Accounts (generally, a $15 fee is charged to the account annually) that would increase the amount of expenses paid on your account. The example below does not include portfolio trading commissions and related expenses and other extraordinary expenses as determined under generally accepted accounting principles.
Hypothetical Example for Comparison Purposes
The information in the table under the heading “Hypothetical (5% return before expenses)” provides information about hypothetical account values and hypothetical expenses based on the Fund’s actual expense ratio and assumed rate of return of 5% per year before expenses, which is not the Fund’s actual return. The hypothetical account values and expenses may not be used to estimate the actual ending account balance or expenses you paid for the period. You may use this information to compare the ongoing costs of investing in the Fund and other funds. To do so, compare this 5% hypothetical example with the 5% hypothetical examples that appear in the shareholder reports of the other funds. As noted above, there are some account fees that are charged to certain types of accounts that would increase the amount of expense paid on your account.
Please note that the expenses shown in the table are meant to highlight your ongoing costs only and do not reflect any transaction costs, such as sales charges (loads), redemption fees, or exchange fees. Therefore, the information under the heading “Hypothetical (5% return before expenses)” is useful in comparing ongoing costs only, and will not help you determine the relative total costs of owning different funds. In addition, if these transactional costs were included, your costs would have been higher.
38
Pemberwick Fund
|
EXPENSE EXAMPLE (Continued)
|
|
March 31, 2017 (Unaudited)
|
|
Beginning
|
Ending
|
Expenses Paid
|
|
|
Account Value
|
Account Value
|
During Period(1)
|
|
|
10/1/2016
|
3/31/2017
|
10/1/2016 – 3/31/2017
|
|
|
Actual
|
|||
|
Total Fund
|
$1,000.00
|
$1,001.90
|
$2.00
|
|
Hypothetical (5% return
|
|||
|
before expenses)
|
|||
|
Total Fund
|
$1,000.00
|
$1,022.94
|
$2.02
|
|
(1)
|
Expenses are equal to the Fund’s annualized expense ratio of 0.40%, multiplied by the average account value over the period, multiplied by 182/365 (to reflect the period).
|
39
Pemberwick Fund
|
NOTICE TO SHAREHOLDERS
|
|
at March 31, 2017 (Unaudited)
|
How to Obtain a Copy of the Fund’s Proxy Voting Policies
A description of the policies and procedures that the Fund uses to determine how to vote proxies relating to portfolio securities is available without charge, upon request, by calling 1-888-893-4491 or on the U.S. Securities and Exchange Commission’s (“SEC”) website at http://www.sec.gov.
How to Obtain a Copy of the Fund’s Proxy Voting Records for the most recent 12-Month Period Ended June 30
Information regarding how the Fund voted proxies relating to portfolio securities during the most recent 12-month period ended June 30 is available no later than August 31 without charge, upon request, by calling 1-888-893-4491. Furthermore, you can obtain the Fund’s proxy voting records on the SEC’s website at http://www.sec.gov.
Quarterly Filings on Form N-Q
The Fund files its complete schedule of portfolio holdings with the SEC for the first and third quarters of each fiscal year on Form N-Q. The Fund’s Form N-Q is available on the SEC’s website at http://www.sec.gov. The Fund’s Form N-Q may be reviewed and copied at the SEC’s Public Reference Room in Washington, DC, and information on the operation of the Public Reference Room may be obtained by calling 1-202-551-8090. Information included in the Fund’s Form N-Q is also available, upon request, by calling 1-888-893-4491.
Householding
In an effort to decrease costs, the Fund intends to reduce the number of duplicate prospectuses and annual and semi-annual reports you receive by sending only one copy of each to those addresses shared by two or more accounts and to shareholders the Transfer Agent reasonably believes are from the same family or household. Once implemented, if you would like to discontinue householding for your accounts, please call toll-free at 1-888-893-4491 to request individual copies of these documents. Once the Transfer Agent receives notice to stop householding, the Transfer Agent will begin sending individual copies thirty days after receiving your request. This policy does not apply to account statements.
40
Pemberwick Fund
|
TRUSTEES AND OFFICERS
|
|
(Unaudited)
|
This chart provides information about the Trustees and Officers who oversee the Fund. Officers elected by the Trustees manage the day-to-day operations of the Funds and execute policies formulated by the Trustees. The information in the chart is as of April 1, 2017.
|
Number of
|
|||||
|
Portfolios
|
Other
|
||||
|
Position(s) Held
|
in Fund
|
Directorships
|
|||
|
Name
|
with the Trust
|
Complex
|
Held by
|
||
|
(Year of Birth)
|
and Length of
|
Principal Occupation(s)
|
Overseen by
|
Trustee During
|
|
|
and Address(1)
|
Time Served(3)
|
During Past Five Years
|
Trustee
|
Past Five Years
|
|
|
INTERESTED TRUSTEE
|
|||||
|
James R.
|
Trustee since
|
President and CEO,
|
2
|
None
|
|
|
Schoenike(2)
|
July 2016
|
Board of Managers,
|
|||
|
(Born 1959)
|
Quasar Distributors, LLC,
|
||||
|
since 2000
|
|||||
|
INDEPENDENT TRUSTEES
|
|||||
|
Gaylord B. Lyman
|
Trustee and Audit
|
Senior Portfolio Manager,
|
2
|
None
|
|
|
(Born 1962)
|
Committee
|
Affinity Investment Advisors,
|
|||
|
Chairman, since
|
LLC, since 2017; Managing
|
||||
|
April 2015
|
Director of Kohala Capital
|
||||
|
Partners, LLC, (2011 – 2016);
|
|||||
|
Vice President, Becker Capital
|
|||||
|
Management, Inc. (1997 – 2011)
|
|||||
|
Scott Craven Jones
|
Trustee since
|
Managing Director,
|
2
|
Director,
|
|
|
(Born 1962)
|
July 2016
|
Carne Global Financial
|
Guestlogix Inc.
|
||
|
Services (US) LLC, since 2013;
|
(a provider of
|
||||
|
Adviser, Wanzenburg Partners
|
ancillary-focused
|
||||
|
(2012 – 2013); Chief Operating
|
technology to the
|
||||
|
Officer and Chief Financial
|
travel industry),
|
||||
|
Officer, Aurora Investment
|
2015 – 2016.
|
||||
|
Management (2010 – 2012)
|
|||||
|
Lawrence T.
|
Trustee since
|
Senior Vice President and
|
2
|
None
|
|
|
Greenberg
|
July 2016
|
Chief Legal Officer, The Motley
|
|||
|
(Born 1963)
|
Fool Holdings, Inc., since 1996;
|
||||
|
General Counsel, Motley Fool
|
|||||
|
Asset Management, LLC, since
|
|||||
|
2008; Manager, Motley Fool
|
|||||
|
Wealth Management, LLC,
|
|||||
|
since 2013; Adjunct Professor,
|
|||||
|
Washington College of Law,
|
|||||
|
American University, since 2006
|
|
(1)
|
The address of each Trustee as it relates to the Trust’s business is c/o U.S. Bancorp Fund Services LLC, 615 East Michigan Street, Milwaukee, WI 53202.
|
|
(2)
|
Mr. Schoenike is an Interested Trustee by virtue of his position as President of Quasar Distributors, LLC, the Funds’ distributor.
|
|
(3)
|
Each Trustee serves during the continued lifetime of the Trust until he dies, resigns, is declared bankrupt or incompetent by a court of competent jurisdiction, or is removed.
|
41
Pemberwick Fund
|
TRUSTEES AND OFFICERS (Continued)
|
|
(Unaudited)
|
|
Name
|
Position(s) Held with
|
|
|
(Year of Birth)
|
the Trust and Length
|
|
|
and Address
|
of Time Served(3)
|
Principal Occupation(s) During Past Five Years
|
|
Douglas J. Neilson(1)
|
President and Principal
|
Vice President, Compliance and Administration,
|
|
(Born 1975)
|
Executive Officer, since
|
USBFS, since 2001
|
|
July 1, 2016
|
||
|
Matthew J. McVoy(1)
|
Treasurer and Principal
|
Assistant Vice President, Compliance and
|
|
(Born 1980)
|
Financial Officer,
|
Administration, USBFS, since 2005
|
|
since July 1, 2016
|
||
|
Nathan R. Bentley, CPA(1)
|
Assistant Treasurer,
|
Officer, Compliance and Administration, USBFS,
|
|
(Born 1983)
|
since July 1, 2016
|
since 2012; Master of Science, Accounting Graduate,
|
|
University of Wisconsin-Milwaukee (2010 – 2012)
|
||
|
Gerard Scarpati(2)
|
Chief Compliance
|
Compliance Director, Vigilant, since 2010
|
|
(Born 1955)
|
Officer and
|
|
|
Anti-Money Laundering
|
||
|
Compliance Officer,
|
||
|
since July 1, 2016
|
||
|
Rachel Spearo(2)
|
Secretary,
|
Vice President, Compliance and Administration,
|
|
(Born 1979)
|
since
|
USBFS, since 2004
|
|
November 14, 2016
|
|
(1)
|
The mailing address of this officer is: 615 East Michigan Street, Milwaukee, Wisconsin 53202.
|
|
(2)
|
The mailing address of this officer is: 223 Wilmington West Chester Pike, Suite 216, Chadds Ford, Pennsylvania 19317.
|
|
(3)
|
Each officer is elected annually and serves until his or her successor has been duly elected and qualified.
|
The Statement of Additional Information includes additional information about the Fund’s Trustees and Officers and is available, without charge, upon request by calling 1-888-893-4491.
42
Pemberwick Fund
|
APPROVAL OF THE PEMBERWICK FUND’S INVESTMENT ADVISORY
|
|
AGREEMENT AND SUB-ADVISORY AGREEMENT (Unaudited)
|
The Board of Trustees (the “Board”) of Manager Directed Portfolios (the “Trust”) met on September 27, 2016 to consider the initial approval of the Investment Advisory Agreement (the “Advisory Agreement”) between the Trust, on behalf of the Pemberwick Fund (the “Fund”), a series of the Trust, and the Fund’s investment adviser, Pemberwick Investment Advisors LLC (“PIA”), and the approval of the Sub-Advisory Agreement (the “Sub-Advisory Agreement,” and, together with the Advisory Agreement, the “Agreements”) between PIA and the Fund’s investment sub-adviser, J.P. Morgan Investment Management Inc. (“JPM”). Prior to the meeting on September 27, 2016, the Board requested and received materials to assist them in considering the approval of the Agreements. The materials provided contained information with respect to the factors enumerated below, including draft copies of the Agreements, a memorandum prepared by the Trust’s outside legal counsel discussing in detail the Board’s fiduciary obligations and the factors the Board should consider in considering the renewal of the Agreements, detailed comparative information relating to the performance of the Fund’s predecessor, the Pemberwick Fund, a series of FundVantage Trust (the “Predecessor Fund”), as well as the management fee, sub-advisory fee and other expenses of the Fund, due diligence materials relating to PIA and JPM, including PIA’s and JPM’s Form ADV, and other pertinent information. Based on their evaluation of the information provided by PIA and JPM, the Trustees (including a majority of the Trustees who are not “interested persons,” as that term is defined in the Investment Company Act of 1940, as amended (the “Independent Trustees”)), approved the Advisory Agreement and Sub-Advisory Agreement each for an initial two-year term. Below is a summary of the factors considered by the Board and the conclusions that formed the basis for the Board’s approval of the Agreements.
|
1.
|
NATURE, EXTENT AND QUALITY OF SERVICES TO BE PROVIDED TO THE FUND. The Trustees considered the nature, extent and quality of services that would be provided by PIA to the Fund and the amount of time to be devoted by PIA’s staff to the Fund’s operations. The Trustees considered PIA’s specific responsibilities in all aspects of day-to-day management of the Fund, as well as the qualifications, experience and responsibilities of key personnel at PIA and JPM who would be involved in the day-to-day activities of the Fund, including Jim Hussey, who would continue to serve as portfolio manager of the Fund, and Gregg Hrivnak, Richard Figuly, and Susan Parekh, who would continue to serve as co-portfolio managers for the sleeve of the Fund’s portfolio sub-advised by JPM. The Trustees reviewed the structure of PIA’s and JPM’s compliance programs, PIA’s commitment to the Fund, as well as the information provided by PIA and JPM in response to the due diligence questionnaire and other information provided by PIA and JPM, all of which was included in the materials provided to the Board in advance of the September 27, 2016 meeting. The Trustees also noted any services that extended beyond portfolio management, and considered the overall capability of PIA and JPM to manage the Fund’s assets. The Trustees, in consultation with
|
43
Pemberwick Fund
|
APPROVAL OF THE PEMBERWICK FUND’S INVESTMENT ADVISORY
|
|
AGREEMENT AND SUB-ADVISORY AGREEMENT (Unaudited) (Continued)
|
|
counsel to the Independent Trustees, reviewed PIA’s and JPM’s compliance programs and received an affirmation from the Trust’s CCO that PIA’s and JPM’s compliance programs were compliant with Rule 206(4)-7(a) promulgated under the Advisers Act. The Trustees concluded that PIA and JPM had sufficient quality and depth of personnel, resources, investment methods and compliance policies and procedures essential to performing their duties under the Advisory Agreement and Sub-Advisory Agreement, respectively, and that the nature, overall quality and extent of the management services to be provided to the Fund were satisfactory.
|
||
|
2.
|
INVESTMENT PERFORMANCE OF THE PREDECESSOR FUND, THE ADVISER AND THE SUB-ADVISER. In assessing the portfolio management services to be provided by PIA and JPM, the Trustees reviewed the investment management experience of Mr. Hussey, who would serve as the Fund’s portfolio manager, and of Mr. Hrivnak, Mr. Figuly, and Ms. Parekh, who would serve as portfolio managers of JPM’s sleeve of Fund assets. As part of their review, the Trustees reviewed the performance of the Predecessor Fund in comparison to a benchmark index, the Barclays 1-3 Year Government/Credit Index. The Trustees examined the performance of the Predecessor Fund for the year-to-date periods ended April 30, 2016 and June 30, 2016 and for the one-year, three-year, five-year and since inception periods ended April 30, 2016 and June 30, 2016. The Trustees noted the Predecessor Fund’s performance tracked very closely to the benchmark index.
|
|
|
The Trustees concluded that the performance obtained by PIA as the advisor and JPM as the sub-advisor for the Fund was satisfactory under applicable market conditions. Although past performance is not a guarantee or indication of future results, the Trustees determined that the Fund and its shareholders were likely to benefit from PIA’s and JPM’s portfolio management services.
|
||
|
3.
|
COSTS OF SERVICES PROVIDED AND PROFITS TO BE REALIZED BY THE ADVISER. The Trustees then considered the cost of services and the structure of PIA’s proposed management fee, including a review of the expense analysis and other pertinent material with respect to the Fund. The Trustees considered data relating to the cost structure of the Fund relative to a peer group of U.S. open-end short-term bond funds with assets in the $100-$300 million range, as compiled by Morningstar (the “Morningstar Peer Group”), which had been included in the materials provided for the September 27, 2016 meeting. The Board considered the Fund’s proposed management fee of 0.25% for Fund assets, noting the fee fell in the first quartile for the Morningstar Peer Group, below the Morningstar Peer Group average fee of 0.61%, which fell in the third quartile. The Board further noted PIA had agreed to voluntarily waive its management fees and/or reimburse Fund expenses in the amount of 0.10%. The Trustees also
|
44
Pemberwick Fund
|
APPROVAL OF THE PEMBERWICK FUND’S INVESTMENT ADVISORY
|
|
AGREEMENT AND SUB-ADVISORY AGREEMENT (Unaudited) (Continued)
|
|
considered the overall profitability of PIA that may result from its management of the Fund, considering PIA’s financial statements. The Trustees also examined the level of profits that could be expected to accrue to PIA from the fees payable under the Advisory Agreement and Sub-Advisory Agreement.
|
||
|
The Trustees concluded the Fund’s expenses and the fees to be paid to PIA were fair and reasonable in light of the comparative expense and management fee information and the investment management services to be provided to the Fund by PIA. The Trustees further concluded, based on a profitability analysis prepared by PIA, that PIA’s projected profit from the Fund would not be excessive and PIA has sufficient financial resources to support its provision of advisory services to the Fund.
|
||
|
The Trustees considered the sub-advisory fee payable by PIA to JPM and found it to be reasonable. In considering the sub-advisory fee, the Trustees noted that it is paid by PIA, and not the Fund.
|
||
|
4.
|
EXTENT OF ECONOMIES OF SCALE AS THE FUND GROWS. The Trustees considered the potential economies of scale that the Fund might realize under the proposed management fee and expense ratio. The Trustees noted that PIA’s management fee did not currently include breakpoint reductions, but that PIA had, historically, voluntarily waived a portion of its advisory fee for the Predecessor Fund. The Trustees noted JPM’s fee did include breakpoints, but that JPM’s fee was paid by PIA and not the Fund, so any fee reduction accrued to PIA’s benefit. After considering PIA’s advisory fee and potential voluntary fee waivers and expense reimbursements, the Trustees concluded the potential economies of scale with respect to the Fund were acceptable given its current asset size.
|
|
|
5.
|
BENEFITS TO BE DERIVED FROM THE RELATIONSHIP WITH THE FUND. The Trustees considered the direct and indirect benefits that could be received by PIA from its association with the Fund. Based on the information presented, the Trustees did not consider any ancillary benefits to PIA or JPM serving as investment adviser and sub-adviser to the Fund, respectively, to be relevant factors.
|
In considering the Advisory Agreement and Sub-Advisory Agreement, the Trustees did not identify any one factor as all-important, but rather considered these factors collectively in light of the Fund’s surrounding circumstances. Based on this review, the Trustees, including a majority of the Independent Trustees, approved the Advisory Agreement and Sub-Advisory Agreement as being in the best interests of the Fund and its shareholders.
45
Pemberwick Fund
|
PRIVACY NOTICE
|
|
FACTS
|
WHAT DOES THE PEMBERWICK FUND (“THE FUND”) DO WITH YOUR
PERSONAL INFORMATION?
|
|||
|
Why?
|
Financial companies choose how they share your personal information. Federal law gives consumers the right to limit some but not all sharing. Federal law also requires us to tell you how we collect, share, and protect your personal information. Please read this notice carefully to understand what we do.
|
|||
|
What?
|
The types of personal information we collect and share depends on the product or service you have with us. This information can include:
|
|||
|
• Social Security number
|
||||
|
• account balances
|
||||
|
• account transactions
|
||||
|
• transaction history
|
||||
|
• wire transfer instructions
|
||||
|
• checking account information
|
||||
|
When you are no longer our customer, we continue to share your information as described in this notice.
|
||||
|
How?
|
All financial companies need to share customers’ personal information to run their everyday business. In the section below, we list the reasons financial companies can share their customers’ personal information; the reasons the Fund chooses to share; and whether you can limit this sharing.
|
|
Does the
|
Can you limit
|
||
|
Reasons we can share your personal information
|
Fund share?
|
this sharing?
|
|
|
For our everyday business purposes – such as to process your
|
Yes
|
No
|
|
|
transactions, maintain your account(s), respond to court orders
|
|||
|
and legal investigations, or report to credit bureaus.
|
|||
|
For our marketing purposes –
|
Yes
|
No
|
|
|
to offer our products and services to you
|
|||
|
For joint marketing with other financial companies
|
No
|
We do not share
|
|
|
For our affiliates’ everyday business purposes –
|
Yes
|
No
|
|
|
information about your transactions and experiences
|
|||
|
For our affiliates’ everyday business purposes –
|
No
|
We do not share
|
|
|
information about your creditworthiness
|
|||
|
For our affiliates to market to you – The Fund may share
|
Yes
|
Yes
|
|
|
information with our affiliates about shareholders or shareholder
|
|||
|
accounts in order to make shareholders aware of services and
|
|||
|
products which the Fund thinks may be of interest or value to them
|
|||
|
For nonaffiliates to market to you
|
No
|
We do not share
|
|
To Limit the
|
To limit our sharing, please notify us in the following way:
|
|||
|
Fund’s Sharing
|
• Contact the Fund by calling our toll-free phone number 1-888-893-4491.
|
|||
|
Your choice to limit the personal information the Fund shares with its affiliates will apply until you request a change. If you are a new customer, we can begin sharing your information with our affiliates for marketing purposes 30 days from the date we sent this notice. When you are no longer a customer, we continue to share your information as described in this notice.
|
||||
|
Questions?
|
If you have any questions or concerns regarding this notice or the Fund’s privacy policies, please contact us at 888-893-4491.
|
46
Pemberwick Fund
|
PRIVACY NOTICE (Continued)
|
|
State Disclosures – In addition to the rights described below and in this notice, you may have other rights under state laws. We will comply with the applicable state laws with respect to our information practices.
|
||
|
California and Vermont have other protections under state law. If your primary mailing address is in California or Vermont, we will not share your financial information that we collect except as permitted by law, including, for example, with your consent or to service your account. We will also not use your information for joint marketing purposes. We do not share customer information with third parties except as permitted by law.
|
|
Who we are
|
||||
|
Who is providing
|
The Fund is an open-end management investment company registered under the
|
|||
|
this notice?
|
Investment Company Act of 1940.
|
|||
|
What we do
|
||||
|
How does the Fund
|
To protect your personal information from unauthorized access and use, we use
|
|||
|
protect my personal
|
security measures that comply with federal law. These measures include computer
|
|||
|
information?
|
safeguards and secured files and buildings.
|
|||
|
How does the Fund
|
We collect your personal information, for example, when you
|
|||
|
collect my personal
|
• open an account
|
|||
|
information?
|
• provide account information
|
|||
|
• give us your contact information
|
||||
|
• make a wire transfer
|
||||
|
• tell us where to send the money
|
||||
|
We collect your personal information from others, such as credit bureaus, affiliates or other companies.
|
||||
|
Why can’t I limit
|
Federal law gives you the right to limit only
|
|||
|
all sharing?
|
• sharing for affiliates’ everyday business purposes – information about your creditworthiness
|
|||
|
• affiliates from using your information to market to you
|
||||
|
• sharing for nonaffiliates to market to you
|
||||
|
State laws and individual companies may give you additional rights to limit sharing.
|
||||
|
Definitions
|
||||
|
Affiliates
|
Companies related by common ownership or control. They can be financial and nonfinancial companies.
|
|||
|
• The Fund’s affiliate is Pemberwick Investment Advisors LLC, investment advisor to the PEMBERWICK FUND.
|
||||
|
Nonaffiliates
|
Companies not related by common ownership or control. They can be financial and nonfinancial companies.
|
|||
|
• The Fund does not share with nonaffiliates so they can market to you.
|
||||
|
Joint marketing
|
A formal agreement between nonaffiliated financial companies that together market financial products or services to you.
|
|||
|
• The Fund does not jointly market.
|
47
Investment Advisor
Pemberwick Investment Advisors LLC
340 Pemberwick Road
Greenwich, CT 06831
Distributor
Quasar Distributors, LLC
615 East Michigan Street, 4th Floor
Milwaukee, WI 53202
Transfer Agent
U.S. Bancorp Fund Services, LLC
615 East Michigan Street
Milwaukee, WI 53202
(888) 893-4491
Custodian
U.S. Bank National Association
Custody Operations
1555 North River Center Drive, Suite 302
Milwaukee, WI 53212
Independent Registered Public Accounting Firm
BBD, LLP
1835 Market Street, 26th Floor
Philadelphia, PA 19103
Legal Counsel
Godfrey & Kahn S.C.
833 East Michigan Street, Suite 1800
Milwaukee, WI 53202
This report is intended for shareholders of the Fund and may not be used as sales literature unless preceded or accompanied by a current prospectus.
Past performance results shown in this report should not be considered a representation of future performance. Share price and returns will fluctuate so that shares, when redeemed, may be worth more or less than their original cost. Statements and other information herein are dated and are subject to change.
Item 2. Code of Ethics.
The registrant has adopted a code of ethics that applies to the registrant’s principal executive officer and principal financial officer. The registrant has not made any substantive amendments to its code of ethics during the period covered by this report. The registrant has not granted any waivers from any provisions of the code of ethics during the period covered by this report.
A copy of the registrant’s Code of Ethics is filed herewith.
Item 3. Audit Committee Financial Experts.
The registrant’s Board of Trustees has determined that there are at least two audit committee financial experts serving on its audit committee. Messrs. Gaylord B. Lyman and Scott C. Jones are the “audit committee financial experts” and are considered to be “independent” as each term is defined in Item 3 of Form N‑CSR.
Item 4. Principal Accountant Fees and Services.
The registrant has engaged its principal accountant to perform audit services, audit-related services, tax services and other services during the past two fiscal years. “Audit services” refer to performing an audit of the registrant's annual financial statements or services that are normally provided by the accountant in connection with statutory and regulatory filings or engagements for those fiscal years. “Audit-related services” refer to the assurance and related services by the principal accountant that are reasonably related to the performance of the audit. “Tax services” refer to professional services rendered by the principal accountant for tax compliance, tax advice, and tax planning. There were no “other services” provided by the principal accountant. The following table details the aggregate fees billed or expected to be billed for each of the last two fiscal years for audit fees, audit-related fees, tax fees and other fees by the principal accountant.
|
FYE 3/31/2017*
|
FYE 4/30/2016
|
|
|
Audit Fees
|
$19,500
|
$27,030
|
|
Audit-Related Fees
|
N/A
|
N/A
|
|
Tax Fees
|
$1,500
|
$2,500
|
|
All Other Fees
|
N/A
|
N/A
|
*Fund changed its fiscal year end from April 30 to March 31.
Pursuant to its charter, the Trust’s Audit Committee must review and approve in advance the engagement of the independent accountants, including each audit and non-audit service permitted by appropriate rules or regulations provided to the Trust and each non-audit service provided to the Trust’s investment advisers and any entity controlling, controlled by or under common control with the investment advisers that provides ongoing services to the Trust relating to the operations and financial reporting of the Trust. The Committee may delegate the authority to grant such pre-approval to one or more Committee members who are independent Trustees within the meaning of Section 10A(i) of the Securities Exchange Act of 1934, as amended, provided that the decision of such member(s) is presented to the full Committee at its next scheduled meeting. The Committee may approve each audit and non-audit service on a case-by-case basis, and/or adopt pre-approval policies and procedures that are detailed as to a particular service, provided that the Committee is informed of each service in a timely manner and the policies and procedures do not include delegation of the Committee’s responsibilities under the Securities Exchange Act of 1934 to management. The foregoing pre-approval requirement with respect to the provision of non-audit services to the Trust may be waived if (i) the aggregate amount of all such non-audit services provided to the Trust constitutes not more than 5 percent of the total amount of revenues paid by the Trust to its independent accountants during the fiscal year in which the non-audit services are provided; (ii) such services were not recognized by the Trust at the time of the engagement to be non-audit services; and (iii) such services are promptly brought to the attention of the Committee and approved prior to the completion of the audit by the Committee or by one or more members of the Committee to whom authority to grant such approvals has been delegated by the Committee.
The percentage of fees billed by BBD, LLP and the previous independent registered public accounting firm for the fiscal years ended 3/31/2017 and 4/30/2016, respectively, applicable to non-audit services pursuant to waiver of pre-approval requirement were as follows:
|
FYE 3/31/2017*
|
FYE 4/30/2016
|
|
|
Audit-Related Fees
|
0%
|
0%
|
|
Tax Fees
|
0%
|
0%
|
|
All Other Fees
|
0%
|
0%
|
*Fund changed its fiscal year end from April 30 to March 31.
All of the principal accountant’s hours spent on auditing the registrant’s financial statements were attributed to work performed by full‑time permanent employees of the principal accountant.
The following table indicates the non-audit fees billed or expected to be billed by the registrant’s accountant for services to the registrant and to the registrant’s investment adviser (and any other controlling entity, etc.—not sub-adviser) for the last two years. The audit committee of the Board of Trustees has considered whether the provision of non-audit services that were rendered to the registrant's investment adviser is compatible with maintaining the principal accountant's independence and has concluded that the provision of such non-audit services by the accountant has not compromised the accountant’s independence.
|
Non-Audit Related Fees
|
FYE 3/31/2017*
|
FYE 4/30/2016
|
|
Registrant
|
N/A
|
N/A
|
|
Registrant’s Investment Adviser
|
N/A
|
N/A
|
* Fund changed its fiscal year end from April 30 to March 31.
Item 5. Audit Committee of Listed Registrants.
Not applicable to registrants who are not listed issuers (as defined in Rule 10A-3 under the Securities Exchange Act of 1934).
Item 6. Investments.
|
(a)
|
Schedule of Investments is included as part of the report to shareholders filed under Item 1 of this Form.
|
|
(b)
|
Not Applicable.
|
Item 7. Disclosure of Proxy Voting Policies and Procedures for Closed-End Management Investment Companies.
Not applicable to open-end investment companies.
Item 8. Portfolio Managers of Closed-End Management Investment Companies.
Not applicable to open-end investment companies.
Item 9. Purchases of Equity Securities by Closed‑End Management Investment Company and Affiliated Purchasers.
Not applicable to open-end investment companies.
Item 10. Submission of Matters to a Vote of Security Holders.
There have been no material changes to the procedures by which shareholders may recommend nominees to the Registrant’s Board of Trustees.
Item 11. Controls and Procedures.
|
(a)
|
The Registrant’s President/Principal Executive Officer and Treasurer/Principal Financial Officer have reviewed the Registrant's disclosure controls and procedures (as defined in Rule 30a-3(c) under the Investment Company Act of 1940, as amended, (the “Act”)) as of a date within 90 days of the filing of this report, as required by Rule 30a-3(b) under the Act and Rules 13a-15(b) or 15d‑15(b) under the Securities Exchange Act of 1934. Based on their review, such officers have concluded that the disclosure controls and procedures are effective in ensuring that information required to be disclosed in this report is appropriately recorded, processed, summarized and reported and made known to them by others within the Registrant and by the Registrant’s service provider.
|
|
(b)
|
There were no changes in the Registrant's internal control over financial reporting (as defined in Rule 30a-3(d) under the Act) that occurred during the fourth fiscal quarter of the period covered by this report that has materially affected, or is reasonably likely to materially affect, the Registrant's internal control over financial reporting.
|
Item 12. Exhibits.
|
(a)
|
(1) Any code of ethics or amendment thereto, that is subject to the disclosure required by Item 2, to the extent that the registrant intends to satisfy Item 2 requirements through filing an exhibit. Filed herewith.
|
(2) A separate certification for each principal executive and principal financial officer pursuant to Section 302 of the Sarbanes-Oxley Act of 2002. Filed herewith.
(3) Any written solicitation to purchase securities under Rule 23c‑1 under the Act sent or given during the period covered by the report by or on behalf of the registrant to 10 or more persons. Not applicable to open-end investment companies.
|
(b)
|
Certifications pursuant to Section 906 of the Sarbanes‑Oxley Act of 2002. Furnished herewith.
|
SIGNATURES
Pursuant to the requirements of the Securities Exchange Act of 1934 and the Investment Company Act of 1940, as amended, the registrant has duly caused this report to be signed on its behalf by the undersigned, thereunto duly authorized.
(Registrant) Manager Directed Portfolios
By (Signature and Title)* /s/Douglas J. Neilson
Douglas J. Neilson, President
Date 6/8/2017
Pursuant to the requirements of the Securities Exchange Act of 1934 and the Investment Company Act of 1940, as amended, this report has been signed below by the following persons on behalf of the registrant and in the capacities and on the dates indicated.
By (Signature and Title)* /s/Douglas J. Neilson
Douglas J. Neilson, President
Date 6/8/2017
By (Signature and Title)* /s/Matthew J. McVoy
Matthew J. McVoy, Treasurer
Date 6/8/2017
* Print the name and title of each signing officer under his or her signature.