UNITED STATES
SECURITIES AND EXCHANGE COMMISSION
Washington, D.C. 20549
FORM 10-K
|
x
|
ANNUAL REPORT PURSUANT TO SECTION 13 OR 15(d) OF THE SECURITIES EXCHANGE ACT OF 1934
|
For the Fiscal Year ended December 31, 2013
or
|
¨
|
TRANSITION REPORT PURSUANT TO SECTION 13 OR 15(d) OF THE SECURITIES EXCHANGE ACT OF 1934
|
For the transition period from to
Commission File Number: 000-52046

|
Delaware
|
36-4151663
|
|
(State or other jurisdiction of incorporation or organization)
|
(I.R.S. Employer Identification No.)
|
|
|
|
|
10201 North Loop East
Houston, Texas
|
77029
|
|
(Address of principal executive offices)
|
(Zip Code)
|
(713) 609-2100
(Registrant’s telephone number, including area code)
Securities registered pursuant to Section 12(b) of the Act:
|
Title of Class
|
|
Name of Each Exchange on Which Registered
|
|
Common stock, par value $0.001 per share
|
|
The NASDAQ Stock Market
|
Securities registered pursuant to Section 12(g) of the Act: None
Indicate by check mark if the registrant is a well-known seasoned issuer, as defined in Rule 405 of the Securities Act.
YES ¨ NO x
Indicate by check mark if the registrant is not required to file reports pursuant to Section 13 or Section 15(d) of the Act.
YES ¨ NO x
Indicate by check mark whether the registrant (1) has filed all reports required to be filed by Section 13 or 15(d) of the Securities Exchange Act of 1934 during the preceding 12 months (or for such shorter period that the Registrant was required to file such reports), and (2) has been subject to such filing requirements for the past 90 days. YES x NO ¨
Indicate by check mark whether the registrant has submitted electronically and posted on its corporate Web site, if any, every Interactive Data File required to be submitted and posted pursuant to Rule 405 of Regulation S-T (§ 232.405 of this chapter) during the preceding 12 months (or for such shorter period that the registrant was required to submit and post such files).
YES x NO ¨
Indicate by check mark if disclosure of delinquent filers pursuant to Item 405 of Regulations S-K is not contained herein, and will not be contained, to the best of Registrant’s knowledge, in definitive proxy or information statements incorporated by reference in Part III of this Form 10-K or any amendment to this Form 10-K. x
Indicate by check mark whether the registrant is a large accelerated filer, an accelerated filer, a non-accelerated filer or a smaller reporting company. See definitions of “large accelerated filer”, “accelerated filer” and “smaller reporting company” in Rule 12b-2 of the Exchange Act.
|
Large Accelerated Filer ¨
|
Accelerated Filer x
|
Non-Accelerated Filer ¨
|
Smaller reporting company ¨
|
Indicate by check mark whether the registrant is a shell company (as defined in Rule 12b-2 of the Exchange Act)
YES ¨ NO x
The aggregate market value of the voting stock (common stock) held by non-affiliates of the registrant as of June 30, 2013 was $244,135,081.
At March 1, 2014, there were 17,954,032 shares of the registrant’s common stock, $.001 par value per share, outstanding.
DOCUMENTS INCORPORATED BY REFERENCE
Part III of this report incorporates by reference specific portions of the registrant’s definitive Proxy Statement relating to the Annual Meeting of Stockholders to be held on May 6, 2014.
HOUSTON WIRE & CABLE COMPANY
Form 10-K
For the Fiscal Year Ended December 31, 2013
INDEX
|
PART I.
|
|
|
|
Item 1.
|
Business
|
3
|
|
Item 1A.
|
Risk Factors
|
6
|
|
Item 1B.
|
Unresolved Staff Comments
|
9
|
|
Item 2.
|
Properties
|
9
|
|
Item 3.
|
Legal Proceedings
|
9
|
|
Item 4.
|
Mine Safety Disclosures
|
9
|
|
|
Supplemental Item. Executive Officers of the Registrant
|
9
|
|
|
|
|
|
PART II.
|
|
|
|
Item 5.
|
Market for Registrant’s Common Equity, Related Stockholder Matters and Issuer Purchases of Equity Securities
|
10
|
|
Item 6.
|
Selected Financial Data
|
12
|
|
Item 7.
|
Management’s Discussion and Analysis of Financial Condition and Results of Operations
|
14
|
|
Item 7A.
|
Quantitative and Qualitative Disclosures About Market Risk
|
24
|
|
Item 8.
|
Consolidated Financial Statements and Supplementary Data
|
25
|
|
Item 9.
|
Changes in and Disagreements with Accountants on Accounting and Financial Disclosure
|
42
|
|
Item 9A.
|
Controls and Procedures
|
42
|
|
Item 9B.
|
Other Information
|
45
|
|
|
|
|
|
PART III.
|
|
|
|
Item 10.
|
Directors, Executive Officers and Corporate Governance
|
45
|
|
Item 11.
|
Executive Compensation
|
45
|
|
Item 12.
|
Security Ownership of Certain Beneficial Owners and Management and Related Stockholder Matters
|
45
|
|
Item 13.
|
Certain Relationships and Related Transactions, and Director Independence
|
45
|
|
Item 14.
|
Principal Accountant Fees and Services |
45
|
|
|
|
|
| PART IV. |
|
|
|
Item 15.
|
Exhibits and Financial Statement Schedules |
46
|
| 2 | ||
PART I
ITEM 1. BUSINESS
Overview
We are one of the largest providers of wire and cable and related services to the U.S. market. We provide our customers with a single-source solution for wire and cable, hardware and related services by offering a large selection of in-stock items, exceptional customer service and high levels of product expertise.
Our wide product selection and specialized services support our position in the supply chain between wire and cable manufacturers and the customer. The breadth and depth of wire and cable and related hardware that we offer, requires significant warehousing resources and a large number of SKU’s (stock-keeping units). While manufacturers may have the space and capabilities to maintain a large supply of inventory, we do not believe that any single manufacturer has the breadth and depth of product that we offer. More importantly, manufacturers historically have not offered the services that our customers need, such as complimentary custom cutting, cable coiling, custom slings and harnesses, paralleling, bundling, striping and same day shipment, and do not have multiple distribution centers across the nation.
Our Cable Management Program addresses our customers’ growing requirement for sophisticated and efficient just-in-time product management for large capital projects. This program entails purchasing and storing dedicated inventory so our customers have immediate product availability for the duration of their project. Advantages of this program include extra pre-allocated safety stock, firm pricing, zero cable surplus and just-in-time delivery. Used on large construction and capital expansion projects, our Cable Management Program combines the expertise of our cable specialists with dedicated project inventory and superior logistics to allow complex projects to be completed on time, within budget and with minimal residual waste.
History
We were founded in 1975 and have a long history of exceptional customer service, broad product selection and high levels of product expertise. In 1987, we completed our first initial public offering and were subsequently purchased in 1989 by ALLTEL Corporation and in 1997 by investment funds affiliated with Code, Hennessy & Simmons LLC. In June 2006, we completed our second initial public offering. On June 25, 2010, the Company purchased Southwest Wire Rope LP (“SWWR”), its general partner Southwest Wire Rope GP LLC and SWWR’s wholly owned subsidiary, Southern Wire (“SW”) (collectively “the acquired businesses”, or “the 2010 acquisition”). On January 1, 2011, the acquired businesses were merged into our operating subsidiary. The Company has no other business activity.
Products
We offer products in most categories of wire and cable, including: continuous and interlocked armor cable; control and power cable; electronic wire and cable; flexible and portable cords; instrumentation and thermocouple cable; lead and high temperature cable; medium voltage cable; premise and category wire and cable, primary and secondary aluminum distribution cable, wire rope and wire rope slings, as well as nylon slings, chain, shackles and other related hardware. We also offer private branded products, including our proprietary brand LifeGuard™, a low-smoke, zero-halogen cable. Our products are used in repair and replacement work, also referred to as Maintenance, Repair and Operations ("MRO"), and related projects, larger-scale projects in the utility, industrial and infrastructure markets and a diverse range of industrial applications including communications, energy, engineering and construction, general manufacturing, marine construction and marine transportation, mining, construction, infrastructure, oilfield services, petrochemical, transportation, utility, and wastewater treatment.
Targeted Markets
Our business is driven, in part, by the strength, growth prospects and activity in the end-markets in which our products are used, which are primarily in the continental United States. We have targeted three of these markets—the utility, industrial and infrastructure markets—in our sales and marketing initiatives.
Utility Market. The utility market includes large investor-owned utilities, rural cooperatives and municipal power authorities. According to Industrial Information Resources’ (“IIR’s”) 2014 Global Industrial Outlook, 2014 spending within the United States power market is expected to be $68.7 billion, up over 8% from 2013 estimates. While we are not a significant distributor of power lines used for the transmission of electricity, we sell many products used in the construction of a power plant and the related pollution control equipment. As such we are positioned to benefit from expenditures for new power generation needed to satisfy a growing population with increasing energy demands and to comply with federal mandates to reduce toxic outputs from power generating facilities. We expect to benefit from this trend as our customers utilize our cable management services to supply the wire and cable required in the construction of new power plants and upgrading of existing power plants. These upgrades often require the addition of highly-engineered and capital-intensive environmental compliance devices such as selective catalytic reduction (SCR) and flue gas desulfurization (FGD) systems to remove harmful emissions from existing power generation units. These projects require the specialty instrumentation, power and control wire and cable that we distribute.
| 3 | ||
Industrial Market. The industrial market is one of the largest segments of the U.S. economy and is comprised of a diverse base of manufacturing and production companies. According to IIR’s 2014 Global Industrial Outlook, the 2014 projected total industrial spending within the United States is expected to be $217.6 billion, up 11% over 2013 spend. We provide a wide variety of products specifically designed for the chemical processing, manufacturing, metal/mineral, and petroleum refining industries where there may be significant exposure to caustic materials or extreme temperatures. We are well positioned to take advantage of the exploration of land based petroleum and natural gas exploration and production driven by hydrocarbon rich shale geographies.
Infrastructure Market. Investments in the development, construction and maintenance of infrastructure markets including education and health care institutions; air, ground and rail transportation; telecommunications, and wastewater are expected to continue to improve from post-recession lows that resulted from public funding shortfalls and budget constraints. Certain segments such as transportation, rail and telecommunications have been identified as prime candidates for growth in 2014 and beyond. According to the American Road & Transportation Builders Association (ARTBA), the overall U.S. transportation infrastructure construction market is estimated to grow approximately 5% from $129 billion in 2013 to $135 billion in 2014. Furthermore, health care and educational institutions are expecting construction spending to increase in 2014 by 6% and 4% respectfully, according to FMI’s Research Services Group. With ongoing advancements in telecommunications technology and growing U.S. demand for greater bandwidth, FMI is also forecasting a 4% increase in the communications market. The infrastructure growth projections are opportunities for HWCC’s product and service offering.
Distribution Logistics
We believe that our national distribution presence and value-added services make us an essential partner in the supply chain for our suppliers. We have successfully expanded our business from one original location in Houston, Texas to twenty-three locations nationwide, which includes five third-party logistics providers. Our standard practice is to process customers' orders the same day they are received. Our strategically located distribution centers generally allow for ground delivery nationwide within 24 hours of shipment. Orders are delivered through a variety of distribution methods, including less-than-truck-load, truck-load, air or parcel service providers, direct from supplier and cross-dock shipments. Freight costs are typically borne by our customers. Due to our shipment volume, we have preferred pricing relationships with our contract carriers.
Customers
During 2013, we served approximately 6,200 customers, shipping approximately 44,000 SKU’s to over 10,000 customer locations nationwide. No customer represented 10% or more of our 2013 sales.
Suppliers
We obtain products from most of the leading wire and cable suppliers. We believe we have strong relationships with our top suppliers. Although we believe that alternative sources are available for the majority of our wire and cable products, we have strategically concentrated our purchases of wire and cable with five leading suppliers in order to maximize product quality, delivery dependability, purchasing efficiencies, and vendor rebates. As a result, in 2013 approximately 55% of our annual purchases came from five suppliers. We do not believe we are dependent on any one supplier for any of our wire and cable products and related hardware.
Our top five suppliers in 2013 were Belden Inc, General Cable Corp, Lake Cable LLC, Nexans Energy USA, Inc and Southwire Company.
| 4 | ||
Sales
We market our wire and cable and related services through an inside sales force situated in our regional offices and a field sales force focused on key geographic markets throughout the U.S. By operating under a decentralized process, region managers are able to adapt quickly to market-specific occurrences, allowing us to compete effectively with local competitors. We believe the knowledge, experience and tenure of our sales force is critical to serving our fragmented and diverse customer and end-user base.
Competition
The wire and cable market is highly competitive and fragmented, with several hundred wire and cable competitors serving this market. The product offerings and levels of service from the other wire and cable providers with whom we compete vary widely. We compete with many wire and cable providers on a national, regional and local basis. Most of our direct competitors are smaller companies that focus on a specific geographical area or feature a select product offering, such as surplus wire. In addition to the direct competition with other wire and cable providers, we also face, on a varying basis, competition with distributors and manufacturers that sell products directly or through multiple distribution channels to end-users or other resellers. In the markets that we serve, competition is primarily based on product line breadth, quality, product availability, service capabilities and price.
Employees
At December 31, 2013, we had 403 employees. Our sales and marketing staff accounted for 180 employees, including 52 field sales personnel and 93 inside sales and technical support personnel.
Our employees are not represented by a labor union or covered by a collective bargaining agreement. We believe that our employee relations are good.
Website Access
We maintain an internet website at www.houwire.com. We make available, free of charge under the “Investor Relations” tab on our website, our annual report on Form 10-K, quarterly reports on Form 10-Q, current reports on Form 8-K, and if applicable, amendments to those reports, as well as proxy and information statements, as soon as reasonably practicable after such documents are electronically filed with or furnished to the Securities and Exchange Commission (the “SEC”). Information contained on our website is not part of, and should not be construed as being incorporated by reference into, this Annual Report on Form 10-K.
Government Regulation
We are subject to regulation by various federal, state and local agencies. We believe we are in compliance in all material respects with existing applicable statutes and regulations affecting environmental issues and our employment, workplace health and workplace safety practices.
| 5 | ||
ITEM 1A. RISK FACTORS
In addition to other information in this Annual Report on Form 10-K, the following risk factors should be carefully considered in evaluating our business, because such factors may have a significant impact on our business, operating results, cash flows and financial condition. As a result of the risks set forth below and elsewhere in this Annual Report, actual results could differ materially from those projected in any forward-looking statements.
Downturns in capital spending and cyclicality in certain of the markets we serve could have a material adverse effect on our financial condition and results of operations.
The majority of our products are used in the construction, maintenance, repair and operation of facilities, plants and projects in the communications, energy, engineering and construction, general manufacturing, infrastructure, petrochemical, marine construction, marine transportation, mining, oilfield services, transportation, utility, and wastewater treatment industries. The demand for our products and services depends to a large degree on the capital spending levels of end-users in these markets. Many of these end-users defer capital expenditures or cancel projects during economic downturns or periods of uncertainty. In addition, certain of the markets we serve are cyclical, which affects capital spending by end-users in these industries.
We have risks associated with our customers’ access to credit.
The continuing uncertainty in global financial markets has not impaired our access to credit to finance our operations. However, poor credit market conditions may adversely impact the availability of construction and other project financing, upon which many of our customers depend, resulting in project cancellations or delays. Our utility and industrial customers may also face limitations when trying to access the credit markets to fund ongoing operations or capital projects. Credit constraints experienced by our customers may result in lost revenues and reduced gross margins for us and, in some cases, higher than expected bad debt losses.
We have risks associated with inventory.
Our business requires us to maintain substantial levels of inventory. We must identify the right mix and quantity of products to keep in our inventory to fulfill customer orders. Failure to do so could adversely affect our sales and earnings. However, if our inventory levels are too high, we are at risk that unexpected changes in circumstances, such as a shift in market demand, drop in prices or loss of a customer, could have a material adverse impact on the net realizable value of our inventory.
Our operating results are affected by fluctuations in commodity prices.
Copper, steel, aluminum and petrochemical products are components of the wire and cable we sell. Fluctuations in the costs of these and other commodities have historically affected our operating results. To the extent higher commodity prices result in increases in the costs we pay for our products, we attempt to reflect the increase in the prices we charge our customers. While we historically have been able to pass most of these cost increases on to our customers, to the extent we are unable to do so in the future, it could have a material adverse effect on our operating results. In addition, as commodity costs increase, our customers may delay or decrease their purchases of our wire and cable, which could adversely affect the demand for our products. To the extent commodity prices decline, the net realizable value of our existing inventory could be reduced, and our gross profit could be adversely affected.
The 2010 oil spill in the Gulf of Mexico resulted in tighter drilling and permitting qualifications by the U.S. Government. Until drilling companies meet these qualifications or the qualifications are eased, oil and gas drilling activity will remain at lower than historical levels, limiting the demand for the products we sell to this market.
If we are unable to maintain our relationships with our customers, it could have a material adverse effect on our financial results.
We rely on customers to purchase our wire and cable and related hardware. The number, size, business strategy and operations of these customers vary widely from market to market. Our success depends heavily on our ability to identify and respond to our customers’ needs.
In 2013, our ten largest customers accounted for approximately 40% of our sales. If we were to lose one or more of our large customers, or if one or more of our large customers were to significantly reduce the amount of wire and cable and related hardware they purchase from us, and we were unable to replace the lost sales on similar terms, we could experience a significant loss of revenue and profits. In addition, if one or more of our key customers failed or were unable to pay, we could experience a write-off or write-down of the related receivables, which could adversely affect our earnings. We participate with national marketing groups and engage in joint promotional sales activities with the members of those groups. Any permanent exclusion of us from, or refusal to allow us to participate in, such national marketing groups could have a material adverse effect on our sales and our results of operations.
| 6 | ||
An inability to obtain the products that we distribute could result in lost revenues and reduced profits and damage our relationships with customers.
In 2013, we sourced products from approximately 290 suppliers. However, we have adopted a strategy to concentrate our purchases of wire and cable with a small number of suppliers in order to maximize product quality, delivery dependability, purchasing efficiencies and vendor rebates. As a result, in 2013 approximately 55% of our purchases came from five suppliers. If any of these suppliers changes its sales strategy or decides to terminate its business relationship with us, our sales and earnings would be adversely affected unless and until we were able to establish relationships with suppliers of comparable products. In addition, if we are not able to obtain the products we distribute from either our current suppliers or other competitive sources, we could experience a loss of revenue, reduction in profits and damage to our relationships with our customers. Supply shortages may occur as a result of unanticipated demand or production cutbacks, shortages of raw materials, labor disputes or weather conditions affecting products or shipments, transportation disruptions or other reasons beyond our control. When shortages occur, wire and cable suppliers often allocate products among their customers, and our allocations might not be adequate to meet our customers' needs.
Loss of key personnel or our inability to attract and retain new qualified personnel could hurt our ability to operate and grow successfully.
Our success is highly dependent upon the services of James L. Pokluda III, our President and Chief Executive Officer and Nicol G. Graham, our Chief Financial Officer. Our success will continue to depend to a significant extent on our executive officers and key management and sales personnel. We do not have key man life insurance covering any of our executive officers. We may not be able to retain our executive officers and key personnel or attract additional qualified management and sales personnel. The loss of any of our executive officers or our other key management and sales personnel or our inability to recruit and retain qualified personnel could hurt our ability to operate and make it difficult to maintain our market share and to execute our growth strategies.
A change in vendor rebate programs could adversely affect our gross margins and results of operations.
The terms on which we purchase products from many of our suppliers entitle us to receive a rebate based on the volume of our purchases. These rebates effectively reduce our costs for products. If suppliers adversely change the terms of some or all of these programs, the changes may lower our gross margins on products we sell and may have an adverse effect on our operating results.
If we encounter difficulties with our management information systems, we would experience problems managing our business.
We believe our management information systems are a competitive advantage in maintaining our leadership position in the wire and cable industry. We rely upon our management information systems to manage and replenish inventory, fill and ship orders on a timely basis and coordinate our sales and marketing activities. If we experience problems with our management information systems, we could experience product shortages, diminished inventory control or an increase in accounts receivable. Any failure by us to maintain our management information systems could adversely impact our ability to attract and serve customers and would cause us to incur higher operating costs and experience reduced profitability.
An increase in competition could decrease sales or earnings.
We operate in a highly competitive industry. We compete directly with national, regional and local providers of wire and cable and related hardware. Competition is primarily focused in the local service area and is generally based on product line breadth, product availability, service capabilities and price. Some of our existing competitors have, and new market entrants may have, greater financial and marketing resources than we do. To the extent existing or future competitors seek to gain or retain market share by reducing prices, we may be required to lower our prices, thereby adversely affecting our financial results. Existing or future competitors also may seek to compete with us for acquisitions, which could have the effect of increasing the price and reducing the number of suitable acquisitions. Other companies, including our current customers, could seek to compete directly with our private branded products, which could adversely affect our sales of those products and ultimately our financial results. Our existing customers, as well as suppliers, could seek to compete with us by offering services similar to ours, which could adversely affect our market share and our financial results. In addition, competitive pressures resulting from the economic downturn and the industry trend toward consolidation could adversely affect our growth and profit margins.
We may not be able to successfully identify acquisition candidates, effectively integrate newly acquired businesses into our operations or achieve expected profitability from our acquisitions.
To supplement our growth, we intend to selectively pursue acquisition opportunities. If we are not successful in finding attractive acquisition candidates that we can acquire on satisfactory terms, or if we cannot complete those acquisitions that we identify, we will not be able to realize the benefit of this growth strategy.
| 7 | ||
Acquisitions involve numerous possible risks, including unforeseen difficulties in integrating operations, technologies, services, accounting and personnel; the diversion of financial and management resources from existing operations; unforeseen difficulties related to entering geographic regions or target markets where we do not have prior experience; the potential loss of key employees; and the inability to generate sufficient profits to offset acquisition or investment-related expenses. If we finance acquisitions by issuing equity securities or securities convertible into equity securities, our existing stockholders could be diluted, which, in turn, could adversely affect the market price of our stock. If we finance an acquisition with debt, it could result in higher leverage and interest costs. As a result, if we fail to evaluate and execute acquisitions properly, we might not achieve the anticipated benefits of these acquisitions, and we may incur costs in excess of what we anticipate.
The Company is anticipating growth in the acquired businesses. However, the investment in the SW reporting unit had a goodwill impairment during 2013 as it did not meet its financial objectives to date. Future goodwill impairments may result, should the acquired businesses not achieve their growth targets.
We sell wire and cable and related hardware. As a result, from time to time we have been named as defendants in lawsuits alleging that these products caused physical injury or injury to property. We rely on product warranties and indemnities from the product manufacturers, as well as insurance that we maintain, to protect us from these claims. However, manufacturers' warranties and indemnities are typically limited in duration and scope and may not cover all claims that might be asserted. Moreover, our insurance coverage may not be available or may not be adequate to cover every claim asserted or the entire amount of every claim.
| 8 | ||
ITEM 1B. UNRESOLVED STAFF COMMENTS
None.
ITEM 2. PROPERTIES
Facilities
We operate out of twenty-three distribution centers strategically located throughout the continental United States with approximately 785,000 square feet of distribution space. We own three facilities in Houston, Texas (one of which houses all centralized and back office functions such as finance, marketing, purchasing, human resources and information technology) and two facilities in Louisiana. One of the Houston facilities was purchased in December 2013, which after extensive building modifications, will be used to consolidate the four existing Houston operations of SWWR. This building should be operational by the third quarter of 2014. All of the other facilities are leased, including five from third-party logistics providers. Fifteen of the facilities, in addition to containing inventory for re-sale, house knowledgeable sales staff. We believe that our properties are in good operating condition and adequately serve our current business operations.
ITEM 3. LEGAL PROCEEDINGS
From time to time, we are involved in lawsuits that are brought against us in the normal course of business. We are not currently a party to any legal proceedings that we expect, either individually or in the aggregate, to have a material adverse effect on our business or financial condition. We, along with many other defendants, have been named in a number of lawsuits in the state courts of Illinois, Minnesota, North Dakota, and South Dakota alleging that certain wire and cable which may have contained asbestos caused injury to the plaintiffs who were exposed to this wire and cable. These lawsuits are individual personal injury suits that seek unspecified amounts of money damages as the sole remedy. It is not clear whether the alleged injuries occurred as a result of the wire and cable in question or whether we, in fact, distributed the wire and cable alleged to have caused any injuries. We maintain general liability insurance that, to date, has covered the defense of and all costs associated with these claims. In addition, we did not manufacture any of the wire and cable at issue, and we would rely on any warranties from the manufacturers of such cable if it were determined that any of the wire or cable that we distributed contained asbestos which caused injury to any of these plaintiffs. In connection with ALLTEL's sale of our company in 1997, ALLTEL provided indemnities with respect to costs and damages associated with these claims that we believe we could enforce if our insurance coverage proves inadequate.
ITEM 4. MINE SAFETY DISCLOSURES
Not applicable.
SUPPLEMENTAL ITEM. EXECUTIVE OFFICERS OF THE REGISTRANT
|
Name/Office
|
|
Age
|
|
Business Experience
During Last 5 Years |
|
|
|
|
|
|
|
James L. Pokluda III
President and Chief Executive Officer
|
|
49
|
|
Chief Executive Officer since January 2012 and President since May 2011. Prior thereto, Vice President Sales & Marketing from April 2007 until May 2011.
|
|
|
|
|
|
|
|
Nicol G. Graham
Chief Financial Officer, Treasurer and Secretary
|
|
61
|
|
Chief Financial Officer, Treasurer and Secretary since 1997.
|
| 9 | ||
PART II
ITEM 5. MARKET FOR REGISTRANT’S COMMON EQUITY, RELATED STOCKHOLDER MATTERS AND ISSUER PURCHASES OF EQUITY SECURITIES
Our common stock is listed on The NASDAQ Global Market under the symbol “HWCC”. The following table lists quarterly information on the price range of our common stock based on the high and low reported sale prices for our common stock as reported by The NASDAQ Global Market for the periods indicated below.
|
|
|
High
|
|
Low
|
|
||
|
Year ended December 31, 2013:
|
|
|
|
|
|
|
|
|
First quarter
|
|
$
|
12.97
|
|
$
|
10.89
|
|
|
Second quarter
|
|
$
|
14.82
|
|
$
|
12.70
|
|
|
Third quarter
|
|
$
|
15.07
|
|
$
|
12.25
|
|
|
Fourth quarter
|
|
$
|
14.49
|
|
$
|
12.42
|
|
|
|
|
|
|
|
|
|
|
|
Year ended December 31, 2012:
|
|
|
|
|
|
|
|
|
First quarter
|
|
$
|
15.33
|
|
$
|
12.91
|
|
|
Second quarter
|
|
$
|
14.12
|
|
$
|
10.60
|
|
|
Third quarter
|
|
$
|
12.29
|
|
$
|
10.58
|
|
|
Fourth quarter
|
|
$
|
12.29
|
|
$
|
10.32
|
|
There were 20 holders of record of our common stock as of December 31, 2013.
Purchases of Equity Securities by the Issuer and Affiliated Purchasers
The following table provides information about our purchases of common stock for the quarter ended December 31, 2013. For further information regarding our stock repurchase activity, see “Note 6 to our Consolidated Financial Statements.”
|
Period
|
|
Total number of
shares purchased |
|
Average
price paid per share |
|
Total number of shares
purchased as part of publicly announced plans or programs |
|
Maximum number (or
approximate dollar value) of shares that may yet be purchased under the plans or programs (2) |
|
|
|
October 1 – 31, 2013
|
|
—
|
|
$
|
—
|
|
—
|
|
—
|
|
|
November 1 – 30, 2013
|
|
—
|
|
$
|
—
|
|
—
|
|
—
|
|
|
December 1 – 31, 2013 (1)
|
|
4,516
|
|
$
|
12.79
|
|
—
|
|
—
|
|
|
Total
|
|
4,516
|
|
$
|
12.79
|
|
—
|
|
—
|
|
| (1) |
These shares were surrendered in connection with the exercise of a stock option to pay the exercise price and withholding taxes in accordance with the terms of our 2006 Stock Plan.
|
| (2) |
The Company had no stock repurchase plan in effect during 2013. For information regarding the adoption of a new repurchase plan in March 2014, see Note 10 to our Consolidated Financial Statements.
|
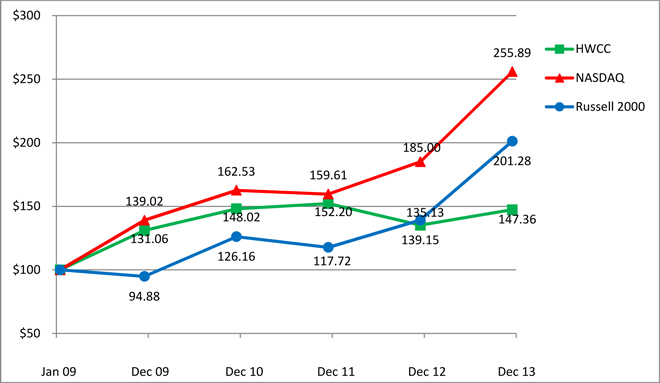
Stock Performance Graph
The following graph compares the total stockholder return on our common stock with the total return on the NASDAQ US Index and the Russell 2000 Index. We believe the Russell 2000 Index includes companies with capitalization comparable to ours. Houston Wire & Cable Company has a unique niche in the marketplace, due to the size and scope of our business platform, and we are unable to identify peer issuers, as the public companies within our industry are substantially more diversified than we are.
| 10 | ||
Total return is based on an initial investment of $100 on January 1, 2009, and reinvestment of dividends.
Dividend Policy
Holders of our common stock are entitled to receive dividends when, as and if declared by our Board of Directors. We have paid a quarterly cash dividend since August 2007. From February 2008 through February 2011, our quarterly cash dividend was $0.085 per share and from May 2011 through February 2013 was $0.09 per share. Beginning in May 2013, the Board of Directors approved a quarterly cash dividend of $0.11 per share. During 2013 and 2012, cash dividends were $0.42 and $0.36 per share, resulting in total dividends paid of $7.5 million and $6.4 million, respectively.
As a holding company, our only source of funds to pay dividends is distributions from our operating subsidiary. Our loan agreement does not limit the amount of dividends we may pay or stock we may repurchase, as long as we are not in default under the loan agreement and we maintain defined levels of fixed charge coverage and availability.
Securities Authorized for Issuance under Equity Compensation Plans
The information called for by this item regarding securities available for issuance is provided in response to Item 12.
| 11 | ||
ITEM 6. SELECTED FINANCIAL DATA
You should read the following selected financial information together with our consolidated financial statements and the related notes and the "Management's Discussion and Analysis of Financial Condition and Results of Operations" appearing elsewhere in this Form 10-K. We have derived the consolidated statement of income data for each of the years ended December 31, 2013, 2012 and 2011, and the consolidated balance sheet data at December 31, 2013 and 2012, from our audited financial statements, which are included in this Form 10-K. We have derived the consolidated statement of income data for each of the years ended December 31, 2010 and 2009, and the consolidated balance sheet data at December 31, 2011, 2010 and 2009 from our audited financial statements, which are not included in this Form 10-K.
|
|
|
Year Ended December 31,
|
|
||||||||||||||
|
|
|
2013
|
|
|
2012
|
|
2011
|
|
2010
|
|
2009
|
|
|||||
|
|
|
(Dollars in thousands, except share data)
|
|
||||||||||||||
|
|
|
|
|
|
|
|
|
|
|
|
|
|
|
|
|
|
|
|
CONSOLIDATED STATEMENT OF INCOME DATA:
|
|
|
|
|
|
|
|
|
|
|
|
|
|
|
|
|
|
|
Sales
|
|
$
|
383,292
|
|
|
$
|
393,036
|
|
$
|
396,410
|
|
$
|
308,522
|
|
$
|
254,819
|
|
|
Cost of sales
|
|
|
298,633
|
|
|
|
306,017
|
|
|
307,515
|
|
|
245,932
|
|
|
201,865
|
|
|
|
|
|
|
|
|
|
|
|
|
|
|
|
|
|
|
|
|
|
Gross profit
|
|
|
84,659
|
|
|
|
87,019
|
|
|
88,895
|
|
|
62,590
|
|
|
52,954
|
|
|
Operating expenses:
|
|
|
|
|
|
|
|
|
|
|
|
|
|
|
|
|
|
|
Salaries and commissions
|
|
|
30,946
|
|
|
|
30,013
|
|
|
28,053
|
|
|
25,281
|
|
|
20,596
|
|
|
Other operating expenses
|
|
|
26,068
|
|
|
|
25,139
|
|
|
24,513
|
|
|
20,565
|
|
|
18,023
|
|
|
Depreciation and amortization
|
|
|
2,978
|
|
|
|
2,941
|
|
|
2,952
|
|
|
1,738
|
|
|
563
|
|
|
Impairment of goodwill
|
|
|
7,562
|
|
|
|
—
|
|
|
—
|
|
|
—
|
|
|
—
|
|
|
Total operating expenses
|
|
|
67,554
|
|
|
|
58,093
|
|
|
55,518
|
|
|
47,584
|
|
|
39,182
|
|
|
|
|
|
|
|
|
|
|
|
|
|
|
|
|
|
|
|
|
|
Operating income
|
|
|
17,105
|
|
|
|
28,926
|
|
|
33,377
|
|
|
15,006
|
|
|
13,772
|
|
|
Interest expense
|
|
|
992
|
|
|
|
1,252
|
|
|
1,424
|
|
|
844
|
|
|
520
|
|
|
|
|
|
|
|
|
|
|
|
|
|
|
|
|
|
|
|
|
|
Income before income taxes
|
|
|
16,113
|
|
|
|
27,674
|
|
|
31,953
|
|
|
14,162
|
|
|
13,252
|
|
|
Income tax provision
|
|
|
8,211
|
|
|
|
10,635
|
|
|
12,276
|
|
|
5,543
|
|
|
5,220
|
|
|
|
|
|
|
|
|
|
|
|
|
|
|
|
|
|
|
|
|
|
Net income
|
|
$
|
7,902
|
(1)
|
|
$
|
17,039
|
|
$
|
19,677
|
|
$
|
8,619
|
|
$
|
8,032
|
|
|
|
|
|
|
|
|
|
|
|
|
|
|
|
|
|
|
|
|
|
Earnings per share:
|
|
|
|
|
|
|
|
|
|
|
|
|
|
|
|
|
|
|
Basic
|
|
$
|
0.44
|
|
|
$
|
0.96
|
|
$
|
1.11
|
|
$
|
0.49
|
|
$
|
0.46
|
|
|
|
|
|
|
|
|
|
|
|
|
|
|
|
|
|
|
|
|
|
Diluted
|
|
$
|
0.44
|
|
|
$
|
0.96
|
|
$
|
1.11
|
|
$
|
0.49
|
|
$
|
0.45
|
|
|
|
|
|
|
|
|
|
|
|
|
|
|
|
|
|
|
|
|
|
Weighted average common shares outstanding :
|
|
|
|
|
|
|
|
|
|
|
|
|
|
|
|
|
|
|
Basic
|
|
|
17,805,464
|
|
|
|
17,723,277
|
|
|
17,679,524
|
|
|
17,657,682
|
|
|
17,648,696
|
|
|
Diluted
|
|
|
17,900,372
|
|
|
|
17,815,401
|
|
|
17,801,134
|
|
|
17,710,123
|
|
|
17,665,924
|
|
| (1) | 2013 net income excluding the after tax impact of the impairment of goodwill was $14,594, and basic and fully diluted earnings per share were each $0.82. |
| 12 | ||
|
|
|
As of December 31,
|
|
|||||||||||||
|
|
|
2013
|
|
2012
|
|
2011
|
|
2010
|
|
2009
|
|
|||||
|
|
|
(Dollars in thousands)
|
|
|||||||||||||
|
CONSOLIDATED BALANCE SHEET DATA:
|
|
|
|
|
|
|
|
|
|
|
|
|
|
|
|
|
|
Cash and cash equivalents
|
|
$
|
—
|
|
$
|
274
|
|
$
|
—
|
|
$
|
—
|
|
$
|
—
|
|
|
Accounts receivable, net
|
|
$
|
60,408
|
|
$
|
65,892
|
|
$
|
59,731
|
|
$
|
67,838
|
|
$
|
46,859
|
|
|
Inventories, net
|
|
$
|
96,107
|
|
$
|
84,662
|
|
$
|
69,517
|
|
$
|
67,503
|
|
$
|
61,325
|
|
|
Total assets
|
|
$
|
196,175
|
|
$
|
197,155
|
|
$
|
179,153
|
|
$
|
185,490
|
|
$
|
122,014
|
|
|
Book overdraft (1)
|
|
$
|
4,594
|
|
$
|
—
|
|
$
|
2,270
|
|
$
|
3,055
|
|
$
|
907
|
|
|
Total debt (2)
|
|
$
|
47,952
|
|
$
|
58,588
|
|
$
|
47,967
|
|
$
|
54,825
|
|
$
|
17,479
|
|
|
Stockholders’ equity
|
|
$
|
110,694
|
|
$
|
109,080
|
|
$
|
97,338
|
|
$
|
85,720
|
|
$
|
80,813
|
|
|
(1)
|
Our book overdraft is funded by our revolving credit facility as soon as the related checks clear our disbursement account.
|
|
(2)
|
On June 25, 2010, we completed the purchase of the acquired businesses for a total purchase price of $51.5 million of which $51.2 million was paid in 2010 and was funded from our loan agreement.
|
| 13 | ||
ITEM 7. MANAGEMENT’S DISCUSSION AND ANALYSIS OF FINANCIAL CONDITION AND RESULTS OF OPERATIONS
You should read the following discussion in conjunction with our consolidated financial statements and related notes appearing elsewhere in this Form 10-K. In addition to historical information, this discussion contains forward-looking statements that involve risks, uncertainties and assumptions that could cause actual results to differ materially from our expectations. Factors that could cause such differences include those described in “Risk Factors” and elsewhere in this Form 10-K. Certain tabular information may not foot due to rounding.
Overview
Since our founding over 38 years ago, we have grown to be one of the largest providers of wire and cable and related services to the U.S. market. Today, we serve approximately 6,200 customers. Our products are used in MRO activities and related projects, as well as for larger-scale projects in the utility, industrial and infrastructure markets and a diverse range of industrial applications including communications, energy, engineering and construction, general manufacturing, mining, construction, oilfield services, infrastructure, petrochemical, transportation, utility, wastewater treatment, marine construction and marine transportation.
Our revenue is driven in part by the level of capital spending within the end-markets we serve. Because many of these end-markets defer capital expenditures during periods of economic downturns, our business has experienced cyclicality from time to time. We believe that our revenue will continue to be impacted by fluctuations in capital spending and by our ability to drive demand through our sales and marketing initiatives and the continued development and marketing of our private branded products, such as LifeGuard™. The continuing economic uncertainty and volatility in commodity prices have impacted sales and the level of demand. This has had and will continue to have an impact on our performance, until economic conditions stabilize.
Our direct costs will continue to be influenced significantly by the prices we pay our suppliers to procure the products we distribute to our customers. Changes in these costs may result, for example, from increases or decreases in raw material costs, changes in our relationships with suppliers or changes in vendor rebates. Our operating expenses will continue to be affected by our investment in sales, marketing and customer support personnel and commissions paid to our sales force for revenue and profit generated. Some of our operating expenses are related to our fixed infrastructure, including rent, utilities, administrative salaries, maintenance, insurance and supplies. To meet our customers’ needs for an extensive product offering and short delivery times, we will need to continue to maintain adequate inventory levels. Our ability to obtain this inventory will depend, in part, on our relationships with suppliers.
Critical Accounting Policies and Estimates
Critical accounting policies are those that both are important to the accurate portrayal of a company’s financial condition and results of operations, and require subjective or complex judgments, often as a result of the need to make estimates about the effect of matters that are inherently uncertain.
In order to prepare financial statements that conform to accounting principles generally accepted in the United States, commonly referred to as GAAP, we make estimates and assumptions that affect the amounts reported in our financial statements and accompanying notes. Certain estimates are particularly sensitive due to their significance to the financial statements and the possibility that future events may be significantly different from our expectations.
We have identified the following accounting policies as those that require us to make the most subjective or complex judgments in order to fairly present our consolidated financial position and results of operations. Actual results in these areas could differ materially from management’s estimates under different assumptions and conditions.
Allowance for Doubtful Accounts
We maintain an allowance for doubtful accounts receivable for estimated losses resulting from the inability of our customers to make required payments. We perform periodic credit evaluations of our customers and typically do not require collateral. Consistent with industry practices, we require payment from most customers within 30 days of the invoice date. We have an estimation procedure, based on historical data, current economic conditions and recent changes in the aging of the receivables, which we use to record reserves throughout the year. In the last five years, write-offs against our allowance for doubtful accounts have averaged $0.1 million per year. A 20% change in our estimate at December 31, 2013 would have resulted in a change in income before income taxes of less than $0.1 million.
| 14 | ||
Reserve for Returns and Allowances
We estimate the gross profit impact of returns and allowances for previously recorded sales. This reserve is calculated on historical and statistical returns and allowances data and adjusted as trends in the variables change. A 20% change in our estimate at December 31, 2013 would have resulted in a change in income before income taxes of $0.1 million.
Inventories
Inventories are valued at the lower of cost, using the average cost method, or market. We continually monitor our inventory levels at each of our distribution centers. Our reserve for inventory is based on the age of the inventory, movements of our inventory over the prior twelve months and the experience of our purchasing and sales departments in estimating demand for the product in the succeeding year. Our inventories are generally not susceptible to technological obsolescence. A 20% change in our estimate at December 31, 2013 would have resulted in a change in income before income taxes of $0.8 million.
Intangible Assets
The Company’s intangible assets, excluding goodwill, represent purchased trade names and customer relationships. Trade names are not being amortized and are treated as indefinite lived assets. Trade names are tested for recoverability on an annual basis in October of each year. The annual test showed no indication of impairment. If this test had indicated that an impairment had occurred, we would have recognized the loss in operating income. The Company assigns useful lives to its intangible assets based on the periods over which it expects the assets to contribute directly or indirectly to the future cash flows of the Company. Customer relationships are amortized over 6 or 7 year useful lives. If events or circumstances were to indicate that any of the Company’s definite-lived intangible assets might be impaired, the Company would assess recoverability based on the estimated undiscounted future cash flows to be generated from the applicable intangible asset.
Vendor Rebates
Many of our arrangements with our vendors entitle us to receive a rebate of a specified amount when we achieve any of a number of measures, generally related to the volume of purchases from the vendor. We account for such rebates as a reduction of the prices of the vendor’s products and therefore as a reduction of inventory until we sell the product, at which time such rebates reduce cost of sales. Throughout the year, we estimate the amount of the rebates earned based on purchases to date relative to the total purchase levels expected to be achieved during the rebate period. We continually revise these estimates to reflect rebates expected to be earned based on actual purchase levels and forecasted purchase volumes for the remainder of the rebate period. A 20% change in our estimate of total rebates earned during 2013 would have resulted in a change in income before income taxes of $1.4 million for the year ended December 31, 2013.
Goodwill represents the excess of the amount we paid to acquire businesses over the estimated fair value of tangible assets and identifiable intangible assets acquired, less liabilities assumed. Determining the fair value of assets acquired and liabilities assumed requires management’s judgment and often involves the use of significant estimates and assumptions, including assumptions with respect to future cash flows, discount rates and asset lives among other items. At December 31, 2013, our goodwill balance was $17.5 million, representing 8.9% of our total assets.
The Company reviews goodwill for impairment annually, or more frequently if indications of possible impairment exist, using a three-step process. The first step is a qualitative evaluation as to whether it is more likely than not that the fair value of any of the reporting units is less than its carrying value using an assessment of relevant events and circumstances. Examples of such events and circumstances include financial performance, industry and market conditions, macroeconomic conditions, reporting unit-specific events, historical results of goodwill impairment testing and the timing of the last performance of a quantitative assessment. If the Company concludes that the goodwill associated with any reporting units is more likely than not impaired, a second step is performed for that reporting unit. This second step, used to quantitatively screen for potential impairment, compares the fair value of the reporting unit with its carrying amount, including goodwill. The third step, employed for any reporting unit that fails the second step, is used to measure the amount of any potential impairment and compares the implied fair value of the reporting unit’s goodwill with the carrying amount of goodwill.
The second and third steps that we use to evaluate goodwill for impairment involve the determination of the fair value of our reporting units. Inherent in such fair value determinations are certain judgments and estimates relating to future cash flows, including our interpretation of current economic indicators and market valuations, and assumptions about our strategic plans. In developing fair values for our reporting units, we may employ a market multiple or a discounted cash flow methodology, or a combination thereof. The market multiple methodology compares us to similar companies on the basis of risk characteristics to determine our risk profile relative to the comparable companies as a group. This analysis generally focuses on quantitative considerations, which include financial performance and other quantifiable data, and qualitative considerations, which include any factors which are expected to impact future financial performance. The most significant assumptions affecting the market multiple methodology are the market multiples and control premium. A control premium represents the value an investor would pay above noncontrolling interest transaction prices in order to obtain a controlling interest in the respective company.
| 15 | ||
The discounted cash flow methodology establishes fair value by estimating the present value of the projected future cash flows to be generated from the reporting unit. The discount rate applied to the projected future cash flows to arrive at the present value is intended to reflect all risks of ownership and the associated risks of realizing the stream of projected future cash flows. The discounted cash flow methodology uses our projections of financial performance. The most significant assumptions used in the discounted cash flow methodology are the discount rate, the customer attrition rate and expected future revenue and operating margins, which vary among reporting units. If actual results are not consistent with our assumptions and judgments used in estimating future cash flows and asset fair values, we may be exposed to future impairment losses that could be material to our results of operations.
During the third quarter of 2013 and prior to the annual impairment test of goodwill at October 1, 2013, the Company concluded that impairment indicators existed at the SW reporting unit, due to a decline in the overall financial performance and overall market demand. The carrying value of the SW reporting unit’s goodwill was $20.1 million and its implied fair value resulting from the impairment test was less than the carrying value. As a result, the Company recorded a non-cash goodwill impairment charge of $7.6 million during the year ended December 31, 2013.
| 16 | ||
Sales
We generate most of our sales by providing wire and cable and related hardware to our customers, as well as billing for freight charges. We recognize revenue upon shipment of our products to customers from our distribution centers or directly from our suppliers. Sales incentives earned by customers are accrued in the same month as the shipment is invoiced and are accounted for as a reduction in sales.
Cost of Sales
Cost of sales consists primarily of the average cost of the wire and cable and related hardware that we sell. We also incur shipping and handling costs in the normal course of business. Cost of sales also reflects cash discounts for prompt payment to vendors and vendor rebates generally related to annual purchase targets, as well as inventory obsolescence charges.
Operating Expenses
Operating expenses include all expenses, excluding freight, incurred to receive, sell and ship product and administer the operations of the Company.
Salaries and Commissions. Salary expense includes the base compensation, and any overtime earned by hourly personnel, for all sales, administrative and warehouse employees and stock compensation expense for options and restricted stock granted to employees. Commission expense is earned by inside sales personnel based on gross profit dollars generated, by field sales personnel from generating sales and meeting various objectives, by sales, national and marketing managers for driving the sales process, by region managers based on the profitability of their branches and by corporate managers based primarily on our profitability and also on other operating metrics.
Other Operating Expenses. Other operating expenses include all other expenses, except for salaries and commissions and depreciation and amortization. This includes all payroll taxes, health insurance, traveling expenses, public company expenses, advertising, management information system expenses, facility rent and all distribution expenses such as packaging, reels, and repair and maintenance of equipment and facilities.
Depreciation and Amortization. We incur depreciation expense on costs related to capitalized property and equipment on a straight-line basis over the estimated useful lives of the assets, which range from three to thirty years. We incur amortization expense on leasehold improvements over the shorter of the lease term or the life of the related asset and on intangible assets over the estimated life of the asset.
Interest Expense
Interest expense consists primarily of interest we incur on our debt.
| 17 | ||
Results of Operations
The following discussion compares our results of operations for the years ended December 31, 2013, 2012 and 2011.
The following table shows, for the periods indicated, information derived from our consolidated statements of income, expressed as a percentage of sales for the period presented.
|
|
|
Year Ended December 31,
|
|
|||||||||
|
|
|
2013
|
|
|
2012
|
|
|
2011
|
|
|||
|
Sales
|
|
|
100.0
|
%
|
|
|
100.0
|
%
|
|
|
100.0
|
%
|
|
Cost of sales
|
|
|
77.9
|
%
|
|
|
77.9
|
%
|
|
|
77.6
|
%
|
|
Gross profit
|
|
|
22.1
|
%
|
|
|
22.1
|
%
|
|
|
22.4
|
%
|
|
|
|
|
|
|
|
|
|
|
|
|
|
|
|
Operating expenses:
|
|
|
|
|
|
|
|
|
|
|
|
|
|
Salaries and commissions
|
|
|
8.1
|
%
|
|
|
7.6
|
%
|
|
|
7.1
|
%
|
|
Other operating expenses
|
|
|
6.8
|
%
|
|
|
6.4
|
%
|
|
|
6.2
|
%
|
|
Depreciation and amortization
|
|
|
0.8
|
%
|
|
|
0.7
|
%
|
|
|
0.7
|
%
|
|
Impairment of goodwill
|
|
|
2.0
|
%
|
|
|
—
|
%
|
|
|
—
|
%
|
|
Total operating expenses
|
|
|
17.6
|
%
|
|
|
14.8
|
%
|
|
|
14.0
|
%
|
|
|
|
|
|
|
|
|
|
|
|
|
|
|
|
Operating income
|
|
|
4.5
|
%
|
|
|
7.4
|
%
|
|
|
8.4
|
%
|
|
Interest expense
|
|
|
0.3
|
%
|
|
|
0.3
|
%
|
|
|
0.4
|
%
|
|
Income before income taxes
|
|
|
4.2
|
%
|
|
|
7.0
|
%
|
|
|
8.1
|
%
|
|
Income tax provision
|
|
|
2.1
|
%
|
|
|
2.7
|
%
|
|
|
3.1
|
%
|
|
|
|
|
|
|
|
|
|
|
|
|
|
|
|
Net income
|
|
|
2.1
|
%
|
|
|
4.3
|
%
|
|
|
5.0
|
%
|
Note: Due to rounding, numbers may not add up to total operating expenses, operating income or income before income taxes.
Comparison of Years Ended December 31, 2013 and 2012
Sales
|
|
|
Year Ended
|
|
||||||||||
|
|
|
December 31,
|
|
||||||||||
|
(Dollars in millions)
|
|
2013
|
|
2012
|
|
Change
|
|
||||||
|
Sales
|
|
$
|
383.3
|
|
$
|
393.0
|
|
$
|
(9.7)
|
|
|
(2.5)
|
%
|
Our sales in 2013 decreased 2.5% to $383.3 million from $393.0 million in 2012. When adjusted for the fluctuation in metal prices, revenues for the 2013 fiscal year were unchanged compared to 2012 sales. Our project business, especially across our key growth initiatives – Environmental Compliance, Engineering & Construction, Industrials, LifeGuard™, Utility Power Generation, and Mechanical wire rope, was down approximately 16%, or 14% metals adjusted, primarily due to delays in project starts and market uncertainty. Maintenance, repair, and operations (MRO) business grew approximately 5%, or 7% metals adjusted, for the year.
Gross Profit
|
|
|
Year Ended
|
|
|||||||||||||
|
|
|
December 31,
|
|
|||||||||||||
|
(Dollars in millions)
|
|
2013
|
|
|
2012
|
|
|
Change
|
|
|||||||
|
Gross profit
|
|
$
|
84.7
|
|
|
$
|
87.0
|
|
|
$
|
(2.4)
|
|
|
|
(2.7)
|
%
|
|
Gross profit as a percent of sales
|
|
|
22.1
|
%
|
|
|
22.1
|
%
|
|
|
(0.0)
|
%
|
|
|
|
|
Gross profit decreased 2.7% to $84.7 million in 2013 from $87.0 million in 2012. The decrease in gross profit was primarily attributed to the decrease in sales. The gross margin (gross profit as a percentage of sales) remained consistent at 22.1% between the periods.
| 18 | ||
Operating Expenses
|
|
|
Year Ended
|
|
|||||||||||||
|
|
|
December 31,
|
|
|||||||||||||
|
(Dollars in millions)
|
|
2013
|
|
|
2012
|
|
|
Change
|
|
|||||||
|
Operating expenses:
|
|
|
|
|
|
|
|
|
|
|
|
|
|
|
|
|
|
Salaries and commissions
|
|
$
|
30.9
|
|
|
$
|
30.0
|
|
|
$
|
0.9
|
|
|
|
3.1
|
%
|
|
Other operating expenses
|
|
|
26.1
|
|
|
|
25.1
|
|
|
|
0.9
|
|
|
|
3.7
|
%
|
|
Depreciation and amortization
|
|
|
3.0
|
|
|
|
2.9
|
|
|
|
0.0
|
|
|
|
1.3
|
%
|
|
Impairment of goodwill
|
|
|
7.6
|
|
|
|
—
|
|
|
|
7.6
|
|
|
|
n/a
|
|
|
Total operating expenses
|
|
$
|
67.6
|
|
|
$
|
58.1
|
|
|
$
|
9.5
|
|
|
|
16.3
|
%
|
|
|
|
|
|
|
|
|
|
|
|
|
|
|
|
|
|
|
|
Operating expenses as a percent of sales
|
|
|
17.6
|
%
|
|
|
14.8
|
%
|
|
|
2.8
|
%
|
|
|
|
|
Note: Due to rounding, numbers may not add up to total operating expenses.
Salaries and Commissions. Salaries and commissions increased 3.1% to $30.9 million in 2013 from $30.0 million in 2012. This increase was due to additional headcount primarily in operations and sales/marketing which was partially offset by lower commissions.
Other Operating Expenses. Other operating expenses increased 3.7% to $26.1 million in 2013 from $25.1 million in 2012. This increase is primarily related to higher operations expenses related to additional facilities and higher inventory. Additional headcount also contributed to the increase.
Depreciation and Amortization. Depreciation and amortization increased slightly between the periods.
Impairment of Goodwill. The Company recorded a non-cash goodwill impairment charge in 2013 with respect to its SW reporting unit. (See Note 3)
Operating expenses as a percentage of sales increased to 17.6% in 2013 from 14.8% in 2012. This increase primarily relates to the impairment of goodwill, as well as higher operations cost and personnel costs.
Interest Expense
Interest expense decreased 20.8% to $1.0 million in 2013 from $1.3 million in 2012 due to lower average interest rates, lower average debt and a higher percentage of the debt in London Interbank Offered Rate (“LIBOR”) borrowings. Average debt was $47.8 million in 2013 compared to $58.0 million in 2012. The average effective interest rate decreased to 1.9% in 2013 from 2.1% in 2012. This decrease was primarily due to a lower applicable LIBOR spread as a result of the higher availability under the loan agreement in 2013.
Income Tax Expense
Income tax expense decreased 22.8% to $8.2 million in 2013 compared to $10.6 million in 2012. This percentage decrease was lower than the percentage decrease in operating income due to the non-deductible portion of the goodwill impairment.
Net Income
Our net income in 2013 was $7.9 million compared to $17.0 million in 2012, a decrease of 53.6%.
Comparison of Years Ended December 31, 2012 and 2011
Sales
|
|
|
Year Ended
|
|
||||||||||
|
|
|
December 31,
|
|
||||||||||
|
(Dollars in millions)
|
|
2012
|
|
2011
|
|
Change
|
|
||||||
|
Sales
|
|
$
|
393.0
|
|
$
|
396.4
|
|
$
|
(3.4)
|
|
|
(0.9)
|
%
|
Our sales in 2012 decreased 0.9% to $393.0 million from $396.4 million in 2011. When adjusted for fluctuation in metals prices, revenues in 2012 were up approximately 3% over 2011 sales. While mega projects which occurred in 2011 did not repeat, our overall project business remained flat in 2012, buoyed by large and medium size projects in our key growth initiatives – Environmental Compliance, Engineering & Construction, Industrials, LifeGuard™ (and other private branded products), Power Generation, and Mechanical Wire Rope. MRO business ended the year down approximately 3% or roughly flat when adjusted for metals prices.
| 19 | ||
Gross Profit
|
|
|
Year Ended
|
|
|||||||||||||
|
|
|
December 31,
|
|
|||||||||||||
|
(Dollars in millions)
|
|
2012
|
|
|
2011
|
|
|
Change
|
|
|||||||
|
Gross profit
|
|
$
|
87.0
|
|
|
$
|
88.9
|
|
|
$
|
(1.9)
|
|
|
|
(2.1)
|
%
|
|
Gross profit as a percent of sales
|
|
|
22.1
|
%
|
|
|
22.4
|
%
|
|
|
(0.3)
|
%
|
|
|
|
|
Gross profit decreased 2.1% to $87.0 million in 2012 from $88.9 million in 2011. The decrease in gross profit was primarily attributed to the reduction in sales and gross margin decreasing to 22.1% in 2012 from 22.4% in 2011. This decrease was primarily attributed to a change in product mix, competitive pricing and some large, direct-ship, low margin orders invoiced in the fourth quarter of 2012.
Operating Expenses
|
|
|
Year Ended
|
|
|||||||||||||
|
|
|
December 31,
|
|
|||||||||||||
|
(Dollars in millions)
|
|
2012
|
|
|
2011
|
|
|
Change
|
|
|||||||
|
Operating expenses:
|
|
|
|
|
|
|
|
|
|
|
|
|
|
|
|
|
|
Salaries and commissions
|
|
$
|
30.0
|
|
|
$
|
28.1
|
|
|
$
|
2.0
|
|
|
|
7.0
|
%
|
|
Other operating expenses
|
|
|
25.1
|
|
|
|
24.5
|
|
|
|
0.6
|
|
|
|
2.6
|
%
|
|
Depreciation and amortization
|
|
|
2.9
|
|
|
|
3.0
|
|
|
|
0.0
|
|
|
|
(0.4)
|
%
|
|
Total operating expenses
|
|
$
|
58.1
|
|
|
$
|
55.5
|
|
|
$
|
2.6
|
|
|
|
4.6
|
%
|
|
|
|
|
|
|
|
|
|
|
|
|
|
|
|
|
|
|
|
Operating expenses as a percent of sales
|
|
|
14.8
|
%
|
|
|
14.0
|
%
|
|
|
0.8
|
%
|
|
|
|
|
Note: Due to rounding, numbers may not add up to total operating expenses.
Salaries and Commissions. Salaries and commissions increased 7.0% to $30.0 million in 2012 from $28.1 million in 2011. The increase was primarily due to a onetime reversal during 2011 relating to $1.7 million of salary expense recognized prior to January 1, 2011 attributed to the change in the estimated forfeiture rate from 0% to 100% for non-vested options previously awarded to our former chief executive officer and to additional headcount in 2012. This was offset by a decrease in commissions in 2012 due to the lower level of profitability.
Other Operating Expenses. Other operating expenses increased slightly primarily due to costs associated with the higher headcount and an increase in consulting and professional fees during the 2012 period.
Depreciation and Amortization. Depreciation and amortization decreased slightly between the periods.
Operating expenses as a percentage of sales increased to 14.8% in 2012 from 14.0% in 2011. More than half of this increase resulted from the onetime reversal during 2011 relating to $1.7 million of salary expense recognized prior to January 1, 2011 attributed to the change in the estimated forfeiture rate from 0% to 100% for non-vested options previously awarded to our former chief executive officer.
Interest Expense
Interest expense decreased 12.1% to $1.3 million in 2012 from $1.4 million in 2011 due to lower LIBOR interest rates and a higher percentage of the debt in LIBOR borrowings. Average debt was $58.0 million in 2012 compared to $58.5 million in 2011. The average effective interest rate decreased to 2.1% in 2012 from 2.3% in 2011. This decrease was primarily due to a lower applicable LIBOR spread as a result of the higher availability under the loan agreement in 2012.
Income Tax Expense
Income tax expense decreased $1.6 million or 13.4% to $10.6 million in 2012 compared to $12.3 million in 2011, as pretax income decreased by 13.4% year over year. The effective income tax rate remained the same for both periods at 38.4%.
Net Income
Our net income in 2012 was $17.0 million compared to $19.7 million in 2011, a decrease of 13.4%.
| 20 | ||
Impact of Inflation and Commodity Prices
Our results of operations are affected by changes in the inflation rate and commodity prices. Moreover, because copper, petrochemical, aluminum and steel products are components of the wire and cable and related hardware we sell, fluctuations in the costs of these and other commodities have historically affected our operating results. We estimate decreasing metal prices negatively impacted sales by approximately 3% in 2013. To the extent commodity prices decline, the net realizable value of our existing inventory could also decline, and our gross profit can be adversely affected because of either reduced selling prices or lower of cost or market adjustments in the carrying value of our inventory. If we turn our inventory approximately four times a year, the impact of changes in commodity prices in any particular quarter would primarily affect the results of the succeeding calendar quarter. If we are unable to pass on to our customers future cost increases due to inflation or rising commodity prices, our operating results could be adversely affected.
Liquidity and Capital Resources
Our primary capital needs are for working capital obligations, capital expenditures, dividend payments, stock repurchases and other general corporate purposes, including acquisitions. Our primary sources of working capital are cash from operations supplemented by bank borrowings.
Liquidity is defined as the ability to generate adequate amounts of cash to meet the current need for cash. We assess our liquidity in terms of our ability to generate cash to fund our operating activities. Significant factors which could affect liquidity include the following:
|
|
·
|
the adequacy of available bank lines of credit;
|
|
|
·
|
cash flows generated from operating activities;
|
|
|
·
|
capital expenditures;
|
|
|
·
|
payment of dividends;
|
|
|
·
|
acquisitions; and
|
|
|
·
|
the ability to attract long-term capital with satisfactory terms
|
Comparison of Years Ended December 31, 2013 and 2012
Our net cash provided by operating activities was $20.7 million in 2013 compared to net cash used in operating activities of $3.0 million in 2012. Although our net income decreased by $9.1 million or 53.6% to $7.9 million in 2013 from $17.0 million in 2012, this was primarily due to the $7.6 million goodwill impairment charge, which was a non-cash item.
Changes in our operating assets and liabilities resulted in cash provided by operating activities of $2.3 million in 2013. Accounts receivable were lower by $5.5 million due to decreased sales in the fourth quarter. Book overdraft, which is funded by our revolving credit facility as soon as the related vendor checks clear our disbursement account, increased $4.6 million. Accrued and other current liabilities increased $3.3 million due primarily to higher accrued purchases and volume rebates to our customers. Trade accounts payable increased $1.3 million due to higher inventory purchases.
Partially offsetting these sources of cash was the $12.0 million increase in inventory. The increase in inventory resulted from the Company taking advantage of lower pricing and increased rebates from manufacturers in the fourth quarter, geographic expansion, the addition of new product lines and expanding certain other product lines.
Net cash used in investing activities was $3.4 million in 2013 compared to $1.0 million in 2012. The increase was primarily attributable to the purchase of a new building in December 2013 which will be used to consolidate four existing SWWR locations in 2014.
Net cash used in financing activities was $17.6 million in 2013 compared to net cash provided by financing activities of $4.3 million in 2012. Net payments on the revolver of $10.6 million and the payment of dividends of $7.5 million were the main components of financing activities in 2013.
Comparison of Years Ended December 31, 2012 and 2011
Our net cash used in operating activities was $3.0 million in 2012 compared to cash provided by operations of $14.3 million in 2011. Our net income decreased by $2.6 million or 13.4% to $17.0 million in 2012 from $19.7 million in 2011.
Changes in our operating assets and liabilities accounted for $24.0 million of cash used in operating activities in 2012. Inventories increased $16.0 million to support anticipated sales activity, the geographic expansion of product lines and the addition of new products. The increase in accounts receivable of $6.1 million is due to higher sales in the last two months of 2012 compared to the prior year period. Accrued and other current liabilities decreased $3.7 million due to lower prepayments on cable management orders as these projects shipped in 2012 and lower commissions due to lower profitability.
| 21 | ||
Net cash used in investing activities was $1.0 million in 2012 compared to $1.2 million in 2011. The decrease was primarily due to the cash paid for acquisition of $0.3 million in 2011.
Net cash provided by financing activities was $4.3 million in 2012 compared to net cash used in financing activities of $13.1 million in 2011. Net borrowings of $10.6 million and the payment of dividends of $6.4 million were the main components of financing activities in 2012.
Indebtedness
Our principal source of liquidity at December 31, 2013 was working capital of $123.5 million compared to $126.4 million at December 31, 2012. We also had available borrowing capacity under our loan agreement in the amount of $50.7 million at December 31, 2013 and $41.4 million at December 31, 2012.
We believe that we will have adequate availability of capital to fund our present operations, meet our commitments on our existing debt, continue to fund our dividend payments, and fund anticipated growth over the next twelve months, including expansion in existing and targeted market areas. We continually seek potential acquisitions and from time to time hold discussions with acquisition candidates. If suitable acquisition opportunities or working capital needs arise that would require additional financing, we believe that our financial position and earnings history provide a solid base for obtaining additional financing resources at competitive rates and terms. Additionally, based on market conditions, we may decide to issue additional shares of common or preferred stock to raise funds.
Loan and Security Agreement
On September 30, 2011, we entered into a Third Amended and Restated Loan and Security Agreement (the “2011 Loan Agreement”) with certain lenders and Bank of America, N.A., as agent. The 2011 Loan Agreement provides for a $100 million revolving credit facility and expires on September 30, 2016. Availability under the 2011 Loan Agreement is limited to a borrowing base equal to 85% of the value of eligible accounts receivable, plus 65% of the value of eligible inventory, less certain reserves. The 2011 Loan Agreement is secured by a lien on substantially all our property, other than real estate.
Portions of the loan under the 2011 Loan Agreement may be converted to LIBOR loans in minimum amounts of $1.0 million and integral multiples of $0.1 million. LIBOR loans bear interest at the British Bankers Association LIBOR Rate plus 125 to 200 basis points based on availability, and loans not converted to LIBOR loans bear interest at a fluctuating rate equal to the greatest of the agent’s prime rate, the federal funds rate plus 50 basis points, or 30-day LIBOR plus 150 basis points. Additionally, we are obligated to pay an unused facility fee on the unused portion of the loan commitment. Unused commitment fees are 25 or 30 basis points, depending on the amount of the unused commitment.
Covenants in the 2011 Loan Agreement require us to maintain certain minimum financial ratios and availability levels. Repaid amounts can be re-borrowed subject to the borrowing base. As of December 31, 2013, we were in compliance with all financial covenants.
Contractual Obligations
The following table describes our cash commitments to settle contractual obligations as of December 31, 2013.
|
|
|
Total
|
|
Less than
1 year |
|
1-3 years
|
|
3-5 years
|
|
More than
5 years |
|
|||||
|
|
|
(In thousands)
|
|
|||||||||||||
|
Loans payable
|
|
$
|
47,952
|
|
$
|
—
|
|
$
|
47,952
|
|
$
|
—
|
|
$
|
—
|
|
|
Operating lease obligations
|
|
|
6,801
|
|
|
2,772
|
|
|
2,961
|
|
|
1,068
|
|
|
—
|
|
|
Non-cancellable purchase obligations (1)
|
|
|
44,288
|
|
|
44,288
|
|
|
—
|
|
|
—
|
|
|
—
|
|
|
Total
|
|
$
|
99,041
|
|
$
|
47,060
|
|
$
|
50,913
|
|
$
|
1,068
|
|
$
|
—
|
|
|
(1)
|
These obligations reflect purchase orders outstanding with manufacturers as of December 31, 2013. We believe that some of these obligations may be cancellable upon negotiation with our vendors, but we are treating these as non-cancellable for this disclosure due to the absence of an express cancellation right.
|
Capital Expenditures
We made capital expenditures of $3.4 million, $1.0 million and $1.3 million in the years ended December 31, 2013, 2012 and 2011, respectively. The increase in 2013 was primarily due to the $2.5 million purchase of a facility which will be used to consolidate the SWWR operations in Houston.
| 22 | ||
Off-Balance Sheet Arrangements
We have no off-balance sheet arrangements, other than operating leases.
Financial Derivatives
We have no financial derivatives.
Market Risk Management
We are exposed to market risks arising from changes in market prices, including movements in interest rates and commodity prices.
Interest Rate Risk
Borrowings under our 2011 Loan Agreement bear interest at variable interest rates and therefore are sensitive to changes in the general level of interest rates. At December 31, 2013, the weighted average interest rate on our $48.0 million of variable interest debt was approximately 2.0%.
While our variable rate debt obligations expose us to the risk of rising interest rates, management does not believe that the potential exposure is material to our overall financial performance or results of operations. Based on December 31, 2013 borrowing levels, a 1.0% increase or decrease in the applicable interest rates would have a $0.5 million effect on our annual interest expense.
Commodity Risk
We are subject to periodic fluctuations in copper prices, as our products have varying levels of copper content in their construction. In addition, varying steel, aluminum and petrochemical prices also impact certain products we purchase. Profitability is influenced by these fluctuations as prices change between the time we buy and sell our products.
| 23 | ||
Foreign Currency Exchange Rate Risk
Our products are purchased and invoiced in U.S. dollars. Accordingly, we do not believe we are exposed to foreign exchange rate risk.
Climate Risk
Our operations are subject to inclement weather conditions including hurricanes, earthquakes and abnormal weather events. Our previous experience from these events has had a minimal effect on our operations and results.
Factors Affecting Future Results
This Annual Report on Form 10-K contains statements that may be considered forward-looking. These statements can be identified by the fact that they do not relate strictly to historical or current facts. They use words such as "aim," "anticipate," "believe," "could," "estimate," "expect," "intend," "may," "plan," "project," "should," "will be," "will continue," "will likely result," "would" and other words and terms of similar meaning in conjunction with a discussion of future operating or financial performance. You should read statements that contain these words carefully, because they discuss our future expectations, contain projections of our future results of operations or of our financial position or state other "forward-looking" information. Actual results could differ materially from the results indicated by these statements, because the realization of those results is subject to many risks and uncertainties. Some of these risks and uncertainties are discussed in greater detail under Item 1A, "Risk Factors."
All forward-looking statements are based on current management expectations and speak only as of the date of this filing. Except as required under federal securities laws and the rules and regulations of the SEC, we do not have any intention, and do not undertake, to update any forward-looking statements to reflect events or circumstances arising after the date of this Form 10-K.
ITEM 7A. QUANTITATIVE AND QUALITATIVE DISCLOSURES ABOUT MARKET RISK
Quantitative and Qualitative Disclosures about Market Risk are reported in Item 7, “Management’s Discussion and Analysis of Financial Condition and Results of Operations”, under the captions “Market Risk Management”, “Interest Rate Risk”, “Commodity Risk”, and “Foreign Currency Exchange Rate Risk”.
| 24 | ||
ITEM 8. CONSOLIDATED FINANCIAL STATEMENTS AND SUPPLEMENTARY DATA
Houston Wire & Cable Company
Index to consolidated financial statements
|
|
|
Page
|
|
Report of Independent Registered Public Accounting Firm
|
|
26
|
|
Consolidated Balance Sheets as of December 31, 2013 and 2012
|
|
27
|
|
Consolidated Statements of Income for the years ended December 31, 2013, 2012 and 2011
|
|
28
|
|
Consolidated Statements of Stockholders’ Equity for the years ended December 31, 2013, 2012 and 2011
|
|
29
|
|
Consolidated Statements of Cash Flows for the years ended December 31, 2013, 2012 and 2011
|
|
30
|
|
Notes to Consolidated Financial Statements
|
|
31
|
| 25 | ||
Report of Independent Registered Public Accounting Firm
Board of Directors and Stockholders
Houston Wire & Cable Company
We have audited the accompanying consolidated balance sheets of Houston Wire & Cable Company (the Company) as of December 31, 2013 and 2012, and the related consolidated statements of income, stockholders’ equity and cash flows for each of the three years in the period ended December 31, 2013. These financial statements are the responsibility of the Company's management. Our responsibility is to express an opinion on these financial statements based on our audits.
We conducted our audits in accordance with the standards of the Public Company Accounting Oversight Board (United States). Those standards require that we plan and perform the audit to obtain reasonable assurance about whether the financial statements are free of material misstatement. An audit includes examining, on a test basis, evidence supporting the amounts and disclosures in the financial statements. An audit also includes assessing the accounting principles used and significant estimates made by management, as well as evaluating the overall financial statement presentation. We believe that our audits provide a reasonable basis for our opinion.
In our opinion, the financial statements referred to above present fairly, in all material respects, the consolidated financial position of Houston Wire & Cable Company at December 31, 2013 and 2012, and the consolidated results of its operations and its cash flows for each of the three years in the period ended December 31, 2013, in conformity with U.S. generally accepted accounting principles.
We also have audited, in accordance with the standards of the Public Company Accounting Oversight Board (United States), Houston Wire & Cable Company’s internal control over financial reporting as of December 31, 2013, based on criteria established in Internal Control-Integrated Framework issued by the Committee of Sponsoring Organizations of the Treadway Commission (1992 framework) and our report dated March 13, 2014 expressed an unqualified opinion thereon.
/s/ Ernst & Young LLP
Houston, Texas
March 13, 2014
| 26 | ||
Houston Wire & Cable Company
Consolidated Balance Sheets
|
|
|
December 31,
|
|
||||
|
|
|
2013
|
|
2012
|
|
||
|
|
|
(In thousands, except
share data) |
|
||||
|
|
|
|
|
|
|
|
|
|
Assets
|
|
|
|
|
|
|
|
|
Current assets:
|
|
|
|
|
|
|
|
|
Cash
|
|
$
|
—
|
|
$
|
274
|
|
|
Accounts receivable, net
|
|
|
60,408
|
|
|
65,892
|
|
|
Inventories, net
|
|
|
96,107
|
|
|
84,662
|
|
|
Deferred income taxes
|
|
|
2,591
|
|
|
2,455
|
|
|
Income taxes
|
|
|
420
|
|
|
—
|
|
|
Prepaids
|
|
|
762
|
|
|
841
|
|
|
Total current assets
|
|
|
160,288
|
|
|
154,124
|
|
|
|
|
|
|
|
|
|
|
|
Property and equipment, net
|
|
|
7,974
|
|
|
5,824
|
|
|
Intangible assets, net
|
|
|
10,234
|
|
|
11,967
|
|
|
Goodwill
|
|
|
17,520
|
|
|
25,082
|
|
|
Other assets
|
|
|
159
|
|
|
158
|
|
|
Total assets
|
|
$
|
196,175
|
|
$
|
197,155
|
|
|
|
|
|
|
|
|
|
|
|
Liabilities and stockholders’ equity
|
|
|
|
|
|
|
|
|
Current liabilities:
|
|
|
|
|
|
|
|
|
Book overdraft
|
|
$
|
4,594
|
|
$
|
—
|
|
|
Trade accounts payable
|
|
|
13,637
|
|
|
12,330
|
|
|
Accrued and other current liabilities
|
|
|
18,772
|
|
|
15,379
|
|
|
Income taxes
|
|
|
—
|
|
|
5
|
|
|
Total current liabilities
|
|
|
37,003
|
|
|
27,714
|
|
|
|
|
|
|
|
|
|
|
|
Debt
|
|
|
47,952
|
|
|
58,588
|
|
|
Other long-term obligations
|
|
|
97
|
|
|
103
|
|
|
Deferred income taxes
|
|
|
429
|
|
|
1,670
|
|
|
Total liabilities
|
|
|
85,481
|
|
|
88,075
|
|
|
|
|
|
|
|
|
|
|
|
Stockholders’ equity:
|
|
|
|
|
|
|
|
|
Preferred stock, $0.001 par value; 5,000,000 shares authorized, none issued
and outstanding |
|
|
—
|
|
|
—
|
|
|
Common stock, $0.001 par value; 100,000,000 shares authorized: 20,988,952
shares issued: 17,954,032 and 17,899,499 shares outstanding at December 31, 2013 and 2012, respectively |
|
|
21
|
|
|
21
|
|
|
Additional paid-in capital
|
|
|
55,642
|
|
|
55,291
|
|
|
Retained earnings
|
|
|
104,607
|
|
|
104,252
|
|
|
Treasury stock
|
|
|
(49,576)
|
|
|
(50,484)
|
|
|
Total stockholders’ equity
|
|
|
110,694
|
|
|
109,080
|
|
|
|
|
|
|
|
|
|
|
|
Total liabilities and stockholders’ equity
|
|
$
|
196,175
|
|
$
|
197,155
|
|
The accompanying notes are an integral part of these consolidated financial statements.
| 27 | ||
Houston Wire & Cable Company
Consolidated Statements of Income
|
|
|
Year Ended December 31,
|
|
|||||||
|
|
|
2013
|
|
2012
|
|
2011
|
|
|||
|
|
|
|
|
|
|
|
|
|
|
|
|
|
|
(In thousands, except share and per share data)
|
|
|||||||
|
|
|
|
|
|
|
|
|
|
|
|
|
Sales
|
|
$
|
383,292
|
|
$
|
393,036
|
|
$
|
396,410
|
|
|
Cost of sales
|
|
|
298,633
|
|
|
306,017
|
|
|
307,515
|
|
|
Gross profit
|
|
|
84,659
|
|
|
87,019
|
|
|
88,895
|
|
|
|
|
|
|
|
|
|
|
|
|
|
|
Operating expenses:
|
|
|
|
|
|
|
|
|
|
|
|
Salaries and commissions
|
|
|
30,946
|
|
|
30,013
|
|
|
28,053
|
|
|
Other operating expenses
|
|
|
26,068
|
|
|
25,139
|
|
|
24,513
|
|
|
Depreciation and amortization
|
|
|
2,978
|
|
|
2,941
|
|
|
2,952
|
|
|
Impairment of goodwill
|
|
|
7,562
|
|
|
—
|
|
|
—
|
|
|
Total operating expenses
|
|
|
67,554
|
|
|
58,093
|
|
|
55,518
|
|
|
|
|
|
|
|
|
|
|
|
|
|
|
Operating income
|
|
|
17,105
|
|
|
28,926
|
|
|
33,377
|
|
|
Interest expense
|
|
|
992
|
|
|
1,252
|
|
|
1,424
|
|
|
Income before income taxes
|
|
|
16,113
|
|
|
27,674
|
|
|
31,953
|
|
|
Income tax provision
|
|
|
8,211
|
|
|
10,635
|
|
|
12,276
|
|
|
Net income
|
|
$
|
7,902
|
|
$
|
17,039
|
|
$
|
19,677
|
|
|
|
|
|
|
|
|
|
|
|
|
|
|
Earnings per share:
|
|
|
|
|
|
|
|
|
|
|
|
Basic
|
|
$
|
0.44
|
|
$
|
0.96
|
|
$
|
1.11
|
|
|
Diluted
|
|
$
|
0.44
|
|
$
|
0.96
|
|
$
|
1.11
|
|
|
|
|
|
|
|
|
|
|
|
|
|
|
Weighted average common shares outstanding:
|
|
|
|
|
|
|
|
|
|
|
|
Basic
|
|
|
17,805,464
|
|
|
17,723,277
|
|
|
17,679,524
|
|
|
Diluted
|
|
|
17,900,372
|
|
|
17,815,401
|
|
|
17,801,134
|
|
|
|
|
|
|
|
|
|
|
|
|
|
|
Dividends declared per share
|
|
$
|
0.42
|
|
$
|
0.36
|
|
$
|
0.355
|
|
The accompanying notes are an integral part of these consolidated financial statements.
| 28 | ||
Houston Wire & Cable Company
Consolidated Statements of Stockholders' Equity
|
|
|
|
|
|
|
|
|
Additional
|
|
|
|
|
|
|
|
|
|
|
Total
|
|
||
|
|
|
Common Stock
|
|
Paid-In
|
|
Retained
|
|
Treasury Stock
|
|
Stockholders'
|
|
|||||||||||
|
|
|
Shares
|
|
Amount
|
|
Capital
|
|
Earnings
|
|
Shares
|
|
Amount
|
|
Equity
|
|
|||||||
|
|
|
|
|
|
|
|
|
|
|
|
|
|
|
|
|
|
|
|
|
|
|
|
|
|
|
(In thousands, except share data)
|
|
|||||||||||||||||||
|
|
|
|
|
|
|
|
|
|
|
|
|
|
|
|
|
|
|
|
|
|
|
|
|
Balance at December 31, 2010
|
|
|
20,988,952
|
|
$
|
21
|
|
$
|
58,642
|
|
$
|
80,187
|
|
|
(3,240,465)
|
|
$
|
(53,130)
|
|
$
|
85,720
|
|
|
Net income
|
|
|
—
|
|
|
—
|
|
|
—
|
|
|
19,677
|
|
|
—
|
|
|
—
|
|
|
19,677
|
|
|
Exercise of stock options, net
|
|
|
—
|
|
|
—
|
|
|
(383)
|
|
|
—
|
|
|
26,899
|
|
|
497
|
|
|
114
|
|
|
Excess tax benefit for stock options
|
|
|
—
|
|
|
—
|
|
|
37
|
|
|
—
|
|
|
—
|
|
|
—
|
|
|
37
|
|
|
Excess tax deficiency for stock options
|
|
|
—
|
|
|
—
|
|
|
(48)
|
|
|
—
|
|
|
—
|
|
|
—
|
|
|
(48)
|
|
|
Amortization of unearned stock
compensation |
|
|
—
|
|
|
—
|
|
|
(707)
|
|
|
—
|
|
|
—
|
|
|
—
|
|
|
(707)
|
|
|
Impact of forfeited vested options
|
|
|
—
|
|
|
—
|
|
|
(1,153)
|
|
|
—
|
|
|
—
|
|
|
—
|
|
|
(1,153)
|
|
|
Impact of forfeited restricted stock awards
|
|
|
—
|
|
|
—
|
|
|
82
|
|
|
—
|
|
|
(5,000)
|
|
|
(82)
|
|
|
—
|
|
|
Issuance of restricted stock awards
|
|
|
—
|
|
|
—
|
|
|
(710)
|
|
|
—
|
|
|
43,251
|
|
|
710
|
|
|
—
|
|
|
Impact of surrendered equity awards to
satisfy taxes |
|
|
—
|
|
|
—
|
|
|
—
|
|
|
—
|
|
|
(1,831)
|
|
|
(26)
|
|
|
(26)
|
|
|
Dividends paid
|
|
|
—
|
|
|
—
|
|
|
—
|
|
|
(6,276)
|
|
|
—
|
|
|
—
|
|
|
(6,276)
|
|
|
|
|
|
|
|
|
|
|
|
|
|
|
|
|
|
|
|
|
|
|
|
|
|
|
Balance at December 31, 2011
|
|
|
20,988,952
|
|
|
21
|
|
|
55,760
|
|
|
93,588
|
|
|
(3,177,146)
|
|
|
(52,031)
|
|
|
97,338
|
|
|
Net income
|
|
|
—
|
|
|
—
|
|
|
—
|
|
|
17,039
|
|
|
—
|
|
|
—
|
|
|
17,039
|
|
|
Exercise of stock options, net
|
|
|
—
|
|
|
—
|
|
|
(395)
|
|
|
—
|
|
|
27,977
|
|
|
532
|
|
|
137
|
|
|
Excess tax benefit for stock options
|
|
|
—
|
|
|
—
|
|
|
35
|
|
|
—
|
|
|
—
|
|
|
—
|
|
|
35
|
|
|
Excess tax deficiency for stock options
|
|
|
—
|
|
|
—
|
|
|
(13)
|
|
|
—
|
|
|
—
|
|
|
—
|
|
|
(13)
|
|
|
Amortization of unearned stock
compensation |
|
|
—
|
|
|
—
|
|
|
1,040
|
|
|
—
|
|
|
—
|
|
|
—
|
|
|
1,040
|
|
|
Impact of forfeited vested options
|
|
|
—
|
|
|
—
|
|
|
(6)
|
|
|
—
|
|
|
—
|
|
|
—
|
|
|
(6)
|
|
|
Impact of forfeited restricted stock awards
|
|
|
—
|
|
|
—
|
|
|
82
|
|
|
—
|
|
|
(5,000)
|
|
|
(82)
|
|
|
—
|
|
|
Issuance of restricted stock awards
|
|
|
—
|
|
|
—
|
|
|
(1,212)
|
|
|
—
|
|
|
74,203
|
|
|
1,212
|
|
|
—
|
|
|
Impact of surrendered equity awards to
satisfy taxes |
|
|
—
|
|
|
—
|
|
|
—
|
|
|
—
|
|
|
(9,487)
|
|
|
(115)
|
|
|
(115)
|
|
|
Dividends paid
|
|
|
—
|
|
|
—
|
|
|
—
|
|
|
(6,375)
|
|
|
—
|
|
|
—
|
|
|
(6,375)
|
|
|
Balance at December 31, 2012
|
|
|
20,988,952
|
|
|
21
|
|
|
55,291
|
|
|
104,252
|
|
|
(3,089,453)
|
|
|
(50,484)
|
|
|
109,080
|
|
|
Net income
|
|
|
—
|
|
|
—
|
|
|
—
|
|
|
7,902
|
|
|
—
|
|
|
—
|
|
|
7,902
|
|
|
Exercise of stock options, net
|
|
|
—
|
|
|
—
|
|
|
(526)
|
|
|
—
|
|
|
62,312
|
|
|
1,018
|
|
|
492
|
|
|
Excess tax benefit for stock options
|
|
|
—
|
|
|
—
|
|
|
49
|
|
|
—
|
|
|
—
|
|
|
—
|
|
|
49
|
|
|
Excess tax deficiency for stock options
|
|
|
—
|
|
|
—
|
|
|
(10)
|
|
|
—
|
|
|
—
|
|
|
—
|
|
|
(10)
|
|
|
Amortization of unearned stock
compensation |
|
|
—
|
|
|
—
|
|
|
900
|
|
|
—
|
|
|
—
|
|
|
—
|
|
|
900
|
|
|
Impact of forfeited vested options
|
|
|
—
|
|
|
—
|
|
|
(108)
|
|
|
—
|
|
|
—
|
|
|
—
|
|
|
(108)
|
|
|
Impact of forfeited restricted stock awards
|
|
|
—
|
|
|
—
|
|
|
232
|
|
|
—
|
|
|
(14,165)
|
|
|
(232)
|
|
|
—
|
|
|
Issuance of restricted stock awards
|
|
|
—
|
|
|
—
|
|
|
(186)
|
|
|
—
|
|
|
11,338
|
|
|
186
|
|
|
—
|
|
|
Impact of surrendered equity awards to
satisfy taxes |
|
|
—
|
|
|
—
|
|
|
—
|
|
|
—
|
|
|
(4,952)
|
|
|
(64)
|
|
|
(64)
|
|
|
Dividends paid
|
|
|
—
|
|
|
—
|
|
|
—
|
|
|
(7,466)
|
|
|
—
|
|
|
—
|
|
|
(7,466)
|
|
|
Dividends accrued
|
|
|
|
|
|
|
|
|
|
|
|
(81)
|
|
|
|
|
|
|
|
|
(81)
|
|
|
Balance at December 31, 2013
|
|
|
20,988,952
|
|
$
|
21
|
|
$
|
55,642
|
|
$
|
104,607
|
|
|
3,034,920
|
|
$
|
49,576
|
|
$
|
110,694
|
|
The accompanying notes are an integral part of these consolidated financial statements.
| 29 | ||
Houston Wire & Cable Company
Consolidated Statements of Cash Flows
|
|
|
Year Ended December 31,
|
|
|
|||||||
|
|
|
2013
|
|
2012
|
|
2011
|
|
|
|||
|
|
|
|
|
|
|
|
|
|
|
|
|
|
|
|
(In thousands)
|
|
|
|||||||
|
Operating activities
|
|
|
|
|
|
|
|
|
|
|
|
|
Net income
|
|
$
|
7,902
|
|
$
|
17,039
|
|
$
|
19,677
|
|
|
|
|
|
|
|
|
|
|
|
|
|
|
|
|
Adjustments to reconcile net income to net cash provided by (used in) operating activities:
|
|
|
|
|
|
|
|
|
|
|
|
|
Impairment of goodwill
|
|
|
7,562
|
|
|
—
|
|
|
—
|
|
|
|
Depreciation and amortization
|
|
|
2,978
|
|
|
2,941
|
|
|
2,952
|
|
|
|
Amortization of capitalized loan costs
|
|
|
18
|
|
|
18
|
|
|
14
|
|
|
|
Amortization of unearned stock compensation
|
|
|
900
|
|
|
1,040
|
|
|
(707)
|
|
|
|
Provision for doubtful accounts
|
|
|
(59)
|
|
|
(19)
|
|
|
(9)
|
|
|
|
Provision for returns and allowances
|
|
|
27
|
|
|
(61)
|
|
|
66
|
|
|
|
Provision for inventory obsolescence
|
|
|
559
|
|
|
815
|
|
|
826
|
|
|
|
(Gain) loss on disposals of property and equipment
|
|
|
(1)
|
|
|
(7)
|
|
|
(2)
|
|
|
|
Deferred income taxes
|
|
|
(1,485)
|
|
|
(773)
|
|
|
283
|
|
|
|
Changes in operating assets and liabilities:
|
|
|
|
|
|
|
|
|
|
|
|
|
Accounts receivable
|
|
|
5,516
|
|
|
(6,081)
|
|
|
8,050
|
|
|
|
Inventories
|
|
|
(12,004)
|
|
|
(15,960)
|
|
|
(2,840)
|
|
|
|
Prepaids
|
|
|
79
|
|
|
(13)
|
|
|
(65)
|
|
|
|
Other assets
|
|
|
(19)
|
|
|
129
|
|
|
(126)
|
|
|
|
Book overdraft
|
|
|
4,594
|
|
|
(2,270)
|
|
|
(785)
|
|
|
|
Trade accounts payable
|
|
|
1,307
|
|
|
2,231
|
|
|
(9,888)
|
|
|
|
Accrued and other current liabilities
|
|
|
3,312
|
|
|
(3,722)
|
|
|
(337)
|
|
|
|
Long term liabilities
|
|
|
(6)
|
|
|
(25)
|
|
|
(13)
|
|
|
|
Income taxes
|
|
|
(435)
|
|
|
1,685
|
|
|
(2,777)
|
|
|
|
Net cash provided by (used in) operating activities
|
|
|
20,745
|
|
|
(3,033)
|
|
|
14,319
|
|
|
|
|
|
|
|
|
|
|
|
|
|
|
|
|
Investing activities
|
|
|
|
|
|
|
|
|
|
|
|
|
Expenditures for property and equipment
|
|
|
(3,396)
|
|
|
(1,005)
|
|
|
(1,319)
|
|
|
|
Proceeds from disposals of property and equipment
|
|
|
2
|
|
|
9
|
|
|
452
|
|
|
|
Cash paid for acquisition
|
|
|
—
|
|
|
—
|
|
|
(343)
|
|
|
|
Net cash used in investing activities
|
|
|
(3,394)
|
|
|
(996)
|
|
|
(1,210)
|
|
|
|
|
|
|
|
|
|
|
|
|
|
|
|
|
Financing activities
|
|
|
|
|
|
|
|
|
|
|
|
|
Borrowings on revolver
|
|
|
396,724
|
|
|
402,231
|
|
|
405,741
|
|
|
|
Payments on revolver
|
|
|
(407,360)
|
|
|
(391,610)
|
|
|
(412,599)
|
|
|
|
Deferred loan cost
|
|
|
—
|
|
|
—
|
|
|
(100)
|
|
|
|
Proceeds from exercise of stock options
|
|
|
492
|
|
|
137
|
|
|
114
|
|
|
|
Payment of dividends
|
|
|
(7,466)
|
|
|
(6,375)
|
|
|
(6,276)
|
|
|
|
Excess tax benefit for options
|
|
|
49
|
|
|
35
|
|
|
37
|
|
|
|
Purchase of treasury stock
|
|
|
(64)
|
|
|
(115)
|
|
|
(26)
|
|
|
|
Net cash (used in) provided by financing activities
|
|
|
(17,625)
|
|
|
4,303
|
|
|
(13,109)
|
|
|
|
|
|
|
|
|
|
|
|
|
|
|
|
|
Net change in cash
|
|
|
(274)
|
|
|
274
|
|
|
—
|
|
|
|
Cash at beginning of year
|
|
|
274
|
|
|
—
|
|
|
—
|
|
|
|
|
|
|
|
|
|
|
|
|
|
|
|
|
Cash at end of year
|
|
$
|
—
|
|
$
|
274
|
|
$
|
—
|
|
|
|
Supplemental disclosures
|
|
|
|
|
|
|
|
|
|
|
|
|
Cash paid during the year for interest
|
|
$
|
998
|
|
$
|
1,231
|
|
$
|
1,445
|
|
|
|
|
|
|
|
|
|
|
|
|
|
|
|
|
Cash paid during the year for income taxes
|
|
$
|
10,236
|
|
$
|
9,762
|
|
$
|
14,732
|
|
|
The accompanying notes are an integral part of these consolidated financial statements.
| 30 | ||
Houston Wire & Cable Company
Notes to Consolidated Financial Statements
(dollars in thousands, except share and per share data)
|
|
1.
|
Organization and Summary of Significant Accounting Policies
|
Description of Business
Houston Wire & Cable Company (the “Company”), through its wholly owned subsidiaries, HWC Wire & Cable Company, Advantage Wire & Cable and Cable Management Services Inc., provides wire and cable, hardware and related services to the U.S. market through twenty-three locations in fourteen states throughout the United States. On June 25, 2010, the Company purchased Southwest Wire Rope LP (“SWWR”), its general partner Southwest Wire Rope GP LLC and SWWR’s wholly owned subsidiary, Southern Wire (“SW”) (collectively “the acquired businesses”, or “the 2010 acquisition”). On January 1, 2011, the acquired businesses were merged into our operating subsidiary. The Company has no other business activity.
Basis of Presentation and Principles of Consolidation
The consolidated financial statements include the accounts of the Company and its subsidiaries and have been prepared following accounting principles generally accepted in the United States (“GAAP”) and the requirements of the Securities and Exchange Commission (“SEC”). The financial statements include all normal and recurring adjustments that are necessary for a fair presentation of the Company’s financial position and operating results. All significant inter-company balances and transactions have been eliminated.
Use of Estimates
The preparation of the financial statements in conformity with GAAP requires management to make estimates and assumptions that affect the amounts reported in the financial statements and accompanying notes. The most significant estimates are those relating to the allowance for doubtful accounts, the reserve for returns and allowances, the inventory obsolescence reserve, vendor rebates, and asset impairments. Actual results could differ materially from the estimates and assumptions used for the preparation of the financial statements.
Earnings per Share
Basic earnings per share is calculated by dividing net income by the weighted average number of common shares outstanding. Diluted earnings per share include the dilutive effects of stock option and unvested restricted stock awards and units.
The following reconciles the denominator used in the calculation of diluted earnings per share:
|
|
|
Year Ended December 31,
|
|
|||||||
|
|
|
2013
|
|
2012
|
|
2011
|
|
|||
|
Denominator:
|
|
|
|
|
|
|
|
|
|
|
|
Weighted average common shares for basic earnings per share
|
|
|
17,805,464
|
|
|
17,723,277
|
|
|
17,679,524
|
|
|
Effect of dilutive securities
|
|
|
94,908
|
|
|
92,124
|
|
|
121,610
|
|
|
Denominator for diluted earnings per share
|
|
|
17,900,372
|
|
|
17,815,401
|
|
|
17,801,134
|
|
Options to purchase 478,458, 525,846 and 811,939 shares of common stock were not included in the diluted net income per share calculation for 2013, 2012 and 2011, respectively, as their inclusion would have been anti-dilutive. The 2011 amount includes 490,385 options, held by the former CEO who retired effective December 31, 2011.
Accounts Receivable
Accounts receivable consists primarily of receivables from customers, less an allowance for doubtful accounts of $148 and $213, and a reserve for returns and allowances of $518 and $491 at December 31, 2013 and 2012, respectively. Consistent with industry practices, the Company normally requires payment from most customers within 30 days. The Company has no contractual repurchase arrangements with its customers. Credit losses have been within management’s expectations.
| 31 | ||
The following table summarizes the changes in the allowance for doubtful accounts for the past three years:
|
|
|
2013
|
|
2012
|
|
2011
|
|
|||
|
Balance at beginning of year
|
|
$
|
213
|
|
$
|
211
|
|
$
|
358
|
|
|
Bad debt expense
|
|
|
(59)
|
|
|
(19)
|
|
|
(9
|
|
|
Write-offs, net of recoveries
|
|
|
(6)
|
|
|
21
|
|
|
(138)
|
|
|
Balance at end of year
|
|
$
|
148
|
|
$
|
213
|
|
$
|
211
|
|
Inventories
Inventories are carried at the lower of cost, using the average cost method, or market and consist primarily of goods purchased for resale, less a reserve for obsolescence and unusable items and unamortized vendor rebates. The reserve for inventory is based upon a number of factors, including the experience of the purchasing and sales departments, age of the inventory, new product offerings, and other factors. The reserve for inventory may periodically require adjustment as the factors identified above change. The inventory reserve was $3,934 and $3,746 at December 31, 2013 and 2012, respectively.
Vendor Rebates
Under many of the Company’s arrangements with its vendors, the Company receives a rebate of a specified amount of consideration, payable when the Company achieves any of a number of measures, generally related to the volume level of purchases from the vendors. The Company accounts for such rebates as a reduction of the prices of the vendors’ products and therefore as a reduction of inventory until it sells the products, at which time such rebates reduce cost of sales in the accompanying consolidated statements of income. Throughout the year, the Company estimates the amount of the rebates earned based on purchases to date relative to the total purchase levels expected to be achieved during the rebate period. The Company continually revises these estimates to reflect rebates expected to be earned based on actual purchase levels and forecasted purchase volumes for the remainder of the rebate period.
Property and Equipment
The Company provides for depreciation on a straight-line method over the following estimated useful lives:
|
Buildings
|
|
25 to 30 years
|
|
|
Machinery and equipment
|
|
3 to 5 years
|
|
Leasehold improvements are depreciated over their estimated life or the term of the lease, whichever is shorter.
Total depreciation expense was approximately $1,245, $1,208, and $1,095 for the years ended December 31, 2013, 2012 and 2011, respectively.
Goodwill
Goodwill represents the excess of the amount we paid to acquire businesses over the estimated fair value of tangible assets and identifiable intangible assets acquired, less liabilities assumed. Determining the fair value of assets acquired and liabilities assumed requires management’s judgment and often involves the use of significant estimates and assumptions, including assumptions with respect to future cash flows, discount rates and asset lives among other items. At December 31, 2013, our goodwill balance was $17.5 million, representing 8.9% of our total assets.
The Company reviews goodwill for impairment annually, or more frequently if indications of possible impairment exist, using a three-step process. The first step is a qualitative evaluation as to whether it is more likely than not that the fair value of any of the reporting units is less than its carrying value using an assessment of relevant events and circumstances. Examples of such events and circumstances include financial performance, industry and market conditions, macroeconomic conditions, reporting unit-specific events, historical results of goodwill impairment testing and the timing of the last performance of a quantitative assessment. If the Company concludes that the goodwill associated with any reporting units is more likely than not impaired, a second step is performed for that reporting unit. This second step, used to quantitatively screen for potential impairment, compares the fair value of the reporting unit with its carrying amount, including goodwill. The third step, employed for any reporting unit that fails the second step, is used to measure the amount of any potential impairment and compares the implied fair value of the reporting unit’s goodwill with the carrying amount of goodwill.
Other Assets
Other assets include deferred financing costs on the current loan agreement of $100. The deferred financing costs are amortized on a straight-line basis over the contractual life of the related loan agreement, which approximates the effective interest method, and such amortization expense is included in interest expense in the accompanying consolidated statements of income. Accumulated amortization at December 31, 2013 and 2012 was approximately $50 and $32, respectively.
Estimated future amortization expense for capitalized loan costs through the maturity of the loan agreement are $18 for each of 2014 and 2015 and $14 in 2016.
| 32 | ||
Intangibles
Intangible assets, from the 2010 acquisition, consist of customer relationships, trade names, and non-compete agreements. The customer relationships are amortized over 6 or 7 year useful lives and non-compete agreements were amortized over a 1 year useful life. If events or circumstances were to indicate that any of the Company’s definite-lived intangible assets might be impaired, the Company would assess recoverability based on the estimated undiscounted future cash flows to be generated from the applicable intangible asset. Trade names are not being amortized and are tested for impairment on an annual basis.
Self Insurance
The Company retains certain self-insurance risks for both health benefits and property and casualty insurance programs. The Company limits its exposure to these self insurance risks by maintaining excess and aggregate liability coverage. Self insurance reserves are established based on claims filed and estimates of claims incurred but not reported. The estimates are based on information provided to the Company by its claims administrators.
Segment Reporting
The Company operates in a single operating and reporting segment, sales of wire and cable, hardware and related services to the U.S. market.
Revenue Recognition, Returns & Allowances
The Company recognizes revenue when the following four basic criteria have been met:
1. Persuasive evidence of an arrangement exists;
2. Delivery has occurred or services have been rendered;
3. The seller’s price to the buyer is fixed or determinable; and
4. Collectability is reasonably assured.
The Company records revenue when customers take delivery of products. Customers may pick up products at any distribution center location, or products may be delivered via third party carriers. Products shipped via third party carriers are considered delivered based on the shipping terms, which are generally FOB shipping point. Normal payment terms are net 30 days. Customers are permitted to return product only on a case-by-case basis. Product exchanges are handled as a credit, with any replacement items being re-invoiced to the customer. Customer returns are recorded as an adjustment to sales. In the past, customer returns have not been material. The Company has no installation obligations.
The Company may offer sales incentives, which are accrued monthly as an adjustment to sales.
Shipping and Handling
The Company incurs shipping and handling costs in the normal course of business. Freight amounts invoiced to customers are included as sales and freight charges are included as a component of cost of sales.
Credit Risk
The Company’s customers are located primarily throughout the United States. No single customer accounted for 10% or more of the Company’s sales in 2013, 2012 or 2011. The Company performs periodic credit evaluations of its customers and generally does not require collateral.
Advertising Costs
Advertising costs are expensed when incurred. Advertising expenses were $333, $314, and $212 for the years ended December 31, 2013, 2012, and 2011, respectively.
Financial Instruments
The carrying values of accounts receivable, trade accounts payable and accrued and other current liabilities approximate fair value, due to the short maturity of these instruments. The carrying amount of long term debt approximates fair value as it bears interest at variable rates.
| 33 | ||
Stock-Based Compensation
Stock options issued under the Company’s stock plan have an exercise price equal to the fair value of the Company’s stock on the grant date. Restricted stock awards and units are valued at the closing price of the Company’s stock on the grant date. The Company recognizes compensation expense ratably over the vesting period. The Company’s compensation expense is included in salaries and commissions expense in the accompanying consolidated statements of income.
The Company receives a tax deduction for certain stock option exercises in the period in which the options are exercised, generally for the excess of the market price on the date of exercise over the exercise price of the options. The Company reports excess tax benefits from the award of equity instruments as financing cash flows. Excess tax benefits result when a deduction reported for tax return purposes for an award of equity instruments exceeds the cumulative compensation cost for the instruments recognized for financial reporting purposes.
Income Taxes
Deferred tax assets and liabilities are determined based on differences between the carrying amounts of assets and liabilities for financial reporting purposes and the amounts used for income tax purposes and are measured using the enacted tax rates and laws that will be in effect when the differences are expected to reverse.
|
|
2.
|
Detail of Selected Balance Sheet Accounts
|
Property and Equipment
Property and equipment are stated at cost and consist of:
|
|
|
At December 31,
|
|
||||
|
|
|
2013
|
|
2012
|
|
||
|
Land
|
|
$
|
2,476
|
|
$
|
1,187
|
|
|
Buildings
|
|
|
4,717
|
|
|
3,466
|
|
|
Machinery and equipment
|
|
|
10,354
|
|
|
9,646
|
|
|
|
|
|
17,547
|
|
|
14,299
|
|
|
Less accumulated depreciation
|
|
|
9,573
|
|
|
8,475
|
|
|
Total
|
|
$
|
7,974
|
|
$
|
5,824
|
|
The purchase price of the new building in December 2013 has been preliminarily allocated $1,290 to land and $1,217 to buildings.
Intangibles assets
Intangibles assets consist of:
|
|
|
At December 31,
|
|
||||
|
|
|
2013
|
|
2012
|
|
||
|
Trade names
|
|
$
|
4,610
|
|
$
|
4,610
|
|
|
Customer relationships
|
|
|
11,630
|
|
|
11,630
|
|
|
Non-compete agreements
|
|
|
250
|
|
|
250
|
|
|
|
|
|
16,490
|
|
|
16,490
|
|
|
Less accumulated amortization:
|
|
|
|
|
|
|
|
|
Trade names
|
|
|
—
|
|
|
—
|
|
|
Customer relationships
|
|
|
6,006
|
|
|
4,273
|
|
|
Non-compete agreements
|
|
|
250
|
|
|
250
|
|
|
|
|
|
6,256
|
|
|
4,523
|
|
|
Total
|
|
$
|
10,234
|
|
$
|
11,967
|
|
Intangible assets include customer relationships which are being amortized over 6 or 7 year useful lives and non-compete agreements which were amortized over a 1 year useful life. The weighted average amortization period for intangible assets is 6.6 years. Trade names are not amortized; however, they are tested annually for impairment. As of December 31, 2013, accumulated amortization on the acquired intangible assets was $6,256, and amortization expense was $1,733 for each of the years ended December 31, 2013 and 2012 and $1,857 for the year ended December 31, 2011. Future amortization expense to be recognized on the acquired intangible assets is expected to be as follows:
| 34 | ||
|
|
|
Annual
Amortization Expense |
|
|
|
2014
|
|
$
|
1,733
|
|
|
2015
|
|
|
1,733
|
|
|
2016
|
|
|
1,512
|
|
|
2017
|
|
|
646
|
|
Goodwill
|
Changes in goodwill were as follows:
|
|
At December 31,
|
|
||||
|
|
|
2013
|
|
2012
|
|
||
|
Balance at beginning of year
|
|
$
|
25,082
|
|
$
|
25,082
|
|
|
Impairment of goodwill
|
|
|
(7,562)
|
|
|
—
|
|
|
Balance at end of year
|
|
$
|
17,520
|
|
$
|
25,082
|
|
Accrued and Other Current Liabilities
|
Accrued and other current liabilities consist of:
|
|
At December 31,
|
|
||||
|
|
|
2013
|
|
2012
|
|
||
|
Customer advances
|
|
$
|
522
|
|
$
|
429
|
|
|
Customer rebates
|
|
|
4,952
|
|
|
4,383
|
|
|
Payroll, commissions, and bonuses
|
|
|
2,226
|
|
|
2,553
|
|
|
Accrued inventory purchases
|
|
|
8,161
|
|
|
5,107
|
|
|
Other
|
|
|
2,911
|
|
|
2,907
|
|
|
Total
|
|
$
|
18,772
|
|
$
|
15,379
|
|
|
|
3.
|
Impairment of Goodwill
|
During the third quarter of 2013 and prior to the annual impairment test of goodwill in October, the Company concluded that impairment indicators existed at the SW reporting unit, due to a decline in the overall financial performance and overall market demand.
The Company performed step two of the impairment test and concluded that the fair value of the SW reporting unit was less than its carrying value; therefore, the Company performed step three of the impairment analysis.
Step three of the impairment analysis measures the impairment charge by allocating the reporting unit’s fair value to all of the assets and liabilities of the reporting unit in a hypothetical analysis that calculates implied fair value of goodwill in the same manner as if the reporting unit was being acquired in a business combination and recording the deferred tax impact. Any excess of the carrying value of the reporting unit’s goodwill over the implied fair value of the reporting unit’s goodwill is recorded as an impairment loss.
The fair value of the SW reporting unit was estimated using a discounted cash flow model combined with a market approach, with a weighting of 50% to the discounted cash flow analysis and 50% to the market approach. The material assumptions used for the income approach included a weighted average cost of capital of 13% and a long-term growth rate of 3-4%. The carrying value of the SW reporting unit’s goodwill was $ 20.1 million and its implied fair value resulting from step two of the impairment test was less than the carrying value. As a result, the Company has recorded a non-cash goodwill impairment charge of $7.6 million during the year ended December 31, 2013.
|
|
4.
|
Debt
|
On September 30, 2011, HWC Wire & Cable Company, as borrower, entered into the Third Amended and Restated Loan and Security Agreement (“2011 Loan Agreement”), with certain lenders and Bank of America, N.A., as agent, and the Company, as guarantor, executed a Second Amended and Restated Guaranty of the borrower’s obligations thereunder. The 2011 Loan Agreement provides for a $100 million revolving credit facility, bears interest at the agent’s base rate, with a London Interbank Offered Rate (“LIBOR”) rate option and expires on September 30, 2016. The 2011 Loan Agreement is secured by a lien on substantially all the property of the Company, other than real estate. Availability under the 2011 Loan Agreement is limited to a borrowing base equal to 85% of the value of eligible accounts receivable, plus 65% of the value of eligible inventory, less certain reserves.
Portions of the loan may be converted to LIBOR loans in minimum amounts of $1,000 and integral multiples of $100. LIBOR loans bear interest at the British Bankers Association LIBOR Rate plus 125 to 200 basis points based on availability, and loans not converted to LIBOR loans bear interest at a fluctuating rate equal to the greatest of the agent’s prime rate, the federal funds rate plus 50 basis points, or 30-day LIBOR plus 150 basis points. Unused commitment fees are 25 or 30 basis points, depending on the amount of the unused commitment.
| 35 | ||
The 2011 Loan Agreement includes, among other things, covenants that require the Company to maintain a specified minimum fixed charge coverage ratio and availability levels. Additionally, the 2011 Loan Agreement allows for the unlimited payment of dividends and repurchases of stock, subject to the absence of events of default and maintenance of a fixed charge coverage ratio and minimum level of availability. The 2011 Loan Agreement contains certain provisions that may cause the debt to be classified as a current liability, in accordance with GAAP, if availability falls below certain thresholds, even though the ultimate maturity date under the loan agreement remains as September 30, 2016. Availability has remained above these thresholds. At December 31, 2013, the Company was in compliance with the financial covenants governing its indebtedness.
The Company’s borrowings at December 31, 2013 and 2012 were $47,952 and $58,588, respectively. The weighted average interest rates on outstanding borrowings were 2.0% and 1.8% at December 31, 2013 and 2012, respectively.
During 2013, the Company had an average available borrowing capacity of approximately $52,091. This average was computed from the monthly borrowing base certificates prepared for the lender. At December 31, 2013, the Company had available borrowing capacity of $50,680 under the terms of the 2011 Loan Agreement. During the years ended December 31, 2013, 2012 and 2011, the Company paid $130, $101, and $71, respectively, for the unused facility.
Principal repayment obligations for succeeding fiscal years are as follows:
|
2014
|
|
$
|
—
|
|
|
2015
|
|
|
—
|
|
|
2016
|
|
|
47,952
|
|
|
2017
|
|
|
—
|
|
|
Total
|
|
$
|
47,952
|
|
|
|
5.
|
Income Taxes
|
The provision (benefit) for income taxes consists of:
|
|
|
Year Ended December 31,
|
|
|||||||
|
|
|
2013
|
|
2012
|
|
2011
|
|
|||
|
Current:
|
|
|
|
|
|
|
|
|
|
|
|
Federal
|
|
$
|
8,675
|
|
$
|
10,129
|
|
$
|
10,612
|
|
|
State
|
|
|
1,021
|
|
|
1,279
|
|
|
1,381
|
|
|
Total current
|
|
|
9,696
|
|
|
11,408
|
|
|
11,993
|
|
|
|
|
|
|
|
|
|
|
|
|
|
|
Deferred:
|
|
|
|
|
|
|
|
|
|
|
|
Federal
|
|
|
(1,290)
|
|
|
(703)
|
|
|
258
|
|
|
State
|
|
|
(195)
|
|
|
(70)
|
|
|
25
|
|
|
Total deferred
|
|
|
(1,485)
|
|
|
(773)
|
|
|
283
|
|
|
|
|
|
|
|
|
|
|
|
|
|
|
Total
|
|
$
|
8,211
|
|
$
|
10,635
|
|
$
|
12,276
|
|
A reconciliation of the U.S. Federal statutory tax rate to the effective tax rate on income before taxes is as follows:
|
|
|
Year Ended December 31,
|
|
|||||||||
|
|
|
2013
|
|
|
2012
|
|
|
2011
|
|
|||
|
|
|
|
|
|
|
|
|
|
|
|
|
|
|
Federal statutory rate
|
|
|
35.0
|
%
|
|
|
35.0
|
%
|
|
|
35.0
|
%
|
|
State taxes, net of federal benefit
|
|
|
3.9
|
|
|
|
2.8
|
|
|
|
2.8
|
|
|
Non-deductible items
|
|
|
12.6
|
|
|
|
0.6
|
|
|
|
0.6
|
|
|
Other
|
|
|
(0.6)
|
|
|
|
—
|
|
|
|
—
|
|
|
Total effective tax rate
|
|
|
50.9
|
%
|
|
|
38.4
|
%
|
|
|
38.4
|
%
|
The non-deductible items in 2013 include the impact of the $5.3 million non-deductible portion of the $7.6 million impairment charge.
| 36 | ||
Significant components of the Company’s deferred taxes were as follows:
|
|
|
Year Ended
December 31, |
|
||||
|
|
|
2013
|
|
2012
|
|
||
|
Deferred tax assets:
|
|
|
|
|
|
|
|
|
Uniform capitalization adjustment
|
|
$
|
1,009
|
|
$
|
796
|
|
|
Inventory reserve
|
|
|
1,514
|
|
|
1,442
|
|
|
Allowance for doubtful accounts
|
|
|
57
|
|
|
82
|
|
|
Stock compensation expense
|
|
|
2,064
|
|
|
1,928
|
|
|
Property and equipment
|
|
|
102
|
|
|
43
|
|
|
Other
|
|
|
—
|
|
|
29
|
|
|
Total deferred tax assets
|
|
|
4,746
|
|
|
4,320
|
|
|
|
|
|
|
|
|
|
|
|
Deferred tax liabilities
|
|
|
|
|
|
|
|
|
Goodwill
|
|
|
185
|
|
|
834
|
|
|
Intangibles
|
|
|
2,303
|
|
|
2,701
|
|
|
Other
|
|
|
96
|
|
|
—
|
|
|
Total deferred tax liabilities
|
|
|
2,584
|
|
|
3,535
|
|
|
Net deferred tax assets
|
|
$
|
2,162
|
|
$
|
785
|
|
The Company recognizes interest on any tax issue as a component of interest expense and any related penalties in other operating expenses. As of December 31, 2013, 2012 and 2011, the Company made no provisions for interest or penalties related to uncertain tax positions. The tax years 2009 through 2013 remain open to examination by the major taxing jurisdictions to which the Company is subject.
|
|
6.
|
Stockholders’ Equity
|
Under the terms of the 2006 Stock Plan, the Company repurchased 4,952 shares that were surrendered by the holders to fund the exercise of the related awards and to pay withholding taxes in 2013.
The Company has paid a quarterly cash dividend since August 2007, resulting in aggregate dividends in 2013, 2012 and 2011 of $7,466, $6,375 and $6,276, respectively.
The Company is authorized to issue 5,000,000 shares of preferred stock, par value $.001 per share. The Board of Directors is authorized to fix the particular preferences, rights, qualifications and restrictions of each series of preferred stock. In connection with the adoption of a now terminated stockholder rights plan, the Board of Directors designated 100,000 shares as Series A Junior Participating Preferred Stock. No shares of preferred stock have been issued.
|
|
7.
|
Employee Benefit Plans
|
The Company maintains a combination profit-sharing plan and salary deferral plan (the “Plan”) for the benefit of its employees. Employees who are eligible to participate in the Plan can contribute a percentage of their base compensation, up to the maximum percentage allowable not to exceed the limits of Internal Revenue Code (“Code”) Sections 401(k), 404, and 415, subject to the IRS-imposed dollar limit. Employee contributions are invested in certain equity and fixed-income securities, based on employee elections. Through 2013, the Company adopted the Safe Harbor provisions of the Code, whereby contributions up to the first 3% of an employee’s compensation were matched 100% by the Company and the next 2% were matched 50% by the Company. The Company’s match for the years ended December 31, 2013, 2012 and 2011 was $803, $735, and $727, respectively. Effective January 1, 2014, the Company adjusted its match and will now match 100% of the first 1% of the employee’s contribution. Accordingly, the Company is no longer adopting the Safe Harbor provisions of the Code.
|
|
8.
|
Incentive Plans
|
On March 23, 2006, the Company adopted and on May 1, 2006, the stockholders approved the 2006 Stock Plan (the “2006 Plan”) to provide incentives for certain key employees and directors through awards of stock options and restricted stock awards and units. The 2006 Plan provides for incentives to be granted at the fair market value of the Company’s common stock at the date of grant and options may be either nonqualified stock options or incentive stock options as defined by Section 422 of the Code. Under the 2006 Plan a maximum of 1,800,000 shares may be issued to designated participants. The maximum number of shares available to any one participant in any one calendar year is 500,000.
| 37 | ||
The Company also has options outstanding under a stock option plan adopted in 2000 (the “2000 Plan”). The 2000 Plan provided for options to be granted at the fair market value of the Company’s common stock at the date of the grant, which options could be either nonqualified stock options or incentive stock options as defined by Section 422 of the Code. In connection with the adoption of the 2006 Plan, the Board of Directors resolved that no further options would be granted under the 2000 Plan.
Stock Option Awards
The Company has granted options to purchase its common stock to employees and directors of the Company under the two stock plans at no less than the fair market value of the underlying stock on the date of grant. These options are granted for a term not exceeding ten years and may be forfeited in the event the employee or director terminates his or her employment or relationship with the Company. Options granted to employees generally vest over three to five years, and options granted to directors generally vest one year after the date of grant. Shares issued to satisfy the exercise of options may be newly issued shares or treasury shares. Both option plans contain anti-dilutive provisions that permit an adjustment of the number of shares of the Company’s common stock represented by each option for any change in capitalization. Compensation cost for options granted is charged to expense on a straight line basis over the term of the option.
On May 8, 2012, the Company granted options under the 2006 Stock Plan to purchase 10,000 shares of its common stock with an exercise price equal to the fair market value of the Company’s stock at the close of trading on May 8, 2012 to new members of the management team. These options have a contractual life of ten years and vest in five equal annual installments on the first five anniversaries of the date of the grant assuming continued employment.
The fair value of each option awarded is estimated on the date of grant using a Black-Scholes option-pricing model. Expected volatilities are based on historical volatility of the Company’s stock and other factors. The Company uses historical data to estimate option exercises and employee terminations within the valuation model. The expected life of options granted represents the period of time that options granted are expected to be outstanding. The risk-free rate for periods within the life of the option is based on the U.S. Treasury yield curve in effect at the time of grant. There were no options granted in 2013. For prior year options granted, the following weighted average assumptions were used:
|
|
|
Year Ended
December 31, |
|
|||||
|
|
|
2012
|
|
|
2011
|
|
||
|
|
|
|
|
|
|
|
|
|
|
Risk-free interest rate
|
|
|
0.89
|
%
|
|
|
1.01
|
%
|
|
Expected dividend yield
|
|
|
3.01
|
%
|
|
|
2.55
|
%
|
|
Weighted average expected life
|
|
|
5.5 years
|
|
|
|
5.5 years
|
|
|
Expected volatility
|
|
|
64
|
%
|
|
|
65
|
%
|
Vesting dates range from May 8, 2014 to December 31, 2017, and expiration dates range from December 30, 2015 to May 8, 2022. The following summarizes stock option activity and related information:
|
|
|
2013
|
|
||||||||||
|
|
|
Options
(in 000’s) |
|
Weighted
Average Exercise Price |
|
Aggregate
Intrinsic Value |
|
Weighted
Average Remaining Contractual Life (in years) |
|
||||
|
Outstanding—Beginning of year
|
|
|
778
|
|
$
|
14.67
|
|
$
|
656
|
|
|
|
|
|
Granted
|
|
|
—
|
|
|
—
|
|
|
|
|
|
|
|
|
Exercised
|
|
|
(62)
|
|
|
7.90
|
|
|
|
|
|
|
|
|
Forfeited
|
|
|
(61)
|
|
|
14.53
|
|
|
|
|
|
|
|
|
Expired
|
|
|
—
|
|
|
—
|
|
|
|
|
|
|
|
|
Outstanding—End of year
|
|
|
655
|
|
$
|
15.33
|
|
$
|
563
|
|
|
5.22
|
|
|
Exercisable—End of year
|
|
|
505
|
|
$
|
15.82
|
|
$
|
521
|
|
|
4.45
|
|
|
Weighted average fair value of options granted
during 2013 |
|
$
|
—
|
|
|
|
|
|
|
|
|
|
|
|
Weighted average fair value of options granted
during 2012 |
|
$
|
5.29
|
|
|
|
|
|
|
|
|
|
|
|
Weighted average fair value of options granted
during 2011 |
|
$
|
6.55
|
|
|
|
|
|
|
|
|
|
|
During the years ended December 31, 2013, 2012 and 2011, excess tax benefits of $49, $35 and $37, respectively, were reflected in financing cash flows.
| 38 | ||
The total intrinsic value of options exercised during the years ended December 31, 2013, 2012 and 2011 was $366, $258 and $277, respectively.
The total fair value of options vested during the years ended December 31, 2013, 2012 and 2011 was $271, $404 and $3,890, respectively. The December 31, 2011 amount includes vested options of the retired former chief executive officer in the amount of $2,993. These options expired upon his departure.
Restricted Stock Awards and Restricted Stock Units
Following the Annual Meeting of Stockholders on May 7, 2013, the Company awarded restricted stock units with a grant date value of $50 to each non-employee director who was re-elected, for an aggregate of 21,006 restricted stock units. Each award of restricted stock units vests at the date of the 2014 Annual Meeting of Stockholders. Each non-employee director is entitled to receive a number of shares of the Company's common stock equal to the number of vested restricted stock units, together with dividend equivalents from the date of grant, at such time as the director’s service on the board terminates for any reason.
On December 17, 2012, the Company granted 56,250 voting shares of restricted stock under the 2006 Plan to management. These shares vest in one third increments, on the third, fourth and fifth anniversaries of the date of grant. Any dividends declared will be accrued and paid to the recipient if and when the related shares vest as long as the recipient is still employed by the Company.
Following the Annual Meeting of Stockholders on May 8, 2012, the Company awarded restricted stock units with a grant date award value of $50 to each non-employee director who was re-elected, for an aggregate of 25,044 restricted stock units. Each award of restricted stock units vested at the date of the 2013 Annual Meeting of Stockholders. Each non-employee director is entitled to receive a number of shares of the Company's common stock equal to the number of restricted stock units, together with dividend equivalents from the date of grant, at such time as the director’s service on the board terminates for any reason.
The Company also granted performance based restricted stock awards to the Company’s President on December 17, 2012 and December 20, 2013 in the amount of 17,953 shares and 11,338 shares respectively. These awards are based on the Company achieving at least 85% of a cumulative operating income target for the three year period commencing January 1, 2013 and ending December 31, 2015 for the 2012 grant and the three year period commencing January 1, 2014 and ending December 31, 2016 for the 2013 grant. Each award will vest after the end of the applicable three year performance period at the 100% level if the Company achieves 100% or more of the cumulative operating income target and on a sliding scale down to 0% vesting if the Company achieves less than 85% of the cumulative operating income target. Vesting is dependent upon the recipient being employed and any dividends declared will be accrued and paid to the recipient when the related shares vest.
Restricted common shares are measured at fair value on the date of grant based on the quoted price of the common stock. Such value is recognized as compensation expense over the corresponding vesting period which ranges from one to five years, based on the number of awards that vest.
The following summarizes restricted stock activity for the year ended December 31, 2013:
|
|
|
2013
|
|
||||||||||
|
|
|
Awards
|
|
Units
|
|
||||||||
|
|
|
Shares
(in 000’s) |
|
Weighted
Average Market Value at Grant Date |
|
Shares
(in 000’s) |
|
Weighted
Average Market Value at Grant Date |
|
||||
|
Non-vested —Beginning of year
|
|
|
166
|
|
$
|
12.19
|
|
|
25
|
|
$
|
11.98
|
|
|
Granted
|
|
|
11
|
|
|
13.23
|
|
|
21
|
|
|
14.28
|
|
|
Vested
|
|
|
(22)
|
|
|
12.18
|
|
|
(25)
|
|
|
11.98
|
|
|
Cancelled/Forfeited
|
|
|
(14)
|
|
|
11.64
|
|
|
—
|
|
|
—
|
|
|
Non-vested —End of year
|
|
|
141
|
|
$
|
12.33
|
|
|
21
|
|
$
|
14.28
|
|
Total stock-based compensation cost/(benefit) was $900, $1,040 and $(707) for the years ended December 31, 2013, 2012 and 2011, respectively. Total income tax benefit/(expense) recognized for stock-based compensation arrangements was $459, $400 and $(274) for the years ended December 31, 2013, 2012 and 2011, respectively. The credit for share-based compensation for the year ended December 31, 2011 is due to the reversal of $1.7 million of compensation expense which was recorded prior to January 1, 2011. This reversal resulted from a change in the estimated forfeiture rate from 0% to 100% of non-vested options previously awarded to the former chief executive officer, who retired from the Company effective December 31, 2011.
| 39 | ||
As of December 31, 2013, there was $1,671 of total unrecognized compensation cost related to nonvested share-based compensation arrangements. The cost is expected to be recognized over a weighted average period of approximately 37 months. There were 509,839 shares available for future grants under the 2006 Plan at December 31, 2013.
|
|
9.
|
Commitments and Contingencies
|
The Company has entered into operating leases, primarily for distribution centers and office facilities. These operating leases frequently include renewal options at the fair rental value at the time of renewal. For leases with step rent provisions, whereby the rental payments increase incrementally over the life of the lease, the Company recognizes the total minimum lease payments on a straight line basis over the minimum lease term. Facility rent expense was approximately $2,697 in 2013, $2,671 in 2012 and $2,809 in 2011.
Future minimum lease payments under non-cancelable operating leases with initial terms of one year or more consisted of the following at December 31, 2013:
|
2014
|
|
$
|
2,772
|
|
|
2015
|
|
|
1,706
|
|
|
2016
|
|
|
1,255
|
|
|
2017
|
|
|
818
|
|
|
2018
|
|
|
250
|
|
|
Thereafter
|
|
|
—
|
|
|
Total minimum lease payments
|
|
$
|
6,801
|
|
The Company had aggregate purchase commitments for fixed inventory quantities of approximately $44,288 at December 31, 2013.
As part of the 2010 acquisition, the Company assumed the liability for the post-remediation monitoring of the water quality at one of the acquired facilities in Louisiana. The expected liability of $97 at December 31, 2013 relates to the cost of the monitoring, which the Company estimates will be incurred over approximately the next 3 years and also the cost to plug the wells. Remediation work was completed prior to the acquisition in accordance with the requirements of the Louisiana Department of Environmental Quality.
The Company, along with many other defendants, has been named in a number of lawsuits in the state courts of Illinois, Minnesota, North Dakota, and South Dakota alleging that certain wire and cable which may have contained asbestos caused injury to the plaintiffs who were exposed to this wire and cable. These lawsuits are individual personal injury suits that seek unspecified amounts of money damages as the sole remedy. It is not clear whether the alleged injuries occurred as a result of the wire and cable in question or whether the Company, in fact, distributed the wire and cable alleged to have caused any injuries. The Company maintains general liability insurance that, to date, has covered the defense of and all costs associated with these claims. In addition, the Company did not manufacture any of the wire and cable at issue, and the Company would rely on any warranties from the manufacturers of such cable if it were determined that any of the wire or cable that the Company distributed contained asbestos which caused injury to any of these plaintiffs. In connection with ALLTEL's sale of the Company in 1997, ALLTEL provided indemnities with respect to costs and damages associated with these claims that the Company believes it could enforce if its insurance coverage proves inadequate.
There are no legal proceedings pending against or involving the Company that, in management’s opinion, based on the current known facts and circumstances, are expected to have a material adverse effect on the Company’s consolidated financial position, cash flows, or results from operations.
|
|
10.
|
Subsequent Events
|
On February 10, 2014, the Board of Directors approved a quarterly dividend of $0.11 per share payable to shareholders of record on February 20, 2014. This dividend totaling $1,959 was paid on February 28, 2014.
On March 7, 2014, the Board of Directors adopted a new stock repurchase program under which the Company is authorized to purchase up to $25 million of its outstanding shares of common stock from time to time, depending on market conditions, trading activity, business conditions and other factors.Shares of stock purchased under the program will be held as treasury shares and may be used to satisfy the exercise of options, as restricted stock, to fund acquisitions or for other uses as authorized by the Board of Directors.
| 40 | ||
|
|
11.
|
Select Quarterly Financial Data (unaudited)
|
The following table presents the Company’s unaudited quarterly results of operations for each of the last eight quarters in the period ended December 31, 2013. The unaudited information has been prepared on the same basis as the audited consolidated financial statements.
|
|
|
Year Ended December 31, 2013
|
|
|||||||||||
|
|
|
Fourth
Quarter |
|
Third
Quarter |
|
|
Second
Quarter |
|
First
Quarter |
|
||||
|
|
|
|
|
|
|
|
|
|
|
|
|
|
|
|
|
|
|
(in thousands, except per share data)
|
|
|||||||||||
|
|
|
|
|
|
|
|
|
|
|
|
|
|
|
|
|
Sales
|
|
$
|
94,442
|
|
$
|
95,214
|
|
|
$
|
99,332
|
|
$
|
94,304
|
|
|
Gross profit
|
|
$
|
20,633
|
|
$
|
20,922
|
|
|
$
|
21,725
|
|
$
|
21,379
|
|
|
Operating (loss) income
|
|
$
|
5,408
|
|
$
|
(1,556)
|
|
|
$
|
6,867
|
|
$
|
6,386
|
|
|
Net income (loss)
|
|
$
|
3,149
|
|
$
|
(3,162)
|
(1)
|
|
$
|
4,053
|
|
$
|
3,862
|
|
|
Earnings (loss) per share:
|
|
|
|
|
|
|
|
|
|
|
|
|
|
|
|
Basic
|
|
$
|
0.18
|
|
$
|
(0.18)
|
|
|
$
|
0.23
|
|
$
|
0.22
|
|
|
Diluted
|
|
$
|
0.18
|
|
$
|
(0.18)
|
|
|
$
|
0.23
|
|
$
|
0.22
|
|
|
(1)
|
During the third quarter of 2013, we recorded a non-cash goodwill impairment charge of $7,562, related to the SW reporting unit. See Note 3 for additional information.
|
|
|
|
Year Ended December 31, 2012
|
|
||||||||||
|
|
|
Fourth
Quarter |
|
Third
Quarter |
|
Second
Quarter |
|
First
Quarter |
|
||||
|
|
|
(in thousands, except per share data)
|
|
||||||||||
|
|
|
|
|
|
|
|
|
|
|
|
|
|
|
|
Sales
|
|
$
|
104,379
|
|
$
|
96,113
|
|
$
|
98,082
|
|
$
|
94,462
|
|
|
Gross profit
|
|
$
|
22,017
|
|
$
|
21,612
|
|
$
|
22,252
|
|
$
|
21,138
|
|
|
Operating income
|
|
$
|
7,438
|
|
$
|
7,156
|
|
$
|
7,530
|
|
$
|
6,802
|
|
|
Net income
|
|
$
|
4,370
|
|
$
|
4,232
|
|
$
|
4,421
|
|
$
|
4,016
|
|
|
Earnings per share:
|
|
|
|
|
|
|
|
|
|
|
|
|
|
|
Basic
|
|
$
|
0.25
|
|
$
|
0.24
|
|
$
|
0.25
|
|
$
|
0.23
|
|
|
Diluted
|
|
$
|
0.25
|
|
$
|
0.24
|
|
$
|
0.25
|
|
$
|
0.23
|
|
| 41 | ||
ITEM 9. CHANGES IN AND DISAGREEMENTS WITH ACCOUNTANTS ON ACCOUNTING AND FINANCIAL DISCLOSURE
None.
ITEM 9A. CONTROLS AND PROCEDURES
Evaluation of Disclosure Controls and Procedures
In accordance with Exchange Act Rules 13a-15 and 15a-15, we carried out an evaluation, under the supervision and with the participation of management, including our Chief Executive Officer and Chief Financial Officer, of the effectiveness of our disclosure controls and procedures as of the end of the period covered by this report. Based on that evaluation, our Chief Executive Officer and Chief Financial Officer concluded that our disclosure controls and procedures were effective as of December 31, 2013.
Design and Evaluation of Internal Control over Financial Reporting
Pursuant to Section 404 of the Sarbanes-Oxley Act of 2002, we included a report of management’s assessment of the design and effectiveness of our internal controls as part of this Annual Report on Form 10-K for the fiscal year ended December 31, 2013. Ernst & Young, LLP, our independent registered public accounting firm, also attested to our internal control over financial reporting. Management’s report and the independent registered accounting firm’s attestation report are included on pages 43 and 44 under the captions entitled “Management’s Report on Internal Control Over Financial Reporting” and “Report of Independent Registered Public Accounting Firm on Internal Control Over Financial Reporting.”
There has been no change in our internal controls over financial reporting that occurred during the year ended December 31, 2013 that has materially affected, or is reasonably likely to materially affect, our internal controls over financial reporting.
| 42 | ||
MANAGEMENT’S REPORT ON INTERNAL CONTROL OVER FINANCIAL REPORTING
The Company has assessed the effectiveness of its internal control over financial reporting as of December 31, 2013 based on criteria established by Internal Control — Integrated Framework issued by the Committee of Sponsoring Organizations of the Treadway Commission (1992 framework) (“COSO Framework”). The Company’s management is responsible for establishing and maintaining adequate internal controls over financial reporting. The Company’s independent registered public accountants that audited the Company’s financial statements as of December 31, 2013 have issued an attestation report on management’s assessment of the effectiveness of the Company’s internal control over financial reporting, which appears on page 44.
Internal control over financial reporting is a process designed to provide reasonable assurance regarding the reliability of financial reporting and the preparation of financial statements for external purposes in accordance with generally accepted accounting principles. Internal control over financial reporting includes those policies and procedures that: (1) pertain to the maintenance of records that, in reasonable detail, accurately and fairly reflect the transactions and dispositions of the assets of the company; (2) provide reasonable assurance that transactions are recorded as necessary to permit preparation of financial statements in accordance with generally accepted accounting principles, and that receipts and expenditures of the company are being made only in accordance with authorizations of management and directors of the company; and (3) provide reasonable assurance regarding prevention or timely detection of unauthorized acquisition, use, or disposition of the company’s assets that could have a material effect on the financial statements. Because of the inherent limitations, internal control over financial reporting may not prevent or detect misstatements. Also, projections of any evaluation of effectiveness to future periods are subject to the risk that controls may become inadequate because of changes in conditions, or that the degree of compliance with the policies and procedures may deteriorate.
The Company’s assessment of the effectiveness of its internal control over financial reporting included testing and evaluating the design and operating effectiveness of its internal controls. In management’s opinion, the Company has maintained effective internal control over financial reporting as of December 31, 2013, based on criteria established in the COSO Framework.
|
/s/ James L. Pokluda III
|
|
/s/ Nicol G. Graham
|
|
James L. Pokluda III
|
|
Nicol G. Graham
|
|
President and Chief Executive Officer
|
|
Chief Financial Officer, Treasurer
|
|
|
|
and Secretary (Chief Accounting Officer)
|
| 43 | ||
Report of Independent Registered Public Accounting Firm
Board of Directors and Stockholders
Houston Wire & Cable Company
We have audited Houston Wire & Cable Company’s internal control over financial reporting as of December 31, 2013, based on criteria established in Internal Control—Integrated Framework issued by the Committee of Sponsoring Organizations of the Treadway Commission (1992 framework) (the COSO criteria). Houston Wire & Cable Company’s management is responsible for maintaining effective internal control over financial reporting, and for its assessment of the effectiveness of internal control over financial reporting included in the accompanying Management’s Report on Internal Control Over Financial Reporting. Our responsibility is to express an opinion on the company’s internal control over financial reporting based on our audit.
We conducted our audit in accordance with the standards of the Public Company Accounting Oversight Board (United States). Those standards require that we plan and perform the audit to obtain reasonable assurance about whether effective internal control over financial reporting was maintained in all material respects. Our audit included obtaining an understanding of internal control over financial reporting, assessing the risk that a material weakness exists, testing and evaluating the design and operating effectiveness of internal control based on the assessed risk, and performing such other procedures as we considered necessary in the circumstances. We believe that our audit provides a reasonable basis for our opinion.
A company’s internal control over financial reporting is a process designed to provide reasonable assurance regarding the reliability of financial reporting and the preparation of financial statements for external purposes in accordance with generally accepted accounting principles. A company’s internal control over financial reporting includes those policies and procedures that (1) pertain to the maintenance of records that, in reasonable detail, accurately and fairly reflect the transactions and dispositions of the assets of the company; (2) provide reasonable assurance that transactions are recorded as necessary to permit preparation of financial statements in accordance with generally accepted accounting principles, and that receipts and expenditures of the company are being made only in accordance with authorizations of management and directors of the company; and (3) provide reasonable assurance regarding prevention or timely detection of unauthorized acquisition, use, or disposition of the company’s assets that could have a material effect on the financial statements.
Because of its inherent limitations, internal control over financial reporting may not prevent or detect misstatements. Also, projections of any evaluation of effectiveness to future periods are subject to the risk that controls may become inadequate because of changes in conditions, or that the degree of compliance with the policies or procedures may deteriorate.
In our opinion, Houston Wire & Cable Company maintained, in all material respects, effective internal control over financial reporting as of December 31, 2013, based on the COSO criteria.
We also have audited, in accordance with the standards of the Public Company Accounting Oversight Board (United States), the consolidated balance sheets of Houston Wire & Cable Company as of December 31, 2013 and 2012, and the related consolidated statements of income, stockholders’ equity, and cash flows for each of the three years in the period ended December 31, 2013 of Houston Wire & Cable Company and our report dated March 13, 2014 expressed an unqualified opinion thereon.
/s/ Ernst & Young LLP
Houston, Texas
March 13, 2014
| 44 | ||
ITEM 9B. OTHER INFORMATION
We have no information to report pursuant to Item 9B.
PART III
ITEM 10. DIRECTORS, EXECUTIVE OFFICERS AND CORPORATE GOVERNANCE
The information called for by Item 10 relating to directors and nominees for election to the Board of Directors is incorporated herein by reference to the “Election of Directors” section of the registrant’s definitive Proxy Statement relating to the Annual Meeting of Stockholders to be held on May 6, 2014. The information called for by Item 10 relating to executive officers and certain significant employees is set forth in Part I of this Annual Report on Form 10-K.
The information called for by Item 10 relating to disclosure of delinquent Form 3, 4 or 5 filers is incorporated herein by reference to the “General – Section 16 (a) Beneficial Ownership Reporting Compliance” section of the registrant’s definitive Proxy Statement relating to the Annual Meeting of Stockholders to be held on May 6, 2014.
The information called for by Item 10 relating to the code of ethics is incorporated herein by reference to the “Corporate Governance and Board Committees – Code of Conduct” section of the registrant’s definitive Proxy Statement relating to the Annual Meeting of Stockholders to be held on May 6, 2014.
The information called for by Item 10 relating to the procedures by which security holders may recommend nominees to the Board of Directors is incorporated herein by reference to the “Corporate Governance and Board Committees – Stockholder Recommendations for Director Nominations” section of the registrant’s definitive Proxy Statement relating to the Annual Meeting of Stockholders to be held on May 6, 2014.
The information called for by Item 10 relating to the audit committee and the audit committee financial expert is incorporated herein by reference to the “Corporate Governance and Board Committees – Committees Established by the Board – Audit Committee” section of the registrant’s definitive Proxy Statement relating to the Annual Meeting of Stockholders to be held on May 6, 2014.
ITEM 11. EXECUTIVE COMPENSATION
The information called for by Item 11 is incorporated herein by reference to the “Compensation Committee Report,” “Compensation Committee Interlocks and Insider Participation,” “Executive Compensation” and “Director Compensation” sections of the registrant’s definitive Proxy Statement relating to the Annual Meeting of Stockholders to be held on May 6, 2014.
ITEM 12. SECURITY OWNERSHIP OF CERTAIN BENEFICIAL OWNERS AND MANAGEMENT AND RELATED STOCKHOLDER MATTERS
The information called for by Item 12 is incorporated herein by reference to the “Stock Ownership of Certain Beneficial Owners and Management” and “Equity Compensation Plan Information” sections of the registrant’s definitive Proxy Statement relating to the Annual Meeting of Stockholders to be held on May 6, 2014.
ITEM 13. CERTAIN RELATIONSHIPS AND RELATED TRANSACTIONS, AND DIRECTOR INDEPENDENCE
The information called for by Item 13 is incorporated herein by reference to the “Corporate Governance and Board Committees – Director Independence” and “Related Party Transaction Policy” sections of the registrant’s definitive Proxy Statement relating to the Annual Meeting of Stockholders to be held on May 6, 2014.
ITEM 14. PRINCIPAL ACCOUNTANT FEES AND SERVICES
The information called for by Item 14 is incorporated herein by reference to the “Principal Independent Accountant Fees and Services” section of the registrant’s definitive Proxy Statement relating to the Annual Meeting of Stockholders to be held on May 6, 2014.
| 45 | ||
PART IV
ITEM 15. EXHIBITS AND FINANCIAL STATEMENT SCHEDULES
| (a) | The following financial statements of our Company and Report of the Independent Registered Public Accounting Firm areincluded in Part II: |
| · | Report of Independent Registered Public Accounting Firm |
| · | Consolidated Balance Sheets as of December 31, 2013 and 2012 |
| · | Consolidated Statements of Income for the years ended December 31, 2013, 2012 and 2011 |
| · | Consolidated Statements of Stockholders’ Equity for the years ended December 31, 2013, 2012 and 2011 |
| · | Consolidated Statements of Cash Flows for the years ended December 31, 2013, 2012 and 2011 |
| · | Notes to Consolidated Financial Statements |
| (b) | Financial Statement Schedules: |
Financial statement schedules have been omitted because they are either not applicable or the required information has been disclosed in the financial statements or notes thereto.
| (c) | Exhibits |
Exhibits are set forth on the attached exhibit index
| 46 | ||
SIGNATURES
Pursuant to the requirements of Section 13 or 15(d) of the Securities Exchange Act of 1934, the registrant has duly caused this report to be signed on its behalf by the undersigned, thereunto duly authorized.
|
|
HOUSTON WIRE & CABLE COMPANY
(Registrant)
|
|
|
|
|
|
|
Date: March 13, 2014
|
By:
|
/s/ NICOL G. GRAHAM
|
|
|
|
Nicol G. Graham
Chief Financial Officer, Treasurer and Secretary
|
Pursuant to the requirements of the Securities Exchange Act of 1934, this report has been signed below by the following persons on behalf of the registrant and in the capacities and on the dates indicated.
|
SIGNATURE
|
|
TITLE
|
|
DATE
|
|
|
|
|
|
|
|
/s/ JAMES L. POKLUDA III
|
|
President, Chief Executive Officer and Director
|
|
March 13, 2014
|
|
James L. Pokluda III
|
|
|
|
|
|
|
|
|
|
|
|
/s/ NICOL G. GRAHAM
|
|
Chief Financial Officer, Treasurer and
Secretary (Principal Accounting Officer)
|
|
March 13, 2014
|
|
Nicol G. Graham
|
|
|
|
|
|
|
|
|
|
|
|
/s/ MICHAEL T. CAMPBELL
|
|
Director
|
|
March 13, 2014
|
|
Michael T. Campbell
|
|
|
|
|
|
|
|
|
|
|
|
/s/ IAN STEWART FARWELL
|
|
Director
|
|
March 13, 2014
|
|
Ian Stewart Farwell
|
|
|
|
|
|
|
|
|
|
|
|
/s/ PETER M. GOTSCH
|
|
Director
|
|
March 13, 2014
|
|
Peter M. Gotsch
|
|
|
|
|
|
|
|
|
|
|
|
/s/ WILSON B. SEXTON
|
|
Director
|
|
March 13, 2014
|
|
Wilson B. Sexton
|
|
|
|
|
|
|
|
|
|
|
|
/s/ WILLIAM H. SHEFFIELD
|
|
Director
|
|
March 13, 2014
|
|
William H. Sheffield
|
|
|
|
|
|
|
|
|
|
|
|
/s/ SCOTT L. THOMPSON
|
|
Director
|
|
March 13, 2014
|
|
Scott L. Thompson
|
|
|
|
|
INDEX TO EXHIBITS
|
EXHIBIT
NUMBER
|
|
EXHIBIT
|
|
|
|
|
|
3.1
|
|
Amended and Restated Certificate of Incorporation of Houston Wire & Cable Company (incorporated herein by reference to Exhibit 3.1 to Houston Wire & Cable Company’s Registration Statement on Form S-1 (Registration No. 333-132703))
|
|
|
|
|
|
3.2
|
|
Amended and Restated By-Laws of Houston Wire & Cable Company (incorporated herein by reference to Exhibit 3.2 to Houston Wire & Cable Company’s Registration Current Report on Form 8-K filed May 11, 2012)
|
|
|
|
|
|
10.1*
|
|
Houston Wire & Cable Company 2000 Stock Plan (incorporated herein by reference to Exhibit 10.2 to Houston Wire & Cable Company’s Registration Statement on Form S-1 (Registration No. 333-132703))
|
|
|
|
|
|
10.2*
|
|
Houston Wire & Cable Company 2006 Stock Plan, as amended (incorporated herein by reference to (i) Exhibit 10.3 to Houston Wire & Cable Company’s Registration Statement on Form S-1 (Registration No. 333-132703) and (ii) Exhibit 10.1 to Houston Wire & Cable Company’s Quarterly Report on Form 10-Q for the quarter ended June 30, 2011, as amended)
|
|
|
|
|
|
10.3*
|
|
Executive Employment Agreement dated as of January 1, 2012 between James L. Pokluda, III and Houston Wire & Cable Company (incorporated herein by reference to Exhibit 10.3 to Houston Wire & Cable Company’s Annual Report on Form 10-K for the year ended December 31, 2011)
|
|
|
|
|
|
10.4*
|
|
Form of Employee Stock Option Agreement under Houston Wire & Cable Company’s 2006 Stock Plan (incorporated herein by reference to Exhibit 10.23 to Houston Wire & Cable Company’s Annual Report on Form 10-K for the year ended December 31, 2007)
|
|
|
|
|
|
10.5*
|
|
Form of Director Stock Option Agreement under Houston Wire & Cable Company’s 2006 Stock Plan (incorporated herein by reference to Exhibit 10.24 to Houston Wire & Cable Company’s Annual Report on Form 10-K for the year ended December 31, 2007)
|
|
|
|
|
|
10.6*
|
|
Form of Employee Stock Award Agreement under Houston Wire & Cable Company’s 2006 Stock Plan (incorporated herein by reference to Exhibit 10.6 to Houston Wire & Cable Company’s Annual Report on Form 10-K for the year ended December 31, 2011)
|
|
|
|
|
|
10.7*
|
|
Form of Restricted Stock Unit Award Agreement for Non-Employee Directors under Houston Wire & Cable Company’s 2006 Stock Plan (incorporated herein by reference to Exhibit 10.2 to Houston Wire & Cable Company’s Quarterly Report on Form 10-Q for the quarter ended June 30, 2011, as amended)
|
|
|
|
|
|
10.8*
|
|
Description of Senior Management Bonus Program (incorporated herein by reference to Exhibit 10.8 to Houston Wire & Cable Company’s Annual Report on Form 10-K for the year ended December 31, 2011)
|
|
|
|
|
|
10.9*
|
|
Form of Director/Officer Indemnification Agreement by and between Houston Wire & Cable Company and a director, member of a committee of the Board of Directors or officer of Houston Wire & Cable Company (incorporated herein by reference to Exhibit 10.24 to Houston Wire & Cable Company’s Annual Report on Form 10-K for the year ended December 31, 2006)
|
|
|
|
|
|
10.10
|
|
Third Amended and Restated Loan and Security Agreement, dated as of September 30, 2011, among HWC Wire & Cable Company, as borrower, Houston Wire & Cable Company, as Guarantor, certain financial institutions, as lenders, and Bank of America, N.A., as agent (incorporated herein by reference to Exhibit 10.1 to Houston Wire & Cable Company’s Current Report on Form 8-K filed October 5, 2011)
|
|
|
|
|
|
10.11
|
|
Second Amended and Restated Guaranty dated as of September 30, 2011, by Houston Wire & Cable Company, as guarantor, in favor of Bank of America, N.A., as agent (incorporated herein by reference to Exhibit 10.2 to Houston Wire & Cable Company’s Current Report on Form 8-K filed October 5, 2011)
|
|
|
|
|
|
10.12*
|
|
Second Amendment to the Houston Wire & Cable Company’s 2006 Stock **
|
|
|
|
|
|
21.1
|
|
Subsidiaries of Houston Wire & Cable Company (incorporated herein by reference to Exhibit 21.1 to Houston Wire & Cable Company’s Registration Statement on Form S-1 (Registration No. 333-132703))
|
|
23.1
|
|
Consent of Ernst & Young, LLP **
|
|
|
|
|
|
31.1
|
|
Certification of CEO Pursuant to Section 302 of the Sarbanes-Oxley Act of 2002 ** |
|
|
|
|
|
31.2
|
|
Certification of CFO Pursuant to Section 302 of the Sarbanes-Oxley Act of 2002 ** |
|
|
|
|
|
32.1
|
|
Certifications of CEO and CFO pursuant to 18 U.S.C. Section 1350, as adopted pursuant to Section 906 of the Sarbanes-Oxley Act of 2002 ** |
* Management contract or compensatory plan or arrangement
** Filed herewith