 Cortical Stimulation for the Treatment of Motor Deficit following Ischemic Stroke Robert M. Levy, MD, PhD Professor of Neurological Surgery Feinberg School of Medicine Northwestern University Exhibit 99.3 |
 ASSFN Vancouver 2008: New Horizons in Functional Neurosurgery June 1-4, 2008 Westin Bayshore Hotel Vancouver, BC |
 Disclosures • Study Sponsor: Northstar Neuroscience, Seattle, WA • RML: Research Grant Support, Consultant • Caution: Investigational device. Limited by Federal (or U.S.) law to investigational use.
|
 Concept: Cortical Stimulation for Stroke Recovery • Cerebral cortex has the ability to reorganize synaptic connectivity in response to injury – neuroplasticity • When combined with rehabilitation, cortical stimulation may facilitate neuroplasticity and improve function |
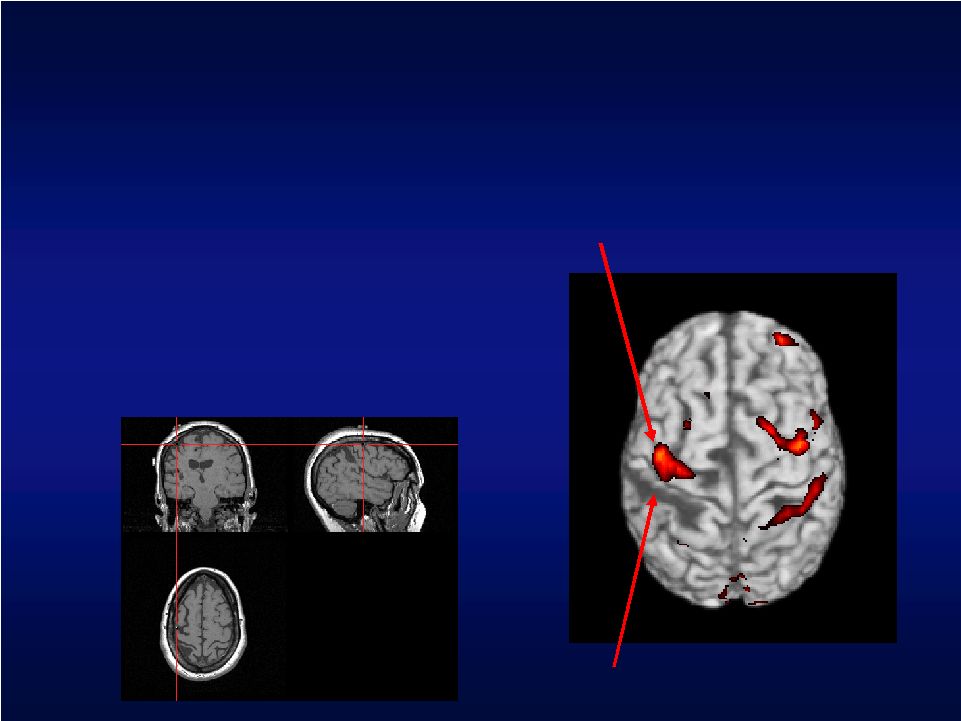
 Neuroplasticity: Shown by Functional Magnetic Resonance Imaging (fMRI) Tissue damaged by stroke Results in loss of motor function Alternative Pathway Other areas of the brain assume some function for the damaged area |
 Pre-Clinical Studies of Cortical Stimulation for Stroke Recovery Rodent G. Campbell Teskey, PhD University of Calgary Randy Nudo, PhD Jeff Kleim, PhD T. Jones, PhD Investigator Primate Rodent Rodent Model University of Texas, Austin University of Lethbridge University of Kansas Institution |
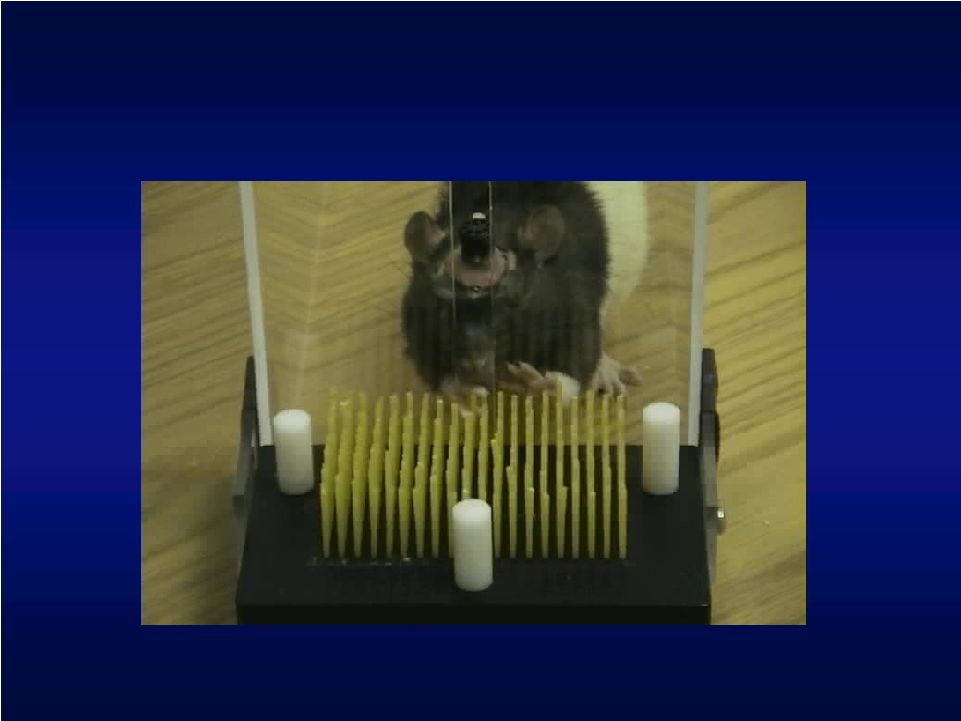
 Preclinical Studies: Montoya Staircase Test Apparatus Food retrieval task Source: T. Jones (U of Texas, Austin) and G.C. Teskey (U of Calgary)
|
 Stimulation During Training vs. Control 0 10 20 30 40 50 60 70 0 1 2 3 4 5 6 7 8 9 10 11 12 Days of Post-Implant Training Pre-Stroke Performance Training only Source: T. Jones (U of Texas, Austin) Behavioral Performance: Stimulation During Training Restores Rats to Pre-Stroke Performance |
 Stimulation During Training vs. Control 0 10 20 30 40 50 60 70 0 1 2 3 4 5 6 7 8 9 10 11 12 Days of Post-Implant Training Pre-Stroke Performance Training only Stimulation during training Source: T. Jones (U of Texas, Austin) Behavioral Performance: Stimulation During Training Restores Rats to Pre-Stroke Performance |
 Pre-Clinical Studies in Rats: Pasta Matrix Test Apparatus Source: G.C. Teskey (U of Calgary) |
 Pre-Clinical Studies in Rats 20 25 30 35 40 45 Pre No 1 2 3 4 5 6 7 8 9 No Rehab Session Rehab only CS during Rehab CS before Rehab CS must be concurrent with rehabilitation Source: G.C. Teskey (U of Calgary) |
 Pre-Clinical Studies in Primates Source: R. Nudo (KUMC) |
 Source:
R. Nudo (KUMC) • Food retrieval task • Tests average time to retrieve pellets from series of wells Primate Studies |
 Neurophysiological Mapping Techniques (ICMS) Source: Plautz et al, Presented at the International Stroke Conference, 2005 PMD SMA S1 M1 PMV 2 mm M1 HAND PMV FACE LATERAL ROSTRAL 2 mm MICROFORCEPS ISCHEMIC AREA CENTRAL SULCUS INFARCT BORDER PRE-INFARCT POST-INFARCT |
 % Recovery Relative to Pre-Infarct Performance Level • CS/RT = Cortical Stimulation + Rehabilitative Training, RT = Rehabilitative Training only • % recovery relative to baseline measured using dwell time performance during therapy • CS/RT produced greater maximum recovery level than RT 0% 20% 40% 60% 80% 100% 9 10 11 12 13 14 15 RT (n=5) CS/RT (n=3) EXPERIMENT WEEK Therapy 88% max recovery 56% max recovery |
 • Therapy initiated 4 months post-stroke • Significant improvements maintained at 6 month follow-up • Replicated in subsequent studies 0.0 0.5 1.0 1.5 2.0 2.5 Pre-lesion Pre-therapy Post-therapy Follow-up 59% improvement Longevity of Functional Improvements, Primate Chronic Stroke Model Source: R. Nudo (KUMC) Cortical Stimulation + Rehabilitative Training |
 Summary of Pre-Clinical Studies • Consistent results were achieved across 2 species (rodent and primate) and 3 ischemic stroke models • Studies demonstrated that cortical stimulation – Is safe – Significantly improves recovery of function compared to control – Shows benefit with both bipolar and monopolar stimulation – Is effective when administered months after stroke – Achieves gains that are significant and are retained for months beyond treatment • Optimal electrical stimulation parameters evaluated • Mapping studies indicate cortical reorganization
|
 ADAMS (2003) Phase I BAKER (2004) Phase II EVEREST (2008) Pivotal Cortical Stimulation for Stroke Recovery Clinical Trials Safety N = 8 3 US sites Safety & Efficacy N = 24 9 US sites Safety & Efficacy N = 151 21 US sites |
 Combined ADAMS and BAKER: Improvement in Upper Extremity Fugl- Meyer (UEFM) ANOVA: Overall P<0.001, group by assessment interaction P=0.04. * P=0.01 compared with control group by t-test. UEFM Score: Change From Baseline Statistically significant improvements in function 0 1 2 3 4 5 6 7 8 9 Baseline Investigational Group Control Gro Follow-Up Week 4 Follow-Up Week 12 * * Clinically Meaningful |
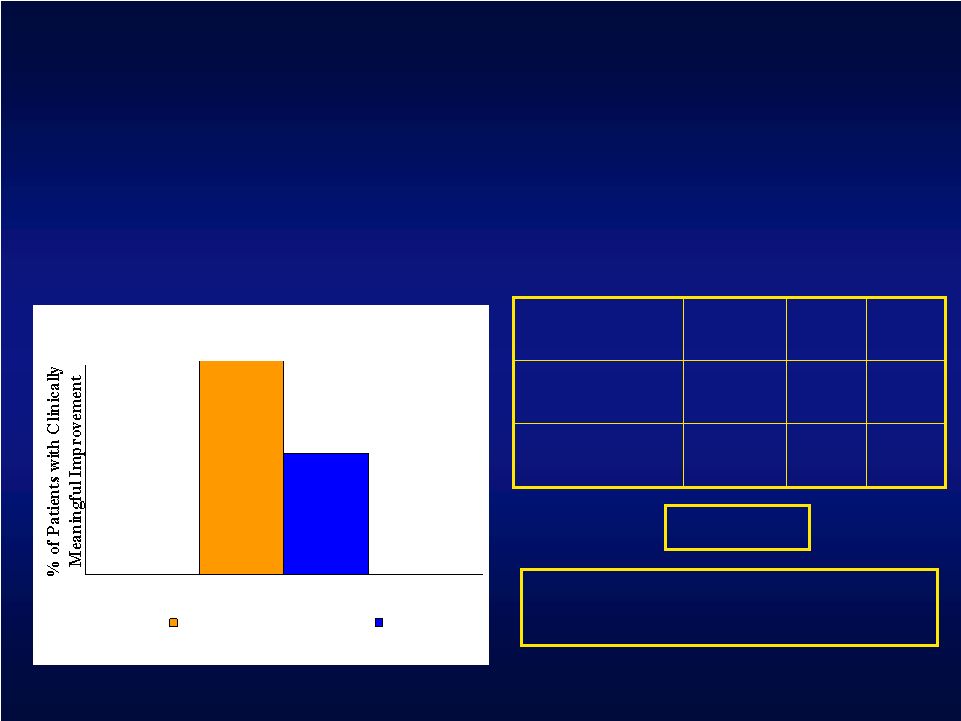
 Patients with Clinically Meaningful Changes (>3.5 points) in UEFM: Combined ADAMS and BAKER * P=0.01 compared with control group by chi-square test. Patients with Clinically Meaningful Improvement in UEFM Score 75% 81% 31% 38% 0% 20% 40% 60% 80% 100% Follow-Up Week 4 Follow-Up Week 12 Investigational Group Control Group * * 75% of cortical stimulation patients showed improvement |
 Evidence of
the Brain’s Response to Cortical Stimulation Therapy using fMRI:
Overview • ADAMS study – MRI analysis was performed at baseline and after completion of the 3 week rehabilitation protocol. • Patients performed the same motor task at each fMRI session: index finger tapping or wrist extension • The fMRI activation maps for each group (control group or the investigational group) were compared to identify changes in activation resulting from therapy • Results published in Stroke May 2005 f |
 fMRI:
Normal Hand Activation |
 Patient 1 – fMRI Analysis Consolidation of activation Prior to therapy Response to therapy |
 ADAMS
MRI Results Baseline Activation f |
 MRI
Consolidation Results • The investigational group showed a reduced volume of activation post-therapy, while the control group showed almost no change • The consolidation of activation seen in the investigational group resembles events seen during spontaneous recovery from stroke Consolidation of activation Caution: Investigational device. Limited by federal (or US) law to investigational use f |
 Case Study (Patient 1) American Academy of Neurology 4/07, Helmi Lutsep MD 0% 10% 20% 30% 40% 50% 60% 70% 80% 90% 100% UEFM AMAT SIS Hand SIS Recovery Baseline 12 weeks 3 years Performance upon initiating ADAMS study (Baseline), 12 weeks after receiving investigational CS and rehabilitation, and 3 years later. Results are normalized to the maximum score (normal function) for each outcome measure. Conclusion: The effects of CS plus rehabilitation not only persisted for 3 years but showed further gains in function. |
 Cortical Stimulation for Stroke Recovery • Pre-clinical and feasibility clinical trials leading up to EVEREST trial – Have shown safety – Have suggested that cortical stimulation combined with rehabilitation significantly improves hand/arm function compared with rehabilitation alone – fMRI has shown that cortical stimulation consolidates activation in the stroke affected hemisphere while the control group showed no significant changes |
 Study Design • Prospective, randomized, single-blinded, multi-center pivotal
trial • Patients randomized into two cohorts: investigational or control • 152 subjects • 94 investigational (implant) • 58 control (no implant) • Investigational cohort implanted with epidural stimulation system and
given sub-threshold cortical stimulation concurrent with
rehabilitation therapy • Both cohorts subjected to same quality and quantity of rehabilitation
(2- 2.5 hours per day, 65 total hours over 6 weeks)
• Study was FDA and IRB approved |
 EVEREST – High-Level Protocol Summary Subject Referral Phone Screen Informed Consent Entry Criteria Evaluation Rehab Screen A fMRI Baseline Evaluation Randomi- zation A Control Arm Investigational Arm Device Implant Rehab w/o Stimulation Follow-Up Weeks 9-24 Follow-up Weeks 1-8 Device Removal Follow-up Weeks 1-8 Rehab and Stimulation Enrolled Randomized |
 EVEREST Clinical Sites Spaulding / MGH Wayne State NU U. AZ U. Utah UT Houston CNI / Swedish OHSU U. Florida Jacksonville U. Cinn U. Pitt U. Penn SUNY USC UCSF Mt. Sinai Stanford UIC St. Luke’s Swedish Emory |
 Cortical Stimulation System • fMRI used to identify activation site for hand • Epidural electrode placed over cortical target indicated by fMRI • Implantable pulse generator • Overnight hospital stay • Subthreshold stimulation delivered only during rehabilitation • Patient does not feel stimulation Caution: Investigational device. Limited by federal (or US) law to investigational use. |
 Stimulation Site Identification • Locate site of cortical activation associated with hand function • Neuronavigation based on fMRI data used to identify stimulation site Region of stroke Neuroplastic area associated with hand function |
 Inclusion Criteria (Partial List) • Ischemic vascular stroke that is: – Above the level of the midbrain – At least 4 months old – Documented by CT or MRI • Index stroke is most recent stroke • Medically and neurologically stable • Moderate to moderately severe upper-extremity hemiparesis: – UEFM 28-50 – Active wrist extension of 5º or repetitive grasp • Age 21 years or older |
 Exclusion Criteria (Partial List) • Primary hemorrhagic stroke • Any additional stroke (other than index stroke) associated with incomplete motor recovery • History of seizure disorder • Moderate to severe hemispatial neglect and/or anosognosia involving the affected limb • Severe sensory deficit • Contraindication to stimulation system placement surgery
|
 Primary Outcome Measures 0.21 point improvement 4.5 point improvement Clinically Meaningful 0-5 points higher score = better performance 0-66 points Higher score = better function Score Range Activities of Daily Living (ADLs) scored for speed, function and quality of movement Hand/arm function (9 components of neurologic and motor function) What is Measured Arm Motor Ability Test Upper Extremity Fugl-Meyer UEFM AMAT |
 UEFM + AMAT Investigational Control 20% Primary Endpoint Analysis • UEFM: % of subjects with clinically meaningful improvement ( 4.5) at 4 weeks following therapy AND • AMAT: % of subjects with clinically meaningful improvement ( .21) at 4 weeks following therapy • Definition of Success: The % of investigational subjects that achieve improvement is at least 20 percentage points more in absolute terms than control subjects |
 Study Results |
 EVEREST: Adverse Events 14 1 45 # SAEs 0 - 6 # SAEs 14 1* 39 # SAEs 12 0 12 Procedure Related 1 - 1* Device Related 31 6 25 Serious AEs (total) # Pts. # Pts. # Pts. Total N = 164 Control N = 60 Investigational N = 104 * Seizure occurred during patient rest day (no stimulation) Device and Procedure related events are a subset of the overall SAE
total |
 Safety • 14 procedure-related SAE’s – 4 infection – 4 pain/HA/nausea – 6 others (clinically sig bleeding between skull and brain, PE with
pre-existing thrombophlebitis, PVC’s, fibrous tissue build up
that was biopsied, cystoscopy for Foley placement) • One death—surgical arm – 76 days after device explant (stroke with resp. failure) • 75% of unrelated SAE’s occurred >30 days post-explant
Cortical Stimulation continues to indicate a good safety profile |
 Primary Outcome Measures: Week 4 |
 EVEREST Composite Primary Efficacy Endpoint Composite Primary Efficacy Endpoint Outcome: The percentage of investigational patients that achieved a clinically meaningful
result for both the UEFM and AMAT at the 4-week
endpoint 29.1% 55 16 Control 31.9% 91 29 Investigational % N Total N Success UEFM + AMAT Investigational Control 31.9% 29.1% UEFM 4.5 AMAT 0.21 & |
 Secondary Analysis of Primary Endpoint – Week Four 0.33 0.5 2.8 (6.0) 21.8 (12.2) 19.7 (12.4) 3.3 (5.0) 22.5 (12.4) 18.9 (11.1) Box & Block Mean (SD) 0.17 0.11 0.26 (0.37) 3.27 (0.75) 3.02 (0.69) 0.37 (0.47) 3.36 (0.71) 2.97 (0.68) AMAT Mean (SD) 0.33 0.3 4.0 (4.3) 41.2 (7.4) 37.6 (5.7) 4.3 (5.3) 42.0 (8.5) 37.6 (6.1) UEFM Mean (SD) Adjusted p–value* Difference Mean Change N=55 Endpoint N=55 Baseline N=58 Change N=91 Endpoint N=91 Baseline N=94 Investigational Control * 1-sided, p-value adjusted for multiplicity
|
 UEFM:
Investigational and Control Mean Scores at 4, 12, 24 weeks 3.8 4.6 4.0 Control Mean Change in UEFM Score from Baseline 4.8 12 weeks 4.6 24 weeks 4.3 Investigational 4 weeks Long-Term Data: UEFM, Full Analysis Population UEFM Mean Scores vs Time 35 36 37 38 39 40 41 42 43 44 45 46 47 Baseline 4 weeks 12 weeks 24 weeks Investigational Control p = 0.62* Overall treatment effect * Repeated Measures Analysis |
 AMAT Mean Scores vs Time 2.9 3 3.1 3.2 3.3 3.4 3.5 3.6 Baseline 4 weeks 12 weeks 24 weeks AMAT: Investigational and Control Mean Scores at 4, 12, 24 weeks 0.17 0.26 0.26 Control Mean Change in AMAT Score from Baseline 0.36 12 weeks 0.35 24 weeks 0.37 Investigational 4 weeks Long-Term Data: AMAT, Full Analysis Population Investigational Control p = 0.12* Overall treatment effect p = 0.02* Treatment effect at 24 weeks * Repeated Measures Analysis |
 Motor Threshold Subset Data |
 What Is the Motor Threshold Subset? • Motor threshold (MT) test performed to evoke hand movement • Stimulation current set to 50% of MT if achieved, else set to maximum device output • MT performed 3 times throughout rehab protocol (Day 1, Day 6 and end of rehab) • 13 of 94 investigational patients (13.8%) achieved a repeatable motor threshold |
 Motor Threshold Subset Analysis 29.1% 55 16 Control 69.2% 13 9 Investigational % Total N N Success Composite Primary Efficacy Endpoint : The percentage of investigational patients that achieved a clinically meaningful result for
both the UEFM and AMAT at the 4-week endpoint p = 0.002* * Post-hoc analysis, 1-sided p-value UEFM + AMAT Investigational Control 69.2% 29.1% Treatment Difference: Investigational – Control = 40.1% |
 Motor Threshold Subset Analysis: Week Four 0.24 1.2 2.8 (6.0) 21.8 (12.2) 19.7 (12.4) 4.0 (4.0) 26.5 (11.7) 22.5 (12.1) Box & Block Mean (SD) 0.04 0.25 0.26 (0.37) 3.27 (0.75) 3.02 (0.69) 0.50 (0.42) 3.55 (0.73) 3.05 (0.73) AMAT Mean (SD) 0.02 3.2 4.0 (4.3) 41.2 (7.4) 37.6 (5.7) 7.2 (3.3) 45.6 (7.6) 38.3 (5.0) UEFM Mean (SD) Adjusted p–value* Difference Mean Change N=55 Endpoint N=55 Baseline N=58 Change N=13 Endpoint N=13 Baseline N=13 Investigational Control * 1-sided, p-value adjusted for multiplicity
|
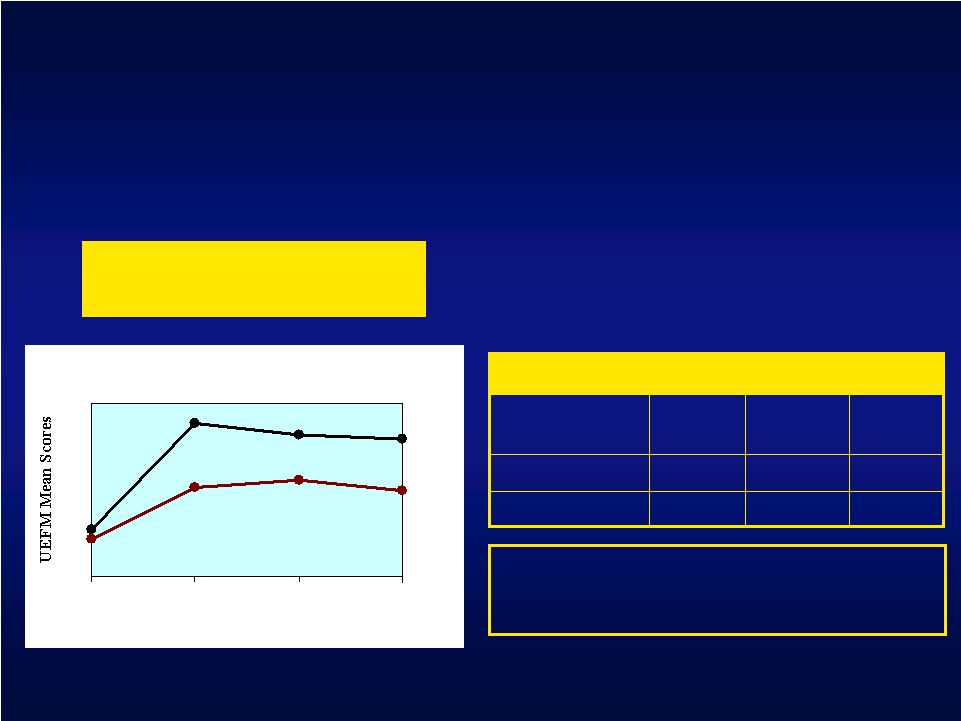 UEFM: Investigational and Control Mean Scores at 4, 12, 24 weeks 3.8 4.6 4.0 Control Mean Change in UEFM Score from Baseline 6.5 12 weeks 6.1 24 weeks 7.2 Investigational 4 weeks Long-Term Data: UEFM, Motor Threshold Subset UEFM Mean Scores vs Time 35 36 37 38 39 40 41 42 43 44 45 46 47 Baseline 4 weeks 12 weeks 24 weeks Investigational Control p = 0.07* Overall treatment effect p = 0.01* Treatment effect at 4 weeks * Repeated Measures Analysis |
 AMAT: Investigational and Control Mean Scores at 4, 12, 24 weeks Long-Term Data: AMAT, Motor Threshold Subset AMAT Mean Scores vs Time 2.9 3 3.1 3.2 3.3 3.4 3.5 3.6 Baseline 4 weeks 12 weeks 24 weeks Investigational Control 0.17 0.26 0.26 Control Mean Change in AMAT Score from Baseline 0.45 12 weeks 0.46 24 weeks 0.51 Investigational 4 weeks p = 0.04* Overall treatment effect p = 0.03* Treatment effect 24 weeks * Repeated Measures Analysis |
 Conclusions • Cortical Stimulation appears safe as anticipated • Data suggest rehabilitation for chronic stroke patients can make a difference (at least acutely) • EVEREST did NOT meet its primary efficacy endpoint |
 Conclusions • Inability to evoke motor activity with CS suggests: • Improper targeting or electrode placement • Inadequate power of stimulation system • Inability to sufficiently stimulate cortex due to subdural CSF and cortical depth (atrophy, deep sulcal target) • Complete functional transection of corticospinal tract |
 Conclusions • Subjects in whom movement was evoked with CS showed significantly superior results as compared to controls • Additional imaging analysis currently underway • Results call for follow-up studies addressing these important issues • CS for stroke related motor deficit may have important clinical applications |
 |