UNITED STATES
SECURITIES AND EXCHANGE COMMISSION
Washington, D.C. 20549
Form 8-K
CURRENT REPORT
Pursuant to Section 13 or 15(d) of the
Securities Exchange Act of 1934
Date of Report (Date of earliest event reported): November 7, 2018
Genesis Healthcare, Inc.
(Exact name of registrant as specified in its charter)
|
|
|
|
|
Delaware |
|
001-33459 |
|
20-3934755 |
(State or Other Jurisdiction of Incorporation) |
|
(Commission File Number) |
|
(IRS Employer Identification Number) |
101 East State Street Kennett Square, PA |
|
19348 |
(Address of Principal Executive Offices) |
|
(Zip Code) |
(610) 444-6350
(Registrant’s telephone number, including area code)
Not Applicable
(Former Name or Former Address, if Changed Since Last Report)
Check the appropriate box below if the Form 8-K filing is intended to simultaneously satisfy the filing obligation of the registrant under any of the following provisions:
◻ |
Written communications pursuant to Rule 425 under the Securities Act (17 CFR 230.425) |
◻ |
Soliciting material pursuant to Rule 14a-12 under the Exchange Act (17 CFR 240.14a-12) |
◻ |
Pre-commencement communications pursuant to Rule 14d-2(b) under the Exchange Act (17 CFR 240.14d-2(b)) |
◻ |
Pre-commencement communications pursuant to Rule 13e-4(c) under the Exchange Act (17 CFR 240.13e-4(c)) |
Indicate by check mark whether the registrant is an emerging growth company as defined in Rule 405 of the Securities Act of 1933 (§230.405 of this chapter) or Rule 12b-2 of the Securities Exchange Act of 1934 (§240.12b-2 of this chapter).
Emerging growth company ◻
If an emerging growth company, indicate by check mark if the registrant has elected not to use the extended transition period for complying with any new or revised financial accounting standards provided pursuant to Section 13(a) of the Exchange Act. ◻
Item 2.02Results of Operations and Financial Condition.
On November 7, 2018, Genesis Healthcare, Inc. (“Genesis”) issued the press release furnished herewith as Exhibit 99.1 reporting its operating results for the third quarter ended September 30, 2018 (the “Earnings Release”).
Certain information contained in the Earnings Release refers to non-GAAP financial measures and other definitions specific to Genesis’ businesses. For an explanation of the adjustments and a description of Genesis’ uses of, and the limitations associated with, non-GAAP financial measures, including Adjusted EBITDA, Adjusted EBITDAR, EBITDA and EBITDAR (each as defined below), see “Reasons for Non-GAAP Financial Disclosure” in the Earnings Release.
Definitions of key performance indicators and non-GAAP measures used in the Earnings Release:
The following is a glossary of terms for some key performance indicators and non-GAAP measures used in reference to Genesis:
“Actual Patient Days” is defined as the number of residents occupying a bed (or units in the case of an assisted/senior living center) for one qualifying day in that period.
“Adjusted EBITDA” is defined as EBITDA adjusted for certain excluded items to provide a supplemental performance measure.
“Adjusted EBITDAR” is defined as EBITDAR adjusted for certain excluded items to provide a supplemental valuation measure.
“Available Patient Days” is defined as the number of available beds (or units in the case of an assisted/senior living center) multiplied by the number of days in that period.
“Average Daily Census” or “ADC” is the number of residents occupying a bed (or units in the case of an assisted/senior living center) over a period of time, divided by the number of calendar days in that period.
“EBITDAR” is defined as net income or loss attributed to Genesis Healthcare, Inc. before net income or loss of non-controlling interests, net income or loss from discontinued operations, depreciation and amortization expense, interest expense and lease expense.
“EBITDA” is defined as EBITDAR less lease expense.
“Insurance” refers collectively to commercial insurance and managed care payor sources, including Medicare Advantage beneficiaries, but does not include managed care payors serving Medicaid residents, which are included in the Medicaid category.
“Occupancy Percentage” is measured as the percentage of Actual Patient Days relative to the Available Patient Days.
“Skilled Mix” refers collectively to Medicare and Insurance payor sources.
“Therapist Efficiency” is computed by dividing billable labor minutes related to patient care by total labor minutes for the period.
This information and the information contained in the press release shall not be deemed “filed” for purposes of Section 18 of the Securities Exchange Act of 1934, as amended, or otherwise subject to the liabilities of that Section. The information in this Current Report on Form 8-K is not incorporated by reference into any filings of the Company made under the Securities Act of 1933, as amended, whether made before or after the date of this
1
Current Report on Form 8-K, regardless of any general incorporation language in the filing, unless specifically stated so therein.
Item 7.01. Regulation FD Disclosure
On November 7, 2018, Genesis Healthcare, Inc. (“Genesis”) will make available on its web site the investor presentation materials attached to this report as Exhibit 99.2. This information and the information contained in the presentation materials shall not be deemed “filed” for purposes of Section 18 of the Securities Exchange Act of 1934, as amended, or otherwise subject to the liabilities of that Section. The information in this Current Report on Form 8-K is not incorporated by reference into any filings of the Company made under the Securities Act of 1933, as amended, whether made before or after the date of this Current Report on Form 8-K, regardless of any general incorporation language in the filing, unless specifically stated so therein. The furnishing of these materials is not intended to constitute a representation that such furnishing is required by Regulation FD or other securities laws, or that the investor presentation materials include material information regarding Genesis that is not otherwise publicly available. In addition, Genesis does not assume any obligation to update such information in the future.
Item 9.01 Financial Statements and Exhibits.
(d) Exhibits.
Exhibit |
Description |
2
SIGNATURES
Pursuant to the requirements of the Securities Exchange Act of 1934, the registrant has duly caused this report to be signed on its behalf by the undersigned hereunto duly authorized.
Date: November 7, 2018 |
GENESIS HEALTHCARE, INC. |
|
/s/ Michael S. Sherman |
|
Michael S. Sherman |
|
Senior Vice President, General Counsel, Secretary and Assistant Treasurer
|
Exhibit 99.1
FOR IMMEDIATE RELEASE
Genesis HealthCare Contact:
Investor Relations
610-925-2000
GENESIS HEALTHCARE REPORTS SOLID THIRD QUARTER 2018 RESULTS
KENNETT SQUARE, PA – (November 7, 2018) – Genesis Healthcare, Inc. (Genesis, or the Company) (NYSE:GEN), one of the largest post-acute care providers in the United States, today announced operating results for the third quarter ended September 30, 2018.
Third Quarter 2018 Results
· |
US GAAP revenue in the third quarter of 2018 was $1.22 billion compared to $1.32 billion in the third quarter of 2017; |
· |
US GAAP net loss attributable to Genesis Healthcare, Inc. in the third quarter of 2018 was $58.1 million compared to $373.8 million in the third quarter of 2017; and |
· |
Adjusted EBITDA in the third quarter of 2018 was $113.5 million compared to $109.1 million in the third quarter of 2017. |
“We are very pleased to report solid results for the third consecutive quarter, as we continued to build on our first half momentum,” noted George V. Hager, Jr., Chief Executive Officer of Genesis. “Adjusted EBITDAR on a same store basis in the third quarter of 2018 grew 2.6% from the third quarter of 2017, marking the first time we will report same store Adjusted EBITDAR growth since 2015. Third quarter 2018 Adjusted EBITDAR less cash lease payments also beat FactSet consensus estimates for the third consecutive quarter and more importantly showed year-over-year growth of $16.2 million or 68%.”
“Focused efforts and execution to reduce our cost of service and overhead structure across both our skilled nursing and rehabilitation services business segments along with the divestiture of underperforming facilities continues to produce value resulting in over 50 basis points of Adjusted EBITDAR margin expansion in the third quarter of 2018 as compared to the same period last year,” continued Hager.
Portfolio Optimization
Genesis continues to progress with its strategy to exit challenging facilities and certain low density markets in order to focus on investment and growth in core, strategic markets. During the third quarter, Genesis divested, exited or closed the operations of seven facilities. Including the facilities divested in the first half of 2018, Genesis exited the operations of a total of 26 facilities since the start of the year, with approximate annual net revenue of $266.4 million, Adjusted EBITDA of $0.2 million and a pre-tax net loss of $35.7 million. Genesis estimates these transactions resulted in the reduction of approximately $20.5 million of annual cash lease payments.
Genesis expects it will continue to exit the operations of challenging facilities and markets in the fourth quarter of 2018. The Company expects to exit the operations of an additional 29 facilities by the end of the year. In total, these 29 facilities generated approximate annual net revenue of $212.3 million, Adjusted EBITDA of $7.8 million and a pre-tax net loss of $3.2 million. These divestitures will result in nearly $100 million of debt repayment and the reduction of $0.3 million of annual cash lease payments.
Portfolio Expansion
1
The Company is excited to report expansion of the services it provides to patients and residents in the following core, strategic markets.
· |
On November 1, 2018, Genesis acquired the operations of eight skilled nursing facilities and one assisted living facility in New Mexico and Arizona, increasing our presence in markets we view as favorable. The nine new facilities have approximately 1,000 beds and generate approximate annual net revenue of $60 million. The facilities are leased from one of the Company’s major REIT partners. Genesis expects no material impact to EBITDA in the next 12 months. |
· |
In August 2018, Genesis opened its 10th stand-alone PowerBack Rehabilitation location in a new 120-bed state-of-the-art rehabilitation facility in Exton, PA. PowerBack Rehabilitation offers 100% all short stay rehabilitation so patients can return home as soon as possible. |
Other Updates - Adoption and Impact of Revenue Recognition Accounting Standard
On January 1, 2018, Genesis adopted FASB Accounting Standards Codification Topic 606, Revenue from Contracts with Customers (ASC 606). Results for reporting periods beginning after January 1, 2018 are presented under ASC 606, while comparative information has not been restated and continues to be reported under the accounting standards in effect for those periods. The impact of applying ASC 606 to the three and nine months ended September 30, 2018 was a $20.6 million and $67.4 million implicit price concession, respectively, directly reducing net revenues, which previously would have been recorded as a provision for losses on accounts receivable.
If the provisions of ASC 606 were applied on a pro forma basis to the three and nine months ended September 30, 2017, reported net revenue would have been $1,290.3 million and $3,973.2 million, respectively, with no impact to net loss attributed to Genesis Healthcare, Inc.
Conference Call
Genesis Healthcare, Inc. will hold a conference call at 8:30 a.m. Eastern Time on Thursday, November 8, 2018. Investors can access the conference call by calling (855) 849-2198 or live via a listen-only webcast through the Genesis website at http://www.genesishcc.com/investor-relations/, where a replay of the call will also be posted for one year.
Stifel 2018 Healthcare Conference
Genesis also announced today that George V. Hager, Jr., Chief Executive Officer, and Tom DiVittorio, Chief Financial Officer, are scheduled to conduct a “fireside chat” at the Stifel 2018 Healthcare Conference on Tuesday, November 13, 2018 at 11:45 a.m. Eastern Time. A live webcast and replay will also be available on the Company’s website at www.genesishcc.com/investor-relations.
About Genesis Healthcare, Inc.
Genesis Healthcare, Inc. (NYSE: GEN) is a holding company with subsidiaries that, on a combined basis, comprise one of the nation's largest post-acute care providers with more than 400 skilled nursing facilities and assisted/senior living communities in 29 states nationwide. Genesis subsidiaries also supply rehabilitation and respiratory therapy to approximately 1,500 healthcare providers in 46 states, the District of Columbia and China. References made in this release to "Genesis," "the Company," "we," "us" and "our" refer to Genesis Healthcare, Inc. and each of its wholly-owned companies. Visit our website at www.genesishcc.com.
Forward-Looking Statements
This release includes “forward-looking statements” within the meaning of the federal securities laws, including the Private Securities Litigation Reform Act of 1995. You can identify these statements by the fact that they do not relate strictly to historical or current facts. These statements contain words such as “may,” “will,” “project,” “might,” “expect,” “believe,” “anticipate,” “intend,” “could,” “would,” “estimate,” “continue,” “pursue,” “plans,” or “prospect,” or the negative or other variations thereof or comparable terminology. They include, but are not limited to, statements about Genesis’ expectations and beliefs regarding its future financial performance, anticipated cost management, anticipated business development, anticipated financing activities and anticipated demographic and supply-demand trends facing the industry. These forward-looking statements are based on current expectations and projections about future events, including the assumptions stated in this release, and there can be no assurance that they will be achieved or occur, in whole or in part, in the timeframes anticipated by the Company or at all. Investors are cautioned that forward-looking statements are not guarantees of future performance or results and involve risks and uncertainties that cannot be predicted or quantified and, consequently, the actual performance of Genesis may differ materially from that expressed or implied by such forward-looking statements.
2
These risks and uncertainties include, but are not limited to, the following:
• reductions and/or delays in Medicare or Medicaid reimbursement rates, or changes in the rules governing the Medicare or Medicaid programs could have a material adverse effect on our revenues, financial condition and results of operations;
• reforms to the U.S. healthcare system that have imposed new requirements on us and uncertainties regarding potential material changes to such reforms;
• revenue we receive from Medicare and Medicaid being subject to potential retroactive reduction;
• our success being dependent upon retaining key executives and personnel;
• it can be difficult to attract and retain qualified nurses, therapists, healthcare professionals and other key personnel, which, along with a growing number of minimum wage and compensation related regulations, can increase our costs related to these employees;
• recently enacted changes in Medicare reimbursements for physician and non-physician services could impact reimbursement for medical professionals;
• we are subject to extensive and complex laws and government regulations. If we are not operating in compliance with these laws and regulations or if these laws and regulations change, we could be required to make significant expenditures or change our operations in order to bring our facilities and operations into compliance;
• our physician services operations are subject to corporate practice of medicine laws and regulations. Our failure to comply with these laws and regulations could have a material adverse effect on our business and operations;
• we face inspections, reviews, audits and investigations under federal and state government programs, such as the Department of Justice. These investigations and audits could result in adverse findings that may negatively affect our business, including our results of operations, liquidity, financial condition, and reputation;
• significant legal actions, which are commonplace in our industry, could subject us to increased operating costs, which could materially and adversely affect our results of operations, liquidity, financial condition, and reputation;
• insurance coverages, including professional liability coverage, may become increasingly expensive and difficult to obtain for health care companies, and our self-insurance may expose us to significant losses;
• failure to maintain effective internal control over financial reporting could have an adverse effect on our ability to report on our financial results on a timely and accurate basis;
• we may be unable to reduce costs to offset decreases in our patient census levels or other expenses timely and completely;
• completed and future acquisitions may consume significant resources, may be unsuccessful and could expose us to unforeseen liabilities and integration risks;
• we lease a significant number of our facilities and may experience risks relating to lease termination, lease expense escalators, lease extensions, special charges and leases that are not economically efficient in the current business environment;
• our substantial indebtedness, scheduled maturities and disruptions in the financial markets could affect our ability to obtain financing or to extend or refinance debt as it matures, which could negatively impact our results of operations, liquidity, financial condition and the market price of our common stock;
• exposure to the credit and non-payment risk of our contracted customer relationships, including as a result from bankruptcy, receivership, liquidation, reorganization or insolvency, especially during times of systemic industry pressures, economic conditions, regulatory uncertainty and tight credit markets, which could result in material losses; and
• some of our directors are significant stockholders or representatives of significant stockholders, which may present issues regarding diversion of corporate opportunities and other potential conflicts.
The Company’s Annual Report on Form 10-K for the year ended December 31, 2017, Quarterly Reports on Form 10-Q, Current Reports on Form 8-K, and other filings with the U.S. Securities and Exchange Commission, discuss the foregoing risks as well as other important risks and uncertainties of which investors should be aware. Any forward-looking statements contained herein are made only as of the date of this release. Genesis disclaims any obligation to update its forward-looking statements or any of the information contained in this release. Investors are cautioned not to place undue reliance on these forward-looking statements.
###
3
GENESIS HEALTHCARE, INC.
CONDENSED CONSOLIDATED STATEMENTS OF OPERATIONS
(UNAUDITED)
(IN THOUSANDS, EXCEPT PER SHARE DATA)
|
|
Three months ended September 30, |
|
Nine months ended September 30, |
||||||||
|
|
2018 |
|
2017 |
|
2018 |
|
2017 |
||||
Net revenues |
|
$ |
1,217,271 |
|
$ |
1,315,452 |
|
$ |
3,790,703 |
|
$ |
4,045,860 |
Salaries, wages and benefits |
|
|
680,604 |
|
|
739,404 |
|
|
2,122,128 |
|
|
2,303,300 |
Other operating expenses |
|
|
371,064 |
|
|
400,086 |
|
|
1,125,779 |
|
|
1,162,223 |
General and administrative costs |
|
|
35,482 |
|
|
41,420 |
|
|
114,404 |
|
|
127,657 |
Lease expense |
|
|
32,366 |
|
|
38,670 |
|
|
97,548 |
|
|
113,004 |
Depreciation and amortization expense |
|
|
53,038 |
|
|
59,390 |
|
|
168,036 |
|
|
183,986 |
Interest expense |
|
|
115,695 |
|
|
124,431 |
|
|
348,687 |
|
|
373,473 |
Loss on early extinguishment of debt |
|
|
— |
|
|
— |
|
|
9,785 |
|
|
2,301 |
Investment income |
|
|
(2,178) |
|
|
(1,596) |
|
|
(4,856) |
|
|
(4,097) |
Other (income) loss |
|
|
(20,207) |
|
|
2,379 |
|
|
(42,360) |
|
|
15,602 |
Transaction costs |
|
|
11,361 |
|
|
1,056 |
|
|
26,567 |
|
|
7,862 |
Customer receivership and other related charges |
|
|
— |
|
|
297 |
|
|
— |
|
|
35,864 |
Long-lived asset impairments |
|
|
32,390 |
|
|
163,364 |
|
|
88,008 |
|
|
163,364 |
Goodwill and identifiable intangible asset impairments |
|
|
929 |
|
|
360,046 |
|
|
2,061 |
|
|
360,046 |
Equity in net (income) loss of unconsolidated affiliates |
|
|
(152) |
|
|
(69) |
|
|
106 |
|
|
(291) |
Loss before income tax (benefit) expense |
|
|
(93,121) |
|
|
(613,426) |
|
|
(265,190) |
|
|
(798,434) |
Income tax (benefit) expense |
|
|
(1,220) |
|
|
1,596 |
|
|
(1,759) |
|
|
5,683 |
Loss from continuing operations |
|
|
(91,901) |
|
|
(615,022) |
|
|
(263,431) |
|
|
(804,117) |
Loss from discontinued operations, net of taxes |
|
|
— |
|
|
(2) |
|
|
— |
|
|
(70) |
Net loss |
|
|
(91,901) |
|
|
(615,024) |
|
|
(263,431) |
|
|
(804,187) |
Less net loss attributable to noncontrolling interests |
|
|
33,773 |
|
|
241,200 |
|
|
97,153 |
|
|
314,446 |
Net loss attributable to Genesis Healthcare, Inc. |
|
$ |
(58,128) |
|
$ |
(373,824) |
|
$ |
(166,278) |
|
$ |
(489,741) |
Loss per common share: |
|
|
|
|
|
|
|
|
|
|
|
|
Basic and diluted: |
|
|
|
|
|
|
|
|
|
|
|
|
Weighted-average shares outstanding for loss from continuing operations per share |
|
|
102,489 |
|
|
94,940 |
|
|
100,461 |
|
|
93,376 |
Net loss per common share: |
|
|
|
|
|
|
|
|
|
|
|
|
Loss from continuing operations attributable to Genesis Healthcare, Inc. |
|
$ |
(0.57) |
|
$ |
(3.94) |
|
$ |
(1.66) |
|
$ |
(5.24) |
Loss from discontinued operations, net of taxes |
|
|
— |
|
|
— |
|
|
— |
|
|
— |
Net loss attributable to Genesis Healthcare, Inc. |
|
$ |
(0.57) |
|
$ |
(3.94) |
|
$ |
(1.66) |
|
$ |
(5.24) |
|
|
|
|
|
|
|
|
|
|
|
|
|
4
GENESIS HEALTHCARE, INC.
CONDENSED CONSOLIDATED BALANCE SHEETS
(UNAUDITED)
(IN THOUSANDS)
|
|
September 30, |
|
December 31, |
|
||
|
|
2018 |
|
2017 |
|
||
Assets: |
|
|
|
|
|
|
|
Current assets: |
|
|
|
|
|
|
|
Cash and equivalents |
|
$ |
23,170 |
|
$ |
54,525 |
|
Restricted cash and equivalents |
|
|
48,675 |
|
|
4,113 |
|
Accounts receivable, net of allowances for doubtful accounts |
|
|
642,993 |
|
|
724,138 |
|
Other current assets |
|
|
176,206 |
|
|
157,131 |
|
Total current assets |
|
|
891,044 |
|
|
939,907 |
|
Property and equipment, net of accumulated depreciation |
|
|
2,919,584 |
|
|
3,413,599 |
|
Restricted cash and equivalents |
|
|
56,255 |
|
|
— |
|
Identifiable intangible assets, net of accumulated amortization |
|
|
125,386 |
|
|
142,976 |
|
Goodwill |
|
|
85,642 |
|
|
85,642 |
|
Other long-term assets |
|
|
313,463 |
|
|
205,741 |
|
Total assets |
|
$ |
4,391,374 |
|
$ |
4,787,865 |
|
|
|
|
|
|
|
|
|
Liabilities and Stockholders' Deficit: |
|
|
|
|
|
|
|
Current liabilities: |
|
|
|
|
|
|
|
Accounts payable and accrued expenses |
|
$ |
454,898 |
|
$ |
519,493 |
|
Accrued compensation |
|
|
165,309 |
|
|
167,368 |
|
Other current liabilities |
|
|
302,770 |
|
|
212,333 |
|
Total current liabilities |
|
|
922,977 |
|
|
899,194 |
|
|
|
|
|
|
|
|
|
Long-term debt |
|
|
1,087,948 |
|
|
1,050,337 |
|
Capital lease obligations |
|
|
950,473 |
|
|
1,025,355 |
|
Financing obligations |
|
|
2,727,250 |
|
|
2,929,483 |
|
Other long-term liabilities |
|
|
641,457 |
|
|
563,628 |
|
Stockholders' deficit |
|
|
(1,938,731) |
|
|
(1,680,132) |
|
Total liabilities and stockholders' deficit |
|
$ |
4,391,374 |
|
$ |
4,787,865 |
|
|
|
|
|
|
|
|
|
GENESIS HEALTHCARE, INC.
CONDENSED CONSOLIDATED STATEMENTS OF CASH FLOWS
(UNAUDITED)
(IN THOUSANDS)
|
|
|
Nine months ended September 30, |
||||
|
|
|
2018 |
|
2017 |
||
Net cash provided by operating activities (1) |
|
|
$ |
14,066 |
|
$ |
67,358 |
Net cash (used in) provided by investing activities |
|
|
|
(54,877) |
|
|
53,367 |
Net cash provided by (used in) financing activities |
|
|
|
110,273 |
|
|
(117,575) |
Net increase in cash, cash equivalents and restricted cash and equivalents |
|
|
|
69,462 |
|
|
3,150 |
Beginning of period |
|
|
|
58,638 |
|
|
63,460 |
End of period |
|
|
$ |
128,100 |
|
$ |
66,610 |
(1) - Net cash provided by operating activities in the nine months ended September 30, 2018 and 2017 includes approximately $16.7 million and $7.9 million, respectively, of cash payments for transaction-related costs.
5
GENESIS HEALTHCARE, INC.
KEY PERFORMANCE AND VALUATION MEASURES
(UNAUDITED)
|
|
Three months ended September 30, |
|
|
Nine months ended September 30, |
||||||||
|
|
2018 |
|
2017 |
|
|
2018 |
|
2017 |
||||
Financial Results (in thousands) |
|
|
|
|
|
|
|
|
|
|
|
|
|
Net revenues |
|
$ |
1,217,271 |
|
$ |
1,315,452 |
|
|
$ |
3,790,703 |
|
$ |
4,045,860 |
EBITDA |
|
|
75,612 |
|
|
(429,605) |
|
|
|
251,533 |
|
|
(240,975) |
Adjusted EBITDAR |
|
|
145,886 |
|
|
147,788 |
|
|
|
459,829 |
|
|
488,829 |
Adjusted EBITDA |
|
|
113,520 |
|
|
109,118 |
|
|
|
362,281 |
|
|
375,825 |
Net loss attributable to Genesis Healthcare, Inc. |
|
|
(58,128) |
|
|
(373,824) |
|
|
|
(166,278) |
|
|
(489,741) |
INPATIENT SEGMENT:
|
|
Three months ended September 30, |
|
|
Nine months ended September 30, |
|||||||||
|
|
2018 |
|
2017 |
|
|
2018 |
|
2017 |
|
||||
Occupancy Statistics - Inpatient |
|
|
|
|
|
|
|
|
|
|
|
|
|
|
Available licensed beds in service at end of period |
|
|
51,634 |
|
|
55,005 |
|
|
|
51,634 |
|
|
55,005 |
|
Available operating beds in service at end of period |
|
|
49,553 |
|
|
52,907 |
|
|
|
49,553 |
|
|
52,907 |
|
Available patient days based on licensed beds |
|
|
4,750,328 |
|
|
5,058,848 |
|
|
|
14,096,082 |
|
|
15,018,709 |
|
Available patient days based on operating beds |
|
|
4,555,745 |
|
|
4,872,838 |
|
|
|
13,522,878 |
|
|
14,479,602 |
|
Actual patient days |
|
|
3,838,454 |
|
|
4,123,001 |
|
|
|
11,424,759 |
|
|
12,323,181 |
|
Occupancy percentage - licensed beds |
|
|
80.8 |
% |
|
81.5 |
% |
|
|
81.0 |
% |
|
82.1 |
% |
Occupancy percentage - operating beds |
|
|
84.3 |
% |
|
84.6 |
% |
|
|
84.5 |
% |
|
85.1 |
% |
Skilled mix |
|
|
17.9 |
% |
|
18.7 |
% |
|
|
19.1 |
% |
|
19.7 |
% |
Average daily census |
|
|
41,722 |
|
|
44,815 |
|
|
|
41,849 |
|
|
45,140 |
|
Revenue per patient day (skilled nursing facilities) |
|
|
|
|
|
|
|
|
|
|
|
|
|
|
Medicare Part A |
|
$ |
522 |
|
$ |
524 |
|
|
$ |
525 |
|
$ |
527 |
|
Insurance |
|
|
456 |
|
|
457 |
|
|
|
458 |
|
|
456 |
|
Private and other |
|
|
337 |
|
|
328 |
|
|
|
336 |
|
|
325 |
|
Medicaid |
|
|
223 |
|
|
219 |
|
|
|
223 |
|
|
218 |
|
Medicaid (net of provider taxes) |
|
|
204 |
|
|
199 |
|
|
|
204 |
|
|
199 |
|
Weighted average (net of provider taxes) |
|
$ |
270 |
|
$ |
269 |
|
|
$ |
274 |
|
$ |
272 |
|
Patient days by payor (skilled nursing facilities) |
|
|
|
|
|
|
|
|
|
|
|
|
|
|
Medicare |
|
|
378,968 |
|
|
439,240 |
|
|
|
1,203,234 |
|
|
1,398,286 |
|
Insurance |
|
|
273,200 |
|
|
293,315 |
|
|
|
854,666 |
|
|
917,343 |
|
Total skilled mix days |
|
|
652,168 |
|
|
732,555 |
|
|
|
2,057,900 |
|
|
2,315,629 |
|
Private and other |
|
|
222,890 |
|
|
257,835 |
|
|
|
670,908 |
|
|
779,228 |
|
Medicaid |
|
|
2,758,817 |
|
|
2,924,845 |
|
|
|
8,098,284 |
|
|
8,616,866 |
|
Total Days |
|
|
3,633,875 |
|
|
3,915,235 |
|
|
|
10,827,092 |
|
|
11,711,723 |
|
Patient days as a percentage of total patient days (skilled nursing facilities) |
|
|
|
|
|
|
|
|
|
|
|
|
|
|
Medicare |
|
|
10.4 |
% |
|
11.2 |
% |
|
|
11.1 |
% |
|
11.9 |
% |
Insurance |
|
|
7.5 |
% |
|
7.5 |
% |
|
|
8.0 |
% |
|
7.8 |
% |
Skilled mix |
|
|
17.9 |
% |
|
18.7 |
% |
|
|
19.1 |
% |
|
19.7 |
% |
Private and other |
|
|
6.1 |
% |
|
6.6 |
% |
|
|
6.2 |
% |
|
6.7 |
% |
Medicaid |
|
|
76.0 |
% |
|
74.7 |
% |
|
|
74.7 |
% |
|
73.6 |
% |
Total |
|
|
100.0 |
% |
|
100.0 |
% |
|
|
100.0 |
% |
|
100.0 |
% |
Facilities at end of period |
|
|
|
|
|
|
|
|
|
|
|
|
|
|
Skilled nursing facilities |
|
|
|
|
|
|
|
|
|
|
|
|
|
|
Leased |
|
|
337 |
|
|
362 |
|
|
|
337 |
|
|
362 |
|
Owned |
|
|
44 |
|
|
44 |
|
|
|
44 |
|
|
44 |
|
Joint Venture |
|
|
5 |
|
|
5 |
|
|
|
5 |
|
|
5 |
|
Managed * |
|
|
33 |
|
|
35 |
|
|
|
33 |
|
|
35 |
|
Total skilled nursing facilities |
|
|
419 |
|
|
446 |
|
|
|
419 |
|
|
446 |
|
Total licensed beds |
|
|
51,543 |
|
|
54,935 |
|
|
|
51,543 |
|
|
54,935 |
|
Assisted/Senior living facilities: |
|
|
|
|
|
|
|
|
|
|
|
|
|
|
Leased |
|
|
19 |
|
|
19 |
|
|
|
19 |
|
|
19 |
|
Owned |
|
|
4 |
|
|
4 |
|
|
|
4 |
|
|
4 |
|
Joint Venture |
|
|
1 |
|
|
1 |
|
|
|
1 |
|
|
1 |
|
Managed |
|
|
2 |
|
|
2 |
|
|
|
2 |
|
|
2 |
|
Total assisted/senior living facilities |
|
|
26 |
|
|
26 |
|
|
|
26 |
|
|
26 |
|
Total licensed beds |
|
|
2,209 |
|
|
2,208 |
|
|
|
2,209 |
|
|
2,208 |
|
Total facilities |
|
|
445 |
|
|
472 |
|
|
|
445 |
|
|
472 |
|
|
|
|
|
|
|
|
|
|
|
|
|
|
|
|
Total Jointly Owned and Managed— (Unconsolidated) |
|
|
15 |
|
|
15 |
|
|
|
15 |
|
|
15 |
|
6
REHABILITATION THERAPY SEGMENT**:
|
|
Three months ended September 30, |
|
|
Nine months ended September 30, |
|||||||||
|
|
2018 |
|
2017 |
|
|
2018 |
|
2017 |
|
||||
Revenue mix %: |
|
|
|
|
|
|
|
|
|
|
|
|
|
|
Company-operated |
|
|
37 |
% |
|
37 |
% |
|
|
37 |
% |
|
37 |
% |
Non-affiliated |
|
|
63 |
% |
|
63 |
% |
|
|
63 |
% |
|
63 |
% |
Sites of service (at end of period) |
|
|
1,327 |
|
|
1,525 |
|
|
|
1,327 |
|
|
1,525 |
|
Revenue per site |
|
$ |
152,273 |
|
$ |
152,956 |
|
|
$ |
476,010 |
|
$ |
460,360 |
|
Therapist efficiency % |
|
|
68 |
% |
|
66 |
% |
|
|
68 |
% |
|
68 |
% |
* In 2018 and 2017, includes 20 facilities located in Texas for which the real estate is owned by Genesis.
** Excludes respiratory therapy services.
Reasons for Non-GAAP Financial Disclosure
The following discussion includes references to Adjusted EBITDAR, EBITDA and Adjusted EBITDA, which are non-GAAP financial measures (collectively, Non-GAAP Financial Measures). A Non-GAAP Financial Measure is a numerical measure of a registrant’s historical or future financial performance, financial position and cash flows that excludes amounts, or is subject to adjustments that have the effect of excluding amounts, that are included in the most directly comparable financial measure calculated and presented in accordance with GAAP in the statement of operations, balance sheet or statement of cash flows (or equivalent statements) of the registrant; or includes amounts, or is subject to adjustments that have the effect of including amounts, that are excluded from the most directly comparable financial measure so calculated and presented. In this regard, GAAP refers to generally accepted accounting principles in the United States. We have provided reconciliations of the Non-GAAP Financial Measures to the most directly comparable GAAP financial measures.
We believe the presentation of Non-GAAP Financial Measures provides useful information to investors regarding our results of operations because these financial measures are useful for trending, analyzing and benchmarking the performance and value of our business. By excluding certain expenses and other items that may not be indicative of our core business operating results, these Non-GAAP Financial Measures:
allow investors to evaluate our performance from management’s perspective, resulting in greater transparency with respect to supplemental information used by us in our financial and operational decision making;
facilitate comparisons with prior periods and reflect the principal basis on which management monitors financial performance;
facilitate comparisons with the performance of others in the post-acute industry;
provide better transparency as to the measures used by management and others who follow our industry to estimate the value of our company; and
allow investors to view our financial performance and condition in the same manner as our significant landlords and lenders require us to report financial information to them in connection with determining our compliance with financial covenants.
We use Non-GAAP Financial Measures primarily as performance measures and believe that the GAAP financial measure most directly comparable to them is net income (loss) attributable to Genesis Healthcare, Inc. We use Non-GAAP Financial Measures to assess the value of our business and the performance of our operating businesses, as well as the employees responsible for operating such businesses. Non-GAAP Financial Measures are useful in this regard because they do not include such costs as interest expense, income taxes and depreciation and amortization expense which may vary from business unit to business unit depending upon such factors as the method used to finance the original purchase of the business unit or the tax law in the state in which a business unit operates. By excluding such factors when measuring financial performance, many of which are outside of the control of the employees responsible for operating our business units, we are better able to evaluate value and the operating performance of the business unit
7
and the employees responsible for business unit performance. Consequently, we use these Non-GAAP Financial Measures to determine the extent to which our employees have met performance goals, and therefore the extent to which they may or may not be eligible for incentive compensation awards.
We also use Non-GAAP Financial Measures in our annual budget process. We believe these Non-GAAP Financial Measures facilitate internal comparisons to historical operating performance of prior periods and external comparisons to competitors’ historical operating performance. The presentation of these Non-GAAP Financial Measures is consistent with our past practice and we believe these measures further enable investors and analysts to compare current non-GAAP measures with non-GAAP measures presented in prior periods.
Although we use Non-GAAP Financial Measures as financial measures to assess value and the performance of our business, the use of these Non-GAAP Financial Measures is limited because they do not consider certain material costs necessary to operate the business. These costs include our lease expense (only in the case of Adjusted EBITDAR), the cost to service debt, the depreciation and amortization associated with our long-lived assets, losses on early extinguishment of debt, transaction costs, long-lived asset impairment charges, federal and state income tax expenses, the operating results of our discontinued businesses and the income or loss attributable to noncontrolling interests. Because Non-GAAP Financial Measures do not consider these important elements of our cost structure, a user of our financial information who relies on Non-GAAP Financial Measures as the only measures of our performance could draw an incomplete or misleading conclusion regarding our financial performance. Consequently, a user of our financial information should consider net loss attributable to Genesis Healthcare, Inc. as an important measure of its financial performance because it provides the most complete measure of our performance.
Other companies may define Non-GAAP Financial Measures differently and, as a result, our Non-GAAP Financial Measures may not be directly comparable to those of other companies. Non-GAAP Financial Measures do not represent net income (loss), as defined by GAAP. Non-GAAP Financial Measures should be considered in addition to, not as a substitute for, or superior to, GAAP Financial Measures.
We use the following Non-GAAP Financial Measures that we believe are useful to investors as key valuation and operating performance measures:
EBITDA
We believe EBITDA is useful to an investor in evaluating our operating performance because it helps investors evaluate and compare the results of our operations from period to period by removing the impact of our capital structure (interest expense) and our asset base (depreciation and amortization expense) from our operating results. In addition, financial covenants in our debt agreements use EBITDA as a measure of compliance.
Adjustments to EBITDA
We adjust EBITDA when evaluating our performance because we believe that the exclusion of certain additional items described below provides useful supplemental information to investors regarding our ongoing operating performance, in the case of Adjusted EBITDA. We believe that the presentation of Adjusted EBITDA, when combined with GAAP net loss attributable to Genesis Healthcare, Inc., and EBITDA, is beneficial to an investor’s complete understanding of our operating performance. In addition, such adjustments are substantially similar to the adjustments to EBITDA provided for in the financial covenant calculations contained in our lease and debt agreements.
We adjust EBITDA for the following items:
· |
Loss on early extinguishment of debt. We recognize gains or losses on the early extinguishment of debt when we refinance our debt prior to its original term, requiring us to write-off any unamortized deferred financing fees. We exclude the effect of gains or losses recorded on the early extinguishment of debt because we believe these gains and losses do not accurately reflect the underlying performance of our operating businesses. |
8
· |
Other (income) loss. We primarily use this income statement caption to capture gains and losses on the sale or disposition of assets. We exclude the effect of such gains and losses because we believe they do not accurately reflect the underlying performance of our operating businesses. |
· |
Transaction costs. In connection with our acquisition and disposition transactions, we incur costs consisting of investment banking, legal, transaction-based compensation and other professional service costs. We exclude acquisition and disposition related transaction costs expensed during the period because we believe these costs do not reflect the underlying performance of our operating businesses. |
· |
Customer receivership and other related charges. We excluded the non-cash costs related to $35.6 million of charges recorded in the nine months ended September 30, 2017 related to customer receivership proceedings and the related respective write-down of unpaid accounts receivable. We believe these charges are caused by the challenging operating environment, particularly for highly levered customers of our rehabilitation therapy business. Accordingly, we believe these costs do not accurately reflect the underlying performance of our operating businesses. |
· |
Long-lived asset impairments. We exclude non-cash long-lived asset impairment charges because we believe including them does not reflect the ongoing performance of our operating businesses. Additionally, such impairment charges represent accelerated depreciation expense, and depreciation expense is also excluded from EBITDA. |
· |
Goodwill and identifiable intangible asset impairments. We exclude non-cash goodwill and identifiable intangible asset impairment charges because we believe including them does not reflect the ongoing operating performance of our operating businesses. |
· |
Severance and restructuring. We exclude severance costs from planned reduction in force initiatives associated with restructuring activities intended to adjust our cost structure in response to changes in the business environment. We believe these costs do not reflect the underlying performance of our operating businesses. We do not exclude severance costs that are not associated with such restructuring activities. |
· |
(Income) losses of newly acquired, constructed or divested businesses. The acquisition and construction of new businesses is an element of our growth strategy. Many of the businesses we acquire have a history of operating losses and continue to generate operating losses in the months that follow our acquisition. Newly constructed or developed businesses also generate losses while in their start-up phase. We view these losses as both temporary and an expected component of our long-term investment in the new venture. We adjust these losses when computing Adjusted EBITDA in order to better analyze the performance of our mature ongoing business. The activities of such businesses are adjusted when computing Adjusted EBITDA until such time as a new business generates positive Adjusted EBITDA. The divestiture of underperforming or non-strategic facilities is also an element of our business strategy. We eliminate the results of divested facilities beginning in the quarter in which they become divested. We view the income or losses associated with the wind-down of such divested facilities as not indicative of the performance of our ongoing operating business. |
· |
Stock-based compensation. We exclude stock-based compensation expense because it does not result in an outlay of cash and such non-cash expenses do not reflect the underlying performance of our operating businesses. |
· |
Other Items. From time to time we incur costs or realize gains that we do not believe reflect the underlying performance of our operating businesses. In the current reporting periods, we incurred the following expenses that we believe are non-recurring in nature and do not reflect ongoing operating performance of the Company or our operating businesses. |
(1) |
Regulatory defense and related costs – We exclude the costs of investigating and defending the inherited legal matters associated with prior transactions. We believe these costs are non-recurring in nature as they will no longer be recognized following the final settlement of these matters. Also, we do not believe the excluded costs reflect underlying performance of our operating businesses. |
9
(2) |
Other non-recurring costs - In the three and nine months ended September 30, 2018, we excluded $8.5 million of costs attributable to the write down of receivables in our non-core physician services business and the impairment of unrealized incentives associated with a government program rewarding the meaningful use of technology in delivery of healthcare. This incentive was estimated to be earned and recognized between 2015 and 2016 within our physician services line of business. In the three and nine months ended September 30, 2017, we excluded $3.5 million of costs primarily incurred in connection with the removal of a non-cash actuarially developed discount related to the settlement of workers’ compensation claims for policy years 2012 and prior. We do not believe the excluded costs reflect the underlying performance of our operating businesses. |
See the reconciliation of net loss attributable to Genesis Healthcare, Inc. to EBITDA and Adjusted EBITDA included herein.
Adjusted EBITDAR
We use Adjusted EBITDAR as one measure in determining the value of prospective acquisitions or divestitures. Adjusted EBITDAR is also a commonly used measure to estimate the enterprise value of businesses in the healthcare industry. In addition, financial covenants in our lease agreements use Adjusted EBITDAR as a measure of compliance.
The adjustments made and previously described in the computation of Adjusted EBITDA are also made when computing Adjusted EBITDAR. See the reconciliation of net loss attributable to Genesis Healthcare, Inc. to Adjusted EBITDAR included herein.
10
GENESIS HEALTHCARE, INC.
RECONCILIATION OF NET LOSS ATTRIBUTABLE TO GENESIS HEALTHCARE, INC. TO EBITDA AND ADJUSTED EBITDA
(UNAUDITED)
(IN THOUSANDS)
|
|
Three months ended September 30, |
|
|
Nine months ended September 30, |
||||||||
|
|
2018 |
|
2017 |
|
|
2018 |
|
2017 |
||||
|
|
|
|
|
|
|
|
|
|
|
|
|
|
Net loss attributable to Genesis Healthcare, Inc. |
|
$ |
(58,128) |
|
$ |
(373,824) |
|
|
$ |
(166,278) |
|
$ |
(489,741) |
Adjustments to compute EBITDA: |
|
|
|
|
|
|
|
|
|
|
|
|
|
Loss from discontinued operations, net of taxes |
|
|
— |
|
|
2 |
|
|
|
— |
|
|
70 |
Net loss attributable to noncontrolling interests |
|
|
(33,773) |
|
|
(241,200) |
|
|
|
(97,153) |
|
|
(314,446) |
Depreciation and amortization expense |
|
|
53,038 |
|
|
59,390 |
|
|
|
168,036 |
|
|
183,986 |
Interest expense |
|
|
115,695 |
|
|
124,431 |
|
|
|
348,687 |
|
|
373,473 |
Income tax (benefit) expense |
|
|
(1,220) |
|
|
1,596 |
|
|
|
(1,759) |
|
|
5,683 |
EBITDA |
|
$ |
75,612 |
|
$ |
(429,605) |
|
|
|
251,533 |
|
|
(240,975) |
Adjustments to compute Adjusted EBITDA: |
|
|
|
|
|
|
|
|
|
|
|
|
|
Loss on early extinguishment of debt |
|
|
— |
|
|
— |
|
|
|
9,785 |
|
|
2,301 |
Other (income) loss |
|
|
(20,207) |
|
|
2,379 |
|
|
|
(42,360) |
|
|
15,602 |
Transaction costs |
|
|
11,361 |
|
|
1,056 |
|
|
|
26,567 |
|
|
7,862 |
Customer receivership and other related charges |
|
|
— |
|
|
297 |
|
|
|
— |
|
|
35,864 |
Long-lived asset impairments |
|
|
32,390 |
|
|
163,364 |
|
|
|
88,008 |
|
|
163,364 |
Goodwill and identifiable intangible asset impairments |
|
|
929 |
|
|
360,046 |
|
|
|
2,061 |
|
|
360,046 |
Severance and restructuring |
|
|
1,023 |
|
|
256 |
|
|
|
7,357 |
|
|
4,950 |
Losses of newly acquired, constructed, or divested businesses |
|
|
1,385 |
|
|
5,320 |
|
|
|
3,560 |
|
|
15,589 |
Stock-based compensation |
|
|
2,176 |
|
|
2,440 |
|
|
|
6,732 |
|
|
7,206 |
Regulatory defense related costs (1) |
|
|
463 |
|
|
41 |
|
|
|
603 |
|
|
492 |
Other non-recurring costs (2) |
|
|
8,388 |
|
|
3,524 |
|
|
|
8,435 |
|
|
3,524 |
Adjusted EBITDA |
|
$ |
113,520 |
|
$ |
109,118 |
|
|
$ |
362,281 |
|
$ |
375,825 |
|
|
|
|
|
|
|
|
|
|
|
|
|
|
Additional lease payments not included in GAAP lease expense |
|
$ |
73,614 |
|
$ |
85,396 |
|
|
$ |
226,110 |
|
$ |
258,724 |
Total cash lease payments made pursuant to operating leases, capital leases and financing obligations |
|
|
105,980 |
|
|
124,066 |
|
|
|
323,658 |
|
|
371,728 |
GENESIS HEALTHCARE, INC.
RECONCILIATION OF NET LOSS ATTRIBUTABLE TO GENESIS HEALTHCARE, INC. TO ADJUSTED EBITDAR
(UNAUDITED)
(IN THOUSANDS)
|
|
Three months ended September 30, |
|
|
Nine months ended September 30, |
||||||||
|
|
2018 |
|
2017 |
|
|
2018 |
|
2017 |
||||
|
|
|
|
|
|
|
|
|
|
|
|
|
|
Net loss attributable to Genesis Healthcare, Inc. |
|
$ |
(58,128) |
|
$ |
(373,824) |
|
|
$ |
(166,278) |
|
$ |
(489,741) |
Adjustments to compute Adjusted EBITDAR: |
|
|
|
|
|
|
|
|
|
|
|
|
|
Loss from discontinued operations, net of taxes |
|
|
— |
|
|
2 |
|
|
|
— |
|
|
70 |
Net loss attributable to noncontrolling interests |
|
|
(33,773) |
|
|
(241,200) |
|
|
|
(97,153) |
|
|
(314,446) |
Depreciation and amortization expense |
|
|
53,038 |
|
|
59,390 |
|
|
|
168,036 |
|
|
183,986 |
Interest expense |
|
|
115,695 |
|
|
124,431 |
|
|
|
348,687 |
|
|
373,473 |
Income tax (benefit) expense |
|
|
(1,220) |
|
|
1,596 |
|
|
|
(1,759) |
|
|
5,683 |
Lease expense |
|
|
32,366 |
|
|
38,670 |
|
|
|
97,548 |
|
|
113,004 |
Loss on early extinguishment of debt |
|
|
— |
|
|
— |
|
|
|
9,785 |
|
|
2,301 |
Other (income) loss |
|
|
(20,207) |
|
|
2,379 |
|
|
|
(42,360) |
|
|
15,602 |
Transaction costs |
|
|
11,361 |
|
|
1,056 |
|
|
|
26,567 |
|
|
7,862 |
Customer receivership and other related charges |
|
|
— |
|
|
297 |
|
|
|
— |
|
|
35,864 |
Long-lived asset impairments |
|
|
32,390 |
|
|
163,364 |
|
|
|
88,008 |
|
|
163,364 |
Goodwill and identifiable intangible asset impairments |
|
|
929 |
|
|
360,046 |
|
|
|
2,061 |
|
|
360,046 |
Severance and restructuring |
|
|
1,023 |
|
|
256 |
|
|
|
7,357 |
|
|
4,950 |
Losses of newly acquired, constructed, or divested businesses |
|
|
1,385 |
|
|
5,320 |
|
|
|
3,560 |
|
|
15,589 |
Stock-based compensation |
|
|
2,176 |
|
|
2,440 |
|
|
|
6,732 |
|
|
7,206 |
Regulatory defense related costs (1) |
|
|
463 |
|
|
41 |
|
|
|
603 |
|
|
492 |
Other non-recurring costs (2) |
|
|
8,388 |
|
|
3,524 |
|
|
|
8,435 |
|
|
3,524 |
Adjusted EBITDAR |
|
$ |
145,886 |
|
$ |
147,788 |
|
|
$ |
459,829 |
|
$ |
488,829 |
11
Exhibit 99.2
© 2018 by Genesis Healthcare, Inc. All Rights Reserved. A leading provider of post-acute services November 2018 |
Safe Harbor Statement Certain statements in this presentation regarding the expected benefits of future opportunities for the Company and any other statements regarding the Company’s future expectations, beliefs, goals, strategies or prospects contained in this presentation constitute “forward-looking statements” under Section 27A of the Securities Act of 1933 and Section 21E of the Securities Exchange Act of 1934. Forward-looking statements may be preceded by, followed by or include the words “may,” “will,” “believe,” “expect,” “anticipate,” “intend,” “plan,” “estimate,” “could,” “might,” or “continue” or the negative or other variations thereof or comparable terminology. A number of important factors could cause actual events or results to differ materially from those indicated by such forward-looking statements, including changes in the Company’s reimbursement rates; healthcare reform legislation; the impact of government investigations and legal actions against the Company’s centers and other factors described in the most recent Annual Report on Form 10-K of the Company and elsewhere in the Company’s filings with the Securities and Exchange Commission. You should not place undue reliance on any of these forward- looking statements. Any forward-looking statement speaks only as of the date on which it is made, and the Company undertakes no obligation to update any such statement to reflect new information, or the occurrence of future events or changes in circumstances. References made in this presentation to "Genesis," "the Company," "we," "us" and "our" refer to Genesis Healthcare, Inc. and each of its wholly-owned companies. 2 |
. Genesis Overview .. Financial Review Agenda |
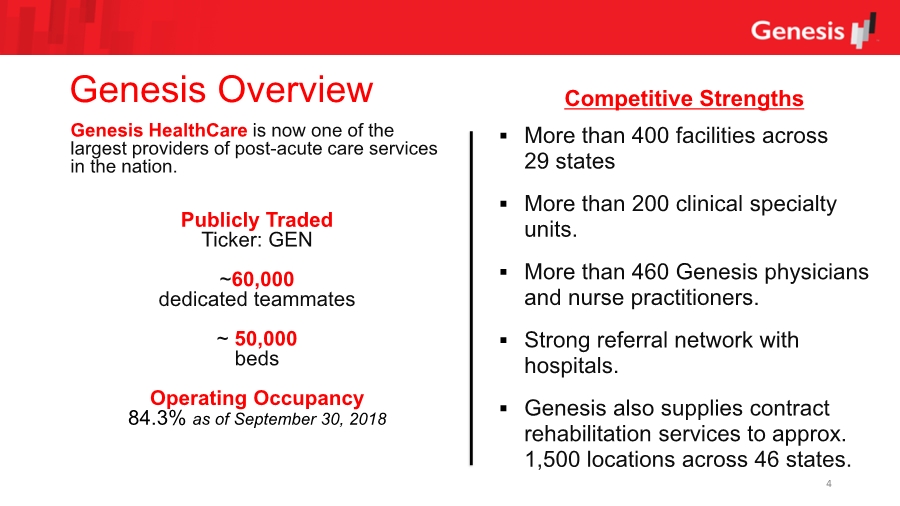
Genesis Overview Genesis HealthCare is now one of the largest providers of post-acute care services in the nation. Publicly Traded Ticker: GEN ~60,000 dedicated teammates ~ 50,000 beds Operating Occupancy 84.3% as of September 30, 2018 Competitive Strengths .. More than 400 facilities across 29 states .. More than 200 clinical specialty units. .. More than 460 Genesis physicians and nurse practitioners. .. Strong referral network with hospitals. .. Genesis also supplies contract rehabilitation services to approx. 1,500 locations across 46 states. 4 |
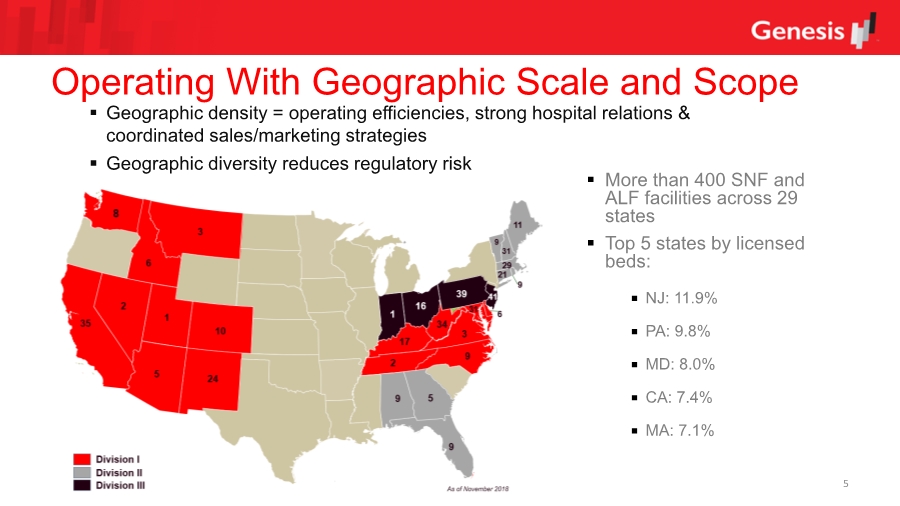
. More than 400 SNF and ALF facilities across 29 states .. Top 5 states by licensed beds: NJ: 11.9% PA: 9.8% MD: 8.0% CA: 7.4% MA: 7.1% 5 Operating With Geographic Scale and Scope .. Geographic density = operating efficiencies, strong hospital relations & coordinated sales/marketing strategies .. Geographic diversity reduces regulatory risk |
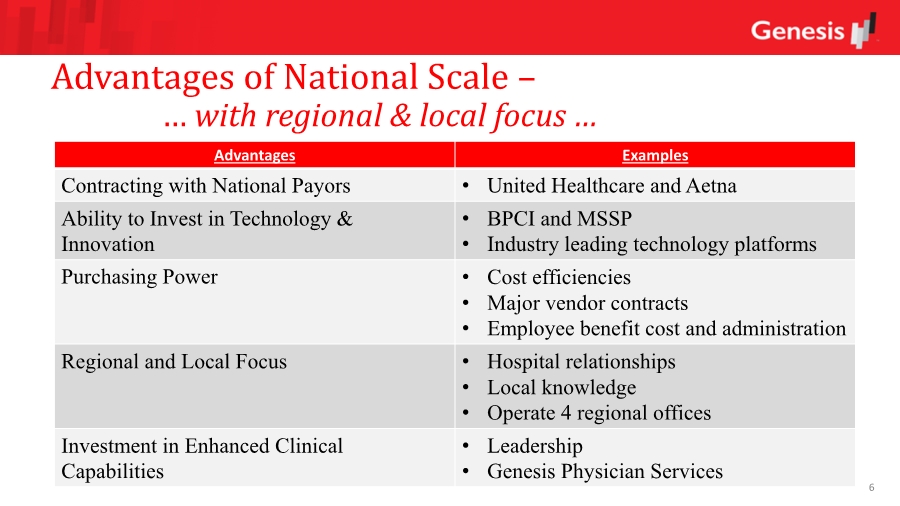
Advantages of National Scale – … with regional & local focus … 6 Advantages Examples Contracting with National Payors • United Healthcare and Aetna Ability to Invest in Technology & Innovation • BPCI and MSSP • Industry leading technology platforms Purchasing Power • Cost efficiencies • Major vendor contracts • Employee benefit cost and administration Regional and Local Focus • Hospital relationships • Local knowledge • Operate 4 regional offices Investment in Enhanced Clinical Capabilities • Leadership • Genesis Physician Services |
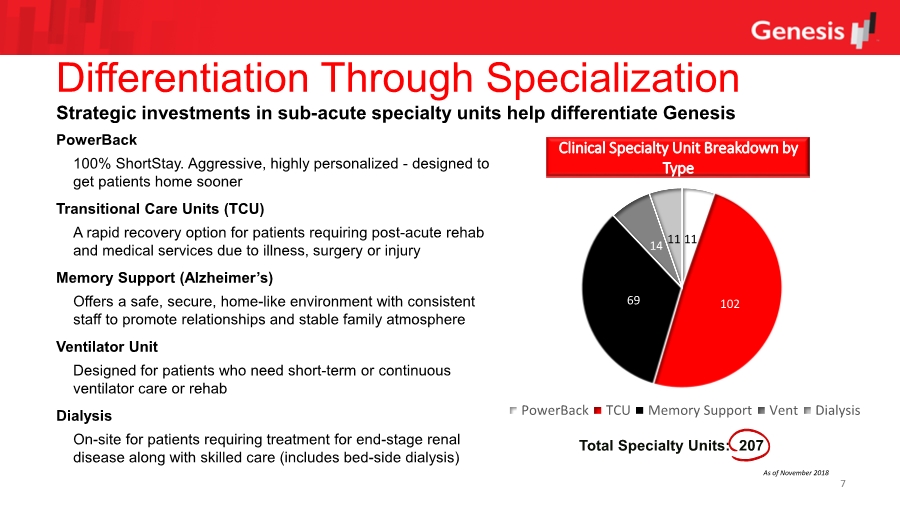
Differentiation Through Specialization 7 PowerBack 100% ShortStay. Aggressive, highly personalized - designed to get patients home sooner Transitional Care Units (TCU) A rapid recovery option for patients requiring post-acute rehab and medical services due to illness, surgery or injury Memory Support (Alzheimer’s) Offers a safe, secure, home-like environment with consistent staff to promote relationships and stable family atmosphere Ventilator Unit Designed for patients who need short-term or continuous ventilator care or rehab Dialysis On-site for patients requiring treatment for end-stage renal disease along with skilled care (includes bed-side dialysis) Clinical Specialty Unit Breakdown by Type Total Specialty Units: 207 Strategic investments in sub-acute specialty units help differentiate Genesis 11 10269 14 11 PowerBack TCU Memory Support Vent Dialysis As of November 2018 |
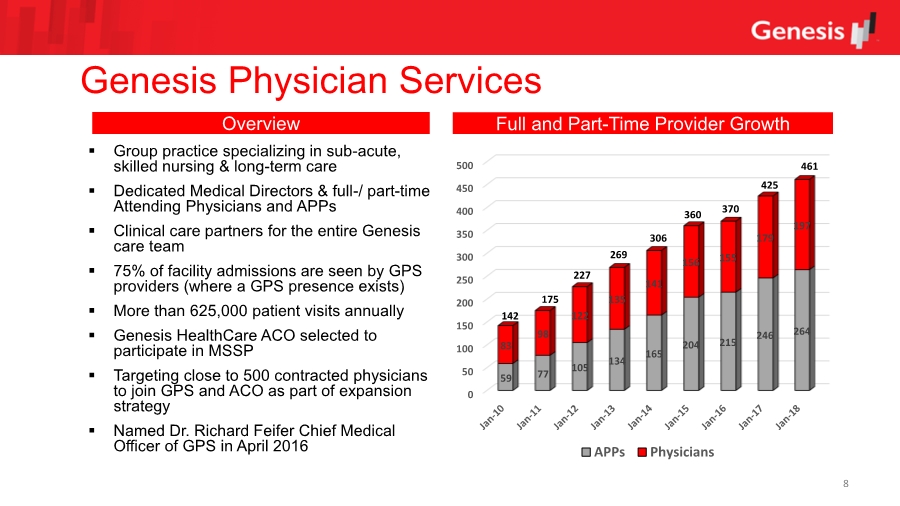
Genesis Physician Services .. Group practice specializing in sub-acute, skilled nursing & long-term care .. Dedicated Medical Directors & full-/ part-time Attending Physicians and APPs .. Clinical care partners for the entire Genesis care team .. 75% of facility admissions are seen by GPS providers (where a GPS presence exists) .. More than 625,000 patient visits annually .. Genesis HealthCare ACO selected to participate in MSSP .. Targeting close to 500 contracted physicians to join GPS and ACO as part of expansion strategy .. Named Dr. Richard Feifer Chief Medical Officer of GPS in April 2016 8 Overview Full and Part-Time Provider Growth 0 50 100 150 200 250 300 350 400 450 500 59 77 105 134 165 204 215 246 264 83 98 122 135 141 156 155 179 197 APPs Physicians 142 175 227 269 306 360 370 425 461 |
. Genesis Overview .. Financial Review Agenda |
10 Improving Trends • Adjusted EBITDAR less cash rents produced growth in each of the last two quarters. • Genesis reports organic Adjusted EBITDAR growth for the first time since 2015. • Occupancy continues to show improvement in 2018. |
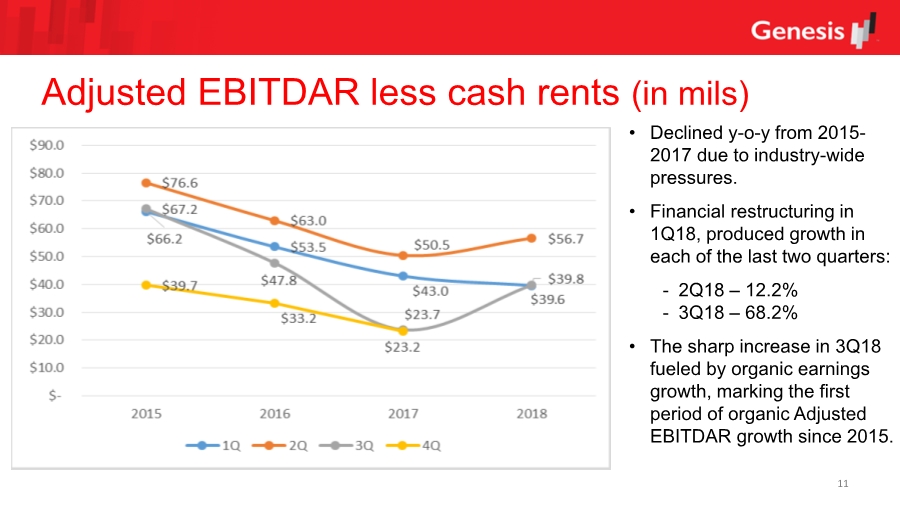
11 Adjusted EBITDAR less cash rents (in mils) • Declined y-o-y from 2015- 2017 due to industry-wide pressures. • Financial restructuring in 1Q18, produced growth in each of the last two quarters: - 2Q18 – 12.2% - 3Q18 – 68.2% • The sharp increase in 3Q18 fueled by organic earnings growth, marking the first period of organic Adjusted EBITDAR growth since 2015. |
12 Adjusted EBITDAR - Organic Trends – 2016 to 2018 • 3Q18 Organic Adjusted EBITDAR growth led by: • Aggressive cost management • Improved productivity • A series of permanent cost reductions implemented in July 2018 • Total annual cost reductions of $50 million to be fully realized by end 2Q19 • ~$4 million of the cost reductions realized in 3Q18 • Organic business performance improved w/ more stable occupancy trends • Genesis reports 2Q18 to 3Q18 sequential occupancy growth for the first time in many years (20 bps) • Occupancy has continued to show strength into 4Q18 |
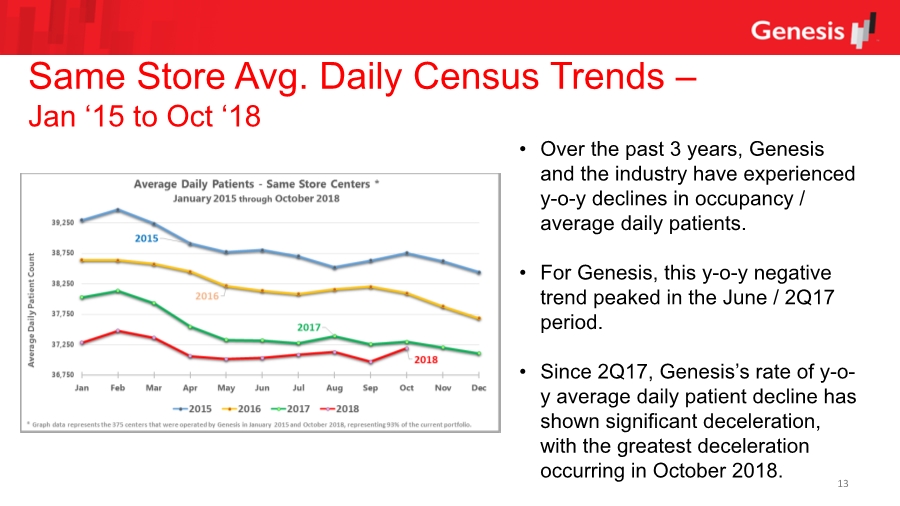
13 Same Store Avg. Daily Census Trends – Jan ‘15 to Oct ‘18 • Over the past 3 years, Genesis and the industry have experienced y-o-y declines in occupancy / average daily patients. • For Genesis, this y-o-y negative trend peaked in the June / 2Q17 period. • Since 2Q17, Genesis’s rate of y-o- y average daily patient decline has shown significant deceleration, with the greatest deceleration occurring in October 2018. |
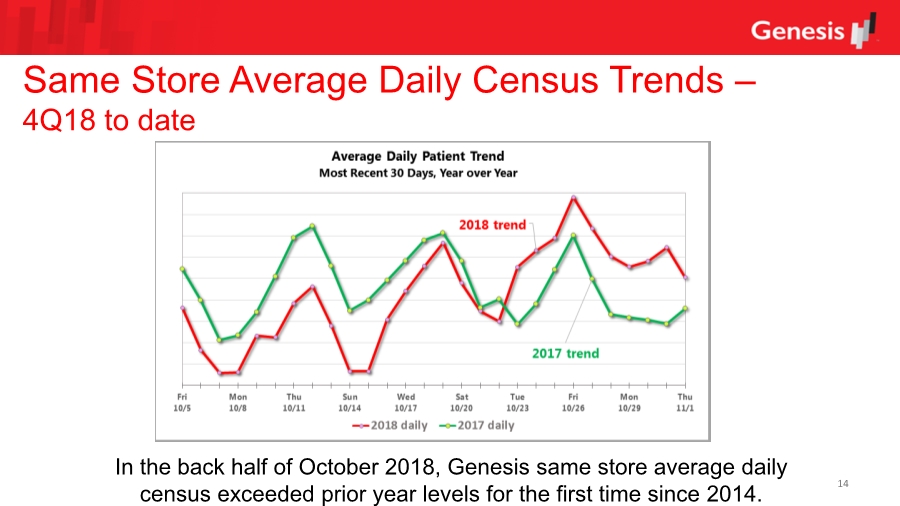
14 Same Store Average Daily Census Trends – 4Q18 to date In the back half of October 2018, Genesis same store average daily census exceeded prior year levels for the first time since 2014. |
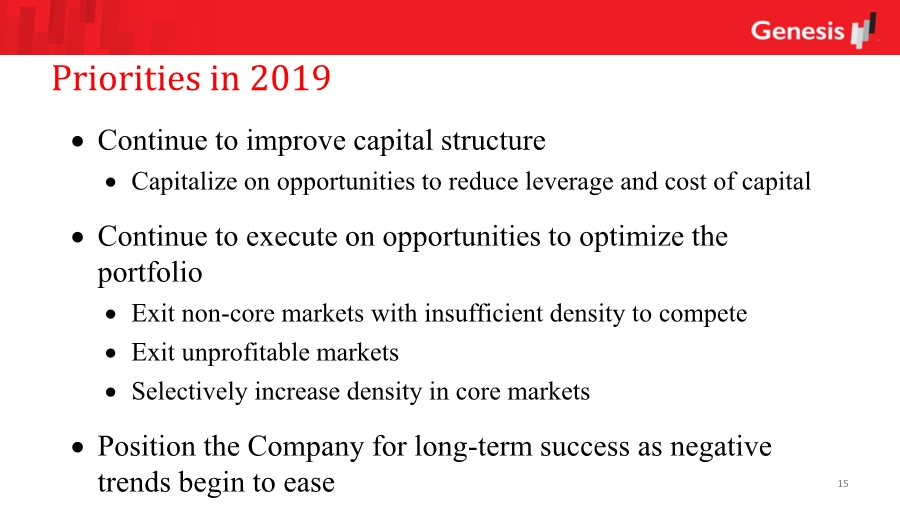
Priorities in 2019 15 Continue to improve capital structure Capitalize on opportunities to reduce leverage and cost of capital Continue to execute on opportunities to optimize the portfolio Exit non-core markets with insufficient density to compete Exit unprofitable markets Selectively increase density in core markets Position the Company for long-term success as negative trends begin to ease |
Appendix |
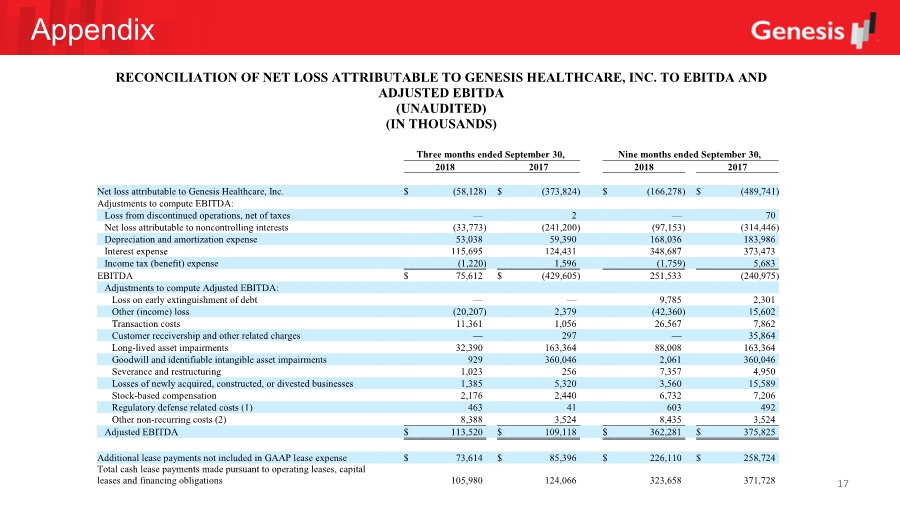
17 Appendix RECONCILIATION OF NET LOSS ATTRIBUTABLE TO GENESIS HEALTHCARE, INC. TO EBITDA AND ADJUSTED EBITDA (UNAUDITED) (IN THOUSANDS) Three months ended September 30, Nine months ended September 30, 2018 2017 2018 2017 Net loss attributable to Genesis Healthcare, Inc. $ (58,128) $ (373,824) $ (166,278) $ (489,741) Adjustments to compute EBITDA: Loss from discontinued operations, net of taxes — 2 — 70 Net loss attributable to noncontrolling interests (33,773) (241,200) (97,153) (314,446) Depreciation and amortization expense 53,038 59,390 168,036 183,986 Interest expense 115,695 124,431 348,687 373,473 Income tax (benefit) expense (1,220) 1,596 (1,759) 5,683 EBITDA $ 75,612 $ (429,605) 251,533 (240,975) Adjustments to compute Adjusted EBITDA: Loss on early extinguishment of debt — — 9,785 2,301 Other (income) loss (20,207) 2,379 (42,360) 15,602 Transaction costs 11,361 1,056 26,567 7,862 Customer receivership and other related charges — 297 — 35,864 Long-lived asset impairments 32,390 163,364 88,008 163,364 Goodwill and identifiable intangible asset impairments 929 360,046 2,061 360,046 Severance and restructuring 1,023 256 7,357 4,950 Losses of newly acquired, constructed, or divested businesses 1,385 5,320 3,560 15,589 Stock-based compensation 2,176 2,440 6,732 7,206 Regulatory defense related costs (1) 463 41 603 492 Other non-recurring costs (2) 8,388 3,524 8,435 3,524 Adjusted EBITDA $ 113,520 $ 109,118 $ 362,281 $ 375,825 Additional lease payments not included in GAAP lease expense $ 73,614 $ 85,396 $ 226,110 $ 258,724 Total cash lease payments made pursuant to operating leases, capital leases and financing obligations 105,980 124,066 323,658 371,728 |
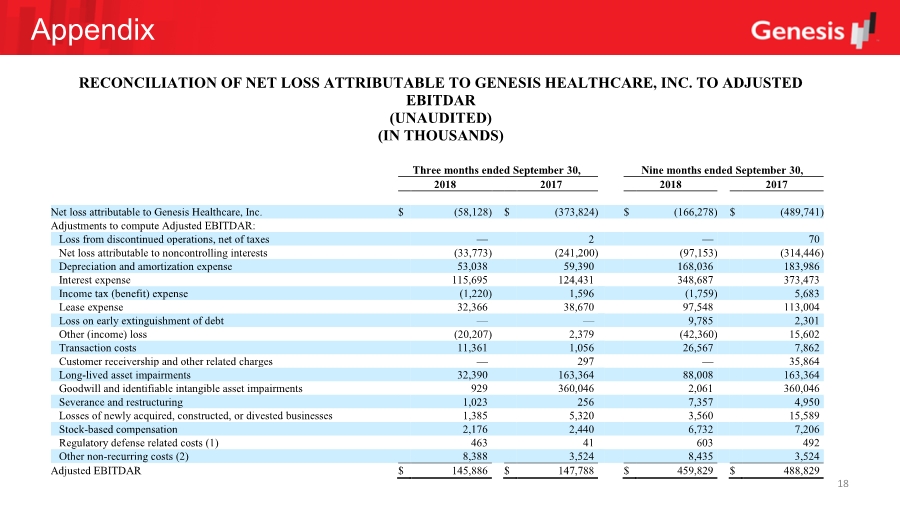
Appendix 18 RECONCILIATION OF NET LOSS ATTRIBUTABLE TO GENESIS HEALTHCARE, INC. TO ADJUSTED EBITDAR (UNAUDITED) (IN THOUSANDS) Three months ended September 30, Nine months ended September 30, 2018 2017 2018 2017 Net loss attributable to Genesis Healthcare, Inc. $ (58,128) $ (373,824) $ (166,278) $ (489,741) Adjustments to compute Adjusted EBITDAR: Loss from discontinued operations, net of taxes — 2 — 70 Net loss attributable to noncontrolling interests (33,773) (241,200) (97,153) (314,446) Depreciation and amortization expense 53,038 59,390 168,036 183,986 Interest expense 115,695 124,431 348,687 373,473 Income tax (benefit) expense (1,220) 1,596 (1,759) 5,683 Lease expense 32,366 38,670 97,548 113,004 Loss on early extinguishment of debt — — 9,785 2,301 Other (income) loss (20,207) 2,379 (42,360) 15,602 Transaction costs 11,361 1,056 26,567 7,862 Customer receivership and other related charges — 297 — 35,864 Long-lived asset impairments 32,390 163,364 88,008 163,364 Goodwill and identifiable intangible asset impairments 929 360,046 2,061 360,046 Severance and restructuring 1,023 256 7,357 4,950 Losses of newly acquired, constructed, or divested businesses 1,385 5,320 3,560 15,589 Stock-based compensation 2,176 2,440 6,732 7,206 Regulatory defense related costs (1) 463 41 603 492 Other non-recurring costs (2) 8,388 3,524 8,435 3,524 Adjusted EBITDAR $ 145,886 $ 147,788 $ 459,829 $ 488,829 |
Appendix 19 We use the following Non-GAAP Financial Measures that we believe are useful to investors as key valuation and operating performance measures: EBITDA We believe EBITDA is useful to an investor in evaluating our operating performance because it helps investors evaluate and compare the results of our operations from period to period by removing the impact of our capital structure (interest expense) and our asset base (depreciation and amortization expense) from our operating results. In addition, financial covenants in our debt agreements use EBITDA as a measure of compliance. Adjustments to EBITDA We adjust EBITDA when evaluating our performance because we believe that the exclusion of certain additional items described below provides useful supplemental information to investors regarding our ongoing operating performance, in the case of Adjusted EBITDA. We believe that the presentation of Adjusted EBITDA, when combined with GAAP net loss attributable to Genesis Healthcare, Inc., and EBITDA, is beneficial to an investor’s complete understanding of our operating performance. In addition, such adjustments are substantially similar to the adjustments to EBITDA provided for in the financial covenant calculations contained in our lease and debt agreements. We adjust EBITDA for the following items: • Loss on early extinguishment of debt. We recognize gains or losses on the early extinguishment of debt when we refinance our debt prior to its original term, requiring us to write-off any unamortized deferred financing fees. We exclude the effect of gains or losses recorded on the early extinguishment of debt because we believe these gains and losses do not accurately reflect the underlying performance of our operating businesses. • Other (income) loss. We primarily use this income statement caption to capture gains and losses on the sale or disposition of assets. We exclude the effect of such gains and losses because we believe they do not accurately reflect the underlying performance of our operating businesses. • Transaction costs. In connection with our acquisition and disposition transactions, we incur costs consisting of investment banking, legal, transaction-based compensation and other professional service costs. We exclude acquisition and disposition related transaction costs expensed during the period because we believe these costs do not reflect the underlying performance of our operating businesses. • Customer receivership and other related charges. We excluded the non-cash costs related to $35.6 million of charges recorded in the nine months ended September 30, 2017 related to customer receivership proceedings and the related respective write-down of unpaid accounts receivable. We believe these charges are caused by the challenging operating environment, particularly for highly levered customers of our rehabilitation therapy business. Accordingly, we believe these costs do not accurately reflect the underlying performance of our operating businesses. • Long-lived asset impairments. We exclude non-cash long-lived asset impairment charges because we believe including them does not reflect the ongoing performance of our operating businesses. Additionally, such impairment charges represent accelerated depreciation expense, and depreciation expense is also excluded from EBITDA. • Goodwill and identifiable intangible asset impairments. We exclude non-cash goodwill and identifiable intangible asset impairment charges because we believe including them does not reflect the ongoing operating performance of our operating businesses. |
Appendix 20 • Severance and restructuring. We exclude severance costs from planned reduction in force initiatives associated with restructuring activities intended to adjust our cost structure in response to changes in the business environment. We believe these costs do not reflect the underlying performance of our operating businesses. We do not exclude severance costs that are not associated with such restructuring activities. •(Income) losses of newly acquired, constructed or divested businesses. The acquisition and construction of new businesses is an element of our growth strategy. Many of the businesses we acquire have a history of operating losses and continue to generate operating losses in the months that follow our acquisition. Newly constructed or developed businesses also generate losses while in their start-up phase. We view these losses as both temporary and an expected component of our long-term investment in the new venture. We adjust these losses when computing Adjusted EBITDA in order to better analyze the performance of our mature ongoing business. The activities of such businesses are adjusted when computing Adjusted EBITDA until such time as a new business generates positive Adjusted EBITDA. The divestiture of underperforming or non-strategic facilities is also an element of our business strategy. We eliminate the results of divested facilities beginning in the quarter in which they become divested. We view the income or losses associated with the wind-down of such divested facilities as not indicative of the performance of our ongoing operating business. • Stock-based compensation. We exclude stock-based compensation expense because it does not result in an outlay of cash and such non-cash expenses do not reflect the underlying performance of our operating businesses. • Other Items. From time to time we incur costs or realize gains that we do not believe reflect the underlying performance of our operating businesses. In the current reporting periods, we incurred the following expenses that we believe are non-recurring in nature and do not reflect ongoing operating performance of the Company or our operating businesses. (1) Regulatory defense and related costs – We exclude the costs of investigating and defending the inherited legal matters associated with prior transactions. We believe these costs are non-recurring in nature as they will no longer be recognized following the final settlement of these matters. Also, we do not believe the excluded costs reflect underlying performance of our operating businesses. (2) Other non-recurring costs - In the three and nine months ended September 30, 2018, we excluded $8.5 million of costs attributable to the write down of receivables in our non-core physician services business and the impairment of unrealized incentives associated with a government program rewarding the meaningful use of technology in delivery of healthcare. This incentive was estimated to be earned and recognized between 2015 and 2016 within our physician services line of business. In the three and nine months ended September 30, 2017, we excluded $3.5 million of costs primarily incurred in connection with the removal of a non-cash actuarially developed discount related to the settlement of workers’ compensation claims for policy years 2012 and prior. We do not believe the excluded costs reflect the underlying performance of our operating businesses. See the reconciliation of net loss attributable to Genesis Healthcare, Inc. to EBITDA and Adjusted EBITDA included herein. Adjusted EBITDAR We use Adjusted EBITDAR as one measure in determining the value of prospective acquisitions or divestitures. Adjusted EBITDAR is also a commonly used measure to estimate the enterprise value of businesses in the healthcare industry. In addition, financial covenants in our lease agreements use Adjusted EBITDAR as a measure of compliance. The adjustments made and previously described in the computation of Adjusted EBITDA are also made when computing Adjusted EBITDAR. See the reconciliation of net loss attributable to Genesis Healthcare, Inc. to Adjusted EBITDAR included herein. |
+=!LXYSI_A:\FDR!
M#!9ZLZF\\\\8B,D3+))A>69-K%=K*FU
MU.-HVC@'>6IZ-K_AJ*\0:99'4+NW3#C8&6-\M]]&16W+L3( ."JD_*, _P!0
M>#O^B>R__P GY?W_)!_Q.;]*3_H]G&G_A3@_P#YC/?/#W[4VNVS0VOCS2O#
M]I?2)YDB:-;ZE;I&!G<-E[JE^Q.<*#OVY#?,>E>P^$?C78^,=1^RZ9=:6(O.
M$6UX;@S.=FY@C_;A&65L*?W9 .XA7'PVC^$\7AWQ/+>R6^C+(@NI&,J,"-O,A*A
M,L5(*X9BHP& 8T?Z@\'?]$]E_P#X!/R_O^2#_B
:C=&YN]#9W/EK;AP;@;5>5PYP'@0$G )QNVU^$
M.@+9^(/'?A[PQ'$;9K[4K73KB\D4KY,5RZQW-PPXW*B NPX+;2JXW"OZ M,_
M9K\+_"/X6V/B'PUK<5UJ-Q:)?/9SWJ,+N?RD 9"J1M!(KDR1Q' Q&JH2OS4
M>Y_&?XJ>'?VLOB5X6^%EMXIL?!^JZW:W,EY=F.%Y$M(UB%RL-L\EL\MQ=221
M^7'+(D:1+-*[,0JG[O\ V0/^"?7[.WP'UC3?'JZNWCKXL>%+^[OK36I[P0&Q
MFU2TO--MT;2(IV@)2VNYXHMW"/&9U.^$2C^;#QM\%?&WC?XA66L6-[_9EPD\
M;W6M0W,T
"M>\3Z7/9:79:K9>'-,TZ
M.>]U'Q3J%K!JR"R9&FBMM-M7O;>W/E0#[1<7=U(UO#$I:50%9J]B^'?[0UAJ
M&MV.D:=\1/!WQ%T34;Y-/.H^%;[P;J\=O>3,4C6\G\(ZMJ4=E*T@$
"9%V.H*MT9@./@?P%K^G?%CPNVKV'AR^-[!;S7RV-Q-#*F
MBW<%W
/7W6O%OBA\:M.2)=.\-SBZG^;S;
ME1?ME26/B_P[;> +6XC@U6]T?6O$/A^
MY#A##K'AVZT=H5SU DM;Z[BE/.V)R3D"OY[/B5J3W4UTNLPO_;NGF:#4+5^)
M'GMF\KS/+.'=%\IGR. I5B<"OU9_:3\6:MHFC>&/BK//-<6_@S5[Q-<1,L3I
M'B6RCL)?EYQ%%*L
<@7+G$"O"=YY+Q[X1\.WUW ][96LU^=Z$N@+J
MH!7'7?P. -HXY'/3[RE<+9"*!K2XL8H52 6X15\A4VHJJORM&%P %XQCKTK\
MP?VDM6UCX=^/-/UYIY)/#VK%(5AV;8;68_?4L,;-W&TX&<,#UR0#"\!:@?[7
MU/0H"^GWFE2RPQ)MVB6W#?(R+CY@5Y+*#WW''%>F6\/C'P[>MK DB\3P7RE?
MLNHV[*;.,[LI'(H,2@KG)
\@: