
UNITED STATES
SECURITIES AND EXCHANGE COMMISSION
Washington, D.C. 20549
FORM
CERTIFIED SHAREHOLDER REPORT OF REGISTERED
MANAGEMENT INVESTMENT COMPANIES
Investment Company Act file number: 811-21846
(exact name of Registrant as specified in charter)
1700
Broadway, Suite 1850
Denver, Colorado 80290
(Address of principal executive offices) (Zip code)
Chris Moore, Secretary
Clough Global Opportunities Fund
1700 Broadway, Suite 1850
Denver, Colorado 80290
(Name and address of agent for service)
Registrant’s telephone number, including area code: 855-425-6844
Date of fiscal year end: October 31
Date of reporting period: November 1, 2023 –
Item 1. Reports to Stockholders.
(a)
CLOUGH GLOBAL DIVIDEND AND INCOME FUND
CLOUGH GLOBAL EQUITY FUND
CLOUGH GLOBAL OPPORTUNITIES FUND
Semi-Annual Report
April 30, 2024
Clough Global Funds
SECTION 19(B) DISCLOSURE
April 30, 2024 (Unaudited)
Clough Global Dividend and Income Fund, Clough Global Equity Fund, and Clough Global Opportunities Fund (each a “Fund” and collectively, the “Funds”), acting pursuant to a Securities and Exchange Commission (“SEC”) exemptive order and with the approval of each Fund’s Board of Trustees (the “Board”), have adopted a plan, consistent with each Fund’s investment objectives and policies to support a level distribution of income, capital gains and/or return of capital (the “Plan”). In accordance with the Plan, the Funds’ managed distribution policy sets the monthly distribution rate at an amount equal to one twelfth of 10% of each Fund’s adjusted year-ending net asset value (“NAV”), which is the average of the NAVs as of the last five business days of the prior calendar year.
Under the Plan, each Fund will distribute all available investment income to its shareholders, consistent with each Fund’s primary investment objectives and as required by the Internal Revenue Code of 1986, as amended (the “Code”). If sufficient investment income is not available on a monthly basis, each Fund will distribute long-term capital gains and/or return of capital to shareholders in order to maintain a level distribution.
Each monthly distribution to shareholders is expected to be at the fixed amount established by the Board, except for extraordinary distributions and potential distribution rate increases to enable each Fund to comply with the distribution requirements imposed by the Code.
Shareholders should not draw any conclusions about each Fund’s investment performance from the amount of these distributions or from the terms of the Plan. Each Fund’s total return performance on net asset value is presented in its financial highlights table.
Each Board may amend, suspend or terminate each Fund’s Plan without prior notice. The suspension or termination of the Plan could have the effect of creating a trading discount (if a Fund’s stock is trading at or above net asset value) or widening an existing trading discount. Each Fund is subject to risks that could have an adverse impact on its ability to maintain level distributions. Examples of potential risks include, but are not limited to, economic downturns impacting the markets, increased market volatility, companies suspending or decreasing corporate dividend distributions and changes in the Code. Please refer to the Notes to Financial Statements in the Annual Report to Shareholders for a more complete description of its risks.
Please refer to Additional Information for a cumulative summary of the Section 19(a) notices for each Fund’s current fiscal period. Section 19(a) notices for each Fund, as applicable, are available on the Clough Global Closed-End Funds website www.cloughcefs.com.
2
TABLE OF CONTENTS
Clough Global Funds
SHAREHOLDER LETTER
April 30, 2024 (Unaudited)
To Our Investors:
Clough Global Dividend and Income Fund
For the semi-annual period ending April 30, 2024, the Clough Global Dividend and Income Fund (“GLV”) gained +17.3% on net asset value (“NAV”) and +16.5% on market price. GLV’s benchmark, the Morningstar Global Allocation Total Return Index, gained +13.9% over the same period.
Equity investments were the primary contributor to performance, driven by holdings in the information technology, industrials, and healthcare sectors. The Fund’s fixed income positions also generated positive gains.
Among the GLV’s top five performers for the semi-annual period, SK Hynix Inc, a South Korean semiconductor company, gained due to elevated demand for its high bandwidth memory (“HBM”) chips used in artificial intelligence (“AI”). Bank of America Corp estimated sales of HBM will more than triple from $4b in 2023 to $15b in 2025 and SK Hynix has the number one position in that market. Lam Research Corp, a semiconductor company, increased in part due to improving visibility in its backlog. The company is an AI beneficiary and should benefit from an improving memory cycle. Airbus SE, the European aerospace company, rose on expectations for further market share gains as Boeing Co continued to struggle with quality and manufacturing issues. Microsoft Corp, the large software company, reported earnings results that exceeded analysts’ expectations. Its Azure segment also benefited from an AI spending tailwind. Ferguson PLC, an industrial distributor with exposure to housing and infrastructure, rounded out the contributors.
Among the GLV’s bottom five performers for the semi-annual period, a short in a European bank detracted from performance as financial equities rallied during the period. A short in a retailer chain detracted from performance as the company exceeded Wall Street same store sales expectations. A short position in a large manufacturer of motorcycles detracted from performance. The company provided guidance below 2024 estimates, but we believe the stock gained in part due to a new product launch for which we think expectations are too optimistic. A short position in an IT services company detracted from performance. We believe the market is ascribing too much valuation to a potential AI business opportunity and added to the short during the period. Finally, a short position in an auto retailer rounded out the detractors.
Clough Global Equity Fund
For the semi-annual period ending April 30, 2024, the Clough Global Equity Fund (“GLQ”) gained +24.9% on NAV and +26.7% on market price. GLQ’s benchmark, the MSCI World Index, the Bloomberg Developed Markets Large & Mid Cap Total Return Index, gained +20.6% and the MSCI World Index, gained +20.6% over the same period.
Equity holdings in the information technology, industrials, healthcare, and consumer discretionary sectors were the primary driver of performance.
Among GLQ’s top five performers for the semi-annual period, NVIDIA Corp, the large semiconductor company focused on AI, gained when the company’s quarterly results and annual guidance exceeded high Wall Street expectations. Alphabet Inc, the parent company of Google, reported Q1 2024 earnings results that exceeded Wall Street expectations on better-than-expected search and cloud results, and the company also announced an incremental $70 billion share repurchase. Lam Research Corp, a semiconductor company, increased in part due to improving visibility in its backlog. The company is an AI beneficiary and should benefit from an improving memory cycle. Amazon.com Inc, the large online retailer and cloud computing platform, reported quarterly results that exceeded estimates. Growth of the company’s cloud offering, Amazon Web Services (AWS), reaccelerated in part due to AI demand. TransDigm Group Inc, an aerospace manufacturing company, gained as the company’s results exceeded Wall Street estimates on higher-than-expected margins and increased guidance.
Among GLQ’s bottom five performers for the semi-annual period, a short in a European bank detracted from performance as financial equities rallied during the period. Transocean Ltd, the offshore drilling company, reported quarterly results and beat estimates on earnings before interest, tax, depreciation and amortization (“EBITDA”) due to cost management, but the company’s outlook trailed Wall Street estimates. A short in a retailer chain detracted from performance as the company exceeded Wall Street same store sales expectations. Argenx SE, a European biotechnology company, declined after one of its clinical trials generated data below expectations. We reduced the position during the period. A short position in a large manufacturer of motorcycles detracted from performance. The company provided guidance below 2024 estimates, but we believe the stock gained in part due to a new product launch for which we think expectations are too optimistic.
Clough Global Opportunities Fund
For the semi-annual period ending April 30, 2024, the Clough Global Opportunities Fund (“GLO”) gained +22.2% on NAV and +23.0% on market price. GLO’s benchmark, the Morningstar Global Allocation Total Return Index, gained +13.9% over the same period.
Equity investments were the primary contributor to performance, driven by holdings in the information technology, industrials, healthcare, and consumer discretionary sectors. The Fund’s fixed income positions also generated positive gains.
Among GLO’s top five performers for the semi-annual period, Alphabet Inc, the parent company of Google, reported Q1 2024 earnings results that exceeded Wall Street expectations on better-than-expected search and cloud results, and the company also announced an incremental $70 billion share repurchase. NVIDIA Corp, the large semiconductor company focused on AI, gained when the company’s quarterly results and annual guidance exceeded high Wall Street expectations. Lam Research Corp, a semiconductor company, increased in part due to improving visibility in its backlog. The company is an AI beneficiary and should benefit from an improving memory cycle. TransDigm Group Inc, an aerospace manufacturing company, gained as the company’s results exceeded Wall Street estimates on higher-than-expected margins and increased guidance. Amazon.com Inc, the large online retailer and cloud computing platform, reported quarterly results that exceeded estimates. Growth of the company’s cloud offering, Amazon Web Services (AWS), reaccelerated in part due to AI demand.
Among GLO’s bottom five performers for the semi-annual period, a short in a European bank detracted from performance as financial equities rallied during the period. Transocean Ltd, the offshore drilling company, reported quarterly results and beat estimates on EBITDA due to cost management, but the company’s outlook trailed Wall Street estimates. A short in a retailer chain detracted from performance as the company exceeded Wall Street same store sales expectations. Argenx SE, a European biotechnology company, declined after one of its clinical trials generated data below expectations. We reduced the position during the
4
Clough Global Funds
SHAREHOLDER LETTER
April 30, 2024 (Continued) (Unaudited)
period. A short position in a large manufacturer of motorcycles detracted from performance. The company provided guidance below 2024 estimates, but we believe the stock gained in part due to a new product launch for which we think expectations are too optimistic.
MARKET COMMENTARY
To our view, two important economic trends will likely create a positive backdrop for equities:
1. Disinflation is likely to continue in the quarters ahead
2. Productivity should drive profits higher
So, we think trying to pick the month the U.S. Federal Reserve (the “Fed”) will first reduce interest rates is a pointless and frustrating exercise.
Equities did well in 2023 and into early 2024 in the face of a 525-basis point rise in interest rates and a $1.6 trillion reduction in assets held by the U.S. Federal Reserve (the “Fed”) on its balance sheet since 2022. Quality spreads have also narrowed, suggesting that both financial conditions and profits are good. If the Fed is that tight, where is the liquidity so vital to healthy financial markets coming from? There might be some residual quantitative easing left, but we think a more important factor is that the private economy is throwing off cash. That substantially reduces financial market dependence on the Fed.
We think inflation is likely to burn itself out. Much of the index price gains of recent months appear to be residual effects of COVID-related supply side issues. But capital is widely available, manufacturing is booming everywhere, and we think many remaining shortages will turn to gluts in time. Barron’s recently reported on a surge in chemical plant construction that will “create a serious glut that could last years”. The periodical noted that even though polyethylene capacity utilization is falling, large new plants are being built in North America, China and the Middle East. Import prices from China are falling and since the dollar has remained stable, disinflation in the rest of the world should help send the price index for manufactured goods down. The rally in commodities is narrow, based largely on supply restrictions for crude oil and copper, and geopolitical issues for gold as central banks attempt to neuter the dollar. And the sharp rise in insurance rates which drove the March Consumer Price Index (“CPI”) report is likely a one-shot effort to catch up with higher auto-related costs while used car prices are declining and automobile manufacturers are ramping up production and discounting more heavily. Leading indicators of apartment rental pricing suggest a downturn in a category that makes up a very large portion of U.S. price indices.
We believe tight monetary policy only intensifies this disinflationary process.
Job growth remains strong, but an expanding labor force explains why. The U.S. is the only developed world economy which measurably benefits from immigration. From November 2023 to March 2024, full-time workers fell by 1.8 million workers while part-time workers rose by 1.6 million. This should eventually translate into lower unit labor costs.
As populations age, they increase savings, particularly in a world where life expectancy is increasing. Japan is the best example. The one inflationary time in the postwar period which persisted occurred in the 1970s when the baby boomers, the most aggressive borrowers and spenders in history, entered their working and family formation years. The baby boomers practically built the housing stock, and private debt as a percentage of GDP nearly tripled. Today they are entering retirement, a time when people spend less and work down debt.
When private sector debt loads are 151% of GDP, as they are today, the ability to borrow and spend dissipates. Medium and lower income folks do most of the spending and their ability to use installment credit at 22%+ interest rates to maintain that spending will likely run out. Credit card delinquencies are rising as are 90-day delinquencies on Federal Housing Administration (“FHA”) insured mortgages. In the corporate sector, leveraged loan defaults are occurring. This, at least, implies we are late in a credit cycle. Most businesses are trying to reduce debt. Many banks will have to deal with commercial real estate loan issues in the coming year.
The failure of the money stock to grow argues in favor of this analysis. M2, the money aggregate which includes bank deposits, has been declining for two years. The rates paid on traditional demand deposits run ten basis points or less, suggesting banks are not willing to bid up for deposits unless they have to. U.S. banking system deposits have declined from $18 billion two years ago to $17.5 billion today. That suggests there are not enough good loans to leverage the stock of deposits they currently hold. To grow, banks may have to make bad loans.
In summary, we believe that the secular disinflationary forces which preceded the COVID-related inflation will reassert themselves. We think they are driven by a combination of demographics, the large amount of private sector debt outstanding and technologically driven productivity gains. All are likely to intensify in coming years.
The portfolios are positioned to balance large-capitalization technology holdings with value cyclicals we believe are likely to generate high levels of free cash flow. We believe the case for large-capitalization technology remains strong. The free cash flows generated by these companies is at a scale never seen before and we think they will maintain their dominance by building the AI infrastructure. This offers an unprecedented long-term runway for growth. These companies are among the few which moved from Internet dominance to equal dominance in cloud and now, AI.
The old economy offers opportunities as well. For example, we think copper will benefit from a perfect storm consisting of growing demand for clean energy, the need to expand the electric grid for AI needs, and the growth of electric vehicles, while an absence of investment will restrict supplies. We also hold stocks which should benefit from a natural gas price recovery owing to a continuing decline in coal availability as a liquefied natural gas (“LNG”) boom emerges. And the aerospace-defense sector faces a decade of increasing demand and rising profitability as new technologies require advanced defense systems.
5
Clough Global Funds
SHAREHOLDER LETTER
April 30, 2024 (Continued) (Unaudited)
As always, please don’t hesitate to reach out to us with any questions or comments.
Sincerely,

Charles I Clough, Jr.

William Whelan
This letter is provided for informational purposes only and is not an offer to purchase or sell shares. Clough Global Dividend and Income Fund, Clough Global Equity Fund, and Clough Global Opportunities Fund (the “Funds”) are closed-end funds, which are traded on the NYSE American LLC, and do not continuously issue shares for sale as open-end mutual funds do. The market price of a closed-end fund is based on the market’s value. The net asset value (“NAV”) of a closed-end fund is the market price of the underlying investments (i.e., stocks and bonds) in the Funds’ portfolios, minus liabilities, divided by the total number of Fund shares outstanding. However, the Funds also have a market price; the value of which it trades on an exchange. This market price can be more or less than its NAV.
Although not generally stated throughout, the information in this letter reflects the opinions of the individual portfolio managers, which opinion is subject to change, and is not intended to be a forecast of future events, a guarantee of future results or investment advice.
The Morningstar Global Allocation Total Return Index represents a multi-asset class portfolio of 60% global equities and 40% global bonds. The asset allocation within each class is driven by Morningstar asset allocation methodology. To maintain broad global exposure and diversification, the index consists of equities & fixed income and utilizes global, float-weighted index methodology to determine allocation to U.S. and non-U.S.
The Bloomberg Developed Markets Large & Mid Cap Total Return Index is a float market capitalization-weighted equity benchmark that covers 85% market capitalization of the measured market.
The MSCI World Index is a free float-adjusted market capitalization weighted index that is designed to measure the equity market performance of 23 developed markets countries. Effective July 31, 2010, the MSCI World Index returns prior to January 1, 2002 were revised to reflect the total returns, with dividends reinvested, reported by MSCI. The MSCI information may only be used for your internal use, may not be reproduced or redisseminated in any form and may not be used as a basis for or a component of any financial instruments or products or indices. None of the MSCI information is intended to constitute investment advice or a recommendation to make (or refrain from making) any kind of investment decision and may not be relied on as such. Historical data and analysis should not be taken as an. indication or guarantee of any future performance analysis, forecast or prediction. The MSCI information is provided on an “as is” basis and the user of this information assumes the entire risk of any use made of this information. MSCI, each of its affiliates and each other person involved in or related to compiling, computing or creating any MSCI information (collectively, the “MSCI Parties”) expressly disclaims all warranties (including, without limitation, any warranties of originality, accuracy, completeness, timeliness, non-infringement, merchantability and fitness for a particular purpose) with respect to this information. Without limiting any of the foregoing, in no event shall any MSCI Party have any liability for any direct, indirect, special, incidental, punitive, consequential (including, without limitation, lost profits) or any other damages (www.msci.com).
Both indices referenced herein reflect the reinvestment of dividends. The performance of the indices referenced herein is used for informational purposes only. One cannot invest directly in an index. Indices are not subject to any of the fees or expenses to which the Funds are subject, and there are significant differences between the Funds’ investments and the components of the indices referenced.
RISKS
An investor should consider investment objectives, risks, charges and expenses carefully before investing. To obtain an annual report or semiannual report which contains this and other information visit www.cloughcefs.com or call 1-855-425-6844. Read them carefully before investing.
The Funds’ distribution policies will, under certain circumstances, have certain adverse consequences to the Funds and their shareholders because it may result in a return of capital resulting in less of a shareholder’s assets being invested in the Funds and, over time, increase the Funds’ expense ratios.
Distributions may be paid from sources of income other than ordinary income, such as net realized short-term capital gains, net realized long-term capital gains and return of capital. Based on current estimates, we anticipate the most recent distribution has been paid from short-term and long-term capital gains. The actual amounts and sources of the amounts for tax reporting purposes will depend upon the Funds’ investment experiences during the remainder of its fiscal year and may be subject to changes based on tax regulations. If a distribution includes anything other than net investment income, the Funds provide a Section 19(a) notice of the best estimate of its distribution sources at that time. These estimates may not match the final tax characterization (for the full year’s distributions) contained in shareholders’ 1099-DIV forms after the end of the year.
The Funds’ investments in securities of foreign issuers are subject to risks not usually associated with owning securities of U.S. issuers. These risks can include fluctuations in foreign currencies, foreign currency exchange controls, social, political and economic instability, differences in securities regulation and trading, expropriation or nationalization of assets, and foreign taxation issues.
6
Clough Global Funds
SHAREHOLDER LETTER
April 30, 2024 (Continued) (Unaudited)
The Funds’ investments in preferred stocks and bonds of below investment grade quality (commonly referred to as “high yield” or “junk bonds”), if any, are predominately speculative because of the credit risk of their issuers.
An investment by the Funds in real estate investment trusts (“REITs”) will subject it to various risks. The first, real estate industry risk, is the risk that the REIT share prices will decline because of adverse developments affecting the real estate industry and real property values. In general, real estate values can be affected by a variety of factors, including supply and demand for properties, the economic health of the country or of different regions, and the strength of specific industries that rent properties. The second, investment style risk, is the risk that returns from REITs—which typically are small or medium capitalization stocks—will trail returns from the overall stock market. The third, interest rate risk, is the risk that changes in interest rates may hurt real estate values or make REIT shares less attractive than other income-producing investments. Credit risk is the risk that an issuer of a preferred or debt security will become unable to meet its obligation to make dividend, interest and principal payments.
Interest rate risk is the risk that preferred stocks paying fixed dividend rates and fixed-rate debt securities will decline in value because of changes in market interest rates. When interest rates rise the value of such securities generally will fall. Derivative transactions (such as futures contracts and options thereon, options, swaps, and short sales) subject the Funds to increased risk of principal loss due to imperfect correlation or unexpected price or interest rate movements. Compared to investment companies that focus only on large companies, the Funds’ share price may be more volatile because it also invests in small and medium capitalization companies. Past performance is neither a guarantee, nor necessarily indicative, of future results, which may be significantly affected by changes in economic and other conditions.
7
Clough Global Dividend and Income Fund
PORTFOLIO ALLOCATION
April 30, 2024 (Unaudited)
Growth of $10,000 Investment
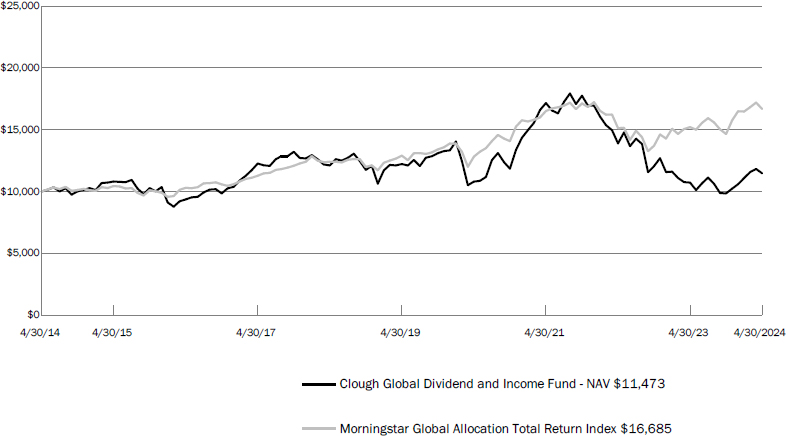
The graph shown above represents historical performance of a hypothetical investment of $10,000 in the Fund over the past ten years. Past performance does not guarantee future results. All returns reflect reinvested dividends, but do not reflect the deduction of taxes that a shareholder would pay on Fund distributions or the redemption of Fund shares
Total Return as of April 30, 2024(a)
| 6 months | 1 Year | 3 Year(b) | 5 Year(b) | 10 Year(b) | Since
Inception (7/28/2004)(b) |
|
| Clough Global Dividend and Income Fund - NAV(c) | 17.31% | 6.25% | -6.30% | 0.26% | 2.01% | 4.94% |
| Clough Global Dividend and Income Fund - Market Price(d) | 16.49% | 7.03% | -12.49% | -1.48% | 1.27% | 3.64% |
| Morningstar Global Allocation Total Return Index | 13.85% | 9.69% | 0.34% | 5.28% | 5.25% | 6.52% |
| (a) | Total returns assume reinvestment of all distributions. |
| (b) | Annualized. |
| (c) | Performance returns are net of management fees and other Fund expenses. |
| (d) | Market price is the value at which the Fund trades on an exchange. This market price can be more or less than its NAV. |
Distributions to Common Shareholders
The Fund intends to make monthly distributions to common shareholders according to its managed distribution policy. The Fund’s managed distribution policy is to set the monthly distribution rate at an amount equal to one twelfth of 10% of the Fund’s adjusted year-ending net asset value per share (“NAV”), which will be the average of the NAVs as of the last five business days of the prior calendar year. The Board of Directors approve the distribution and may adjust it from time to time. The monthly distribution amount paid from November 1, 2023 to December 31, 2023 was $0.0597 per share and the Fund paid $0.0526 per share monthly between January 1, 2024 and April 30, 2024. At times, to maintain a stable level of distributions, the Fund may pay out less than all of its net investment income or pay out accumulated undistributed income, or return of capital, in addition to current net investment income.
8
Clough Global Dividend and Income Fund
PORTFOLIO ALLOCATION
April 30, 2024 (Continued) (Unaudited)
| Global Securities Holdings | %
of Total Portfolio(a) |
| United States of America | 50.80% |
| U.S. Multinationals(b) | 26.35% |
| South Korea | 7.43% |
| France | 4.01% |
| Netherlands | 3.42% |
| Sweden | 2.23% |
| India | 2.00% |
| China | 1.31% |
| Switzerland | 1.11% |
| Ireland | 1.03% |
| Brazil | 0.89% |
| Hong Kong | 0.30% |
| Germany | -0.88% |
| TOTAL INVESTMENTS | 100.00% |
| Asset Allocation | % of Total Portfolio(a) |
| Common Stock - Foreign | 47.59% |
| Common Stock - US | 41.61% |
| Preferred Stock | 1.33% |
| Exchange Traded Funds | -1.01% |
| Total Equities | 89.52% |
| Corporate Bonds | 8.56% |
| Asset-Backed Securities | 0.02% |
| Total Fixed Income | 8.58% |
| Money Market Funds | 1.88% |
| Cash | 0.02% |
| TOTAL INVESTMENTS | 100.00% |
| (a) | Percentages calculated based on total portfolio, including securities sold short and cash balances. |
| (b) | U.S. Multinationals include companies organized or located in the United States that have more than 50% of revenues derived outside of the United States. |
9
Clough Global Equity Fund
PORTFOLIO ALLOCATION
April 30, 2024 (Unaudited)
Growth of $10,000 Investment
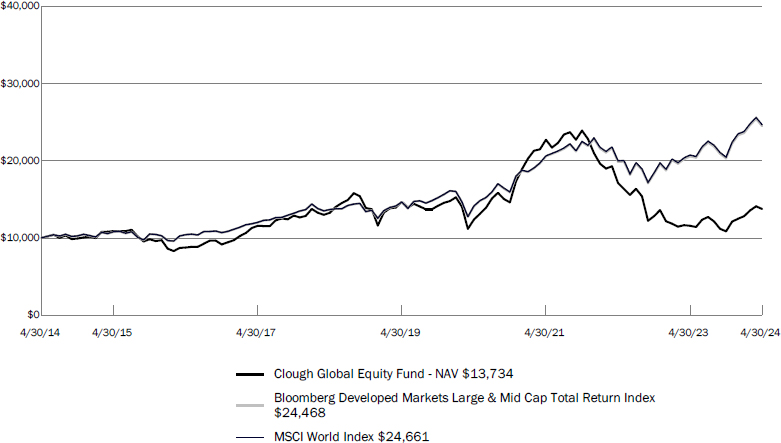
The graph shown above represents historical performance of a hypothetical investment of $10,000 in the Fund over the past ten years. Past performance does not guarantee future results. All returns reflect reinvested dividends, but do not reflect the deduction of taxes that a shareholder would pay on Fund distributions or the redemption of Fund shares
Total Return as of April 30, 2024(a)
| 6 months | 1 Year | 3 Year(b) | 5 Year(b) | 10 Year(b) | Since
Inception (4/27/2005)(b) | |
| Clough Global Equity Fund - NAV(c) | 24.86% | 18.02% | -11.41% | 1.54% | 4.02% | 5.76% |
| Clough Global Equity Fund - Market Price(d) | 26.72% | 18.82% | -15.37% | -1.61% | 3.06% | 4.38% |
| Bloomberg Developed Markets Large & Mid Cap Total Return Index(e) | 20.57% | 19.04% | 5.96% | 10.85% | 9.36% | 8.33% |
| MSCI World Index | 20.59% | 18.96% | 6.14% | 11.00% | 9.45% | 8.47% |
| (a) | Total returns assume reinvestment of all distributions. |
| (b) | Annualized. |
| (c) | Performance returns are net of management fees and other Fund expenses. |
| (d) | Market price is the value at which the Fund trades on an exchange. This market price can be more or less than its NAV. |
| (e) | Effective March 31, 2024, the Bloomberg Developed Markets Large & Mid Cap Total Return Index replaced the MSCI World Index as the Fund’s primary index. |
Distributions to Common Shareholders
The Fund intends to make monthly distributions to common shareholders according to its managed distribution policy. The Fund’s managed distribution policy is to set the monthly distribution rate at an amount equal to one twelfth of 10% of the Fund’s adjusted year-ending net asset value per share (“NAV”), which will be the average of the NAVs as of the last five business days of the prior calendar year. The Board of Directors approve the distribution and may adjust it from time to time. The monthly distribution amount paid from November 1, 2023 to December 31, 2023 was $0.0599 per share and the Fund paid $0.0603 per share monthly between January 1, 2024 and April 30, 2024. At times, to maintain a stable level of distributions, the Fund may pay out less than all of its net investment income or pay out accumulated undistributed income, or return of capital, in addition to current net investment income.
10
Clough Global Equity Fund
PORTFOLIO ALLOCATION
April 30, 2024 (Continued) (Unaudited)
| Global Securities Holdings | %
of Total Portfolio(a) |
| United States of America | 47.03% |
| U.S. Multinationals(b) | 32.49% |
| South Korea | 7.03% |
| India | 3.94% |
| Netherlands | 3.33% |
| China | 3.03% |
| France | 2.95% |
| Switzerland | 1.07% |
| Germany | -1.44% |
| TOTAL INVESTMENTS | 100.00% |
| Asset Allocation | %
of Total Portfolio(a) |
| Common Stock – Foreign | 52.97% |
| Common Stock – US | 46.09% |
| Total Equities | 99.06% |
| Convertible Corporate Bonds | 0.02% |
| Total Fixed Income | 0.02% |
| Money Market Funds | 0.91% |
| Cash | 0.01% |
| TOTAL INVESTMENTS | 100.00% |
| (a) | Percentages calculated based on total portfolio, including securities sold short and cash balances. |
| (b) | U.S. Multinationals includes companies organized or located in the United States that have more than 50% of revenues derived outside of the United States. |
11
Clough Global Opportunities Fund
PORTFOLIO ALLOCATION
April 30, 2024 (Unaudited)
Growth of $10,000 Investment

The graph shown above represents historical performance of a hypothetical investment of $10,000 in the Fund over the past ten years. Past performance does not guarantee future results. All returns reflect reinvested dividends, but do not reflect the deduction of taxes that a shareholder would pay on Fund distributions or the redemption of Fund shares
Total Return as of April 30, 2024(a)
| 6 months | 1 Year | 3 Year(b) | 5 Year(b) | 10 Year(b) | Since
Inception (4/25/2006)(b) | |
| Clough Global Opportunities Fund - NAV(c) | 22.19% | 16.20% | -12.25% | 0.89% | 2.97% | 4.01% |
| Clough Global Opportunities Fund - Market Price(d) | 23.00% | 14.35% | -17.04% | -0.98% | 2.40% | 2.60% |
| Morningstar Global Allocation Total Return Index | 13.85% | 9.69% | 0.34% | 5.28% | 5.25% | 5.59% |
| (a) | Total returns assume reinvestment of all distributions. |
| (b) | Annualized. |
| (c) | Performance returns are net of management fees and other Fund expenses. |
| (d) | Market price is the value at which the Fund trades on an exchange. This market price can be more or less than its NAV. |
Distributions to Common Shareholders
The Fund intends to make monthly distributions to common shareholders according to its managed distribution policy. The Fund’s managed distribution policy is to set the monthly distribution rate at an amount equal to one twelfth of 10% of the Fund’s adjusted year-ending net asset value per share (“NAV”), which will be the average of the NAVs as of the last five business days of the prior calendar year. The Board of Directors approve the distribution and may adjust it from time to time. The monthly distribution amount paid from November 1, 2023 to December 31, 2023 was $0.0483 per share and the Fund paid $0.0480 per share monthly between January 1, 2024 and April 30, 2024. At times, to maintain a stable level of distributions, the Fund may pay out less than all of its net investment income or pay out accumulated undistributed income, or return of capital, in addition to current net investment income.
12
Clough Global Opportunities Fund
PORTFOLIO ALLOCATION
April 30, 2024 (Continued) (Unaudited)
| Global Securities Holdings | %
of Total Portfolio(a) |
| United States of America | 49.81% |
| US Multinationals(b) | 30.23% |
| South Korea | 5.67% |
| India | 3.85% |
| Netherlands | 3.34% |
| France | 2.95% |
| China | 2.95% |
| Switzerland | 1.07% |
| Ireland | 1.00% |
| Germany | -1.45% |
| TOTAL INVESTMENTS | 100.00% |
| Asset Allocation | % of Total Portfolio(a) |
| Common Stock – Foreign | 48.80% |
| Common Stock – US | 42.69% |
| Total Equities | 91.49% |
| Corporate Bonds | 6.96% |
| Convertible Corporate Bonds | 0.02% |
| Total Fixed Income | 6.98% |
| Money Market Funds | 1.52% |
| Cash | 0.01% |
| TOTAL INVESTMENTS | 100.00% |
| (a) | Percentages calculated based on total portfolio, including securities sold short and cash balances. |
| (b) | U.S. Multinationals includes companies organized or located in the United States that have more than 50% of revenues derived outside of the United States. |
13
Clough Global Dividend and Income Fund
SCHEDULE OF INVESTMENTS
April 30, 2024 (Unaudited)
| Shares | Value | |||||||
| COMMON STOCKS - 106.64% | ||||||||
| Communication Services - 4.43% | ||||||||
| AT&T, Inc.(a) | 52,400 | $ | 885,036 | |||||
| Comcast Corp., Class A(a)(b) | 42,200 | 1,608,242 | ||||||
| Meta Platforms, Inc. | 1,550 | 666,764 | ||||||
| Verizon Communications, Inc.(a) | 11,000 | 434,390 | ||||||
| 3,594,432 | ||||||||
| Consumer Discretionary - 11.05% | ||||||||
| Autoliv, Inc.(a) | 14,250 | 1,707,007 | ||||||
| BYD Co. Ltd. | 36,500 | 1,005,970 | ||||||
| D.R. Horton, Inc. | 6,270 | 893,412 | ||||||
| Home Depot, Inc.(a)(b) | 5,648 | 1,887,675 | ||||||
| McDonald's Corp.(a) | 4,567 | 1,246,974 | ||||||
| PulteGroup, Inc.(a) | 9,380 | 1,045,120 | ||||||
| Starbucks Corp.(a) | 13,200 | 1,168,068 | ||||||
| 8,954,226 | ||||||||
| Consumer Staples - 5.71% | ||||||||
| Coca-Cola Co.(a) | 24,850 | 1,534,985 | ||||||
| PepsiCo, Inc.(a) | 5,540 | 974,541 | ||||||
| Procter & Gamble Co.(a) | 13,000 | 2,121,600 | ||||||
| 4,631,126 | ||||||||
| Energy - 4.55% | ||||||||
| Chesapeake Energy Corp.(a) | 13,160 | 1,182,821 | ||||||
| Chevron Corp.(a) | 6,600 | 1,064,382 | ||||||
| Exxon Mobil Corp.(a) | 12,210 | 1,444,077 | ||||||
| 3,691,280 | ||||||||
| Financials - 13.47% | ||||||||
| Bank of America Corp.(a) | 24,000 | 888,240 | ||||||
| Charles Schwab Corp.(a) | 24,310 | 1,797,724 | ||||||
| Everest Group Ltd. | 4,245 | 1,555,410 | ||||||
| HDFC Bank Ltd. - ADR(a)(b) | 10,400 | 599,040 | ||||||
| ICICI Bank Ltd. - Sponsored ADR(a)(b) | 33,900 | 933,267 | ||||||
| JPMorgan Chase & Co.(a) | 13,300 | 2,550,142 | ||||||
| Morgan Stanley(a) | 18,550 | 1,685,082 | ||||||
| Prudential Financial, Inc.(a) | 3,300 | 364,584 | ||||||
| Starwood Property Trust, Inc.(a)(b) | 28,600 | 542,542 | ||||||
| 10,916,031 | ||||||||
| Shares | Value | |||||||
| COMMON STOCKS - 106.64% (continued) | ||||||||
| Health Care - 14.94% | ||||||||
| AbbVie, Inc.(a) | 2,850 | $ | 463,524 | |||||
| Eli Lilly & Co. | 1,889 | 1,475,498 | ||||||
| Encompass Health Corp.(a) | 15,300 | 1,275,714 | ||||||
| Gilead Sciences, Inc.(a) | 6,300 | 410,760 | ||||||
| HCA Healthcare, Inc.(a) | 4,830 | 1,496,431 | ||||||
| Humana, Inc. | 1,820 | 549,804 | ||||||
| Johnson & Johnson(a) | 3,107 | 449,241 | ||||||
| Lonza Group AG | 1,584 | 879,493 | ||||||
| Medtronic PLC(a) | 15,600 | 1,251,744 | ||||||
| Merck & Co., Inc.(a) | 16,020 | 2,070,104 | ||||||
| Select Medical Holdings Corp.(a) | 33,500 | 950,395 | ||||||
| Universal Health Services, Inc. | 4,990 | 850,446 | ||||||
| 12,123,154 | ||||||||
| Industrials - 13.48% | ||||||||
| Airbus SE | 18,656 | 3,079,635 | ||||||
| Ferguson PLC(a) | 10,125 | 2,125,238 | ||||||
| General Dynamics Corp.(a) | 9,245 | 2,654,147 | ||||||
| Illinois Tool Works, Inc.(a)(b) | 1,793 | 437,689 | ||||||
| Lockheed Martin Corp.(a) | 815 | 378,918 | ||||||
| Northrop Grumman Corp.(a) | 1,087 | 527,228 | ||||||
| RTX Corp.(a)(b) | 16,995 | 1,725,332 | ||||||
| 10,928,187 | ||||||||
| Information Technology - 28.36% | ||||||||
| Amphenol Corp., Class A | 4,000 | 483,080 | ||||||
| Apple, Inc.(a)(b) | 15,980 | 2,721,873 | ||||||
| ASML Holding N.V. | 3,007 | 2,623,517 | ||||||
| Broadcom, Inc.(a)(b) | 1,475 | 1,917,898 | ||||||
| Cisco Systems, Inc.(a) | 11,500 | 540,270 | ||||||
| Lam Research Corp.(a) | 2,795 | 2,499,876 | ||||||
| Microsoft Corp.(a) | 13,795 | 5,370,807 | ||||||
| NVIDIA Corp. | 1,300 | 1,123,226 | ||||||
| Samsung Electronics Co., Ltd. | 26,583 | 1,490,618 | ||||||
| Samsung Electronics Co., Ltd., Preference | 8,548 | 403,248 | ||||||
| SK Hynix, Inc. | 30,219 | 3,808,805 | ||||||
| 22,983,218 | ||||||||
| Materials - 6.61% | ||||||||
| Dow, Inc.(a) | 17,100 | 972,990 | ||||||
| Ecolab, Inc. | 3,030 | 685,234 | ||||||
| Freeport-McMoRan, Inc., Class B(a) | 39,450 | 1,970,133 | ||||||
| Glencore PLC | 69,270 | 404,823 | ||||||
| International Paper Co.(a)(b) | 18,600 | 649,884 | ||||||
| Vale SA - Sponsored ADR, Class B(a) | 56,300 | 685,171 | ||||||
| 5,368,235 | ||||||||
| Real Estate - 1.41% | ||||||||
| Simon Property Group, Inc.(a)(b) | 4,800 | 674,544 | ||||||
| VICI Properties, Inc.(a) | 16,500 | 471,075 | ||||||
| 1,145,619 | ||||||||
See Notes to Financial Statements.
14
Clough Global Dividend and Income Fund
SCHEDULE OF INVESTMENTS
April 30, 2024 (Continued) (Unaudited)
| Shares | Value | |||||||
| COMMON STOCKS - 106.64% (continued) | ||||||||
| Utilities - 2.63% | ||||||||
| Duke Energy Corp.(a) | 10,400 | $ | 1,021,904 | |||||
| Exelon Corp.(a)(b) | 29,500 | 1,108,610 | ||||||
| 2,130,514 | ||||||||
| TOTAL COMMON STOCKS | ||||||||
| (Cost $71,694,809) | 86,466,022 | |||||||
| Description/Maturity Date/Rate | Shares | Value | ||||||
| PREFERRED STOCKS - 1.26% | ||||||||
| Gabelli Equity Trust, Inc., Series K, Perpetual Maturity, 5.000%(a)(c) | 21,200 | 455,694 | ||||||
| Trinity Capital, Inc., 1/16/2025, 7.000%(a) | 22,400 | 568,064 | ||||||
| 1,023,758 | ||||||||
| TOTAL PREFERRED STOCKS | ||||||||
| (Cost $1,090,000) | 1,023,758 | |||||||
| Description/Maturity Date/Rate | Principal Amount | Value | ||||||
| CORPORATE BONDS - 8.10% | ||||||||
| Consumer Discretionary - 0.90% | ||||||||
| Melco Resorts Finance Ltd., 7/21/2028, 5.750%(a)(d)(e) | $ | 250,000 | 232,059 | |||||
| PulteGroup, Inc., 1/15/2027, 5.000%(a)(b) | 500,000 | 492,578 | ||||||
| 724,637 | ||||||||
| Energy - 1.83% | ||||||||
| Transocean, Inc., 2/1/2027, 8.000%(d)(e) | 1,476,000 | 1,480,831 | ||||||
| Financials - 0.57% | ||||||||
| Trinity Capital, Inc., 8/24/2026, 4.375%(a) | 500,000 | 463,836 | ||||||
| Health Care - 1.10% | ||||||||
| Tenet Healthcare Corp., 10/1/2028, 6.125% | 900,000 | 889,545 | ||||||
| Industrials - 2.47% | ||||||||
| AerCap Holdings N.V., 10/10/2079, 5.875% | 800,000 | 791,381 | ||||||
| American Airlines 2013-1 Class A Pass Through Trust, 7/15/2025, 4.000% | 368,438 | 358,772 | ||||||
| United Airlines 2020-1 Class B Pass Through Trust, 1/15/2026, 4.875% | 292,320 | 285,596 | ||||||
| Description/Maturity Date/Rate | Principal Amount | Value | ||||||
| CORPORATE BONDS - 8.10% (continued) | ||||||||
| Industrials - 2.47% (continued) | ||||||||
| US Airways 2012-2 Class A Pass Through Trust, 6/3/2025, 4.625%(a) | $ | 579,479 | $ | 572,045 | ||||
| 2,007,794 | ||||||||
| Information Technology - 1.23% | ||||||||
| Apple, Inc., 5/6/2024, 3.450%(a) | 1,000,000 | 999,803 | ||||||
| TOTAL CORPORATE BONDS | ||||||||
| (Cost $6,602,240) | 6,566,446 | |||||||
| Description/Maturity Date/Rate | Principal Amount | Value | ||||||
| ASSET-BACKED SECURITIES - 0.02% | ||||||||
| United States Small Business Administration, 12/1/2028, 6.220%(a) | 19,345 | 19,169 | ||||||
| TOTAL ASSET-BACKED SECURITIES | ||||||||
| (Cost $19,345) | 19,169 | |||||||
| Shares | Value | |||||||
| MONEY MARKET FUNDS - 1.78% | ||||||||
| BlackRock Liquidity Funds, T-Fund Portfolio, Institutional Class, 5.180% (7-day yield) | 1,439,399 | 1,439,399 | ||||||
| TOTAL MONEY MARKET FUNDS | ||||||||
| (Cost $1,439,399) | 1,439,399 | |||||||
| TOTAL INVESTMENTS - 117.80% | ||||||||
| (Cost $80,845,793) | 95,514,794 | |||||||
| Liabilities in Excess of Other Assets - (17.80)%(f) | (14,430,355 | ) | ||||||
| NET ASSETS - 100.00% | $ | 81,084,439 | ||||||
See Notes to Financial Statements.
15
Clough Global Dividend and Income Fund
SCHEDULE OF INVESTMENTS
April 30, 2024 (Continued) (Unaudited)
| SCHEDULE OF SECURITIES SOLD SHORT | Shares | Value | ||||||
| COMMON STOCKS - (22.23)% | ||||||||
| Consumer Discretionary - (9.85)% | ||||||||
| Asbury Automotive Group, Inc.(g) | (1,800 | ) | $ | (378,432 | ) | |||
| BRP, Inc. | (5,670 | ) | (381,473 | ) | ||||
| Brunswick Corp. | (17,500 | ) | (1,411,200 | ) | ||||
| Ford Motor Co. | (14,870 | ) | (180,671 | ) | ||||
| General Motors Co. | (4,980 | ) | (221,759 | ) | ||||
| Harley-Davidson, Inc. | (24,410 | ) | (839,460 | ) | ||||
| Lithia Motors, Inc., Class A | (1,270 | ) | (323,063 | ) | ||||
| Lowe's Cos., Inc. | (1,800 | ) | (410,382 | ) | ||||
| On Holding AG(g) | (13,700 | ) | (434,975 | ) | ||||
| Pool Corp. | (2,800 | ) | (1,015,084 | ) | ||||
| Signet Jewelers Ltd. | (4,600 | ) | (450,938 | ) | ||||
| Tractor Supply Co. | (4,550 | ) | (1,242,514 | ) | ||||
| YETI Holdings, Inc.(g) | (19,400 | ) | (692,968 | ) | ||||
| (7,982,919 | ) | |||||||
| Consumer Staples - (0.83)% | ||||||||
| Energizer Holdings, Inc. | (23,400 | ) | (672,048 | ) | ||||
| Financials - (2.70)% | ||||||||
| Apollo Global Management, Inc. | (3,700 | ) | (401,006 | ) | ||||
| Blackstone, Inc. | (3,400 | ) | (396,474 | ) | ||||
| Deutsche Bank AG | (42,200 | ) | (677,310 | ) | ||||
| KKR & Co., Inc. | (4,300 | ) | (400,201 | ) | ||||
| SoFi Technologies, Inc.(g) | (46,637 | ) | (316,199 | ) | ||||
| (2,191,190 | ) | |||||||
| Health Care - (1.99)% | ||||||||
| Bio-Techne Corp. | (11,900 | ) | (752,199 | ) | ||||
| United Therapeutics Corp.(g) | (3,670 | ) | (859,991 | ) | ||||
| (1,612,190 | ) | |||||||
| Industrials - (3.48)% | ||||||||
| American Airlines Group, Inc.(g) | (13,900 | ) | (187,789 | ) | ||||
| AMETEK, Inc. | (1,600 | ) | (279,456 | ) | ||||
| Honeywell International, Inc. | (1,300 | ) | (250,549 | ) | ||||
| Jacobs Solutions, Inc. | (2,000 | ) | (287,060 | ) | ||||
| The Middleby Corp.(g) | (3,200 | ) | (444,704 | ) | ||||
| Paychex, Inc. | (6,900 | ) | (819,789 | ) | ||||
| Rockwell Automation, Inc. | (900 | ) | (243,864 | ) | ||||
| Shoals
Technologies Group, Inc., Class A(g) | (37,400 | ) | (316,030 | ) | ||||
| (2,829,241 | ) | |||||||
| Information Technology - (1.77)% | ||||||||
| Clearwater Analytics Holdings(g) | (27,600 | ) | (435,528 | ) | ||||
| International Business Machines Corp. | (6,015 | ) | (999,693 | ) | ||||
| (1,435,221 | ) | |||||||
| Shares | Value | |||||||
| Materials - (1.61)% | ||||||||
| Avery Dennison Corp. | (4,000 | ) | $ | (869,120 | ) | |||
| Corteva, Inc. | (8,100 | ) | (438,453 | ) | ||||
| (1,307,573 | ) | |||||||
| TOTAL COMMON STOCKS | ||||||||
| (Proceeds $18,741,657) | (18,030,382 | ) | ||||||
| EXCHANGE-TRADED FUNDS - (0.96)% | ||||||||
| Consumer Staples Select Sector SPDR Fund | (10,300 | ) | (777,650 | ) | ||||
| TOTAL EXCHANGE-TRADED FUNDS | ||||||||
| (Proceeds $732,375) | (777,650 | ) | ||||||
| TOTAL SECURITIES SOLD SHORT | ||||||||
| (Proceeds $19,474,032) | (18,808,032 | ) | ||||||
| Investment Abbreviations: | ||||||||
| ADR – American Depository Receipt | ||||||||
| PLC – Public Limited Company | ||||||||
| (a) | Pledged security; a portion or all of the security is pledged as collateral for securities sold short or borrowings. As of April 30, 2024, the aggregate value of those securities was $63,227,832, representing 77.98% of net assets. |
| (b) | Loaned security; a portion or all of the security is on loan as of April 30, 2024. |
| (c) | This security has no contractual maturity date, is not redeemable and contractually pays an indefinite stream of interest. |
| (d) | Restricted security. |
| (e) | All or a portion of the security is exempt from registration of the Securities Act of 1933. These securities may be resold in transactions exempt from registration under Rule 144A, normally to qualified institutional buyers. As of April 30, 2024, these securities had an aggregate value of $1,712,890 or 2.11% of net assets. |
| (f) | Includes cash which is being held as collateral for securities sold short. |
| (g) | Non-income producing security. |
For Fund compliance purposes, the Fund’s sector classifications refer to any one of the sector sub-classifications used by one or more widely recognized market indexes, and/or as defined by Fund management. This definition may not apply for purposes of this report, which may combine sector sub-classifications for reporting ease. Sectors are shown as a percent of net assets. These sector classifications are unaudited.
See Notes to Financial Statements.
16
Clough Global Equity Fund
SCHEDULE OF INVESTMENTS
April 30, 2024 (Unaudited)
| Shares | Value | |||||||
| COMMON STOCKS - 117.45% | ||||||||
| Communication Services - 8.89% | ||||||||
| Alphabet, Inc.(a)(b)(c) | 51,310 | $ | 8,447,678 | |||||
| Liberty Media Corp. - Liberty Formula One, Class C(a) | 15,100 | 1,056,547 | ||||||
| Meta Platforms, Inc. | 2,730 | 1,174,364 | ||||||
| Verizon Communications, Inc. | 51,500 | 2,033,735 | ||||||
| 12,712,324 | ||||||||
| Consumer Discretionary - 19.84% | ||||||||
| Amazon.com, Inc.(a)(c) | 45,760 | 8,008,000 | ||||||
| Booking Holdings, Inc.(c) | 350 | 1,208,210 | ||||||
| BYD Co. Ltd. | 103,000 | 2,838,764 | ||||||
| Carnival Corp.(a)(b)(c) | 246,600 | 3,654,612 | ||||||
| D.R. Horton, Inc.(c) | 10,260 | 1,461,947 | ||||||
| DraftKings, Inc.(a)(c) | 59,760 | 2,483,626 | ||||||
| MakeMyTrip Ltd.(a) | 19,700 | 1,304,337 | ||||||
| PulteGroup, Inc.(c) | 8,110 | 903,616 | ||||||
| Royal Caribbean Cruises Ltd.(a)(b)(c) | 20,210 | 2,821,922 | ||||||
| SharkNinja, Inc. | 36,350 | 2,336,578 | ||||||
| Trip.com Group Ltd. - ADR(a)(c) | 27,600 | 1,331,976 | ||||||
| 28,353,588 | ||||||||
| Consumer Staples - 2.89% | ||||||||
| Coca-Cola Co.(c) | 10,400 | 642,408 | ||||||
| General Mills, Inc.(b)(c) | 13,900 | 979,394 | ||||||
| Procter & Gamble Co.(b)(c) | 15,300 | 2,496,960 | ||||||
| 4,118,762 | ||||||||
| Energy - 6.53% | ||||||||
| Chesapeake Energy Corp.(b)(c) | 18,209 | 1,636,625 | ||||||
| Diamondback Energy, Inc.(c) | 2,405 | 483,718 | ||||||
| Exxon Mobil Corp.(c) | 11,919 | 1,409,660 | ||||||
| Noble Corp PLC | 16,057 | 712,610 | ||||||
| Schlumberger N.V.(c) | 14,061 | 667,616 | ||||||
| Southwestern Energy Co.(a)(c) | 250,973 | 1,879,788 | ||||||
| Transocean Ltd.(a)(c) | 481,477 | 2,513,310 | ||||||
| 9,303,327 | ||||||||
| Financials - 9.83% | ||||||||
| Berkshire Hathaway, Inc., Class A(a)(c) | 3 | 1,798,500 | ||||||
| Berkshire Hathaway, Inc., Class B(a) | 1,086 | 430,849 | ||||||
| Charles Schwab Corp. | 25,890 | 1,914,565 | ||||||
| Everest Group Ltd. | 7,470 | 2,737,083 | ||||||
| HDFC Bank Ltd. - ADR(b)(c) | 17,700 | 1,019,520 | ||||||
| ICICI Bank Ltd. - Sponsored ADR(b)(c) | 112,500 | 3,097,125 | ||||||
| JPMorgan Chase & Co.(c) | 15,800 | 3,029,492 | ||||||
| 14,027,134 | ||||||||
| Shares | Value | |||||||
| COMMON STOCKS - 117.45% (continued) | ||||||||
| Health Care - 17.47% | ||||||||
| Amphivena Therapeutics, Inc. Series C(a) (d)(e)(f)(g)(h) | 334,425 | $ | 125,376 | |||||
| Biogen, Inc.(a) | 6,700 | 1,439,294 | ||||||
| Centrexion Therapeutics Corp.(a)(d)(e)(f)(g)(h) | 4,336 | 5,819 | ||||||
| Centrexion Therapeutics Corp. Series D Preferred(a)(d)(e)(f)(g)(h) | 66,719 | 89,537 | ||||||
| DexCom, Inc.(a)(c) | 18,400 | 2,343,976 | ||||||
| Elevance Health, Inc.(c) | 4,345 | 2,296,680 | ||||||
| Eli Lilly & Co. | 4,827 | 3,770,370 | ||||||
| Encompass Health Corp.(c) | 16,000 | 1,334,080 | ||||||
| HCA Healthcare, Inc.(c) | 5,580 | 1,728,796 | ||||||
| Humana, Inc. | 4,410 | 1,332,217 | ||||||
| Intra-Cellular Therapies Inc(a) | 10,100 | 725,281 | ||||||
| Lonza Group AG | 2,752 | 1,528,008 | ||||||
| Merck & Co., Inc.(b)(c) | 16,680 | 2,155,390 | ||||||
| Roivant Sciences Ltd.(a) | 115,900 | 1,263,310 | ||||||
| Select Medical Holdings Corp.(b)(c) | 55,500 | 1,574,535 | ||||||
| UnitedHealth Group, Inc. | 2,900 | 1,402,730 | ||||||
| Universal Health Services, Inc. | 8,540 | 1,455,472 | ||||||
| Viking Therapeutics, Inc.(a) | 5,100 | 405,858 | ||||||
| 24,976,729 | ||||||||
| Industrials - 12.51% | ||||||||
| Airbus SE | 24,617 | 4,063,645 | ||||||
| Boeing Co.(a)(c) | 12,395 | 2,080,377 | ||||||
| Ferguson PLC(c) | 16,530 | 3,469,647 | ||||||
| General Dynamics Corp.(b)(c) | 8,640 | 2,480,458 | ||||||
| Northrop Grumman Corp.(b)(c) | 1,853 | 898,760 | ||||||
| TransDigm Group, Inc.(c) | 3,909 | 4,878,549 | ||||||
| 17,871,436 | ||||||||
| Information Technology - 33.07% | ||||||||
| Amphenol Corp., Class A(c) | 23,400 | 2,826,018 | ||||||
| Apple, Inc.(c) | 25,120 | 4,278,690 | ||||||
| ASML Holding N.V. | 5,264 | 4,592,682 | ||||||
| Broadcom, Inc.(b)(c) | 2,581 | 3,355,997 | ||||||
| Lam Research Corp.(b)(c) | 5,511 | 4,929,093 | ||||||
| Microsoft Corp.(c) | 25,400 | 9,888,982 | ||||||
| NVIDIA Corp.(c) | 5,065 | 4,376,261 | ||||||
| Palo Alto Networks, Inc.(a) | 11,390 | 3,313,237 | ||||||
| Samsung Electronics Co., Ltd. | 45,046 | 2,525,913 | ||||||
| Samsung Electronics Co., Ltd., Preference | 14,668 | 691,957 | ||||||
| SK Hynix, Inc. | 51,339 | 6,470,772 | ||||||
| 47,249,602 | ||||||||
| Materials - 4.26% | ||||||||
| Freeport-McMoRan, Inc., Class B(c) | 69,800 | 3,485,812 | ||||||
| Glencore PLC | 122,583 | 716,391 | ||||||
| Linde PLC(c) | 4,287 | 1,890,396 | ||||||
| 6,092,599 | ||||||||
See Notes to Financial Statements.
17
Clough Global Equity Fund
SCHEDULE OF INVESTMENTS
April 30, 2024 (Continued) (Unaudited)
| Shares | Value | |||||||
| COMMON STOCKS - 117.45% (continued) | ||||||||
| Real Estate - 0.54% | ||||||||
| Prologis, Inc.(c) | 3,200 | $ | 326,560 | |||||
| Simon Property Group, Inc.(c) | 3,200 | 449,696 | ||||||
| 776,256 | ||||||||
| Utilities - 1.62% | ||||||||
| Duke Energy Corp.(b)(c) | 10,800 | 1,061,208 | ||||||
| Exelon Corp.(c) | 33,600 | 1,262,688 | ||||||
| 2,323,896 | ||||||||
| TOTAL COMMON STOCKS | ||||||||
| (Cost $134,531,916) | 167,805,653 | |||||||
| Principal | ||||||||
| Description/Maturity Date | Amount | Value | ||||||
| CONVERTIBLE CORPORATE BONDS - 0.02% | ||||||||
| Health Care - 0.02% | ||||||||
| Amphivena Convertible Note PP, 12/31/2049(a)(d)(e)(f)(g)(h) | 108,750 | 21,859 | ||||||
| TOTAL CONVERTIBLE CORPORATE BONDS | ||||||||
| (Cost $108,750) | 21,859 | |||||||
| Shares | Value | |||||||
| MONEY MARKET FUNDS - 0.87% | ||||||||
| BlackRock Liquidity Funds, T-Fund Portfolio, Institutional Class, 5.180% (7-day yield) | 1,247,728 | 1,247,728 | ||||||
| TOTAL MONEY MARKET FUNDS | ||||||||
| (Cost $1,247,728) | 1,247,728 | |||||||
| TOTAL INVESTMENTS - 118.34% | ||||||||
| (Cost $135,888,394) | 169,075,240 | |||||||
| Liabilities in Excess of Other Assets - (18.34)%(i) | (26,201,143 | ) | ||||||
| NET ASSETS - 100.00% | ||||||||
| $ | 142,874,097 | |||||||
| SCHEDULE OF SECURITIES SOLD SHORT | Shares | Value | ||||||
| COMMON STOCKS - (21.95)% | ||||||||
| Consumer Discretionary - (9.65)% | ||||||||
| Asbury Automotive Group, Inc.(a) | (3,175 | ) | $ | (667,512 | ) | |||
| BRP, Inc. | (9,970 | ) | (670,774 | ) | ||||
| Brunswick Corp. | (28,600 | ) | (2,306,304 | ) | ||||
| Ford Motor Co. | (26,070 | ) | (316,750 | ) | ||||
| General Motors Co. | (8,560 | ) | (381,177 | ) | ||||
| Harley-Davidson, Inc. | (42,890 | ) | (1,474,987 | ) | ||||
| Lithia Motors, Inc., Class A | (2,280 | ) | (579,986 | ) | ||||
| Lowe’s Cos., Inc. | (3,100 | ) | (706,769 | ) | ||||
| On Holding AG(a) | (24,300 | ) | (771,525 | ) | ||||
| Pool Corp. | (4,920 | ) | (1,783,648 | ) | ||||
| Signet Jewelers Ltd. | (8,100 | ) | (794,043 | ) | ||||
| Tractor Supply Co. | (8,070 | ) | (2,203,756 | ) | ||||
| YETI Holdings, Inc.(a) | (31,500 | ) | (1,125,180 | ) | ||||
| (13,782,411 | ) | |||||||
| Consumer Staples - (0.80)% | ||||||||
| Energizer Holdings, Inc. | (39,900 | ) | (1,145,928 | ) | ||||
| Financials - (2.73)% | ||||||||
| Apollo Global Management, Inc. | (6,600 | ) | (715,308 | ) | ||||
| Blackstone, Inc. | (6,100 | ) | (711,321 | ) | ||||
| Deutsche Bank AG | (74,500 | ) | (1,195,725 | ) | ||||
| KKR & Co., Inc. | (7,700 | ) | (716,639 | ) | ||||
| SoFi Technologies, Inc.(a) | (81,862 | ) | (555,024 | ) | ||||
| (3,894,017 | ) | |||||||
| Health Care - (1.98)% | ||||||||
| Bio-Techne Corp. | (20,900 | ) | (1,321,089 | ) | ||||
| United Therapeutics Corp.(a) | (6,460 | ) | (1,513,772 | ) | ||||
| (2,834,861 | ) | |||||||
| Industrials - (3.41)% | ||||||||
| American Airlines Group, Inc.(a) | (23,900 | ) | (322,889 | ) | ||||
| AMETEK, Inc. | (2,800 | ) | (489,048 | ) | ||||
| Honeywell International, Inc. | (2,100 | ) | (404,733 | ) | ||||
| Jacobs Solutions, Inc. | (3,600 | ) | (516,708 | ) | ||||
| The Middleby Corp.(a) | (5,600 | ) | (778,232 | ) | ||||
| Paychex, Inc. | (12,180 | ) | (1,447,106 | ) | ||||
| Rockwell Automation, Inc. | (1,400 | ) | (379,344 | ) | ||||
| Shoals Technologies Group, Inc., Class A(a) | (63,700 | ) | (538,265 | ) | ||||
| (4,876,325 | ) | |||||||
| Information Technology - (1.77)% | ||||||||
| Clearwater Analytics Holdings(a) | (49,100 | ) | (774,798 | ) | ||||
| International Business Machines Corp. | (10,560 | ) | (1,755,072 | ) | ||||
| (2,529,870 | ) | |||||||
See Notes to Financial Statements.
18
Clough Global Equity Fund
SCHEDULE OF INVESTMENTS
April 30, 2024 (Continued) (Unaudited)
| SCHEDULE OF SECURITIES SOLD SHORT (continued) | Shares | Value | ||||||
| Materials - (1.61)% | ||||||||
| Avery Dennison Corp. | (7,000 | ) | $ | (1,520,960 | ) | |||
| Corteva, Inc. | (14,400 | ) | (779,472 | ) | ||||
| (2,300,432 | ) | |||||||
| TOTAL COMMON STOCKS | ||||||||
| (Proceeds $32,572,126) | (31,363,844 | ) | ||||||
| TOTAL SECURITIES SOLD SHORT | ||||||||
| (Proceeds $32,572,126) | (31,363,844 | ) | ||||||
Investment Abbreviations:
ADR – American Depository Receipt
PLC – Public Limited Company
| (a) | Non-income producing security. |
| (b) | Loaned security; a portion or all of the security is on loan as of April 30, 2024. |
| (c) | Pledged security; a portion or all of the security is pledged as collateral for securities sold short or borrowings. As of April 30, 2024, the aggregate value of those securities was $99,863,493, representing 69.90% of net assets. |
| (d) | All or a portion of the security is exempt from registration of the Securities Act of 1933. These securities may be resold in transactions exempt from registration under Rule 144A, normally to qualified institutional buyers. As of April 30, 2024, these securities had an aggregate value of $242,591 or 0.17% of net assets. |
| (e) | As a result of the use of significant unobservable inputs to determine fair value, these investments have been classified as Level 3 assets. |
| (f) | Restricted security. |
| (g) | Fair valued security; valued in accordance with procedures approved by the Board. As of April 30, 2024, these securities had an aggregate value of $242,591 or 0.17% of total net assets. |
| (h) | Private Placement; these securities may only be resold in transactions exempt from registration under the Securities Act of 1933. As of April 30, 2024, these securities had an aggregate value of $242,591 or 0.17% of net assets. |
| (i) | Includes cash which is being held as collateral for securities sold short. |
For Fund compliance purposes, the Fund’s sector classifications refer to any one of the sector sub-classifications used by one or more widely recognized market indexes, and/or as defined by Fund management. This definition may not apply for purposes of this report, which may combine sector sub-classifications for reporting ease. Sectors are shown as a percent of net assets. These sector classifications are unaudited.
See Notes to Financial Statements.
19
Clough Global Opportunities Fund
SCHEDULE OF INVESTMENTS
April 30, 2024 (Unaudited)
| Shares | Value | |||||||
| COMMON STOCKS - 110.06% | ||||||||
| Communication Services - 8.56% | ||||||||
| Alphabet, Inc.(a)(b) | 86,530 | $ | 14,246,299 | |||||
| Liberty Media Corp. - Liberty Formula One, Class C(a) | 27,200 | 1,903,184 | ||||||
| Meta Platforms, Inc. | 4,900 | 2,107,833 | ||||||
| Verizon Communications, Inc.(b) | 93,300 | 3,684,417 | ||||||
| 21,941,733 | ||||||||
| Consumer Discretionary - 18.53% | ||||||||
| Amazon.com, Inc.(a)(b) | 71,650 | 12,538,750 | ||||||
| Booking Holdings, Inc.(b) | 574 | 1,981,465 | ||||||
| BYD Co. Ltd. | 177,500 | 4,892,045 | ||||||
| Carnival Corp.(a)(b)(c) | 435,600 | 6,455,592 | ||||||
| D.R. Horton, Inc.(b) | 17,810 | 2,537,747 | ||||||
| DraftKings, Inc.(a)(b) | 102,440 | 4,257,406 | ||||||
| MakeMyTrip Ltd.(a) | 35,500 | 2,350,455 | ||||||
| PulteGroup, Inc. | 13,890 | 1,547,624 | ||||||
| Royal Caribbean Cruises Ltd.(a)(b)(c) | 31,337 | 4,375,585 | ||||||
| SharkNinja, Inc. | 65,200 | 4,191,056 | ||||||
| Trip.com Group Ltd. - ADR(a) | 49,600 | 2,393,696 | ||||||
| 47,521,421 | ||||||||
| Consumer Staples - 2.70% | ||||||||
| Coca-Cola Co.(b)(c) | 17,900 | 1,105,683 | ||||||
| General Mills, Inc.(b) | 21,700 | 1,528,982 | ||||||
| Procter & Gamble Co.(b) | 26,300 | 4,292,160 | ||||||
| 6,926,825 | ||||||||
| Energy - 5.93% | ||||||||
| Chesapeake Energy Corp.(b) | 29,432 | 2,645,348 | ||||||
| Diamondback Energy, Inc. | 3,912 | 786,821 | ||||||
| Exxon Mobil Corp.(b)(c) | 19,160 | 2,266,053 | ||||||
| Noble Corp PLC(b)(c) | 26,152 | 1,160,626 | ||||||
| Schlumberger N.V.(b) | 16,875 | 801,225 | ||||||
| Southwestern Energy Co.(a)(b) | 406,994 | 3,048,385 | ||||||
| Transocean Ltd.(a)(b)(c) | 862,095 | 4,500,136 | ||||||
| 15,208,594 | ||||||||
| Financials - 9.86% | ||||||||
| Berkshire Hathaway, Inc., Class A(a)(b) | 5 | 2,997,500 | ||||||
| Berkshire Hathaway, Inc., Class B(a) | 1,963 | 778,781 | ||||||
| Charles Schwab Corp. | 46,680 | 3,451,986 | ||||||
| Everest Group Ltd. | 13,390 | 4,906,230 | ||||||
| HDFC Bank Ltd. - ADR(b)(c) | 32,075 | 1,847,520 | ||||||
| ICICI Bank Ltd. - Sponsored ADR(b)(c) | 192,800 | 5,307,784 | ||||||
| JPMorgan Chase & Co.(b) | 27,100 | 5,196,154 | ||||||
| Starwood Property Trust, Inc.(b)(c) | 41,673 | 790,537 | ||||||
| 25,276,492 | ||||||||
| Shares | Value | |||||||
| COMMON STOCKS - 110.06% (continued) | ||||||||
| Health Care - 16.64% | ||||||||
| Amphivena Therapeutics, Inc. Series C(a) (d)(e)(f)(g)(h) | 780,326 | $ | 292,544 | |||||
| Biogen, Inc.(a) | 12,000 | 2,577,840 | ||||||
| Centrexion Therapeutics Corp.(a)(d)(e)(f)(g)(h) | 14,166 | 19,011 | ||||||
| Centrexion Therapeutics Corp. Series D Preferred(a)(d)(e)(f)(g)(h) | 217,952 | 292,492 | ||||||
| DexCom, Inc.(a)(b) | 31,360 | 3,994,950 | ||||||
| Elevance Health, Inc.(b) | 7,644 | 4,040,466 | ||||||
| Eli Lilly & Co. | 7,651 | 5,976,196 | ||||||
| Encompass Health Corp.(b) | 27,400 | 2,284,612 | ||||||
| HCA Healthcare, Inc.(b) | 9,560 | 2,961,879 | ||||||
| Humana, Inc. | 7,750 | 2,341,197 | ||||||
| Intra-Cellular Therapies Inc(a) | 18,100 | 1,299,761 | ||||||
| Lonza Group AG | 4,963 | 2,755,633 | ||||||
| Merck & Co., Inc.(b)(c) | 28,450 | 3,676,309 | ||||||
| Roivant Sciences Ltd.(a) | 198,600 | 2,164,740 | ||||||
| Select Medical Holdings Corp.(b) | 77,200 | 2,190,164 | ||||||
| UnitedHealth Group, Inc. | 5,150 | 2,491,055 | ||||||
| Universal Health Services, Inc. | 15,460 | 2,634,848 | ||||||
| Viking Therapeutics, Inc.(a) | 9,100 | 724,178 | ||||||
| 42,717,875 | ||||||||
| Industrials - 12.14% | ||||||||
| Airbus SE | 44,067 | 7,274,349 | ||||||
| Boeing Co.(a)(b)(c) | 22,305 | 3,743,671 | ||||||
| Ferguson PLC(b) | 30,275 | 6,354,722 | ||||||
| General Dynamics Corp.(b) | 13,940 | 4,002,035 | ||||||
| Northrop Grumman Corp.(b) | 2,909 | 1,410,952 | ||||||
| TransDigm Group, Inc.(b) | 6,681 | 8,338,088 | ||||||
| 31,123,817 | ||||||||
| Information Technology - 29.41% | ||||||||
| Amphenol Corp., Class A | 31,600 | 3,816,332 | ||||||
| Apple, Inc.(b) | 37,300 | 6,353,309 | ||||||
| ASML Holding N.V. | 9,447 | 8,242,224 | ||||||
| Broadcom, Inc.(b)(c) | 4,436 | 5,767,998 | ||||||
| Lam Research Corp.(b)(c) | 10,377 | 9,281,292 | ||||||
| Microsoft Corp.(b)(c) | 40,320 | 15,697,786 | ||||||
| NVIDIA Corp.(b) | 7,293 | 6,301,298 | ||||||
| Palo Alto Networks, Inc.(a) | 20,430 | 5,942,883 | ||||||
| Samsung Electronics Co., Ltd. | 78,075 | 4,377,985 | ||||||
| Samsung Electronics Co., Ltd., Preference | 26,679 | 1,258,571 | ||||||
| SK Hynix, Inc. | 66,464 | 8,377,128 | ||||||
| 75,416,806 | ||||||||
| Materials - 4.20% | ||||||||
| Freeport-McMoRan, Inc., Class B | 124,950 | 6,240,003 | ||||||
| Glencore PLC | 219,538 | 1,283,009 | ||||||
| Linde PLC(b) | 7,380 | 3,254,285 | ||||||
| 10,777,297 | ||||||||
See Notes to Financial Statements.
20
Clough Global Opportunities Fund
SCHEDULE OF INVESTMENTS
April 30, 2024 (Continued) (Unaudited)
| Shares | Value | |||||||
| COMMON STOCKS - 110.06% (continued) | ||||||||
| Real Estate - 0.53% | ||||||||
| Prologis, Inc.(b) | 5,600 | $ | 571,480 | |||||
| Simon Property Group, Inc.(b)(c) | 5,600 | 786,968 | ||||||
| 1,358,448 | ||||||||
| Utilities - 1.56% | ||||||||
| Duke Energy Corp.(b) | 18,700 | 1,837,462 | ||||||
| Exelon Corp.(b)(c) | 57,600 | 2,164,608 | ||||||
| 4,002,070 | ||||||||
| TOTAL COMMON STOCKS | ||||||||
| (Cost $229,382,784) | 282,271,378 | |||||||
| Description/Maturity Date/Rate | Principal Amount | Value | ||||||
| CORPORATE BONDS - 6.70% | ||||||||
| Energy - 1.73% | ||||||||
| Transocean, Inc., 2/1/2027, 8.000%(d)(f) | $ | 4,419,000 | 4,433,463 | |||||
| Financials - 0.76% | ||||||||
| Bank of Americal Corp., Perpetual Maturity, 5.875%(i) | 2,040,000 | 1,959,145 | ||||||
| Health Care - 0.99% | ||||||||
| Tenet Healthcare Corp., 10/1/2028, 6.125%(b)(c) | 2,560,000 | 2,530,261 | ||||||
| Industrials - 3.22% | ||||||||
| AerCap Holdings N.V., 10/10/2079, 5.875% | 2,500,000 | 2,473,065 | ||||||
| American Airlines 2013-1 Class A Pass Through Trust, 7/15/2025, 4.000% | 1,068,469 | 1,040,438 | ||||||
| American Airlines 2019-1 Class A Pass Through Trust, 2/15/2032, 3.500%(b)(c) | 3,445,193 | 2,968,860 | ||||||
| Hexcel Corp., 8/15/2025, 4.950%(b) | 1,000,000 | 991,761 | ||||||
| United Airlines 2020-1 Class B Pass Through Trust, 1/15/2026, 4.875% | 806,400 | 787,852 | ||||||
| 8,261,976 | ||||||||
| TOTAL CORPORATE BONDS | ||||||||
| (Cost $17,154,524) | 17,184,845 | |||||||
| Principal | ||||||||
| Description/Maturity Date | Amount | Value | ||||||
| CONVERTIBLE CORPORATE BONDS - 0.02% | ||||||||
| Health Care - 0.02% | ||||||||
| Amphivena Convertible Note PP, 12/31/2049(a)(d)(e)(f)(g)(h) | 253,750 | $ | 51,004 | |||||
| TOTAL CONVERTIBLE CORPORATE BONDS | ||||||||
| (Cost $253,750) | 51,004 | |||||||
| Shares | Value | |||||||
| MONEY MARKET FUNDS - 1.47% | ||||||||
| BlackRock Liquidity Funds, T-Fund Portfolio, Institutional Class, 5.180% (7-day yield) | 3,759,238 | 3,759,238 | ||||||
| TOTAL MONEY MARKET FUNDS | ||||||||
| (Cost $3,759,238) | 3,759,238 | |||||||
| TOTAL INVESTMENTS - 118.25% | ||||||||
| (Cost $250,550,296) | 303,266,465 | |||||||
| Liabilities in Excess of Other Assets - (18.25)%(j) | (46,809,285 | ) | ||||||
| NET ASSETS - 100.00% | $ | 256,457,180 | ||||||
| SCHEDULE OF SECURITIES SOLD SHORT | Shares | Value | ||||||
| COMMON STOCKS - (21.95)% | ||||||||
| Consumer Discretionary - (9.66)% | ||||||||
| Asbury Automotive Group, Inc.(a) | (5,690 | ) | (1,196,266 | ) | ||||
| BRP, Inc. | (17,860 | ) | (1,201,608 | ) | ||||
| Brunswick Corp. | (51,350 | ) | (4,140,864 | ) | ||||
| Ford Motor Co. | (46,790 | ) | (568,499 | ) | ||||
| General Motors Co. | (15,500 | ) | (690,215 | ) | ||||
| Harley-Davidson, Inc. | (77,010 | ) | (2,648,374 | ) | ||||
| Lithia Motors, Inc., Class A | (4,090 | ) | (1,040,414 | ) | ||||
| Lowe’s Cos., Inc. | (5,600 | ) | (1,276,744 | ) | ||||
| On Holding AG(a) | (43,600 | ) | (1,384,300 | ) | ||||
| Pool Corp. | (8,810 | ) | (3,193,889 | ) | ||||
| Signet Jewelers Ltd. | (14,600 | ) | (1,431,238 | ) | ||||
| Tractor Supply Co. | (14,455 | ) | (3,947,371 | ) | ||||
| YETI Holdings, Inc.(a) | (57,200 | ) | (2,043,184 | ) | ||||
| (24,762,966 | ) | |||||||
| Consumer Staples - (0.81)% | ||||||||
| Energizer Holdings, Inc. | (72,400 | ) | (2,079,328 | ) | ||||
See Notes to Financial Statements.
21
Clough Global Opportunities Fund
SCHEDULE OF INVESTMENTS
April 30, 2024 (Continued) (Unaudited)
| SCHEDULE OF SECURITIES SOLD SHORT (continued) | Shares | Value | ||||||
| Financials - (2.71)% | ||||||||
| Apollo Global Management, Inc. | (11,800 | ) | $ | (1,278,884 | ) | |||
| Blackstone, Inc. | (10,900 | ) | (1,271,049 | ) | ||||
| Deutsche Bank AG | (133,500 | ) | (2,142,675 | ) | ||||
| KKR & Co., Inc. | (13,700 | ) | (1,275,059 | ) | ||||
| SoFi Technologies, Inc.(a) | (146,643 | ) | (994,240 | ) | ||||
| (6,961,907 | ) | |||||||
| Health Care - (1.98)% | ||||||||
| Bio-Techne Corp. | (37,400 | ) | (2,364,054 | ) | ||||
| United Therapeutics Corp.(a) | (11,565 | ) | (2,710,026 | ) | ||||
| (5,074,080 | ) | |||||||
| Industrials - (3.41)% | ||||||||
| American Airlines Group, Inc.(a) | (43,300 | ) | (584,983 | ) | ||||
| AMETEK, Inc. | (5,000 | ) | (873,300 | ) | ||||
| Honeywell International, Inc. | (3,800 | ) | (732,374 | ) | ||||
| Jacobs Solutions, Inc. | (6,400 | ) | (918,592 | ) | ||||
| The Middleby Corp.(a) | (10,100 | ) | (1,403,597 | ) | ||||
| Paychex, Inc. | (21,820 | ) | (2,592,434 | ) | ||||
| Rockwell Automation, Inc. | (2,500 | ) | (677,400 | ) | ||||
| Shoals Technologies Group, Inc., Class A(a) | (115,800 | ) | (978,510 | ) | ||||
| (8,761,190 | ) | |||||||
| Information Technology - (1.77)% | ||||||||
| Clearwater Analytics Holdings(a) | (88,000 | ) | (1,388,640 | ) | ||||
| International Business Machines Corp. | (18,940 | ) | (3,147,828 | ) | ||||
| (4,536,468 | ) | |||||||
| Materials - (1.61)% | ||||||||
| Avery Dennison Corp. | (12,500 | ) | (2,716,000 | ) | ||||
| Corteva, Inc. | (25,900 | ) | (1,401,967 | ) | ||||
| (4,117,967 | ) | |||||||
| TOTAL COMMON STOCKS | ||||||||
| (Proceeds $58,484,838) | (56,293,906 | ) | ||||||
| TOTAL SECURITIES SOLD SHORT | ||||||||
| (Proceeds $58,484,838) | (56,293,906 | ) | ||||||
Investment Abbreviations:
ADR – American Depository Receipt
PLC – Public Limited Company
| (a) | Non-income producing security. |
| (b) | Pledged security; a portion or all of the security is pledged as collateral for securities sold short or borrowings. As of April 30, 2024, the aggregate value of those securities was $168,012,220, representing 65.51% of net assets. |
| (c) | Loaned security; a portion or all of the security is on loan as of April 30, 2024. |
| (d) | All or a portion of the security is exempt from registration of the Securities Act of 1933. These securities may be resold in transactions exempt from registration under Rule 144A, normally to qualified institutional buyers. As of April 30, 2024, these securities had an aggregate value of $5,088,514 or 1.98% of net assets. |
| (e) | As a result of the use of significant unobservable inputs to determine fair value, these investments have been classified as Level 3 assets. |
| (f) | Restricted security. |
| (g) | Fair valued security; valued in accordance with procedures approved by the Board. As of April 30, 2024, these securities had an aggregate value of $655,051 or 0.26% of total net assets. |
| (h) | Private Placement; these securities may only be resold in transactions exempt from registration under the Securities Act of 1933. As of April 30, 2024, these securities had an aggregate value of $655,051 or 0.26% of net assets. |
| (i) | This security has no contractual maturity date, is not redeemable and contractually pays an indefinite stream of interest. |
| (j) | Includes cash which is being held as collateral for securities sold short. |
For Fund compliance purposes, the Fund’s sector classifications refer to any one of the sector sub-classifications used by one or more widely recognized market indexes, and/or as defined by Fund management. This definition may not apply for purposes of this report, which may combine sector sub-classifications for reporting ease. Sectors are shown as a percent of net assets. These sector classifications are unaudited.
See Notes to Financial Statements.
22
Clough Global Funds
STATEMENTS OF ASSETS AND LIABILITIES
April 30, 2024 (Unaudited)
| Clough Global Dividend and Income Fund | Clough Global Equity Fund | Clough Global
Opportunities Funds |
| |||||||||
| ASSETS: | ||||||||||||
| Investments, at value* | $ | 95,514,794 | $ | 169,075,240 | $ | 303,266,465 | ||||||
| Cash | 29,987 | 18,170 | 35,317 | |||||||||
| Foreign currencies, at value | 6 | – | 5 | |||||||||
| Deposit with broker for securities sold short | 18,231,230 | 30,094,990 | 54,128,351 | |||||||||
| Dividends receivable | 107,148 | 137,255 | 237,500 | |||||||||
| Interest receivable | 94,333 | 12,343 | 198,739 | |||||||||
| Interest receivable on deposits with broker | 70,095 | 116,510 | 208,788 | |||||||||
| Receivable for investments sold | 2,011,102 | 6,695,466 | 11,922,713 | |||||||||
| Prepaid expenses and other assets | 11,190 | 3,138 | 3,138 | |||||||||
| Total Assets | 116,069,885 | 206,153,112 | 370,001,016 | |||||||||
| LIABILITIES: | ||||||||||||
| Loan payable | 16,000,000 | 29,000,000 | 52,000,000 | |||||||||
| Interest on loan payable | 81,516 | 147,747 | 264,925 | |||||||||
| Securities sold short, at value | 18,808,032 | 31,363,844 | 56,293,906 | |||||||||
| Payable for investments purchased | – | 2,565,941 | 4,593,813 | |||||||||
| Dividends payable - short sales | 2,851 | 4,947 | 8,915 | |||||||||
| Accrued investment advisory fee | 66,125 | 149,268 | 297,492 | |||||||||
| Accrued administration fee | 26,922 | 47,268 | 84,785 | |||||||||
| Total Liabilities | 34,985,446 | 63,279,015 | 113,543,836 | |||||||||
| NET ASSETS | $ | 81,084,439 | $ | 142,874,097 | $ | 256,457,180 | ||||||
| COMPOSITION OF NET ASSETS: | ||||||||||||
| Paid in capital | $ | 98,172,260 | $ | 194,322,281 | $ | 366,040,514 | ||||||
| Distributable earnings/(Accumulated loss) | (17,087,821 | ) | (51,448,184 | ) | (109,583,334 | ) | ||||||
| NET ASSETS | $ | 81,084,439 | $ | 142,874,097 | $ | 256,457,180 | ||||||
| Shares outstanding, unlimited shares authorized | 12,472,683 | 18,805,321 | ||||||||||
| Net Asset Value, per share | $ | 6.50 | $ | 7.60 | $ | |||||||
| Investments, at cost | $ | 80,845,793 | $ | 135,888,394 | $ | 250,550,296 | ||||||
| Foreign Currencies, at cost | 6 | – | 5 | |||||||||
| Proceeds of Securities Sold Short | 19,474,032 | 32,572,126 | 58,484,838 | |||||||||
| * Securities Loaned, at value | $ | 13,817,407 | $ | 25,663,464 | $ | 47,502,835 | ||||||
See Notes to Financial Statements.
23
Clough Global Funds
STATEMENTS OF OPERATIONS
For the period ended April 30, 2024 (Unaudited)
| Clough Global Dividend and Income Fund | Clough Global Equity Fund | Clough Global
Opportunities Funds |
| |||||||||
| INVESTMENT INCOME: | ||||||||||||
| Dividends* | $ | 1,028,891 | $ | 1,180,909 | $ | 1,965,002 | ||||||
| Interest | 303,418 | 75,147 | 996,353 | |||||||||
| Interest on deposits with broker | 414,340 | 683,694 | 1,239,302 | |||||||||
| Total Income | 1,746,649 | 1,939,750 | 4,200,657 | |||||||||
| EXPENSES: | ||||||||||||
| Investment advisory fee | 388,834 | 865,719 | 1,736,210 | |||||||||
| Administration fee | 158,311 | 274,145 | 494,820 | |||||||||
| Interest on loan | 494,908 | 897,017 | 1,608,441 | |||||||||
| Trustees' fees | 86,549 | 86,549 | 86,549 | |||||||||
| Dividend expense - short sales | 50,888 | 88,005 | 161,656 | |||||||||
| Total Expenses | 1,179,490 | 2,211,435 | 4,087,676 | |||||||||
| NET INVESTMENT INCOME/(LOSS) | 567,159 | (271,685 | ) | 112,981 | ||||||||
| Net realized gain/(loss) on: | ||||||||||||
| Investment securities | (842,719 | ) | 3,943,059 | 6,319,656 | ||||||||
| Securities sold short | (2,914,316 | ) | (4,571,488 | ) | (8,351,893 | ) | ||||||
| Total return swap contracts | (116,642 | ) | (210,580 | ) | (388,403 | ) | ||||||
| Written options | 516,486 | 807,000 | 1,452,620 | |||||||||
| Foreign currency related transactions | (19,191 | ) | (32,793 | ) | (36,342 | ) | ||||||
| Net Realized Loss | (3,376,382 | ) | (64,802 | ) | (1,004,362 | ) | ||||||
| Net change in unrealized appreciation/depreciation on: | ||||||||||||
| Investment Securities | 14,124,798 | 28,008,323 | 45,909,647 | |||||||||
| Securities sold short | 828,057 | 1,320,665 | 2,397,393 | |||||||||
| Total return swap contracts | 87,072 | 157,197 | 289,941 | |||||||||
| Written options | (496,486 | ) | (775,750 | ) | (1,396,370 | ) | ||||||
| Foreign currency related translations | (83 | ) | (130 | ) | (142 | ) | ||||||
| Net Change In Unrealized Appreciation | 14,543,358 | 28,710,305 | 47,200,469 | |||||||||
| NET REALIZED AND UNREALIZED GAIN ON INVESTMENTS | 11,166,976 | 28,645,503 | 46,196,107 | |||||||||
| NET INCREASE IN NET ASSETS RESULTING FROM OPERATIONS | $ | 11,734,135 | $ | 28,373,818 | $ | 46,309,088 | ||||||
| *Foreign taxes withheld on dividends | $ | 18,801 | $ | 28,961 | $ | 48,932 | ||||||
See Notes to Financial Statements.
24
Clough Global Funds
STATEMENTS OF CHANGES IN NET ASSETS
April 30, 2024
| Clough Global Dividend and Income Fund | Six Months Ended April 30, 2024 (Unaudited) | Year Ended October 31, 2023 | ||||||
| OPERATIONS | ||||||||
| Net investment income | $ | 567,159 | $ | 221,087 | ||||
| Net realized loss | (3,376,382 | ) | (12,255,806 | ) | ||||
| Net change in unrealized appreciation | 14,543,358 | 3,317,013 | ||||||
| Long-term capital gain distributions from other investment companies | – | 33,215 | ||||||
| Net increase/decrease in net assets resulting from operations | 11,734,135 | (8,684,491 | ) | |||||
| DISTRIBUTIONS TO COMMON SHAREHOLDERS | ||||||||
| From distributable earnings | (4,122,708 | ) | (275,010 | ) | ||||
| Tax return of capital | – | (9,589,169 | ) | |||||
| Net decrease in net assets from distributions | (4,122,708 | ) | (9,864,179 | ) | ||||
| CAPITAL SHARE TRANSACTIONS | ||||||||
| Repurchase of fund shares | (186,614 | ) | (1,075,630 | ) | ||||
| Net decrease in net assets derived from capital share transactions | (186,614 | ) | (1,075,630 | ) | ||||
| Net increase/decrease in net assets attributable to common shares | 7,424,813 | (19,624,300 | ) | |||||
| NET ASSETS ATTRIBUTABLE TO COMMON SHARES | ||||||||
| Beginning of period | 73,659,626 | 93,283,926 | ||||||
| End of period | $ | 81,084,439 | $ | 73,659,626 | ||||
| Clough Global Equity Fund | Six Months Ended April 30, 2024 (Unaudited) | Year Ended October 31, 2023 | ||||||
| OPERATIONS | ||||||||
| Net investment loss | $ | (271,685 | ) | $ | (2,730,707 | ) | ||
| Net realized loss | (64,802 | ) | (23,851,860 | ) | ||||
| Net change in unrealized appreciation | 28,710,305 | 17,777,241 | ||||||
| Net increase/decrease in net assets resulting from operations | 28,373,818 | (8,805,326 | ) | |||||
| DISTRIBUTIONS TO COMMON SHAREHOLDERS | ||||||||
| From distributable earnings | (6,798,938 | ) | – | |||||
| Tax return of capital | – | (15,858,657 | ) | |||||
| Net decrease in net assets from distributions | (6,798,938 | ) | (15,858,657 | ) | ||||
| CAPITAL SHARE TRANSACTIONS | ||||||||
| Repurchase of fund shares | (219,893 | ) | (1,686,484 | ) | ||||
| Net decrease in net assets derived from capital share transactions | (219,893 | ) | (1,686,484 | ) | ||||
| Net increase/decrease in net assets attributable to common shares | 21,354,987 | (26,350,467 | ) | |||||
| NET ASSETS ATTRIBUTABLE TO COMMON SHARES | ||||||||
| Beginning of period | 121,519,110 | 147,869,577 | ||||||
| End of period | $ | 142,874,097 | $ | 121,519,110 | ||||
See Notes to Financial Statements.
25
Clough Global Funds
STATEMENTS OF CHANGES IN NET ASSETS
April 30, 2024
| Clough Global Opportunities Fund | Six Months Ended April 30, 2024 (Unaudited) |
| Year Ended October 31, 2023 |
|||||
| OPERATIONS | ||||||||
| Net investment income/(loss) | $ | 112,981 | $ | (4,787,989 | ) | |||
| Net realized loss | (1,004,362 | ) | (42,942,027 | ) | ||||
| Net change in unrealized appreciation | 47,200,469 | 32,442,679 | ||||||
| Net increase/decrease in net assets resulting from operations | 46,309,088 | (15,287,337 | ) | |||||
| DISTRIBUTIONS TO COMMON SHAREHOLDERS | ||||||||
| From distributable earnings | (12,369,218 | ) | – | |||||
| Tax return of capital | – | (29,164,469 | ) | |||||
| Net decrease in net assets from distributions | (12,369,218 | ) | (29,164,469 | ) | ||||
| CAPITAL SHARE TRANSACTIONS | ||||||||
| Repurchase of fund shares | (171,506 | ) | (3,251,552 | ) | ||||
| Net decrease in net assets derived from capital share transactions | (171,506 | ) | (3,251,552 | ) | ||||
| Net increase/decrease in net assets attributable to common shares | 33,768,364 | (47,703,358 | ) | |||||
| NET ASSETS ATTRIBUTABLE TO COMMON SHARES | ||||||||
| Beginning of period | 222,688,816 | 270,392,174 | ||||||
| End of period | $ | 256,457,180 | $ | 222,688,816 | ||||
See Notes to Financial Statements.
26
Clough Global Funds
STATEMENTS OF CASH FLOWS
April 30, 2024 (Unaudited)
Clough Global Dividend and Income Fund |
| Clough Global Equity Fund |
| Clough Global Opportunities Fund |
| |||||||
| CASH FLOWS FROM OPERATING ACTIVITIES: | ||||||||||||
| Net increase in net assets from operations | $ | 11,734,135 | $ | 28,373,818 | $ | 46,309,088 | ||||||
| Purchase of investment securities | (22,081,826 | ) | (62,885,091 | ) | (116,940,679 | ) | ||||||
| Net sales of short-term investment securities | 327,908 | 1,695,906 | 37,968 | |||||||||
| Proceeds from disposition of investment securities | 26,164,622 | 68,579,837 | 129,759,776 | |||||||||
| Amortization of premium and accretion of discount on investments | (16,731 | ) | – | (99,960 | ) | |||||||
| Proceeds from securities sold transactions | 36,092,825 | 62,099,556 | 112,212,625 | |||||||||
| Cover securities sold short transactions | (31,290,049 | ) | (52,768,810 | ) | (96,141,718 | ) | ||||||
| Net realized (gain)/loss on: | ||||||||||||
| Investments | 842,720 | (3,943,059 | ) | (6,319,656 | ) | |||||||
| Securities sold short | 2,914,316 | 4,571,488 | 8,351,893 | |||||||||
| Written options | (516,486 | ) | (807,000 | ) | (1,452,620 | ) | ||||||
| Net change in unrealized appreciation/depreciation on: | ||||||||||||
| Investments | (14,124,798 | ) | (28,008,323 | ) | (45,909,647 | ) | ||||||
| Securities sold short | (828,057 | ) | (1,320,665 | ) | (2,397,393 | ) | ||||||
| Written options | 496,486 | 775,750 | 1,396,370 | |||||||||
| Total return swap contracts | (87,072 | ) | (157,197 | ) | (289,941 | ) | ||||||
| (Increase)/Decrease in assets: | ||||||||||||
| Dividends receivable | 7,332 | (38,787 | ) | (66,363 | ) | |||||||
| Interest receivable | 106,482 | 7,512 | 331,799 | |||||||||
| Interest receivable on deposits with broker | (16,226 | ) | (21,789 | ) | (37,077 | ) | ||||||
| Total return swap contracts receivable | 5,331 | 9,624 | 17,751 | |||||||||
| Prepaid expenses and other assets | (3,138 | ) | (3,138 | ) | (3,138 | ) | ||||||
| Increase/(Decrease) in liabilities: | ||||||||||||
| Administration fees payable | (2,016 | ) | (1,669 | ) | (3,365 | ) | ||||||
| Interest due on loan payable | (79,304 | ) | (132,583 | ) | (221,615 | ) | ||||||
| Investment advisory fees payable | (4,951 | ) | (5,271 | ) | (11,807 | ) | ||||||
| Short sales dividends payable | 2,851 | 4,947 | 8,915 | |||||||||
| Trustees' fees and expenses payable | (926 | ) | (926 | ) | (926 | ) | ||||||
| Accrued expenses and other payables | (3,334 | ) | (3,334 | ) | (3,334 | ) | ||||||
| Net Cash Provided by Operating Activities | 9,640,094 | 16,020,796 | 28,526,946 | |||||||||
| CASH FLOWS FROM FINANCING ACTIVITIES: | ||||||||||||
| Repurchase of shares | (186,614 | ) | (219,893 | ) | (171,506 | ) | ||||||
| Cash distributions paid | (4,122,708 | ) | (6,798,938 | ) | (12,369,218 | ) | ||||||
| Net Cash Used in Financing Activities | (4,309,322 | ) | (7,018,831 | ) | (12,540,724 | ) | ||||||
| Net increase in cash | 5,330,772 | 9,001,965 | 15,986,222 | |||||||||
| Cash and restricted cash, beginning balance | 12,930,451 | 21,111,195 | 38,177,451 | |||||||||
| Cash and restricted cash, ending balance | $ | 18,261,223 | $ | 30,113,160 | $ | 54,163,673 | ||||||
| SUPPLEMENTAL DISCLOSURE OF CASH FLOW INFORMATION: | ||||||||||||
| Cash paid during the year for interest from loan payable: | $ | 574,212 | $ | 1,029,600 | $ | 1,830,056 | ||||||
| RECONCILIAITION OF BEGINNING BALANCE OF RESTRICTED AND UNRESTRICTED CASH TO STATEMENT OF ASSETS AND LIABILITIES | ||||||||||||
| Cash | $ | 21,081 | $ | 32,029 | $ | 58,589 | ||||||
| Foreign currencies, at value | 6 | – | 5 | |||||||||
| Deposits with broker | ||||||||||||
| Futures | 650,369 | 1,023,586 | 1,884,236 | |||||||||
| Securities sold short | 12,207,723 | 19,963,016 | 36,063,892 | |||||||||
| Total return swaps | 51,272 | 92,564 | 170,729 | |||||||||
See Notes to Financial Statements.
27
Clough Global Funds
STATEMENTS OF CASH FLOWS
April 30, 2024 (Continued) (Unaudited)
Clough Global Dividend and Income Fund |
| Clough Global Equity Fund |
| Clough Global Opportunities Fund |
| |||||||
| RECONCILIAITION OF ENDING BALANCE OF RESTRICTED AND UNRESTRICTED CASH TO STATEMENT OF ASSETS AND LIABILITIES | ||||||||||||
| Cash | $ | 29,987 | $ | 18,170 | $ | 35,317 | ||||||
| Foreign currencies, at value | 6 | – | 5 | |||||||||
| Deposits with broker | ||||||||||||
| Securities sold short | 18,231,230 | 30,094,990 | 54,128,351 | |||||||||
See Notes to Financial Statements.
28
Clough Global Dividend and Income Fund
FINANCIAL HIGHLIGHTS
April 30, 2024
For the Six Months Ended April 30, 2024 (Unaudited) |
| For the Year Ended October 31, 2023 |
| For the Year Ended October 31, 2022 |
| For the Year Ended October 31, 2021 |
| For the Year Ended October 31, 2020 |
| For the Year Ended October 31, 2019 |
| |||||||||||||
| PER COMMON SHARE OPERATING PERFORMANCE: | ||||||||||||||||||||||||
| Net Asset Value, Beginning of Period | $ | 5.89 | $ | 7.34 | $ | 11.02 | $ | 10.23 | $ | 12.21 | $ | 12.54 | ||||||||||||
| INCOME FROM INVESTMENT OPERATIONS: | ||||||||||||||||||||||||
| Net investment income/(loss)(a) | 0.05 | 0.02 | (0.02 | ) | 0.06 | 0.12 | 0.16 | |||||||||||||||||
| Net realized and unrealized gain/(loss) on investments | 0.89 | (0.71 | ) | (2.59 | ) | 2.28 | (0.89 | ) | 1.08 | |||||||||||||||
| Total from Investment Operations | 0.94 | (0.69 | ) | (2.61 | ) | 2.34 | (0.77 | ) | 1.24 | |||||||||||||||
| DISTRIBUTIONS TO COMMON SHAREHOLDERS FROM: | ||||||||||||||||||||||||
| Net investment income | (0.33 | ) | (0.02 | ) | – | – | (0.20 | ) | (0.06 | ) | ||||||||||||||
| Net realized gains | – | – | – | (0.41 | ) | – | (0.53 | ) | ||||||||||||||||
| Tax return of capital | – | (0.76 | ) | (1.10 | ) | (0.76 | ) | (1.01 | ) | (0.64 | ) | |||||||||||||
| Total Distributions to Common Shareholders | (0.33 | ) | (0.78 | ) | (1.10 | ) | (1.17 | ) | (1.21 | ) | (1.23 | ) | ||||||||||||
| CAPITAL SHARE TRANSACTIONS: | ||||||||||||||||||||||||
| Impact of capital share transactions | 0.00 | (b) | 0.02 | 0.03 | (0.38 | ) | – | (0.34 | ) | |||||||||||||||
| Total Capital Share Transactions | 0.00 | (b) | 0.02 | 0.03 | (0.38 | ) | – | (0.34 | ) | |||||||||||||||
| Net Increase/(Decrease) in net asset value | 0.61 | (1.45 | ) | (3.68 | ) | 0.79 | (1.98 | ) | (0.33 | ) | ||||||||||||||
| Net Asset Value - End of Period | $ | 6.50 | $ | 5.89 | $ | 7.34 | $ | 11.02 | $ | 10.23 | $ | 12.21 | ||||||||||||
| Market Value - End of Period | $ | 5.37 | $ | 4.90 | $ | 6.84 | $ | 11.43 | $ | 8.73 | $ | 10.96 | ||||||||||||
| Total Investment Return - Net Asset Value(c) | 17.31 | % | (8.45 | %) | (24.49 | %) | 23.34 | % | (4.91 | %) | 11.75 | % | ||||||||||||
| Total Investment Return - Market Price(d) | 16.49 | % | (18.27 | %) | (32.14 | %) | 49.90 | % | (9.59 | %) | 11.51 | % | ||||||||||||
| RATIOS AND SUPPLEMENTAL DATA:(e) | ||||||||||||||||||||||||
| Net Assets, end of period (000s) | $ | 81,084 | $ | 73,660 | $ | 93,284 | $ | 124,485 | $ | 86,016 | $ | 102,670 | ||||||||||||
| Ratios to average net assets attributable to common shareholders: | ||||||||||||||||||||||||
| Total expense ratio | 2.97 | %(f) | 5.32 | % | 3.58 | % | 2.38 | % | 2.98 | % | 3.66 | % | ||||||||||||
| Total expense ratio excluding interest expense and dividends on short sales expense | 1.59 | %(f) | 1.97 | % | 1.91 | % | 1.78 | % | 1.89 | % | 1.85 | % | ||||||||||||
| Ratio of net investment income/(loss) | 1.43 | %(f) | 0.26 | % | (0.17 | %) | 0.49 | % | 1.10 | % | 1.30 | % | ||||||||||||
| Portfolio turnover rate | 43 | %(f) | 72 | % | 199 | % | 147 | % | 229 | % | 253 | % | ||||||||||||
| BORROWINGS AT END OF PERIOD: | ||||||||||||||||||||||||
| Aggregate Amount Outstanding (000s) | $ | 16,000 | $ | 16,000 | $ | 53,000 | $ | 61,500 | $ | 50,500 | $ | 49,500 | ||||||||||||
| Asset Coverage Per $1,000(g) | 6,068 | 5,604 | 2,760 | 3,024 | 2,703 | 3,074 | ||||||||||||||||||
| (a) | Calculated based on the average number of common shares outstanding during each fiscal period. |
| (b) | Amount represents less than $0.005 per common share. |
| (c) | Total investment return - Net Asset Value is calculated based on the funds calculated net asset value, assuming a purchase of a common share at the opening on the first day and a sale at the closing on the last day of each period reported and that all rights in the Fund's rights offering were exercised. Dividends and distributions, if any, are assumed for purposes of this calculation to be reinvested at price obtained under the Fund's dividend reinvestment plan. Total investment returns do not reflect brokerage commissions on the purchase or sale of the Fund's common shares. Past performance is not a guarantee of future results. Total returns include adjustments in accordance with accounting principles generally accepted in the United States of America for financial reporting purposes and may differ from those reported to the market. |
| (d) | Total investment return - Market Price is calculated based on where the fund is trading in the market, assuming a purchase of a common share at the opening on the first day and a sale at the closing on the last day of each period reported. Total investment returns do not reflect brokerage commissions on the purchase or sale of the Fund's common shares. Past performance is not a guarantee of future results. |
| (e) | Ratios do not reflect the proportionate share of income and expenses of the underlying investee funds. |
| (f) | Annualized. |
| (g) | Calculated by subtracting the Fund's total liabilities (excluding the principal amount of Leverage Facility) from the Fund's total assets and dividing by the principal amount of the Leverage Facility and then multiplying by $1,000. |
See Notes to Financial Statements.
29
Clough Global Equity Fund
FINANCIAL HIGHLIGHTS
April 30, 2024
For the Six Months Ended April 30, 2024 (Unaudited) |
| For the Year Ended October 31, 2023 |
| For the Year Ended October 31, 2022 |
| For the Year Ended October 31, 2021 |
| For the Year Ended October 31, 2020 |
| For the Year Ended October 31, 2019 |
| |||||||||||||
| PER COMMON SHARE OPERATING PERFORMANCE: | ||||||||||||||||||||||||
| Net Asset Value, Beginning of Period | $ | 6.45 | $ | 7.73 | $ | 15.11 | $ | 12.81 | $ | 12.95 | $ | 13.55 | ||||||||||||
| INCOME FROM INVESTMENT OPERATIONS: | ||||||||||||||||||||||||
| Net investment loss(a) | (0.01 | ) | (0.14 | ) | (0.25 | ) | (0.19 | ) | (0.09 | ) | (0.06 | ) | ||||||||||||
| Net realized and unrealized gain/(loss) on investments | 1.52 | (0.33 | ) | (5.71 | ) | 4.72 | 1.27 | 1.15 | ||||||||||||||||
| Total from Investment Operations | 1.51 | (0.47 | ) | (5.96 | ) | 4.53 | 1.18 | 1.09 | ||||||||||||||||
| DISTRIBUTIONS TO COMMON SHAREHOLDERS FROM: | ||||||||||||||||||||||||
| Net investment income | (0.36 | ) | (0.00 | )(b) | – | (0.12 | ) | (0.60 | ) | – | ||||||||||||||
| Net realized gains | – | – | (0.75 | ) | (1.44 | ) | (0.72 | ) | (1.34 | ) | ||||||||||||||
| Tax return of capital | – | (0.83 | ) | (0.68 | ) | – | – | – | ||||||||||||||||
| Total Distributions to Common Shareholders | (0.36 | ) | (0.83 | ) | (1.43 | ) | (1.56 | ) | (1.32 | ) | (1.34 | ) | ||||||||||||
| CAPITAL SHARE TRANSACTIONS: | ||||||||||||||||||||||||
| Impact of capital share transactions | 0.00 | (b) | 0.02 | 0.01 | (0.67 | ) | – | (0.35 | ) | |||||||||||||||
| Total Capital Share Transactions | 0.00 | (b) | 0.02 | 0.01 | (0.67 | ) | – | (0.35 | ) | |||||||||||||||
| Net Increase/(Decrease) in net asset value | 1.15 | (1.28 | ) | (7.38 | ) | 2.30 | (0.14 | ) | (0.60 | ) | ||||||||||||||
| Net Asset Value - End of Period | $ | 7.60 | $ | 6.45 | $ | 7.73 | $ | 15.11 | $ | 12.81 | $ | 12.95 | ||||||||||||
| Market Value - End of Period | $ | 6.29 | $ | 5.26 | $ | 7.09 | $ | 15.27 | $ | 10.78 | $ | 11.77 | ||||||||||||
| Total Investment Return - Net Asset Value(c) | 24.86 | % | (4.78 | %) | (40.97 | %) | 36.34 | % | 11.47 | % | 9.40 | % | ||||||||||||
| Total Investment Return - Market Price(d) | 26.72 | % | (15.34 | %) | (46.43 | %) | 63.73 | % | 3.21 | % | 1.99 | % | ||||||||||||
| RATIOS AND SUPPLEMENTAL DATA:(e) | ||||||||||||||||||||||||
| Net Assets, end of period (000s) | $ | 142,874 | $ | 121,519 | $ | 147,870 | $ | 267,675 | $ | 169,542 | $ | 171,337 | ||||||||||||
| Ratios to average net assets attributable to common shareholders: | ||||||||||||||||||||||||
| Total expense ratio | 3.21 | %(f) | 5.60 | % | 4.39 | % | 2.64 | % | 3.23 | % | 3.94 | % | ||||||||||||
| Total expense ratio excluding interest expense and dividends on short sales expense | 1.78 | %(f) | 2.23 | % | 2.44 | % | 2.07 | % | 2.20 | % | 2.18 | % | ||||||||||||
| Ratio of net investment (loss) | (0.39 | %)(f) | (1.99 | %) | (2.31 | %) | (1.21 | %) | (0.70 | %) | (0.45 | %) | ||||||||||||
| Portfolio turnover rate | 60 | %(f) | 122 | % | 198 | % | 194 | % | 256 | % | 297 | % | ||||||||||||
| BORROWINGS AT END OF PERIOD: | ||||||||||||||||||||||||
| Aggregate Amount Outstanding (000s) | $ | 29,000 | $ | 29,000 | $ | 110,000 | $ | 131,500 | $ | 92,000 | $ | 84,500 | ||||||||||||
| Asset Coverage Per $1,000(g) | 5,927 | 5,190 | 2,344 | 3,036 | 2,843 | 3,028 | ||||||||||||||||||
| (a) | Calculated based on the average number of common shares outstanding during each fiscal period. |
| (b) | Amount represents less than $0.005 per common share. |
| (c) | Total investment return - Net Asset Value is calculated based on the funds calculated net asset value, assuming a purchase of a common share at the opening on the first day and a sale at the closing on the last day of each period reported and that all rights in the Fund’s rights offering were exercised. Dividends and distributions, if any, are assumed for purposes of this calculation to be reinvested at price obtained under the Fund’s dividend reinvestment plan. Total investment returns do not reflect brokerage commissions on the purchase or sale of the Fund’s common shares. Past performance is not a guarantee of future results. Total returns include adjustments in accordance with accounting principles generally accepted in the United States of America for financial reporting purposes and may differ from those reported to the market. |
| (d) | Total investment return - Market Price is calculated based on where the fund is trading in the market, assuming a purchase of a common share at the opening on the first day and a sale at the closing on the last day of each period reported. Total investment returns do not reflect brokerage commissions on the purchase or sale of the Fund’s common shares. Past performance is not a guarantee of future results. |
| (e) | Ratios do not reflect the proportionate share of income and expenses of the underlying investee funds. |
| (f) | Annualized. |
| (g) | Calculated by subtracting the Fund’s total liabilities (excluding the principal amount of Leverage Facility) from the Fund’s total assets and dividing by the principal amount of the Leverage Facility and then multiplying by $1,000. |
See Notes to Financial Statements.
30
Clough Global Opportunities Fund
FINANCIAL HIGHLIGHTS
April 30, 2024
For the Six Months Ended April 30, 2024 (Unaudited) |
| For the Year Ended October 31, 2023 |
| For the Year Ended October 31, 2022 |
| For the Year Ended October 31, 2021 |
| For the Year Ended October 31, 2020 |
| For the Year Ended October 31, 2019 |
| |||||||||||||
| PER COMMON SHARE OPERATING | ||||||||||||||||||||||||
| PERFORMANCE: | ||||||||||||||||||||||||
| Net Asset Value, Beginning of Period | $ | $ | $ | $ | $ | $ | ||||||||||||||||||
| INCOME
FROM INVESTMENT OPERATIONS: Net investment loss(a) | 0.00 | (b) | (0.11 | ) | (0.18 | ) | (0.16 | ) | (0.08 | ) | (0.04 | ) | ||||||||||||
| Net realized and unrealized gain/(loss) on investments | 1.09 | (0.25 | ) | (4.83 | ) | 3.60 | 1.07 | 1.03 | ||||||||||||||||
| Total from Investment Operations | 1.09 | (0.36 | ) | (5.01 | ) | 3.44 | 0.99 | 0.99 | ||||||||||||||||
| DISTRIBUTIONS TO COMMON SHAREHOLDERS FROM: | ||||||||||||||||||||||||
| Net investment income | (0.29 | ) | (0.00 | )(b) | – | – | (0.71 | ) | – | |||||||||||||||
| Net realized gains | – | – | (0.52 | ) | (1.27 | ) | (0.14 | ) | (0.71 | ) | ||||||||||||||
| Tax return of capital | – | (0.67 | ) | (0.64 | ) | – | (0.22 | ) | (0.35 | ) | ||||||||||||||
| Total Distributions to Common Shareholders | (0.29 | ) | (0.67 | ) | (1.16 | ) | (1.27 | ) | (1.07 | ) | (1.06 | ) | ||||||||||||
| CAPITAL SHARE TRANSACTIONS: | ||||||||||||||||||||||||
| Impact of capital share transactions | 0.00 | (b) | 0.01 | 0.01 | (0.28 | ) | – | – | ||||||||||||||||
| Total Capital Share Transactions | 0.00 | (b) | 0.01 | 0.01 | (0.28 | ) | – | – | ||||||||||||||||
| Net Increase/(Decrease) in net asset value | 0.80 | (1.02 | ) | (6.16 | ) | 1.89 | (0.08 | ) | (0.07 | ) | ||||||||||||||
| Net Asset Value - End of Period | $ | $ | $ | $ | $ | $ | ||||||||||||||||||
| Market Value - End of Period | $ | $ | $ | $ | $ | $ | ||||||||||||||||||
| Total Investment Return - Net Asset Value(c) | 22.19 | % | (4.49 | %) | (42.06 | %) | 34.71 | % | 11.91 | % | 11.08 | % | ||||||||||||
| Total Investment Return - Market Price(d) | 23.00 | % | (16.38 | %) | (48.53 | %) | 66.16 | % | 8.46 | % | 7.49 | % | ||||||||||||
| RATIOS AND SUPPLEMENTAL DATA:(e) | ||||||||||||||||||||||||
| Net Assets, end of period (000s) | $ | 256,457 | $ | 222,689 | $ | 270,392 | $ | 495,734 | $ | 337,761 | $ | 340,278 | ||||||||||||
| Ratios to average net assets attributable to common shareholders: | ||||||||||||||||||||||||
| Total expense ratio | 3.29 | %(f) | 5.71 | % | 4.57 | % | 2.78 | % | 3.42 | % | 4.14 | % | ||||||||||||
| Total expense ratio excluding interest expense and dividends on short sales expense | 1.86 | %(f) | 2.36 | % | 2.60 | % | 2.20 | % | 2.35 | % | 2.33 | % | ||||||||||||
| Ratio of net investment income/(loss) | 0.09 | %(f) | (1.91 | %) | (2.09 | %) | (1.26 | %) | (0.73 | %) | (0.39 | %) | ||||||||||||
| Portfolio turnover rate | 60 | %(f) | 115 | % | 212 | % | 209 | % | 261 | % | 306 | % | ||||||||||||
| BORROWINGS AT END OF PERIOD: | ||||||||||||||||||||||||
| Aggregate Amount Outstanding (000s) | $ | $ | $ | $ | $ | $ | ||||||||||||||||||
| Asset Coverage Per $1,000(g) | ||||||||||||||||||||||||
| (a) | Calculated based on the average number of common shares outstanding during each fiscal period. |
| (b) | Amount represents less than $0.005 per common share. |
| (c) | Total investment return - Net Asset Value is calculated based on the funds calculated net asset value, assuming a purchase of a common share at the opening on the first day and a sale at the closing on the last day of each period reported and that all rights in the Fund’s rights offering were exercised. Dividends and distributions, if any, are assumed for purposes of this calculation to be reinvested at price obtained under the Fund’s dividend reinvestment plan. Total investment returns do not reflect brokerage commissions on the purchase or sale of the Fund’s common shares. Past performance is not a guarantee of future results. Total returns include adjustments in accordance with accounting principles generally accepted in the United States of America for financial reporting purposes and may differ from those reported to the market. |
| (d) | Total investment return - Market Price is calculated based on where the fund is trading in the market, assuming a purchase of a common share at the opening on the first day and a sale at the closing on the last day of each period reported. Total investment returns do not reflect brokerage commissions on the purchase or sale of the Fund’s common shares. Past performance is not a guarantee of future results. |
| (e) | Ratios do not reflect the proportionate share of income and expenses of the underlying investee funds. |
| (f) | Annualized. |
| (g) |
See Notes to Financial Statements.
31
Clough Global Funds
NOTES TO FINANCIAL STATEMENTS
April 30, 2024 (Unaudited)
NOTE 1 - ORGANIZATION AND SIGNIFICANT ACCOUNTING AND OPERATING POLICIES
Clough Global Dividend and Income Fund, Clough Global Equity Fund, and Clough Global Opportunities Fund (each a “Fund”, collectively the “Funds”), are closed-end management investment companies registered under the Investment Company Act of 1940 (the “1940 Act”). The Funds were organized under the laws of the state of Delaware on April 27, 2004, January 25, 2005, and January 12, 2006, respectively for Clough Global Dividend and Income Fund, Clough Global Equity Fund, and Clough Global Opportunities Fund. The Funds were previously registered as non-diversified investment companies. As a result of ongoing operations, each of the Funds became a diversified company. The Funds may not resume operating in a non-diversified manner without first obtaining shareholder approval. Each Fund’s investment objective is to provide a high level of total return. Each Declaration of Trust provides that the Board of Trustees (the “Board”) may authorize separate classes of shares of beneficial interest. The common shares of Clough Global Dividend and Income Fund, Clough Global Equity Fund, and Clough Global Opportunities Fund are listed on the NYSE American LLC and trade under the ticker symbols “GLV”, “GLQ” and “GLO” respectively.
The following is a summary of significant accounting policies followed by the Funds. These policies are in conformity with U.S. generally accepted accounting principles (“GAAP”). The preparation of financial statements in accordance with GAAP requires management to make estimates and assumptions that affect the reported amounts and disclosures, including the disclosure of contingent assets and liabilities, in the financial statements during the reporting period. Management believes the estimates and security valuations are appropriate; however, actual results may differ from those estimates, and the security valuations reflected in the financial statements may differ from the value the Funds ultimately realize upon sale of the securities. Each Fund is considered an investment company for financial reporting purposes under GAAP and follows the accounting and reporting guidance applicable to investment companies as codified in Accounting Standards Codification (“ASC”) Topic 946, Financial Services – Investment Companies.
The net asset value (“NAV”) per share of each Fund is determined no less frequently than daily, on each day that the New York Stock Exchange (“NYSE” or the “Exchange”) is open for trading, as of the close of regular trading on the Exchange (normally 4:00 p.m. New York time). Trading may take place in foreign issues held by a Fund at times when the Fund is not open for business. As a result, each Fund’s NAV may change at times when it is not possible to purchase or sell shares of that Fund.
Investment Valuation – Securities, held by each Fund, for which exchange quotations are readily available, are valued at the last sale price, or if no sale price or if traded on the over-the-counter market, at the mean of the bid and asked prices on such day. Money market funds are valued based on the closing NAV. Most securities listed on a foreign exchange are valued at the last sale price at the close of the exchange on which the security is primarily traded. In certain countries market maker prices are used since they are the most representative of the daily trading activity. Market maker prices are usually the mean between the bid and ask prices. Certain markets are not closed at the time that the Funds price their portfolio securities. In these situations, snapshot prices are provided by the individual pricing services or other alternate sources at the close of the NYSE as appropriate. Securities not traded on a particular day are valued at the mean between the last reported bid and the asked quotes, or the last sale price when appropriate; otherwise fair value will be determined by the Board-appointed fair valuation committee. Debt securities for which the over-the-counter market is the primary market are normally valued on the basis of prices furnished by one or more pricing services or dealers at the mean between the latest available bid and asked prices. As authorized by the Board, debt securities (including short-term obligations that will mature in 60 days or less) may be valued on the basis of valuations furnished by a pricing service which determines valuations based upon market transactions for normal, institutional-size trading units of securities or a matrix method which considers yield or price of comparable bonds provided by a pricing service. Over-the-counter options are valued at the mean between bid and asked prices provided by dealers. Exchange-traded options are valued at the mean of the bid and asked prices. Total return swaps are priced based on valuations provided by a Board approved independent third party pricing agent. If a total return swap price cannot be obtained from an independent third party pricing agent the Fund shall seek to obtain a bid price from at least one independent and/ or executing broker. Futures and options on futures are valued at settlement prices.
If the price of a security is unavailable, or the price of a security is unreliable, e.g., due to the occurrence of a significant event, the security may be valued at its fair value determined the valuation designee. Pursuant to Rule 2a-5 under the 1940 Act, the Board has designated the Fund's investment adviser, Clough Capital Partners L.P. ("Clough" or the "Adviser"), as the valuation designee with respect to the fair valuation of each Fund's portfolio securities, subject to oversight by and periodic reporting to the Board. For this purpose, fair value is the price that a Fund reasonably expects to receive on a current sale of the security. Due to the number of variables affecting the price of a security, however; it is possible that the fair value of a security may not accurately reflect the price that a Fund could actually receive on a sale of the security.
A three-tier hierarchy has been established to classify fair value measurements for disclosure purposes. Inputs refer broadly to the assumptions that market participants would use in pricing the asset or liability, including assumptions about risk. Inputs may be observable or unobservable. Observable inputs are inputs that reflect the assumptions market participants would use in pricing the asset or liability that are developed based on market data obtained from sources independent of the reporting entity. Unobservable inputs are inputs that reflect the reporting entity’s own assumptions about the assumptions market participants would use in pricing the asset or liability that are developed based on the best information available.
Various inputs are used in determining the value of each Fund’s investments as of the reporting period end. These inputs are categorized in the following hierarchy under applicable financial accounting standards:
Level 1 – Unadjusted quoted prices in active markets for identical, unrestricted assets or liabilities that a Fund has the ability to access at the measurement date;
Level 2 – Quoted prices which are not active, quoted prices for similar assets or liabilities in active markets or inputs other than quoted prices that are observable (either directly or indirectly) for substantially the full term of the asset or liability; and
Level 3 – Significant unobservable prices or inputs (including the Fund’s own assumptions in determining the fair value of investments) where there is little or no market activity for the asset or liability at the measurement date.
32
Clough Global Funds
NOTES TO FINANCIAL STATEMENTS
April 30, 2024 (Continued) (Unaudited)
The following is a summary of the inputs used as of April 30, 2024, in valuing each Fund’s investments carried at value.
Clough Global Dividend and Income Fund
| Investments in Securities at Value(a) | Level 1 - Unadjusted Quoted Prices |
| Level 2 - Other Significant Observable Inputs |
Level 3 - Significant Unobservable Inputs |
| Total | ||||||||||
| Common Stocks | $ | 86,466,022 | $ | – | $ | – | $ | 86,466,022 | ||||||||
| Preferred Stocks | 1,023,758 | – | – | 1,023,758 | ||||||||||||
| Corporate Bonds | – | 6,566,446 | – | 6,566,446 | ||||||||||||
| Asset-Backed Securities | – | 19,169 | – | 19,169 | ||||||||||||
| Money Market Funds | 1,439,399 | – | – | 1,439,399 | ||||||||||||
| Total | $ | 88,929,179 | $ | 6,585,615 | $ | – | $ | 95,514,794 | ||||||||
| Other Financial Instruments | ||||||||||||||||
| Liabilities | ||||||||||||||||
| Securities Sold Short | ||||||||||||||||
| Common Stocks | (18,030,382 | ) | – | – | (18,030,382 | ) | ||||||||||
| Exchange-Traded Funds | (777,650 | ) | – | – | (777,650 | ) | ||||||||||
| Total | $ | (18,808,032 | ) | $ | – | $ | – | $ | (18,808,032 | ) | ||||||
Clough Global Equity Fund
| Investments in Securities at Value(a) | Level 1 - Unadjusted Quoted Prices |
| Level 2 - Other Significant Observable Inputs |
Level 3 - Significant Unobservable Inputs |
| Total | ||||||||||
| Common Stocks | ||||||||||||||||
| Communication Services | $ | 12,712,324 | $ | – | $ | – | $ | 12,712,324 | ||||||||
| Consumer Discretionary | 28,353,588 | – | – | 28,353,588 | ||||||||||||
| Consumer Staples | 4,118,762 | – | – | 4,118,762 | ||||||||||||
| Energy | 9,303,327 | – | – | 9,303,327 | ||||||||||||
| Financials | 14,027,134 | – | – | 14,027,134 | ||||||||||||
| Health Care | 24,755,997 | – | 220,732 | 24,976,729 | ||||||||||||
| Industrials | 17,871,436 | – | – | 17,871,436 | ||||||||||||
| Information Technology | 47,249,602 | – | – | 47,249,602 | ||||||||||||
| Materials | 6,092,599 | – | – | 6,092,599 | ||||||||||||
| Real Estate | 776,256 | – | – | 776,256 | ||||||||||||
| Utilities | 2,323,896 | – | – | 2,323,896 | ||||||||||||
| Convertible Corporate Bonds | – | – | 21,859 | 21,859 | ||||||||||||
| Money Market Funds | 1,247,728 | – | – | 1,247,728 | ||||||||||||
| Total | $ | 168,832,649 | $ | – | $ | 242,591 | $ | 169,075,240 | ||||||||
| Other Financial Instruments | ||||||||||||||||
| Liabilities | ||||||||||||||||
| Securities Sold Short | ||||||||||||||||
| Common Stocks | (31,363,844 | ) | – | – | (31,363,844 | ) | ||||||||||
| Total | $ | (31,363,844 | ) | $ | – | $ | – | $ | (31,363,844 | ) | ||||||
Clough Global Opportunities Fund
| Investments in Securities at Value(a) | Level 1 - Unadjusted Quoted Prices |
| Level 2 - Other Significant Observable Inputs |
Level 3 - Significant Unobservable Inputs |
Total | |||||||||||
| Common Stocks | ||||||||||||||||
| Communication Services | $ | 21,941,733 | $ | – | $ | – | $ | 21,941,733 | ||||||||
| Consumer Discretionary | 47,521,421 | – | – | 47,521,421 | ||||||||||||
| Consumer Staples | 6,926,825 | – | – | 6,926,825 | ||||||||||||
| Energy | 15,208,594 | – | – | 15,208,594 | ||||||||||||
| Financials | 25,276,492 | – | – | 25,276,492 | ||||||||||||
| Health Care | 42,113,828 | – | 604,047 | 42,717,875 | ||||||||||||
| Industrials | 31,123,817 | – | – | 31,123,817 | ||||||||||||
| Information Technology | 75,416,806 | – | – | 75,416,806 | ||||||||||||
| Materials | 10,777,297 | – | – | 10,777,297 | ||||||||||||
| Real Estate | 1,358,448 | – | – | 1,358,448 | ||||||||||||
33
Clough Global Funds
NOTES TO FINANCIAL STATEMENTS
April 30, 2024 (Continued) (Unaudited)
| Utilities | 4,002,070 | – | – | 4,002,070 | ||||||||||||
| Corporate Bonds | – | 17,184,845 | – | 17,184,845 | ||||||||||||
| Convertible Corporate Bonds | – | – | 51,004 | 51,004 | ||||||||||||
| Money Market Funds | 3,759,238 | – | – | 3,759,238 | ||||||||||||
| Total | $ | 285,426,569 | $ | 17,184,845 | $ | 655,051 | $ | 303,266,465 | ||||||||
| Other Financial Instruments | ||||||||||||||||
| Liabilities | ||||||||||||||||
| Securities
Sold Short Common Stocks |
(56,293,906 | ) | – | – | (56,293,906 | ) | ||||||||||
| Total | $ | (56,293,906 | ) | $ | – | $ | – | $ | (56,293,906 | ) |
| (a) | For detailed descriptions and other security classifications, see the accompanying Schedules of Investments. |
In the event an independent pricing service is unable to provide an evaluated price for a security or the Adviser believes the price provided is not reliable, securities of each Fund may be valued at fair value as described above. In these instances the Adviser may seek to find an alternative independent source, such as a broker/dealer to provide a price quote, or by using evaluated pricing models similar to the techniques and models used by the independent pricing service. These fair value measurement techniques may utilize unobservable inputs (Level 3).
Additional information about Level 3 securities is presented when a Fund has a significant amount of Level 3 securities at the end of a period in relation to net assets. Management has concluded that Level 3 securities are not material in relation to net assets as of April 30, 2024.
Cash and Cash Equivalents – Cash and cash equivalents may include demand deposits and highly liquid investments, typically with original maturities of three months or less. Cash and cash equivalents are carried at cost, which approximates fair value.
Foreign Securities – Each Fund may invest a portion of its assets in foreign securities. In the event that a Fund executes a foreign security transaction, the Fund will generally enter into a foreign currency spot contract to settle the foreign security transaction. Foreign securities may carry more risk than U.S. securities, such as political, market and currency risks.
The accounting records of each Fund are maintained in U.S. dollars. Prices of securities denominated in foreign currencies are translated into U.S. dollars at the closing rates of exchange at period end. Amounts related to the purchase and sale of foreign securities and investment income are translated at the rates of exchange prevailing on the respective dates of such transactions. Although the net assets and the values are presented at the foreign exchange rates at market close, the Funds do not isolate the portion of the results of operations resulting from changes in foreign exchange rates on investments from the fluctuations arising from changes in prices of securities held.
The effect of changes in foreign currency exchange rates on investments is reported with investment securities realized and unrealized gains and losses in the Funds’ Statements of Operations.
A foreign currency spot contract is a commitment to purchase or sell a foreign currency at a future date, at a negotiated rate. Each Fund may enter into foreign currency spot contracts to settle specific purchases or sales of securities denominated in a foreign currency and for protection from adverse exchange rate fluctuation. Risks to a Fund include the potential inability of the counterparty to meet the terms of the contract.
The net U.S. dollar value of foreign currency underlying all contractual commitments held by a Fund and the resulting unrealized appreciation or depreciation are determined using prevailing forward foreign currency exchange rates. Unrealized appreciation and depreciation on foreign currency spot contracts are reported in the Funds’ Statements of Assets and Liabilities as a receivable for investments sold or a payable for investments purchased and in the Funds’ Statements of Operations with the change in unrealized appreciation or depreciation on translation of assets and liabilities denominated in foreign currencies. These spot contracts are used by the broker to settle investments denominated in foreign currencies.
A Fund may realize a gain or loss upon the closing or settlement of the foreign transactions. Such realized gains and losses are reported with all other foreign currency gains and losses in the Statements of Operations.
Exchange Traded Funds – Each Fund may invest in Exchange Traded Funds (“ETFs”), which are funds whose shares are traded on a national exchange. ETFs may be based on underlying equity or fixed income securities, as well as commodities or currencies. ETFs do not sell individual shares directly to investors and only issue their shares in large blocks known as “creation units.” The investor purchasing a creation unit then sells the individual shares on a secondary market. Although similar diversification benefits may be achieved through an investment in another investment company, ETFs generally offer greater liquidity and lower expenses. Because an ETF incurs its own fees and expenses, shareholders of a Fund investing in an ETF will indirectly bear those costs. Such Funds will also incur brokerage commissions and related charges when purchasing or selling shares of an ETF. Unlike typical investment company shares, which are valued once daily, shares in an ETF may be purchased or sold on a securities exchange throughout the trading day at market prices that are generally close to the NAV of the ETF.
Short Sales – Each Fund may sell a security it does not own in anticipation of a decline in the fair value of that security. When a Fund sells a security short, it must borrow the security sold short and deliver it to the broker-dealer through which it made the short sale. A gain, limited to the price at which a Fund sold the security short, or a loss, unlimited in size, will be recognized upon the termination of the short sale.
Each Fund’s obligation to replace the borrowed security will be secured by collateral deposited with the broker-dealer, usually cash, U.S. government securities or other liquid securities. Each Fund will also be required to designate on its books and records similar collateral with its custodian to the extent, if any, necessary so that the aggregate collateral value is at all times at least equal to the current value of the security sold short. The cash amount is reported on the Statements of Assets and Liabilities as Deposit with broker for securities sold short which is held with one counterparty. Each Fund is obligated to pay interest to the broker for any debit balance of the margin account relating to short sales. The interest incurred by the Funds is reported on the Statements of Operations as Interest expense – margin account. Interest amounts payable, if any, are reported on the Statements of Assets and Liabilities as Interest payable – margin account.
34
Clough Global Funds
NOTES TO FINANCIAL STATEMENTS
April 30, 2024 (Continued) (Unaudited)
Each Fund may also sell a security short if it owns at least an equal amount of the security sold short or another security convertible or exchangeable for an equal amount of the security sold short without payment of further compensation (a short sale against-the-box). In a short sale against-the-box, the short seller is exposed to the risk of being forced to deliver stock that it holds to close the position if the borrowed stock is called in by the lender, which would cause gain or loss to be recognized on the delivered stock. Each Fund expects normally to close its short sales against-the-box by delivering newly acquired stock. Since the Funds intend to hold securities sold short for the short term, these securities are excluded from the purchases and sales of investment securities in Note 4 and each Fund’s Portfolio Turnover in the Financial Highlights.
Derivatives Instruments and Hedging Activities – The following discloses the Funds’ use of derivative instruments and hedging activities.
The Funds’ investment objectives not only permit the Funds to purchase investment securities, they also allow the Funds to enter into various types of derivative contracts, including, but not limited to, purchased and written options, swaps, futures and warrants. In doing so, the Funds will employ strategies in differing combinations to permit them to increase, decrease, or change the level or types of exposure to market factors. Central to those strategies are features inherent to derivatives that make them more attractive for this purpose than equity securities; they require little or no initial cash investment, they can focus exposure on only certain selected risk factors, and they may not require the ultimate receipt or delivery of the underlying security (or securities) to the contract. This may allow the Funds to pursue their objectives more quickly and efficiently than if they were to make direct purchases or sales of securities capable of affecting a similar response to market factors.
Risk of Investing in Derivatives - The Funds’ use of derivatives can result in losses due to unanticipated changes in the market risk factors and the overall market. In instances where the Funds are using derivatives to decrease or hedge exposures to market risk factors for securities held by the Funds, there are also risks that those derivatives may not perform as expected, resulting in losses for the combined or hedged positions.
Derivatives may have little or no initial cash investment relative to their market value exposure and therefore can produce significant gains or losses in excess of their cost. This use of embedded leverage allows the Funds to increase their market value exposure relative to their net assets and can substantially increase the volatility of the Funds’ performance.
Additional associated risks from investing in derivatives also exist and potentially could have significant effects on the valuation of the derivative and the Funds. Typically, the associated risks are not the risks that the Funds are attempting to increase or decrease exposure to, per their investment objectives, but are the additional risks from investing in derivatives.
Examples of these associated risks are liquidity risk, which is the risk that the Funds will not be able to sell the derivative in the open market in a timely manner, and counterparty credit risk, which is the risk that the counterparty will not fulfill its obligation to the Funds. Associated risks can be different for each type of derivative and are discussed by each derivative type in the notes that follow.
Each Fund may acquire put and call options and options on stock indices and enter into stock index futures contracts, certain credit derivatives transactions and short sales in connection with its equity investments. In connection with a Fund’s investments in debt securities, it may enter into related derivatives transactions such as interest rate futures, swaps and options thereon and certain credit derivatives transactions. Derivatives transactions of the types described above subject a Fund to increased risk of principal loss due to imperfect correlation or unexpected price or interest rate movements. Each Fund also will be subject to credit risk with respect to the counterparties to the derivatives contracts purchased by a Fund. If a counterparty becomes bankrupt or otherwise fails to perform its obligations under a derivatives contract due to financial difficulties, each Fund may experience significant delays in obtaining any recovery under the derivatives contract in a bankruptcy or other reorganization proceeding. Each Fund may obtain only a limited recovery or may obtain no recovery in such circumstances.
Market Risk Factors – In addition, in pursuit of their investment objectives, certain Funds may seek to use derivatives, which may increase or decrease exposure to the following market risk factors:
Equity Risk: Equity risk relates to the change in value of equity securities as they relate to increases or decreases in the general market.
Foreign Exchange Rate Risk: Foreign exchange rate risk relates to the change in the U.S. dollar value of a security held that is denominated in a foreign currency. The value of a foreign currency denominated security will decrease as the dollar appreciates against the currency, while the value of the foreign currency denominated security will increase as the dollar depreciates against the currency.
Option Writing/Purchasing - Each Fund may purchase or write (sell) put and call options. One of the risks associated with purchasing an option among others, is that a Fund pays a premium whether or not the option is exercised. Additionally, a Fund bears the risk of loss of premium and change in value should the counterparty not perform under the contract. The cost of securities acquired through the exercise of call options is increased by premiums paid. The proceeds from securities sold through the exercise of put options are decreased by the premiums paid. Each Fund is obligated to pay interest to the broker for any debit balance of the margin account relating to options. Each Fund pledges cash or liquid assets as collateral to satisfy the current obligations with respect to written options. The interest incurred, if any, on the Funds is reported on the Statements of Operations as Interest expense – margin account. Interest amounts payable by the Funds, if any, are reported on the Statements of Assets and Liabilities as Interest payable – margin account.
When a Fund writes an option, an amount equal to the premium received by a Fund is recorded as a liability and is subsequently adjusted to the current value of the option written. Premiums received from writing options that expire unexercised are treated by a Fund on the expiration date as realized gains. The difference between the premium received and the amount paid on effecting a closing purchase transaction, including brokerage commissions, is recorded as a realized gain or loss. If a call option is exercised, the premium is added to the proceeds from the sale of the underlying security or currency in determining whether a Fund has realized a gain or loss. If a put option is exercised, the premium reduces the cost basis of the securities purchased by a Fund. Each Fund, as writer of an option, bears the market risk of an unfavorable change in the price of the security underlying the written option.
Futures Contracts: Each Fund may enter into futures contracts. A futures contract is an agreement to buy or sell a security or currency (or to deliver a final cash settlement price in the case of a contract relating to an index or otherwise not calling for physical delivery at the end of trading in the contract) for a set price at a future date. If a Fund buys a security futures contract, the Fund enters into a contract to purchase the underlying security and is said to be “long” under the contract. If a Fund sells a security futures contact, the Fund enters into a contract to sell the underlying security and is said to be “short” under the contract. The price at which the contract trades (the “contract price”) is determined by relative buying and selling interest on a regulated exchange. Futures contracts are marked
35
Clough Global Funds
NOTES TO FINANCIAL STATEMENTS
April 30, 2024 (Continued) (Unaudited)
to market daily and an appropriate payable or receivable for the change in value (“variation margin”) is recorded by the Fund. Such payables or receivables, if any, are recorded for financial statement purposes as variation margin payable or variation margin receivable by each Fund. Each Fund pledges cash or liquid assets as collateral to satisfy the current obligations with respect to futures contracts. The cash amount, if any, is reported on the Statements of Assets and Liabilities as Deposit with broker for futures contracts which is held with one counterparty. Management has reviewed the futures agreement under which the futures contracts are traded and has determined that the Funds do not have the right to set-off, and therefore the futures contracts are not subject to enforceable netting arrangements.
The Funds enter into such transactions for hedging and other appropriate risk-management purposes or to increase return. While a Fund may enter into futures contracts for hedging purposes, the use of futures contracts might result in a poorer overall performance for the Fund than if it had not engaged in any such transactions. If, for example, the Fund had insufficient cash, it might have to sell a portion of its underlying portfolio of securities in order to meet daily variation margin requirements on its futures contracts or options on futures contracts at a time when it might be disadvantageous to do so. There may be an imperfect correlation between the Funds’ portfolio holdings and futures contracts entered into by the Fund, which may prevent the Fund from achieving the intended hedge or expose the Fund to risk of loss.
Futures contract transactions may result in losses substantially in excess of the variation margin. There can be no guarantee that there will be a correlation between price movements in the hedging vehicle and in the portfolio securities being hedged. An incorrect correlation could result in a loss on both the hedged securities in a Fund and the hedging vehicle so that the portfolio return might have been greater had hedging not been attempted. There can be no assurance that a liquid market will exist at a time when the Fund seeks to close out a futures contract. Lack of a liquid market for any reason may prevent a Fund from liquidating an unfavorable position, and the Fund would remain obligated to meet margin requirements until the position is closed. In addition, the Fund could be exposed to risk if the counterparties to the contracts are unable to meet the terms of their contracts. With exchange-traded-futures contracts, there is minimal counterparty credit risk to the Funds since futures contracts are exchange-traded and the exchange’s clearinghouse, as counterparty to all exchange-traded futures contracts, guarantees the futures contracts against default.
Swaps: A swap is an agreement that obligates two parties to exchange a series of cash flows at specified intervals based upon or calculated by reference to changes in specified prices or rates for a specified amount of an underlying asset. Each Fund may utilize swap agreements as a means to gain exposure to certain assets and/or to “hedge” or protect the Fund from adverse movements in securities prices or interest rates. Each Fund is subject to equity risk and interest rate risk in the normal course of pursuing its investment objective through investments in swap contracts. Swap agreements entail the risk that a party will default on its payment obligation to a Fund. If the other party to a swap defaults, a Fund would risk the loss of the net amount of the payments that it contractually is entitled to receive. If each Fund utilizes a swap at the wrong time or judges market conditions incorrectly, the swap may result in a loss to the Fund and reduce the Fund’s total return.
Total return swaps involve an exchange by two parties in which one party makes payments based on a set rate, either fixed or variable, while the other party makes payments based on the return of an underlying asset, which includes both the income it generates and any capital gains over the payment period. A Fund’s maximum risk of loss from counterparty risk or credit risk is the discounted value of the payments to be received from/paid to the counterparty over the contract’s remaining life, to the extent that the amount is positive. The risk is mitigated by having a netting arrangement between a Fund and the counterparty and by the posting of collateral to a Fund to cover the Fund’s exposure to the counterparty. Each Fund pledges cash or liquid assets as collateral to satisfy the current obligations with respect to swap contracts. The cash amount is reported on the Statements of Assets and Liabilities as Deposit with broker for total return swap contracts which is held with one counterparty.
International Swaps and Derivatives Association, Inc. Master Agreements (“ISDA Master Agreements”) govern OTC financial derivative transactions entered into by a Fund and those counterparties. The ISDA Master Agreements maintain provisions for general obligations, representations, agreements, collateral and events of default or termination. Events of termination include conditions that may entitle counterparties to elect to terminate early and cause settlement of all outstanding transactions under the applicable ISDA Master Agreement. Any election to early terminate could be material to the financial statements. During the period April 30, 2024, the Funds invested in swap agreements consistent with the Funds’ investment strategies to gain exposure to certain markets or indices.
Warrants/Rights: Each Fund may purchase or otherwise receive warrants or rights. Warrants and rights generally give the holder the right to receive, upon exercise, a security of the issuer at a set price. Funds typically use warrants and rights in a manner similar to their use of purchased options on securities, as described in options above. Risks associated with the use of warrants and rights are generally similar to risks associated with the use of purchased options. However, warrants and rights often do not have standardized terms, and may have longer maturities and may be less liquid than exchange-traded options. In addition, the terms of warrants or rights may limit each Fund’s ability to exercise the warrants or rights at such times and in such quantities as each Fund would otherwise wish.
36
Clough Global Funds
NOTES TO FINANCIAL STATEMENTS
April 30, 2024 (Continued) (Unaudited)
The effect of derivatives instruments on each Fund's Statement of Operations for the period ended April 30, 2024:
Clough Global Dividend and Income Fund
| Risk Exposure | Statement of Operations Location | Realized Gain/(Loss) on Derivatives | Change in Unrealized Appreciation/ (Depreciation) on Derivatives | |||||||
| Equity Contracts (Total Return Swaps) | Net realized gain/(loss) on total return swap contracts/ Net change in unrealized appreciation/depreciation on total return swap contracts | $ | (116,642 | ) | $ | 87,072 | ||||
| Interest Rate Contracts (Purchased Options) | Net realized gain/(loss) on investment securities/Net change in unrealized appreciation/depreciation on investment securities | $ | (1,351,732 | ) | $ | 1,331,732 | ||||
| Interest Rate Contracts (Written Options) | Net realized gain/(loss) on written options/Net change in unrealized appreciation/depreciation on written options | $ | 516,486 | $ | (496,486 | ) | ||||
| Total | $ | (951,888 | ) | $ | 922,318 | |||||
Clough Global Equity Fund
| Risk Exposure | Statement of Operations Location | Realized Gain/ (Loss) on Derivatives | Change in Unrealized Appreciation/ (Depreciation) on Derivatives | |||||||
| Equity Contracts (Total Return Swaps) | Net realized gain/(loss) on total return swap contracts/ Net change in unrealized appreciation/depreciation on total return swap contracts | $ | (210,580 | ) | $ | 157,197 | ||||
| Interest Rate Contracts (Purchased Options) | Net realized gain/(loss) on investment securities/Net change in unrealized appreciation/depreciation on investment securities | $ | (2,112,074 | ) | $ | 2,080,824 | ||||
| Interest Rate Contracts (Written Options) | Net realized gain/(loss) on written options/Net change in unrealized appreciation/depreciation on written options | $ | 807,000 | $ | (775,750 | ) | ||||
| Total | $ | (1,515,654 | ) | $ | 1,462,271 | |||||
Clough Global Opportunities Fund
| Risk Exposure | Statement of Operations Location | Realized Gain/ (Loss) on Derivatives | Change in Unrealized Appreciation/ (Depreciation) on Derivatives | |||||||
| Equity Contracts (Total Return Swaps) | Net realized gain/(loss) on total return swap contracts/ Net change in unrealized appreciation/depreciation on total return swap contracts | $ | (388,403 | ) | $ | 289,941 | ||||
| Interest Rate Contracts (Purchased Options) | Net realized gain/(loss) on investment securities/Net change in unrealized appreciation/depreciation on investment securities | $ | (3,801,786 | ) | $ | 3,745,536 | ||||
| Interest Rate Contracts (Written Options) | Net realized gain/(loss) on written options/Net change in unrealized appreciation/depreciation on written options | $ | 1,452,620 | $ | (1,396,370 | ) | ||||
| Total | $ | (2,737,569 | ) | $ | 2,639,107 | |||||
The average notional value of total return swap contracts for the period in which the Funds held total return swaps during the period ended April 30, 2024, is noted below.
| Fund | Average Total Return Swap Contracts Notional Value | |
| Clough Global Dividend and Income Fund | $ | 118,014 |
| Clough Global Equity Fund | 213,058 | |
| Clough Global Opportunities Fund | 392,974 | |
37
Clough Global Funds
NOTES TO FINANCIAL STATEMENTS
April 30, 2024 (Continued) (Unaudited)
The average notional value of options contracts for the period in which the Funds held options during the period ended April 30, 2024, is noted below.
| Fund | Average Purchased Option Contract Notional Value |
Average Written Option Contract Notional Value |
||||
| Clough Global Dividend and Income Fund | $ | 756,980,000 | $ | 756,980,000 | ||
| Clough Global Equity Fund | 1,182,781,250 | 1,182,781,250 | ||||
| Clough Global Opportunities Fund | 2,129,006,250 | 2,129,006,250 | ||||
The average notional value of warrants for the period in which the Funds held warrants during the period ended April 30, 2024, is noted below.
| Fund | Average Warrants Notional Value | ||
| Clough Global Equity Fund | $ | 378,078 | |
| Clough Global Opportunities Fund | 656,735 | ||
Restricted Securities: Although the Funds will invest primarily in publicly traded securities, they may invest a portion of their assets (up to 10% of its value) in restricted securities. Restricted securities are securities that may not be sold to the public without an effective registration statement under the Securities Act of 1933, as amended (the "Securities Act") or, if they are unregistered, may be sold only in a privately negotiated transaction or pursuant to an exemption from registration.
Restricted securities as of April 30, 2024, were as follows.
Clough Global Dividend and Income Fund
| Security | % of Net Assets | Acquisition Date |
Principal Amount |
Cost | Value | |||||||||||
| Melco Resorts Finance Ltd. | 0.29% | 9/21/2020 | $ | 250,000 | $ | 254,407 | $ | 232,059 | ||||||||
| Transocean, Inc. | 1.82 | 7/21/2023 | 1,476,000 | 1,432,818 | 1,480,831 | |||||||||||
| TOTAL | 2.11% | $ | 1,726,000 | $ | 1,687,225 | $ | 1,712,890 | |||||||||
Clough Global Equity Fund
| Security | % of Net Assets | Acquisition Date |
Principal Amount |
Cost | Value | |||||||||||
| Amphivena Convertible Note PP | 0.02% | 8/27/2021 | $ | 108,750 | $ | 108,750 | $ | 21,859 | ||||||||
| Amphivena Therapeutics, Inc. Series C | 0.09 | 4/8/2019 | 334,425 | 1,199,997 | 125,376 | |||||||||||
| Centrexion Therapeutics Corp. | 0.00 | 3/19/2019 | 4,336 | 48,741 | 5,819 | |||||||||||
| Centrexion Therapeutics Corp. Series D Preferred | 0.06 | 12/18/2017 | 66,719 | 701,250 | 89,537 | |||||||||||
| TOTAL | 0.17% | $ | 514,230 | $ | 2,058,738 | $ | 242,591 | |||||||||
Clough Global Opportunities Fund
| Security | % of Net Assets | Acquisition Date |
Principal Amount |
Cost | Value | |||||||||||
| Amphivena Convertible Note PP | 0.02% | 8/27/2021 | $ | 253,750 | $ | 253,750 | $ | 51,004 | ||||||||
| Amphivena Therapeutics, Inc. Series C | 0.11 | 4/8/2019 | 780,326 | 2,799,997 | 292,544 | |||||||||||
| Centrexion Therapeutics Corp. | 0.01 | 3/19/2019 | 14,166 | 159,240 | 19,011 | |||||||||||
| Centrexion Therapeutics Corp. Series D Preferred | 0.11 | 12/18/2017 | 217,952 | 2,290,759 | 292,492 | |||||||||||
| Transocean, Inc. | 1.73 | 7/21/2023 | 4,419,000 | 4,290,447 | 4,433,463 | |||||||||||
| TOTAL | 1.98% | $ | 5,685,194 | $ | 9,794,193 | $ | 5,088,514 | |||||||||
Income Taxes: Each Fund’s policy is to comply with the provisions of the Internal Revenue Code applicable to regulated investment companies and to distribute all of its taxable income to its shareholders. Therefore, no federal income tax provision is required. As of and during the period ended April 30, 2023, the Funds did not have a liability for any unrecognized tax benefits. The Funds recognize the interest and penalties, if any, related to the unrecognized tax benefits as income tax expense in the Statements of Operations. During the period ended April 30, 2024, the Funds did not incur any interest or penalties.
The Funds file U.S. federal, state, and local tax returns as required. The Funds’ tax returns are subject to examination by the relevant tax authorities until expiration of the applicable statute of limitations, which is generally three years after the filing of the tax return. Tax returns for open years have incorporated no uncertain tax positions that require a provision for income taxes.
Distributions to Shareholders: Each Fund intends to make a dividend distribution each month to Common Shareholders after payment of interest on any outstanding borrowings. Any net capital gains earned by a Fund are distributed at least annually to the extent necessary to avoid federal income and excise taxes. Distributions to shareholders are recorded by each Fund on the ex-dividend date. Each Fund has received approval from the Securities and Exchange Commission (the “Commission”) for exemption from Section 19(b) of the 1940 Act, and Rule 19b-1 there under permitting each Fund to make periodic distributions of long-term capital gains, provided that the distribution policy of a Fund with respect to its Common Shares calls for periodic (e.g. quarterly/monthly) distributions in an amount equal to a fixed percentage of each Fund’s average NAV over a specified period of time or market price per common share at or about the time of distributions or pay-out of a level dollar amount.
38
Clough Global Funds
NOTES TO FINANCIAL STATEMENTS
April 30, 2024 (Continued) (Unaudited)
Effective August 2017, each Fund’s Board approved a managed dividend distribution rate of 10% of each Fund’s prior month average NAV. Subject to certain conditions, these distribution policies remained in effect through July 2019. Effective August 2019, each Fund's Board agreed that the Fund would pay monthly distributions in an amount not less than the average distribution rate of a peer group of closed-end funds selected by the Board. Each Fund's current managed distribution policy is to set the monthly distribution rate at an amount equal to one twelfth of 10% of each Fund's adjusted year-ending NAV, which is the average of the NAVs as of the last five business days of the prior calendar year.
Securities Transactions and Investment Income: Investment security transactions are accounted for on a trade date basis. Dividend income and dividend expense-short sales are recorded on the ex-dividend date. Certain dividend income from foreign securities will be recorded, in the exercise of reasonable diligence, as soon as a Fund is informed of the dividend if such information is obtained subsequent to the ex-dividend date and may be subject to withholding taxes in these jurisdictions. Withholding taxes on foreign dividends are paid (a portion of which may be reclaimable) or provided for in accordance with the applicable country’s tax rules and rates and are disclosed in the Statements of Operations. Interest income, which includes amortization of premium and accretion of discount, is recorded on the accrual basis. Realized gains and losses from securities transactions and unrealized appreciation and depreciation of securities are determined using the identified cost basis for both financial reporting and income tax purposes.
Foreign Taxes: The Funds may be subject to foreign taxes related to foreign income received (a portion of which may be reclaimable), capital gains on the sale of securities and certain foreign currency transactions. All foreign taxes are recorded in accordance with the applicable regulations and rates that exist in the foreign jurisdictions in which the Funds invest.
Certain foreign countries impose a capital gains tax which is accrued by the Funds based on the unrealized appreciation, if any, on affected securities. Any accrual would reduce a Fund’s NAV. The tax is paid when the gain is realized and is included in capital gains tax in the Statements of Operations.
Counterparty Risk: Each of the Funds run the risk that the issuer or guarantor of a fixed income security, the counterparty to an over-the-counter derivatives contract, a borrower of each Fund’s securities or the obligor of an obligation underlying an asset-backed security will be unable or unwilling to make timely principal, interest, or settlement payments or otherwise honor its obligations. In addition, to the extent that each of the Funds use over-the-counter derivatives, and/or has significant exposure to a single counterparty, this risk will be particularly pronounced for each of the Funds.
Other Risk Factors: Investing in the Funds may involve certain risks including, but not limited to, the following:
Unforeseen developments in market conditions may result in the decline of prices of, and the income generated by, the securities held by the Funds. These events may have adverse effects on the Funds such as a decline in the value and liquidity of many securities held by the Funds, and a decrease in NAV. Such unforeseen developments may limit or preclude the Funds’ ability to achieve their investment objective.
Investing in stocks may involve larger price fluctuation and greater potential for loss than other types of investments. This may result in the securities held by the Funds being subject to larger short-term declines in value compared to other types of investments.
The Funds may have elements of risk due to their investments in foreign issuers located in various countries outside the U.S. Such investments may subject the Funds to additional risks resulting from future political or economic conditions and/or possible impositions of adverse foreign governmental laws or currency exchange restrictions. Investments in securities of non-U.S. issuers have unique risks not present in securities of U.S. issuers, such as greater price volatility and less liquidity.
Fixed income securities are subject to credit risk, which is the possibility that a security could have its credit rating downgraded or that the issuer of the security could fail to make timely payments or default on payments of interest or principal. Additionally, fixed income securities are subject to interest rate risk, meaning the decline in the price of debt securities that accompanies a rise in interest rates. Bonds with longer maturities are subject to greater price fluctuations than bonds with shorter maturities.
The Funds invest in bonds which are rated below investment grade. These high yield bonds may be more susceptible than higher grade bonds to real or perceived adverse economic or industry conditions. The secondary market, on which high yield bonds are traded, may also be less liquid than the market for higher grade bonds.
The economic impacts of a global pandemic may adversely impact the Funds’ ability to reach their investment objectives and may adversely affect the value and liquidity of the Funds’ investments. Because of uncertainties in valuation, values reflected in these financial statements may differ from the value received upon sales of those investments. These circumstances may continue for an extended period of time, and may adversely affect the value and liquidity of the Funds’ investments.
Prices of bonds and other fixed rate fixed-income securities are subject to interest rate risk as the price tends to move inversely with changes in interest rates. Typically, a rise in rates will adversely affect fixed-income securities and, accordingly, will cause the value of the Funds' investments in these securities to decline. Interest rates in the United States have been rising and might increase in the near future. A wide variety of market factors can cause interest rates to rise, including central bank monetary policy, rising inflation and changes in general economic conditions. During periods of very low interest rates, which occur from time to time due to market forces or actions of governments and/or their central banks, including the Board of Governors of the Federal Reserve System in the U.S., the fund may be subject to a greater risk of principal decline from rising interest rates.
NOTE 2 - FEDERAL INCOME TAXES
Classification of Distributions: Net investment income/(loss) and net realized gain/(loss) may differ for financial statement and tax purposes. The character of distributions made during the year from net investment income or net realized gains may differ from its ultimate characterization for federal income tax purposes. Also, due to the timing of dividend distributions, the fiscal year in which amounts are distributed may differ from the fiscal year in which the income or realized gain was recorded by the Funds. The amounts and characteristics of tax basis distributions and composition of distributable earnings/(accumulated losses) are finalized at fiscal year-end; accordingly, tax basis balances have not been determined as of April 30, 2024. Management has estimated as of April 30, 2024, it is likely the Funds will have a return of capital as of October 31, 2024.
39
Clough Global Funds
NOTES TO FINANCIAL STATEMENTS
April 30, 2024 (Continued) (Unaudited)
The tax character of the distributions paid by the Funds during the year ended October 31, 2023, were as follows:
| Fund | Ordinary Income | Long-Term Capital Gains |
Return of Capital | Total | ||||||||
| Clough Global Dividend and Income Fund | $ | 275,010 | $ | – | $ | 9,589,169 | $ | 9,864,179 | ||||
| Clough Global Equity Fund | – | – | 15,858,657 | 15,858,657 | ||||||||
| Clough Global Opportunities Fund | – | – | 29,164,469 | 29,164,469 | ||||||||
Tax Basis of Investments: Net unrealized appreciation/(depreciation) of investments based on federal tax cost as of April 30, 2024, were as follows:
Gross Appreciation (excess of value over tax cost) | Gross Depreciation (excess of tax cost over value) | Net Appreciation/ (Depreciation) of Foreign Currency | Net Unrealized Appreciation/ (Depreciation) | Cost of Investments for Income Tax Purposes(a) | ||||||||||||||||
| Clough Global Dividend and Income Fund | $ | 15,819,949 | $ | (2,772,327 | ) | $ | (402 | ) | $ | 13,047,220 | $ | 82,467,172 | ||||||||
| Clough Global Equity Fund | 37,508,057 | (7,246,067 | ) | (785 | ) | 30,261,205 | 138,813,250 | |||||||||||||
| Clough Global Opportunities Fund | 62,191,619 | (14,622,884 | ) | (1,408 | ) | 47,567,327 | 255,697,730 | |||||||||||||
| (a) | Represents cost for federal income tax purposes and differs from the cost for financial reporting purposes due to various book-to-tax differences. |
The difference between book and tax basis unrealized appreciation is attributable primarily to wash sales and other investments.
NOTE 3 - CAPITAL TRANSACTIONS
Common Shares: There are an unlimited number of no par value common shares of beneficial interest authorized for each Fund.
The Funds have filed registration statements with the SEC authorizing the Funds to issue additional common shares through one or more equity shelf programs (“Shelf Offerings”). Under the Shelf Offerings, the Funds, subject to market conditions, may raise additional equity capital by issuing additional common shares from time to time in varying amounts and by different offering methods at a net price at or above the Fund’s NAV per common share. In the event the Fund’s Shelf Offering registration statement is no longer current, the Funds may not issue additional common shares until a post-effective amendment to the registration statement has been filed with the SEC.
The Board of each Fund announced, on June 2, 2023, that it had approved a share repurchase program in accordance with Section 23(c) of the 1940 Act. Under the share repurchase program, each Fund may purchase up to 5% of its outstanding common shares in open market transactions over a one-year period beginning on June 5, 2023.
Transactions in common shares were as follows:
Six Months Ended April 30, 2024 |
Year Ended October 31, 2023 | |
| Clough Global Dividend and Income Fund | ||
| Common shares outstanding - beginning of period | 12,506,783 | 12,709,583 |
| Repurchase of fund shares | (34,100) | (202,800) |
| Common shares outstanding - end of period | 12,472,683 | 12,506,783 |
| Clough Global Equity Fund | ||
| Common shares outstanding - beginning of period | 18,839,921 | 19,124,621 |
| Repurchase of fund shares | (34,600) | (284,700) |
| Common shares outstanding - end of period | 18,805,321 | 18,839,921 |
| Clough Global Opportunities Fund | ||
| Common shares outstanding - beginning of period | ||
| Repurchase of fund shares | (34,498) | (679,602) |
| Common shares outstanding - end of period |
For the period ended April 30, 2024, the average discount to net asset value on shares repurchased for Clough Global Dividend and Income Fund, Clough Global Equity Fund and Clough Global Opportunities Fund were 16.27%, 16.55%, and 17.26%, respectively. For the year ended October 31, 2023, the average discount to net asset value on shares repurchased for Clough Global Dividend and Income Fund, Clough Global Equity Fund and Clough Global Opportunities Fund were 16.58%, 16.61%, and 16.43%, respectively.
NOTE 4 - PORTFOLIO SECURITIES
Purchases and sales of investment securities, excluding securities sold short intended to be held for less than one year and short-term securities, for the period ended April 30, 2024, are listed in the table below.
40
Clough Global Funds
NOTES TO FINANCIAL STATEMENTS
April 30, 2024 (Continued) (Unaudited)
| Fund | Cost
of Investments Purchased | Proceeds
from Investments Sold |
|||||
| Clough Global Dividend and Income Fund | $ | 19,708,608 | $ | 25,822,489 | |||
| Clough Global Equity Fund | 61,351,755 | 71,002,140 | |||||
| Clough Global Opportunities Fund | 114,164,561 | 134,223,919 | |||||
NOTE 5 - INVESTMENT ADVISORY AND ADMINISTRATION AGREEMENTS
Clough serves as each Fund’s investment adviser pursuant to an Investment Advisory Agreement (each an “Advisory Agreement” and collectively, the “Advisory Agreements”) with each Fund. As compensation for its services to the Fund, Clough receives an annual investment advisory fee of 0.70%, 0.90% and 1.00% based on Clough Global Dividend and Income Fund’s, Clough Global Equity Fund’s and Clough Global Opportunities Fund’s, respectively, average daily total assets, computed daily and payable monthly.
Paralel Technologies LLC (“Paralel”) serves as each Fund’s administrator pursuant to an administration and fund accounting agreement with each Fund. As compensation for its services to each Fund, Paralel receives a monthly administration fee based on each Fund’s average daily total assets, computed daily and payable monthly. Paralel will pay all routine operating expenses of the Funds, except the following: advisory fees; taxes and governmental fees; expenses related to portfolio transactions and management of the portfolio (inclusive of leverage costs); expenses associated with secondary offerings of shares (including costs related to the offering, redemption and/or maintenance of preferred shares or similar instruments); trustee fees and retainers; expenses associated with tender offers and other share repurchases; and other extraordinary expenses as may arise, including, without limit, litigation, claims, and indemnification expenses.
NOTE 6 - COMMITTED FACILITY AGREEMENT AND LENDING AGREEMENT
Each Fund entered into a financing package that includes a Committed Facility Agreement (the “Agreement”) dated January 16, 2009, as amended and restated, between each Fund and BNP Paribas Prime Brokerage, Inc. (“BNP”) that allows each Fund to borrow funds from BNP. Each Fund entered a Special Custody and Pledge Agreement (the “Pledge Agreement”) dated December 9, 2013, as amended, between each Fund, the Funds’ custodian, and BNP. As of October 31, 2016, the Pledge Agreement was assigned from BNP to BNP Paribas Prime Brokerage International, Ltd. Per the Pledge Agreement, borrowings under the Agreement are secured by assets of each Fund that are held by the Fund’s custodian in a separate account (the “pledged collateral”). On April 30, 2024, the pledged collateral was valued at $55,582,152, $90,130,063 and $145,161,705 for the Clough Global Dividend and Income Fund, Clough Global Equity Fund and Clough Global Opportunities Fund, respectively. Each Fund may, with 30 days’ notice, reduce the Maximum Commitment Financing to the highest possible amount that, if fully drawn, would be in compliance with the applicable asset coverage requirement of Section 18 of the 1940 Act. Interest is charged at the Overnight Bank Funding Rate (“OBFR”) plus 0.80% on the amount borrowed.
The Maximum Commitment Financing allowed under the Agreement is the lower of the outstanding borrowings of Each Fund or $63,300,000, $139,500,000 and $257,000,000 for the Clough Global Dividend and Income Fund, Clough Global Equity Fund and the Clough Global Opportunities Fund, respectively. For the period ended April 30, 2024, the average borrowings outstanding for Clough Global Dividend and Income Fund, Clough Global Equity Fund and Clough Global Opportunities Fund under the agreement were $16,000,000, $29,000,000 and $52,000,000, respectively, and the average interest rate for the borrowings was 6.12%. As of April 30, 2024, the outstanding borrowings for Clough Global Dividend and Income Fund, Clough Global Equity Fund and Clough Global Opportunities Fund were $16,000,000, $29,000,000 and $52,000,000, respectively. The interest rate applicable to the borrowings of Clough Global Dividend and Income Fund, Clough Global Equity Fund and Clough Global Opportunities Fund on April 30, 2024, was 6.12%.
The Lending Agreement is a separate side-agreement between each Fund and BNP pursuant to which BNP may borrow a portion of the pledged collateral (the “Lent Securities”) in an amount not to exceed the outstanding borrowings owed by a Fund to BNP under the Agreement. The Lending Agreement is intended to permit each Fund to significantly reduce the cost of its borrowings under the Agreement. BNP has the ability to re-register the Lent Securities in its own name or in another name other than the Fund to pledge, re-pledge, sell, lend or otherwise transfer or use the collateral with all attendant rights of ownership. (It is each Fund’s understanding that BNP will perform due diligence to determine the creditworthiness of any party that borrows Lent Securities from BNP.) Each Fund may designate any security within the pledged collateral as ineligible to be a Lent Security, provided there are eligible securities within the pledged collateral in an amount equal to the outstanding borrowing owed by a Fund. During the year in which the Lent Securities are outstanding, BNP must remit payment to each Fund equal to the amount of all dividends, interest or other distributions earned or made by the Lent Securities.
Under the terms of the Lending Agreement, the Lent Securities are marked to market daily, and if the value of the Lent Securities exceeds the value of the then-outstanding borrowings owed by a Fund to BNP under the Agreement (the “Current Borrowings”), BNP must, on that day, either (1) return Lent Securities to each Fund’s custodian in an amount sufficient to cause the value of the outstanding Lent Securities to equal the Current Borrowings; or (2) post cash collateral with each Fund’s custodian equal to the difference between the value of the Lent Securities and the value of the Current Borrowings. If BNP fails to perform either of these actions as required, each Fund will recall securities, as discussed below, in an amount sufficient to cause the value of the outstanding Lent Securities to equal the Current Borrowings. Each Fund can recall any of the Lent Securities and BNP shall, to the extent commercially possible, return such security or equivalent security to each Fund’s custodian no later than three business days after such request. If a Fund recalls a Lent Security pursuant to the Lending Agreement, and BNP fails to return the Lent Securities or equivalent securities in a timely fashion, BNP shall remain liable for the ultimate delivery to each Fund’s custodian of such Lent Securities, or equivalent securities, and for any buy-in costs that the executing broker for the sales transaction may impose with respect to the failure to deliver. Should the borrower of the securities fail financially, the Funds have the right to reduce the outstanding amount of the Current Borrowings against which the pledged collateral has been secured. Although risk is mitigated by the collateral, the Funds could experience a delay in recovering their securities and possible loss of income or value if the borrower fails to return the borrowed securities. Under the terms of the Lending Agreement, each Fund shall have the right to apply and set-off an amount equal to one hundred percent (100%) of the then current fair value of such Lent Securities against the Current Borrowings. As of April 30, 2024, the value of the Lent Securities for Clough Global Dividend and Income Fund, Clough Global Equity Fund and Clough Global Opportunities Fund were $13,817,407, $25,663,464, and $47,502,835, respectively.
41
Clough Global Funds
NOTES TO FINANCIAL STATEMENTS
April 30, 2024 (Continued) (Unaudited)
NOTE 7 - SUBSEQUENT EVENT
On June 4, 2024, each Board of the Funds, advised by Clough, announced that each Fund has renewed its share repurchase program under which it may purchase, through June 30, 2025, up to 5% of its outstanding common shares in open market transactions.
42
Clough Global Funds
DIVIDEND REINVESTMENT PLAN
April 30, 2024 (Unaudited)
Unless the registered owner of Common Shares elects to receive cash by contacting SS&C Global Investor & Distribution Solutions, Inc. (“SS&C GIDS”) (the “Plan Administrator”), all dividends declared on Common Shares will be automatically reinvested by the Plan Administrator for shareholders in each Fund’s Dividend Reinvestment Plan (the “Plan”), in additional Common Shares. Shareholders who elect not to participate in the Plan will receive all dividends and other distributions in cash paid by check mailed directly to the shareholder of record (or, if the Common Shares are held in street or other nominee name, then to such nominee) by the Plan Administrator as dividend disbursing agent. You may elect not to participate in the Plan and to receive all dividends in cash by contacting the Plan Administrator, as dividend disbursing agent, at the address set forth below. Participation in the Plan is completely voluntary and may be terminated or resumed at any time without penalty by notice if received and processed by the Plan Administrator prior to the dividend record date; otherwise such termination or resumption will be effective with respect to any subsequently declared dividend or other distribution. Some brokers may automatically elect to receive cash on your behalf and may re–invest that cash in additional Common Shares for you. If you wish for all dividends declared on your Common Shares to be automatically reinvested pursuant to the Plan, please contact your broker.
The Plan Administrator will open an account for each Common Shareholder under the Plan in the same name in which such Common Shareholder’s Common Shares are registered. Whenever a Fund declares a dividend or other distribution (together, a “Dividend”) payable in cash, non–participants in the Plan will receive cash and participants in the Plan will receive the equivalent in Common Shares. The Common Shares will be acquired by the Plan Administrator for the participants’ accounts, depending upon the circumstances described below, either (i) through receipt of additional unissued but authorized Common Shares from a Fund (“Newly Issued Common Shares”) or (ii) by purchase of outstanding Common Shares on the open market (“Open–Market Purchases”) on the American Stock Exchange or elsewhere. If, on the payment date for any Dividend, the closing market price plus estimated brokerage commissions per Common Share is equal to or greater than the net asset value per Common Share, the Plan Administrator will invest the Dividend amount in Newly Issued Common Shares on behalf of the participants. The number of Newly Issued Common Shares to be credited to each participant’s account will be determined by dividing the dollar amount of the Dividend by the net asset value per Common Share on the payment date; provided that, if the net asset value is less than or equal to 95% of the closing market value on the payment date, the dollar amount of the Dividend will be divided by 95% of the closing market price per Common Share on the payment date. If, on the payment date for any Dividend, the net asset value per Common Share is greater than the closing market value plus estimated brokerage commissions, the Plan Administrator will invest the Dividend amount in Common Shares acquired on behalf of the participants in Open–Market Purchases. In the event of a market discount on the payment date for any Dividend, the Plan Administrator will have until the last business day before the next date on which the Common Shares trade on an “ex–dividend” basis or 30 days after the payment date for such Dividend, whichever is sooner (the “Last Purchase Date”), to invest the Dividend amount in Common Shares acquired in Open–Market Purchases. If, before the Plan Administrator has completed its Open–Market Purchases, the market price per Common Share exceeds the net asset value per Common Share, the average per Common Share purchase price paid by the Plan Administrator may exceed the net asset value of the Common Shares, resulting in the acquisition of fewer Common Shares than if the Dividend had been paid in Newly Issued Common Shares on the Dividend payment date. Because of the foregoing difficulty with respect to Open–Market Purchases, the Plan provides that if the Plan Administrator is unable to invest the full Dividend amount in Open–Market Purchases during the purchase period or if the market discount shifts to a market premium during the purchase period, the Plan Administrator may cease making Open–Market Purchases and may invest the uninvested portion of the Dividend amount in Newly Issued Common Shares at the net asset value per Common Share at the close of business on the Last Purchase Date provided that, if the net asset value is less than or equal to 95% of the then current market price per Common Share; the dollar amount of the Dividend will be divided by 95% of the market price on the payment date.
The Plan Administrator maintains all shareholders’ accounts in the Plan and furnishes written confirmation of all transactions in the accounts, including information needed by shareholders for tax records. Common Shares in the account of each Plan participant will be held by the Plan Administrator on behalf of the Plan participant, and each shareholder proxy will include those shares purchased or received pursuant to the Plan. The Plan Administrator will forward all proxy solicitation materials to participants and vote proxies for shares held under the Plan in accordance with the instructions of the participants.
In the case of Common Shareholders such as banks, brokers or nominees which hold shares for others who are the beneficial owners, the Plan Administrator will administer the Plan on the basis of the number of Common Shares certified from time to time by the record shareholder’s name and held for the account of beneficial owners who participate in the Plan.
There will be no brokerage charges with respect to Common Shares issued directly by a Fund. However, each participant will pay a pro rata share of brokerage commissions incurred in connection with Open–Market Purchases. The automatic reinvestment of Dividends will not relieve participants of any federal, state or local income tax that may be payable (or required to be withheld) on such Dividends. Participants that request a sale of Common Shares through the Plan Administrator are subject to brokerage commissions.
Each Fund reserves the right to amend or terminate the Plan. There is no direct service charge to participants with regard to purchases in the Plan; however, each Fund reserves the right to amend the Plan to include a service charge payable by the participants.
All correspondence or questions concerning the Plan should be directed to the Plan Administrator, SS&C Global Investor & Distribution Solutions, Inc., 430 W 7th Street Kansas City, MO 64105.
43
Clough Global Funds
ADDITIONAL INFORMATION
April 30, 2024 (Unaudited)
FUND PROXY VOTING POLICIES AND PROCEDURES
Each Fund’s policies and procedures used in determining how to vote proxies relating to portfolio securities are available without charge, on the Funds’ website at http://www.cloughcefs.com, on the Commission’s website at http://www.sec.gov or by contacting the Funds at 1-855-425-6844. Information regarding how each Fund voted proxies relating to portfolio securities held by each Fund for the period ended June 30, are available without charge, on the Funds’ website at http:// www.cloughcefs.com, on the Commission’s website at http://www.sec.gov or by contacting the Funds at 1-855-425-6844.
PORTFOLIO HOLDINGS
The Funds file their complete schedule of portfolio holdings with the Commission for each fiscal quarter on Form N-PORT within 60 days after the end of the period. Copies of the Funds’ Form N-PORT are available without a charge on the Funds’ website at http://www.cloughcefs.com, by contacting the Funds at 1- 855-425-6844 and on the Commission’s website at http://www.sec.gov.
NOTICE
Notice is hereby given in accordance with Section 23(c) of the Investment Company Act of 1940 that each Fund may purchase at market prices from time to time shares of its common stock in the open market.
SECTION 19(A) NOTICES
The following table sets forth the estimated amount of the sources of distribution for purposes of Section 19 of the Investment Company Act of 1940, as amended, and the related rules adopted there under. Each Fund estimates the following percentages, of the total distribution amount per share, attributable to (i) current and prior fiscal year net investment income, (ii) net realized short-term capital gain, (iii) net realized long-term capital gain and (iv) return of capital or other capital source as a percentage of the total distribution amount. These percentages are disclosed for the fiscal year-to-date cumulative distribution amount per share for each Fund.
The amounts and sources of distributions reported in these 19(a) notices are only estimates and not for tax reporting purposes. The actual amounts and sources of the amounts for tax reporting purposes will depend upon the Fund’s investment experience during the remainder of its fiscal year and may be subject to changes based on tax regulations. The Fund will send you a Form 1099-DIV for the calendar year that will tell you how to report these distributions for federal income tax purposes.
| Total
Cumulative Distributions for the six months ended April 30, 2024 | %
Breakdown of the Total Cumulative Distributions for the six months ended April 30, 2024 | |||||||||||||||||||||||||||||||
Net Investment | Net Realized Capital Gains | Return of Capital | Total
Per Common Share | Net Investment Income | Net
Realized Gains | Return of Capital | Total
Per Common Share | |||||||||||||||||||||||||
| Clough Global Dividend and Income Fund | $ | 0.04527 | $ | – | $ | 0.28453 | $ | 0.32980 | 13.73 | % | – | 86.27 | % | 100.00 | % | |||||||||||||||||
| Clough Global Equity Fund | $ | 0.00378 | $ | – | $ | 0.35722 | $ | 0.36100 | 1.05 | % | – | 98.95 | % | 100.00 | % | |||||||||||||||||
| Clough Global Opportunities Fund | $ | 0.00771 | $ | – | $ | 0.28089 | $ | 0.28860 | 2.67 | % | – | 97.33 | % | 100.00 | % | |||||||||||||||||
Each Fund’s dividend policy is to distribute all or a portion of its net investment income to its shareholders on a monthly basis. In order to provide shareholders with a more stable level of dividend distributions, each Fund may at times pay out less than the entire amount of net investment income earned in any particular month and may at times in any particular month pay out such accumulated but undistributed income in addition to net investment income earned in that month. As a result, the dividends paid by each Fund for any particular month may be more or less than the amount of net investment income earned by the Fund during such month. Each Fund’s current accumulated but undistributed net investment income, if any, is disclosed in the Statements of Assets and Liabilities, which comprises part of the financial information included in this report.
You should not draw any conclusions about each Fund’s investment performance from the amount of the distributions or from the terms of each Fund’s plan.
44
Clough Global Funds
INVESTMENT ADVISORY AGREEMENT APPROVAL
April 30, 2024 (Unaudited)
On April 25, 2024, the Board of Trustees (the “Board” or the “Trustees”) of each of Clough Global Dividend and Income Fund (“GLV”), Clough Global Equity Fund (“GLQ”) and Clough Global Opportunities Fund (“GLO” and together with GLV and GLQ, each, a “Fund” and collectively, the “Funds”) met to, among other things, review and consider the renewal of the Investment Advisory Agreements between each Fund and Clough Capital Partners L.P. (“Clough” or “Clough Capital”) (each, an “Advisory Agreement” and collectively, the “Advisory Agreements”). During their review of each Advisory Agreement, the Trustees, including the Trustees who are not “interested persons” of the Fund (the “Independent Trustees”), as that term is defined in the Investment Company Act of 1940, as amended (the “1940 Act”), considered all factors that it believed to be relevant, including those discussed below. The Board did not identify any one factor as dispositive and each Board member may have attributed different weights to the factors considered.
Prior to the beginning of their review of the Advisory Agreements, counsel to the Funds, who also serves as independent counsel to the Independent Trustees, discussed with the Trustees their role and fiduciary responsibilities in general and also specifically under the 1940 Act with respect to the renewal of each Advisory Agreement.
Representatives from Clough discussed Clough’s materials relating to the Trustees’ consideration of renewal of the Advisory Agreements. It was noted that included in the Board materials were responses by Clough to a request letter prepared by legal counsel on behalf of the Independent Trustees to assist the Board in evaluating whether to renew the Advisory Agreements (the “15(c) Materials”). It was also noted that the 15(c) Materials were extensive and included information relating to: each Fund’s investment results; portfolio composition; advisory fee and expense comparisons and profitability to Clough; financial information regarding Clough; descriptions of policies, including compliance monitoring and portfolio trading practices; information about the personnel providing investment management services to the Funds; and the nature of services provided under each Advisory Agreement. In addition, the Independent Trustees considered information provided to them at prior Board meetings in presentations from Clough Capital representatives.
The Board considered the organizational structure and business operations of Clough. The Board also considered the qualifications of Clough and its principals to act as each Fund’s investment adviser. The Board considered the professional experience of the portfolio managers, Charles I. Clough, Jr., and William Whelan (the “Portfolio Managers”), emphasizing that the Portfolio Managers had substantial experience as investment professionals. The Trustees acknowledged their familiarity with the expertise and standing in the investment community of the Portfolio Managers and their satisfaction with the expertise of Clough and the services provided by Clough to the Funds. The Trustees concluded that the portfolio management team was well qualified to serve the Funds in those functions.
The Board considered various investment products managed by Clough other than the Funds. The Board also considered the adequacy of Clough’s facilities. The Trustees concluded that Clough appeared to have adequate procedures and personnel in place to ensure compliance by Clough with applicable law and with each Fund’s investment objectives and restrictions.
The Board considered materials regarding the comparability of the investment advisory fees of the Funds with the investment advisory fees of other comparable investment companies (each a “Peer Group”), which had been prepared by FUSE Research (“FUSE”). The Trustees considered the fees charged by Clough to other clients for which it provides comparable services, Clough’s balance sheet for the year ended December 31, 2023, and a profit and loss analysis as it relates to Clough’s advisory business.
The Board considered Clough’s compliance program and its operations. The Board further considered information provided by Clough on whether Clough has experienced or anticipates it may experience conflicts of interest in managing the Funds. The Board considered that the materials contained information regarding Clough’s business continuity and disaster recovery plans as well as steps Clough has undertaken to reasonably detect and prevent cybersecurity crimes. The Board also considered information related to Clough’s trading activities and how Clough monitors best execution. The Board considered the possible benefits Clough may accrue because of its relationship with the Funds as well as potential benefits that accrue to the Funds because of their relationship with Clough. The Board noted that, other than soft dollar arrangements, Clough does not realize any direct benefits due to the allocation of brokerage and related transactions on behalf of the Funds.
The Board considered information in the FUSE report regarding each Fund’s investment performance as compared to the performance during similar periods of other funds in its applicable Peer Group. The Trustees further considered each Fund’s performance as compared to the performance of each Fund’s Peer Group funds for various periods ended February 29, 2024, noting each Fund’s performance across a range of market cycles.
The Board considered the limitations of performance comparisons to the Peer Group funds, noting these comparisons may be affected by a number of factors, including different investment policies and limitations applicable to the Funds as compared to the Peer Group funds, as well as the specific periods being reviewed. The Board also considered each Fund’s performance in light of a range of market conditions.
The Board took into consideration that the Funds were relatively unique in the registered fund marketplace, noting that FUSE had selected the Peer Group funds from other leveraged closed-end funds with global equity or global allocation mandates. The Board also noted that only one of the Peer Group funds employed a long/short strategy similar to the Funds.
The Board reviewed the cost and expense structures of each Fund with the cost and expense structures of other funds in the relevant Fund’s Peer Group. The Board noted the extent to which each Fund utilizes leverage and short sales, thereby increasing its investment-related expenses, noting that the use of leverage and short sales were an important part of each Fund’s investment strategy. The Board recognized that the Funds’ use of these strategies led to higher investment expenses than the Peer Group funds, limiting the relevance of the net expense comparison to the Peer Group funds. Accordingly, the Board agreed that the contractual advisory fee comparisons in the FUSE report provided more relevant comparisons to the Funds.
The Trustees also considered profitability information on each Fund provided by Clough. The Board agreed that economies of scale were unlikely to occur due to the Funds’ closed-end fund structure and complexity of the Funds’ strategy.
The Independent Trustees met in executive session and with the assistance of legal counsel reviewed and discussed in more detail the information that had been presented relating to Clough, the Advisory Agreements and Clough’s profitability.
45
Clough Global Funds
INVESTMENT ADVISORY AGREEMENT APPROVAL
April 30, 2024 (Continued) (Unaudited)
After executive session, the Board of each Fund, present in person, with the Independent Trustees present in person voting separately, unanimously concluded that each Fund’s investment advisory fee was fair and reasonable in light of the services rendered and that the renewal of each Advisory Agreement was in the best interests of each respective Fund and its shareholders.
46

INVESTMENT ADVISOR
Clough Capital Partners L.P.
53 State Street, 27th Floor
Boston, MA 02109
INDEPENDENT REGISTERED PUBLIC ACCOUNTING FIRM
Cohen & Company, Ltd.
1350 Euclid Avenue, Suite 800
Cleveland, OH 44115
LEGAL COUNSEL
K&L Gates LLP
1601 K Street NW
Washington DC 20006
ADMINISTRATOR AND ACCOUNTANT
Paralel Technologies LLC
1700 Broadway, Suite 1850
Denver, CO 80290
TRANSFER AGENT AND DIVIDEND DISBURSING AGENT
SS&C
Global Investor & Distribution Solutions, Inc.
430 W 7th Street
Kansas City, MO 64105
CUSTODIAN
State Street Bank and Trust
One Congress Street, Suite 1
Boston, MA 02114-2016
Must be accompanied or preceded by a prospectus.
47
(b) Not applicable.
Item 2. Code of Ethics.
Not applicable to semi-annual report.
Item 3. Audit Committee Financial Expert.
Not applicable to semi-annual report.
Item 4. Principal Accountant Fees and Services.
Not applicable to semi-annual report.
Item 5. Audit Committee of Listed Registrants.
Not applicable to semi-annual report.
Item 6. Investments.
| (a) | Schedule I – Investments in securities of unaffiliated issuers is included as part of the Report to Stockholders filed under Item 1(a) of this form. |
| (b) | Not applicable to the Registrant. |
Item 7. Disclosure of Proxy Voting Policies and Procedures for Closed-End Management Investment Companies.
Not applicable to semi-annual report.
Item 8. Portfolio Managers of Closed-End Management Investment Companies.
No changes have occurred that require reporting under this Item 8.
Item 9. Purchases of Equity Securities by Closed-End Management Investment Companies and Affiliated Purchasers.
| Period | Total Number of Shares (or Units) Purchased | Average Price Paid per Share (or Unit) | Total Number of Shares (or Units) Purchased as Part of Publicly Announced Plans or Programs | Maximum Number (or Approximate Dollar Value) of Shares (or Units) that May Yet Be Purchased Under the Plans or Programs |
| 11/1/23 - 11/30/23 | - | N/A | - | N/A |
| 12/1/23 - 12/31/23 | - | N/A | - | N/A |
| 1/1/24 - 1/31/24 | 3,000 | 4.65 | 3,000 | N/A |
| 2/1/24 - 2/29/24 | 3,000 | 4.93 | 3,000 | N/A |
| 3/1/24 - 3/31/24 | 11,998 | 5.02 | 11,998 | N/A |
| 4/1/24 - 4/30/24 | 16,500 | 5.00 | 16,500 | N/A |
The Registrant implemented a share repurchase program beginning June 5, 2023 for a period of one year, whereby the Registrant could repurchase up to 5% of the Fund’s outstanding shares. All repurchases in the table above occurred pursuant to the program.
Upon the expiration of the program, the repurchase program was renewed for an additional period through June 30, 2024 for an additional 5% of the Fund’s outstanding shares.
Item 10. Submission of Matters to a Vote of Security Holders.
There have been no material changes by which shareholders may recommend nominees to the Board of Trustees.
Item 11. Controls and Procedures.
| (a) | The Registrant’s principal executive officer and principal financial officer have concluded that the Registrant’s disclosure controls and procedures (as defined in Rule 30a-3(c) under the Investment Company Act of 1940, as amended) are effective based on their evaluation of these controls and procedures as of a date within 90 days of the filing date of this document. |
| (b) | There was no change in the Registrant's internal control over financial reporting (as defined in Rule 30a-3(d) under the Investment Company Act of 1940, as amended) during the period covered by this report that has materially affected, or is reasonably likely to materially affect, the Registrant's internal control over financial reporting. |
Item 12. Disclosure of Securities Lending Activities for Closed-End Management Investment Companies.
Not applicable to semi-annual report.
Item 13. Exhibits.
(a)(1) Not applicable to semi-annual report.
SIGNATURES
Pursuant to the requirements of the Securities Exchange Act of 1934 and the Investment Company Act of 1940, the Registrant has duly caused this report to be signed on its behalf by the undersigned, thereunto duly authorized.
CLOUGH GLOBAL OPPORTUNITIES FUND
| By: | /s/ Jeremy May | |
| Jeremy May | ||
| President/Principal Executive Officer | ||
| Date: | July 3, 2024 |
Pursuant to the requirements of the Securities Exchange Act of 1934 and the Investment Company Act of 1940, this report has been signed below by the following persons on behalf of the Registrant and in the capacities and on the dates indicated.
CLOUGH GLOBAL OPPORTUNITIES FUND
| By: | /s/ Jeremy May | |
| Jeremy May | ||
| President/Principal Executive Officer | ||
| Date: | July 3, 2024 |
| By: | /s/ Jill Kerschen | |
| Jill Kerschen | ||
| Treasurer/Principal Financial Officer | ||
| Date: | July 3, 2024 |