2021Q3false0001349436--12-31P3Y00013494362021-01-012021-09-30xbrli:shares00013494362021-11-04iso4217:USD00013494362021-09-3000013494362020-12-31iso4217:USDxbrli:shares0001349436us-gaap:OilAndGasMember2021-07-012021-09-300001349436us-gaap:OilAndGasMember2020-07-012020-09-300001349436us-gaap:OilAndGasMember2021-01-012021-09-300001349436us-gaap:OilAndGasMember2020-01-012020-09-300001349436sd:OtherRevenueSourceMember2021-07-012021-09-300001349436sd:OtherRevenueSourceMember2020-07-012020-09-300001349436sd:OtherRevenueSourceMember2021-01-012021-09-300001349436sd:OtherRevenueSourceMember2020-01-012020-09-3000013494362021-07-012021-09-3000013494362020-07-012020-09-3000013494362020-01-012020-09-300001349436us-gaap:CommonStockMember2020-12-310001349436us-gaap:WarrantMember2020-12-310001349436us-gaap:AdditionalPaidInCapitalMember2020-12-310001349436us-gaap:RetainedEarningsMember2020-12-310001349436us-gaap:CommonStockMember2021-01-012021-03-310001349436us-gaap:AdditionalPaidInCapitalMember2021-01-012021-03-3100013494362021-01-012021-03-310001349436us-gaap:WarrantMember2021-01-012021-03-310001349436us-gaap:RetainedEarningsMember2021-01-012021-03-310001349436us-gaap:CommonStockMember2021-03-310001349436us-gaap:WarrantMember2021-03-310001349436us-gaap:AdditionalPaidInCapitalMember2021-03-310001349436us-gaap:RetainedEarningsMember2021-03-3100013494362021-03-310001349436us-gaap:CommonStockMember2021-04-012021-06-300001349436us-gaap:AdditionalPaidInCapitalMember2021-04-012021-06-3000013494362021-04-012021-06-300001349436us-gaap:RetainedEarningsMember2021-04-012021-06-300001349436us-gaap:CommonStockMember2021-06-300001349436us-gaap:WarrantMember2021-06-300001349436us-gaap:AdditionalPaidInCapitalMember2021-06-300001349436us-gaap:RetainedEarningsMember2021-06-3000013494362021-06-300001349436us-gaap:AdditionalPaidInCapitalMember2021-07-012021-09-300001349436us-gaap:CommonStockMember2021-07-012021-09-300001349436us-gaap:CommonStockMember2021-09-300001349436us-gaap:WarrantMember2021-09-300001349436us-gaap:AdditionalPaidInCapitalMember2021-09-300001349436us-gaap:RetainedEarningsMember2021-09-300001349436us-gaap:CommonStockMember2019-12-310001349436us-gaap:WarrantMember2019-12-310001349436us-gaap:AdditionalPaidInCapitalMember2019-12-310001349436us-gaap:RetainedEarningsMember2019-12-3100013494362019-12-310001349436us-gaap:CommonStockMember2020-01-012020-03-310001349436us-gaap:AdditionalPaidInCapitalMember2020-01-012020-03-3100013494362020-01-012020-03-310001349436us-gaap:WarrantMember2020-01-012020-03-310001349436us-gaap:RetainedEarningsMember2020-01-012020-03-310001349436us-gaap:CommonStockMember2020-03-310001349436us-gaap:WarrantMember2020-03-310001349436us-gaap:AdditionalPaidInCapitalMember2020-03-310001349436us-gaap:RetainedEarningsMember2020-03-3100013494362020-03-310001349436us-gaap:CommonStockMember2020-04-012020-06-300001349436us-gaap:AdditionalPaidInCapitalMember2020-04-012020-06-3000013494362020-04-012020-06-300001349436us-gaap:RetainedEarningsMember2020-04-012020-06-300001349436us-gaap:CommonStockMember2020-06-300001349436us-gaap:WarrantMember2020-06-300001349436us-gaap:AdditionalPaidInCapitalMember2020-06-300001349436us-gaap:RetainedEarningsMember2020-06-3000013494362020-06-300001349436us-gaap:CommonStockMember2020-07-012020-09-300001349436us-gaap:AdditionalPaidInCapitalMember2020-07-012020-09-300001349436us-gaap:RetainedEarningsMember2020-07-012020-09-300001349436us-gaap:CommonStockMember2020-09-300001349436us-gaap:WarrantMember2020-09-300001349436us-gaap:AdditionalPaidInCapitalMember2020-09-300001349436us-gaap:RetainedEarningsMember2020-09-3000013494362020-09-300001349436us-gaap:FairValueInputsLevel1Memberus-gaap:CommodityContractMemberus-gaap:FairValueMeasurementsRecurringMember2021-09-300001349436us-gaap:CommodityContractMemberus-gaap:FairValueMeasurementsRecurringMemberus-gaap:FairValueInputsLevel2Member2021-09-300001349436us-gaap:CommodityContractMemberus-gaap:FairValueMeasurementsRecurringMemberus-gaap:FairValueInputsLevel3Member2021-09-300001349436us-gaap:CommodityContractMemberus-gaap:FairValueMeasurementsRecurringMemberus-gaap:FairValueMeasuredAtNetAssetValuePerShareMember2021-09-300001349436us-gaap:CommodityContractMemberus-gaap:FairValueMeasurementsRecurringMember2021-09-300001349436us-gaap:CommodityContractMember2021-07-012021-09-300001349436us-gaap:CommodityContractMember2020-07-012020-09-300001349436us-gaap:CommodityContractMember2021-01-012021-09-300001349436us-gaap:CommodityContractMember2020-01-012020-09-30utr:gal0001349436sd:NGLPriceSwapsOctober2021ToFebruary2022Member2021-01-012021-09-30iso4217:USDsd:Unit0001349436sd:NGLPriceSwapsOctober2021ToFebruary2022Member2021-09-30utr:MMBTU0001349436sd:NaturalGasPriceSwapsOctober2021ToFebruary2022Member2021-01-012021-09-300001349436sd:NaturalGasPriceSwapsOctober2021ToFebruary2022Member2021-09-300001349436sd:DerivativeContractsCurrentMembersd:NGLPriceSwapsOctober2021ToFebruary2022Member2021-09-300001349436sd:NaturalGasPriceSwapsOctober2021ToFebruary2022Membersd:DerivativeContractsCurrentMember2021-09-300001349436us-gaap:LandMember2021-09-300001349436us-gaap:LandMember2020-12-310001349436us-gaap:ElectricTransmissionAndDistributionMember2021-09-300001349436us-gaap:ElectricTransmissionAndDistributionMember2020-12-310001349436us-gaap:OtherCapitalizedPropertyPlantAndEquipmentMember2021-09-300001349436us-gaap:OtherCapitalizedPropertyPlantAndEquipmentMember2020-12-310001349436us-gaap:BuildingMember2021-09-300001349436us-gaap:BuildingMember2020-12-31iso4217:USDutr:bblutr:MMcf0001349436sd:CorporateHeadquartersBuildingMemberus-gaap:DisposalGroupHeldforsaleNotDiscontinuedOperationsMember2020-01-012020-09-300001349436sd:CorporateHeadquartersBuildingMemberus-gaap:DisposalGroupHeldforsaleNotDiscontinuedOperationsMember2020-06-302020-06-300001349436sd:RoyaltyInterestOfSandRidgeMississippianTrustIMember2021-04-222021-04-22xbrli:pure0001349436sd:SandRidgeEnergyIncMembersd:RoyaltyInterestOfSandRidgeMississippianTrustIMember2021-04-220001349436sd:RoyaltyInterestOfSandRidgeMississippianTrustIIMember2021-09-102021-09-100001349436sd:SandRidgeEnergyIncMembersd:RoyaltyInterestOfSandRidgeMississippianTrustIIMember2021-09-100001349436us-gaap:DisposalGroupHeldforsaleNotDiscontinuedOperationsMembersd:NorthParkBasinColoradoMember2021-02-050001349436us-gaap:DisposalGroupHeldforsaleNotDiscontinuedOperationsMembersd:NorthParkBasinColoradoMember2021-02-052021-02-050001349436us-gaap:DisposalGroupHeldforsaleNotDiscontinuedOperationsMembersd:NorthParkBasinColoradoMember2021-07-012021-09-300001349436us-gaap:DisposalGroupHeldforsaleNotDiscontinuedOperationsMembersd:NorthParkBasinColoradoMember2021-01-012021-09-300001349436us-gaap:SalesRevenueNetMemberus-gaap:RevenueFromRightsConcentrationRiskMemberus-gaap:DisposalGroupHeldforsaleNotDiscontinuedOperationsMembersd:NorthParkBasinColoradoMember2021-01-012021-09-300001349436sd:ConsolidatedLeaseOperatingExpenseMemberus-gaap:RevenueFromRightsConcentrationRiskMemberus-gaap:DisposalGroupHeldforsaleNotDiscontinuedOperationsMembersd:NorthParkBasinColoradoMember2021-01-012021-09-30utr:MMBoe0001349436sd:ConsolidatedProductionMemberus-gaap:RevenueFromRightsConcentrationRiskMemberus-gaap:DisposalGroupHeldforsaleNotDiscontinuedOperationsMembersd:NorthParkBasinColoradoMember2021-01-012021-09-300001349436us-gaap:DisposalGroupHeldforsaleNotDiscontinuedOperationsMembersd:NorthParkBasinColoradoMember2020-07-012020-09-300001349436us-gaap:SalesRevenueNetMemberus-gaap:RevenueFromRightsConcentrationRiskMemberus-gaap:DisposalGroupHeldforsaleNotDiscontinuedOperationsMembersd:NorthParkBasinColoradoMember2020-07-012020-09-300001349436sd:ConsolidatedLeaseOperatingExpenseMemberus-gaap:RevenueFromRightsConcentrationRiskMemberus-gaap:DisposalGroupHeldforsaleNotDiscontinuedOperationsMembersd:NorthParkBasinColoradoMember2020-07-012020-09-300001349436sd:ConsolidatedProductionAdValoremAndOtherTaxesMemberus-gaap:RevenueFromRightsConcentrationRiskMemberus-gaap:DisposalGroupHeldforsaleNotDiscontinuedOperationsMembersd:NorthParkBasinColoradoMember2020-07-012020-09-300001349436sd:ConsolidatedProductionMemberus-gaap:RevenueFromRightsConcentrationRiskMemberus-gaap:DisposalGroupHeldforsaleNotDiscontinuedOperationsMembersd:NorthParkBasinColoradoMember2020-07-012020-09-300001349436us-gaap:DisposalGroupHeldforsaleNotDiscontinuedOperationsMembersd:NorthParkBasinColoradoMember2020-01-012020-09-300001349436us-gaap:SalesRevenueNetMemberus-gaap:RevenueFromRightsConcentrationRiskMemberus-gaap:DisposalGroupHeldforsaleNotDiscontinuedOperationsMembersd:NorthParkBasinColoradoMember2020-01-012020-09-300001349436sd:ConsolidatedLeaseOperatingExpenseMemberus-gaap:RevenueFromRightsConcentrationRiskMemberus-gaap:DisposalGroupHeldforsaleNotDiscontinuedOperationsMembersd:NorthParkBasinColoradoMember2020-01-012020-09-300001349436sd:ConsolidatedProductionAdValoremAndOtherTaxesMemberus-gaap:RevenueFromRightsConcentrationRiskMemberus-gaap:DisposalGroupHeldforsaleNotDiscontinuedOperationsMembersd:NorthParkBasinColoradoMember2020-01-012020-09-300001349436sd:ConsolidatedProductionMemberus-gaap:RevenueFromRightsConcentrationRiskMemberus-gaap:DisposalGroupHeldforsaleNotDiscontinuedOperationsMembersd:NorthParkBasinColoradoMember2020-01-012020-09-300001349436sd:NewCreditFacilityMember2020-11-300001349436us-gaap:RevolvingCreditFacilityMemberus-gaap:RevolvingCreditFacilityMember2021-09-300001349436us-gaap:RevolvingCreditFacilityMemberus-gaap:RevolvingCreditFacilityMember2020-12-310001349436sd:NewCreditFacilityMemberus-gaap:LineOfCreditMember2021-09-300001349436sd:TermLoanMembersd:NewCreditFacilityMember2021-09-300001349436us-gaap:RevolvingCreditFacilityMemberus-gaap:RevolvingCreditFacilityMember2021-09-022021-09-020001349436us-gaap:RevolvingCreditFacilityMembersd:NewCreditFacilityMember2021-07-012021-09-300001349436us-gaap:RevolvingCreditFacilityMembersd:NewCreditFacilityMember2021-01-012021-09-300001349436srt:AffiliatedEntityMember2021-07-012021-09-300001349436srt:AffiliatedEntityMember2021-01-012021-09-300001349436us-gaap:DomesticCountryMember2021-09-300001349436srt:MinimumMember2021-01-012021-09-300001349436srt:MaximumMember2021-01-012021-09-300001349436us-gaap:RestrictedStockMember2021-09-300001349436us-gaap:RestrictedStockUnitsRSUMember2021-09-300001349436sd:SeriesAWarrantsMember2021-01-012021-09-300001349436sd:SeriesBWarrantsMember2021-01-012021-09-300001349436sd:SeriesAWarrantsMember2021-09-300001349436sd:SeriesBWarrantsMember2021-09-3000013494362021-08-160001349436sd:TheTaxBenefitsPreservationPlanMember2020-07-010001349436us-gaap:PreferredStockMembersd:TheTaxBenefitsPreservationPlanMember2020-07-0100013494362021-03-1600013494362021-03-162021-03-160001349436sd:TheTaxBenefitsPreservationPlanMember2021-03-16sd:swap0001349436srt:OilReservesMember2021-07-012021-09-300001349436srt:OilReservesMember2020-07-012020-09-300001349436srt:OilReservesMember2021-01-012021-09-300001349436srt:OilReservesMember2020-01-012020-09-300001349436srt:NaturalGasLiquidsReservesMember2021-07-012021-09-300001349436srt:NaturalGasLiquidsReservesMember2020-07-012020-09-300001349436srt:NaturalGasLiquidsReservesMember2021-01-012021-09-300001349436srt:NaturalGasLiquidsReservesMember2020-01-012020-09-300001349436srt:NaturalGasReservesMember2021-07-012021-09-300001349436srt:NaturalGasReservesMember2020-07-012020-09-300001349436srt:NaturalGasReservesMember2021-01-012021-09-300001349436srt:NaturalGasReservesMember2020-01-012020-09-300001349436sd:RevenueReceivableFromContractWithCustomersMember2021-09-300001349436sd:RevenueReceivableFromContractWithCustomersMember2020-12-310001349436sd:ExecutiveEmployeeTerminationBenefitsMember2021-07-012021-09-300001349436sd:OtherEmployeeTerminationBenefitsMember2021-07-012021-09-300001349436sd:ExecutiveEmployeeTerminationBenefitsMember2020-07-012020-09-300001349436sd:OtherEmployeeTerminationBenefitsMember2020-07-012020-09-300001349436sd:ExecutiveEmployeeTerminationBenefitsMember2021-01-012021-09-300001349436sd:OtherEmployeeTerminationBenefitsMember2021-01-012021-09-300001349436sd:ExecutiveEmployeeTerminationBenefitsMember2020-01-012020-09-300001349436sd:OtherEmployeeTerminationBenefitsMember2020-01-012020-09-300001349436us-gaap:RestrictedStockMember2021-01-012021-09-300001349436us-gaap:RestrictedStockMember2020-07-012020-09-300001349436us-gaap:EmployeeStockOptionMember2021-07-012021-09-300001349436us-gaap:WarrantMember2021-07-012021-09-300001349436us-gaap:WarrantMember2020-01-012020-09-300001349436us-gaap:EmployeeStockOptionMember2020-07-012020-09-300001349436us-gaap:PerformanceSharesMember2020-07-012020-09-300001349436us-gaap:RestrictedStockMember2021-07-012021-09-300001349436us-gaap:WarrantMember2021-01-012021-09-300001349436us-gaap:RestrictedStockMember2020-01-012020-09-300001349436us-gaap:PerformanceSharesMember2021-01-012021-09-300001349436us-gaap:EmployeeStockOptionMember2020-01-012020-09-300001349436us-gaap:WarrantMember2020-07-012020-09-300001349436us-gaap:EmployeeStockOptionMember2021-01-012021-09-300001349436us-gaap:PerformanceSharesMember2020-01-012020-09-300001349436us-gaap:PerformanceSharesMember2021-07-012021-09-300001349436us-gaap:RestrictedStockMember2021-01-012021-09-30
UNITED STATES
SECURITIES AND EXCHANGE COMMISSION
Washington, D.C. 20549
(Mark One) | | | | | |
| ☑ | QUARTERLY REPORT PURSUANT TO SECTION 13 OR 15(d) OF THE SECURITIES EXCHANGE ACT OF 1934 |
For the quarterly period ended September 30, 2021
OR | | | | | |
| ☐ | TRANSITION REPORT PURSUANT TO SECTION 13 OR 15(d) OF THE SECURITIES EXCHANGE ACT OF 1934 |
For the transition period from to
Commission File Number: 001-33784
| | | | | | | | |
| | |
| SANDRIDGE ENERGY, INC. |
| (Exact name of registrant as specified in its charter) |
| | |
| | | | | | | | |
| Delaware | | 20-8084793 |
(State or other jurisdiction of incorporation or organization) | | (I.R.S. Employer Identification No.) |
| | |
1 E. Sheridan Ave, Suite 500 Oklahoma City, Oklahoma | | 73104 |
(Address of principal executive offices) | | (Zip Code) |
Registrant’s telephone number, including area code: (405) 429-5500
Former name, former address and former fiscal year, if changed since last report: Not applicable
Securities registered pursuant to Section 12(b) of the Act: | | | | | | | | | | | | | | |
| Title of each class | | Trading Symbol | | Name of each exchange on which registered |
| Common Stock, $.001 par value | | SD | | New York Stock Exchange |
Indicate by check mark whether the registrant (1) has filed all reports required to be filed by Section 13 or 15 (d) of the Securities Exchange Act of 1934 during the preceding 12 months (or for such shorter period that the registrant was required to file such reports), and (2) has been subject to such filing requirements for the past 90 days. Yes þ No o
Indicate by check mark whether the registrant has submitted electronically every Interactive Data File required to be submitted pursuant to Rule 405 of Regulation S-T during the preceding 12 months (or for such shorter period that the registrant was required to submit such files). Yes ☑ No ☐
Indicate by check mark whether the registrant is a large accelerated filer, an accelerated filer, a non-accelerated filer, a smaller reporting company, or an emerging growth company. See the definitions of “large accelerated filer,” “accelerated filer,” “smaller reporting company,” and “emerging growth company” in Rule 12b-2 of the Exchange Act. | | | | | | | | | | | | | | |
| Large accelerated filer | ☐ | | Accelerated filer | ☐ |
| Non-accelerated filer | ☑
| | Smaller reporting company | ☑ |
| | | Emerging growth company | ☐ |
If an emerging growth company, indicate by check mark if the registrant has elected not to use the extended transition period for complying with any new or revised financial accounting standards provided pursuant to Section 13(a) of the Exchange Act. o
Indicate by check mark whether the registrant is a shell company (as defined in Rule 12b-2 of the Exchange Act). Yes ☐ No þ
Indicate by check mark whether the registrant has filed all documents and reports required to be filed by Sections 12, 13, or 15(d) of the Securities Exchange Act of 1934 subsequent to the distribution of securities under a plan confirmed by a court. Yes ☑ No o
The number of shares outstanding of the registrant’s common stock, par value $0.001 per share, as of the close of business on November 4, 2021, was 36,674,454.
References in this report to the “Company,” “SandRidge,” “we,” “our,” and “us” mean SandRidge Energy, Inc., including its consolidated subsidiaries and its proportionately consolidated share of SandRidge Mississippian Trust I and SandRidge Mississippian Trust II, (collectively, the “Royalty Trusts”).
DISCLOSURES REGARDING FORWARD-LOOKING STATEMENTS
This Quarterly Report on Form 10-Q (“Quarterly Report”) of the Company includes “forward-looking statements” as defined by the SEC. These forward-looking statements may include projections and estimates concerning our capital expenditures, liquidity, capital resources and debt profile, the timing and success of specific projects, the impact of the COVID-19 pandemic, the potential impact of international negotiations on the supply and demand of oil and gas, outcomes and effects of litigation, claims and disputes, elements of our business strategy, compliance with governmental regulation of the oil and natural gas industry, including environmental regulations, acquisitions and divestitures and the potential effects on our financial condition and other statements concerning our operations, financial performance and financial condition.
Forward-looking statements are generally accompanied by words such as “estimate,” “assume,” “target,” “project,” “predict,” “believe,” “expect,” “anticipate,” “potential,” “could,” “may,” “foresee,” “plan,” “goal,” “should,” “intend” or other words that convey the uncertainty of future events or outcomes. These forward-looking statements are based on certain assumptions and analyses based on our experience and perception of historical trends, current conditions and expected future developments as well as other factors we believe are appropriate under the circumstances. Such statements are not guarantees of future performance and actual results or developments may differ materially from those projected. The Company disclaims any obligation to update or revise these forward-looking statements unless required by law, and it cautions readers not to rely on them unduly. While we consider these expectations and assumptions to be reasonable, they are inherently subject to significant business, economic, competitive, regulatory and other risks, contingencies and uncertainties relating to, among other matters, the risks and uncertainties discussed in “Risk Factors” in Item 1A of the Company’s Annual Report on Form 10-K for the fiscal year ended December 31, 2020 (the “2020 Form 10-K”) and in Item 1A of this Quarterly Report.
SANDRIDGE ENERGY, INC. AND SUBSIDIARIES
FORM 10-Q
Quarter Ended September 30, 2021
INDEX
| | | | | | | | |
|
| | |
ITEM 1. | | |
| | |
| | |
| | |
| | |
| | |
ITEM 2. | | |
ITEM 3. | | |
ITEM 4. | | |
| | |
|
| | |
ITEM 1. | | |
ITEM 1A. | | |
ITEM 2. | | |
ITEM 3. | | |
| ITEM 4. | | |
| ITEM 5. | | |
ITEM 6. | | |
| | |
PART I. Financial Information
ITEM 1. Financial Statements
SANDRIDGE ENERGY, INC. AND SUBSIDIARIES
CONDENSED CONSOLIDATED BALANCE SHEETS (Unaudited)
(In thousands)
| | | | | | | | | | | |
| September 30,
2021 | | December 31, 2020 |
ASSETS | | | |
| Current assets | | | |
| Cash and cash equivalents | $ | 96,738 | | | $ | 22,130 | |
| Restricted cash - other | 2,264 | | | 6,136 | |
| Accounts receivable, net | 29,365 | | | 19,576 | |
| Prepaid expenses | 1,279 | | | 2,890 | |
| Other current assets | 80 | | | 80 | |
| Total current assets | 129,726 | | | 50,812 | |
| Oil and natural gas properties, using full cost method of accounting | | | |
| Proved | 1,442,972 | | | 1,463,950 | |
| Unproved | 12,905 | | | 17,964 | |
| Less: accumulated depreciation, depletion and impairment | (1,371,123) | | | (1,375,692) | |
| 84,754 | | | 106,222 | |
| Other property, plant and equipment, net | 98,951 | | | 103,118 | |
| Other assets | 358 | | | 680 | |
| Total assets | $ | 313,789 | | | $ | 260,832 | |
| | | | | | | | | | | |
| | | |
| LIABILITIES AND STOCKHOLDERS’ EQUITY | | | |
| Current liabilities | | | |
| Accounts payable and accrued expenses | $ | 46,778 | | | $ | 51,426 | |
| Derivative contracts | 4,129 | | | — | |
| Asset retirement obligation | 16,099 | | | 16,467 | |
| Other current liabilities | 600 | | | 984 | |
| Total current liabilities | 67,606 | | | 68,877 | |
| Long-term debt | — | | | 20,000 | |
| Asset retirement obligation | 36,339 | | | 40,701 | |
| Other long-term obligations | 1,727 | | | 3,188 | |
| Total liabilities | 105,672 | | | 132,766 | |
Commitments and contingencies (Note 9) | | | |
| Stockholders’ Equity | | | |
Common stock, $0.001 par value; 250,000 shares authorized; 36,674 issued and outstanding at September 30, 2021 and 35,928 issued and outstanding at December 31, 2020 | 37 | | | 36 | |
| Warrants | 88,520 | | | 88,520 | |
| Additional paid-in capital | 1,062,376 | | | 1,062,220 | |
| Accumulated deficit | (942,816) | | | (1,022,710) | |
| Total stockholders’ equity | 208,117 | | | 128,066 | |
| Total liabilities and stockholders’ equity | $ | 313,789 | | | $ | 260,832 | |
The accompanying notes are an integral part of these condensed consolidated financial statements.
SANDRIDGE ENERGY, INC. AND SUBSIDIARIES
CONDENSED CONSOLIDATED STATEMENTS OF OPERATIONS (Unaudited)
(In thousands, except per share data)
| | | | | | | | | | | | | | | | | | | | | | | |
| Three Months Ended September 30, | | Nine Months Ended September 30, |
| 2021 | | 2020 | | 2021 | | 2020 |
| Revenues | | | | | | | |
| Oil, natural gas and NGL | $ | 46,584 | | | $ | 27,547 | | | $ | 114,403 | | | $ | 84,134 | |
| Other | — | | | 129 | | | — | | | 526 | |
| Total revenues | 46,584 | | | 27,676 | | | 114,403 | | | 84,660 | |
| Expenses | | | | | | | |
| Lease operating expenses | 9,080 | | | 8,069 | | | 26,266 | | | 32,409 | |
| Production, ad valorem, and other taxes | 2,219 | | | 2,333 | | | 6,929 | | | 7,386 | |
| Depreciation and depletion — oil and natural gas | 2,092 | | | 7,525 | | | 6,790 | | | 45,728 | |
| Depreciation and amortization — other | 1,513 | | | 1,698 | | | 4,482 | | | 6,071 | |
| Impairment | — | | | 44,043 | | | — | | | 253,797 | |
| General and administrative | 2,229 | | | 2,493 | | | 6,841 | | | 12,290 | |
| Restructuring expenses | (1,696) | | | 1,199 | | | 614 | | | 1,643 | |
| Employee termination benefits | — | | | 3,184 | | | 49 | | | 8,431 | |
| (Gain) loss on derivative contracts | 4,129 | | | 5,299 | | | 4,129 | | | (7,168) | |
| (Gain) loss on sale of assets | 761 | | | (178) | | | (18,952) | | | (100) | |
| Other operating (income) expense, net | (202) | | | 62 | | | (315) | | | 369 | |
| Total expenses | 20,125 | | | 75,727 | | | 36,833 | | | 360,856 | |
| Income (loss) from operations | 26,459 | | | (48,051) | | | 77,570 | | | (276,196) | |
| Other income (expense) | | | | | | | |
| Interest expense, net | (256) | | | (569) | | | (387) | | | (1,653) | |
| Other income (expense), net | 2,396 | | | (129) | | | 2,711 | | | 5 | |
| Total other income (expense) | 2,140 | | | (698) | | | 2,324 | | | (1,648) | |
| Income (loss) before income taxes | 28,599 | | | (48,749) | | | 79,894 | | | (277,844) | |
| Income tax expense (benefit) | — | | | — | | | — | | | (646) | |
| Net income (loss) | $ | 28,599 | | | $ | (48,749) | | | $ | 79,894 | | | $ | (277,198) | |
| Net income (loss) per share | | | | | | | |
| Basic | $ | 0.78 | | | $ | (1.36) | | | $ | 2.20 | | | $ | (7.78) | |
| Diluted | $ | 0.77 | | | $ | (1.36) | | | $ | 2.15 | | | $ | (7.78) | |
| Weighted average number of common shares outstanding | | | | | | | |
| Basic | 36,577 | | | 35,783 | | | 36,318 | | | 35,649 | |
| Diluted | 36,996 | | | 35,783 | | | 37,200 | | | 35,649 | |
The accompanying notes are an integral part of these condensed consolidated financial statements.
SANDRIDGE ENERGY, INC. AND SUBSIDIARIES
CONDENSED CONSOLIDATED STATEMENT OF CHANGES IN STOCKHOLDERS’ EQUITY (Unaudited)
(In thousands)
| | | | | | | | | | | | | | | | | | | | | | | | | | | | | | | | | | | | | | | | | | | | | | |
| | Common Stock | | Warrants | | Additional Paid-In Capital | | | | Accumulated Deficit | | Total |
| | Shares | | Amount | | Shares | | Amount | | | | |
| Nine Months Ended September 30, 2021 | | | | | | | | | | | | | | | | |
Balance at December 31, 2020 | | 35,928 | | | $ | 36 | | | 6,734 | | | $ | 88,520 | | | $ | 1,062,220 | | | | | $ | (1,022,710) | | | $ | 128,066 | |
| Issuance of stock awards, net of cancellations | | 6 | | | — | | | — | | | — | | | — | | | | | — | | | — | |
| | | | | | | | | | | | | | | | |
| | | | | | | | | | | | | | | | |
| Stock-based compensation | | — | | | — | | | — | | | — | | | 236 | | | | | — | | | 236 | |
| Issuance of common stock for general unsecured claims | | 201 | | | — | | | — | | | — | | | — | | | | | — | | | — | |
| Issuance of warrants for general unsecured claims | | — | | | — | | | 247 | | | — | | | — | | | | | — | | | — | |
| Cash paid for tax obligations on vested stock awards | | — | | | — | | | — | | | — | | | (19) | | | | | — | | | (19) | |
| | | | | | | | | | | | | | | | |
Net income | | — | | | — | | | — | | | — | | | — | | | | | 35,043 | | | 35,043 | |
| Balance at March 31, 2021 | | 36,135 | | | $ | 36 | | | 6,981 | | | $ | 88,520 | | | $ | 1,062,437 | | | | | $ | (987,667) | | | $ | 163,326 | |
| Issuance of stock awards, net of cancellations | | 425 | | | 1 | | | — | | | — | | | (1) | | | | | — | | | — | |
| Stock options exercised and Stock-based compensation | | — | | | — | | | — | | | — | | | 584 | | | | | — | | | 584 | |
| | | | | | | | | | | | | | | | |
| | | | | | | | | | | | | | | | |
| Cash paid for tax obligations on vested stock awards | | — | | | — | | | — | | | — | | | (594) | | | | | — | | | (594) | |
Net income | | — | | | — | | | — | | | — | | | | | | | 16,252 | | | 16,252 | |
| Balance at June 30, 2021 | | 36,560 | | | $ | 37 | | | 6,981 | | | $ | 88,520 | | | $ | 1,062,426 | | | | | $ | (971,415) | | | $ | 179,568 | |
| Stock-based compensation | | — | | | — | | | — | | | — | | | 236 | | | | | — | | | 236 | |
| Issuance of stock awards, net of cancellations | | 114 | | | — | | | — | | | — | | | — | | | | | — | | | — | |
| Cash paid for tax obligations on vested stock awards | | — | | | — | | | — | | | — | | | (286) | | | | | — | | | (286) | |
Net income | | — | | | — | | | — | | | — | | | — | | | | | 28,599 | | | 28,599 | |
Balance at September 30, 2021 | | 36,674 | | | $ | 37 | | | 6,981 | | | $ | 88,520 | | | $ | 1,062,376 | | | | | $ | (942,816) | | | $ | 208,117 | |
| Nine Months Ended September 30, 2020 | | | | | | | | | | | | | | | | |
| Balance at December 31, 2019 | | 35,772 | | | $ | 36 | | | 6,659 | | | $ | 88,520 | | | $ | 1,059,253 | | | | | $ | (745,357) | | | $ | 402,452 | |
| | | | | | | | | | | | | | | | |
| | | | | | | | | | | | | | | | |
| Common stock issued for general unsecured claims | | 38 | | | — | | | — | | | — | | | — | | | | | — | | | — | |
| Stock-based compensation | | — | | | — | | | — | | | — | | | 185 | | | | | — | | | 185 | |
| Issuance of warrants for general unsecured claims | | — | | | — | | | 47 | | | — | | | — | | | | | — | | | — | |
| | | | | | | | | | | | | | | | |
| Cash paid for tax obligations on vested stock awards | | — | | | — | | | — | | | — | | | (1) | | | | | — | | | (1) | |
Net loss | | — | | | — | | | — | | | — | | | — | | | | | (12,670) | | | (12,670) | |
| Balance at March 31, 2020 | | 35,810 | | | $ | 36 | | | 6,706 | | | $ | 88,520 | | | $ | 1,059,437 | | | | | $ | (758,027) | | | $ | 389,966 | |
| Issuance of stock awards, net of cancellations | | 55 | | | — | | | — | | | — | | | — | | | | | — | | | — | |
| Stock-based compensation | | — | | | — | | | — | | | — | | | 583 | | | | | — | | | 583 | |
| Cash paid for tax obligations on vested stock awards | | — | | | — | | | — | | | — | | | (1) | | | | | — | | | (1) | |
Net loss | | — | | | — | | | — | | | — | | | — | | | | | (215,779) | | | (215,779) | |
| Balance at June 30, 2020 | | 35,865 | | | 36 | | | 6,706 | | | 88,520 | | | $ | 1,060,019 | | | | | $ | (973,806) | | | $ | 174,769 | |
| Issuance of stock awards, net of cancellations | | 41 | | | — | | | — | | | — | | | — | | | | | — | | | — | |
| Stock-based compensation | | — | | | — | | | — | | | — | | | 2,004 | | | | | — | | | 2,004 | |
| Cash paid for tax obligations on vested stock awards | | — | | | — | | | — | | | — | | | (62) | | | | | — | | | (62) | |
Net loss | | — | | | — | | | — | | | — | | | — | | | | | (48,749) | | | (48,749) | |
| Balance at September 30, 2020 | | 35,906 | | | 36 | | | 6,706 | | | 88,520 | | | $ | 1,061,961 | | | | | $ | (1,022,555) | | | $ | 127,962 | |
| | | | | | | | | | | | | | | | |
| | | | | | | | | | | | | | | | |
| | | | | | | | | | | | | | | | |
| | | | | | | | | | | | | | | | |
| | | | | | | | | | | | | | | | |
The accompanying notes are an integral part of these condensed consolidated financial statements.
SANDRIDGE ENERGY, INC. AND SUBSIDIARIES
CONDENSED CONSOLIDATED STATEMENTS OF CASH FLOWS (Unaudited)
(In thousands)
| | | | | | | | | | | |
| Nine Months Ended September 30, |
| 2021 | | 2020 |
| CASH FLOWS FROM OPERATING ACTIVITIES | | | |
| Net income (loss) | $ | 79,894 | | | $ | (277,198) | |
| Adjustments to reconcile net income (loss) to net cash provided by operating activities | | | |
| Provision for doubtful accounts | (2,329) | | | 469 | |
| Depreciation, depletion, and amortization | 11,272 | | | 51,799 | |
| Impairment | — | | | 253,797 | |
| Debt issuance costs amortization | 57 | | | 477 | |
| | | |
| Write off of debt issuance costs | 174 | | | — | |
| | | |
| | | |
| | | |
| (Gain) loss on derivative contracts | 4,129 | | | (7,168) | |
| Cash received on settlement of derivative contracts | — | | | 11,197 | |
| | | |
| | | |
| (Gain) loss on sale of assets | (18,952) | | | (100) | |
| Stock-based compensation | 1,036 | | | 2,753 | |
| Other | 107 | | | 114 | |
| Changes in operating assets and liabilities | (9,073) | | | (8,784) | |
| Net cash provided by (used in) operating activities | 66,315 | | | 27,356 | |
| CASH FLOWS FROM INVESTING ACTIVITIES | | | |
| Capital expenditures for property, plant and equipment | (8,615) | | | (8,110) | |
| Acquisition of assets | (3,545) | | | (3,276) | |
| Purchase of other property and equipment | (59) | | | — | |
| Proceeds from sale of assets | 38,086 | | | 37,243 | |
| Net cash provided by (used in) investing activities | 25,867 | | | 25,857 | |
| CASH FLOWS FROM FINANCING ACTIVITIES | | | |
| Proceeds from borrowings | — | | | 39,000 | |
| Repayments of borrowings | (20,000) | | | (84,500) | |
| Reduction of financing lease liability | (493) | | | (977) | |
| Debt issuance costs | (75) | | | — | |
| Proceeds from exercise of stock options | 21 | | | — | |
| Cash paid for tax obligations on vested stock awards | (899) | | | (63) | |
| Net cash provided by (used in) financing activities | (21,446) | | | (46,540) | |
| NET INCREASE (DECREASE) IN CASH, CASH EQUIVALENTS and RESTRICTED CASH | 70,736 | | | 6,673 | |
| CASH, CASH EQUIVALENTS and RESTRICTED CASH, beginning of year | 28,266 | | | 5,968 | |
| CASH, CASH EQUIVALENTS and RESTRICTED CASH, end of period | $ | 99,002 | | | $ | 12,641 | |
| Supplemental Disclosure of Cash Flow Information | | | |
| Cash paid for interest, net of amounts capitalized | $ | (168) | | | $ | (1,271) | |
| Cash received for income taxes | $ | — | | | $ | 616 | |
| Supplemental Disclosure of Noncash Investing and Financing Activities | | | |
| Purchase of PP&E in accounts payable | $ | 2,169 | | | $ | 683 | |
| Right-of-use assets obtained in exchange for financing lease obligations | $ | 960 | | | $ | 67 | |
| Carrying value of properties exchanged | $ | — | | | $ | 3,890 | |
The accompanying notes are an integral part of these condensed consolidated financial statements.
SANDRIDGE ENERGY, INC. AND SUBSIDIARIES
NOTES TO CONDENSED CONSOLIDATED FINANCIAL STATEMENTS
(Unaudited)
1. Basis of Presentation
Nature of Business. SandRidge Energy, Inc. is an oil and natural gas acquisition, development and production company headquartered in Oklahoma City, Oklahoma with a principal focus on developing and producing hydrocarbon resources in the United States.
Principles of Consolidation. The consolidated financial statements include the accounts of the Company and its wholly owned or majority owned subsidiaries, including its proportionate share of the Royalty Trusts. All intercompany accounts and transactions have been eliminated in consolidation.
Interim Financial Statements. The accompanying unaudited condensed consolidated financial statements and notes should be read in conjunction with the audited financial statements and notes contained in the Company’s 2020 Form 10-K. Certain information and disclosures normally included in financial statements prepared in accordance with accounting principles generally accepted in the United States of America (“GAAP”) have been condensed or omitted, although the Company believes that the disclosures contained herein are adequate to make the information presented not misleading. In the opinion of management, the financial statements include all adjustments, which consist of normal recurring adjustments unless otherwise disclosed, necessary to fairly state the Company’s unaudited condensed consolidated financial statements.
Significant Accounting Policies. The unaudited condensed consolidated financial statements were prepared in accordance with the accounting policies stated in the 2020 Form 10-K, as well as the items noted below.
Use of Estimates. The preparation of the unaudited condensed consolidated financial statements in conformity with GAAP requires management to make estimates and assumptions that affect the reported amounts of assets and liabilities and disclosure of contingent assets and liabilities at the date of the financial statements and the reported amounts of revenues and expenses during the reporting period.
The more significant areas requiring the use of assumptions, judgments and estimates include: oil, natural gas and natural gas liquids (“NGL”) reserves; impairment tests of long-lived assets; the carrying value of unproved oil and natural gas properties; depreciation, depletion and amortization; asset retirement obligations; determinations of significant alterations to the full cost pool and related estimates of fair value used to allocate the full cost pool net book value to divested properties, as necessary; valuation allowances for deferred tax assets; income taxes; valuation of derivative instruments; contingencies; and accrued revenue and related receivables. Although management believes the estimates used in the areas noted above are reasonable, actual results could differ significantly from those estimates.
Going Concern Consideration. The accompanying condensed consolidated financial statements are prepared in accordance with GAAP, as applicable to a going concern, which contemplates the realization of assets and the satisfaction of liabilities in the normal course of business.
Recently Adopted Accounting Pronouncements ASU 2019-12. In December 2019, the FASB issued ASU 2019-12, “Income Taxes (Topic 740): Simplifying the Accounting for Income Taxes,” which simplifies various aspects of accounting for income taxes, including requirements related to hybrid tax regimes, the tax basis step-up in goodwill obtained in a transaction that is not a business combination, separate financial statements of entities not subject to tax, the intraperiod tax allocation exception to the incremental approach, ownership changes in investments, interim-period accounting for enacted changes in tax laws, and year-to-date loss limitation in interim-period tax accounting. The Company adopted this ASU on January 1, 2021 using an applied prospective basis; however, the impact was not material upon adoption.
Recent Accounting Pronouncements Not Yet Adopted ASU 2020-04. In March 2020, FASB issued ASU No. 2020-04, Reference Rate Reform (Topic 848), to facilitate the effects of reference rate reform on financial reporting. This ASU provides optional practical expedients and exceptions for applying GAAP provisions to contracts, hedging relationships, and other transactions that reference London Inter-Bank Offered Rate ("LIBOR"), or other reference rates expected to be discontinued because of reference rate reform, if certain criteria are met. The provisions of this ASU do not apply to contract modifications made and hedging transactions entered into or evaluated after December 31, 2022, except for hedging relationships existing as of December 31, 2022, that an entity has elected certain optional expedients for and that are retained through the end of the hedging relationship. The amendments in ASU 2020-04 are effective, for all entities, as of March 12, 2020 through December 31, 2022. The Company believes the impact upon adoptions will not have a material impact on the financial statements.
SANDRIDGE ENERGY, INC. AND SUBSIDIARIES
NOTES TO CONDENSED CONSOLIDATED FINANCIAL STATEMENTS - CONTINUED
(Unaudited)
2. Fair Value Measurements
The Company measures and reports certain assets and liabilities on a fair value basis and has classified and disclosed its fair value measurements using the levels of the fair value hierarchy noted below. The carrying values of cash, restricted cash, accounts receivable, prepaid expenses, certain other current and non-current assets, accounts payable and accrued expenses, and other current liabilities and other long-term obligations included in the unaudited condensed consolidated balance sheets approximated fair value at September 30, 2021 and December 31, 2020. Additionally, the carrying amount of debt associated with borrowings outstanding under the credit facility dated November 30, 2020 ("New Credit Facility") approximates fair value as borrowings bear interest at variable rates. As a result, these financial assets and liabilities are not discussed below.
| | | | | |
| Level 1 | Unadjusted quoted prices in active markets that are accessible at the measurement date for identical, unrestricted assets or liabilities. |
| |
| Level 2 | Quoted prices in markets that are not active, or inputs which are observable, either directly or indirectly, for substantially the full term of the asset or liability. |
| |
| Level 3 | Measurement based on prices or valuation models that require inputs that are both significant to the fair value measurement and less observable from objective sources (i.e., supported by little or no market activity). |
Assets and liabilities that are measured at fair value are classified based on the lowest level of input that is significant to the fair value measurement. The Company’s assessment of the significance of a particular input to the fair value measurement requires judgment, which may affect the valuation of the fair value of assets and liabilities and their placement within the fair value hierarchy levels. The determination of the fair values, stated below, considers the market for the Company’s financial assets and liabilities, the associated credit risk and other factors. The Company considers active markets as those in which transactions for the assets or liabilities occur in sufficient frequency and volume to provide pricing information on an ongoing basis. The Company had liabilities classified in Level 2 of the hierarchy as of September 30, 2021 and none as of December 31, 2020 as described below.
Level 2 Fair Value Measurements
Commodity Derivative Contracts. As applicable, the fair values of the Company’s oil and natural gas fixed price swaps are based upon inputs that are either readily available in the public market, such as oil and natural gas futures prices, volatility factors and discount rates, or can be corroborated from active markets. Fair value is determined through the use of a discounted cash flow model or option pricing model using the applicable inputs discussed above. The Company applies a weighted average credit default risk rating factor for its counterparties or gives effect to its credit default risk rating, as applicable, in determining the fair value of these derivative contracts. Credit default risk ratings are based on current published credit default swap rates.
Fair Value - Recurring Measurement Basis
The Company had liabilities classified in Level 2 of the hierarchy as of September 30, 2021 and no open commodity derivative contracts as of December 31, 2020.
The following table summarize the Company’s assets measured at fair value on a recurring basis by the fair value hierarchy (in thousands):
September 30, 2021
| | | | | | | | | | | | | | | | | | | | | | | | | | | | | |
| Fair Value Measurements | | Netting(1) | | Assets/Liabilities at Fair Value |
| Level 1 | | Level 2 | | Level 3 |
| | | | | | | | | |
| | | | | | | | | |
| | | | | | | | | |
| Liabilities | | | | | | | | | |
| Commodity derivative contracts | $ | — | | | $ | 4,129 | | | $ | — | | | $ | — | | | $ | 4,129 | |
Total | $ | — | | | $ | 4,129 | | | $ | — | | | $ | — | | | $ | 4,129 | |
____________________
(1) Represents the effect of netting assets and liabilities for counterparties with which the right of offset exists.
SANDRIDGE ENERGY, INC. AND SUBSIDIARIES
NOTES TO CONDENSED CONSOLIDATED FINANCIAL STATEMENTS - CONTINUED
(Unaudited)
Transfers. The Company did not have any transfers between Level 1, Level 2 or Level 3 fair value measurements during the three and nine-month periods ended September 30, 2021 and 2020.
3. Derivatives
Commodity Derivatives
The Company is exposed to commodity price risk, which impacts the predictability of its cash flows from the sale of oil and natural gas. On occasion, the Company has attempted to manage this risk on a portion of its forecasted oil or natural gas production sales through the use of commodity derivative contracts.
The Company has not designated any of its derivative contracts as hedges for accounting purposes. All derivative contracts have been recorded at fair value with changes in derivative contract fair values recognized as a gain or loss on derivative contracts in the condensed consolidated statements of operations. Commodity derivative contracts were settled on a monthly basis, and the commodity derivative contract valuations were adjusted to the mark-to-market valuation on a quarterly basis.
The following table summarizes derivative activity for the three and nine-month periods ended September 30, 2021, and 2020 (in thousands):
| | | | | | | | | | | | | | | | | | | | | | | |
| Three Months Ended September 30, | | Nine Months Ended September 30, |
| 2021 | | 2020 | | 2021 | | 2020 |
| (Gain) loss on commodity derivative contracts | $ | 4,129 | | | $ | 5,299 | | | $ | 4,129 | | | $ | (7,168) | |
| Cash (paid) received on settlements | $ | — | | | $ | 619 | | | $ | — | | | $ | 11,197 | |
Master Netting Agreements and the Right of Offset. As applicable, the Company has master netting agreements with all of its commodity derivative counterparties and has presented its derivative assets and liabilities with the same counterparty on a net basis in the unaudited condensed consolidated balance sheets. As a result of the netting provisions, the Company's maximum amount of loss under commodity derivative transactions due to credit risk is limited to the net amounts due from its counterparties.
The following table summarizes (i) the Company's commodity derivative contracts on a gross basis, (ii) the effects of netting assets and liabilities for which the right of offset exists based on master netting arrangements and (iii) for the Company’s net derivative liability positions as of September 30, 2021 and no open positions as of December 31, 2020 (in thousands):
September 30, 2021
| | | | | | | | | | | | | | | | | | | | | | | | | | | | | | | | |
| | Gross Amounts | | Gross Amounts Offset | | Amounts Net of Offset | | Financial Collateral | | Net Amount |
| Liabilities | | | | | | | | | | |
Derivative contracts - current | | $ | 4,129 | | | $ | — | | | $ | 4,129 | | | $ | — | | | $ | 4,129 | |
Total | | $ | 4,129 | | | $ | — | | | $ | 4,129 | | | $ | — | | | $ | 4,129 | |
SANDRIDGE ENERGY, INC. AND SUBSIDIARIES
NOTES TO CONDENSED CONSOLIDATED FINANCIAL STATEMENTS - CONTINUED
(Unaudited)
As of September 30, 2021, the Company's open derivative contracts consisted of natural gas and NGL commodity derivative contracts under which we will receive a fixed price for the contract and pay a floating market price to the counterparty over a specified period for a contracted volume. These commodity derivative contracts consisted of the following:
| | | | | | | | | | | | | | | | | | | | |
| | Notional | | Units | | Weighted Average Fixed Price per Unit |
| NGL Price Swaps: October 2021 - February 2022 | | 2,605,000 | | | Gallons | | $ | 1.20 | |
| Natural Gas Price Swaps: October 2021 - February 2022 | | 1,800,000 | | | MMBtu | | $ | 4.07 | |
Because we did not designate any of our derivative contracts as hedges for accounting purposes, changes in the fair value of our derivative contracts were recognized as gains and losses in current period earnings. As a result, and as applicable, our current period earnings could have been significantly affected by changes in the fair value of our commodity derivative contracts. Changes in fair value were principally measured based on a comparison of future prices to the contract price at the end of the period.
Fair Value of Derivatives
The following table presents the fair value of the Company’s derivative contracts as of September 30, 2021 on a gross basis without regard to same counterparty netting (in thousands):
| | | | | | | | | | | | | | | | |
| Type of Contract | | Balance Sheet Classification | | September 30, 2021 | | |
| | | | | | |
| | | | | | |
| | | | | | |
| | | | | | |
| | | | | | |
| Derivative liabilities | | | | | | |
| NGL price swaps | | Derivative Contracts - Current | | $ | 819 | | | |
| Natural gas price swaps | | Derivative Contracts - Current | | 3,310 | | | |
| | | | | | |
| | | | | | |
| Total net derivative contracts | | $ | 4,129 | | | |
See Note 2 for additional discussion of the fair value measurement of the Company’s derivative contracts.
4. Property, Plant and Equipment
Property, plant and equipment consists of the following (in thousands): | | | | | | | | | | | |
| September 30,
2021 | | December 31, 2020 |
Oil and natural gas properties | | | |
Proved | $ | 1,442,972 | | | $ | 1,463,950 | |
Unproved | 12,905 | | | 17,964 | |
Total oil and natural gas properties | 1,455,877 | | | 1,481,914 | |
| Less: accumulated depreciation, depletion and impairment | (1,371,123) | | | (1,375,692) | |
| Net oil and natural gas properties | 84,754 | | | 106,222 | |
| | | |
| Land | 200 | | | 200 | |
| Electrical infrastructure | 121,819 | | | 121,819 | |
| Other non-oil and natural gas equipment | 1,602 | | | 1,563 | |
| Buildings and structures | 3,603 | | | 3,603 | |
| Financing leases | 1,128 | | | 1,051 | |
| Total | 128,352 | | | 128,236 | |
| Less: accumulated depreciation and amortization | (29,401) | | | (25,118) | |
Other property, plant and equipment, net | 98,951 | | | 103,118 | |
Total property, plant and equipment, net | $ | 183,705 | | | $ | 209,340 | |
See Note 5 for discussion of impairment of property, plant and equipment.
SANDRIDGE ENERGY, INC. AND SUBSIDIARIES
NOTES TO CONDENSED CONSOLIDATED FINANCIAL STATEMENTS - CONTINUED
(Unaudited)
5. Impairment
The Company assesses the need to impair its oil and gas properties during its quarterly full cost pool ceiling limitation calculation. The Company analyzes various property, plant and equipment for impairment when certain triggering events occur by comparing the carrying values of the assets to their estimated fair values. The full cost pool ceiling limitation and estimated fair values of midstream and other assets were determined in accordance with the policies discussed in Note 1, as applicable.
Calculation of the full cost ceiling test is based on, among other factors, average prices for the trailing twelve-month period determined by reference to the first-day-of-the-month index prices ("SEC Prices") as adjusted for price differentials and other contractual arrangements. The SEC Prices utilized in the calculation of proved reserves included in the full cost ceiling test at September 30, 2021 were $57.69 per barrel of oil and $2.94 per Mcf of natural gas, before price differential adjustments.
In the three and nine-month periods ended September 30, 2021, we did not record a full cost ceiling limitation impairment charge.
In the three-month period ended September 30, 2020, the Company recorded a total impairment charge of $44.0 million, which related to the full cost ceiling limitation impairment charge. The Company recorded a total impairment charge of $253.8 million for the nine-month period ended September 30, 2020, which included a full cost ceiling limitation impairment charge of $215.8 million, and an impairment charge of $38.0 million to write down the value of the Company's office headquarters.
The June 30, 2020, asset impairment charge of $38.0 million resulted from the write down of the net carrying amount of the office headquarters building assets to their estimated fair value less estimated costs to sell the building. In May 2020, the Company entered into an agreement for the sale of its corporate headquarters building located in Oklahoma City, OK. The building sale closed on August 31, 2020. Prior to the sale of the corporate headquarters building, the Company was required to report the building at its carrying amount, as a result the building was assessed for recoverability and impairment using undiscounted cash flow measures of the consolidated Company as prescribed under ASC 360-10-35, rather than fair value as prescribed under ASC 360-10-45-9.
6. Acquisitions and Divestitures
Overriding Royalty Interest Assets
On April 22, 2021, the Company acquired all of the overriding royalty interest assets of SandRidge Mississippian Trust I (the “Trust”). The gross purchase price was $4.9 million (net $3.6 million, given our 26.9% ownership of the Trust).
On September 10, 2020, the Company acquired all of the overriding royalty interest assets of SandRidge Mississippian Trust II. The gross purchase price was $5.3 million (net $3.3 million, given our 37.6% ownership of the Trust).
North Park Basin Sale
On February 5, 2021, the Company sold all of its oil and natural gas properties and related assets of the North Park Basin (“NPB” or “North Park”), in Colorado, for a purchase price of $47 million. The sale closed for net proceeds of $39.7 million in cash, which amounts to the purchase price of $47 million net of effective date to close date adjustments. Consequently, the Company allocated a portion of the full cost pool net book value, using the income approach, to the divested oil and gas properties and recognized a reduction of full cost pool assets of $22.0 million and a reduction of $4.6 million to its non-full cost pool assets. As the sale significantly altered the relationship between capitalized costs and proved reserves, the Company recognized a $19.7 million gain related to the assets sold. The gain represents net proceeds of $39.7 million coupled with the release of revenues in suspense of $0.5 million and the relief of asset retirement obligations of $6.1 million offset by the reduction of $26.6 million in oil and gas properties related to NPB. The Company recorded a decrease to the sales price of $0.8 million as a result of post-closing adjustments made during the three months ended September 30, 2021. As a result, (Gain) loss on sale of assets decreased to $18.9 million for the nine months ended September 30, 2021.
For the nine-months ended September 30, 2021, NPB represented $3.2 million, or 2.8% of the Company's $114.4 million total consolidated Revenues, NPB represented $0.9 million, or 3.5% of the Company's $26.3 million consolidated Lease
SANDRIDGE ENERGY, INC. AND SUBSIDIARIES
NOTES TO CONDENSED CONSOLIDATED FINANCIAL STATEMENTS - CONTINUED
(Unaudited)
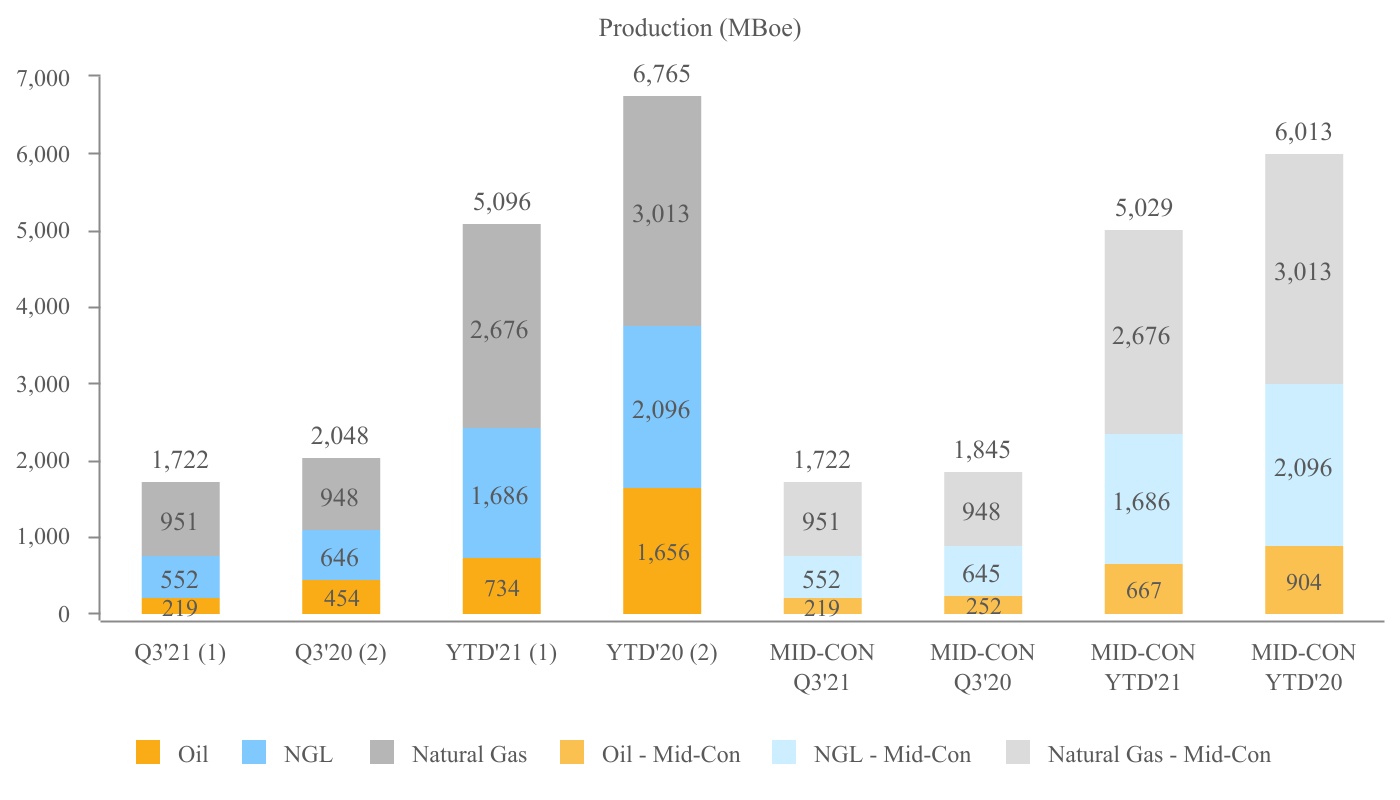
operating expense and NPB represented 0.1 MMBoe, or 1.3% of the Company's consolidated total production volumes of 5.1 MMBoe.
For the three-months ended September 30, 2020, NPB represented $7.1 million, or 25.6% of the Company's $27.7 million total consolidated Revenues, NPB represented $1.3 million or 16.4% of the Company's $8.1 million consolidated Lease operating expense, it represented $0.5 million, or 19.9% of the Company's $2.3 million consolidated Production, ad valorem and other taxes and NPB represented 0.2 MMBoe, or 9.9% of the Company's consolidated total production volumes of 2.0 MMBoe.
For the nine-months ended September 30, 2020, NPB represented $24.5 million, or 28.9% of the Company's $84.7 million total consolidated Revenues, NPB represented $7.1 million or 21.9% of the Company's $32.4 million consolidated Lease operating expense, it represented $1.5 million, or 20.9% of the Company's $7.4 million consolidated Production, ad valorem and other taxes and NPB represented 0.8 MMBoe, or 11.1% of the Company's consolidated total production volumes of 6.8 MMBoe.
7. Accounts Payable and Accrued Expenses
Accounts payable and accrued expenses consist of the following (in thousands): | | | | | | | | | | | | |
| September 30,
2021 | | | December 31, 2020 |
| Accounts payable and other accrued expenses | $ | 15,907 | | | | $ | 23,017 | |
| Production payable | 22,476 | | | | 15,367 | |
| Payroll and benefits | 2,765 | | | | 5,640 | |
| Taxes payable | 5,396 | | | | 6,864 | |
| Drilling advances | 234 | | | | 477 | |
| Accrued interest | — | | | | 61 | |
| Total accounts payable and accrued expenses | $ | 46,778 | | | | $ | 51,426 | |
8. Long-Term Debt
Credit Facility.
On November 30, 2020 the Company entered into the New Credit Facility of $30.0 million with a related party and affiliate of Icahn Enterprises, as Lender and Icahn Agency Services LLC, as administrative agent. As of September 30, 2021 the Company did not have an outstanding balance and as of December 31, 2020, the Company had a $20.0 million term loan outstanding under the New Credit Facility. The New Credit Facility consisted of a $10.0 million revolving loan facility and a $20 million term loan facility.
On September 2, 2021, the Company repaid its $20.0 million, term loan in full and terminated all commitments and obligations under the New Credit Facility. The Company’s payment to the Lender under the Credit Agreement satisfied all of the Company’s remaining term debt and revolving debt obligations. The Company did not incur any early termination penalties as a result of the repayment of indebtedness or termination of the Credit Agreement.
During the three and nine-months ended September 30, 2021, the weighted average interest rate paid for borrowings outstanding under the New Credit Facility was approximately 2.60% and 2.61%, respectively.
During the three and nine-months ended September 30, 2021, the Company paid the Lender, a related party, $0.1 million and $0.4 million, respectively of interest expense which is included on the Interest expense, net line item on the Condensed Consolidated Statement of Operations.
SANDRIDGE ENERGY, INC. AND SUBSIDIARIES
NOTES TO CONDENSED CONSOLIDATED FINANCIAL STATEMENTS - CONTINUED
(Unaudited)
9. Commitments and Contingencies
Legal Proceedings. The Company is subject to various legal proceedings and claims arising in the ordinary course of its business. The Company has provided accruals where necessary for contingent liabilities, based on ASC 450, Contingencies, when it has determined that a liability is probable and reasonably estimable. The Company continuously assesses the potential liability related to the Company's pending litigation and revises its estimates when additional information becomes available. Additionally, the Company currently expenses all legal costs as they are incurred.
As previously disclosed in the Company's 2020 Form 10-K, there are certain ongoing Cases (as that term is defined in the Company's 2020 Form 10-K).
In each of the Cases, lead plaintiffs seek to recover unspecified damages, interest, costs and expenses incurred in the litigation on behalf of themselves and class members. Although the claims against the Company in each Case have been discharged pursuant to the Plan, the Company remains a nominal defendant because of a technical connection with the Cases, and is necessary for the court to decide all issues and make a proper judgement. The Company may also be contractually obligated to indemnify two former officers who are defendants and the SandRidge Mississippian Trust I against losses, claims, damages, liabilities and expenses, including reasonable costs of investigation and attorney’s fees and expenses, which it is required to advance, arising out of the Cases, although the Company disputes any such obligations. Such indemnification is not covered by insurance with respect to the Trust. As of October 2020, we have exhausted all remaining insurance coverage for the costs of indemnification and expect no further reimbursements.
In light of the status of the Cases, and the facts, circumstances and legal theories relating thereto, the Company is not able to determine the likelihood of an outcome in either case or provide an estimate of any reasonably possible loss or range of possible loss related thereto. Accordingly, the Company has not established or accrued any liabilities relating to the Cases and believes that the plaintiffs' claims are without merit. However, considering the exhaustion of insurance coverage available to the Company, such losses, if incurred, could be material. The Company intends to continue to vigorously defend against the Cases in its capacity as a nominal defendant.
SANDRIDGE ENERGY, INC. AND SUBSIDIARIES
NOTES TO CONDENSED CONSOLIDATED FINANCIAL STATEMENTS - CONTINUED
(Unaudited)
10. Income Taxes
For each interim reporting period, the Company estimates the effective tax rate expected for the full fiscal year and uses that estimated rate in providing for income taxes on a current year-to-date basis.
Deferred income taxes are provided to reflect the future tax consequences of temporary differences between the tax basis of assets and liabilities and their reported amounts in the financial statements. The Company’s deferred tax assets have been reduced by a valuation allowance due to a determination that it is more likely than not that some or all of the deferred assets will not be realized based on the weight of all available evidence. The Company continues to closely monitor and weigh all available evidence, including both positive and negative, in making its determination whether to maintain a valuation allowance. As a result of the significant weight placed on the Company's cumulative negative earnings position, the Company continued to maintain a full valuation allowance against its net deferred tax asset at September 30, 2021 and December 31, 2020. As a result, the Company had no federal or state income tax expense or benefit for the three and nine-month periods ended September 30, 2021 and recorded an insignificant income tax benefit for the year ended December 21, 2020. The benefit is related to previously sequestered alternative minimum tax ("AMT") refund amounts released to the Company during 2020. The Company has no remaining AMT credits to be refunded.
Internal Revenue Code (“IRC”) Section 382 addresses company ownership changes and specifically limits the utilization of certain deductions and other tax attributes on an annual basis following an ownership change. As a result of the Chapter 11 reorganization and related transactions, the Company experienced an ownership change within the meaning of IRC Section 382 during 2016 that subjected certain of the Company’s tax attributes, including net operating losses ("NOLs"), to an IRC Section 382 limitation. This limitation has not resulted in cash taxes for any period subsequent to the ownership change. Since the 2016 ownership change, the Company has generated additional NOLs and other tax attributes that are not currently subject to an IRC Section 382 limitation. The Company's ability to use NOLs and other tax attributes to reduce taxable income and income taxes could be materially impacted by a future IRC 382 ownership change. Future transactions involving the Company's stock, including those outside of the Company's control, could cause an IRC 382 ownership change resulting in a limitation on tax attributes currently not limited and a more restrictive limitation on tax attributes currently subject to the previous IRC 382 limitation.
As of September 30, 2021, the Company had approximately $1.6 billion of federal NOL carryforwards, net of NOLs expected to expire unused due to the 2016 IRC Section 382 limitation. Of the $1.6 billion of federal NOL carryforwards, $0.8 billion expire during the years 2025 through 2037, while $0.8 billion do not have an expiration date. Additionally, the Company had federal tax credits in excess of $33.5 million which begin expiring in 2029.
The Company did not have unrecognized tax benefits at September 30, 2021 and December 31, 2020.
The Company’s only taxing jurisdiction is the United States (federal and state). The Company’s tax years 2017 to present remain open for federal examination. Additionally, tax years 2005 through 2016 remain subject to examination for the purpose of determining the amount of federal NOL and other carryforwards. The number of years open for state tax audits varies, depending on the state, but are generally from three to five years.
11. Equity
Common Stock, Performance Share Units, and Stock Options. At September 30, 2021, the Company had approximately 250.0 million shares of common stock authorized, 36.7 million shares of common stock, par value $0.001 per share, issued and outstanding. Further, at September 30, 2021, the Company had approximately 0.1 million shares of unvested restricted stock awards, 0.4 million shares of unvested restricted stock units, 0.3 million stock options outstanding, and an immaterial number of unvested performance share units.
Warrants. The Company has issued approximately 4.9 million Series A warrants and 2.1 million Series B warrants that are exercisable until October 4, 2022 for one share of common stock per warrant at initial prices of $41.34 and $42.03 per share, respectively, subject to adjustments pursuant to the terms of the warrants, to certain holders of general unsecured claims as defined in the Plan. The warrants contain customary anti-dilution adjustments in the event of any stock split, reverse stock split, reclassification, stock dividend or other distributions.
SANDRIDGE ENERGY, INC. AND SUBSIDIARIES
NOTES TO CONDENSED CONSOLIDATED FINANCIAL STATEMENTS - CONTINUED
(Unaudited)
Share Repurchase Program. In August 2021, the Company's Board of Directors (the “Board”) approved the initiation of a share repurchase program (the "Program") authorizing the Company to purchase up to an aggregate of $25.0 million of the Company’s common stock beginning as early as August 16, 2021. The Program is in accordance with Rule 10b-18 of the Exchange Act. Subject to applicable rules and regulations, repurchases under the Program can be made from time to time in open markets at the Company's discretion and in compliance with safe harbor provisions, or in privately negotiated transactions. The Program does not require any specific number of shares to be acquired, and can be modified or discontinued by the Board at any time. The Company did not repurchase any common stock under the Program during the third quarter ended September 30, 2021.
The Tax Benefits Preservation Plan. On July 1, 2020, the Board declared a dividend distribution of one right (a “Right”) for each outstanding share of Company common stock, par value $0.001 per share to stockholders of record at the close of business on July 13, 2020. Each Right entitles its holder, under certain circumstances, to purchase from the Company one one-thousandth of a share of Series A Junior Participating Preferred Stock of the Company, par value $0.001 per share, at an exercise price of $5.00 per Right, subject to adjustment. The description and terms of the Rights are set forth in the tax benefits preservation plan, dated as of July 1, 2020, between the Company and American Stock Transfer & Trust Company, LLC, as rights agent (the “Tax Benefits Preservation Plan”).
The Company adopted the Tax Benefits Preservation Plan, as amended on March 16, 2021, in order to protect shareholder value against a possible limitation on the Company’s ability to use its tax NOLs and certain other tax benefits to reduce potential future U.S. federal income tax obligations. The NOLs are a valuable to the Company, which may inure to the benefit of the Company and its stockholders. However, if the Company experiences an “ownership change,” as defined in Section 382 of the Internal Revenue Code of 1986, as amended, its ability to fully utilize the NOLs and certain other tax benefits will be substantially limited and the timing of the usage of the NOLs and such other benefits could be substantially delayed, which could significantly impair the value of those assets. Generally, an “ownership change” occurs if the percentage of the Company’s stock owned by one or more of its “five-percent shareholders” (as such term is defined in Section 382 of the Code) increases by more than 50 percentage points over the lowest percentage of stock owned by such stockholder or stockholders at any time over a three-year period. The Tax Benefits Preservation Plan is intended to prevent against such an “ownership change” by deterring any person or group from acquiring beneficial ownership of 4.9% or more of the Company’s securities.
Subject to certain exceptions, the Rights become exercisable and trade separately from Common Stock only upon the “Distribution Time,” which occurs upon the earlier of:
•the close of business on the tenth (10th) day after the “Stock Acquisition Date,” which is (a) the first date of public announcement that a person or group of affiliated or associated persons (with certain exceptions, an “Acquiring Person”) has acquired, or obtained the right or obligation to acquire, beneficial ownership of 4.9% or more of the outstanding shares of Common Stock (with certain exceptions) or (b) such other date, as determined by the Board, on which a person or group has become an Acquiring Person, or
•the close of business on the tenth (10th) business day (or later date as may be determined by the Board prior to such time as any person or group becomes an Acquiring Person) following the commencement of a tender offer or exchange offer which, if consummated, would result in a person or group becoming an Acquiring Person.
Any existing stockholder or group that beneficially owns 4.9% or more of Common Stock has been grandfathered at its current ownership level, but the Rights will not be exercisable if, at any time after the announcement of the Tax Benefits Preservation Plan, such stockholder or group increases its ownership of Common Stock by one share of Common Stock. Certain synthetic interests in securities created by derivative positions, whether or not such interests are considered to be ownership of the underlying Common Stock or are reportable for purposes of Regulation 13D of the Securities Exchange Act of 1934, as amended, are treated as beneficial ownership of the number of shares of Common Stock equivalent to the economic exposure created by the derivative position, to the extent actual shares of Common Stock are directly or indirectly held by counterparties to the derivatives contracts.
Until the earlier of the Distribution Time and the Expiration Time (as defined herein), the surrender for transfer of any shares of Common Stock will also constitute the transfer of the Rights associated with those shares. As soon as practicable after the Distribution Time, separate rights certificates will be mailed to holders of record of Common Stock as of the close of business on the Distribution Time. From and after the Distribution Time, the separate rights certificates alone will represent the Rights. Except as otherwise provided in the Tax Benefits Preservation Plan, only shares of Common Stock issued prior to the Distribution Time will be issued with Rights. The Rights are not exercisable until the Distribution Time.
SANDRIDGE ENERGY, INC. AND SUBSIDIARIES
NOTES TO CONDENSED CONSOLIDATED FINANCIAL STATEMENTS - CONTINUED
(Unaudited)
The Tax Benefits Preservation Plan was approved at the 2021 annual meeting of stockholders on May 25, 2021.
In the event that any person or group (other than certain exempt persons) becomes an Acquiring Person, each holder of a Right (other than any Acquiring Person and certain related parties, whose Rights automatically become null and void) will have the right to receive, upon exercise, shares of Common Stock having a value equal to two times the exercise price of the Right.
In the event that, at any time following the Stock Acquisition Date, any of the following occurs:
•the Company consolidates with, or merges with and into, any other entity, and the Company is not the continuing or surviving entity;
•any entity engages in a share exchange with or consolidates with, or merges with or into, the Company, and the Company is the continuing or surviving entity and, in connection with such share exchange, consolidation or merger, all or part of the outstanding shares of Common Stock are changed into or exchanged for stock or other securities of any other entity or cash or any other property; or
•the Company sells or otherwise transfers, in one transaction or a series of related transactions, fifty percent (50%) or more of the Company’s assets, cash flow or earning power,
•each holder of a Right (except Rights which previously have been voided as described above) will have the right to receive, upon exercise, common stock of the acquiring company having a value equal to two times the exercise price of the Right.
12. Revenues
The following table disaggregates the Company’s revenue by source for the three and nine-month periods ended September 30, 2021 and 2020: | | | | | | | | | | | | | | | | | | | | | | | |
| Three Months Ended September 30, | | Nine Months Ended September 30, |
| 2021 | | 2020 | | 2021 | | 2020 |
| | | | | | | |
| (In thousands) |
Oil | $ | 15,198 | | | $ | 17,071 | | | $ | 45,412 | | | $ | 57,279 | |
NGL | 14,863 | | | 4,983 | | | 34,344 | | | 12,508 | |
Natural gas | 16,523 | | | 5,493 | | | 34,647 | | | 14,347 | |
Other | — | | | 129 | | | — | | | 526 | |
Total revenues | $ | 46,584 | | | $ | 27,676 | | | $ | 114,403 | | | $ | 84,660 | |
Oil, natural gas and NGL revenues. A majority of the Company’s revenues come from the sale of oil, natural gas and NGLs and are recorded at a point in time when control of the oil, natural gas and NGL production passes to the customer at the inlet of the processing plant or pipeline, or the delivery point for onloading to a delivery truck. As the Company’s customers obtain control of the production prior to selling it to other end customers, the Company presents its revenues on a net basis, rather than on a gross basis.
Pricing for the Company’s oil, natural gas and NGL contracts is variable and is based on either an index price, net of deductions, or a percentage of the sales price obtained by the customer, which is also based on index prices. The transaction price is allocated on a pro-rata basis to each unit of oil, natural gas or NGL sold based on the terms of the contract. Oil, natural gas and NGL revenues are also recorded net of royalties, discounts and allowances, and transportation costs, as applicable. Taxes assessed by governmental authorities on oil, natural gas and NGL sales are presented separately from revenues and are included in production, ad valorem, and other tax expense in the consolidated statements of operations.
Revenues Receivable. The Company records an asset in accounts receivable, net on its consolidated balance sheet for revenues receivable from contracts with customers at the end of each period. Pricing for revenues receivable is estimated using current month crude oil, natural gas and NGL prices, net of deductions. Revenues receivable are typically collected the month after the Company delivers the related production to its customers. As of September 30, 2021, and December 31, 2020, the
SANDRIDGE ENERGY, INC. AND SUBSIDIARIES
NOTES TO CONDENSED CONSOLIDATED FINANCIAL STATEMENTS - CONTINUED
(Unaudited)
Company had revenues receivable of $19.0 million and $12.8 million, respectively, and did not record any bad debt expense on revenues receivable during the three and nine-month periods ended September 30, 2021 and 2020.
13. Employee Termination Benefits
During the three-month period ended September 30, 2021, no employees received termination benefits. Certain employees received termination benefits including cash severance and accelerated share-based compensation upon separation of service from the Company as a result of the sale of North Park assets and other employee terminations during the nine-month period ended September 30, 2021 and as a result of a reduction in workforce during the three and nine-month periods ended September 30, 2020. The following tables presents a summary of employee termination benefits for the three and nine-month periods ended September 30, 2021 and 2020 (in thousands):
| | | | | | | | | | | | | | | | | | | | | | | | | | |
| | Cash | | Share-Based Compensation (1) | | Number of Shares | | Total Employee Termination Benefits |
| Three Months Ended September 30, 2021 | | | | | | | | |
| Executive Employee Termination Benefits | | $ | — | | | $ | — | | | — | | | $ | — | |
| Other Employee Termination Benefits | | — | | | — | | | — | | | — | |
| | $ | — | | | $ | — | | | — | | | $ | — | |
| Three Months Ended September 30, 2020 | | | | | | | | |
Executive Employee Termination Benefits | | $ | 1,005 | | | $ | 1,784 | | | 159 | | | $ | 2,789 | |
Other Employee Termination Benefits | | 395 | | | — | | | — | | | 395 | |
| | $ | 1,400 | | | $ | 1,784 | | | 159 | | | $ | 3,184 | |
| Nine Months Ended September 30, 2021 | | | | | | | | |
| Executive Employee Termination Benefits | | $ | — | | | $ | — | | | — | | | $ | — | |
| Other Employee Termination Benefits | | 32 | | | 17 | | | — | | | 49 | |
| | $ | 32 | | | $ | 17 | | | — | | | $ | 49 | |
| Nine Months Ended September 30, 2020 | | | | | | | | |
| Executive Employee Termination Benefits | | $ | 1,009 | | | $ | 1,784 | | | 159 | | | $ | 2,793 | |
| Other Employee Termination Benefits | | 5,598 | | | 40 | | | 4 | | | 5,638 | |
| | $ | 6,607 | | | $ | 1,824 | | | 163 | | | $ | 8,431 | |
____________________
(1) Share-based compensation recognized in connection with the accelerated vesting of restricted stock awards due to the sale of the North Park assets for the nine-month period ended September 30, 2021 and as a result of the reduction in workforce for the three and nine-month periods ended September 30, 2020. The remaining unrecognized compensation expense associated with these awards at the date of termination was recorded as employee termination benefits. The unrecognized compensation expense was calculated using the grant date fair value for restricted stock awards. One share of the Company’s common stock was issued per restricted stock award.
SANDRIDGE ENERGY, INC. AND SUBSIDIARIES
NOTES TO CONDENSED CONSOLIDATED FINANCIAL STATEMENTS - CONTINUED
(Unaudited)
14. Earnings (Loss) per Share
The following table summarizes the calculation of weighted average common shares outstanding used in the computation of diluted earnings (loss) per share: | | | | | | | | | | | | | | |
| Earnings (Loss) | | Weighted Average Shares | Earnings (Loss) Per Share |
| | | | |
| (In thousands, except per share amounts) |
| Three Months Ended September 30, 2021 | | | | |
Basic earnings per share | $ | 28,599 | | | 36,577 | | $ | 0.78 | |
| Effect of dilutive securities | | | | |
| Restricted stock units | — | | | 343 | | |
| Restricted stock awards | — | | | 28 | | |
| Performance share units (1) | — | | | — | | |
| Warrants | — | | | — | | |
| Stock options | — | | | 48 | | |
Diluted earnings share (2) | $ | 28,599 | | | 36,996 | | $ | 0.77 | |
| Three Months Ended September 30, 2020 | | | | |
| Basic loss per share | $ | (48,749) | | | 35,783 | | $ | (1.36) | |
| Effect of dilutive securities | | | | |
| Restricted stock awards | — | | | — | | |
| Performance share units | — | | | — | | |
| Warrants | — | | | — | | |
| Stock options | — | | | — | | |
| Diluted loss per share (3) | $ | (48,749) | | | 35,783 | | $ | (1.36) | |
| Nine Months Ended September 30, 2021 | | | | |
Basic earnings per share | $ | 79,894 | | | 36,318 | | $ | 2.20 | |
| Effect of dilutive securities | | | | |
| Restricted stock units | — | | | 787 | | |
| Restricted stock awards | — | | | 54 | | |
| Performance share units (1) | — | | | — | | |
| Warrants | — | | | — | | |
| Stock options | — | | | 41 | | |
Diluted earnings per share (2) | $ | 79,894 | | | 37,200 | | $ | 2.15 | |
| Nine Months Ended September 30, 2020 | | | | |
| Basic loss per share | $ | (277,198) | | | 35,649 | | $ | (7.78) | |
| Effect of dilutive securities | | | | |
| Restricted stock awards | — | | | — | | |
| Performance share units | — | | | — | | |
| Warrants | — | | | — | | |
| Stock options | — | | | — | | |
| Diluted loss per share (3) | $ | (277,198) | | | 35,649 | | $ | (7.78) | |
____________________
(1)The performance share unit awards are contingently issuable and are considered in the calculation of diluted earnings per share. The Company assesses the number of awards that would be issuable, if any, under the terms of the agreement if the end of the reporting period were the end of the contingency period.
(2)The incremental shares of potentially dilutive restricted stock units and restricted stock awards were included for the three and nine-month periods ended September 30, 2021 as their effect was dilutive under the treasury stock method.
(3)No incremental shares of potentially dilutive restricted stock awards, performance share units, warrants or stock options were included for the three and nine-month periods ended September 30, 2020, as their effect was antidilutive under the treasury stock method.
ITEM 2. Management’s Discussion and Analysis of Financial Condition and Results of Operations
Introduction
The following discussion and analysis is intended to help the reader understand our business, financial condition, results of operations, liquidity and capital resources. This discussion and analysis should be read in conjunction with the accompanying unaudited condensed consolidated financial statements and the accompanying notes included in this Quarterly Report, as well as our audited consolidated financial statements and the accompanying notes included in the 2020 Form 10-K. Our discussion and analysis includes the following subjects:
•Overview;
•Consolidated Results of Operations;
•Liquidity and Capital Resources; and
•Critical Accounting Policies and Estimates.
The financial information with respect to the three and nine-month periods ended September 30, 2021, and 2020, discussed below, is unaudited. In the opinion of management, this information contains all adjustments, which consist only of normal recurring adjustments unless otherwise disclosed, necessary to state fairly the accompanying unaudited condensed consolidated financial statements. The results of operations for the interim periods are not necessarily indicative of the results of operations for the full fiscal year.
Overview
We are an independent oil and natural gas company with a principal focus on acquisition, development and production activities in the U.S. Mid-Continent ("Mid-Con"). Prior to February 5, 2021, we held assets in the North Park Basin ("NPB" or “North Park") of Colorado, which have been sold in their entirety.
The chart below shows production by product for the three and nine-month periods ended September 30, 2021 and 2020:
(1)For the three-months ended September 30, 2021, there was no NPB oil production as a result of the sale. For the nine-months ended September 30, 2021, NPB had 67 MBoe of oil production.
(2)For the three and nine-months ended September 30, 2020, NPB had 203 MBoe and 752 MBoe, respectively of oil production.
Total production for the three-month periods ended September 30, 2021 and September 30, 2020 were comprised of approximately 12.7% oil, 55.2% natural gas and 32.1% NGLs compared to 22.2% oil, 46.3% natural gas and 31.5% NGLs, respectively.
Total production for the nine-month periods ended September 30, 2021 and September 30, 2020 were comprised of approximately 14.4% oil, 52.5% natural gas and 33.1% NGLs compared to 24.5% oil, 44.5% natural gas and 31.0% NGLs, respectively.
Mid-Continent total production for the three and nine-month periods ended September 30, 2021 and 2020 was comprised of the following:
| | | | | | | | | | | | | | | | | | | | | | | |
| Three Months Ended September 30, | | Nine Months Ended September 30, |
| 2021 | | 2020 | | 2021 | | 2020 |
| Oil | 12.7 | % | | 13.6 | % | | 13.3 | % | | 15.0 | % |
| NGL | 32.1 | % | | 35.0 | % | | 33.5 | % | | 34.9 | % |
| Natural gas | 55.2 | % | | 51.4 | % | | 53.2 | % | | 50.1 | % |
| Total | 100.0 | % | | 100.0 | % | | 100.0 | % | | 100.0 | % |
Recent Events
•On September 2, 2021, we repaid our $20.0 million term loan in full and terminated all commitments and obligations under the New Credit Facility. Our repayment of the term loan satisfied all of our remaining term debt and revolving debt obligations.
•In August 2021, our Board of Directors (the “Board”) approved the initiation of a share repurchase program (the "Program") authorizing us to purchase up to an aggregate of $25.0 million of our common stock beginning as early as August 16, 2021. The Program is in accordance with Rule 10b-18 of the Exchange Act. Subject to applicable rules and regulations, repurchases under the Program can be made from time to time in open markets at our discretion and in compliance with safe harbor provisions, or in privately negotiated transactions. The Program does not require any specific number of shares to be acquired, and can be modified or discontinued by the Board at any time. We did not repurchase any common stock under the Program during the third quarter ended September 30, 2021.
Outlook
Throughout 2021, we have focused, and will continue to focus, on maximizing free cash flow through a combination of cost control measures and the continued exercise of financial discipline and prudent capital allocation. This combination includes limiting our capital projects to projects we believe will provide high rates of return in the current commodity price environment. Given our levels of capital expenditures in 2020 and 2021, our oil, natural gas and NGL production has declined and may continue to decline prospectively. However, wells brought back online during the period, as well as potential future well reactivations may partially offset the natural decline of our base production. We may consider further expanding our capital program after assessing all factors, including commodity prices. We will also continue our pursuit of acquisitions and business combinations which provide high margin properties with attractive returns at current commodity prices.
As the impact of the COVID-19 lessens, demand for commodities is continuing to rise to pre-pandemic levels with United States commodities inventory being below five-year average levels. The continued demand with the noted lower inventory levels have led to favorable commodity prices during the quarter ended September 30, 2021. However, the spread of COVID-19 variants and the effectiveness of the vaccines against these variants are significant risk factors to a full and sustained recovery. If the vaccines currently available are not effective against COVID-19 or its other variants, we may have to rely on mobility and activity restrictions to mitigate the spread, which could lead to reduced demand for certain products.
Additionally, we have implemented several additional initiatives to maximize free cash flow, our liquidity position and, ultimately realize greater shareholder value. These initiatives included personnel and non-personnel cost reductions, along with the sale of our headquarters during 2020. Prior to February 5, 2021, we held assets in the North Park Basin, which have been sold in their entirety.
Consolidated Results of Operations
The majority of our consolidated revenues and cash flow are generated from the production and sale of oil, natural gas and NGLs. Our revenues, profitability and future growth depend substantially on prevailing prices received for our production, the quantity of oil, natural gas and NGLs we produce, and our ability to find and economically develop and produce our reserves. Prices for oil, natural gas and NGLs fluctuate widely and are difficult to predict. To provide information on the general trend in pricing, the average New York Mercantile Exchange "NYMEX" prices for oil and natural gas are shown in the table below:
| | | | | | | | | | | | | | | | | | | | | | | | | | | | | | | | | | | | | | |
| | | | | | Three month periods ended | | |
| | | | September 30, 2021 | | June 30, 2021 | | March 31, 2021 | | December 31, 2020 | | September 30, 2020 | | |
| NYMEX Oil (per Bbl) | | | | | | $ | 70.59 | | | $ | 66.18 | | | $ | 58.09 | | | $ | 42.58 | | | $ | 40.92 | | | |
| NYMEX Natural gas (per MMBtu) | | | | | | $ | 4.32 | | | $ | 2.98 | | | $ | 2.72 | | | $ | 2.76 | | | $ | 2.12 | | | |
In order to reduce our exposure to price fluctuations, from time to time we enter into commodity derivative contracts for a portion of our anticipated future oil and natural gas production as discussed in “Item 3. Quantitative and Qualitative Disclosures About Market Risk.” During periods where the strike prices for our commodity derivative contracts are below market prices at the time of settlement, we may not fully benefit from increases in the market price of oil and natural gas. Conversely, during periods of declining oil and natural gas market prices, our commodity derivative contracts may partially offset declining revenues and cash flow to the extent strike prices for our contracts are above market prices at the time of settlement.
Revenues
Consolidated revenues for the three and nine-month periods ended September 30, 2021, and 2020 are presented in the table below (in thousands):
| | | | | | | | | | | | | | | | | | | | | | | |
| Three Months Ended September 30, | | Nine Months Ended September 30, |
| 2021 | | 2020 | | 2021 | | 2020 |
| Oil | $ | 15,198 | | | $ | 17,071 | | | $ | 45,412 | | | $ | 57,279 | |
| NGL | 14,863 | | | 4,983 | | | 34,344 | | | 12,508 | |
| Natural gas | 16,523 | | | 5,493 | | | 34,647 | | | 14,347 | |
| Other | — | | | 129 | | | — | | | 526 | |
| Total revenues (1) | $ | 46,584 | | | $ | 27,676 | | | $ | 114,403 | | | $ | 84,660 | |
Oil, Natural Gas and NGL Production and Pricing
Our production and pricing information for the three and nine-month periods ended September 30, 2021, and 2020 is shown in the table below: | | | | | | | | | | | | | | | | | | | | | | | |
| Three Months Ended September 30, | | Nine Months Ended September 30, |
| | | | | | | |
| 2021 | | 2020 | | 2021 | | 2020 |
| | | | | | | |
| | | | | | | |
| | | | | | | |
| | | | | | | |
| | | | | | | |
| | | | | | | |
| | | | | | | |
| | | | | | | |
| | | | | | | |
| | | | | | | |
| | | | | | | |
| | | | | | | |
| | | | | | | |
| | | | | | | |
| | | | | | | |
| | | | | | | |
| | | | | | | |
| | | | | | | |
| | | | | | | |
| | | | | | | |
| | | | | | | |
| Production data | | | | | | | |
| Oil (MBbls) | 219 | | | 454 | | | 734 | | | 1,656 | |
| NGL (MBbls) | 552 | | | 646 | | | 1,686 | | | 2,096 | |
| Natural gas (MMcf) | 5,710 | | | 5,686 | | | 16,059 | | | 18,078 | |
| Total volumes (MBoe) | 1,722 | | | 2,048 | | | 5,096 | | | 6,765 | |
| Average daily total volumes (MBoe/d) | 18.7 | | | 22.3 | | | 18.7 | | | 24.7 | |
| Average prices—as reported (1) | | | | | | | |
| Oil (per Bbl) | $ | 69.40 | | | $ | 37.60 | | | $ | 61.87 | | | $ | 34.59 | |
| NGL (per Bbl) | $ | 26.93 | | | $ | 7.71 | | | $ | 20.37 | | | $ | 5.97 | |
| Natural gas (per Mcf) | $ | 2.89 | | | $ | 0.97 | | | $ | 2.16 | | | $ | 0.79 | |
| Total (per Boe) | $ | 27.06 | | | $ | 13.45 | | | $ | 22.45 | | | $ | 12.44 | |
| Average prices—including impact of derivative contract settlements | | | | | | | |
| Oil (per Bbl) | $ | 69.40 | | | $ | 37.60 | | | $ | 61.87 | | | $ | 40.59 | |
| NGL (per Bbl) | $ | 26.93 | | | $ | 7.71 | | | $ | 20.37 | | | $ | 5.97 | |
| Natural gas (per Mcf) | $ | 2.89 | | | $ | 1.07 | | | $ | 2.16 | | | $ | 0.86 | |
| Total (per Boe) | $ | 27.06 | | | $ | 13.76 | | | $ | 22.45 | | | $ | 14.09 | |
__________________
(1)Prices represent actual average sales prices for the periods presented and do not include effects of derivative settlement.
The table below presents production by area of operation for the three and nine-month periods ended September 30, 2021, and 2020:
| | | | | | | | | | | | | | | | | | | | | | | | | | | | | | | | | | | | | | | | | | | | | | | |
| Three Months Ended September 30, | | Nine Months Ended September 30, |
| | | | | | | |
| 2021 | | 2020 | | 2021 | | 2020 |
| Production (MBoe) | | % of Total | | Production (MBoe) | | % of Total | | Production (MBoe) | | % of Total | | Production (MBoe) | | % of Total |
| | | | | | | | | | | | | | | |
| Mid-Continent | 1,722 | | | 100.0 | % | | 1,845 | | | 90.1 | % | | 5,029 | | | 98.7 | % | | 6,013 | | | 88.9 | % |
| North Park Basin | — | | | — | % | | 203 | | | 9.9 | % | | 67 | | | 1.3 | % | | 752 | | | 11.1 | % |
| Total | 1,722 | | | 100.0 | % | | 2,048 | | | 100.0 | % | | 5,096 | | | 100.0 | % | | 6,765 | | | 100.0 | % |
Variances in oil, natural gas and NGL revenues attributable to changes in the average prices received for our production and total production volumes sold for the three and nine-month periods ended September 30, 2021, and 2020 are shown in the table below (in thousands):
| | | | | | | | | | | |
| Three Months Ended September 30, 2021 | | Nine Months Ended September 30, 2021 |
| 2020 oil, natural gas and NGL revenues | $ | 27,547 | | | $ | 84,134 | |
| Change due to production volumes | (8,819) | | | (37,471) | |
| Change due to average prices | 27,856 | | | 67,740 | |
| 2021 oil, natural gas and NGL revenues | $ | 46,584 | | | $ | 114,403 | |
Revenues from oil, natural gas and NGL sales increased $19.0 million or 69.1% for the three-months ended September 30, 2021 as compared to the three-months ended September 30, 2020. Revenues from oil, natural gas and NGL sales increased
$30.3 million or 36.0% for the nine months ended September 30, 2021 as compared to the nine months ended September 30, 2020. Revenue for the three and nine months ended has increased primarily due to increased oil, natural gas and NGL realized prices primarily as a result of increased economic activity and recovery from the COVID-19 pandemic and the related increase in energy demand, in addition to a contraction of differentials on realized commodity prices offset by a slight decrease in oil revenue due to lower production as a result of the sale of NPB. These increases were partially offset by an overall decline in production due to the natural declines in our existing producing wells and divestiture of the NPB properties.
Mid-Continent and North Park revenues for the three and nine-month periods ended September 30, 2021, and 2020 consisted of the following (in thousands):
| | | | | | | | | | | | | | | | | | | | | | | | | | | | | | | | | | | | | | | | | | | | | | | |
| Three Months Ended September 30, | | Nine Months Ended September 30, |
| 2021 | | 2020 | | 2021 | | 2020 |
| $ | | % of Total | | $ | | % of Total | | $ | | % of Total | | $ | | % of Total |
| Mid-Continent | $ | 46,584 | | | 100.0 | % | | $ | 20,464 | | | 74.3 | % | | $ | 111,233 | | | 97.2 | % | | $ | 59,665 | | | 70.9 | % |
| North Park | $ | — | | | — | % | | $ | 7,083 | | | 25.7 | % | | $ | 3,170 | | | 2.8 | % | | $ | 24,469 | | | 29.1 | % |
See "Item 1A—Risk Factors" included in our 2020 Form 10-K for additional discussion of the potential impact these events may have on our future revenues.
Operating Expenses
Operating expenses for the three and nine-month periods ended September 30, 2021, and 2020 consisted of the following (in thousands): | | | | | | | | | | | | | | | | | | | | | | | |
| Three Months Ended September 30, | | Nine Months Ended September 30, |
| | | | | | | |
| 2021 | | 2020 | | 2021 | | 2020 |
| | | | | | | |
| Lease operating expenses | $ | 9,080 | | | $ | 8,069 | | | $ | 26,266 | | | $ | 32,409 | |
| Production, ad valorem, and other taxes | 2,219 | | | 2,333 | | | 6,929 | | | 7,386 | |
| Depreciation and depletion—oil and natural gas | 2,092 | | | 7,525 | | | 6,790 | | | 45,728 | |
| Depreciation and amortization—other | 1,513 | | | 1,698 | | | 4,482 | | | 6,071 | |
| Total operating expenses | $ | 14,904 | | | $ | 19,625 | | | $ | 44,467 | | | $ | 91,594 | |
| | | | | | | |
| Lease operating expenses ($/Boe) | $ | 5.27 | | | $ | 3.94 | | | $ | 5.15 | | | $ | 4.79 | |
| Production, ad valorem, and other taxes ($/Boe) | $ | 1.29 | | | $ | 1.14 | | | $ | 1.36 | | | $ | 1.09 | |
| Depreciation and depletion—oil and natural gas ($/Boe) | $ | 1.22 | | | $ | 3.67 | | | $ | 1.33 | | | $ | 6.76 | |
| Production, ad valorem, and other taxes (% of oil, natural gas, and NGL revenue) | 4.8 | % | | 8.5 | % | | 6.1 | % | | 8.8 | % |
Lease operating expenses increased by $1.0 million or $1.33/Boe for the three-months ended September 30, 2021, as compared to the three-months ended September 30, 2020. The increase was the result of reactivating wells that are now considered economic due to increased commodity prices. Lease operating expenses decreased by $6.1 million or $0.36/Boe for the nine months ended September 30, 2021, as compared to the nine months ended September 30, 2020. These decreases primarily resulted from field personnel reductions in force, the sale of NPB and other cost reduction efforts.
Production, ad valorem, and other taxes for the three and nine-months ended September 30, 2021 decreased primarily due to a decline in ad valorem taxes due to the sale of NPB in Colorado and a change in estimate for the last ad valorem tax payment related to NPB partially offset by an increase in production taxes due to an increase in revenues as discussed above. Further, they have decreased as a percentage of oil, natural gas, and NGL revenue for the three and nine months ended September 30, 2021 as compared to the same period in 2020, primarily due to the change in estimate for ad valorem taxes.
The average depreciation and depletion rate for our oil and natural gas properties for the three-months ended September 30, 2021 decreased by $2.46/Boe from the three-months ended September 30, 2020. The average depreciation and depletion rate for our oil and natural gas properties for the nine-months ended September 30, 2021 decreased by $5.43/Boe from the nine-months ended September 30, 2020. These decreases are primarily due to the sale of the North Park Basin properties and full cost ceiling test impairments recorded during 2020, which lowered the net cost basis of our oil and gas properties significantly.
Impairment
We did not record a full cost ceiling limitation impairment during the three and nine-months ended September 30, 2021. In the three-month period ended September 30, 2020, we recorded a total impairment charge of $44.0 million. In the nine-month period ended September 30, 2020, we recorded a total impairment charge of $253.8 million, which included a full cost ceiling limitation impairment charge of $215.8 million, and an impairment charge of $38.0 million to write down the value of our office headquarters to its estimated fair value less estimated costs to sell the building. The ceiling limitation impairment charges recorded in the three and nine-month periods ended September 30, 2020, resulted from various factors including a decrease in the trailing twelve-month weighted average natural gas price in 2020.
Calculation of the full cost ceiling test is based on, among other factors, trailing twelve-month SEC Prices as adjusted for price differentials and other contractual arrangements. The SEC Prices utilized in the calculation of proved reserves included in the full cost ceiling test at September 30, 2021 were $57.69 per barrel of oil and $2.94 per Mcf of natural gas, before price differential adjustments.
Based on the SEC Prices over the trailing eleven months ended November 1, 2021, as well as one month of NYMEX strip pricing for December of 2021 as of November 1, 2021, we anticipate the SEC Prices utilized in the December 31, 2021 full cost ceiling test may be $67.97 per barrel of oil and $3.64 per Mcf of natural gas, (the "estimated year-end prices"). Applying these estimated year-end prices, and holding all other inputs constant to those used in the calculation of our September 30, 2021 ceiling test, we expect that no full cost ceiling limitation impairment is indicated for the year-end of 2021.
Any actual full cost ceiling limitation impairment recognized in future quarters may fluctuate significantly from projected amounts based on the outcome of numerous other factors such as declines in the actual trailing twelve-month SEC Prices, lower NGL pricing, changes in estimated future development costs and operating expenses, and other adjustments to our levels of proved reserves. Any such ceiling test impairments in 2021 could be material to our net earnings.
Full cost pool impairments have no impact to our cash flow or liquidity.
Other Operating Expenses
Other operating expenses for the three and nine-month periods ended September 30, 2021, and 2020 consisted of the following (in thousands): | | | | | | | | | | | | | | | | | | | | | | | |
| Three Months Ended September 30, | | Nine Months Ended September 30, |
| | | | | | | |
| 2021 | | 2020 | | 2021 | | 2020 |
| General and administrative | $ | 2,229 | | | $ | 2,493 | | | $ | 6,841 | | | $ | 12,290 | |
| Restructuring expenses | (1,696) | | | 1,199 | | | 614 | | | 1,643 | |
| Employee termination benefits | — | | | 3,184 | | | 49 | | | 8,431 | |
| (Gain) loss on derivative contracts | 4,129 | | | 5,299 | | | 4,129 | | | (7,168) | |
| (Gain) loss on sale of assets | 761 | | | (178) | | | (18,952) | | | (100) | |
| Other operating (income) expense | (202) | | | 62 | | | (315) | | | 369 | |
| Total non-operating expenses | $ | 5,221 | | | $ | 12,059 | | | $ | (7,634) | | | $ | 15,465 | |
General and administrative expenses decreased by $0.3 million for the three-months ended September 30, 2021, compared to the same period in 2020. The decrease related to lower salaries and wages as a result of reductions in personnel costs. General and administrative expenses decreased by $5.4 million for the nine months ended September 30, 2021, compared to the same period in 2020. These decreases resulted primarily from a reduction in compensation related costs after completing reductions in force during 2020, significant reductions in information technology and software costs and overhead related to our previously held corporate headquarters building and other cost reduction efforts. Part of the decrease is also due to reductions in professional costs such as legal expenses, audit fees and consulting services. General and administrative expenses for the first nine months of 2021 were impacted by a legal retainer refund related to prior periods.
Restructuring expenses represent fees and costs associated with the 2016 bankruptcy and exit from NPB in Colorado. Restructuring expenses decreased by $2.9 million for the three-months ended September 30, 2021, compared to the same period in 2020. Restructuring expenses decreased by $1.0 million for the nine months ended September 30, 2021, compared to the same period in 2020. These decreases are primarily related to previously accrued expenses for the 2016 Bankruptcy that were
removed as a result of the notice of completion of final distribution being filed in the United States Bankruptcy Court for the Southern District of Texas on July 26, 2021.
Employee termination benefits for the three and nine-month periods ended September 30, 2021 and 2020 include cash and share-based severance costs incurred for the reduction in force, sale of NPB and other employee terminations in the relevant periods. See “Note 13 - Employee Termination Benefits” in the accompanying unaudited condensed consolidated financial statements for additional discussion of these expenses.
(Gain) loss on sale of assets decreased by $0.9 million for the three-months ended September 30, 2021, compared to the same period in 2020. The decrease primarily relates to a reduction to the NPB sales price as a result of post-closing adjustments. (Gain) loss on sale of assets increased by $18.9 million for the nine months ended September 30, 2021, compared to the same period in 2020. The increase is directly related to the gain on sale for the sale of NPB assets in Colorado in February 2021.
The following table summarizes derivative activity for the three and nine-month periods ended September 30, 2021, and 2020 (in thousands): | | | | | | | | | | | | | | | | | | | | | | | |
| Three Months Ended September 30, | | Nine Months Ended September 30, |
| 2021 | | 2020 | | 2021 | | 2020 |
| (Gain) loss on commodity derivative contracts | $ | 4,129 | | | $ | 5,299 | | | $ | 4,129 | | | $ | (7,168) | |
| Cash received (paid) on settlements | $ | — | | | $ | 619 | | | $ | — | | | $ | 11,197 | |
As applicable, our derivative contracts were not designated as accounting hedges and, as a result, changes in their fair values were recorded each quarter as a component of operating expenses. Management views the settlement of commodity derivative contracts at contractual maturity as adjustments to the price received for oil and natural gas production to determine “effective prices.” In general, cash is received on settlement of contracts due to lower oil and natural gas prices at the time of settlement compared to the contract price for our commodity derivative contracts, and cash is paid on settlement of contracts due to higher oil and natural gas prices at the time of settlement compared to the contract price for our commodity derivative contracts. See further discussion of derivative contracts in “Item 3. Quantitative and Qualitative Disclosures about Market Risk” included in Part I of this Quarterly Report.
Other Income (Expense)
Our other income (expense) for the three and nine-month periods ended September 30, 2021, and 2020 are presented in the table below (in thousands): | | | | | | | | | | | | | | | | | | | | | | | |
| Three Months Ended September 30, | | Nine Months Ended September 30, |
| 2021 | | 2020 | | 2021 | | 2020 |
Other income (expense) | | | | | | | |
Interest expense, net | $ | (256) | | | $ | (569) | | | $ | (387) | | | $ | (1,653) | |
| | | | | | | |
Other income (expense), net | 2,396 | | | (129) | | | 2,711 | | | 5 | |
Total other income (expense) | $ | 2,140 | | | $ | (698) | | | $ | 2,324 | | | $ | (1,648) | |
Interest expense incurred during the three and nine-month periods ended September 30, 2021 is primarily comprised of interest paid on the New Credit Facility. The New Credit Facility has been fully repaid and terminated as of September 2, 2021. As a result of the termination of the New Credit Facility, $0.2 million of deferred financing costs were expensed to Interest expense. Interest expense incurred during the three and nine-month periods ended September 30, 2020 is primarily comprised of interest and fees paid on the prior credit facility that was terminated on November 30, 2020. Interest expense is net of amounts capitalized.
The Other income (expense), net line item for the three and nine-month periods ended September 30, 2021 includes the removal of an allowance for doubtful accounts recorded for the year ended December 31, 2020 as a result of management determining the receivable from a government agency is collectible.
Liquidity and Capital Resources
As of September 30, 2021, we had cash and cash equivalents, including restricted cash, of $99.0 million. The New Credit Facility was terminated, as discussed below. See "Note 8—Long-Term Debt" to the accompanying condensed consolidated financial statements in Item 1 of this Quarterly Report. As of November 5, 2021, we had approximately $115.8 million of cash on hand, including restricted cash. For the next twelve months, we expect to have ample liquidity with cash on hand and cash from operations.
On September 2, 2021, we repaid our $20.0 million term loan in full and terminated all commitments and obligations under the New Credit Facility, between us, as Borrower, IEP Energy Holding LLC, as Lender, and Icahn Agency Services LLC, as Administrative Agent. Our payment to the Lender under the Credit Agreement satisfied all of our term debt and revolving debt obligations. We did not incur any early termination penalties as a result of the repayment of indebtedness or termination of the Credit Agreement.
In August 2021, our Board approved the initiation of a share repurchase program authorizing us to purchase up to an aggregate of $25.0 million of our common stock beginning as early as August 16, 2021. We did not repurchase any common stock under the Program during the third quarter ended September 30, 2021.
Working Capital and Sources and Uses of Cash
Our principal sources of liquidity for the next year include cash flows from operations and cash on hand.
Our working capital increased to $62.1 million at September 30, 2021, compared to a deficit of $18.1 million at December 31, 2020, the positive impact on working capital resulted primarily from an increase in cash and cash equivalents at September 30, 2021 as a result of proceeds from the sale of NPB and cash flows from operations. In addition, accounts payable and accrued liabilities decreased due to our continuous cost reduction efforts, the sale of NPB and the timing of payments.
Cash Flows
Our cash flows from operations are substantially dependent on current and future prices for oil and natural gas, which historically have been, and may continue to be, volatile. Cash flows from operations are also affected by timing of cash receipts and disbursements and changes in other working capital assets and liabilities.
Our cash flows for the nine-month periods ended September 30, 2021, and 2020 are presented in the following table and discussed below (in thousands): | | | | | | | | | | | |
| Nine Months Ended September 30, |
| 2021 | | 2020 |
| Cash flows provided by (used in ) operating activities | $ | 66,315 | | | $ | 27,356 | |
| Cash flows provided by (used in) investing activities | 25,867 | | | 25,857 | |
| Cash flows provided by (used in) financing activities | (21,446) | | | (46,540) | |
| Net increase (decrease) in cash and cash equivalents | $ | 70,736 | | | $ | 6,673 | |
Cash Flows from Operating Activities
The $39.0 million increase in operating cash flows for the nine-month period ended September 30, 2021 compared to the same period in 2020, is primarily due to the increases in revenues as a result of improved commodity prices as discussed above and reductions in expenses due to our cost reduction efforts partially offset by the gain on sale of assets primarily related to NPB.
Cash Flows from Investing Activities
Our cash flows provided in investing activities during the nine-month period ended September 30, 2021 reflects $38.1 million of net cash proceeds from the sale of assets offset primarily by capital expenditures of $8.6 million and acquisition of overriding royalty interests for $3.6 million. See "Note 6—Acquisitions and Divestitures" to the accompanying unaudited condensed consolidated financial statements included in Item 1 of this Quarterly Report for additional information.
During the nine-month period ended September 30, 2020, cash flows provided in investing activities primarily reflects $35.4 million net cash proceeds from the sale of the corporate office building offset by cash payments made for capital expenditures and of acquisition of overriding royalty interests for $3.3 million.
Capital expenditures for the nine-month periods ended September 30, 2021, and 2020 are summarized below (in thousands):
| | | | | | | | | | | |
| Nine Months Ended September 30, |
| 2021 | | 2020 |
| Capital Expenditures | | | |
| Drilling, completion and capital workovers | $ | 6,374 | | | $ | 3,306 | |
| Leasehold and geophysical | 467 | | | 896 | |
| | | |
| | | |
| Capital expenditures, excluding acquisitions (on an accrual basis) | 6,841 | | | 4,202 | |
| Acquisitions | 3,604 | | | 3,276 | |
| Capital expenditures, including acquisitions | 10,445 | | | 7,478 | |
| Change in capital accruals | 1,774 | | | 3,908 | |
| Total cash paid for capital expenditures | $ | 12,219 | | | $ | 11,386 | |
Cash Flows from Financing Activities
Cash used in financing activities for the nine-month period ended September 30, 2021 consisted primarily of repayments of borrowings under the New Credit Facility of $20.0 million, finance lease payments of $0.5 million and cash paid for tax obligations on vested stock awards of $0.9 million.
Cash used by financing activities for the nine-month period ended September 30, 2020 consisted primarily of repayments of borrowings under the credit facility of $84.5 million, finance lease payments of $1.0 million and cash paid for tax obligations on vested stock awards of $0.1 million partially offset by borrowings of $39.0 million.
Indebtedness
See “Note 8—Long-Term Debt” to the accompanying unaudited condensed consolidated financial statements for additional discussion of our debt at September 30, 2021 and December 31, 2020.
Contractual Obligations and Off-Balance Sheet Arrangements
At September 30, 2021, our contractual obligations included asset retirement obligations, short-term leases and other individually insignificant obligations. Additionally, we have certain financial instruments representing potential commitments that were incurred in the normal course of business to support our operations, including surety bonds. The underlying liabilities insured by these instruments are reflected in our balance sheets, where applicable. Therefore, no additional liability is reflected for the surety bonds or other instruments.
There were no other significant changes in total contractual obligations and off-balance sheet arrangements from those reported in the 2020 Form 10-K.
Critical Accounting Policies and Estimates
ITEM 3. Quantitative and Qualitative Disclosures About Market Risk
General
This discussion provides information about the financial instruments we use to manage commodity prices. All contracts are settled in cash and do not require the actual delivery of a commodity at settlement. Additionally, our exposure to credit risk and interest rate risk is also discussed.
Commodity Price Risk. Our most significant market risk relates to the prices we receive for our oil, natural gas and NGLs. Due to the historical price volatility of these commodities, from time to time, depending upon our view of opportunities under the then-prevailing current market conditions, we enter into commodity derivative contracts for a portion of our anticipated production volumes for the purpose of reducing the impact of the variability of oil and natural gas prices.
We may use a variety of commodity-based derivative contracts, including fixed price swaps, basis swaps and collars. At September 30, 2021, the Company's open derivative contracts consisted of natural gas and NGL commodity derivative contracts under which we will receive a fixed price for the contract and pay a floating market price to the counterparty over a specified period for a contracted volume. These commodity derivative contracts consisted of the following:
| | | | | | | | | | | | | | | | | | | | |
| | Notional | | Units | | Weighted Average Fixed Price per Unit |
| NGL Price Swaps: October 2021 - February 2022 | | 2,605,000 | | | Gallons | | $ | 1.20 | |
| Natural Gas Price Swaps: October 2021 - February 2022 | | 1,800,000 | | | MMBtu | | $ | 4.07 | |
Because we have not designated any of our derivative contracts as hedges for accounting purposes, changes in the fair value of our derivative contracts were recognized as gains and losses in current period earnings. As a result, and when applicable, current period earnings could have been significantly affected by changes in the fair value of our commodity derivative contracts. Changes in fair value were principally measured based on a comparison of future prices to the contract price at the end of the period.
The following table summarizes derivative activity for the three-and nine-month periods ended September 30, 2021, and 2020 (in thousands): | | | | | | | | | | | | | | | | | | | | | | | |
| Three Months Ended September 30, | | Nine Months Ended September 30, |
| 2021 | | 2020 | | 2021 | | 2020 |
| (Gain) loss on commodity derivative contracts | $ | 4,129 | | | $ | 5,299 | | | $ | 4,129 | | | $ | (7,168) | |
| Cash received (paid) on settlements | $ | — | | | $ | 619 | | | $ | — | | | $ | 11,197 | |
See “Note 3 - Derivatives” to the accompanying unaudited condensed consolidated financial statements included in this Quarterly Report for additional information regarding our commodity derivatives.
Credit Risk. As applicable, we are exposed to credit risk related to counterparties to our derivative financial contracts. All of our derivative transactions have been carried out in the over-the-counter market. The use of derivative transactions in over-the-counter markets involves the risk that the counterparties may be unable to meet the financial terms of the transactions. The counterparties for all of our derivative transactions have had an “investment grade” credit rating. We have monitored the credit ratings of our derivative counterparties and considered our counterparties’ credit default risk ratings in determining the fair value of our derivative contracts. Our derivative contracts have historically been with multiple counterparties to minimize exposure to any individual counterparty, and in addition our counterparties have been large financial institutions.
We do not require collateral or other security from counterparties to support derivative instruments. We have master netting agreements with our derivative contract counterparties, which allows us to net our derivative assets and liabilities by commodity type with the same counterparty. As a result of the netting provisions, our maximum amount of loss under derivative transactions due to credit risk is limited to the net amounts due from the counterparties under the commodity derivative contracts. Therefore, we are not required to post additional collateral under our commodity derivative contracts.
We are also exposed to credit risk related to the collection of receivables from our joint interest partners for their proportionate share of expenditures made on projects we operate. Historically, our credit losses on joint interest receivables have been immaterial.
Interest Rate Risk. We are not exposed to interest rate risk as of September 30, 2021.
ITEM 4. Controls and Procedures
Disclosure Controls and Procedures
Under the supervision and with the participation of the Company’s management, including the Company’s CEO and CFO, the Company performed an evaluation of the effectiveness of the design and operation of its disclosure controls and procedures pursuant to Exchange Act Rules 13a-15 and 15d-15 as of the end of the period covered by this Quarterly Report. Based on that evaluation, the Company’s CEO and CFO concluded that the Company’s disclosure controls and procedures were effective as of September 30, 2021, to provide reasonable assurance that the information required to be disclosed by the Company in its reports filed or submitted under the Exchange Act is recorded, processed, summarized and reported within the time periods specified in the rules and forms of the Securities and Exchange Commission, and such information is accumulated and communicated to management, as appropriate to allow timely decisions regarding required disclosure.
Changes in Internal Control Over Financial Reporting
There was no change in the Company’s internal control over financial reporting during the quarter ended September 30, 2021 that has materially affected, or is reasonably likely to materially affect, the Company’s internal control over financial reporting.
PART II. Other Information
ITEM 1. Legal Proceedings
See "Note 9—Commitments and Contingencies” to the accompanying condensed consolidated financial statements in Item 1 of this Quarterly Report.
ITEM 1A. Risk Factors
There have been no material changes to the risk factors previously discussed in Item 1A—Risk Factors in the Company's 2020 Form 10-K.
ITEM 2. Unregistered Sales of Equity Securities and Use of Proceeds
The following table presents a summary of share repurchases made by the Company during the three-month period ended September 30, 2021. | | | | | | | | | | | | | | | | | | | | | | | |
| Period | Total Number of Shares Purchased(1) | | Average Price Paid per Share | | Total Number of Shares Purchased as Part of Publicly Announced Program | | Maximum Approximate Dollar Value of Shares that May Yet Be Purchased Under the Program
(in Millions) |
| July 1, 2021 - July 31, 2021 | 2,431 | | | $ | 6.30 | | | N/A | | N/A |
| August 1, 2021 - August 31, 2021 | 33,032 | | | $ | 8.20 | | | N/A | | N/A |
| September 1, 2021 - September 30, 2021 | — | | | $ | — | | | N/A | | N/A |
| Total | 35,463 | | | | | — | | | |
___________________
(1) Includes shares of common stock tendered by employees in order to satisfy tax withholding requirements upon vesting of their stock awards. Shares withheld are initially recorded as treasury shares, then immediately retired.
ITEM 3. Defaults Upon Senior Securities
None.
ITEM 4. Mine Safety Disclosures
Not applicable.
ITEM 5. Other Information
None.
ITEM 6. Exhibits
| | | | | | | | | | | | | | | | | | | | | | | | | | | | | | | | |
| | Incorporated by Reference | | |
Exhibit No. | Exhibit Description | Form | | SEC File No. | | Exhibit | | Filing Date | | Filed Herewith |
| 2.1 |
| 8-A | | 001-33784 | | 2.1 | | 10/4/2016 | | |
| 3.1 |
| 8-A | | 001-33784 | | 3.1 | | 10/4/2016 | | |
| 3.2 |
| 8-A | | 001-33784 | | 3.2 | | 10/4/2016 | | |
| 4.7 | | 8-K | | 001-33784 | | 4.1 | | 3/16/2021 | | |
| 31.1 | | | | | | | | | | * |
| 31.2 | | | | | | | | | | * |
| 32.1 | | | | | | | | | | * |
| 101.INS | XBRL Instance Document - the instance document does not appear in the Interactive Data File because its XBRL tags are embedded within the Inline XBRL document. | | | | | | | | | * |
| 101.SCH | XBRL Taxonomy Extension Schema Document | | | | | | | | | * |
| 101.CAL | XBRL Taxonomy Extension Calculation Linkbase Document | | | | | | | | | * |
| 101.DEF | XBRL Taxonomy Extension Definition Document | | | | | | | | | * |
| 101.LAB | XBRL Taxonomy Extension Label Linkbase Document | | | | | | | | | * |
| 101.PRE | XBRL Taxonomy Extension Presentation Linkbase Document | | | | | | | | | * |
| 104 | Cover Page Interactive Data File (formatted as Inline XBRL and contained in Exhibit 101) | | | | | | | | | * |
| | | | | | | | | |
SIGNATURE
Pursuant to the requirements of the Securities Exchange Act of 1934, the registrant has duly caused this report to be signed on its behalf by the undersigned thereunto duly authorized.
| | | | | | | | |
| SandRidge Energy, Inc. |
| | |
Date: November 10, 2021 | By: | /s/ Salah Gamoudi |
| | Salah Gamoudi Senior Vice President, Chief Financial Officer and Chief Accounting Officer (Principal Financial and Accounting Officer) |