UNITED STATES
SECURITIES AND EXCHANGE COMMISSION
WASHINGTON, D.C. 20549
FORM N-CSR
CERTIFIED SHAREHOLDER REPORT OF REGISTERED
MANAGEMENT INVESTMENT COMPANIES
Investment Company Act file number: 811-21829
BBH TRUST
On behalf of the following series:
BBH Core Select
BBH Global Core Select
BBH Partner Fund - International Equity
BBH Limited Duration Fund
BBH Intermediate Municipal Bond Fund
(Exact name of registrant as specified in charter)
140 Broadway, New York, NY 10005
(Address of principal executive offices) (Zip Code)
Corporation Services Company
2711 Centerville Road, Suite 400, Wilmington, DE 19808
(Name and address of agent for service)
Registrant's telephone number, including area code: (800) 575-1265
Date of fiscal year end: October 31
Date of reporting period: October 31, 2017
Item 1. Report to Stockholders.

BBH CORE SELECT
MANAGEMENT’S DISCUSSION OF FUND PERFORMANCE
October 31, 2017
BBH CORE SELECT
MANAGEMENT’S DISCUSSION OF FUND PERFORMANCE (continued)
October 31, 2017
population of large-cap momentum leaders in particular) stand as evidence of the prevailing market views, in our opinion. Stated differently, many investors appear to be primarily concerned about capturing additional upside and keeping pace with equity indices. In this context, we remain cautious regarding valuation levels and the potentially disruptive effects of swelling global debt levels, monetary policy overreach and the buildup of one-way bets behind factors such as momentum and low volatility. For Core Select, we remain focused on our fundamental principles and our valuation discipline with the goal of maintaining a quantitative and qualitative margin of safety in each of our holdings and delivering attractive compound returns over long periods of time.
|
|
BBH CORE SELECT
MANAGEMENT’S DISCUSSION OF FUND PERFORMANCE (continued)
October 31, 2017
expectations. Difficult transitions in the Company’s business model, consumer behavior and the retail competitive environment reduced our level of certainty regarding the range of potential long-term outcomes for the business.
BBH CORE SELECT
MANAGEMENT’S DISCUSSION OF FUND PERFORMANCE (continued)
October 31, 2017
|
|
BBH CORE SELECT
MANAGEMENT’S DISCUSSION OF FUND PERFORMANCE (continued)
October 31, 2017
|
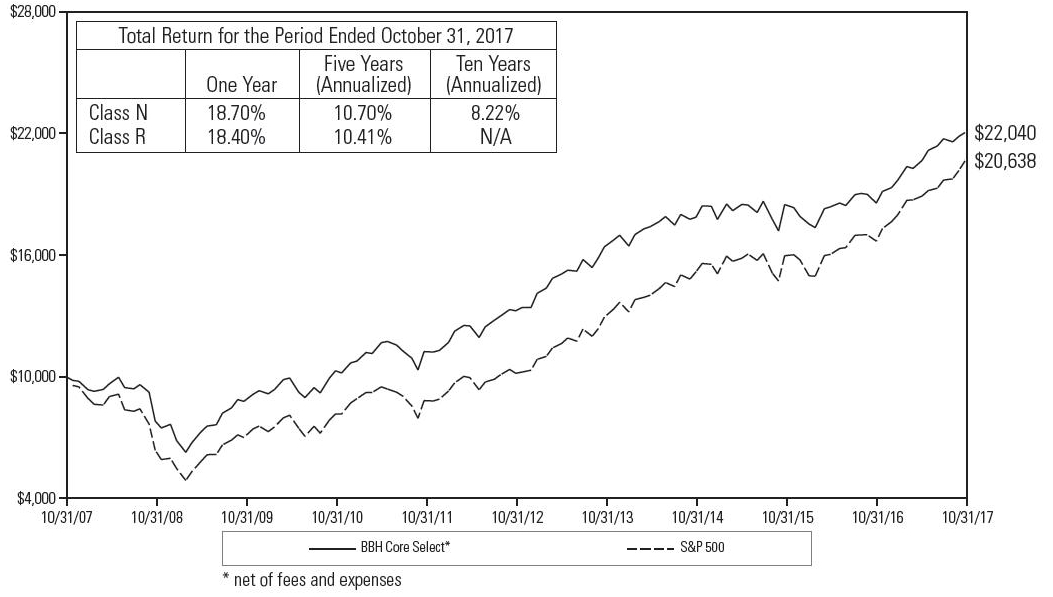
| 1 | The Fund’s performance assumes the reinvestment of all dividends and distributions. The S&P 500 has been adjusted to reflect reinvestment of dividends on securities. The S&P 500 is not adjusted to reflect sales charges, expenses or other fees that the Securities and Exchange Commission requires to be reflected in the Fund’s performance. The index is unmanaged. Investments cannot be made in an index. |
BBH CORE SELECT
REPORT OF INDEPENDENT REGISTERED PUBLIC ACCOUNTING FIRM
December 22,
2017
|
|
BBH CORE SELECT
PORTFOLIO ALLOCATION
October 31, 2017
| U.S. $ Value |
Percent of Net Assets |
|||||||||
Common Stocks: |
||||||||||
Basic Materials |
$ | 156,101,576 | 5.7 | % | ||||||
Communications |
461,402,275 | 16.8 | ||||||||
Consumer Cyclical |
68,136,826 | 2.5 | ||||||||
Consumer Non-Cyclical |
938,304,702 | 34.3 | ||||||||
Financials |
511,587,943 | 18.7 | ||||||||
Industrials |
46,230,567 | 1.7 | ||||||||
Technology |
360,119,446 | 13.1 | ||||||||
Repurchase Agreements |
118,000,000 | 4.3 | ||||||||
U.S. Treasury Bills |
74,861,167 | 2.7 | ||||||||
Cash and Other Assets in Excess of Liabilities |
4,255,510 | 0.2 | ||||||||
NET ASSETS |
$ | 2,739,000,012 | 100.0 | % | ||||||
The accompanying notes are an integral part of these
financial statements.
BBH CORE SELECT
PORTFOLIO OF INVESTMENTS
October 31, 2017
| Shares |
Value |
|||||
COMMON STOCKS (92.8%) |
||||||
BASIC MATERIALS (5.7%) |
||||||
| 744,968 | Celanese Corp. (Series A) |
$ | 77,707,612 | |||
| 536,504 | Praxair, Inc. |
78,393,964 | ||||
Total Basic Materials |
156,101,576 | |||||
COMMUNICATIONS (16.8%) |
||||||
| 167,678 | Alphabet, Inc. (Class C)1 |
170,468,162 | ||||
| 4,423,676 | Comcast Corp. (Class A) |
159,385,046 | ||||
| 3,241,263 | Discovery Communications, Inc. (Class C)1 |
57,726,894 | ||||
| 2,469,795 | Liberty Global, Plc. (Class C) (United Kingdom)1 |
73,822,173 | ||||
Total Communications |
461,402,275 | |||||
CONSUMER CYCLICAL (2.5%) |
||||||
| 2,998,980 | Liberty Interactive Corp. QVC Group (Class A)1 |
68,136,826 | ||||
Total Consumer Cyclical |
68,136,826 | |||||
CONSUMER NON-CYCLICAL (34.3%) |
||||||
| 375,666 | Dentsply Sirona, Inc. |
22,941,923 | ||||
| 721,381 | Diageo, Plc. ADR (United Kingdom) |
98,836,411 | ||||
| 625,913 | FleetCor Technologies, Inc.1 |
103,444,641 | ||||
| 479,250 | Henry Schein, Inc.1 |
37,669,050 | ||||
| 2,234,524 | Kroger Co. |
46,254,647 | ||||
| 654,050 | Nestle SA ADR (Switzerland) |
55,090,631 | ||||
| 1,660,410 | Nielsen Holdings, Plc. (United Kingdom) |
61,551,399 | ||||
| 1,605,487 | Novartis AG ADR (Switzerland) |
132,581,116 | ||||
| 1,235,889 | PayPal Holdings, Inc.1 |
89,676,106 | ||||
| 839,529 | Perrigo Co., Plc. (Ireland) |
67,993,454 | ||||
| 2,725,986 | Sabre Corp. |
53,320,286 | ||||
| 1,169,458 | Unilever NV (NY Shares) (Netherlands) |
67,781,786 | ||||
| 1,585,134 | Zoetis, Inc. |
101,163,252 | ||||
Total Consumer Non-Cyclical |
938,304,702 | |||||
The accompanying notes are an integral part of these
financial statements.
|
|
BBH CORE SELECT
PORTFOLIO OF INVESTMENTS (continued)
October 31, 2017
| Shares |
Value | |||||
COMMON STOCKS (continued) |
||||||
FINANCIALS (18.7%) |
||||||
| 735 | Berkshire Hathaway, Inc. (Class A)1 |
$ | 206,145,450 | |||
| 2,780,480 | US Bancorp |
151,202,503 | ||||
| 2,747,417 | Wells Fargo & Co. |
154,239,990 | ||||
Total Financials |
511,587,943 | |||||
INDUSTRIALS (1.7%) |
||||||
| 562,621 | Waste Management, Inc. |
46,230,567 | ||||
Total Industrials |
46,230,567 | |||||
TECHNOLOGY (13.1%) |
||||||
| 1,003,683 | Microsoft Corp. |
83,486,352 | ||||
| 4,120,235 | Oracle Corp. |
209,719,961 | ||||
| 1,311,765 | QUALCOMM, Inc. |
66,913,133 | ||||
Total Technology |
360,119,446 | |||||
Total Common Stocks (Identified cost $1,538,265,807) |
2,541,883,335 | |||||
The accompanying notes are an integral part of these
financial statements.
BBH CORE SELECT
PORTFOLIO OF INVESTMENTS (continued)
October 31, 2017
| Principal Amount |
Maturity Date |
Interest Rate |
Value |
|||||||||||||||
REPURCHASE AGREEMENTS (4.3%) |
||||||||||||||||||
| $118,000,000 | National Australia Bank, Ltd. (Agreement dated 10/31/17 collateralized by U.S. Treasury Notes 1.375%, due 05/31/20, original par
$120,725,000, valued at $120,360,000 |
11/01/17 | 1.000 | % | $ | 118,000,000 | ||||||||||||
Total Repurchase Agreements (Identified cost $118,000,000) |
118,000,000 | |||||||||||||||||
U.S. TREASURY BILLS (2.7%) |
||||||||||||||||||
| 75,000,000 | U.S. Treasury Bills2 |
01/04/18 | 0.000 | 74,861,167 | ||||||||||||||
Total U.S. Treasury Bills (Identified cost $74,860,667) |
74,861,167 | |||||||||||||||||
| TOTAL INVESTMENTS (Identified cost $1,731,126,474)3 | 99.8 | % | $ | 2,734,744,502 | ||||||||||||||
| CASH AND OTHER ASSETS IN EXCESS OF LIABILITIES | 0.2 | % | 4,255,510 | |||||||||||||||
| NET ASSETS | 100.0 | % | $ | 2,739,000,012 | ||||||||||||||
| 1 | Non-income producing security. |
| 2 | Security issued with a zero coupon. Income is recognized through accretion of discount. |
| 3 | The aggregate cost for federal income tax purposes is $1,731,516,762, the aggregate gross unrealized appreciation is $1,063,449,957 and the aggregate gross unrealized depreciation is $60,222,217, resulting in net unrealized appreciation of $1,003,227,740. |
The accompanying notes are an integral part of these
financial statements.
|
|
BBH CORE SELECT
PORTFOLIO OF INVESTMENTS (continued)
October 31, 2017
— |
Level 1 – unadjusted quoted prices in active markets for identical assets and liabilities. |
— |
Level 2 – significant other observable inputs (including quoted prices for similar assets and liabilities, interest rates, prepayment speeds, credit risk, etc.). |
— |
Level 3 – significant unobservable inputs (including the Fund’s own assumptions in determining the fair value of assets and liabilities). |
The accompanying notes are an integral part of these
financial statements.
BBH CORE SELECT
PORTFOLIO OF INVESTMENTS (continued)
October 31, 2017
| Investments, at value |
Unadjusted Quoted Prices in Active Markets for Identical Investments (Level 1)* |
Significant Other Observable Inputs (Level 2)* |
Significant Unobservable Inputs (Level 3)* |
Balance as of October 31, 2017 |
||||||||||||||
Common Stocks: |
||||||||||||||||||
Basic Materials |
$ | 156,101,576 | $ | — | $ | — | $ | 156,101,576 | ||||||||||
Communications |
461,402,275 | — | — | 461,402,275 | ||||||||||||||
Consumer Cyclical |
68,136,826 | — | — | 68,136,826 | ||||||||||||||
Consumer Non-Cyclical |
938,304,702 | — | — | 938,304,702 | ||||||||||||||
Financials |
511,587,943 | — | — | 511,587,943 | ||||||||||||||
Industrials |
46,230,567 | — | — | 46,230,567 | ||||||||||||||
Technology |
360,119,446 | — | — | 360,119,446 | ||||||||||||||
Repurchase Agreements |
— | 118,000,000 | — | 118,000,000 | ||||||||||||||
U.S. Treasury Bills |
— | 74,861,167 | — | 74,861,167 | ||||||||||||||
Investments, at value |
$ | 2,541,883,335 | $ | 192,861,167 | $ | — | $ | 2,734,744,502 | ||||||||||
* |
The Fund’s policy is to disclose transfers between levels based on valuations at the end of the reporting period. There were no transfers between Levels 1, 2 or 3 during the period ended October 31, 2017. |
The accompanying notes are an integral part of these
financial statements.
|
|
BBH CORE SELECT
STATEMENT OF ASSETS AND LIABILITIES
October 31, 2017
| ASSETS: | ||||||
Investments in securities, at value (Identified cost $1,613,126,474) |
$ | 2,616,744,502 | ||||
Repurchase agreements (Identified cost $118,000,000) |
118,000,000 | |||||
Cash |
1,762,243 | |||||
Receivables for: |
||||||
Dividends |
6,955,893 | |||||
Shares sold |
1,128,804 | |||||
Investment advisory and administrative fees waiver reimbursement |
29,444 | |||||
Interest |
3,278 | |||||
Prepaid assets |
22,462 | |||||
Total Assets |
2,744,646,626 | |||||
LIABILITIES: |
||||||
Payables for: |
||||||
Shares redeemed |
2,496,431 | |||||
Investment advisory and administrative fees |
1,824,843 | |||||
Investments purchased |
582,657 | |||||
Shareholder servicing fees |
456,211 | |||||
Professional fees |
90,293 | |||||
Distributor fees |
40,728 | |||||
Transfer agent fees |
36,294 | |||||
Custody and fund accounting fees |
25,157 | |||||
Board of Trustees’ fees |
354 | |||||
Accrued expenses and other liabilities |
93,646 | |||||
Total Liabilities |
5,646,614 | |||||
NET ASSETS |
$ | 2,739,000,012 | ||||
Net
Assets Consist of: |
||||||
Paid-in capital |
$ | 1,315,175,164 | ||||
Undistributed net investment income |
12,701,945 | |||||
Accumulated net realized gain on investments in securities |
407,504,875 | |||||
Net unrealized appreciation/(depreciation) on investments in securities |
1,003,618,028 | |||||
Net Assets |
$ | 2,739,000,012 | ||||
NET ASSET VALUE AND OFFERING PRICE PER SHARE |
||||||
CLASS N SHARES |
||||||
($2,591,726,947 ÷ 111,832,146 shares outstanding) |
$23.18 |
|||||
RETAIL CLASS SHARES |
||||||
($147,273,065 ÷ 10,899,133 shares outstanding) |
$13.51 |
The accompanying notes are an integral part of these
financial statements.
BBH CORE SELECT
STATEMENT OF OPERATIONS
For the year ended October 31, 2017
NET INVESTMENT INCOME: |
||||||
Income: |
||||||
Dividends (net of foreign withholding taxes of $1,513,774) |
$ | 44,189,846 | ||||
Interest income |
1,553,951 | |||||
Other income |
422 | |||||
Total Income |
45,744,219 | |||||
Expenses: |
||||||
Investment advisory and administrative fees |
24,983,386 | |||||
Shareholder servicing fees |
6,269,383 | |||||
Distributors fees |
474,200 | |||||
Transfer agent fees |
223,451 | |||||
Custody and fund accounting fees |
174,287 | |||||
Professional fees |
100,718 | |||||
Board of Trustees’ fees |
54,853 | |||||
Miscellaneous expenses |
304,068 | |||||
Total Expenses |
32,584,346 | |||||
Investment advisory and administrative fees waiver |
(806,872 | ) | ||||
Expense offset arrangement |
(16,863 | ) | ||||
Net Expenses |
31,760,611 | |||||
Net Investment Income |
13,983,608 | |||||
NET REALIZED AND UNREALIZED GAIN: |
||||||
Net realized gain on investments in securities |
542,225,458 | |||||
Net change in unrealized appreciation/(depreciation) on investments in securities |
(1,648,305 | ) | ||||
Net Realized and Unrealized Gain |
540,577,153 | |||||
Net Increase in Net Assets Resulting from Operations |
$ | 554,560,761 |
The accompanying notes are an integral part of these
financial statements.
|
|
BBH CORE SELECT
STATEMENTS OF CHANGES IN NET ASSETS
| For the years ended October 31, |
|||||||||||
| 2017 |
2016 |
||||||||||
DECREASE IN NET ASSETS: |
|||||||||||
Operations: |
|||||||||||
Net investment income |
$ | 13,983,608 | $ | 23,194,771 | |||||||
Net realized gain on investments in securities |
542,225,458 | 344,540,579 | |||||||||
Net change in unrealized appreciation/(depreciation) on investments in securities |
(1,648,305 | ) | (380,299,794 | ) | |||||||
Net increase/(decrease) in net assets resulting from operations |
554,560,761 | (12,564,444 | ) | ||||||||
Dividends and distributions declared: |
|||||||||||
From net investment income: |
|||||||||||
Class N |
(20,614,105 | ) | (24,454,690 | ) | |||||||
Retail Class |
(1,323,018 | ) | (1,357,111 | ) | |||||||
From net realized gains: |
|||||||||||
Class N |
(242,554,177 | ) | (314,097,487 | ) | |||||||
Retail Class |
(20,839,178 | ) | (29,099,366 | ) | |||||||
Total dividends and distributions declared |
(285,330,478 | ) | (369,008,654 | ) | |||||||
Share transactions: |
|||||||||||
Proceeds from sales of shares* |
263,771,524 | 347,243,754 | |||||||||
Net asset value of shares issued to shareholders for reinvestment of dividends and distributions |
204,685,714 | 312,156,128 | |||||||||
Proceeds from short-term redemption fees |
14,407 | 21,134 | |||||||||
Cost of shares redeemed* |
(1,579,605,854 | ) | (1,947,081,352 | ) | |||||||
Net decrease in net assets resulting from share transactions |
(1,111,134,209 | ) | (1,287,660,336 | ) | |||||||
Total decrease in net assets |
(841,903,926 | ) | (1,669,233,434 | ) | |||||||
NET ASSETS: |
|||||||||||
Beginning of year |
3,580,903,938 | 5,250,137,372 | |||||||||
End of year (including undistributed net investment income of $12,701,945 and $20,655,460, respectively) |
$ | 2,739,000,012 | $ | 3,580,903,938 | |||||||
* |
Includes share exchanges. See Note 5 in Notes to Financial Statements. |
The accompanying notes are an integral part of these
financial statements.
BBH CORE SELECT
FINANCIAL HIGHLIGHTS
Selected per share data and ratios for a Class N share outstanding throughout each
year.
| For the years ended October 31, |
|||||||||||||||||||||||
| 2017 |
2016 |
2015 |
2014 |
2013 |
|||||||||||||||||||
Net asset value, beginning of year |
$ | 21.15 | $ | 22.79 | $ | 22.52 | $ | 21.21 | $ | 17.46 | |||||||||||||
Income from investment operations: |
|||||||||||||||||||||||
Net investment income1 |
0.10 | 0.12 | 0.12 | 0.14 | 0.13 | ||||||||||||||||||
Net realized and unrealized gain (loss) |
3.64 | (0.08 | ) | 0.64 | 1.70 | 3.95 | |||||||||||||||||
Total income from investment operations |
3.74 | 0.04 | 0.76 | 1.84 | 4.08 | ||||||||||||||||||
Less dividends and distributions: |
|||||||||||||||||||||||
From net investment income |
(0.13 | ) | (0.12 | ) | (0.14 | ) | (0.10 | ) | (0.10 | ) | |||||||||||||
From net realized gains |
(1.58 | ) | (1.56 | ) | (0.35 | ) | (0.43 | ) | (0.23 | ) | |||||||||||||
Total dividends and distributions |
(1.71 | ) | (1.68 | ) | (0.49 | ) | (0.53 | ) | (0.33 | ) | |||||||||||||
Short-term redemption fees1,2 |
0.00 | 0.00 | 0.00 | 0.00 | 0.00 | ||||||||||||||||||
Net asset value, end of year |
$ | 23.18 | $ | 21.15 | $ | 22.79 | $ | 22.52 | $ | 21.21 | |||||||||||||
Total return |
18.70 | % | 0.40 | % | 3.47 | % | 8.90 | % | 23.78 | % | |||||||||||||
Ratios/Supplemental data: |
|||||||||||||||||||||||
Net assets, end of year (in millions) |
$ | 2,592 | $ | 3,403 | $ | 4,970 | $ | 5,816 | $ | 5,645 | |||||||||||||
Ratio of expenses to average net assets before reductions |
1.02 | % | 1.01 | % | 1.07 | % | 1.07 | % | 1.09 | % | |||||||||||||
Fee waiver |
0.02 | %3 | 0.01 | %3 | 0.07 | %3 | 0.07 | %3 | 0.09 | %3 | |||||||||||||
Expense offset arrangement |
0.00 | %4 | 0.00 | %4 | 0.00 | %4 | 0.00 | %4 | 0.00 | %4 | |||||||||||||
Ratio of expenses to average net assets after reductions |
1.00 | % | 1.00 | % | 1.00 | % | 1.00 | % | 1.00 | % | |||||||||||||
Ratio of net investment income to average net assets |
0.46 | % | 0.57 | % | 0.53 | % | 0.66 | % | 0.65 | % | |||||||||||||
Portfolio turnover rate |
15 | % | 12 | % | 8 | % | 8 | % | 12 | % | |||||||||||||
| 1 | Calculated using average shares outstanding for the year. |
| 2 | Less than $0.01. |
| 3 | The ratio of expenses to average net assets for the years ended October 31, 2017, 2016, 2015, 2014 and 2013, reflect fees reduced as result of a contractual operating expense limitation of the share class of 1.00%. The agreement is effective for all periods presented and is effective through March 1, 2018 unless renewed by all parties to the agreement. For the years ended October 31, 2017, 2016, 2015, 2014 and 2013, the waived fees were $673,403, $531,298, $3,938,986, $4,238,260 and $3,983,262, respectively. |
| 4 | Less than 0.01%. |
The accompanying notes are an integral part of these
financial statements.
|
|
BBH CORE SELECT
FINANCIAL HIGHLIGHTS (continued)
Selected per share data and ratios for a Retail Class share outstanding throughout each
year.
| For the years ended October 31, |
|||||||||||||||||||||||
| 2017 |
2016 |
2015 |
2014 |
2013 |
|||||||||||||||||||
Net asset value, beginning of year |
$ | 13.00 | $ | 14.65 | $ | 14.66 | $ | 13.99 | $ | 11.61 | |||||||||||||
Income from investment operations: |
|||||||||||||||||||||||
Net investment income1 |
0.03 | 0.05 | 0.03 | 0.06 | 0.06 | ||||||||||||||||||
Net realized and unrealized gain (loss) |
2.16 | (0.07 | ) | 0.42 | 1.11 | 2.60 | |||||||||||||||||
Total income/(loss) from investment operations |
2.19 | (0.02 | ) | 0.45 | 1.17 | 2.66 | |||||||||||||||||
Less dividends and distributions: |
|||||||||||||||||||||||
From net investment income |
(0.10 | ) | (0.07 | ) | (0.11 | ) | (0.07 | ) | (0.05 | ) | |||||||||||||
From net realized gains |
(1.58 | ) | (1.56 | ) | (0.35 | ) | (0.43 | ) | (0.23 | ) | |||||||||||||
Total dividends and distributions |
(1.68 | ) | (1.63 | ) | (0.46 | ) | (0.50 | ) | (0.28 | ) | |||||||||||||
Short-term redemption fees1,2 |
0.00 | 0.00 | 0.00 | 0.00 | 0.00 | ||||||||||||||||||
Net asset value, end of year |
$ | 13.51 | $ | 13.00 | $ | 14.65 | $ | 14.66 | $ | 13.99 | |||||||||||||
Total return |
18.40 | % | 0.19 | % | 3.14 | % | 8.63 | % | 23.42 | % | |||||||||||||
Ratios/Supplemental data: |
|||||||||||||||||||||||
Net assets, end of year (in millions) |
$ | 147 | $ | 178 | $ | 280 | $ | 400 | $ | 367 | |||||||||||||
Ratio of expenses to average net assets before reductions |
1.33 | % | 1.33 | % | 1.39 | % | 1.40 | % | 1.42 | % | |||||||||||||
Fee waiver |
0.08 | %3 | 0.10 | %3 | 0.14 | %3 | 0.15 | %3 | 0.17 | %3 | |||||||||||||
Expense offset arrangement |
0.00 | %4 | 0.00 | %4 | 0.00 | %4 | 0.00 | %4 | 0.00 | %4 | |||||||||||||
Ratio of expenses to average net assets after reductions |
1.25 | % | 1.23 | % | 1.25 | % | 1.25 | % | 1.25 | % | |||||||||||||
Ratio of net investment income to average net assets |
0.21 | % | 0.37 | % | 0.24 | % | 0.40 | % | 0.44 | % | |||||||||||||
Portfolio turnover rate |
15 | % | 12 | % | 8 | % | 8 | % | 12 | % | |||||||||||||
| 1 | Calculated using average shares outstanding for the year. |
| 2 | Less than $0.01. |
| 3 | The ratio of expenses to average net assets for the years ended October 31, 2017, 2016, 2015, 2014 and 2013, reflect fees reduced as result of contractual operating expense limitation of the share class of 1.25%. The agreement is effective for all periods presented and is effective through March 1, 2018, unless renewed by all parties to the agreement. For the years ended October 31, 2017, 2016, 2015, 2014 and 2013, the waived fees were $133,469, 234,959, $551,384, $577,948 and $568,410, respectively. |
| 4 | Less than 0.01%. |
The accompanying notes are an integral part of these
financial statements.
BBH CORE SELECT
NOTES TO FINANCIAL STATEMENTS
October 31, 2017
1. |
Organization. The Fund is a separate, non-diversified series of BBH Trust (the “Trust”), which is registered under the Investment Company Act of 1940, as amended (the “1940 Act”), as an open-end management investment company. The Trust was originally organized under the laws of the State of Maryland on July 16, 1990 as BBH Fund, Inc. and re-organized as a Delaware statutory trust on June 12, 2007. The Fund commenced operations on November 2, 1998. The Fund offers Class N and Retail Class shares. Class N and Retail Class shares have different operating expenses. With the exception of class specific expenses, all expenses are allocated between classes based on net assets. Neither Class N shares nor Retail Class shares automatically convert to any other share class of the Fund. Effective January 29, 2016, the Fund reopened to new investors. As of October 31, 2017, there were six series of the Trust. |
2. |
Significant Accounting Policies. The Fund’s financial
statements are prepared in accordance with Generally Accepted Accounting Principles in the United States of America (“GAAP”). The Fund is an
investment company and accordingly follows the investment company accounting and reporting guidance of the Financial Accounting Standards Board (FASB)
Accounting Standard Codification Topic 946 Financial Services — Investments Companies. The following summarizes significant accounting policies of
the Fund: |
A. |
Valuation of Investments. (1) The value of investments listed on a securities exchange is based on the last sale price on that exchange prior to the time when assets are valued, or in the absence of recorded sales, at the average of readily available closing bid and asked prices on such exchange; (2) securities not traded on an exchange are valued at the average of the quoted bid and asked prices in the over-the counter market; (3) securities or other assets for which market quotations are not readily available are valued at fair value in accordance with procedures established by and under the general supervision and responsibility of the Board of Trustees (the “Board”); (4) short-term investments, which mature in 60 days or less are valued at amortized cost if their original maturity was 60 days or less, or by amortizing their value on the 61st day prior to maturity, if their original maturity when acquired by the Fund was more than 60 days, unless the use of amortized cost is determined not to represent “fair value” by the Board. |
B. |
Accounting for Investments and Income. Investment transactions are accounted for on the trade date. Realized gains and losses on investment transactions are determined based on the identified cost method. Dividend income and other distributions received from portfolio securities are recorded on the ex-dividend date. Non-cash dividends included in dividend income, if any, are recorded at the fair market value of securities received at ex-date. Distributions received on securities that represent a return of capital are recorded as a reduction of cost of investments. Distributions received on securities that represent a capital gain are recorded as a realized gain. Interest income is accrued daily. Investment income is recorded net of any foreign taxes withheld where recovery of such tax is uncertain. |
|
|
BBH CORE SELECT
NOTES TO FINANCIAL STATEMENTS (continued)
October 31, 2017
C. |
Fund Expenses. Most expenses of the Trust can be directly attributed to a specific fund. Expenses which cannot be directly attributed to a fund are apportioned amongst each fund in the Trust equally. Expense estimates are accrued in the period to which they relate and adjustments are made when actual amounts are known. |
D. |
Repurchase Agreements. The Fund may enter into repurchase agreements. Repurchase agreements are transactions in which the Fund buys a security from a dealer or bank and agrees to sell the security back at a mutually agreed upon time and price. The repurchase price normally is in excess of the purchase price, reflecting an agreed upon interest rate. The rate is effective for the period of time that assets of the Fund are invested in the agreement and is not related to the coupon rate on the underlying security. The Fund will enter into repurchase agreements only with banks and other recognized financial institutions, such as securities dealers, deemed creditworthy by the investment adviser. The Fund’s custodian or sub-custodian will take possession of the securities subject to repurchase agreements. The investment adviser, custodian or sub-custodian will monitor the value of the underlying collateral each day to ensure that the value of the security always equals or exceeds the repurchase price. |
| Repurchase agreements are entered into by the Fund under Master Repurchase Agreements (MRA) which permit the Fund, under certain circumstances including an event of default (such as bankruptcy or insolvency), to offset payables and/or receivables under the MRA with collateral held and/or posted to the counterparty and create one single net payment due to or from the Fund. However, bankruptcy or insolvency laws of a particular jurisdiction may impose restrictions on or prohibitions against such a right of offset in the event of the MRA counterparty’s bankruptcy or insolvency. Lastly, the MRA does not preclude the Fund from selling, transferring, pledging or hypothecating the underlying collateral but no such transaction shall relieve the Fund of its obligation to transfer the collateral to the counterparty upon the latter’s repurchase of the securities. |
| The Fund’s repurchase agreements as of October 31, 2017 are shown on a gross basis and the required disclosures under Accounting Standards Update (“ASU”) 2013-01 are shown in the Portfolio of Investments. Repurchase agreements are subject to credit risks. |
E. |
Federal Income Taxes. It is the Trust’s policy to comply with the requirements of the Internal Revenue Code (the “Code”) applicable to regulated investment companies and to distribute substantially all of its taxable income to its shareholders. Accordingly, no federal income tax provision is required. The Fund files a tax return annually using tax accounting methods required under provisions of the Code, which may differ from GAAP, which is the basis on which these financial statements are prepared. Accordingly, the amount of net investment income and net realized gain reported in these financial statements may differ from that reported on the Fund’s tax |
BBH CORE SELECT
NOTES TO FINANCIAL STATEMENTS (continued)
October 31, 2017
| return, due to certain book-to-tax timing differences such as losses deferred due to “wash sale” transactions and utilization of capital loss carryforwards. These differences may result in temporary over-distributions for financial statement purposes and are classified as distributions in excess of accumulated net realized gains or net investment income. These distributions do not constitute a return of capital. Permanent differences are reclassified in the Statement of Assets & Liabilities based upon their tax classification. As such, the character of distributions to shareholders reported in the Financial Highlights table may differ from that reported to shareholders on Form 1099-DIV. |
| The Fund is subject to the provisions of Accounting Standards Codification 740 Income Taxes (“ASC 740”). ASC 740 sets forth a minimum threshold for financial statement recognition of the benefit of a tax position taken or expected to be taken in a tax return. The Fund did not have any unrecognized tax benefits as of October 31, 2017, nor were there any increases or decreases in unrecognized tax benefits for the year then ended. The Fund recognizes interest and penalties, if any, related to unrecognized tax benefits as an income tax expense in the Statement of Operations. During the year ended October 31, 2017, the Fund did not incur any such interest or penalties. The Fund is subject to examination by U.S. federal and state tax authorities for returns filed for the prior three year ends. The Fund is not aware of any tax positions for which it is reasonably possible that the total amounts of unrecognized tax benefits will significantly change in the next twelve months. |
F. |
Dividends and Distributions to Shareholders. Dividends and distributions to shareholders, if any, are paid annually and are recorded on the ex-dividend date. The Fund declared dividends in the amounts of $263,168,282 and $22,162,196 to Class N shares and Retail Class shareholders, respectively, during the year ended October 31, 2017. In addition, the Fund designated a portion of the payment made to redeeming shareholders as a distribution for income tax purposes. |
|
|
BBH CORE SELECT
NOTES TO FINANCIAL STATEMENTS (continued)
October 31, 2017
| The tax character of distributions paid during the years ended
October 31, 2017 and 2016, respectively, were as follows: |
| Distributions paid
from: |
||||||||||||||||||||||
| Ordinary income |
Net long-term capital gain |
Total taxable distributions |
Tax return of capital |
Total distributions paid |
||||||||||||||||||
2017: |
$ | 21,937,123 | $ | 263,393,355 | $ | 285,330,478 | $ | — | $ | 285,330,478 | ||||||||||||
2016: |
25,811,801 | 343,196,853 | 369,008,654 | — | 369,008,654 | |||||||||||||||||
| As of October 31, 2017 and 2016, respectively, the components of
accumulated earnings/(deficit) on a tax basis were as follows: |
| Components of accumulated
earnings/(deficit): |
||||||||||||||||||||||||||||||
| Undistributed ordinary income |
Undistributed long-term capital gain |
Accumulated earnings |
Accumulated capital and other losses |
Other book/tax temporary differences |
Book unrealized appreciation/ (depreciation) |
Total accumulated earnings/ (deficit) |
||||||||||||||||||||||||
2017: |
$ | 12,701,945 | $ | 407,895,164 | $ | 420,597,109 | $ | — | $ | (390,289 | ) | $ | 1,003,618,028 | $ | 1,423,824,848 | |||||||||||||||
2016: |
20,655,460 | 263,377,781 | 284,033,241 | — | (851,121 | ) | 1,005,266,333 | 1,288,448,453 | ||||||||||||||||||||||
| The Fund did not have a net capital loss carryforward at October 31, 2017. |
| Total distributions paid may differ from amounts reported in the Statements of Changes in Net Assets because, for tax purposes, dividends are recognized when actually paid. |
| The differences between book-basis and tax-basis unrealized appreciation/(depreciation) is attributable primarily to the tax deferral of losses on wash sales. |
| To the extent future capital gains are offset by capital loss carryforwards, if any; such gains will not be distributed. |
BBH CORE SELECT
NOTES TO FINANCIAL STATEMENTS (continued)
October 31, 2017
G. |
Use of Estimates. The preparation of the financial statements in accordance with GAAP requires management to make estimates and assumptions that affect the reported amounts of assets and liabilities in the financial statements, disclosure of contingent assets and liabilities at the date of the financial statements and the reported amounts of increase and decrease in net assets from operations during the reporting period. Actual results could differ from these estimates. |
3. |
Fees and Other Transactions with Affiliates. |
A. |
Investment Advisory and Administrative Fees. Under a combined Investment Advisory and Administrative Services Agreement (“Agreement”) with the Trust, Brown Brothers Harriman & Co. (“BBH”) through a separately identifiable department (“SID” or “Investment Adviser”) provides investment advisory, portfolio management and administrative services to the Fund. The Fund pays a combined fee for investment advisory and administrative services calculated daily and paid monthly at an annual rate equivalent to 0.80% per annum on the first $3,000,000,000 of the Fund’s average daily net assets and 0.75% per annum on the Fund’s average daily net assets over $3,000,000,000. For the year ended October 31, 2017, the Fund incurred $24,983,386 under the Agreement. |
B. |
Investment Advisory and Administrative Fee Waivers. Effective July 14, 2010, the Investment Adviser contractually agreed to limit the annual fund operating expenses (excluding interest, taxes, brokerage commissions, other expenditures that are capitalized in accordance with GAAP, other extraordinary expenses not incurred in the ordinary course of the Fund’s business and for Retail Class, amounts payable pursuant to any plan adopted in accordance with Rule 12b-1) of Class N and Retail Class to 1.00%. The agreement will terminate on March 1, 2018, unless it is renewed by all parties to the agreement. The agreement may only be terminated during its term with approval of the Fund’s Board of Trustees. For the year ended October 31, 2017, the Investment Adviser waived fees in the amount of $673,403 and $133,469 for Class N and Retail Class, respectively. |
C. |
Shareholder Servicing Fees. The Trust has a shareholder servicing agreement with BBH. BBH receives a fee from the Fund calculated daily and paid monthly at an annual rate of 0.20% of Class N and Retail Class shares’ average daily net assets. For the year ended October 31, 2017, the Fund incurred shareholder servicing fees in the amount of $5,933,210 and $336,173 for Class N and Retail Class, respectively. |
D. |
Distribution (12b-1) Fees. The Fund has adopted a distribution plan pursuant to Rule 12b-1 for Retail Class shares that allows the Fund to pay distribution and other fees for the sale of its shares and for services provided to shareholders. Because these fees are paid out of the Fund’s assets |
|
|
BBH CORE SELECT
NOTES TO FINANCIAL STATEMENTS (continued)
October 31, 2017
| continuously, over time these fees will increase the cost of investment and may cost the shareholder more than paying other types of sales charges. The maximum annual distribution fee for Retail Class shares is 0.25% of the average daily net assets of the Retail Class shares of the Fund. With this agreement along with the investment advisory and waiver agreements above, it is anticipated that total operating expenses for Retail Class shares will be 1.25% of the average daily net assets. For the year ended October 31, 2017, Retail Class shares of the Fund incurred $419,809 for Distribution (12b-1) Fees. This amount is presented under line item “Distributors fees” in the Statement of Operations. |
E. |
Custody and Fund Accounting Fees. BBH acts as a custodian and fund accountant and receives custody and fund accounting fees from the Fund calculated daily and incurred monthly. BBH holds all of the Fund’s cash and investments and calculates the Fund’s daily net asset value. The custody fee is an asset and transaction-based fee. The fund accounting fee is an asset-based fee calculated at 0.004% of the Fund’s net asset value. For the year ended October 31, 2017, the Fund incurred $174,287 in custody and fund accounting fees. These fees for the Fund were reduced by $16,863 as a result of an expense offset arrangement with the Fund’s custodian. The credit amount (if any) is disclosed in the Statement of Operations as a reduction to the Fund’s expenses. In the event that the Fund is overdrawn, under the custody agreement with BBH, BBH will make overnight loans to the Fund to cover overdrafts. Pursuant to their agreement, the Fund will pay the Federal Funds overnight investment rate on the day of the overdraft. The total interest incurred by the Fund for the year ended October 31, 2017, was $2,011. This amount is included under line item “Custody and fund accounting fees” in the Statement of Operations. |
F. |
Board of Trustees’ Fees. Each Trustee who is not an “interested person” as defined under the 1940 Act receives an annual fee as well as reimbursement for reasonable out-of-pocket expenses from the Fund. For the year ended October 31, 2017, the Fund incurred $54,853 in independent Trustee compensation and expense reimbursements. |
4. |
Investment Transactions. For the year ended October 31, 2017, the cost of purchases and the proceeds of sales of investment securities, other than short-term investments, were $437,452,244 and $1,761,698,862, respectively. |
BBH CORE SELECT
NOTES TO FINANCIAL STATEMENTS (continued)
October 31, 2017
5. |
Shares of Beneficial Interest. The Trust is permitted to
issue an unlimited number of Class N and Retail Class shares of beneficial interest at no par value. Transactions in Class N and Retail Class shares
were as follows: |
| For the year ended October 31, 2017 |
For the year ended October 31, 2016 |
||||||||||||||||||
| Shares |
Dollars |
Shares |
Dollars |
||||||||||||||||
Class N |
|||||||||||||||||||
Shares sold |
11,338,201 | $ | 246,670,938 | 15,774,935 | $ | 325,665,400 | |||||||||||||
Shares issued in connection with reinvestments of dividends |
8,861,662 | 182,638,860 | 13,754,570 | 281,831,140 | |||||||||||||||
Proceeds from short-term redemption fees |
N/A | 13,587 | N/A | 18,776 | |||||||||||||||
Shares redeemed |
(69,301,288 | ) | (1,503,377,696 | ) | (86,710,828 | ) | (1,824,200,480 | ) | |||||||||||
Net decrease |
(49,101,425 | ) | $ | (1,074,054,311 | ) | (57,181,323 | ) | $ | (1,216,685,164 | ) | |||||||||
Retail Class |
|||||||||||||||||||
Shares sold |
1,334,628 | $ | 17,100,586 | 1,664,283 | $ | 21,578,354 | |||||||||||||
Shares issued in connection with reinvestments of dividends |
1,831,134 | 22,046,854 | 2,402,931 | 30,324,988 | |||||||||||||||
Proceeds from short-term redemption fees |
N/A | 820 | N/A | 2,358 | |||||||||||||||
Shares redeemed |
(5,942,387 | ) | (76,228,158 | ) | (9,517,253 | ) | (122,880,872 | ) | |||||||||||
Net decrease |
(2,776,625 | ) | $ | (37,079,898 | ) | (5,450,039 | ) | $ | (70,975,172 | ) | |||||||||
|
|
BBH CORE SELECT
NOTES TO FINANCIAL STATEMENTS (continued)
October 31, 2017
6. |
Principal Risk Factors and Indemnifications. |
A. |
Principal Risk Factors. Investing in the Fund may
involve certain risks, as discussed in the Fund’s prospectus, including but not limited to, those described below: |
| A shareholder may lose money by investing in the Fund (investment risk). The Fund is actively managed and the decisions by the Investment Adviser may cause the Fund to incur losses or miss profit opportunities (management risk). Price movements may occur due to factors affecting individual companies, such as the issuance of an unfavorable earnings report, or other events affecting particular industries or the equity market as a whole (equity securities risk). The value of securities held by the Fund may fall due to changing economic, political, regulatory or market conditions, or due to a company’s or issuer’s individual situation (market risk). In the normal course of business, the Fund invests in securities and enters into transactions where risks exist due to assumption of large positions in securities of a small number of issuers (non-diversification risk). There are certain risks associated with investing in foreign securities not present in domestic investments, including, but not limited to, recovery of tax withheld by foreign jurisdictions (foreign investment risk). The Fund’s shareholders may be adversely impacted by asset allocation decisions made by an investment adviser whose discretionary clients make up a large percentage of the Fund’s shareholders (shareholder concentration risk). The extent of the Fund’s exposure to these risks in respect to these financial assets is included in their value as recorded in the Fund’s Statement of Assets and Liabilities. |
| Please refer to the Fund’s prospectus for a complete description of the principal risks of investing in the Fund. |
B. |
Indemnifications. Under the Trust’s organizational documents, its officers and Trustees may be indemnified against certain liabilities and expenses arising out of the performance of their duties to the Fund, and shareholders are indemnified against personal liability for the obligations of the Trust. Additionally, in the normal course of business, the Fund enters into agreements with service providers that may contain indemnification clauses. The Fund’s maximum exposure under these arrangements is unknown as this would involve future claims that may be made against the Fund that have not yet occurred. The risk of material loss from such claims is considered remote. |
BBH CORE SELECT
NOTES TO FINANCIAL STATEMENTS (continued)
October 31, 2017
7. |
Recent Pronouncements. |
A. |
Regulation S-X. In October 2016, the U.S. Securities and Exchange Commission adopted new rules and amended existing rules (together, “final rules”) intended to modernize the reporting and disclosure of information by registered investment companies. In part, the final rules amend Regulation S-X and require standardized, enhanced disclosure about derivatives in investment company financial statements, as well as other amendments. The compliance date for the amendments to Regulation S-X was August 1, 2017. The changes related to Regulation S-X are reflected in the financial statements. |
8. |
Subsequent Events. Management has evaluated events and transactions that have occurred since October 31, 2017 through the date the financial statements were issued and determined that there were none that would require recognition or additional disclosure in the financial statements. |
|
|
BBH CORE SELECT
DISCLOSURE OF FUND EXPENSES
October 31, 2017 (unaudited)
BBH CORE SELECT
DISCLOSURE OF FUND EXPENSES (continued)
October 31, 2017 (unaudited)
| Beginning Account Value May 1, 2017 |
Ending Account Value October 31, 2017 |
Expenses Paid During Period May 1, 2017 to October 31, 20171 |
||||||||||||
Class N |
||||||||||||||
Actual |
$ | 1,000 | $ | 1,066 | $ | 5.21 | ||||||||
Hypothetical2 |
$ | 1,000 | $ | 1,020 | $ | 5.09 | ||||||||
| Beginning Account Value May 1, 2017 |
Ending Account Value October 31, 2017 |
Expenses Paid During Period May 1, 2017 to October 31, 20171 |
||||||||||||
Retail Class |
||||||||||||||
Actual |
$ | 1,000 | $ | 1,065 | $ | 6.45 | ||||||||
Hypothetical2 |
$ | 1,000 | $ | 1,019 | $ | 6.31 | ||||||||
| 1 | Expenses are equal to the Fund’s annualized expense ratio of 1.00% and 1.24% for Class N and Retail Class shares, respectively, multiplied by the average account value over the period, multiplied by 184/365 (to reflect the one-half year period). |
| 2 | Assumes a return of 5% before expenses. For the purposes of the calculation, the applicable annualized expense ratio for each class of shares is subtracted from the assumed return before expenses. |
|
|
BBH CORE SELECT
CONFLICTS OF INTEREST
October 31, 2017 (unaudited)
BBH CORE SELECT
CONFLICTS OF INTEREST (continued)
October 31, 2017 (unaudited)
|
|
BBH CORE SELECT
CONFLICTS OF INTEREST (continued)
October 31, 2017 (unaudited)
BBH CORE SELECT
CONFLICTS OF INTEREST (continued)
October 31, 2017 (unaudited)
|
|
BBH CORE SELECT
CONFLICTS OF INTEREST (continued)
October 31, 2017 (unaudited)
BBH CORE SELECT
ADDITIONAL FEDERAL TAX INFORMATION
October 31, 2017 (unaudited)
|
|
TRUSTEES AND OFFICERS OF BBH CORE SELECT
(unaudited)
| Name and Birth Year |
|
Position(s) Held with the Trust |
|
Term of Office and Length of Time Served# |
|
Principal Occupation(s) During Past 5 Years |
|
Number of Portfolios in Fund Complex Overseen by Trusteeˆ |
|
Other Public Company or Investment Company Directorships held by Trustee During Past 5 Years |
Independent Trustees |
||||||||||
H.
Whitney Wagner Birth Year: 1956 |
Chairman of the Board and Trustee |
Chairman Since 2014; Trustee Since 2007 and 2006-2007 with the Predecessor Trust |
President, Clear Brook Advisors, a registered investment adviser. |
6 |
None. |
|||||
Andrew S. Frazier Birth Year: 1948 |
Trustee |
Since 2010 |
Consultant to Western World Insurance Group, Inc. (“WWIG”) (January 2010 to January 2012). |
6 |
Director of WWIG. |
|||||
Mark M. Collins Birth Year: 1956 |
Trustee |
Since 2011 |
Partner of Brown Investment Advisory Incorporated, a registered investment adviser. |
6 |
Chairman of Dillon Trust Company. |
|||||
John M. Tesoro Birth Year: 1952 |
Trustee |
Since 2014 |
Partner, Certified Public Accountant, KPMG LLP (retired in September 2012). |
6 |
Trustee, Bridge Builder Trust (8 Funds) Director; Teton Advisors, Inc. (a registered investment adviser). |
TRUSTEES AND OFFICERS OF BBH CORE SELECT
(unaudited)
| Name, Address and Birth Year |
|
Position(s) Held with the Trust |
|
Term of Office and Length of Time Served# |
|
Principal Occupation(s) During Past 5 Years |
|
Number of Portfolios in Fund Complex Overseen by Trusteeˆ |
|
Other Public Company or Investment Company Directorships held by Trustee During Past 5 Years |
Interested Trustees |
||||||||||
Susan C. Livingston+ 50 Post Office Square Boston, MA 02110 Birth Year: 1957 |
Trustee |
Since 2011 |
Partner (since 1998) and Senior Client Advocate (since 2010) for BBH&Co., Director of BBH Luxembourg S.C.A. (since 1992). |
6 |
None. |
|||||
John A. Gehret+ 140 Broadway New York, NY 10005 Birth Year: 1959 |
Trustee |
Since 2011 |
Limited Partner of BBH&Co. (2012-present); Director of BBH Luxembourg S.C.A. (since 2012); Director of BBH Trust Company (Cayman) Ltd. (since
2012). |
6 |
None. |
|
|
TRUSTEES AND OFFICERS OF BBH CORE SELECT
(unaudited)
| Name, Address and Birth Year |
|
Position(s) Held with the Trust |
|
Term of Office and Length of Time Served# |
|
Principal Occupation(s) During Past 5
Years |
Officers |
||||||
Jean-Pierre Paquin 140 Broadway New York, NY 10005 Birth Year: 1973 |
President and Principal Executive Officer |
Since 2016 |
Partner of BBH&Co. since 2015; joined BBH&Co. in 1996. |
|||
Daniel Greifenkamp 140 Broadway New York, NY 10005 Birth Year: 1969 |
Vice
President |
Since 2016 |
Managing Director of BBH&Co. since 2014; joined BBH&Co. in 2011. |
|||
Charles H. Schreiber 140 Broadway New York, NY 10005 Birth Year: 1957 |
Treasurer and Principal Financial Officer |
Since 2007 2006-2007 with the Predecessor Trust |
Senior Vice President of BBH&Co. since 2001; joined BBH&Co. in 1999. |
|||
Paul F. Gallagher 140 Broadway New York, NY 10005 Birth Year: 1959 |
Chief Compliance Officer (“CCO”) |
Since 2015 |
Senior Vice President of BBH&Co. since September 2015; Executive Director, Counsel, Morgan Stanley Smith Barney LLC (2009-September
2015). |
|||
Keith M. Kelley 140 Broadway New York, NY 10005 Birth Year: 1983 |
Anti-Money Laundering Officer (“AMLO”) |
Since 2016 |
Vice
President of BBH&Co. since February 2016; joined BBH&Co. in 2016; Director, Legal and Compliance, Morgan Stanley Smith Barney LLC
(2014-February 2016); Compliance Manager, State Street Corporation (2013-2014); Associate, J.P. Morgan Chase & Co. (2011-2013). |
TRUSTEES AND OFFICERS OF BBH CORE SELECT
(unaudited)
| Name, Address and Birth Year |
|
Position(s) Held with the Trust |
|
Term of Office and Length of Time Served# |
|
Principal Occupation(s) During Past 5
Years |
Suzan M. Barron 50 Post Office Square Boston, MA 02110 Birth Year: 1964 |
Secretary |
Since 2009 |
Senior Vice President and Senior Investor Services Counsel, BBH&Co. since 2005. |
|||
Rowena Rothman 140 Broadway New York, NY 10005 Birth Year: 1967 |
Assistant Treasurer |
Since 2011 |
Vice
President of BBH&Co. since 2009. |
# |
All officers of the Trust hold office for one year and until their respective successors are chosen and qualified (subject to the ability of the Trustees to remove any officer in accordance with the Trust’s By-laws). Mr. Wagner previously served on the Board of Trustees of the Predecessor Trust. |
+ |
Ms. Livingston and Mr. Gehret are “interested persons” of the Trust as defined in the 1940 Act because of their positions as Partner and Limited Partner of BBH&Co., respectively. |
ˆ |
The Fund Complex consists of the Trust, which has six series, and each is counted as one “Portfolio” for purposes of this table. |
|
|
Administrator Brown Brothers Harriman & Co. 140 Broadway New York, NY 10005 Distributor ALPS Distributors, Inc. 1290 Broadway, Suite 1100 Denver, CO 80203 Shareholder Servicing Agent Brown Brothers Harriman & Co. 140 Broadway New York, NY 10005 1-800-575-1265 |
Investment Adviser Brown Brothers Harriman Mutual Fund Advisory Department 140 Broadway New York, NY 10005 |
By telephone: |
Call
1-800-575-1265 |
|
By E-mail send your request to: |
bbhfunds@bbh.com |
|
On the internet: |
www.bbhfunds.com |

BBH GLOBAL CORE SELECT
MANAGEMENT’S DISCUSSION OF FUND PERFORMANCE
October 31, 2017
* |
MSCI World Index is a free float-adjusted market capitalization weighted index that is designed to measure the equity market performance of developed markets. |
BBH GLOBAL CORE SELECT
MANAGEMENT’S DISCUSSION OF FUND PERFORMANCE (continued)
October 31, 2017
During fiscal 2017 we also briefly owned shares of Rotork, a U.K.-based manufacturer of actuators and other industrial
products. We sold our Rotork shares several months after purchasing them due to the unexpected departure of the company’s well-regarded CEO. We
exited our positions in seven other companies during the fiscal year: Vermilion Energy, Lundin Petroleum, Schlumberger, Occidental Petroleum, Svenska
Handelsbanken, Wal-Mart Stores, and Bed Bath & Beyond. We sold our positions in Lundin, Schlumberger, Occidental, and Vermillion following a
comprehensive review of the structure and long-term outlook for the global oil and gas industry. We ultimately determined that changes in technology
and oil and gas supply and demand dynamics have made energy companies harder to value and a worse fit with our Core Select investment criteria. We sold
our successful investment in Svenska Handelsbanken when its share price reached our estimate of intrinsic value. Handelsbanken is a well-managed and
differentiated bank that we would like to own again at the right price.
Wal-Mart had been a holding in Global Core Select since the Fund’s
inception and a meaningful positive contributor. Wal-Mart’s shares responded favorably to progress in its e-commerce business and
growing recognition of its favorable positioning in a multi-channel retail environment, and we sold our position as the share price reached our
estimate of intrinsic value. Bed Bath & Beyond was a less successful retail investment. We reduced our position in Bed Bath & Beyond (BBBY) in
February 2017 and subsequently sold our remaining shares in September at a substantial loss. We are very disappointed in this outcome since one of our
key goals for Global Core Select is to avoid the permanent loss of capital on each investment. It has become increasingly evident that
transitioning organically from a bricks and mortar retailer to a combined store-based/e-commerce retailer is very difficult and costly to execute. With
the benefit of hindsight, we underestimated the impact of these changes on BBBY’s financial model and, while the business remains very profitable
and cash generative, margins and returns have declined significantly relative to where we believed they would stabilize.
Our largest
positive contributors in fiscal 2017 were PayPal, Oracle, and Wendel. PayPal has maintained a pace of very strong revenue and earnings results driven
primarily by favorable secular trends toward online and mobile payments that have powered double-digit growth in active users and payment volume. The
company’s key business metrics such as payments per user, principal per transaction, overhead expense leverage, and free cash flow conversion also
remain very strong. We have been very pleased with the management team’s strategic decisions and operational execution over the last few years as
PayPal has not only grown its core ‘payment button’ business, but also broadened its offerings to meet the evolving needs of consumers,
merchants, and other players in the payments value chain. Oracle remains a global leader in infrastructure software, as well as an important vendor in
the ecosystem of cloud-based software, applications software, hardware and technology services, and the share price has
|
|
BBH GLOBAL CORE SELECT
MANAGEMENT’S DISCUSSION OF FUND PERFORMANCE (continued)
October 31, 2017
responded favorably to improved visibility in respect
to Oracle’s business model transition from on-premise software licenses to cloud-based subscriptions. We believe that
business attributes such as high customer switching costs, economies of scale, and innovation capabilities should enable Oracle to capitalize on
positive secular trends in infrastructure and application software and services. Wendel’s shares rose in response to strong operating performance
in both its listed and unlisted subsidiary companies and a meaningful increase in the company’s estimate of its underlying Net Asset Value (NAV)
per share. On a consolidated basis, most of the company’s offerings are intermediate products and services that are indispensable components of
other companies’ value chains and industrial activities. In our view, the combination of good capital deployment and solid business results should
result in substantial long-term value creation for Wendel.
The largest detractors from the Fund’s performance in fiscal 2017 were
QUALCOMM, Discovery Communications, and Nielsen. QUALCOMM’s share price declined sharply beginning in January due to
legal challenges to its intellectual property licensing model by both the U.S. Federal Trade Commission and Apple, which has halted royalty payments
from Apple device manufacturers to QUALCOMM pending resolution of the dispute. As a leader in the development and commercialization of
wireless technologies, and with cumulative research and development investments of nearly $40 billion over the last 10 years, QUALCOMM
has a large intellectual property (IP) portfolio consisting of tens of thousands of patents that are essential in mobile networks, and manufacturers
have freely chosen to reach “portfolio license” agreements with QUALCOMM for usage of the IP. The company has faced similar
legal challenges in the past and while there have been occasional setbacks and meaningful fines, recognition of the company’s IP and the validity
of its licensing model have endured. However, we are factoring in a range of outcomes in respect to resolution of this case and are reflecting those
scenarios in our valuation and position sizing of the investment.
Shares of Nielsen Holdings have come under pressure due to weak
operating performance on the “Buy” side of the business as well as growing negative investor sentiment towards the media sector. While the
Buy segment of the business is likely to remain challenged in developed markets due to slow growth in the businesses of its primary
customers (large consumer products companies), we believe that Nielsen’s migration away from project-based work to a
platform-based business will result in a higher-margin business with the potential for broader customer appeal. The
“Watch” side of the business, which is essential to the measurement of video consumption and remains the currency by which
media companies and advertisers transact, continues to perform well and is a significantly larger contributor to Nielsen’s operating profit.
Discovery’s share price has come under significant pressure in response to incremental softness in U.S. video subscriber trends,
lower-than-expected operating results in certain international businesses, and skepticism regarding the Company’s
announced acquisition of Scripps Networks. While we recognize the challenges faced by cable networks, particularly in the U.S. market, we continue to
view Discovery’s core cable networks as resilient businesses that should be able to navigate the changing media landscape based on the proprietary
nature of its content and its ability to partner with distributors,
BBH GLOBAL CORE SELECT
MANAGEMENT’S DISCUSSION OF FUND PERFORMANCE (continued)
October 31, 2017
particularly with an expanded portfolio of content
following the Scripps acquisition. We have a favorable view of Scripps’ three big networks (HGTV, Food Network, and Travel Channel) and believe
that Discovery should be able to realize significant cost and revenue synergies pending the closure of the transaction.
As of October 31, 2017,
Global Core Select held positions in 30 companies, with approximately 44% of the assets in the ten largest companies. The Fund ended the fiscal year
trading at approximately 88% of our underlying intrinsic value estimates on a weighted-average basis and our cash position was approximately 13%. We
view equities broadly as expensive and have remained disciplined in applying our strict valuation approach, trimming positions of holdings that
approach intrinsic value and investing where we see strong margins of safety supported by significant discounts to intrinsic value.
The Global Core
Select investment team remains focused on the careful and patient application of our investment criteria and valuation requirements in all markets
around the world. Our bottom-up research work emphasizes business quality, industry structures, growth opportunities, management skill and corporate
culture. We use absolute, not relative methods to estimate companies’ intrinsic values, and we use the movement of market prices around these
intrinsic value estimates to construct and manage a concentrated portfolio of high-quality businesses that have the potential to create substantial
shareholder value over many years.
|
|
BBH GLOBAL CORE SELECT
MANAGEMENT’S DISCUSSION OF FUND PERFORMANCE (continued)
October 31, 2017
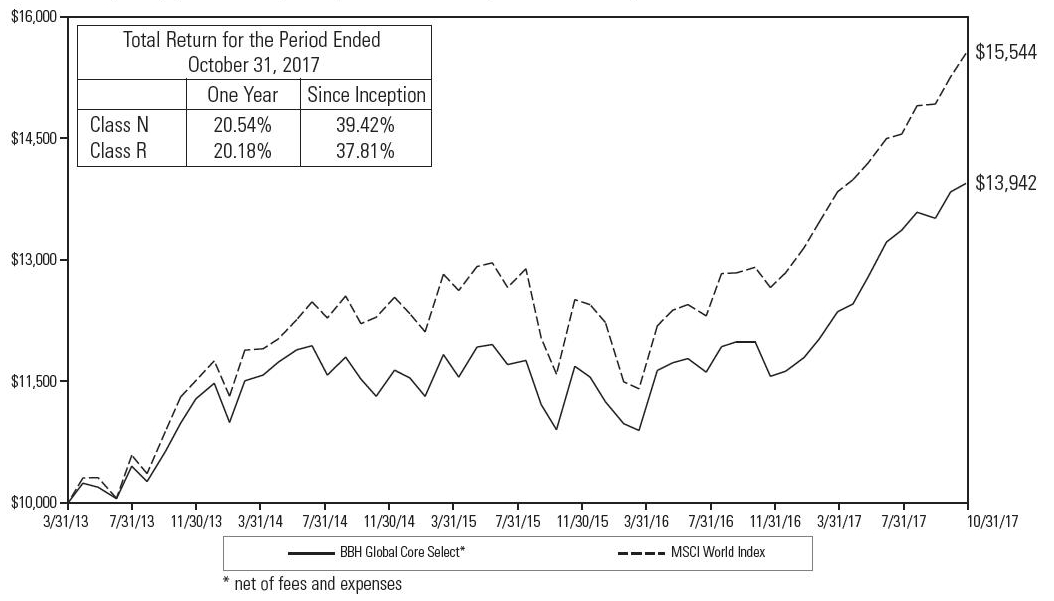
| 1 | The Fund’s performance assumes the reinvestment of all dividends and distributions. The MSCI World Index has been adjusted to reflect reinvestment of dividends on securities. The MSCI World Index is not adjusted to reflect sales charges, expenses or other fees that the Securities and Exchange Commission requires to be reflected in the Fund’s performance. The index is unmanaged. Investments cannot be made in an index. |
BBH GLOBAL CORE SELECT
REPORT OF INDEPENDENT REGISTERED PUBLIC ACCOUNTING FIRM
December 22,
2017
|
|
BBH GLOBAL CORE SELECT
PORTFOLIO ALLOCATION
October 31, 2017
| U.S. $ Value |
Percent of Net Assets |
|||||||||
Common Stocks: |
||||||||||
Canada |
$ | 1,845,334 | 1.4 | % | ||||||
France |
13,709,859 | 10.2 | ||||||||
Germany |
3,946,908 | 2.9 | ||||||||
Ireland |
3,292,567 | 2.5 | ||||||||
Italy |
4,236,447 | 3.2 | ||||||||
Netherlands |
5,292,535 | 3.9 | ||||||||
Switzerland |
8,304,415 | 6.2 | ||||||||
United Kingdom |
19,855,331 | 14.8 | ||||||||
United States |
57,685,532 | 42.9 | ||||||||
Repurchase Agreements |
12,500,000 | 9.3 | ||||||||
Cash and Other Assets in Excess of Liabilities |
3,686,346 | 2.7 | ||||||||
NET ASSETS |
$ | 134,355,274 | 100.0 | % | ||||||
| U.S. $ Value |
Percent of Net Assets |
|||||||||
Common Stocks: |
||||||||||
Basic Materials |
$ | 12,151,153 | 9.0 | % | ||||||
Communications |
17,164,625 | 12.8 | ||||||||
Consumer Cyclical |
2,640,064 | 2.0 | ||||||||
Consumer Non-Cyclical |
51,128,777 | 38.0 | ||||||||
Diversified |
6,293,049 | 4.7 | ||||||||
Financials |
12,445,989 | 9.3 | ||||||||
Technology |
16,345,271 | 12.2 | ||||||||
Repurchase Agreements |
12,500,000 | 9.3 | ||||||||
Cash and Other Assets in Excess of Liabilities |
3,686,346 | 2.7 | ||||||||
NET ASSETS |
$ | 134,355,274 | 100.0 | % | ||||||
The accompanying notes are an integral
part of these financial statements.
BBH GLOBAL CORE SELECT
PORTFOLIO OF INVESTMENTS
October 31, 2017
| Shares |
Value |
|||||||||
COMMON STOCKS (88.0%) |
||||||||||
CANADA (1.4%) |
||||||||||
FINANCIALS |
||||||||||
| 22,550 | Intact Financial Corp. |
$ | 1,845,334 | |||||||
Total Canada |
1,845,334 |
|||||||||
FRANCE (10.2%) |
||||||||||
COMMUNICATIONS |
||||||||||
| 94,270 | JCDecaux S.A. |
3,608,221 | ||||||||
CONSUMER NON-CYCLICAL |
||||||||||
| 40,200 | Sanofi |
3,808,589 | ||||||||
DIVERSIFIED |
||||||||||
| 37,300 | Wendel S.A. |
6,293,049 | ||||||||
Total France |
13,709,859 |
|||||||||
GERMANY (2.9%) |
||||||||||
BASIC MATERIALS |
||||||||||
| 32,400 | Brenntag AG |
1,834,881 | ||||||||
| 42,400 | Fuchs Petrolub SE |
2,112,027 | ||||||||
Total Germany |
3,946,908 |
|||||||||
IRELAND (2.5%) |
||||||||||
CONSUMER NON-CYCLICAL |
||||||||||
| 40,654 | Perrigo Co., Plc. |
3,292,567 | ||||||||
Total Ireland |
3,292,567 | |||||||||
ITALY (3.2%) |
||||||||||
CONSUMER NON-CYCLICAL |
||||||||||
| 528,900 | Davide Campari-Milano SpA |
4,236,447 | ||||||||
Total Italy |
4,236,447 | |||||||||
NETHERLANDS (3.9%) |
||||||||||
CONSUMER NON-CYCLICAL |
||||||||||
| 23,900 | Heineken Holding NV |
2,218,637 | ||||||||
| 52,900 | Unilever NV |
3,073,898 | ||||||||
Total Netherlands |
5,292,535 |
|||||||||
The accompanying notes are an integral
part of these financial statements.
|
|
BBH GLOBAL CORE SELECT
PORTFOLIO OF INVESTMENTS (continued)
October 31, 2017
| Shares |
Value | |||||||||
COMMON STOCKS (continued) |
||||||||||
SWITZERLAND (6.2%) |
||||||||||
CONSUMER NON-CYCLICAL |
||||||||||
| 29,375 | Nestle SA |
$ | 2,473,691 | |||||||
| 70,626 | Novartis AG |
5,830,724 | ||||||||
Total Switzerland |
8,304,415 |
|||||||||
UNITED KINGDOM (14.8%) |
||||||||||
COMMUNICATIONS |
||||||||||
| 111,949 | Liberty Global, Plc. (Series C)1 |
3,346,156 | ||||||||
CONSUMER NON-CYCLICAL |
||||||||||
| 43,139 | Aggreko, Plc. |
536,094 | ||||||||
| 173,325 | Diageo, Plc. |
5,916,205 | ||||||||
| 95,425 | Nielsen Holdings, Plc. |
3,537,405 | ||||||||
| 29,100 | Reckitt Benckiser Group, Plc. |
2,602,283 | ||||||||
| 12,591,987 | ||||||||||
FINANCIALS |
||||||||||
| 4,320,400 | Lloyds Banking Group, Plc. |
3,917,188 | ||||||||
Total United Kingdom |
19,855,331 | |||||||||
UNITED STATES (42.9%) |
||||||||||
BASIC MATERIALS |
||||||||||
| 40,375 | Celanese Corp. (Series A) |
4,211,516 | ||||||||
| 27,325 | Praxair, Inc. |
3,992,729 | ||||||||
| 8,204,245 | ||||||||||
COMMUNICATIONS |
||||||||||
| 7,068 | Alphabet, Inc. (Class C)1 |
7,185,611 | ||||||||
| 169,828 | Discovery Communications, Inc. (Class C)1 |
3,024,637 | ||||||||
| 10,210,248 | ||||||||||
CONSUMER CYCLICAL |
||||||||||
| 116,200 | Liberty Interactive Corp. QVC Group (Class A)1 |
2,640,064 | ||||||||
CONSUMER NON-CYCLICAL |
||||||||||
| 28,285 | FleetCor Technologies, Inc.1 |
4,674,662 | ||||||||
| 58,875 | PayPal Holdings, Inc.1 |
4,271,970 | ||||||||
| 72,949 | Zoetis, Inc. |
4,655,605 | ||||||||
| 13,602,237 | ||||||||||
FINANCIALS |
||||||||||
| 119,050 | Wells Fargo & Co. |
6,683,467 | ||||||||
The accompanying notes are an integral
part of these financial statements.
BBH GLOBAL CORE SELECT
PORTFOLIO OF INVESTMENTS (continued)
October 31, 2017
| Shares |
Value | ||||||
COMMON STOCKS (continued) |
|||||||
UNITED STATES (continued) |
|||||||
TECHNOLOGY |
|||||||
| 44,475 | Microsoft Corp. |
$ | 3,699,430 | ||||
| 187,325 | Oracle Corp. |
9,534,843 | |||||
| 60,988 | QUALCOMM, Inc. |
3,110,998 | |||||
| 16,345,271 | |||||||
Total United States |
57,685,532 | ||||||
Total Common Stocks (Identified cost $89,825,013) |
118,168,928 | ||||||
| Principal Amount |
Maturity Date |
Interest Rate |
Value |
|||||||||||||||
REPURCHASE AGREEMENTS (9.3%) |
||||||||||||||||||
| $12,500,000 | National Australia Bank, Ltd. (Agreement dated 10/31/17 collateralized by U.S. Treasury Note 1.375%, due 05/31/20, original par
$12,790,000, valued at $12,750,000) |
11/01/17 | 1.000% | $ | 12,500,000 | |||||||||||||
Total Repurchase Agreements (Identified cost $12,500,000) |
12,500,000 | |||||||||||||||||
| TOTAL INVESTMENTS (Identified cost $102,325,013)2 | 97.3% | $ | 130,668,928 | |||||||||||||||
| CASH AND OTHER ASSETS IN EXCESS OF LIABILITIES | 2.7% | 3,686,346 | ||||||||||||||||
| NET ASSETS | 100.0% | $ | 134,355,274 | |||||||||||||||
| 1 | Non-income producing security. |
| 2 | The aggregate cost for federal income tax purposes is $102,772,204, the aggregate gross unrealized appreciation is $33,050,585 and the aggregate gross unrealized depreciation is $5,153,861, resulting in net unrealized appreciation of $27,896,724. |
The accompanying notes are an integral
part of these financial statements.
|
|
BBH GLOBAL CORE SELECT
PORTFOLIO OF INVESTMENTS (continued)
October 31, 2017
FAIR VALUE MEASUREMENTS
The Fund is required to disclose information regarding the fair value measurements of the Fund’s assets and liabilities. Fair value is the price that would be received to sell an asset or paid to transfer a liability in an orderly transaction between market participants at the measurement date. The disclosure requirement established a three-tier hierarchy to maximize the use of observable market data and minimize the use of unobservable inputs and to establish classification of fair value measurements for disclosure purposes. Inputs refer broadly to the assumptions that market participants would use in pricing the asset or liability, including for example, the risk inherent in a particular valuation technique used to measure fair value, including the model and/or the risk inherent in the inputs to the valuation technique. Inputs may be observable or unobservable. Observable inputs are inputs that reflect the assumptions market participants would use in pricing the asset or liability developed based on market data obtained from sources independent of the reporting entity. Unobservable inputs are inputs that reflect the Fund’s own considerations about the assumptions market participants would use in pricing the asset or liability developed based on the best information available in the circumstances.
— |
Level 1 – unadjusted quoted prices in active markets for identical assets and liabilities. |
— |
Level 2 – significant other observable inputs (including quoted prices for similar assets and liabilities, interest rates, prepayment speeds, credit risk, etc.). |
— |
Level 3 – significant unobservable inputs (including the Fund’s own assumptions in determining the fair value of assets and liabilities). |
The accompanying notes are an integral
part of these financial statements.
BBH GLOBAL CORE SELECT
PORTFOLIO OF INVESTMENTS (continued)
October 31, 2017
The accompanying notes are an integral
part of these financial statements.
|
|
BBH GLOBAL CORE SELECT
PORTFOLIO OF INVESTMENTS (continued)
October 31, 2017
| Investments, at value |
Unadjusted Quoted Prices in Active Markets for Identical Investments (Level 1)* |
Significant Other Observable Inputs (Level 2)* |
Significant Unobservable Inputs (Level 3)* |
Balance as of October 31, 2017 |
||||||||||||||
Common Stocks: |
||||||||||||||||||
Basic Materials |
$ | 8,204,245 | $ | 3,946,908 | $ | — | $ | 12,151,153 | ||||||||||
Communications |
13,556,404 | 3,608,221 | — | 17,164,625 | ||||||||||||||
Consumer Cyclical |
2,640,064 | — | — | 2,640,064 | ||||||||||||||
Consumer Non-Cyclical |
20,432,209 | 30,696,568 | — | 51,128,777 | ||||||||||||||
Diversified |
— | 6,293,049 | — | 6,293,049 | ||||||||||||||
Financials |
8,528,801 | 3,917,188 | — | 12,445,989 | ||||||||||||||
Technology |
16,345,271 | — | — | 16,345,271 | ||||||||||||||
Repurchase Agreements |
— | 12,500,000 | — | 12,500,000 | ||||||||||||||
Investments, at value |
$ | 69,706,994 | $ | 60,961,934 | $ | — | $ | 130,668,928 | ||||||||||
* |
The Fund’s policy is to disclose transfers between levels based on valuations at the end of the reporting period. There were no transfers between Levels 1, 2 or 3 during the period ended October 31, 2017. |
The accompanying notes are an integral
part of these financial statements.
BBH GLOBAL CORE SELECT
STATEMENT OF ASSETS AND LIABILITIES
October 31, 2017
| ASSETS: | ||||||
Investments in securities, at value (Identified cost $89,825,013) |
$ | 118,168,928 | ||||
Repurchase agreements (Identified cost $12,500,000) |
12,500,000 | |||||
Cash |
3,457,558 | |||||
Foreign currency at value (Identified cost $134) |
130 | |||||
Receivables for: |
||||||
Shares sold |
321,700 | |||||
Dividends |
121,274 | |||||
Investment advisory and administrative fee waiver reimbursement |
7,674 | |||||
Interest |
347 | |||||
Prepaid assets |
863 | |||||
Total Assets |
134,578,474 | |||||
LIABILITIES: |
||||||
Payables for: |
||||||
Investment advisory and administrative fees |
104,263 | |||||
Professional fees |
65,400 | |||||
Shareholder servicing fees |
21,950 | |||||
Custody and fund accounting fees |
6,285 | |||||
Transfer agent fees |
5,415 | |||||
Distributors fees |
4,842 | |||||
Shares redeemed |
3,270 | |||||
Board of Trustees’ fees |
141 | |||||
Accrued expenses and other liabilities |
11,634 | |||||
Total Liabilities |
223,200 | |||||
NET ASSETS |
$ | 134,355,274 | ||||
Net
Assets Consist of: |
||||||
Paid-in capital |
$ | 103,448,758 | ||||
Undistributed net investment income |
496,880 | |||||
Accumulated net realized gain on investments in securities and foreign exchange transactions |
2,065,858 | |||||
Net unrealized appreciation/(depreciation) on investments in securities and foreign currency translations |
28,343,778 | |||||
Net Assets |
$ | 134,355,274 | ||||
NET ASSET VALUE AND OFFERING PRICE PER SHARE |
||||||
CLASS N SHARES |
||||||
($130,462,881 ÷ 9,797,176 shares outstanding) |
$13.32 | |||||
RETAIL CLASS SHARES |
||||||
($3,892,393 ÷ 294,035 shares outstanding) |
$13.24 | |||||
The accompanying notes are an integral
part of these financial statements.
|
|
BBH GLOBAL CORE SELECT
STATEMENT OF OPERATIONS
For the year ended October 31, 2017
NET
INVESTMENT INCOME: |
||||||
Income: |
||||||
Dividends
(net of foreign withholding taxes of $125,730) |
$ | 2,021,948 | ||||
Interest
income |
43,575 | |||||
Total
Income |
2,065,523 | |||||
Expenses: |
||||||
Investment
advisory and administrative fees |
1,158,801 | |||||
Shareholder
servicing fees |
243,958 | |||||
Professional
fees |
73,905 | |||||
Board
of Trustees’ fees |
54,543 | |||||
Custody
and fund accounting fees |
39,091 | |||||
Transfer
agent fees |
31,741 | |||||
Distributors
fees |
27,630 | |||||
Miscellaneous
expenses |
65,392 | |||||
Total
Expenses |
1,695,061 | |||||
Investment
advisory and administrative fee waiver |
(145,914 | ) | ||||
Expense
offset arrangement |
(14,993 | ) | ||||
Net
Expenses |
1,534,154 | |||||
Net
Investment Income |
531,369 | |||||
NET
REALIZED AND UNREALIZED GAIN: |
||||||
Net
realized gain on investments in securities |
2,883,752 | |||||
Net
realized gain on foreign exchange transactions |
1,571 | |||||
Net
realized gain on investments in securities and foreign exchange transactions and translations |
2,885,323 | |||||
Net
change in unrealized appreciation/(depreciation) on investments in securities |
19,189,794 | |||||
Net
change in unrealized appreciation/(depreciation) on foreign currency translations |
2,920 | |||||
Net
change in unrealized appreciation/(depreciation) on investments in securities and foreign
currency translations |
19,192,714 | |||||
Net
Realized and Unrealized Gain |
22,078,037 | |||||
Net
Increase in Net Assets Resulting from Operations |
$ | 22,609,406 |
The accompanying notes are an integral
part of these financial statements.
BBH GLOBAL CORE SELECT
STATEMENT OF CHANGES IN NET ASSETS
| For the years ended October 31, |
|||||||||||
| 2017 |
2016 |
||||||||||
INCREASE (DECREASE) IN NET ASSETS: |
|||||||||||
Operations: |
|||||||||||
Net investment income |
$ | 531,369 | $ | 644,900 | |||||||
Net realized gain on investments in securities and foreign exchange
transactions and translations |
2,885,323 | 289,452 | |||||||||
Net change in unrealized appreciation/(depreciation) on investments
in securities and foreign currency translations |
19,192,714 | (2,249,925 | ) | ||||||||
Net increase (decrease) in net assets resulting from operations |
22,609,406 | (1,315,573 | ) | ||||||||
Dividends and distributions declared: |
|||||||||||
From net investment income: |
|||||||||||
Class N |
(593,082 | ) | (634,126 | ) | |||||||
Retail Class |
(10,877 | ) | (14,668 | ) | |||||||
From net realized gains: |
|||||||||||
Class N |
— | (675,503 | ) | ||||||||
Retail Class |
— | (22,680 | ) | ||||||||
Total dividends and distributions declared |
(603,959 | ) | (1,346,977 | ) | |||||||
Share transactions: |
|||||||||||
Proceeds from sales of shares |
10,904,266 | 12,490,720 | * | ||||||||
Net asset value of shares issued to shareholders for reinvestment
of dividends and distributions |
480,926 | 1,305,720 | |||||||||
Proceeds from short-term redemption fees |
— | 297 | |||||||||
Cost of shares redeemed |
(11,071,494 | ) | (35,196,533 | )* | |||||||
Net increase (decrease) in net assets resulting from share transactions |
313,698 | (21,399,796 | ) | ||||||||
Total increase (decrease) in net assets |
22,319,145 | (24,062,346 | ) | ||||||||
NET ASSETS: |
|||||||||||
Beginning of year |
112,036,129 | 136,098,475 | |||||||||
End of year (including undistributed net investment income
of $496,880 and $567,899, respectively) |
$ | 134,355,274 | $ | 112,036,129 | |||||||
* |
Includes share exchanges. See Note 5 in Notes to Financial Statements. |
The accompanying notes are an integral
part of these financial statements.
|
|
BBH GLOBAL CORE SELECT
FINANCIAL HIGHLIGHTS
Selected per share data and ratios for a Class N share outstanding throughout each
period.
| |
For the period from March 28, 2013 (commencement of operations) to October 31, 2013 | |||||||||||||||||||||
| For the years ended October 31, | ||||||||||||||||||||||
| 2017 | 2016 | 2015 | 2014 | |||||||||||||||||||
Net asset value, beginning of period |
$ | 11.11 | $ | 11.37 | $ | 11.27 | $ | 10.99 | $ | 10.00 | ||||||||||||
Income from investment operations: |
||||||||||||||||||||||
Net investment income1 |
0.05 | 0.06 | 0.06 | 0.12 | 0.03 | |||||||||||||||||
Net realized and unrealized gain (loss) |
2.22 | (0.18) | 0.30 | 0.21 | 0.96 | |||||||||||||||||
Total income (loss) from investment operations |
2.27 | (0.12) | 0.36 | 0.33 | 0.99 | |||||||||||||||||
Less dividends and distributions: |
||||||||||||||||||||||
From net investment income |
(0.06) | (0.07) | (0.13) | (0.02) | — | |||||||||||||||||
From net realized gains |
— | (0.07) | (0.13) | (0.03) | — | |||||||||||||||||
Total dividends and distributions |
(0.06) | (0.14) | (0.26) | (0.05) | — | |||||||||||||||||
Short-term redemption fees1 |
— | 0.00 | 2 | — | 0.00 | 2 | — | |||||||||||||||
Net asset value, end of period |
13.32 | $ | 11.11 | $ | 11.37 | $ | 11.27 | $ | 10.99 | |||||||||||||
Total return |
20.54 | % | (1.06) | % | 3.27 | % | 3.01 | % | 9.90 | %3 | ||||||||||||
Ratios/Supplemental data: |
||||||||||||||||||||||
Net assets, end of period (in millions) |
$ | 130 | $ | 108 | $ | 132 | $ | 127 | $ | 88 | ||||||||||||
Ratio of expenses to average net assets before reductions |
1.36 | % | 1.38 | % | 1.31 | % | 1.32 | % | 1.87 | %4 | ||||||||||||
Fee waiver |
0.10 | %5 | 0.13 | %5 | 0.05 | %5 | 0.07 | %5 | 0.61 | %4,5 | ||||||||||||
Expense offset arrangement |
0.01 | % | 0.01 | % | 0.01 | % | 0.00 | %6 | 0.01 | %4 | ||||||||||||
Ratio of expenses to average net assets after reductions |
1.25 | % | 1.24 | % | 1.25 | % | 1.25 | % | 1.25 | %4 | ||||||||||||
Ratio of net investment income to average net assets |
0.44 | % | 0.58 | % | 0.55 | % | 1.01 | % | 0.50 | %4 | ||||||||||||
Portfolio turnover rate |
23 | % | 19 | % | 31 | % | 40 | % | 6 | %7 | ||||||||||||
| 1 | Calculated using average shares outstanding for the period. |
| 2 | Less than $0.01. |
| 3 | Not annualized. |
| 4 | Annualized. |
| 5 | The ratio of expenses to average net assets for the years ended October 31, 2017, 2016, 2015 and 2014 and the period ended October 31, 2013 reflect fees reduced as result of a contractual operating expense limitation of the share class of 1.25%. The agreement is effective for the period beginning on March 28, 2013 through April 1, 2014 and has been renewed by all parties to the agreement through March 1, 2018. For the years ended October 31, 2017, 2016, 2015 and 2014 and the period ended October 31, 2013, the waived fees were $110,626, $146,074, $74,640, $90,671 and $152,928, respectively. |
| 6 | Less than 0.01%. |
| 7 | Represents Fund portfolio turnover for the period ended October 31, 2013. |
The accompanying notes are an integral
part of these financial statements.
BBH GLOBAL CORE SELECT
FINANCIAL HIGHLIGHTS (continued)
Selected per share data and ratios for a Retail Class share outstanding throughout each
period.
| |
For the period from April 2, 2013 (commencement of operations) to October 31, 2013 | |||||||||||||||||||||
| For the years ended October 31, | ||||||||||||||||||||||
2017 |
2016 | 2015 | 2014 | |||||||||||||||||||
Net asset value, beginning of period |
$ | 11.05 | $ | 11.31 | $ | 11.24 | $ | 10.98 | $ | 10.00 | ||||||||||||
Income from investment operations: |
||||||||||||||||||||||
Net investment income1 |
0.02 | 0.04 | 0.03 | 0.07 | 0.00 | 2 | ||||||||||||||||
Net realized and unrealized gain (loss) |
2.20 | (0.18) | 0.29 | 0.22 | 0.98 | |||||||||||||||||
Total income (loss) from investment operations |
2.22 | (0.14) | 0.32 | 0.29 | 0.98 | |||||||||||||||||
Less dividends and distributions: |
||||||||||||||||||||||
From net investment income |
(0.03) | (0.05) | (0.12) | (0.01) | — | |||||||||||||||||
From net realized gains |
— | (0.07) | (0.13) | (0.03) | — | |||||||||||||||||
Total dividends and distributions |
(0.03) | (0.12) | (0.25) | (0.04) | — | |||||||||||||||||
Short-term redemption fees1 |
— | — | — | 0.01 | 0.00 | 2 | ||||||||||||||||
Net asset value, end of period |
13.24 | $ | 11.05 | $ | 11.31 | $ | 11.24 | $ | 10.98 | |||||||||||||
Total return |
20.18 | % | (1.25) | % | 2.98 | % | 2.70 | % | 9.80 | %3 | ||||||||||||
Ratios/Supplemental data: |
||||||||||||||||||||||
Net assets, end of period (in millions) |
$ | 4 | $ | 4 | $ | 4 | $ | 2 | $ | 2 | ||||||||||||
Ratio of expenses to average net assets before reductions |
2.44 | % | 2.65 | % | 2.93 | % | 3.36 | % | 4.88 | %4 | ||||||||||||
Fee waiver |
0.93 | %5 | 1.14 | %5 | 1.43 | %5 | 1.86 | %5 | 3.37 | %4,5 | ||||||||||||
Expense offset arrangement |
0.01 | % | 0.01 | % | 0.00 | %6 | 0.00 | %6 | 0.01 | %4 | ||||||||||||
Ratio of expenses to average net assets after reductions |
1.50 | % | 1.50 | % | 1.50 | % | 1.50 | % | 1.50 | %4 | ||||||||||||
Ratio of net investment income to average net assets |
0.20 | % | 0.32 | % | 0.29 | % | 0.61 | % | 0.02 | %4 | ||||||||||||
Portfolio turnover rate |
23 | % | 19 | % | 31 | % | 40 | % | 6 | %7 | ||||||||||||
| 1 | Calculated using average shares outstanding for the period. |
| 2 | Less than $0.01. |
| 3 | Not annualized. |
| 4 | Annualized. |
| 5 | The ratio of expenses to average net assets for the years ended October 31, 2017, 2016, 2015 and 2014 and the period ended October 31, 2013 reflect fees reduced as result of a contractual operating expense limitation of the share class of 1.50%. The agreement is effective for the period beginning on March 28, 2013 through April 1, 2014 and has been renewed by all parties to the agreement through March 1, 2018. For the years ended October 31, 2017, 2016, 2015 and 2014 and the period ended October 31, 2013, the waived fees were $35,288, $40,663, $41,058, $41,099 and $17,913, respectively. |
| 6 | Less than 0.01%. |
| 7 | Represents Fund portfolio turnover for the period ended October 31, 2013. |
The accompanying notes are an integral
part of these financial statements.
|
|
BBH GLOBAL CORE SELECT
NOTES TO FINANCIALS STATEMENTS
October 31, 2017
1. |
Organization. The Fund is a separate, non-diversified series of BBH Trust (the “Trust”), which is registered under the Investment Company Act of 1940, as amended (the “1940 Act”), as an open-end management investment company. The Trust was originally organized under the laws of the State of Maryland on July 16, 1990 as BBH Fund, Inc. and re-organized as a Delaware statutory trust on June 12, 2007. The Fund is the successor to the BBH private investment fund, BBH Global Funds, LLC — Global Core Select, which launched on April 2, 2012. The Fund commenced operations on March 28, 2013. The Fund offers Class N shares and Retail Class shares. Class N and Retail Class shares have different operating expenses. With the exception of class specific expenses, all expenses are allocated between classes based on net assets. Neither Class N shares nor Retail Class shares automatically convert to any other class of shares of the Fund. As of October 31, 2017 there were six series of the Trust. |
2. |
Significant Accounting Policies. The Fund’s financial statements are prepared in accordance with Generally Accepted Accounting Principles in the United States of America (“GAAP”). The Fund is an investment company and accordingly follows the investment company accounting and reporting guidance of the Financial Accounting Standards Board (FASB) Accounting Standard Codification Topic 946 Financial Services — Investment Companies. The following summarizes significant accounting policies of the Fund: |
A. |
Valuation of Investments. (1) The value of investments listed on a securities exchange is based on the last sale price on that exchange prior to the time when assets are valued, or in the absence of recorded sales, at the average of readily available closing bid and asked prices on such exchange; (2) securities not traded on an exchange are valued at the average of the quoted bid and asked prices in the over-the counter market; (3) securities or other assets for which market quotations are not readily available are valued at fair value in accordance with procedures established by and under the general supervision and responsibility of the Board of Trustees (the “Board”); (4) for securities traded on international exchanges, if events which may affect the value of the Fund’s securities occur after the close of the primary exchange on which such securities trade and before the Fund’s net asset value is next determined, then those securities will be fair valued as determined in good faith under supervision of the Board. The Fund currently uses a systematic fair value model provided by an independent third party to adjust the observed values of international securities on a daily basis; (5) short-term investments, which mature in 60 days or less are valued at amortized cost if their original maturity was 60 days or less, or by amortizing their value on the 61st day prior to maturity, if their original maturity when acquired by the Fund was more than 60 days, unless the use of amortized cost is determined not to represent “fair value” by the Board. |
BBH GLOBAL CORE SELECT
NOTES TO FINANCIALS STATEMENTS (continued)
October 31, 2017
B. |
Accounting for Investments and Income. Investment transactions are accounted for on the trade date. Realized gains and losses on investment transactions are determined based on the identified cost method. Dividend income and other distributions received from portfolio securities are recorded on the ex-dividend date. Non-cash dividends included in dividend income, if any, are recorded at the fair market value of securities received at ex-date. Distributions received on securities that represent a return of capital are recorded as a reduction of cost of investments. Distributions received on securities that represent a capital gain are recorded as a realized gain. Interest income is accrued daily. Investment income is recorded net of any foreign taxes withheld where recovery of such tax is uncertain. |
C. |
Fund Expenses. Most expenses of the Trust can be directly attributed to a specific fund. Expenses which cannot be directly attributed to a fund are apportioned amongst each fund in the Trust equally. Expense estimates are accrued in the period to which they relate and adjustments are made when actual amounts are known. |
D. |
Repurchase Agreements. The Fund may enter into repurchase agreements. Repurchase agreements are transactions in which the Fund buys a security from a dealer or bank and agrees to sell the security back at a mutually agreed upon time and price. The repurchase price normally is in excess of the purchase price, reflecting an agreed upon interest rate. The rate is effective for the period of time that assets of the Fund are invested in the agreement and is not related to the coupon rate on the underlying security. The Fund will enter into repurchase agreements only with banks and other recognized financial institutions, such as securities dealers, deemed creditworthy by the investment adviser. The Fund’s custodian or sub-custodian will take possession of the securities subject to repurchase agreements. The investment adviser, custodian or sub-custodian will monitor the value of the underlying collateral each day to ensure that the value of the security always equals or exceeds the repurchase price. |
|
|
BBH GLOBAL CORE SELECT
NOTES TO FINANCIALS STATEMENTS (continued)
October 31, 2017
E. |
Foreign Currency Translations. The accounting records of the Fund are maintained in U.S. dollars. Foreign currency amounts are translated into U.S. dollars at the current rate of exchange of such currency against the U.S. dollar to determine the value of investments, assets and liabilities. Purchases and sales of securities, and income and expenses are translated at the prevailing rate of exchange on the respective dates of such transactions. Upon the purchase or sale of a security denominated in foreign currency, the Fund may enter into forward foreign currency exchange contracts for the purchase or sale, for a fixed amount of U.S. dollars, of the amount of foreign currency involved in the underlying security transaction. Reported net realized gains and losses arise from the sales of portfolio securities, sales of foreign currencies, currency gains or losses realized between the trade and settlement dates on securities transactions, and the difference between the amounts of dividends, interest and foreign withholding taxes recorded on the Fund’s books and the U.S. dollar equivalent of the amounts actually received or paid. The effect of changes in foreign exchange rates on foreign denominated securities is reflected in the net realized and unrealized gain or loss on investments in securities and foreign exchange transactions and translations and net change in unrealized appreciation or depreciation on investments in securities and foreign currency translations. Net unrealized appreciation or depreciation on foreign currency translations arise from changes in the value of the assets and liabilities, excluding investments in securities, at period end, resulting from changes in the exchange rate. |
F. |
Federal Income Taxes. The Fund may be subject to foreign taxes on income, gains on investments or currency repatriation, a portion of which may be recoverable. The Fund will accrue such taxes and recoveries, as applicable, based upon its current interpretation of tax rules and regulations that exist in the markets in which it invests. |
BBH GLOBAL CORE SELECT
NOTES TO FINANCIALS STATEMENTS (continued)
October 31, 2017
Accordingly, the amount of net
investment income and net realized gain reported in these financial statements may differ from that reported on the Fund’s tax return, due to
certain book-to-tax timing differences such as losses deferred due to “wash sale” transactions and utilization of capital loss carryforwards.
These differences may result in temporary over-distributions for financial statement purposes and are classified as distributions in excess of
accumulated net realized gains or net investment income. These distributions do not constitute a return of capital. Permanent differences are
reclassified in the Statement of Assets & Liabilities based upon their tax classification. As such, the character of distributions to shareholders
reported in the Financial Highlights table may differ from that reported to shareholders on Form 1099-DIV.
G. |
Dividends and Distributions to Shareholders. Dividends and distributions to shareholders, if any, are paid annually and are recorded on the ex-dividend date. The Fund declared dividends in the amount of $593,082 and $10,877 to Class N and Retail Class shareholders, respectively, during the year ended October 31, 2017. In addition, the Fund designated a portion of the payment made to redeeming shareholders as a distribution for income tax purposes. |
| Distributions paid
from: |
||||||||||||||||||||||
| Ordinary income |
Net long-term capital gain |
Total taxable distributions |
Tax return of capital |
Total distributions paid |
||||||||||||||||||
2017: |
$ | 603,959 | $ | — | $ | 603,959 | $ | — | $ | 603,959 | ||||||||||||
2016: |
648,794 | 698,183 | 1,346,977 | — | 1,346,977 | |||||||||||||||||
|
|
BBH GLOBAL CORE SELECT
NOTES TO FINANCIALS STATEMENTS (continued)
October 31, 2017
| Components of accumulated
earnings/(deficit): |
||||||||||||||||||||||||||||||||
| Undistributed ordinary income |
Undistributed long-term capital gain |
Accumulated earnings |
Accumulated capital and other losses |
Other book/tax temporary differences |
Book unrealized appreciation/ (depreciation) |
Total accumulated earnings / (deficit) |
||||||||||||||||||||||||||
2017: |
$ | 1,374,478 | $ | 1,635,451 | $ | 3,009,929 | — | $ | (447,191 | ) | $ | 28,343,778 | $ | 30,906,516 | ||||||||||||||||||
2016: |
567,899 | — | 567,899 | — | (772,531 | ) | 9,151,064 | 8,946,432 | ||||||||||||||||||||||||
H. |
Use of Estimates. The preparation of the financial statements in accordance with GAAP requires management to make estimates and assumptions that affect the reported amounts of assets and liabilities in the financial statements, disclosure of contingent assets and liabilities at the date of the financial statements and the reported amounts of increase and decrease in net assets from operations during the reporting period. Actual results could differ from these estimates. |
3. |
Fees and Other Transactions with Affiliates. |
A. |
Investment Advisory and Administrative Fees. Under a combined Investment Advisory and Administrative Services Agreement (“Agreement”) with the Trust, Brown Brothers Harriman & Co. (“BBH”) through a separately identifiable department (“SID” or “Investment Adviser”) provides investment advisory, portfolio management and administrative services to the Fund. The Fund pays a combined fee for investment advisory and administrative services calculated daily and paid monthly at an annual rate equivalent to 0.95% on the first $3,000,000,000 of the Fund’s average daily net assets and 0.90% per annum on the Fund’s average daily net assets over $3,000,000,000. For the year ended October 31, 2017, the Fund incurred $1,158,801 under the Agreement. |
BBH GLOBAL CORE SELECT
NOTES TO FINANCIALS STATEMENTS (continued)
October 31, 2017
B. |
Investment Advisory and Administrative Fee Waivers. Effective March 28, 2013 (commencement of operations), the Investment Adviser contractually agreed to limit the annual Fund operating expenses (excluding interest, taxes, brokerage commissions, other expenditures that are capitalized in accordance with GAAP, other extraordinary expenses not incurred in the ordinary course of the Fund’s business and for Retail Class, amounts payable pursuant to any plan adopted in accordance with Rule 12b-1) of Class N and Retail Class to 1.25%. The agreement will terminate on March 1, 2018, unless it is renewed by all parties to the agreement. The agreement may only be terminated during its term with approval of the Fund’s Board of Trustees. For the year ended October 31, 2017, the Investment Adviser waived fees in the amount of $110,626 and $35,288 for Class N and Retail Class, respectively. |
C. |
Shareholder Servicing Fees. The Trust has a shareholder servicing agreement with BBH. BBH receives a fee from the Fund calculated daily and paid monthly at an annual rate of 0.20% of Class N and Retail Class shares’ average daily net assets. For the year ended October 31, 2017, the Fund incurred shareholder servicing fees in the amount of $236,354 and $7,604 for Class N and Retail Class, respectively. |
D. |
Distribution (12b-1) Fees. The Fund has adopted a distribution plan pursuant to Rule 12b-1 for Retail Class shares that allows the Fund to pay distribution and other fees for the sale of its shares and for services provided to shareholders. Because these fees are paid out of the Fund’s assets continuously, over time these fees will increase the cost of investment and may cost the shareholder more than paying other types of sales charges. The maximum annual distribution fee for Retail Class shares is 0.25% of the average daily net assets of the Retail Class shares of the Fund. With this agreement along with the investment advisory and waiver agreements above, it is anticipated that total operating expenses for Retail Class shares will be 1.50% of the average daily net assets. For the year ended October 31, 2017, Retail Class shares of the Fund incurred $9,508 for Distribution (12b-1) Fees. This amount is presented under line item “Distributors fees” in the Statement of Operations. |
E. |
Custody and Fund Accounting Fees. BBH acts as a custodian and fund accountant and receives custody and fund accounting fees from the Fund calculated daily and incurred monthly. BBH holds all of the Fund’s cash and investments and calculates the Fund’s daily net asset value. The custody fee is an asset and transaction-based fee. The fund accounting fee is an asset-based fee calculated at 0.004% of the Fund’s net asset value. For the year ended October 31, 2017, the Fund incurred $39,091 in custody and fund accounting fees. These fees for the Fund were reduced by $14,993 as a result of an expense offset arrangement with the Fund’s custodian. The credit amount (if any) is disclosed in the Statement of Operations as a reduction to the Fund’s expenses. In the event that the Fund is overdrawn, under the custody agreement with BBH, BBH will make overnight loans to the Fund to cover overdrafts. |
|
|
BBH GLOBAL CORE SELECT
NOTES TO FINANCIALS STATEMENTS (continued)
October 31, 2017
F. |
Board of Trustees’ Fees. Each Trustee who is not an “interested person” as defined under the 1940 Act receives an annual fee as well as reimbursement for reasonable out-of-pocket expenses from the Fund. For the year ended October 31, 2017, the Fund incurred $54,543 in independent Trustee compensation and reimbursements. |
4. |
Investment Transactions. For the year ended October 31, 2017, the cost of purchases and the proceeds of sales of investment securities, other than short-term investments, were $26,574,123 and $31,153,777, respectively. |
5. |
Shares of Beneficial Interest. The Trust is permitted to issue an unlimited number of Class N and Retail Class shares of beneficial interest, at no par value. Transactions in Class N and Retail Class shares were as follows: |
| For the year ended October 31, 2017 |
For the year ended October 31, 2016 |
||||||||||||||
| Shares | Dollars | Shares | Dollars | ||||||||||||
Class N |
|||||||||||||||
Shares sold |
891,299 | $ | 10,859,908 | 1,128,001 | $ | 12,396,138 | |||||||||
Shares issued in connection with reinvestments of dividends |
41,531 | 470,955 | 117,195 | 1,271,563 | |||||||||||
Proceeds from short-term redemption fees |
N/A | — | N/A | 297 | |||||||||||
Shares redeemed |
(901,051 | ) | (10,675,842 | ) | (3,124,991 | ) | (35,007,891 | ) | |||||||
Net increase (decrease) |
31,779 | $ | 655,021 | (1,879,795 | ) | $ | (21,339,893 | ) | |||||||
Retail Class |
|||||||||||||||
Shares sold |
3,632 | $ | 44,358 | 8,626 | $ | 94,582 | |||||||||
Shares issued in connection with reinvestments of dividends |
882 | 9,971 | 3,160 | 34,157 | |||||||||||
Shares redeemed |
(31,411 | ) | (395,652 | ) | (17,195 | ) | (188,642 | ) | |||||||
Net decrease |
(26,897 | ) | $ | (341,323 | ) | (5,409 | ) | $ | (59,903 | ) | |||||
BBH GLOBAL CORE SELECT
NOTES TO FINANCIALS STATEMENTS (continued)
October 31, 2017
6. |
Principal Risk Factors and Indemnifications. |
A. |
Principal Risk Factors. Investing in the Fund may involve certain risks, as discussed in the Fund’s prospectus, including but not limited to, those described below: |
|
|
BBH GLOBAL CORE SELECT
NOTES TO FINANCIALS STATEMENTS (continued)
October 31, 2017
B. |
Indemnifications. Under the Trust’s organizational documents, its officers and Trustees may be indemnified against certain liabilities and expenses arising out of the performance of their duties to the Fund, and shareholders are indemnified against personal liability for the obligations of the Trust. Additionally, in the normal course of business, the Fund enters into agreements with service providers that may contain indemnification clauses. The Fund’s maximum exposure under these arrangements is unknown as this would involve future claims that may be made against the Fund that have not yet occurred. The risk of material loss from such claims is considered remote. |
7. |
Recent Pronouncements. |
A. |
Regulation S-X. In October 2016, the U.S. Securities and Exchange Commission adopted new rules and amended existing rules (together, “final rules”) intended to modernize the reporting and disclosure of information by registered investment companies. In part, the final rules amend Regulation S-X and require standardized, enhanced disclosure about derivatives in investment company financial statements, as well as other amendments. The compliance date for the amendments to Regulation S-X was August 1, 2017. The changes related to Regulation S-X are reflected in the financial statements. |
8. |
Subsequent Events. Management has evaluated events and transactions that have occurred since October 31, 2017 through the date the financial statements were issued and determined that there were none that would require recognition or additional disclosure in the financial statements. |
BBH GLOBAL CORE SELECT
DISCLOSURE OF FUND EXPENSES
October 31, 2017 (unaudited)
|
|
BBH GLOBAL CORE SELECT
DISCLOSURE OF FUND EXPENSES (continued)
October 31, 2017 (unaudited)
| Beginning Account Value May 1, 2017 |
Ending Account Value October 31, 2017 |
Expenses Paid During Period May 1, 2017 to October 31, 20171 |
||||||||||||
Class N |
||||||||||||||
Actual |
$ | 1,000 | $ | 1,090 | $ | 6.58 | ||||||||
Hypothetical2 |
$ | 1,000 | $ | 1,019 | $ | 6.36 | ||||||||
| Beginning Account Value May 1, 2017 |
Ending Account Value October 31, 2017 |
Expenses Paid During Period May 1, 2017 to October 31, 20171 |
||||||||||||
Retail Class |
||||||||||||||
Actual |
$ | 1,000 | $ | 1,088 | $ | 7.89 | ||||||||
Hypothetical2 |
$ | 1,000 | $ | 1,018 | $ | 7.63 | ||||||||
| 1 | Expenses are equal to the Fund’s annualized expense ratio of 1.25% and 1.50% for Class N and Retail Class shares, respectively, multiplied by the average account value over the period, multiplied by 184/365 (to reflect the one-half year period). |
| 2 | Assumes a return of 5% before expenses. For the purposes of the calculation, the applicable annualized expenses ratio for each class of shares is subtracted from the assumed return before expenses. |
BBH GLOBAL CORE SELECT
CONFLICTS OF INTEREST
October 31, 2017 (unaudited)
|
|
BBH GLOBAL CORE SELECT
CONFLICTS OF INTEREST (continued)
October 31, 2017 (unaudited)
BBH GLOBAL CORE SELECT
CONFLICTS OF INTEREST (continued)
October 31, 2017 (unaudited)
|
|
BBH GLOBAL CORE SELECT
CONFLICTS OF INTEREST (continued)
October 31, 2017 (unaudited)
BBH GLOBAL CORE SELECT
CONFLICTS OF INTEREST (continued)
October 31, 2017 (unaudited)
|
|
BBH GLOBAL CORE SELECT
CONFLICTS OF INTEREST (continued)
October 31, 2017 (unaudited)
BBH GLOBAL CORE SELECT
ADDITIONAL FEDERAL TAX INFORMATION
October 31, 2017 (unaudited)
|
|
TRUSTEES AND OFFICERS OF BBH GLOBAL CORE
SELECT
(unaudited)
| Name and Birth Year |
|
Position(s) Held with the Trust |
|
Term of Office and Length of Time Served# |
|
Principal Occupation(s) During Past 5 Years |
|
Number of Portfolios in Fund Complex Overseen by Trusteeˆ |
|
Other Public Company or Investment Company Directorships held by Trustee During Past 5 Years |
|||||||||||||
Independent Trustees |
|||||||||||||||||||||||
H. Whitney Wagner Birth Year: 1956 |
Chairman of the Board and Trustee |
Chairman Since 2014; Trustee Since 2007 and 2006-2007 with the Predecessor Trust |
President, Clear Brook Advisors, a registered investment adviser. |
6 |
None. |
||||||||||||||||||
Andrew S. Frazier Birth Year: 1948 |
Trustee |
Since 2010 |
Consultant to Western World Insurance Group, Inc. (“WWIG”) (January 2010 to January 2012). |
6 |
Director of WWIG. |
||||||||||||||||||
Mark M. Collins Birth Year: 1956 |
Trustee |
Since 2011 |
Partner of Brown Investment Advisory Incorporated, a registered investment adviser. |
6 |
Chairman of Dillon Trust Company. |
||||||||||||||||||
John M. Tesoro Birth Year: 1952 |
Trustee |
Since 2014 |
Partner, Certified Public Accountant, KPMG LLP (retired in September 2012). |
6 |
Trustee, Bridge Builder Trust (8 Funds) Director; Teton Advisors, Inc. (a registered investment adviser). |
||||||||||||||||||
TRUSTEES AND OFFICERS OF BBH GLOBAL CORE
SELECT
(unaudited)
| Name, Address and Birth Year |
|
Position(s) Held with the Trust |
|
Term of Office and Length of Time Served# |
|
Principal Occupation(s) During Past 5 Years |
|
Number of Portfolios in Fund Complex Overseen by Trusteeˆ |
|
Other Public Company or Investment Company Directorships held by Trustee During Past 5 Years |
|||||||||||||
Interested Trustees |
|||||||||||||||||||||||
Susan C. Livingston+ 50 Post Office Square Boston, MA 02110 Birth Year: 1957 |
Trustee |
Since 2011 |
Partner (since 1998) and Senior Client Advocate (since 2010) for BBH&Co.; Director of BBH Luxembourg S.C.A. (since
1992). |
6 |
None. |
||||||||||||||||||
John A. Gehret+ 140 Broadway New York, NY 10005 Birth Year: 1959 |
Trustee |
Since 2011 |
Limited Partner of BBH&Co. (2012-present); Director of BBH Luxembourg S.C.A. (since 2012); Director of BBH Trust Company (Cayman)
Ltd. (since 2012). |
6 |
None. |
||||||||||||||||||
|
|
TRUSTEES AND OFFICERS OF BBH GLOBAL CORE
SELECT
(unaudited)
| Name, Address and Birth Year |
|
Position(s) Held with the Trust |
|
Term of Office and Length of Time Served# |
|
Principal Occupation(s) During Past 5
Years |
Officers |
||||||
Jean-Pierre Paquin 140 Broadway New York, NY 10005 Birth Year: 1973 |
President and Principal Executive Officer |
Since 2016 |
Partner of BBH&Co. since 2015; joined BBH&Co. in 1996. |
|||
Daniel Greifenkamp 140 Broadway New York, NY 10005 Birth Year: 1969 |
Vice
President |
Since 2016 |
Managing Director of BBH&Co. since 2014; joined BBH&Co. in 2011. |
|||
Charles H. Schreiber 140 Broadway New York, NY 10005 Birth Year: 1957 |
Treasurer and Principal Financial Officer |
Since 2007 2006-2007 with the Predecessor Trust |
Senior Vice President of BBH&Co. since 2001; joined BBH&Co. in 1999. |
|||
Paul F. Gallagher 140 Broadway New York, NY 10005 Birth Year: 1959 |
Chief Compliance Officer (“CCO”) |
Since 2015 |
Senior Vice President of BBH&Co. since September 2015; Executive Director, Counsel, Morgan Stanley Smith Barney LLC (2009-September
2015). |
|||
Keith M. Kelley 140 Broadway New York, NY 10005 Birth Year: 1983 |
Anti-Money Laundering Officer (“AMLO”) |
Since 2016 |
Vice
President of BBH&Co. since February 2016; joined BBH&Co. in 2016; Director, Legal and Compliance, Morgan Stanley Smith Barney LLC
(2014-February 2016); Compliance Manager, State Street Corporation (2013- 2014); Associate, J.P. Morgan Chase & Co. (2011-2013). |
TRUSTEES AND OFFICERS OF BBH GLOBAL CORE
SELECT
(unaudited)
| Name, Address and Birth Year |
|
Position(s) Held with the Trust |
|
Term of Office and Length of Time Served# |
|
Principal Occupation(s) During Past 5
Years |
Suzan M. Barron 50 Post Office Square Boston, MA 02110 Birth Year: 1964 |
Secretary |
Since 2009 |
Senior Vice President and Senior Investor Services Counsel, BBH&Co. since 2005. |
|||
Rowena Rothman 140 Broadway New York, NY 10005 Birth Year: 1967 |
Assistant Treasurer |
Since 2011 |
Vice
President of BBH&Co. since 2009. |
| # | All officers of the Trust hold office for one year and until their respective successors are chosen and qualified (subject to the ability of the Trustees to remove any officer in accordance with the Trust’s By-laws). Mr. Wagner previously served on the Board of Trustees of the Predecessor Trust. |
| + | Ms. Livingston and Mr. Gehret are “interested persons” of the Trust as defined in the 1940 Act because of their positions as Partner and Limited Partner of BBH&Co., respectively. |
ˆ |
The Fund Complex consists of the Trust, which has six series, and each is counted as one “Portfolio” for purposes of this table. |
|
|
Administrator
Brown Brothers Harriman & Co. 140 Broadway New York, NY 10005 Distributor Alps Distributors, Inc. 1290 Broadway, Suite 1100 Denver, Co 80203 Shareholder Servicing Agent Brown Brothers Harriman & Co. 140 Broadway New York, NY 10005 1-800-575-1265 |
Investment Adviser Brown Brothers Harriman Mutual Fund Advisory Department 140 Broadway New York, NY 10005 |
By telephone: |
Call
1-800-575-1265 |
|||||
By E-mail send your request to: |
bbhfunds@bbh.com |
|||||
On the internet: |
www.bbhfunds.com |
|||||
(FORMERLY BBH INTERNATIONAL
EQUITY FUND)
BBH PARTNER FUND – INTERNATIONAL EQUITY
(formerly BBH International Equity Fund)
MANAGEMENT’S DISCUSSION OF FUND PERFORMANCE
October
31, 2017
BBH PARTNER FUND – INTERNATIONAL EQUITY
(formerly BBH International Equity Fund)
MANAGEMENT’S DISCUSSION OF FUND PERFORMANCE
(continued)
October 31, 2017
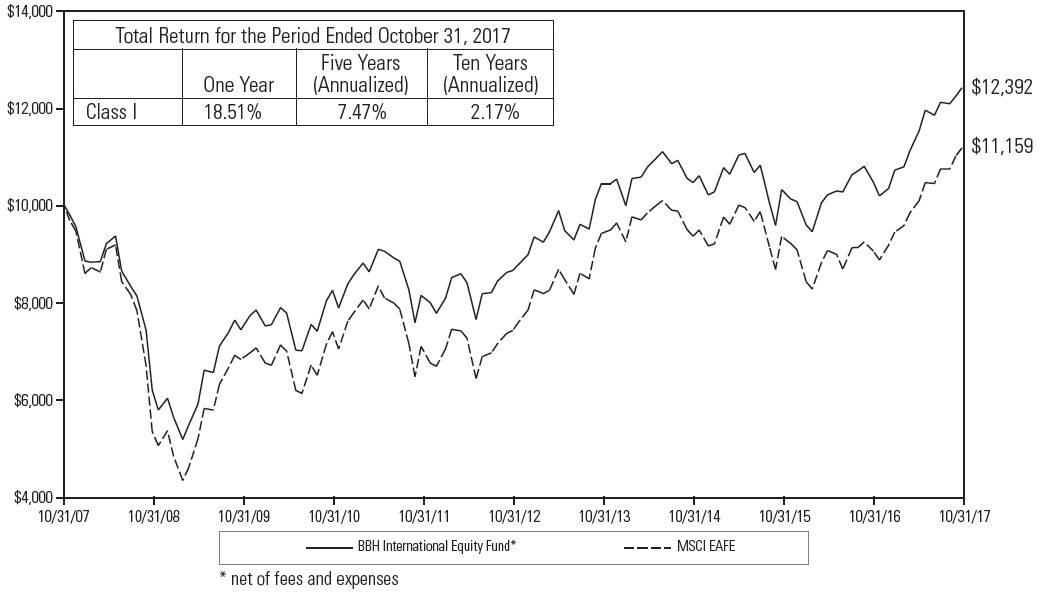
|
| 1 | The Fund’s performance assumes the reinvestment of all dividends and distributions. The EAFE has been adjusted to reflect reinvestment of dividends on securities in the index. The EAFE is not adjusted to reflect sales charges, expenses or other fees that the Securities and Exchange Commission requires to be reflected in the Fund’s performance. |
|
|
BBH PARTNER FUND – INTERNATIONAL EQUITY
(formerly BBH International Equity Fund)
REPORT OF INDEPENDENT REGISTERED PUBLIC ACCOUNTING
FIRM
International Equity (formerly BBH International Equity Fund):
December 22,
2017
BBH PARTNER FUND – INTERNATIONAL EQUITY
(formerly BBH International Equity Fund)
PORTFOLIO ALLOCATION
October 31, 2017
| U.S. $ Value |
Percent of Net Assets |
|||||||||
Common Stocks: |
||||||||||
Bermuda |
$ | 10,378,859 | 0.7 | % | ||||||
Brazil |
16,523,879 | 1.2 | ||||||||
Canada |
93,677,646 | 6.6 | ||||||||
Cayman Islands |
28,382,175 | 2.0 | ||||||||
Denmark |
19,199,626 | 1.3 | ||||||||
France |
203,785,006 | 14.3 | ||||||||
Germany |
120,759,065 | 8.5 | ||||||||
Hong Kong |
63,618,800 | 4.5 | ||||||||
Ireland |
24,504,218 | 1.7 | ||||||||
Israel |
22,180,684 | 1.5 | ||||||||
Italy |
21,659,471 | 1.5 | ||||||||
Japan |
124,256,726 | 8.7 | ||||||||
Jersey |
25,185,303 | 1.8 | ||||||||
Mexico |
30,999,130 | 2.2 | ||||||||
Spain |
50,968,123 | 3.6 | ||||||||
Switzerland |
186,778,960 | 13.1 | ||||||||
United Kingdom |
134,221,232 | 9.4 | ||||||||
Registered Investment Companies: |
||||||||||
United States |
219,300,000 | 15.4 | ||||||||
Cash and Other Assets in Excess of Liabilities |
29,162,907 | 2.0 | ||||||||
NET ASSETS |
$ | 1,425,541,810 | 100.0 | % | ||||||
The accompanying notes are an integral part of these
financial statements.
|
|
BBH PARTNER FUND – INTERNATIONAL EQUITY
(formerly BBH International Equity Fund)
PORTFOLIO ALLOCATION (continued)
October 31,
2017
SECTOR DIVERSIFICATION
| U.S. $ Value |
Percent of Net Assets |
|||||||||
Common Stocks: |
||||||||||
Basic Materials |
$ | 66,579,573 | 4.7 | % | ||||||
Communications |
100,744,305 | 7.1 | ||||||||
Consumer Cyclical |
297,172,399 | 20.8 | ||||||||
Consumer Non-Cyclical |
250,830,793 | 17.6 | ||||||||
Financials |
209,964,567 | 14.7 | ||||||||
Industrials |
161,192,977 | 11.3 | ||||||||
Technology |
90,594,289 | 6.4 | ||||||||
Registered Investment Companies |
219,300,000 | 15.4 | ||||||||
Cash and Other Assets in Excess of Liabilities |
29,162,907 | 2.0 | ||||||||
NET ASSETS |
$ | 1,425,541,810 | 100.0 | % | ||||||
All data as of October 31, 2017. The Fund’s sector diversification is expressed as a percentage of net assets and may vary over time.
The accompanying notes are an integral part of these
financial statements.
BBH PARTNER FUND – INTERNATIONAL EQUITY
(formerly BBH International Equity Fund)
PORTFOLIO OF INVESTMENTS
October 31,
2017
| Shares/ Units |
Value |
|||||||
COMMON STOCKS (82.6%) |
||||||||
BERMUDA (0.7%) |
||||||||
CONSUMER NON-CYCLICAL |
||||||||
| 243,578 | IHS Markit, Ltd.1 |
$ | 10,378,859 | |||||
Total Bermuda |
10,378,859 |
|||||||
BRAZIL (1.2%) |
||||||||
CONSUMER NON-CYCLICAL |
||||||||
| 2,585,829 | Ambev SA |
16,523,879 | ||||||
Total Brazil |
16,523,879 |
|||||||
CANADA (6.6%) |
||||||||
CONSUMER CYCLICAL |
||||||||
| 509,647 | Alimentation Couche-Tard, Inc. (Class B) |
23,924,063 | ||||||
FINANCIALS |
||||||||
| 929,269 | Brookfield Asset Management, Inc. (Class A) |
38,973,542 | ||||||
INDUSTRIALS |
||||||||
| 177,321 | Canadian Pacific Railway, Ltd.1 |
30,780,041 | ||||||
Total Canada |
93,677,646 |
|||||||
CAYMAN ISLANDS (2.0%) |
||||||||
COMMUNICATIONS |
||||||||
| 116,349 | Baidu, Inc. ADR1 |
28,382,175 | ||||||
Total Cayman Islands |
28,382,175 |
|||||||
DENMARK (1.3%) |
||||||||
CONSUMER NON-CYCLICAL |
||||||||
| 218,335 | Coloplast AS (Class B) |
19,199,626 | ||||||
Total Denmark |
19,199,626 |
|||||||
FRANCE (14.3%) |
||||||||
BASIC MATERIALS |
||||||||
| 438,541 | Air Liquide SA |
55,858,381 | ||||||
CONSUMER CYCLICAL |
||||||||
| 108,249 | LVMH Moet Hennessy Louis Vuitton SE |
32,307,325 | ||||||
| 168,334 | Sodexo SA |
21,429,250 | ||||||
| 53,736,575 | ||||||||
The accompanying notes are an integral part of these
financial statements.
|
|
BBH PARTNER FUND – INTERNATIONAL EQUITY
(formerly BBH International Equity Fund)
PORTFOLIO OF INVESTMENTS (continued)
October 31,
2017
| Shares/ Units |
Value | |||||||
COMMON STOCKS (continued) |
||||||||
FRANCE (continued) |
||||||||
CONSUMER NON-CYCLICAL |
||||||||
| 148,107 | Essilor International SA |
$ | 18,760,576 | |||||
INDUSTRIALS |
||||||||
| 272,548 | Safran SA1 |
28,719,080 | ||||||
TECHNOLOGY |
||||||||
| 271,165 | Capgemini SE |
32,973,361 | ||||||
| 129,318 | Dassault Systemes SE |
13,737,033 | ||||||
| 46,710,394 | ||||||||
Total France |
203,785,006 |
|||||||
GERMANY (8.5%) |
||||||||
CONSUMER CYCLICAL |
||||||||
| 208,999 | Adidas AG |
46,512,197 | ||||||
CONSUMER NON-CYCLICAL |
||||||||
| 630,825 | Fresenius SE & Co. KGaA |
52,697,058 | ||||||
| 51,377 | Henkel AG & Co. KGaA (Preference Shares) |
7,211,690 | ||||||
| 59,908,748 | ||||||||
TECHNOLOGY |
||||||||
| 126,034 | SAP SE |
14,338,120 | ||||||
Total Germany |
120,759,065 |
|||||||
HONG KONG (4.5%) |
||||||||
FINANCIALS |
||||||||
| 8,453,600 | AIA Group, Ltd. |
63,618,800 | ||||||
Total Hong Kong |
63,618,800 |
|||||||
IRELAND (1.7%) |
||||||||
INDUSTRIALS |
||||||||
| 649,198 | CRH, Plc.1 |
24,504,218 | ||||||
Total Ireland |
24,504,218 |
|||||||
The accompanying notes are an integral part of these
financial statements.
BBH PARTNER FUND – INTERNATIONAL EQUITY
(formerly BBH International Equity Fund)
PORTFOLIO OF INVESTMENTS (continued)
October 31,
2017
| Shares/ Units |
Value | |||||||
COMMON STOCKS (continued) |
||||||||
ISRAEL (1.5%) |
||||||||
TECHNOLOGY |
||||||||
| 188,435 | Check Point Software Technologies, Ltd.1 |
$ | 22,180,684 | |||||
Total Israel |
22,180,684 |
|||||||
ITALY (1.5%) |
||||||||
CONSUMER CYCLICAL |
||||||||
| 377,933 | Luxottica Group SpA |
21,659,471 | ||||||
Total Italy |
21,659,471 |
|||||||
JAPAN (8.7%) |
||||||||
COMMUNICATIONS |
||||||||
| 968,515 | Dentsu, Inc. |
41,363,000 | ||||||
CONSUMER NON-CYCLICAL |
||||||||
| 164,900 | Kao Corp. |
9,976,048 | ||||||
| 1,255,600 | Seven & i Holdings Co., Ltd. |
50,775,533 | ||||||
| 60,751,581 | ||||||||
INDUSTRIALS |
||||||||
| 40,000 | Keyence Corp.1 |
22,142,145 | ||||||
Total Japan |
124,256,726 |
|||||||
JERSEY (1.8%) |
||||||||
CONSUMER CYCLICAL |
||||||||
| 361,212 | Ferguson, Plc. |
25,185,303 | ||||||
Total Jersey |
25,185,303 |
|||||||
MEXICO (2.2%) |
||||||||
COMMUNICATIONS |
||||||||
| 1,416,132 | Grupo Televisa SAB ADR |
30,999,130 | ||||||
Total Mexico |
30,999,130 |
|||||||
The accompanying notes are an integral part of these
financial statements.
|
|
BBH PARTNER FUND – INTERNATIONAL EQUITY
(formerly BBH International Equity Fund)
PORTFOLIO OF INVESTMENTS (continued)
October 31,
2017
| Shares/ Units |
Value | |||||||
COMMON STOCKS (continued) |
||||||||
SPAIN (3.6%) |
||||||||
CONSUMER CYCLICAL |
||||||||
| 1,166,441 | Industria de Diseno Textil SA |
$ | 43,603,032 | |||||
TECHNOLOGY |
||||||||
| 108,562 | Amadeus IT Group SA |
7,365,091 | ||||||
Total Spain |
50,968,123 |
|||||||
SWITZERLAND (13.1%) |
||||||||
BASIC MATERIALS |
||||||||
| 4,797 | Givaudan SA |
10,721,192 | ||||||
CONSUMER CYCLICAL |
||||||||
| 289,073 | Cie Financiere Richemont SA |
26,706,271 | ||||||
CONSUMER NON-CYCLICAL |
||||||||
| 563,392 | Nestle SA |
47,443,673 | ||||||
FINANCIALS |
||||||||
| 239,486 | Chubb, Ltd. |
36,119,279 | ||||||
| 15,959 | Partners Group Holding AG |
10,741,052 | ||||||
| 46,860,331 | ||||||||
INDUSTRIALS |
||||||||
| 423,221 | ABB, Ltd. |
11,085,131 | ||||||
| 251,311 | Kuehne + Nagel International AG1 |
43,962,362 | ||||||
| 55,047,493 | ||||||||
Total Switzerland |
186,778,960 | |||||||
The accompanying notes are an integral part of these
financial statements.
BBH PARTNER FUND – INTERNATIONAL EQUITY
(formerly BBH International Equity Fund)
PORTFOLIO OF INVESTMENTS (continued)
October 31,
2017
| Shares/ Units |
Value |
|||||||
COMMON STOCKS (continued) |
||||||||
UNITED KINGDOM (9.4%) |
||||||||
CONSUMER CYCLICAL |
||||||||
| 2,544,437 | Compass Group, Plc. |
$ | 55,845,487 | |||||
CONSUMER NON-CYCLICAL |
||||||||
| 523,351 | Diageo, Plc. |
17,863,851 | ||||||
FINANCIALS |
||||||||
| 1,061,557 | Prudential, Plc. |
26,126,785 | ||||||
| 6,376,881 | Worldpay Group, Plc. |
34,385,109 | ||||||
| 60,511,894 | ||||||||
Total United Kingdom |
134,221,232 |
|||||||
Total Common Stocks (Identified cost $1,018,934,162) |
1,177,078,903 |
|||||||
REGISTERED INVESTMENT COMPANIES (15.4%) |
||||||||
| 219,300,000 | Morgan Stanley Institutional Liquidity Funds – Treasury Securities Portfolio, Institutional Share Class |
219,300,000 | ||||||
Total Registered Investment Companies (Identified cost $219,300,000) |
219,300,000 |
|||||||
TOTAL INVESTMENTS (Identified cost $1,238,234,162)2 |
98.0 | % | $ | 1,396,378,903 |
||||||
CASH AND OTHER ASSETS IN EXCESS OF LIABILITIES |
2.0 | % | 29,162,907 | |||||||
NET ASSETS |
100.0 | % | $ | 1,425,541,810 |
| 1 | Non-income producing security. |
| 2 | The aggregate cost for federal income tax purposes is $1,238,335,074, the aggregate gross unrealized appreciation is $184,314,705 and the aggregate gross unrealized depreciation is $26,270,876, resulting in net unrealized appreciation of $158,043,829. |
The accompanying notes are an integral part of these
financial statements.
|
|
BBH PARTNER FUND – INTERNATIONAL EQUITY
(formerly BBH International Equity Fund)
PORTFOLIO OF INVESTMENTS (continued)
October 31,
2017
— |
Level 1 – unadjusted quoted prices in active markets for identical assets and liabilities. |
— |
Level 2 – significant other observable inputs (including quoted prices for similar assets and liabilities, interest rates, prepayment speeds, credit risk, etc.). |
— |
Level 3 – significant unobservable inputs (including the Fund’s own assumptions in determining the fair value of assets and liabilities). |
The accompanying notes are an integral part of these
financial statements.
BBH PARTNER FUND – INTERNATIONAL EQUITY
(formerly BBH International Equity Fund)
PORTFOLIO OF INVESTMENTS (continued)
October 31,
2017
The accompanying notes are an integral part of these
financial statements.
|
|
BBH PARTNER FUND – INTERNATIONAL EQUITY
(formerly BBH International Equity Fund)
PORTFOLIO OF INVESTMENTS (continued)
October 31,
2017
| Investments, at value |
Unadjusted Quoted Prices in Active Markets for Identical Investments (Level 1)* |
Significant Other Observable Inputs (Level 2)* |
Significant Unobservable Inputs (Level 3)* |
Balance as of October 31, 2017 |
||||||||||||||
Common Stocks: |
||||||||||||||||||
Bermuda |
$ | 10,378,859 | $ | — | $ | — | $ | 10,378,859 | ||||||||||
Brazil |
— | 16,523,879 | — | 16,523,879 | ||||||||||||||
Canada |
93,677,646 | — | — | 93,677,646 | ||||||||||||||
Cayman Islands |
28,382,175 | — | — | 28,382,175 | ||||||||||||||
Denmark |
— | 19,199,626 | — | 19,199,626 | ||||||||||||||
France |
— | 203,785,006 | — | 203,785,006 | ||||||||||||||
Germany |
— | 120,759,065 | — | 120,759,065 | ||||||||||||||
Hong Kong |
— | 63,618,800 | — | 63,618,800 | ||||||||||||||
Ireland |
— | 24,504,218 | — | 24,504,218 | ||||||||||||||
Israel |
22,180,684 | — | — | 22,180,684 | ||||||||||||||
Italy |
— | 21,659,471 | — | 21,659,471 | ||||||||||||||
Japan |
— | 124,256,726 | — | 124,256,726 | ||||||||||||||
Jersey |
— | 25,185,303 | — | 25,185,303 | ||||||||||||||
Mexico |
30,999,130 | — | — | 30,999,130 | ||||||||||||||
Spain |
— | 50,968,123 | — | 50,968,123 | ||||||||||||||
Switzerland |
36,119,279 | 150,659,681 | — | 186,778,960 | ||||||||||||||
United Kingdom |
— | 134,221,232 | — | 134,221,232 | ||||||||||||||
Registered Investment Companies: |
||||||||||||||||||
United States |
219,300,000 | — | — | 219,300,000 | ||||||||||||||
Investments, at value |
$ | 441,037,773 | $ | 955,341,130 | $ | — | $ | 1,396,378,903 | ||||||||||
* |
The Fund’s policy is to disclose transfers between levels based on valuations at the end of the reporting period. There were no transfers between Levels 1, 2 or 3 during the period ended October 31, 2017. |
The accompanying notes are an integral part of these
financial statements.
BBH PARTNER FUND – INTERNATIONAL EQUITY
(formerly BBH International Equity Fund)
STATEMENT OF ASSETS AND LIABILITIES
October 31,
2017
| ASSETS: | ||||||||
Investments in securities, at value (Identified cost $1,238,234,162) |
$ | 1,396,378,903 | ||||||
Cash |
21,499,931 | |||||||
Foreign currency at value (Identified cost $74,292) |
74,004 | |||||||
Receivables for: |
||||||||
Investments sold |
3,162,057 | |||||||
Dividends |
2,981,779 | |||||||
Shares sold |
2,374,900 | |||||||
Prepaid assets |
8,655 | |||||||
Total Assets |
1,426,480,229 | |||||||
LIABILITIES: |
||||||||
Payables for: |
||||||||
Investment advisory and administrative fees |
754,523 | |||||||
Professional fees |
80,859 | |||||||
Shares redeemed |
51,025 | |||||||
Custody and fund accounting fees |
33,833 | |||||||
Distributor fees |
5,499 | |||||||
Transfer agent fees |
4,201 | |||||||
Accrued expenses and other liabilities |
8,479 | |||||||
Total Liabilities |
938,419 | |||||||
NET ASSETS |
$ | 1,425,541,810 | ||||||
Net
Assets Consist of: |
||||||||
Paid-in capital |
$ | 1,164,617,981 | ||||||
Undistributed net investment income |
8,990,100 | |||||||
Accumulated net realized gain on investments in securities and foreign exchange transactions |
93,803,871 | |||||||
Net unrealized appreciation/(depreciation) on investments in securities and foreign currency translations |
158,129,858 | |||||||
Net Assets |
$ | 1,425,541,810 | ||||||
NET ASSET VALUE AND OFFERING PRICE PER SHARE |
||||||||
CLASS I SHARES |
||||||||
($1,425,541,810 ÷ 85,111,906 shares outstanding) |
$16.75 | |||||||
The accompanying notes are an integral part of these
financial statements.
|
|
BBH PARTNER FUND – INTERNATIONAL EQUITY
(formerly BBH International Equity Fund)
STATEMENT OF OPERATIONS
For the year ended October 31,
2017
NET INVESTMENT INCOME: |
||||||
Income: |
||||||
Dividends (net of foreign withholding taxes of $1,841,510) |
$ | 19,350,024 | ||||
Interest income |
1,602 | |||||
Other income |
32 | |||||
Total Income |
19,351,658 | |||||
Expenses: |
||||||
Investment advisory and administrative fees |
8,129,325 | |||||
Custody and fund accounting fees |
292,266 | |||||
Professional fees |
125,118 | |||||
Board of Trustees’ fees |
54,441 | |||||
Transfer agent fees |
28,888 | |||||
Shareholder servicing fees |
28,394 | |||||
Distributor fees |
28,270 | |||||
Miscellaneous expenses |
96,406 | |||||
Total Expenses |
8,783,108 | |||||
Expense offset arrangement |
(142,502 | ) | ||||
Investment advisory and administrative fees waiver |
(8,095 | ) | ||||
| Net Expenses | 8,632,511 | |||||
Net Investment Income |
10,719,147 | |||||
NET REALIZED AND UNREALIZED GAIN: |
||||||
Net realized gain on investments in securities |
149,302,631 | |||||
Net realized loss on foreign exchange transactions and translations |
(761,646 | ) | ||||
Net realized gain on investments in securities and foreign exchange transactions and translations |
148,540,985 | |||||
Net change in unrealized appreciation/(depreciation) on investments in securities |
40,964,393 | |||||
Net change in unrealized appreciation/(depreciation) on foreign currency translations |
70,310 | |||||
Net change in unrealized appreciation/(depreciation) on investments in securities and foreign currency translations |
41,034,703 | |||||
Net Realized and Unrealized Gain |
189,575,688 |
|||||
Net Increase in Net Assets Resulting from Operations |
$ | 200,294,835 |
The accompanying notes are an integral part of these
financial statements.
BBH PARTNER FUND – INTERNATIONAL EQUITY
(formerly BBH International Equity Fund)
STATEMENTS OF CHANGES IN NET
ASSETS
| For the years ended October 31, |
||||||||||
| 2017 |
2016 |
|||||||||
INCREASE IN NET ASSETS: |
||||||||||
Operations: |
||||||||||
Net investment income |
$ | 10,719,147 | $ | 17,588,064 | ||||||
Net realized gain (loss) on investments in securities and foreign exchange transactions and translations. |
148,540,985 | (5,920,115 | ) | |||||||
Net change in unrealized appreciation/(depreciation) on investments in securities and foreign currency translations |
41,034,703 | 8,168,515 | ||||||||
Net increase in net assets resulting from operations |
200,294,835 | 19,836,464 | ||||||||
Dividends and distributions declared: |
||||||||||
From net investment income: |
||||||||||
Class N* |
(912,244 | ) | (11,418,433 | ) | ||||||
Class I |
(20,664,200 | ) | (1,321,700 | ) | ||||||
Total dividends and distributions declared |
(21,576,444 | ) | (12,740,133 | ) | ||||||
Share transactions: |
||||||||||
Proceeds from sales of shares** |
425,081,311 | 884,413,974 | ||||||||
Net asset value of shares issued to shareholders for reinvestment of dividends and distributions |
1,195,485 | 12,671,721 | ||||||||
Proceeds from short-term redemption fees |
5,129 | 4,306 | ||||||||
Cost of shares redeemed** |
(138,701,031 | ) | (677,619,363 | ) | ||||||
Net increase in net assets resulting from share transactions |
287,580,894 | 219,470,639 | ||||||||
Total increase in net assets |
466,299,285 | 226,566,969 | ||||||||
NET ASSETS: |
||||||||||
Beginning of year |
959,242,525 | 732,675,556 | ||||||||
End of year (including undistributed net investment income of $8,990,100 and $20,024,709, respectively) |
$ | 1,425,541,810 |
$ | 959,242,525 |
||||||
* |
Effective February 24, 2017 Class N shares were converted into Class I shares. |
** |
Includes share exchanges. See note 5 in Notes to Financial Statements. |
The accompanying notes are an integral part of these
financial statements.
|
|
BBH PARTNER FUND – INTERNATIONAL EQUITY
(formerly BBH International Equity Fund)
FINANCIAL HIGHLIGHTS
Selected per share data and ratios for
a Class I share outstanding throughout each year.
| For the years ended October 31, |
|||||||||||||||||||||||
| 2017* |
2016 |
2015 |
2014 |
2013 |
|||||||||||||||||||
Net asset value, beginning of year |
$ | 14.46 | $ | 14.54 | $ | 15.16 | $ | 15.43 | $ | 13.08 | |||||||||||||
Income from investment operations: |
|||||||||||||||||||||||
Net investment income1 |
0.14 | 0.34 | 0.26 | 0.40 | 0.28 | ||||||||||||||||||
Net realized and unrealized gain (loss) |
2.47 | (0.14 | ) | (0.49 | ) | (0.38 | ) | 2.37 | |||||||||||||||
Total income (loss) from investment operations |
2.61 | 0.20 | (0.23 | ) | 0.02 | 2.65 | |||||||||||||||||
Less dividends and distributions: |
|||||||||||||||||||||||
From net investment income |
(0.32 | ) | (0.28 | ) | (0.39 | ) | (0.29 | ) | (0.30 | ) | |||||||||||||
Total dividends and distributions . |
(0.32 | ) | (0.28 | ) | (0.39 | ) | (0.29 | ) | (0.30 | ) | |||||||||||||
Short-term redemption fees1 |
0.00 |
2 | 0.00 |
2 | 0.00 |
2 | — | 0.00 |
2 | ||||||||||||||
Net asset value, end of year |
$ | 16.75 | $ | 14.46 | $ | 14.54 | $ | 15.16 | $ | 15.43 | |||||||||||||
Total return |
18.51 | % | 1.51 | % | (1.42 | )% | 0.21 | % | 20.64 | % | |||||||||||||
Ratios/Supplemental data: |
|||||||||||||||||||||||
Net assets, end of year (in millions). |
$ | 1,426 | $ | 914 | $ | 68 | $ | 86 | $ | 75 | |||||||||||||
Ratio of expenses to average net assets before reductions |
0.74 | % | 0.85 | % | 0.89 | % | 0.90 | % | 0.90 | % | |||||||||||||
Expense offset arrangement |
0.01 | % | 0.00 | %3 | 0.00 | %3 | 0.00 | %3 | 0.00 | %3 | |||||||||||||
Ratio of expenses to average net assets after reductions |
0.73 | % | 0.85 | % | 0.89 | % | 0.90 | % | 0.90 | % | |||||||||||||
Ratio of net investment income to average net assets |
0.91 | % | 2.41 | % | 1.77 | % | 2.62 | % | 2.01 | % | |||||||||||||
Portfolio turnover rate |
130 | % | 12 | % | 18 | % | 15 | % | 14 | % | |||||||||||||
* |
Effective February 24, 2017 Class N shares were converted into Class I shares. |
| 1 | Calculated using average shares outstanding for the year. |
| 2 | Less than $0.01. |
| 3 | Less than 0.01%. |
The accompanying notes are an integral part of these
financial statements.
BBH PARTNER FUND – INTERNATIONAL EQUITY
(formerly BBH International Equity Fund)
NOTES TO FINANCIAL STATEMENTS
October 31,
2017
1. |
Organization. The Fund is a separate, diversified series of BBH Trust (the “Trust”), which is registered under the Investment Company Act of 1940, as amended (the “1940 Act”), as an open-end management investment company. The Trust was originally organized under the laws of the State of Maryland on July 16, 1990 as BBH Fund, Inc. and re-organized as a Delaware statutory trust on June 12, 2007. The Fund commenced operations on June 6, 1997. On February 24, 2017, the name of the Fund was changed from “BBH International Equity Fund” to “BBH Partner Fund – International Equity”. Effective February 24, 2017, the Fund’s Class N shares were converted into Class I shares. The Fund currently offers one class of shares designated as Class I shares. The investment objective of the Fund is long-term maximization of total return, primarily through capital appreciation. As of October 31, 2017, there were six series of the Trust. |
2. |
Significant Accounting Policies. The Fund’s financial
statements are prepared in accordance with Generally Accepted Accounting Principles in the United States of America (“GAAP”). The Fund is an
investment company and accordingly follows the investment company accounting and reporting guidance of the Financial Accounting Standards Board (FASB)
Accounting Standard Codification Topic 946 Financial Services — Investment Companies. The following summarizes significant accounting policies of
the Fund: |
A. |
Valuation of Investments. (1) The value of investments listed on a securities exchange is based on the last sale price on that exchange prior to the time when assets are valued, or in the absence of recorded sales, at the average of readily available closing bid and asked prices on such exchange; (2) securities not traded on an exchange are valued at the average of the quoted bid and asked prices in the over-the counter market; (3) securities or other assets for which market quotations are not readily available are valued at fair value in accordance with procedures established by and under the general supervision and responsibility of the Board of Trustees (the “Board“); (4) for securities traded on international exchanges, if events which may affect the value of the Fund’s securities occur after the close of the primary exchange on which such securities trade and before the Fund’s net asset value is next determined, then those securities will be fair valued as determined in good faith under supervision of the Board. The Fund currently uses a systematic fair value model provided by an independent third party to adjust the observed values of international securities on a daily basis; (5) short-term investments, which mature in 60 days or less are valued at amortized cost if their original maturity was 60 days or less, or by amortizing their value on the 61st day prior to maturity, if their original maturity when acquired by the Fund was more than 60 days, unless the use of amortized cost is determined not to represent “fair value” by the Board. |
B. |
Accounting for Investments and Income. Investment transactions are accounted for on the trade date. Realized gains and losses on investment transactions are determined based on the identified cost method. Dividend income and other distributions received from portfolio securities are recorded |
|
|
BBH PARTNER FUND – INTERNATIONAL EQUITY
(formerly BBH International Equity Fund)
NOTES TO FINANCIAL STATEMENTS (continued)
October 31,
2017
| on the ex-dividend date. Non-cash dividends included in dividend income, if any, are recorded at the fair market value of securities received at ex-date. Distributions received on securities that represent a return of capital are recorded as a reduction of cost of investments. Distributions received on securities that represent a capital gain are recorded as a realized gain. Interest income is accrued daily. Investment income is recorded net of any foreign taxes withheld where recovery of such tax is uncertain. |
C. |
Fund Expenses. Most expenses of the Trust can be directly attributed to a specific fund. Expenses which cannot be directly attributed to a fund are apportioned amongst each fund in the Trust equally. Expense estimates are accrued in the period to which they relate and adjustments are made when actual amounts are known. |
D. |
Forward Foreign Currency Exchange Contracts. The Fund may enter into forward foreign currency exchange contracts (“Contracts”) in connection with planned purchases or sales of securities to economically hedge the U.S. dollar value of securities denominated in a particular currency, or to increase or shift its exposure to a currency other than U.S. dollars. The Fund has no specific limitation on the percentage of assets which may be committed to these types of Contracts. The Fund could be exposed to risks if the counterparties to the Contracts are unable to meet the terms of their Contracts or if the value of the foreign currency changes unfavorably. The U.S. dollar values of foreign currency underlying all contractual commitments held by the Fund are determined using forward foreign currency exchange rates supplied by a quotation service. During the year ended October 31, 2017 the Fund had no open contracts. |
E. |
Foreign Currency Translations. The accounting records of the Fund are maintained in U.S. dollars. Foreign currency amounts are translated into U.S. dollars at the current rate of exchange of such currency against the U.S. dollar to determine the value of investments, assets and liabilities. Purchases and sales of securities, and income and expenses are translated at the prevailing rate of exchange on the respective dates of such transactions. Upon the purchase or sale of a security denominated in foreign currency, the Fund may enter into forward foreign currency exchange contracts for the purchase or sale, for a fixed amount of U.S. dollars, of the amount of foreign currency involved in the underlying security transaction. Reported net realized gains and losses arise from the sales of portfolio securities, sales of foreign currencies, currency gains or losses realized between the trade and settlement dates on securities transactions, and the difference between the amounts of dividends, interest and foreign withholding taxes recorded on the Fund’s books and the U.S. dollar equivalent of the amounts actually received or paid. The effect of changes in foreign exchange rates on foreign denominated securities is reflected in the net realized and unrealized gain or loss on investments in securities and foreign exchange transactions and translations and net change in unrealized appreciation or depreciation on investments in securities and foreign |
BBH PARTNER FUND – INTERNATIONAL EQUITY
(formerly BBH International Equity Fund)
NOTES TO FINANCIAL STATEMENTS (continued)
October 31,
2017
| currency translations. Net unrealized appreciation or depreciation on foreign currency translations arise from changes in the value of the assets and liabilities, excluding investments in securities, at period end, resulting from changes in the exchange rate. |
F. |
Federal Income Taxes. The Fund may be subject to foreign taxes on income, gains on investments or currency repatriation, a portion of which may be recoverable. The Fund will accrue such taxes and recoveries, as applicable, based upon its current interpretation of tax rules and regulations that exist in the markets in which it invests. |
|
|
BBH PARTNER FUND – INTERNATIONAL EQUITY
(formerly BBH International Equity Fund)
NOTES TO FINANCIAL STATEMENTS (continued)
October 31,
2017
prior three years. The Fund is
not aware of any tax positions for which it is reasonably possible that the total amounts of unrecognized tax benefits will significantly change in the
next twelve months.
G. |
Dividends and Distributions to Shareholders. Dividends and distributions to shareholders, if any, are paid annually and are recorded on the ex-dividend date. The Fund declared dividends in the amounts of $912,244 and $20,664,200 to Class N shares and Class I shares, respectively, during the year ended October 31, 2017. In addition, the Fund designated a portion of the payment made to redeeming shareholders as a distribution for income tax purposes. |
| Distributions paid
from: |
||||||||||||||||||||||
| Ordinary income |
Net long-term capital gain |
Total taxable distributions |
Tax return of capital |
Total distributions paid |
||||||||||||||||||
2017: |
$ | 21,576,444 | — | $ | 21,576,444 | — | $ | 21,576,444 | ||||||||||||||
2016: |
12,740,133 | — | 12,740,133 | — | 12,740,133 | |||||||||||||||||
| Components of accumulated
earnings/(deficit): |
||||||||||||||||||||||||||||||
| Undistributed ordinary income |
Undistributed long-term capital gain |
Accumulated earnings |
Accumulated capital and other losses |
Other book/tax temporary differences |
Book unrealized appreciation/ (depreciation) |
Total accumulated earnings/ (deficit) |
||||||||||||||||||||||||
2017: |
$ | 17,227,537 | $ | 85,667,346 | $ | 102,894,883 | — | $ | (100,912 | ) | $ | 158,129,858 | $ | 260,923,829 | ||||||||||||||||
2016: |
20,493,926 | — | 20,493,926 | (46,271,458 | ) | (7,009,826 | ) | 117,095,155 | 84,307,797 | |||||||||||||||||||||
BBH PARTNER FUND – INTERNATIONAL EQUITY
(formerly BBH International Equity Fund)
NOTES TO FINANCIAL STATEMENTS (continued)
October 31,
2017
H. |
Use of Estimates. The preparation of the financial statements in accordance with GAAP requires management to make estimates and assumptions that affect the reported amounts of assets and liabilities in the financial statements, disclosure of contingent assets and liabilities at the date of the financial statements and the reported amounts of increase and decrease in net assets from operations during the reporting period. Actual results could differ from these estimates. |
A. |
Investment Advisory and Administrative Fees. Under a combined Investment Advisory and Administrative Services Agreement (“Agreement”) with the Trust, Brown Brothers Harriman & Co. (“BBH”) through a separately identifiable department (“SID” or “Investment Adviser”) provides investment advisory, portfolio management and administrative services to the Fund. BBH employs a “manager-of-managers” investment approach, whereby it allocated the Fund’s assets among the Fund’s sub-advisers, until February 24, 2017, Mondrian Investment Partners Limited and Walter Scott & Partners Limited (together, “Sub-advisers”). Effective February 24, 2017, BBH replaced the Sub-advisers with a sole sub-adviser, Select Equity Group, L.P. (“Select Equity Group” or the “Sub-adviser”). The Sub-advisers are responsible for investing the assets of the Fund and the Investment Adviser oversaw the Sub-advisers and evaluated their performance results. Until February 24, 2017, the Fund’s investment advisory and administrative services fee was calculated daily and paid monthly at an annual rate equivalent to 0.80% per annum on the first $1,000,000,000 of average daily net assets and 0.70% per annum on all average daily net assets over $1,000,000,000. Effective February 24, 2017, the Fund’s investment advisory and administrative services fee is calculated daily and paid monthly at an annual rate equivalent to 0.65% per annum on the first $3,000,000,000 of average daily net assets and 0.60% per annum on all average daily net assets over $3,000,000,000. The Investment Adviser pays its Sub-advisers a percentage from its investment advisory and administrative fees. For the year ended October 31, 2017 the Fund incurred $8,129,325 for services under the Agreements. |
B. |
Investment Advisory and Administrative Fee Waivers. Effective December 29, 2015 and until February 24, 2017, the Investment Adviser has voluntarily agreed to limit the annual fund operating expenses (excluding interest, taxes, brokerage commissions, other expenditures that are capitalized in accordance with GAAP, and other extraordinary expenses not incurred in the ordinary course of |
|
|
BBH PARTNER FUND – INTERNATIONAL EQUITY
(formerly BBH International Equity Fund)
NOTES TO FINANCIAL STATEMENTS (continued)
October 31,
2017
| the Fund’s business) of Class N to 1.07%. This was a voluntary waiver that could have been changed at any time at the sole discretion of the Investment Adviser. From November 1, 2016 to February 23, 2017, the Investment Adviser waived fees in the amount of $8,095 for Class N. |
C. |
Shareholder Servicing Fees. The Trust had a shareholder servicing agreement with BBH. BBH received a fee from the Fund calculated daily and paid monthly at an annual rate of 0.20% of Class N shares’ average daily net assets. From November 1, 2016 to February 23, 2017, Class N shares of the Fund incurred $28,394 in shareholder servicing fees. |
D. |
Custody and Fund Accounting Fees. BBH acts as a custodian and fund accountant and receives custody and fund accounting fees from the Fund calculated daily and incurred monthly. BBH holds all of the Fund’s cash and investments and calculates the Fund’s daily net asset value. The custody fee is an asset and transaction-based fee. The fund accounting fee is an asset-based fee calculated at 0.004% of the Fund’s net asset value. For the year ended October 31, 2017, the Fund incurred $292,266 in custody and fund accounting fees. These fees for the Fund were reduced by $142,502 as a result of an expense offset arrangement with the Fund’s custodian. The credit amount (if any) is disclosed in the Statement of Operations as a reduction to the Fund’s expenses. In the event that the Fund is overdrawn, under the custody agreement with BBH, BBH will make overnight loans to the Fund to cover overdrafts. Pursuant to their agreement, the Fund will pay the Federal Funds overnight investment rate on the day of the overdraft. The total interest incurred by the Fund for the year ended October 31, 2017, was $195. This amount is included under line item “Custody and fund accounting fees” in the Statement of Operations. |
E. |
Board of Trustees’ Fees. Each Trustee who is not an “interested person” as defined under the 1940 Act receives an annual fee as well as reimbursement for reasonable out-of-pocket expenses from the Fund. For the year ended October 31, 2017, the Fund incurred $54,441 in independent Trustee compensation and expense reimbursements. |
4. |
Investment Transactions. For the year ended October 31, 2017, the cost of purchases and the proceeds of sales of investment securities, other than short-term investments, were $1,775,668,033 and $1,504,154,731 respectively. |
BBH PARTNER FUND – INTERNATIONAL EQUITY
(formerly BBH International Equity Fund)
NOTES TO FINANCIAL STATEMENTS (continued)
October 31,
2017
5. |
Shares of Beneficial Interest. The Trust is permitted to
issue an unlimited number of Class I shares of beneficial interest, at no par value. Effective February 24, 2017, the Fund’s Class N shares were
converted into Class I shares. Transactions in Class N shares and Class I shares were as follows: |
| For the year ended October 31, 2017 |
For the year ended October 31, 2016 |
||||||||||||||||||
| Shares |
Dollars |
Shares |
Dollars |
||||||||||||||||
Class N |
|||||||||||||||||||
Shares sold |
254,302 | $ | 3,635,185 | 1,338,991 | $ | 18,817,299 | |||||||||||||
Shares issued in connection with reinvestments of dividends |
63,325 | 885,747 | 836,244 | 11,364,561 | |||||||||||||||
Proceeds from short-term redemption fees |
N/A | — | N/A | 185 | |||||||||||||||
Shares redeemed |
(3,432,844 | ) | (50,037,147 | ) | (44,930,525 | ) | (607,010,304 | ) | |||||||||||
Net decrease |
(3,115,217 | ) | $ | (45,516,215 | ) | (42,755,290 | ) | $ | (576,828,259 | ) | |||||||||
Class I |
|||||||||||||||||||
Shares sold |
27,598,208 | $ | 421,446,126 | 63,509,676 | $ | 865,596,675 | |||||||||||||
Shares issued in connection with reinvestments of dividends |
22,126 | 309,738 | 96,115 | 1,307,160 | |||||||||||||||
Proceeds from short-term redemption fees |
N/A | 5,129 | N/A | 4,121 | |||||||||||||||
Shares redeemed |
(5,731,089 | ) | (88,663,884 | ) | (5,063,173 | ) | (70,609,059 | ) | |||||||||||
Net increase |
21,889,245 | $ | 333,097,109 | 58,542,618 | $ | 796,298,897 | |||||||||||||
|
|
BBH PARTNER FUND – INTERNATIONAL EQUITY
(formerly BBH International Equity Fund)
NOTES TO FINANCIAL STATEMENTS (continued)
October 31,
2017
A. |
Principal Risk Factors. Investing in the Fund may
involve certain risks, as discussed in the Fund’s prospectus, including, but not limited to, those described below: |
BBH PARTNER FUND – INTERNATIONAL EQUITY
(formerly BBH International Equity Fund)
NOTES TO FINANCIAL STATEMENTS (continued)
October 31,
2017
B. |
Indemnifications. Under the Trust’s organizational documents, its officers and Trustees may be indemnified against certain liabilities and expenses arising out of the performance of their duties to the Fund, and shareholders are indemnified against personal liability for the obligations of the Trust. Additionally, in the normal course of business, the Fund enters into agreements with service providers that may contain indemnification clauses. The Fund’s maximum exposure under these arrangements is unknown as this would involve future claims that may be made against the Fund that have not yet occurred. The risk of material loss from such claims is considered remote. |
7. |
Recent Pronouncements. |
A. |
Regulation S-X. In October 2016, the U.S. Securities and Exchange Commission adopted new rules and amended existing rules (together, “final rules”) intended to modernize the reporting and disclosure of information by registered investment companies. In part, the final rules amend Regulation S-X and require standardized, enhanced disclosure about derivatives in investment company financial statements, as well as other amendments. The compliance date for the amendments to Regulation S-X was August 1, 2017. The changes related to Regulation S-X are reflected in the financial statements. |
8. |
Subsequent Events. Management has evaluated events and transactions that have occurred since October 31, 2017 through the date the financial statements were issued and determined that there were none that would require recognition or additional disclosure in the financial statements. |
|
|
BBH PARTNER FUND – INTERNATIONAL EQUITY
(formerly BBH International Equity Fund)
DISCLOSURE OF FUND EXPENSES
October 31, 2017
(unaudited)
BBH PARTNER FUND – INTERNATIONAL EQUITY
(formerly BBH International Equity Fund)
DISCLOSURE OF FUND EXPENSES (continued)
October 31, 2017
(unaudited)
| Beginning Account Value May 1, 2017 |
Ending Account Value October 31, 2017 |
Expenses Paid During Period May 1, 2017 to October 31, 20171 |
||||||||||||
Class I |
||||||||||||||
Actual |
$ | 1,000 | $ | 1,077 | $ | 3.61 | ||||||||
Hypothetical2 |
$ | 1,000 | $ | 1,022 | $ | 3.52 | ||||||||
| 1 | Expenses are equal to the Fund’s annualized expense ratio of 0.69% for I shares, multiplied by the average account value over the period, multiplied by 184/365 (to reflect the one-half year period). |
| 2 | Assumes a return of 5% before expenses. For the purposes of the calculation, the applicable annualized expenses ratio for each class of shares is subtracted from the assumed return before expenses. |
|
|
BBH PARTNER FUND – INTERNATIONAL EQUITY
(formerly BBH International Equity Fund)
CONFLICTS OF INTEREST
October 31, 2017
(unaudited)
BBH PARTNER FUND – INTERNATIONAL EQUITY
(formerly BBH International Equity Fund)
CONFLICTS OF INTEREST (continued)
October 31, 2017
(unaudited)
investment methods and strategies, of Other
Clients. Accordingly, such Other Clients may produce results that are materially different from those experienced by the Fund. Certain
other conflicts of interest may arise in connection with a portfolio manager’s management of the Fund’s investments, on the one hand, and the
investments of other funds or accounts for which the portfolio manager is responsible, on the other. For example, it is possible that the various funds
or accounts managed by the Investment Adviser or Sub-Adviser could have different investment strategies that, at times, might conflict
with one another to the possible detriment of the Fund. From time to time, the Investment Adviser and Sub-Adviser,
establish, sponsor and are affiliated with other investment pools and accounts which engage in the same or similar
businesses as the Fund using the same or similar investment strategies. To the extent that the same investment opportunities might be desirable for
more than one account or fund, possible conflicts could arise in determining how to allocate them because the Investment Adviser or
Sub-Adviser may have an incentive to allocate investment opportunities to certain accounts or funds. However, the investment
Adviser and the Sub-Adviser have implemented policies and procedures to assure that investment opportunities are allocated equitably between the
Fund and other funds and accounts they manage with similar investment strategies.
|
|
BBH PARTNER FUND – INTERNATIONAL EQUITY
(formerly BBH International Equity Fund)
CONFLICTS OF INTEREST (continued)
October 31, 2017
(unaudited)
When this occurs, the various prices may be averaged,
and the Fund will be charged or credited with the average price. Thus, the effect of the aggregation may operate on some occasions to the disadvantage
of the Fund. In addition, under certain circumstances, the Fund will not be charged the same commission or commission equivalent rates in connection
with an aggregated order.
BBH PARTNER FUND – INTERNATIONAL EQUITY
(formerly BBH International Equity Fund)
CONFLICTS OF INTEREST (continued)
October 31, 2017
(unaudited)
superior performance. BBH, the Investment Adviser and
their affiliates providing services to the Fund benefit from additional fees when the Fund is included as an investment by a discretionary investment
advisory client.
|
|
BBH PARTNER FUND – INTERNATIONAL EQUITY
(formerly BBH International Equity Fund)
CONFLICTS OF INTEREST (continued)
October 31, 2017
(unaudited)
TRUSTEES AND OFFICERS OF BBH PARTNER FUND –
INTERNATIONAL EQUITY
(formerly BBH International Equity Fund)
ADDITIONAL FEDERAL TAX
INFORMATION
| Foreign Source Income |
Foreign Taxes Paid |
|
$24,003,946 |
$1,839,023 |
|
|
TRUSTEES AND OFFICERS OF BBH PARTNER FUND –
INTERNATIONAL EQUITY
(formerly BBH International Equity Fund)
(unaudited)
| Name and Birth Year |
|
Position(s) Held with the Trust |
|
Term of Office and Length of Time Served# |
|
Principal Occupation(s) During Past 5 Years |
|
Number of Portfolios in Fund Complex Overseen by Trusteeˆ |
|
Other Public Company or Investment Company Directorships held by Trustee During Past 5 Years |
||
Independent Trustees |
||||||||||||
H. Whitney Wagner Birth Year: 1956 |
Chairman of the Board and Trustee |
Chairman Since 2014; Trustee Since 2007 and 2006-2007 with the Predecessor Trust |
President, Clear Brook Advisors, a registered investment adviser. |
6 |
None. |
|||||||
Andrew S. Frazier Birth Year: 1948 |
Trustee |
Since 2010 |
Consultant to Western World Insurance Group, Inc. (“WWIG”) (January 2010 to January 2012). |
6 |
Director of WWIG. |
|||||||
Mark M. Collins Birth Year: 1956 |
Trustee |
Since 2011 |
Partner of Brown Investment Advisory Incorporated, a registered investment adviser. |
6 |
Chairman of Dillon Trust Company. |
|||||||
John M. Tesoro Birth Year: 1952 |
Trustee |
Since 2014 |
Partner, Certified Public Accountant, KPMG LLP (retired in September 2012). |
6 |
Trustee, Bridge Builder Trust (8 Funds) Director; Teton Advisors, Inc. (a registered investment adviser). |
TRUSTEES AND OFFICERS OF BBH PARTNER FUND –
INTERNATIONAL EQUITY
(formerly BBH International Equity Fund)
(unaudited)
| Name, Address and Birth Year |
|
Position(s) Held with the Trust |
|
Term of Office and Length of Time Served# |
|
Principal Occupation(s) During Past 5 Years |
|
Number of Portfolios in Fund Complex Overseen by Trusteeˆ |
|
Other Public Company or Investment Company Directorships held by Trustee During Past 5 Years |
||
Interested Trustees |
||||||||||||
Susan C. Livingston+ 50 Post Office Square Boston, MA 02110 Birth Year: 1957 |
Trustee |
Since 2011 |
Partner (since 1998) and Senior Client Advocate (since 2010) for BBH&Co.; Director of BBH Luxembourg S.C.A. (since
1992). |
6 |
None. |
|||||||
John A. Gehret+ 140 Broadway New York, NY 10005 Birth Year: 1959 |
Trustee |
Since 2011 |
Limited Partner of BBH&Co. (2012-present); Director of BBH Luxembourg S.C.A. (since 2012); Director of BBH Trust Company (Cayman)
Ltd. (since 2012). |
6 |
None. |
|
|
TRUSTEES AND OFFICERS OF BBH PARTNER FUND –
INTERNATIONAL EQUITY
(formerly BBH International Equity Fund)
(unaudited)
| Name, Address and Birth Year |
|
Position(s) Held with the Trust |
|
Term of Office and Length of Time Served# |
|
Principal Occupation(s) During
Past 5 Years |
Officers |
||||||
Jean-Pierre Paquin 140 Broadway New York, NY 10005 Birth Year: 1973 |
President and Principal Executive Officer |
Since 2016 |
Partner of BBH&Co. since 2015; joined BBH&Co. in 1996. |
|||
Daniel Greifenkamp 140 Broadway New York, NY 10005 Birth Year: 1969 |
Vice
President |
Since 2016 |
Managing Director of BBH&Co. since 2014; joined BBH&Co. in 2011. |
|||
Charles H. Schreiber 140 Broadway New York, NY 10005 Birth Year: 1957 |
Treasurer and Principal Financial Officer |
Since 2007 2006-2007 with the Predecessor Trust |
Senior Vice President of BBH&Co. since 2001; joined BBH&Co. in 1999. |
|||
Paul F. Gallagher 140 Broadway New York, NY 10005 Birth Year: 1959 |
Chief Compliance Officer (“CCO”) |
Since 2015 |
Senior Vice President of BBH&Co. since September 2015; Executive Director, Counsel, Morgan Stanley Smith Barney LLC
(2009-September 2015). |
|||
Keith M. Kelley 140 Broadway New York, NY 10005 Birth Year: 1983 |
Anti-Money Laundering Officer (“AMLO”) |
Since 2016 |
Vice President of BBH&Co. since February 2016; joined BBH&Co. in 2016; Director, Legal and Compliance, Morgan Stanley Smith
Barney LLC (2014-February 2016); Compliance Manager, State Street Corporation (2013-2014); Associate, J.P. Morgan Chase & Co.
(2011-2013). |
TRUSTEES AND OFFICERS OF BBH PARTNER FUND –
INTERNATIONAL EQUITY
(formerly BBH International Equity Fund)
(unaudited)
| Name, Address and Birth Year |
|
Position(s) Held with the Trust |
|
Term of Office and Length of Time Served# |
|
Principal Occupation(s) During
Past 5 Years |
Suzan M. Barron 50 Post Office Square Boston, MA 02110 Birth Year: 1964 |
Secretary |
Since 2009 |
Senior Vice President and Senior Investor Services Counsel, BBH&Co. since 2005. |
|||
Rowena Rothman 140 Broadway New York, NY 10005 Birth Year: 1967 |
Assistant Treasurer |
Since 2011 |
Vice President of BBH&Co. since 2009. |
# |
All officers of the Trust hold office for one year and until their respective successors are chosen and qualified (subject to the ability of the Trustees to remove any officer in accordance with the Trust’s By-laws). Mr. Wagner previously served on the Board of Trustees of the Predecessor Trust. |
+ |
Ms. Livingston and Mr. Gehret are “interested persons” of the Trust as defined in the 1940 Act because of their positions as Partner and Limited Partner of BBH&Co., respectively. |
ˆ |
The Fund Complex consists of the Trust, which has six series, and each is counted as one “Portfolio” for purposes of this table. |
|
|
Administrator Brown Brothers Harriman & Co. 140 Broadway New York, NY 10005 Distributor ALPS Distributors, Inc. 1290 Broadway, Suite 1100 Denver, CO 80203 Shareholder Servicing Agent Brown Brothers Harriman & Co. 140 Broadway New York, NY 10005 1-800-575-1265 |
Investment Adviser Brown Brothers Harriman Mutual Fund Advisory Department 140 Broadway New York, NY 10005 |
|||||
By telephone: |
Call
1-800-575-1265 |
|||||
By E-mail send your request to: |
bbhfunds@bbh.com |
|||||
On the internet: |
www.bbhfunds.com |
|||||
Annual Report
OCTOBER 31, 2017
BBH LIMITED DURATION FUND
MANAGEMENT’S DISCUSSION OF FUND PERFORMANCE
October 31, 2017
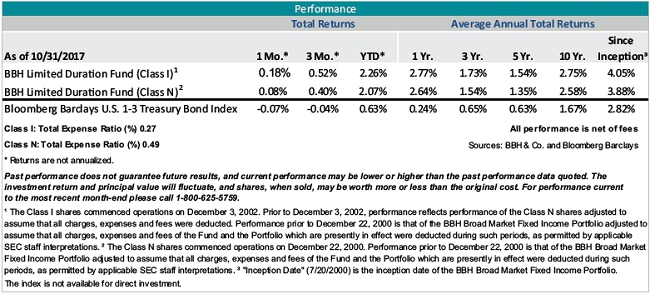
BBH LIMITED DURATION FUND
MANAGEMENT’S DISCUSSION OF FUND PERFORMANCE (continued)
October 31, 2017
| Return
Attribution (%) |
|||||||||||||
| Sector
and Rating Exposure |
Security Selection |
Total Contribution |
|||||||||||
Excess return contributions*: |
|||||||||||||
Agency |
0.01 | 0.00 | 0.01 | ||||||||||
Asset-Backed Securities (“ABS”) |
0.22 | 0.63 | 0.85 | ||||||||||
Commercial Mortgage-Backed Securities (“CMBS”) |
0.16 | 0.10 | 0.26 | ||||||||||
Mortgage-Backed Securities (“MBS”) |
0.00 | 0.01 | 0.01 | ||||||||||
Corporate |
1.06 | 0.23 | 1.29 | ||||||||||
Municipal |
0.02 | 0.03 | 0.05 | ||||||||||
TIPS |
— | — | |||||||||||
Total Excess Return Contribution |
1.47 | 1.00 | 2.47 | ||||||||||
Return from rates and expenses: |
|||||||||||||
Duration and Yield Curve |
0.50 | ||||||||||||
Fees and expenses |
(0.28 | ) | |||||||||||
Other |
0.08 | ||||||||||||
Total Return |
2.77 | ||||||||||||
| * | Excess Return Contribution is the return in excess of a comparable duration U.S. Treasuries multiplied by the exposure size in the account. |
|
|
BBH LIMITED DURATION FUND
MANAGEMENT’S DISCUSSION OF FUND PERFORMANCE (continued)
October 31, 2017
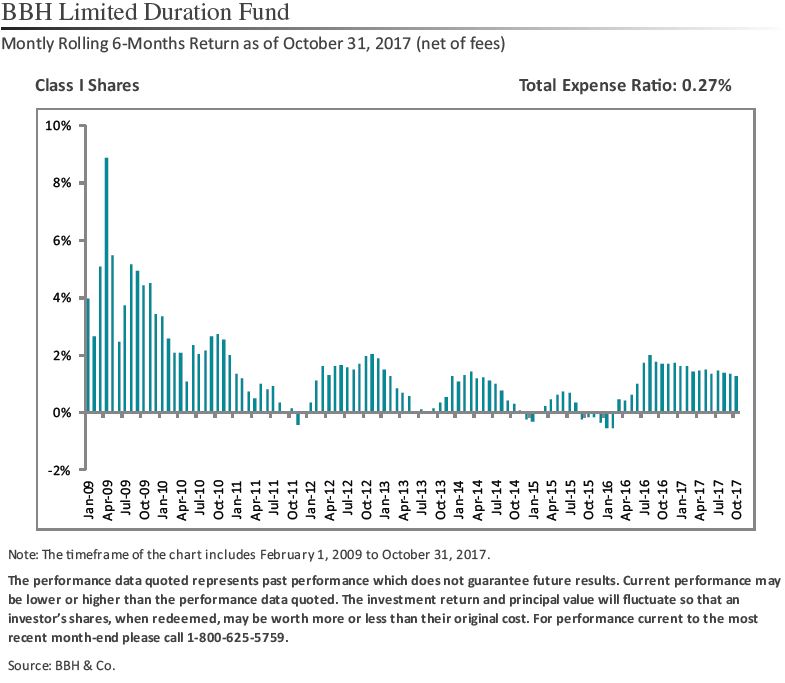 |
BBH LIMITED DURATION FUND
MANAGEMENT’S DISCUSSION OF FUND PERFORMANCE (continued)
October 31, 2017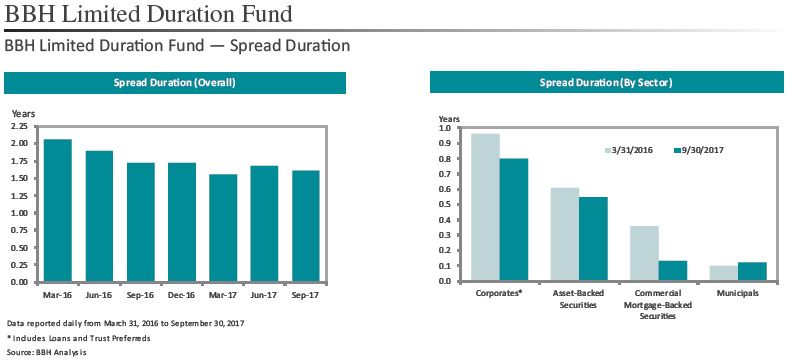
|
|
BBH LIMITED DURATION FUND
MANAGEMENT’S DISCUSSION OF FUND PERFORMANCE (continued)
October 31, 2017
owners of Dell and Western Digital loans
through their acquisitions, as we have a lot of confidence in those two management teams. They have been large contributors to performance, but
as they appreciated, our exposures have decreased.
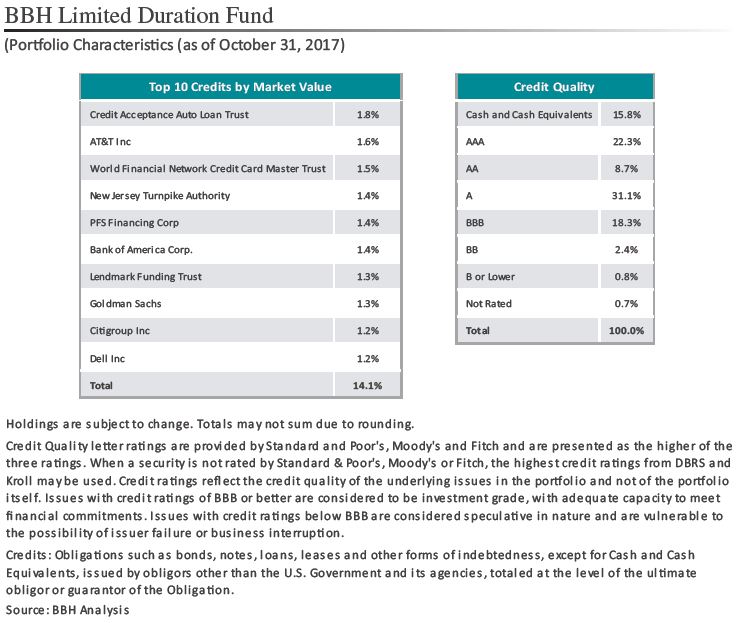
BBH LIMITED DURATION FUND
MANAGEMENT’S DISCUSSION OF FUND PERFORMANCE (continued)
October 31, 2017
|
|
BBH LIMITED DURATION FUND
MANAGEMENT’S DISCUSSION OF FUND PERFORMANCE (continued)
October 31, 2017
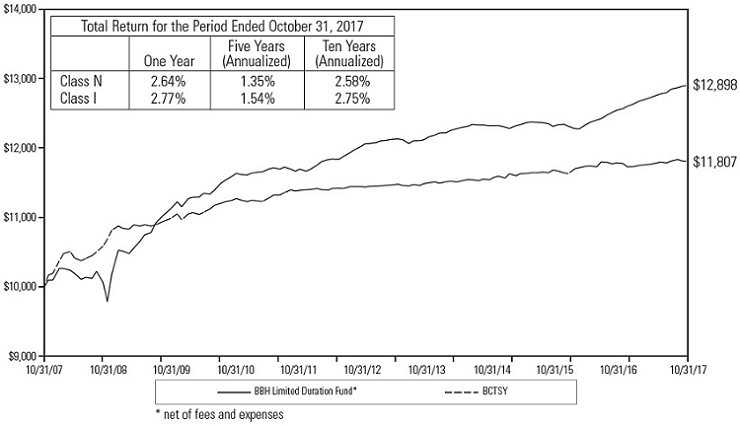
| 1 | The Fund’s performance assumes the reinvestment of all dividends and distributions. The Barclays Capital U.S. 1-3 Year Treasury Bond Index (“BCTSY”) has been adjusted to reflect reinvestment of dividends on securities in the index. The BCTSY is not adjusted to reflect sales charges, expenses or other fees that the Securities and Exchange Commission requires to be reflected in the Fund’s performance. The index is unmanaged. Investments cannot be made in the index. |
BBH LIMITED DURATION FUND
REPORT OF INDEPENDENT REGISTERED PUBLIC ACCOUNTING FIRM
December 22,
2017
The accompanying notes are an integral part of these
financial statements.
|
|
BBH LIMITED DURATION FUND
PORTFOLIO ALLOCATION
October 31, 2017
| U.S. $ Value |
Percent of Net Assets |
|||||||||
Asset Backed Securities |
$ | 2,047,573,377 | 31.9 | % | ||||||
Commercial Mortgage Backed Securities |
327,314,710 | 5.1 | ||||||||
Corporate Bonds |
2,284,923,713 | 35.6 | ||||||||
Loan Participations and Assignments |
529,517,091 | 8.3 | ||||||||
Municipal Bonds |
449,520,487 | 7.0 | ||||||||
U.S. Government Agency Obligations |
214,650,690 | 3.3 | ||||||||
U.S. Treasury Bills |
548,885,852 | 8.6 | ||||||||
Cash and Other Assets in Excess of Liabilities |
15,904,286 | 0.2 | ||||||||
NET ASSETS |
$ | 6,418,290,206 | 100.0 | % | ||||||
The accompanying notes are an integral part of these
financial statements.
BBH LIMITED DURATION FUND
PORTFOLIO OF INVESTMENTS
October 31, 2017
| Principal Amount |
Maturity Date |
Interest Rate |
Value |
||||||||
ASSET BACKED SECURITIES (31.9%) |
|||||||||||
| $ 26,366,190 | AIM Aviation Finance, Ltd. 2015-1A1 |
02/15/40 | 4.213 | % | $ | 26,452,271 | |||||
| 1,072,559 | AmeriCredit Automobile Receivables Trust 2013-3 |
06/10/19 | 2.380 | 1,072,614 | |||||||
| 30,680,000 | AmeriCredit Automobile Receivables Trust 2017-2 |
09/18/20 | 1.650 | 30,661,202 | |||||||
| 10,970,000 | ARI Fleet Lease Trust 2017-A1 |
04/15/26 | 1.910 | 10,966,818 | |||||||
| 5,089,252 | AXIS Equipment Finance Receivables III LLC 2015-1A1 |
03/20/20 | 1.900 | 5,085,931 | |||||||
| 15,881,108 | AXIS Equipment Finance Receivables IV LLC 2016-1A1 |
11/20/21 | 2.210 | 15,826,064 | |||||||
| 10,295,716 | BCC Funding X LLC 2015-11 |
10/20/20 | 2.224 | 10,284,689 | |||||||
| 13,401,687 | BCC Funding XIII LLC 2016-11 |
12/20/21 | 2.200 | 13,382,059 | |||||||
| 14,090,000 | Canadian Pacer Auto Receivables Trust 2017-1A1 |
12/19/19 | 1.772 | 14,085,191 | |||||||
| 24,884,950 | Capital Automotive REIT LLC 2017-1A1 |
04/15/47 | 3.870 | 25,031,858 | |||||||
| 6,124,542 | Cazenovia Creek Funding I LLC 2015-1A1 |
12/10/23 | 2.000 | 6,109,231 | |||||||
| 36,592,000 | CCG Receivables Trust 2017-11 |
11/14/23 | 1.840 | 36,528,048 | |||||||
| 45,000,000 | Chase Issuance Trust 2016-A6 |
01/15/20 | 1.100 | 44,967,240 | |||||||
| 28,360,000 | Chesapeake Funding II LLC 2017-2A1 |
05/15/29 | 1.990 | 28,367,927 | |||||||
| 25,130,000 | Chesapeake Funding II LLC 2017-4A1 |
11/15/29 | 2.120 | 25,115,543 | |||||||
| 24,486,240 | Chesterfield Financial Holdings LLC 2014-1A1 |
12/15/34 | 4.500 | 24,423,695 | |||||||
| 2,149,366 | CIT Equipment Collateral 2014-VT11 |
10/21/19 | 1.500 | 2,148,872 | |||||||
| 13,000,000 | Citibank Credit Card Issuance Trust 2014-A8 |
04/09/20 | 1.730 | 13,013,390 | |||||||
| 47,700,000 | Citibank Credit Card Issuance Trust 2017-A2 |
01/19/21 | 1.740 | 47,716,843 | |||||||
| 10,890,000 | Credit Acceptance Auto Loan Trust 2015-1A1 |
01/17/23 | 2.610 | 10,909,380 | |||||||
| 14,190,000 | Credit Acceptance Auto Loan Trust 2016-2A1 |
11/15/23 | 2.420 | 14,242,856 | |||||||
| 15,480,000 | Credit Acceptance Auto Loan Trust 2017-1A1 |
10/15/25 | 2.560 | 15,503,082 | |||||||
The accompanying notes are an integral part of these
financial statements.
|
|
BBH LIMITED DURATION FUND
PORTFOLIO OF INVESTMENTS (continued)
October 31, 2017
| Principal Amount |
Maturity Date |
Interest Rate |
Value |
||||||||
ASSET BACKED SECURITIES (continued) |
|||||||||||
| $ 50,700,000 | Credit Acceptance Auto Loan Trust 2017-2A1 |
02/17/26 | 2.550 | % | $ | 50,578,300 | |||||
| 25,550,000 | Credit Acceptance Auto Loan Trust 2017-3A1 |
06/15/26 | 2.650 | 25,547,925 | |||||||
| 18,613,392 | Drive Auto Receivables Trust 2015-BA1 |
07/15/21 | 2.760 | 18,689,843 | |||||||
| 9,493,574 | Drive Auto Receivables Trust 2017-1 |
05/15/19 | 1.670 | 9,493,568 | |||||||
| 12,978,000 | Eagle I, Ltd. 2014-1A1 |
12/15/39 | 4.310 | 12,972,634 | |||||||
| 24,155,543 | ECAF I, Ltd. 2015-1A1 |
06/15/40 | 3.473 | 23,946,366 | |||||||
| 21,900,000 | Elm Trust 2016-1A1 |
06/20/25 | 4.163 | 22,129,293 | |||||||
| 17,549,565 | Emerald Aviation Finance, Ltd. 2013-11 |
10/15/38 | 4.650 | 17,984,392 | |||||||
| 16,082,066 | Engs Commercial Finance Trust 2015-1A1 |
10/22/21 | 2.310 | 16,040,190 | |||||||
| 15,390,501 | Enterprise Fleet Financing LLC 2016-21 |
02/22/22 | 1.740 | 15,379,001 | |||||||
| 17,170,000 | Enterprise Fleet Financing LLC 2017-11 |
07/20/22 | 2.130 | 17,210,528 | |||||||
| 20,810,000 | Enterprise Fleet Financing LLC 2017-21 |
01/20/23 | 1.970 | 20,809,022 | |||||||
| 23,660,000 | Enterprise Fleet Financing LLC 2017-31 |
05/22/23 | 2.130 | 23,659,782 | |||||||
| 3,563,701 | FNA Trust 2015-11 |
12/10/23 | 3.240 | 3,547,173 | |||||||
| 14,500,000 | Ford Credit Auto Owner Trust 2014-21 |
04/15/26 | 2.310 | 14,592,603 | |||||||
| 44,320,000 | Ford Credit Floorplan Master Owner Trust A 2017-2 |
09/15/22 | 2.160 | 44,392,078 | |||||||
| 10,205,595 | Foursight Capital Automobile Receivables Trust 2015-11 |
01/15/21 | 2.340 | 10,206,089 | |||||||
| 16,788,473 | Foursight Capital Automobile Receivables Trust 2017-11 |
04/15/22 | 2.370 | 16,745,112 | |||||||
| 4,666,701 | FRS I LLC 2013-1A1 |
04/15/43 | 1.800 | 4,645,670 | |||||||
| 14,889,280 | Global Container Assets, Ltd. 2015-1A1 |
02/05/30 | 2.100 | 14,806,205 | |||||||
| 11,360,000 | GM Financial Consumer Automobile 2017-1A1 |
03/16/20 | 1.510 | 11,353,433 | |||||||
| 12,180,000 | GM Financial Consumer Automobile 2017-1A1 |
10/18/21 | 1.780 | 12,146,377 | |||||||
| 16,510,000 | GMF Floorplan Owner Revolving Trust 2015-11 |
05/15/20 | 1.650 | 16,514,189 | |||||||
| 6,525,000 | GMF Floorplan Owner Revolving Trust 2015-11 |
05/15/20 | 1.970 | 6,526,572 | |||||||
| 10,730,000 | GMF Floorplan Owner Revolving Trust 2015-11 |
05/15/20 | 2.220 | 10,731,085 | |||||||
The accompanying notes are an integral part of these
financial statements.
BBH LIMITED DURATION FUND
PORTFOLIO OF INVESTMENTS (continued)
October 31, 2017
| Principal Amount |
Maturity Date |
Interest Rate |
Value |
||||||||
ASSET BACKED SECURITIES (continued) |
|||||||||||
| $ 32,520,000 | GMF Floorplan Owner Revolving Trust 2017-21 |
07/15/22 | 2.130 | % | $ | 32,366,893 | |||||
| 24,900,000 | Hertz Fleet Lease Funding LP 2017-11 |
04/10/31 | 2.130 | 24,859,821 | |||||||
| 7,822,666 | Leaf Receivables Funding 12 LLC 2017-11 |
05/15/19 | 1.720 | 7,820,992 | |||||||
| 19,210,000 | Lendmark Funding Trust 2016-A1 |
08/21/23 | 4.820 | 19,562,565 | |||||||
| 24,110,000 | Lendmark Funding Trust 2016-2A1 |
04/21/25 | 3.260 | 24,173,269 | |||||||
| 38,860,000 | Lendmark Funding Trust 2017-1A1 |
12/22/25 | 2.830 | 38,894,446 | |||||||
| 19,500,000 | Mariner Finance Issuance Trust 2017-AA1 |
02/20/29 | 3.620 | 19,576,637 | |||||||
| 3,104,020 | MCA Fund I Holding LLC 2014-1 (3-Month USD-LIBOR + 2.000%)1,2 |
08/15/24 | 3.315 | 3,108,179 | |||||||
| 26,273,089 | MCA Fund II Holding LLC 2017-1 (3-Month USD-LIBOR + 1.650%)1,2 |
08/15/28 | 2.965 | 26,273,414 | |||||||
| 16,130,000 | MMAF Equipment Finance LLC 2017-AA1 |
05/18/20 | 1.730 | 16,127,277 | |||||||
| 23,130,000 | Motor 2017-1 PLC 2017-1A (1-Month USD-LIBOR + 0.530%)1,2 |
09/25/24 | 1.768 | 23,161,017 | |||||||
| 1,273,988 | Nations Equipment Finance Funding II LLC 2014-1A1 |
07/20/18 | 1.558 | 1,273,456 | |||||||
| 8,417,931 | Nations Equipment Finance Funding III LLC 2016-1A1 |
02/20/21 | 3.610 | 8,438,862 | |||||||
| 14,074,264 | Nationstar HECM Loan Trust 2017-1A1 |
05/25/27 | 1.968 | 14,062,582 | |||||||
| 18,379,710 | Nationstar HECM Loan Trust 2017-2A1,2,3 |
09/25/27 | 2.038 | 18,379,710 | |||||||
| 2,463,167 | Navitas Equipment Receivables LLC 2015-11 |
11/15/18 | 2.120 | 2,464,302 | |||||||
| 17,225,233 | Navitas Equipment Receivables LLC 2016-11 |
06/15/21 | 2.200 | 17,212,048 | |||||||
| 13,096,040 | New Mexico State Educational Assistance Foundation 2013-1 (1-Month USD-LIBOR + 0.700%)2 |
01/02/25 | 1.935 | 13,064,479 | |||||||
| 5,693,842 | Newtek Small Business Loan Trust 2010-1 (1-Month USD-LIBOR + 2.300%)1,2 |
02/25/41 | 3.538 | 5,666,861 | |||||||
The accompanying notes are an integral part of these
financial statements.
|
|
BBH LIMITED DURATION FUND
PORTFOLIO OF INVESTMENTS (continued)
October 31, 2017
| Principal Amount |
Maturity Date |
Interest Rate |
Value |
||||||||
ASSET BACKED SECURITIES (continued) |
|||||||||||
| $ 16,502,513 | Newtek Small Business Loan Trust 2016-1A (1-Month USD-LIBOR + 3.000%)1,2 |
02/25/42 | 4.238 | % | $ | 16,589,755 | |||||
| 22,200,000 | NextGear Floorplan Master Owner Trust 2016-2A1 |
09/15/21 | 2.190 | 22,156,042 | |||||||
| 16,020,000 | NextGear Floorplan Master Owner Trust 2017-2A1 |
10/17/22 | 2.560 | 16,034,945 | |||||||
| 6,140,000 | NRZ Advance Receivables Trust Advance Receivables Backed 2016-T11 |
06/15/49 | 2.751 | 6,086,914 | |||||||
| 15,230,000 | OneMain Financial Issuance Trust 2014-2A1 |
09/18/24 | 3.020 | 15,257,059 | |||||||
| 26,190,000 | OneMain Financial Issuance Trust 2015-1A1 |
03/18/26 | 3.850 | 26,559,837 | |||||||
| 14,823,140 | OSCAR US Funding Trust VI LLC 2017-1A1 |
05/11/20 | 2.300 | 14,831,322 | |||||||
| 29,540,000 | OSCAR US Funding Trust VII LLC 2017-2A1 |
11/10/20 | 2.130 | 29,403,200 | |||||||
| 11,632,359 | Oxford Finance Funding LLC 2014-1A1 |
12/15/22 | 3.475 | 11,588,659 | |||||||
| 14,750,000 | Oxford Finance Funding LLC 2016-1A1 |
06/17/24 | 3.968 | 14,867,503 | |||||||
| 29,000,000 | PFS Financing Corp. 2017-AA (1-Month USD-LIBOR + 0.580%)1,2 |
03/15/21 | 1.819 | 29,043,718 | |||||||
| 26,450,000 | PFS Financing Corp. 2017-BA1 |
07/15/22 | 2.220 | 26,257,600 | |||||||
| 34,310,000 | PFS Financing Corp. 2017-D1 |
10/17/22 | 2.400 | 34,301,285 | |||||||
| 16,641,293 | ReadyCap Lending Small Business Loan Trust 2015-1 (1-Month USD-LIBOR + 1.250%)2 |
12/25/38 | 2.488 | 16,590,415 | |||||||
| 4,989,391 | Santander Drive Auto Receivables Trust 2015-3 |
04/15/20 | 2.070 | 4,992,569 | |||||||
| 22,790,000 | Santander Drive Auto Receivables Trust 2015-3 |
01/15/21 | 2.740 | 22,951,654 | |||||||
| 47,610,000 | Santander Drive Auto Receivables Trust 2017-2 |
03/16/20 | 1.600 | 47,597,298 | |||||||
| 18,277,883 | Shenton Aircraft Investment I, Ltd. 2015-1A1 |
10/15/42 | 4.750 | 19,063,538 | |||||||
| 662,952 | SMART Trust 2015-1US |
09/14/18 | 1.500 | 662,858 | |||||||
The accompanying notes are an integral part of these
financial statements.
BBH LIMITED DURATION FUND
PORTFOLIO OF INVESTMENTS (continued)
October 31, 2017
| Principal Amount |
Maturity Date |
Interest Rate |
Value |
||||||||
ASSET BACKED SECURITIES (continued) |
|||||||||||
| $ 33,210,000 | Spirit Master Funding LLC 2014-4A1 |
01/20/45 | 3.501 | % | $ | 33,256,952 | |||||
| 9,900,000 | Spirit Master Funding VII LLC 2013-1A1 |
12/20/43 | 3.887 | 9,872,557 | |||||||
| 34,770,000 | SPS Servicer Advance Receivables Trust Advance Receivables Backed Notes 2016-T21 |
11/15/49 | 2.750 | 34,861,567 | |||||||
| 16,750,001 | STORE Master Funding LLC 2013-1A1 |
03/20/43 | 4.160 | 16,789,280 | |||||||
| 11,993,305 | STORE Master Funding LLC 2013-2A1 |
07/20/43 | 4.370 | 12,017,160 | |||||||
| 20,068,083 | STORE Master Funding LLC 2013-3A1 |
11/20/43 | 4.240 | 20,322,526 | |||||||
| 891,624 | TAL Advantage V LLC 2014-2A1 |
05/20/39 | 1.700 | 890,144 | |||||||
| 16,787,500 | TAL Advantage V LLC 2014-3A1 |
11/21/39 | 3.270 | 16,657,624 | |||||||
| 5,606,814 | Tax Ease Funding 2016-1 LLC 2016-1A1 |
06/15/28 | 3.131 | 5,632,124 | |||||||
| 26,380,668 | Textainer Marine Containers V, Ltd. 2017-1A1 |
05/20/42 | 3.720 | 26,695,647 | |||||||
| 35,694,323 | Textainer Marine Containers V, Ltd. 2017-2A1 |
06/20/42 | 3.520 | 35,428,625 | |||||||
| 61,740,000 | Trafigura Securitisation Finance, Plc. 2017-1A1 |
12/15/20 | 2.470 | 61,504,091 | |||||||
| 54,753,639 | Triton Container Finance IV LLC 2017-2A1 |
08/20/42 | 3.620 | 55,432,080 | |||||||
| 3,559,583 | Utah State Board of Regents 2011-1 (3-Month USD-LIBOR + 0.850%)2 |
05/01/29 | 2.161 | 3,570,546 | |||||||
| 18,960,000 | Veros Automobile Receivables Trust 2017-11 |
04/17/23 | 2.840 | 18,956,822 | |||||||
| 3,021,633 | Westlake Automobile Receivables Trust 2015-1A1 |
11/16/20 | 2.290 | 3,023,204 | |||||||
| 14,336,251 | Westlake Automobile Receivables Trust 2015-2A1 |
01/15/21 | 2.450 | 14,352,932 | |||||||
| 19,570,000 | World Financial Network Credit Card Master Trust 2016-B |
06/15/22 | 1.440 | 19,527,758 | |||||||
| 64,480,000 | World Financial Network Credit Card Master Trust 2017-A |
03/15/24 | 2.120 | 64,378,612 | |||||||
The accompanying notes are an integral part of these
financial statements.
|
|
BBH LIMITED DURATION FUND
PORTFOLIO OF INVESTMENTS (continued)
October 31, 2017
| Principal Amount |
Maturity Date |
Interest Rate |
Value |
||||||||
ASSET BACKED SECURITIES (continued) |
|||||||||||
| $ 10,310,000 | World Financial Network Credit Card Master Trust 2017-B |
06/15/23 | 1.980 | % | $ | 10,302,048 | |||||
| 30,450,000 | WRG Debt Funding II LLC 2017-11 |
03/15/26 | 4.458 | 30,235,863 | |||||||
| Total Asset Backed Securities (Identified cost $2,044,802,091) |
2,047,573,377 | ||||||||||
COMMERCIAL MORTGAGE BACKED SECURITIES (5.1%) |
|||||||||||
| 15,540,000 | Aventura Mall Trust 2013-AVM1,2,3 |
12/05/32 | 3.867 | 15,882,674 | |||||||
| 13,860,000 | BBCMS Trust 2015-RRI (1-Month USD-LIBOR + 2.150%)1,2 |
05/15/32 | 3.389 | 13,892,693 | |||||||
| 26,807,000 | BB-UBS Trust 2012-TFT1,2,3 |
06/05/30 | 3.584 | 26,298,621 | |||||||
| 6,349,000 | BHMS Mortgage Trust 2014-ATLS (1-Month USD-LIBOR + 2.450%)1,2 |
07/05/33 | 3.688 | 6,441,805 | |||||||
| 32,018,000 | BHMS Mortgage Trust 2014-ATLS1,2,3 |
07/05/33 | 4.847 | 32,361,121 | |||||||
| 30,106,000 | BXHTL Mortgage Trust 2015-JWRZ (1-Month USD-LIBOR + 2.150%)1,2 |
05/15/29 | 3.389 | 30,192,847 | |||||||
| 31,329,000 | CG-CCRE Commercial Mortgage Trust 2014-FL2 (1-Month USD-LIBOR + 2.900%)1,2 |
11/15/31 | 4.139 | 31,455,218 | |||||||
| 2,085,000 | Citigroup Commercial Mortgage Trust 2013-SMP1 |
01/12/30 | 2.738 | 2,085,178 | |||||||
| 6,546,684 | Commercial Mortgage Pass Through Certificates 2013-GAM1 |
02/10/28 | 1.705 | 6,475,765 | |||||||
| 9,690,000 | Commercial Mortgage Pass Through Certificates 2013-GAM1,2,3 |
02/10/28 | 3.531 | 9,507,756 | |||||||
| 22,660,000 | Commercial Mortgage Pass Through Certificates 2014-TWC (1-Month USD-LIBOR + 0.850%)1,2 |
02/13/32 | 2.089 | 22,681,096 | |||||||
| 23,010,000 | Cosmopolitan Hotel Trust 2016-CSMO (1-Month USD-LIBOR + 1.400%)1,2 |
11/15/33 | 2.639 | 23,148,345 | |||||||
| 29,435,000 | Hospitality Mortgage Trust 2017-HIT (1-Month USD-LIBOR + 0.850%)1,2 |
05/08/30 | 2.088 | 29,490,223 | |||||||
| 35,700,000 | SBA Tower Trust 1 |
04/09/43 | 2.240 | 35,704,666 | |||||||
The accompanying notes are an integral part of these
financial statements.
BBH LIMITED DURATION FUND
PORTFOLIO OF INVESTMENTS (continued)
October 31, 2017
| Principal Amount |
Maturity Date |
Interest Rate |
Value |
||||||||
COMMERCIAL MORTGAGE BACKED SECURITIES (continued) |
|||||||||||
| $ 14,500,000 | Wells Fargo Commercial Mortgage Trust 2014-TISH (1-Month USD-LIBOR + 1.850%)1,2 |
02/15/27 | 3.089 | % | $ | 14,558,921 | |||||
| 15,651,867 | WFCG Commercial Mortgage Trust 2015-BXRP (1-Month USD-LIBOR + 1.122%)1,2 |
11/15/29 | 2.361 | 15,661,664 | |||||||
| 11,468,922 | WFCG Commercial Mortgage Trust 2015-BXRP (1-Month USD-LIBOR + 1.472%)1,2 |
11/15/29 | 2.711 | 11,476,117 | |||||||
| Total Commercial Mortgage Backed Securities (Identified cost $326,605,960) |
327,314,710 | ||||||||||
CORPORATE BONDS (35.6%) |
|||||||||||
AEROSPACE/DEFENSE (0.4%) |
|||||||||||
| 24,988,000 | BAE Systems Holdings, Inc.1 |
06/01/19 | 6.375 | 26,613,580 | |||||||
AUTO MANUFACTURERS (2.4%) |
|||||||||||
| 35,420,000 | Daimler Finance North America LLC1 |
01/11/18 | 1.875 | 35,438,064 | |||||||
| 41,036,000 | Ford Motor Credit Co. LLC |
01/16/18 | 2.375 | 41,093,450 | |||||||
| 23,798,000 | Ford Motor Credit Co. LLC |
10/01/18 | 2.875 | 24,008,832 | |||||||
| 33,898,000 | General Motors Co. |
10/02/18 | 3.500 | 34,386,003 | |||||||
| 17,725,000 | General Motors Financial Co., Inc. |
05/15/18 | 3.250 | 17,861,432 | |||||||
| 152,787,781 | |||||||||||
BANKS (11.7%) |
|||||||||||
| 24,290,000 | ANZ New Zealand (Int’l), Ltd., London Branch1 |
02/01/19 | 2.250 | 24,388,178 | |||||||
| 84,532,000 | Bank of America Corp. |
04/25/18 | 6.875 | 86,586,589 | |||||||
| 13,255,000 | Bank of Tokyo-Mitsubishi UFJ Ltd.1 |
03/05/18 | 1.700 | 13,260,828 | |||||||
| 4,840,000 | Bank of Tokyo-Mitsubishi UFJ Ltd.1 |
09/14/18 | 2.150 | 4,854,942 | |||||||
| 20,435,000 | BNZ International Funding, Ltd., London Branch1 |
02/21/20 | 2.400 | 20,504,571 | |||||||
The accompanying notes are an integral part of these
financial statements.
|
|
BBH LIMITED DURATION FUND
PORTFOLIO OF INVESTMENTS (continued)
October 31, 2017
| Principal Amount |
Maturity Date |
Interest Rate |
Value |
||||||||
CORPORATE BONDS (continued) |
|||||||||||
BANKS (continued) |
|||||||||||
| $ 24,335,000 | BNZ International Funding, Ltd., London Branch1 |
03/02/21 | 2.750 | % | $ | 24,553,791 | |||||
| 14,000,000 | Caisse Centrale Desjardins1 |
01/29/18 | 1.750 | 14,008,360 | |||||||
| 36,883,000 | Capital One NA |
02/05/18 | 1.650 | 36,871,288 | |||||||
| 37,775,000 | Citigroup, Inc. |
04/27/18 | 1.700 | 37,758,341 | |||||||
| 39,974,000 | Citigroup, Inc. |
05/15/18 | 6.125 | 40,899,185 | |||||||
| 26,250,000 | Commonwealth Bank of Australia1 |
10/15/19 | 5.000 | 27,691,906 | |||||||
| 438,665 | FNBC 1993-A Pass Through Trust |
01/05/18 | 8.080 | 439,183 | |||||||
| 79,121,000 | Goldman Sachs Group, Inc. |
04/01/18 | 6.150 | 80,539,652 | |||||||
| 32,505,000 | Huntington National Bank |
02/26/18 | 1.700 | 32,512,807 | |||||||
| 18,180,000 | JPMorgan Chase & Co. |
03/01/18 | 1.700 | 18,187,533 | |||||||
| 31,050,000 | Morgan Stanley |
04/01/18 | 6.625 | 31,666,656 | |||||||
| 36,797,000 | Morgan Stanley |
04/25/18 | 2.125 | 36,864,138 | |||||||
| 13,760,000 | National Australia Bank, Ltd. |
07/12/19 | 1.375 | 13,639,354 | |||||||
| 24,850,000 | Royal Bank of Canada |
04/15/19 | 1.625 | 24,779,764 | |||||||
| 39,890,000 | Skandinaviska Enskilda Banken AB |
03/11/20 | 2.300 | 40,067,539 | |||||||
| 12,345,000 | Skandinaviska Enskilda Banken AB |
03/15/21 | 2.625 | 12,478,865 | |||||||
| 18,165,000 | State Street Corp. |
05/15/18 | 1.350 | 18,139,005 | |||||||
| 25,085,000 | Toronto-Dominion Bank |
04/07/21 | 2.125 | 24,970,318 | |||||||
| 29,515,000 | Wells Fargo Bank NA |
01/22/18 | 1.650 | 29,525,035 | |||||||
| 11,500,000 | Wells Fargo Bank NA |
05/24/19 | 1.750 | 11,475,486 | |||||||
| 17,750,000 | Westpac Banking Corp. |
12/01/17 | 1.500 | 17,752,308 | |||||||
| 10,000,000 | Westpac Banking Corp. |
07/30/18 | 2.250 | 10,045,041 | |||||||
| 18,153,000 | Westpac Banking Corp. |
03/06/20 | 2.150 | 18,192,790 | |||||||
| 752,653,453 | |||||||||||
BEVERAGES (1.1%) |
|||||||||||
| 39,350,000 | Anheuser-Busch InBev Finance, Inc. |
02/01/19 | 1.900 | 39,388,598 | |||||||
| 12,695,000 | Anheuser-Busch InBev Finance, Inc. |
02/01/21 | 2.650 | 12,856,981 | |||||||
| 18,782,000 | Diageo Capital, Plc. |
04/29/18 | 1.125 | 18,737,101 | |||||||
| 70,982,680 | |||||||||||
BIOTECHNOLOGY (0.4%) |
|||||||||||
| 22,975,000 | Amgen, Inc. |
05/10/19 | 1.900 | 22,979,839 | |||||||
The accompanying notes are an integral part of these
financial statements.
BBH LIMITED DURATION FUND
PORTFOLIO OF INVESTMENTS (continued)
October 31, 2017
| Principal Amount |
Maturity Date |
Interest Rate |
Value |
||||||||
CORPORATE BONDS (continued) |
|||||||||||
COMMERCIAL SERVICES (0.4%) |
|||||||||||
| $ 27,350,000 | United Rentals North America, Inc. |
07/15/23 | 4.625 | % | $ | 28,512,375 | |||||
COMPUTERS (0.4%) |
|||||||||||
| 6,790,000 | Dell International LLC / EMC Corp.1 |
06/15/21 | 4.420 | 7,139,728 | |||||||
| 17,250,000 | Dell International LLC / EMC Corp.1 |
06/15/23 | 5.450 | 18,901,539 | |||||||
| 26,041,267 | |||||||||||
COSMETICS/PERSONAL CARE (0.3%) |
|||||||||||
| 17,745,000 | Avon Products, Inc. |
03/15/20 | 6.600 | 17,478,825 | |||||||
DIVERSIFIED FINANCIAL SERVICES (2.7%) |
|||||||||||
| 6,783,393 | AA Aircraft Financing 2013-1 LLC1,2,3 |
11/01/19 | 3.596 | 6,749,476 | |||||||
| 3,251,599 | Ahold Lease Series 2001-A-1 Pass Through Trust |
01/02/20 | 7.820 | 3,342,354 | |||||||
| 15,950,000 | Air Lease Corp. |
09/04/18 | 2.625 | 16,050,987 | |||||||
| 20,430,000 | Alliance Data Systems Corp.1 |
12/01/17 | 5.250 | 20,460,645 | |||||||
| 3,210,000 | Alliance Data Systems Corp.1 |
04/01/20 | 6.375 | 3,242,100 | |||||||
| 3,750,000 | Alliance Data Systems Corp.1 |
11/01/21 | 5.875 | 3,881,250 | |||||||
| 8,790,000 | Alliance Data Systems Corp.1 |
08/01/22 | 5.375 | 8,965,800 | |||||||
| 37,962,000 | American Express Co. |
03/19/18 | 7.000 | 38,731,675 | |||||||
| 8,500,000 | Credit Acceptance Corp. |
02/15/21 | 6.125 | 8,648,750 | |||||||
| 9,470,440 | Doric Nimrod Air Alpha 2013-1 Pass Through Trust 1 |
05/30/25 | 5.250 | 9,917,445 | |||||||
| 5,002,035 | Doric Nimrod Air Finance Alpha, Ltd. 2012-1 (Class A) Pass Through Trust 1 |
11/30/24 | 5.125 | 5,232,517 | |||||||
| 49,455,000 | Drawbridge Special Opportunities Fund1 |
08/01/21 | 5.000 | 50,906,572 | |||||||
| 176,129,571 | |||||||||||
ELECTRIC (0.5%) |
|||||||||||
| 5,580,000 | TransAlta Corp. |
05/15/18 | 6.900 | 5,718,942 | |||||||
| 28,301,000 | Virginia Electric & Power Co. |
04/30/18 | 5.400 | 28,829,447 | |||||||
| 34,548,389 | |||||||||||
The accompanying notes are an integral part of these
financial statements.
|
|
BBH LIMITED DURATION FUND
PORTFOLIO OF INVESTMENTS (continued)
October 31, 2017
| Principal Amount |
Maturity Date |
Interest Rate |
Value |
||||||||
CORPORATE BONDS (continued) |
|||||||||||
GAS (0.6%) |
|||||||||||
| $ 35,006,000 | NiSource Finance Corp. |
03/15/18 | 6.400 | % | $ | 35,632,390 | |||||
HEALTHCARE-PRODUCTS (0.2%) |
|||||||||||
| 7,995,000 | Mallinckrodt International Finance SA |
04/15/18 | 3.500 | 7,995,000 | |||||||
| 1,435,000 | Mallinckrodt International Finance SA / Mallinckrodt CB LLC 1 |
04/15/20 | 4.875 | 1,433,206 | |||||||
| 9,428,206 | |||||||||||
HEALTHCARE-SERVICES (0.8%) |
|||||||||||
| 27,406,000 | UnitedHealth Group, Inc. |
02/15/18 | 6.000 | 27,750,514 | |||||||
| 26,155,000 | UnitedHealth Group, Inc. |
07/16/18 | 1.900 | 26,210,121 | |||||||
| 53,960,635 | |||||||||||
INSURANCE (2.8%) |
|||||||||||
| 15,775,000 | Athene Global Funding1 |
10/23/18 | 2.875 | 15,900,237 | |||||||
| 24,310,000 | Athene Global Funding1 |
01/25/22 | 4.000 | 25,229,924 | |||||||
| 12,290,000 | Enstar Group, Ltd. |
03/10/22 | 4.500 | 12,642,324 | |||||||
| 15,985,000 | Fairfax Financial Holdings, Ltd.1 |
05/15/21 | 5.800 | 17,112,712 | |||||||
| 7,638,000 | Marsh & McLennan Cos, Inc. |
09/10/19 | 2.350 | 7,675,140 | |||||||
| 22,800,000 | New York Life Global Funding1 |
04/09/20 | 2.000 | 22,801,980 | |||||||
| 31,810,000 | Sirius International Group, Ltd.1 |
11/01/26 | 4.600 | 31,122,904 | |||||||
| 33,100,000 | Vitality Re V, Ltd. (Underlying Investment Yield + 1.750%)1,2 |
01/07/20 | 2.879 | 33,066,900 | |||||||
| 16,740,000 | Vitality Re VIII, Ltd. (Underlying Investment Yield + 1.750%)1,2 |
01/08/22 | 2.879 | 16,766,784 | |||||||
| 182,318,905 | |||||||||||
INTERNET (0.3%) |
|||||||||||
| 15,630,000 | Expedia, Inc. |
08/15/20 | 5.950 | 17,009,667 | |||||||
The accompanying notes are an integral part of these
financial statements.
BBH LIMITED DURATION FUND
PORTFOLIO OF INVESTMENTS (continued)
October 31, 2017
| Principal Amount |
Maturity Date |
Interest Rate |
Value |
||||||||
CORPORATE BONDS (continued) |
|||||||||||
INVESTMENT COMPANIES (1.0%) |
|||||||||||
| $ 6,800,000 | Ares Capital Corp. |
11/30/18 | 4.875 | % | $ | 6,992,751 | |||||
| 6,455,000 | Ares Capital Corp. |
01/19/22 | 3.625 | 6,526,336 | |||||||
| 2,247,939 | Carlyle Investment Management LLC4 |
07/15/19 | 3.359 | 2,247,939 | |||||||
| 22,645,000 | FS Investment Corp. |
01/15/20 | 4.250 | 23,151,320 | |||||||
| 21,515,000 | PennantPark Investment Corp. |
10/01/19 | 4.500 | 21,796,138 | |||||||
| 60,714,484 | |||||||||||
MACHINERY—CONSTRUCTION & MINING (0.7%) |
|||||||||||
| 19,495,000 | Caterpillar Financial Services Corp. |
03/22/19 | 1.900 | 19,525,224 | |||||||
| 10,397,000 | Caterpillar Financial Services Corp. |
05/18/19 | 1.350 | 10,316,465 | |||||||
| 17,525,000 | Caterpillar Financial Services Corp. |
01/10/20 | 2.100 | 17,596,411 | |||||||
| 47,438,100 | |||||||||||
MEDIA (0.1%) |
|||||||||||
| 8,781,000 | TEGNA, Inc. |
10/15/19 | 5.125 | 8,912,715 | |||||||
MINING (0.1%) |
|||||||||||
| 8,000,000 | Freeport-McMoRan, Inc. |
11/15/20 | 6.500 | 8,150,000 | |||||||
OIL & GAS (0.4%) |
|||||||||||
| 10,065,000 | Occidental Petroleum Corp. |
02/15/18 | 1.500 | 10,060,603 | |||||||
| 19,630,325 | Odebrecht Drilling NorbeVIII/IX, Ltd.1,5 |
06/30/22 | 6.350 | 11,778,195 | |||||||
| 9,922,800 | Odebrecht Offshore Drilling Finance, Ltd.1,5 |
10/01/23 | 6.750 | 3,523,586 | |||||||
| 25,362,384 | |||||||||||
PHARMACEUTICALS (1.4%) |
|||||||||||
| 14,270,000 | AbbVie, Inc. |
05/14/18 | 1.800 | 14,278,858 | |||||||
| 9,000,000 | AbbVie, Inc. |
05/14/20 | 2.500 | 9,072,965 | |||||||
| 14,000,000 | AbbVie, Inc. |
05/14/21 | 2.300 | 13,979,603 | |||||||
| 34,383,000 | Allergan Funding SCS |
03/12/18 | 2.350 | 34,461,929 | |||||||
| 16,787,000 | GlaxoSmithKline Capital, Inc. |
05/15/18 | 5.650 | 17,161,271 | |||||||
| 88,954,626 | |||||||||||
The accompanying notes are an integral part of these
financial statements.
|
|
BBH LIMITED DURATION FUND
PORTFOLIO OF INVESTMENTS (continued)
October 31, 2017
| Principal Amount |
Maturity Date |
Interest Rate |
Value |
||||||||
CORPORATE BONDS (continued) |
|||||||||||
PIPELINES (1.1%) |
|||||||||||
| $ 43,420,000 | Kinder Morgan Energy Partners LP |
02/15/18 | 5.950 | % | $ | 43,912,361 | |||||
| 16,117,000 | TransCanada PipeLines, Ltd. |
11/09/17 | 1.625 | 16,117,645 | |||||||
| 12,960,000 | TransCanada PipeLines, Ltd. |
01/15/19 | 3.125 | 13,123,572 | |||||||
| 73,153,578 | |||||||||||
REAL ESTATE (0.2%) |
|||||||||||
| 11,490,000 | Prologis International Funding II SA1 |
02/15/20 | 4.875 | 12,119,897 | |||||||
REAL ESTATE INVESTMENT TRUSTS (1.4%) |
|||||||||||
| 31,465,000 | Omega Healthcare Investors, Inc. |
01/15/25 | 4.500 | 31,883,491 | |||||||
| 8,850,000 | Select Income REIT |
02/01/18 | 2.850 | 8,862,240 | |||||||
| 13,534,000 | Simon Property Group LP1 |
02/01/18 | 1.500 | 13,534,903 | |||||||
| 32,311,000 | Welltower, Inc. |
03/15/18 | 2.250 | 32,385,422 | |||||||
| 86,666,056 | |||||||||||
RETAIL (0.9%) |
|||||||||||
| 25,441,000 | Target Corp. |
01/15/18 | 6.000 | 25,677,699 | |||||||
| 31,840,000 | Wal-Mart Stores, Inc2,3. |
06/01/18 | 5.498 | 32,574,649 | |||||||
| 58,252,348 | |||||||||||
TELECOMMUNICATIONS (2.4%) |
|||||||||||
| 38,575,000 | AT&T, Inc. |
02/01/18 | 5.500 | 38,940,618 | |||||||
| 23,240,000 | BellSouth LLC1 |
04/26/21 | 4.285 | 23,525,334 | |||||||
| 11,940,000 | British Telecommunications, Plc. |
01/15/18 | 5.950 | 12,047,799 | |||||||
| 39,053,000 | Deutsche Telekom International Finance BV |
08/20/18 | 6.750 | 40,590,028 | |||||||
| 29,525,000 | Rogers Communications, Inc. |
08/15/18 | 6.800 | 30,676,971 | |||||||
| 8,760,000 | Sprint Spectrum Co. LLC / Sprint Spectrum Co. II LLC / Sprint Spectrum Co. III LLC 1 |
03/20/23 | 3.360 | 8,887,020 | |||||||
| 154,667,770 | |||||||||||
The accompanying notes are an integral part of these
financial statements.
BBH LIMITED DURATION FUND
PORTFOLIO OF INVESTMENTS (continued)
October 31, 2017
| Principal Amount |
Maturity Date |
Interest Rate |
Value |
||||||||
CORPORATE BONDS (continued) |
|||||||||||
TRANSPORTATION (0.4%) |
|||||||||||
| $ 23,687,000 | Norfolk Southern Corp. |
04/01/18 | 5.750 | % | $ | 24,069,317 | |||||
TRUCKING & LEASING (0.5%) |
|||||||||||
| 11,480,000 | GATX Corp. |
07/30/18 | 2.375 | 11,517,675 | |||||||
| 17,180,000 | Park Aerospace Holdings, Ltd.1 |
08/15/22 | 5.250 | 17,867,200 | |||||||
| 29,384,875 | |||||||||||
| Total Corporate Bonds (Identified cost $2,286,886,813) |
2,284,923,713 | ||||||||||
LOAN PARTICIPATIONS AND ASSIGNMENTS (8.3%) |
|||||||||||
| 34,302,295 | Analog Devices, Inc. (1-Month USD-LIBOR + 1.125%)2 |
09/23/19 | 2.365 | 34,259,417 | |||||||
| 5,952,148 | Analog Devices, Inc. (1-Month USD-LIBOR + 1.250%)2 |
09/23/21 | 2.490 | 5,937,267 | |||||||
| 9,697,567 | Aria Energy Operating LLC (1-Month USD-LIBOR + 4.500%)2 |
05/27/22 | 5.742 | 9,733,933 | |||||||
| 40,000,000 | AT&T, Inc. Term A (3-Month USD-LIBOR + 1.000%)2 |
05/15/19 | 2.381 | 39,950,000 | |||||||
| 13,600,913 | Avolon TLB Borrower 1 (US) LLC Term B2 (1-Month USD-LIBOR + 2.250%)2 |
03/21/22 | 3.488 | 13,702,103 | |||||||
| 3,000,000 | BCP Renaissance Parent LLC (3-Month USD-LIBOR + 4.000%)2 |
10/31/24 | 5.380 | 3,032,820 | |||||||
| 21,318,633 | Brixmor Operating Partnership LP (1-Month USD-LIBOR + 1.400%)2 |
03/18/19 | 2.650 | 21,291,984 | |||||||
| 35,076,849 | Charter Communications Operating LLC (CCO Safari LLC) Term H-1 (1-Month USD-LIBOR + 2.000%)2
|
01/15/22 | 3.250 | 35,221,716 | |||||||
| 25,325,000 | Dell International LLC Term A2 (1-Month USD-LIBOR + 1.750%)2 |
09/07/21 | 3.000 | 25,348,046 | |||||||
| 25,250,841 | Dell International Term B (1-Month USD-LIBOR + 2.000%)2 |
09/07/23 | 3.250 | 25,307,403 | |||||||
The accompanying notes are an integral part of these
financial statements.
|
|
BBH LIMITED DURATION FUND
PORTFOLIO OF INVESTMENTS (continued)
October 31, 2017
| Principal Amount |
Maturity Date |
Interest Rate |
Value |
||||||||
LOAN PARTICIPATIONS AND ASSIGNMENTS (continued) |
|||||||||||
| $ 34,844,330 | Delos Finance S.a.r.l. (3-Month USD-LIBOR + 2.000%)2 |
10/06/23 | 3.333 | % | $ | 35,089,285 | |||||
| 20,868,038 | Eastern Power LLC (TPF II LC LLC) (1-Month USD-LIBOR + 3.750%)2 |
10/02/23 | 4.992 | 21,024,549 | |||||||
| 11,710,374 | Entergy Rhode Island Energy LP Term B (1-Month USD-LIBOR + 4.750%)2 |
12/19/22 | 6.000 | 11,856,753 | |||||||
| 45,000,000 | Gilead Sciences, Inc. (3-Month USD-LIBOR + 1.000%)2 |
09/08/20 | 2.271 | 44,887,500 | |||||||
| 22,500,000 | Gilead Sciences, Inc. (3-Month USD-LIBOR + 1.000%)2 |
09/08/22 | 2.271 | 22,471,875 | |||||||
| 15,742,033 | HCA, Inc. Term B9 (1-Month USD-LIBOR + 2.000%)2 |
03/17/23 | 3.242 | 15,811,928 | |||||||
| 19,437,946 | Mallinckrodt International Finance SA Term B (3-Month USD-LIBOR + 2.750%)2 |
09/24/24 | 4.083 | 19,479,349 | |||||||
| 5,250,000 | Oneok Partners LP (1-Month USD-LIBOR + 1.300%)2 |
01/08/19 | 2.542 | 5,250,000 | |||||||
| 8,500,000 | RPI Finance Trust Term A3 (3-Month USD-LIBOR + 1.750%)2 |
10/14/21 | 3.131 | 8,500,000 | |||||||
| 48,482,254 | RPI Finance Trust Term B6 (3-Month USD-LIBOR + 2.000%)2 |
03/27/23 | 3.333 | 48,658,245 | |||||||
| 22,586,500 | Sprint Communications, Inc. (1-Month USD-LIBOR + 2.500%)2 |
02/02/24 | 3.750 | 22,661,713 | |||||||
| 39,896,515 | Western Digital Corporation Term B2 (1-Month USD-LIBOR + 2.750%)2 |
04/29/23 | 3.990 | 40,016,205 | |||||||
| 20,000,000 | Western Union Company (1-Month USD-LIBOR + 1.500%)2 |
04/09/21 | 2.735 | 20,025,000 | |||||||
| Total Loan Participations and Assignments (Identified cost $528,440,569) |
529,517,091 | ||||||||||
The accompanying notes are an integral part of these
financial statements.
|
BBH LIMITED DURATION FUND
PORTFOLIO OF INVESTMENTS (continued)
October 31, 2017
| Principal Amount |
Maturity Date |
Interest Rate |
Value |
||||||||
MUNICIPAL BONDS (7.0%) |
|||||||||||
| $ 14,250,000 | Baylor Health Care System, Revenue Bonds2,3 |
11/15/25 | 1.770 | % | $ | 13,609,320 | |||||
| 5,000,000 | Butler County General Authority, Revenue Bonds, AGM6 |
11/07/17 | 0.960 | 5,000,000 | |||||||
| 67,300,000 | California Statewide Communities Development Authority, Revenue Bonds6 |
11/07/17 | 0.860 | 67,300,000 | |||||||
| 18,000,000 | Charlotte-Mecklenburg Hospital Authority, Revenue Bonds6 |
11/01/17 | 0.920 | 18,000,000 | |||||||
| 6,800,000 | City of Charlotte, North Carolina, Certificates of Participation6 |
11/07/17 | 0.890 | 6,800,000 | |||||||
| 10,800,000 | City of New York, General Obligation Bonds6 |
11/07/17 | 0.920 | 10,800,000 | |||||||
| 23,635,000 | City of New York, General Obligation Bonds6 |
11/07/17 | 0.920 | 23,635,000 | |||||||
| 52,300,000 | County of Franklin, Ohio, Revenue Bonds6 |
11/07/17 | 0.930 | 52,300,000 | |||||||
| 9,600,000 | Illinois Finance Authority, Revenue Bonds6 |
11/07/17 | 0.910 | 9,600,000 | |||||||
| 28,005,000 | New Jersey Economic Development Authority, Revenue Bonds, AGM7 |
02/15/18 | 0.000 | 27,863,855 | |||||||
| 14,525,000 | New Jersey Economic Development Authority, Revenue Bonds |
06/15/21 | 5.000 | 15,879,166 | |||||||
| 10,100,000 | New Jersey Turnpike Authority, Revenue Bonds (70% of 1-Month USD-LIBOR + 0.700%)2,7
|
01/01/24 | 0.000 | 10,119,392 | |||||||
| 80,000,000 | New Jersey Turnpike Authority, Revenue Bonds (70% of 1-Month USD-LIBOR + 0.700%)2 |
01/01/24 | 1.568 | 80,153,600 | |||||||
| 10,850,000 | New York City Water & Sewer System, Revenue Bonds6 |
11/01/17 | 0.920 | 10,850,000 | |||||||
| 3,600,000 | New York State Energy Research & Development Authority, Revenue Bonds, NPFG2,3 |
12/01/20 | 1.610 | 3,546,216 | |||||||
The accompanying notes are an integral part of these
financial statements.
|
|
BBH LIMITED DURATION FUND
PORTFOLIO OF INVESTMENTS (continued)
October 31, 2017
| Principal Amount |
Maturity Date |
Interest Rate |
Value |
||||||||
MUNICIPAL BONDS (continued) |
|||||||||||
| $ 49,900,000 | New York State Housing Finance Agency, Revenue Bonds6 |
11/07/17 | 0.920 | % | $ | 49,900,000 | |||||
| 18,000,000 | New York State Housing Finance Agency, Revenue Bonds6 |
11/07/17 | 0.950 | 18,000,000 | |||||||
| 13,300,000 | Ohio Higher Educational Facility Commission, Revenue Bonds6 |
11/01/17 | 0.900 | 13,300,000 | |||||||
| 6,641,000 | Pennsylvania Industrial Development Authority, Revenue Bonds1 |
07/01/21 | 2.967 | 6,647,707 | |||||||
| 2,330,000 | School District of Philadelphia, General Obligation Bonds |
09/01/18 | 2.512 | 2,293,419 | |||||||
| 13,925,000 | Tobacco Settlement Financing Corp., Revenue Bonds7 |
06/01/41 | 0.000 | 3,922,812 | |||||||
| Total Municipal Bonds (Identified cost $448,478,116) |
449,520,487 | ||||||||||
U.S. GOVERNMENT AGENCY OBLIGATIONS (3.3%) |
|||||||||||
| 50,000,000 | Federal Home Loan Bank Discount Notes7 |
11/10/17 | 0.000 | 49,987,038 | |||||||
| 70,000,000 | Federal Home Loan Bank Discount Notes7 |
11/15/17 | 0.000 | 69,972,506 | |||||||
| 74,000,000 | Federal Home Loan Bank Discount Notes7 |
12/13/17 | 0.000 | 73,911,940 | |||||||
| 119,207 | Federal Home Loan Mortgage Corp. (FHLMC) Non Gold Guaranteed (1-Year USD-LIBOR + 1.788%)2 |
04/01/36 | 3.524 | 125,417 | |||||||
| 52,383 | Federal Home Loan Mortgage Corp. (FHLMC) Non Gold Guaranteed (6-Month USD-LIBOR + 1.740%)2 |
12/01/36 | 3.115 | 55,396 | |||||||
| 35,767 | Federal Home Loan Mortgage Corp. (FHLMC) Non Gold Guaranteed (1-Year USD-LIBOR + 1.745%)2 |
01/01/37 | 3.370 | 37,755 | |||||||
| 80,661 | Federal Home Loan Mortgage Corp. (FHLMC) Non Gold Guaranteed (1-Year USD-LIBOR + 1.846%)2 |
02/01/37 | 3.583 | 85,006 | |||||||
The accompanying notes are an integral part of these
financial statements.
BBH LIMITED DURATION FUND
PORTFOLIO OF INVESTMENTS (continued)
October 31, 2017
| Principal Amount |
Maturity Date |
Interest Rate |
Value |
||||||||
U.S. GOVERNMENT AGENCY OBLIGATIONS (continued) |
|||||||||||
| $ 8,680,618 | Federal National Mortgage Association (FNMA) |
07/01/35 | 5.000 | % | $ | 9,518,088 | |||||
| 596,768 | Federal National Mortgage Association (FNMA) |
11/01/35 | 5.500 | 666,866 | |||||||
| 76,890 | Federal National Mortgage Association (FNMA) (1-Year USD-LIBOR + 2.002%)2 |
07/01/36 | 3.752 | 81,741 | |||||||
| 109,543 | Federal National Mortgage Association (FNMA) (1-Year USD-LIBOR + 1.714%)2 |
09/01/36 | 3.464 | 114,856 | |||||||
| 83,052 | Federal National Mortgage Association (FNMA) (1-Year USD-LIBOR + 1.830%)2 |
01/01/37 | 3.437 | 87,469 | |||||||
| 504,824 | Federal National Mortgage Association (FNMA) |
08/01/37 | 5.500 | 563,416 | |||||||
| 5,863,059 | Federal National Mortgage Association (FNMA) |
08/01/37 | 5.500 | 6,552,003 | |||||||
| 2,556,328 | Federal National Mortgage Association (FNMA) |
06/01/40 | 6.500 | 2,873,361 | |||||||
| 17,301 | Government National Mortgage Association (GNMA) (1-Year CMT Index + 1.500%)2 |
08/20/29 | 2.750 | 17,832 | |||||||
| Total U.S. Government Agency Obligations (Identified cost $213,945,098) |
214,650,690 | ||||||||||
U.S. TREASURY BILLS (8.6%) |
|||||||||||
| 4,750,000 | U.S. Treasury Bill7,8 |
11/02/17 | 0.000 | 4,749,865 | |||||||
| 50,000,000 | U.S. Treasury Bill7 |
11/24/17 | 0.000 | 49,967,538 | |||||||
| 50,000,000 | U.S. Treasury Bill7 |
11/30/17 | 0.000 | 49,959,863 | |||||||
| 75,000,000 | U.S. Treasury Bill7 |
12/07/17 | 0.000 | 74,923,913 | |||||||
| 50,000,000 | U.S. Treasury Bill7 |
12/14/17 | 0.000 | 49,934,843 | |||||||
| 75,000,000 | U.S. Treasury Bill7 |
12/21/17 | 0.000 | 74,897,969 | |||||||
| 90,000,000 | U.S. Treasury Bill7 |
01/04/18 | 0.000 | 89,833,400 | |||||||
| 35,000,000 | U.S. Treasury Bill7 |
01/11/18 | 0.000 | 34,928,038 | |||||||
The accompanying notes are an integral part of these
financial statements.
|
|
BBH LIMITED DURATION FUND
PORTFOLIO OF INVESTMENTS (continued)
October 31, 2017
| Principal Amount |
Maturity Date |
Interest Rate |
Value |
||||||||
U.S. TREASURY BILLS (continued) |
|||||||||||
| $ 70,000,000 | U.S. Treasury Bill7 |
01/18/18 | 0.000 | % | $ | 69,835,451 | |||||
| 50,000,000 | U.S. Treasury Bill7 |
02/01/18 | 0.000 | 49,854,972 | |||||||
| Total U.S. Treasury Bills (Identified cost $548,911,785) |
548,885,852 | ||||||||||
| TOTAL INVESTMENTS (Identified cost $6,398,070,432)9 | 99.8 | % | $ | 6,402,385,920 | |||||||
| CASH AND OTHER ASSETS IN EXCESS OF LIABILITIES | 0.2 | % | 15,904,286 | ||||||||
| NET ASSETS | 100.0 | % | $ | 6,418,290,206 | |||||||
| 1 | Security exempt from registration under Rule 144A of the Securities Act of 1933, as amended. These securities may be resold in transactions exempt from registration, normally to qualified institutional buyers. Total market value of Rule 144A securities owned at October 31, 2017 was $2,567,962,696 or 40.0% of net assets. Unless otherwise noted, these securities are not considered illiquid. |
| 2 | Variable rate instrument. Interest rates change on specific dates (such as coupon or interest payment date). The yield shown represents the October 31, 2017 coupon or interest rate. |
| 3 | This variable rate security is based on a predetermined schedule and the rate at year end also represents the reference rate at year end. |
| 4 | Security that used significant unobservable inputs to determine fair value. |
| 5 | Security is in default. |
| 6 | Variable rate demand note. The maturity date reflects the demand repayment dates. The interest rate changes on specific dates (such as coupon or interest payment date). The yield shown represents the coupon or interest rate as of October 31, 2017. |
| 7 | Security issued with zero coupon. Income is recognized through accretion of discount. |
| 8 | All or a portion of this security is held at the broker as collateral for open futures contracts. |
| 9 | The aggregate cost for federal income tax purposes is $6,403,935,269, the aggregate gross unrealized appreciation is $24,148,170 and the aggregate gross unrealized depreciation is $20,339,628, resulting in net unrealized appreciation of $3,808,542. |
The accompanying notes are an integral part of these
financial statements.
BBH LIMITED DURATION FUND
PORTFOLIO OF INVESTMENTS (continued)
October 31, 2017
| Description |
Number of Contracts |
Expiration Date |
Notional Amount |
Market Value |
Unrealized Gain/(Loss) |
|||||||||||||||
Contracts to Sell: |
||||||||||||||||||||
U.S. Treasury 2-Year Notes |
1,475 | December 2017 | $ | 318,902,229 | $ | 317,655,080 | $ | 1,247,149 | ||||||||||||
U.S. Treasury 5-Year Notes |
2,725 | December 2017 | 322,359,960 | 319,335,937 | 3,024,023 | |||||||||||||||
U.S. Treasury 10-Year Notes |
650 | December 2017 | 82,296,094 | 81,209,375 | 1,086,719 | |||||||||||||||
| $ | 5,357,891 | |||||||||||||||||||
— |
Level 1 – unadjusted quoted prices in active markets for identical assets and liabilities. |
— |
Level 2 – significant other observable inputs (including quoted prices for similar assets and liabilities, interest rates, prepayment speeds, credit risk, etc.). |
— |
Level 3 – significant unobservable inputs (including the Fund’s own assumptions in determining the fair value of assets and liabilities). |
The accompanying notes are an integral part of these
financial statements.
|
|
BBH LIMITED DURATION FUND
PORTFOLIO OF INVESTMENTS (continued)
October 31, 2017
The accompanying notes are an integral part of these
financial statements.
BBH LIMITED DURATION FUND
PORTFOLIO OF INVESTMENTS (continued)
October 31, 2017
| Investments,
at value |
Unadjusted Quoted Prices in Active Markets for Identical Investments (Level 1)* |
Significant Other Observable Inputs (Level 2)* |
Significant Unobservable Inputs (Level 3)* |
Balance as
of October 31, 2017 |
||||||||||||
Asset Backed Securities |
$ | — | $ | 2,047,573,377 | $ | — | $ | 2,047,573,377 | ||||||||
Commercial Mortgage Backed Securities |
— | 327,314,710 | — | 327,314,710 | ||||||||||||
Corporate Bonds |
— | 2,282,675,774 | 2,247,939 | 2,284,923,713 | ||||||||||||
Loan Participations and Assignments |
— | 529,517,091 | — | 529,517,091 | ||||||||||||
Municipal Bonds |
— | 449,520,487 | — | 449,520,487 | ||||||||||||
U.S. Government Agency Obligations |
— | 214,650,690 | — | 214,650,690 | ||||||||||||
U.S. Treasury Bills |
— | 548,885,852 | — | 548,885,852 | ||||||||||||
Total Investments, at value |
$ | — | $ | 6,400,137,981 | $ | 2,247,939 | $ | 6,402,385,920 | ||||||||
Other Financial Instruments, at value |
||||||||||||||||
Financial Futures Contracts |
$ | 5,357,891 | $ | — | $ | — | $ | 5,357,891 | ||||||||
Other Financial Instruments, at value |
$ | 5,357,891 | $ | — | $ | — | $ | 5,357,891 | ||||||||
* |
The Fund’s policy is to disclose transfers between levels based on valuations at the end of the reporting period. There were no transfers between Levels 1, 2 or 3 during the period ended October 31, 2017. |
The accompanying notes are an integral part of these
financial statements.
|
|
BBH LIMITED DURATION FUND
PORTFOLIO OF INVESTMENTS (continued)
October 31, 2017
| Assets
Back Securities |
Corporate Bonds | Total | ||||||||||
Balance as of October 31, 2016 |
$ | 12,548,798 | $ | — | $ | 12,548,798 | ||||||
Purchases |
— | 2,569,074 | 2,569,074 | |||||||||
Sales / Paydowns |
(17,076,184 | ) | (321,135 | ) | (17,397,319 | ) | ||||||
Realized gains (losses) |
(601 | ) | — | (601 | ) | |||||||
Change in unrealized appreciation (depreciation) |
4,526,765 | — | 4,526,765 | |||||||||
Amortization |
1,222 | — | 1,222 | |||||||||
Transfers from Level 3 |
— | — | — | |||||||||
Transfers to Level 3 |
— | — | — | |||||||||
Balance as of October 31, 2017 |
$ | — | $ | 2,247,939 | $ | 2,247,939 | ||||||
The accompanying notes are an integral part of these
financial statements.
BBH LIMITED DURATION FUND
STATEMENT OF ASSETS AND LIABILITIES
October 31, 2017
ASSETS: |
||||
Investments in securities, at value (Identified cost $6,398,070,432) |
$ | 6,402,385,920 | ||
Cash |
5,305,811 | |||
Receivables for: |
||||
Investments sold |
74,966,188 | |||
Interest |
24,195,841 | |||
Shares sold |
5,240,948 | |||
Futures variation margin on open contracts |
357,619 | |||
Investment advisory and administrative fee waiver reimbursement |
19,281 | |||
Other |
2,357,508 | |||
Prepaid assets |
43,411 | |||
Total Assets |
6,514,872,527 | |||
LIABILITIES: |
||||
Payables for: |
||||
Investments purchased |
84,913,275 | |||
Shares redeemed |
10,018,973 | |||
Investment advisory and administrative fees |
1,346,673 | |||
Periodic distributions |
93,592 | |||
Professional fees |
86,738 | |||
Custody and fund accounting fees |
55,624 | |||
Distributor fees |
15,789 | |||
Shareholder servicing fees |
10,896 | |||
Transfer agent fees |
4,214 | |||
Board of Trustees’ fees |
418 | |||
Accrued expenses and other liabilities |
36,129 | |||
Total Liabilities |
96,582,321 | |||
NET ASSETS |
$ | 6,418,290,206 | ||
Net
Assets Consist of: |
||||
Paid-in capital |
$ | 6,458,544,023 | ||
Undistributed net investment income |
1,712,065 | |||
Accumulated net realized loss on investments in securities and futures contracts |
(51,639,261 | ) | ||
Net unrealized appreciation/(depreciation) on investments in securities and futures contracts |
9,673,379 | |||
Net Assets |
$ | 6,418,290,206 | ||
NET ASSET VALUE AND OFFERING PRICE PER SHARE |
||||
CLASS N SHARES |
||||
($72,186,444 ÷ 7,081,562 shares outstanding) |
$10.19 |
|||
CLASS I SHARES |
||||
($6,346,103,762 ÷ 622,833,019 shares outstanding) |
$10.19 |
The accompanying notes are an integral part of these
financial statements.
|
|
BBH LIMITED DURATION FUND
STATEMENT OF OPERATIONS
For the year ended October 31, 2017
NET INVESTMENT INCOME: |
||||
Income: |
||||
Dividends |
$ | 3,393,287 | ||
Interest income |
139,350,564 | |||
Other income |
1,129,629 | |||
Total Income |
143,873,480 | |||
Expenses: |
||||
Investment advisory and administrative fees |
15,168,817 | |||
Custody and fund accounting fees |
408,343 | |||
Shareholder servicing fees |
100,571 | |||
Professional fees |
95,303 | |||
Distributor fees |
78,637 | |||
Board of Trustees’ fees |
54,543 | |||
Transfer agent fees |
34,023 | |||
Miscellaneous expenses |
924,740 | |||
Total Expenses |
16,864,977 | |||
Investment advisory and administrative fee waiver |
(132,560 | ) | ||
Expense offset arrangement |
(146,237 | ) | ||
Net Expenses |
16,586,180 | |||
Net Investment Income |
127,287,300 | |||
NET REALIZED AND UNREALIZED GAIN: |
||||
Net realized gain on investments in securities |
2,279,595 | |||
Net realized gain on futures contracts |
9,080,229 | |||
Net realized gain on investments in securities and futures contracts |
11,359,824 | |||
Net change in unrealized appreciation/(depreciation) on investments in securities |
17,409,208 | |||
Net change in unrealized appreciation/(depreciation) on futures contracts |
2,707,894 | |||
Net change in unrealized appreciation/(depreciation) on investments in securities and futures contracts |
20,117,102 | |||
Net Realized and Unrealized Gain |
31,476,926 | |||
Net Increase in Net Assets Resulting from Operations |
$ | 158,764,226 |
The accompanying notes are an integral part of these
financial statements.
BBH LIMITED DURATION FUND
STATEMENTS OF CHANGES IN NET ASSETS
| For the years ended October 31, | ||||||||
| 2017 | 2016 | |||||||
INCREASE IN NET ASSETS: |
||||||||
Operations: |
||||||||
Net investment income |
$ | 127,287,300 | $ | 108,238,798 | ||||
Net realized gain (loss) on investments in securities and futures contracts |
11,359,824 | (21,546,019 | ) | |||||
Net change in unrealized appreciation/(depreciation) on investments in securities and futures contracts |
20,117,102 | 20,017,174 | ||||||
Net increase in net assets resulting from operations |
158,764,226 | 106,709,953 | ||||||
Dividends and distributions declared: |
||||||||
From net investment income: |
||||||||
Class N |
(1,046,363 | ) | (8,926,897 | ) | ||||
Class I |
(124,987,733 | ) | (98,807,189 | ) | ||||
Total dividends and distributions declared |
(126,034,096 | ) | (107,734,086 | ) | ||||
Share transactions: |
||||||||
Proceeds from sales of shares* |
4,351,810,164 | 4,430,445,855 | ||||||
Net asset value of shares issued to shareholders for reinvestment of dividends and distributions |
16,722,566 | 73,615,791 | ||||||
Cost of shares redeemed* |
(2,762,241,924 | ) | (4,434,265,957 | ) | ||||
Net increase in net assets resulting from share transactions |
1,606,290,806 | 69,795,689 | ||||||
Total increase in net assets |
1,639,020,936 | 68,771,556 | ||||||
NET ASSETS: |
||||||||
Beginning of year |
4,779,269,270 | 4,710,497,714 | ||||||
End
of year (including undistributed net investment income of $1,712,065 and $1,631,645,
respectively) |
$ | 6,418,290,206 | $ | 4,779,269,270 | ||||
* |
Includes share exchanges. See Note 5 in Notes to Financial Statements. |
The accompanying notes are an integral part of these
financial statements.
|
|
BBH LIMITED DURATION FUND
FINANCIAL HIGHLIGHTS
Selected per share data and ratios for a Class N share outstanding throughout each
year.
| For the years ended October 31, | ||||||||||||||||||||
| 2017 | 2016 | 2015 | 2014 | 2013 | ||||||||||||||||
Net asset value, beginning of year |
$ | 10.13 | $ | 10.14 | $ | 10.31 | $ | 10.35 | $ | 10.44 | ||||||||||
Income from investment operations: |
||||||||||||||||||||
Net investment income1 |
0.21 | 0.19 | 0.18 | 0.14 | 0.15 | |||||||||||||||
Net realized and unrealized gain (loss) |
0.05 | (0.00 |
)2 | (0.17 | ) | (0.01 | ) | (0.06 | ) | |||||||||||
Total income from investment operations |
0.26 | 0.19 | 0.01 | 0.13 | 0.09 | |||||||||||||||
Less dividends and distributions: |
||||||||||||||||||||
From net investment income |
(0.20 | ) | (0.20 | ) | (0.18 | ) | (0.14 | ) | (0.15 | ) | ||||||||||
From net realized gains |
— | — | — | (0.03 | ) | (0.03 | ) | |||||||||||||
Total dividends and distributions |
(0.20 | ) | (0.20 | ) | (0.18 | ) | (0.17 | ) | (0.18 | ) | ||||||||||
Net asset value, end of year |
$ | 10.19 | $ | 10.13 | $ | 10.14 | $ | 10.31 | $ | 10.35 | ||||||||||
Total return |
2.64 | % | 1.90 | % | 0.10 | % | 1.32 | % | 0.82 | % | ||||||||||
Ratios/Supplemental data: |
||||||||||||||||||||
Net assets, end of year (in millions) |
$ | 72 | $ | 42 | $ | 2,557 | $ | 2,625 | $ | 2,170 | ||||||||||
Ratio of expenses to average net assets before reductions |
0.67 | % | 0.49 | % | 0.48 | % | 0.48 | % | 0.49 | % | ||||||||||
Fee waiver |
0.27 | %3 | 0.01 | %3 | —% | —% | —% | |||||||||||||
Expense offset arrangement |
0.00 | %4 | 0.00 | %4 | 0.00 | %4 | 0.00 | %4 | 0.00 | %4 | ||||||||||
Ratio of expenses to average net assets after reductions |
0.40 | % | 0.48 | % | 0.48 | % | 0.48 | % | 0.49 | % | ||||||||||
Ratio of net investment income to average net assets |
2.05 | % | 1.91 | % | 1.75 | % | 1.36 | % | 1.44 | % | ||||||||||
Portfolio turnover rate |
52 | % | 53 | % | 46 | % | 35 | % | 48 | % | ||||||||||
| 1 | Calculated using average shares outstanding for the year. |
| 2 | Less than $0.01 |
| 3 | The ratio of expenses to average net assets for the years ended October 31, 2017 and 2016, reflect fees reduced as result of voluntary operating expense limitation of the share class to 0.35%, prior to March 24, 2017, the expense limitation of share class was 0.48%. The agreement is effective for the periods beginning on December 29, 2015 and can be changed at any time at the sole discretion of the Investment Advisor. For the years ended October 31, 2017 and 2016, the waived fees were $132,560 and 45,079, respectively. |
| 4 | Less than 0.01% |
The accompanying notes are an integral part of these
financial statements.
BBH LIMITED DURATION FUND
FINANCIAL HIGHLIGHTS (continued)
Selected per share data and ratios for a Class I share outstanding throughout each
year.
| For the years ended October 31, | ||||||||||||||||||||
| 2017 | 2016 | 2015 | 2014 | 2013 | ||||||||||||||||
Net asset value, beginning of year |
$ | 10.13 | $ | 10.14 | $ | 10.31 | $ | 10.35 | $ | 10.44 | ||||||||||
Income from investment operations: |
||||||||||||||||||||
Net investment income1 |
0.22 | 0.22 | 0.20 | 0.16 | 0.17 | |||||||||||||||
Net realized and unrealized gain (loss) |
0.06 | (0.01 | ) | (0.17 | ) | (0.01 | ) | (0.06 | ) | |||||||||||
Total income from investment operations |
0.28 | 0.21 | 0.03 | 0.15 | 0.11 | |||||||||||||||
Less dividends and distributions: |
||||||||||||||||||||
From net investment income |
(0.22 | ) | (0.22 | ) | (0.20 | ) | (0.16 | ) | (0.17 | ) | ||||||||||
From net realized gains |
— | — | — | (0.03 | ) | (0.03 | ) | |||||||||||||
Total dividends and distributions |
(0.22 | ) | (0.22 | ) | (0.20 | ) | (0.19 | ) | (0.20 | ) | ||||||||||
Net asset value, end of year |
$ | 10.19 | $ | 10.13 | $ | 10.14 | $ | 10.31 | $ | 10.35 | ||||||||||
Total return |
2.77 | % | 2.13 | % | 0.30 | % | 1.52 | % | 1.01 | % | ||||||||||
Ratios/Supplemental data: |
||||||||||||||||||||
Net assets, end of year (in millions) |
$ | 6,346 | $ | 4,737 | $ | 2,153 | $ | 2,547 | $ | 1,448 | ||||||||||
Ratio of expenses to average net assets before reductions |
0.28 | % | 0.27 | % | 0.28 | % | 0.29 | % | 0.29 | % | ||||||||||
Expense offset arrangement |
0.00 | %2 | 0.00 | %2 | 0.00 | %2 | 0.00 | %2 | 0.00 | %2 | ||||||||||
Ratio of expenses to average net assets after reductions |
0.28 | % | 0.27 | % | 0.28 | % | 0.29 | % | 0.29 | % | ||||||||||
Ratio of net investment income to average net assets |
2.17 | % | 2.21 | % | 1.94 | % | 1.56 | % | 1.63 | % | ||||||||||
Portfolio turnover rate |
52 | % | 53 | % | 46 | % | 35 | % | 48 | % | ||||||||||
| 1 | Calculated using average shares outstanding for the year. |
| 2 | Less than 0.01% |
The accompanying notes are an integral part of these
financial statements.
|
|
BBH LIMITED DURATION FUND
NOTES TO FINANCIAL STATEMENTS
October 31, 2017
1. |
Organization. The Fund is a separate, diversified series of BBH Trust (the “Trust”), which is registered under the Investment Company Act of 1940, as amended (the “1940 Act”), as an open-end management investment company. The Trust was originally organized under the laws of the State of Maryland on July 16, 1990 as BBH Fund, Inc. and re-organized as a Delaware statutory trust on June 12, 2007. The Fund commenced operations on December 22, 2000. The Fund offers Class N and Class I shares. Class N and Class I shares have different operating expenses. With the exception of class specific expenses, all expenses are allocated between classes based on net assets. Neither Class N shares nor Class I shares automatically convert to any other share class of the Fund. As of October 31, 2017, there were six series of the Trust . |
2. |
Significant Accounting Policies. The Fund’s financial statements are prepared in accordance with Generally Accepted Accounting Principles in the United States of America (“GAAP”). The Fund is an investment company and accordingly follows the investment company accounting and reporting guidance of the Financial Accounting Standards Board (FASB) Accounting Standard Codification Topic 946 Financial Services — Investment Companies. The following summarizes significant accounting policies of the Fund: |
A. |
Valuation of Investments. Bonds and other fixed income securities, including restricted securities (other than short-term obligations but including listed issues) are valued at their most recent bid prices (sales price if the principal market is an exchange) in the principal market in which such securities are normally traded, on the basis of valuations furnished by a pricing service, use of which has been approved by the Board of Trustees (the “Board”). In making such valuations, the pricing service utilizes both dealer supplied valuations and electronic data processing techniques, which take into account appropriate factors such as institutional-size trading in similar groups of securities, yield, quality, coupon rate, maturity, type of issue, trading characteristics and other market data, without exclusive reliance upon quoted prices, or exchange or over-the-counter prices, since such valuations are believed to reflect more accurately the fair value of such securities. Future contracts held by the Fund are valued daily at the official settlement price of the exchange on which it is traded. |
BBH LIMITED DURATION FUND
NOTES TO FINANCIAL STATEMENTS (continued)
October 31, 2017
B. |
Accounting for Investments and Income. Investment transactions are accounted for on the trade date. Realized gains and losses on investment transactions are determined based on the identified cost method. Interest income is accrued daily and consists of interest accrued, discount earned (including, if any, both original issue and market discount) and premium amortization on the investments of the Fund. Investment income is recorded net of any foreign taxes withheld where recovery of such tax is uncertain. Debt obligations may be placed on non-accrual status and related interest income may be reduced by ceasing current accruals and writing off interest receivable when the collection of all or a portion of the interest has become doubtful based on consistently applied procedures. A debt obligation is removed from non-accrual status when the issuer resumes interest payments or when collectability of interest is reasonably assured. |
C. |
Fund Expenses. Most expenses of the Trust can be directly attributed to a specific fund. Expenses which cannot be directly attributed to a fund are apportioned amongst each fund in the Trust equally. Expense estimates are accrued in the period to which they relate and adjustments are made when actual amounts are known. |
D. |
Financial Futures Contracts. The Fund may enter into open futures contracts in order to hedge against anticipated future changes in interest rates which otherwise might either adversely affect the value of securities held for the Fund or adversely affect the prices of securities that are intended to be purchased at a later date for the Fund. The contractual amount of the futures contracts represents the investment the Fund has in a particular contract and does not necessarily represent the amounts potentially subject to risk of loss. Trading in futures contracts involves, to varying degrees, risk of loss in excess of any futures variation margin reflected in the Statement of Assets and Liabilities. The measurement of risk associated with futures contracts is meaningful only when all related and offsetting transactions are considered. Gains and losses are realized upon the expiration or closing of the futures contracts. |
|
|
BBH LIMITED DURATION FUND
NOTES TO FINANCIAL STATEMENTS (continued)
October 31, 2017
| Asset
Derivatives |
Liability
Derivatives |
||||||||||||||||||
| Risk |
Statement
of Assets and Liabilities Location |
Fair
Value |
Statement of Assets and Liabilities Location |
Fair Value |
|||||||||||||||
Interest Rate Risk |
Net unrealized appreciation/(depreciation) on investments in securities and futures contracts. |
$ | 5,357,891 | * | Net unrealized appreciation/(depreciation) on investments in securities and futures contracts. |
$ | — | ||||||||||||
Total |
$ | 5,357,891 | $ | — | |||||||||||||||
* |
Includes cumulative appreciation of futures contracts as reported in the Statement of Assets and Liabilities and Notes to Financial Statements. Only the current day’s variation margin is reported within the Statement of Assets and Liabilities. |
| Interest Rate Risk |
||||||
Net Realized Gain on Derivatives |
||||||
Futures Contracts |
$ | 9,080,229 | ||||
Net Change in Unrealized Appreciation/(Depreciation) on Derivatives |
||||||
Futures Contracts |
$ | 2,707,894 | ||||
E. |
Rule 144A Securities. The Fund may purchase securities that are not registered under the Securities Act of 1933, as amended (“1933 Act”) but that can be sold to “qualified institutional buyers” in accordance with the requirements stated in Rule 144A under the 1933 Act (“Rule 144A Securities”). A Rule 144A Security may be considered illiquid and therefore subject to the 15% limitation on the purchase of illiquid securities, unless it is determined on an ongoing basis that an adequate trading market exists for the security, which is the case for the Fund. Guidelines have been adopted and the daily function of determining and monitoring liquidity of Rule 144A Securities has been delegated to the investment adviser. All relevant factors will be considered in determining the liquidity of Rule 144A Securities and all investments in Rule 144A Securities will be carefully monitored. Information regarding Rule 144A Securities is included at the end of the Portfolio of Investments. |
BBH LIMITED DURATION FUND
NOTES TO FINANCIAL STATEMENTS (continued)
October 31, 2017
F. |
Loan Participations and Assignments. The Fund may invest in loan participations and assignments, which include institutionally traded floating and fixed-rate debt securities generally acquired as an assignment from another holder of, or participation interest in, loans originated by a bank or financial institution (the “Lender”) that acts as agent for all holders. Some loan participations and assignments may be purchased on a “when-issued” basis. The agent administers the terms of the loan, as specified in the loan agreement. When investing in a loan participation, the Fund has the right to receive payments of principal, interest and any fees to which it is entitled only from the Lender selling the loan agreement and only upon receipt by the Lender of payments from the borrower. The Fund generally has no right to enforce compliance with the terms of the loan agreement with the borrower. |
G. |
Federal Income Taxes. It is the Trust’s policy to comply with the requirements of the Internal Revenue Code (the “Code”) applicable to regulated investment companies and to distribute substantially all of its taxable income to its shareholders. Accordingly, no federal income tax provision is required. The Fund files a tax return annually using tax accounting methods required under provisions of the Code, which may differ from GAAP, which is the basis on which these financial statements are prepared. Accordingly, the amount of net investment income and net realized gain reported in these financial statements may differ from that reported on the Fund’s tax return, due to certain book-to-tax timing differences such as losses deferred due to “wash sale” transactions and utilization of capital loss carryforwards. These differences may result in temporary over-distributions for financial statement purposes and are classified as distributions in excess of accumulated net realized gains or net investment income. These distributions do not constitute a return of capital. Permanent differences are reclassified in the Statement of Assets & Liabilities based upon their tax classification. As such, the character of distributions to shareholders reported in the Financial Highlights table may differ from that reported to shareholders on Form 1099-DIV. |
|
|
BBH LIMITED DURATION FUND
NOTES TO FINANCIAL STATEMENTS (continued)
October 31, 2017
H. |
Dividends and Distributions to Shareholders. Dividends and distributions from net investment income to shareholders, if any, are paid monthly and are recorded on the ex-dividend date. Distributions from net capital gains, if any, are generally declared and paid annually and are recorded on the ex-dividend date. The Fund declared dividends in the amount of $1,046,363 and $124,987,733 to Class N and Class I shareholders, respectively, during the year ended October 31, 2017. |
| Distributions
paid from: |
|||||||||||||||||||||||
| Ordinary income |
Net long-term capital gain |
Total taxable distributions |
Tax
return of capital |
Total distributions paid |
|||||||||||||||||||
2017: |
$ | 126,034,096 | $ | — | $ | 126,034,096 | $ | — | $ | 126,034,096 | |||||||||||||
2016: |
107,734,086 | — | 107,734,086 | — | 107,734,086 | ||||||||||||||||||
| Components of accumulated
earnings/(deficit): |
|||||||||||||||||||||||||||||||
| Undistributed ordinary income |
Undistributed long-term capital gain |
Accumulated earnings |
Accumulated capital and other losses |
Other book/tax temporary differences |
Book unrealized appreciation/ (depreciation) |
Total accumulated earnings/ (deficit) |
|||||||||||||||||||||||||
2017: |
$ | 1,712,065 | $ | — | $ | 1,712,065 | $ | (45,774,424 | ) | $ | (5,864,837 | ) | $ | 9,673,379 | $ | (40,253,817 | ) | ||||||||||||||
2016: |
1,631,645 | — | 1,631,645 | (61,521,827 | ) | (2,650,042 | ) | (10,443,723 | ) | (72,983,947 | ) | ||||||||||||||||||||
BBH LIMITED DURATION FUND
NOTES TO FINANCIAL STATEMENTS (continued)
October 31, 2017
I. |
Use of Estimates. The preparation of the financial statements in accordance with GAAP requires management to make estimates and assumptions that affect the reported amounts of assets and liabilities in the financial statements, disclosure of contingent assets and liabilities at the date of the financial statements and the reported amounts of increase and decrease in net assets from operations during the reporting period. Actual results could differ from these estimates. |
3. |
Fees and Other Transactions with Affiliates. |
A. |
Investment Advisory and Administrative Fees. Under a combined Investment Advisory and Administrative Services Agreement (“Agreement”) with the Trust, Brown Brothers Harriman & Co. (“BBH”) through a separately identifiable department (“SID” or “Investment Adviser”) provides investment advisory and portfolio management services to the Fund. BBH also provides administrative services to the Fund. The Fund pays a combined fee for investment advisory and administration services calculated daily and paid monthly at an annual rate equivalent to 0.30% per annum on the first $1,000,000,000 of the Fund’s average daily net assets and 0.25% per annum on the Fund’s average daily net assets over $1,000,000,000. For the year ended October 31, 2017, the Fund incurred $15,168,817 for services under the Agreement. |
|
|
BBH LIMITED DURATION FUND
NOTES TO FINANCIAL STATEMENTS (continued)
October 31, 2017
B. |
Investment Advisory and Administrative Fee Waivers. Effective March 24, 2017 the Investment Adviser has voluntarily agreed to waive fees and/or reimburse expenses for the Fund’s Class N shares in order to limit total annual fund operating expenses (excluding interest, taxes, brokerage commissions, other expenditures that are capitalized in accordance with GAAP, other extraordinary expenses not incurred in the ordinary courses of the Fund’s business) of Class N to 0.35%. Effective December 29, 2015 and prior to March 24, 2017 the Investment Adviser had voluntarily agreed to limit the annual fund operating expenses of Class N to 0.48%. This is a voluntary waiver that can be changed at any time at the sole discretion of the Investment Adviser. For the year ended October 31, 2017, the Investment Adviser waived fees in the amount of $132,560 for Class N. |
C. |
Shareholder Servicing Fees. The Trust has a shareholder servicing agreement with BBH. BBH receives a fee from the Fund calculated daily and paid monthly at an annual rate of 0.20% of Class N shares’ average daily net assets. For the year ended October 31, 2017, Class N shares of the Fund incurred $100,571 in shareholder servicing fees. |
D. |
Custody and Fund Accounting Fees. BBH acts as a custodian and fund accountant and receives custody and fund accounting fees from the Fund calculated daily and incurred monthly. BBH holds all of the Fund’s cash and investments and calculates the Fund’s daily net asset value. The custody fee is an asset and transaction-based fee. The fund accounting fee is an asset-based fee calculated at 0.004% of the Fund’s net asset value. For the year ended October 31, 2017, the Fund incurred $408,343 in custody and fund accounting fees. These fees for the Fund were reduced by $146,237 as a result of an expense offset arrangement with the Fund’s custodian. The credit amount (if any) is disclosed in the Statement of Operations as a reduction to the Fund’s expenses. In the event that the Fund is overdrawn, under the custody agreement with BBH, BBH will make overnight loans to the Fund to cover overdrafts. Pursuant to their agreement, the Fund will pay the Federal Funds overnight investment rate on the day of the overdraft. The total interest incurred by the Fund for the year ended October 31, 2017, was $1,571. This amount is presented under line item “Custody and fund accounting fees” in the Statements of Operations. |
E. |
Board of Trustees’ Fees. Each Trustee who is not an “interested person” as defined under the 1940 Act receives an annual fee as well as reimbursement for reasonable out-of-pocket expenses from the Fund. For the year ended October 31, 2017, the Fund incurred $54,543 in independent Trustee compensation and reimbursements. |
4. |
Investment Transactions. For the year ended October 31, 2017, the cost of purchases and the proceeds of sales of investment securities, other than short-term investments, were $2,898,428,223 and $2,351,405,030, respectively. |
BBH LIMITED DURATION FUND
NOTES TO FINANCIAL STATEMENTS (continued)
October 31, 2017
5. |
Shares of Beneficial Interest. The Trust is permitted to issue an unlimited number of Class N shares and Class I shares of beneficial interest, at no par value. Transactions in Class N and Class I shares were as follows: |
| For
the year ended October 31, 2017 |
For
the year ended October 31, 2016 |
|||||||||||||||||
| Shares |
Dollars |
Shares |
Dollars |
|||||||||||||||
Class N |
||||||||||||||||||
Shares sold |
4,739,548 | $ | 48,279,174 | 11,203,221 | $ | 113,390,603 | ||||||||||||
Shares issued in connection with reinvestments of dividends |
73,191 | 744,949 | 855,227 | 8,645,267 | ||||||||||||||
Shares redeemed |
(1,925,295 | ) | (19,575,111 | ) | (259,973,297 | ) | (2,623,811,320 | ) | ||||||||||
Net increase (decrease) |
2,887,444 | $ | 29,449,012 | (247,914,849 | ) | $ | (2,501,775,450 | ) | ||||||||||
Class I |
||||||||||||||||||
Shares sold |
423,523,826 | $ | 4,303,530,990 | 427,925,868 | $ | 4,317,055,252 | ||||||||||||
Shares issued in connection with reinvestments of dividends |
1,571,105 | 15,977,617 | 6,454,769 | 64,970,524 | ||||||||||||||
Shares redeemed |
(269,859,797 | ) | (2,742,666,813 | ) | (179,053,181 | ) | (1,810,454,637 | ) | ||||||||||
Net increase |
155,235,134 | $ | 1,576,841,794 | 255,327,456 | $ | 2,571,571,139 | ||||||||||||
6. |
Principal Risk Factors and Indemnifications. |
A. |
Principal Risk Factors. Investing in the Fund may involve certain risks, as discussed in the Fund’s prospectus, including but not limited to, those described below: |
|
|
BBH LIMITED DURATION FUND
NOTES TO FINANCIAL STATEMENTS (continued)
October 31, 2017
transaction to perform (credit
risk), changes in interest rates (interest rate risk), higher volatility for securities with longer maturities (maturity risk), financial performance
or leverage of the issuer (issuer risk), difficulty in being able to purchase or sell a security (liquidity risk), or certain risks associated with
investing in foreign securities not present in domestic investments, including, but not limited to, recovery of tax withheld by foreign jurisdictions
(foreign investment risk). The Fund’s use of derivatives creates risks that are different from, or possibly greater than, the risks associated
with investing directly in securities as the Fund could lose more than the principal amount invested (derivatives risk). The Fund invests in
asset-backed and mortgage-backed securities (mortgage-backed securities risk) which are subject to the risk that borrowers may default on the
obligations that underlie these securities. In addition, these securities may be paid off sooner (prepayment risk) or later than expected which may
increase the volatility of securities during periods of fluctuating interest rates. The Fund may invest in bonds issued by foreign governments which
may be unable or unwilling to make interest payments and/or repay the principal owed (sovereign debt risk). The Fund’s use of borrowing, in
reverse repurchase agreements and investment in some derivatives, involves leverage. Leverage tends to exaggerate the effect of any increase or
decrease in the value of the Fund’s securities and may cause the Fund to be more volatile (leverage risk). The value of securities held by the
Fund may decline in response to certain events, including: those directly involving the companies or issuers whose securities are held by the Fund;
conditions affecting the general economy; overall market changes; local, regional or political, social or economic instability; and currency and
interest rate and price fluctuations (market risk). The Fund’s shareholders may be adversely impacted by asset allocation decisions made by an
investment adviser whose discretionary clients make up a large percentage of the Fund’s shareholders (shareholder concentration risk). While
the U.S. Government has historically provided financial support to U.S. government-sponsored agencies or instrumentalities during times of financial
stress, such as the various actions taken to stabilize the Federal National Mortgage Association and Federal Home Loan Mortgage Corporation during the
credit crisis of 2008, no assurance can be given that it will do so in the future. Such securities are neither issued nor guaranteed by the U.S.
Treasury (U.S. Government Agency Securities Risk). The extent of the Fund’s exposure to these risks in respect to these financial assets is
included in their value as recorded in the Fund’s Statement of Assets and Liabilities.
B. |
Indemnifications. Under the Trust’s organizational documents, its officers and Trustees may be indemnified against certain liabilities and expenses arising out of the performance of their duties to the Fund, and shareholders are indemnified against personal liability for the obligations of the Trust. Additionally, in the normal course of business, the Fund enters into agreements with service |
BBH LIMITED DURATION FUND
NOTES TO FINANCIAL STATEMENTS (continued)
October 31, 2017
7. |
Recent Pronouncements. |
A. |
Regulation S-X. In October 2016, the U.S. Securities and Exchange Commission adopted new rules and amended existing rules (together, “final rules”) intended to modernize the reporting and disclosure of information by registered investment companies. In part, the final rules amend Regulation S-X and require standardized, enhanced disclosure about derivatives in investment company financial statements, as well as other amendments. The compliance date for the amendments to Regulation S-X was August 1, 2017. The changes related to Regulation S-X are reflected in the financial statements. |
B. |
ASU 2017-08. In March 2017, the Financial Accounting Standards Board issued an Accounting Standards Update, ASU 2017-08, Receivables – Nonrefundable Fees and Other Costs (Subtopic 310-20), Premium Amortization on Purchased Callable Debt Securities (the “ASU”) which amends the amortization period for certain purchased callable debt securities held at a premium, shortening such period to the earliest call date. The ASU does not require any accounting change for debt securities held at a discount; the discount continues to be amortized to maturity. The ASU is effective for years, and interim periods within those years, beginning after December 15, 2018. Management is currently evaluating the application of ASU 2017-08 and its impact, if any, on the Fund’s financial statements. |
8. |
Subsequent Events. Management has evaluated events and transactions that have occurred since October 31, 2017 through the date the financial statements were issued and determined that there were none that would require recognition or additional disclosure in the financial statements. |
|
|
BBH LIMITED DURATION FUND
DISCLOSURE OF FUND EXPENSES
October 31, 2017 (unaudited)
BBH LIMITED DURATION FUND
DISCLOSURE OF FUND EXPENSES (continued)
October 31, 2017 (unaudited)
| Beginning Account Value May 1, 2017 |
Ending Account Value October 31, 2017 |
Expenses Paid During Period May 1, 2017 to October 31, 20171 |
||||||||||||
Class N |
||||||||||||||
Actual |
$ | 1,000 | $ | 1,011 | $ | 1.83 | ||||||||
Hypothetical2 |
$ | 1,000 | $ | 1,023 | $ | 1.84 | ||||||||
| Beginning Account Value May 1, 2017 |
Ending Account Value October 31, 2017 |
Expenses Paid During Period May 1, 2017 to October 31, 20171 |
||||||||||||
Class I |
||||||||||||||
Actual |
$ | 1,000 | $ | 1,013 | $ | 1.47 | ||||||||
Hypothetical2 |
$ | 1,000 | $ | 1,024 | $ | 1.48 | ||||||||
| 1 | Expenses are equal to the Fund’s annualized expense ratio of 0.36% and 0.29% for Class N and I shares, respectively, multiplied by the average account value over the period, multiplied by 184/365 (to reflect the one-half year period). |
| 2 | Assumes a return of 5% before expenses. For the purposes of the calculation, the applicable annualized expenses ratio for each class of shares is subtracted from the assumed return before expenses. |
|
|
BBH LIMITED DURATION FUND
CONFLICTS OF INTEREST
October 31, 2017 (unaudited)
BBH LIMITED DURATION FUND
CONFLICTS OF INTEREST (continued)
October 31, 2017 (unaudited)
|
|
BBH LIMITED DURATION FUND
CONFLICTS OF INTEREST (continued)
October 31, 2017 (unaudited)
agree to higher fees than it would in the case of
unaffiliated providers. BBH acting in its capacity as the Fund’s administrator is the primary valuation agent of the Fund. BBH values securities
and assets in the Fund according to the Fund’s valuation policies. Because the Investment Adviser and BBH’s advisory and administrative fees
are calculated by reference to a Fund’s net assets, BBH and its affiliates may have an incentive to seek to overvalue certain
assets.
BBH LIMITED DURATION FUND
CONFLICTS OF INTEREST (continued)
October 31, 2017 (unaudited)
benefits, of economies of scale or price discounts in
connection with products and services that may be provided to the Fund and to such other BBH client accounts. To the extent that BBH uses soft dollars,
it will not have to pay for those products and services itself.
|
|
BBH LIMITED DURATION FUND
CONFLICTS OF INTEREST (continued)
October 31, 2017 (unaudited)
BBH LIMITED DURATION FUND
ADDITIONAL FEDERAL TAX INFORMATION
October 31, 2017 (unaudited)
|
|
TRUSTEES AND OFFICERS OF BBH LIMITED DURATION
FUND
(unaudited)
| Name
and Birth Year |
Position(s) Held with the Trust |
|
Term of Office and Length of Time Served# |
|
Principal
Occupation(s) During Past 5 Years |
|
Number of Portfolios in Fund Complex Overseen by Trusteeˆ |
|
Other Public Company or Investment Company Directorships held by Trustee During Past 5 Years |
|
Independent Trustees
|
||||||||||
H. Whitney Wagner Birth Year: 1956 |
Chairman of the Board and Trustee |
Chairman Since 2014; Trustee Since 2007 and 2006-2007 with the Predecessor Trust |
President, Clear Brook Advisors, a registered investment adviser. |
6 |
None. |
|||||
Andrew S. Frazier Birth Year: 1948 |
Trustee |
Since 2010 |
Consultant to Western World Insurance Group, Inc. (“WWIG”) (January 2010 to January 2012). |
6 |
Director of WWIG. |
|||||
Mark M. Collins Birth Year: 1956 |
Trustee |
Since 2011 |
Partner of Brown Investment Advisory Incorporated, a registered investment adviser. |
6 |
Chairman of Dillon Trust Company. |
|||||
John M. Tesoro Birth Year: 1952 |
Trustee |
Since 2014 |
Partner, Certified Public Accountant, KPMG LLP (retired in September 2012). |
6 |
Trustee, Bridge Builder Trust (8 Funds) Director; Teton Advisors, Inc. (a registered investment adviser). |
|||||
TRUSTEES AND OFFICERS OF BBH LIMITED DURATION
FUND
(unaudited)
| Name,
Address and Birth Year |
Position(s) Held with the Trust |
|
Term
of Office and Length of Time Served# |
|
Principal
Occupation(s) During Past 5 Years |
|
Number
of Portfolios in Fund Complex Overseen by Trusteeˆ |
|
Other
Public Company or Investment Company Directorships held by Trustee During Past 5 Years |
|
Interested Trustees |
||||||||||
Susan C. Livingston+ 50 Post Office Square Boston, MA 02110 Birth Year: 1957 |
Trustee |
Since 2011 |
Partner (since 1998) and Senior Client Advocate (since 2010) for BBH&Co.; Director of BBH Luxembourg S.C.A. (since
1992). |
6 |
None. |
|||||
John A. Gehret+ 140 Broadway New York, NY 10005 Birth Year: 1959 |
Trustee |
Since 2011 |
Limited Partner of BBH&Co. (2012-present); Director of BBH Luxembourg S.C.A. (since 2012); Director of BBH Trust Company (Cayman)
Ltd. (since 2012). |
6 |
None. |
|
|
TRUSTEES AND OFFICERS OF BBH LIMITED DURATION
FUND
(unaudited)
| Name, Address and Birth Year |
Position(s) Held with the Trust |
|
Term of Office and Length of Time Served# |
|
Principal
Occupation(s) During Past 5 Years |
|
Officers |
||||||
Jean-Pierre Paquin 140 Broadway New York, NY 10005 Birth Year: 1973 |
President and Principal Executive Officer |
Since 2016 |
Partner of BBH&Co. since 2015; joined BBH&Co. in 1996. |
|||
Daniel Greifenkamp 140 Broadway New York, NY 10005 Birth Year: 1969 |
Vice
President |
Since 2016 |
Managing Director of BBH&Co. since 2014; joined BBH&Co. in 2011. |
|||
Charles H. Schreiber 140 Broadway New York, NY 10005 Birth Year: 1957 |
Treasurer and Principal Financial Officer |
Since 2007 2006-2007 with the Predecessor Trust |
Senior Vice President of BBH&Co. since 2001; joined BBH&Co. in 1999. |
|||
Paul F. Gallagher 140 Broadway New York, NY 10005 Birth Year: 1959 |
Chief Compliance Officer (“CCO”) |
Since 2015 |
Senior Vice President of BBH&Co. since September 2015; Executive Director, Counsel, Morgan Stanley Smith Barney LLC
(2009-September 2015). |
|||
Keith M. Kelley 140 Broadway New York, NY 10005 Birth Year: 1983 |
Anti-Money Laundering Officer (“AMLO”) |
Since 2016 |
Vice President of BBH&Co. since February 2016; joined BBH&Co. in 2016; Director, Legal and Compliance, Morgan Stanley Smith
Barney LLC (2014-February 2016); Compliance Manager, State Street Corporation (2013-2014); Associate, J.P. Morgan Chase & Co.
(2011-2013). |
TRUSTEES AND OFFICERS OF BBH LIMITED DURATION
FUND
(unaudited)
| Name,
Address and Birth Year |
Position(s) Held with the Trust |
|
Term of Office and Length of Time Served# |
|
Principal
Occupation(s) During Past 5 Years | |
Suzan M. Barron 50 Post Office Square Boston, MA 02110 Birth Year: 1964 |
Secretary |
Since 2009 |
Senior Vice President and Senior Investor Services Counsel, BBH&Co. since 2005. |
|||
Rowena Rothman 140 Broadway New York, NY 10005 Birth Year: 1967 |
Assistant Treasurer |
Since 2011 |
Vice President of BBH&Co. since 2009. |
# |
All officers of the Trust hold office for one year and until their respective successors are chosen and qualified (subject to the ability of the Trustees to remove any officer in accordance with the Trust’s By-laws). Mr. Wagner previously served on the Board of Trustees of the Predecessor Trust. |
+ |
Ms. Livingston and Mr. Gehret are “interested persons” of the Trust as defined in the 1940 Act because of their positions as Partner and Limited Partner of BBH&Co., respectively. |
ˆ |
The Fund Complex consists of the Trust, which has six series, and each is counted as one “Portfolio” for purposes of this table. |
|
|
Administrator Brown Brothers Harriman & Co. 140 Broadway New York, NY 10005 Distributor ALPS Distributors, Inc. 1290 Broadway, Suite 1100 Denver, CO 80203 Shareholder Servicing Agent Brown Brothers Harriman & Co. 140 Broadway New York, NY 10005 1-800-575-1265 |
Investment Adviser Brown Brothers Harriman Mutual Fund Advisory Department 140 Broadway New York, NY 10005 |
By telephone: |
Call
1-800-575-1265 |
By E-mail send your request to: |
bbhfunds@bbh.com |
On the internet: |
www.bbhfunds.com |
BBH INTERMEDIATE MUNICIPAL BOND FUND
MANAGEMENT’S DISCUSSION OF FUND PERFORMANCE
October 31, 2017
BBH INTERMEDIATE MUNICIPAL BOND FUND
MANAGEMENT’S DISCUSSION OF FUND PERFORMANCE (continued)
October 31, 2017
strong protection from call risk. Owning a combination
of floaters and zeros has allowed us to largely avoid the most expensive segment of the municipal yield curve — 1 to 5-year maturities. This
positioning helps generate a yield advantage for the Fund.
| 1 | Barclays Municipal Bond 1-15 Year Blend (1-17) Index is a sub-index of the Barclays Capital Municipal Bond Index, a rules-based market value-weighted index of bonds with maturities of one year to 17 years engineered for the tax exempt bond market. One cannot invest directly in an index. |
| 2 | One “basis point” or ”bp” is 1/100th of a percent (0.01% or 0.0001). |
|
|
BBH INTERMEDIATE MUNICIPAL BOND FUND
MANAGEMENT’S DISCUSSION OF FUND PERFORMANCE (continued)
October 31, 2017
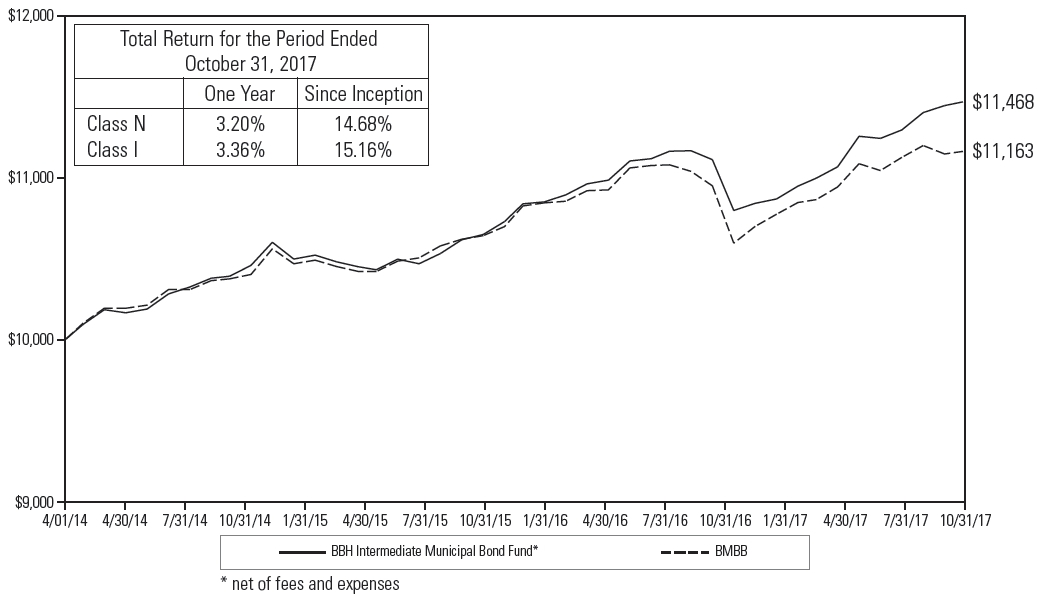
|
| 1 | The Fund’s performance assumes the reinvestment of all dividends and distributions. The Barclays Municipal Bond 1-15 Year Blend (1-17) Index (“BMBB”) has been adjusted to reflect reinvestment of dividends on securities in the index. The BMBB is not adjusted to reflect sales charges, expenses or other fees that the Securities and Exchange Commission requires to be reflected in the Fund’s performance. The index is unmanaged. Investments cannot be made in the index. |
BBH INTERMEDIATE MUNICIPAL BOND FUND
REPORT OF INDEPENDENT REGISTERED PUBLIC ACCOUNTING FIRM
BBH Intermediate Municipal Bond Fund:
December 22,
2017
|
|
BBH INTERMEDIATE MUNICIPAL BOND FUND
PORTFOLIO ALLOCATION
October 31, 2017
| U.S. $ Value |
Percent of Net Assets |
|||||||||
Municipal Bonds |
$ | 86,614,945 | 99.0 | % | ||||||
Cash
and Other Assets in Excess of Liabilities |
874,913 | 1.0 | ||||||||
NET ASSETS |
$ | 87,489,858 |
100.0 | % | ||||||
| U.S. $ Value |
Percent of Total Investments |
|||||||||
AAA
|
$ | 17,724,885 | 20.5 | % | ||||||
AA
|
27,035,610 | 31.2 | ||||||||
A
|
35,684,240 | 41.2 | ||||||||
BBB
|
6,170,210 | 7.1 | ||||||||
TOTAL INVESTMENTS |
$ | 86,614,945 | 100.0 | % | ||||||
The accompanying notes are an integral part of these
financial statements.
BBH INTERMEDIATE MUNICIPAL BOND FUND
PORTFOLIO OF INVESTMENTS
October 31, 2017
| Principal Amount |
Maturity Date |
Interest Rate |
Value |
|||||||||||||
MUNICIPAL BONDS (99.0%) |
||||||||||||||||
Arizona (0.7%) |
||||||||||||||||
| $ 475,000 | Salt Verde Financial Corp., Revenue Bonds |
12/01/19 | 5.250 | % | $ | 510,535 | ||||||||||
| 55,000 | Salt Verde Financial Corp., Revenue Bonds |
12/01/22 | 5.250 | 63,306 | ||||||||||||
Total Arizona |
573,841 | |||||||||||||||
California (12.7%) |
||||||||||||||||
| 1,000,000 | Anaheim City School District, General Obligation Bonds, NPFG1 |
08/01/26 | 0.000 | 806,060 | ||||||||||||
| 2,000,000 | Anaheim City School District, General Obligation Bonds, AGM, NPFG1 |
08/01/29 | 0.000 | 1,421,120 | ||||||||||||
| 750,000 | California Pollution Control Financing Authority, Revenue Bonds2,3 |
11/01/40 | 3.125 | 779,385 | ||||||||||||
| 1,000,000 | California Statewide Communities Development Authority, Revenue Bonds2,3 |
11/01/33 | 2.625 | 1,026,930 | ||||||||||||
| 1,000,000 | Golden State Tobacco Securitization Corp., Revenue Bonds, AGM1 |
06/01/25 | 0.000 | 840,840 | ||||||||||||
| 1,100,000 | La Mesa-Spring Valley School District, General Obligation Bonds, NPFG1 |
08/01/26 | 0.000 | 876,766 | ||||||||||||
| 25,000 | Long Beach Bond Finance Authority, Revenue Bonds |
11/15/19 | 5.250 | 26,805 | ||||||||||||
| 725,000 | Long Beach Bond Finance Authority, Revenue Bonds |
11/15/22 | 5.250 | 834,344 | ||||||||||||
| 30,000 | Long Beach Bond Finance Authority, Revenue Bonds (3-Month USD-LIBOR + 1.450%)2 |
11/15/27 | 2.331 | 28,673 | ||||||||||||
| 500,000 | Monterey Peninsula Community College District, General Obligation Bonds1 |
08/01/26 | 0.000 | 409,170 | ||||||||||||
| 1,000,000 | Santa Ana Unified School District, General Obligation Bonds, NPFG1 |
08/01/24 | 0.000 | 862,580 | ||||||||||||
| 180,000 | State of California, General Obligation Bonds (SIFMA Municipal Swap Index Yield + 1.150%)2 |
05/01/20 | 2.070 | 182,808 | ||||||||||||
The accompanying notes are an integral part of these
financial statements.
|
|
BBH INTERMEDIATE MUNICIPAL BOND FUND
PORTFOLIO OF INVESTMENTS (continued)
October 31, 2017
| Principal Amount |
Maturity Date |
Interest Rate |
Value |
|||||||||||||
MUNICIPAL BONDS (continued) |
||||||||||||||||
California (continued) |
||||||||||||||||
| $ 1,000,000 | Ukiah Unified School District, General Obligation Bonds, NPFG1 |
08/01/23 | 0.000 | % | $ | 891,420 | ||||||||||
| 1,000,000 | Ukiah Unified School District, General Obligation Bonds, NPFG1 |
08/01/24 | 0.000 | 862,180 | ||||||||||||
| 590,000 | Ukiah Unified School District, General Obligation Bonds, NPFG1 |
08/01/25 | 0.000 | 489,311 | ||||||||||||
| 1,120,000 | Whittier Union High School District, General Obligation Bonds1 |
08/01/29 | 0.000 | 799,523 | ||||||||||||
Total California |
11,137,915 | |||||||||||||||
Connecticut (0.8%) |
||||||||||||||||
| 725,000 | State of Connecticut, General Obligation Bonds (SIFMA Municipal Swap Index Yield + 0.990%)2 |
03/01/25 | 1.910 | 720,693 | ||||||||||||
Total Connecticut |
720,693 | |||||||||||||||
Florida (3.0%) |
||||||||||||||||
| 1,005,000 | County of Broward Airport System, Revenue Bonds |
10/01/25 | 5.000 | 1,139,378 | ||||||||||||
| 1,000,000 | County of Hillsborough Solid Waste & Resource Recovery, Revenue Bonds |
09/01/24 | 5.000 | 1,173,880 | ||||||||||||
| 35,000 | Hillsborough County Aviation Authority, Revenue Bonds |
10/01/25 | 5.000 | 40,217 | ||||||||||||
| 10,000 | Hillsborough County Aviation Authority, Revenue Bonds |
10/01/26 | 5.000 | 11,491 | ||||||||||||
| 250,000 | Pinellas County Health Facilities Authority, Revenue Bonds, NPFG2,3 |
11/15/23 | 1.803 | 236,257 | ||||||||||||
Total Florida |
2,601,223 | |||||||||||||||
Georgia (4.5%) |
||||||||||||||||
| 1,500,000 | Bartow County Development Authority, Revenue Bonds2,3 |
09/01/29 | 2.050 | 1,497,675 | ||||||||||||
| 2,000,000 | State of Georgia, General Obligation Bonds |
12/01/24 | 5.000 | 2,434,040 | ||||||||||||
Total Georgia |
3,931,715 | |||||||||||||||
The accompanying notes are an integral part of these
financial statements.
BBH INTERMEDIATE MUNICIPAL BOND FUND
PORTFOLIO OF INVESTMENTS (continued)
October 31, 2017
| Principal Amount |
Maturity Date |
Interest Rate |
Value |
|||||||||||||
MUNICIPAL BONDS (continued) |
||||||||||||||||
Illinois (2.1%) |
||||||||||||||||
| $ 75,000 | Chicago Park District, General Obligation Bonds |
01/01/19 | 3.000 | % | $ | 76,031 | ||||||||||
| 360,000 | Chicago Park District, General Obligation Bonds |
01/01/19 | 4.000 | 369,076 | ||||||||||||
| 100,000 | Chicago Park District, General Obligation Bonds |
01/01/19 | 5.000 | 103,667 | ||||||||||||
| 170,000 | Chicago Transit Authority, Revenue Bonds, AGC |
06/01/19 | 5.250 | 174,170 | ||||||||||||
| 320,000 | Chicago Transit Authority, Revenue Bonds, AGC |
06/01/22 | 5.000 | 333,613 | ||||||||||||
| 300,000 | Chicago Transit Authority, Revenue Bonds, AGC |
06/01/23 | 5.250 | 307,359 | ||||||||||||
| 165,000 | Chicago Transit Authority, Revenue Bonds, AGC |
06/01/24 | 5.250 | 169,047 | ||||||||||||
| 300,000 | Illinois Finance Authority, Revenue Bonds3 |
11/07/17 | 0.910 | 300,000 | ||||||||||||
Total Illinois |
1,832,963 | |||||||||||||||
Indiana (1.8%) |
||||||||||||||||
| 1,520,000 | Indiana University, Revenue Bonds |
06/01/29 | 2.750 | 1,529,257 | ||||||||||||
Total Indiana |
1,529,257 | |||||||||||||||
Kansas (0.4%) |
||||||||||||||||
| 200,000 | City of La Cygne, Revenue Bonds, NPFG2,3 |
04/15/27 | 1.880 | 179,320 | ||||||||||||
| 100,000 | City of St. Marys, Revenue Bonds, NPFG2,3 |
04/15/32 | 1.880 | 89,471 | ||||||||||||
| 100,000 | City of Wamego, Revenue Bonds, NPFG2,3 |
04/15/32 | 1.840 | 88,585 | ||||||||||||
Total Kansas |
357,376 | |||||||||||||||
Maryland (1.4%) |
||||||||||||||||
| 1,000,000 | County of Howard, General Obligation Bonds |
02/15/27 | 5.000 | 1,253,060 | ||||||||||||
Total Maryland |
1,253,060 | |||||||||||||||
The accompanying notes are an integral part of these
financial statements.
|
|
BBH INTERMEDIATE MUNICIPAL BOND FUND
PORTFOLIO OF INVESTMENTS (continued)
October 31, 2017
| Principal Amount |
Maturity Date |
Interest Rate |
Value | |||||||||||||
MUNICIPAL BONDS (continued) |
||||||||||||||||
Massachusetts (3.9%) |
||||||||||||||||
| $ 300,000 | Commonwealth of Massachusetts, General Obligation Bonds, AGM2,3 |
11/01/19 | 2.608 | % | $ | 302,760 | ||||||||||
| 1,500,000 | Commonwealth of Massachusetts, Revenue Bonds, AGM2,3 |
06/01/22 | 2.576 | 1,569,780 | ||||||||||||
| 500,000 | Massachusetts Clean Water Trust, Revenue Bonds2,3 |
08/01/23 | 3.255 | 505,530 | ||||||||||||
| 1,000,000 | Massachusetts Housing Finance Agency, Revenue Bonds |
12/01/21 | 2.500 | 1,019,420 | ||||||||||||
Total Massachusetts |
3,397,490 | |||||||||||||||
Michigan (7.1%) |
||||||||||||||||
| 220,000 | Detroit City School District, General Obligation Bonds, FGIC |
05/01/20 | 6.000 | 243,091 | ||||||||||||
| 350,000 | Detroit City School District, General Obligation Bonds |
05/01/23 | 5.000 | 398,013 | ||||||||||||
| 95,000 | Detroit City School District, General Obligation Bonds, BHAC, FGIC |
05/01/25 | 5.250 | 107,939 | ||||||||||||
| 90,000 | Detroit City School District, General Obligation Bonds, AGM |
05/01/27 | 5.250 | 108,194 | ||||||||||||
| 345,000 | Detroit City School District, General Obligation Bonds, AGM |
05/01/29 | 6.000 | 423,743 | ||||||||||||
| 1,510,000 | Detroit City School District, General Obligation Bonds, AGM |
05/01/30 | 5.250 | 1,856,590 | ||||||||||||
| 1,000,000 | Detroit City School District, General Obligation Bonds, AGM |
05/01/32 | 5.250 | 1,244,130 | ||||||||||||
| 105,000 | Michigan Finance Authority, Revenue Bonds, |
05/01/19 | 5.000 | 110,919 | ||||||||||||
| 1,425,000 | New Haven Community Schools, General Obligation Bonds |
05/01/26 | 3.000 | 1,492,602 | ||||||||||||
| 200,000 | University of Michigan, Revenue Bonds4 |
11/01/17 | 0.800 | 200,000 | ||||||||||||
Total Michigan |
6,185,221 | |||||||||||||||
The accompanying notes are an integral part of these
financial statements.
BBH INTERMEDIATE MUNICIPAL BOND FUND
PORTFOLIO OF INVESTMENTS (continued)
October 31, 2017
| Principal Amount |
Maturity Date |
Interest Rate |
Value | |||||||||||||
MUNICIPAL BONDS (continued) |
||||||||||||||||
Minnesota (0.1%) |
||||||||||||||||
| $ 100,000 | City of Minneapolis, Revenue Bonds4 |
11/07/17 | 0.900 | % | $ | 100,000 | ||||||||||
Total Minnesota |
100,000 | |||||||||||||||
Missouri (1.0%) |
||||||||||||||||
| 310,000 | Health & Educational Facilities Authority of the State of Missouri, Revenue Bonds, AMBAC2,3 |
06/01/31 | 1.657 | 285,693 | ||||||||||||
| 600,000 | Health & Educational Facilities Authority of the State of Missouri, Revenue Bonds, AMBAC2,3 |
06/01/31 | 1.659 | 552,671 | ||||||||||||
Total Missouri |
838,364 | |||||||||||||||
Nebraska (0.5%) |
||||||||||||||||
| 355,000 | Central Plains Energy Project, Revenue Bonds |
09/01/27 | 5.000 | 399,091 | ||||||||||||
Total Nebraska |
399,091 | |||||||||||||||
New Hampshire (0.7%) |
||||||||||||||||
| 600,000 | New Hampshire Health & Education Facilities Authority Act, Revenue Bonds4 |
11/01/17 | 0.900 | 600,000 | ||||||||||||
Total New Hampshire |
600,000 | |||||||||||||||
New Jersey (17.4%) |
||||||||||||||||
| 1,500,000 | New Jersey Economic Development Authority, Revenue Bonds (SIFMA Municipal Swap Index Yield + 1.550%)2 |
09/01/27 | 2.470 | 1,465,455 | ||||||||||||
| 1,315,000 | New Jersey Transit Corp., Revenue Bonds |
09/15/19 | 5.000 | 1,383,525 | ||||||||||||
| 1,125,000 | New Jersey Transit Corp., Revenue Bonds |
09/15/20 | 5.000 | 1,216,339 | ||||||||||||
| 460,000 | New Jersey Transit Corp., Revenue Bonds |
09/15/21 | 5.000 | 504,468 | ||||||||||||
| 1,150,000 | New Jersey Transportation Trust Fund Authority, Revenue Bonds1 |
12/15/26 | 0.000 | 810,025 | ||||||||||||
The accompanying notes are an integral part of these
financial statements.
|
|
BBH INTERMEDIATE MUNICIPAL BOND FUND
PORTFOLIO OF INVESTMENTS (continued)
October 31, 2017
| Principal Amount |
Maturity Date |
Interest Rate |
Value | |||||||||||||
MUNICIPAL BONDS (continued) |
||||||||||||||||
New Jersey (continued) |
||||||||||||||||
| $ 1,850,000 | New Jersey Transportation Trust Fund Authority, Revenue Bonds1 |
12/15/30 | 0.000 | % | $ | 1,068,245 | ||||||||||
| 2,500,000 | New Jersey Turnpike Authority, Revenue Bonds (1-Month USD- LIBOR + 0.750%)2 |
01/01/30 | 1.618 | 2,500,575 | ||||||||||||
| 8,150,000 | Tobacco Settlement Financing Corp., Revenue Bonds1 |
06/01/41 | 0.000 | 2,295,937 | ||||||||||||
| 14,365,000 | Tobacco Settlement Financing Corp., Revenue Bonds1 |
06/01/41 | 0.000 | 3,958,994 | ||||||||||||
Total New Jersey |
15,203,563 | |||||||||||||||
New York (14.5%) |
||||||||||||||||
| 1,600,000 | City of New York, General Obligation Bonds4 |
11/01/17 | 0.900 | 1,600,000 | ||||||||||||
| 200,000 | New York City Water & Sewer System, Revenue Bonds4 |
11/01/17 | 0.880 | 200,000 | ||||||||||||
| 300,000 | New York City Water & Sewer System, Revenue Bonds4 |
11/01/17 | 0.880 | 300,000 | ||||||||||||
| 400,000 | New York City Water & Sewer System, Revenue Bonds4 |
11/01/17 | 0.900 | 400,000 | ||||||||||||
| 1,500,000 | New York City Water & Sewer System, Revenue Bonds4 |
11/01/17 | 0.900 | 1,500,000 | ||||||||||||
| 1,000,000 | New York State Dormitory Authority, Revenue Bonds |
02/15/25 | 5.000 | 1,213,770 | ||||||||||||
| 120,000 | New York State Energy Research & Development Authority, Revenue Bonds, AMBAC2,3 |
12/01/23 | 3.104 | 117,530 | ||||||||||||
| 700,000 | New York State Energy Research & Development Authority, Revenue Bonds, FGIC2,3 |
06/01/25 | 3.104 | 665,503 | ||||||||||||
| 270,000 | New York State Energy Research & Development Authority, Revenue Bonds, AMBAC2,3 |
12/01/25 | 3.030 | 265,639 | ||||||||||||
The accompanying notes are an integral part of these
financial statements.
BBH INTERMEDIATE MUNICIPAL BOND FUND
PORTFOLIO OF INVESTMENTS (continued)
October 31, 2017
| Principal Amount |
Maturity Date |
Interest Rate |
Value | |||||||||||||
MUNICIPAL BONDS (continued) |
||||||||||||||||
New York (continued) |
||||||||||||||||
| $ 305,000 | New York State Energy Research & Development Authority, Revenue Bonds, AMBAC2,3 |
12/01/26 | 3.097 | % | $ | 299,962 | ||||||||||
| 600,000 | New York State Energy Research & Development Authority, Revenue Bonds, AMBAC2,3 |
03/01/27 | 3.050 | 599,294 | ||||||||||||
| 1,890,000 | New York State Energy Research & Development Authority, Revenue Bonds, AMBAC2,3 |
07/01/27 | 3.100 | 1,850,423 | ||||||||||||
| 110,000 | New York State Energy Research & Development Authority, Revenue Bonds, AMBAC2,3 |
07/01/27 | 3.097 | 107,697 | ||||||||||||
| 2,000,000 | New York State Energy Research & Development Authority, Revenue Bonds, AMBAC2,3 |
05/01/34 | 1.593 | 1,893,702 | ||||||||||||
| 490,000 | New York State Energy Research & Development Authority, Revenue Bonds, XLCA2,3 |
07/01/29 | 3.104 | 484,580 | ||||||||||||
| 1,000,000 | Port Authority of New York & New Jersey, Revenue Bonds |
10/15/27 | 5.000 | 1,218,710 | ||||||||||||
Total New York |
12,716,810 | |||||||||||||||
North Carolina (1.9%) |
||||||||||||||||
| 1,405,000 | County of Mecklenburg, General Obligation Bonds |
04/01/24 | 5.000 | 1,691,269 | ||||||||||||
Total North Carolina |
1,691,269 | |||||||||||||||
Ohio (0.3%) |
||||||||||||||||
| 100,000 | County of Montgomery, Revenue Bonds4 |
11/01/17 | 0.900 | 100,000 | ||||||||||||
| 200,000 | Ohio Higher Educational Facility Commission, Revenue Bonds4 |
11/01/17 | 0.900 | 200,000 | ||||||||||||
Total Ohio |
300,000 | |||||||||||||||
The accompanying notes are an integral part of these
financial statements.
|
|
BBH INTERMEDIATE MUNICIPAL BOND FUND
PORTFOLIO OF INVESTMENTS (continued)
October 31, 2017
| Principal Amount |
Maturity Date |
Interest Rate |
Value | |||||||||||||
MUNICIPAL BONDS (continued) |
||||||||||||||||
Pennsylvania (5.1%) |
||||||||||||||||
| $ 150,000 | Allegheny County Airport Authority, Revenue Bonds, FGIC |
01/01/22 | 5.000 | % | $ | 168,144 | ||||||||||
| 50,000 | Allegheny County Airport Authority, Revenue Bonds, FGIC |
01/01/23 | 5.000 | 57,007 | ||||||||||||
| 300,000 | Geisinger Authority, Revenue Bonds4 |
11/01/17 | 0.890 | 300,000 | ||||||||||||
| 100,000 | Hospitals & Higher Education Facilities Authority of Philadelphia, Revenue Bonds4 |
11/01/17 | 0.900 | 100,000 | ||||||||||||
| 255,000 | School District of Philadelphia, General Obligation Bonds, AGM, FGIC |
06/01/24 | 5.000 | 292,546 | ||||||||||||
| 1,100,000 | School District of Philadelphia, General Obligation Bonds |
09/01/24 | 5.000 | 1,266,441 | ||||||||||||
| 1,000,000 | School District of Philadelphia, General Obligation Bonds |
09/01/27 | 5.000 | 1,154,940 | ||||||||||||
| 1,000,000 | State Public School Building Authority, Revenue Bonds |
06/01/32 | 5.000 | 1,129,910 | ||||||||||||
Total Pennsylvania |
4,468,988 | |||||||||||||||
South Dakota (0.5%) |
||||||||||||||||
| 430,000 | Educational Enhancement Funding Corp., Revenue Bonds |
06/01/25 | 5.000 | 476,909 | ||||||||||||
Total South Dakota |
476,909 | |||||||||||||||
Texas (11.0%) |
||||||||||||||||
| 1,000,000 | Allen Independent School District, General Obligation Bonds |
02/15/25 | 5.000 | 1,215,290 | ||||||||||||
| 325,000 | City of Houston Airport System, Revenue Bonds, AGM2,3 |
07/01/30 | 2.421 | 306,652 | ||||||||||||
| 750,000 | City of Houston Airport System, Revenue Bonds, AGM2,3 |
07/01/30 | 2.461 | 707,734 | ||||||||||||
| 475,000 | City of Houston Airport System, Revenue Bonds, XLCA2,3 |
07/01/32 | 2.480 | 447,037 | ||||||||||||
| 525,000 | City of Houston Airport System, Revenue Bonds, XLCA2,3 |
07/01/32 | 2.480 | 494,046 | ||||||||||||
The accompanying notes are an integral part of these
financial statements.
BBH INTERMEDIATE MUNICIPAL BOND FUND
PORTFOLIO OF INVESTMENTS (continued)
October 31, 2017
| Principal Amount |
Maturity Date |
Interest Rate |
Value | |||||||||||||
MUNICIPAL BONDS (continued) |
||||||||||||||||
Texas (continued) |
||||||||||||||||
| $ 725,000 | City of Houston Airport System, Revenue Bonds, XLCA2,3 |
07/01/32 | 2.485 | % | $ | 682,390 | ||||||||||
| 1,000,000 | Dallas Love Field, Revenue Bonds |
11/01/25 | 5.000 | 1,187,370 | ||||||||||||
| 1,000,000 | Houston Independent School District, General Obligation Bonds |
02/15/25 | 5.000 | 1,215,290 | ||||||||||||
| 2,000,000 | State of Texas, General Obligation Bonds |
04/01/25 | 5.000 | 2,433,000 | ||||||||||||
| 380,000 | Texas Municipal Gas Acquisition & Supply Corp. I, Revenue Bonds |
12/15/19 | 5.250 | 408,371 | ||||||||||||
| 95,000 | Texas Municipal Gas Acquisition & Supply Corp. I, Revenue Bonds |
12/15/20 | 5.250 | 104,715 | ||||||||||||
| 400,000 | Texas Municipal Gas Acquisition & Supply Corp. I, Revenue Bonds |
12/15/21 | 5.250 | 450,644 | ||||||||||||
Total Texas |
9,652,539 | |||||||||||||||
Virginia (2.8%) |
||||||||||||||||
| 2,000,000 | County of Arlington, General Obligation Bonds |
08/15/25 | 5.000 | 2,464,600 | ||||||||||||
Total Virginia |
2,464,600 | |||||||||||||||
Washington (1.2%) |
||||||||||||||||
| 500,000 | Port of Seattle, Revenue Bonds |
06/01/23 | 5.000 | 573,700 | ||||||||||||
| 425,000 | Port of Seattle, Revenue Bonds |
06/01/27 | 3.750 | 442,591 | ||||||||||||
Total Washington |
1,016,291 | |||||||||||||||
The accompanying notes are an integral part of these
financial statements.
|
|
BBH INTERMEDIATE MUNICIPAL BOND FUND
PORTFOLIO OF INVESTMENTS (continued)
October 31, 2017
| Principal Amount |
Maturity Date |
Interest Rate |
Value | |||||||||||||||
MUNICIPAL BONDS (continued) |
||||||||||||||||||
Wisconsin (3.6%) |
||||||||||||||||||
| $ 280,000 | County of Milwaukee Airport, Revenue Bonds |
12/01/28 | 5.250 | % | $ | 324,377 | ||||||||||||
| 1,000,000 | Public Finance Authority, Revenue Bonds2,3 |
07/01/29 | 2.000 | 1,009,680 | ||||||||||||||
| 1,500,000 | State of Wisconsin, General Obligation Bonds |
05/01/25 | 5.000 | 1,831,710 | ||||||||||||||
Total Wisconsin |
3,165,767 | |||||||||||||||||
Total Municipal Bonds (Identified cost $84,503,902) |
86,614,945 | |||||||||||||||||
| TOTAL INVESTMENTS (Identified cost $84,503,902)5 | 99.0 | % | $ | 86,614,945 | ||||||||||||||
| CASH AND OTHER ASSETS IN EXCESS OF LIABILITIES | 1.0 | % | 874,913 | |||||||||||||||
| NET ASSETS | 100.0 | % | $ | 87,489,858 | ||||||||||||||
| 1 | Security issued with zero coupon. Income is recognized through accretion of discount. |
| 2 | Variable rate instrument. Interest rates change on specific dates (such as coupon or interest payment date). The yield shown represents the October 31, 2017 coupon or interest rate. |
| 3 | This variable rate security is based on a predetermined schedule and the rate at year end also represents the reference rate at year end. |
| 4 | Variable rate demand note. The maturity date reflects the demand repayment dates. Interest rates change on specific dates (such as coupon or interest payment date). The yield shown represents the coupon or interest rate as of October 31, 2017. |
| 5 | The aggregate cost for federal income tax purposes is $84,503,902, the aggregate gross unrealized appreciation is $2,173,214, and the aggregate gross unrealized depreciation is $62,171, resulting in net unrealized appreciation of $2,111,043. |
The accompanying notes are an integral part of these
financial statements.
BBH INTERMEDIATE MUNICIPAL BOND FUND
PORTFOLIO OF INVESTMENTS (continued)
October 31, 2017
— |
Level 1 – unadjusted quoted prices in active markets for identical assets and liabilities. |
— |
Level 2 – significant other observable inputs (including quoted prices for similar assets and liabilities, interest rates, prepayment speeds, credit risk, etc.). |
— |
Level 3 – significant unobservable inputs (including the Fund’s own assumptions in determining the fair value of assets and liabilities). |
The accompanying notes are an integral part of these
financial statements.
|
|
BBH INTERMEDIATE MUNICIPAL BOND FUND
PORTFOLIO OF INVESTMENTS (continued)
October 31, 2017
| Investments, at value |
Unadjusted Quoted Prices in Active Markets for Identical Investments (Level 1)* |
Significant Other Observable Inputs (Level 2)* |
Significant Unobservable Inputs (Level 3)* |
Balance as of October 31, 2017 |
||||||||||||||
Municipal Bonds** |
$ | — | $ | 86,614,945 | $ | — | $ | 86,614,945 | ||||||||||
Investments, at value |
$ | — | $ | 86,614,945 | $ | — | $ | 86,614,945 | ||||||||||
* |
The Fund’s policy is to disclose transfers between levels based on valuations at the end of the reporting period. There were no transfers between Levels 1, 2 or 3 during the period ended October 31, 2017. |
** |
For geographical breakdown of municipal bond investments, refer to the Portfolio of Investments. |
The accompanying notes are an integral part of these
financial statements.
BBH INTERMEDIATE MUNICIPAL BOND FUND
STATEMENT OF ASSETS AND LIABILITIES
October 31, 2017
ASSETS: |
|||||||||
Investments in securities, at value (Identified cost $84,503,902) |
$ | 86,614,945 | |||||||
Cash |
371,050 | ||||||||
Receivables for: |
|||||||||
Interest |
589,069 | ||||||||
Shares sold |
19,468 | ||||||||
Investment advisory and administrative fee waiver reimbursement |
13,840 | ||||||||
Prepaid assets |
591 | ||||||||
Total Assets |
87,608,963 | ||||||||
LIABILITIES: |
|||||||||
Payables for: |
|||||||||
Professional fees |
54,159 | ||||||||
Investment advisory and administrative fees |
28,652 | ||||||||
Shares redeemed |
6,693 | ||||||||
Transfer agent fees |
5,394 | ||||||||
Custody and fund accounting fees |
5,115 | ||||||||
Distributor fees |
4,286 | ||||||||
Shareholder servicing fees |
2,580 | ||||||||
Board of Trustees’ fees |
354 | ||||||||
Accrued expenses and other liabilities |
11,872 | ||||||||
Total Liabilities |
119,105 | ||||||||
NET ASSETS |
$ | 87,489,858 | |||||||
Net
Assets Consist of: |
|||||||||
Paid-in capital |
$ | 84,573,333 | |||||||
Accumulated net realized gain on investments in securities |
805,482 | ||||||||
Net unrealized appreciation/(depreciation) on investments in securities |
2,111,043 | ||||||||
Net Assets |
$ | 87,489,858 | |||||||
NET ASSET VALUE AND OFFERING PRICE PER SHARE |
|||||||||
CLASS N SHARES |
|||||||||
($15,982,155 ÷ 1,524,419 shares outstanding) |
$10.48 | ||||||||
CLASS I SHARES |
|||||||||
($71,507,703 ÷ 6,828,103 shares outstanding) |
$10.47 | ||||||||
The accompanying notes are an integral part of these
financial statements.
|
|
BBH INTERMEDIATE MUNICIPAL BOND FUND
STATEMENT OF OPERATIONS
For the year ended October 31, 2017
NET INVESTMENT INCOME: |
||||||
Income: |
||||||
Interest |
$ | 2,443,517 | ||||
Other income |
122 | |||||
Total Income |
2,443,639 | |||||
Expenses: |
||||||
Investment advisory and administrative fees |
334,405 | |||||
Professional fees |
64,106 | |||||
Board of Trustees’ fees |
54,743 | |||||
Custody and fund accounting fees |
39,831 | |||||
Shareholder servicing fees |
39,101 | |||||
Registration fees |
34,070 | |||||
Transfer agent fees |
31,113 | |||||
Distributor fees |
17,636 | |||||
Miscellaneous expenses |
35,392 | |||||
Total Expenses |
650,397 | |||||
Investment advisory and administrative fee waiver |
(202,356 | ) | ||||
Expense offset arrangement |
(709 | ) | ||||
Net Expenses |
447,332 | |||||
Net Investment Income |
1,996,307 | |||||
NET REALIZED AND UNREALIZED GAIN/(LOSS): |
||||||
Net realized gain on investments in securities |
1,099,658 | |||||
Net change in unrealized appreciation/(depreciation) on investments in securities |
(534,966 | ) | ||||
Net Realized and Unrealized Gain |
564,692 | |||||
Net Increase in Net Assets Resulting from Operations |
$ | 2,560,999 |
The accompanying notes are an integral part of these
financial statements.
BBH INTERMEDIATE MUNICIPAL BOND FUND
STATEMENTS OF CHANGES IN NET ASSETS
| For the years ended October 31, |
||||||||||
| 2017 |
2016 |
|||||||||
INCREASE IN NET ASSETS: |
||||||||||
Operations: |
||||||||||
Net investment income |
$ | 1,996,307 | $ | 1,682,680 | ||||||
Net realized gain on investments in securities |
1,099,658 | 1,254,006 | ||||||||
Net change in unrealized appreciation/(depreciation) on investments in securities |
(534,966 | ) | 1,415,612 | |||||||
Net increase in net assets resulting from operations |
2,560,999 | 4,352,298 | ||||||||
Dividends and distributions declared: |
||||||||||
From net investment income: |
||||||||||
Class N |
(449,944 | ) | (421,806 | ) | ||||||
Class I |
(1,740,315 | ) | (1,260,733 | ) | ||||||
From net realized gains: |
||||||||||
Class N |
(307,076 | ) | (54,688 | ) | ||||||
Class I |
(842,969 | ) | (143,942 | ) | ||||||
Total dividends and distributions declared |
(3,340,304 | ) | (1,881,169 | ) | ||||||
Share transactions: |
||||||||||
Proceeds from sales of shares |
22,328,960 | * | 15,152,028 | |||||||
Net asset value of shares issued to shareholders for reinvestment of dividends and distributions |
1,394,699 | 720,752 | ||||||||
Proceeds from short-term redemption fees |
146 | 542 | ||||||||
Cost of shares redeemed |
(24,953,058 | )* | (20,695,368 | ) | ||||||
Net decrease in net assets resulting from share transactions |
(1,229,253 | ) | (4,822,046 | ) | ||||||
Total decrease in net assets |
(2,008,558 | ) | (2,350,917 | ) | ||||||
NET ASSETS: |
||||||||||
Beginning of year |
89,498,416 | 91,849,333 | ||||||||
End of year (including undistributed net investment income of $0 and $141, respectively) |
$ | 87,489,858 |
$ | 89,498,416 |
||||||
* |
Includes share exchanges. See Note 5 in Notes to Financial Statements. |
The accompanying notes are an integral part of these
financial statements.
|
|
BBH INTERMEDIATE MUNICIPAL BOND FUND
FINANCIAL HIGHLIGHTS
Selected per share data and ratios for a Class N share outstanding throughout each
period.
| For the period from April 1, 2014 (commencement of operations) to October 31, 2014 | ||||||||||||||||||
| For the years ended October 31, |
||||||||||||||||||
| 2017 |
2016 |
2015 |
||||||||||||||||
Net
asset value, beginning of period |
$ | 10.56 | $ | 10.29 | $ | 10.30 | $ | 10.00 | ||||||||||
Income from investment operations: |
||||||||||||||||||
Net investment income1 |
0.22 | 0.18 | 0.15 | 0.09 | ||||||||||||||
Net realized and unrealized gain |
0.11 | 0.29 | 0.08 | 0.29 | ||||||||||||||
Total income from investment operations |
0.33 | 0.47 | 0.23 | 0.38 | ||||||||||||||
Less dividends and distributions: |
||||||||||||||||||
From net investment income |
(0.26 | ) | (0.18 | ) | (0.16 | ) | (0.08 | ) | ||||||||||
From net realized gains |
(0.15 | ) | (0.02 | ) | (0.08 | ) | — | |||||||||||
Total dividends and distributions |
(0.41 | ) | (0.20 | ) | (0.24 | ) | (0.08 | ) | ||||||||||
Short-term redemption fees1 |
0.00 | 2 | 0.00 | 2 | 0.00 | 2 | — | |||||||||||
Net
asset value, end of period |
$ | 10.48 | $ | 10.56 | $ | 10.29 | $ | 10.30 | ||||||||||
Total return |
3.20 | % | 4.64 | % | 2.29 | % | 3.82 | %3 | ||||||||||
Ratios/Supplemental data: |
||||||||||||||||||
Net assets, end of period (in millions) |
$16 |
$23 |
$26 |
$1 |
||||||||||||||
Ratio of expenses to average net assets before reductions |
1.05 | % | 1.03 | % | 1.10 | % | 8.78 | % 4 | ||||||||||
Fee waiver |
0.40 | %5 | 0.38 | %5 | 0.45 | %5 | 8.13 | %4,5 | ||||||||||
Expense offset arrangement |
0.00 | %6 | 0.00 | %6 | 0.00 | %6 | 0.00 | %4,6 | ||||||||||
Ratio of expenses to average net assets after reductions |
0.65 | % | 0.65 | % | 0.65 | % | 0.65 | %4 | ||||||||||
Ratio of net investment income to average net assets |
2.16 | % | 1.73 | % | 1.43 | % | 1.43 | %4 | ||||||||||
Portfolio turnover rate |
125 | % | 77 | % | 142 | % | 91 | % | ||||||||||
Portfolio turnover rate7 |
64 | % | 40 | % | 83 | % | 56 | % | ||||||||||
| 1 | Calculated using average shares outstanding for the period. |
| 2 | Less than $0.01. |
| 3 | Not annualized. |
| 4 | Annualized with the exception of audit fees and registration fees. |
| 5 | The ratio of expenses to average net assets for the years ended October 31, 2017, 2016 and 2015 and the period ended October 31, 2014, reflect fees reduced as result of a contractual operating expense limitation of the share class of 0.65%. The agreement is effective beginning on April 1, 2014 and will terminate on March 1, 2018, unless it is renewed by all parties to the agreement. For the years ended October 31, 2017, 2016 and 2015 and the period from April 1, 2014 to October 31, 2014, the waived fees were $78,871, $92,199, $71,871 and $47,942, respectively. |
| 6 | Less than 0.01%. |
| 7 | The portfolio turnover rate excludes variable rate demand notes. |
The accompanying notes are an integral part of these
financial statements.
BBH INTERMEDIATE MUNICIPAL BOND FUND
FINANCIAL HIGHLIGHTS (continued)
Selected per share data and ratios for a Class I share outstanding throughout each
period.
| For the period from April 1, 2014 (commencement of operations) to October 31, 2014 | ||||||||||||||||||
| For the years ended October 31, |
||||||||||||||||||
| 2017 |
2016 |
2015 |
||||||||||||||||
Net
asset value, beginning of period |
$ | 10.55 | $ | 10.28 | $ | 10.30 | $ | 10.00 | ||||||||||
Income from investment operations: |
||||||||||||||||||
Net investment income1 |
0.25 | 0.20 | 0.18 | 0.09 | ||||||||||||||
Net realized and unrealized gain |
0.09 | 0.29 | 0.06 | 0.30 | ||||||||||||||
Total income from investment operations |
0.34 | 0.49 | 0.24 | 0.39 | ||||||||||||||
Less dividends and distributions: |
||||||||||||||||||
From net investment income |
(0.27 | ) | (0.20 | ) | (0.18 | ) | (0.09 | ) | ||||||||||
From net realized gains |
(0.15 | ) | (0.02 | ) | (0.08 | ) | — | |||||||||||
Total dividends and distributions |
(0.42 | ) | (0.22 | ) | (0.26 | ) | (0.09 | ) | ||||||||||
Short-term redemption fees1 |
0.00 | 2 | 0.00 | 2 | 0.00 | 2 | — | |||||||||||
Net
asset value, end of period |
$ | 10.47 | $ | 10.55 | $ | 10.28 | $ | 10.30 | ||||||||||
Total return |
3.36 | % | 4.80 | % | 2.33 | % | 3.89 | %3 | ||||||||||
Ratios/Supplemental data: |
||||||||||||||||||
Net assets, end of period (in millions) |
$71 |
$66 |
$66 |
$52 |
||||||||||||||
Ratio of expenses to average net assets before reductions |
0.69 | % | 0.68 | % | 0.78 | % | 0.88 | %4 | ||||||||||
Fee waiver |
0.19 | %5 | 0.18 | %5 | 0.28 | %5 | 0.38 | %4,5 | ||||||||||
Expense offset arrangement |
0.00 | %6 | 0.00 | %6 | 0.00 | %6 | 0.00 | %4,6 | ||||||||||
Ratio of expenses to average net assets after reductions |
0.50 | % | 0.50 | % | 0.50 | % | 0.50 | %4 | ||||||||||
Ratio of net investment income to average net assets |
2.46 | % | 1.88 | % | 1.72 | % | 1.49 | %4 | ||||||||||
Portfolio turnover rate |
125 | % | 77 | % | 142 | % | 91 | % | ||||||||||
Portfolio turnover rate7 |
64 | % | 40 | % | 83 | % | 56 | % | ||||||||||
| 1 | Calculated using average shares outstanding for the period. |
| 2 | Less than $0.01. |
| 3 | Not annualized. |
| 4 | Annualized with the exception of audit fees and registration fees. |
| 5 | The ratio of expenses to average net assets for the years ended October 31, 2017, 2016 and 2015 and the period ended October 31, 2014, reflect fees reduced as result of a contractual operating expense limitation of the share class of 0.50%. The agreement is effective for period beginning on April 1, 2014 and will terminate on March 1, 2018, unless it is renewed by all parties to the agreement. For the years ended October 31, 2017, 2016 and 2015 and the period from April 1, 2014 to October 31, 2014, the waived fees were $123,485, $121,168, $163,323 and $137,383, respectively. |
| 6 | Less than 0.01%. |
| 7 | The portfolio turnover rate excludes variable rate demand notes. |
The accompanying notes are an integral part of these
financial statements.
|
|
BBH INTERMEDIATE MUNICIPAL BOND FUND
NOTES TO FINANCIAL STATEMENTS
October 31, 2017
1. |
Organization. The Fund is a separate, diversified series of BBH Trust (the “Trust”), which is registered under the Investment Company Act of 1940, as amended (the “1940 Act”), as an open-end management investment company. The Trust was originally organized under the laws of the State of Maryland on July 16, 1990 as BBH Fund, Inc. and re-organized as a Delaware statutory trust on June 12, 2007. The Fund commenced operations on April 1, 2014. The Fund offers Class N shares and Class I shares. Class N and Class I shares have different operating expenses. With the exception of class specific expenses, all expenses are allocated between classes based on net assets. Neither Class N shares nor Class I shares automatically convert to any other share class of the Fund. As of October 31, 2017, there were six series of the Trust. |
2. |
Significant Accounting Policies. The Fund’s financial statements are prepared in accordance with Generally Accepted Accounting Principles in the United States of America (“GAAP”). The Fund is an investment company and accordingly follows the investment company accounting and reporting guidance of the Financial Accounting Standards Board (FASB) Accounting Standard Codification Topic 946 Financial Services — Investment Companies. The following summarizes significant accounting policies of the Fund: |
A. |
Valuation of Investments. Prices of municipal bonds are provided by an external pricing service approved by the Fund’s Board of Trustees (the “Board”). These securities are generally classified as Level 2. The evaluated vendor pricing is based on methods that may include consideration of the following: yields or prices of municipal securities of comparable quality, type of issue, coupon, maturity and rating, market quotes or indications of value from security dealers, evaluations of anticipated cash flows or collateral, general market conditions and other information and analysis, including the obligor’s credit characteristics considered relevant. |
B. |
Accounting for Investments and Income. Investment transactions are accounted for on the trade date. Realized gains and losses on investment transactions are determined based on the identified cost method. Interest income is accrued daily and consists of interest accrued, discount earned (including, if any, both original issue and market discount) and premium amortization on the investments of the Fund. Debt obligations may be placed on non-accrual status and related interest income may be reduced by ceasing current accruals and writing off interest receivable when the |
BBH INTERMEDIATE MUNICIPAL BOND FUND
NOTES TO FINANCIAL STATEMENTS (continued)
October 31, 2017
C. |
Fund Expenses. Most expenses of the Trust can be directly attributed to a specific fund. Expenses which cannot be directly attributed to a fund are apportioned amongst each fund in the Trust equally. Expense estimates are accrued in the period to which they relate and adjustments are made when actual amounts are known. |
D. |
Federal Income Taxes. It is the Trust’s policy to comply with the requirements of the Internal Revenue Code (the “Code”) applicable to regulated investment companies and to distribute substantially all of its taxable income to its shareholders. Accordingly, no federal income tax provision is required. The Fund files a tax return annually using tax accounting methods required under provisions of the Code, which may differ from GAAP, which is the basis on which these financial statements are prepared. Accordingly, the amount of net investment income and net realized gain reported in these financial statements may differ from that reported on the Fund’s tax return, due to certain book-to-tax timing differences such as losses deferred due to “wash sale” transactions and utilization of capital loss carryforwards. These differences may result in temporary over-distributions for financial statement purposes and are classified as distributions in excess of accumulated net realized gains or net investment income. These distributions do not constitute a return of capital. Permanent differences are reclassified in the Statement of Assets & Liabilities based upon their tax classification. As such, the character of distributions to shareholders reported in the Financial Highlights table may differ from that reported to shareholders on Form 1099-DIV. |
E. |
Dividends and Distributions to Shareholders. Dividends and distributions from net investment income to shareholders, if any, are paid monthly and are recorded on the ex-dividend date. Distributions from net capital gains, if any, are generally declared and paid annually and are recorded on the ex-dividend date. The Fund declared dividends in the amount of $757,020 and $2,583,284 |
|
|
BBH INTERMEDIATE MUNICIPAL BOND FUND
NOTES TO FINANCIAL STATEMENTS (continued)
October 31, 2017
| to Class N and Class I shareholders, respectively, during the year ended October 31, 2017. In addition, the Fund designated a portion of the payment made to redeeming shareholders as a distribution for income tax purposes. |
| Distributions paid
from: |
||||||||||||||||||||||||||
| Ordinary income |
Net long-term capital gain |
Total taxable distributions |
Tax exempt income |
Tax return of capital |
Total distributions paid |
|||||||||||||||||||||
2017: |
$ | 795,101 | $ | 705,293 | $ | 1,500,394 | $ | 1,839,910 | $ | — | $ | 3,340,304 | ||||||||||||||
2016: |
474,909 | 124,475 | 599,384 | 1,281,785 | — | 1,881,169 | ||||||||||||||||||||
| Components of accumulated
earnings/(deficit): |
||||||||||||||||||||||||||||||
| Undistributed ordinary income |
Undistributed long-term capital gain |
Accumulated earnings |
Accumulated capital and other losses |
Other book/tax temporary differences |
Book unrealized appreciation/ (depreciation) |
Total accumulated earnings / (deficit) |
||||||||||||||||||||||||
2017: |
$ | 108,314 | $ | 697,168 | $ | 805,482 | $ | — | $ | — | $ | 2,111,043 | $ | 2,916,525 | ||||||||||||||||
2016: |
638,250 | 511,015 | 1,149,265 | — | — | 2,646,009 | 3,795,274 | |||||||||||||||||||||||
F. |
Use of Estimates. The preparation of financial statements in accordance with GAAP requires management to make estimates and assumptions that affect the reported amounts of assets and liabilities in the financial statements, disclosure of contingent assets and liabilities at the date of the financial statements and the reported amounts of increases and decreases in net assets from operations during the reporting period. Actual results could differ from these estimates. |
BBH INTERMEDIATE MUNICIPAL BOND FUND
NOTES TO FINANCIAL STATEMENTS (continued)
October 31, 2017
3. |
Fees and Other Transactions with Affiliates. |
A. |
Investment Advisory and Administrative Fees. Effective April 1, 2014 (commencement of operations), under a combined Investment Advisory and Administrative Services Agreement (“Agreement”) with the Trust, Brown Brothers Harriman & Co. (“BBH”) through a separately identifiable department (“SID” or “Investment Adviser”) provides investment advisory, portfolio management and administrative services to the Fund. The Fund’s investment advisory and administrative services fee is calculated daily and paid monthly at an annual rate equivalent to 0.40% of the Fund’s average daily net assets. For the year ended October 31, 2017, the Fund incurred $334,405 under the Agreement. |
B. |
Investment Advisory and Administrative Fee Waiver. Effective April 1, 2014 (commencement of operations), the Investment Adviser contractually agreed to limit the annual fund operating expenses (excluding interest, taxes, brokerage commissions, other expenditures that are capitalized in accordance with GAAP and other extraordinary expenses not incurred in the ordinary course of the Fund’s business) of Class N and Class I to 0.65% and 0.50%, respectively. The agreement will terminate on March 1, 2018, unless it is renewed by all parties to the agreement. The agreement may only be terminated during its term with approval of the Fund’s Board of Trustees. For the year ended October 31, 2017, the Investment Adviser waived fees in the amount of $78,871 and $123,485 for Class N and Class I, respectively. |
C. |
Shareholder Servicing Fees. The Trust has a shareholder servicing agreement with BBH. BBH receives a fee from the Fund calculated daily and paid monthly at an annual rate of 0.20% of Class N shares’ average daily net assets. For the year ended October 31, 2017, Class N shares of the Fund incurred $39,101 in shareholder servicing fees. |
D. |
Custody and Fund Accounting Fees. BBH acts as a custodian and fund accountant and receives custody and fund accounting fees from the Fund calculated daily and incurred monthly. BBH holds all of the Fund’s cash and investments and calculates the Fund’s daily net asset value. The custody fee is an asset and transaction-based fee. The fund accounting fee is an asset-based fee calculated at 0.004% of the Fund’s net asset value. For the year ended October 31, 2017, the Fund incurred $39,831 in custody and fund accounting fees. These fees for the Fund were reduced by $709 as a result of an expense offset arrangement with the Fund’s custodian. The credit amount (if any) is disclosed in the Statement of Operations as a reduction to the Fund’s expenses. In the event that the Fund is overdrawn, under the custody agreement with BBH, BBH will make overnight loans to the Fund to cover overdrafts. Pursuant to their agreement, the Fund will pay the Federal Funds |
|
|
BBH INTERMEDIATE MUNICIPAL BOND FUND
NOTES TO FINANCIAL STATEMENTS (continued)
October 31, 2017
E. |
Board of Trustees’ Fees. Each Trustee who is not an “interested person” as defined under the 1940 Act receives an annual fee as well as reimbursement for reasonable out-of-pocket expenses from the Fund. For the year ended October 31, 2017, the Fund incurred $54,743 in independent Trustee compensation and reimbursements. |
F. |
Affiliated Ownership. As of October 31, 2017, BBH is the owner of record of 49.8% of the total outstanding shares of the Fund. |
4. |
Investment Transactions. For the year ended October 31, 2017, the cost of purchases and the proceeds of sales of investment securities, other than short-term investments, was $104,036,350 and $108,855,666, respectively. |
5. |
Shares of Beneficial Interest. The Trust is permitted to issue an unlimited number of Class N shares and Class I shares of beneficial interest, at no par value. Transactions in Class N and Class I shares were as follows: |
| For the year ended October 31, 2017 |
For the year ended October 31, 2016 |
||||||||||||||||||
| Shares |
Dollars |
Shares |
Dollars |
||||||||||||||||
Class N |
|||||||||||||||||||
Shares sold |
453,720 | $ | 4,704,644 | 456,024 | $ | 4,784,482 | |||||||||||||
Shares issued in connection with reinvestments of dividends |
61,745 | 633,673 | 36,145 | 378,154 | |||||||||||||||
Proceeds from short-term redemption fees |
N/A | 118 | N/A | 105 | |||||||||||||||
Shares redeemed |
(1,188,349 | ) | (12,342,086 | ) | (817,062 | ) | (8,568,577 | ) | |||||||||||
Net decrease |
(672,884 | ) | $ | (7,003,651 | ) | (324,893 | ) | $ | (3,405,836 | ) | |||||||||
Class I |
|||||||||||||||||||
Shares sold |
1,700,059 | $ | 17,624,316 | 989,906 | $ | 10,367,546 | |||||||||||||
Shares issued in connection with reinvestments of dividends |
73,690 | 761,026 | 32,728 | 342,598 | |||||||||||||||
Proceeds from short-term redemption fees |
N/A | 28 | N/A | 437 | |||||||||||||||
Shares redeemed |
(1,227,128 | ) | (12,610,972 | ) | (1,155,115 | ) | (12,126,791 | ) | |||||||||||
Net increase (decrease) |
546,621 | $ | 5,774,398 | (132,481 | ) | $ | (1,416,210 | ) | |||||||||||
BBH INTERMEDIATE MUNICIPAL BOND FUND
NOTES TO FINANCIAL STATEMENTS (continued)
October 31, 2017
6. |
Principal Risk Factors and Indemnifications. |
A. |
Principal Risk Factors. Investing in the Fund may involve certain risks, as discussed in the Fund’s prospectus, including but not limited to, those described below: |
|
|
BBH INTERMEDIATE MUNICIPAL BOND FUND
NOTES TO FINANCIAL STATEMENTS (continued)
October 31, 2017
B. |
Indemnifications. Under the Trust’s organizational documents, its officers and Trustees may be indemnified against certain liabilities and expenses arising out of the performance of their duties to the Fund, and shareholders are indemnified against personal liability for the obligations of the Trust. Additionally, in the normal course of business, the Fund enters into agreements with service providers that may contain indemnification clauses. The Fund’s maximum exposure under these arrangements is unknown as this would involve future claims that may be made against the Fund that have not yet occurred. The risk of material loss from such claims is considered remote. |
7. |
Recent pronouncements. |
A. |
Regulation S-X. In October 2016, the U.S. Securities and Exchange Commission adopted new rules and amended existing rules (together, “final rules”) intended to modernize the reporting and disclosure of information by registered investment companies. In part, the final rules amend Regulation S-X and require standardized, enhanced disclosure about derivatives in investment company financial statements, as well as other amendments. The compliance date for the amendments to Regulation S-X was August 1, 2017. The changes related to Regulation S-X are reflected in the financial statements. |
B. |
ASU 2017-08. In March 2017, the Financial Accounting Standards Board issued an Accounting Standards Update, ASU 2017-08, Receivables — Nonrefundable Fees and Other Costs (Subtopic 310-20), Premium Amortization on Purchased Callable Debt Securities (the “ASU”) which amends the amortization period for certain purchased callable debt securities held at a premium, shortening such period to the earliest call date. The ASU does not require any accounting change for debt securities held at a discount; the discount continues to be amortized to maturity. The ASU is effective for years, and interim periods within those years, beginning after December 15, 2018. Management is currently evaluating the application of ASU 2017-08 and its impact, if any, on the Fund’s financial statements. |
8. |
Subsequent Events. Management has evaluated events and transactions that have occurred since October 31, 2017 through the date the financial statements were issued and determined that there were none that would require recognition or additional disclosure in the financial statements. |
BBH INTERMEDIATE MUNICIPAL BOND FUND
DISCLOSURE OF FUND EXPENSES
October 31, 2017 (unaudited)
|
|
BBH INTERMEDIATE MUNICIPAL BOND FUND
DISCLOSURE OF FUND EXPENSES (continued)
October 31, 2017 (unaudited)
| Beginning Account Value May 1, 2017 |
Ending Account Value October 31, 2017 |
Expenses Paid During Period May 1, 2017 to October 31, 20171 |
||||||||||||
Class N |
||||||||||||||
Actual |
$ | 1,000 | $ | 1,036 | $ | 3.34 | ||||||||
Hypothetical2 |
$ | 1,000 | $ | 1,022 | $ | 3.31 | ||||||||
| Beginning Account Value May 1, 2017 |
Ending Account Value October 31, 2017 |
Expenses Paid During Period May 1, 2017 to October 31, 20171 |
||||||||||||
Class I |
||||||||||||||
Actual |
$ | 1,000 | $ | 1,037 | $ | 2.57 | ||||||||
Hypothetical2 |
$ | 1,000 | $ | 1,023 | $ | 2.55 | ||||||||
| 1 | Expenses are equal to the Fund’s annualized expense ratio of 0.65% and 0.50% for Class N and I shares, respectively, multiplied by the average account value over the period, multiplied by 184/365 (to reflect the one-half year period). |
| 2 | Assumes a return of 5% before expenses. For the purposes of the calculation, the applicable annualized expenses ratio for each class of shares is subtracted from the assumed return before expenses. |
BBH INTERMEDIATE MUNICIPAL BOND FUND
CONFLICT OF INTEREST
October 31, 2017 (unaudited)
|
|
BBH INTERMEDIATE MUNICIPAL BOND FUND
CONFLICT OF INTEREST (continued)
October 31, 2017 (unaudited)
BBH INTERMEDIATE MUNICIPAL BOND FUND
CONFLICT OF INTEREST (continued)
October 31, 2017 (unaudited)
agree to higher fees than it would in the case of
unaffiliated providers. BBH acting in its capacity as the Fund’s administrator is the primary valuation agent of the Fund. BBH values securities
and assets in the Fund according to the Fund’s valuation policies. Because the Investment Adviser and BBH’s advisory and administrative fees
are calculated by reference to a Fund’s net assets, BBH and its affiliates may have an incentive to seek to overvalue certain
assets.
|
|
BBH INTERMEDIATE MUNICIPAL BOND FUND
CONFLICT OF INTEREST (continued)
October 31, 2017 (unaudited)
provided to the Fund and to such other BBH client
accounts. To the extent that BBH uses soft dollars, it will not have to pay for those products and services itself.
BBH INTERMEDIATE MUNICIPAL BOND FUND
CONFLICT OF INTEREST (continued)
October 31, 2017 (unaudited)
behalf of its discretionary investment advisory clients
could significantly reduce the asset size of the Fund, which might have an adverse effect on the Fund’s investment flexibility, portfolio
diversification and expense ratio.
|
|
BBH INTERMEDIATE MUNICIPAL BOND FUND
ADDITIONAL FEDERAL TAX INFORMATION
October 31, 2017 (unaudited)
TRUSTEES AND OFFICERS OF BBH INTERMEDIATE MUNICIPAL
BOND FUND
(unaudited)
| Name and Birth Year |
|
Position(s) Held with the Trust |
|
Term of Office and Length of Time Served# |
|
Principal Occupation(s) During Past 5 Years |
|
Number of Portfolios in Fund Complex Overseen by Trusteeˆ |
|
Other Public Company or Investment Company Directorships held by Trustee During Past 5 Years |
Independent Trustees
|
||||||||||
H. Whitney Wagner Birth Year: 1956 |
Chairman of the Board and Trustee |
Chairman Since 2014; Trustee Since 2007 and 2006-2007 with the Predecessor Trust |
President, Clear Brook Advisors, a registered investment adviser. |
6 |
None. |
|||||
Andrew S. Frazier Birth Year: 1948 |
Trustee |
Since 2010 |
Consultant to Western World Insurance Group, Inc. (“WWIG”) (January 2010 to January 2012). |
6 |
Director of WWIG. |
|||||
Mark M. Collins Birth Year: 1956 |
Trustee |
Since 2011 |
Partner of Brown Investment Advisory Incorporated, a registered investment adviser. |
6 |
Chairman of Dillon Trust Company. |
|||||
John M. Tesoro Birth Year: 1952 |
Trustee |
Since 2014 |
Partner, Certified Public Accountant, KPMG LLP (Retired in September 2012). |
6 |
Trustee, Bridge Builder Trust (8 Funds) Director; Teton Advisors, Inc. (a registered investment adviser). |
|||||
|
|
TRUSTEES AND OFFICERS OF BBH INTERMEDIATE MUNICIPAL
BOND FUND
(unaudited)
| Name, Address and Birth Year |
|
Position(s) Held with the Trust |
|
Term of Office and Length of Time Served# |
|
Principal Occupation(s) During Past 5 Years |
|
Number of Portfolios in Fund Complex Overseen by Trusteeˆ |
|
Other Public Company or Investment
Company Directorships held by Trustee During Past 5 Years |
Interested Trustees |
||||||||||
Susan C. Livingston+ 50 Post Office Square Boston, MA 02110 Birth Year: 1957 |
Trustee |
Since 2011 |
Partner (since 1998) and Senior Client Advocate (since 2010) for BBH&Co.; Director of BBH Luxembourg S.C.A. (since
1992). |
6 |
None. |
|||||
John A. Gehret+ 140 Broadway New York, NY 10005 Birth Year: 1959 |
Trustee |
Since 2011 |
Limited Partner of BBH&Co. (2012-present); General Partner of BBH&Co. (1998 to 2011). Director of BBH Luxembourg S.C.A.
(since 2012); Director of BBH Trust (Cayman) Company Ltd. (since 2012). |
6 |
None. |
TRUSTEES AND OFFICERS OF BBH INTERMEDIATE MUNICIPAL
BOND FUND
(unaudited)
| Name, Address and Birth Year |
|
Position(s) Held with the Trust |
|
Term of Office and Length of Time Served# |
|
Principal Occupation(s) During Past 5 Years |
Officers |
||||||
Jean-Pierre Paquin 140 Broadway New York, NY 10005 Birth Year: 1973 |
President and Principal Executive Officer |
Since 2016 |
Partner of BBH&Co. since 2015; joined BBH&Co. in 1996. |
|||
Daniel Greifenkamp 140 Broadway New York, NY 10005 Birth Year: 1969 |
Vice
President |
Since 2016 |
Managing Director of BBH&Co. since 2014; joined BBH&Co. in 2011. |
|||
Charles H. Schreiber 140 Broadway New York, NY 10005 Birth Year: 1957 |
Treasurer and Principal Financial Officer |
Since 2007 2006-2007 with the Predecessor Trust |
Senior Vice President of BBH&Co. since 2001; joined BBH&Co. in 1999. |
|||
Paul F. Gallagher 140 Broadway New York, NY 10005 Birth Year: 1959 |
Chief Compliance Officer (“CCO”) |
Since 2015 |
Senior Vice President of BBH&Co. since September 2015; Executive Director, Counsel, Morgan Stanley Smith Barney LLC (2009-September
2015). |
|||
Keith M. Kelley 140 Broadway New York, NY 10005 Birth Year: 1983 |
Anti-Money Laundering Officer (“AMLO”) |
Since 2016 |
Vice
President of BBH&Co. since February 2016; joined BBH&Co. in 2016; Director, Legal and Compliance, Morgan Stanley Smith Barney LLC
(2014-February 2016); Compliance Manager, State Street Corporation (2013-2014); Associate, J.P. Morgan Chase & Co. (2011-2013). |
|
|
TRUSTEES AND OFFICERS OF BBH INTERMEDIATE MUNICIPAL
BOND FUND
(unaudited)
| Name, Address and Birth Year |
|
Position(s) Held with the Trust |
|
Term of Office and Length of Time Served# |
|
Principal Occupation(s) During Past 5 Years |
Suzan M. Barron 50 Post Office Square Boston, MA 02110 Birth Year: 1964 |
Secretary |
Since 2009 |
Senior Vice President and Senior Investor Services Counsel, BBH&Co. since 2005. |
|||
Rowena Rothman 140 Broadway New York, NY 10005 Birth Year: 1967 |
Assistant Treasurer |
Since 2011 |
Vice
President of BBH&Co. since 2009. |
# |
All officers of the Trust hold office for one year and until their respective successors are chosen and qualified (subject to the ability of the Trustees to remove any officer in accordance with the Trust’s By-laws). Mr. Wagner previously served on the Board of Trustees of the Predecessor Trust. |
+ |
Ms. Livingston and Mr. Gehret are “interested persons” of the Trust as defined in the 1940 Act because of their positions as Partner and Limited Partner of BBH&Co., respectively. |
ˆ |
The Fund Complex consists of the Trust, which has six series, and each is counted as one “Portfolio” for purposes of this table. |
Administrator Brown Brothers Harriman & Co. 140 Broadway New York, NY 10005 Distributor ALPS Distributors, Inc. 1290 Broadway, Suite 1100 Denver, CO 80203 Shareholder Servicing Agent Brown Brothers Harriman & Co. 140 Broadway New York, NY 10005 1-800-575-1265 |
Investment Adviser Brown Brothers Harriman Mutual Fund Advisory Department 140 Broadway New York, NY 10005 |
By telephone: |
Call
1-800-575-1265 |
|
By E-mail send your request to: |
bbhfunds@bbh.com |
|
On the internet: |
www.bbhfunds.com |
Item 2. Code of Ethics.
| As of the period ended October 31, 2017 (the “Reporting Period”), the Registrant has adopted a code of ethics that applies to the Registrant’s principal executive officer and principal financial officer, principal accounting officer or controller or persons performing similar functions. During the Reporting Period, there have been no changes to, amendments to or waivers from, any provision of the code of ethics. A copy of this code of ethics can be obtained upon request, free of charge, by calling (800) 575 - 1265. |
Item 3. Audit Committee Financial Expert.
| The Board of Trustees of the Registrant has determined that Andrew S. Frazier, John M. Tesoro and Mark M. Collins possess the attributes identified in Instruction (b) of Item 3 to Form N-CSR to each qualify as an “audit committee financial expert,” and has designated Andrew S. Frazier, John M. Tesoro and Mark M. Collins as the Registrant’s audit committee financial experts. Messrs. Andrew S. Frazier, John M. Tesoro and Mark M. Collins are “independent” Trustees pursuant to paragraph (a)(2) of Item 3 to Form N-CSR. |
Item 4. Principal Accountant Fees and Services.
| (a) | Audit Fees The aggregate fees billed for each of the last two fiscal years for professional services rendered by the principal accountant for the audit of the Registrant’s annual financial statements or services that are normally provided by the accountant in connection with statutory and regulatory filings or engagements for those fiscal years were $302,000 for 2017 and $274,750 for 2016.
|
| (b) | Audit Related Fees The aggregate fees billed in each of the last two fiscal years for assurance and related services rendered to the Registrant by the principal accountant that are reasonably related to the performance of the audit of the Registrant’s financial statements and are not reported under paragraph (a) of this Item were $0 for 2017 and $0 for 2016.
|
| (c) | Tax Fees The aggregate fees billed in each of the last two fiscal years for professional services rendered to the Registrant by the principal accountant for tax compliance, tax advice and tax planning were $36,726 for 2017 and $35,496 for 2016. These services consisted of (i) review or preparation of U.S. federal, state, local and excise tax returns; (ii) U.S. federal, state and local entity tax planning, advice and assistance regarding statutory, regulatory or administrative developments, and (iii) tax advice regarding tax qualification. |
| (d) | All Other Fees The aggregate fees billed in each of the last two fiscal years for products and services provided by the principal accountant, other than the services reported in paragraphs (a) through (c) of this Item were $40,400 for 2017 and $57,800 for 2016. |
The other services provided to the Registrant consisted of examinations pursuant to Rule 17f-2 of the Investment Company Act of 1940, as amended and filings of Form N-17f-2 “Certificate of Accounting of Securities and Similar Investments in the Custody of Management Investment Companies” with the U.S. Securities and Exchange Commission (“17f-2 Services”) in addition to audit services, tax services and 17f-2 Services provided to other series of the Registrant.
| |
| (e)(1) | Pursuant to the Registrant’s Audit Committee Charter that has been adopted by the audit committee, the audit committee shall approve all audit and permissible non-audit services to be provided to the Registrant and all permissible non-audit services to be provided to its investment adviser or any entity controlling, controlled by or under common control with the investment adviser that provides ongoing services to the Registrant if the engagement relates directly to the operations and financial reporting of the Registrant. The audit committee has delegated to its Chairman the approval of such services subject to reports to the full audit committee at its next subsequent meeting.
|
| (e)(2) | The percentage of services described in each of paragraphs (b) through (d) of this Item that were approved by the audit committee pursuant to paragraph (c)(7)(i)(C) of Rule 2-01 of Regulation S-X, with respect to: Audit-Related Fees were 0%; Tax Fees were 0%; and Other Fees were 0%.
|
| (f) | Not applicable.
|
| (g) | The aggregate non-audit fees billed by the Registrant's accountant for services rendered to the Registrant, and rendered to the Registrant's investment adviser (not including any sub-adviser whose role is primarily portfolio management and is subcontracted with or overseen by another investment adviser), and any entity controlling, controlled by, or under common control with the investment adviser that provides ongoing services to the Registrant for each of the last two fiscal years of the Registrant were $1,664,835 for 2017 and $1,765,095 for 2016.
|
| (h) | The Registrant’s audit committee has considered whether the provision of non-audit services that were rendered to the Registrant’s investment adviser (not including any subadviser whose role is primarily portfolio management and is subcontracted with or overseen by another investment adviser), and any entity controlling, controlled by, or under common control with the investment adviser that provides ongoing services to the Registrant that were not pre-approved pursuant to paragraph (c)(7)(ii) of Rule 2-01 of Regulation S-X is compatible with maintaining the principal accountant’s independence. |
Item 5. Audit Committee of Listed Registrants.
| Not Applicable |
Item 6. Investments.
| (a) | A Schedule of Investments in securities of unaffiliated issuers as of the close of the Reporting Period is included as part of the report to shareholders filed under Item 1 of this Form N-CSR.
|
| (b) | Not applicable. |
Item 7. Disclosure of Proxy Voting Policies and Procedures for Closed-End Management Investment Companies.
| Not applicable. |
Item 8. Portfolio Managers of Closed-End Management Investment Companies.
| Not applicable. |
Item 9. Purchases of Equity Securities by Closed-End Management Investment Company and Affiliated Purchasers.
| Not applicable. |
Item 10. Submission of Matters to a Vote of Security Holders.
| Not applicable. |
Item 11. Controls and Procedures.
| (a) | The Registrant’s principal executive and financial officers have concluded that the Registrant’s disclosure controls and procedures (as defined in Rule 30a-3(c) under the Investment Company Act of 1940, as amended (the “1940 Act”)) are effective, as of a date within 90 days of the filing date of this Form N-CSR, based on their evaluation of these controls and procedures required by Rule 30a-3(b) under the 1940 Act and Rules 13a-15(b) or 15d-15(b) under the Securities Exchange Act of 1934, as amended (the “Exchange Act”).
|
| (b) | There were no changes in the Registrant's internal control over financial reporting (as defined in Rule 30a-3(d) under the 1940 Act) that occurred during the Registrant's second fiscal quarter of the period covered by this Form N-CSR, that have materially affected, or are reasonably likely to materially affect, the Registrant's internal control over financial reporting. |
Item 12. Disclosure of Securities Lending Activities for Closed-End Management Investment Companies.
| Not applicable. |
Item 13. Exhibits.
| (a)(1) | Not applicable.
|
| (a)(2) | Certifications required by Rule 30a-2(a) under the 1940 Act and Section 302 of the Sarbanes-Oxley Act of 2002 are filed as Exhibit 12(a)(2) to this Form N-CSR.
|
| (a)(3) | Not applicable. |
| (b) | Certifications required by Rule 30a-2(b) under the 1940 Act and Section 906 of the Sarbanes-Oxley Act of 2002 are furnished as Exhibit 12(b) to this Form N-CSR. |
SIGNATURES
Pursuant to the requirements of the Securities Exchange Act of 1934 and the Investment Company Act of 1940, the Registrant has duly caused this report to be signed on its behalf by the undersigned, thereunto duly authorized.
(Registrant) BBH Trust
By: (Signature and Title)
Jean-Pierre Paquin
Title: President (Principal Executive Officer)
Date: January 5, 2018
Pursuant to the requirements of the Securities Exchange Act of 1934 and the Investment Company Act of 1940, this report has been signed below by the following persons on behalf of the Registrant and in the capacities and on the dates indicated.
By: (Signature and Title)
Jean-Pierre Paquin
Title: President (Principal Executive Officer)
Date: January 5, 2018
By: (Signature and Title)
Charles H. Schreiber
Title: Treasurer (Principal Financial Officer)
Date: January 5, 2018