Exhibit 99.1
Regency Energy Partners Reports Third-Quarter 2011 Results
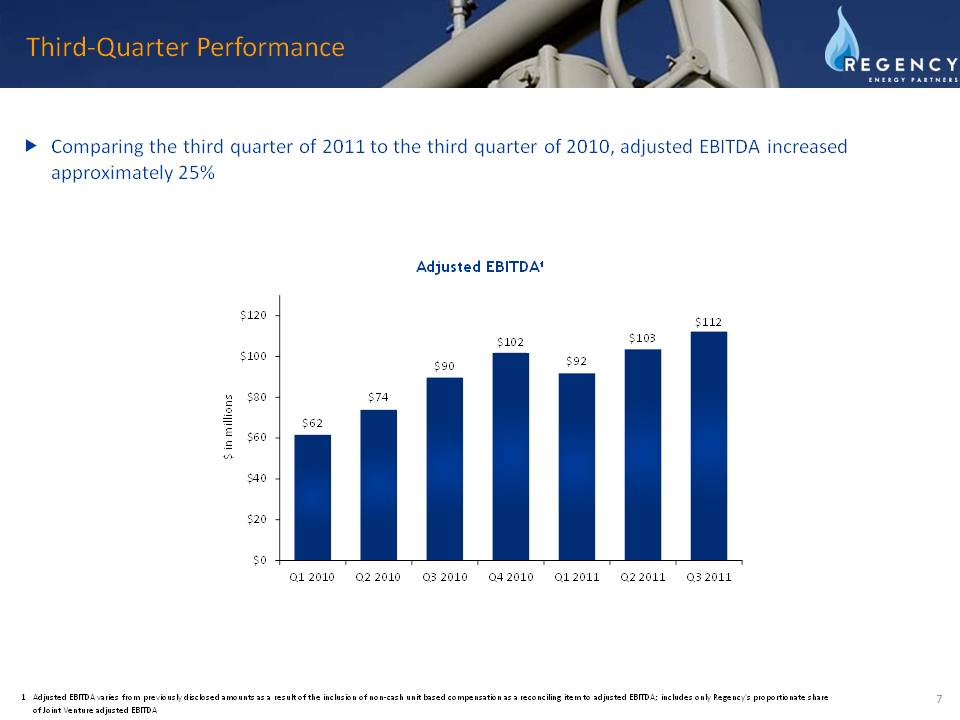
Adjusted EBITDA Increased 25% Over Third Quarter of 2010
DALLAS, Nov. 2, 2011 – Regency Energy Partners LP (NYSE: RGP), (“Regency” or the “Partnership”), announced today its financial results for the third quarter ended September 30, 2011.
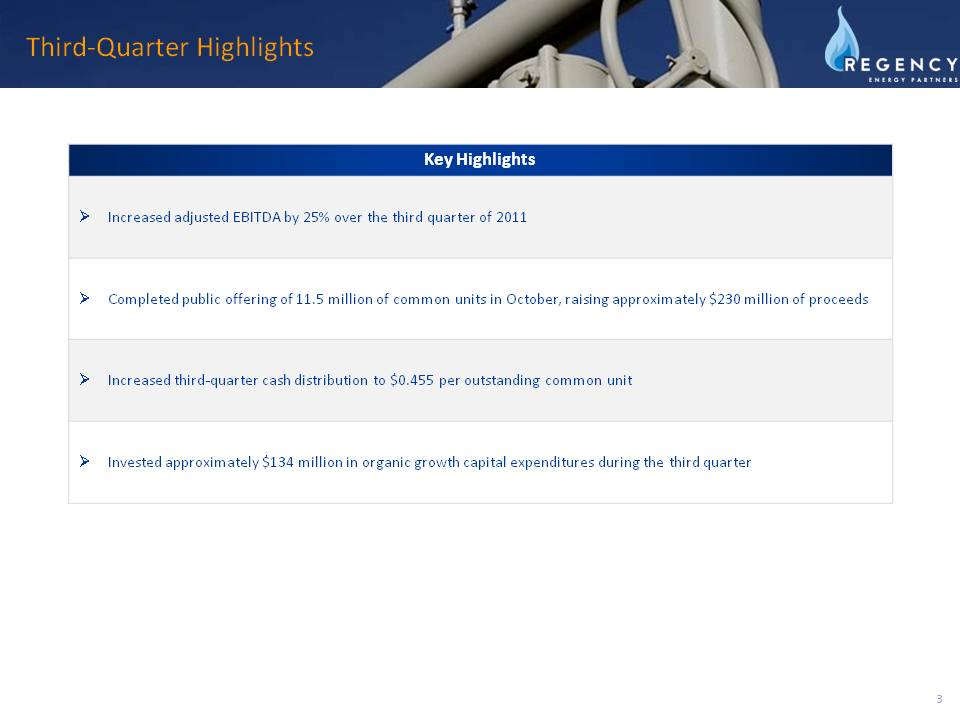
Regency’s adjusted EBITDA increased 25% to $112 million in the third quarter of 2011, compared to $90 million in the third quarter of 2010. This increase was primarily attributable to the acquisition of a 30% interest in the Lone Star Joint Venture in May 2011, and an increase in the adjusted segment margin in the Gathering and Processing segment due to increased volumes in south and west Texas.
“We delivered solid year-over-year adjusted EBITDA growth for the third quarter of 2011, due mostly to increased volumes from our Eagle Ford expansion project and a full quarter’s contribution from the Lone Star Joint Venture,” said Mike Bradley, president and chief executive officer of Regency. “We have a strong foundation of assets and have announced significant organic growth projects that position Regency to deliver long-term accretion.”
REVIEW OF SEGMENT PERFORMANCE
Adjusted total segment margin increased 13% to $111 million for the third quarter of 2011, compared to $98 million for the third quarter of 2010.
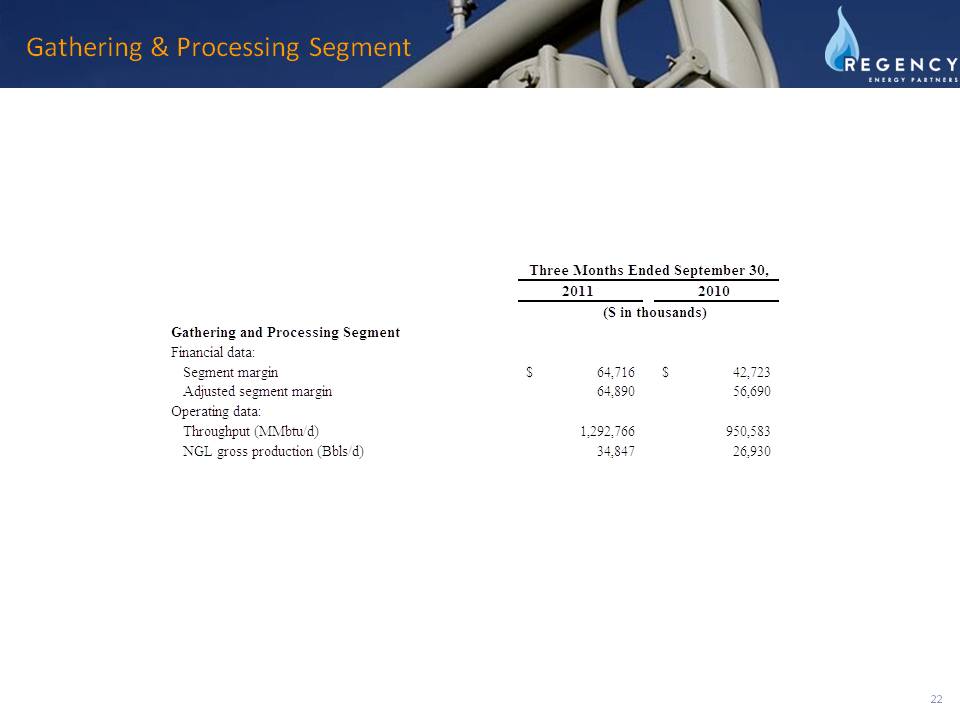
Gathering and Processing – The Gathering and Processing segment provides wellhead-to-market services to producers of natural gas, which includes gathering raw natural gas from the wellhead through gathering systems, processing raw natural gas to separate NGLs from the raw natural gas and selling or delivering pipeline-quality natural gas and NGLs to various markets and pipeline systems.
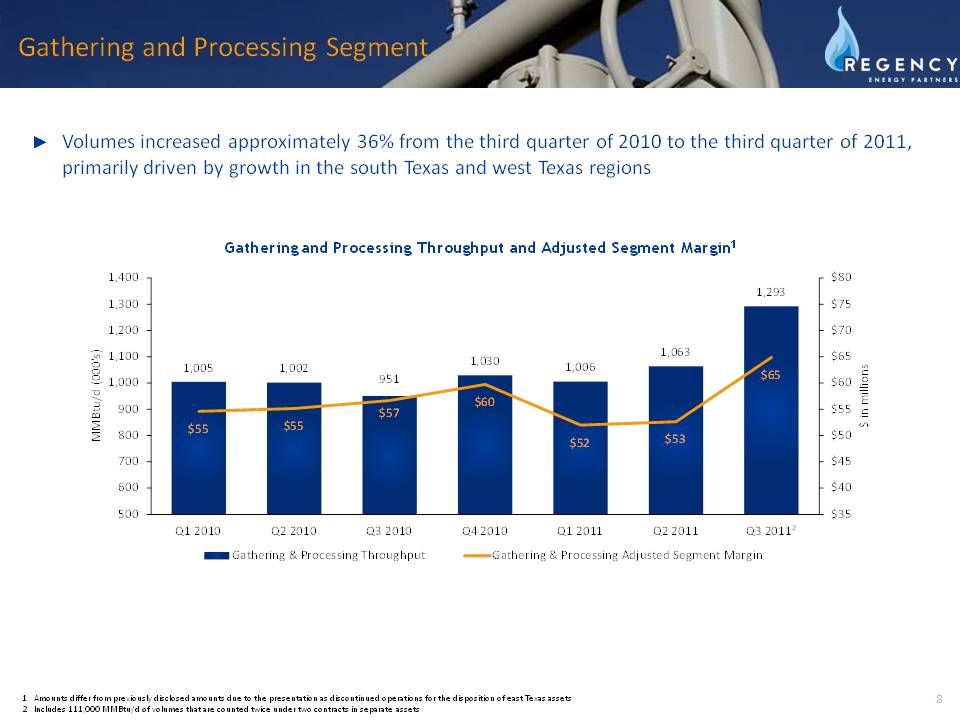
Adjusted segment margin for the Gathering and Processing segment, which excludes non-cash hedging gains and losses, was $65 million for the third quarter of 2011, compared to $57 million for the third quarter of 2010. The increase was primarily due to volume growth in the Eagle Ford Shale and Permian Basin.
Total throughput volumes for the Gathering and Processing segment increased 36% to 1.3 million MMbtu per day of natural gas in the third quarter of 2011, compared to 1.0 million MMbtu per day of natural gas in the third quarter of 2010. Processed NGLs increased to 35,000 barrels per day for the third quarter of 2011, compared to 27,000 barrels per day for the third quarter of 2010.
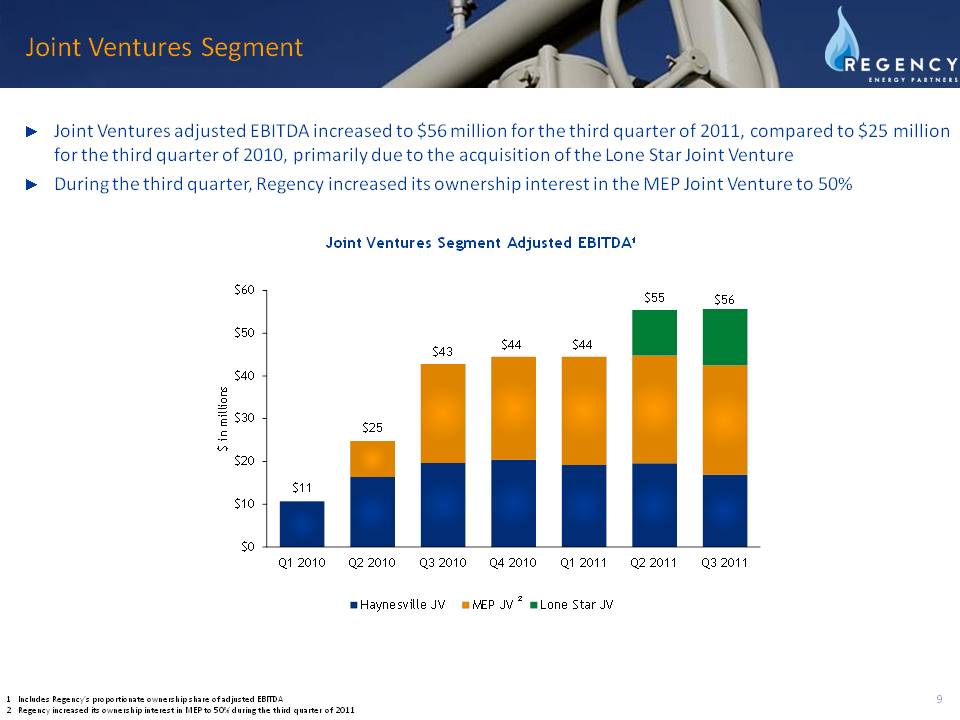
Joint Ventures – The Joint Ventures segment, formerly called the Transportation segment, consists of a 49.99% interest in the Haynesville Joint Venture, a 50% interest in the MEP Joint Venture and a 30% interest in the Lone Star Joint Venture. Since Regency uses the equity method of accounting for these joint ventures, Regency does not record segment margin for the Joint Ventures segment. Rather, the income attributable to each of the joint ventures is recorded as income from unconsolidated affiliates.
For the third quarter of 2011, Regency reported income from unconsolidated affiliates of $31 million, compared to $22 million for the third quarter of 2010.
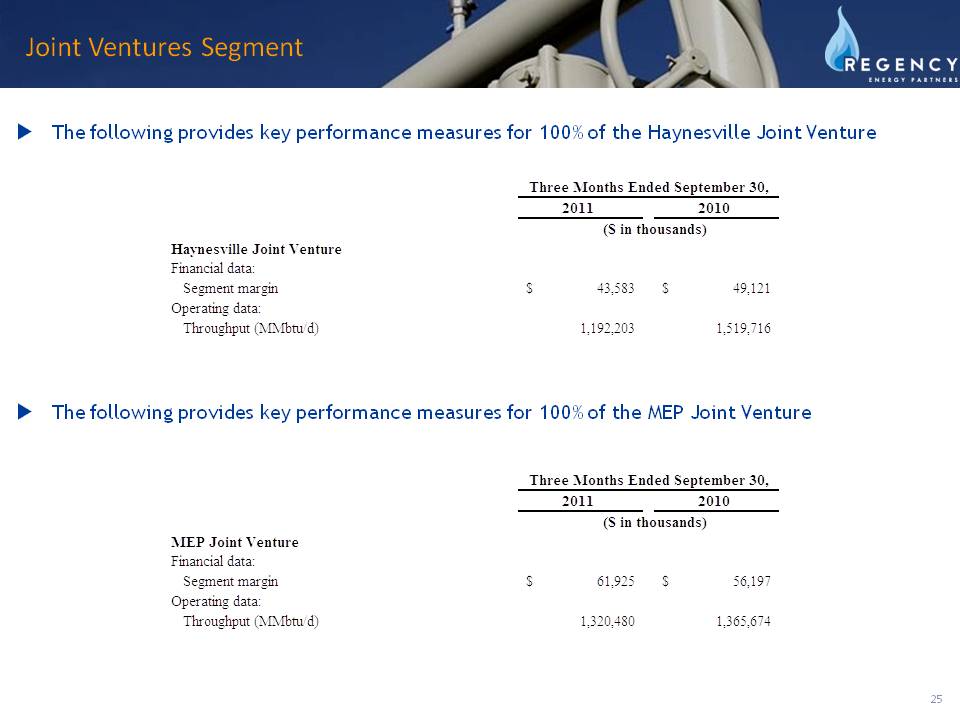
The Haynesville Joint Venture consists solely of the Regency Intrastate Gas System and is operated by Regency. Income from unconsolidated affiliates for the Haynesville Joint Venture decreased from $14 million in the third quarter of 2010 to $11 million in the third quarter of 2011. Total throughput volumes for the Haynesville Joint Venture averaged 1.5 million MMbtu per day of natural gas for the third quarter of 2010, compared to an average of 1.2 million MMbtu per day of natural gas for the third quarter of 2011.
The MEP Joint Venture consists solely of the Midcontinent Express Pipeline (“MEP”), which is operated by Kinder Morgan Energy Partners, L.P. Income from unconsolidated affiliates for the MEP Joint Venture increased from $8 million in the third quarter of 2010 to $11 million in the third quarter of 2011. Total throughput volumes for the MEP Joint Venture averaged 1.4 million MMbtu per day of natural gas for the third quarter of 2010, compared to an average of 1.3 million MMbtu per day of natural gas for the third quarter of 2011.
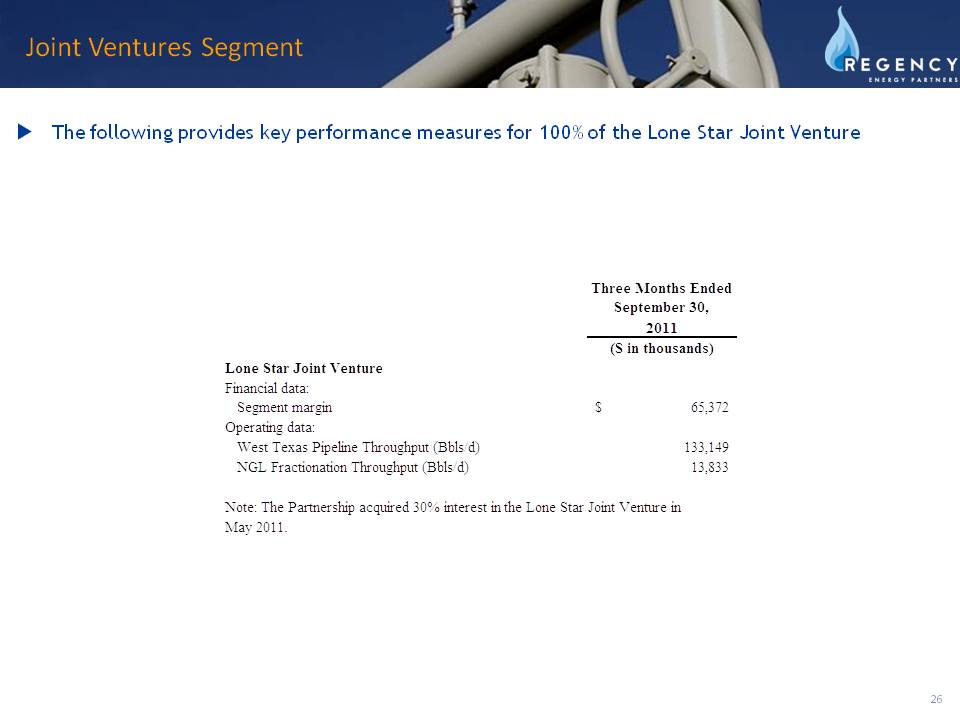
The Lone Star Joint Venture, which was acquired in May 2011, owns and operates NGL storage, fractionation and transportation assets, and is operated by Energy Transfer Partners, L.P. For the third quarter of 2011, income from unconsolidated affiliates for the Lone Star Joint Venture was $9 million. For the third quarter of 2011, total throughput volumes for the West Texas Pipeline averaged 133,000 barrels per day and NGL Fractionation Throughput volumes averaged 14,000 barrels per day.
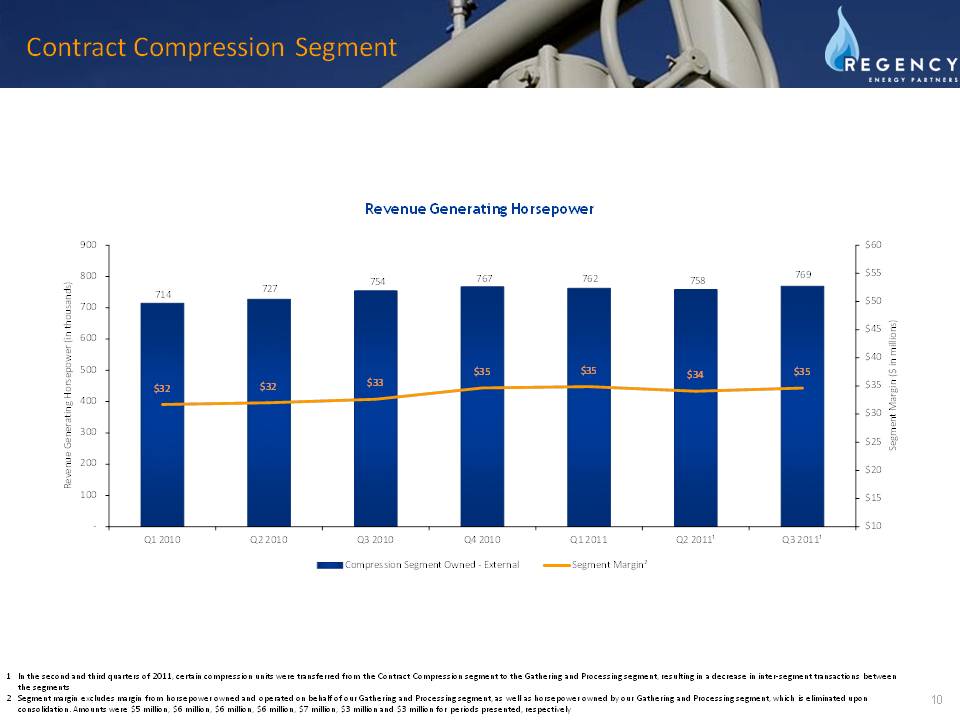
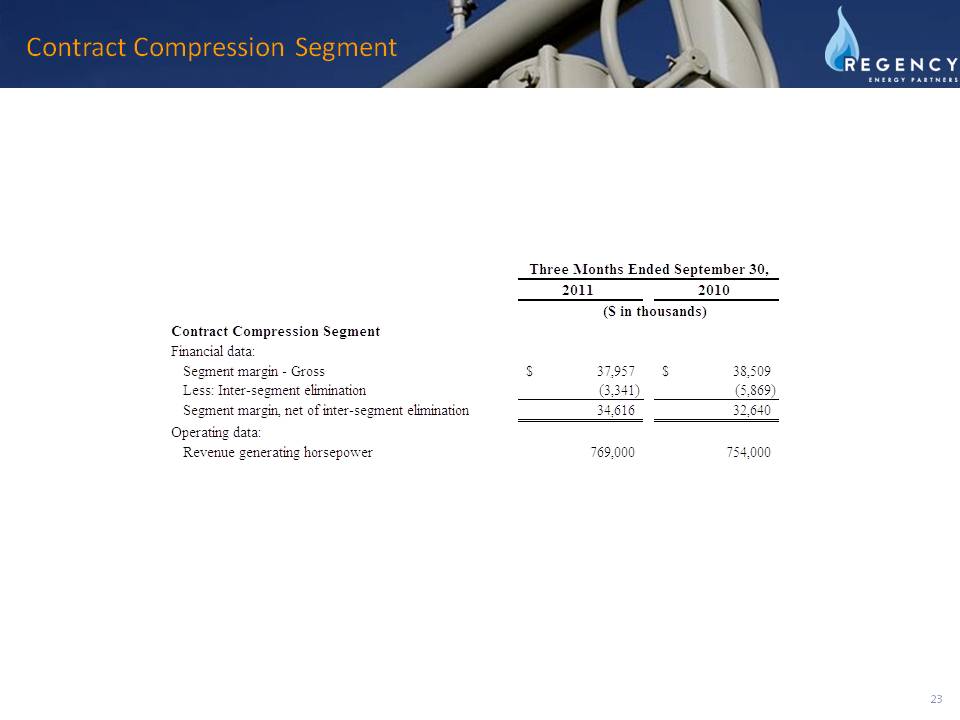
Contract Compression – The Contract Compression segment provides turn-key natural gas compression services for customer-specific systems.
Regency will now be presenting segment margin excluding margin from intercompany horsepower, which is eliminated upon consolidation. Segment margin for the Contract Compression segment, excluding intercompany segment margin, was $35 million for the third quarter of 2011, compared to $33 million for the third quarter of 2010. As of September 30, 2011, our Contract Compression segment’s revenue generating horsepower was 769,000 compared to 754,000 as of September 30, 2010.
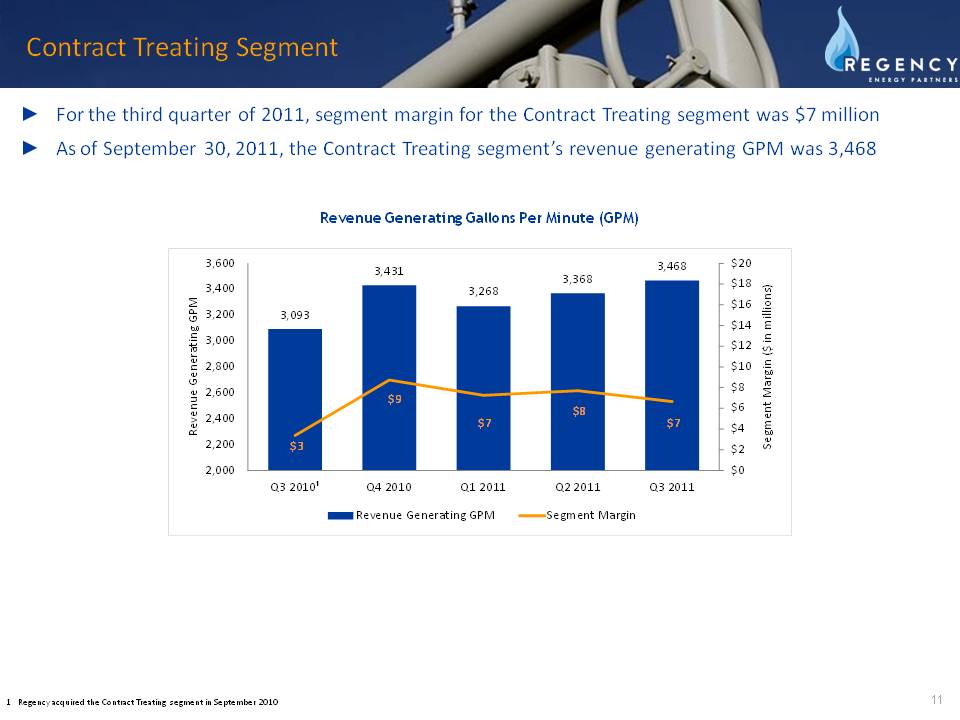
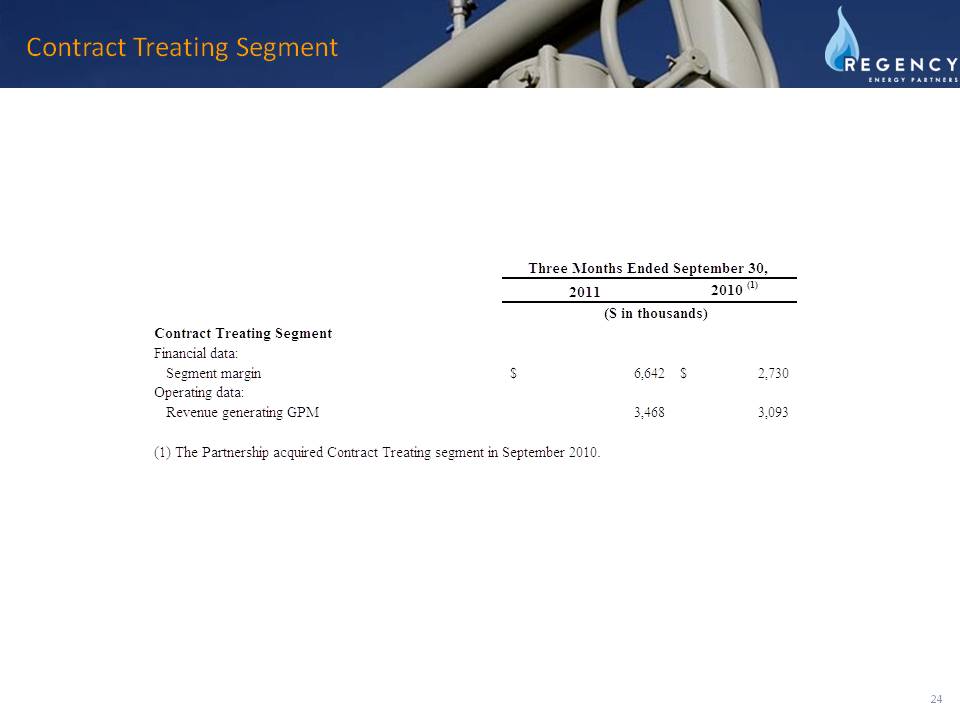
Contract Treating – The Partnership owns and operates a fleet of equipment used to provide treating services, such as carbon dioxide and hydrogen sulfide removal, natural gas cooling, dehydration and BTU management, to natural gas producers and midstream pipeline companies.
Segment margin for the Contract Treating segment, which was acquired in September 2010, was $7 million for the third quarter of 2011. As of September 30, 2011, revenue generating gallons per minute (“GPM”) was 3,468, compared to 3,093 as of September 30, 2010.
Corporate and Others – The Corporate and Others segment is primarily comprised of revenues from the operations of a 10-mile interstate pipeline, as well as partial reimbursements of general and administrative costs from the Haynesville Joint Venture. Segment margin in the Corporate and Others segment was $5 million for the third quarter of 2011 compared to $6 million for the third quarter of 2010.
ORGANIC GROWTH
In the nine months ended September 30, 2011, Regency invested $258 million in growth capital projects, of which $172 million was related to organic growth projects in the Gathering and Processing segment; $68 million was related to the fabrication of new compressor packages for the Contract Compression segment; $10 million was related to the Lone Star Joint Venture; $5 million was related to the fabrication of new treating plants for the Contract Treating segment; and $3 million for vehicle fleet purchases in the Corporate and Others segment.
Regency’s $373 million of projected 2011 organic growth capital expenditures includes $200 million for the Gathering and Processing segment, which is inclusive of 2011 expenditures related to the south Texas gathering system expansion, $95 million for the Contract Compression segment, $65 million to fund Regency’s proportionate share of growth projects associated with the Lone Star Joint Venture, $9 million for the Contract Treating segment and $4 million related to the Corporate and Others segment.
In 2012, Regency expects to invest between $630 and $680 million in growth capital expenditures, of which $290 million is expected to be invested in organic growth projects in the Gathering and Processing segment, including a portion for the south Texas gathering system expansion; between $250 and $300 million is expected to be invested in its portion of growth capital expenditures for the Lone Star Joint Venture; $70 million is expected to be invested in the fabrication of new compressor packages for the Contract Compression segment; $15 million is expected to be invested in the fabrication of new treating plants for the Contract Treating segment; and $5 million is expected to be invested in the Corporate and Others segment.
CASH DISTRIBUTIONS
On October 25, 2011, Regency announced a cash distribution increase to $0.455 per outstanding common unit for the third quarter ended September 30, 2011. This distribution is equivalent to $1.82 per outstanding common unit on an annual basis and will be paid on November 14, 2011, to unitholders of record at the close of business on November 7, 2011.
Based on the terms of the agreement, the Series A Preferred Units will be paid a quarterly distribution of $0.445 per unit for the third quarter ended September 30, 2011, on the same schedule as set forth above.
In the third quarter of 2011, Regency generated $73 million in cash available for distribution, representing coverage of 0.98 times the amount required to cover its announced distribution to unitholders. Excluding the 11.5 million common units issued in October 2011, the coverage ratio would have been 1.06 times.
Regency makes distribution determinations based on its cash available for distribution and the perceived sustainability of distribution levels over an extended period. In addition to considering the cash available for distribution generated during the quarter, Regency takes into account cash reserves established with respect to prior distributions, seasonality of results, and its internal forecasts of adjusted EBITDA and cash available for distribution over an extended period. Distributions are set by the Board of Directors and are driven by the long-term sustainability of the business.
TELECONFERENCE
Regency Energy Partners will hold a quarterly conference call to discuss third quarter 2011 results on Thursday, November 3, 2011, at 10 a.m. Central Time (11 a.m. Eastern Time).
The dial-in number for the call is 1-866-713-8310 in the United States, or +1-617-597-5308 outside the United States, passcode 27975225. A live webcast of the call may be accessed on the investor information page of Regency Energy Partners’ website at www.regencyenergy.com. The call will be available for replay for seven days by dialing 1-888-286-8010 (from outside the U.S., +1-617-801-6888) passcode 60456168. A replay of the webcast will also be available on the Partnership’s website for seven days.
NON-GAAP FINANCIAL INFORMATION
This press release and the accompanying financial schedules include the non-GAAP financial measures of:
|
·
|
EBITDA;
|
|
·
|
adjusted EBITDA;
|
|
·
|
cash available for distribution;
|
|
·
|
segment margin;
|
|
·
|
total segment margin;
|
|
·
|
adjusted segment margin; and
|
|
·
|
adjusted total segment margin.
|
These financial metrics are key measures of the Partnership’s financial performance. The accompanying schedules provide reconciliations of these non-GAAP financial measures to their most directly-comparable financial measures calculated and presented in accordance with accounting principles generally accepted in the United States of America ("GAAP"). Our non-GAAP financial measures should not be considered an alternative to, or more meaningful than, net income, operating income, cash flows from operating activities or any other measure of financial performance presented in accordance with GAAP as a measure of operating performance, liquidity or ability to service debt obligations.
We define EBITDA as net income (loss) plus interest expense, net, income tax expense, net and depreciation and amortization expense.
We define adjusted EBITDA as EBITDA plus (minus) non-cash loss (gain) from commodity and embedded derivatives, non-cash unit-based compensation, loss (gain) on asset sales, net, loss on debt refinancing, other non-cash (income) expense, net; net income attributable to noncontrolling interest; and the Partnership’s interest in adjusted EBITDA from unconsolidated affiliates less income from unconsolidated affiliates.
Adjusted EBITDA is used as a supplemental performance measure by our management and by external users of our financial statements such as investors, commercial banks, research analysts and others, to assess:
-- financial performance of our assets without regard to
financing methods, capital structure or historical cost basis;
-- the ability of our assets to generate cash sufficient to pay interest costs,
support our indebtedness and make cash distributions to our
unitholders and general partner;
-- our operating performance and return on capital as compared to
those of other companies in the midstream energy sector,
without regard to financing methods or capital structure; and
-- the viability of acquisitions and capital expenditure projects
and the overall rates of return on alternative investment
opportunities.
Neither EBITDA nor adjusted EBITDA should be considered as an alternative to, or more meaningful than, net income, operating income, cash flows from operating activities or any other measure of financial performance presented in accordance with GAAP.
We define cash available for distribution as adjusted EBITDA:
|
·
|
minus interest expense, excluding capitalized interest;
|
|
·
|
minus maintenance capital expenditures;
|
|
·
|
plus cash proceeds from asset sales, if any; and
|
|
·
|
joint venture adjustments, which mainly include interest expense and maintenance capital expenditures.
|
Cash available for distribution is used as a supplemental liquidity measure by our management and by external users of our financial statements such as investors, commercial banks, research analysts and others, to approximate the amount of operating surplus generated by us during a specific period and to assess our ability to make cash distributions to our unitholders and our general partner. Cash available for distribution is not the same measure as operating surplus or available cash, both of which are defined in our partnership agreement.
We define segment margin for the Gathering and Processing and the Corporate and Others segments, as revenues generated from operations minus the cost of natural gas and NGLs purchased and other cost of sales, including third-party transportation and processing fees.
We do not record segment margin for the Joint Ventures segment because we record our ownership percentages of the net income in the Haynesville Joint Venture, MEP Joint Venture and the Lone Star Joint Venture as income from unconsolidated affiliates.
We calculate our Contract Compression segment margin as our revenues minus the direct costs, primarily compressor unit repairs, associated with those revenues.
We calculate our Contract Treating segment margin as our revenues minus direct costs associated with those revenues.
We calculate total segment margin as the summation of segment margin of our five segments, less intersegment eliminations.
We define adjusted segment margin as segment margin adjusted for non-cash (gains) losses from commodity derivatives. Our adjusted total segment margin equals the sum of our operating segments’ adjusted segment margins or segment margins, including intersegment eliminations. Adjusted segment margin and adjusted total segment margin are included as supplemental disclosures because they are primary performance measures used by management as they represent the results of our revenues and cost of revenues, a key component of our operations.
FORWARD-LOOKING INFORMATION
This release contains “forward-looking” statements, which are any statements that do not relate strictly to historical facts. The words “anticipate,” “believe,” “continue,” “estimate,” “expect,” “forecast,” “goal,” “intend,” “may,” “plan,” “project,” “will” or similar expressions help identify forward-looking statements. Forward-looking statements are subject to a variety of risks, uncertainties and assumptions, which include, but are not limited to, the risks, uncertainties and assumptions enumerated in our Forms 10-Q and 10-K as filed with the Securities and Exchange Commission. Although we believe our forward-looking statements are based on reasonable assumptions, current expectations and projections about future events, we cannot give assurances that such assumptions, expectations and projections will prove to be correct. Therefore, actual results and outcomes may differ materially from those expressed in such forward-looking statements. We undertake no obligation to update publicly or to revise any forward-looking statements, whether as a result of new information, future events or otherwise.
Regency Energy Partners LP (NYSE: RGP) is a growth-oriented, midstream energy partnership engaged in the gathering and processing, contract compression, treating, transportation, fractionation and storage of natural gas and natural gas liquids. Regency's general partner is owned by Energy Transfer Equity, L.P. (NYSE: ETE). For more information, visit the Regency Energy Partners LP website at www.regencyenergy.com.
CONTACT:
Investor Relations:
Lyndsay Hannah
Regency Energy Partners
Manager, Finance & Investor Relations
214-840-5477
ir@regencygas.com
Media Relations:
Elizabeth Cornelius
HCK2 Partners
972-716-0500 x26
elizabeth.cornelius@hck2.com
Consolidated Income Statement
|
Regency Energy Partners LP
|
||||||
|
Consolidated Income Statements
|
||||||
|
Unaudited
|
||||||
|
($ in thousands)
|
||||||
|
Three Months Ended September 30,
|
||||||
|
2011
|
2010
|
|||||
|
REVENUES
|
||||||
|
Gas sales, including related party amounts of $3,840 and $1,680
|
$ | 118,754 | $ | 132,130 | ||
|
NGL sales, including related party amounts of $103,892 and $51,062
|
174,537 | 91,489 | ||||
|
Gathering, transportation and other fees, including related party amounts of $6,141 and $5,680
|
91,596 | 72,184 | ||||
|
Net realized and unrealized loss from derivatives
|
(5,380 | ) | (6,218 | ) | ||
|
Other, including related party amounts of $2,665 and $1,111
|
10,760 | 7,303 | ||||
|
Total revenues
|
390,267 | 296,888 | ||||
|
OPERATING COSTS AND EXPENSES
|
||||||
|
Cost of sales, including related party amounts of $5,049 and $4,768
|
279,526 | 213,032 | ||||
|
Operation and maintenance
|
37,950 | 34,306 | ||||
|
General and administrative, including related party amounts of $4,225 and $2,500
|
17,350 | 18,072 | ||||
|
(Gain) loss on asset sales, net
|
(131 | ) | 200 | |||
|
Depreciation and amortization
|
41,956 | 32,205 | ||||
|
Total operating costs and expenses
|
376,651 | 297,815 | ||||
|
OPERATING INCOME (LOSS)
|
13,616 | (927 | ) | |||
|
Income from unconsolidated affiliates
|
30,946 | 21,754 | ||||
|
Interest expense, net
|
(28,852 | ) | (20,379 | ) | ||
|
Other income and deductions, net
|
15,050 | 7,524 | ||||
|
INCOME BEFORE INCOME TAXES
|
30,760 | 7,972 | ||||
|
Income tax (benefit) expense
|
(89 | ) | 450 | |||
|
INCOME FROM CONTINUING OPERATIONS
|
30,849 | 7,522 | ||||
|
DISCONTINUED OPERATIONS
|
||||||
|
Net income from operations of east Texas assets, including gain on disposal of $20 in 2010
|
- | 324 | ||||
|
NET INCOME
|
$ | 30,849 | $ | 7,846 | ||
|
Net income attributable to noncontrolling interest
|
(549 | ) | (58 | ) | ||
|
NET INCOME ATTRIBUTABLE TO REGENCY ENERGY PARTNERS LP
|
$ | 30,300 | $ | 7,788 | ||
Segment Financial and Operating Data
|
Three Months Ended September 30,
|
||||||
|
2011
|
2010
|
|||||
|
($ in thousands)
|
||||||
|
Gathering and Processing Segment
|
||||||
|
Financial data:
|
||||||
|
Segment margin
|
$ | 64,716 | $ | 42,723 | ||
|
Adjusted segment margin
|
64,890 | 56,690 | ||||
|
Operating data:
|
||||||
|
Throughput (MMbtu/d)
|
1,292,766 | 950,583 | ||||
|
NGL gross production (Bbls/d)
|
34,847 | 26,930 | ||||
|
Three Months Ended September 30,
|
||||||
|
2011
|
2010
|
|||||
|
($ in thousands)
|
||||||
|
Contract Compression Segment
|
||||||
|
Financial data:
|
||||||
|
Segment margin - Gross
|
$ | 37,957 | $ | 38,509 | ||
|
Less: Inter-segment elimination
|
(3,341 | ) | (5,869 | ) | ||
|
Segment margin, net of inter-segment elimination
|
34,616 | 32,640 | ||||
|
Operating data:
|
||||||
|
Revenue generating horsepower
|
769,000 | 754,000 | ||||
|
Three Months Ended September 30,
|
||||||
|
2011
|
2010 (1)
|
|||||
|
($ in thousands)
|
||||||
|
Contract Treating Segment
|
||||||
|
Financial data:
|
||||||
|
Segment margin
|
$ | 6,642 | $ | 2,730 | ||
|
Operating data:
|
||||||
|
Revenue generating GPM
|
3,468 | 3,093 | ||||
|
(1) The Partnership acquired Contract Treating segment in September 2010.
|
||||||
|
Three Months Ended September 30,
|
||||||
|
2011
|
2010
|
|||||
|
($ in thousands)
|
||||||
|
Corporate & Others
|
||||||
|
Financial data:
|
||||||
|
Segment margin
|
$ | 4,767 | $ | 5,763 | ||
The following provides key performance measures for 100% of the Haynesville Joint Venture, the MEP Joint Venture and the Lone Star Joint Venture
|
Three Months Ended September 30,
|
||||||
|
2011
|
2010
|
|||||
|
($ in thousands)
|
||||||
|
Haynesville Joint Venture
|
||||||
|
Financial data:
|
||||||
|
Segment margin
|
$ | 43,583 | $ | 49,121 | ||
|
Operating data:
|
||||||
|
Throughput (MMbtu/d)
|
1,192,203 | 1,519,716 | ||||
|
Three Months Ended September 30,
|
||||||
|
2011
|
2010
|
|||||
|
($ in thousands)
|
||||||
|
MEP Joint Venture
|
||||||
|
Financial data:
|
||||||
|
Segment margin
|
$ | 61,925 | $ | 56,197 | ||
|
Operating data:
|
||||||
|
Throughput (MMbtu/d)
|
1,320,480 | 1,365,674 | ||||
|
Three Months Ended September 30,
|
|||
|
2011
|
|||
|
($ in thousands)
|
|||
|
Lone Star Joint Venture
|
|||
|
Financial data:
|
|||
|
Segment margin
|
$ | 65,372 | |
|
Operating data:
|
|||
|
West Texas Pipeline- Throughput (Bbls/d)
|
133,149 | ||
|
NGL Fractionation Throughput (Bbls/d)
|
13,833 | ||
|
Note: The Partnership acquired 30% interest in the Lone Star Joint Venture in May 2011.
|
|||
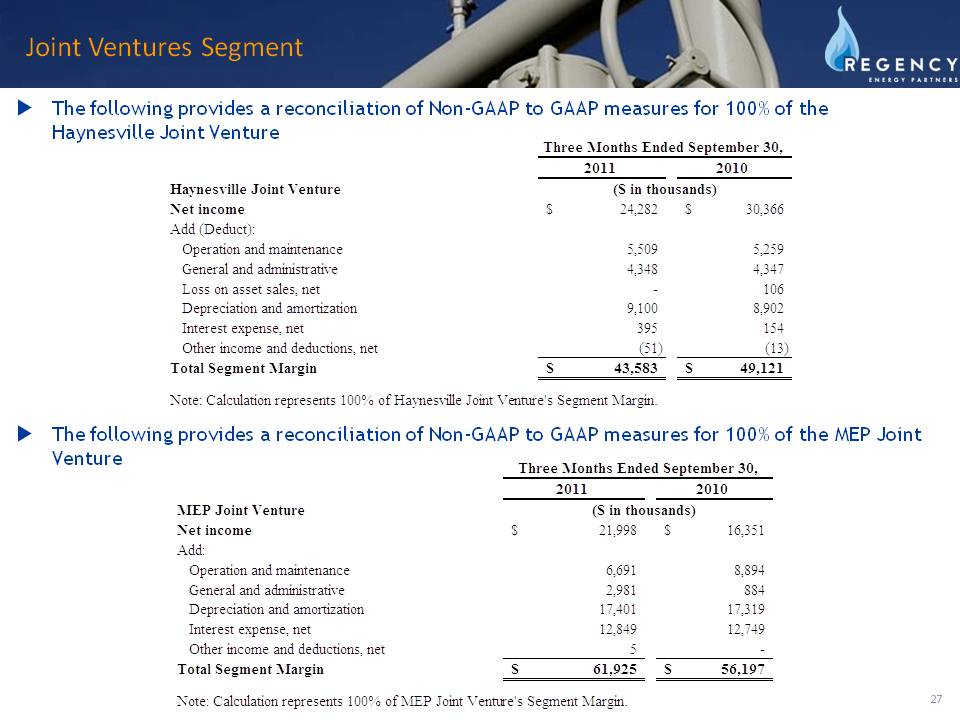
The following provides a reconciliation of segment margin to net income for 100% of the Haynesville Joint Venture, the MEP Joint Venture and the Lone Star Joint Venture
|
Three Months Ended September 30,
|
||||||
|
2011
|
2010
|
|||||
|
Haynesville Joint Venture
|
($ in thousands)
|
|||||
|
Net income
|
$ | 24,282 | $ | 30,366 | ||
|
Add (Deduct):
|
||||||
|
Operation and maintenance
|
5,509 | 5,259 | ||||
|
General and administrative
|
4,348 | 4,347 | ||||
|
Loss on asset sales, net
|
- | 106 | ||||
|
Depreciation and amortization
|
9,100 | 8,902 | ||||
|
Interest expense, net
|
395 | 154 | ||||
|
Other income and deductions, net
|
(51 | ) | (13 | ) | ||
|
Total Segment Margin
|
$ | 43,583 | $ | 49,121 | ||
|
Note: Calculation represents 100% of Haynesville Joint Venture's Segment Margin.
|
||||||
|
Three Months Ended September 30,
|
||||||
|
2011
|
2010
|
|||||
|
MEP Joint Venture
|
($ in thousands)
|
|||||
|
Net income
|
$ | 21,998 | $ | 16,351 | ||
|
Add:
|
||||||
|
Operation and maintenance
|
6,691 | 8,894 | ||||
|
General and administrative
|
2,981 | 884 | ||||
|
Depreciation and amortization
|
17,401 | 17,319 | ||||
|
Interest expense, net
|
12,849 | 12,749 | ||||
|
Other income and deductions, net
|
5 | - | ||||
|
Total Segment Margin
|
$ | 61,925 | $ | 56,197 | ||
|
Note: Calculation represents 100% of MEP Joint Venture's Segment Margin.
|
||||||
|
Three Months Ended September 30,
|
|||
|
2011
|
|||
|
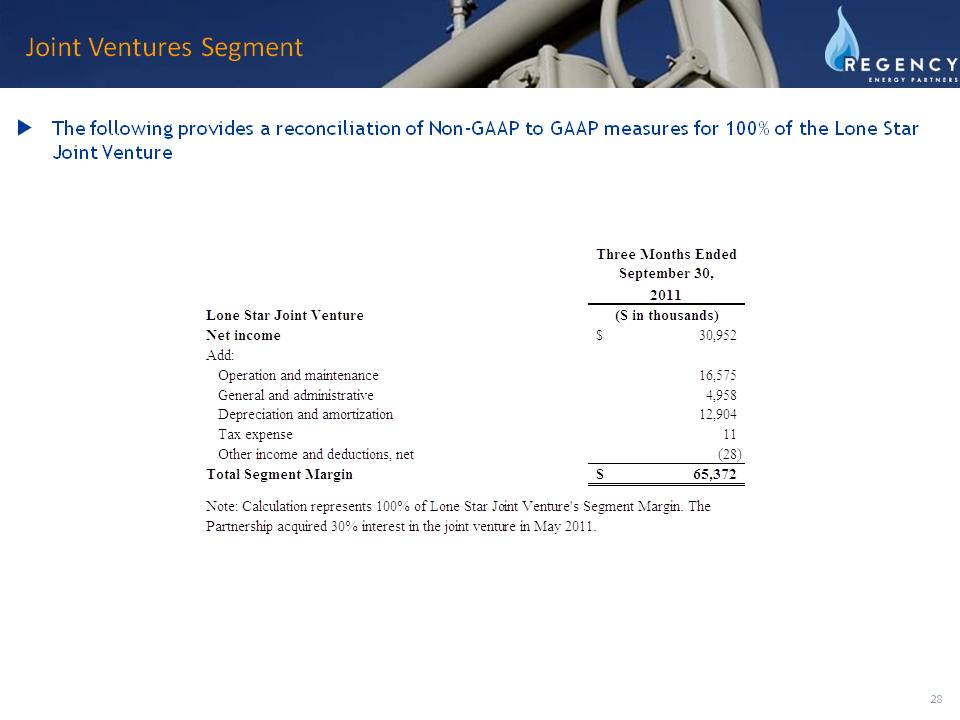
Lone Star Joint Venture
|
($ in thousands)
|
||
|
Net income
|
$ | 30,952 | |
|
Add:
|
|||
|
Operation and maintenance
|
16,575 | ||
|
General and administrative
|
4,958 | ||
|
Depreciation and amortization
|
12,904 | ||
|
Tax expense
|
11 | ||
|
Other income and deductions, net
|
(28 | ) | |
|
Total Segment Margin
|
$ | 65,372 | |
| Note: Calculation represents 100% of Lone Star Joint Venture's Segment Margin. The Partnership acquired 30% interest in the joint venture in May 2011. | |||
Reconciliation of Non-GAAP Measures to GAAP Measures
|
Three Months Ended September 30,
|
||||||
|
2011
|
2010
|
|||||
|
($ in thousands)
|
||||||
|
Net income
|
$ | 30,849 | $ | 7,846 | ||
|
Add (deduct):
|
||||||
|
Interest expense, net
|
28,852 | 20,393 | ||||
|
Depreciation and amortization
|
41,956 | 32,429 | ||||
|
Income tax (benefit) expense
|
(89 | ) | 450 | |||
|
EBITDA (1)
|
$ | 101,568 | $ | 61,118 | ||
|
Add (deduct):
|
||||||
|
Non-cash (gain) loss from commodity and embedded derivatives
|
(15,056 | ) | 6,646 | |||
|
Non-cash unit-based compensation
|
891 | 303 | ||||
|
(Gain) loss on asset sales, net
|
(131 | ) | 200 | |||
|
Income from unconsolidated affiliates
|
(30,946 | ) | (21,754 | ) | ||
|
Partnership's interest in Haynesville Joint Venture's adjusted EBITDA (2)
|
16,885 | 19,632 | ||||
|
Partnership's interest in MEP Joint Venture's adjusted EBITDA (3)
|
26,091 | 23,163 | ||||
|
Partnership's interest in Lone Star Joint Venture's adjusted EBITDA (4)
|
13,152 | - | ||||
|
Other (income) expense, net
|
(178 | ) | 346 | |||
|
Adjusted EBITDA
|
$ | 112,276 | $ | 89,654 | ||
|
(1) Earnings before interest, taxes, depreciation and amortization.
|
||||||
|
(2) 100% of Haynesville Joint Venture's Adjusted EBITDA is calculated as follows:
|
||||||
|
Net income Haynesville Joint Venture
|
$ | 24,282 | $ | 30,366 | ||
|
Add:
|
||||||
|
Depreciation and amortization
|
9,100 | 8,902 | ||||
|
Interest expense, net
|
395 | 154 | ||||
|
Other expense (income), net
|
5 | (149 | ) | |||
|
Haynesville Joint Venture's Adjusted EBITDA
|
$ | 33,782 | $ | 39,273 | ||
|
(3) 100% of MEP Joint Venture's Adjusted EBITDA is calculated as follows:
|
||||||
|
Net income MEP Joint Venture
|
$ | 21,998 | $ | 16,351 | ||
|
Add:
|
||||||
|
Depreciation and amortization
|
17,401 | 17,319 | ||||
|
Interest expense, net
|
12,855 | 12,749 | ||||
|
MEP Joint Venture's Adjusted EBITDA
|
$ | 52,254 | $ | 46,419 | ||
|
(4) 100% of Lone Star Joint Venture's Adjusted EBITDA is calculated as follows:
|
||||||
|
Net income Lone Star Joint Venture
|
$ | 30,952 | $ | - | ||
|
Add:
|
||||||
|
Depreciation and amortization
|
12,904 | - | ||||
|
Other expenses, net
|
(16 | ) | - | |||
|
Lone Star Joint Venture's Adjusted EBITDA
|
$ | 43,840 | $ | - | ||
Non-GAAP Adjusted Total Segment Margin to GAAP Net Income
|
Three Months Ended
|
||||||
|
September 30, 2011
|
September 30, 2010
|
|||||
|
($ in thousands)
|
||||||
|
Net income
|
$ | 30,849 | $ | 7,846 | ||
|
Add (Deduct):
|
||||||
|
Operation and maintenance
|
37,950 | 34,306 | ||||
|
General and administrative
|
17,350 | 18,072 | ||||
|
(Gain) loss on asset sales, net
|
(131 | ) | 200 | |||
|
Depreciation and amortization
|
41,956 | 32,205 | ||||
|
Income from unconsolidated affiliates
|
(30,946 | ) | (21,754 | ) | ||
|
Interest expense, net
|
28,852 | 20,379 | ||||
|
Other income and deductions, net
|
(15,050 | ) | (7,524 | ) | ||
|
Income tax (benefit) expense
|
(89 | ) | 450 | |||
|
Discontinued operations
|
- | (324 | ) | |||
|
Total Segment Margin
|
110,741 | 83,856 | ||||
|
Non-cash loss from commodity derivatives
|
174 | 13,967 | ||||
|
Adjusted Total Segment Margin
|
$ | 110,915 | $ | 97,823 | ||
|
Gathering and Processing Segment Margin
|
$ | 64,716 | $ | 42,723 | ||
|
Non-cash loss from commodity derivatives
|
174 | 13,967 | ||||
|
Adjusted Gathering and Processing Segment Margin
|
64,890 | 56,690 | ||||
|
Contract Compression Segment Margin
|
37,957 | 38,509 | ||||
|
Contract Treating Segment Margin
|
6,642 | 2,730 | ||||
|
Corporate and Others Segment Margin
|
4,767 | 5,763 | ||||
|
Inter-segment Elimination
|
(3,341 | ) | (5,869 | ) | ||
|
Adjusted Total Segment Margin
|
$ | 110,915 | $ | 97,823 | ||
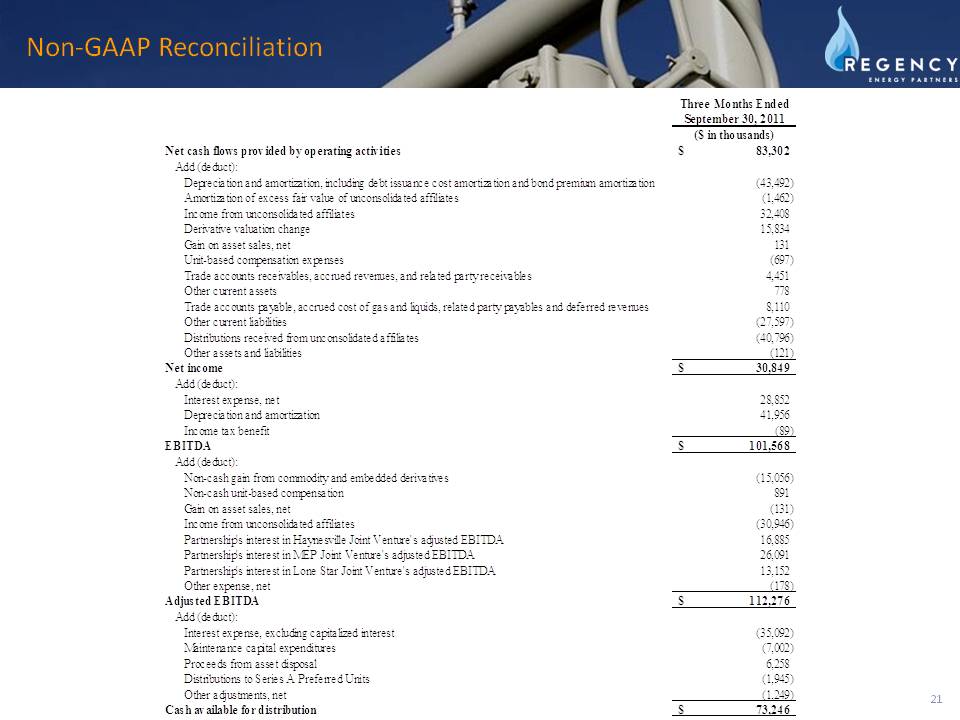
Reconciliation of “cash available for distribution” to net cash flows provided by operating activities and to net income
|
Three Months Ended
|
|||
|
September 30, 2011
|
|||
|
($ in thousands)
|
|||
|
Net cash flows provided by operating activities
|
$ | 83,302 | |
|
Add (deduct):
|
|||
|
Depreciation and amortization, including debt issuance cost amortization and bond premium amortization
|
(43,492 | ) | |
|
Amortization of excess fair value of unconsolidated affiliates
|
(1,462 | ) | |
|
Income from unconsolidated affiliates
|
32,408 | ||
|
Derivative valuation change
|
15,834 | ||
|
Gain on asset sales, net
|
131 | ||
|
Unit-based compensation expenses
|
(697 | ) | |
|
Trade accounts receivables, accrued revenues, and related party receivables
|
4,451 | ||
|
Other current assets
|
778 | ||
|
Trade accounts payable, accrued cost of gas and liquids, related party payables and deferred revenues
|
8,110 | ||
|
Other current liabilities
|
(27,597 | ) | |
|
Distributions received from unconsolidated affiliates
|
(40,796 | ) | |
|
Other assets and liabilities
|
(121 | ) | |
|
Net income
|
$ | 30,849 | |
|
Add (deduct):
|
|||
|
Interest expense, net
|
28,852 | ||
|
Depreciation and amortization
|
41,956 | ||
|
Income tax benefit
|
(89 | ) | |
|
EBITDA
|
$ | 101,568 | |
|
Add (deduct):
|
|||
|
Non-cash gain from commodity and embedded derivatives
|
(15,056 | ) | |
|
Non-cash unit-based compensation
|
891 | ||
|
Gain on asset sales, net
|
(131 | ) | |
|
Income from unconsolidated affiliates
|
(30,946 | ) | |
|
Partnership's interest in Haynesville Joint Venture's adjusted EBITDA
|
16,885 | ||
|
Partnership's interest in MEP Joint Venture's adjusted EBITDA
|
26,091 | ||
|
Partnership's interest in Lone Star Joint Venture's adjusted EBITDA
|
13,152 | ||
|
Other expense, net
|
(178 | ) | |
|
Adjusted EBITDA
|
$ | 112,276 | |
|
Add (deduct):
|
|||
|
Interest expense, excluding capitalized interest
|
(35,092 | ) | |
|
Maintenance capital expenditures
|
(7,002 | ) | |
|
Proceeds from asset disposal
|
6,258 | ||
|
Distributions to Series A Preferred Units
|
(1,945 | ) | |
|
Other adjustments, net
|
(1,249 | ) | |
|
Cash available for distribution
|
$ | 73,246 | |