 Welcome and Introduction Welcome and Introduction Stuart Davis SVP, Investor and Employee Owner Relations Exhibit 99.1 |
 2 Agenda Agenda Welcome Stuart Davis Enterprise Overview Ken Dahlberg Operational Perspectives Larry Prior Financial Overview Mark Sopp Corporate Q&A Security and Transportation Security Alex Preston Closing Remarks Ken Dahlberg Final Q&A Break Defense Solutions Deb Alderson Future Combat Systems John Gully Lunch and Future Combat Systems Demonstration Intelligence, Security & Technology Stu Shea IT & Network Solutions Charles Koontz Infrastructure, Logistics & Product Solutions Joe Craver Break |
 3 Forward Looking Statements Forward Looking Statements This presentation describes financial results through 7/31/07 (FY2008 Q2) Certain statements in these presentations contain forward-looking statements within the meaning of Section 27A of the Securities Act of 1933, as amended. The forward-looking statements involve a number of risks and uncertainties. A number of factors could cause our actual results, performance, achievements, or industry results to be materially different from any future results, performance, or achievements expressed or implied by these forward-looking statements. Some of these factors include, but are not limited to, the risk factors set forth in the Company’s Annual Report on Form 10-K for the year ended January 31, 2007, and other filings that the Company makes with the SEC from time to time. Due to these uncertainties and risks, persons who view these presentations are cautioned not to place undue reliance on such forward-looking statements, which speak only as of October 9, 2007. The Company disclaims any duty to update guidance or any other forward- looking statement provided in these presentations to reflect subsequent events, actual results or changes in the Company's expectations. |
 Enterprise Overview Enterprise Overview Ken Dahlberg Chairman and CEO |
 2 Who Are We? Who Are We? Leading science/technology services & solutions provider – Platform independence creates “honest broker” – Broad capabilities to win and execute bundled procurements $8B+ revenue—38 years of organic growth and profitability Focused on important national and global problems – National security – Intelligence “Go-to” provider for government’s most difficult problems – Leadership positions on important national and global programs – Deeply embedded in our customers’ missions Highly skilled and innovative workforce Entrepreneurial culture that motivates our people – Built around customer/mission success and technical excellence – Most employees own stock, driving performance for all stockholders – Homeland security – Energy – Logistics – Health care |
 3 SAIC Core Values & Purpose SAIC Core Values & Purpose |
 4 SAIC Organization SAIC Organization Mark Sopp CFO Greg Henson Business Development Brian Keenan Human Resources Arnold Punaro Gov’t Affairs, Communication and Support Ops Doug Scott Legal and Audit Joe Walkush Strategic Initiatives & Investments Deb Alderson Defense Solutions Joe Craver Infrastructure, Logistics & Product Solutions Charles Koontz Information Technology & Network Solutions Stu Shea Intelligence, Security & Technology Ken Dahlberg Chairman and CEO Lawrence Prior COO |
 5 SAIC Fundamental Guiding Principles SAIC Fundamental Guiding Principles Live our core values – Open, honest, and straightforward with all our constituencies (customers, employees, stockholders, the public) Build long-term value, per share, for our stockholders – Balance short-term and long-term objectives Pursue business in our “circle of competency” – Expand into adjacent areas when it makes sense Increase capability to serve our customers and drive growth Allocate capital on a rational, disciplined basis |
 6 Corporate Transformation Corporate Transformation Formal planning discipline informs investment allocations “No Grand Plan” Strategy IPO completed: ~130M share float $1.1B in cash; $0.1B in net debt 100% owned by employees/retirees $2.2B in cash; $1.0B in net cash Capital Structure Significant progress on past issues; no new major problem contracts High-profile issues: Greece, Trilogy, Trailblazer Problem Contracts Talent Management Review w/ training, succession, and redeployment programs Individuals responsible for their own coverage and career development People Management Committed $100M to complete top-to- bottom refresh of all IT systems Legacy systems requiring extensive maintenance and work around IT Systems One SAIC promoted through alignment and incentives Entrepreneurial Darwinism promotes internal competition Collaboration Focused on high-growth markets through acquisitions/divestitures Amalgam including declining markets with no strategic value Business Mix 4 Groups, 20 Business Units Aligned by Customers/Capabilities 15 Sectors, 55 Business Units No “Swim Lanes” Line Structure 11 Members (1 internal); 6 committees 19 members (10 internal); 19 committees Board October 2007 November 2003 Element |
 7 Focus on Execution Focus on Execution Accelerate organic growth – Improving toward 6-9% – Greater collaboration on growing pipeline of major opportunities Improve margins sustainably – 20-30 bps improvement planned for FY08 – Provided best practices training; initiated review of corporate structure/spending Instill culture of discipline – SOX 404 implementation complete – No new major problem programs Improve ability to plan/forecast – Implemented integrated planning process, 6 quarter rolling forecast – More detailed bottoms up and top down tests of reasonableness Invest in people – New training courses implemented, including for every new hire – Recruiting and retention improving through attention at all levels Build technology base – Increasing IR&D investment linked to business thrusts – 33 communities of practice link technical contributors across company
|
 8 3-5 Year Outlook 3-5 Year Outlook Addressable market growth will flatten – Budgets less predictable with increasing deficit pressure – Competition more fierce—industry will experience margin pressure – Lowering of prices, strong cash generation will promote more consolidation Sources of Revenue–about 90% federal/10% commercial – Continue our focus in federal markets – Commercial business provides growth and leverages synergies Increased capability and recognition as major prime contractor for larger bids
– Government losing ability to supervise acquisition of big systems – SAIC must be able to provide total solutions for our customers Increased ability to handle different business models – Requires business savvy and risk mitigation (e.g., performance based contracting)
– More product business to provide total solutions and better margins Improved financial performance – Revenue–grow 6% to 9% organically – Add 2%-4% from midsized strategic acquisitions; opportunistic on larger ones – Operating Margins–expand at least 100 bps – EPS—grow 15% on average |
 9 Near-Term Strategic Actions Near-Term Strategic Actions Repurchase our stock when the purchase price yields an attractive return to stockholders Target larger acquisition opportunities (>$500M) opportunistically– when the fit and price are right Mature capabilities to develop light touch production and LRIP products from our technology base Improve ability to develop, deliver, and support total solutions over the program life cycle Build our capabilities (large program management, system engineering, team-building) and reputation as a prime Execute corporate campaigns around energy, health, cyber security, and space superiority Reduce corporate overhead and invest in organic growth |
 10 Enterprise Summary Enterprise Summary One year later after IPO, investment thesis is unchanged – Market expected to grow for years to come – SAIC has the ability to deliver strong returns by accelerating organic growth, expanding margins, and deploying capital Company is executing according to IPO plan – 6% organic growth rate and improving operating margin since IPO Demonstrated progress since IPO – Divested non-core businesses—AMSEC and ANX – Restructured leadership team – Built pipeline of major opportunities – Won large competitive programs—GPS, POL-Chem, NATO BMD – Deployed $400M+ on acquisitions: AMTI, Benham, AETC, Scicom – Initiated share repurchase plan to managed dilution – Changed incentive programs to address option overhang |
 Operational Perspectives Operational Perspectives Larry Prior COO |
 2 CEO and COO Areas of Focus CEO and COO Areas of Focus CEO COO Execute via the Line Board/Legal Strategy/M&A Investor Relations Gov’t Affairs CFO (IT) Talent Management Shared Focus Operational Performance Program Management/SE Risk Management Contracts/Procurement Technology & Science Corporate Services Review Customer Focus and Interface Top Line Creation/Business Development Retention and Recruiting 10-Year Outlook 3-Year Strategy Annual Operating Plan Quarterly Earnings Monthly Operational Performance Weekly Action Plans Daily Issues |
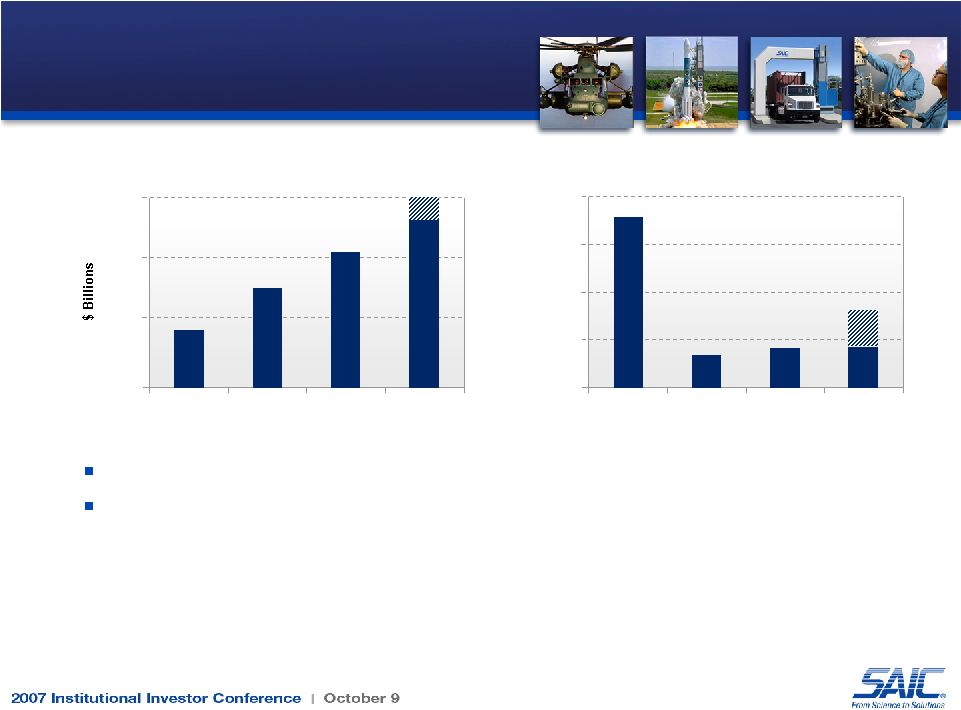
 3 Top Line Creation Top Line Creation Drivers of top-line growth – Employee-owners and entrepreneurs – Operations and division managers – Group presidents and business unit GM’s – Greg Henson and the corporate team Key metrics: – Backlog: $14.1B (Q2) – Book to bill: 0.8 H1, 0.9 Q2 – trending up – Conservative bookings and backlog definitions do not include ID/IQ master agreement values – Submitted pipeline awaiting award: ~$15B (Q2) same as Q1 – Significant wins since Q2; 6 wins >$100M each Greg Henson |
 4 Top Line Creation Top Line Creation YOY win expected value is up $2.9B YOY $ win rate is up 11% (now 72%) YOY $ win rate for >$100M up 43% (now 83%) YTD 15 wins >$100M Pursuing 102 opportunities >$100M Customer intimacy and recompetes Increase % of large SE&I pursuits Business process and tool refinement Adjacent market exploration Cross-company collaboration Growing the workforce (e.g. TMR, Gallup survey, training) IDIQ-Single Award (expected value): – ISEA Services Blue Velvet: ~$470M – Tactical C2 Integration Services: ~$460M – Expeditionary Combat Support System: ~$275M IDIQ-Multiple Award (expected value): – Alliant: ~$3B – HHS Enterprise Systems Development: ~$330M Non-IDIQ (expected value): – Automatic Dependent Surveillance Broadcast: ~$100M Backlog $14.1B ~$2.7B Expected Value not in Backlog ~$0.1B Multi IDIQs ~$2.6B Single IDIQs >$100M Wins (since end of Q2) Business Development Thrusts Performance Factors – through 9/7/2007 Healthy Book of Business – As of Q2 FY08 IDIQ Wins Also not in backlog: remaining expected value from IDIQ master agreements won prior years + + |
 5 Retention and Recruiting Retention and Recruiting Retention and Redeployment – Voluntary turnover - 14.3% (11.5% for scientists and engineers) – Redeployment reducing turnover (500 employees redeployed YTD) Recruiting: >5K YTD hires – Average time to fill a vacancy is 40 days Talent Management Review – Focused on succession planning, developing High Potentials Professional and Career Development – Foundation courses: leadership, program management, systems engineering, BD – Career Paths: program management fully rolled out; intelligence analysts, systems
engineering, and line management in development for pilot in FY08
Employee Survey – Launched in July with annual follow-on to track progress – Confirmed strong customer focus and entrepreneurial culture – Identified areas for improving frontline people management and communication Brian Keenan |
 6 Execution Execution Strong line management – Group presidents make markets – Business unit GMs have customer focus Program management, controls and SE Monthly reviews – Financial performance vs. plan and forecast • Revenue, PBT, fee, operating margin, rates, unallowable, timesold, DWC, AR – Business development • Submits, awards – Program management and performance – Retention and recruiting Joe Craver Deb Alderson Charles Koontz Stu Shea |
 Financial Overview Financial Overview Mark Sopp EVP and CFO |
 2 Agenda Agenda Income Statement Cash Flow Balance Sheet $450 or greater Cash flow from operations (millions) $0.83 - $0.88 Diluted EPS from continuing operations $8.70 - $9.00 Revenue (billions) FY08 Guidance Measure Income Statement Cash Flow Balance Sheet |
 3 Revenue Trends Revenue Trends Internal Revenue Growth 20% 15% 10% 5% 0% FY05 FY06 FY07 FY08* Revenue $9.0 $8.0 $7.0 $6.0 FY05 FY06 FY07 FY08* * FY08 reflects disclosed guidance range Uninterrupted growth since 1969 Internal growth beginning to accelerate – Recovery from cessation or leveling of large contracts (GIG-BE, Trailblazer, FCS) and lost recompetes (AF IPV, DNI CIO) – FY08 internal growth rate projected at 5-6% |
 4 FY07 Revenue Breakout FY07 Revenue Breakout Group Customer Contract Source CP 48% T&M 36% FFP 16% Multiple Award IDIQ 24% Single Award IDIQ 26% Standard Contract 34% GSA Schedule 16% Contract Type A1957-ID-02 Defense Solutions 30% Intelligence, Security & Technology 30% Infrastructure, Logistics & Product Solutions 22% IT & Network Solutions 18% Army 18% Navy/Marines 13% Commercial & State/Local 12% NASA 5% Air Force 9% Fed Civil 14% Intell/ Other DoD 29% |
    5 Revenue Acceleration Revenue Acceleration Next 3 Years Increased IR&D Collaborating on Larger Contracts Acquisition Synergies Aggressive Pipeline Post IPO to Q208 Focus on Recompetes BD Leadership Team Higher Growth Markets Organizational Alignment CRM Phase I Pre-IPO IPO FY07 Q2 FY08 Internal Growth Rate 3% 6% Target 6-9% Internal Revenue Growth |
 6 Operating Margin Trend Operating Margin Trend * FY08 reflects mid-point of disclosed range of 20- 30 bp improvement 5.5% 6.0% 6.5% 7.0% 7.5% FY05 FY06 FY07 FY08* Improving operating margin 20-30 bps per year – Despite 40 bps of FAS 123R expense in FY07 and FY08 – FY06 margin lower because of $83M loss on the Greek contract
|
 7 0 10 20 30 40 50 60 70 80 FY08 FY09 FY10 Option Vesting Stock Option Expense Converted to Vesting Stock Expense Option Expense Converted to Vesting Stock Expense FAS 123R expense builds to “normalized” state in FY10 Redirected many FY08 options to vesting stock (3:1) – Vesting stock expense is allowable; option expense is unallowable – Prior option program would have eroded annual margins 60-70 bps – Current option programs erode margins 30-40 bps in long term state Pre-Option Reduction Post-Option Reduction $41 $56 $73 0 10 20 30 40 50 60 70 80 FY08 FY09 FY10 Option $29 $36 $44 $12 $21 $29 Level Beyond |
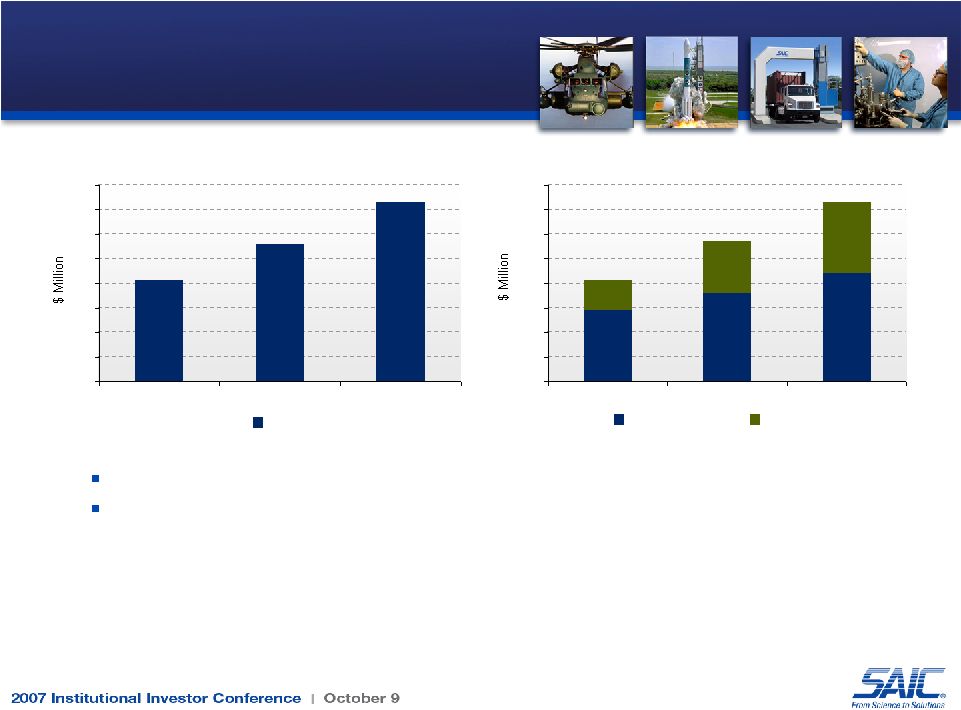
 8 Strategic Investment Areas Strategic Investment Areas $0 $20 $40 $60 $80 $100 $120 $140 $160 FY05 FY06 FY07 FY08 Q2 0.0% 0.5% 1.0% 1.5% 2.0% Bid & Proposal and Corp BD 1.7% 1.9% 1.8% $129 $77 $126 1.8% $157 $0 $5 $10 $15 $20 $25 $30 $35 FY05 FY06 FY07 FY08 Q2 0.0% 0.1% 0.2% 0.3% 0.4% 0.5% IR&D 0.4% 0.4% 0.5% $27 $34 $21 $25 0.4% $0 $20 $40 $60 $80 $100 FY05 FY06 FY07 FY08 Q2 0.0% 0.5% 1.0% 1.5% Corp IT 1.0% 1.2% 1.2% $79 $96 $51 $60 0.9% Growing our key investments Focused on delivering either top line growth or operational efficiencies Expect IT spend reductions FY10 |
  9 Margin Expansion – Key Steps Margin Expansion – Key Steps Cultural Awareness Profit Motivation Manager Training Greater Collaboration Reduce Corporate Spending More Effective IT Systems Aggressive Fee Negotiation on Subs and Materials Avoid or Recover Rate Varience Channel Investments to High Margin Business Higher Contract Fees Lower Costs Margin Expansion Improve Retention |
 10 Margin Expansion – End State Margin Expansion – End State Ultimate margins with current business base should be 8%-9% – Improve 20-30 bps per year Changes in business base could change end margins – Greater relative acceleration of logistics business (down) – Contractor reform actions: fee limits, holdbacks, investigations (down) – Customer shifts in contract mix ( FP/T&M up, CP down) – Greater relative acceleration of products business (up) Total 40-80 bps Fast growth in high-margin areas 10-20 bps More internal collaboration 10-20 bps Enhanced fee on M&S 20-40 bps Improve Contract Fees Total 45-95 bps Better rate/unallowable management 10-30 bps Return to normal IT spend 15-25 bps Cut overhead 20-40 bps Reduce Indirect Costs |
 11 Share Count Share Count Share count held in check with share repurchase program – Future repurchases subject to market conditions, stock price, and other cash uses
Reworked equity programs—retirement plan contributions and vested bonus stock
replaced with cash Option overhang should continue to fall as larger prior year grants mature Average Quarterly Diluted Shares 250 300 350 400 450 FY07 Q1 FY07 Q2 FY07 Q3 FY07 Q4 FY08 Q1 FY08 Q2 Preferred Shares Common Shares Option CSEs Vesting CSEs Option Overhang 10% 15% 20% FY07 Q1 FY07 Q2 FY07 Q3 FY07 Q4 FY08 Q1 FY08 Q2 |
 12 Income Statement Takeaways Income Statement Takeaways Revenue Diverse contract base mitigates risk Tracking to almost double pre-IPO internal growth rate Operating Profit/Margins G&A costs contained; increased BD and IR&D Tracking to deliver 20 – 30 bps YoY improvement Share Count Option overhang significantly reduced Repurchases have kept share creep in check EPS All EPS growth model elements on track Targeting 15% long term growth |
 13 Operating Cash Flow Trends Operating Cash Flow Trends DSO continues to improve year over year (FY08 Q2 was exceptional) FY08 operating cash flow reduction from FY07 driven primarily by: – Cash partially replacing equity compensation (~$50M) – Reclassification of excess option tax benefits to financing cash flow (~$30M) – Income tax refund/payment timing (~$50M) – Extra payroll tax payment in FY08 (~$40M) (guidance) FY06 FY07 FY08 Operating Cash Flow FY06 FY07 FY08 Q2 DSO 0 100 200 300 400 500 600 700 40 50 60 70 |
 14 0 (25) Net Cash & Shares After Repurchases (11) (200) Public & Private Repurchases to Keep Share Count Constant 11 175 Net Cash & Shares Before Repurchases 3 Price Appreciation (15) Stock Repurchased to Pay for Vesting Stock Taxes 5 Option Tax Benefits Net of Shares Repurchased for Tax 25 FAS 123R Non-Cash Option Expense 3 50 Vesting Stock Non-Cash Amortization Expense 2 30 Cash Option Exercise 4 80 ESPP Gross Share Count (Million Shares) Cash Flow (Million $) Notional FY08 Share and Cash Flows Notional FY08 Share and Cash Flows Annual equity programs increase cash flow by ~$175M – Real cash inflows from ESPP, option exercise are ~$110M – Non-cash expense from vesting stock & option programs are ~75M Repurchases of ~$200M needed to keep share count constant Annual equity grants running at ~7M options and ~5M vesting shares – ~25% of grants are forfeited |
 15 Cash Flow Takeaways Cash Flow Takeaways Investing Cash Flow Capex at $70 – $80M; figure 1% of revenue Expect acquisitions to require $300M-$400M cash per year Financing Cash Flow Option tax benefit ($60 - $70M/year) is real cash flow Repurchases are an “option” based on markets/pecking order “All In” Net annual cash generation provides for internal growth, acquisitions, capex, and share dilution management repurchases Operating Cash Flow Still exceeds net income by ~ 1.2x More frugal with equity compensation; using ~$50M cash to offset $60 - $70M of option tax benefit moved to financing per FAS 123R
|
 16 Balance Sheet Trends Balance Sheet Trends Net working capital excludes cash, debt, income taxes, and disc. ops. After-tax EBIT (Shareholder Equity + Net Debt) ROIC = -$500 $0 $500 $1,000 $1,500 $2,000 $2,500 $3,000 FY06 FY07 FY08 Q2 NWC Annual Percent Revenue 0% 10% 20% 30% FY06 FY07 FY08 Q2 ROIC Cash and Net Cash/Debt Cash Net Cash/Debt (Annualized) Debt/EBITDA (Annualized) FY06 FY07 FY08 Q2 0.0 0.5 1.0 1.5 2.0 2.5 0 100 200 300 400 FY06 FY07 FY08 Q2 0% 1% 2% 3% 4% 5% 6% Net Working Capital |
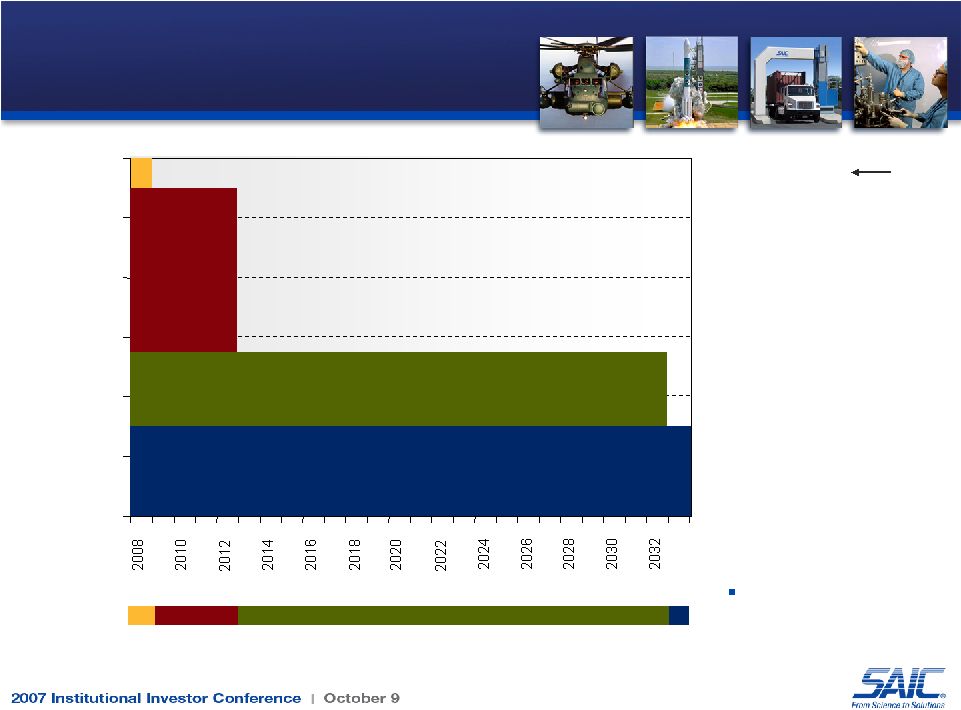 17 Maturity of Notes (LT Debt) Maturity of Notes (LT Debt) Average Interest Rate Libor + 350 bps 6.72% 6.52% 6.53% 5.78% $0 $200 $400 $600 $800 $1,000 $1,200 $100 M $300 M $550 M $250 M 9.00% 9.00% 6.50% 7.43% 5.78% Interest Rate Debt is in long- term notes at low, fixed rates |
 18 Debt Capacity Debt Capacity Initial capacity analysis indicates $2B in additional borrowings possible while still maintaining solid investment grade rating (BBB) Investment Grade Actual S&P 500 Median Theoretical S&P 500 Optimum ACN BA SAIC CSC GD LMT NOC RTN BAE L3 CAI 1.4% 0.2% 1.9% 1.7% 5.8% 12.3% 10.4% 12.5% 16.9% 8.7% 4.3% 2.9% 2.2% 2.7% 1.4% 0.0% 14.7% 0% 5% 10% 15% 20% AAA AA+ AA AA- A+ A A- BBB+ BBB BBB- BB+ BB BB- B+ B B- NR S&P 500 Sr. Bond Rating Distribution (Excluding Financials)
|
 19 Capital Deployment Capital Deployment Deploy “excess capital” wisely according to ROIC analysis Internal growth through IR&D, strategic campaigns Acquisitions to build out capabilities and customers – Typically deploy $300M-$400M at about 1x revenue – Not interested in buying simply to bulk up or deploy capital – Focus on mid-sized deals but ready for larger Stock buybacks through open market transaction – 40M share authorization (~30M shares remaining) |
 20 Balance Sheet Takeaways Balance Sheet Takeaways Assets $1.1 billion cash on hand Strong A/R management; DSO 65 – 70 days Liabilities Unfunded, 5 year credit facility $750 million $100 million of $1.2 billion Notes due 2/1/2008 Remaining balance fixed at 6.5% Capacity ~$750 million of cash that can be redeployed Credit rating A–; should be able to borrow an additional $2B and still maintain investment grade rating |
 21 Financial Summary Financial Summary Sustainable growth in shareholder value – Accelerating internal growth – Expanding operating margins – Deploying capital Consistent, demonstrated progress on all fronts Realistic, achievable path with identified enablers – IT systems modernization expected to enable cost efficiencies – Building pipeline of large opportunities – Margin expansion training completed across the organization – Improving cost discipline |
 Defense Solutions Group Defense Solutions Group Deb Alderson President |
 2 Group Structure and Focus Group Structure and Focus DEFENSE SOLUTIONS GROUP Revenue $2.5B Group President Deborah Alderson Tactical Systems & Solutions J. Gully $300 Systems & Tech. Solutions B. Gurley $250 Defense & Maritime Solutions T. Baybrook $600M Federal Comm. Solutions P. Dube $500M C4IT D. James $250M Analysis, Simulation, Systems Eng. & Training B. Seay $500M System Integration & Enterprise Life-Cycle Management Technical & Software Development – Missile Defense Systems Technical & Engineering Services - Software & Hardware Enterprise & Complex Network Services C4 Engineering & Network Centric Integration Modeling, Simulation & Training; Management Systems Major provider for Combatant Commanders; Air Force & Army # 1 contractor to Navy SPAWAR System Center San Diego #1 DISA Contractor Key provider to Naval Surface/ Under Sea Warfare Centers Major support of Army & Missile Defense Agency #1 integrator for Future Combat System |
 3 Key Customers and Capabilities Key Customers and Capabilities ` A1957-ID_06 Army 28% Navy 26% DISA 16% Other DoD 10% Other 11% Marines 4% Air Force 5% AOC – WSI ACC CAAS III SPAWAR System Centers Naval Surface Warfare Centers SEAPORT-e MRAP USMC SysCom Future Combat Systems Army Aviation & Missile Command Human Resources Command GIG-BE DGS NexGen MDA CoComs Joint Coast Guard/DHS Fed Civil State/Local Modeling and simulation Command, control and communications Technical and engineering services Enterprise and network- centric mission related systems Systems engineering and integration |
 4 Vision and Strategic Intent Vision and Strategic Intent The preferred thought leader and value-driven implementer of complex integrated enterprise and defense solutions that improve our national security and our customers’ mission success Increase large systems business…SE&I/Engineering agent Lead in interoperable, SOA solutions for joint C2 & C4 Build Cyber Related Business & Solutions Expand modeling, simulation, and training footprint Grow missile defense business Leverage FCS capabilities |
 5 Major Growth Drivers Major Growth Drivers People First – We hire the right people at the right time and treat them as our number one asset Integrated focus; no longer constrained by individual business units focused on a customer – Broad focus across the entire defense spectrum – Integrated systems solutions leveraging unique enterprise and system of systems experience Expertise in systems engineering and integration throughout the life- cycle; a cradle-to-grave market orientation Honest broker, unconstrained by OEM culture, permitting capability and value-driven solutions through an open business model Proven history of solving complex problems of national significance Flexibility in applications…engineering agent, LSI, Prime…large
program pursuits. Capable of defining, winning and executing complex,
life-cycle solutions programs Adept at task order execution as well as large scale program opportunities |
 6 Maturity of Business Portfolio Maturity of Business Portfolio EMERGING
GROWTH
MATURE
MARKET MATURITY VALUE MODELING AND SIMULATION STUDIES ANALYSIS & MANAGEMENT SERVICES NETWORK MANAGEMENT SERVICES TECHNICAL AND ENGINEERING SERVICES NETWORK CENTRIC COMMAND, CONTROL AND COMMUNICATIONS ENTERPRISE & CAPABILITY MANAGEMENT • Foundation for capability management • Builds on technical expertise • Focused on the front end of system life cycle • Grow and further secure our traditional base • Leverage technical expertise, customer intimacy, subcontractor management, and honest broker status • Leverage second-to-none knowledge of DISA core network • Expand to Services, other government agencies • New approach to SE&I delivering required capability without contractual authority over subs • SE&I “agent” delivering an open, composable C3 “platform” to meet evolving customer needs • FCS; MRAP integration • Apply proven reconfigurable simulator technology to growing flight simulation market • Leverages leadership in constructive and virtual simulations |
 7 Strategy for Future Growth Strategy for Future Growth 1990s Early 2000 Today 2010 Complex Stove-piped Systems Emergence of “General Contractors” Full Life Cycle Capability Solutions Acceleration of Shift from Products Toward Capability Solutions • Life Cycle Systems/ Solutions focused on capability • Acquisition Reform/need for honest broker – Make the Homeland Secure – Integrated Missile Defense – Global Strike – CANES Vertically Integrated Complex Systems Life Cycle Capability Solutions Engineering System Integration Capability Management • LSI Performance and Congressional oversight drives some Acq. functions back to Government • SE&I Contractor as an agent for PMO – SBI NET – DLA- Global FASI – Deepwater- Restructuring • Net-centric warfare (Network versus Platform) • DoD/DHS hires LSI’s to address SoS complexity – FCS – Deepwater • Systems Integration market dominated by a few systems programs • Little integration/ interoperability across systems – Missile Defense – Joint Strike Fighter |
 8 President’s Summary President’s Summary PEOPLE FIRST AGGRESSIVE AGILE ADAPTABLE Task Order Marketing Pure Play Opportunistic Stay Ahead Streamlined BD Process Margin Expansion Customer Intimacy Competition Target Campaign Protect the Base Follow the $$ The Way Ahead: Aggressive…Agile…Adaptable Organic Growth |
 Defense Solutions Group— Future Combat Systems Defense Solutions Group— Future Combat Systems John Gully Tactical Systems & Solutions Business Unit General Manager |
 2 Army Leadership’s View of FCS Army Leadership’s View of FCS Principal Army modernization program Benefits all US ground forces Builds on Army modular force organization Provides advanced capabilities Increases operational and strategic options Most affordable, effective way to modernize “We never want a fair fight, and with FCS, our Soldiers will have the ability to see first, understand first, and act first. FCS serves the present through spin-outs, but it is the future. We must keep it on track.” The Honorable Pete Geren - Secretary of the Army AUSA Institute of Land Warfare Breakfast - May 10, 2007 “FCS technologies will be vital to the Army’s ability to fight a nontraditional war such as the combat in Iraq. We’re up against an adaptive, asymmetric enemy who is changing his tactics every day. We need to give our soldiers every advantage.” General George Casey, Jr. – Chief of Staff, U.S. Army DefenseNews.com - 25 April 2007 |
 3 FCS System-of-Systems (SoS) FCS System-of-Systems (SoS) Manned Ground Vehicles (MGV) Non-Line of Sight Mortar (NLOS-M) Medical Vehicle Treatment (MV-T) FCS Recovery and Maintenance Vehicle (FRMV) Unmanned Aerial Systems (UAS) Class I UAS Class IV UAS Unattended Ground Systems (UGS) Tactical and Urban Unattended Ground Sensors Unmanned Ground Vehicles (UGV) Small UGV (SUGV) Armed Robotic Vehicle – Assault (Light) (ARV-A-L) MULE-C MULE-T Mounted Combat System (MCS) Infantry Carrier Vehicle (ICV) T-UGS U-UGS Medical Vehicle Evacuation (MV-E) Non-Line of Sight Launch System (NLOS-LS) Multifunction Utility/ Logistics and Equipment Countermine and Transport Reconnaissance And Surveillance Vehicle (RSV) Command and Control Vehicle (C2V) Common Chassis APS MRM Medium Range Munitions Centralized Controller Notional Non-Line of Sight Cannon (NLOS-C) |
 4 Lead Systems Integrator (LSI) Lead Systems Integrator (LSI) Focuses on system engineering, system integration, system planning and control Gets best of industry to work the hardware / software Total system integration responsibility |
 5 FCS One Team – Changing the Way We Do Business FCS One Team – Changing the Way We Do Business Lead Systems Integrator provides total system-of-systems integration, brings all stakeholders together, and delivers capability faster to our Warfighters 30% reduction in development-to-field timeline One integrated management team vs. multiple independent teams One step design process to integrate requirements to capabilities Delivers and integrated family of systems for the FCS Brigade Combat Team (FCS BCT), vs. a collection of individual platforms The whole is greater than the sum of the parts Best of industry Reduced life cycle cost Commonality across systems Designed-in availability Less Expensive Better Faster |
 6 SAIC FCS SDD Program Summary SAIC FCS SDD Program Summary SAIC and Boeing have formed a badgeless team in which SAIC shares Program and IPT leadership roles – Deputy Program Manger – Chief Architect – Chief Analyst SAIC’s technical leadership roles include: – Land Warfare Technology – MGVs, UGVs, C4ISR – Unmanned Aerial Vehicles – Operational and System of Systems Architecture Design & Analysis – System Engineering & Integration – Specialty Engineering – Training, Logistics – Distributed Interactive Simulation, Test & Evaluation – Software Integration – Risk Management SAIC’s Product Team leadership roles include: – Integrated Simulation & Test – Technology Development – Training Systems – Unmanned Ground Vehicles – Warfighter Systems SAIC’s Business Process roles include: – Earned Value Management Systems – Supplier Management & Procurement – Quality Assurance Workshare: 15% of Boeing contract cost (SAIC $2.7B) Contract Type: CP FF/IF Fixed Fee: 7.5% Incentive Fee: 7.5% |
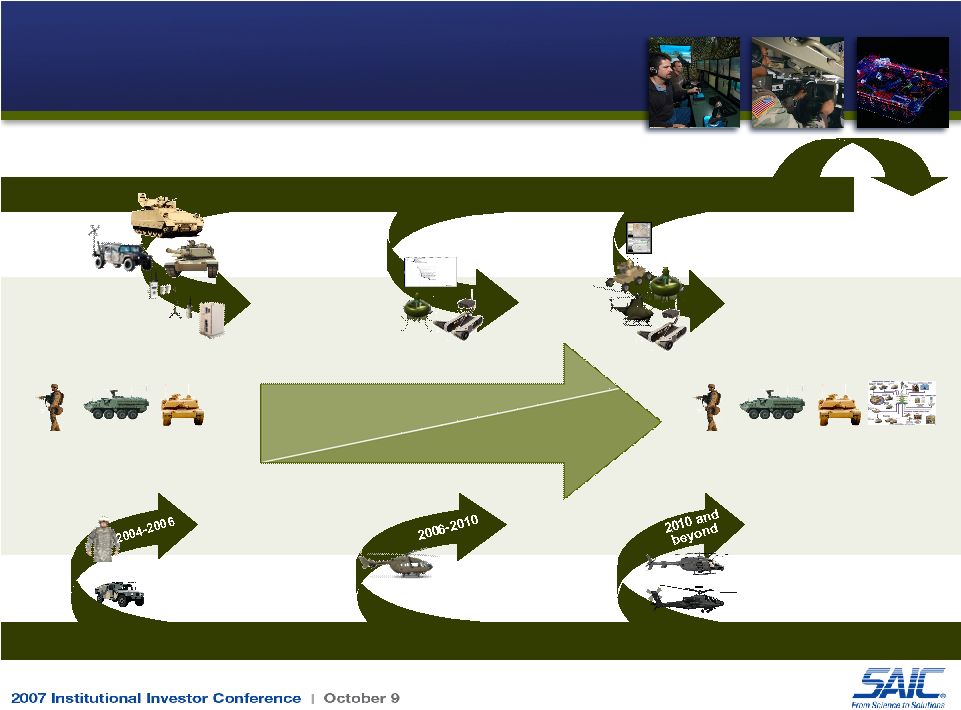 7 Related Advanced Developments – DCGS-A (V3)(2007) – Excalibur (2007) – LUH (2008) – WIN-T Inc 1 (2008-09) Lessons Learned OIF and OEF RAVEN Tactical UAV Interceptor Body Armor (IBA) Counter IED (Warlock, Duke) Uparmored Vehicles (UAH, AoA) Buffalo mine-clearing vehicle FCS – System Development and Demonstration Spin Out 1 FY 2008-10 Spin Out 2 FY 2010-12 Spin Out 3 FY 2012-15 - Limited Battle Command - JTRS (GMR/HMS) - Unattended Ground Sensors - Non-Line of Sight Launch Systems Systems/ Component - APS - Mast Mounted Sensor Options: - Small UGV - Class 1 UAV - ABCS to FCS Battle Command - ARV-A-L - Small UGV - Class I UAV - Class IV UAV Core Program Delivery FY 2015 Joint Networked System of Systems Army Modernization Strategy Army Modernization Strategy – GSS (2010-14) – ARH (2010-2014) – JTRS AMF (2011-12) – JTRS (GMR/HMS) – Apache Longbow Block III (2011) – JLTV (2012-13) – WIN-T Inc 2 (2014) Future Fielding 6 current force BCTs/yr (76) Fielding 15 FCS BCTs Current Infantry Stryker Heavy FCS Infantry Stryker Heavy Networked Sensors/ Shooters Schedule Network and Ground/ Air Vehicles A1957-ID-07 |
 8 FCS FY08 Funding FCS FY08 Funding FY08 President Budget at $3.7B…RDTE & Production Congressional Marks SAC-D: FCS fully funded at $3.7B No Adverse Language HAC-D: Net cut of $406M $190.3M from MGV $167.0M for Program Management (incl +$25M for Small Business Tech Insertion) +$1.1M for UAV $3.1M for UGV $47.0M for Sustainment & Training SASC: FCS fully funded at $3.7B Added $90M to restore Armed Robotic Vehicle program Added $25M to accelerate APS for Stryker HASC: Cut $867M $21.0M for CL IV UAV $46.7M for MULE UGV $233.0M from MGV $566.3M for Program Management and Fee Senate House |
 9 FCS Status and Outlook FCS Status and Outlook LRIP J&A signed by ASA Claude Bolton on 11 July 2007 – FY08 – FY13 President’s Budget identifies funding for the program – 18 MGV Early Production Vehicles – Spin Out 1: 17 BCTs – Spin Out 2: Enhanced Capabilities for Stryker – Spin-out 3: 9 BCTs – FCS: 3 BCTs (LRIP) – Logistics & Network Services, Training, and Fielding (LRIP) Army deployed ~1000 soldiers to Ft Bliss to evaluate FCS Key Highlights / Indicators – On budget, on schedule – Successful experiment 1.1 soldier exercise – Delivered FCS Build 1 software (~5M SLOCs) – Delivered first 12 current force network “Kits” – Initiated FCS Production planning – Discovery Channel “Future Weapons” – Major Prototype Builds Underway - All systems 65 test activities underway…all platforms in testing Strong Momentum… |
 10 FCS Expansion FCS Expansion +1 X15 Infantry Modular BCT Stryker Modular BCT Heavy Modular BCT X63 SPT BDEs X198 Also includes Configuration Management & Logistics Support FCS BCT Current Contract Future Opportunities |
  11 SAIC Capability Management – Addressing The Future Need SAIC Capability Management – Addressing The Future Need Exploits SAIC’s front-end strength, SoS qualifications, domain expertise across full life-cycle, honest broker reputation and ability to partner with our customers
to incorporate best-of-breed capabilities into full life-cycle,
best value solutions – Address our customers’ capability needs, not just their equipment needs – Provide disciplined SoS Life Cycle SE&I processes that are not corrupted by a
solutions view focused on platforms – Enable greater innovation by supporting honest equipment trades – Maximize probability of getting it right the first time and meeting customer
expectations – Achieve greater adaptability and flexibility through emphasis on GOTS/COTS, upgrades and spirals to offer a more robust solution (re: addressing changing user challenges)
Studies & Analysis Operational Design System Optimization Reqmts & Specs Design & Code Assy, Integrate & Test Production Train Field Support Capability Management Throughout the Life Cycle |
 Intelligence, Security and Technology Group Intelligence, Security and Technology Group Stu Shea President |
 2 Group Structure and Focus Group Structure and Focus INTELLIGENCE, SECURITY and TECHNOLOGY GROUP Revenue $2.8B Group President Stu Shea Space and Geospatial Intelligence Tony Moraco $450M Intelligence and Information Solutions Larry Cox $450M Technology and Advanced Systems Jurgen Gobien $650M Operations, Intelligence and Security John Thomas $800M Information Operations, Assurance, and Security Mission Integration Leo Hazlewood $450M National Intelligence Science R&D / Systems Engineering and Prototyping National Security Space / Intelligence Production Defense Intelligence and Operations Support #1 NCTC technical services contractor #1 NGA contractor for geospatial products Leading provider of operational intelligence support to deployed forces #2 NSA technical services contractor #1 DARPA R&D contractor |
 3 Key Customers and Capabilities Key Customers and Capabilities Air Force 17% National Security 62% Army 13% Navy 6% Other Gov’t 4% • Counterterrorism Analysis • Policy Support • Digital Asset Systems • IT Planning & Oversight • Watch Center Support • Translation Support • Analytical Training • HUMINT Support • Geospatial Production • SE&I • QRC • Advanced SIGINT Processing • Space Hardware • Cryptologic Support • Development and Integration • ONI/NMIC Analysis • Special Programs Support • Cryptologic Support • Information Dominance • Joint Intelligence OPS • NGIC Analysis • Target Intelligence Analysis • Counter IED • Advanced R&D • Operations Research • Space Systems Design • SE&I • Air / Space S&T Analysis • Technology Studies • UAS Support |
   4 IST Group Supports the Entire Intelligence Community IST Group Supports the Entire Intelligence Community Cryptologic Support Development and Integration ONI/NMIC Analysis/ACINT support Special Programs Support Technical Support SETA (SIGINT, COMM, AS&T, DSI&E) Special Technology Development Advanced SIGINT Processing Advanced Technology Studies Operational Experiments All-source Analysis Collection Management S&T Analysis Translation Services Analytic Support Analytic Training CI Analysis DNA Indexing Information Sharing (LEO) Intel Analysis & Technical Operations Support Watch Center Support Identity Management Support Cryptologic Support Information Dominance Joint Intelligence Operations NGIC Analysis Target Intelligence Analysis Air/Space S&T Analysis Cryptologic Support IO/IA/IW Support Requirements Support War Gaming Support Cryptologic Support CT Database Support Geospatial Support MCIA Database Support Analytical Support CBR Support Gamma Ray Vehicle Inspection IT Support IA and C&A Support Analytical Training Conference Support HUMINT Support Strategic Planning Technical Collection Technical Training Translation Services S&T Analysis Equipment QRC IO/IA/IW Support Processing QRC SIGINT Architecture Signal and S&T Analysis Acquisition Support Collection Management Geospatial Production Policy Support SE&I Studies and Assessments Counterterrorism Analysis Customs Enforcement Geospatial Architectures Planning and Policy Watch Center Support COOP Operations Research Nuclear Technical Support Enterprise Security Studies and Assessments Technical Services Translation Services Special Access Required Defense Intelligence Agency National Security Agency Army Intelligence Navy Intelligence Air Force Intelligence Marine Corps Intelligence Department of State Department of Energy Department of Treasury Department of Homeland Security Federal Bureau of Investigation Drug Enforcement Administration Coast Guard National Geospatial - Intelligence Agency National Reconnaissance Office • CT Analysis • Policy Support • Digital Asset Systems • Administrative Services • IT Planning & Oversight • Watch Center Support • Strategic Planning Analytic Support CBW Vulnerability Embassy Security Strategic Planning Facial Recognition |
 5 Vision and Strategic Intent Vision and Strategic Intent Top provider of full spectrum intelligence and security solutions to the national
security community: – Preferred partner for analysis, IT, ops support, tech ops support, and system
engineering and integration capabilities to the Intelligence and National Security Communities – Leading provider of intelligence services to downrange and contingency ops – Principal support contractor for the evolution of the O/DNI, Department of Homeland
Security, and Department of Defense Joint Functional Component
Commands Leading provider of intelligence, tools, and services for
information and network operations in defense, government, and commercial
infrastructure markets Top SE&I provider for DoD and NRO in National Security Space Top-global provider of all aspect, end-to-end physical, cyber and converged
security solutions Top developer and integrator for intelligence, surveillance, reconnaissance,
and targeting systems #1 Provider of system engineering and integration services for federal government’s large scale, multi-vendor Systems-of-Systems #1 Provider of specialized, rapid-response technologies to enable intelligence
and national security missions Leading provider of security, operational intelligence, and technology solutions
for U.S. strategic partners supporting U.S. international security
objectives Frontline Partner in National Security and Intelligence A vital member of the National Security Community…. confronting its toughest challenges Performing mission-critical tasks for our nation’s most important customers |
 6 Our People are our #1 Discriminator Success Depends on the People on our Team Success Depends on the People on our Team Breadth and depth of Group market penetration – Strategic, operational, and tactical levels – Location, location, location Breadth and depth of science and technology expertise – 33 of 64 SAIC Fellows in IST – Performing over half of all SAIC IR&D research – 5 patents issued in FY 08 USSTRATCOM Strategic Advisory Group AFCEA Intelligence Committee Intelligence and National Security Alliance Information Technology Association of America Defense Science Board Military Intelligence Corps Association Marine Corps Intelligence Association National Correlation Working Group NGA Advisory Board USGIF & GEOINT Symposium NSA/DARPA Leadership Panel Our Senior Executives Play Leadership Roles in a Wide Variety of External Organizations Operational acumen Real experience in enterprise systems Flexibility to provide special services Leading provider of cleared personnel |
 7 Maturity of Business Portfolio Maturity of Business Portfolio A1957-ID-11 VALUE R&D, T+E, EARTH SCIENCES IC AND DOD INTELLIGENCE SURVEILLANCE, RECONAISSANCE, and TARGETING HOMELAND SECURITY and DEFENSE DOWNRANGE OPERATIONS SPACE SUPERIORITY CYBER-SECURITY OPERATIONS INTEGRATED SECURITY SOLUTIONS INFORMATION OPERATIONS GLOBAL CHANGE IMPACT EMERGING
GROWTH MATURE
MARKET MATURITY |
 8 Explosive Growth Opportunities Explosive Growth Opportunities Cyber-Security Operations – Integrated defensive and offensive computer operations that protect national military, government, and industrial networks – $20B Market Value (09-11) Space Superiority Mission Systems – Satellite and ground systems that support space surveillance and offensive / defensive counter-space missions – $6B Market Value (09-11) Downrange Operations – Operational services and products that support defense and intelligence overseas missions – $1B Market Value (09-11) Global Change Impact Services – International operational intelligence and security services driven by global change – $0.5B Market Value (09-11) |
 9 Space Superiority: A National Imperative Space Superiority: A National Imperative On January 11, 2007, the Chinese demonstrated the ability to destroy Low Earth Orbit (LEO) satellites with a Direct Ascent Anti-Satellite (DA ASAT) missile. – D/NRO acknowledged Chinese laser tracking of US EO - LEO satellite in 2006 (Space News) – Intelligence Estimates project Chinese satellite-to-satellite capability in 2009 (AWS&T) SAIC will continue to perform on a broad range of space programs covering a wide range of technologies and operations (communications, navigation, imaging), but is targeting a growth market in the space superiority area – driven by these international events SAIC has participated on the cutting edge of the national space superiority initiative with thought leadership, operational sensor systems, and analytical support |
 10 President’s Summary President’s Summary We have a passion for executing the mission and a commitment to take on tasks of vital interest to the Nation…our people are mission critical
We have deep domain expertise in every mission area we support and
we are the best at what we do… recognized national treasures walk our hallways We apply creative science and disciplined engineering to create innovative solutions for our customers – people for whom we care and strive for their success We work as imaginative, driven, entrepreneurial teams and we move mountains to deliver results We share in our customers’ success, and we thrive on the hard work that gets us there At the same time, we take pride in our high ethical standards and joy in doing good deeds for our communities, families, friends, neighbors and fellow employees Our work enriches us and it is an honor to be part of SAIC
|
 Information Technology and Network Solutions Group Information Technology and Network Solutions Group Charles Koontz President |
 2 Group Structure and Focus Group Structure and Focus INFORMATION TECHNOLOGY & NETWORK SOLUTIONS GROUP Revenue $1.5B Group President Charles Koontz Technology Development & Science Discovery for Diagnosis & Treatment of Cancer & AIDS Managed IT & Infrastructure Services Health IT, Public Health & Biomedical Research Global Energy and Life Sciences Solutions and Integration Services Top Tier Provider for IT Services in Oil & Gas Upstream Sole Source Contractor for the National Cancer Institute #1 Provider of DHS data center migration, consolidation, and transformation solutions Top 3 Provider of IT Services to the Dept. of Health & Human Services Enterprise Solutions R. Cash $600M Health Solutions B. McCord $350M Commercial Business Services D. Charles $550M SAIC-Frederick (NCI) L. Arthur |
 3 Key Customers & Capabilities Key Customers & Capabilities Federal, DoD & Commercial Health 30% World-wide deployment and support of IT Health Solutions Disease Surveillance and Bioterrism Research Support and Knowledge Management Enterprise IT Optimization Full-Service IT Provider Enterprise and Business Strategy Solutions Infrastructure and Applications Rationalization, Consolidation and Transformation Information Content and Data Mgmt Solutions Infrastructure Services Mgmt and Support Civilian Government 35% Commercial Energy 35% – CDC – NCI-Frederick – TRICARE – Pfizer – BP – Scottish Power – Entergy – DHS – NASA – State/Local A1957-ID-09 Digital Oil Field Solutions Refinery of the Future Solutions Advanced Metering Infrastructure Application Development & Maintenance Enterprise Architecture Global Data Management Managed Network Services Infrastructure Outsourcing |
 4 Vision & Strategic Intent Vision & Strategic Intent DHS: achieve top-3 IT solutions provider status – Capture 3 data center migrations – Maintain #1 share position in EAGLE task order awards Expand NASA business following UNITeS re-compete win Become Top 5 provider of data management services in US & UK Energy Become Top 5 provider of IT services for Oil and Gas Upstream Become #1 IT provider to the Military Health System Expand role at CDC beyond bio-surveillance Double our revenue at NIH Become a top-3 provider of IT services at VA – including VHA, VBA and administrative groups Become a preferred contractor at CMS The Information Technology and Network Solutions center of excellence for SAIC
with responsibility for the Federal DoD (non-war-fighting), Federal Civil,
Health, and Commercial & International markets. By expanding our
presence in these markets, we will diversify our business thereby improving
our resiliency to accommodate any DoD market shifts.
|
 5 Major Growth Drivers Major Growth Drivers Use of domain knowledge to deliver IT business solutions ISO, ITIL, and CMMI certifications ensure customer focus and continuous improvement Flexible, platform-independent pricing models fit all client needs (both
federal and commercial) and bring creative pricing strategies to the federal space “Skin in the Game” performance metrics ensure strong, sustainable performance Integrated Services Management Center (ISMC) and SAIC India delivers outstanding infrastructure support services at reduced cost for federal and/or commercial clients Migration, consolidation, transformation model reduces footprint and cost of infrastructure and provides long-term cost reduction and performance improvement as applications and data are transformed Strong focus on specific vertical markets with outstanding pipeline— Homeland Security, Health, and Energy—provide the domain knowledge to deliver business solutions |
 6 DHS, Federal Health (MHS, VA, HHS, incl. NIH, CDC, FDA, CMS & NCI), NASA (UNITeS), Commercial (Energy, Pharma) NASA (other IT), Census, DOT, FAA, SSA NRC, OPM, SBA, Smithsonian, DOL, HUD, Armed Services IT, State and Local Gov, Process Industries Opportunistic Markets EPA, Agriculture, IRS, DOE (IT), Commerce UK Public Sector (Central Gov) “Pre-Strategic” Markets Strategic Markets Energy Strategic Campaigns Major Growth Markets Major Growth Markets Health |
 7 Strategic Campaign - Energy Strategic Campaign - Energy Core Business – Upstream Oil & Gas • Enhanced Oil recovery / Digital Oil Field - Engineering & IT Services – Downstream Oil & Gas • Pipelines, Refineries, Fuels, Retail – Power generation • Efficiency using Fossil Fuels • Carbon Capture and Sequestration – SmartGrid Solutions (T&D) – Energy Management Services • Benham Associates – Remote Power systems Key Customers and Programs – BP: Field of the Future – Shell: Collaborative Work Environments – Marathon: IT Outsourcing – Entergy: Applications & IT Infrastructure – Scottish Power: IT Outsourcing Innovative Capabilities, Solutions and Technologies – Process Modeling and Simulation – Process Optimization – Economic & Business Modeling – Regulatory Consulting – Environmental Solutions – Command & Control Systems – Products (Robotics, Inspection, etc.) – Outsourced R&D – Engineering Services (domain) – IT (Apps, Data, Infrastructure) |
 8 Strategic Campaign - Health Strategic Campaign - Health Core Business – Health Information Technology • Electronic Health Records • Technical & Semantic Interoperability • Privacy Protection • Data Mining & Knowledge Extraction • Federated Systems – Public Health • Biosurveillance • Situational Awareness, Bioinformatics • Technical & Semantic Interoperability – Life Sciences • Biomedical/Clinical Research • Clinical Trials Information Exchange (CRIX) • Adverse Events Surveillance – Health Services • Medicare Program Integrity • Behavioral Health Key Customers and Programs – Military Health System: CHCS Legacy Support, Tricare Online – Department of Veterans Affairs: VistA Contractor Support – Centers for Disease Control and Prevention: BioSense – National Institutes of Health: Malaria Vaccine Production Support – National Cancer Institute: NCI- Frederick FFRDC, caBIG Innovative Capabilities, Solutions and Technologies – Medical Terminology Provisioning – Health Grid – Drug Safety Information Exchange – Translational Research – DoD/VA Data Sharing – Disease Surveillance |
   9 Bio-Surveillance & Epidemiology Maturity of Business Portfolio Maturity of Business Portfolio Cancer & AIDS Research Data Lifecycle Management Software Portfolio Management • SOA & WS infrastructure & business process enablement & governance • Apps development in focused market domains (i.e. MHS, HHS, DHS, Oil & Gas) • Legacy apps consolidation & rationalization Data Lifecycle Management • Business Intelligence & Data Warehouse • Enterprise Content Management • Knowledge management for Drug Discovery • Information Security & Assurance • GIS and Data Analytics for supply chains Managed IT Services & Infrastructure Business Analysis & IT Transformation • Bio-terror threat detection & mitigation • Drug safety adverse events reporting • Pandemic detection and response services • Data center consolidation • Security infrastructure design, and integration • Managed networks • Service Centers (ISMC, NOC/SOC, India) • Technology assessment • Early Clinical Trial R&D • Bio-Medical Computing • Enterprise Architecture • Business Process Optimization & Automation • Shared Service Integration • Utility Computing / SaaS Energy Solutions • Digital Oil Field • SmartGrid • Enhanced Oil Recovery • Bio-Fuels VALUE EMERGING
GROWTH MATURE
MARKET MATURITY |
 10 President’s Summary President’s Summary We are well positioned to deliver growth and margin improvement through prudent execution of our strategy – Invest to grow faster in “strategic” markets: DoD & Civilian Health, Homeland Security, Commercial Energy & Life Sciences – Launch solution campaigns in Energy & Health and prepare to invest in our “pre-Strategic” markets in FY10/11 – Increased competitiveness via agile business models (e.g., service catalogue, performance based pricing) – Export our defense, intelligence and IT offerings to selected International commercial markets – Grow our high margin key business area via organic investments and M&A in business intelligence, software and IT transformation
|
 Infrastructure, Logistics and Product Solutions Group Infrastructure, Logistics and Product Solutions Group Joe Craver President |
 2 Group Structure and Focus Group Structure and Focus INFRASTRUCTURE, LOGISTICS and PRODUCT SOLUTIONS GROUP Revenue $2.0B Group President Joseph W. Craver III Security and Transportation Technology A. Preston $200M Science and Systems Engineering Solutions C. Zang $450M Logistics, Engineering, and Product Support Solutions J. Cuff $600M Engineering and Infrastructure R. Shokes $450M Systems Engineering, Mission Support, and OT&E Homeland Protection and Preparedness J. Ferriter $350M CBRN and Preparedness Services and Solutions Logistics and Product Support Solutions Non-Intrusive Inspection & Rad Detection Products Environmental, Energy, and Engineering Services #1 Provider of CBRN Services #1 installed base of large NII equipment Top 10 provider #1 Technical services NASA contractor #1 Non-OEM provider to Defense Logistics Agency |
 3 Key Customers and Capabilities Key Customers and Capabilities Homeland Security and Defense 26% NASA, Global Climate Change and Other 21% Energy, Environment and Infrastructure 25% Safety and Mission Assurance Earth Sciences Data Integration Operational Test and Evaluation Energy Management Environmental Services Design/Build of Tech- Intensive Infrastructure Supply Chain Management Asset Visibility Logistics Systems Product Support Integration Integrated Container Inspection Radiation Detection CBRN Services and Systems Non-Intrusive Imaging Systems Transportation Automation Logistics and Product Support 27% – DLA – DoD – NASA – NOAA – USGS – FAA – Comm’l – DoD – DOE – DHS – DoD – Int’l |
 4 Vision and Strategic Intent Vision and Strategic Intent #1 Non-OEM Sustainment provider to DoD #1 Operational Test and Evaluation provider for DoD #1 Provider of Security Products for ports and borders #1 provider of CBRN/ All-Hazards preparedness systems and services in US Top 3 Integrated Energy Management Services provider #1 Integrator of Earth sciences/ climate change data in support of research and national policy formation Provide Life-Cycle Technical Solutions with Deep Domain Content to Homeland Security, Energy, Logistics, Environmental, and Earth Sciences Markets |
 5 Major Growth Drivers Major Growth Drivers Superior performance in Non-Intrusive Inspection – Patented technology drives greater penetration and throughput, smaller footprint – Security and Commerce Proprietary technology platform drives supply chain efficiency Deep CBRN expertise makes us private sector supplier of choice End-to-end Energy Management Services solution provider Deep talent base and exceptional reputation in Test and Evaluation community keeps us the market leader Deep reputation for quality and commitment to safety at NASA Lifecycle technology deployment skills and experience Robust Health and Safety program and record of success 6 SAIC combines deep domain and technical expertise with customer understanding to deliver Life-Cycle Technology Solutions across our markets
|
 6 Maturity of Business Portfolio Maturity of Business Portfolio Energy Homeland Security/Defense Environmental/ Infrastructure Build Commercial Energy business lines Leverage Lifecycle Solutions Delivery acquisition(s) Leverage Lifecycle Solutions Delivery acquisition(s) to grow capabilities Follow Commercial customers internationally ICIS/HE deployment Grow product portfolio Expand CBRN services Expand on training portfolio Traditional Logistics & Systems Engineering Prime Vendor/ Managed Services Testing & Evaluation Adapt to changing procurement patterns Streamline systems Position for next NASA era Pursue growing govt. outsourcing opportunities Increase value added VALUE EMERGING
GROWTH MATURE
MARKET MATURITY |
 7 Integrated Strategy for Trade Security Integrated Strategy for Trade Security P7500 High Energy Product Line Data analysis, management, and integration ICIS S/W Platform Rapid IR&D Program + Integrated Cargo Inspection System – ICIS SAFE Ports/ SFI pilots Military Mobile VACIS VACIS Family of Products Gamma-based Radiation Monitors Mobile VACIS Relocatable Rail Pallet Portal Optical Character Recognition P H A S E 1 P H A S E 2 P H A S E 3 Mobile Rail Other |
 8 CBRN Lifecycle Solutions CBRN Lifecycle Solutions Basic Research Applied Research Engineering & Design Analysis & Assessment Integration & Implementation Training & Exercise Logistics & Sustainment From Science to Solutions Edgewood Chem & Bio Center Naval Research Lab DTRA Natick Soldier Center Naval Health Research Center Chemical Weapons Disposal Support CBRNE Mail Screening CB Protective Mask Programs Department of Defense Installation Protection CB Protective Mask Programs Natl. Guard Analytical Laboratory Systems Center for Domestic Preparedness Army Chemical and MP School Edgewood Chem & Bio Center US Marine Corps/ Pre-Positioned Equipment PODS Department of Homeland Security Research and Development Program Management & Technical Support Systems Integration Training, Exercise, Doctrine CBRN/ 1st Responder Logistics |
 9 Logistics Investments Paying Off Logistics Investments Paying Off IPV Qualifications Integrated Logistics Toolset w/ Repairables Capability POLCHEM IR&D RESET IR&D DLA Repairables Varec Acquisition Fuels management for DLA Automated tank gauging Outsourcing of Defense Fuel Supply Point Investments Legend Opportunities Contracts TIRES ProcureNet Acquisition Purchase Place/Plus PVMRO Quals 40,000 Qualified Vendors Integrated Logistics Toolset Advanced Logistics Technologies AIT/RFID UID Advanced Logistics Systems |
 10 Building Portfolio of Capabilities in Energy (Non-IT) Building Portfolio of Capabilities in Energy (Non-IT) Benham Domain Engineering Process Resources CCS Utility Capabilities EMS Consulting CCS Domain Engineering Utility Capabilities EMS Consulting Benham Utility Capabilities EMS Consulting Utility Capabilities EMS Consulting Benham Core SAIC Adds project delivery skills Increases EMS credibility and capacity Acquire domain engineering skills Begin pursuit of CCS expertise– building on environmental heritage Add Biofuels process expertise Grow Benham engineering base Continue pursuit of CCS expertise Investment areas: Talent Customer Solutions Engineering skills |
 11 Leadership in Climate Change Leadership in Climate Change NOAA NASA DOE USCG Air Force NSF FAA Navy USGS MMS Corp of Engineers EPA Data Collection - Air, Ground, Sea, Space Data Integration - Architecture, Systems, Expertise Research and Policy Support Ocean Observation Initiative Meteorological Training Marine Domain Awareness Data Infrastructure Operational Modeling Climate Change Support Oil and Gas Support Landsat data processing Operational Modeling Data Collection Earth Sciences Research Research Modeling Environmental Support Environmental Support Laboratory Management Environmental Support Systems Integration |
 12 President’s Summary President’s Summary We are well-positioned to deliver growth and profitability to our shareholders and distinctive capabilities and solutions to our customers: – Delivering Energy Management Services and Engineering capabilities to a nation struggling with fast-rising energy costs – Helping protect the Homeland with CBRN, Preparedness, and Trade Security solutions – Supporting the Department of Defense with logistics and product sustainment solutions – Playing a leadership role in our nation’s Climate Change research and policy program – Supporting NASA in its human spaceflight and exploration missions
|
 Infrastructure, Logistics and Product Solutions Group— Non-Intrusive Inspection Systems Infrastructure, Logistics and Product Solutions Group— Non-Intrusive Inspection Systems Alex Preston Security and Transportation Technology General Manager |
 2 Business/Product Overview Business/Product Overview Imaging inspection systems Gamma ray and X-ray imaging for cargo and vehicles Sensing and classification products Identification of radiation sources, explosives, chemicals, and other hazardous materials Intermodal solutions OCR, digital imaging, and biometrics to streamline terminal processes Railway and road systems RFID and OCR systems for rail management and traffic enforcement Integrated solutions Combinations of technologies for complex requirements |
 3 Veracruz, Mexico Otay Mesa, California Non Intrusive Inspection (VACIS) Overview Non Intrusive Inspection (VACIS) Overview |
 4 Integrated Cargo Inspection System (ICIS) Overview Integrated Cargo Inspection System (ICIS) Overview System to scan vehicles without impeding traffic Provides assurance of security Integrates data from many sources: – Gamma ray imaging – Radiation scanning – OCR equipment Identification – Driver data Console displays integrated data Streamlines inspection processes Fixed and mobile configurations A1957-ID-08 |
 5 Integrated Cargo Inspection System (ICIS) Overview Integrated Cargo Inspection System (ICIS) Overview |
 6 Integrated Cargo Inspection System (ICIS) Overview Integrated Cargo Inspection System (ICIS) Overview |
 7 Market / Growth Opportunities Market / Growth Opportunities Safe Ports Act – 100% screening of US bound containers – Secure Freight Initiative – 7 port pilots in 2007/2008 – Congressional Feedback • October: Southampton, Honduras, Pakistan • April: Oman, Hong Kong, Singapore, Korea Container Security – Information Management – US Targeting Center Pilot in progress Air Cargo Security – Democrat’s Security Initiative Ship-To-Ship Container Transfer – Product Initiative Military Mobile market/aftermarket opportunity |
 8 P7500 in Southampton, UK High Energy Portal (P7500) Product Development High Energy Portal (P7500) Product Development First deployment of new core X-Ray technology Rapid development (less than 12 months) and deployment Deployed as part of Secure Freight Initiative Significant return on investment in less than one year SAIC is setting the standard for ‘commerce and security’ |
 9 High Energy Portal (P7500) Product Development High Energy Portal (P7500) Product Development |
 10 High Energy Mobile Product Development High Energy Mobile Product Development |
 11 High Energy Mobile Product Development High Energy Mobile Product Development |
 12 High Energy Mobile Product Development High Energy Mobile Product Development What does it take to be successful in the Security Products business? Competitive Pricing – SAIC commercial price for a mobile x-ray system will be $2.4M – 25% lower cost than competitive products Greater Effectiveness/Value – Higher throughput (price/performance) – Lower lifecycle (service) costs Lower Safety Risk – Smallest control area – Lowest dose to driver – Lowest dose to cargo Rapid Development First production unit delivery will be Dec 2007 |
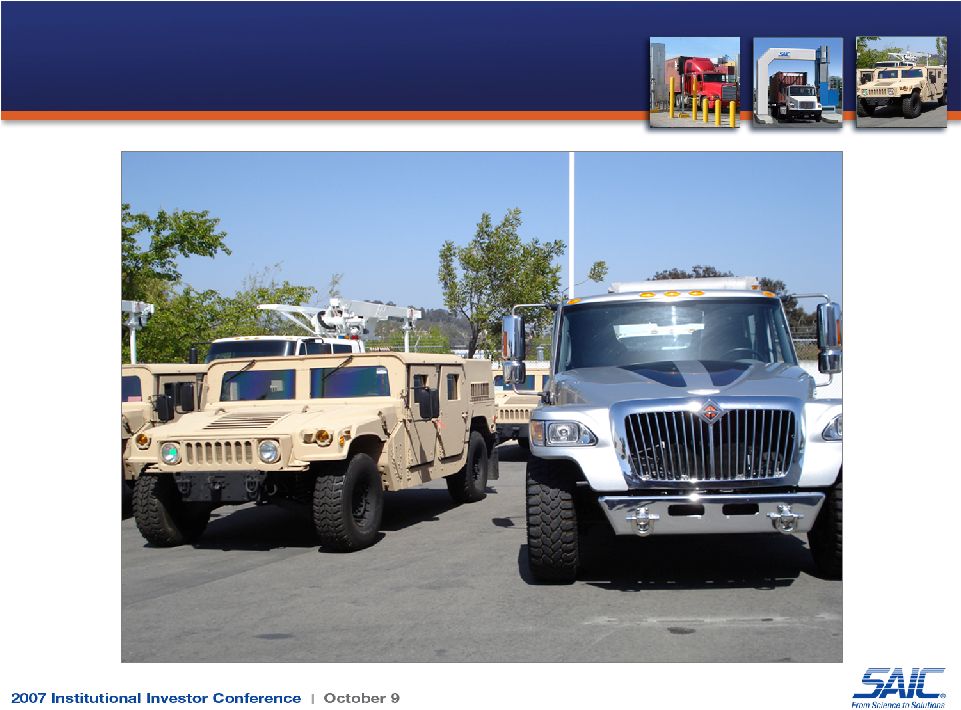
 13 Military Mobile Applications Military Mobile Applications |
 14 Military Mobile Applications Military Mobile Applications |
 15 Military Mobile Applications Military Mobile Applications 23 Military Mobile VACIS units in production – Delivery schedule: 4-5 per month from May through September – Likely shipment South West Asia In theater maintenance and support provided by SAIC – Complements ‘Award Winning’ maintenance and service in Iraq Commercial product for aftermarket and military applications
|
 16 Next Generation Mil Mobile Product Development Next Generation Mil Mobile Product Development A1957-ID-09 |
 17 Next Generation Mil Mobile Product Development Next Generation Mil Mobile Product Development A1957-ID-09 |
 18 Spectroscopic Portal Option/Upgrade Hutchison Port Holdings Pilot (IP6500) Product Development Hutchison Port Holdings Pilot (IP6500) Product Development ‘ICIS in a box’ combining X-Ray and Advanced Spectroscopic Portal (ASP) Reduce footprint, civil works costs, maintenance compared to ICIS Hutchison Port Holdings currently evaluating the integrated unit 6 months from specification to first production unit Exploits SAIC unique integration capabilities |
 19 Driver holding area Control booth Normalization/maintenance parking location Info marquee Relocatable shielding CAARS Conceptual Design CAARS Conceptual Design |