
|
|
ANNUAL REPORT PURSUANT TO SECTION 13 OR 15(d) OF THE SECURITIES EXCHANGE ACT OF 1934
|
|
|
TRANSITION REPORT PURSUANT TO SECTION 13 OR 15(d) OF THE SECURITIES EXCHANGE ACT OF 1934
|
|
For the transition period from ________________ to ________________
|
|
|
|
|
|
(State or other jurisdiction of incorporation of organization)
|
(I.R.S. Employer Identification No.)
|
|
500 North Shoreline, Ste. 800, Corpus Christi, Texas, U.S.A.
|
78401
|
|
|
(U.S. corporate headquarters)
|
(Zip Code)
|
|
|
|
|
|
(Canadian corporate headquarters)
|
(Zip Code)
|
|
(
|
||
|
(Registrant’s telephone number, including
area code)
|
|
Title of each class:
|
Trading Symbol(s)
|
Name of each exchange on which registered:
|
|
|
|
|
|
☒
|
☐ Accelerated filer
|
|
☐ Non-accelerated filer
|
|
|
|
|
Country
|
State/Province
|
Project
|
Location
(Latitude)
|
Location
(Longitude)
|
Equity
Interest
|
Operator
|
Stage
|
Mining
Method
|
Mineralization
Style
|
|
|
|
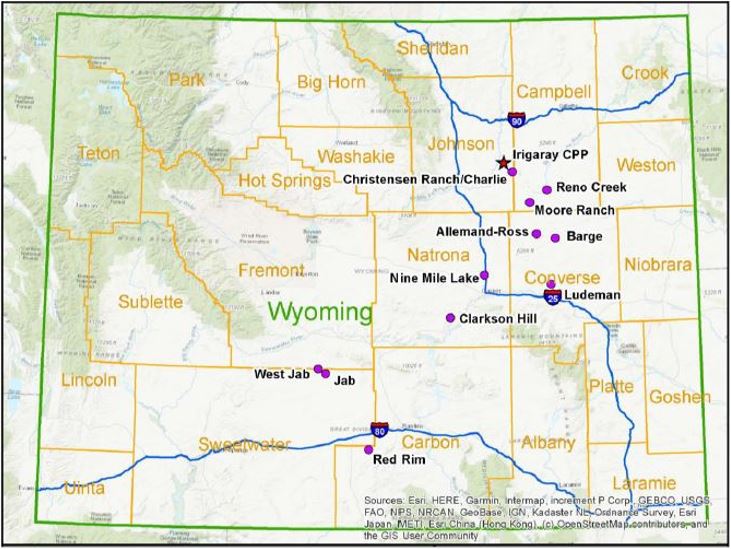
Allemand-Ross
|
43.3101
|
-105.7787
|
100%
|
UEC
|
Exploration Stage
|
ISR
|
Roll-Front
|
|
Antelope
|
42.2263
|
-107.9095
|
100%
|
UEC
|
Exploration Stage
|
ISR
|
Roll-Front
|
||
|
Barge
|
43.2729
|
-105.5905
|
100%
|
UEC
|
Exploration Stage
|
ISR
|
Roll-Front
|
||
|
Black Hills
|
44.7764
|
-104.8831
|
100%
|
UEC
|
Exploration Stage
|
ISR
|
Roll-Front
|
||
|
Brown Ranch
|
43.7377
|
-105.9684
|
100%
|
UEC
|
Exploration Stage
|
ISR
|
Roll-Front
|
||
|
Bull Springs
|
42.1584
|
-107.6305
|
100%
|
UEC
|
Exploration Stage
|
ISR
|
Roll-Front
|
||
|
Central Shirley Basin
|
42.3378
|
-106.4100
|
100%
|
UEC
|
Exploration Stage
|
ISR
|
Roll-Front
|
||
|
Charlie
|
43.8274
|
-106.0594
|
100%
|
UEC
|
Exploration Stage
|
ISR
|
Roll-Front
|
||
|
Christensen Ranch
|
43.7982
|
-106.0235
|
100%
|
UEC
|
Exploration Stage
|
ISR
|
Roll-Front
|
||
|
Clarkson Hills
|
42.6593
|
-106.7006
|
100%
|
UEC
|
Exploration Stage
|
ISR
|
Roll-Front
|
||
|
Crooks Creek
|
42.2867
|
-107.7660
|
100%
|
UEC
|
Exploration Stage
|
ISR
|
Roll-Front
|
||
|
Crook's Mountain
|
42.3840
|
-107.9060
|
100%
|
UEC
|
Exploration Stage
|
ISR
|
Roll-Front
|
||
|
Crossroads
|
43.0040
|
-105.6364
|
100%
|
UEC
|
Exploration Stage
|
ISR
|
Roll-Front
|
||
|
Cyclone Rim
|
42.2943
|
-108.3332
|
100%
|
UEC
|
Exploration Stage
|
ISR
|
Roll-Front
|
||
|
East Shirley Basin
|
42.3192
|
-106.1616
|
100%
|
UEC
|
Exploration Stage
|
ISR
|
Roll-Front
|
||
|
Gas Hills
|
42.7094
|
-107.6521
|
100%
|
UEC
|
Exploration Stage
|
ISR
|
Roll-Front
|
||
| United States | Wyoming |
Horse Creek
|
42.5957
|
-106.9867
|
100%
|
UEC
|
Exploration Stage
|
ISR
|
Roll-Front
|
|
Irigaray
|
43.8683
|
-106.1186
|
100%
|
UEC
|
Exploration Stage
|
ISR
|
Roll-Front
|
||
|
Jab/West Jab
|
42.2209/42.2611
|
-108.0439/
-108.1225
|
100%
|
UEC
|
Exploration Stage
|
ISR
|
Roll-Front
|
||
|
Ludeman
|
42.9119
|
-105.6277
|
100%
|
UEC
|
Exploration Stage
|
ISR
|
Roll-Front
|
||
|
Moore Ranch
|
43.5652
|
-105.8480
|
100%
|
UEC
|
Exploration Stage
|
ISR
|
Roll-Front
|
||
|
Mule Creek
|
42.2118
|
-105.8143
|
100%
|
UEC
|
Exploration Stage
|
ISR
|
Roll-Front
|
||
|
Niles Ranch
|
43.8024
|
-105.7961
|
100%
|
UEC
|
Exploration Stage
|
ISR
|
Roll-Front
|
||
|
Nine Mile Lake
|
42.9807
|
-106.3278
|
100%
|
UEC
|
Exploration Stage
|
ISR
|
Roll-Front
|
||
|
Pine Ridge
|
43.4591
|
-106.0725
|
100%
|
UEC
|
Exploration Stage
|
ISR
|
Roll-Front
|
||
|
Pine Tree U1
|
43.6173
|
-105.7860
|
100%
|
UEC
|
Exploration Stage
|
ISR
|
Roll-Front
|
||
|
Pumpkin Creek
|
43.8163
|
-105.8955
|
100%
|
UEC
|
Exploration Stage
|
ISR
|
Roll-Front
|
||
|
Red Rim
|
41.6502
|
-107.5755
|
100%
|
UEC
|
Exploration Stage
|
ISR
|
Roll-Front
|
||
|
Reno Creek
|
43.6796
|
-105.7226
|
100%
|
UEC
|
Exploration Stage
|
ISR
|
Roll-Front
|
||
|
Ross Flats
|
43.5224
|
-105.8861
|
100%
|
UEC
|
Exploration Stage
|
ISR
|
Roll-Front
|
||
|
Sand Creek
|
42.7007
|
-105.2645
|
100%
|
UEC
|
Exploration Stage
|
ISR
|
Roll-Front
|
||
|
South Pine Ridge
|
43.1204
|
-105.9251
|
100%
|
UEC
|
Exploration Stage
|
ISR
|
Roll-Front
|
||
|
South Reno Creek
|
43.6440
|
-105.6199
|
100%
|
UEC
|
Exploration Stage
|
ISR
|
Roll-Front
|
|
Country
|
State/Province
|
Project
|
Location
(Latitude)
|
Location
(Longitude)
|
Equity
Interest
|
Operator
|
Stage
|
Mining
Method
|
Mineralization
Style
|
|
Uranium Projects
|
|||||||||
|
South Sweetwater
|
41.9694
|
-107.9820
|
100%
|
UEC
|
Exploration Stage
|
ISR
|
Roll-Front
|
||
|
Stewart Creek
|
43.3124
|
-105.7342
|
100%
|
UEC
|
Exploration Stage
|
ISR
|
Roll-Front
|
||
|
Taylor Ranch
|
43.5578
|
-106.0098
|
100%
|
UEC
|
Exploration Stage
|
ISR
|
Roll-Front
|
||
|
Twin Buttes
|
42.2316
|
-107.7205
|
100%
|
UEC
|
Exploration Stage
|
ISR
|
Roll-Front
|
||
|
West Beaver Rim
|
42.5967
|
-108.1568
|
100%
|
UEC
|
Exploration Stage
|
ISR
|
Roll-Front
|
||
|
West Crook's Creek
|
42.2984
|
-107.8603
|
100%
|
UEC
|
Exploration Stage
|
ISR
|
Roll-Front
|
||
|
West Sweetwater
|
42.1318
|
-108.0931
|
100%
|
UEC
|
Exploration Stage
|
ISR
|
Roll-Front
|
||
|
|
Burke Hollow
|
27.6756
|
-97.5176
|
100%
|
UEC
|
Exploration Stage
|
ISR
|
Roll-Front
|
|
|
Goliad
|
28.8686
|
-97.3433
|
100%
|
UEC
|
Exploration Stage
|
ISR
|
Roll-Front
|
||
| Texas |
La Palangana
|
28.2638
|
-98.3959
|
100%
|
UEC
|
Exploration Stage
|
ISR
|
Roll-Front
|
|
|
Salvo
|
28.2632
|
-97.7889
|
100%
|
UEC
|
Exploration Stage
|
ISR
|
Roll-Front
|
||
|
Longhorn
|
28.1700
|
-98.1200
|
100%
|
UEC
|
Exploration Stage
|
ISR
|
Roll-Front
|
||
|
|
Anderson
|
34.1829
|
-113.1632
|
100%
|
UEC
|
Exploration Stage
|
Conventional
|
Tabular
|
|
| Arizona |
Los Cuatros
|
33.548
|
-112.322
|
100%
|
UEC
|
Exploration Stage
|
Conventional
|
Tabular
|
|
|
Workman Creek
|
33.50
|
-110.57
|
100%
|
UEC
|
Exploration Stage
|
Conventional
|
Tabular
|
||
|
New Mexico
|
C de Baca
|
34.18
|
-107.15
|
100%
|
UEC
|
Exploration Stage
|
Conventional
|
Tabular
|
|
|
Dalton Pass
|
35.40
|
-108.14
|
100%
|
UEC
|
Exploration Stage
|
Conventional
|
Tabular
|
||
|
|
|
Alexandra
|
58.023
|
-109.789
|
21.05%
|
Orano Canada Inc.
|
Exploration Stage
|
Conventional
|
Unconformity Related
|
|
Axis Lake
|
59.304
|
-106.136
|
100.00%
|
UEC
|
Exploration Stage
|
Conventional
|
Unconformity Related
|
||
|
Beatty River
|
57.897
|
-109.542
|
32.76%
|
Orano Canada Inc.
|
Exploration Stage
|
Conventional
|
Unconformity Related
|
||
|
Black Lake
|
59.1167
|
-105.905
|
51.43%
|
UEC
|
Exploration Stage
|
Conventional
|
Unconformity Related
|
||
|
Brander Lake
|
58.2895
|
-109.888
|
49.10%
|
Orano Canada Inc.
|
Exploration Stage
|
Conventional
|
Unconformity Related
|
||
|
Candle Lake
|
57.9969
|
-104.93
|
12.50%
|
Denison Mines Corp.
|
Exploration Stage
|
Conventional
|
Unconformity Related
|
||
|
Christie Lake
|
57.8128
|
-104.86
|
82.77%
|
UEC
|
Exploration Stage
|
Conventional
|
Unconformity Related
|
||
|
Close Lake
|
57.9729
|
-105.082
|
5.16%
|
Orano Canada Inc.
|
Exploration Stage
|
Conventional
|
Unconformity Related
|
||
| Canada | Saskatchewan |
Cree Extension
|
57.5881
|
-105.551
|
15.05%
|
Cameco Corporation
|
Exploration Stage
|
Conventional
|
Unconformity Related
|
|
Diabase
Peninsula
|
57.4294
|
-106.913
|
100.00%
|
UEC
|
Exploration Stage
|
Conventional
|
Unconformity Related
|
||
|
Erica
|
58.1465
|
-109.731
|
49.10%
|
Orano Canada Inc.
|
Exploration Stage
|
Conventional
|
Unconformity Related
|
||
|
Hidden Bay
|
58.157
|
-103.88
|
100.00%
|
UEC
|
Exploration Stage
|
Conventional
|
Unconformity Related
|
||
|
Horseshoe-Raven
|
58.1331
|
-103.76
|
100.00%
|
UEC
|
Exploration Stage
|
Conventional
|
Unconformity Related
|
||
|
Key West
|
57.2731
|
-106.217
|
100.00%
|
UEC
|
Exploration Stage
|
Conventional
|
Unconformity Related
|
||
|
Laurie
|
57.6579
|
-108.721
|
32.99%
|
Orano Canada Inc.
|
Exploration Stage
|
Conventional
|
Unconformity Related
|
||
|
Millennium
|
57.5138
|
-105.639
|
15.05%
|
Cameco Corporation
|
Exploration Stage
|
Conventional
|
Unconformity Related
|
||
|
Mirror River
|
57.6078
|
-108.423
|
32.34%
|
Orano Canada Inc.
|
Exploration Stage
|
Conventional
|
Unconformity Related
|
||
|
Moon Lake
|
57.4669
|
-105.634
|
10.07%
|
Orano Canada Inc.
|
Exploration Stage
|
Conventional
|
Unconformity Related
|
||
|
Moore Tomblin
|
57.4512
|
-105.135
|
6.80%
|
Orano Canada Inc.
|
Exploration Stage
|
Conventional
|
Unconformity Related
|
||
|
Nikita
|
58.0107
|
-109.574
|
12.72%
|
Orano Canada Inc.
|
Exploration Stage
|
Conventional
|
Unconformity Related
|
||
|
Country
|
State/Province
|
Project
|
Location (Latitude)
|
Location (Longitude)
|
Equity Interest
|
Operator
|
Stage
|
Mining
Method
|
Mineralization Style
|
|
Uranium Projects
|
|||||||||
|
Riou Lake
|
59.0491
|
-106.156
|
100.00%
|
UEC
|
Exploration Stage
|
Conventional
|
Unconformity Related
|
||
|
Roughrider
|
58.3374
|
-104.021
|
100.00%
|
UEC
|
Exploration Stage
|
Conventional
|
Unconformity Related
|
||
|
Shea Creek
|
58.1804
|
-109.49
|
49.10%
|
Orano Canada Inc.
|
Exploration Stage
|
Conventional
|
Unconformity Related
|
||
|
Uchrich
|
57.7196
|
-108.483
|
30.48%
|
Orano Canada Inc.
|
Exploration Stage
|
Conventional
|
Unconformity Related
|
||
|
Waterfound
River
|
58.4588
|
-104.548
|
12.90%
|
Orano Canada Inc.
|
Exploration Stage
|
Conventional
|
Unconformity Related
|
||
|
West Bear
|
57.8744
|
-103.975
|
100.00%
|
UEC
|
Exploration Stage
|
Conventional
|
Unconformity Related
|
||
|
Wheeler River
|
57.5000
|
-105.421
|
5.00%
|
Denison Mines Corp.
|
Development
|
Conventional
|
Unconformity Related
|
||
|
Wolly
|
58.3927
|
-103.799
|
6.38%
|
Orano Canada Inc.
|
Exploration Stage
|
Conventional
|
Unconformity Related
|
||
|
Nunavut
|
Kiggavik
|
64.3752
|
-97.7685
|
16.91%
|
Orano Canada Inc.
|
Exploration Stage
|
Conventional
|
Unconformity Related
|
|
|
Paraguay
|
Yuty
|
25.2702
|
56.3125
|
100.00%
|
UEC
|
Exploration Stage
|
ISR
|
Roll-Front
|
|
|
Oviedo
|
25.2702
|
56.2828
|
100.00%
|
UEC
|
Exploration Stage
|
ISR
|
Roll-Front
|
||
|
Titanium Projects
|
|||||||||
|
Paraguay
|
Alto Parana
|
24.8147
|
54.9083
|
100.00%
|
UEC
|
Exploration Stage
|
Conventional
|
Surficial
|
|
|
Acres
|
Hectares
|
State Leases
|
Fee Mineral Leases
|
Federal Lode Mining Claims
|
Provincial Mineral Dispositions
|
Provincial Mining
Leases
|
|||||||||||||
|
Country
|
State/Province
|
Project
|
Total
|
Total
|
Number
|
Acres
|
Expiration Date
|
Number
|
Acres
|
Expiration Date
|
Number
|
Acres
|
Expiration Date
|
Number
|
Hectares
|
Expiration Date
|
Number
|
Hectares
|
Expiration Date
|
|
Uranium Projects
|
|||||||||||||||||||
|
|
|
Allemand-Ross
|
13,331.72
|
5,395.16
|
3
|
958
|
Annual
|
7
|
3,333.72
|
July 2025 - Feb 2029 (variable
|
452
|
9,040
|
Annual
|
||||||
|
Antelope
|
13,220
|
5,349.94
|
1
|
640
|
Annual
|
629
|
12,580
|
Annual
|
|||||||||||
|
Barge
|
7,480
|
3,027.05
|
1
|
640
|
Annual
|
342
|
6,840
|
Annual
|
|||||||||||
|
Black Hills
|
1,280
|
518.00
|
1
|
640
|
Annual
|
32
|
640
|
Annual
|
|||||||||||
|
Brown Ranch
|
3,640
|
1,473.06
|
1
|
640
|
Annual
|
150
|
3,000
|
Annual
|
|||||||||||
|
Bull Springs
|
5,702.8
|
2,307.84
|
2
|
1,922.8
|
Annual
|
189
|
3,780
|
Annual
|
|||||||||||
|
Central Shirley Basin
|
2,380
|
963.15
|
2
|
760
|
Annual
|
81
|
1,620
|
Annual
|
|||||||||||
|
Charlie
|
820
|
331.84
|
1
|
720
|
Annual
|
5
|
100
|
Annual
|
|||||||||||
| United States | Wyoming |
Christensen Ranch
|
11,140
|
4,508.20
|
1
|
1,280
|
Annual
|
1
|
720
|
Annual
|
358
|
9,140
|
Annual
|
||||||
|
Clarkson Hills
|
400
|
161.87
|
20
|
400
|
Annual
|
||||||||||||||
|
Crooks Creek
|
6,979.25
|
2,824.40
|
6
|
2,599.25
|
Annual
|
219
|
4,380
|
Annual
|
|||||||||||
|
Crook's Mountain
|
2,480
|
1,003.62
|
2
|
1,280
|
Annual
|
60
|
1,200
|
Annual
|
|||||||||||
|
Crossroads
|
5,680
|
2,298.61
|
2
|
1,280
|
Annual
|
220
|
4,400
|
Annual
|
|||||||||||
|
Cyclone Rim
|
4,280
|
1,732.06
|
0
|
0
|
214
|
4,280
|
Annual
|
||||||||||||
|
East Shirley Basin
|
4,599.90
|
1,861.51
|
4
|
2,099.9
|
Annual
|
125
|
2,500
|
Annual
|
|||||||||||
|
Gas Hills
|
6,114.76
|
2,474.56
|
5
|
3,394.76
|
Annual
|
136
|
2,720
|
Annual
|
|||||||||||
| Acres | Hectares | State Leases | Fee Mineral Leases | Federal Lode Mining Claims | Provincial Mineral Dispositions |
Provincial
Mining Leases
|
|||||||||||||
|
Country
|
State/Province
|
Project
|
Total
|
Total
|
Number
|
Acres
|
Expiration Date
|
Number
|
Acres
|
Expiration Date
|
Number
|
Acres
|
Expiration Date
|
Number
|
Hectares
|
Expiration Date
|
Number
|
Hectares
|
Expiration Date
|
|
Horse Creek
|
540
|
218.53
|
27
|
540
|
Annual
|
||||||||||||||
|
Irigaray
|
2,320
|
938.87
|
2
|
480
|
Annual
|
92
|
1,840
|
Annual
|
|||||||||||
|
Jab/West Jab
|
5,300
|
2,144.83
|
3
|
960
|
Annual
|
217
|
4,340
|
Annual
|
|||||||||||
|
Ludeman
|
18,101.89
|
7,325.57
|
4
|
1,440
|
Annual
|
2
|
1,741.89
|
Sept. 2026 and Jan. 2029
|
746
|
14,920
|
Annual
|
||||||||
|
Moore Ranch
|
4,180
|
1,691.59
|
3
|
1,280
|
Annual
|
4
|
1,180
|
Aug. 2025 through Mar. 2027 (variable)
|
86
|
1,720
|
Annual
|
||||||||
|
Mule Creek
|
260
|
105.22
|
13
|
260
|
Annual
|
||||||||||||||
|
Niles Ranch
|
3,560
|
1,440.68
|
6
|
2,560
|
Annual
|
50
|
1,000
|
Annual
|
|||||||||||
|
Nine Mile Lake
|
2,620
|
1,060.28
|
3
|
1,280
|
Annual
|
67
|
1,340
|
Annual
|
|||||||||||
|
Pine Ridge
|
3,780
|
1,529.71
|
2
|
720
|
Annual
|
153
|
3,060
|
Annual
|
|||||||||||
|
Pine Tree U1
|
1,540
|
623.22
|
1
|
80
|
Annual
|
73
|
1,460
|
Annual
|
|||||||||||
|
Pumpkin Creek
|
1,000
|
404.69
|
50
|
1,000
|
Annual
|
||||||||||||||
|
Red Rim
|
680
|
275.19
|
34
|
680
|
Annual
|
||||||||||||||
|
Reno Creek
|
18,763
|
7,593.12
|
4
|
3,200
|
Annual
|
36
|
4,583
|
Variable
|
549
|
10,980
|
Annual
|
||||||||
|
Ross Flats
|
5,480
|
2,217.68
|
3
|
1,040
|
Annual
|
3
|
1,680
|
Mar. 2027
|
138
|
2,760
|
Annual
|
||||||||
|
Sand Creek
|
3,000
|
1,214.06
|
3
|
1,920
|
Annual
|
54
|
1,080
|
Annual
|
|||||||||||
|
South Pine Ridge
|
4,020
|
1,626.84
|
5
|
2,360
|
Annual
|
83
|
1,660
|
Annual
|
|||||||||||
|
South Reno Creek
|
2,580
|
1,044.09
|
1
|
80
|
Annual
|
125
|
2,500
|
Annual
|
|||||||||||
|
South Sweetwater
|
1,120
|
453.25
|
1
|
640
|
Annual
|
24
|
480
|
Annual
|
|||||||||||
|
Stewart Creek
|
2,460
|
995.53
|
1
|
640
|
Annual
|
91
|
1,820
|
Annual
|
|||||||||||
|
Taylor Ranch
|
3,940
|
1,594.46
|
7
|
2,880
|
Annual
|
53
|
1,060
|
Annual
|
|||||||||||
|
Twin Buttes
|
7,740
|
3,132.27
|
3
|
1,600
|
Annual
|
307
|
6,140
|
Annual
|
|||||||||||
|
West Beaver Rim
|
1,900
|
768.90
|
1
|
640
|
Annual
|
63
|
1,260
|
Annual
|
|||||||||||
|
West Crook's Creek
|
1,520
|
615.12
|
1
|
640
|
Annual
|
44
|
880
|
Annual
|
|||||||||||
|
West Sweetwater
|
1,080
|
437.06
|
54
|
1,080
|
Annual
|
||||||||||||||
|
|
Burke Hollow
|
17,511
|
7,086
|
1
|
17,511
|
2032
|
|||||||||||||
|
Goliad
|
636
|
257
|
7
|
636
|
2024 & 2025
|
||||||||||||||
| Texas |
Palangana
|
6,969
|
2,820
|
12
|
6,969
|
2025 thru 2032
|
|||||||||||||
|
Salvo
|
800
|
324
|
2
|
800
|
2026 & 2027
|
||||||||||||||
|
Longhorn
|
594
|
240
|
40
|
594
|
2027 thru 2028
|
||||||||||||||
|
Arizona
|
Anderson
|
8,268
|
3,346
|
1
|
640
|
2024
|
386
|
7,628
|
2024
|
||||||||||
|
Los Cuatros
|
640
|
259
|
1
|
640
|
2024
|
||||||||||||||
| Acres | Hectares | State Leases | Fee Mineral Leases | Federal Lode Mining Claims | Provincial Mineral Dispositions |
Provincial Mining
Leases
|
|||||||||||||
|
Country
|
State/Province
|
Project
|
Total
|
Total
|
Number
|
Acres
|
Expiration Date
|
Number
|
Acres
|
Expiration Date
|
Number
|
Acres
|
Expiration Date
|
Number
|
Hectares
|
Expiration Date
|
Number
|
Hectares
|
Expiration Date
|
|
Workman Creek
|
4,036
|
1,374
|
198
|
4,036
|
2024
|
||||||||||||||
|
New
Mexico
|
C de Baca
|
600
|
243
|
30
|
600
|
2024
|
|||||||||||||
|
Dalton Pass
|
1,020
|
413
|
51
|
1,020
|
2024
|
||||||||||||||
|
|
|
Alexandra
|
36,485
|
14,765
|
6
|
14,765
|
Oct. 4042
|
||||||||||||
|
Axis Lake
|
13,045
|
5,279
|
3
|
5,279
|
Aug. 2023
|
||||||||||||||
|
Beatty River
|
16,526
|
6,688
|
7
|
6,688
|
Sept. 2027
|
||||||||||||||
| Canada | Saskatchewan |
Black Lake
|
78,335
|
31,701
|
13
|
31,701
|
Nov. 2024
|
||||||||||||
|
Brander Lake
|
34,577
|
13,993
|
9
|
13,993
|
Apr. 2035
|
||||||||||||||
|
Candle Lake
|
6,412
|
2,595
|
1
|
2,595
|
Oct. 2038
|
||||||||||||||
|
Christie Lake
|
19,575
|
7,922
|
6
|
7,922
|
Mar. 2044
|
||||||||||||||
|
Christie West
|
813
|
329
|
2
|
329
|
Jun. 2023
|
||||||||||||||
|
Close Lake
|
95,578
|
38,679
|
21
|
38,679
|
Oct. 2023
|
||||||||||||||
|
Cree Extension
|
30,115
|
12,187
|
11
|
12,187
|
Aug. 2040
|
||||||||||||||
|
Diabase Peninsula
|
77,164
|
31,227
|
22
|
31,227
|
|||||||||||||||
|
Erica
|
91,409
|
36,992
|
20
|
36,992
|
Nov. 2036
|
||||||||||||||
|
Hidden Bay
|
126,933
|
51,368
|
45
|
51,368
|
Aug. 2037
|
||||||||||||||
|
Horseshoe-Raven
|
11,085
|
4,486
|
1
|
4,486
|
Feb. 2041
|
||||||||||||||
|
Key West
|
31,827
|
12,880
|
4
|
12,880
|
Apr. 2024
|
||||||||||||||
|
Laurie
|
21,691
|
8,778
|
4
|
8,778
|
May 2027
|
||||||||||||||
|
Millennium
|
1,458
|
590
|
1
|
590
|
Feb. 2039
|
||||||||||||||
|
Mirror River
|
42,996
|
17,400
|
5
|
17,400
|
Apr. 2024
|
||||||||||||||
|
Moon Lake
|
9,385
|
3,798
|
5
|
3,798
|
Oct. 2039
|
||||||||||||||
|
Moore Tomblin
|
3,249
|
1,315
|
2
|
1,315
|
May 2028
|
||||||||||||||
|
Nikita
|
37,390
|
15,131
|
6
|
15,131
|
Jun. 2043
|
||||||||||||||
|
Riou Lake
|
27,634
|
11,183
|
14
|
11,183
|
Nov. 2023
|
||||||||||||||
|
Roughrider
|
1,475
|
597
|
1
|
597
|
Jan. 2028
|
||||||||||||||
|
Shea Creek
|
81,451
|
32,962
|
18
|
32,962
|
Mar. 2035
|
||||||||||||||
|
Uchrich
|
5,592
|
2,263
|
1
|
2,263
|
May 2027
|
||||||||||||||
|
Waterfound River
|
28,837
|
11,670
|
25
|
11,670
|
Jul. 2031
|
||||||||||||||
|
West Bear
|
27,439
|
11,104
|
26
|
10,807
|
Feb 2043
|
1
|
297
|
June 2035
|
|||||||||||
|
Wheeler River
|
28,961
|
11,720
|
19
|
11,720
|
Oct. 2041
|
||||||||||||||
|
Wolly
|
58,564
|
23,700
|
17
|
23,700
|
Nov. 2038
|
||||||||||||||
|
Nunavut
|
Kiggavik
|
45,638
|
18,469
|
37
|
18,469
|
Oct. 2038
|
|||||||||||||
|
Paraguay
|
Yuty
|
289,687
|
117,232
|
||||||||||||||||
|
Oviedo
|
223,754
|
90,550
|
|||||||||||||||||
|
Titanium Projects
|
|||||||||||||||||||
|
Paraguay
|
Alto Parana
|
174,204
|
70,498
|
||||||||||||||||
|
Uranium Projects
|
||||||||||
|
Texas
|
||||||||||
|
Property
|
Fully
Permitted to
Mine
|
Partially
Permitted to
Mine
|
Not
Permitted
to Mine
|
RRC
Exploration
Permit
|
TCEQ Class 1
Well Permits
|
TCEQ
Injection
Control
Permit
|
TCEQ Area
Permit
|
TCEQ/EPA
Aquifer
Exemption
|
TCEQ
Radioactive
Materials
License
|
Notes
|
|
Burke Hollow
|
X
|
Yes
|
2
|
Yes
|
Yes
|
Yes
|
Yes
|
Has all major permits, waiting on final production authorization
|
||
|
Goliad
|
X
|
Yes
|
2
|
Yes
|
Yes
|
Yes
|
Yes
|
Has all major permits and first production authorization
|
||
|
La Palangana
|
X
|
Yes
|
2
|
Yes
|
Yes
|
Yes
|
Yes
|
Has all major permits and four production authorizations
|
||
|
Salvo
|
X
|
No
|
0
|
No
|
No
|
No
|
No
|
|||
|
Longhorn
|
X
|
No
|
0
|
No
|
No
|
No
|
No
|
|||
|
Wyoming
|
||||||||||
|
Property
|
Fully
Permitted to
Mine
|
Partially
Permitted to
Mine
|
Not
Permitted
to Mine
|
Class III UIC
Permit
to Mine
|
WDEQ Class 1
Well Permits
|
Source and
Byproduct
Materials
License
|
BLM Plan
of
Operations
|
WDEQ/EPA
Aquifer
Exemption
|
Notes
|
|
|
Allemand-Ross
|
X
|
Drilling Notification DN339
|
||||||||
|
Antelope
|
X
|
Yes
|
Drilling Notification DN353
|
|||||||
|
Barge
|
X
|
|||||||||
|
Black Hills
|
X
|
|||||||||
|
Brown Ranch
|
X
|
|||||||||
|
Bull Springs
|
X
|
|||||||||
|
Central Shirley Basin
|
X
|
|||||||||
|
Charlie
|
X
|
Permitted as an open pit mine not ISR
|
||||||||
|
Christensen Ranch
|
X
|
Yes
|
Yes
|
Yes
|
Yes
|
|||||
|
Clarkson Hill
|
X
|
|||||||||
|
Crooks Creek
|
X
|
|||||||||
|
Crook's Mountain
|
X
|
|||||||||
|
Crossroads
|
X
|
|||||||||
|
Cyclone Rim
|
X
|
|||||||||
|
East Shirley Basin
|
X
|
|||||||||
|
Gas Hills
|
X
|
|||||||||
|
Horse Creek
|
X
|
|||||||||
|
Irigaray Project
|
X
|
Yes
|
Yes
|
Yes
|
Yes
|
Irigaray mine expansion to north and south will require a permit revision.
Drilling Notification DN342
|
||||
|
Jab/West Jab
|
X
|
Drilling Notification DN353
|
||||||||
|
Ludeman
|
X
|
Yes
|
Yes
|
Yes
|
||||||
|
Moore Ranch
|
X
|
Yes
|
Yes
|
Yes
|
Yes
|
|||||
|
Mule Creek
|
X
|
|||||||||
|
Niles Ranch
|
X
|
|||||||||
|
Nine Mile Lake
|
X
|
Drilling Notification DN339
|
||||||||
|
Pine Ridge
|
X
|
Drilling Notification DN342
|
||||||||
|
Pine Tree U1
|
X
|
Drilling Notification DN342
|
||||||||
|
Pumpkin Creek
|
X
|
Drilling Notification DN342
|
||||||||
|
Red Rim
|
X
|
|||||||||
|
Reno Creek
|
X
|
Yes
|
Yes
|
Yes
|
Yes
|
North Reno Creek and SW Reno Creek Resource areas are permitted.
|
||||
|
Ross Flat
|
X
|
Drilling Notification DN342
|
||||||||
|
Sand Creek
|
X
|
|||||||||
|
South Pine Ridge
|
X
|
|||||||||
|
South Reno Creek
|
X
|
|||||||||
|
South Sweetwater
|
X
|
|||||||||
|
Stewart Creek
|
X
|
|||||||||
|
Taylor Ranch
|
X
|
Drilling Notification DN342
|
||||||||
|
Twin Buttes
|
X
|
|||||||||
|
West Beaver Rim
|
X
|
|||||||||
|
West Crook's Creek
|
X
|
|||||||||
|
West Sweetwater
|
X
|
|||||||||
|
Arizona
|
||||||||||
|
Property
|
Fully
Permitted to
Mine
|
Partially
Permitted to
Mine
|
Not
Permitted
to Mine
|
Class III UIC
Permit to
Mine
|
WDEQ Class 1
Well Permits
|
Source and
Byproduct
Materials
License
|
BLM Plan
of
Operations
|
WDEQ/EPA
Aquifer
Exemption
|
Notes
|
|
|
Anderson
|
X
|
|||||||||
|
Los Cuatros
|
X
|
|||||||||
|
Workman Creek
|
X
|
|||||||||
|
New Mexico
|
||||||||||
|
Property
|
Fully
Permitted to
Mine
|
Partially
Permitted to
Mine
|
Not
Permitted
to Mine
|
Class III UIC
Permit to
Mine
|
WDEQ Class 1
Well Permits
|
Source and
Byproduct
Materials
License
|
BLM Plan
of
Operations
|
WDEQ/EPA
Aquifer
Exemption
|
Notes
|
|
|
C de Baca
|
X
|
|||||||||
|
Dalton Pass
|
X
|
|||||||||
|
Canada
|
||||||||||
|
Property
|
Fully
Permitted to
Mine
|
Partially
Permitted to
Mine
|
Not
Permitted
to Mine
|
Notes
|
||||||
|
Alexandra
|
X
|
Exploration-Stage Project with no resources
|
||||||||
|
Axis Lake
|
X
|
Exploration-Stage Project with no resources
|
||||||||
|
Beatty River
|
X
|
Exploration-Stage Project with no resources
|
||||||||
|
Black Lake
|
X
|
Exploration-Stage Project with no resources
|
||||||||
|
Brander Lake
|
X
|
Exploration-Stage Project with no resources
|
||||||||
|
Candle Lake
|
X
|
Exploration-Stage Project with no resources
|
||||||||
|
Christie Lake
|
X
|
Exploration-Stage Project with resources
|
||||||||
|
Christie West
|
X
|
Exploration-Stage Project with no resources
|
||||||||
|
Close Lake
|
X
|
Exploration-Stage Project with no resources
|
||||||||
|
Cree Extension
|
X
|
Exploration-Stage Project with no resources
|
||||||||
|
Diabase Peninsula
|
X
|
Exploration-Stage Project with no resources
|
||||||||
|
Erica
|
X
|
Exploration-Stage Project with no resources
|
||||||||
|
Hidden Bay
|
X
|
Exploration-Stage Project with no resources
|
||||||||
|
Horseshoe-Raven
|
X
|
Exploration-Stage Project with resources
|
||||||||
|
Key West
|
X
|
Exploration-Stage Project with no resources
|
||||||||
|
Laurie
|
X
|
Exploration-Stage Project with no resources
|
||||||||
|
Millennium
|
X
|
Exploration-Stage Project with resources
|
||||||||
|
Mirror River
|
X
|
Exploration-Stage Project with no resources
|
||||||||
|
Moon Lake
|
X
|
Exploration-Stage Project with no resources
|
||||||||
|
Moore Tomblin
|
X
|
Exploration-Stage Project with no resources
|
||||||||
|
Nikita
|
X
|
Exploration-Stage Project with no resources
|
||||||||
|
Riou Lake
|
X
|
Exploration-Stage Project with no resources
|
||||||||
|
Roughrider
|
X
|
Exploration-Stage Project with resources
|
||||||||
|
Shea Creek
|
X
|
Exploration-Stage Project with resources
|
||||||||
|
Uchrich
|
X
|
Exploration-Stage Project with no resources
|
||||||||
|
Waterfound River
|
X
|
Exploration-Stage Project with no resources
|
||||||||
|
West Bear
|
X
|
Exploration-Stage Project with no resources
|
|
Wheeler River
|
X
|
Feasibility Field Test mining completed
|
||||||||
|
Wolly
|
X
|
Exploration-Stage Project with no resources
|
||||||||
|
Kiggavik
|
X
|
Development-Stage, not permitted to mine
|
||||||||
|
Paraguay
|
||||||||||
|
Property
|
Fully
Permitted to
Mine
|
Partially Permitted to Mine
|
Not
Permitted
to Mine
|
Notes
|
||||||
|
Yuty
|
X
|
Exploration-Stage Project with resources
|
||||||||
|
Oviedo
|
X
|
Exploration-Stage Project with no resources
|
||||||||
|
Titanium Projects
|
||||||||||
|
Paraguay
|
||||||||||
|
Property
|
Fully
Permitted to
Mine
|
Partially Permitted to Mine
|
Not
Permitted
to Mine
|
Notes
|
||||||
|
Alto Parana
|
X
|
Exploration-Stage Project with no resources
|
||||||||
|
State/Province
|
Plant
|
Location (Latitude)
|
Location (Longitude)
|
Equity Interest
|
Operator
|
Status
|
Annual Permitted Production Capacity
|
Fully Permitted
to Mine
|
Partially Permitted
to Mine
|
Not
Permitted
to Mine
|
WDEQ Class 1 Well Permits
|
TCEQ Radioactive Materials License
|
|
Wyoming
|
Irigaray Central Processing Plant
|
100%
|
UEC
|
Production Suspended
|
2.5 Mlb/year
|
X
|
2
|
Yes
|
||||
|
Christensen Ranch Satellite Production Plant
|
100%
|
UEC
|
Standby
|
9,000 gpm
|
X
|
4
|
Yes
|
|||||
|
State/Province
|
Plant
|
Location (Latitude)
|
Location (Longitude)
|
Equity Interest
|
Operator
|
Status
|
Annual Permitted Production Capacity
|
Fully Permitted
to Mine
|
Partially Permitted
to Mine
|
Not
Permitted
to Mine
|
TCEQ Class 1 Well Permits
|
TCEQ Radioactive Materials License
|
|
Texas
|
Hobson Central Processing Plant
|
28.945
|
-97.989
|
100%
|
UEC
|
Production Suspended
|
4.0 Mlb/year
|
X
|
2
|
Yes
|
|
Uranium Oxide Mineral Resources
|
||||||||||||||
|
Country
|
State/Province
|
Project
|
Measured
|
Indicated
|
Inferred
|
|||||||||
|
Tons
('000's)
|
Tonnes
('000's) |
Grade
(% U3O8) |
Pounds
U3O8
('000's)
|
Tons
('000's)
|
Tonnes
('000's) |
Grade
(% U3O8) |
Pounds
U3O8 ('000's)
|
Tons
('000's)
|
Tonnes
('000's) |
Grade
(% U3O8) |
Pounds
U3O8 ('000's)
|
|||
|
|
|
Allemand-Ross
|
246
|
223
|
0.09%
|
417
|
32
|
29
|
0.07%
|
42
|
1,275
|
1,157
|
0.10%
|
2,496
|
|
Barge
|
4,301
|
3,902
|
0.05%
|
4,361
|
||||||||||
|
Charlie
|
1,255
|
1,139
|
0.12%
|
3,100
|
411
|
373
|
0.12%
|
988
|
||||||
|
Christensen Ranch
|
6,555
|
5,947
|
0.07%
|
9,596
|
||||||||||
|
Clarkson Hill
|
957
|
868
|
0.06%
|
1,113
|
||||||||||
|
Irigaray
|
3,881
|
3,521
|
0.08%
|
5,899
|
104
|
94
|
0.07%
|
141
|
||||||
| Wyoming |
Jab/West Jab
|
1,621
|
1,471
|
0.07%
|
2,335
|
253
|
230
|
0.08%
|
392
|
1,402
|
1,272
|
0.06%
|
1,677
|
|
|
Ludeman
|
2,674
|
2,426
|
0.09%
|
5,017
|
2,660
|
2,413
|
0.09%
|
4,697
|
866
|
786
|
0.07%
|
1,258
|
||
|
Moore Ranch
|
2,675
|
2,427
|
0.06%
|
3,210
|
46
|
42
|
0.05%
|
44
|
||||||
|
Nine Mile Lake
|
3,405
|
3,089
|
0.04%
|
4,308
|
||||||||||
|
Red Rim
|
337
|
306
|
0.17%
|
1,142
|
473
|
429
|
0.16%
|
1,539
|
||||||
| United States |
Reno Creek
|
14,990
|
13,599
|
0.04%
|
12,920
|
16,980
|
15,404
|
0.04%
|
13,070
|
1,920
|
1,742
|
0.04%
|
1,490
|
|
|
Wyoming Total
|
22,206
|
20,145
|
0.05%
|
23,899
|
36,254
|
32,889
|
0.06%
|
42,299
|
10,859
|
9,851
|
0.07%
|
15,054
|
||
|
|
Burke Hollow
|
70
|
64
|
0.08%
|
115
|
1,337
|
1,213
|
0.09%
|
2,209
|
2,494
|
2,263
|
0.10%
|
4,859
|
|
|
Goliad
|
1,595
|
1,447
|
0.05%
|
2,668
|
1,504
|
1,364
|
0.10%
|
3,492
|
333
|
302
|
0.20%
|
1,225
|
||
| Texas |
Palangana
|
232
|
210
|
0.13%
|
643
|
302
|
274
|
0.18%
|
1,001
|
|||||
|
Salvo
|
1125
|
1,020
|
0.09%
|
2,839
|
||||||||||
|
Texas Total
|
1,665
|
1,510
|
0.08%
|
2,783
|
3,073
|
2,788
|
0.10%
|
6,344
|
5,469
|
4,961
|
0.09%
|
9,924
|
||
|
|
Anderson
|
16,175
|
14,674
|
0.10%
|
32,055
|
|||||||||
| Arizona |
Workman Creek
|
1,981
|
1,797
|
0.11%
|
4,459
|
|||||||||
|
Arizona Total
|
16,175
|
14,674
|
0.10%
|
32,055
|
1,981
|
1,797
|
0.11%
|
4,459
|
||||||
|
United States Total
|
23,871
|
21,655
|
0.06%
|
26,682
|
55,502
|
50,351
|
0.07%
|
80,698
|
18,309
|
16,610
|
0.08%
|
29,437
|
||
|
|
|
Christie Lake
|
537
|
488
|
1.57%
|
16,836
|
||||||||
|
Roughrider
|
429
|
389
|
3.25%
|
27,842
|
396
|
359
|
4.55%
|
36,043
|
||||||
| Canada | Saskatchewan |
Horseshoe-Raven
|
11,412
|
10,353
|
0.16%
|
37,426
|
||||||||
|
Shea Creek
|
1,113
|
1,009
|
1.49%
|
33,175
|
679
|
616
|
1.02%
|
13,775
|
||||||
|
Millennium
|
239
|
217
|
2.39%
|
11,423
|
68
|
62
|
3.19%
|
4,364
|
||||||
|
Canada Total
|
13,192
|
11,968
|
0.42%
|
109,867
|
1,681
|
1,525
|
2.11%
|
71,019
|
||||||
|
Paraguay
|
Yuty
|
9,074
|
8,232
|
0.05%
|
8,962
|
2,733
|
2,479
|
0.04%
|
2,203
|
|||||
|
Total Resources
|
23,871
|
21,655
|
0.06%
|
26,682
|
77,768
|
70,550
|
0.13%
|
199,527
|
22,797
|
20,681
|
0.23%
|
102,658
|
||
|
1.
|
The Mineral Resource estimates in this table meet S-K 1300 definitions.
|
|
|
2.
|
Mineral Resources are not Mineral Reserves and do not have demonstrated economic viability.
|
|
|
3.
|
The point of reference for mineral resources is in-situ at the Project.
|
|
|
4.
|
Mineral Resources are estimated using a long-term uranium price of $40 per pound for ISR projects and $65 per pound for conventional projects, except for the Canadian projects where a price of $56 per pound was used for the Roughrider Project, a price of $75 per pound was used for the Horseshoe-Raven Project, a price of $50 per pound was used for the Shea Creek Project, a price of $50 per pound was used for the Christie Lake Project and a price of $62 per pound was used for the Millennium Project.
|
|
|
5.
|
Mineral Resources in the table above are 100% attributable to the Company. Where JV projects have resources that are attributable to other companies, these resources are not listed in this table.
|
|
|
6.
|
Numbers may not add due to rounding.
|
|
Uranium Oxide Resources
|
|||||||||||
|
FY 2022
|
FY 2023
|
YOY Change
|
|||||||||
|
Country
|
State/Province
|
Project
|
Measured
Pounds
U3O8 ('000's)
|
Indicated
Pounds
U3O8 ('000's)
|
Inferred
Pounds
U3O8
('000's)
|
Measured Pounds
U3O8
('000's)
|
Indicated
Pounds
U3O8
('000's)
|
Inferred
Pounds
U3O8
('000's)
|
% Change
in
Measured
Pounds
|
% Change in
Indicated
Pounds
|
% Change in
Inferred
Pounds
|
|
|
|
Allemand-Ross
|
417
|
42
|
2,496
|
417
|
42
|
2,496
|
0%
|
0%
|
0%
|
|
Barge
|
4,361
|
4,361
|
0%
|
||||||||
|
Charlie
|
3,100
|
988
|
3,100
|
988
|
0%
|
0%
|
|||||
|
Christensen Ranch
|
9,596
|
9,596
|
0%
|
||||||||
|
Clarkson Hill
|
1,113
|
1,113
|
0%
|
||||||||
|
Irigaray
|
5,899
|
141
|
5,899
|
141
|
0%
|
0%
|
|||||
| Wyoming |
Jab/West Jab
|
2,335
|
392
|
1,677
|
2,335
|
392
|
1,677
|
0%
|
0%
|
0%
|
|
|
Ludeman
|
5,017
|
4,697
|
1,258
|
5,017
|
4,697
|
1,258
|
0%
|
0%
|
0%
|
||
|
Moore Ranch
|
3,210
|
44
|
3,210
|
44
|
0%
|
0%
|
|||||
| United States |
Nine Mile Lake
|
4,308
|
4,308
|
0%
|
|||||||
|
Red Rim
|
1,142
|
1,539
|
1,142
|
1,539
|
0%
|
0%
|
|||||
|
Reno Creek
|
12,920
|
13,070
|
1,490
|
12,920
|
13,070
|
1,490
|
0%
|
0%
|
0%
|
||
|
Wyoming Total
|
23,899
|
42,299
|
15,054
|
23,899
|
42,299
|
15,054
|
0%
|
0%
|
0%
|
||
|
|
Burke Hollow
|
115
|
2,209
|
4,859
|
115
|
2,209
|
4,859
|
0%
|
0%
|
0%
|
|
| Texas |
Goliad
|
2,668
|
3,492
|
1,225
|
2,668
|
3,492
|
1,225
|
0%
|
0%
|
0%
|
|
|
Palangana
|
643
|
1,001
|
643
|
1,001
|
0%
|
0%
|
|||||
|
Salvo
|
2,839
|
2,839
|
0%
|
||||||||
|
Texas Total
|
2,783
|
6,344
|
9,924
|
2,783
|
6,344
|
9,924
|
0%
|
0%
|
0%
|
||
|
|
Anderson
|
32,055
|
32,055
|
0%
|
|||||||
| Arizona |
Workman Creek
|
4,459
|
4,459
|
0%
|
|||||||
|
Arizona Total
|
32,055
|
4,459
|
32,055
|
4,459
|
0%
|
0%
|
|||||
|
United States Total
|
26,682
|
80,698
|
29,437
|
26,682
|
80,698
|
29,437
|
0%
|
0%
|
0%
|
||
|
|
|
Christie Lake
|
16,836
|
100%
|
|||||||
|
Roughrider
|
27,842
|
36,043
|
100%
|
100%
|
|||||||
| Canada | Saskatchewan |
Horseshoe-Raven
|
37,426
|
100%
|
|||||||
|
Shea Creek
|
33,175
|
13,775
|
100%
|
100%
|
|||||||
|
Millennium
|
11,423
|
4,364
|
100%
|
100%
|
|||||||
|
Canada Total
|
109,867
|
71,019
|
100%
|
100%
|
|||||||
|
Paraguay
|
Yuty
|
8,962
|
2,203
|
8,962
|
2,203
|
0%
|
0%
|
||||
|
Total Resources
|
26,682
|
89,660
|
31,640
|
26,682
|
199,527
|
102,658
|
0%
|
123%
|
224%
|
||
|
1.
|
The Mineral Resource estimates in this table meet S-K 1300 definitions.
|
|
|
2.
|
Mineral Resources are not Mineral Reserves and do not have demonstrated economic viability.
|
|
|
3.
|
The point of reference for mineral resources is in-situ at the Project.
|
|
|
4.
|
Mineral Resources are estimated using a long-term uranium price of $40 per pound for ISR projects and $65 per pound for conventional projects, except for the Canadian projects where a price of $56 per pound was used for the Roughrider Project, a price of $75 per pound was used for the Horseshoe-Raven Project, a price of $50 per pound was used for the Shea Creek Project, a price of $50 per pound was used for the Christie Lake Project and a price of $62 per pound was used for the Millennium Project..
|
|
|
5.
|
Mineral Resources are 100% attributable to the Company. Where JV projects have resources that are attributable to other companies, these resources are not listed in this table.
|
|
|
6.
|
Numbers may not add due to rounding.
|
|
●
|
The Tullock member consists of sandstone, siltstone and sparse coal and carbonaceous shale;
|
|
●
|
The Lebo member consists of abundant drab gray mudstone, minor siltstone and sandstone and sparse coal and carbonaceous shale beds; and
|
|
●
|
The Tongue River member consists of interbedded sandstone, conglomerate, siltstone, mudstone, limestone, anomalously thick coal beds and carbonaceous shale beds. This member has been mined extensively for its coal beds, which can be hundreds of feet thick.
|

|
Year
|
Company
|
Operations/Activity
|
Amount
(No. of Drill holes)
|
Results of Work
|
|
1969
|
Homestake Mining (“Homestake”)
|
Original controller of the Irigaray Project Area.
|
Approximately 1,340
|
Right to mine secured. Preliminary delineation of mineralized areas.
|
|
1975
|
Westinghouse Electric Corporation (“Westinghouse”)
|
Acquired property from Homestake. The project was licensed for ISR production in 1978 and was operated by Wyoming Mineral Corporation, a subsidiary of Westinghouse. Operations ceased in 1982 due to market trends.
|
Approximately 470
|
Delineation of mineralized areas. Began ISR production.
|
|
1987
|
Malapai Resources Company (“Malapai”)
|
Acquired property from Westinghouse.
|
None
|
Ownership transition.
|
|
1990
|
Total Minerals Corporation (“TOMIN”) and Électricité de France (“EDF”)
|
Acquired property from Malapai. TOMIN acted as project operator.
|
None
|
Ownership transition.
|
|
1993
|
COGEMA Resources, Inc. (“COGEMA”) (now Orano S.A.)/Areva
|
Replaced TOMIN as project operator in partnership with EDF. COGEMA acquired interests from TOMIN.
|
Approximately 20
|
0.74 million lb. of U3O8 produced from 1978 through 2000.
|
|
2010
|
Uranium One
|
Dried many millions of pounds from Christensen Ranch and through toll milling.
|
N/A
|
Decommissioned Irigaray wellfields.
|
|
2021
|
UEC
|
Irigaray Project Area acquired by UEC from Uranium One.
|
N/A
|
Ownership transition.
|
|
Classification
|
Tons Ore
(000’s)
|
Tonnes Ore
(1000’s)
|
Average
Grade
(% eU3O8)
|
Pounds
eU3O8
(000’s)
|
|
Measured
|
-
|
-
|
-
|
-
|
|
Indicated
|
3,881
|
3,521
|
0.076
|
5,899.0
|
|
Total M&I
|
3,881
|
3,521
|
0.076
|
5,899.0
|
|
Inferred
|
104
|
94
|
0.068
|
141.0
|
|
Total Resources
|
3,985
|
3,615
|
0.076
|
6,040.0
|
|
1.
|
The sum of resource tons and lbs. may not add up to the reported total due to rounding.
|
|
|
2.
|
Measured, indicated and inferred mineral resources as defined in 17 CFR § 229.1300.
|
|
|
3.
|
GT Cutoff = 0.25 ft% eU3O8.
|
|
|
4.
|
All reported resources occur below the static water table.
|
|
|
5.
|
The point of reference for mineral resources is in-situ at the Project.
|
|
|
6.
|
Mineral resources that are not mineral reserves do not have demonstrated economic viability.
|
|
|
7.
|
A long-term uranium price of $40/lb U3O8 and an 80% metallurgical recovery factor were considered for the purposes of determining the reasonable prospect of economic extraction.
|

|
Year
|
Company
|
Operations/Activity
|
Amount
(No. of Drill
holes)
|
Results of Work
|
|
1967
|
Independent Operators
|
Assembled as a large land package by independent operators.
|
Approximately 4,860
|
Right to mine secured. Preliminary delineation of mineralized areas.
|
|
1979
|
Arizona Public Services (“APS”), parent company of Malapai
|
APS became a 50% partner in 1979.
|
Approximately 2,220
|
Delineation of mineralized areas.
|
|
1981
|
Malapai
|
Malapai assumed sole ownership of the Christensen Ranch Project Area by acquiring the interests of Wold Energy (“Wold”) and Western Nuclear Corporation (“WNC”). Malapai purchased the Irigaray Project Area from Westinghouse in 1987, and the Christensen Ranch Project Area was licensed for operations under the Irigaray U.S. NRC and Wyoming Department of Environmental Quality (“WDEQ”) license/permit in 1988. Uranium production by ISR was started by Malapai in 1989 and was placed on standby in 1990.
|
Approximately 1,460
|
Delineation of mineralized areas. Began ISR production.
|
|
1990
|
TOMIN and EDF
|
EDF acquired the Irigaray and Christensen Ranch Project Areas from Malapai in 1990. TOMIN acted as project operator for EDF under a joint participation agreement. TOMIN restarted ISR operations in 1991.
|
Approximately 2,270
|
Delineation of mineralized areas. Restarted ISR production.
|
|
1993
|
COGEMA and EDF
|
In 1993, COGEMA acquired the assets of TOMIN and changed the name of the operating entity to COGEMA Mining, Inc. EDF (now Malapai) was still owner of 29%, COGEMA, as operator, owned 71% through the joint participation agreement.
|
Approximately 3,690
|
3.70 million lbs of U3O8 produced from 1989 through 2000.
|
|
2000
|
COGEMA and Malapai
|
Groundwater restoration of Mine Units 2 through 6 was completed. The Christensen Ranch Project Area was placed on standby from 2006 through 2010, at which time COGEMA and Malapai sold the project to Uranium One and Uranium One USA, Inc. (collectively, “Uranium One”).
|
N/A
|
188,000 lbs of U3O8 produced during restoration.
|
|
2010
|
Uranium One
|
Mine Units 7, 8 and 10 were installed and operated. A ramp up occurred in 2011, and a ramp down occurred in 2013 (all wellfield development ceased). Low production mode occurred in 2014 through 2018, and production ended in 2018, at which time the Christensen Ranch Project Area was placed on care and maintenance.
|
N/A
|
2.6 million lbs of U3O8 produced.
|
|
2021
|
UEC
|
The Christensen Ranch Project Area acquired by UEC from Uranium One.
|
N/A
|
Ownership transition.
|
|
Classification
|
Tons Ore
(000’s)
|
Tonnes Ore
(1000’s)
|
Average
Grade
(% eU3O8)
|
Pounds
eU3O8
(000’s)
|
|
Measured
|
-
|
-
|
-
|
-
|
|
Indicated
|
6,555
|
5,947
|
0.073
|
9,596
|
|
Total M&I
|
6,555
|
5,947
|
0.073
|
9,596
|
|
Inferred
|
-
|
-
|
-
|
-
|
|
Total Resources
|
6,555
|
5,947
|
0.073
|
9,596
|
|
1.
|
The sum of resource tons and lbs. may not add up to the reported total due to rounding.
|
|
|
2.
|
Measured, indicated, and inferred mineral resources as defined in 17 CFR § 229.1300.
|
|
|
3.
|
GT Cutoff = 0.25 ft% eU3O8.
|
|
|
4.
|
All reported resources occur below the static water table.
|
|
|
5.
|
The point of reference for mineral resources is in-situ at the Project.
|
|
|
6.
|
Mineral resources that are not mineral reserves do not have demonstrated economic viability.
|
|
|
7.
|
A long-term uranium price of $40/lb U3O8 and an 80% metallurgical recovery factor were considered for the purposes of determining the reasonable prospect of economic extraction.
|
|
Year
|
Company
|
Operations/Activity
|
Amount
(No. of Drill holes)
|
Results of Work
|
|
1971
|
Conoco Minerals (“Conoco”) and Kerr-McGee Corporation (“Kerr-McGee”)
|
Conoco and Kerr-McGee operated as a joint venture. Of the joint venture, Conoco controlled 50% of the Moore Ranch Project Area and served as the operator.
|
Approximately 2,700 rotary drill holes
Approximately 130 core holes
|
Discovery and delineation of mineralized areas. Permitting and licensing of a proposed uranium processing facility known as Sand Rock Mill was completed through the WDEQ/LQD and the NRC.
|
|
1983
|
Wold and Kerr-McGee
|
Conoco sold its interests to Wold in 1983. Kerr-McGee retained the rights with Wold. Assessment drilling was conducted.
|
None
|
Retained mining claims. Mining claim assessment drilling.
|
|
1989
|
Rio Algom Mining Corp.
(“Rio Algom”) |
Rio Algom acquired the project in 1989. Rio Algom conducted mining claim assessment drilling to retain mining claims through 1992, which was the last year to allow mining claim assessment drilling.
|
None
|
Retained mining claims. Mining claim assessment drilling.
|
|
1992
|
Rio Algom
|
Claim maintenance paid directly to the BLM. No further drilling conducted.
|
None
|
Mining claims retained through payment.
|
|
2002
|
Power Resources, Inc. (“PRI”)
(now Cameco Resources) |
Rio Algom acquired by PRI.
|
None
|
Ownership transition.
|
|
2004
|
Energy Metals Corporation (“EMC”)
|
EMC acquired most of the mining claims and state leases.
|
N/A
|
Secured right to mine.
|
|
2007
|
Uranium One
|
Uranium One acquired EMC and all rights to the Moore Ranch Project Area. Uranium One completed verification and resource enhancement drilling, coring, baseline monitor wells, and pump test wells. The Moore Ranch Project Area is fully permitted by WDEQ/LQD in 2011 and the NRC in 2013.
|
Approximately 800
|
Exploration efforts focused on developing and upgrading mineral resources.
|
|
2021
|
UEC
|
Moore Ranch Project Area acquired by UEC from Uranium One.
|
N/A
|
Ownership transition.
|
|
Classification
|
Tons Ore
(000’s)
|
Tonnes Ore
(1000’s)
|
Average
Grade
(% eU3O8)
|
Pounds
eU3O8
(000’s)
|
|
Measured
|
2,675
|
2,427
|
0.06
|
3,210.0
|
|
Indicated
|
-
|
-
|
-
|
-
|
|
Total M&I
|
2,675
|
2,427
|
0.06
|
3,210.0
|
|
Inferred
|
46
|
42
|
0.047
|
43.7
|
|
Total Resources
|
2,721
|
2,469
|
0.06
|
3,253.7
|
|
1.
|
The sum of resource tons and lbs. may not add up to the reported total due to rounding.
|
|
|
2.
|
Measured, indicated, and inferred mineral resources as defined in 17 CFR § 229.1300.
|
|
|
3.
|
GT Cutoff = 0.3 ft% eU3O8.
|
|
|
4.
|
All reported resources occur below the static water table.
|
|
|
5.
|
The point of reference for mineral resources is in-situ at the Project.
|
|
|
6.
|
Mineral resources that are not mineral reserves do not have demonstrated economic viability.
|
|
|
7.
|
A long-term uranium price of $40/lb U3O8 and an 80% metallurgical recovery factor were considered for the purposes of determining the reasonable prospect of economic extraction.
|
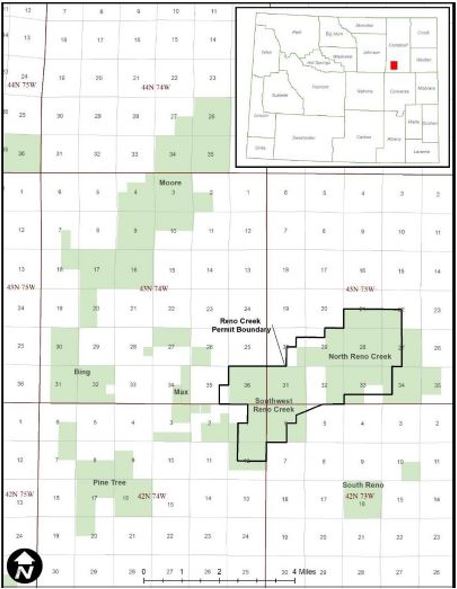
|
Year
|
Company
|
Operations/Activity
|
Amount
(No. of Drill holes)
|
Results of Work
|
|
Reno Creek – North Reno Creek
|
||||
|
Late 1960s
|
Rocky Mountain Energy Company (“RME”)
|
Drilled exploration holes at and around North Reno Creek resource area.
|
Approximately 5,800
|
Delineated Approximately 10 miles of roll-front deposits.
|
|
Mid 1970s
|
RME, Mono Power Company (“Mono”) and Halliburton Services
|
Partnership formed to develop North Reno Creek Resource Area using ISR methods.
|
N/A
|
Acquisition of the Reno Creek Project Area.
|
|
1992
|
Energy Fuels Nuclear Inc./International Uranium Corporation
|
Energy Fuels Nuclear Inc. acquired RME’s North Reno Creek Resource Area and later became International Uranium Corporation.
|
N/A
|
Acquisition of the Reno Creek Project Area.
|
|
2001
|
Rio Algom
|
Rio Algom acquired International Uranium Corporation’s property.
|
N/A
|
Acquisition of the Reno Creek Project Area.
|
|
2001
|
PRI
|
PRI acquired North Reno Creek Area and dropped claims in 2003.
|
N/A
|
Acquisition of the Reno Creek Project Area and mining claims dropped.
|
|
2004
|
Strathmore Minerals Corporation and American Uranium Corporation (“AUCA”)
|
Re-staked and filed new mining claims on approximately 16,000 acres.
|
N/A
|
Refiled mining claims and secured right to mine.
|
|
2007
|
AUCA
|
Advanced project through acquisition of most major permits and required authorizations.
|
N/A
|
Acquisition of the Reno Creek Project Area and secured permits and authorizations.
|
|
2017
|
UEC
|
Consolidated ownership of multiple resource areas and oversaw technical reporting and auditing of Project resources.
|
N/A
|
Consolidation of ownership. Auditing of project resources.
|
|
Reno Creek – Southwest Reno Creek
|
||||
|
Pre-2007
|
AUCA and Tennessee Valley Authority JV
|
Controlled Southwest Reno Creek and drilled exploration holes.
|
Approximately 700
|
Delineation of mineralized areas.
|
|
2007
|
AUCA
|
Advanced project through acquisition of most major permits and required authorizations.
|
N/A
|
Secured permits and required authorizations.
|
|
2017
|
UEC
|
Consolidated ownership of multiple Resource Areas and oversaw technical reporting and auditing of Project resources.
|
N/A
|
Consolidation of ownership. Auditing of the Reno Creek Project Area resources.
|
|
Reno Creek – Moore, Pine Tree, and Bing
|
||||
|
1960s
|
Utah International Mining Company
|
Exploration on Moore and Pine Tree Resource Areas.
|
N/A
|
Delineation of mineralized areas.
|
|
Late 1970s
|
Pathfinder Mines, Inc.
|
Utah International Mining Company becomes Pathfinder Mines, Inc. and continues exploration on Moore and Pine Tree Resource Areas.
|
>1,560
|
Delineation of mineralized areas.
|
|
1980s
|
RME
|
Obtained ownership of Moore Area, continued exploration drilling until the 1990s.
|
>400
|
Acquired the Reno Creek Project Area. Delineation of mineralized areas.
|
|
1960s
|
Cleveland-Cliffs Iron Company
|
Exploration of Bing Area, drilled several hundred exploration holes and conducted limited hydrologic testing in the 1970s.
|
177
|
Delineation of mineralized areas through drilling and conducted hydrologic testing.
|
|
2007
|
AUCA
|
Consolidated the Resource Areas under one owner.
|
N/A
|
Consolidated ownership.
|
|
2017
|
UEC
|
Oversaw technical reporting and auditing of project resources.
|
N/A
|
Auditing of the Reno Creek Project Area resources.
|
|
Classification
|
Tons Ore
(000’s)
|
Tonnes Ore
(1000’s)
|
Average
Grade
(% eU3O8)
|
Pounds
eU3O8
(000’s)
|
|
Measured
|
14,990
|
13,599
|
0.043
|
12,920.0
|
|
Indicated
|
16,980
|
15,404
|
0.039
|
13,070.0
|
|
Total M&I
|
31,970
|
29,003
|
0.041
|
25,990.0
|
|
Inferred
|
1,920
|
1,742
|
0.039
|
1,490.0
|
|
Total Resources
|
33,890
|
30,745
|
0.041
|
27,480.0
|
|
1.
|
The sum of resources tons and lbs. may not add up to the reported total due to rounding.
|
|
|
2.
|
Measured, indicated, and inferred mineral resources as defined in 17 CFR § 229.1300.
|
|
|
3.
|
GT Cutoff = 0.20 ft% eU3O8.
|
|
|
4.
|
All reported resources occur below the static water table.
|
|
|
5.
|
The point of reference for mineral resources is in-situ at the Project.
|
|
|
6.
|
Mineral resources that are not mineral reserves do not have demonstrated economic viability.
|
|
|
7.
|
A long-term uranium price of $40/lb U3O8 and an 80% metallurgical recovery factor were considered for the purposes of determining the reasonable prospect of economic extraction.
|

|
Year
|
Company
|
Operations/Activity
|
Amount
(No. of Drill holes)
|
Results of Work
|
|
1960s-1970s
|
Cordero Mining
|
Numerous exploration companies including Teton Exploration (“Teton”), PRI, Uranium Resources, Inc. (“URI”) and Malapai (a subsidiary of APS) collectively explored in the Ludeman Project Area.
|
Approximately 5,420
|
Explored for uranium roll-front mineralization and delineated deposits in the Ludeman Project Area.
|
|
1980
|
United Nuclear Corp. (“UNC”) and partner Teton
|
Constructed and operated the Leuenberger ISR pilot test facility for 12 months. Groundwater restoration was completed following production and a commercial permit to mine was granted. Due to a decline in the market, the permitted mine was not placed into commercial operation and the permit expired.
|
N/A
|
Produced 12,800 lbs of U3O8 from the pilot facility.
|
|
1981
|
URI
|
Constructed and operated the North Platte ISR project on a portion of the Ludeman Project Area. The pilot test facility produced for five months during 1982.
|
N/A
|
Produced 1,515 lbs of U3O8 from the pilot facility.
|
|
1980s
|
Malapai
|
Permitted the Peterson Project for pilot operations but was never operated.
|
N/A
|
Facility was never operated.
|
|
1985-Early 1990s
|
Central Electrical Generating Board of England (known as PRI)
|
Nedco and Union Pacific properties were consolidated into the Teton Leuenberger Project. PRI purchased the property and added to the acreage through the purchase of adjacent claim blocks owned by Kerr-McGee.
|
N/A
|
Ownership transition and growth in acreage through acquisitions.
|
|
Late 1990s
|
PRI
|
Leuenberger properties were released due to declining market trends. Some claims reverted to previous owners.
|
N/A
|
Decrease in claims and generally the Ludeman Project Area.
|
|
Early
to Mid- 2000s
|
High Plains Uranium (“HPU”) and EMC
|
HPU held most claims and leases in the Ludeman Project Area. Energy Metals held the remaining claims in the Ludeman Project Area.
|
N/A
|
Claims and leases increased in the Ludeman Project Area.
|
|
2007
|
EMC
|
EMC acquired HPU.
|
N/A
|
Consolidation through acquisition.
|
|
2007
|
Uranium One
|
Uranium One acquired Energy Metals in late 2007 and continued exploration of the Ludeman Project Area from 2007 through 2012. The primary goals of drilling included exploration to establish continuity of regional ore trends, development drilling to determine the lateral extents of the ore body, stratigraphic investigation, confirmation of the location and nature of mineralization, and collection of cores for leach testing and analysis of uranium, mineralogy, trace metals, disequilibrium, permeability, porosity and density. Acquired the WDEQ/LQD mine permit and NRC license.
|
Approximately 2,180
|
Continued exploration of the Ludeman Project Area. Additional holes included boreholes, core holes, and monitor wells.
|
|
2021
|
UEC
|
The Ludeman Project Area acquired by UEC from Uranium One.
|
N/A
|
Ownership transition.
|
|
Classification
|
Tons Ore
(000’s)
|
Tonnes Ore
(1000’s)
|
Average
Grade
(% eU3O8)
|
Pounds
eU3O8
(000’s)
|
|
Measured
|
2,674
|
2,426
|
0.094
|
5,016.9
|
|
Indicated
|
2,660
|
2,413
|
0.088
|
4,696.9
|
|
Total M&I
|
5,334
|
4,839
|
0.091
|
9,713.8
|
|
Inferred
|
866
|
786
|
0.073
|
1,258.0
|
|
Total Resources
|
6,200
|
5,625
|
0.088
|
10,971.8
|
|
1.
|
The sum of measured and indicated tons and lbs. may not add up to the reported total due to rounding.
|
|
|
2.
|
Measured and indicated mineral resources as defined in 17 CFR § 229.1300.
|
|
|
3.
|
GT Cutoff = 0.25 ft% eU3O8.
|
|
|
4.
|
All reported resources occur below the static water table.
|
|
|
5.
|
The point of reference for mineral resources is in-situ at the Project.
|
|
|
6.
|
Mineral resources that are not mineral reserves do not have demonstrated economic viability.
|
|
|
7.
|
A long-term uranium price of $40/lb U3O8 and an 80% metallurgical recovery factor were considered for the purposes of determining the reasonable prospect of economic extraction.
|
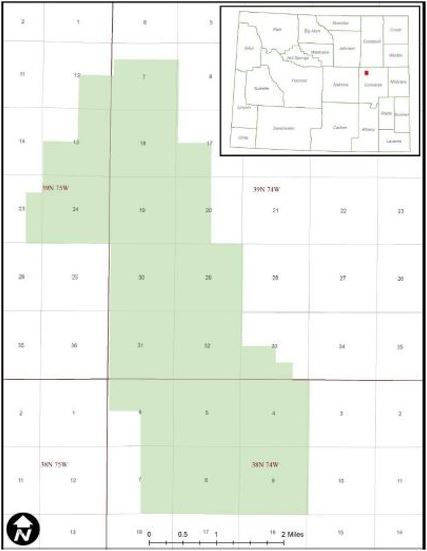
|
Year
|
Company
|
Operations/Activity
|
Amount
(No. of Drill holes)
|
Results of Work
|
|
1967
|
Kerr-McGee, Homestake, Teton
|
Early uranium exploration was completed by the three companies in the Allemand-Ross Project Area. Exploration was typically for shallower mineralization (<1,000 ft).
|
Approximately 100
|
Exploration of shallow mineralization (<1,000 ft).
|
|
1971
|
Conoco
|
Conoco staked lode mining claims in 1969. In 1970, Conoco entered an agreement with National Resources Corporation to earn in on the Allemand-Ranch land holdings. National Resources Corporation’s interests were acquired by Pioneer Nuclear in 1972 and the joint venture partnership was maintained until 1975. In 1979, Conoco continued to operate the drilling program. Conoco closed its mineral department in 1984.
|
Approximately 1,180
|
A significant amount of the mineralization within the Allemand-Ross Project Area was delineated.
|
|
1984
|
Power Reactor and Nuclear Fuel Development Corporation (“PNC”)
|
PNC assumed control of the Allemand-Ross Project Area and continued exploration.
|
Approximately 50
|
Additional exploration completed by PNC.
|
|
Early
1990s
|
PNC
|
Mineral rights were allowed to lapse due to further declining uranium market conditions.
|
N/A
|
Lost mineral rights.
|
|
Early
2000s-2005
|
HPU and EMC
|
Claims and leases were acquired during the uranium market upswing. HPU held most claims and leases and EMC holding the remainder of the Allemand-Ross Project Area.
|
N/A
|
Mineral rights were acquired.
|
|
2007
|
EMC
|
EMC acquired HPU. The properties were consolidated.
|
N/A
|
Properties consolidated.
|
|
2007
|
Uranium One
|
Uranium One acquired EMC. Uranium One proceeded to conduct verification and resource enhancement drilling. Most drilling was completed between 2008 and 2010.
|
Approximately 300
|
Additional exploration completed within the Allemand-Ross Project Area with average depths ranging from 1,118 ft to 1,546 ft.
|
|
2021
|
UEC
|
The Allemand-Ross Project Area acquired by UEC from Uranium One.
|
N/A
|
Ownership transition.
|
|
Classification
|
Tons Ore
(000’s)
|
Tonnes Ore
(1000’s)
|
Average
Grade
(% eU3O8)
|
Pounds
eU3O8
(000’s)
|
|
Measured
|
246
|
223
|
0.085
|
417.0
|
|
Indicated
|
32
|
29
|
0.066
|
42.4
|
|
Total M&I
|
278
|
252
|
0.083
|
459.4
|
|
Inferred
|
1,275
|
1,157
|
0.098
|
2,496.0
|
|
Total Resources
|
1,553
|
1,409
|
0.095
|
2,955.4
|
|
1.
|
The sum of resource tons and lbs. may not add up to the reported total due to rounding.
|
|
|
2.
|
Measured and indicated mineral resources as defined in 17 CFR § 229.1300.
|
|
|
3.
|
GT Cutoff = 0.25 ft% eU3O8.
|
|
|
4.
|
All reported resources occur below the static water table.
|
|
|
5.
|
The point of reference for mineral resources is in-situ at the Project.
|
|
|
6.
|
Mineral resources that are not mineral reserves do not have demonstrated economic viability.
|
|
|
7.
|
A long-term uranium price of $40/lb U3O8 and an 80% metallurgical recovery factor were considered for the purposes of determining the reasonable prospect of economic extraction.
|

|
Year
|
Company
|
Operations/Activity
|
Amount
(No. of Drill holes)
|
Results of Work
|
|
1969
|
Mono and RME
|
Under a joint venture, Mono and RME conducted the initial exploration program through drilling. Upon successful exploration, the Bear Creek Uranium Company was formed under general partnership between Mono and RME.
|
Unspecified and included in the total estimate.
|
Successful exploration led to joint venture and mill construction.
|
|
1975-1982
|
Bear Creek Uranium Company
|
A mill was constructed in 1975. Open pit mining operations began in 1977 until 1982. Mining claims were dropped after 1982.
|
Approximately 6,880
|
4.7 million tons of material from open pit mining processed at the Bear Creek mill.
|
|
2006
|
EMC
|
EMC located the unpatented mining claims and acquired the state mineral leases.
|
N/A
|
Lapsed mineral leases acquired.
|
|
2007
|
Uranium One
|
Uranium One acquired EMC and all rights to the Barge Project Area.
|
None as of 2019.
|
No exploration had been completed.
|
|
2021
|
UEC
|
Barge Project Area acquired by UEC from Uranium One.
|
N/A
|
Ownership.
|
|
Classification
|
Tons Ore (000’s)
|
Tonnes Ore
(1000’s)
|
Average Grade
(% eU3O8)
|
Pounds
eU3O8 (000’s)
|
|
Measured
|
-
|
-
|
-
|
-
|
|
Indicated
|
4,301
|
3,902
|
0.051
|
4,361.0
|
|
Total M&I
|
4,301
|
3,902
|
0.051
|
4,361.0
|
|
Inferred
|
-
|
-
|
-
|
-
|
|
Total Resources
|
4,301
|
3,902
|
0.051
|
4,361.0
|
|
1.
|
The sum of measured and indicated tons and lbs. may not add up to the reported total due to rounding.
|
|
|
2.
|
Measured and indicated mineral resources as defined in 17 CFR § 229.1300.
|
|
|
3.
|
GT Cutoff = 0.25 ft% eU3O8.
|
|
|
4.
|
All reported resources occur below the static water table.
|
|
|
5.
|
The point of reference for mineral resources is in-situ at the Project.
|
|
|
6.
|
Mineral resources that are not mineral reserves do not have demonstrated economic viability.
|
|
|
7.
|
A long-term uranium price of $40/lb U3O8 and an 80% metallurgical recovery factor were considered for the purposes of determining the reasonable prospect of economic extraction.
|

|
Year
|
Company
|
Operations/Activity
|
Amount
(No. of Drill holes)
|
Results of Work
|
|
Jab
|
||||
|
Unspecified
|
Silverbell Industries
|
Originator of the Jab/West Jab Project Area.
|
Not specified.
|
The Jab/West Jab Project Area initially developed.
|
|
1972
|
Union Carbide Corporation (“UCC”)
|
Delineated an area of shallow oxidized mineralization and completed feasibility studies for open pit mining. The plan was not executed, and a mining permit was prepared for the WDEQ/LQD. The permit was withdrawn due to the declining uranium market in 1982.
|
Approximately 1,830
|
Delineation of shallow oxidized material.
|
|
1985-2000
|
Yellowstone Fuels
|
Property held until a decline in the uranium market in 2000. No data developed by Yellowstone Fuels were available for evaluation.
|
No data available.
|
The Jab/West Jab Project Area held but not substantially developed.
|
|
West Jab
|
||||
|
Unspecified
|
AMAX Petroleum Company
|
Originator of the Jab/West Jab Project Area.
|
Not specified.
|
The Jab/West Jab Project Area initially developed.
|
|
1975-1983
|
WNC
|
WNC drilled the Jab/West Jab Project Area until 1983 when uranium markets had dropped. WNC terminated claim. AMAX Petroleum Company regained control until the claims were dropped.
|
Approximately 1,020
|
Exploration completed by WNC.
|
|
Jab/West Jab
|
||||
|
2006
|
EMC
|
Identified the unpatented mining claims and acquired the state mineral leases.
|
N/A
|
Secured right to mine.
|
|
2007
|
Uranium One
|
Uranium One acquired EMC and all rights to the Jab/West Jab Project Area.
|
None as of 2019
|
No exploration had been completed. Right to mine secured.
|
|
2021
|
UEC
|
The Jab/West Jab Project Area acquired by UEC from Uranium One.
|
N/A
|
Ownership transition.
|
|
Classification
|
Tons Ore (000’s)
|
Tonnes Ore
(1000’s)
|
Average Grade
(% eU3O8)
|
Pounds
eU3O8 (000’s)
|
|
Measured
|
1,621
|
1,471
|
0.072
|
2,335.0
|
|
Indicated
|
253
|
230
|
0.077
|
392.0
|
|
Total M&I
|
1,874
|
1,701
|
0.073
|
2,727.0
|
|
Inferred
|
1,402
|
1,272
|
0.06
|
1,677.0
|
|
Total Resources
|
3,276
|
2,973
|
0.067
|
4,404.0
|
|
1.
|
The sum of resource tons and lbs. may not add up to the reported total due to rounding.
|
|
|
2.
|
Measured, indicated, and inferred mineral resources as defined in 17 CFR § 229.1300.
|
|
|
3.
|
GT Cutoff = 0.25 ft% eU3O8.
|
|
|
4.
|
Measured and indicated resources occur below the static water table. The inferred resources at Jab/West Jab occur above the water table and may not be amenable to ISR.
|
|
|
5.
|
The point of reference for mineral resources is in-situ at the Project.
|
|
|
6.
|
Mineral resources that are not mineral reserves do not have demonstrated economic viability.
|
|
|
7.
|
A long-term uranium price of $40/lb U3O8 and an 80% metallurgical recovery factor were considered for the purposes of determining the reasonable prospect of economic extraction.
|
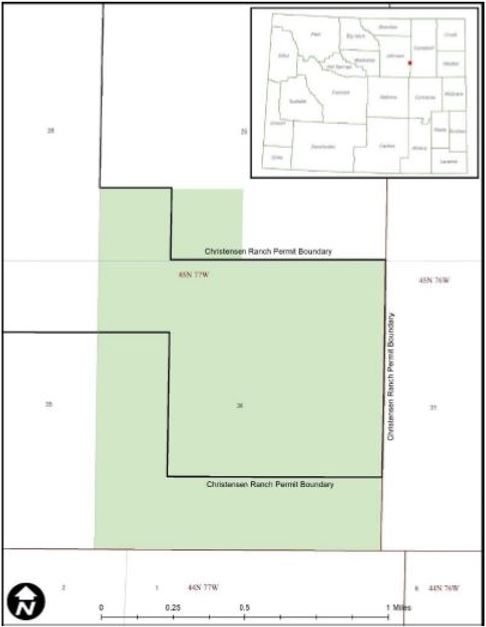
|
Year
|
Company
|
Operations/Activity
|
Amount
(No. of Drill
holes)
|
Results of Work
|
|
1966
|
Preston Oil Co. (“Preston Oil”)
|
Awarded the state lease for 720 acres.
|
None.
|
Right to mine secured.
|
|
1966
|
Inexco Oil Company (“Inexco”)
|
Inexco assigned lease from Preston Oil in 1966 and conducted exploration drilling program in 1969 and 1970.
|
215
|
Delineation of mineralized areas.
|
|
1974
|
Uranerz USA
|
Inexco formed a joint venture with Uranerz USA who became the operator. Over the next two years, Uranerz expanded the drilling program, including core drilling.
|
715
|
Delineation of mineralized areas.
|
|
Not specified
|
Cotter Corporation (“Cotter”)
|
Cotter acquired the property and evaluated both conventional open pit and in situ mining methods. Cotter obtained a surface mining permit in 1979. A 200-foot-deep test pit was excavated in 1981 in a small mineralization area. The pit was subsequently reclaimed, but the state mining permit remains active.
|
Not specified
|
Falling uranium prices in the 1980’s halted
further development.
|
|
1994
|
Cotter and PRI
|
PRI entered a joint venture agreement with Cotter and completed a feasibility study for development as an ISR mine (PRI, 1995). Completed additional drilling in 1994.
|
Not specified
|
The feasibility study was positive; however, the Charlie Project Area did not proceed, and the joint venture agreement expired.
|
|
2014
|
Cotter
|
In 2014 Cotter sought to convert the permit to ISR mining; however, that process has not been completed.
|
None
|
Unknown.
|
|
2018
|
Anfield Energy Inc. (“Anfield”)
|
Anfield acquired the Charlie Project Area from Cotter.
|
None
|
Oversaw technical reporting and auditing of Charlie Project Area resources.
|
|
2021
|
UEC
|
UEC acquired the Charlie Project Area from Anfield.
|
N/A
|
Ownership transition.
|
|
Classification
|
Tons Ore (000’s)
|
Tonnes Ore
(1000’s)
|
Average Grade
(% eU3O8)
|
Pounds
eU3O8 (000’s)
|
|
Measured
|
-
|
-
|
-
|
-
|
|
Indicated
|
1,255
|
1,139
|
0.123
|
3,100.0
|
|
Total M&I
|
1,255
|
1,139
|
0.123
|
3,100.0
|
|
Inferred
|
411
|
373
|
0.120
|
988.0
|
|
Total Resources
|
1,666
|
1,512
|
0.123
|
4,088.0
|
|
1.
|
The sum of resource tons and lbs. may not add up to the reported total due to rounding.
|
|
|
2.
|
Measured, indicated, and inferred mineral resources as defined in 17 CFR § 229.1300.
|
|
|
3.
|
GT Cutoff = 0.20 ft% eU3O8.
|
|
|
4.
|
All reported resources occur below the static water table.
|
|
|
5.
|
The point of reference for mineral resources is in-situ at the Project.
|
|
|
6.
|
Mineral resources that are not mineral reserves do not have demonstrated economic viability.
|
|
|
7.
|
A long-term uranium price of $40/lb U3O8 and an 80% metallurgical recovery factor were considered for the purposes of determining the reasonable prospect of economic extraction.
|

|
Year
|
Company
|
Operations/Activity
|
Amount
(No. of Drill holes)
|
Results of
Work
|
|
Early 1950s
|
Independent operator
|
An internal report from 1969 states a Mr. Vickers reportedly discovered surficial mineralization and mined approximately 100 tons U3O8 at an average grade of 0.30%. Uranium was shipped to the AEC buying station at Edgemont, South Dakota.
|
None
|
Exploration and production of 100 tons U3O8.
|
|
1972
|
RME
|
RME acquired interest in the project in 1972 and conducted extensive drilling through 1978. Pilot scale ISR mining was conducted using four seven-spot patterns with a 50-foot radius. The first 3 patterns used sulfuric acid as the primary lixiviant and the fourth sodium carbonate-bicarbonate as the primary lixiviant. The U.S. Bureau of Mines assisted RME in conducting the pilot testing and documented the results in a publication titled “Case History of a Pilot-Scale Acidic In Situ Uranium Leaching Experiment” (Nigbor, N. T., et al, 1982). RME controlled the project until the late 1980s when the mineral interests were dropped due to declining uranium prices.
|
Approximately 1,100
|
Exploration and pilot scale ISR mining.
|
|
2005 and
2006
|
EMC
|
EMC located unpatented mining lode claims and secured mineral leases and surface agreements within the area formerly held by RME. EMC conducted exploratory drilling and compiled previous data and maps for the project.
|
Approximately 45
|
Secured right to mine.
|
|
2008
|
Uranium One
|
EMC was acquired by Uranium One.
|
None
|
Ownership transition.
|
|
2016
|
Anfield
|
Anfield purchased Nine Mile Lake Project from Uranium One.
|
None
|
Oversaw technical reporting and auditing of project resources.
|
|
2022
|
UEC
|
UEC acquired the Nine Mile Lake Project from Anfield.
|
N/A
|
Ownership transition.
|
|
Classification
|
Tons Ore (000’s)
|
Tonnes Ore
(1000’s)
|
Average Grade
(% eU3O8)
|
Pounds
eU3O8 (000’s)
|
|
Measured
|
-
|
-
|
-
|
-
|
|
Indicated
|
-
|
-
|
-
|
-
|
|
Total M&I
|
-
|
-
|
-
|
-
|
|
Inferred
|
3,405
|
3,089
|
0.036
|
4,308.0
|
|
Total Resources
|
3,405
|
3,089
|
0.036
|
4,308.0
|
|
1.
|
The sum of resource tons and lbs. may not add up to the reported total due to rounding.
|
|
|
2.
|
Measured, indicated, and inferred mineral resources as defined in 17 CFR § 229.1300.
|
|
|
3.
|
GT Cutoff = 0.25 ft% eU3O8.
|
|
|
4.
|
All reported resources occur below the static water table.
|
|
|
5.
|
The point of reference for mineral resources is in-situ at the Project.
|
|
|
6.
|
Mineral resources that are not mineral reserves do not have demonstrated economic viability.
|
|
|
7.
|
A long-term uranium price of $40/lb U3O8 and an 80% metallurgical recovery factor were considered for the purposes of determining the reasonable prospect of economic extraction.
|
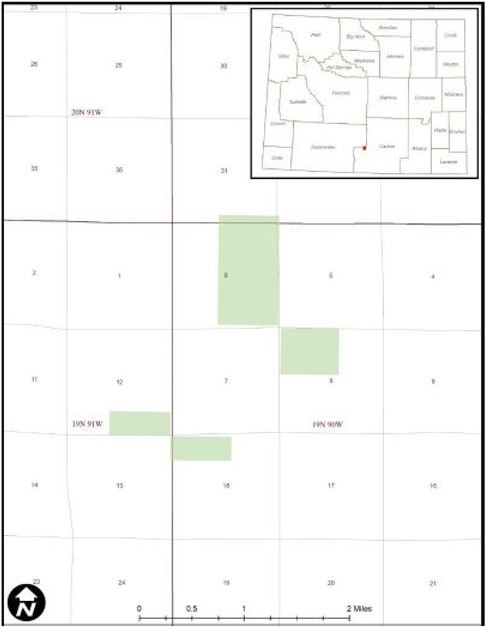
|
Year
|
Company
|
Operations/Activity
|
Amount
(No. of Drill holes)
|
Results of Work
|
|
1970
|
Kerr McGee Corp. and UCC
|
Both companies located claims in the vicinity and conducted exploration and drilling programs. The claims were dropped by 1973.
|
Not specified.
|
Exploration is reported to have encountered alteration and mineralization at depth.
|
|
1974
|
Timberline Minerals and Wold
|
Both companies located claims in the vicinity.
|
None.
|
Secured federal mining claims.
|
|
1976
|
UCC
|
UCC leased the Timberline Minerals property and entered a joint venture agreement with RME, a subsidiary of the Union Pacific Railroad, for the alternate sections of railroad grant lands in the area. UCC relinquished their mineral interests at Red Rim in 1986 and the mining claims reverted to Timberline Minerals, which subsequently dropped the claims.
|
138
|
Conducted an exploration and drilling program. Of the 138 drill holes on the current Red Rim Project Area, 42 are barren or contain trace mineralization and the remaining 96 are mineralized.
|
|
2004
|
EMC
|
Located 49 unpatented mining lode claims that comprise the current Red Rim Project Area.
|
None.
|
Secured federal mining claims.
|
|
2007
|
Uranium One
|
Uranium One Inc. acquired EMC. Through subsequent transactions, Uranium One Inc. became Uranium One Americas, Inc.
|
None.
|
Ownership transition.
|
|
2016
|
Anfield
|
Anfield purchased Red Rim Project from Uranium One.
|
None.
|
Oversaw technical reporting and auditing of project resources.
|
|
2022
|
UEC
|
UEC acquired the Red Rim project from Anfield.
|
N/A
|
Ownership transition.
|
|
Classification
|
Tons Ore (000’s)
|
Tonnes Ore
(1000’s)
|
Average Grade
(% eU3O8)
|
Pounds
eU3O8 (000’s)
|
|
Measured
|
-
|
-
|
-
|
-
|
|
Indicated
|
337
|
306
|
0.170
|
1,142.0
|
|
Total M&I
|
337
|
306
|
0.170
|
1,142.0
|
|
Inferred
|
473
|
429
|
0.163
|
1,539.0
|
|
Total Resources
|
810
|
735
|
0.165
|
2,681.0
|
|
1.
|
The sum of resource tons and lbs. may not add up to the reported total due to rounding.
|
|
|
2.
|
Measured, indicated, and inferred mineral resources as defined in 17 CFR § 229.1300.
|
|
|
3.
|
GT Cutoff = 0.25 ft% eU3O8.
|
|
|
4.
|
All reported resources occur below the static water table.
|
|
|
5.
|
The point of reference for mineral resources is in-situ at the Project.
|
|
|
6.
|
Mineral resources that are not mineral reserves do not have demonstrated economic viability.
|
|
|
7.
|
A long-term uranium price of $40/lb U3O8 and an 80% metallurgical recovery factor were considered for the purposes of determining the reasonable prospect of economic extraction.
|

|
Year
|
Company
|
Operations/Activity
|
Amount
(No. of Drill holes)
|
Results of Work
|
|
1959
|
Utah Construction and Mining
|
Conducted uranium exploration drilling.
|
Not specified.
|
Unknown.
|
|
1968
|
Minerals Exploration Company (“MEC”) and Nuclear Reserves Inc.
|
MEC performed exploratory drilling between 1968 and 1981. In 1969, MEC and Nuclear Reserves Inc. entered into a joint venture. MEC held the Clarkson Hill Project Area through the mid-1980s, when they dropped the claims due to declining uranium prices.
|
250
|
Delineation of mineralized areas. Falling uranium prices in the 1980’s halted further development.
|
|
Unknown
|
EMC
|
EMC performed initial staking of 14 claims and compiled relevant data for the Clarkson Hill Project Area. EMC optioned the Clarkson Hill Project Area to Artha Resources, who conducted limited verification drilling during 2008. The Clarkson Hill Project Area reverted from Artha to EMC.
|
5
|
Unknown.
|
|
2008
|
Uranium One
|
EMC was acquired by Uranium One Inc. Through subsequent transactions Uranium One Inc. became Uranium One Americas Inc.
|
None.
|
Ownership transition.
|
|
2016
|
Anfield Resources, Inc. (now Anfield Energy, Inc.)
|
Anfield purchased the Clarkson Hill Project Area from Uranium One.
|
None.
|
Oversaw technical reporting and auditing of the Clarkson Hill Project Area resources.
|
|
2022
|
UEC
|
UEC acquire the Clarkson Hill Project Area from Anfield.
|
N/A
|
Ownership transition.
|
|
Classification
|
Tons Ore (000’s)
|
Tonnes Ore (1000’s)
|
Average Grade (% eU3O8)
|
Pounds eU3O8 (000’s)
|
|
Measured
|
-
|
-
|
-
|
-
|
|
Indicated
|
-
|
-
|
-
|
-
|
|
Total M&I
|
-
|
-
|
-
|
-
|
|
Inferred
|
957
|
868
|
0.058
|
1,113.0
|
|
Total Resources
|
957
|
868
|
0.058
|
1,113.0
|
|
1.
|
The sum of resource tons and lbs. may not add up to the reported total due to rounding.
|
|
|
2.
|
Measured, indicated, and inferred mineral resources as defined in 17 CFR § 229.1300.
|
|
|
3.
|
GT Cutoff = 0.25 ft% eU3O8.
|
|
|
4.
|
All reported resources occur below the static water table.
|
|
|
5.
|
The point of reference for mineral resources is in-situ at the Project.
|
|
|
6.
|
Mineral resources that are not mineral reserves do not have demonstrated economic viability.
|
|
|
7.
|
A long-term uranium price of $40/lb U3O8 and an 80% metallurgical recovery factor were considered for the purposes of determining the reasonable prospect of economic extraction.
|
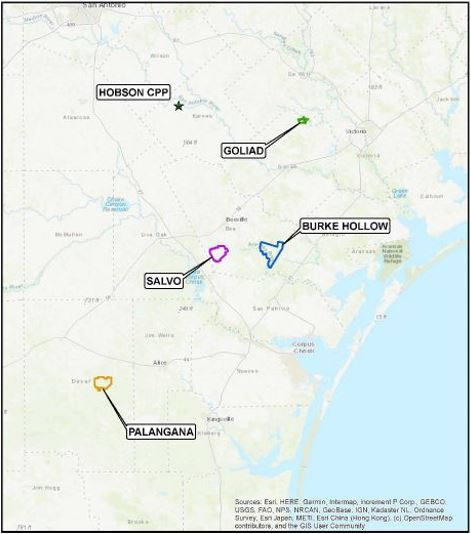
|
●
|
the TCEQ will require UEC to apply for and obtain a radioactive material license pursuant to Title 30 Texas Administrative Code Chapters 305 and 336. The application must address a number of matters including, but not limited to, site characteristics (ecology, geology, topography, hydrology, meteorology, historical and cultural landmarks and archaeology), radiological and non-radiological impacts, environmental effects of accidents, decommissioning, decontamination and reclamation;
|
|
●
|
to produce uranium from subsurface deposits, an operator must obtain an area permit and production area authorization (PAA) pursuant to the Texas Water Code, Chapter 27. Underground injection activities cannot commence until the TCEQ has issued an area permit and PAA to authorize such activities. In addition, all portions of the proposed production zone in groundwater with a total dissolved solids concentration less than 10,000 mg/L, which will be affected by mining solutions, are included within an aquifer exemption approved by TCEQ and the EPA. The PAA application may be developed concurrently with or after the area permit application. As additional production areas are proposed to be activated within the area permit, additional PAA applications must be submitted to the TCEQ for processing and issuance before injecting within the production area;
|
|
●
|
in 1975, the Texas Legislature gave the RRC jurisdiction to regulate surface mining for coal and uranium. No surface mining for uranium is currently conducted at the Project, but uranium exploration for ISR operations is administered by the Surface Mining and Reclamation Division of the RRC. Active uranium exploration sites are inspected monthly (RRC, 2023). The RRC requires exploration permits for any uranium exploration in the state;
|
|
●
|
Texas state law does not provide any agency with the authority to regulate the use or production of groundwater unless the location lies within a water conservation district (WCD). Burke Hollow and Salvo are both located in the Bee County WCD, Goliad is located in the Goliad County WCD and Palangana resides in the Duval County WCD. Prior to initiating uranium recovery at the Project, UEC will need to acquire industrial permits to withdraw groundwater from the host sandstones. Please refer to the TRS report for the Texas Hub and Spoke Project for further details.; and
|
|
●
|
Class I and III injection wells are also regulated by the TCEQ. Therefore, UEC will need to acquire the appropriate permits in order to construct and operate these wells.
|
|
Year
|
Company
|
Operations/Activity
|
Amount
(No. of Drill holes) |
Results of Work
|
|
1979-1988
|
Everest Minerals Corporation (later Everest Exploration, Inc. (EEI))
|
Hobson facility constructed.
|
N/A
|
N/A
|
|
2005
|
Standard Uranium
|
N/A
|
N/A
|
N/A
|
|
2006
|
EMC
|
Standard Uranium and EMC merger.
Extensive renovation of the plant. |
N/A
|
N/A
|
|
2007
|
Uranium One
|
Renovation of the plant.
|
N/A
|
CPP capable of processing 1.5 million lbs per year.
|
|
2009
|
UEC
|
Acquires the Hobson Plant through acquisition of South Texas Mining Venture (STMV)/Uranium One.
|
N/A
|
N/A
|
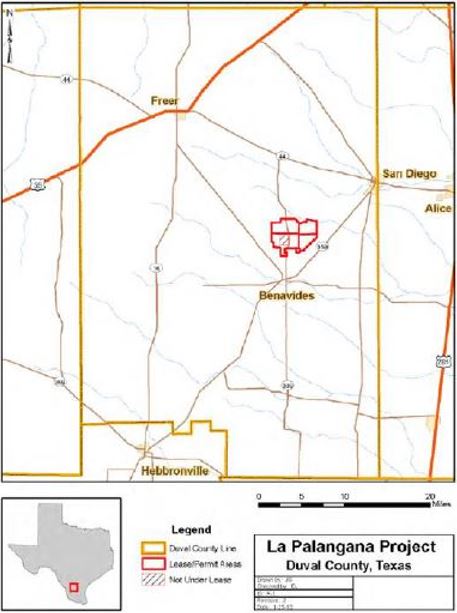
|
Year
|
Company
|
Operations/Activity
|
Amount
(# of Drill holes) |
Results of Work
|
|
1952
|
CSI
|
Original controller of Palangana Project Area.
|
Records of CSI’s exploration work was unavailable
|
Right to mine secured. Uranium mineralization was discovered during potash exploration drilling of the Palangana Dome in 1952 by CSI. CSI conducted active uranium exploration drilling on the property starting in March 1956. CSI and the AEC estimated underground mineable uranium resources. The estimation method included identifying 0.15% eU3O8, a minimum mining thickness of 3 ft, and exploration was widely spaced drilling on a nominal 200 ft exploration grid.
|
|
1958
|
UCC
|
UCC acquired the Palangana Project Area in 1958 and ceased operations shortly after until 1967, when operations resumed for over a decade due to new technology. UCC placed the Palangana Project Area up for lease in 1980.
|
Over 1,000 exploration and development holes in 1960s and 70s (296 cores)
Over 3,000 injection-production holes |
Early development work was quickly abandoned because of concentrations of Hydrogen Sulfide (H2S) gas. The property was reacquired in 1967 after emerging ISR mining technologies were available. ISR operation occurred from 1977 through 1979. About 340,000 lbs of U3O8 were produced from portions of a 31-acre wellfield block. The production pounds indicate a 32% to 34% recovery rate. The ISR work was conducted at a research level in contrast to the current level of knowledge. Historic production lies on the western flank of the dome and is not part of this resource estimate.
|
|
1981
– Unknown
|
Chevron
|
Chevron acquired the UCC leases and conducted their own resource evaluation.
|
N/A
|
Chevron resource evaluation indicated that an estimated 8 million lbs (non-CIM compliant) of eU3O8 existed on the entire site within unclassified material containing 0.125% eU3O8.
|
|
Unknown
to late
1990’s
|
General Atomics
|
General Atomics acquired the Palangana Project Area for restoration work.
|
N/A
|
General Atomics acquired the property and dismantled the process plant in a property-wide restoration effort. Upon formal approval of the clean up by the Texas Natural Resources Conservation Commission and the NRC, the property was returned to the landowners in the late 1990s.
|
|
Late 1990’s
to 2005
|
N/A
|
The Palangana Project Area returned to surface rights landowners.
|
N/A
|
N/A
|
|
2005
|
EEI and Energy Metals/Uranium One
|
EEI acquires Palangana and joint ventured with Energy Metals by forming the STMV. In 2008, Energy Metals was acquired by Uranium One.
|
Approximately 236 exploration and confirmation holes.
|
Blackstone (2005) estimated 5.7 million lbs of inferred resources in the area referred to as the Dome trend proximal to the dome on the west side, north of the prior UCC leach field. In 2006 and 2007, Energy Metals drilled approximately 200 additional confirmation and delineation holes. The PA-1 and PA-2 areas were delineated during this drilling program. During 2008 and 2009, the remainder of the holes were drilled by Uranium One. During this time, five exploration trends on the east side of the dome were identified and partially delineated.
|
|
2009
|
UEC
|
Palangana Project Area acquired by UEC from Uranium One.
|
N/A
|
UEC acquires Palangana. SRK was retained by UEC in 2010 to provide an independent resource and reserve evaluation on PA-1 and PA-2 and adjacent exploration areas. SRK concluded the sandstone, roll-front deposits on the east side of the Palangana Dome contain significant resources of eU3O8. Specifically, PA-1 and PA-2 bodies are adequately delineated for the calculation of Measured and Indicated Resources. SRK developed resource estimates within distinct sand and roll-front zones utilizing detailed computer block modeling of grade and GT modeling. The results of the resource estimation are complex and presented in more detail in this report. In 2010, UEC resumed production at Palangana. Approximately 563,600 pounds were produced from 2010 to 2016 in PA-1, PA-2 and PA-3.
|
|
Classification
|
Tons Ore
(000’s)
|
Tonnes Ore
(1000’s)
|
Average
Grade
(% eU3O8)
|
Pounds
eU3O8
(000’s)
|
|
Measured
|
-
|
-
|
-
|
-
|
|
Indicated
|
232
|
210
|
0.134
|
643.1
|
|
Total M&I
|
232
|
210
|
0.134
|
643.1
|
|
Inferred – PA-1 and PA-2
|
96
|
87
|
0.100
|
192.5
|
|
Inferred – Dome, NE Garcia, SW Garcia, CC Brine, Jemison Fence, Jemison East
|
206
|
187
|
0.110 – 0.300
|
808.8
|
|
Total Resources
|
534
|
484
|
0.154
|
1,644.4
|
|
1.
|
Pounds reported with Disequilibrium Factor (DEF) applied.
|
|
|
2.
|
A range of grades is presented for the Palangana inferred mineral because the resource estimation methods differed between PA-1/PA-2 and the rest of the trends. There was no cutoff for PA-1 and PA-2 block models. See Section 11.1 of the Texas Hub and Spoke TRS for a more detailed explanation.
|
|
|
3.
|
The sum of resource tons and lbs may not add up to the reported total due to rounding.
|
|
|
4.
|
Measured, indicated, and inferred mineral resources as defined in 17 CFR § 229.1300.
|
|
|
5.
|
Delineation drilling conducted at Palangana after 2010 was not incorporated into the resource estimate as in the experience of the QP, this type of drilling does not generally substantially change the resource estimates.
|
|
|
6.
|
All reported resources occur below the static water table.
|
|
|
7.
|
The point of reference for mineral resources is in-situ at the Project.
|
|
|
8.
|
Mineral resources that are not mineral reserves do not have demonstrated economic viability.
|
|
|
9.
|
A long-term uranium price of $40/lb U3O8 and an 80% metallurgical recovery factor were considered for the purposes of determining the reasonable prospect of economic extraction.
|

|
Year
|
Company
|
Operations/Activity
|
Amount
(No. of Drill holes) |
Results of Work
|
|
1982
|
Nufuels
|
Original controller of the Burke Hollow Project Area.
|
18 exploration holes on or nearby the Welder Lease
|
Nufuels drilled 18 exploration holes on or nearby UEC’s 1,825-acre Welder lease in conjunction with a larger regional program, which was conducted by Nufuels. Exploration holes were drilled to approximately 1,100 ft bgs and tested the entire prospective Goliad Formation. Results showed the presence of a reduction-oxidation interface in sands of the lower Goliad Formation, but there was insufficient data to link economically viable uranium mineralization.
|
|
1993
|
TOMIN
|
Exploration program.
|
12 exploration holes on or near the Thomson-Barrow Lease.
|
TOMIN conducted a short reconnaissance exploration drilling program on the Thomson-Barrow lease. TOMIN drilled a total of 12 holes on permitted acreage that they negotiated for exploration. 11 of the 12 drill holes intersected anomalous gamma ray log signatures indicative of uranium mineralization, but there was insufficient data to link economically viable uranium mineralization.
|
|
2011
|
UEC
|
The Burke Hollow Project Area was acquired by UEC from TOMIN.
|
From 2012-2017, 707 uranium exploration drill holes, including 30 monitor wells completed at the Welder lease (Kurrus et al. 2014).
|
The historic data package was obtained and reviewed by UEC for portions of the current Burke Hollow Project Area (Kurrus and Yancy, 2017). Based on the limited number of drill holes, no meaningful resource or reserve determination was made using the historic exploration data. However, the actual drilling and geophysical logging results were determined to be properly conducted, per industry standards. UEC completed two drilling campaigns to delineate the opened ended Lower B1 and B2 trends (Carothers et al., 2013). The results of historic and contemporary borehole gamma-ray, SP and resistance logs, as well as PFN logs indicate that uranium mineralization occurs in the upper to lower Goliad Formation sand/sandstone units below the water table at depths from approximately 180 to 1,100 ft bgs. Evidence indicate ISR would likely be the most suitable mining method for this project. In 2017, UEC estimated an Inferred Mineral Resource of 4,064,575 tons grading 0.088% pU3O8 (PFN determination) containing approximately 7.09 million pounds U3O8 in the combined Graben and Eastern Lower B trends.
|
|
2019
|
UEC
|
Exploration program.
|
In 2019, 129 delineation holes were drilled.
From 2021-2022, 168 delineation and exploration holes were drilled. |
In 2019, UEC completed 129 drill holes, mostly focusing on delineating the Lower B1 and Lower B2 sands in the proposed PA-1. In addition, UEC began installing perimeter monitor wells in proposed PA-1. In total, 57 holes were drilled solely for delineation and exploration purposes and 72 holes were drilled for monitoring purposes. From 2021 to 2022, UEC conducted another drilling program to upgrade a portion of their resources from inferred to measured and indicated, to better define the ore body in proposed PA-1 and to install monitor wells. 168 delineation and exploration holes were drilled as of March 7, 2022. 24 of these holes were also used as monitor wells. This drilling program is ongoing for the purpose of completing more monitor wells. The first production area authorization application has been submitted and 533 exploration and delineation holes have been drilled within PA-2 area as of July 31, 2023.
|
|
Classification
|
Tons Ore (000’s)
|
Tonnes Ore
(1000’s)
|
Average Grade
(% eU3O8)
|
Pounds
eU3O8 (000’s)
|
|
Measured
|
70
|
64
|
0.082
|
114.7
|
|
Indicated
|
1,337
|
1,213
|
0.087
|
2,209.0
|
|
Total M&I
|
1,407
|
1,277
|
0.083
|
2,323.7
|
|
Inferred
|
2,494
|
2,263
|
0.095
|
4,859.0
|
|
Total Resources
|
3,901
|
3,540
|
0.092
|
7,182.7
|
|
1.
|
Pounds reported with Disequilibrium Factor (DEF) applied.
|
|
|
2.
|
The sum of resource tons and lbs. may not add up to the reported total due to rounding.
|
|
|
3.
|
Measured, indicated, and inferred mineral resources as defined in 17 CFR § 229.1300.
|
|
|
4.
|
GT Cutoff = 0.30 ft% eU3O8.
|
|
|
5.
|
All reported resources occur below the static water table.
|
|
|
6.
|
The point of reference for mineral resources is in-situ at the Project.
|
|
|
7.
|
Mineral resources that are not mineral reserves do not have demonstrated economic viability.
|
|
|
8.
|
A long-term uranium price of $40/lb U3O8 and an 80% metallurgical recovery factor were considered for the purposes of determining the reasonable prospect of economic extraction.
|
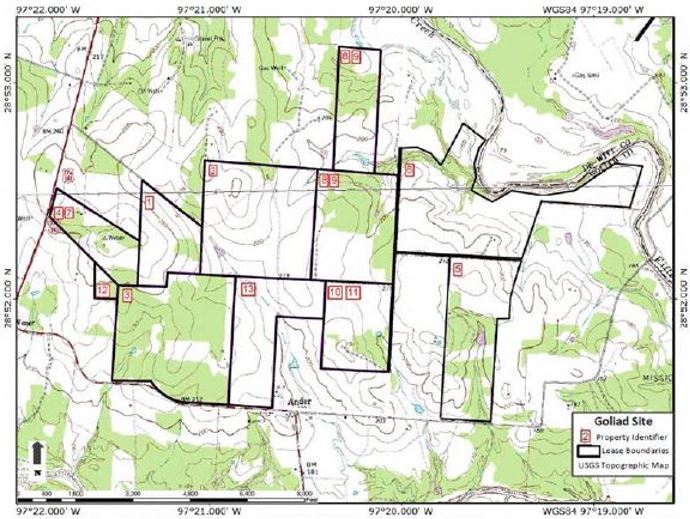
|
Year
|
Company
|
Operations/Activity
|
Amount
(No. of Drill holes) |
Results of Work
|
|
1979
|
Coastal Uranium, Inc. (Coastal Uranium)
|
Exploration program.
|
12 exploration holes.
|
Coastal Uranium drilled widely spaced exploration holes in the region as part of the Coastal States wide-spaced drilling exploration effort. Eight of these holes were drilled at or near the Goliad Project Area. Additional information on the exploration is described below.
|
|
1980
|
Moore Energy Corporation
|
Review of data and leases from Coastal Uranium and exploration program.
|
479 exploration and delineation holes.
|
Moore Energy Corporation reviewed the Coastal States exploration data and soon after acquired several leases from Coastal Uranium, including several in the Goliad Project Area. From March 1983 through August 1984, Moore Energy Corporation conducted an exploration program at Goliad. All of the boreholes were drilled using truck-mounted drilling rigs contracted with various drilling companies. Samples were taken by the driller for review and logged by a geologist. The holes were logged for gamma ray, self-potential and resistance by contract logging companies. No down-hole deviation tool was available. Historical resource estimates were prepared by Moore Energy Corporation from data gathered in 1983-1985. For each drill hole, a Grade x Thickness (GT) was determined, and the mineral was outlined with a 0.3 GT contour. The average GT of the holes within the contoured outline was used to estimate the resources meeting the specified criteria. Moore Energy Corporation’s historical resource estimated approximately 3,366,000 tons at an average grade of 0.05% (eU3O8 and an average DEF of 1.494 (Moore, 1986). This equates to approximately 5.2 million lbs of uranium.
|
|
2006
|
UEC
|
Exploration program.
|
360 exploration and delineation holes.
|
UEC obtained mine leases by assignment from Brad A. Moore for the current Goliad Project Area in 2006. UEC drilled 360 more holes at the property from May 2006 through June 2007. These holes include closer-spaced delineation work on the areas drilled by Moore Energy Corporation. Additionally, several of the UEC holes were drilled to further exploration on contiguous leases to the east of the property. A 2007/2008 report by Thomas Carothers, PG estimated historical mineral resources based on the UEC 2006-2007 confirmation drilling results and the Moore Energy Corporation historical estimate. The author concluded that significant uranium resources from the work in 1983-85 described by Moore Energy Corporation appears to be backed and supported by the more recent UEC exploration data.
|
|
2014
|
UEC
|
Exploration and water well program.
|
33 exploration holes and two water wells drilled.
|
In 2014, UEC conducted a drilling program at the Goliad Project Area for exploration and water wells. 35 holes were drilled and logged for exploration and water supply purposes with a majority of the holes being drilled in PA-1 and PA-2.
|
|
Classification
|
Tons Ore (000’s)
|
Tonnes Ore
(1000’s)
|
Average Grade
(% eU3O8)
|
Pounds
eU3O8 (000’s)
|
|
Measured
|
1,595
|
1,447
|
0.053
|
2,667.9
|
|
Indicated
|
1,504
|
1,364
|
0.102
|
3,492.0
|
|
Total M&I
|
3,099
|
2,811
|
0.085
|
6,159.9
|
|
Inferred
|
333
|
302
|
0.195
|
1,224.8
|
|
Total Resources
|
3,432
|
3,113
|
0.079
|
7,384.7
|
|
1.
|
Pounds reported with Disequilibrium Factor (DEF) applied.
|
|
|
2.
|
The sum of resource tons and lbs. may not add up to the reported total due to rounding.
|
|
|
3.
|
Measured, indicated, and inferred mineral resources as defined in 17 CFR § 229.1300.
|
|
|
4.
|
GT Cutoff = 0.20 ft% eU3O8.
|
|
|
5.
|
All reported resources occur below the static water table.
|
|
|
6.
|
The point of reference for mineral resources is in-situ at the Project.
|
|
|
7.
|
Mineral resources that are not mineral reserves do not have demonstrated economic viability.
|
|
|
8.
|
A long-term uranium price of $40/lb U3O8 and an 80% metallurgical recovery factor were considered for the purposes of determining the reasonable prospect of economic extraction.
|
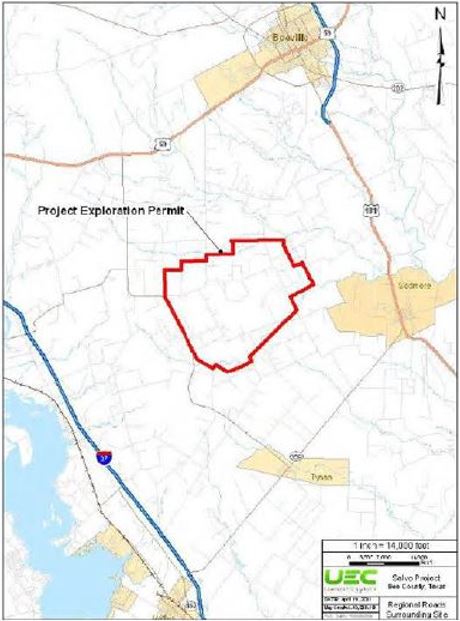
|
Year
|
Company
|
Operations/Activity
|
Amount
(No. of Drill holes)
|
Results of Work
|
|
Unknown
to 1983
|
Nufuels
|
Original controller of the Salvo Project Area.
|
111 exploration holes.
|
Nufuels discovered uranium mineralization in La Para sands of the Miocene-aged Goliad Formation in 1982 in Bee County, Texas. Mobil’s reconnaissance drilling located two areas of interest, known as the Salvo and Segar projects. Mobil had drilled a total of 111 exploration holes at Salvo and Seger in 1982. Shortly after conducting their exploration drilling in this area, Mobil elected to discontinue their uranium exploration efforts and sell their uranium production facilities. The early Salvo exploration drilling conducted by Nufuels indicated significant uranium mineralization was present.
|
|
1983
|
URI joint venture with Saaberg Interplan Uran Gmbh (“SIPU”) (“URI/SIPU”)
|
URI formed a joint venture exploration program with SIPU, a German utility. URI/SIPU acquired Salvo from Mobil, along with the Seger Project, an eastward extension along the same geochemical roll-front system. URI/SIPU leased the property until about 1993 when secondary lease expired.
|
295 exploration and delineation holes in 1984.
19 exploration holes at the nearby Seger Project. |
URI/SIPU calculated a resource of approximately 1.5 million pounds U3O8 at Salvo using a 0.5 GT cutoff in 1984. Average GT was modeled at 0.989, with a ratio of 0.194, width of 45 ft, length of 140 ft, and tonnage factor of 1.236 lbs/ft2. Due to low uranium prices, URI/SIPU elected not to permit the project at that time (R.B. Smith, unpublished report, 2005). URI utilized a Monte Carlo-based computer simulation to calculate the historic resource (URI, 1984).
|
|
2005
|
R.B. Smith & Associates Inc. (“R.B. Smith”)
|
Review of past exploration data.
|
N/A
|
R.B. Smith (2005) completed an evaluation of the Goliad Formation trend project data at the Salvo and Seger projects. Data were on loan from URI/SIPU. Smith did not retain copies of maps or electric logs, and the original data set of logs and maps was returned to URI. URI held the data in storage until 2010.
|
|
2010
|
UEC
|
The Salvo Project Area was acquired by UEC from URI/SIPU. UEC negotiated a purchase of available data from URI. URI and UEC reached agreement on sales of Salvo and Seger project data in 2010. The adjacent Seger property is no longer included in UEC’s Salvo leases.
|
N/A
|
Ownership transition. UEC received 425 exploration log files, and several drill hole location maps and land maps. The 425 log files include good quality electric logs from Mobil’s activities at Seger and Salvo in 1982, as well as URI/SIPU’s drill hole logs from exploration activities in 1984. Each log file also contains a detailed lithological report based on drill hole cuttings prepared by Mobil’s and later by URI’s field geologists supervising and monitoring drilling activity. Four core holes were drilled by URI, and core analysis reports were included in the appropriate log files. Eight holes were logged by Princeton Gamma-Tech (PGT, and early form of PFN), a logging company which specialized in uranium chemical assay logging. The PGT logs were utilized and verified as having excellent correlation to actual chemical uranium content by several south Texas ISR mining operations. These results are believed to be pertinent to the understanding of this deposit and indicated a generally positive DEF like other known Goliad Formation sandstones in the region. The historic mineralized intercepts from URI exploration boreholes were presented in the initial NI 43-101 UEC Salvo Project TRS dated July 16, 2010. The estimated historic uranium resource (URI 1984 classification only) of approximately 1.5 million pounds eU3O8 was determined but was not verified independently. However, it was presented in the initial 43-101 TRS.
|
|
Classification
|
Tons Ore (000’s)
|
Tonnes Ore
(1000’s)
|
Average Grade
(% eU3O8)
|
Pounds
eU3O8 (000’s)
|
|
Measured
|
-
|
-
|
-
|
-
|
|
Indicated
|
-
|
-
|
-
|
-
|
|
Total M&I
|
-
|
-
|
-
|
-
|
|
Inferred
|
1,125
|
1,020
|
0.091
|
2,839.0
|
|
Total Resources
|
1,125
|
1,020
|
0.091
|
2,839.0
|
|
1.
|
Pounds reported with Disequilibrium Factor (DEF) applied.
|
|
|
2.
|
The sum of resource tons and lbs. may not add up to the reported total due to rounding.
|
|
|
3.
|
Measured, indicated, and inferred mineral resources as defined in 17 CFR § 229.1300.
|
|
|
4.
|
GT Cutoff = 0.30 ft% eU3O8.
|
|
|
5.
|
All reported resources occur below the static water table.
|
|
|
6.
|
The point of reference for mineral resources is in-situ at the Project.
|
|
|
7.
|
Mineral resources that are not mineral reserves do not have demonstrated economic viability.
|
|
|
8.
|
A long-term uranium price of $40/lb U3O8 and an 80% metallurgical recovery factor were considered for the purposes of determining the reasonable prospect of economic extraction.
|
|
●
|
all exploration and mining activities must comply with the National Environmental Policy Act (NEPA); and
|
|
●
|
required environmental permits and licenses would include but may not be limited to:
|
|
●
|
Mine Land Reclamation Plan; Arizona State Mine Inspector;
|
|
●
|
Exploration Permit; Arizona State Land Department;
|
|
●
|
Plan of Operations; Bureau of Land Management;
|
|
●
|
Source Material License; U.S. Nuclear Regulatory Commission;
|
|
●
|
Water Wells and Appropriations; Arizona Department of Water Resources;
|
|
●
|
Dams and Impoundments; Arizona Department of Water Resources;
|
|
●
|
Air Quality Control Permit; Arizona Department of Environmental Quality;
|
|
●
|
Water and Stormwater Discharge Permits; Arizona Department of Environmental Quality;
|
|
●
|
Hazardous Waste; Arizona Department of Environmental Quality and EPA;
|
|
●
|
Solid Waste; Arizona Department of Environmental Quality;
|
|
●
|
Mine Safety and Health; Arizona State Mine Inspector and MSHA; and
|
|
●
|
County Zoning and Construction Permits.
|
|
●
|
Precambrian or Jurassic granitic basement complex;
|
|
●
|
Lacustrine clastic and volcanic members of the Palaeocene-Eocene Artillery Peak Formation;
|
|
●
|
Arrastra Volcanic Complex, including dacitic intrusions, andesitic flows and volcaniclastic members of Paleogene age;
|
|
●
|
Chapin Wash Formation, Anderson Mine lacustrine sediments of Miocene age;
|
|
●
|
Conglomeratic-sandstone unit, possibly equivalent to upper Chapin Wash Formation;
|
|
●
|
Miocene basalt;
|
|
●
|
Pliocene-Pleistocene conglomerate; and
|
|
●
|
Quaternary alluvium.
|
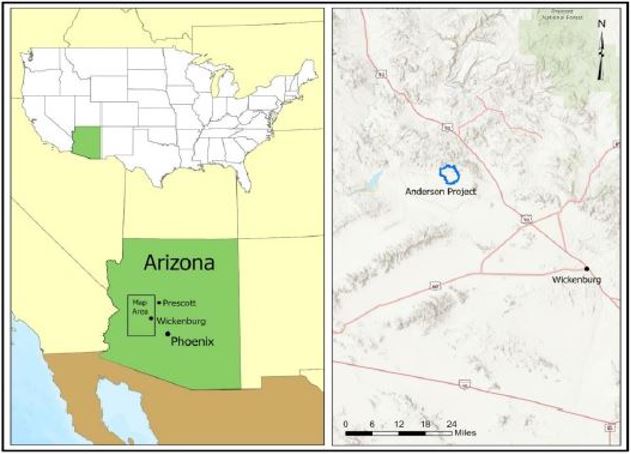
|
●
|
Crystalline Intrusive Rocks: coarse-grained to pegmatitic Precambrian granite;
|
|
●
|
Felsic to Intermediate Volcanic: flows, breccias, tuffs and minor intrusive;
|
|
●
|
Felsic to Intermediate Volcaniclastic: ash flows, tuffaceous beds and arkosic sandstone;
|
|
●
|
Andesitic Volcanic: porphyritic andesitic flows with a paleosurface and locally reddish-brown paleosols;
|
|
●
|
Lacustrine Sedimentary rocks: micaceous siltstones and mudstone, calcareous siltstones and silty limestone, thin beds of carbonaceous siltstone and lignitic material and host of uranium mineralization, averaging about 60 to 100 meters thick;
|
|
●
|
Lower Sandstone Conglomerate: arkosic sandstones and conglomerate, averaging about 60 to 100 meters thick;
|
|
●
|
Basaltic Flows and Dikes: amygdular basalt, averaging about 20 meters thick;
|
|
●
|
Upper Conglomerate: cobble and boulder conglomerate, partly indurate and locally calcite cemented, averaging about zero to 60 meters thick; and
|
|
●
|
Quaternary Alluvium: unconsolidated sand and gravel, caliche formed where calcite cemented.
|
|
Classification
|
Tons Ore (000’s)
|
Tonnes Ore
(1000’s)
|
Average Sum
Thickness (ft)
|
Average Grade
(% eU3O8)
|
Pounds eU3O8 (000’s)
|
|
Measured
|
-
|
-
|
-
|
-
|
-
|
|
Indicated – Zone A
|
862
|
782
|
3.8
|
0.111
|
1,907
|
|
Indicated – Zone B
|
7,347
|
6,665
|
9.5
|
0.108
|
15,816
|
|
Indicated – Zone C
|
6,211
|
5,634
|
10.4
|
0.094
|
11,730
|
|
Indicated – Zone D
|
760
|
689
|
3.2
|
0.093
|
1,421
|
|
Indicated – Zone E
|
911
|
826
|
7.6
|
0.060
|
1,095
|
|
Indicated – Zone F
|
84
|
76
|
4.6
|
0.051
|
86
|
|
Total M&I
|
16,175
|
14,673
|
8.2
|
0.099
|
32,055
|
|
Inferred
|
-
|
-
|
-
|
-
|
-
|
|
Total Resources
|
16,175
|
14,673
|
8.2
|
0.099
|
32,055
|
|
1.
|
The sum of resource tons and lbs. may not add up to the reported total due to rounding.
|
|
|
2.
|
Measured, indicated, and inferred mineral resources as defined in 17 CFR § 229.1300.
|
|
|
3.
|
GT Cutoff = 0.1 ft% eU3O8 and metallurgical Recovery estimated at 90%.
|
|
|
4.
|
Economic factors have been applied to the estimates in consideration of reasonable prospects for economic extraction.
|
|
|
5.
|
The point of reference for mineral resources is in-situ at the Project.
|
|
|
6.
|
Mineral resources that are not mineral reserves do not have demonstrated economic viability.
|
|
|
7.
|
A long-term uranium price of $65/lb U3O8 was considered for the purposes of determining the reasonable prospect of economic extraction.
|


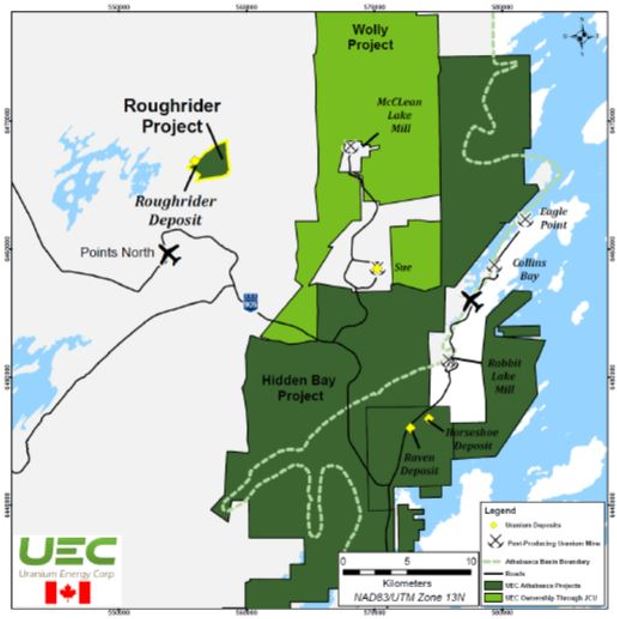
|
Mining Scenario
|
Deposit
|
Classification
|
Tons (‘000’s)
|
Tonnes
(‘000s)
|
Grade
(% U3O8) |
Pounds
U3O8 (‘000s)
|
|
Cut & Fill
|
RRW
|
Indicated
|
44
|
40
|
3.38
|
3,000
|
|
Inferred
|
12
|
11
|
3.64
|
800
|
||
|
Long Hole Open
Stope
|
RRW
|
Indicated
|
176
|
160
|
4.62
|
16,200
|
|
Inferred
|
75
|
68
|
6.06
|
9,100
|
||
|
RRE
|
Indicated
|
-
|
-
|
-
|
-
|
|
|
Inferred
|
256
|
232
|
4.41
|
22,600
|
||
|
RRFE
|
Indicated
|
208
|
189
|
2.07
|
8,600
|
|
|
Inferred
|
53
|
48
|
3.26
|
3,500
|
||
|
Combined RRW, RRE, and RRFE
|
||||||
|
Total
|
Indicated
|
429
|
389
|
3.25
|
27,800
|
|
|
Inferred
|
396
|
359
|
4.55
|
36,000
|
||
|
1.
|
Mineral Resources are not Mineral Reserves and do not have demonstrated economic viability.
|
|
|
2.
|
Mineral Resources are reported exclusive of Mineral Reserves. There are no Mineral Reserves for the Project.
|
|
|
3.
|
Mineral Resources are reported on a 100% ownership basis.
|
|
|
4.
|
Mineral Resources are reported diluted within the MSO shapes based on a U3O8 price of US$56/1b of U3O8 and metallurgical recovery of 97%. Cut and Fill (“C&F”) and long-hole open stoping (“LHOS”) scenario cut-off grades are 0.52% U3O8 and 0.45% U3O8 respectively.
|
|
|
5.
|
The Mineral Resources were estimated by SRK, a third-party QP under the definitions defined by S-K 1300.The tonnage (presented in metric tonnes), grade (%), and contained metal (metric tonnes and imperial pounds) have been rounded to reflect the accuracy of the estimates.
|

|
●
|
a basal pelitic gneiss composed of coarse, mature quarzitic to arkosic metasedimentary rocks;
|
|
●
|
a meta-pelite, commonly graphitic and interlayered with quartzitic semi-pelite and calc-silicate;
|
|
●
|
a thick meta-arkose interlayered with minor calc-silicate and pelite; and
|
|
●
|
upper amphibole-quartzite interlayered with calcareous metasedimentary rocks and graphitic pelite, known as the Hidden Bay assemblage.
|
|
Deposit
|
Classification
|
Tons (‘000s)
|
Tonnes
(‘000s)
|
Grade
(% U3O8) |
Pounds
U3O8 (‘000s)
|
|
Horseshoe
|
Indicated
|
5,493
|
4,983
|
0.215
|
23,600
|
|
Raven
|
Indicated
|
5,919
|
5,370
|
0.117
|
13,800
|
|
1.
|
Mineral resources are not mineral reserves and have not demonstrated economic viability.
|
|
|
2.
|
There is no certainty that all or any part of the mineral resource will be converted into mineral reserves.
|
|
|
3.
|
All figures are rounded to reflect the relative accuracy of the estimates.
|
|
|
4.
|
Resources were estimated using a COG of 0.05% U3O8. COG was determined using a uranium price of $75 / lb and metallurgical recovery of 95%.
|
|
|
5.
|
Mineral Resources are reported on a 100% ownership basis.
|
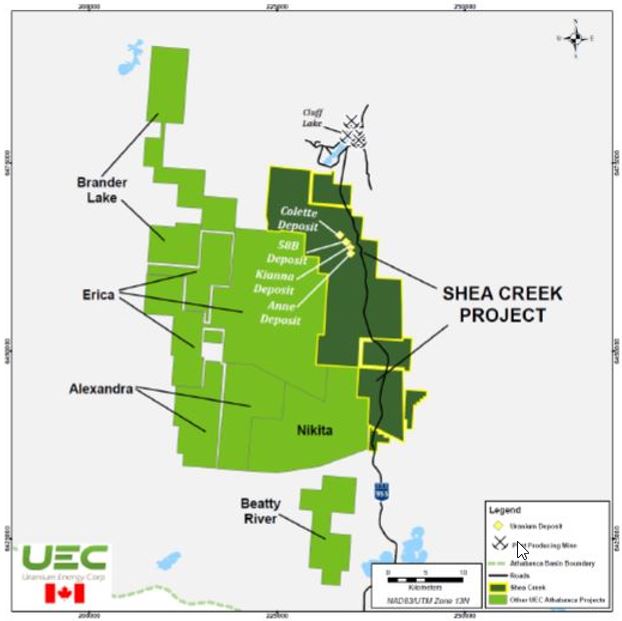
|
Deposit
|
Classification
|
Tons (000’s)
|
Tonnes
(‘000s)
|
Grade
(% U3O8) |
Pounds
U3O8 (‘000s)
|
|
Collette
|
Indicated
|
360
|
327
|
0.787
|
2,786
|
|
Inferred
|
542
|
492
|
0.717
|
3,814
|
|
|
58B
|
Indicated
|
156
|
142
|
0.773
|
1,188
|
|
Inferred
|
89
|
81
|
0.510
|
445
|
|
|
Kianna
|
Indicated
|
1,132
|
1,027
|
1.535
|
17,058
|
|
Inferred
|
603
|
547
|
1.390
|
8,235
|
|
|
Anne
|
Indicated
|
617
|
560
|
2.002
|
12,144
|
|
Inferred
|
148
|
134
|
0.883
|
1,282
|
|
|
TOTAL
|
Indicated
|
2,266
|
2,056
|
1.491
|
33,175
|
|
Inferred
|
1,382
|
1,254
|
1.015
|
13,775
|
|
1.
|
Mineral resources are not mineral reserves and have not demonstrated economic viability.
|
|
|
2.
|
There is no certainty that all or any part of the mineral resource will be converted into mineral reserves.
|
|
|
3.
|
Figures are rounded to reflect the relative accuracy of the estimates.
|
|
|
4.
|
Resources were estimated using a cut-off grade of 0.30% U3O8, a $50 uranium price, and a metallurgical recovery of 95% was used.
|
|
|
5.
|
UEC's share of mineral resources is calculated based on UEC's 49.0975% equity in the project.
|

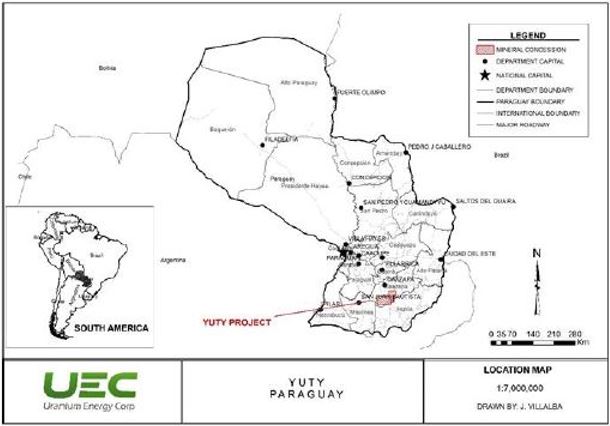
|
●
|
Cabacua Formation: 200 meters thick;
|
|
●
|
Tapyata Formation: 125 meters thick;
|
|
●
|
Tacuary Formation: 280 meters thick; and
|
|
●
|
San Miguel Formation: 20 to 90 meters thick.
|
|
●
|
Upper Sand Unit: Estimated to be approximately 50 meters thick;
|
|
●
|
Alternating Sandstone and Shale Unit: Estimated to be approximately 150 meters thick;
|
|
●
|
Massive Sand Unit: Estimated to be 60 to 100 meters thick;
|
|
●
|
Fine-grained Sand Unit: Estimated to be up to 15 meters thick; and
|
|
●
|
Wavy Unit: Estimated to be up to 20 meters thick.
|
|
Category
|
Tons Ore
(000’s)
|
Tonnes Ore
(1000’s)
|
Weighted
Average
Grade
(% eU3O8)
|
Pounds
eU3O8 (000’s)
|
|
Measured
|
-
|
-
|
-
|
-
|
|
Indicated – Massive Sand Unit
|
7,233
|
6,562
|
0.048
|
6,969
|
|
Indicated – Fine-Grained and Wavy Sand Units
|
1,842
|
1,671
|
0.054
|
1,994
|
|
Total M&I
|
9,074
|
8,232
|
0.049
|
8,962
|
|
Inferred – Massive Sand Unit
|
1690
|
1533
|
0.045
|
1,528
|
|
Inferred – Fine Grained and Wavy Sand Units
|
1043
|
946
|
0.032
|
675
|
|
Total Resources
|
2,733
|
2,479
|
0.040
|
2,203
|
|
1.
|
The sum of resource tons and lbs. may not add up to the reported total due to rounding.
|
|
|
2.
|
Measured, indicated, and inferred mineral resources as defined in 17 CFR § 229.1300.
|
|
|
3.
|
Resources estimated using a 0.02% eU3O8 grade cutoff and a 0.1 ft% GT cutoff.
|
|
|
4.
|
Mineral Resources are estimated using a long-term uranium price of $65 per pound and a metallurgical recovery of 70%.
|
|
|
5.
|
The point of reference for mineral resources is in-situ at the Project.
|
|
|
6.
|
Mineral resources that are not mineral reserves do not have demonstrated economic viability.
|
|
Exhibit
Number
|
Description of Exhibit
|
|
2.1
|
|
|
2.2
|
|
|
2.3
|
|
|
2.4
|
|
|
2.5
|
|
|
2.6
|
|
|
3.1
|
|
|
3.1.1
|
|
|
3.2
|
|
|
4.1
|
|
|
4.2
|
|
|
4.3
|
|
|
4.4
|
|
|
4.5
|
|
|
4.6
|
|
|
4.7
|
|
|
10.1
|
|
|
10.2
|
|
|
10.3
|
|
|
10.4
|
|
|
10.5
|
|
|
10.6
|
|
|
10.7
|
|
|
10.8
|
|
|
10.9
|
|
|
10.10
|
|
|
10.11
|
|
|
10.12
|
|
|
10.13
|
|
|
10.14
|
|
|
10.15
|
|
|
10.16
|
|
|
10.17
|
|
|
10.18
|
|
|
10.19
|
|
|
10.20
|
|
|
10.21
|
|
|
10.22
|
|
|
10.23
|
|
|
10.24
|
|
10.25
|
|
|
10.26
|
|
|
10.27
|
|
|
10.28
|
|
|
10.29
|
|
|
10.30
|
|
|
10.31
|
|
|
10.32
|
|
|
10.33
|
|
|
10.34
|
|
|
10.35
|
|
|
10.36
|
|
|
10.37
|
|
|
10.38
|
|
|
10.39
|
|
|
10.40
|
|
|
10.41
|
|
|
10.42
|
|
|
10.43
|
|
|
10.44
|
|
|
10.45
|
|
|
10.46
|
|
|
10.47
|
|
|
10.48
|
|
|
10.49
|
|
|
10.50
|
|
|
10.51
|
|
|
10.52
|
|
|
10.53
|
|
|
10.54
|
|
|
10.55
|
|
|
10.56
|
|
|
10.57
|
|
|
10.58
|
|
|
10.59
|
|
|
10.60
|
|
|
10.61
|
|
|
10.62
|
|
|
10.63
|
|
|
10.64
|
|
|
10.65
|
|
|
10.66
|
|
10.67
|
|
|
10.68
|
|
|
10.69
|
|
|
10.70
|
|
|
10.71
|
|
|
10.72
|
|
|
10.73
|
|
|
10.74
|
|
|
10.75
|
|
|
10.76
|
|
|
10.77
|
|
|
10.78
|
|
|
10.79
|
|
|
10.80
|
|
|
10.81
|
|
|
10.82
|
|
|
10.83
|
|
|
10.84
|
|
|
10.85
|
|
|
10.86
|
|
|
10.87
|
|
|
10.88
|
|
|
10.89
|
|
|
21.1
|
|
|
23.1
|
|
|
23.2
|
|
|
23.3
|
|
|
23.4
|
|
|
23.5
|
|
|
23.6
|
|
|
23.7
|
|
|
23.8
|
|
|
23.9
|
|
|
23.10
|
|
|
23.11
|
|
|
23.12
|
|
|
23.13
|
|
|
23.14
|
|
|
31.1
|
|
|
31.2
|
|
32.1
|
|
|
96.1
|
|
|
96.2
|
|
|
96.3
|
|
|
96.4
|
|
|
96.5
|
|
|
96.6
|
|
|
96.7
|
|
|
96.8
|
|
|
96.9
|
|
|
96.10
|
|
|
99.1
|
|
|
99.2
|
|
|
99.3
|
|
|
101.1NS
|
Inline XBRL Instance Document
|
|
101.SCH
|
Inline XBRL Taxonomy Extension Schema Document
|
|
101.CAL
|
Inline XBRL Taxonomy Extension Calculation Linkbase Document
|
|
101.DEF
|
Inline XBRL Taxonomy Extension Definitions Linkbase Document
|
|
101.LAB
|
Inline XBRL Taxonomy Extension Label Linkbase Document
|
|
101.PRE
|
Inline XBRL Taxonomy Extension Presentation Linkbase Document
|
|
104
|
Cover Page Interactive Data File (formatted as Inline XBRL and contained in Exhibit 101)
|
|
*
|
Filed herewith.
|
|
†
|
Previously filed as an exhibit to our Annual Report on Form 10-K filed with the SEC on September 29, 2022.
|
|
‡
|
Portions of this exhibit have been omitted.
|
|
(1)
|
Incorporated by reference to our Registration Statement on Form SB-2 filed with the SEC on August 4, 2005.
|
|
(2)
|
Incorporated by reference to our Current Report on Form 8-K filed with the SEC on February 9, 2006.
|
|
(3)
|
Incorporated by reference to our Current Report on Form 8-K filed with the SEC on May 4, 2007.
|
|
(4)
|
Incorporated by reference to our Current Report on Form 8-K filed with the SEC on October 9, 2007.
|
|
(5)
|
Incorporated by reference to our Current Report on Form 8-K filed with the SEC on November 6, 2007.
|
|
(6)
|
Incorporated by reference to our Current Report on Form 8-K filed with the SEC on January 16, 2009.
|
|
(7)
|
Incorporated by reference to our Current Report on Form 8-K filed with the SEC on June 2, 2009.
|
|
(8)
|
Incorporated by reference to our Current Report on Form 8-K filed with the SEC on June 9, 2009.
|
|
(9)
|
Incorporated by reference to our Current Report on Form 8-K filed with the SEC on July 27, 2009.
|
|
(10)
|
Incorporated by reference to our Registration Statement on Form S-8 filed with the SEC on October 1, 2009.
|
|
(11)
|
Incorporated by reference to our Annual Report on Form 10-K/A filed with the SEC on April 21, 2010.
|
|
(12)
|
Incorporated by reference to our Current Report on Form 8-K filed with the SEC on February 23, 2010.
|
|
(13)
|
Incorporated by reference to our Registration Statement on Form S-8 filed with the SEC on February 7, 2011.
|
|
(14)
|
Incorporated by reference to our Current Report on Form 8-K filed with the SEC on January 10, 2011.
|
|
(15)
|
Incorporated by reference to our Current Report on Form 8-K filed with the SEC on May 11, 2011.
|
|
(16)
|
Incorporated by reference to our Current Report on Form 8-K filed with the SEC on May 17, 2011.
|
|
(17)
|
Incorporated by reference to our Current Report on Form 8-K filed with the SEC on July 11, 2011.
|
|
(18)
|
Incorporated by reference to our Current Report on Form 8-K filed with the SEC on October 31, 2011.
|
|
(19)
|
Incorporated by reference to our Current Report on Form 8-K filed with the SEC on November 8, 2011.
|
|
(20)
|
Incorporated by reference to our Current Report on Form 8-K filed with the SEC on March 5, 2012.
|
|
(21)
|
Incorporated by reference to our Current Report on Form 8-K filed with the SEC on August 5, 2013.
|
|
(22)
|
Incorporated by reference to our Current Report on Form 8-K filed with the SEC on October 2, 2013.
|
|
(23)
|
Incorporated by reference to our Current Report on Form 8-K filed with the SEC on October 23, 2013.
|
|
(24)
|
Incorporated by reference to our Registration Statement on Form S-3 filed with the SEC on November 19, 2013.
|
|
(25)
|
Incorporated by reference to our Registration Statement on Form S-8 filed with the SEC on November 21, 2013.
|
|
(26)
|
Incorporated by reference to our Current Report on Form 8-K/A filed with the SEC on December 6, 2013.
|
|
(27)
|
Incorporated by reference to our Registration Statement on Form S-3 filed with the SEC on December 27, 2013.
|
|
(28)
|
Incorporated by reference to our Current Report on Form 8-K filed with the SEC on December 31, 2013.
|
|
(29)
|
Incorporated by reference to our Current Report on Form 8-K filed with the SEC on March 19, 2014.
|
|
(30)
|
Incorporated by reference to our Annual Report on Form 10-K filed with the SEC on October 14, 2014.
|
|
(31)
|
Incorporated by reference to our Registration Statement on Form S-8 filed with the SEC on January 9, 2015.
|
|
(32)
|
Incorporated by reference to our Quarterly Report on Form 10-Q filed with the SEC on March 12, 2015.
|
|
(33)
|
Incorporated by reference to our Schedule 14A Definitive Proxy Statement filed with the SEC on June 19, 2015.
|
|
(34)
|
Incorporated by reference to our Current Report on Form 8-K filed with the SEC on June 25, 2015.
|
|
(35)
|
Incorporated by reference to our Quarterly Report on Form 10-Q filed with the SEC on December 8, 2015.
|
|
(36)
|
Incorporated by reference to our Current Report on Form 8-K filed with the SEC on February 16, 2016
|
|
(37)
|
Incorporated by reference to our Current Report on Form 8-K filed with the SEC on March 10, 2016.
|
|
(38)
|
Incorporated by reference to our Current Report on Form 8-K filed with the SEC on March 10, 2016.
|
|
(39)
|
Incorporated by reference to our Registration Statement on Form S-8 filed with the SEC on September 2, 2016.
|
|
(40)
|
Incorporated by reference to our Registration Statement on Form S-3 filed with the SEC on January 5, 2017.
|
|
(41)
|
Incorporated by reference to our Current Report on Form 8-K filed with the SEC on January 17, 2017.
|
|
(42)
|
Incorporated by reference to our Current Report on Form 8-K filed with the SEC on March 9, 2017.
|
|
(43)
|
Incorporated by reference to our Quarterly Report on Form 10-Q filed with the SEC on June 9, 2017.
|
|
(44)
|
Incorporated by reference to our Current Report on Form 8-K filed with the SEC on August 11, 2017.
|
|
(45)
|
Incorporated by reference to our Registration Statement on Form S-3 filed with the SEC on September 8, 2017.
|
|
(46)
|
Incorporated by reference to our Annual Report on Form 10-K filed with the SEC on October 16, 2017.
|
|
(47)
|
Incorporated by reference to our Current Report on Form 8-K filed with the SEC on November 6, 2017.
|
|
(48)
|
Incorporated by reference to our Annual Report on Form 10-K filed with the SEC on October 15, 2018.
|
|
(49)
|
Incorporated by reference to our Registration Statement on Form S-8 filed with the SEC on August 27, 2018.
|
|
(50)
|
Incorporated by reference to our Current Report on Form 8-K filed with the SEC on October 1, 2018.
|
|
(51)
|
Incorporated by reference to our Current Report on Form 8-K filed with the SEC on December 7, 2018.
|
|
(52)
|
Incorporated by reference to our Current Report on Form 8-K filed with the SEC on March 18, 2019.
|
|
(53)
|
Incorporated by reference to our Current Report on Form 8-K filed with the SEC on April 9, 2019.
|
|
(54)
|
Incorporated by reference to our Registration Statement on Form S-8 filed with the SEC on September 12, 2019.
|
|
(55)
|
Incorporated by reference to our Current Report on Form 8-K filed with the SEC on March 19, 2020.
|
|
(56)
|
Incorporated by reference to our Current Report on Form 8-K filed with the SEC on September 21, 2020.
|
|
(57)
|
Incorporated by reference to our Current Report on Form 8-K filed with the SEC on March 19, 2021.
|
|
(58)
|
Incorporated by reference to our Current Report on Form 8-K filed with the SEC on April 8, 2021.
|
|
(59)
|
Incorporated by reference to our Registration Statement on Form S-3 filed with the SEC on May 17, 2021.
|
|
(60)
|
Incorporated by reference to our Current Report on Form 8-K filed with the SEC on November 9, 2021.
|
|
(61)
|
Incorporated by reference to our Current Report on Form 8-K filed with the SEC on February 8, 2022.
|
|
(62)
|
Incorporated by reference to our Current Report on Form 8-K filed with the SEC on April 5, 2022.
|
|
(63)
|
Incorporated by reference to our Current Report on Form 8-K filed with the SEC on June 13, 2022.
|
|
(64)
|
Incorporated by reference to our Current Report on Form 8-K filed with the SEC on June 17, 2022.
|
|
(65)
|
Incorporated by reference to our Current Report on Form 8-K filed with the SEC on August 17, 2022.
|
|
(66)
|
Incorporated by reference to our Current Report on Form 8-K filed with the SEC on August 11, 2022.
|
|
(67)
|
Incorporated by reference to our Current Report on Form 8-K filed with the SEC on August 15, 2022.
|
|
(68)
|
Incorporated by reference to our Current Report on Form 8-K filed with the SEC on October 13, 2022.
|
|
(69)
|
Incorporated by reference to our Current Report on Form 8-K filed with the SEC on January 11, 2023.
|
|
(70)
|
Incorporated by reference to our Current Report on Form 8-K filed with the SEC on January 23, 2023.
|
|
(71)
|
Incorporated by reference to our Current Report on Form 8-K filed with the SEC on March 13, 2023.
|
|
(72)
|
Incorporated by reference to our Current Report on Form 8-K filed with the SEC on March 14, 2023.
|
|
(73)
|
Incorporated by reference to our Amendment to our Annual Report on Form 10-K/A filed with the SEC on April 3, 2023.
|
|
(74)
|
Incorporated by reference to our Current Report on Form 8-K filed with the SEC on May 1, 2023.
|
|
(75)
|
Incorporated by reference to our Current Report on Form 8-K filed with the SEC on May 11, 2023.
|
|
(76)
|
Previously filed as an exhibit to our Annual Report on Form 10-K filed with the SEC on September 29, 2023.
|
|
URANIUM ENERGY CORP.
|
|||
|
By:
|
/s/ Amir Adnani
|
||
|
Amir Adnani, President, Chief Executive
Officer and Director
|
|||
|
(Principal Executive Officer)
|
|||
|
Date: April 2, 2024.
|
|||