SECURITIES AND EXCHANGE COMMISSION
Washington, D.C. 20549
FORM 6-K
REPORT OF FOREIGN PRIVATE ISSUER
Pursuant to Rule 13a-16 or 15d-16 of the
Securities Exchange Act of 1934
For the month of May 2023
Commission file number: 001-32749
FRESENIUS MEDICAL CARE AG & Co. KGaA
(Translation of registrant's name into English)
Else-Kröner Strasse 1
61346 Bad Homburg
Germany
(Address of principal executive offices)
Indicate by check mark whether the registrant files or will file annual reports under cover of Form 20-F or Form 40-F.
Form 20-F x Form 40-F ¨
On May 9, 2023, Fresenius Medical Care AG & Co. KGaA (the “Company”) issued a Press Release announcing its first quarter results for the period ending March 31, 2023. A copy of the Press Release is furnished as Exhibit 99.1 and the corresponding financial figures as Exhibit 99.2.
The attached Press Release contains non-GAAP financial measures. For purposes of Regulation G, a non-GAAP financial measure is a numerical measure of a company’s performance, financial position, or cash flows that either excludes or includes amounts that are not normally excluded or included in the most directly comparable measure calculated and presented in accordance with generally accepted accounting principles. To supplement the Company’s first quarter 2023 consolidated financial results presented in accordance with International Financial Reporting Standards, or IFRS, we have used non-GAAP financial measures, including (a) EBITDA, or operating income excluding interest, taxes, depreciation and amortization, (b) free cash flow, (c) net leverage ratio (ratio of net debt to adjusted EBITDA) and (d) results presented in constant currency and as adjusted for special items identified in the Press Release and associated tables. These non-GAAP measures are provided to enhance the user’s overall understanding of our current financial performance and our prospects for the future. In addition, because we have historically reported certain non-GAAP financial measures in our financial results, we believe the inclusion of these non-IFRS financial measures provides consistency and comparability in our financial reporting to prior periods for which these non-GAAP financial measures were previously reported. These non-GAAP financial measures should not be used as a substitute for or be considered superior to GAAP financial measures. Reconciliation of the non-GAAP financial measures to the most comparable IFRS financial measures are included in the attached Financial Statements. As the reconciliation of amounts stated in Constant Currency is inherent in the disclosure included in the Press Release, we believe that a separate reconciliation would not provide any additional benefit.
The Exhibits attached hereto, shall not be deemed “filed” for purposes of Section 18 of the Securities and Exchange Act of 1934 (the “Exchange Act”) or otherwise subject to the liabilities of that section, nor shall they be deemed incorporated by reference in any filing under the Securities Act of 1933 or the Exchange Act, regardless of any general incorporation language in such filing.
EXHIBITS
The following exhibits are being furnished with this Report:
Exhibit 99.1 | Press release issued on May 9, 2023. | |
Exhibit 99.2 | Complete overview of the first quarter 2023. |
SIGNATURES
Pursuant to the requirements of the Securities Exchange Act of 1934, the Registrant has duly caused this report to be signed on its behalf by the undersigned thereunto duly authorized.
DATE: May 9, 2023
Fresenius Medical Care AG & Co. KGaA, | ||
a partnership limited by shares, represented by: | ||
fresenius medical care management ag, its | ||
General Partner | ||
By: | /s/ Helen Giza | |
Name: | Helen Giza | |
Title: | Chief Executive Officer, Chair of the Management Board of the General Partner and Acting Chief Financial Officer |
By: | /s/ Dr. Katarzyna Mazur-Hofsäß | |
Name: | Dr. Katarzyna Mazur-Hofsäß | |
Title: | CEO Care Enablement and member of the Management Board of the General Partner |
Exhibit 99.1
Press Release
|
Media contact |
Leif Heussen | |
T +49 6172 608-4030 | |
leif.heussen@fresenius.com | |
Contact for analysts | |
and investors | |
Dr. Dominik Heger | |
T +49 6172 609-2601 | |
dominik.heger@fmc-ag.com | |
www.freseniusmedicalcare.com |
Under the U.S. Securities Act of 1933, as amended (the “Securities Act”), this press release may be deemed to be offering material of Fresenius Medical Care AG & Co. KGaA (“FME”). FME has filed a registration statement on Form F-4 under the Securities Act with the U.S. Securities and Exchange Commission (the “SEC”), including an information statement/prospectus constituting a part thereof. FME SHAREHOLDERS ARE URGED TO READ THE REGISTRATION STATEMENT AND ANY OTHER RELEVANT DOCUMENTS FILED OR THAT WILL BE FILED WITH THE SEC, INCLUDING THE INFORMATION STATEMENT/PROSPECTUS THAT IS PART OF THE REGISTRATION STATEMENT, AS THEY BECOME AVAILABLE, BECAUSE THEY CONTAIN OR WILL CONTAIN IMPORTANT INFORMATION ABOUT THE PROPOSED CONVERSION DESCRIBED THEREIN. The final information statement/prospectus will be distributed to FME shareholders. Shareholders may obtain a free copy of the disclosure documents (when they are available) and other documents filed by FME with the SEC at the SEC’s website at www.sec.gov or from Fresenius Medical Care AG & Co. KGaA, Attention: Investor Relations, Else-Kröner-Straße 1, 61352 Bad Homburg v.d.H., Germany.
Page 1/9
May 9, 2023
Fresenius Medical Care sees improving trends in the first quarter and is progressing on its transformation
- | Both segments contributed to organic growth with improving volume trends in Care Delivery and strong critical care business in Care Enablement |
- | More moderate decline in operating income due to phasing, continued improvement in organic growth in line with expectations, easing labor shortage in the U.S., and progressing FME25 transformation |
- | First measures of legacy portfolio optimization delivered |
- | Financial outlook for FY 2023 confirmed |
Helen Giza, Chief Executive Officer of Fresenius Medical Care, said: “While the results for the first quarter slightly exceeded our albeit low expectations formulated at the beginning of the year, we still expect 2023 to be a year of level-setting for Fresenius Medical Care. However, the operational improvements already achieved, show that our newly implemented operating model and the turnaround plan provide the right framework. The first quarter confirmed the trends towards improving treatment volumes and towards a stabilizing labor environment in the U.S. Both are key for an increasing operating leverage as well as for ensuring the high-quality standard for our patients. Based on these positive developments, we confirm our financial outlook for 2023.”
Page 2/9
Key figures (IFRS, unaudited)
Q1 2023 EUR m | Q1 2022 EUR m | Growth yoy | Growth yoy, cc | |||||||||||||
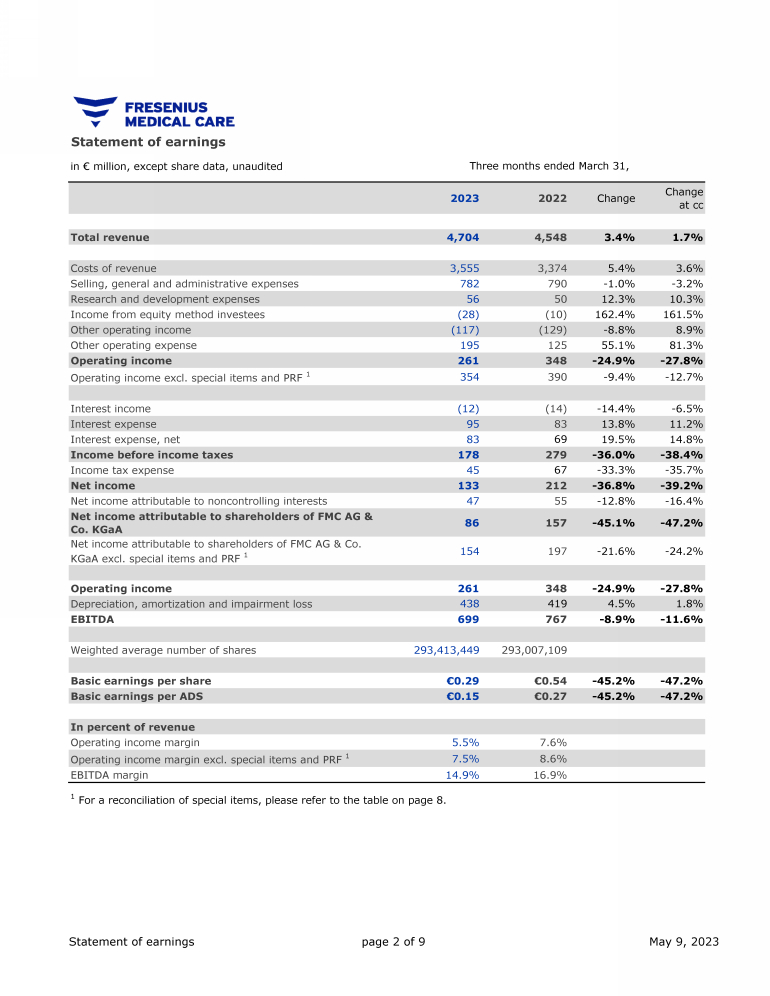
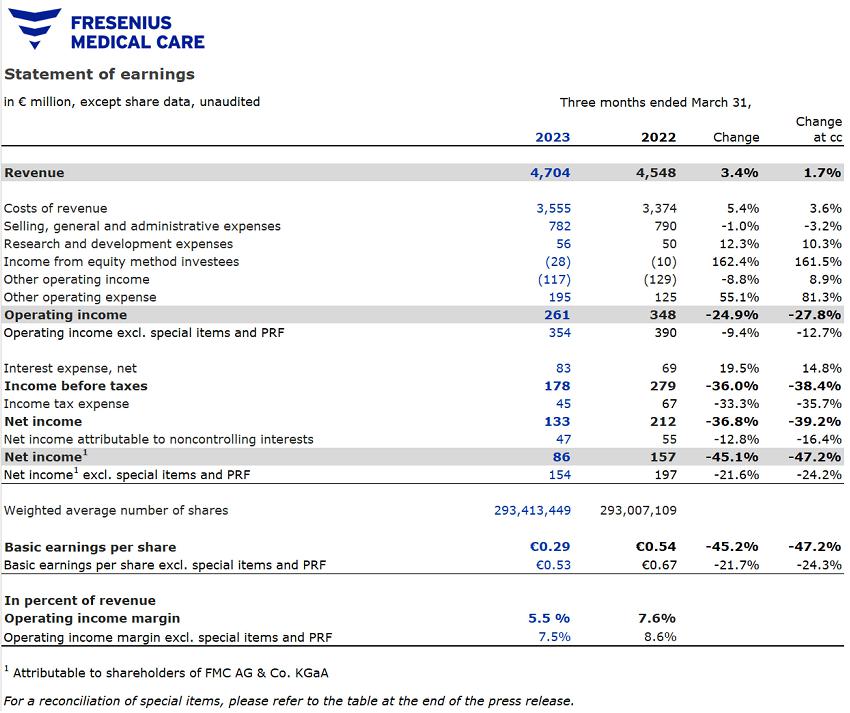
Revenue | 4,704 | 4,548 | +3 | % | +2 | % | ||||||||||
Operating income excl. special items and PRF1 | 261 354 | 348 390 | -25 -9 | % % | -28 -13 | % % | ||||||||||
Net income2 excl. special items and PRF1 | 86 154 | 157 197 | -45 -22 | % % | -47 -24 | % % | ||||||||||
Basic EPS (EUR) excl. special items and PRF1 | 0.29 0.53 | 0.54 0.67 | -45 -22 | % % | -47 -24 | % % |
yoy = year-on-year, cc = at constant currency, EPS = earnings per share
Operating income decline moderated by positive underlying trends
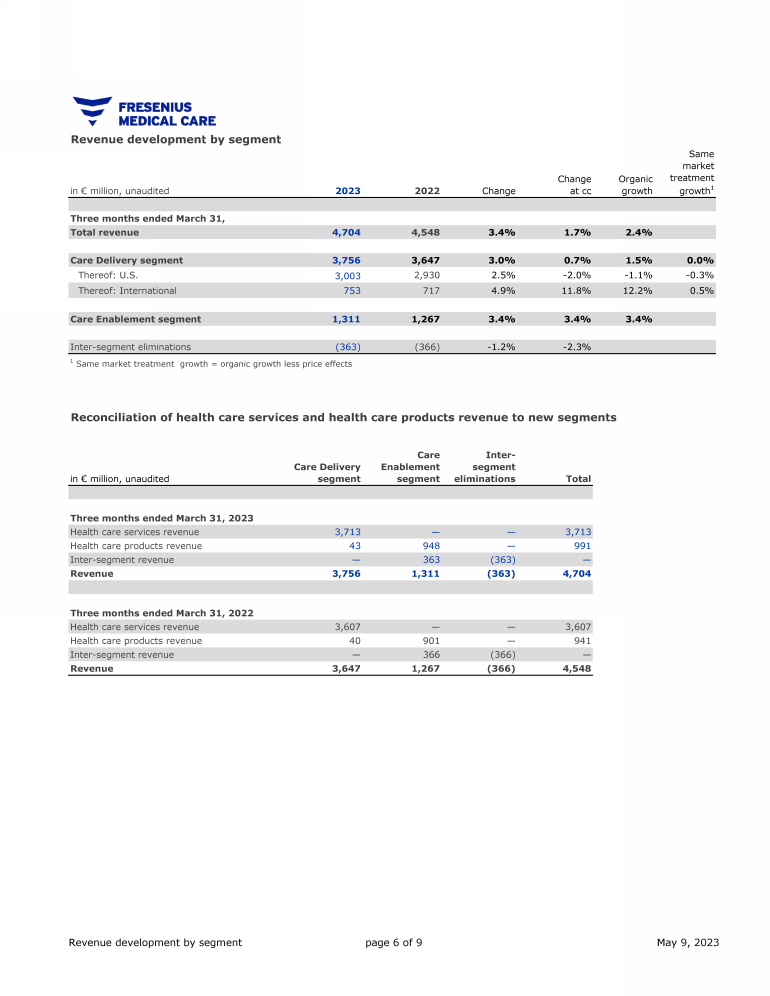
Revenue increased by 3% to EUR 4,704 million (+2% at constant currency, +2% organic).
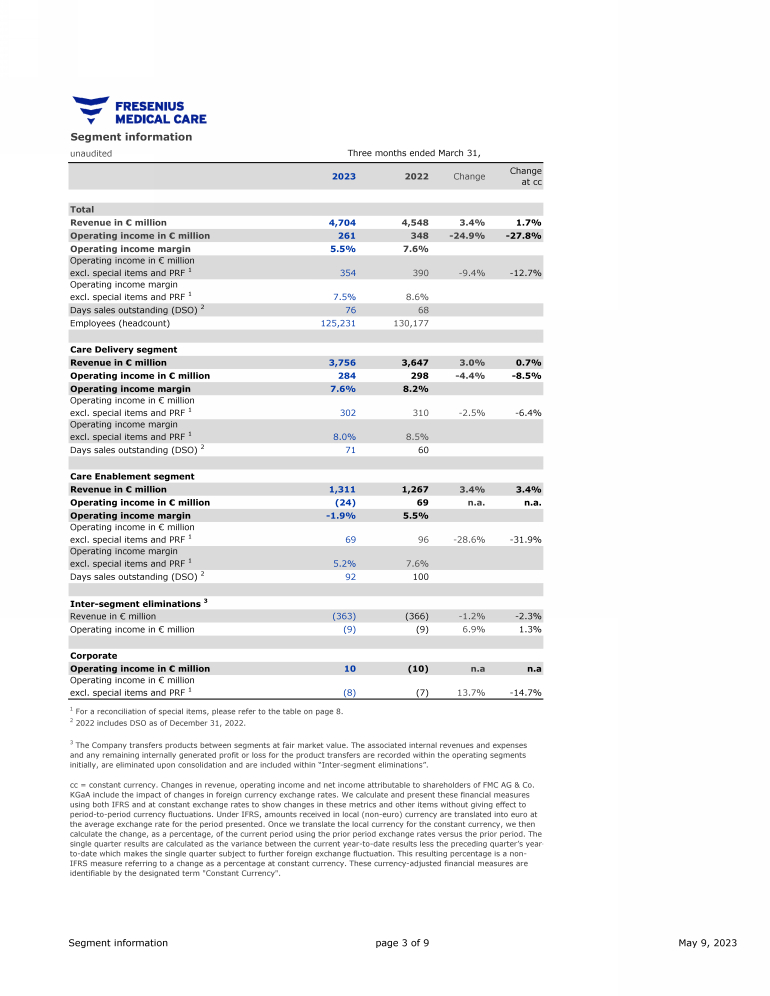
Care Delivery revenue increased by 3% to EUR 3,756 million (+1% at constant currency, +2% organic).
In Care Delivery U.S., growth of 2% (-2% at constant currency, -1% organic) was mainly driven by a positive exchange rate effect. At constant currency, the decrease in revenue was mainly due to a decline in organic growth and the prior-year partial reversal of an accrual related to a revenue recognition adjustment for accounts receivable in legal dispute. Despite reimbursement rate increases in 2023, organic growth in the U.S. was negatively affected by the impact of the reconciliation of revenues recorded in 2022 for the final performance year of our ESRD Seamless Care Organizations (ESCOs). While the annualization effect of COVID-19-related excess mortality continues to weigh on growth, the improvement trend has continued with only slightly negative same market treatment growth (–0.3%).
In Care Delivery International, revenue grew dynamically at 5% (+12% at constant currency, +12% organic). At constant currency, this was mainly driven by strong organic growth, which was mostly due to the effects of hyperinflation in various markets, including Latin America, as well as contributions from acquisitions. Despite the annualization effect of COVID-19-related excess mortality, same market treatment growth was positive at 0.5%.
1 For FY 2022, special items included costs related to the FME25 program, the impact of the war in Ukraine, the impact of hyperinflation in Turkiye, the Humacyte investment remeasurement and the net gain related to InterWell Health. Additionally, the FY 2022 basis for the 2023 outlook was adjusted for U.S. Provider Relief Funding. For FY 2023, special items include costs related to the FME25 program, the Humacyte investment remeasurement, the costs associated with the legal form conversion and effects from legacy portfolio optimization. For further details please see the reconciliation attached to the Press Release.
2 Net income attributable to shareholders of Fresenius Medical Care AG & Co. KGaA
Page 3/9
Care Enablement revenue increased by 3% to EUR 1,311 million (+3% at constant currency, +3% organic). At constant currency, growth was mainly driven by higher sales of critical care products in China and home hemodialysis products. The revenue development was additionally supported by increased average sales prices for products sold.
Within Inter-segment eliminations, revenue for products transferred between the operating segments at fair market value decreased by 1% to EUR 363 million (-2% at constant currency; Q1 2022: EUR 366 million).3
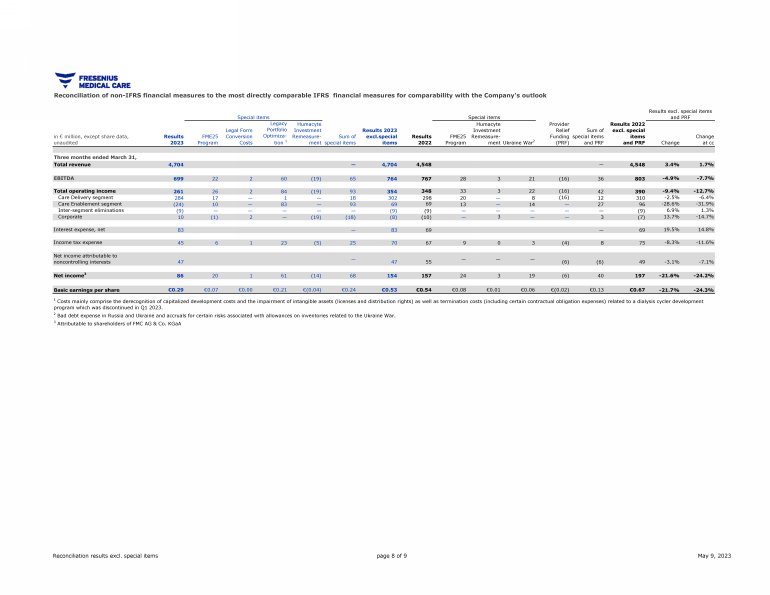
Operating income decreased by 25% to EUR 261 million (-28% at constant currency), resulting in a margin of 5.5% (Q1 2022: 7.6%). Operating income excluding special items and U.S. Provider Relief Funding (PRF)1 declined by 9% to EUR 354 million (-13% at constant currency), resulting in a margin of 7.5% (Q1 2022: 8.6%).
Operating income in Care Delivery decreased by 4% to EUR 284 million (-9% at constant currency), resulting in a margin of 7.6% (Q1 2022: 8.2%). Operating income excluding special items and PRF1 decreased by 2% to EUR 302 million (-6% at constant currency). At constant currency, excluding special items and PRF1, this was mainly due to the absence of effects that had contributed positively in the previous year, i.e. the partial reversal of an accrual related to a revenue recognition adjustment for accounts receivable in legal dispute, the reconciliation of revenues recorded in 2022 for the final performance year of our ESCOs, and the suspension of sequestration in the U.S. Savings from the FME25 Program, favorable business growth and lower personnel expense had a positive impact.
Operating income in the Care Enablement segment decreased to EUR -24 million (Q1 2022: EUR 69 million), resulting in a margin of -1.9% (Q1 2022: 5.5%). Operating income excluding special items and PRF1 decreased by 29% to EUR 69 million (-32% at constant currency). At constant currency, excluding special items and PRF1 this was mainly due to inflationary cost increases for energy, material and personnel. Higher volumes in critical care, in particular in China, overall price improvements and savings from the FME25 Program contributed positively. With EUR 83 million, the costs related to the discontinuation of a development program for a dialysis cycler was the most sizable special item that has been adjusted for in the first quarter. This is part of the announced legacy portfolio optimization.
3 The Company transfers products between segments at fair market value. The associated internal revenues and expenses and any remaining internally generated profit or loss for the product transfers are recorded within the operating segments initially, are eliminated upon consolidation and are included within “Inter-segment eliminations”.
Page 4/9
Operating income for Corporate was positive with EUR 10 million (Q1 2022: EUR -10 million), mainly due to the remeasurement of the investment in Humacyte. Excluding special items, operating income amounted to EUR -8 million (Q1 2022: EUR -7 million).
Net income2 decreased by 45% to EUR 86 million (-47% at constant currency). Excluding special items and PRF1, net income declined by 22% to EUR 154 million (-24% at constant currency). In addition to the effects on operating income mentioned above, negative impacts resulted from higher net interest expense, which was mainly driven by refinancing activities, as well as an increase in the proportionate share of non-tax-deductible expenses compared to taxable income.
Basic earnings per share (EPS) decreased by 45% to EUR 0.29 (-47% at constant currency). EPS excluding special items and PRF1 declined by 22% to EUR 0.53 (-24% at constant currency).
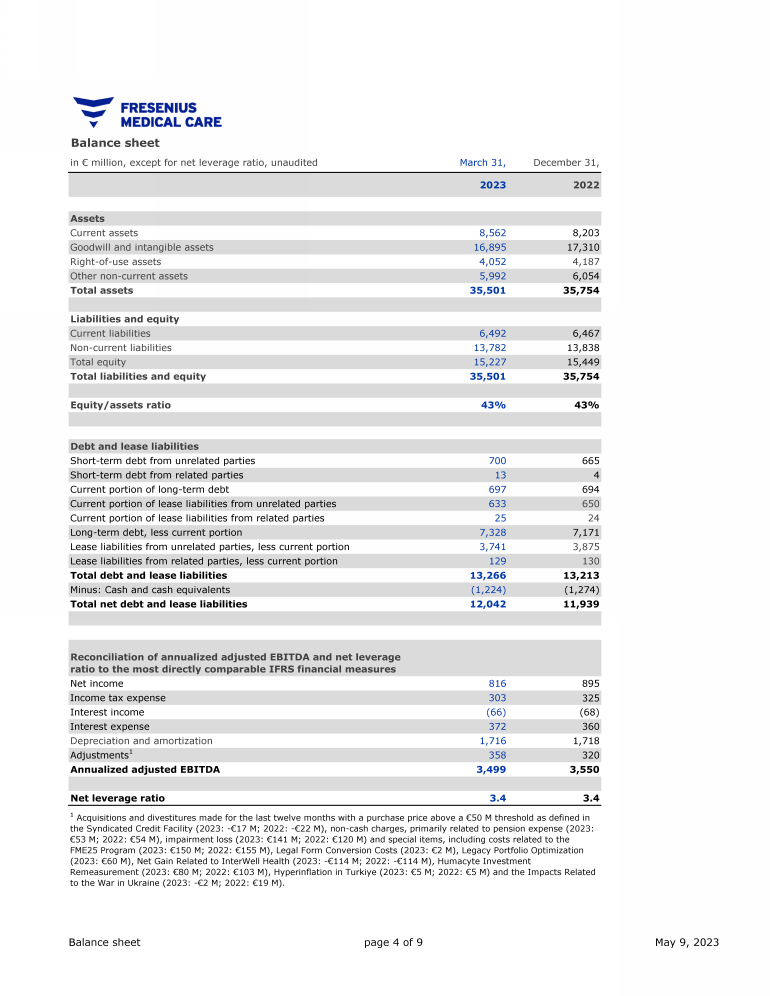
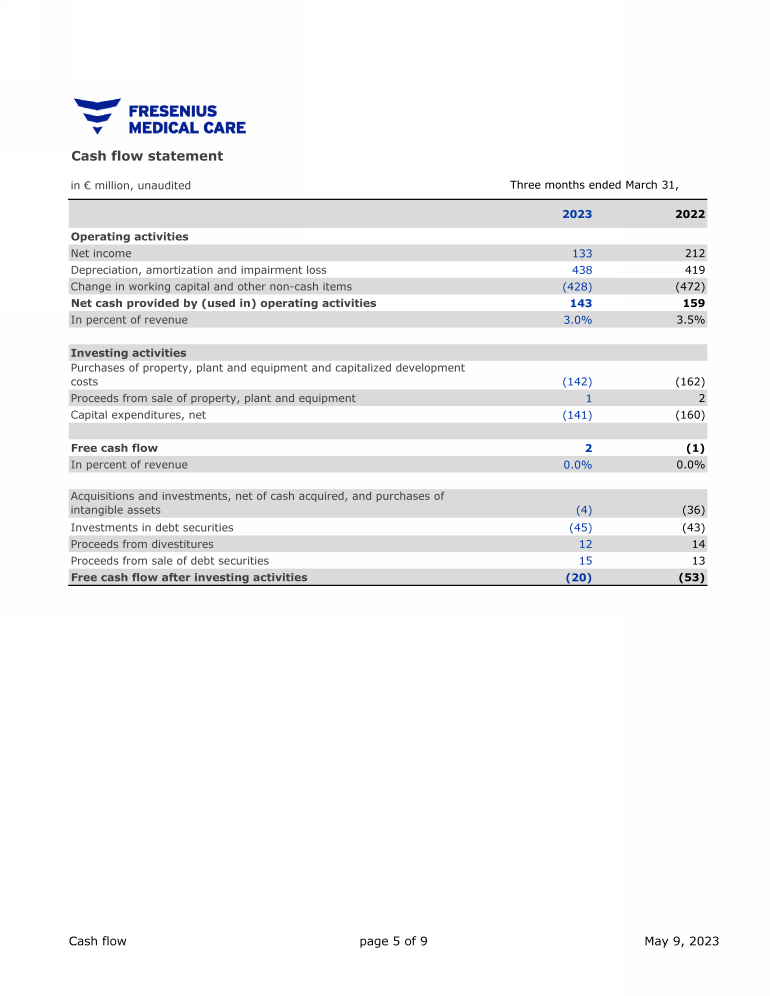
Cash flow development
In the first quarter, Fresenius Medical Care generated EUR 143 million of operating cash flow (Q1 2022: EUR 159 million), resulting in a margin of 3.0% (Q1 2022: 3.5%). The reduction was mainly due to the decrease in net income.
Free cash flow4 amounted to EUR 2 million (Q1 2022: EUR -1 million) in the first quarter, resulting in a margin of 0.0% (Q1 2022: 0.0%).
Outlook
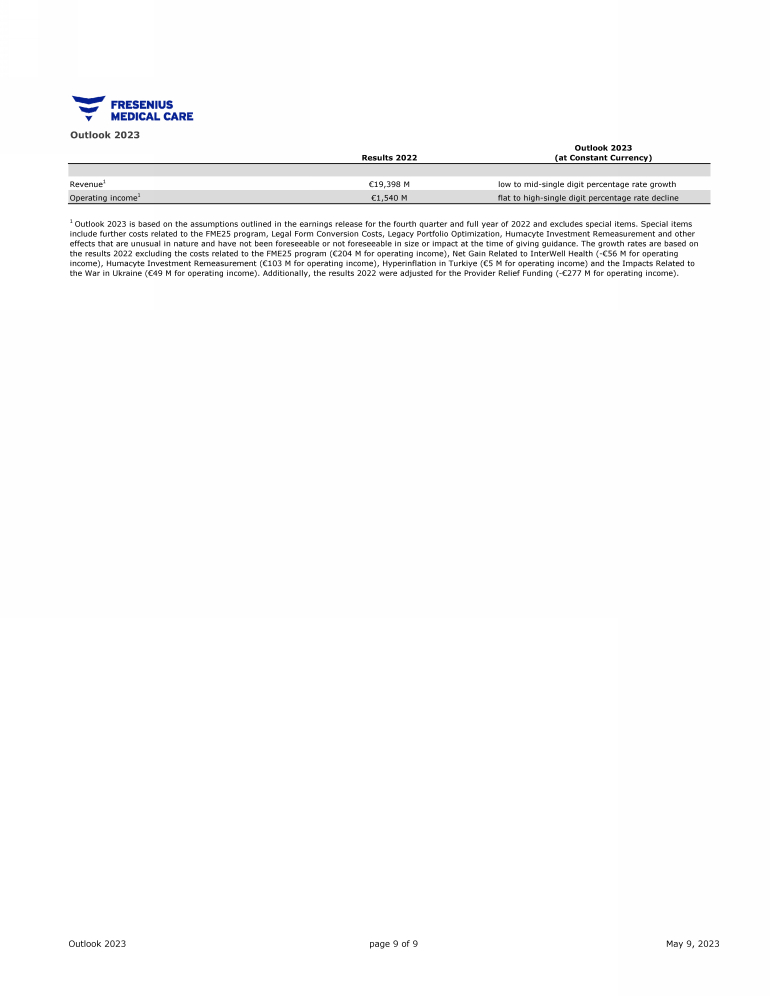
Based on the results for the first quarter, Fresenius Medical Care confirms its financial targets for 2023.
4 Net cash provided by / used in operating activities, after capital expenditures, before acquisitions, investments, and dividends
Page 5/9
Fresenius Medical Care expects for 2023 revenue to grow at a low to mid-single digit percentage rate (2022 basis: EUR 19,398 million) and operating income to remain flat or decline by up to a high-single digit percentage rate (2022 basis: EUR 1,540 million).5
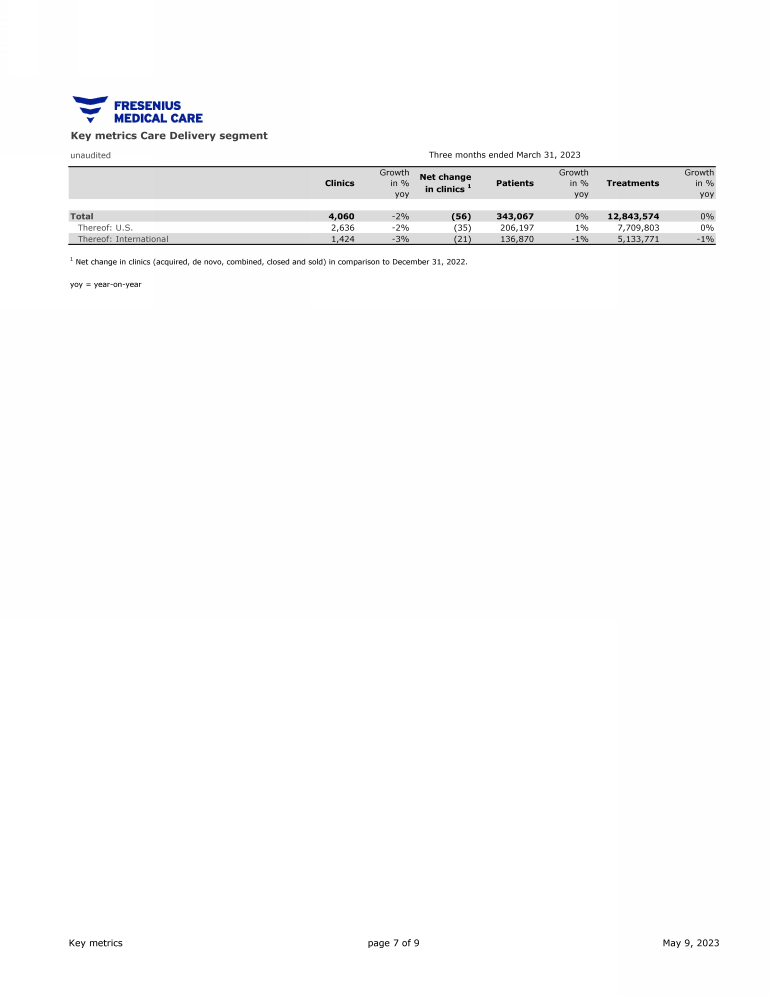
Patients, clinics and employees
As of March 31, 2023, Fresenius Medical Care treated 343,067 patients in 4,060 dialysis clinics worldwide and had 125,231 employees (headcount) globally, compared to 130,177 employees as of March 31, 2022.
Conference call
Fresenius Medical Care will host a conference call to discuss the results of the first quarter 2023 on May 9, 2023 at 3:30 p.m. CEST / 9:30 a.m. EDT. Details will be available on the Fresenius Medical Care website in the “Investors” section. A replay will be available shortly after the call.
Please refer to our statement of earnings included at the end of this news and to the attachments as separate PDF files for a complete overview of the results of the first quarter 2023. Our 6-K disclosure provides more details.
Fresenius Medical Care is the world's leading provider of products and services for individuals with renal diseases of which around 3.9 million patients worldwide regularly undergo dialysis treatment. Through its network of 4,060 dialysis clinics, Fresenius Medical Care provides dialysis treatments for approximately 343,000 patients around the globe. Fresenius Medical Care is also the leading provider of dialysis products such as dialysis machines or dialyzers. Fresenius Medical Care is listed on the Frankfurt Stock Exchange (FME) and on the New York Stock Exchange (FMS).
For more information visit the Company’s website at www.freseniusmedicalcare.com.
5 Revenue and operating income, as referred to in the outlook, are both on a constant currency basis and excluding special items. Special items will be provided as separate KPI (“Revenue excluding special items”, “Operating income excluding special items”) to capture effects that are unusual in nature and have not been foreseeable or not foreseeable in size or impact at the time of giving guidance. These items are excluded to ensure comparability of the figures presented with the Company’s financial targets which have been defined excluding special items. For FY 2022, special items included costs related to the FME25 program, the impact of the war in Ukraine, the impact of hyperinflation in Turkiye, the Humacyte investment remeasurement., and the net gain related to InterWell Health. Additionally, FY 2022 basis for Outlook 2023 and 2025 was adjusted for Provider Relief Funding. For FY 2023, special items include costs related to the FME25 program, the Humacyte investment remeasurement, the costs associated with the legal conversion and effects from legacy portfolio optimization. For further details please see the reconciliation attached to the Press Release.
Page 6/9
Disclaimer:
This release contains forward-looking statements that are subject to various risks and uncertainties. Actual results could differ materially from those described in these forward-looking statements due to various factors, including, but not limited to, changes in business, economic and competitive conditions, legal changes, regulatory approvals, impacts related to COVID-19, results of clinical studies, foreign exchange rate fluctuations, uncertainties in litigation or investigative proceedings, and the availability of financing. These and other risks and uncertainties are detailed in Fresenius Medical Care AG & Co. KGaA's reports filed with the U.S. Securities and Exchange Commission. Fresenius Medical Care AG & Co. KGaA does not undertake any responsibility to update the forward-looking statements in this release.
Implementation of measures as presented herein may be subject to information and consultation procedures with works councils and other employee representative bodies, as per local laws and practice. Consultation procedures may lead to changes on proposed measures.
Page 7/9
Page 8/9
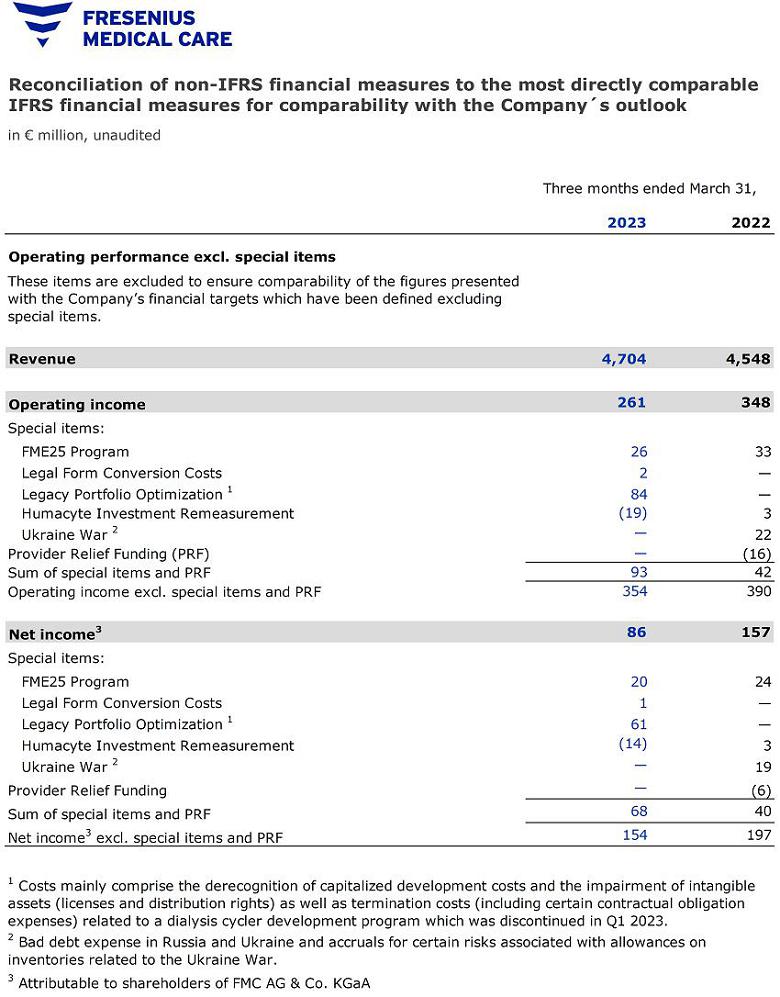
unaudited20232022Operating performance excl. special itemsThese items are excluded to ensure comparability of the figures presented with the Company’s financial targets which have been defined excluding special items.Revenue4,7044,548Operating income261348Special items:FME25 Program2633Legal Form Conversion Costs2—Legacy Portfolio Optimization 184—Humacyte Investment Remeasurement(19)3Ukraine War 2—22Provider Relief Funding (PRF)—(16)Sum of special items and PRF9342Operating income excl. special items and PRF354390Net income3 86157Special items:FME25 Program2024Legal Form Conversion Costs1—Legacy Portfolio Optimization 161—Humacyte Investment Remeasurement(14)3Ukraine War 2—19Provider Relief Funding—(6)Sum of special items and PRF6840Net income3 excl. special items and PRF1541973 Attributable to shareholders of FMC AG & Co. KGaAReconciliation of non-IFRS financial measures to the most directly comparable IFRS financial measures for comparability with the Company´s outlookThree months ended March 31, 2 Bad debt expense in Russia and Ukraine and accruals for certain risks associated with allowances on inventories related to the Ukraine War.1 Costs mainly comprise the derecognition of capitalized development costs and the impairment of intangible assets (licenses and distribution rights) as well as termination costs (including certain contractual obligation
Page 9/9
Content: Statement of earnings page 2 Segment information page 3 Balance sheet page 4 Cash flow page 5 page 6 Key metrics page 7 page 8 Outlook 2023 page 9 Disclaimer Copyright by Fresenius Medical Care AG & Co. KGaA email: ir@fmc-ag.com phone: +49 6172 609 2525 Revenue development by segment Reconciliation results excl. special items This release contains forward-looking statements that are subject to various risks and uncertainties. Actual results could differ materially from those described in these forward-looking statements due to certain factors, including changes in business, economic and competitive conditions, regulatory reforms, foreign exchange rate fluctuations, uncertainties in litigation or investigative proceedings, and the availability of financing. These and other risks and uncertainties are detailed in Fresenius Medical Care AG & Co. KGaA's reports filed with the U.S. Securities and Exchange Commission. Fresenius Medical Care AG & Co. KGaA does not undertake any responsibility to update the forward-looking statements in this release. Fresenius Medical Care AG & Co. KGaA May 9, 2023 COMPLETE OVERVIEW OF THE FIRST QUARTER 2023 Investor Relations |
Statement of earnings in € million, except share data, unaudited 2023 2022 Change Change at cc Total revenue 4,704 4,548 3.4% 1.7% Costs of revenue 3,555 3,374 5.4% 3.6% Selling, general and administrative expenses 782 790 -1.0% -3.2% Research and development expenses 56 50 12.3% 10.3% Income from equity method investees (28) (10) 162.4% 161.5% Other operating income (117) (129) -8.8% 8.9% Other operating expense 195 125 55.1% 81.3% Operating income 261 348 -24.9% -27.8% Operating income excl. special items and PRF 1 354 390 -9.4% -12.7% Interest income (12) (14) -14.4% -6.5% Interest expense 95 83 13.8% 11.2% Interest expense, net 83 69 19.5% 14.8% Income before income taxes 178 279 -36.0% -38.4% Income tax expense 45 67 -33.3% -35.7% Net income 133 212 -36.8% -39.2% Net income attributable to noncontrolling interests 47 55 -12.8% -16.4% Net income attributable to shareholders of FMC AG & Co. KGaA 86 157 -45.1% -47.2% Net income attributable to shareholders of FMC AG & Co. KGaA excl. special items and PRF 1 154 197 -21.6% -24.2% Operating income 261 348 -24.9% -27.8% Depreciation, amortization and impairment loss 438 419 4.5% 1.8% EBITDA 699 767 -8.9% -11.6% Weighted average number of shares 293,413,449 293,007,109 Basic earnings per share €0.29 €0.54 -45.2% -47.2% Basic earnings per ADS €0.15 €0.27 -45.2% -47.2% In percent of revenue Operating income margin 5.5% 7.6% Operating income margin excl. special items and PRF 1 7.5% 8.6% EBITDA margin 14.9% 16.9% 1 For a reconciliation of special items, please refer to the table on page 8. Three months ended March 31, Statement of earnings page 2 of 9 May 9, 2023 |
Segment information unaudited 2023 2022 Change Change at cc Total Revenue in € million 4,704 4,548 3.4% 1.7% Operating income in € million 261 348 -24.9% -27.8% Operating income margin 5.5% 7.6% Operating income in € million excl. special items and PRF 1 354 390 -9.4% -12.7% Operating income margin excl. special items and PRF 1 7.5% 8.6% Days sales outstanding (DSO) 2 76 68 Employees (headcount) 125,231 130,177 Care Delivery segment Revenue in € million 3,756 3,647 3.0% 0.7% Operating income in € million 284 298 -4.4% -8.5% Operating income margin 7.6% 8.2% Operating income in € million excl. special items and PRF 1 302 310 -2.5% -6.4% Operating income margin excl. special items and PRF 1 8.0% 8.5% Days sales outstanding (DSO) 2 71 60 Care Enablement segment Revenue in € million 1,311 1,267 3.4% 3.4% Operating income in € million (24) 69 n.a. n.a. Operating income margin -1.9% 5.5% Operating income in € million excl. special items and PRF 1 69 96 -28.6% -31.9% Operating income margin excl. special items and PRF 1 5.2% 7.6% Days sales outstanding (DSO) 2 92 100 Inter-segment eliminations 3 Revenue in € million (363) (366) -1.2% -2.3% Operating income in € million (9) (9) 6.9% 1.3% Corporate Operating income in € million 10 (10) n.a n.a Operating income in € million excl. special items and PRF 1 (8) (7) 13.7% -14.7% 2 2022 includes DSO as of December 31, 2022. 3 The Company transfers products between segments at fair market value. The associated internal revenues and expenses and any remaining internally generated profit or loss for the product transfers are recorded within the operating segments initially, are eliminated upon consolidation and are included within “Inter-segment eliminations”. 1 For a reconciliation of special items, please refer to the table on page 8. cc = constant currency. Changes in revenue, operating income and net income attributable to shareholders of FMC AG & Co. KGaA include the impact of changes in foreign currency exchange rates. We calculate and present these financial measures using both IFRS and at constant exchange rates to show changes in these metrics and other items without giving effect to period-to-period currency fluctuations. Under IFRS, amounts received in local (non-euro) currency are translated into euro at the average exchange rate for the period presented. Once we translate the local currency for the constant currency, we then calculate the change, as a percentage, of the current period using the prior period exchange rates versus the prior period. The single quarter results are calculated as the variance between the current year-to-date results less the preceding quarter’s year-to-date which makes the single quarter subject to further foreign exchange fluctuation. This resulting percentage is a non-IFRS measure referring to a change as a percentage at constant currency. These currency-adjusted financial measures are identifiable by the designated term "Constant Currency". Three months ended March 31, Segment information page 3 of 9 May 9, 2023 |
Balance sheet in € million, except for net leverage ratio, unaudited March 31, December 31, 2023 2022 Assets Current assets 8,562 8,203 Goodwill and intangible assets 16,895 17,310 Right-of-use assets 4,052 4,187 Other non-current assets 5,992 6,054 Total assets 35,501 35,754 Liabilities and equity Current liabilities 6,492 6,467 Non-current liabilities 13,782 13,838 Total equity 15,227 15,449 Total liabilities and equity 35,501 35,754 Equity/assets ratio 43% 43% Debt and lease liabilities Short-term debt from unrelated parties 700 665 Short-term debt from related parties 13 4 Current portion of long-term debt 697 694 Current portion of lease liabilities from unrelated parties 633 650 Current portion of lease liabilities from related parties 25 24 Long-term debt, less current portion 7,328 7,171 Lease liabilities from unrelated parties, less current portion 3,741 3,875 Lease liabilities from related parties, less current portion 129 130 Total debt and lease liabilities 13,266 13,213 Minus: Cash and cash equivalents (1,224) (1,274) Total net debt and lease liabilities 12,042 11,939 Reconciliation of annualized adjusted EBITDA and net leverage ratio to the most directly comparable IFRS financial measures Net income 816 895 Income tax expense 303 325 Interest income (66) (68) Interest expense 372 360 Depreciation and amortization 1,716 1,718 Adjustments1 358 320 Annualized adjusted EBITDA 3,499 3,550 Net leverage ratio 3.4 3.4 1 Acquisitions and divestitures made for the last twelve months with a purchase price above a €50 M threshold as defined in the Syndicated Credit Facility (2023: -€17 M; 2022: -€22 M), non-cash charges, primarily related to pension expense (2023: €53 M; 2022: €54 M), impairment loss (2023: €141 M; 2022: €120 M) and special items, including costs related to the FME25 Program (2023: €150 M; 2022: €155 M), Legal Form Conversion Costs (2023: €2 M), Legacy Portfolio Optimization (2023: €60 M), Net Gain Related to InterWell Health (2023: -€114 M; 2022: -€114 M), Humacyte Investment Remeasurement (2023: €80 M; 2022: €103 M), Hyperinflation in Turkiye (2023: €5 M; 2022: €5 M) and the Impacts Related to the War in Ukraine (2023: -€2 M; 2022: €19 M). Balance sheet page 4 of 9 May 9, 2023 |
Cash flow statement in € million, unaudited 2023 2022 Operating activities Net income 133 212 Depreciation, amortization and impairment loss 438 419 Change in working capital and other non-cash items (428) (472) Net cash provided by (used in) operating activities 143 159 In percent of revenue 3.0% 3.5% Investing activities Purchases of property, plant and equipment and capitalized development costs (142) (162) Proceeds from sale of property, plant and equipment 1 2 Capital expenditures, net (141) (160) Free cash flow 2 (1) In percent of revenue 0.0% 0.0% Acquisitions and investments, net of cash acquired, and purchases of intangible assets (4) (36) Investments in debt securities (45) (43) Proceeds from divestitures 12 14 Proceeds from sale of debt securities 15 13 Free cash flow after investing activities (20) (53) Three months ended March 31, Cash flow page 5 of 9 May 9, 2023 |
in € million, unaudited 2023 2022 Change Change at cc Organic growth Same market treatment growth1 Three months ended March 31, Total revenue 4,704 4,548 3.4% 1.7% 2.4% Care Delivery segment 3,756 3,647 3.0% 0.7% 1.5% 0.0% Thereof: U.S. 3,003 2,930 2.5% -2.0% -1.1% -0.3% Thereof: International 753 717 4.9% 11.8% 12.2% 0.5% Care Enablement segment 1,311 1,267 3.4% 3.4% 3.4% Inter-segment eliminations (363) (366) -1.2% -2.3% in € million, unaudited Care Delivery segment Care Enablement segment Inter-segment eliminations Total Three months ended March 31, 2023 Health care services revenue 3,713 — — 3,713 Health care products revenue 43 948 — 991 Inter-segment revenue — 363 (363) — Revenue 3,756 1,311 (363) 4,704 Three months ended March 31, 2022 Health care services revenue 3,607 — — 3,607 Health care products revenue 40 901 — 941 Inter-segment revenue — 366 (366) — Revenue 3,647 1,267 (366) 4,548 Reconciliation of health care services and health care products revenue to new segments 1 Same market treatment growth = organic growth less price effects Revenue development by segment Revenue development by segment page 6 of 9 May 9, 2023 |
unaudited Clinics Growth in % yoy Net change in clinics 1 Patients Growth in % yoy Treatments Growth in % yoy Total 4,060 -2% (56) 343,067 0% 12,843,574 0% Thereof: U.S. 2,636 -2% (35) 206,197 1% 7,709,803 0% Thereof: International 1,424 -3% (21) 136,870 -1% 5,133,771 -1% yoy = year-on-year Key metrics Care Delivery segment Three months ended March 31, 2023 1 Net change in clinics (acquired, de novo, combined, closed and sold) in comparison to December 31, 2022. Key metrics page 7 of 9 May 9, 2023 |
in € million, except share data, unaudited Results 2023 FME25 Program Legal Form Conversion Costs Legacy Portfolio Optimiza-tion 1 Humacyte Investment Remeasure-ment Sum of special items Results 2023 excl.special items Results 2022 FME25 Program Humacyte Investment Remeasure-ment Ukraine War2 Provider Relief Funding (PRF) Sum of special items and PRF Results 2022 excl. special items and PRF Change Change at cc Three months ended March 31, Total revenue 4,704 — 4,704 4,548 — 4,548 3.4% 1.7% EBITDA 699 22 2 60 (19) 65 764 767 28 3 21 (16) 36 803 -4.9% -7.7% Total operating income 261 26 2 84 (19) 93 354 348 33 3 22 (16) 42 390 -9.4% -12.7% Care Delivery segment 284 17 — 1 — 18 302 298 20 — 8 (16) 12 310 -2.5% -6.4% Care Enablement segment (24) 10 — 83 — 93 69 69 13 — 14 — 27 96 -28.6% -31.9% Inter-segment eliminations (9) — — — — — (9) (9) ———— — (9) 6.9% 1.3% Corporate 10 (1) 2 — (19) (18) (8) (10) — 3 — — 3 (7) 13.7% -14.7% Interest expense, net 83 — 83 69 — 69 19.5% 14.8% Income tax expense 45 6 1 23 (5) 25 70 67 9 0 3 (4) 8 75 -8.3% -11.6% Net income attributable to noncontrolling interests 47 — 47 55 ——— (6) (6) 49 -3.1% -7.1% Net income3 86 20 1 61 (14) 68 154 157 24 3 19 (6) 40 197 -21.6% -24.2% Basic earnings per share €0.29 €0.07 €0.00 €0.21 €(0.04) €0.24 €0.53 €0.54 €0.08 €0.01 €0.06 €(0.02) €0.13 €0.67 -21.7% -24.3% 1 Costs mainly comprise the derecognition of capitalized development costs and the impairment of intangible assets (licenses and distribution rights) as well as termination costs (including certain contractual obligation expenses) related to a dialysis cycler development program which was discontinued in Q1 2023. 3 Attributable to shareholders of FMC AG & Co. KGaA 2 Bad debt expense in Russia and Ukraine and accruals for certain risks associated with allowances on inventories related to the Ukraine War. Special items Reconciliation of non-IFRS financial measures to the most directly comparable IFRS financial measures for comparability with the Company's outlook Results excl. special items Special items and PRF Reconciliation results excl. special items page 8 of 9 May 9, 2023 |
Outlook 2023 Spalte1 Results 2022 Outlook 2023 (at Constant Currency) Revenue1 €19,398 M low to mid-single digit percentage rate growth Operating income1 €1,540 M flat to high-single digit percentage rate decline 1 Outlook 2023 is based on the assumptions outlined in the earnings release for the fourth quarter and full year of 2022 and excludes special items. Special items include further costs related to the FME25 program, Legal Form Conversion Costs, Legacy Portfolio Optimization, Humacyte Investment Remeasurement and other effects that are unusual in nature and have not been foreseeable or not foreseeable in size or impact at the time of giving guidance. The growth rates are based on the results 2022 excluding the costs related to the FME25 program (€204 M for operating income), Net Gain Related to InterWell Health (-€56 M for operating income), Humacyte Investment Remeasurement (€103 M for operating income), Hyperinflation in Turkiye (€5 M for operating income) and the Impacts Related to the War in Ukraine (€49 M for operating income). Additionally, the results 2022 were adjusted for the Provider Relief Funding (-€277 M for operating income). Outlook 2023 page 9 of 9 May 9, 2023 |
K
MWM_86:W%YHBV:*DGF*LFZ8L@9@#C#)DX /X5SGB'PAXIU*W:R,#7EN^F1P0
M:J]M%;2+'AM\:C]\2W(+''0' Y(!Z%/XFT*UU)=-N-8L8KYW$:VSW"K(6(!
MVDYR01^8I+OQ/H-CJ::9=ZS807[E0MM)<*LA+'"@*3GGM7-ZGX6O;NT\4B.U
MA-QJ$]L]LY(R5C2(VEZ9=0P2^89//D5UC)QV!&_.3G/3 ZG;U+P[IGB*RMXM3BFD2"0R1B
M.YDAPV>#E&&?QJQ+H.FS0WD,EN62\D22X'F-\[*%"G.>.$7ICI[FA?U^'_!!
M_P!?B8L.O:S
#6
M9J?A+3;SPW)H5E;6NGV
M:-% &=>^']&U.Y6YO](L+NX5#&LMQ;)(X0YRH)!..3Q[FEN=!
MT>\NC=76E6,]P8C 9I;=&?RR""F2,[2"1CIR:T** *CZ7I\B7"26-LZW("SJ
MT2D2@# #-@<
A!Z&HETVP5(T6RMPL4QGC B7"
M2$DEQQPQ+-D]?F/K5JB@#/BT+2+>[N;N'2K&.YN@5N)DMT#S ]0Y RP^M);>
M']&LK)K.TTBPM[5Y!*T$5LB(7!!#%0,9! .?85HT4 5I-/LI3
5^4=?H.O2N-OM5M1HFC6FD^*)Q%*CR?
MVA