UNITED STATES
SECURITIES AND EXCHANGE COMMISSION
Washington, D.C. 20549
FORM N-CSR
CERTIFIED SHAREHOLDER REPORT OF REGISTERED MANAGEMENT INVESTMENT COMPANIES
Investment Company Act file number 811-21779
JOHN HANCOCK FUNDS II
---------------------------------------------------------
(Exact name of registrant as specified in charter)
601 CONGRESS STREET, BOSTON, MA 02210-2805
-------------------------------------------------------------
(Address of principal executive offices) (Zip code)
SALVATORE SCHIAVONE, 601 CONGRESS STREET, BOSTON, MA 02210-2805
------------------------------------------------------------------------------------------
(Name and address of agent for service)
Registrant’s telephone number, including area code: (617) 663-4497
-------------------
Date of fiscal year end: 7/31
Date of reporting period: 1/31/16
ITEM 1. REPORTS TO STOCKHOLDERS.
The Registrant prepared nine semiannual reports to shareholders for the period ended January 31, 2016. The first report applies to the Technical Opportunities Fund, the second report applies to the Global Income Fund, the third report applies to the Short Duration Credit Opportunities Fund, the fourth report applies to the Absolute Return Currency Fund, the fifth report applies to the Fundamental All Cap Core Fund, the sixth report applies to the Fundamental Large Cap Core Fund, the seventh report applies to the Fundamental Large Cap Value Fund, the eighth report applies to the Diversified Strategies Fund, and the ninth report applies to the Global Absolute Return Strategies Fund.
John Hancock
Technical Opportunities Fund
Semiannual report 1/31/16


A message to shareholders
Dear shareholder,
The six-month period has been a challenging time for all investors. Oil prices, having already dropped precipitously, continued to slide in the back half of 2015, and by January oil frequently traded at multi-year lows. Concerns about slowing global growth added to negative investor psychology, and stock prices fell steeply around the world. Stocks were not the only investment that faced headwinds; all risk assets struggled over the past six months and these types of declines are unsettling.
Although volatility returned in force to the markets, much of the global economic picture continues to move in the right direction. In December, the U.S. Federal Reserve raised short-term interest rates for the first time in nine years on the evidence that the persistent strength in the labor markets warranted a somewhat less accommodative stance. Central banks outside of the United States continue to signal that they would take action to support economies and markets.
At John Hancock Investments, portfolio risk management is a critical part of our role as an asset manager, and our dedicated risk team is focused on these issues every day. We continually strive for new ways to analyze potential risks and have liquidity tools in place, such as a credit facility and an interfund lending program. In times like these, your best resource is your financial advisor, who can ensure your portfolio is sufficiently diversified to meet your long-term objectives and to withstand the inevitable bumps along the way.
On behalf of everyone at John Hancock Investments, I'd like to take this opportunity to thank you for the continued trust you've placed in us.
Sincerely,

Andrew G. Arnott
President and Chief Executive Officer
John Hancock Investments
This commentary reflects the CEO's views as of January 31, 2016. They are subject to change at any time. All investments entail risks, including the possible loss of principal. For more up-to-date information, you can visit our website at jhinvestments.com.
John Hancock
Technical Opportunities Fund
INVESTMENT OBJECTIVE
The fund seeks long-term capital appreciation.
AVERAGE ANNUAL TOTAL RETURNS AS OF 1/31/16 (%)
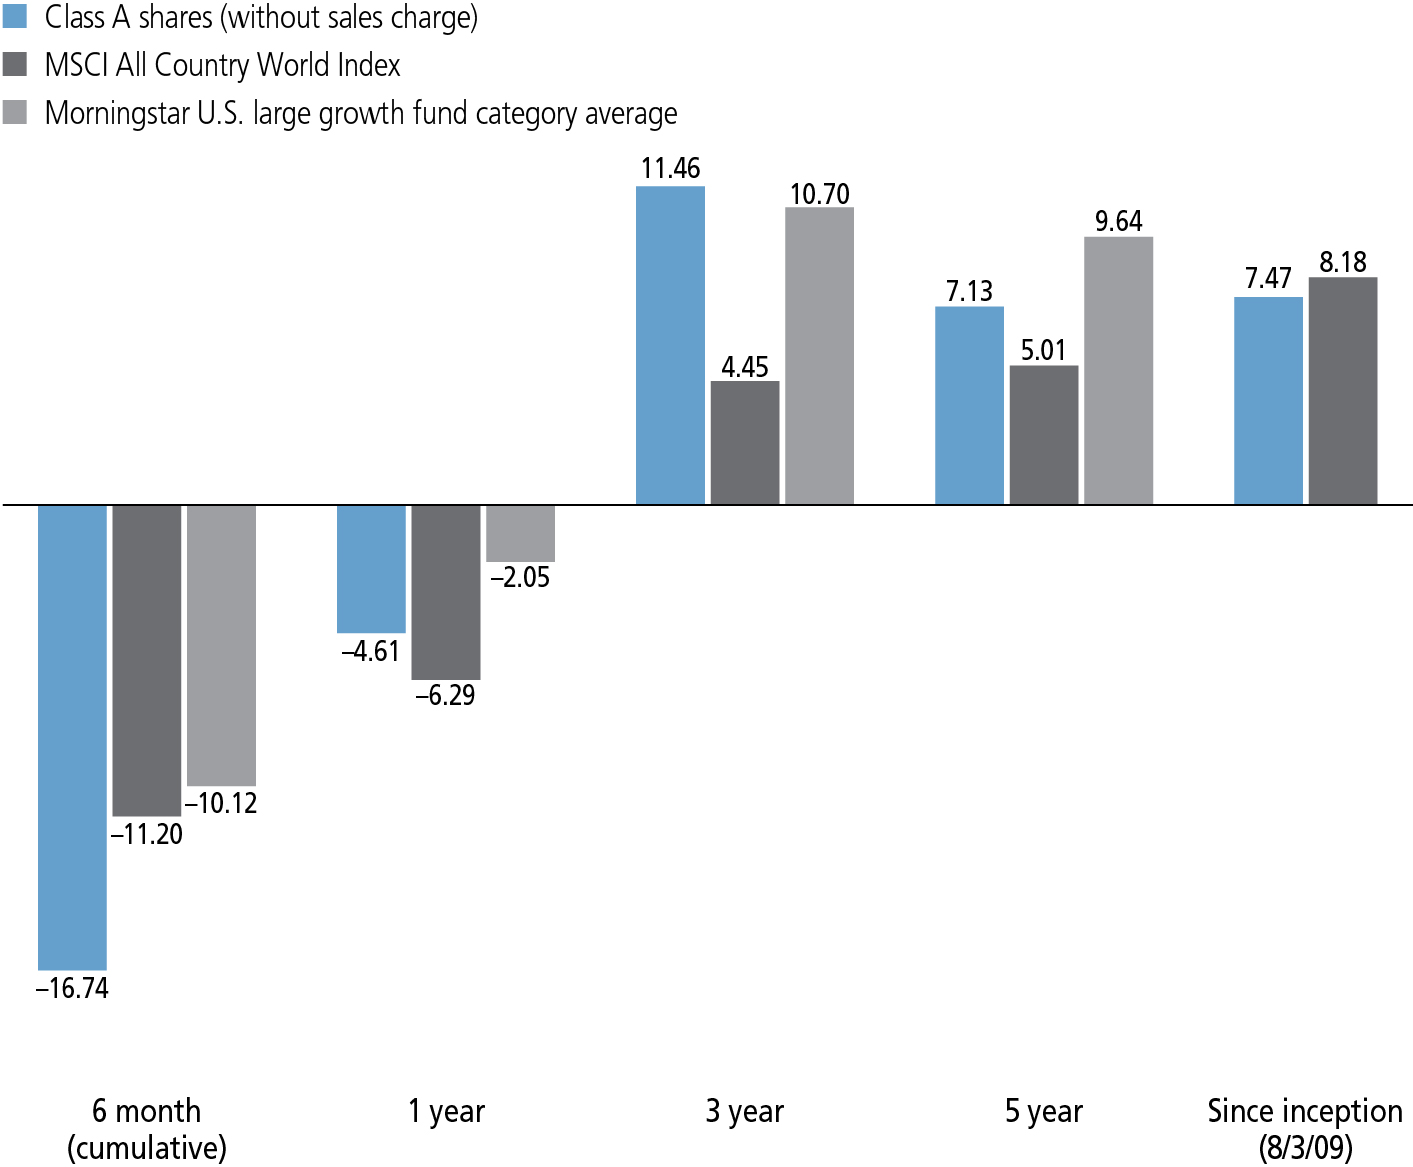
The MSCI All Country World Index (gross of foreign withholding tax on dividends) is a free float-adjusted market capitalization weighted index that is designed to measure the equity market performance of developed and emerging markets.
It is not possible to invest directly in an index. Index figures do not reflect expenses or sales charges, which would result in lower returns.
Figures from Morningstar, Inc. include reinvested distributions and do not take into account sales charges. Actual load-adjusted performance is lower. Since-inception returns for the Morningstar fund category average are not available.
The past performance shown here reflects reinvested distributions and the beneficial effect of any expense reductions, and does not guarantee future results. Returns for periods shorter than one year are cumulative. Performance of the other share classes will vary based on the difference in the fees and expenses of those classes. Shares will fluctuate in value and, when redeemed, may be worth more or less than their original cost. Current month-end performance may be lower or higher than the performance cited, and can be found at jhinvestments.com or by calling 800-225-5291. For further information on the fund's objectives, risks, and strategy, see the fund's prospectus.
PERFORMANCE HIGHLIGHTS OVER THE LAST SIX MONTHS
Global equities declined during the period
Slowing economic growth, falling commodity prices, and speculation about U.S. Federal Reserve policy weighed on investor sentiment and pressured the performance of the world stock markets.
The fund underperformed its benchmark
The fund's stock selection in the healthcare sector was the primary factor in its shortfall versus its benchmark, the MSCI AC World Index.
Mixed performance outside of healthcare
While stock selection in the financials and materials sectors added value, selection in the information technology and consumer discretionary sectors detracted.
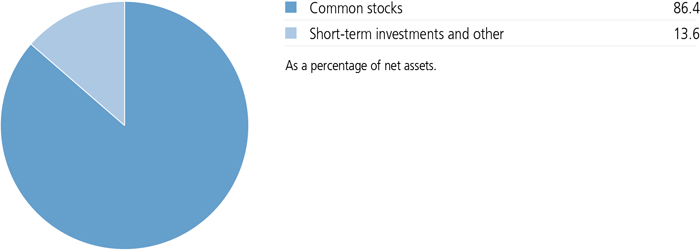
PORTFOLIO COMPOSITION AS OF 1/31/16 (%)
A note about risks
A fund concentrated in one sector or that holds a limited number of securities may fluctuate more than a fund that invests in a wider variety of sectors. Stock prices can be volatile and are affected by both general economic conditions and the financial prospects of individual companies. The value of a company's equity securities is subject to changes in the company's financial condition and overall market and economic conditions. Foreign investing, including emerging markets, has additional risks, such as currency and market volatility and political and social instability. Hedging, derivatives, and other strategic transactions may increase a fund's volatility and could produce disproportionate losses, potentially more than the fund's principal investment. The fund may invest its assets in a small number of issuers. Performance could suffer significantly from adverse events affecting these issuers. Frequent trading may increase fund transaction costs. The fund may invest in initial public offerings, which are frequently volatile in price. The fund can invest up to 100% of its assets in cash, which may cause the fund to not meet its investment objective. Please see the fund's prospectuses for additional risks.

Frank L. Teixeira, CMT, CFA
Portfolio Manager
Wellington Management Company LLP
Can you describe the market environment of the past six months?
The world equity markets declined during the six-month period ended January 31, 2016. The growth slowdown in China and its implications for global commerce fueled investor anxiety. In addition, the weaker outlook for China led to a sharp downturn in the prices of oil and other commodities, weighing heavily on the performance of stocks in the energy and materials sectors. On the other side of the ledger, elevated volatility and concerns about the state of the global economy fueled relative outperformance for the more defensive segments of the market, such as consumer staples, utilities, and telecommunication services.
Uncertainty about the U.S. Federal Reserve's (Fed's) timeline for interest-rate increases also contributed to weaker market sentiment. As many market participants expected, the Fed left rates unchanged at its highly anticipated September meeting. The Fed ultimately enacted a quarter-point rate hike in December, its first increase since 2006. The market initially reacted positively to the news, but volatility remained elevated through the end of 2015 as investors assessed the impact of the rate increase and global economic developments. The markets continued their downward trend in January, with the fund's benchmark, the MSCI AC World Index, losing 6.0% for the month.
From a technical standpoint, we saw a narrowing of potential investment opportunities during the course of the period. While companies offering growth, high-quality recurring revenue streams, steady and growing returns of capital to shareholders, low share price volatility, and exposure to the U.S. consumer performed well through much of 2015, such stocks began to experience weaker relative performance during the second half of the period. Our preference for these types of companies, together with the fund's underweight in the defensive market segments, contributed to the fund's underperformance during the past six months. However, the fund has outpaced its benchmark for the three- and five-year periods ended January 31, 2016.
What other factors detracted from performance during the period?
The fund underperformed its benchmark due largely to weak stock selection in the healthcare sector, where stocks with positive price trends generally reversed course in mid-August and lagged
Selection in the consumer discretionary and information technology sectors also detracted from performance. In the former, the fund lost some ground through positions in Netflix, Inc., Asics Corp., and Expedia Inc. In technology, the leading detractors were HubSpot, Inc., a maker of cloud-based marketing software, and ServiceNow, Inc., a provider of cloud-based technology services. These detractors were offset, to some extent, by the strong performance of the fund's holdings in Facebook, Inc. and Activision Blizzard, Inc. We sold Netflix, Asics, and ServiceNow prior to the end of the period.
What aspects of the fund's positioning aided performance?
On the positive side, the fund was helped by strong stock selection in the financials and materials
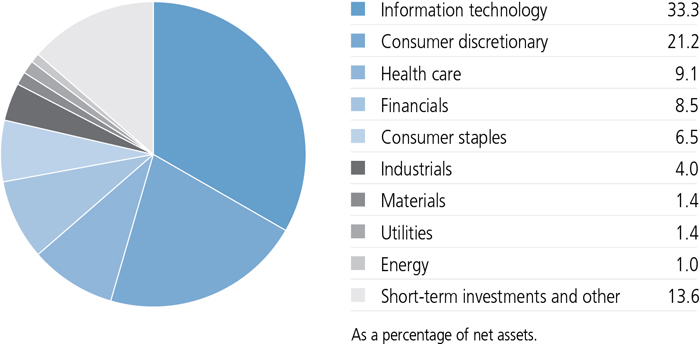
SECTOR COMPOSITION AS OF 1/31/16 (%)
How would you characterize the fund's positioning?
We do not attempt to forecast macroeconomic events or company fundamentals; instead, we use a technical analysis framework to identify sustained price trends and align the portfolio accordingly.
With this in mind, the fund closed the period with overweight positions in the United States and Japan, both of which continued to demonstrate the strongest technical conditions on both an absolute and relative basis. The fund had a significant underweight in the emerging markets, and it remained underweight in Europe, albeit to a smaller extent than it was at the beginning of the period. Information technology was the fund's largest overweight at the sector level, followed by consumer discretionary and healthcare. However, it should be noted that we significantly reduced fund's weighting in healthcare during the course of the period. The fund held a lower weighting in the defensive segments of the market, such as utilities, real estate investment trusts, and
TOP 10 HOLDINGS AS OF 1/31/16 (%)
| Facebook, Inc., Class A | 5.0 |
| Alphabet, Inc., Class A | 4.4 |
| Amazon.com, Inc. | 4.2 |
| Microsoft Corp. | 2.6 |
| Expedia, Inc. | 2.1 |
| Visa, Inc., Class A | 1.9 |
| MasterCard, Inc., Class A | 1.9 |
| ANTA Sports Products, Ltd. | 1.6 |
| Adobe Systems, Inc. | 1.5 |
| Zalando SE | 1.5 |
| TOTAL | 26.7 |
| As a percentage of net assets. | |
| Cash and cash equivalents are not included. | |
MANAGED BY
| |
Frank L. Teixeira, CMT, CFA On the fund since 2009 Investing since 1989 |
![]()
COUNTRY COMPOSITION AS OF 1/31/16 (%)
| United States | 73.0 |
| Japan | 8.4 |
| Germany | 4.7 |
| United Kingdom | 4.1 |
| China | 3.3 |
| Switzerland | 1.8 |
| Denmark | 1.4 |
| Isle of Man | 1.3 |
| Ireland | 1.2 |
| Netherlands | 0.8 |
| TOTAL | 100.0 |
| As a percentage of net assets. |
TOTAL RETURNS FOR THE PERIOD ENDED JANUARY 31, 2016
| Average annual total returns (%) with maximum sales charge |
Cumulative total returns (%) with maximum sales charge |
||||||
| 1-year | 5-year | Since inception1 |
6-month | 5-year | Since inception1 |
||
| Class A | -9.35 | 6.03 | 6.62 | -20.89 | 34.01 | 51.70 | |
| Class C2 | -6.08 | 6.43 | 6.77 | -17.71 | 36.54 | 53.10 | |
| Class I3 | -4.25 | 7.49 | 7.84 | -16.51 | 43.48 | 63.43 | |
| Class NAV3 | -4.21 | 7.67 | 8.02 | -16.51 | 44.72 | 65.13 | |
| Index† | -6.29 | 5.01 | 8.18 | -11.20 | 27.69 | 66.73 | |
Performance figures assume all distributions have been reinvested. Figures reflect maximum sales charges on Class A shares of 5.00% and the applicable contingent deferred sales charge (CDSC) on Class C shares. Class C shares sold within one year of purchase are subject to a 1% CDSC. Sales charges are not applicable to Class I and Class NAV shares.
The expense ratios of the fund, both net (including any fee waivers and/or expense limitations) and gross (excluding any fee waivers and/or expense limitations), are set forth according to the most recent publicly available prospectuses for the fund and may differ from those disclosed in the Financial highlights tables in this report. The expense ratios are as follows:
| Class A | Class C | Class I | Class NAV | |
| Gross/Net (%) | 1.63 | 2.34 | 1.32 | 1.21 |
Please refer to the most recent prospectus and annual or semiannual report for more information on expenses and any expense limitation arrangements for each class.
The returns reflect past results and should not be considered indicative of future performance. The return and principal value of an investment will fluctuate so that shares, when redeemed, may be worth more or less than their original cost. Due to market volatility and other factors, the fund's current performance may be higher or lower than the performance shown. For current to the most recent month-end performance data, please call 800-225-5291 or visit the fund's website at jhinvestments.com.
The performance table above and the chart on the next page do not reflect the deduction of taxes that a shareholder would pay on fund distributions or the redemption of fund shares. The fund's performance results reflect any applicable fee waivers or expense reductions, without which the expenses would increase and results would have been less favorable.
| † | Index is the MSCI All Country World Index. |
See the following page for footnotes.
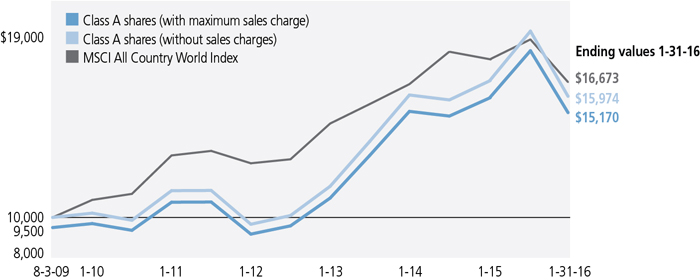
This chart and table show what happened to a hypothetical $10,000 investment in John Hancock Technical Opportunities Fund for the share classes and periods indicated, assuming all distributions were reinvested. For comparison, we've shown the same investment in the MSCI All Country World Index.
| Start date | With maximum sales charge ($) |
Without sales charge ($) |
Index ($) | |
| Class C2,4 | 8-3-09 | 15,310 | 15,310 | 16,673 |
| Class I3 | 8-3-09 | 16,343 | 16,343 | 16,673 |
| Class NAV3 | 8-3-09 | 16,513 | 16,513 | 16,673 |
The MSCI All Country World Index (gross of foreign withholding tax on dividends) is a free float-adjusted market capitalization weighted index that is designed to measure the equity market performance of developed and emerging markets.
It is not possible to invest directly in an index. Index figures do not reflect expenses or sales charges, which would result in lower returns.
Footnotes related to performance pages
| 1 | From 8-3-09. |
| 2 | Class C shares were first offered on 8-28-14. The returns prior to this date are those of Class A shares that have been recalculated to apply the gross fees and expenses of Class C shares. |
| 3 | For certain types of investors as described in the fund's prospectuses. |
| 4 | The contingent deferred sales charge is not applicable. |
These examples are intended to help you understand your ongoing operating expenses of investing in the fund so you can compare these costs with the ongoing costs of investing in other mutual funds.
Understanding fund expenses
As a shareholder of the fund, you incur two types of costs:
| • | Transaction costs, which include sales charges (loads) on purchases or redemptions (varies by share class), minimum account fee charge, etc. |
| • | Ongoing operating expenses, including management fees, distribution and service fees (if applicable), and other fund expenses. |
We are presenting only your ongoing operating expenses here.
Actual expenses/actual returns
This example is intended to provide information about the fund's actual ongoing operating expenses, and is based on the fund's actual return. It assumes an account value of $1,000.00 on August 1, 2015, with the same investment held until January 31, 2016.
| Account value on 8-1-2015 |
Ending value on 1-31-2016 |
Expenses paid during period ended 1-31-20161 |
Annualized expense ratio |
|
| Class A | $1,000.00 | $832.60 | $7.55 | 1.64% |
| Class C | 1,000.00 | 830.30 | 10.81 | 2.35% |
| Class I | 1,000.00 | 834.90 | 6.09 | 1.32% |
| Class NAV | 1,000.00 | 834.90 | 5.63 | 1.22% |
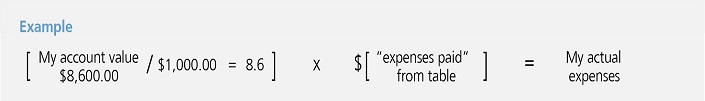
Together with the value of your account, you may use this information to estimate the operating expenses that you paid over the period. Simply divide your account value at January 31, 2016, by $1,000.00, then multiply it by the "expenses paid" for your share class from the table above. For example, for an account value of $8,600.00, the operating expenses should be calculated as follows:
Hypothetical example for comparison purposes
This table allows you to compare the fund's ongoing operating expenses with those of any other fund. It provides an example of the fund's hypothetical account values and hypothetical expenses based on each class's actual expense ratio and an assumed 5% annualized return before expenses (which is not the fund's actual return). It assumes an account value of $1,000.00 on August 1, 2015, with the same investment held until January 31, 2016. Look in any other fund shareholder report to find its hypothetical example and you will be able to compare these expenses. Please remember that these hypothetical account values and expenses may not be used to estimate the actual ending account balance or expenses you paid for the period.
| Account value on 8-1-2015 |
Ending value on 1-31-2016 |
Expenses paid during period ended 1-31-20161 |
Annualized expense ratio |
|
| Class A | $1,000.00 | $1,016.90 | $8.31 | 1.64% |
| Class C | 1,000.00 | 1,013.30 | 11.89 | 2.35% |
| Class I | 1,000.00 | 1,018.50 | 6.70 | 1.32% |
| Class NAV | 1,000.00 | 1,019.00 | 6.19 | 1.22% |
Remember, these examples do not include any transaction costs, therefore, these examples will not help you to determine the relative total costs of owning different funds. If transaction costs were included, your expenses would have been higher. See the prospectuses for details regarding transaction costs.
| 1 | Expenses are equal to the fund's annualized expense ratio, multiplied by the average account value over the period, multiplied by 184/366 (to reflect the one-half year period). |
Fund's investments
| As of 1-31-16 (unaudited) | |||||||||||||||||
| Shares | Value | ||||||||||||||||
| Common stocks 86.4% | $583,575,787 | ||||||||||||||||
| (Cost $543,584,782) | |||||||||||||||||
| Consumer discretionary 21.2% | 143,184,941 | ||||||||||||||||
| Distributors 0.8% | |||||||||||||||||
| Core-Mark Holding Company, Inc. | 63,196 | 5,137,203 | |||||||||||||||
| Diversified consumer services 0.1% | |||||||||||||||||
| Bright Horizons Family Solutions, Inc. (I) | 13,200 | 926,244 | |||||||||||||||
| Hotels, restaurants and leisure 4.0% | |||||||||||||||||
| Chuy's Holdings, Inc. (I) | 46,355 | 1,584,877 | |||||||||||||||
| Darden Restaurants, Inc. | 74,770 | 4,714,996 | |||||||||||||||
| Domino's Pizza, Inc. | 40,984 | 4,669,307 | |||||||||||||||
| McDonald's Corp. | 59,697 | 7,389,295 | |||||||||||||||
| Panera Bread Company, Class A (I) | 10,250 | 1,988,500 | |||||||||||||||
| Starbucks Corp. | 109,685 | 6,665,557 | |||||||||||||||
| Internet and catalog retail 9.0% | |||||||||||||||||
| Amazon.com, Inc. (I) | 48,812 | 28,652,644 | |||||||||||||||
| Ctrip.com International, Ltd., ADR (I) | 114,542 | 4,888,653 | |||||||||||||||
| Expedia, Inc. | 142,343 | 14,382,337 | |||||||||||||||
| Yoox Net-A-Porter Group SpA (I) | 85,766 | 2,950,972 | |||||||||||||||
| Zalando SE (I) | 285,579 | 9,834,876 | |||||||||||||||
| Media 0.5% | |||||||||||||||||
| ProSiebenSat.1 Media AG | 70,916 | 3,543,238 | |||||||||||||||
| Specialty retail 3.7% | |||||||||||||||||
| L Brands, Inc. | 34,436 | 3,311,021 | |||||||||||||||
| Nitori Holdings Company, Ltd. | 42,421 | 3,445,679 | |||||||||||||||
| Ross Stores, Inc. | 119,235 | 6,708,161 | |||||||||||||||
| Ulta Salon Cosmetics & Fragrance, Inc. (I) | 31,354 | 5,680,404 | |||||||||||||||
| Yamada Denki Company, Ltd. | 1,219,673 | 5,906,468 | |||||||||||||||
| Textiles, apparel and luxury goods 3.1% | |||||||||||||||||
| adidas AG | 33,115 | 3,409,939 | |||||||||||||||
| ANTA Sports Products, Ltd. | 4,476,973 | 10,822,625 | |||||||||||||||
| Pandora A/S | 49,123 | 6,571,945 | |||||||||||||||
| Consumer staples 6.5% | 43,642,594 | ||||||||||||||||
| Beverages 1.8% | |||||||||||||||||
| Davide Campari-Milano SpA | 114,676 | 1,001,903 | |||||||||||||||
| Dr. Pepper Snapple Group, Inc. | 35,337 | 3,316,024 | |||||||||||||||
| Molson Coors Brewing Company, Class B | 51,653 | 4,673,563 | |||||||||||||||
| PepsiCo, Inc. | 33,581 | 3,334,593 | |||||||||||||||
| Food and staples retailing 0.6% | |||||||||||||||||
| Ain Holdings, Inc. | 86,275 | 3,920,196 | |||||||||||||||
| Shares | Value | ||||||||||||||||
| Consumer staples (continued) | |||||||||||||||||
| Food products 1.1% | |||||||||||||||||
| Diamond Foods, Inc. (I) | 42,186 | $1,548,226 | |||||||||||||||
| Greencore Group PLC | 171,988 | 955,388 | |||||||||||||||
| Hormel Foods Corp. | 58,320 | 4,689,511 | |||||||||||||||
| Household products 0.5% | |||||||||||||||||
| Kimberly-Clark Corp. | 25,760 | 3,308,099 | |||||||||||||||
| Tobacco 2.5% | |||||||||||||||||
| Altria Group, Inc. | 76,662 | 4,684,815 | |||||||||||||||
| Philip Morris International, Inc. | 51,834 | 4,665,578 | |||||||||||||||
| Reynolds American, Inc. | 151,045 | 7,544,698 | |||||||||||||||
| Energy 1.0% | 6,978,237 | ||||||||||||||||
| Oil, gas and consumable fuels 1.0% | |||||||||||||||||
| Tesoro Corp. | 39,138 | 3,414,791 | |||||||||||||||
| Valero Energy Corp. | 52,504 | 3,563,446 | |||||||||||||||
| Financials 8.5% | 57,717,291 | ||||||||||||||||
| Capital markets 1.8% | |||||||||||||||||
| Interactive Brokers Group, Inc., Class A | 170,520 | 5,502,680 | |||||||||||||||
| Partners Group Holding AG | 19,040 | 6,866,863 | |||||||||||||||
| Diversified financial services 4.8% | |||||||||||||||||
| CBOE Holdings, Inc. | 50,684 | 3,376,568 | |||||||||||||||
| Euronext NV (S) | 115,230 | 5,585,936 | |||||||||||||||
| Intercontinental Exchange, Inc. | 19,303 | 5,092,131 | |||||||||||||||
| Japan Exchange Group, Inc. | 365,502 | 5,196,324 | |||||||||||||||
| London Stock Exchange Group PLC | 140,699 | 4,982,063 | |||||||||||||||
| Markit, Ltd. (I) | 134,911 | 3,826,076 | |||||||||||||||
| Nasdaq, Inc. | 75,399 | 4,674,738 | |||||||||||||||
| Real estate investment trusts 1.9% | |||||||||||||||||
| Equinix, Inc. | 25,663 | 7,970,158 | |||||||||||||||
| Federal Realty Investment Trust | 30,788 | 4,643,754 | |||||||||||||||
| Health care 9.1% | 61,190,728 | ||||||||||||||||
| Biotechnology 0.9% | |||||||||||||||||
| Actelion, Ltd. (I) | 38,759 | 5,107,645 | |||||||||||||||
| Portola Pharmaceuticals, Inc. (I) | 27,541 | 909,679 | |||||||||||||||
| Health care equipment and supplies 2.4% | |||||||||||||||||
| Edwards Lifesciences Corp. (I) | 57,724 | 4,514,594 | |||||||||||||||
| Intuitive Surgical, Inc. (I) | 4,817 | 2,605,274 | |||||||||||||||
| STERIS PLC | 62,490 | 4,326,808 | |||||||||||||||
| Sysmex Corp. | 71,962 | 4,633,819 | |||||||||||||||
| Pharmaceuticals 5.8% | |||||||||||||||||
| Allergan PLC (I) | 24,557 | 6,984,748 | |||||||||||||||
| Bristol-Myers Squibb Company | 132,996 | 8,267,031 | |||||||||||||||
| Shares | Value | ||||||||||||||||
| Health care (continued) | |||||||||||||||||
| Pharmaceuticals (continued) | |||||||||||||||||
| Eli Lilly & Company | 48,563 | $3,841,333 | |||||||||||||||
| Ono Pharmaceutical Company, Ltd. | 49,811 | 8,027,686 | |||||||||||||||
| Santen Pharmaceutical Company, Ltd. | 294,123 | 4,698,590 | |||||||||||||||
| Shionogi & Company, Ltd. | 106,936 | 4,666,626 | |||||||||||||||
| The Medicines Company (I) | 75,431 | 2,606,895 | |||||||||||||||
| Industrials 4.0% | 26,961,062 | ||||||||||||||||
| Aerospace and defense 2.1% | |||||||||||||||||
| Orbital ATK, Inc. | 78,187 | 7,054,813 | |||||||||||||||
| Raytheon Company | 56,344 | 7,225,555 | |||||||||||||||
| Construction and engineering 0.5% | |||||||||||||||||
| Vinci SA | 49,618 | 3,361,481 | |||||||||||||||
| Machinery 0.5% | |||||||||||||||||
| KUKA AG (L) | 42,661 | 3,279,816 | |||||||||||||||
| Road and rail 0.9% | |||||||||||||||||
| DSV A/S | 82,340 | 3,204,375 | |||||||||||||||
| East Japan Railway Company | 30,843 | 2,835,022 | |||||||||||||||
| Information technology 33.3% | 224,994,135 | ||||||||||||||||
| Communications equipment 0.4% | |||||||||||||||||
| Harris Corp. | 30,706 | 2,670,501 | |||||||||||||||
| Internet software and services 13.2% | |||||||||||||||||
| Alphabet, Inc., Class A (I) | 38,813 | 29,550,278 | |||||||||||||||
| Facebook, Inc., Class A (I) | 298,891 | 33,538,562 | |||||||||||||||
| GoDaddy, Inc., Class A (I)(L) | 146,049 | 4,453,034 | |||||||||||||||
| Rightmove PLC | 74,921 | 4,274,889 | |||||||||||||||
| Tencent Holdings, Ltd. | 356,218 | 6,692,157 | |||||||||||||||
| United Internet AG | 118,042 | 6,109,079 | |||||||||||||||
| VeriSign, Inc. (I)(L) | 63,328 | 4,787,597 | |||||||||||||||
| IT services 10.3% | |||||||||||||||||
| Accenture PLC, Class A | 66,580 | 7,026,853 | |||||||||||||||
| EPAM Systems, Inc. (I) | 19,344 | 1,448,866 | |||||||||||||||
| ExlService Holdings, Inc. (I) | 89,138 | 3,891,765 | |||||||||||||||
| Global Payments, Inc. | 149,363 | 8,804,949 | |||||||||||||||
| MasterCard, Inc., Class A | 146,231 | 13,018,946 | |||||||||||||||
| Nomura Research Institute, Ltd. | 94,371 | 3,424,537 | |||||||||||||||
| Obic Company, Ltd. | 85,539 | 4,430,909 | |||||||||||||||
| Paysafe Group PLC (I) | 1,524,684 | 8,784,476 | |||||||||||||||
| Visa, Inc., Class A | 175,022 | 13,037,389 | |||||||||||||||
| Wirecard AG (L) | 114,537 | 5,792,231 | |||||||||||||||
| Software 9.4% | |||||||||||||||||
| Activision Blizzard, Inc. | 139,676 | 4,863,518 | |||||||||||||||
| Shares | Value | ||||||||||||||||
| Information technology (continued) | |||||||||||||||||
| Software (continued) | |||||||||||||||||
| Adobe Systems, Inc. (I) | 111,541 | $9,941,649 | |||||||||||||||
| Guidewire Software, Inc. (I) | 140,050 | 7,708,352 | |||||||||||||||
| HubSpot, Inc. (I) | 176,046 | 7,145,707 | |||||||||||||||
| Manhattan Associates, Inc. (I) | 59,306 | 3,418,991 | |||||||||||||||
| Microsoft Corp. | 315,942 | 17,405,245 | |||||||||||||||
| salesforce.com, Inc. (I) | 95,592 | 6,505,992 | |||||||||||||||
| The Sage Group PLC | 703,119 | 6,267,663 | |||||||||||||||
| Materials 1.4% | 9,479,377 | ||||||||||||||||
| Chemicals 0.8% | |||||||||||||||||
| Daicel Corp. | 368,699 | 5,423,958 | |||||||||||||||
| Containers and packaging 0.6% | |||||||||||||||||
| RPC Group PLC | 377,508 | 4,055,419 | |||||||||||||||
| Utilities 1.4% | 9,427,422 | ||||||||||||||||
| Multi-utilities 1.4% | |||||||||||||||||
| CMS Energy Corp. | 69,281 | 2,693,645 | |||||||||||||||
| NiSource, Inc. | 161,267 | 3,388,220 | |||||||||||||||
| WEC Energy Group, Inc. | 60,575 | 3,345,557 | |||||||||||||||
| Yield (%) | Shares | Value | |||||||||||||||
| Securities lending collateral 3.1% | $21,178,568 | ||||||||||||||||
| (Cost $21,178,453) | |||||||||||||||||
| John Hancock Collateral Trust (W) | 0.4110(Y) | 2,116,841 | 21,178,568 | ||||||||||||||
| Par value^ | Value | ||||||||||||||||
| Short-term investments 8.8% | $59,200,000 | ||||||||||||||||
| (Cost $59,200,000) | |||||||||||||||||
| Repurchase agreement 8.8% | 59,200,000 | ||||||||||||||||
| Bank of America Tri-Party Repurchase Agreement dated 1-29-16 at 0.340% to be repurchased at $59,201,677 on 2-1-16, collateralized by $56,320,052 Government National Mortgage Association 4.000% due 2-20-45 (valued at $60,384,001, including interest). | 59,200,000 | 59,200,000 | |||||||||||||||
| Total investments (Cost $623,963,235)† 98.3% | $663,954,355 | ||||||||||||||||
| Other assets and liabilities, net 1.7% | $11,478,535 | ||||||||||||||||
| Total net assets 100.0% | $675,432,890 | ||||||||||||||||
| The percentage shown for each investment category is the total value
of the category as a percentage of the net assets of the fund.
^All par values are denominated in U.S. dollars unless otherwise indicated. |
|||||||||||||||||
| Key to Security Abbreviations and Legend | |||||||||||||||||
| ADR | American Depositary Receipts | ||||||||||||||||
| (I) | Non-income producing security. | ||||||||||||||||
| (L) | A portion of this security is on loan as of 1-31-16. | ||||||||||||||||
| (S) | These securities are exempt from registration under Rule 144A of the Securities Act of 1933. Such securities may be resold, normally to qualified institutional buyers, in transactions exempt from registration. | ||||||||||||||||
| (W) | Investment is an affiliate of the fund, the advisor and/or subadvisor. This security represents the investment of cash collateral received for securities lending. | ||||||||||||||||
| (Y) | The rate shown is the annualized seven-day yield as of 1-31-16. | ||||||||||||||||
| † | At 1-31-16, the aggregate cost of investment securities for federal income tax purposes was $627,521,260. Net unrealized appreciation aggregated $36,433,095, of which $47,147,101 related to appreciated investment securities and $10,714,006 related to depreciated investment securities. | ||||||||||||||||
Financial statements
STATEMENT OF ASSETS AND LIABILITIES 1-31-16 (unaudited)
| Assets | ||||||||||||||||||||||||||||||
| Investments in unaffiliated issuers, at value (Cost $602,784,782) including $20,753,681 of securities loaned | $642,775,787 | |||||||||||||||||||||||||||||
| Investments in affiliated issuers, at value (Cost $21,178,453) | 21,178,568 | |||||||||||||||||||||||||||||
| Total investments, at value (Cost $623,963,235) | 663,954,355 | |||||||||||||||||||||||||||||
| Cash | 78,639 | |||||||||||||||||||||||||||||
| Foreign currency, at value (Cost $3,361,562) | 3,361,564 | |||||||||||||||||||||||||||||
| Receivable for investments sold | 139,015,470 | |||||||||||||||||||||||||||||
| Receivable for fund shares sold | 133,950 | |||||||||||||||||||||||||||||
| Unrealized appreciation on forward foreign currency exchange contracts | 3,432,534 | |||||||||||||||||||||||||||||
| Dividends and interest receivable | 161,960 | |||||||||||||||||||||||||||||
| Receivable for securities lending income | 52,255 | |||||||||||||||||||||||||||||
| Other receivables and prepaid expenses | 34,802 | |||||||||||||||||||||||||||||
| Total assets | 810,225,529 | |||||||||||||||||||||||||||||
| Liabilities | ||||||||||||||||||||||||||||||
| Payable for investments purchased | 109,307,018 | |||||||||||||||||||||||||||||
| Unrealized depreciation on forward foreign currency exchange contracts | 2,177,234 | |||||||||||||||||||||||||||||
| Payable for fund shares repurchased | 1,975,083 | |||||||||||||||||||||||||||||
| Payable upon return of securities loaned | 21,231,398 | |||||||||||||||||||||||||||||
| Payable to affiliates | ||||||||||||||||||||||||||||||
| Accounting and legal services fees | 18,370 | |||||||||||||||||||||||||||||
| Transfer agent fees | 16,796 | |||||||||||||||||||||||||||||
| Trustees' fees | 1,552 | |||||||||||||||||||||||||||||
| Other liabilities and accrued expenses | 65,188 | |||||||||||||||||||||||||||||
| Total liabilities | 134,792,639 | |||||||||||||||||||||||||||||
| Net assets | $675,432,890 | |||||||||||||||||||||||||||||
| Net assets consist of | ||||||||||||||||||||||||||||||
| Paid-in capital | $662,350,235 | |||||||||||||||||||||||||||||
| Accumulated net investment loss | (2,401,807 | ) | ||||||||||||||||||||||||||||
| Accumulated net realized gain (loss) on investments and foreign currency transactions | (25,805,589 | ) | ||||||||||||||||||||||||||||
| Net unrealized appreciation (depreciation) on investments and translation of assets and liabilities in foreign currencies | 41,290,051 | |||||||||||||||||||||||||||||
| Net assets | $675,432,890 | |||||||||||||||||||||||||||||
STATEMENT OF ASSETS AND LIABILITIES (continued)
| Net asset value per share | ||||||||||||||||||
| Based on net asset values and shares outstanding-the fund has an unlimited number of shares authorized with no par value | ||||||||||||||||||
| Class A ($52,591,586 ÷ 4,944,092 shares)1 | $10.64 | |||||||||||||||||
| Class C ($3,195,037 ÷ 292,514 shares)1 | $10.92 | |||||||||||||||||
| Class I ($20,338,362 ÷ 1,854,263 shares) | $10.97 | |||||||||||||||||
| Class NAV ($599,307,905 ÷ 53,817,195 shares) | $11.14 | |||||||||||||||||
| Maximum offering price per share | ||||||||||||||||||
| Class A (net asset value per share ÷ 95%)2 | $11.20 | |||||||||||||||||
| 1 | Redemption price per share is equal to net asset value less any applicable contingent deferred sales charge. | ||||||||||||||||
| 2 | On single retail sales of less than $50,000. On sales of $50,000 or more and on group sales the offering price is reduced. | ||||||||||||||||
STATEMENT OF OPERATIONS For the six months ended 1-31-16 (unaudited)
| Investment income | ||||||||||||||||||||||||
| Dividends | $2,402,814 | |||||||||||||||||||||||
| Securities lending | 160,834 | |||||||||||||||||||||||
| Interest | 22,196 | |||||||||||||||||||||||
| Less foreign taxes withheld | (71,820 | ) | ||||||||||||||||||||||
| Total investment income | 2,514,024 | |||||||||||||||||||||||
| Expenses | ||||||||||||||||||||||||
| Investment management fees | 4,541,023 | |||||||||||||||||||||||
| Distribution and service fees | 105,571 | |||||||||||||||||||||||
| Accounting and legal services fees | 51,029 | |||||||||||||||||||||||
| Transfer agent fees | 56,638 | |||||||||||||||||||||||
| Trustees' fees | 7,247 | |||||||||||||||||||||||
| State registration fees | 33,164 | |||||||||||||||||||||||
| Printing and postage | 7,502 | |||||||||||||||||||||||
| Professional fees | 28,667 | |||||||||||||||||||||||
| Custodian fees | 70,496 | |||||||||||||||||||||||
| Registration and filing fees | 26,263 | |||||||||||||||||||||||
| Other | 9,741 | |||||||||||||||||||||||
| Total expenses | 4,937,341 | |||||||||||||||||||||||
| Less expense reductions | (29,006 | ) | ||||||||||||||||||||||
| Net expenses | 4,908,335 | |||||||||||||||||||||||
| Net investment loss | (2,394,311 | ) | ||||||||||||||||||||||
| Realized and unrealized gain (loss) | ||||||||||||||||||||||||
| Net realized gain (loss) on | ||||||||||||||||||||||||
| Investments in unaffiliated issuers and foreign currency transactions | (17,522,962 | ) | ||||||||||||||||||||||
| Investments in affiliated issuers | (1,122 | ) | ||||||||||||||||||||||
| (17,524,084 | ) | |||||||||||||||||||||||
| Change in net unrealized appreciation (depreciation) of | ||||||||||||||||||||||||
| Investments in unaffiliated issuers and translation of assets and liabilities in foreign currencies | (120,329,007 | ) | ||||||||||||||||||||||
| Investments in affiliated issuers | (137 | ) | ||||||||||||||||||||||
| (120,329,144 | ) | |||||||||||||||||||||||
| Net realized and unrealized loss | (137,853,228 | ) | ||||||||||||||||||||||
| Decrease in net assets from operations | ($140,247,539 | ) | ||||||||||||||||||||||
STATEMENTS OF CHANGES IN NET ASSETS
| Six months ended 1-31-16 | Year ended 7-31-15 | ||||||||||||||||||||||||||||||||||||||||||||
| (unaudited) | |||||||||||||||||||||||||||||||||||||||||||||
| Increase (decrease) in net assets | |||||||||||||||||||||||||||||||||||||||||||||
| From operations | |||||||||||||||||||||||||||||||||||||||||||||
| Net investment loss | ($2,394,311 | ) | ($5,518,116 | ) | |||||||||||||||||||||||||||||||||||||||||
| Net realized gain (loss) | (17,524,084 | ) | 90,774,253 | ||||||||||||||||||||||||||||||||||||||||||
| Change in net unrealized appreciation (depreciation) | (120,329,144 | ) | 92,347,365 | ||||||||||||||||||||||||||||||||||||||||||
| Increase (decrease) in net assets resulting from operations | (140,247,539 | ) | 177,603,502 | ||||||||||||||||||||||||||||||||||||||||||
| Distributions to shareholders | |||||||||||||||||||||||||||||||||||||||||||||
| From net realized gain | |||||||||||||||||||||||||||||||||||||||||||||
| Class A | (7,236,588 | ) | (7,064,030 | ) | |||||||||||||||||||||||||||||||||||||||||
| Class C | (411,214 | ) | (17,531 | ) | |||||||||||||||||||||||||||||||||||||||||
| Class I | (2,737,264 | ) | (4,070,058 | ) | |||||||||||||||||||||||||||||||||||||||||
| Class NAV | (77,283,763 | ) | (106,392,068 | ) | |||||||||||||||||||||||||||||||||||||||||
| Total distributions | (87,668,829 | ) | (117,543,687 | ) | |||||||||||||||||||||||||||||||||||||||||
| From fund share transactions | 33,651,799 | (62,339,874 | ) | ||||||||||||||||||||||||||||||||||||||||||
| Total decrease | (194,264,569 | ) | (2,280,059 | ) | |||||||||||||||||||||||||||||||||||||||||
| Net assets | |||||||||||||||||||||||||||||||||||||||||||||
| Beginning of period | 869,697,459 | 871,977,518 | |||||||||||||||||||||||||||||||||||||||||||
| End of period | $675,432,890 | $869,697,459 | |||||||||||||||||||||||||||||||||||||||||||
| Accumulated net investment loss | ($2,401,807 | ) | ($7,496 | ) | |||||||||||||||||||||||||||||||||||||||||
Financial highlights
| Class A Shares Period ended | 1-31-16 | 1 | 7-31-15 | 7-31-14 | 7-31-13 | 7-31-12 | 7-31-11 | |||||||||||||||||||||||||||||||||||||||||||||||||||||||||||||||||||||||||||||||||||||||||||||||||||||||||||||||
| Per share operating performance | ||||||||||||||||||||||||||||||||||||||||||||||||||||||||||||||||||||||||||||||||||||||||||||||||||||||||||||||||||||||
| Net asset value, beginning of period | $14.47 | $13.76 | $13.15 | $9.65 | $11.33 | $9.86 | ||||||||||||||||||||||||||||||||||||||||||||||||||||||||||||||||||||||||||||||||||||||||||||||||||||||||||||||||
| Net investment loss2 | (0.06 | ) | (0.14 | ) | (0.14 | ) | (0.08 | ) | (0.10 | ) | (0.09 | ) | ||||||||||||||||||||||||||||||||||||||||||||||||||||||||||||||||||||||||||||||||||||||||||||||||||||||||||
| Net realized and unrealized gain (loss) on investments | (2.20 | ) | 2.81 | 2.09 | 3.58 | (1.17 | ) | 1.56 | ||||||||||||||||||||||||||||||||||||||||||||||||||||||||||||||||||||||||||||||||||||||||||||||||||||||||||||||
| Total from investment operations | (2.26 | ) | 2.67 | 1.95 | 3.50 | (1.27 | ) | 1.47 | ||||||||||||||||||||||||||||||||||||||||||||||||||||||||||||||||||||||||||||||||||||||||||||||||||||||||||||||
| Less distributions | ||||||||||||||||||||||||||||||||||||||||||||||||||||||||||||||||||||||||||||||||||||||||||||||||||||||||||||||||||||||
| From net realized gain | (1.57 | ) | (1.96 | ) | (1.34 | ) | — | (0.41 | ) | — | ||||||||||||||||||||||||||||||||||||||||||||||||||||||||||||||||||||||||||||||||||||||||||||||||||||||||||||
| Net asset value, end of period | $10.64 | $14.47 | $13.76 | $13.15 | $9.65 | $11.33 | ||||||||||||||||||||||||||||||||||||||||||||||||||||||||||||||||||||||||||||||||||||||||||||||||||||||||||||||||
| Total return (%)3,4 | (16.74 | ) 5 | 21.46 | 14.86 | 36.27 | (10.93 | ) | 14.91 | ||||||||||||||||||||||||||||||||||||||||||||||||||||||||||||||||||||||||||||||||||||||||||||||||||||||||||||||
| Ratios and supplemental data | ||||||||||||||||||||||||||||||||||||||||||||||||||||||||||||||||||||||||||||||||||||||||||||||||||||||||||||||||||||||
| Net assets, end of period (in millions) | $53 | $66 | $59 | $45 | $51 | $125 | ||||||||||||||||||||||||||||||||||||||||||||||||||||||||||||||||||||||||||||||||||||||||||||||||||||||||||||||||
| Ratios (as a percentage of average net assets): | ||||||||||||||||||||||||||||||||||||||||||||||||||||||||||||||||||||||||||||||||||||||||||||||||||||||||||||||||||||||
| Expenses before reductions | 1.65 | 6 | 1.67 | 1.72 | 1.78 | 1.88 | 1.90 | |||||||||||||||||||||||||||||||||||||||||||||||||||||||||||||||||||||||||||||||||||||||||||||||||||||||||||||||
| Expenses including reductions | 1.64 | 6 | 1.65 | 1.71 | 1.78 | 1.88 | 1.90 | |||||||||||||||||||||||||||||||||||||||||||||||||||||||||||||||||||||||||||||||||||||||||||||||||||||||||||||||
| Net investment loss | (1.00 | ) 6 | (1.05 | ) | (1.03 | ) | (0.69 | ) | (1.04 | ) | (0.79 | ) | ||||||||||||||||||||||||||||||||||||||||||||||||||||||||||||||||||||||||||||||||||||||||||||||||||||||||||
| Portfolio turnover (%) | 133 | 228 | 306 | 391 | 507 | 361 | ||||||||||||||||||||||||||||||||||||||||||||||||||||||||||||||||||||||||||||||||||||||||||||||||||||||||||||||||
| 1 | Six months ended 1-31-16. Unaudited. | ||||||||||||||||||||||||||||||||||||||||||||||||||||||||||||||||||||||||||||||||||
| 2 | Based on average daily shares outstanding. | ||||||||||||||||||||||||||||||||||||||||||||||||||||||||||||||||||||||||||||||||||
| 3 | Does not reflect the effect of sales charges, if any. | ||||||||||||||||||||||||||||||||||||||||||||||||||||||||||||||||||||||||||||||||||
| 4 | Total returns would have been lower had certain expenses not been reduced during the applicable periods. | ||||||||||||||||||||||||||||||||||||||||||||||||||||||||||||||||||||||||||||||||||
| 5 | Not annualized. | ||||||||||||||||||||||||||||||||||||||||||||||||||||||||||||||||||||||||||||||||||
| 6 | Annualized. | ||||||||||||||||||||||||||||||||||||||||||||||||||||||||||||||||||||||||||||||||||
| Class C Shares Period ended | 1-31-16 | 1 | 7-31-15 | 2 | ||||||||||||||||||||||||||||||||||||||||||||||
| Per share operating performance | ||||||||||||||||||||||||||||||||||||||||||||||||||
| Net asset value, beginning of period | $14.86 | $14.94 | ||||||||||||||||||||||||||||||||||||||||||||||||
| Net investment loss3 | (0.11 | ) | (0.27 | ) | ||||||||||||||||||||||||||||||||||||||||||||||
| Net realized and unrealized gain (loss) on investments | (2.26 | ) | 2.15 | |||||||||||||||||||||||||||||||||||||||||||||||
| Total from investment operations | (2.37 | ) | 1.88 | |||||||||||||||||||||||||||||||||||||||||||||||
| Less distributions | ||||||||||||||||||||||||||||||||||||||||||||||||||
| From net realized gain | (1.57 | ) | (1.96 | ) | ||||||||||||||||||||||||||||||||||||||||||||||
| Net asset value, end of period | $10.92 | $14.86 | ||||||||||||||||||||||||||||||||||||||||||||||||
| Total return (%)4,5 | (16.97 | ) 6 | 14.41 | 6 | ||||||||||||||||||||||||||||||||||||||||||||||
| Ratios and supplemental data | ||||||||||||||||||||||||||||||||||||||||||||||||||
| Net assets, end of period (in millions) | $3 | $2 | ||||||||||||||||||||||||||||||||||||||||||||||||
| Ratios (as a percentage of average net assets): | ||||||||||||||||||||||||||||||||||||||||||||||||||
| Expenses before reductions | 2.36 | 7 | 3.39 | 7 | ||||||||||||||||||||||||||||||||||||||||||||||
| Expenses including reductions | 2.35 | 7 | 2.50 | 7 | ||||||||||||||||||||||||||||||||||||||||||||||
| Net investment loss | (1.72 | ) 7 | (2.06 | ) 7 | ||||||||||||||||||||||||||||||||||||||||||||||
| Portfolio turnover (%) | 133 | 228 | 8 | |||||||||||||||||||||||||||||||||||||||||||||||
| 1 | Six months ended 1-31-16. Unaudited. | ||||||||||||||||||||||||||||||||||||||||||||||||||||||||||
| 2 | The inception date for Class C shares is 8-28-14. | ||||||||||||||||||||||||||||||||||||||||||||||||||||||||||
| 3 | Based on average daily shares outstanding. | ||||||||||||||||||||||||||||||||||||||||||||||||||||||||||
| 4 | Total returns would have been lower had certain expenses not been reduced during the applicable periods. | ||||||||||||||||||||||||||||||||||||||||||||||||||||||||||
| 5 | Does not reflect the effect of sales charges, if any. | ||||||||||||||||||||||||||||||||||||||||||||||||||||||||||
| 6 | Not annualized. | ||||||||||||||||||||||||||||||||||||||||||||||||||||||||||
| 7 | Annualized. | ||||||||||||||||||||||||||||||||||||||||||||||||||||||||||
| 8 | The portfolio turnover is shown for the period from 8-1-14 to 7-31-15. | ||||||||||||||||||||||||||||||||||||||||||||||||||||||||||
| Class I Shares Period ended | 1-31-16 | 1 | 7-31-15 | 7-31-14 | 7-31-13 | 7-31-12 | 7-31-11 | |||||||||||||||||||||||||||||||||||||||||||||||||||||||||||||||||||||||||||||||||||||||||||||||||||||||||||||||
| Per share operating performance | ||||||||||||||||||||||||||||||||||||||||||||||||||||||||||||||||||||||||||||||||||||||||||||||||||||||||||||||||||||||
| Net asset value, beginning of period | $14.84 | $14.03 | $13.35 | $9.77 | $11.42 | $9.89 | ||||||||||||||||||||||||||||||||||||||||||||||||||||||||||||||||||||||||||||||||||||||||||||||||||||||||||||||||
| Net investment loss2 | (0.04 | ) | (0.10 | ) | (0.11 | ) | (0.04 | ) | (0.07 | ) | (0.04 | ) | ||||||||||||||||||||||||||||||||||||||||||||||||||||||||||||||||||||||||||||||||||||||||||||||||||||||||||
| Net realized and unrealized gain (loss) on investments | (2.26 | ) | 2.87 | 2.13 | 3.62 | (1.17 | ) | 1.57 | ||||||||||||||||||||||||||||||||||||||||||||||||||||||||||||||||||||||||||||||||||||||||||||||||||||||||||||||
| Total from investment operations | (2.30 | ) | 2.77 | 2.02 | 3.58 | (1.24 | ) | 1.53 | ||||||||||||||||||||||||||||||||||||||||||||||||||||||||||||||||||||||||||||||||||||||||||||||||||||||||||||||
| Less distributions | ||||||||||||||||||||||||||||||||||||||||||||||||||||||||||||||||||||||||||||||||||||||||||||||||||||||||||||||||||||||
| From net realized gain | (1.57 | ) | (1.96 | ) | (1.34 | ) | — | (0.41 | ) | — | ||||||||||||||||||||||||||||||||||||||||||||||||||||||||||||||||||||||||||||||||||||||||||||||||||||||||||||
| Net asset value, end of period | $10.97 | $14.84 | $14.03 | $13.35 | $9.77 | $11.42 | ||||||||||||||||||||||||||||||||||||||||||||||||||||||||||||||||||||||||||||||||||||||||||||||||||||||||||||||||
| Total return (%)3 | (16.51 | ) 4 | 21.79 | 15.17 | 36.64 | (10.57 | ) | 15.47 | ||||||||||||||||||||||||||||||||||||||||||||||||||||||||||||||||||||||||||||||||||||||||||||||||||||||||||||||
| Ratios and supplemental data | ||||||||||||||||||||||||||||||||||||||||||||||||||||||||||||||||||||||||||||||||||||||||||||||||||||||||||||||||||||||
| Net assets, end of period (in millions) | $20 | $44 | $30 | $18 | $17 | $63 | ||||||||||||||||||||||||||||||||||||||||||||||||||||||||||||||||||||||||||||||||||||||||||||||||||||||||||||||||
| Ratios (as a percentage of average net assets): | ||||||||||||||||||||||||||||||||||||||||||||||||||||||||||||||||||||||||||||||||||||||||||||||||||||||||||||||||||||||
| Expenses before reductions | 1.33 | 5 | 1.35 | 1.44 | 1.48 | 1.55 | 1.49 | |||||||||||||||||||||||||||||||||||||||||||||||||||||||||||||||||||||||||||||||||||||||||||||||||||||||||||||||
| Expenses including reductions | 1.32 | 5 | 1.35 | 1.43 | 1.47 | 1.51 | 1.49 | |||||||||||||||||||||||||||||||||||||||||||||||||||||||||||||||||||||||||||||||||||||||||||||||||||||||||||||||
| Net investment loss | (0.65 | ) 5 | (0.74 | ) | (0.75 | ) | (0.39 | ) | (0.69 | ) | (0.37 | ) | ||||||||||||||||||||||||||||||||||||||||||||||||||||||||||||||||||||||||||||||||||||||||||||||||||||||||||
| Portfolio turnover (%) | 133 | 228 | 306 | 391 | 507 | 361 | ||||||||||||||||||||||||||||||||||||||||||||||||||||||||||||||||||||||||||||||||||||||||||||||||||||||||||||||||
| 1 | Six months ended 1-31-16. Unaudited. | ||||||||||||||||||||||||||||||||||||||||||||||||||||||||||||||||||||||||||||||||||
| 2 | Based on average daily shares outstanding. | ||||||||||||||||||||||||||||||||||||||||||||||||||||||||||||||||||||||||||||||||||
| 3 | Total returns would have been lower had certain expenses not been reduced during the applicable periods. | ||||||||||||||||||||||||||||||||||||||||||||||||||||||||||||||||||||||||||||||||||
| 4 | Not annualized. | ||||||||||||||||||||||||||||||||||||||||||||||||||||||||||||||||||||||||||||||||||
| 5 | Annualized. | ||||||||||||||||||||||||||||||||||||||||||||||||||||||||||||||||||||||||||||||||||
| Class NAV Shares Period ended | 1-31-16 | 1 | 7-31-15 | 7-31-14 | 7-31-13 | 7-31-12 | 7-31-11 | |||||||||||||||||||||||||||||||||||||||||||||||||||||||||||||||||||||||||||||||||||||||||||||||||||||||||||||||
| Per share operating performance | ||||||||||||||||||||||||||||||||||||||||||||||||||||||||||||||||||||||||||||||||||||||||||||||||||||||||||||||||||||||
| Net asset value, beginning of period | $15.03 | $14.16 | $13.44 | $9.81 | $11.45 | $9.90 | ||||||||||||||||||||||||||||||||||||||||||||||||||||||||||||||||||||||||||||||||||||||||||||||||||||||||||||||||
| Net investment loss2 | (0.04 | ) | (0.08 | ) | (0.08 | ) | (0.02 | ) | (0.04 | ) | (0.03 | ) | ||||||||||||||||||||||||||||||||||||||||||||||||||||||||||||||||||||||||||||||||||||||||||||||||||||||||||
| Net realized and unrealized gain (loss) on investments | (2.28 | ) | 2.91 | 2.14 | 3.65 | (1.19 | ) | 1.58 | ||||||||||||||||||||||||||||||||||||||||||||||||||||||||||||||||||||||||||||||||||||||||||||||||||||||||||||||
| Total from investment operations | (2.32 | ) | 2.83 | 2.06 | 3.63 | (1.23 | ) | 1.55 | ||||||||||||||||||||||||||||||||||||||||||||||||||||||||||||||||||||||||||||||||||||||||||||||||||||||||||||||
| Less distributions | ||||||||||||||||||||||||||||||||||||||||||||||||||||||||||||||||||||||||||||||||||||||||||||||||||||||||||||||||||||||
| From net realized gain | (1.57 | ) | (1.96 | ) | (1.34 | ) | — | (0.41 | ) | — | ||||||||||||||||||||||||||||||||||||||||||||||||||||||||||||||||||||||||||||||||||||||||||||||||||||||||||||
| Net asset value, end of period | $11.14 | $15.03 | $14.16 | $13.44 | $9.81 | $11.45 | ||||||||||||||||||||||||||||||||||||||||||||||||||||||||||||||||||||||||||||||||||||||||||||||||||||||||||||||||
| Total return (%)3 | (16.51 | ) 4 | 22.02 | 15.38 | 37.00 | (10.45 | ) | 15.66 | ||||||||||||||||||||||||||||||||||||||||||||||||||||||||||||||||||||||||||||||||||||||||||||||||||||||||||||||
| Ratios and supplemental data | ||||||||||||||||||||||||||||||||||||||||||||||||||||||||||||||||||||||||||||||||||||||||||||||||||||||||||||||||||||||
| Net assets, end of period (in millions) | $599 | $758 | $783 | $606 | $433 | $535 | ||||||||||||||||||||||||||||||||||||||||||||||||||||||||||||||||||||||||||||||||||||||||||||||||||||||||||||||||
| Ratios (as a percentage of average net assets): | ||||||||||||||||||||||||||||||||||||||||||||||||||||||||||||||||||||||||||||||||||||||||||||||||||||||||||||||||||||||
| Expenses before reductions | 1.23 | 5 | 1.21 | 1.22 | 1.24 | 1.32 | 1.37 | |||||||||||||||||||||||||||||||||||||||||||||||||||||||||||||||||||||||||||||||||||||||||||||||||||||||||||||||
| Expenses including reductions | 1.22 | 5 | 1.20 | 1.21 | 1.23 | 1.32 | 1.37 | |||||||||||||||||||||||||||||||||||||||||||||||||||||||||||||||||||||||||||||||||||||||||||||||||||||||||||||||
| Net investment loss | (0.57 | ) 5 | (0.59 | ) | (0.54 | ) | (0.16 | ) | (0.46 | ) | (0.31 | ) | ||||||||||||||||||||||||||||||||||||||||||||||||||||||||||||||||||||||||||||||||||||||||||||||||||||||||||
| Portfolio turnover (%) | 133 | 228 | 306 | 391 | 507 | 361 | ||||||||||||||||||||||||||||||||||||||||||||||||||||||||||||||||||||||||||||||||||||||||||||||||||||||||||||||||
| 1 | Six months ended 1-31-16. Unaudited. | ||||||||||||||||||||||||||||||||||||||||||||||||||||||||||||||||||||||||||||||||||
| 2 | Based on average daily shares outstanding. | ||||||||||||||||||||||||||||||||||||||||||||||||||||||||||||||||||||||||||||||||||
| 3 | Total returns would have been lower had certain expenses not been reduced during the applicable periods. | ||||||||||||||||||||||||||||||||||||||||||||||||||||||||||||||||||||||||||||||||||
| 4 | Not annualized. | ||||||||||||||||||||||||||||||||||||||||||||||||||||||||||||||||||||||||||||||||||
| 5 | Annualized. | ||||||||||||||||||||||||||||||||||||||||||||||||||||||||||||||||||||||||||||||||||
Note 1 — Organization
John Hancock Technical Opportunities Fund (the fund) is a series of John Hancock Funds II (the Trust), an open-end management investment company organized as a Massachusetts business trust and registered under the Investment Company Act of 1940, as amended (the 1940 Act). The investment objective of the fund is to seek long-term capital appreciation.
The fund may offer multiple classes of shares. The shares currently offered are detailed in the Statement of assets and liabilities. Class A and Class C shares are offered to all investors. Class I shares are offered to institutions and certain investors. Class NAV shares are offered to John Hancock affiliated funds of funds and certain 529 plans. Shareholders of each class have exclusive voting rights to matters that affect that class. The distribution and service fees, if any, and transfer agent fees for each class may differ.
Note 2 — Significant accounting policies
The financial statements have been prepared in conformity with accounting principles generally accepted in the United States of America (US GAAP), which require management to make certain estimates and assumptions as of the date of the financial statements. Actual results could differ from those estimates and those differences could be significant. The fund qualifies as an investment company under Topic 946 of Accounting Standards Codification of US GAAP.
Events or transactions occurring after the end of the fiscal period through the date that the financial statements were issued have been evaluated in the preparation of the financial statements. The following summarizes the significant accounting policies of the fund:
Security valuation. Investments are stated at value as of the close of regular trading on the New York Stock Exchange (NYSE), normally at 4:00 p.m., Eastern Time. In order to value the securities, the fund uses the following valuation techniques: Equity securities held by the fund are valued at the last sale price or official closing price on the exchange or principal market where the security was acquired or most likely will be sold. In the event there were no sales during the day or closing prices are not available, the securities are valued using the last available bid price. Investments by the fund in open-end mutual funds, including John Hancock Collateral Trust (JHCT), are valued at their respective net asset values each business day. Foreign securities and currencies, including forward foreign currency contracts, are valued in U.S. dollars, based on foreign currency exchange rates supplied by an independent pricing vendor. Securities that trade only in the over-the-counter (OTC) market are valued using bid prices.
Other portfolio securities and assets, for which reliable market quotations are not readily available, are valued at fair value as determined in good faith by the fund's Pricing Committee following procedures established by the Board of Trustees. The frequency with which these fair valuation procedures are used cannot be predicted and fair value of securities may differ significantly from the value that would have been used had a ready market for such securities existed. Trading in foreign securities may be completed before the daily close of trading on the NYSE. Significant events at the issuer or market level may affect the values of securities between the time when the valuation of the securities is generally determined and the close of the NYSE. If a significant event occurs, these securities may be fair valued, as determined in good faith by the fund's Pricing Committee, following procedures established by the Board of Trustees. The fund uses fair value adjustment factors provided by an independent pricing vendor to value certain foreign securities in order to adjust for events that may occur between the close of foreign exchanges or markets and the close of the NYSE.
The fund uses a three-tier hierarchy to prioritize the pricing assumptions, referred to as inputs, used in valuation techniques to measure fair value. Level 1 includes securities valued using quoted prices in active markets for identical securities. Level 2 includes securities valued using other significant observable inputs. Observable inputs may include quoted prices for similar securities, interest rates, prepayment speeds and credit risk. Prices for securities valued using these inputs are received from independent pricing vendors and brokers and are based on an evaluation of the inputs described. Level 3 includes securities valued using significant unobservable inputs when market prices are not readily available or reliable, including the fund's own assumptions in determining the fair value of investments. Factors used in determining value may include market or issuer specific events or trends, changes in interest rates and credit quality. The inputs or methodology used for valuing
securities are not necessarily an indication of the risks associated with investing in those securities. Changes in valuation techniques and related inputs may result in transfers into or out of an assigned level within the disclosure hierarchy.
The following is a summary of the values by input classification of the fund's investments as of January 31, 2016, by major security category or type:
| Total value at 1-31-16 |
Level 1 quoted price |
Level 2 significant observable inputs |
Level 3 significant unobservable inputs |
||
| Common stocks | |||||
| Consumer discretionary | $143,184,941 | $96,699,199 | $46,485,742 | — | |
| Consumer staples | 43,642,594 | 37,765,107 | 5,877,487 | — | |
| Energy | 6,978,237 | 6,978,237 | — | — | |
| Financials | 57,717,291 | 35,086,105 | 22,631,186 | — | |
| Health care | 61,190,728 | 34,056,362 | 27,134,366 | — | |
| Industrials | 26,961,062 | 14,280,368 | 12,680,694 | — | |
| Information technology | 224,994,135 | 179,218,194 | 45,775,941 | — | |
| Materials | 9,479,377 | — | 9,479,377 | — | |
| Utilities | 9,427,422 | 9,427,422 | — | — | |
| Securities lending collateral | 21,178,568 | 21,178,568 | — | — | |
| Short-term investments | 59,200,000 | — | 59,200,000 | — | |
| Total investments in securities | $663,954,355 | $434,689,562 | $229,264,793 | — | |
| Other financial instruments | |||||
| Forward foreign currency contracts | $1,255,300 | — | $1,255,300 | — | |
Repurchase agreements. The fund may enter into repurchase agreements. When the fund enters into a repurchase agreement, it receives collateral that is held in a segregated account by the fund's custodian, or for tri-party repurchase agreements, collateral is held at a third-party custodian bank in a segregated account for the benefit of the fund. The collateral amount is marked-to-market and monitored on a daily basis to ensure that the collateral held is in an amount not less than the principal amount of the repurchase agreement plus any accrued interest. Collateral received by the fund for repurchase agreements is disclosed in the Fund's investments as part of the caption related to the repurchase agreement.
Repurchase agreements are typically governed by the terms and conditions of the Master Repurchase Agreement and/or Global Master Repurchase Agreement (collectively, MRA). Upon an event of default, the non-defaulting party may close out all transactions traded under the MRA and net amounts owed. Absent an event of default, assets and liabilities resulting from repurchase agreements are not offset in the Statement of assets and liabilities. In the event of a default by the counterparty, realization of the collateral proceeds could be delayed, during which time the collateral value may decline or the counterparty may have insufficient assets to pay back claims resulting from close-out of the transactions.
Security transactions and related investment income. Investment security transactions are accounted for on a trade date plus one basis for daily net asset value calculations. However, for financial reporting purposes, investment transactions are reported on trade date. Dividend income is recorded on the ex-date, except for dividends of foreign securities where the dividend may not be known until after the ex-date. In those cases, dividend income, net of withholding taxes, is recorded when the fund becomes aware of the dividends. Interest income is accrued as earned. Foreign taxes are provided for based on the fund's understanding of the tax rules and rates that exist in the foreign markets in which it invests. Gains and losses on securities sold are determined on the basis of identified cost and may include proceeds from litigation.
Securities lending. The fund may lend its securities to earn additional income. The fund receives cash collateral from the borrower in an amount not less than the market value of the loaned securities. The fund will invest its collateral in JHCT, an affiliate of the fund, which has a floating net asset value and is registered with the Securities and Exchange Commission as an investment company. JHCT invests cash received as collateral as part of the securities lending program in short-term
money market investments. The fund will receive the benefit of any gains and bear any losses generated by JHCT with respect to the cash collateral.
The fund has the right to recall loaned securities on demand. If a borrower fails to return loaned securities when due, then the lending agent is responsible and indemnifies the fund for the lent securities. The lending agent uses the collateral received from the borrower to purchase replacement securities of the same issue, type, class and series of the loaned securities. If the value of the collateral is less than the purchase cost of replacement securities, the lending agent is responsible for satisfying the shortfall but only to the extent that the shortfall is not due to any decrease in the value of JHCT.
Although the risk of the loss of the securities lent is mitigated by receiving collateral from the borrower and through lending agent indemnification, the fund could experience a delay in recovering securities or could experience a lower than expected return if the borrower fails to return the securities on a timely basis. The fund may receive compensation for lending its securities by retaining a portion of the return on the investment of the collateral and compensation from fees earned from borrowers of the securities. Net income received from JHCT is a component of securities lending income as recorded on the Statement of operations.
Obligations to repay collateral received by the fund are shown on the Statement of assets and liabilities as Payable upon return of securities loaned and are secured by the loaned securities. As of January 31, 2016, the fund loaned common stocks valued at $20,753,681 and received $21,231,398 of cash collateral.
Foreign currency translation. Assets, including investments and liabilities denominated in foreign currencies, are translated into U.S. dollar values each day at the prevailing exchange rate. Purchases and sales of securities, income and expenses are translated into U.S. dollars at the prevailing exchange rate on the date of the transaction. The effect of changes in foreign currency exchange rates on the value of securities is reflected as a component of the realized and unrealized gains (losses) on investments.
Funds that invest internationally generally carry more risk than funds that invest strictly in U.S. securities. These risks are heightened for investments in emerging markets. Risks can result from differences in economic and political conditions, regulations, market practices (including higher transaction costs), accounting standards and other factors. Foreign investments are also subject to a decline in the value of a foreign currency versus the U.S. dollar, which reduces the dollar value of securities denominated in that currency.
Foreign taxes.The fund may be subject to withholding tax on income and/or capital gains or repatriation taxes imposed by certain countries in which the fund invests. Taxes are accrued based upon investment income, realized gains or unrealized appreciation.
Line of credit. The fund may borrow from banks for temporary or emergency purposes, including meeting redemption requests that otherwise might require the untimely sale of securities. Pursuant to the fund's custodian agreement, the custodian may loan money to the fund to make properly authorized payments. The fund is obligated to repay the custodian for any overdraft, including any related costs or expenses. The custodian may have a lien, security interest or security entitlement in any fund property that is not otherwise segregated or pledged, to the extent of any overdraft, and to the maximum extent permitted by law.
The fund and other affiliated funds have entered into a syndicated line of credit agreement, with Citibank, N.A. as the administrative agent, that enables them to participate in a $750 million unsecured committed line of credit. A commitment fee, payable at the end of each calendar quarter, based on the average daily unused portion of the effective line of credit, is charged to each participating fund on a pro rata basis and is reflected in Other expenses on the Statement of operations. Commitment fees for the six months ended January 31, 2016 were $501. For the six months ended January 31, 2016, the fund had no borrowings under the line of credit.
Expenses. Within the John Hancock group of funds complex, expenses that are directly attributable to an individual fund are allocated to such fund. Expenses that are not readily attributable to a specific fund are allocated among all funds in an equitable manner, taking into consideration, among other things, the nature and type of expense and the fund's relative net
assets. Expense estimates are accrued in the period to which they relate and adjustments are made when actual amounts are known.
Class allocations. Income, common expenses and realized and unrealized gains (losses) are determined at the fund level and allocated daily to each class of shares based on the net assets of the class. Class-specific expenses, such as distribution and service fees, if any, and transfer agent fees, are calculated daily for each class, based on the net asset value of the class and the applicable specific expense rates.
Federal income taxes. The fund intends to continue to qualify as a regulated investment company by complying with the applicable provisions of the Internal Revenue Code and will not be subject to federal income tax on taxable income that is distributed to shareholders. Therefore, no federal income tax provision is required.
As of July 31, 2015, the fund had no uncertain tax positions that would require financial statement recognition, derecognition or disclosure. The fund's federal tax returns are subject to examination by the Internal Revenue Service for a period of three years.
Distribution of income and gains. Distributions to shareholders from net investment income and net realized gains, if any, are recorded on the ex-date. The fund generally declares and pays dividends and capital gain distributions, if any, annually.
Distributions paid by the fund with respect to each class of shares are calculated in the same manner, at the same time and in the same amount, except for the effect of class level expenses that may be applied differently to each class.
Such distributions, on a tax basis, are determined in conformity with income tax regulations, which may differ from US GAAP.
Capital accounts within the financial statements are adjusted for permanent book-tax differences. These adjustments have no impact on net assets or the results of operations. Temporary book-tax differences, if any, will reverse in a subsequent period. Book-tax differences are primarily attributable to wash sale loss deferrals and net operating losses.
Note 3 — Derivative Instruments
The fund may invest in derivatives in order to meet its investment objective. Derivatives include a variety of different instruments that may be traded in the OTC market, on a regulated exchange or through a clearing facility. The risks in using derivatives vary depending upon the structure of the instruments, including the use of leverage, optionality, the liquidity or lack of liquidity of the contract, the creditworthiness of the counterparty or clearing organization and the volatility of the position. Some derivatives involve risks that are potentially greater than the risks associated with investing directly in the referenced securities or other referenced underlying instrument. Specifically, the fund is exposed to the risk that the counterparty to an OTC derivatives contract will be unable or unwilling to make timely settlement payments or otherwise honor its obligations. OTC derivatives transactions typically can only be closed out with the other party to the transaction.
Forward foreign currency contracts are typically traded through the OTC market. Certain forwards are regulated by the Commodity Futures Trading Commission (the CFTC) as swaps. Derivative counterparty risk is managed through an ongoing evaluation of the creditworthiness of all potential counterparties and, if applicable, designated clearing organizations. The fund attempts to reduce its exposure to counterparty risk for derivatives traded in the OTC market, whenever possible, by entering into an International Swaps and Derivatives Association (ISDA) Master Agreement with each of its OTC counterparties. The ISDA gives each party to the agreement the right to terminate all transactions traded under the agreement if there is certain deterioration in the credit quality or contractual default of the other party, as defined in the ISDA. Upon an event of default or a termination of the ISDA, the non-defaulting party has the right to close out all transactions and to net amounts owed.
As defined by the ISDA, the fund may have collateral agreements with certain counterparties to mitigate counterparty risk on OTC derivatives. Subject to established minimum levels, collateral for OTC transactions is generally determined based on the net aggregate unrealized gain or loss on contracts with a particular counterparty. Collateral pledged to the fund is held in a segregated account by a third-party agent or held by the custodian bank for the benefit of the fund and can be in the form of cash or debt securities issued by the U.S. government or related agencies; collateral posted by the fund for OTC transactions is
held in a segregated account at the fund's custodian and is noted in the accompanying Fund's investments, or if cash is posted, on the Statement of assets and liabilities. The fund's maximum risk of loss due to counterparty risk is equal to the asset value of outstanding contracts offset by collateral received.
Forward foreign currency contracts. A forward foreign currency contract is an agreement between two parties to buy and sell specific currencies at a price that is set on the date of the contract. The forward contract calls for delivery of the currencies on a future date that is specified in the contract. Risks related to the use of forwards include the possible failure of counterparties to meet the terms of the forward agreement, the failure of the counterparties to timely post collateral if applicable, the risk that currency movements will not favor the fund thereby reducing the fund's total return, and the potential for losses in excess of the amounts recognized on the Statement of assets and liabilities.
The market value of a forward foreign currency contract fluctuates with changes in foreign currency exchange rates. Forward foreign currency contracts are marked-to-market daily and the change in value is recorded by the fund as an unrealized gain or loss. Realized gains or losses, equal to the difference between the value of the contract at the time it was opened and the value at the time it was closed, are recorded upon delivery or receipt of the currency or settlement with the counterparty.
The fund used forward foreign currency contracts to manage against anticipated changes in currency exchange rates. During the six months ended January 31, 2016, the fund held forward foreign currency contracts with USD notional values ranging up to approximately $330.4 million, as measured at each quarter end. The following table summarizes the contracts held at January 31, 2016:
| Contract to buy | Contract to sell | Counterparty | Contractual settlement date |
Unrealized appreciation |
Unrealized depreciation |
Net unrealized appreciation/ (depreciation) |
||||||||||||||||||||||||||
| CHF | 2,260,000 | USD | 2,249,719 | Bank of Montreal | 3/16/2016 | — | ($39,591 | ) | ($39,591 | ) | ||||||||||||||||||||||
| DKK | 6,960,000 | USD | 1,016,504 | Bank of Montreal | 3/16/2016 | — | (4,954 | ) | (4,954 | ) | ||||||||||||||||||||||
| EUR | 6,170,000 | USD | 6,726,164 | Bank of Montreal | 3/16/2016 | — | (34,888 | ) | (34,888 | ) | ||||||||||||||||||||||
| EUR | 3,060,000 | USD | 3,347,120 | Royal Bank of Scotland PLC | 3/16/2016 | — | (28,594 | ) | (28,594 | ) | ||||||||||||||||||||||
| EUR | 4,590,000 | USD | 5,000,571 | HSBC Bank USA | 3/16/2016 | — | (22,782 | ) | (22,782 | ) | ||||||||||||||||||||||
| GBP | 4,165,000 | USD | 5,923,205 | HSBC Bank USA | 3/16/2016 | $11,939 | — | 11,939 | ||||||||||||||||||||||||
| JPY | 2,502,300,000 | USD | 21,289,398 | Bank of Montreal | 3/16/2016 | — | (599,645 | ) | (599,645 | ) | ||||||||||||||||||||||
| JPY | 1,536,500,000 | USD | 12,701,769 | Commonwealth Bank of Australia Sydney |
3/16/2016 | 2,465 | — | 2,465 | ||||||||||||||||||||||||
| JPY | 1,023,800,000 | USD | 8,421,721 | JPMorgan Chase Bank N.A. | 3/16/2016 | 43,359 | — | 43,359 | ||||||||||||||||||||||||
| JPY | 553,000,000 | USD | 4,713,001 | Royal Bank of Scotland PLC | 3/16/2016 | — | (140,634 | ) | (140,634 | ) | ||||||||||||||||||||||
| JPY | 2,359,900,000 | USD | 19,628,555 | Standard Chartered Bank | 3/16/2016 | — | (116,207 | ) | (116,207 | ) | ||||||||||||||||||||||
| USD | 14,131,836 | CHF | 13,920,000 | Credit Suisse International | 3/16/2016 | 519,012 | — | 519,012 | ||||||||||||||||||||||||
| USD | 10,058,359 | DKK | 68,280,000 | UBS AG | 3/16/2016 | 134,711 | — | 134,711 | ||||||||||||||||||||||||
| USD | 51,188,159 | EUR | 46,580,000 | Citibank N.A. | 3/16/2016 | 672,821 | — | 672,821 | ||||||||||||||||||||||||
| USD | 4,081,557 | EUR | 3,765,000 | Commonwealth Bank of Australia Sydney |
3/16/2016 | — | (1,531 | ) | (1,531 | ) | ||||||||||||||||||||||
| USD | 4,049,092 | EUR | 3,690,000 | JPMorgan Chase Bank N.A. | 3/16/2016 | 47,341 | — | 47,341 | ||||||||||||||||||||||||
| USD | 27,190,264 | GBP | 17,905,000 | Citibank N.A. | 3/16/2016 | 1,675,560 | — | 1,675,560 | ||||||||||||||||||||||||
| USD | 2,798,353 | GBP | 1,965,000 | Commonwealth Bank of Australia Sydney |
3/16/2016 | — | (1,781 | ) | (1,781 | ) | ||||||||||||||||||||||
| USD | 6,467,095 | GBP | 4,310,000 | JPMorgan Chase Bank N.A. | 3/16/2016 | 325,326 | — | 325,326 | ||||||||||||||||||||||||
| USD | 119,439,521 | JPY | 14,589,000,000 | UBS AG | 3/16/2016 | — | (1,186,627 | ) | (1,186,627 | ) | ||||||||||||||||||||||
| $3,432,534 | ($2,177,234 | ) | $1,255,300 | |||||||||||||||||||||||||||||
| Currency abbreviations: | |||
| CHF | Swiss Franc | GBP | British Pound |
| DKK | Danish Krone | JPY | Japanese Yen |
| EUR | Euro | USD | US Dollar |
Fair value of derivative instruments by risk category
The table below summarizes the fair value of derivatives held by the fund at January 31, 2016 by risk category:
| Risk | Statement of assets and liabilities location |
Financial instruments location |
Asset derivatives fair value |
Liabilities derivatives fair value |
||||||||||
| Foreign currency | Unrealized appreciation/depreciation on forward foreign currency exchange contracts |
Forward foreign currency contracts |
$3,432,534 | ($2,177,234 | ) |
Effect of derivative instruments on the Statement of operations
The table below summarizes the net realized gain (loss) included in the net increase (decrease) in net assets from operations, classified by derivative instrument and risk category, for the six months ended January 31, 2016:
| Risk | Statement of operations location | Investments and foreign currency transactions* |
| Foreign currency | Net realized gain (loss) | $2,406,776 |
*Realized gain/loss associated with forward foreign currency contracts is included in this caption on the Statement of operations.
The table below summarizes the net change in unrealized appreciation (depreciation) included in the net increase (decrease) in net assets from operations, classified by derivative instrument and risk category, or the six months ended January 31, 2016:
| Risk | Statement of operations location | Investments and translation of assets and liabilities in foreign currencies* |
| Foreign currency | Change in unrealized appreciation (depreciation) | $1,255,300 |
*Change in unrealized appreciation/depreciation associated with forward foreign currency contracts is included in this caption of the Statement of operations.
Note 4 — Guarantees and indemnifications
Under the Trust's organizational documents, its Officers and Trustees are indemnified against certain liabilities arising out of the performance of their duties to the Trust, including the fund. Additionally, in the normal course of business, the fund enters into contracts with service providers that contain general indemnification clauses. The fund's maximum exposure under these arrangements is unknown, as this would involve future claims that may be made against the fund that have not yet occurred. The risk of material loss from such claims is considered remote.
Note 5 — Fees and transactions with affiliates
John Hancock Advisers, LLC (the Advisor) serves as investment advisor for the fund. John Hancock Funds, LLC (the Distributor), an affiliate of the Advisor, serves as principal underwriter of the fund. The Advisor and the Distributor are indirect, wholly owned subsidiaries of Manulife Financial Corporation (MFC).
Management fee. The fund has an investment management agreement with the Advisor under which the fund pays a daily management fee to the Advisor equivalent, on an annual basis, to the sum of: a) 1.20% of the first $250 million of the fund's average daily net assets and b) 1.15% of the fund's average daily net assets in excess of $250 million. The Advisor has a subadvisory agreement with Wellington Management Company LLP. The fund is not responsible for payment of the subadvisory fees.
The Advisor has contractually agreed to waive a portion of its management fee and/or reimburse expenses for certain funds of the John Hancock group of funds complex, including the fund (the participating portfolios). This waiver is based upon aggregate net assets of all the participating portfolios. The amount of the reimbursement is calculated daily and allocated among all the participating portfolios in proportion to the daily net assets of each fund. During the six months ended January 31, 2016, this waiver amounted to 0.01% of the fund's average net assets on an annualized basis. This arrangement may be amended or terminated at any time by the Advisor upon notice to the fund and with the approval of the Board of Trustees.
Prior to December 1, 2015, the Advisor contractually agreed to reduce its management fee or, if necessary, make payment to Class C shares to the extent that expenses of Class C shares exceeded 2.50% of average annual net assets in an amount equal to the amount by which expenses of the share class exceed the class expense limitation. Expenses means all fund-level and class-specific operating expenses, excluding taxes, brokerage commissions, interest expense, underlying fund expenses, litigation and indemnification expenses and other extraordinary expenses not incurred in the ordinary course of the fund's business, and short dividend expense.
The expense reductions described above amounted to the following for the six months ended January 31, 2016:
| Class | Expense Reduction | Class | Expense Reduction | |
| Class A | $2,262 | Class NAV | $25,459 | |
| Class C | 108 | Total | $29,006 | |
| Class I | 1,177 |
The investment management fees, including the impact of the waivers and reimbursements as described above, incurred for the six months ended January 31, 2016 were equivalent to a net annual effective rate of 1.16% of the fund's average daily net assets.
Accounting and legal services. Pursuant to a service agreement, the fund reimburses the Advisor for all expenses associated with providing the administrative, financial, legal, accounting and recordkeeping services to the fund, including the preparation of all tax returns, periodic reports to shareholders and regulatory reports, among other services. These expenses are allocated to each share class based on its relative net assets at the time the expense was incurred. These accounting and legal services fees incurred for the six months ended January 31, 2016 amounted to an annual rate of 0.01% of the fund's average daily net assets.
Distribution and service plans. The fund has a distribution agreement with the Distributor. The fund has adopted distribution and service plans with respect to Class A and Class C shares pursuant to Rule 12b-1 under the 1940 Act, to pay the Distributor for services provided as the distributor of shares of the fund. The fund may pay up to the following contractual rates of distribution and service fees under these arrangements, expressed as an annual percentage of average daily net assets for each class of the fund's shares:
| Class | Rule 12b-1 Fee |
| Class A | 0.30% |
| Class C | 1.00% |
Sales charges. Class A shares are assessed up-front sales charges, which resulted in payments to the Distributor amounting to $66,732 for the six months ended January 31, 2016. Of this amount, $10,783 was retained and used for printing prospectuses, advertising, sales literature and other purposes, $54,272 was paid as sales commissions to broker-dealers and $1,677 was paid as sales commissions to sales personnel of Signator Investors, Inc., a broker-dealer affiliate of the Advisor.
Class A and Class C shares may be subject to contingent deferred sales charges (CDSCs). Certain Class A shares that are acquired through purchases of $1 million or more and are redeemed within one year of purchase are subject to a 1.00% sales charge. Class C shares that are redeemed within one year of purchase are subject to a 1.00% CDSC. CDSCs are applied to the lesser of the current market value at the time of redemption or the original purchase cost of the shares being redeemed. Proceeds from CDSCs are used to compensate the Distributor for providing distribution-related services in connection with the sale of these shares. During the six months ended January 31, 2016, CDSCs received by the Distributor amounted to $3,789 and $1,292 for Class A and Class C shares, respectively.
Transfer agent fees. The fund has a transfer agent agreement with John Hancock Signature Services, Inc. (Signature Services), an affiliate of the Advisor. The transfer agent fees paid to Signature Services are determined based on the cost to Signature Services (Signature Services Cost) of providing recordkeeping services. It also includes out-of-pocket expenses, including payments made to third-parties for recordkeeping services provided to their clients who invest in one or more John
Hancock funds. In addition, Signature Services Cost may be reduced by certain fees that Signature Services receives in connection with retirement and small accounts. Signature Services Cost is calculated monthly and allocated, as applicable, to five categories of share classes: Retail Share and Institutional Share Classes of Non-Municipal Bond Funds, Class R6 Shares, Retirement Share Classes and Municipal Bond Share Classes. Within each of these categories, the applicable costs are allocated to the affected John Hancock affiliated funds and/or classes, based on the relative average daily net assets.
Class level expenses. Class level expenses for the six months ended January 31, 2016 were:
| Class | Distribution and service fees | Transfer agent fees |
| Class A | $91,084 | $37,383 |
| Class C | 14,487 | 1,781 |
| Class I | — | 17,474 |
| Total | $105,571 | $56,638 |
Trustee expenses. The fund compensates each Trustee who is not an employee of the Advisor or its affiliates. The costs of paying Trustee compensation and expenses are allocated to each fund based on its net assets relative to other funds within the John Hancock group of funds complex.
Note 6 — Fund share transactions
Transactions in fund shares for the six months ended January 31, 2016 and for the year ended July 31, 2015 were as follows:
| Six months ended 1-31-16 | Year ended 7-31-15 | |||||||||||||||||||||||||
| Shares | Amount | Shares | Amount | |||||||||||||||||||||||
| Class A shares | ||||||||||||||||||||||||||
| Sold | 841,978 | $11,203,914 | 1,563,779 | $21,819,493 | ||||||||||||||||||||||
| Distributions reinvested | 602,249 | 7,154,724 | 552,141 | 6,979,063 | ||||||||||||||||||||||
| Repurchased | (1,087,741 | ) | (13,551,515 | ) | (1,796,035 | ) | (24,805,471 | ) | ||||||||||||||||||
| Net increase | 356,486 | $4,807,123 | 319,885 | $3,993,085 | ||||||||||||||||||||||
| Class C shares1 | ||||||||||||||||||||||||||
| Sold | 179,700 | $2,430,132 | 133,315 | $1,913,897 | ||||||||||||||||||||||
| Distributions reinvested | 27,492 | 335,403 | 339 | 4,415 | ||||||||||||||||||||||
| Repurchased | (39,448 | ) | (495,166 | ) | (8,884 | ) | (124,711 | ) | ||||||||||||||||||
| Net increase | 167,744 | $2,270,369 | 124,770 | $1,793,601 | ||||||||||||||||||||||
| Class I shares | ||||||||||||||||||||||||||
| Sold | 780,989 | $10,313,180 | 1,622,024 | $23,236,910 | ||||||||||||||||||||||
| Distributions reinvested | 200,155 | 2,449,902 | 305,393 | 3,951,781 | ||||||||||||||||||||||
| Repurchased | (2,058,188 | ) | (27,432,503 | ) | (1,168,738 | ) | (16,237,349 | ) | ||||||||||||||||||
| Net increase (decrease) | (1,077,044 | ) | ($14,669,421 | ) | 758,679 | $10,951,342 | ||||||||||||||||||||
| Class NAV shares | ||||||||||||||||||||||||||
| Sold | 305,457 | $4,172,556 | 1,943,810 | $28,158,805 | ||||||||||||||||||||||
| Distributions reinvested | 6,217,519 | 77,283,763 | 8,121,532 | 106,392,068 | ||||||||||||||||||||||
| Repurchased | (3,124,014 | ) | (40,212,591 | ) | (14,911,150 | ) | (213,628,775 | ) | ||||||||||||||||||
| Net increase (decrease) | 3,398,962 | $41,243,728 | (4,845,808 | ) | ($79,077,902 | ) | ||||||||||||||||||||
| Total net increase (decrease) | 2,846,148 | $33,651,799 | (3,642,474 | ) | ($62,339,874 | ) | ||||||||||||||||||||
1 The inception date for Class C shares is 8-28-14.
Affiliates of the fund owned 100% of shares of beneficial interest of Class NAV on January 31, 2016.
Note 7 — Purchase and sale of securities
Purchases and sales of securities, other than short-term investments, amounted to $966,117,706 and $1,058,883,574, respectively, for the six months ended January 31, 2016.
Note 8 — Industry or sector risk
The fund generally invests a large percentage of its assets in one or more particular industries or sectors of the economy. If a large percentage of the fund's assets are economically tied to a single or small number of industries or sectors of the economy, the fund will be less diversified than a more broadly diversified fund, and it may cause the fund to underperform if that industry or sector underperforms. In addition, focusing on a particular industry or sector may make the fund's net asset value more volatile. Further, a fund that invests in particular industries or sectors is particularly susceptible to the impact of market, economic, regulatory and other factors affecting those industries or sectors. Financial services companies can be hurt by economic declines, changes in interest rates regulatory and market impacts.
Note 9 — Investment by affiliated funds
Certain investors in the fund are affiliated funds that are managed by the Advisor and its affiliates. The affiliated funds do not invest in the fund for the purpose of exercising management or control; however, this investment may represent a significant portion of the fund's net assets. At January 31, 2016, funds within the John Hancock group of funds complex held 88.1% of the fund's net assets. The following funds had an affiliate ownership of 5% or more of the fund's net assets:
| Fund | Affiliated concentration |
| John Hancock Funds II Lifestyle Growth Fund | 41.2% |
| John Hancock Funds II Lifestyle Balanced Fund | 25.5% |
| John Hancock Funds II Lifestyle Aggressive Fund | 16.0% |
| John Hancock Funds II Alternative Asset Allocation Fund | 5.4% |
|
Trustees James M. Oates, Chairperson Officers Andrew G. Arnott John J. Danello Francis V. Knox, Jr. Charles A. Rizzo Salvatore Schiavone |
Investment advisor John Hancock Advisers, LLC Subadvisor Wellington Management Company LLP Principal distributor John Hancock Funds, LLC Custodian State Street Bank and Trust Company Transfer agent John Hancock Signature Services, Inc. Legal counsel K&L Gates LLP |
*Member of the Audit Committee
†Non-Independent Trustee
The fund's proxy voting policies and procedures, as well as the fund proxy voting record for the most recent twelve-month period ended June 30, are available free of charge on the Securities and Exchange Commission (SEC) website at sec.gov or on our website.
The fund's complete list of portfolio holdings, for the first and third fiscal quarters, is filed with the SEC on Form N-Q. The fund's Form N-Q is available on our website and the SEC's website, sec.gov, and can be reviewed and copied (for a fee) at the SEC's Public Reference Room in Washington, DC. Call 800-SEC-0330 to receive information on the operation of the SEC's Public Reference Room.
We make this information on your fund, as well as monthly portfolio holdings, and other fund details available on our website at jhinvestments.com or by calling 800-225-5291.
| You can also contact us: | |||
| 800-225-5291 jhinvestments.com |
Regular mail: John Hancock Signature Services, Inc. |
Express mail: John Hancock Signature Services, Inc. |
|
John Hancock family of funds
|
DOMESTIC EQUITY FUNDS Balanced Blue Chip Growth Classic Value Disciplined Value Disciplined Value Mid Cap Equity Income Fundamental All Cap Core Fundamental Large Cap Core Fundamental Large Cap Value New Opportunities Select Growth Small Cap Equity Small Cap Value Small Company Strategic Growth U.S. Equity U.S. Global Leaders Growth Value Equity GLOBAL AND INTERNATIONAL EQUITY FUNDS Disciplined Value International Emerging Markets Emerging Markets Equity Global Equity Global Shareholder Yield Greater China Opportunities International Core International Growth International Small Company International Value Equity |
INCOME FUNDS Bond California Tax-Free Income Core High Yield Emerging Markets Debt Floating Rate Income Focused High Yield Global Income Government Income High Yield Municipal Bond Income Investment Grade Bond Money Market Short Duration Credit Opportunities Spectrum Income Strategic Income Opportunities Tax-Free Bond ALTERNATIVE AND SPECIALTY FUNDS Absolute Return Currency Alternative Asset Allocation Enduring Assets Financial Industries Global Absolute Return Strategies Global Conservative Absolute Return Global Real Estate Natural Resources Redwood Regional Bank Seaport Technical Opportunities |
A fund's investment objectives, risks, charges, and expenses should be considered carefully before investing. The prospectus contains this and other important information about the fund. To obtain a prospectus, contact your financial professional, call John Hancock Investments at 800-225-5291, or visit our website at jhinvestments.com. Please read the prospectus carefully before investing or sending money.
|
ASSET ALLOCATION Income Allocation Fund Lifestyle Aggressive Portfolio Lifestyle Balanced Portfolio Lifestyle Conservative Portfolio Lifestyle Growth Portfolio Lifestyle Moderate Portfolio Retirement Choices Portfolios (2010-2055) Retirement Living Portfolios (2010-2055) Retirement Living II Portfolios (2010-2055) EXCHANGE-TRADED FUNDS John Hancock Multifactor Consumer Discretionary ETF John Hancock Multifactor Financials ETF John Hancock Multifactor Healthcare ETF John Hancock Multifactor Large Cap ETF John Hancock Multifactor Mid Cap ETF John Hancock Multifactor Technology ETF CLOSED-END FUNDS Financial Opportunities Hedged Equity & Income Income Securities Trust Investors Trust Preferred Income Preferred Income II Preferred Income III Premium Dividend Tax-Advantaged Dividend Income Tax-Advantaged Global Shareholder Yield |
"As an investment firm,
upholding the proud
tradition of John Hancock
comes down to one thing:
putting shareholders
first. We believe that if
our shareholders are
successful, then we will
be successful."
Andrew G. Arnott
President and Chief Executive Officer
John Hancock Investments
John Hancock Multifactor ETF shares are bought and sold at market
price (not NAV), and are not individually redeemed
from the fund. Brokerage commissions will reduce returns.
John Hancock ETFs are distributed by Foreside Fund Services, LLC, and
are subadvised by Dimensional Fund Advisors LP.
Foreside is not affiliated with John Hancock Funds, LLC or
Dimensional Fund Advisors LP.
Dimensional Fund Advisors LP receives compensation from John Hancock
in connection with licensing rights to the
John Hancock Dimensional indexes. Dimensional Fund Advisors LP does
not sponsor, endorse, or sell, and makes no
representation as to the advisability of investing in, John Hancock
Multifactor ETFs.
John Hancock Investments
A trusted brand
John Hancock Investments is a premier asset manager representing
one of America's most trusted brands, with a heritage of financial
stewardship dating back to 1862. Helping our shareholders pursue
their financial goals is at the core of everything we do. It's why we
support the role of professional financial advice and operate with the
highest standards of conduct and integrity.
A better way to invest
We build funds based on investor needs, then search the world to find
proven portfolio teams with specialized expertise in those strategies.
As a manager of managers, we apply vigorous oversight to ensure that
they continue to meet our uncompromising standards and serve the
best interests of our shareholders.
Results for investors
Our unique approach to asset management enables us to provide
a diverse set of investments backed by some of the world's best
managers, along with strong risk-adjusted returns across asset classes.

 |
John Hancock Funds, LLC n Member FINRA, SIPC 601 Congress Street n Boston, MA 02210-2805 800-225-5291 n jhinvestments.com |
|
| This report is for the information of the shareholders of John Hancock Technical Opportunities Fund. It is not authorized for distribution to prospective investors unless preceded or accompanied by a prospectus. | ||
| MF274543 | 347SA 1/16 3/16 |
|
John Hancock
Global Income Fund
Semiannual report 1/31/16

A message to shareholders
Dear shareholder,
The past six months have been a challenging period for all investors, and the fixed-income markets offered no exception. Oil prices, having already dropped precipitously, continued to slide in the back half of 2015, and by January oil frequently traded at multi-year lows. Against this backdrop, corporate and high-yield bonds continued to suffer on fears of a wave of defaults from commodity-linked issuers. High yield was not the only market that faced headwinds; all risk assets struggled over the past six months, and while these types of declines are unsettling, history shows that they tend not to last.
Although volatility returned in force to the markets, the economic picture in the United States continued to offer reasons for optimism. In fact, in December, the U.S. Federal Reserve raised short-term interest rates for the first time in nine years on the evidence that the persistent strength in the labor markets warranted a somewhat less accommodative stance.
At John Hancock Investments, portfolio risk management is a critical part of our role as an asset manager, and our dedicated risk team is focused on these issues every day. We continually strive for new ways to analyze potential risks and have liquidity tools in place, such as a credit facility and an interfund lending program. In times like these, your best resource is your financial advisor, who can ensure your portfolio is sufficiently diversified to meet your long-term objectives and to withstand the inevitable bumps along the way.
On behalf of everyone at John Hancock Investments, I'd like to take this opportunity to thank you for the continued trust you've placed in us.
Sincerely,
Andrew G. Arnott
President and Chief Executive Officer
John Hancock Investments
This commentary reflects the CEO's views as of January 31, 2016. They are subject to change at any time. All investments entail risks, including the possible loss of principal. For more up-to-date information, you can visit our website at jhinvestments.com.
John Hancock
Global Income Fund
INVESTMENT OBJECTIVE
The fund seeks a high level of current income with capital appreciation as a secondary objective.
AVERAGE ANNUAL TOTAL RETURNS AS OF 1/31/16 (%)
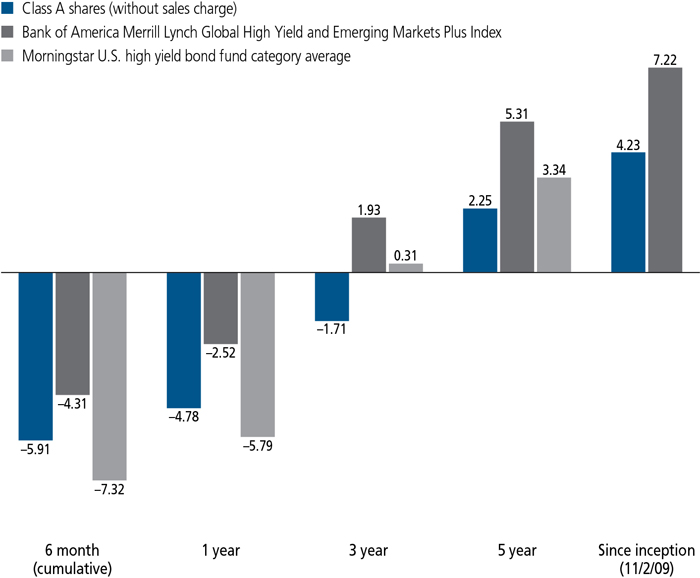
The Bank of America Merrill Lynch Global High Yield and Emerging Markets Plus Index tracks the performance of the below and border-line investment-grade global debt markets denominated in the major developed market currencies.
It is not possible to invest directly in an index. Index figures do not reflect expenses or sales charges, which would result in lower returns.
Figures from Morningstar, Inc. include reinvested distributions and do not take into account sales charges. Actual load-adjusted performance is lower. Since-inception returns for the Morningstar fund category average are not available.
The past performance shown here reflects reinvested distributions and the beneficial effect of any expense reductions, and does not guarantee future results. Returns for periods shorter than one year are cumulative. Performance of the other share classes will vary based on the difference in the fees and expenses of those classes. Shares will fluctuate in value and, when redeemed, may be worth more or less than their original cost. Current month-end performance may be lower or higher than the performance cited, and can be found at jhinvestments.com or by calling 800-225-5291. For further information on the fund's objectives, risks, and strategy, see the fund's prospectus.
PERFORMANCE HIGHLIGHTS OVER THE LAST SIX MONTHS
Slowing global growth pressured the credit-sensitive market segments
High-yield bonds and emerging-markets debt both finished the six-month period with negative returns.
The fund lagged its benchmark
Country and individual issuer selection in the fund's emerging-markets portfolio was the key factor in its underperformance.
The fund's high-yield portfolio outperformed
The fund's defensive approach in high yield, which was highlighted by an underweight position in the resources sectors, aided performance.
PORTFOLIO COMPOSITION AS OF 1/31/16 (%)
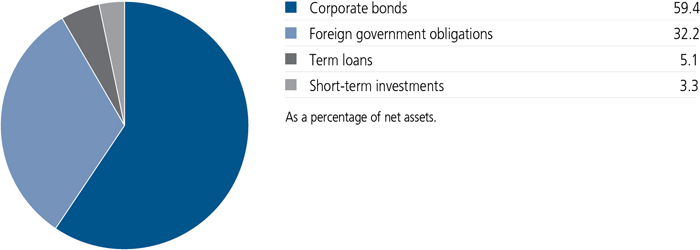
A note about risks
Fixed-income investments are subject to interest-rate and credit risk; their value will normally decline as interest rates rise or if a creditor is unable or unwilling to make principal or interest payments. Investments in higher-yielding, lower-rated securities include a higher risk of default. Liquidity—the extent to which a security may be sold or a derivative position closed without negatively affecting its market value, if at all—may be impaired by reduced trading volume, heightened volatility, rising interest rates, and other market conditions. Foreign investing, especially in emerging markets, has additional risks, such as currency and market volatility and political and social instability. Currency transactions are affected by fluctuations in exchange rates. Hedging, derivatives, and other strategic transactions may increase a fund's volatility and could produce disproportionate losses, potentially more than the fund's principal investment. Mortgage- and asset-backed securities may be sensitive to changes in interest rates, and may be subject to early repayment and the market's perception of issuer creditworthiness. Loan participations and assignments involve additional risks, including credit, interest-rate, counterparty, liquidity, and lending risk. Please see the fund's prospectuses for additional risks.
From the Investment Management Team
Stone Harbor Investment Partners LP
How did the bond market perform during the past six months?
A backdrop of slowing global growth and heightened elevated risk aversion aided the performance of U.S. Treasuries during the six-month period, but the credit-sensitive segments in which the fund is invested—high-yield bonds and the emerging markets—lost ground.
The prospect of slower economic growth proved very challenging for both asset classes. First, weaker economic conditions led to a softer credit outlook for higher-risk issues and prompted investors to seek shelter in "safe havens" such as U.S. Treasuries. In addition, slow growth contributed to falling demand for commodities, pressuring the prices of oil and base metals. This trend weighed heavily on the resources sectors within high yield, and the resulting selling pressure spilled over to the rest of the market during November and December due to the poor liquidity conditions typically associated with year-end. The emerging markets were also affected by falling commodity prices, which weighed on the growth outlook for the many countries that rely on raw-materials exports to fuel their economies. With that said, a low level of new-issue supply enabled the emerging markets to outperform domestic, high-yield bonds by a comfortable margin.
Why did the fund underperform its benchmark index during the period?
The fund's positioning in its emerging-markets portfolio was the primary cause of its performance shortfall. The fund was hurt by being overweight in Brazil, which lagged the broader asset class due to the unfavorable combination of recessionary conditions, rising interest rates, and political turmoil. While Brazil's market rallied significantly in January, this was not enough to overcome the weakness that occurred late in 2015. The fund's performance was also hurt by its overweight position in Mexico, which lagged in the November-December period, and its underweight in Ukraine, which rallied after receiving better-than-expected terms in its debt restructuring. The fund's exposure to bonds denominated in local currencies, while modest, also had a negative impact on results due to the weakness in emerging-market currencies relative to the U.S. dollar. On the plus side, fund performance was boosted by our decision to overweight Venezuela, which was one of the top performing countries for the period due in part to market-friendly election results and successful debt repayments in October and November. A position in the bonds of a state-owned Kazakhstan-based energy producer, which rallied after the Kazakh government offered to buy back the company's debt, also aided performance.
The fund's high-yield portfolio outpaced its benchmark, which helped counterbalance some of the underperformance in the emerging markets. Our industry positioning made a substantial contribution to returns, highlighted by the portfolio's underweights in energy and mining, two of the worst performing segments of the benchmark. We also elected to overweight defensive industries such as cable/media and food products/beverages, both of which held up relatively well
How was the fund positioned at the end of the period?
The fund held approximately equal weightings in high-yield bonds and the emerging markets at the close of the period, maintaining the allocation strategy we have employed since December 2014.
Our positioning in the fund's emerging-markets portfolio reflects our efforts to take advantage of potential values that were created by the volatility of 2015. We believe broad-based selling in higher-risk assets gave rise to values by pressuring the prices of otherwise healthy, creditworthy issuers. We found this to be the case in Africa, where yield spreads widened even among countries with light debt-repayment schedules. Accordingly, we established or maintained positions in Ivory Coast, Kenya, Ghana, Nigeria, Zambia, and other African nations. We also sought opportunities in quasi-sovereign corporate issuers (companies that are owned entirely or in part by governments) in the resources sectors. Many bonds in this category lost ground in sympathy with the broader sell-off in energy-related assets, and we believe yield spreads have climbed to levels that more than compensate investors for the underlying risks. Argentina is another country in which we slightly
QUALITY COMPOSITION AS OF 1/31/16 (%)
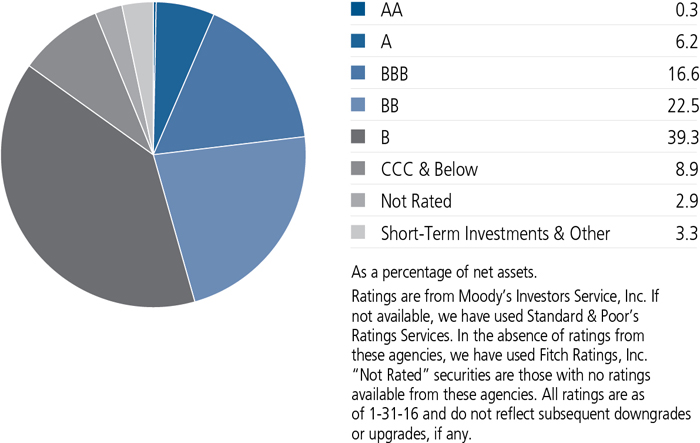
Generally speaking, these moves represented our effort to capitalize on specific opportunities by rotating the portfolio from stronger performers into those with more attractive valuations. While we believe the broader market will continue to experience volatility due to fluctuations in both commodity prices and investors' appetite for risk, we think this opportunistic, value-oriented approach can help the portfolio navigate a potentially challenging environment for the emerging markets.
We retained a defensive posture in the high-yield portfolio in response to elevated volatility. The U.S. high-yield market continued to be significantly pressured by depressed commodity prices, increasing credit-rating downgrades, accelerating default rates, and deepening concerns surrounding slowing global growth. In addition, below-average liquidity conditions exacerbated both overall market volatility and the price swings in individual securities. With that in mind, we added to the portfolio's allocation to leveraged loans, a segment of the market with lower exposure to commodity-related sectors. In addition, we maintained the portfolio's underweight in issues rated CCC and below (the lowest-quality segment of the market). From an industry standpoint, we remained overweight in several defensive areas such as the cable/media, food/beverage and consumer products industries, all of which stand to benefit from their stable operations, strong cash flows, and solid asset values.
TOP 10 ISSUERS AS OF 1/31/16 (%)
| Petroleos Mexicanos | 2.9 |
| Federative Republic of Brazil | 2.3 |
| Republic of Colombia | 2.0 |
| Republic of Argentina | 1.9 |
| Corporacion Nacional del Cobre de Chile | 1.8 |
| Petroleos de Venezuela SA | 1.7 |
| Republic of Turkey | 1.7 |
| Government of Dominican Republic | 1.7 |
| Republic of Indonesia | 1.6 |
| Republic of Ivory Coast | 1.6 |
| TOTAL | 19.2 |
| As a percentage of net assets. | |
| Cash and cash equivalents are not included. |
Overall, we believe our active approach-and ability to invest across the full range of the global fixed-income markets-can add value at a time of both elevated risk and increasingly compelling valuations.
MANAGED BY
| The Global Income Fund is managed by a five person team at Stone Harbor Investment Partners LP. |
COUNTRY COMPOSITION AS OF 1/31/16 (%)
| United States | 43.5 |
| Mexico | 4.2 |
| Brazil | 3.1 |
| Colombia | 2.7 |
| Argentina | 2.4 |
| Russia | 2.1 |
| United Kingdom | 2.1 |
| Chile | 1.9 |
| Venezuela | 1.8 |
| Indonesia | 1.7 |
| Other countries | 34.5 |
| TOTAL | 100.0 |
| As a percentage of net assets. |
TOTAL RETURNS FOR THE PERIOD ENDED JANUARY 31, 2016
| Average annual total returns (%) with maximum sales charge |
Cumulative total returns (%) with maximum sales charge |
SEC 30-day yield (%) subsidized |
SEC 30-day yield (%) unsubsidized1 |
||||||||
| 1-year | 5-year | Since inception2 |
6-month | 5-year | Since inception2 |
as of 1-31-16 |
as of 1-31-16 |
||||
| Class A | -8.55 | 1.42 | 3.54 | -9.69 | 7.30 | 24.34 | 6.00 | 5.99 | |||
| Class I3 | -4.50 | 2.54 | 4.52 | -5.77 | 13.36 | 31.86 | 6.59 | 6.59 | |||
| Class NAV3 | -4.32 | 2.70 | 4.67 | -5.71 | 14.27 | 33.04 | 6.69 | 6.69 | |||
| Index 1† | -2.52 | 5.31 | 7.22 | -4.31 | 29.50 | 54.57 | — | — | |||
| Index 2† | -3.40 | 4.79 | 6.56 | -4.55 | 26.34 | 48.77 | — | — | |||
Performance figures assume all distributions are reinvested. Figures reflect maximum sales charge on Class A shares of 4%. The returns for Class A shares have been adjusted to reflect the reduction in the maximum sales charge from 4.5% to 4.0%, effective 2-3-14. Sales charges are not applicable to Class I and Class NAV shares.
The expense ratios of the fund, both net (including any fee waivers and/or expense limitations) and gross (excluding any fee waivers and/or expense limitations), are set forth according to the most recent publicly available prospectus for the fund and may differ from those disclosed in the Financial highlights tables in this report.
| Class A | Class I | Class NAV | |
| Gross/Net (%) | 1.25 | 0.94 | 0.83 |
Please refer to the most recent prospectus and annual or semiannual report for more information on expenses and any expense limitation arrangements for each class.
The returns reflect past results and should not be considered indicative of future performance. The return and principal value of an investment will fluctuate so that shares, when redeemed, may be worth more or less than their original cost. Due to market volatility and other factors, the fund's current performance may be higher or lower than the performance shown. For current to the most recent month-end performance data, please call 800-225-5291 or visit the fund's website at jhinvestments.com.
The performance table above and the chart on the next page do not reflect the deduction of taxes that a shareholder would pay on fund distributions or the redemption of fund shares. The fund's performance results reflect any applicable fee waivers or expense reductions, without which the expenses would increase and results would have been less favorable.
| † | Index 1 is the Bank of America Merrill Lynch Global High Yield and Emerging Markets Plus Index; Index 2 is 50% Bank of America Merrill Lynch U.S. High Yield Master II Constrained Index and 50% JPMorgan EMBI Global Diversified Index. |
See the following page for footnotes.
This chart and table show what happened to a hypothetical $10,000 investment in John Hancock Global Income Fund for the share classes and periods indicated, assuming all distributions were reinvested. For comparison, we've shown the same investment in a separate index and a blended index.
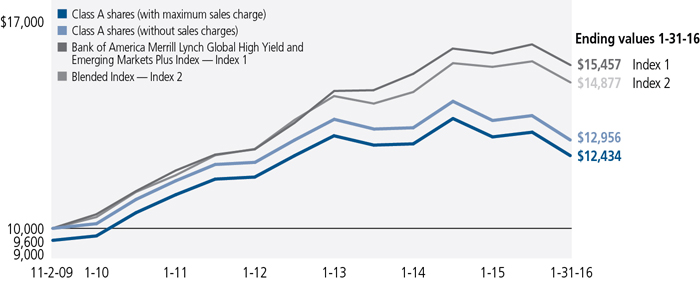
| Start date | With maximum sales charge ($) |
Without sales charge ($) |
Index 1 ($) | Index 2 ($) | |
| Class I3 | 11-2-09 | 13,186 | 13,186 | 15,457 | 14,877 |
| Class NAV3 | 11-2-09 | 13,304 | 13,304 | 15,457 | 14,877 |
The values shown in the chart for Class A with maximum sales charge have been adjusted to reflect the reduction in the Class A maximum sales charge from 4.5% to 4.0%, which became effective on 2-3-14.
The BofA Merrill Lynch Global High Yield and Emerging Markets Plus Index tracks the performance of the below and border-line investment-grade global debt markets denominated in the major developed market currencies.
The blended index is 50% BofA Merrill Lynch U.S. High Yield Master II Constrained Index and 50% JPMorgan EMBI Global Diversified Index.
It is not possible to invest directly in an index. Index figures do not reflect expenses or sales charges, which would result in lower returns.
Footnotes related to performance pages
| 1 | Unsubsidized yield reflects what the yield would have been without the effect of reimbursements and waivers. |
| 2 | From 11-2-09. |
| 3 | For certain types of investors as described in the fund's prospectuses. |
These examples are intended to help you understand your ongoing operating expenses of investing in the fund so you can compare these costs with the ongoing costs of investing in other mutual funds.
Understanding fund expenses
As a shareholder of the fund, you incur two types of costs:
| • | Transaction costs, which include sales charges (loads) on purchases or redemptions (varies by share class), minimum account fee charge, etc. |
| • | Ongoing operating expenses, including management fees, distribution and service fees (if applicable), and other fund expenses. |
We are presenting only your ongoing operating expenses here.
Actual expenses/actual returns
This example is intended to provide information about the fund's actual ongoing operating expenses, and is based on the fund's actual return. It assumes an account value of $1,000.00 on August 1, 2015, with the same investment held until January 31, 2016.
| Account value on 8-1-2015 |
Ending value on 1-31-2016 |
Expenses paid during period ended 1-31-20161 |
Annualized expense ratio |
|
| Class A | $1,000.00 | $940.90 | $6.34 | 1.30% |
| Class I | 1,000.00 | 942.30 | 4.78 | 0.98% |
| Class NAV | 1,000.00 | 942.90 | 4.25 | 0.87% |
Together with the value of your account, you may use this information to estimate the operating expenses that you paid over the period. Simply divide your account value at January 31, 2016, by $1,000.00, then multiply it by the "expenses paid" for your share class from the table above. For example, for an account value of $8,600.00, the operating expenses should be calculated as follows:
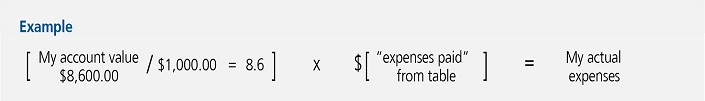
Hypothetical example for comparison purposes
This table allows you to compare the fund's ongoing operating expenses with those of any other fund. It provides an example of the fund's hypothetical account values and hypothetical expenses based on each class's actual expense ratio and an assumed 5% annualized return before expenses (which is not the fund's actual return). It assumes an account value of $1,000.00 on August 1, 2015, with the same investment held until January 31, 2016. Look in any other fund shareholder report to find its hypothetical example and you will be able to compare these expenses. Please remember that these hypothetical account values and expenses may not be used to estimate the actual ending account balance or expenses you paid for the period.
| Account value on 8-1-2015 |
Ending value on 1-31-2016 |
Expenses paid during period ended 1-31-20161 |
Annualized expense ratio |
|
| Class A | $1,000.00 | $1,018.60 | $6.60 | 1.30% |
| Class I | 1,000.00 | 1,020.20 | 4.98 | 0.98% |
| Class NAV | 1,000.00 | 1,020.80 | 4.42 | 0.87% |
Remember, these examples do not include any transaction costs, therefore, these examples will not help you to determine the relative total costs of owning different funds. If transaction costs were included, your expenses would have been higher. See the prospectus for details regarding transaction costs.
| 1 | Expenses are equal to the fund's annualized expense ratio, multiplied by the average account value over the period, multiplied by 184/366 (to reflect the one-half year period). |
Fund's investments
| As of 1-31-16 (unaudited) | |||||||||||||||||||||||||||||
| Rate (%) | Maturity date | Par value^ | Value | ||||||||||||||||||||||||||
| Corporate bonds 59.4% | $233,743,288 | ||||||||||||||||||||||||||||
| (Cost $267,920,881) | |||||||||||||||||||||||||||||
| Argentina 0.5% | 1,913,600 | ||||||||||||||||||||||||||||
| YPF SA | 8.500 | 07-28-25 | 518,000 | 482,064 | |||||||||||||||||||||||||
| YPF SA (S) | 8.500 | 07-28-25 | 650,000 | 604,906 | |||||||||||||||||||||||||
| YPF SA (S) | 8.750 | 04-04-24 | 862,000 | 826,630 | |||||||||||||||||||||||||
| Austria 0.1% | 580,115 | ||||||||||||||||||||||||||||
| ESAL GmbH (S) | 6.250 | 02-05-23 | 739,000 | 580,115 | |||||||||||||||||||||||||
| Azerbaijan 0.5% | 1,936,724 | ||||||||||||||||||||||||||||
| State Oil Company of the Azerbaijan Republic | 4.750 | 03-13-23 | 2,011,000 | 1,648,441 | |||||||||||||||||||||||||
| State Oil Company of the Azerbaijan Republic | 5.450 | 02-09-17 | 284,000 | 288,283 | |||||||||||||||||||||||||
| Brazil 0.8% | 3,194,521 | ||||||||||||||||||||||||||||
| Brazil Loan Trust 1 (S) | 5.477 | 07-24-23 | 2,457,692 | 2,107,471 | |||||||||||||||||||||||||
| Brazil Loan Trust 1 | 5.477 | 07-24-23 | 198,417 | 171,135 | |||||||||||||||||||||||||
| Brazil Minas SPE | 5.333 | 02-15-28 | 500,000 | 382,500 | |||||||||||||||||||||||||
| GTL Trade Finance, Inc. (S) | 5.893 | 04-29-24 | 634,000 | 430,169 | |||||||||||||||||||||||||
| Samarco Mineracao SA (S) | 4.125 | 11-01-22 | 246,000 | 103,246 | |||||||||||||||||||||||||
| Canada 1.3% | 5,303,939 | ||||||||||||||||||||||||||||
| Cascades, Inc. (S) | 5.500 | 07-15-22 | 845,000 | 809,088 | |||||||||||||||||||||||||
| Mercer International, Inc. | 7.750 | 12-01-22 | 1,485,000 | 1,369,913 | |||||||||||||||||||||||||
| Norbord, Inc. (S) | 5.375 | 12-01-20 | 1,525,000 | 1,525,000 | |||||||||||||||||||||||||
| Quebecor Media, Inc. | 5.750 | 01-15-23 | 1,590,000 | 1,599,938 | |||||||||||||||||||||||||
| Chile 1.9% | 7,397,298 | ||||||||||||||||||||||||||||
| Banco del Estado de Chile (S) | 3.875 | 02-08-22 | 164,000 | 165,190 | |||||||||||||||||||||||||
| Corporacion Nacional del Cobre de Chile (S) | 3.000 | 07-17-22 | 2,484,000 | 2,286,224 | |||||||||||||||||||||||||
| Corporacion Nacional del Cobre de Chile (S) | 4.250 | 07-17-42 | 637,000 | 489,692 | |||||||||||||||||||||||||
| Corporacion Nacional del Cobre de Chile (S) | 4.500 | 08-13-23 | 909,000 | 887,852 | |||||||||||||||||||||||||
| Corporacion Nacional del Cobre de Chile (S) | 4.500 | 09-16-25 | 253,000 | 242,408 | |||||||||||||||||||||||||
| Corporacion Nacional del Cobre de Chile (S) | 4.875 | 11-04-44 | 608,000 | 508,997 | |||||||||||||||||||||||||
| Corporacion Nacional del Cobre de Chile | 6.150 | 10-24-36 | 2,361,000 | 2,343,930 | |||||||||||||||||||||||||
| Corporacion Nacional del Cobre de Chile (S) | 6.150 | 10-24-36 | 255,000 | 253,156 | |||||||||||||||||||||||||
| Corporacion Nacional del Cobre de Chile | 7.500 | 01-15-19 | 197,000 | 219,849 | |||||||||||||||||||||||||
| China 0.2% | 737,118 | ||||||||||||||||||||||||||||
| Sinopec Group Overseas Development 2012, Ltd. (S) | 4.875 | 05-17-42 | 371,000 | 388,695 | |||||||||||||||||||||||||
| Three Gorges Finance I Cayman Islands, Ltd. (S) | 3.700 | 06-10-25 | 334,000 | 348,423 | |||||||||||||||||||||||||
| Colombia 0.5% | 1,788,483 | ||||||||||||||||||||||||||||
| Ecopetrol SA | 4.125 | 01-16-25 | 1,440,000 | 1,094,400 | |||||||||||||||||||||||||
| Ecopetrol SA | 5.875 | 05-28-45 | 644,000 | 445,777 | |||||||||||||||||||||||||
| Ecopetrol SA | 7.375 | 09-18-43 | 323,000 | 248,306 | |||||||||||||||||||||||||
| Rate (%) | Maturity date | Par value^ | Value | ||||||||||||||||||||||||||
| Ecuador 0.6% | $2,430,326 | ||||||||||||||||||||||||||||
| EP PetroEcuador (P) | 6.224 | 09-24-19 | 3,146,053 | 2,430,326 | |||||||||||||||||||||||||
| France 0.8% | 3,257,176 | ||||||||||||||||||||||||||||
| Albea Beauty Holdings SA (S) | 8.375 | 11-01-19 | 1,095,000 | 1,141,538 | |||||||||||||||||||||||||
| Numericable-SFR SAS (S) | 6.000 | 05-15-22 | 1,110,000 | 1,093,350 | |||||||||||||||||||||||||
| Numericable-SFR SAS (S) | 6.250 | 05-15-24 | 630,000 | 614,250 | |||||||||||||||||||||||||
| SPCM SA (S) | 6.000 | 01-15-22 | 405,000 | 408,038 | |||||||||||||||||||||||||
| Germany 0.8% | 2,951,430 | ||||||||||||||||||||||||||||
| CeramTec Group GmbH | 8.250 | 08-15-21 | EUR | 1,275,000 | 1,474,219 | ||||||||||||||||||||||||
| Unitymedia Hessen GmbH & Company KG (S) | 5.000 | 01-15-25 | 855,000 | 852,863 | |||||||||||||||||||||||||
| Unitymedia KabelBW GmbH (S) | 6.125 | 01-15-25 | 615,000 | 624,348 | |||||||||||||||||||||||||
| Hong Kong 0.8% | 3,039,513 | ||||||||||||||||||||||||||||
| Sinochem Overseas Capital Company, Ltd. | 4.500 | 11-12-20 | 2,875,000 | 3,039,513 | |||||||||||||||||||||||||
| India 0.0% | 185,822 | ||||||||||||||||||||||||||||
| Vedanta Resources PLC (S) | 6.000 | 01-31-19 | 142,000 | 87,515 | |||||||||||||||||||||||||
| Vedanta Resources PLC (S) | 8.250 | 06-07-21 | 172,000 | 98,307 | |||||||||||||||||||||||||
| Indonesia 0.1% | 513,500 | ||||||||||||||||||||||||||||
| Perusahaan Listrik Negara PT | 5.250 | 10-24-42 | 650,000 | 513,500 | |||||||||||||||||||||||||
| Ireland 0.6% | 2,421,539 | ||||||||||||||||||||||||||||
| Endo, Ltd. (S) | 6.000 | 02-01-25 | 1,365,000 | 1,348,101 | |||||||||||||||||||||||||
| Mallinckrodt International Finance SA (S) | 5.625 | 10-15-23 | 1,145,000 | 1,073,438 | |||||||||||||||||||||||||
| Italy 0.3% | 1,194,375 | ||||||||||||||||||||||||||||
| Telecom Italia SpA (S) | 5.303 | 05-30-24 | 1,225,000 | 1,194,375 | |||||||||||||||||||||||||
| Jamaica 0.2% | 662,750 | ||||||||||||||||||||||||||||
| Digicel Group, Ltd. (S) | 7.125 | 04-01-22 | 889,000 | 662,750 | |||||||||||||||||||||||||
| Kazakhstan 1.3% | 5,232,741 | ||||||||||||||||||||||||||||
| KazMunayGas National Company (S) | 6.375 | 04-09-21 | 1,462,000 | 1,430,640 | |||||||||||||||||||||||||
| KazMunayGas National Company | 6.375 | 04-09-21 | 2,057,000 | 2,015,885 | |||||||||||||||||||||||||
| KazMunayGas National Company | 7.000 | 05-05-20 | 507,000 | 511,602 | |||||||||||||||||||||||||
| KazMunayGas National Company (S) | 9.125 | 07-02-18 | 619,000 | 660,164 | |||||||||||||||||||||||||
| Zhaikmunai LLP (S) | 6.375 | 02-14-19 | 347,000 | 254,178 | |||||||||||||||||||||||||
| Zhaikmunai LLP (S) | 7.125 | 11-13-19 | 492,000 | 360,272 | |||||||||||||||||||||||||
| Luxembourg 1.5% | 5,934,401 | ||||||||||||||||||||||||||||
| Altice Luxembourg SA (S) | 7.750 | 05-15-22 | 1,510,000 | 1,408,075 | |||||||||||||||||||||||||
| ArcelorMittal | 7.250 | 02-25-22 | 525,000 | 426,563 | |||||||||||||||||||||||||
| ArcelorMittal | 7.500 | 10-15-39 | 920,000 | 648,600 | |||||||||||||||||||||||||
| Cosan Luxembourg SA (S) | 5.000 | 03-14-23 | 692,000 | 532,840 | |||||||||||||||||||||||||
| INEOS Group Holdings SA (S) | 5.875 | 02-15-19 | 1,795,000 | 1,743,394 | |||||||||||||||||||||||||
| Wind Acquisition Finance SA (S) | 4.750 | 07-15-20 | 625,000 | 614,063 | |||||||||||||||||||||||||
| Wind Acquisition Finance SA (S) | 7.375 | 04-23-21 | 590,000 | 560,866 | |||||||||||||||||||||||||
| Rate (%) | Maturity date | Par value^ | Value | ||||||||||||||||||||||||||
| Malaysia 0.9% | $3,562,991 | ||||||||||||||||||||||||||||
| 1MDB Global Investments, Ltd. | 4.400 | 03-09-23 | 1,100,000 | 969,858 | |||||||||||||||||||||||||
| Petronas Capital, Ltd. (S) | 3.500 | 03-18-25 | 2,133,000 | 2,095,510 | |||||||||||||||||||||||||
| Petronas Capital, Ltd. (S) | 4.500 | 03-18-45 | 519,000 | 497,623 | |||||||||||||||||||||||||
| Mexico 3.3% | 12,973,386 | ||||||||||||||||||||||||||||
| Cemex Finance LLC (S) | 9.375 | 10-12-22 | 166,000 | 167,610 | |||||||||||||||||||||||||
| Cemex SAB de CV (S) | 5.700 | 01-11-25 | 34,000 | 28,475 | |||||||||||||||||||||||||
| Cemex SAB de CV (S) | 6.125 | 05-05-25 | 337,000 | 288,455 | |||||||||||||||||||||||||
| Cemex SAB de CV (S) | 7.250 | 01-15-21 | 200,000 | 190,500 | |||||||||||||||||||||||||
| Cemex SAB de CV (S) | 9.500 | 06-15-18 | 396,000 | 410,850 | |||||||||||||||||||||||||
| Comision Federal de Electricidad (S) | 4.875 | 01-15-24 | 295,000 | 293,525 | |||||||||||||||||||||||||
| Petroleos Mexicanos | 3.500 | 01-30-23 | 1,381,000 | 1,177,303 | |||||||||||||||||||||||||
| Petroleos Mexicanos (S) | 4.500 | 01-23-26 | 302,000 | 259,720 | |||||||||||||||||||||||||
| Petroleos Mexicanos | 4.875 | 01-18-24 | 750,000 | 678,660 | |||||||||||||||||||||||||
| Petroleos Mexicanos | 5.500 | 01-21-21 | 1,737,000 | 1,616,274 | |||||||||||||||||||||||||
| Petroleos Mexicanos | 5.500 | 06-27-44 | 406,000 | 305,515 | |||||||||||||||||||||||||
| Petroleos Mexicanos (S) | 5.625 | 01-23-46 | 3,212,000 | 2,473,240 | |||||||||||||||||||||||||
| Petroleos Mexicanos | 5.625 | 01-23-46 | 260,000 | 200,200 | |||||||||||||||||||||||||
| Petroleos Mexicanos | 6.000 | 03-05-20 | 94,000 | 95,645 | |||||||||||||||||||||||||
| Petroleos Mexicanos (S) | 6.375 | 02-04-21 | 275,000 | 277,831 | |||||||||||||||||||||||||
| Petroleos Mexicanos | 6.375 | 01-23-45 | 2,189,000 | 1,846,969 | |||||||||||||||||||||||||
| Petroleos Mexicanos | 6.500 | 06-02-41 | 1,022,000 | 870,744 | |||||||||||||||||||||||||
| Petroleos Mexicanos (S) | 6.875 | 08-04-26 | 1,538,000 | 1,553,380 | |||||||||||||||||||||||||
| Petroleos Mexicanos | 9.500 | 09-15-27 | 154,000 | 174,790 | |||||||||||||||||||||||||
| Sixsigma Networks Mexico SA de CV (S) | 8.250 | 11-07-21 | 70,000 | 63,700 | |||||||||||||||||||||||||
| Morocco 0.2% | 665,279 | ||||||||||||||||||||||||||||
| OCP SA (S) | 4.500 | 10-22-25 | 83,000 | 74,710 | |||||||||||||||||||||||||
| OCP SA (S) | 5.625 | 04-25-24 | 362,000 | 359,944 | |||||||||||||||||||||||||
| OCP SA (S) | 6.875 | 04-25-44 | 246,000 | 230,625 | |||||||||||||||||||||||||
| Netherlands 0.7% | 2,693,246 | ||||||||||||||||||||||||||||
| Intergas Finance BV | 6.375 | 05-14-17 | 158,000 | 159,608 | |||||||||||||||||||||||||
| Schaeffler Holding Finance BV, PIK (S) | 6.250 | 11-15-19 | 625,000 | 651,563 | |||||||||||||||||||||||||
| UPCB Finance IV, Ltd. (S) | 5.375 | 01-15-25 | 960,000 | 921,600 | |||||||||||||||||||||||||
| VTR Finance BV (S) | 6.875 | 01-15-24 | 1,030,000 | 960,475 | |||||||||||||||||||||||||
| Portugal 0.0% | 97,785 | ||||||||||||||||||||||||||||
| CIMPOR Financial Operations BV (S) | 5.750 | 07-17-24 | 159,000 | 97,785 | |||||||||||||||||||||||||
| Russia 1.3% | 5,075,123 | ||||||||||||||||||||||||||||
| Gazprom Neft OAO (S) | 4.375 | 09-19-22 | 228,000 | 199,500 | |||||||||||||||||||||||||
| Gazprom OAO (S) | 4.950 | 07-19-22 | 87,000 | 81,597 | |||||||||||||||||||||||||
| Gazprom OAO (S) | 5.999 | 01-23-21 | 281,000 | 278,997 | |||||||||||||||||||||||||
| Gazprom OAO (S) | 6.510 | 03-07-22 | 241,000 | 243,434 | |||||||||||||||||||||||||
| Gazprom OAO (S) | 8.146 | 04-11-18 | 222,000 | 236,896 | |||||||||||||||||||||||||
| Rate (%) | Maturity date | Par value^ | Value | ||||||||||||||||||||||||||
| Russia (continued) | |||||||||||||||||||||||||||||
| Gazprom OAO (S) | 9.250 | 04-23-19 | 410,000 | $454,288 | |||||||||||||||||||||||||
| Gazprom OAO | 9.250 | 04-23-19 | 530,000 | 588,136 | |||||||||||||||||||||||||
| Rosneft Oil Company (S) | 4.199 | 03-06-22 | 3,410,000 | 2,992,275 | |||||||||||||||||||||||||
| Singapore 0.1% | 571,768 | ||||||||||||||||||||||||||||
| ABJA Investment Company Pte, Ltd. | 5.950 | 07-31-24 | 680,000 | 571,768 | |||||||||||||||||||||||||
| South Africa 1.0% | 3,856,875 | ||||||||||||||||||||||||||||
| Eskom Holdings SOC, Ltd. (S) | 6.750 | 08-06-23 | 1,023,000 | 882,542 | |||||||||||||||||||||||||
| Eskom Holdings SOC, Ltd. (S) | 7.125 | 02-11-25 | 3,452,000 | 2,974,333 | |||||||||||||||||||||||||
| United Kingdom 2.1% | 8,102,801 | ||||||||||||||||||||||||||||
| Bakkavor Finance 2 PLC | 8.250 | 02-15-18 | GBP | 140,204 | 203,779 | ||||||||||||||||||||||||
| Boparan Finance PLC | 5.500 | 07-15-21 | GBP | 1,550,000 | 1,956,554 | ||||||||||||||||||||||||
| Fiat Chrysler Automobiles NV | 5.250 | 04-15-23 | 145,000 | 135,213 | |||||||||||||||||||||||||
| Fiat Chrysler Automobiles NV (S) | 5.250 | 04-15-23 | 765,000 | 713,363 | |||||||||||||||||||||||||
| Premier Foods Finance PLC | 6.500 | 03-15-21 | GBP | 1,000,000 | 1,325,896 | ||||||||||||||||||||||||
| R&R PLC, PIK | 9.250 | 05-15-18 | EUR | 1,100,000 | 1,198,496 | ||||||||||||||||||||||||
| Virgin Media Finance PLC (S) | 6.000 | 10-15-24 | 1,440,000 | 1,450,800 | |||||||||||||||||||||||||
| Virgin Media Secured Finance PLC (S) | 5.250 | 01-15-26 | 1,130,000 | 1,118,700 | |||||||||||||||||||||||||
| United States 35.3% | 138,748,144 | ||||||||||||||||||||||||||||
| ACCO Brands Corp. | 6.750 | 04-30-20 | 1,267,000 | 1,303,426 | |||||||||||||||||||||||||
| AECOM | 5.750 | 10-15-22 | 1,280,000 | 1,294,400 | |||||||||||||||||||||||||
| Altice US Finance I Corp. (S) | 5.375 | 07-15-23 | 575,000 | 577,875 | |||||||||||||||||||||||||
| AMC Entertainment, Inc. | 5.750 | 06-15-25 | 1,710,000 | 1,742,063 | |||||||||||||||||||||||||
| Amsurg Corp. | 5.625 | 07-15-22 | 1,135,000 | 1,140,533 | |||||||||||||||||||||||||
| Argos Merger Sub, Inc. (S) | 7.125 | 03-15-23 | 1,470,000 | 1,481,025 | |||||||||||||||||||||||||
| Artesyn Embedded Technologies, Inc. (S) | 9.750 | 10-15-20 | 1,030,000 | 896,100 | |||||||||||||||||||||||||
| Ball Corp. | 5.250 | 07-01-25 | 340,000 | 350,200 | |||||||||||||||||||||||||
| Berry Plastics Corp. (S) | 6.000 | 10-15-22 | 790,000 | 805,800 | |||||||||||||||||||||||||
| Bonanza Creek Energy, Inc. | 5.750 | 02-01-23 | 450,000 | 162,000 | |||||||||||||||||||||||||
| Bonanza Creek Energy, Inc. | 6.750 | 04-15-21 | 1,710,000 | 671,175 | |||||||||||||||||||||||||
| Building Materials Corp. of America (S) | 5.375 | 11-15-24 | 1,125,000 | 1,108,125 | |||||||||||||||||||||||||
| Cable One, Inc. (S) | 5.750 | 06-15-22 | 1,135,000 | 1,146,350 | |||||||||||||||||||||||||
| Cablevision Systems Corp. | 5.875 | 09-15-22 | 2,575,000 | 2,124,375 | |||||||||||||||||||||||||
| Cablevision Systems Corp. | 8.000 | 04-15-20 | 490,000 | 463,050 | |||||||||||||||||||||||||
| CalAtlantic Group, Inc. | 5.875 | 11-15-24 | 747,000 | 775,013 | |||||||||||||||||||||||||
| Calpine Corp. | 5.750 | 01-15-25 | 1,490,000 | 1,339,138 | |||||||||||||||||||||||||
| Calumet Specialty Products Partners LP | 7.625 | 01-15-22 | 570,000 | 416,100 | |||||||||||||||||||||||||
| Calumet Specialty Products Partners LP (S) | 7.750 | 04-15-23 | 190,000 | 138,700 | |||||||||||||||||||||||||
| CCO Holdings LLC | 6.625 | 01-31-22 | 1,630,000 | 1,725,763 | |||||||||||||||||||||||||
| CCOH Safari LLC (S) | 5.750 | 02-15-26 | 655,000 | 651,643 | |||||||||||||||||||||||||
| Centene Escrow Corp. (S) | 5.625 | 02-15-21 | 530,000 | 539,938 | |||||||||||||||||||||||||
| CenturyLink, Inc. | 5.800 | 03-15-22 | 680,000 | 633,250 | |||||||||||||||||||||||||
| CenturyLink, Inc. | 7.650 | 03-15-42 | 1,310,000 | 982,500 | |||||||||||||||||||||||||
| Rate (%) | Maturity date | Par value^ | Value | ||||||||||||||||||||||||||
| United States (continued) | |||||||||||||||||||||||||||||
| Cequel Communications Holdings I LLC (S) | 5.125 | 12-15-21 | 1,000,000 | $904,400 | |||||||||||||||||||||||||
| Chemtura Corp. | 5.750 | 07-15-21 | 2,150,000 | 2,133,875 | |||||||||||||||||||||||||
| Chiquita Brands International, Inc. | 7.875 | 02-01-21 | 840,000 | 890,400 | |||||||||||||||||||||||||
| Cincinnati Bell, Inc. | 8.375 | 10-15-20 | 1,130,000 | 1,149,775 | |||||||||||||||||||||||||
| Cinemark USA, Inc. | 5.125 | 12-15-22 | 725,000 | 728,625 | |||||||||||||||||||||||||
| Cleaver-Brooks, Inc. (S) | 8.750 | 12-15-19 | 1,381,000 | 1,298,140 | |||||||||||||||||||||||||
| Cloud Peak Energy Resources LLC | 6.375 | 03-15-24 | 355,000 | 91,413 | |||||||||||||||||||||||||
| CNOOC Finance 2015 USA LLC | 3.500 | 05-05-25 | 240,000 | 231,183 | |||||||||||||||||||||||||
| Cogent Communications Group, Inc. (S) | 5.375 | 03-01-22 | 740,000 | 717,800 | |||||||||||||||||||||||||
| Community Health Systems, Inc. | 6.875 | 02-01-22 | 1,465,000 | 1,331,136 | |||||||||||||||||||||||||
| Constellation Brands, Inc. | 4.750 | 12-01-25 | 465,000 | 480,113 | |||||||||||||||||||||||||
| CyrusOne LP | 6.375 | 11-15-22 | 1,400,000 | 1,421,000 | |||||||||||||||||||||||||
| DaVita HealthCare Partners, Inc. | 5.125 | 07-15-24 | 1,000,000 | 1,005,625 | |||||||||||||||||||||||||
| Dean Foods Company (S) | 6.500 | 03-15-23 | 1,730,000 | 1,781,900 | |||||||||||||||||||||||||
| Denbury Resources, Inc. | 5.500 | 05-01-22 | 1,780,000 | 623,000 | |||||||||||||||||||||||||
| DISH DBS Corp. | 5.000 | 03-15-23 | 3,020,000 | 2,627,400 | |||||||||||||||||||||||||
| Dynegy, Inc. | 6.750 | 11-01-19 | 1,470,000 | 1,420,388 | |||||||||||||||||||||||||
| Dynegy, Inc. | 7.625 | 11-01-24 | 795,000 | 699,600 | |||||||||||||||||||||||||
| Energizer Holdings, Inc. (S) | 5.500 | 06-15-25 | 935,000 | 869,550 | |||||||||||||||||||||||||
| EnerSys (S) | 5.000 | 04-30-23 | 880,000 | 866,800 | |||||||||||||||||||||||||
| EP Energy LLC | 6.375 | 06-15-23 | 740,000 | 259,000 | |||||||||||||||||||||||||
| EP Energy LLC | 9.375 | 05-01-20 | 925,000 | 393,125 | |||||||||||||||||||||||||
| Erickson, Inc. | 8.250 | 05-01-20 | 889,000 | 551,180 | |||||||||||||||||||||||||
| First Data Corp. (S) | 7.000 | 12-01-23 | 975,000 | 984,750 | |||||||||||||||||||||||||
| Frontier Communications Corp. | 6.250 | 09-15-21 | 1,095,000 | 922,198 | |||||||||||||||||||||||||
| Frontier Communications Corp. | 9.000 | 08-15-31 | 1,629,000 | 1,295,055 | |||||||||||||||||||||||||
| FTS International, Inc. | 6.250 | 05-01-22 | 1,365,000 | 255,938 | |||||||||||||||||||||||||
| GCI, Inc. | 6.875 | 04-15-25 | 1,300,000 | 1,274,000 | |||||||||||||||||||||||||
| GenOn Energy, Inc. | 9.500 | 10-15-18 | 3,175,000 | 2,222,500 | |||||||||||||||||||||||||
| GLP Capital LP | 5.375 | 11-01-23 | 675,000 | 646,313 | |||||||||||||||||||||||||
| Gray Television, Inc. | 7.500 | 10-01-20 | 1,570,000 | 1,619,063 | |||||||||||||||||||||||||
| Griffon Corp. | 5.250 | 03-01-22 | 1,840,000 | 1,757,200 | |||||||||||||||||||||||||
| Halcon Resources Corp. | 9.750 | 07-15-20 | 1,690,000 | 245,050 | |||||||||||||||||||||||||
| HCA, Inc. | 5.250 | 04-15-25 | 560,000 | 574,000 | |||||||||||||||||||||||||
| HCA, Inc. | 5.375 | 02-01-25 | 1,910,000 | 1,931,488 | |||||||||||||||||||||||||
| HealthSouth Corp. | 5.750 | 11-01-24 | 1,325,000 | 1,307,894 | |||||||||||||||||||||||||
| Hornbeck Offshore Services, Inc. | 5.000 | 03-01-21 | 965,000 | 545,225 | |||||||||||||||||||||||||
| Hornbeck Offshore Services, Inc. | 5.875 | 04-01-20 | 550,000 | 330,000 | |||||||||||||||||||||||||
| Hot Topic, Inc. (S) | 9.250 | 06-15-21 | 1,500,000 | 1,342,500 | |||||||||||||||||||||||||
| Huntington Ingalls Industries, Inc. (S) | 5.000 | 12-15-21 | 340,000 | 351,050 | |||||||||||||||||||||||||
| IASIS Healthcare LLC | 8.375 | 05-15-19 | 965,000 | 904,688 | |||||||||||||||||||||||||
| Isle of Capri Casinos, Inc. | 5.875 | 03-15-21 | 1,520,000 | 1,554,200 | |||||||||||||||||||||||||
| Jarden Corp. (S) | 5.000 | 11-15-23 | 700,000 | 717,500 | |||||||||||||||||||||||||
| Kinetic Concepts, Inc. | 10.500 | 11-01-18 | 855,000 | 829,350 | |||||||||||||||||||||||||
| Rate (%) | Maturity date | Par value^ | Value | ||||||||||||||||||||||||||
| United States (continued) | |||||||||||||||||||||||||||||
| Kinetic Concepts, Inc. | 12.500 | 11-01-19 | 820,000 | $733,900 | |||||||||||||||||||||||||
| L Brands, Inc. (S) | 6.875 | 11-01-35 | 1,075,000 | 1,111,281 | |||||||||||||||||||||||||
| Landry's, Inc. (S) | 9.375 | 05-01-20 | 716,000 | 756,275 | |||||||||||||||||||||||||
| Laredo Petroleum, Inc. | 5.625 | 01-15-22 | 715,000 | 507,650 | |||||||||||||||||||||||||
| Laredo Petroleum, Inc. | 7.375 | 05-01-22 | 830,000 | 616,275 | |||||||||||||||||||||||||
| Level 3 Communications, Inc. | 5.750 | 12-01-22 | 930,000 | 957,900 | |||||||||||||||||||||||||
| Level 3 Financing, Inc. | 5.375 | 08-15-22 | 1,665,000 | 1,700,381 | |||||||||||||||||||||||||
| Levi Strauss & Company | 5.000 | 05-01-25 | 680,000 | 663,000 | |||||||||||||||||||||||||
| LifePoint Health, Inc. | 5.500 | 12-01-21 | 1,475,000 | 1,497,125 | |||||||||||||||||||||||||
| Lin Television Corp. | 5.875 | 11-15-22 | 1,835,000 | 1,848,763 | |||||||||||||||||||||||||
| Linn Energy LLC | 6.500 | 09-15-21 | 690,000 | 75,900 | |||||||||||||||||||||||||
| Linn Energy LLC | 7.750 | 02-01-21 | 1,900,000 | 228,000 | |||||||||||||||||||||||||
| Louisiana-Pacific Corp. | 7.500 | 06-01-20 | 600,000 | 618,000 | |||||||||||||||||||||||||
| Masonite International Corp. (S) | 5.625 | 03-15-23 | 680,000 | 697,000 | |||||||||||||||||||||||||
| MasTec, Inc. | 4.875 | 03-15-23 | 1,915,000 | 1,603,813 | |||||||||||||||||||||||||
| Mediacom LLC | 7.250 | 02-15-22 | 2,015,000 | 2,025,075 | |||||||||||||||||||||||||
| MEDNAX, Inc. (S) | 5.250 | 12-01-23 | 810,000 | 830,250 | |||||||||||||||||||||||||
| MGM Resorts International | 6.625 | 12-15-21 | 1,610,000 | 1,654,275 | |||||||||||||||||||||||||
| Midstates Petroleum Company, Inc. | 10.750 | 10-01-20 | 945,000 | 42,525 | |||||||||||||||||||||||||
| MPG Holdco I, Inc. | 7.375 | 10-15-22 | 1,360,000 | 1,312,400 | |||||||||||||||||||||||||
| NCI Building Systems, Inc. (S) | 8.250 | 01-15-23 | 705,000 | 733,200 | |||||||||||||||||||||||||
| NCR Corp. | 5.000 | 07-15-22 | 825,000 | 783,750 | |||||||||||||||||||||||||
| Nexstar Broadcasting, Inc. | 6.875 | 11-15-20 | 1,815,000 | 1,819,538 | |||||||||||||||||||||||||
| NRG Energy, Inc. | 6.250 | 07-15-22 | 1,905,000 | 1,571,625 | |||||||||||||||||||||||||
| Nuance Communications, Inc. (S) | 5.375 | 08-15-20 | 1,250,000 | 1,246,875 | |||||||||||||||||||||||||
| Oasis Petroleum, Inc. | 7.250 | 02-01-19 | 1,660,000 | 1,029,200 | |||||||||||||||||||||||||
| Outerwall, Inc. | 6.000 | 03-15-19 | 1,480,000 | 1,285,750 | |||||||||||||||||||||||||
| Outfront Media Capital LLC | 5.250 | 02-15-22 | 805,000 | 823,113 | |||||||||||||||||||||||||
| Owens-Brockway Glass Container, Inc. (S) | 5.875 | 08-15-23 | 1,020,000 | 1,000,875 | |||||||||||||||||||||||||
| Pilgrim's Pride Corp. (S) | 5.750 | 03-15-25 | 1,165,000 | 1,121,313 | |||||||||||||||||||||||||
| Pinnacle Entertainment, Inc. | 6.375 | 08-01-21 | 1,110,000 | 1,176,600 | |||||||||||||||||||||||||
| Pinnacle Foods, Inc. (S) | 5.875 | 01-15-24 | 675,000 | 698,625 | |||||||||||||||||||||||||
| Platform Specialty Products Corp. (S) | 6.500 | 02-01-22 | 1,050,000 | 824,250 | |||||||||||||||||||||||||
| Post Holdings, Inc. | 7.375 | 02-15-22 | 1,535,000 | 1,617,506 | |||||||||||||||||||||||||
| QEP Resources, Inc. | 5.375 | 10-01-22 | 1,645,000 | 1,118,600 | |||||||||||||||||||||||||
| Quicken Loans, Inc. (S) | 5.750 | 05-01-25 | 985,000 | 923,438 | |||||||||||||||||||||||||
| Quiksilver, Inc. (H)(S) | 7.875 | 08-01-18 | 1,095,000 | 219,000 | |||||||||||||||||||||||||
| Quiksilver, Inc. (H) | 10.000 | 08-01-20 | 515,000 | 30,900 | |||||||||||||||||||||||||
| Quintiles Transnational Corp. (S) | 4.875 | 05-15-23 | 480,000 | 486,000 | |||||||||||||||||||||||||
| Revlon Consumer Products Corp. | 5.750 | 02-15-21 | 685,000 | 667,875 | |||||||||||||||||||||||||
| RHP Hotel Properties LP | 5.000 | 04-15-21 | 1,235,000 | 1,250,438 | |||||||||||||||||||||||||
| RJS Power Holdings LLC (S) | 4.625 | 07-15-19 | 1,550,000 | 1,185,750 | |||||||||||||||||||||||||
| RSI Home Products, Inc. (S) | 6.500 | 03-15-23 | 1,390,000 | 1,428,225 | |||||||||||||||||||||||||
| Sally Holdings LLC | 5.625 | 12-01-25 | 780,000 | 805,350 | |||||||||||||||||||||||||
| Rate (%) | Maturity date | Par value^ | Value | ||||||||||||||||||||||||||
| United States (continued) | |||||||||||||||||||||||||||||
| Shea Homes LP (S) | 5.875 | 04-01-23 | 680,000 | $680,850 | |||||||||||||||||||||||||
| Signode Industrial Group Lux SA (S) | 6.375 | 05-01-22 | 990,000 | 821,700 | |||||||||||||||||||||||||
| Sinclair Television Group, Inc. | 6.125 | 10-01-22 | 1,745,000 | 1,801,713 | |||||||||||||||||||||||||
| Smithfield Foods, Inc. | 6.625 | 08-15-22 | 1,000,000 | 1,056,100 | |||||||||||||||||||||||||
| Spectrum Brands, Inc. (S) | 5.750 | 07-15-25 | 1,110,000 | 1,137,750 | |||||||||||||||||||||||||
| Spectrum Brands, Inc. (S) | 6.125 | 12-15-24 | 770,000 | 800,800 | |||||||||||||||||||||||||
| Sprint Capital Corp. | 8.750 | 03-15-32 | 3,280,000 | 2,312,400 | |||||||||||||||||||||||||
| T-Mobile USA, Inc. | 6.500 | 01-15-26 | 1,165,000 | 1,159,175 | |||||||||||||||||||||||||
| T-Mobile USA, Inc. | 6.731 | 04-28-22 | 1,655,000 | 1,700,513 | |||||||||||||||||||||||||
| Talen Energy Supply LLC | 6.500 | 06-01-25 | 545,000 | 307,925 | |||||||||||||||||||||||||
| Team Health, Inc. (S) | 7.250 | 12-15-23 | 1,115,000 | 1,165,175 | |||||||||||||||||||||||||
| TEGNA, Inc. | 6.375 | 10-15-23 | 1,435,000 | 1,513,925 | |||||||||||||||||||||||||
| Tenet Healthcare Corp. | 6.000 | 10-01-20 | 290,000 | 307,400 | |||||||||||||||||||||||||
| Tesoro Logistics LP | 5.875 | 10-01-20 | 622,000 | 578,460 | |||||||||||||||||||||||||
| Tesoro Logistics LP | 6.125 | 10-15-21 | 810,000 | 733,050 | |||||||||||||||||||||||||
| The Goodyear Tire & Rubber Company | 5.125 | 11-15-23 | 545,000 | 557,263 | |||||||||||||||||||||||||
| The Sun Products Corp. (S) | 7.750 | 03-15-21 | 900,000 | 825,750 | |||||||||||||||||||||||||
| The William Carter Company | 5.250 | 08-15-21 | 1,125,000 | 1,161,563 | |||||||||||||||||||||||||
| Tops Holding LLC (S) | 8.000 | 06-15-22 | 1,150,000 | 1,092,500 | |||||||||||||||||||||||||
| Tribune Media Company (S) | 5.875 | 07-15-22 | 1,850,000 | 1,845,375 | |||||||||||||||||||||||||
| Trinseo Materials Operating SCA (S) | 6.750 | 05-01-22 | 1,195,000 | 1,135,250 | |||||||||||||||||||||||||
| VRX Escrow Corp. (S) | 5.875 | 05-15-23 | 1,445,000 | 1,293,275 | |||||||||||||||||||||||||
| WESCO Distribution, Inc. | 5.375 | 12-15-21 | 660,000 | 617,100 | |||||||||||||||||||||||||
| Windstream Corp. | 7.500 | 04-01-23 | 2,073,000 | 1,591,028 | |||||||||||||||||||||||||
| Xerium Technologies, Inc. | 8.875 | 06-15-18 | 570,000 | 553,613 | |||||||||||||||||||||||||
| XPO Logistics, Inc. (S) | 6.500 | 06-15-22 | 1,255,000 | 1,123,225 | |||||||||||||||||||||||||
| ZF North America Capital, Inc. (S) | 4.750 | 04-29-25 | 1,060,000 | 993,750 | |||||||||||||||||||||||||
| Venezuela 1.7% | 6,720,519 | ||||||||||||||||||||||||||||
| Petroleos de Venezuela SA | 5.125 | 10-28-16 | 1,813,794 | 1,006,656 | |||||||||||||||||||||||||
| Petroleos de Venezuela SA | 5.250 | 04-12-17 | 4,271,000 | 1,665,690 | |||||||||||||||||||||||||
| Petroleos de Venezuela SA | 8.500 | 11-02-17 | 9,816,133 | 4,048,173 | |||||||||||||||||||||||||
| Foreign government obligations 32.2% |
$126,922,497 | ||||||||||||||||||||||||||||
| (Cost $137,679,227) | |||||||||||||||||||||||||||||
| Angola 0.7% | 2,799,038 | ||||||||||||||||||||||||||||
| Republic of Angola | |||||||||||||||||||||||||||||
| Bond | 7.000 | 08-16-19 | 852,188 | 802,075 | |||||||||||||||||||||||||
| Bond | 9.500 | 11-12-25 | 600,000 | 501,120 | |||||||||||||||||||||||||
| Bond (S) | 9.500 | 11-12-25 | 1,791,000 | 1,495,843 | |||||||||||||||||||||||||
| Argentina 1.9% | 7,580,702 | ||||||||||||||||||||||||||||
| Republic of Argentina | |||||||||||||||||||||||||||||
| Bond (H) | 2.260 | 12-31-38 | EUR | 472,449 | 283,351 | ||||||||||||||||||||||||
| Bond (H) | 5.870 | 03-31-23 | EUR | 600,000 | 332,328 | ||||||||||||||||||||||||
| Rate (%) | Maturity date | Par value^ | Value | ||||||||||||||||||||||||||
| Argentina (continued) | |||||||||||||||||||||||||||||
| Bond (H) | 6.000 | 03-31-23 | 946,000 | $1,106,820 | |||||||||||||||||||||||||
| Bond (H) | 7.820 | 12-31-33 | EUR | 488,517 | 543,942 | ||||||||||||||||||||||||
| Bond (H) | 7.820 | 12-31-33 | EUR | 3,877,680 | 4,359,719 | ||||||||||||||||||||||||
| Bond (H) | 9.250 | 07-20-49 | EUR | 38,000 | 42,400 | ||||||||||||||||||||||||
| Bond (H) | 9.750 | 11-26-49 | EUR | 4,000 | 4,767 | ||||||||||||||||||||||||
| Bond (H) | 10.250 | 01-26-49 | EUR | 5,000 | 5,958 | ||||||||||||||||||||||||
| Bond (H) | 11.000 | 12-04-49 | 54,000 | 108,540 | |||||||||||||||||||||||||
| Bond (H) | 11.375 | 01-30-17 | 4,000 | 8,360 | |||||||||||||||||||||||||
| Bond (H) | 11.750 | 04-07-49 | 3,000 | 6,030 | |||||||||||||||||||||||||
| Bond (H) | 12.250 | 06-19-18 | 5,306 | 11,090 | |||||||||||||||||||||||||
| Bond (H) | 15.500 | 12-19-49 | 34,000 | 71,060 | |||||||||||||||||||||||||
| GDP-Linked Note (I) | 4.380 | * | 12-15-35 | EUR | 3,898,942 | 432,085 | |||||||||||||||||||||||
| GDP-Linked Note (I) | 4.447 | * | 12-15-35 | 2,424,329 | 264,252 | ||||||||||||||||||||||||
| Azerbaijan 0.3% | 1,311,975 | ||||||||||||||||||||||||||||
| Republic of Azerbaijan Bond (S) |
4.750 | 03-18-24 | 1,470,000 | 1,311,975 | |||||||||||||||||||||||||
| Bahrain 0.1% | 552,260 | ||||||||||||||||||||||||||||
| Kingdom of Bahrain Bond (S) |
7.000 | 01-26-26 | 554,000 | 552,260 | |||||||||||||||||||||||||
| Brazil 2.3% | 9,104,433 | ||||||||||||||||||||||||||||
| Federative Republic of Brazil | |||||||||||||||||||||||||||||
| Bond | 2.625 | 01-05-23 | 1,349,000 | 1,062,338 | |||||||||||||||||||||||||
| Bond | 4.250 | 01-07-25 | 2,346,000 | 1,964,775 | |||||||||||||||||||||||||
| Bond | 5.000 | 01-27-45 | 1,658,000 | 1,139,875 | |||||||||||||||||||||||||
| Bond | 5.625 | 01-07-41 | 2,141,000 | 1,605,750 | |||||||||||||||||||||||||
| Bond | 7.125 | 01-20-37 | 2,321,000 | 2,100,505 | |||||||||||||||||||||||||
| Bond | 8.250 | 01-20-34 | 1,219,000 | 1,231,190 | |||||||||||||||||||||||||
| Cameroon 0.1% | 234,955 | ||||||||||||||||||||||||||||
| Republic of Cameroon Bond |
9.500 | 11-19-25 | 274,000 | 234,955 | |||||||||||||||||||||||||
| Colombia 2.2% | 8,842,971 | ||||||||||||||||||||||||||||
| Bogota Distrito Capital Bond |
9.750 | 07-26-28 | COP | 2,728,000,000 | 871,589 | ||||||||||||||||||||||||
| Republic of Colombia | |||||||||||||||||||||||||||||
| Bond | 2.625 | 03-15-23 | COP | 510,000,000 | 173,237 | ||||||||||||||||||||||||
| Bond | 4.000 | 02-26-24 | 4,115,000 | 3,863,985 | |||||||||||||||||||||||||
| Bond | 5.000 | 06-15-45 | 624,000 | 510,120 | |||||||||||||||||||||||||
| Bond | 5.625 | 02-26-44 | 293,000 | 255,643 | |||||||||||||||||||||||||
| Bond | 7.375 | 09-18-37 | 1,828,000 | 1,919,400 | |||||||||||||||||||||||||
| Bond | 7.750 | 04-14-21 | COP | 633,000,000 | 193,227 | ||||||||||||||||||||||||
| Bond | 8.125 | 05-21-24 | 450,000 | 529,875 | |||||||||||||||||||||||||
| Bond | 10.375 | 01-28-33 | 391,000 | 525,895 | |||||||||||||||||||||||||
| Rate (%) | Maturity date | Par value^ | Value | ||||||||||||||||||||||||||
| Costa Rica 1.5% | $5,869,230 | ||||||||||||||||||||||||||||
| Republic of Costa Rica | |||||||||||||||||||||||||||||
| Bond | 4.250 | 01-26-23 | 3,660,000 | 3,229,950 | |||||||||||||||||||||||||
| Bond (S) | 7.000 | 04-04-44 | 1,622,000 | 1,362,480 | |||||||||||||||||||||||||
| Bond | 7.158 | 03-12-45 | 1,520,000 | 1,276,800 | |||||||||||||||||||||||||
| Croatia 0.9% | 3,430,869 | ||||||||||||||||||||||||||||
| Republic of Croatia | |||||||||||||||||||||||||||||
| Bond (S) | 5.500 | 04-04-23 | 630,000 | 657,090 | |||||||||||||||||||||||||
| Bond | 6.250 | 04-27-17 | 1,450,000 | 1,508,178 | |||||||||||||||||||||||||
| Bond (S) | 6.375 | 03-24-21 | 549,000 | 595,116 | |||||||||||||||||||||||||
| Bond | 6.625 | 07-14-20 | 614,000 | 670,485 | |||||||||||||||||||||||||
| Dominican Republic 1.7% | 6,557,841 | ||||||||||||||||||||||||||||
| Government of Dominican Republic | |||||||||||||||||||||||||||||
| Bond (S) | 5.875 | 04-18-24 | 1,461,000 | 1,409,865 | |||||||||||||||||||||||||
| Bond | 6.600 | 01-28-24 | 2,459,000 | 2,477,443 | |||||||||||||||||||||||||
| Bond (S) | 6.850 | 01-27-45 | 654,000 | 596,775 | |||||||||||||||||||||||||
| Bond | 7.500 | 05-06-21 | 1,961,000 | 2,073,758 | |||||||||||||||||||||||||
| Ecuador 0.1% | 444,000 | ||||||||||||||||||||||||||||
| Government of Ecuador Bond |
10.500 | 03-24-20 | 600,000 | 444,000 | |||||||||||||||||||||||||
| Egypt 0.4% | 1,687,886 | ||||||||||||||||||||||||||||
| Arab Republic of Egypt Bond (S) |
5.875 | 06-11-25 | 2,024,000 | 1,687,886 | |||||||||||||||||||||||||
| El Salvador 1.0% | 3,912,382 | ||||||||||||||||||||||||||||
| Republic of El Salvador | |||||||||||||||||||||||||||||
| Bond | 7.375 | 12-01-19 | 880,000 | 848,100 | |||||||||||||||||||||||||
| Bond | 7.650 | 06-15-35 | 1,995,000 | 1,571,063 | |||||||||||||||||||||||||
| Bond | 7.750 | 01-24-23 | 1,135,000 | 1,056,969 | |||||||||||||||||||||||||
| Bond | 8.250 | 04-10-32 | 500,000 | 436,250 | |||||||||||||||||||||||||
| Ethiopia 0.2% | 613,323 | ||||||||||||||||||||||||||||
| Federal Democratic Republic of Ethiopia Bond (S) |
6.625 | 12-11-24 | 713,000 | 613,323 | |||||||||||||||||||||||||
| Gabon 0.2% | 985,512 | ||||||||||||||||||||||||||||
| Republic of Gabon | |||||||||||||||||||||||||||||
| Bond | 6.375 | 12-12-24 | 277,684 | 214,327 | |||||||||||||||||||||||||
| Bond | 6.950 | 06-16-25 | 480,000 | 472,371 | |||||||||||||||||||||||||
| Bond (S) | 6.950 | 06-16-25 | 388,000 | 298,814 | |||||||||||||||||||||||||
| Ghana 0.7% | 2,833,815 | ||||||||||||||||||||||||||||
| Republic of Ghana | |||||||||||||||||||||||||||||
| Bond | 7.875 | 08-07-23 | 611,000 | 442,571 | |||||||||||||||||||||||||
| Bond (S) | 7.875 | 08-07-23 | 1,107,000 | 800,361 | |||||||||||||||||||||||||
| Bond (S) | 8.125 | 01-18-26 | 905,000 | 648,089 | |||||||||||||||||||||||||
| Rate (%) | Maturity date | Par value^ | Value | ||||||||||||||||||||||||||
| Ghana (continued) | |||||||||||||||||||||||||||||
| Bond (S) | 10.750 | 10-14-30 | 996,000 | $942,794 | |||||||||||||||||||||||||
| Hungary 0.8% | 3,184,090 | ||||||||||||||||||||||||||||
| Republic of Hungary | |||||||||||||||||||||||||||||
| Bond | 4.375 | 07-04-17 | EUR | 442,000 | 505,312 | ||||||||||||||||||||||||
| Bond | 5.000 | 03-30-16 | GBP | 104,000 | 148,726 | ||||||||||||||||||||||||
| Bond | 5.375 | 02-21-23 | 1,939,000 | 2,119,715 | |||||||||||||||||||||||||
| Bond | 6.000 | 01-11-19 | EUR | 331,000 | 410,337 | ||||||||||||||||||||||||
| Indonesia 1.6% | 6,343,198 | ||||||||||||||||||||||||||||
| Republic of Indonesia | |||||||||||||||||||||||||||||
| Bond | 3.750 | 04-25-22 | 341,000 | 332,574 | |||||||||||||||||||||||||
| Bond (S) | 4.750 | 01-08-26 | 1,559,000 | 1,587,400 | |||||||||||||||||||||||||
| Bond | 4.875 | 05-05-21 | 472,000 | 496,145 | |||||||||||||||||||||||||
| Bond | 7.750 | 01-17-38 | 2,500,000 | 2,972,620 | |||||||||||||||||||||||||
| Bond | 8.500 | 10-12-35 | 755,000 | 954,459 | |||||||||||||||||||||||||
| Iraq 0.6% | 2,190,358 | ||||||||||||||||||||||||||||
| Republic of Iraq Bond |
5.800 | 01-15-28 | 3,463,000 | 2,190,358 | |||||||||||||||||||||||||
| Ivory Coast 1.6% | 6,127,650 | ||||||||||||||||||||||||||||
| Republic of Ivory Coast | |||||||||||||||||||||||||||||
| Bond (S) | 5.375 | 07-23-24 | 916,000 | 789,702 | |||||||||||||||||||||||||
| Bond | 5.750 | 12-31-32 | 4,637,000 | 4,027,782 | |||||||||||||||||||||||||
| Bond (S) | 6.375 | 03-03-28 | 1,487,000 | 1,310,166 | |||||||||||||||||||||||||
| Jamaica 0.6% | 2,561,213 | ||||||||||||||||||||||||||||
| Government of Jamaica | |||||||||||||||||||||||||||||
| Bond | 6.750 | 04-28-28 | 486,000 | 482,355 | |||||||||||||||||||||||||
| Bond | 7.625 | 07-09-25 | 1,451,000 | 1,534,433 | |||||||||||||||||||||||||
| Bond | 8.000 | 06-24-19 | 510,000 | 544,425 | |||||||||||||||||||||||||
| Kazakhstan 0.1% | 348,531 | ||||||||||||||||||||||||||||
| Republic of Kazakhstan Bond (S) |
4.875 | 10-14-44 | 423,000 | 348,531 | |||||||||||||||||||||||||
| Kenya 0.7% | 2,668,066 | ||||||||||||||||||||||||||||
| Republic of Kenya | |||||||||||||||||||||||||||||
| Bond (S) | 5.875 | 06-24-19 | 386,000 | 365,619 | |||||||||||||||||||||||||
| Bond (S) | 6.875 | 06-24-24 | 1,902,000 | 1,692,856 | |||||||||||||||||||||||||
| Bond | 6.875 | 06-24-24 | 684,000 | 609,591 | |||||||||||||||||||||||||
| Lithuania 0.1% | 217,580 | ||||||||||||||||||||||||||||
| Republic of Lithuania Bond (S) |
7.375 | 02-11-20 | 184,000 | 217,580 | |||||||||||||||||||||||||
| Mexico 0.9% | 3,609,844 | ||||||||||||||||||||||||||||
| Government of Mexico | |||||||||||||||||||||||||||||
| Bond | 3.600 | 01-30-25 | 877,000 | 851,786 | |||||||||||||||||||||||||
| Rate (%) | Maturity date | Par value^ | Value | ||||||||||||||||||||||||||
| Mexico (continued) | |||||||||||||||||||||||||||||
| Bond | 4.600 | 01-23-46 | 1,368,000 | $1,214,100 | |||||||||||||||||||||||||
| Bond | 4.750 | 03-08-44 | 566,000 | 510,815 | |||||||||||||||||||||||||
| Bond | 5.550 | 01-21-45 | 150,000 | 151,463 | |||||||||||||||||||||||||
| Bond | 6.050 | 01-11-40 | 824,000 | 881,680 | |||||||||||||||||||||||||
| Morocco 0.0% | 74,382 | ||||||||||||||||||||||||||||
| Kingdom of Morocco Bond (S) |
4.250 | 12-11-22 | 74,000 | 74,382 | |||||||||||||||||||||||||
| Mozambique 0.1% | 409,005 | ||||||||||||||||||||||||||||
| Republic of Mozambique Bond |
6.305 | 09-11-20 | 516,880 | 409,005 | |||||||||||||||||||||||||
| Namibia 0.1% | 563,325 | ||||||||||||||||||||||||||||
| Republic of Namibia Bond (S) |
5.250 | 10-29-25 | 609,000 | 563,325 | |||||||||||||||||||||||||
| Nigeria 0.6% | 2,274,582 | ||||||||||||||||||||||||||||
| Federal Republic of Nigeria | |||||||||||||||||||||||||||||
| Bond (S) | 6.375 | 07-12-23 | 526,000 | 465,194 | |||||||||||||||||||||||||
| Bond | 6.375 | 07-12-23 | 353,000 | 312,941 | |||||||||||||||||||||||||
| Bond | 6.750 | 01-28-21 | 1,589,000 | 1,496,447 | |||||||||||||||||||||||||
| Panama 1.2% | 4,692,023 | ||||||||||||||||||||||||||||
| Republic of Panama | |||||||||||||||||||||||||||||
| Bond | 6.700 | 01-26-36 | 1,234,000 | 1,474,630 | |||||||||||||||||||||||||
| Bond | 7.125 | 01-29-26 | 101,000 | 124,735 | |||||||||||||||||||||||||
| Bond | 8.125 | 04-28-34 | 472,000 | 617,140 | |||||||||||||||||||||||||
| Bond | 8.875 | 09-30-27 | 491,000 | 682,490 | |||||||||||||||||||||||||
| Bond | 9.375 | 04-01-29 | 1,243,000 | 1,793,028 | |||||||||||||||||||||||||
| Paraguay 0.3% | 1,205,198 | ||||||||||||||||||||||||||||
| Republic of Paraguay | |||||||||||||||||||||||||||||
| Bond (S) | 4.625 | 01-25-23 | 379,000 | 370,473 | |||||||||||||||||||||||||
| Bond (S) | 6.100 | 08-11-44 | 865,000 | 834,725 | |||||||||||||||||||||||||
| Peru 1.2% | 4,784,172 | ||||||||||||||||||||||||||||
| Republic of Peru | |||||||||||||||||||||||||||||
| Bond | 4.125 | 08-25-27 | 919,000 | 908,432 | |||||||||||||||||||||||||
| Bond | 6.550 | 03-14-37 | 1,596,000 | 1,839,390 | |||||||||||||||||||||||||
| Bond | 8.750 | 11-21-33 | 1,465,000 | 2,036,350 | |||||||||||||||||||||||||
| Philippines 0.5% | 1,895,923 | ||||||||||||||||||||||||||||
| Republic of Philippines | |||||||||||||||||||||||||||||
| Bond | 6.375 | 01-15-32 | 141,000 | 187,968 | |||||||||||||||||||||||||
| Bond | 7.750 | 01-14-31 | 566,000 | 826,661 | |||||||||||||||||||||||||
| Bond | 9.500 | 02-02-30 | 540,000 | 881,294 | |||||||||||||||||||||||||
| Rate (%) | Maturity date | Par value^ | Value | ||||||||||||||||||||||||||
| Poland 0.1% | $270,000 | ||||||||||||||||||||||||||||
| Republic of Poland Bond |
3.000 | 03-17-23 | 274,000 | 270,000 | |||||||||||||||||||||||||
| Romania 0.3% | 1,156,694 | ||||||||||||||||||||||||||||
| Government of Romania | |||||||||||||||||||||||||||||
| Bond (S) | 4.375 | 08-22-23 | 536,000 | 563,556 | |||||||||||||||||||||||||
| Bond | 6.750 | 02-07-22 | 502,000 | 593,138 | |||||||||||||||||||||||||
| Russia 0.8% | 3,081,708 | ||||||||||||||||||||||||||||
| Government of Russia | |||||||||||||||||||||||||||||
| Bond | 5.625 | 04-04-42 | 2,800,000 | 2,689,218 | |||||||||||||||||||||||||
| Bond | 5.875 | 09-16-43 | 400,000 | 392,490 | |||||||||||||||||||||||||
| Serbia 0.2% | 841,612 | ||||||||||||||||||||||||||||
| Republic of Serbia | |||||||||||||||||||||||||||||
| Bond | 4.875 | 02-25-20 | 613,000 | 624,779 | |||||||||||||||||||||||||
| Bond (S) | 5.875 | 12-03-18 | 207,000 | 216,833 | |||||||||||||||||||||||||
| South Africa 0.3% | 1,190,896 | ||||||||||||||||||||||||||||
| Republic of South Africa Bond |
4.665 | 01-17-24 | 1,223,000 | 1,190,896 | |||||||||||||||||||||||||
| Sri Lanka 0.5% | 2,112,399 | ||||||||||||||||||||||||||||
| Republic of Sri Lanka | |||||||||||||||||||||||||||||
| Bond (S) | 5.875 | 07-25-22 | 1,469,000 | 1,327,422 | |||||||||||||||||||||||||
| Bond (S) | 6.125 | 06-03-25 | 900,000 | 784,977 | |||||||||||||||||||||||||
| Trinidad And Tobago 0.3% | 1,168,275 | ||||||||||||||||||||||||||||
| Republic of Trinidad & Tobago Bond (S) |
4.375 | 01-16-24 | 1,110,000 | 1,168,275 | |||||||||||||||||||||||||
| Turkey 1.7% | 6,614,485 | ||||||||||||||||||||||||||||
| Republic of Turkey | |||||||||||||||||||||||||||||
| Bond | 3.250 | 03-23-23 | 1,530,000 | 1,417,441 | |||||||||||||||||||||||||
| Bond | 4.875 | 04-16-43 | 582,000 | 518,708 | |||||||||||||||||||||||||
| Bond | 5.750 | 03-22-24 | 1,757,000 | 1,878,233 | |||||||||||||||||||||||||
| Bond | 7.000 | 06-05-20 | 522,000 | 583,220 | |||||||||||||||||||||||||
| Bond | 7.375 | 02-05-25 | 1,882,000 | 2,216,883 | |||||||||||||||||||||||||
| Ukraine 1.0% | 4,000,976 | ||||||||||||||||||||||||||||
| Republic of Ukraine | |||||||||||||||||||||||||||||
| Bond (S) | 7.750 | 09-01-20 | 355,000 | 333,523 | |||||||||||||||||||||||||
| Bond (S) | 7.750 | 09-01-22 | 324,000 | 301,968 | |||||||||||||||||||||||||
| Bond (S) | 7.750 | 09-01-23 | 979,000 | 900,191 | |||||||||||||||||||||||||
| Bond (S) | 7.750 | 09-01-24 | 1,814,000 | 1,655,638 | |||||||||||||||||||||||||
| Bond (S) | 7.750 | 09-01-25 | 792,000 | 719,136 | |||||||||||||||||||||||||
| Bond (S) | 7.750 | 09-01-26 | 100,000 | 90,520 | |||||||||||||||||||||||||
| Uruguay 1.1% | 4,313,769 | ||||||||||||||||||||||||||||
| Rate (%) | Maturity date | Par value^ | Value | ||||||||||||||||||||||||||
| Uruguay (continued) | |||||||||||||||||||||||||||||
| Republic of Uruguay | |||||||||||||||||||||||||||||
| Bond | 4.375 | 10-27-27 | 1,650,000 | $1,608,750 | |||||||||||||||||||||||||
| Bond | 4.500 | 08-14-24 | 484,426 | 491,692 | |||||||||||||||||||||||||
| Bond | 5.100 | 06-18-50 | 2,558,760 | 2,213,327 | |||||||||||||||||||||||||
| Venezuela 0.1% | 352,350 | ||||||||||||||||||||||||||||
| Republic of Venezuela Bond |
13.625 | 08-15-18 | 810,000 | 352,350 | |||||||||||||||||||||||||
| Zambia 0.5% | 1,909,001 | ||||||||||||||||||||||||||||
| Republic of Zambia | |||||||||||||||||||||||||||||
| Bond | 5.375 | 09-20-22 | 200,000 | 133,280 | |||||||||||||||||||||||||
| Bond (S) | 8.500 | 04-14-24 | 507,000 | 362,312 | |||||||||||||||||||||||||
| Bond | 8.970 | 07-30-27 | 600,000 | 427,790 | |||||||||||||||||||||||||
| Bond (S) | 8.970 | 07-30-27 | 1,388,000 | 985,619 | |||||||||||||||||||||||||
| Term loans (M) 5.1% | $20,002,773 | ||||||||||||||||||||||||||||
| (Cost $22,993,734) | |||||||||||||||||||||||||||||
| Germany 0.4% | 1,650,726 | ||||||||||||||||||||||||||||
| Styrolution Group GmbH | 6.500 | 11-07-19 | 1,663,200 | 1,650,726 | |||||||||||||||||||||||||
| Luxembourg 0.2% | 626,905 | ||||||||||||||||||||||||||||
| Accudyne Industries Borrower SCA | 4.000 | 12-13-19 | 762,195 | 626,905 | |||||||||||||||||||||||||
| United States 4.5% | 17,725,142 | ||||||||||||||||||||||||||||
| Albertson's Holdings LLC | 5.500 | 08-25-21 | 2,283,299 | 2,231,569 | |||||||||||||||||||||||||
| Avago Technologies, Ltd. (T) | TBD | 02-01-23 | 1,130,000 | 1,110,564 | |||||||||||||||||||||||||
| Axalta Coating Systems US Holdings, Inc. | 3.750 | 02-01-20 | 541,941 | 536,231 | |||||||||||||||||||||||||
| Beacon Roofing Supply, Inc. | 4.000 | 10-01-22 | 663,338 | 659,814 | |||||||||||||||||||||||||
| Berry Plastics Corp. | 4.000 | 10-01-22 | 759,479 | 755,396 | |||||||||||||||||||||||||
| Gates Global LLC | 4.250 | 07-05-21 | 1,256,140 | 1,129,479 | |||||||||||||||||||||||||
| HD Supply, Inc. | 3.750 | 08-13-21 | 673,313 | 661,530 | |||||||||||||||||||||||||
| Hostess Brands LLC | 4.500 | 08-03-22 | 1,276,800 | 1,268,022 | |||||||||||||||||||||||||
| JC Penney Corp., Inc. | 6.000 | 05-22-18 | 860,000 | 839,844 | |||||||||||||||||||||||||
| La Quinta Intermediate Holdings LLC | 3.750 | 04-14-21 | 1,256,291 | 1,214,415 | |||||||||||||||||||||||||
| MacDermid, Inc. | 5.500 | 06-07-20 | 738,150 | 685,424 | |||||||||||||||||||||||||
| Micro Focus US, Inc. | 5.250 | 11-19-21 | 647,391 | 638,220 | |||||||||||||||||||||||||
| Petco Animal Supplies, Inc. (T) | TBD | 01-26-23 | 1,400,000 | 1,370,390 | |||||||||||||||||||||||||
| Reynolds Group Holdings, Inc. | 4.500 | 12-01-18 | 1,100,000 | 1,093,719 | |||||||||||||||||||||||||
| Summit Materials LLC | 4.250 | 07-17-22 | 716,400 | 703,863 | |||||||||||||||||||||||||
| Texas Competitive Electric Holdings Company LLC (H) | 4.646 | 10-10-17 | 4,483,433 | 1,339,426 | |||||||||||||||||||||||||
| Univision Communications, Inc. | 4.000 | 03-01-20 | 1,524,068 | 1,487,236 | |||||||||||||||||||||||||
| Shares | Value | ||||||||||||||||||||||||||||
| Common stocks 0.0% | $68,148 | ||||||||||||||||||||||||||||
| (Cost $456,967) | |||||||||||||||||||||||||||||
| United States 0.0% | 68,148 | ||||||||||||||||||||||||||||
| EME Reorganization Trust | 1,794,196 | 5,383 | |||||||||||||||||||||||||||
| NRG Energy, Inc. | 5,899 | 62,765 | |||||||||||||||||||||||||||
| Warrants 0.0% | $2 | ||||||||||||||||||||||||||||
| (Cost $0) | |||||||||||||||||||||||||||||
| Marshall Islands 0.0% | 2 | ||||||||||||||||||||||||||||
| General Maritime Corp. (Expiration Date: 5-17-17) (I)(N) | 1,262 | 2 | |||||||||||||||||||||||||||
| Yield (%) | Shares | Value | |||||||||||||||||||||||||||
| Short-term investments 2.4% | $9,409,349 | ||||||||||||||||||||||||||||
| (Cost $9,409,349) | |||||||||||||||||||||||||||||
| Money market funds 2.4% | 9,409,349 | ||||||||||||||||||||||||||||
| Morgan Stanley Institutional Liquidity Funds - Prime Portfolio | 0.3471(Y) | 9,409,349 | 9,409,349 | ||||||||||||||||||||||||||
| Total investments (Cost $438,460,158)† 99.1% | $390,146,057 | ||||||||||||||||||||||||||||
| Other assets and liabilities, net 0.9% | $3,475,017 | ||||||||||||||||||||||||||||
| Total net assets 100.0% | $393,621,074 | ||||||||||||||||||||||||||||
| The percentage shown for each investment category is the total value of the category as a percentage of the net assets of the fund. | |||||||||||||||||||||||||||||
| ^All par values are denominated in U.S. Dollars unless otherwise indicated. | |||||||||||||||||||||||||||||
| Key to Currency Abbreviations | |||||||||||||||||||||||||||||
| COP | Colombian Peso | ||||||||||||||||||||||||||||
| EUR | Euro | ||||||||||||||||||||||||||||
| GBP | Pound Sterling | ||||||||||||||||||||||||||||
| Key to Security Abbreviations and Legend | |||||||||||||||||||||||||||||
| PIK | Payment-in-kind | ||||||||||||||||||||||||||||
| TBD | To Be Determined | ||||||||||||||||||||||||||||
| (H) | Non-income producing - Issuer is in default. | ||||||||||||||||||||||||||||
| (I) | Non-income producing security. | ||||||||||||||||||||||||||||
| (M) | Term loans are variable rate obligations. The coupon rate shown represents the rate at period end. | ||||||||||||||||||||||||||||
| (N) | Strike price and/or expiration date not available. | ||||||||||||||||||||||||||||
| (P) | Variable rate obligation. The coupon rate shown represents the rate at period end. | ||||||||||||||||||||||||||||
| (S) | These securities are exempt from registration under Rule 144A of the Securities Act of 1933. Such securities may be resold, normally to qualified institutional buyers, in transactions exempt from registration. Rule 144A securities amounted to $127,204,770 or 32.3% of the fund's net assets as of 1-31-16. | ||||||||||||||||||||||||||||
| (T) | This position represents an unsettled loan commitment at period end. Certain details associated with this purchase are not known prior to the settlement date, including coupon rate. | ||||||||||||||||||||||||||||
| (Y) | The rate shown is the annualized seven-day yield as of 1-31-16. | ||||||||||||||||||||||||||||
| * | Yield represents either the annualized yield at the date of purchase, the stated coupon rate or, for floating rate securities, the rate at period end. | ||||||||||||||||||||||||||||
| † | At 1-31-16, the aggregate cost of investment securities for federal income tax purposes was $440,668,267. Net unrealized depreciation aggregated $50,522,210, of which $1,548,188 related to appreciated investment securities and $52,070,398 related to depreciated investment securities. | ||||||||||||||||||||||||||||
Financial statements
STATEMENT OF ASSETS AND LIABILITIES 1-31-16 (unaudited)
| Assets | |||||||||||||||||||||||||||||||||
| Investments, at value (Cost $438,460,158) | $390,146,057 | ||||||||||||||||||||||||||||||||
| Cash | 203,339 | ||||||||||||||||||||||||||||||||
| Foreign currency, at value (Cost $21,502) | 21,534 | ||||||||||||||||||||||||||||||||
| Receivable for investments sold | 2,729,738 | ||||||||||||||||||||||||||||||||
| Receivable for fund shares sold | 3,112 | ||||||||||||||||||||||||||||||||
| Unrealized appreciation on forward foreign currency exchange contracts | 119,059 | ||||||||||||||||||||||||||||||||
| Dividends and interest receivable | 6,377,695 | ||||||||||||||||||||||||||||||||
| Receivable for exchange cleared swaps | 257,292 | ||||||||||||||||||||||||||||||||
| Other receivables and prepaid expenses | 67,000 | ||||||||||||||||||||||||||||||||
| Total assets | 399,924,826 | ||||||||||||||||||||||||||||||||
| Liabilities | |||||||||||||||||||||||||||||||||
| Payable for investments purchased | 6,011,600 | ||||||||||||||||||||||||||||||||
| Unrealized depreciation on forward foreign currency exchange contracts | 8,857 | ||||||||||||||||||||||||||||||||
| Payable for fund shares repurchased | 180,231 | ||||||||||||||||||||||||||||||||
| Distributions payable | 495 | ||||||||||||||||||||||||||||||||
| Payable to affiliates | |||||||||||||||||||||||||||||||||
| Accounting and legal services fees | 9,533 | ||||||||||||||||||||||||||||||||
| Transfer agent fees | 684 | ||||||||||||||||||||||||||||||||
| Trustees' fees | 1,071 | ||||||||||||||||||||||||||||||||
| Other liabilities and accrued expenses | 91,281 | ||||||||||||||||||||||||||||||||
| Total liabilities | 6,303,752 | ||||||||||||||||||||||||||||||||
| Net assets | $393,621,074 | ||||||||||||||||||||||||||||||||
| Net assets consist of | |||||||||||||||||||||||||||||||||
| Paid-in capital | $482,791,304 | ||||||||||||||||||||||||||||||||
| Accumulated distributions in excess of net investment income | (6,439 | ) | |||||||||||||||||||||||||||||||
| Accumulated net realized gain (loss) on investments, swap agreements and foreign currency transactions | (40,651,283 | ) | |||||||||||||||||||||||||||||||
| Net unrealized appreciation (depreciation) on investments, translation of assets and liabilities in foreign currencies and swap agreements | (48,512,508 | ) | |||||||||||||||||||||||||||||||
| Net assets | $393,621,074 | ||||||||||||||||||||||||||||||||
| Net asset value per share | |||||||||||||||||||||||||||||||||
| Based on net asset values and shares outstanding - The fund has an unlimited number of shares authorized with no par value | |||||||||||||||||||||||||||||||||
| Class A ($2,984,043 ÷ 350,321 shares)1 | $8.52 | ||||||||||||||||||||||||||||||||
| Class I ($145,978 ÷ 17,144 shares) | $8.51 | ||||||||||||||||||||||||||||||||
| Class NAV ($390,491,053 ÷ 45,835,977 shares) | $8.52 | ||||||||||||||||||||||||||||||||
| Maximum offering price per share | |||||||||||||||||||||||||||||||||
| Class A (net assets value per share ÷ 962 | $8.88 | ||||||||||||||||||||||||||||||||
| 1 | Redemption price per share is equal to net asset value less any applicable contingent deferred sales charge. | |||||||||||||||||||
| 2 | On single retail sales of less than $100,000. On sales of $100,000 or more and on group sales the offering price is reduced. | |||||||||||||||||||
STATEMENT OF OPERATIONS For the six months ended 1-31-16 (unaudited)
| Investment income | ||||||||||||||||||||||||
| Interest | $16,018,575 | |||||||||||||||||||||||
| Less foreign taxes withheld | (4,179 | ) | ||||||||||||||||||||||
| Total investment income | 16,014,396 | |||||||||||||||||||||||
| Expenses | ||||||||||||||||||||||||
| Investment management fees | 1,729,846 | |||||||||||||||||||||||
| Distribution and service fees | 5,169 | |||||||||||||||||||||||
| Accounting and legal services fees | 29,852 | |||||||||||||||||||||||
| Transfer agent fees | 2,189 | |||||||||||||||||||||||
| Trustees' fees | 4,336 | |||||||||||||||||||||||
| State registration fees | 41,571 | |||||||||||||||||||||||
| Printing and postage | 1,276 | |||||||||||||||||||||||
| Professional fees | 67,441 | |||||||||||||||||||||||
| Custodian fees | 41,170 | |||||||||||||||||||||||
| Registration and filing fees | 17,834 | |||||||||||||||||||||||
| Other | 25,647 | |||||||||||||||||||||||
| Total expenses | 1,966,331 | |||||||||||||||||||||||
| Less expense reductions | (16,541 | ) | ||||||||||||||||||||||
| Net expenses | 1,949,790 | |||||||||||||||||||||||
| Net investment income | 14,064,606 | |||||||||||||||||||||||
| Realized and unrealized gain (loss) | ||||||||||||||||||||||||
| Net realized gain (loss) on | ||||||||||||||||||||||||
| Investments and foreign currency transactions | (13,487,662 | ) | ||||||||||||||||||||||
| Swap contracts | (76,322 | ) | ||||||||||||||||||||||
| (13,563,984 | ) | |||||||||||||||||||||||
| Change in net unrealized appreciation (depreciation) of | ||||||||||||||||||||||||
| Investments and translation of assets and liabilities in foreign currencies | (26,147,107 | ) | ||||||||||||||||||||||
| Swap contracts | (365,101 | ) | ||||||||||||||||||||||
| (26,512,208 | ) | |||||||||||||||||||||||
| Net realized and unrealized loss | (40,076,192 | ) | ||||||||||||||||||||||
| Decrease in net assets from operations | ($26,011,586 | ) | ||||||||||||||||||||||
STATEMENTS OF CHANGES IN NET ASSETS
| Six months ended 1-31-16 | Year ended 7-31-15 | ||||||||||||||||||||||||||||||||||||||||||||
| (unaudited) | |||||||||||||||||||||||||||||||||||||||||||||
| Increase (decrease) in net assets | |||||||||||||||||||||||||||||||||||||||||||||
| From operations | |||||||||||||||||||||||||||||||||||||||||||||
| Net investment income | $14,064,606 | $31,026,439 | |||||||||||||||||||||||||||||||||||||||||||
| Net realized loss | (13,563,984 | ) | (18,305,125 | ) | |||||||||||||||||||||||||||||||||||||||||
| Change in net unrealized appreciation (depreciation) | (26,512,208 | ) | (29,657,256 | ) | |||||||||||||||||||||||||||||||||||||||||
| Decrease in net assets resulting from operations | (26,011,586 | ) | (16,935,942 | ) | |||||||||||||||||||||||||||||||||||||||||
| Distributions to shareholders | |||||||||||||||||||||||||||||||||||||||||||||
| From net investment income | |||||||||||||||||||||||||||||||||||||||||||||
| Class A | (101,685 | ) | (167,034 | ) | |||||||||||||||||||||||||||||||||||||||||
| Class I | (3,793 | ) | (29,854 | ) | |||||||||||||||||||||||||||||||||||||||||
| Class NAV | (13,915,584 | ) | (31,769,537 | ) | |||||||||||||||||||||||||||||||||||||||||
| Total distributions | (14,021,062 | ) | (31,966,425 | ) | |||||||||||||||||||||||||||||||||||||||||
| From fund share transactions | (64,030,152 | ) | (44,709,759 | ) | |||||||||||||||||||||||||||||||||||||||||
| Total decrease | (104,062,800 | ) | (93,612,126 | ) | |||||||||||||||||||||||||||||||||||||||||
| Net assets | |||||||||||||||||||||||||||||||||||||||||||||
| Beginning of period | 497,683,874 | 591,296,000 | |||||||||||||||||||||||||||||||||||||||||||
| End of period | $393,621,074 | $497,683,874 | |||||||||||||||||||||||||||||||||||||||||||
| Accumulated distributions in excess of net investment income | ($6,439 | ) | ($49,983 | ) | |||||||||||||||||||||||||||||||||||||||||
Financial highlights
| Class A Shares Period ended | 1-31-16 | 1 | 7-31-15 | 7-31-14 | 7-31-13 | 7-31-12 | 7-31-11 | |||||||||||||||||||||||||||||||||||||||||||||||||||||||||||||||||||||||||||||||||||||||||||||||||||||||||||||||
| Per share operating performance | ||||||||||||||||||||||||||||||||||||||||||||||||||||||||||||||||||||||||||||||||||||||||||||||||||||||||||||||||||||||
| Net asset value, beginning of period | $9.33 | $10.18 | $10.09 | $10.47 | $10.67 | $10.47 | ||||||||||||||||||||||||||||||||||||||||||||||||||||||||||||||||||||||||||||||||||||||||||||||||||||||||||||||||
| Net investment income2 | 0.27 | 0.49 | 0.47 | 0.52 | 0.63 | 0.65 | ||||||||||||||||||||||||||||||||||||||||||||||||||||||||||||||||||||||||||||||||||||||||||||||||||||||||||||||||
| Net realized and unrealized gain (loss) on investments | (0.82 | ) | (0.82 | ) | 0.21 | (0.21 | ) | 0.02 | 0.42 | |||||||||||||||||||||||||||||||||||||||||||||||||||||||||||||||||||||||||||||||||||||||||||||||||||||||||||||
| Total from investment operations | (0.55 | ) | (0.33 | ) | 0.68 | 0.31 | 0.65 | 1.07 | ||||||||||||||||||||||||||||||||||||||||||||||||||||||||||||||||||||||||||||||||||||||||||||||||||||||||||||||
| Less distributions | ||||||||||||||||||||||||||||||||||||||||||||||||||||||||||||||||||||||||||||||||||||||||||||||||||||||||||||||||||||||
| From net investment income | (0.26 | ) | (0.52 | ) | (0.51 | ) | (0.57 | ) | (0.71 | ) | (0.68 | ) | ||||||||||||||||||||||||||||||||||||||||||||||||||||||||||||||||||||||||||||||||||||||||||||||||||||||||||
| From net realized gain | — | — | (0.07 | ) | (0.12 | ) | (0.14 | ) | (0.19 | ) | ||||||||||||||||||||||||||||||||||||||||||||||||||||||||||||||||||||||||||||||||||||||||||||||||||||||||||||
| From tax return of capital | — | — | (0.01 | ) | — | — | — | |||||||||||||||||||||||||||||||||||||||||||||||||||||||||||||||||||||||||||||||||||||||||||||||||||||||||||||||
| Total distributions | (0.26 | ) | (0.52 | ) | (0.59 | ) | (0.69 | ) | (0.85 | ) | (0.87 | ) | ||||||||||||||||||||||||||||||||||||||||||||||||||||||||||||||||||||||||||||||||||||||||||||||||||||||||||
| Net asset value, end of period | $8.52 | $9.33 | $10.18 | $10.09 | $10.47 | $10.67 | ||||||||||||||||||||||||||||||||||||||||||||||||||||||||||||||||||||||||||||||||||||||||||||||||||||||||||||||||
| Total return (%)3,4 | (5.91 | ) 5 | (3.34 | ) | 6.95 | 2.85 | 6.72 | 10.67 | ||||||||||||||||||||||||||||||||||||||||||||||||||||||||||||||||||||||||||||||||||||||||||||||||||||||||||||||
| Ratios and supplemental data | ||||||||||||||||||||||||||||||||||||||||||||||||||||||||||||||||||||||||||||||||||||||||||||||||||||||||||||||||||||||
| Net assets, end of period (in millions) | $3 | $4 | $3 | $1 | — | 6 | — | 6 | ||||||||||||||||||||||||||||||||||||||||||||||||||||||||||||||||||||||||||||||||||||||||||||||||||||||||||||||
| Ratios (as a percentage of average net assets): | ||||||||||||||||||||||||||||||||||||||||||||||||||||||||||||||||||||||||||||||||||||||||||||||||||||||||||||||||||||||
| Expenses before reductions | 1.31 | 7 | 1.51 | 3.22 | 7.91 | 1.41 | 1.39 | |||||||||||||||||||||||||||||||||||||||||||||||||||||||||||||||||||||||||||||||||||||||||||||||||||||||||||||||
| Expenses including reductions | 1.30 | 7 | 1.35 | 1.35 | 1.34 | 1.30 | 1.30 | |||||||||||||||||||||||||||||||||||||||||||||||||||||||||||||||||||||||||||||||||||||||||||||||||||||||||||||||
| Net investment income | 5.94 | 7 | 5.11 | 4.65 | 5.18 | 6.17 | 6.11 | |||||||||||||||||||||||||||||||||||||||||||||||||||||||||||||||||||||||||||||||||||||||||||||||||||||||||||||||
| Portfolio turnover (%) | 29 | 63 | 70 | 71 | 48 | 68 | ||||||||||||||||||||||||||||||||||||||||||||||||||||||||||||||||||||||||||||||||||||||||||||||||||||||||||||||||
| 1 | Six months ended 1-31-16. Unaudited. | ||||||||||||||||||||||||||||||||||||||||||||||||||||||||||||||||||||||||||||||||||
| 2 | Based on average daily shares outstanding. | ||||||||||||||||||||||||||||||||||||||||||||||||||||||||||||||||||||||||||||||||||
| 3 | Total returns would have been lower had certain expenses not been reduced during the applicable periods. | ||||||||||||||||||||||||||||||||||||||||||||||||||||||||||||||||||||||||||||||||||
| 4 | Does not reflect the effect of sales charges, if any. | ||||||||||||||||||||||||||||||||||||||||||||||||||||||||||||||||||||||||||||||||||
| 5 | Not annualized. | ||||||||||||||||||||||||||||||||||||||||||||||||||||||||||||||||||||||||||||||||||
| 6 | Less than $500,000. | ||||||||||||||||||||||||||||||||||||||||||||||||||||||||||||||||||||||||||||||||||
| 7 | Annualized. | ||||||||||||||||||||||||||||||||||||||||||||||||||||||||||||||||||||||||||||||||||
| Class I Shares Period ended | 1-31-16 | 1 | 7-31-15 | 7-31-14 | 7-31-13 | 7-31-12 | 7-31-11 | |||||||||||||||||||||||||||||||||||||||||||||||||||||||||||||||||||||||||||||||||||||||||||||||||||||||||||||||
| Per share operating performance | ||||||||||||||||||||||||||||||||||||||||||||||||||||||||||||||||||||||||||||||||||||||||||||||||||||||||||||||||||||||
| Net asset value, beginning of period | $9.32 | $10.17 | $10.09 | $10.47 | $10.67 | $10.47 | ||||||||||||||||||||||||||||||||||||||||||||||||||||||||||||||||||||||||||||||||||||||||||||||||||||||||||||||||
| Net investment income2 | 0.28 | 0.46 | 0.50 | 0.55 | 0.66 | 0.68 | ||||||||||||||||||||||||||||||||||||||||||||||||||||||||||||||||||||||||||||||||||||||||||||||||||||||||||||||||
| Net realized and unrealized gain (loss) on investments | (0.81 | ) | (0.77 | ) | 0.20 | (0.21 | ) | 0.03 | 0.42 | |||||||||||||||||||||||||||||||||||||||||||||||||||||||||||||||||||||||||||||||||||||||||||||||||||||||||||||
| Total from investment operations | (0.53 | ) | (0.31 | ) | 0.70 | 0.34 | 0.69 | 1.10 | ||||||||||||||||||||||||||||||||||||||||||||||||||||||||||||||||||||||||||||||||||||||||||||||||||||||||||||||
| Less distributions | ||||||||||||||||||||||||||||||||||||||||||||||||||||||||||||||||||||||||||||||||||||||||||||||||||||||||||||||||||||||
| From net investment income | (0.28 | ) | (0.54 | ) | (0.53 | ) | (0.60 | ) | (0.75 | ) | (0.71 | ) | ||||||||||||||||||||||||||||||||||||||||||||||||||||||||||||||||||||||||||||||||||||||||||||||||||||||||||
| From net realized gain | — | — | (0.07 | ) | (0.12 | ) | (0.14 | ) | (0.19 | ) | ||||||||||||||||||||||||||||||||||||||||||||||||||||||||||||||||||||||||||||||||||||||||||||||||||||||||||||
| From tax return of capital | — | — | (0.02 | ) | — | — | — | |||||||||||||||||||||||||||||||||||||||||||||||||||||||||||||||||||||||||||||||||||||||||||||||||||||||||||||||
| Total distributions | (0.28 | ) | (0.54 | ) | (0.62 | ) | (0.72 | ) | (0.89 | ) | (0.90 | ) | ||||||||||||||||||||||||||||||||||||||||||||||||||||||||||||||||||||||||||||||||||||||||||||||||||||||||||
| Net asset value, end of period | $8.51 | $9.32 | $10.17 | $10.09 | $10.47 | $10.67 | ||||||||||||||||||||||||||||||||||||||||||||||||||||||||||||||||||||||||||||||||||||||||||||||||||||||||||||||||
| Total return (%)3 | (5.77 | ) 4 | (3.07 | ) | 7.17 | 3.17 | 7.05 | 11.00 | ||||||||||||||||||||||||||||||||||||||||||||||||||||||||||||||||||||||||||||||||||||||||||||||||||||||||||||||
| Ratios and supplemental data | ||||||||||||||||||||||||||||||||||||||||||||||||||||||||||||||||||||||||||||||||||||||||||||||||||||||||||||||||||||||
| Net assets, end of period (in millions) | — | 5 | — | 5 | — | 5 | — | 5 | — | 5 | — | 5 | ||||||||||||||||||||||||||||||||||||||||||||||||||||||||||||||||||||||||||||||||||||||||||||||||||||||||||
| Ratios (as a percentage of average net assets): | ||||||||||||||||||||||||||||||||||||||||||||||||||||||||||||||||||||||||||||||||||||||||||||||||||||||||||||||||||||||
| Expenses before reductions | 0.99 | 6 | 2.24 | 5.82 | 16.19 | 1.01 | 0.97 | |||||||||||||||||||||||||||||||||||||||||||||||||||||||||||||||||||||||||||||||||||||||||||||||||||||||||||||||
| Expenses including reductions | 0.98 | 6 | 1.04 | 1.04 | 1.02 | 1.00 | 1.00 | |||||||||||||||||||||||||||||||||||||||||||||||||||||||||||||||||||||||||||||||||||||||||||||||||||||||||||||||
| Net investment income | 6.27 | 6 | 4.74 | 4.92 | 5.31 | 6.47 | 6.41 | |||||||||||||||||||||||||||||||||||||||||||||||||||||||||||||||||||||||||||||||||||||||||||||||||||||||||||||||
| Portfolio turnover (%) | 29 | 63 | 70 | 71 | 48 | 68 | ||||||||||||||||||||||||||||||||||||||||||||||||||||||||||||||||||||||||||||||||||||||||||||||||||||||||||||||||
| 1 | Six months ended 1-31-16. Unaudited. | ||||||||||||||||||||||||||||||||||||||||||||||||||||||||||||||||||||||||||||||||||
| 2 | Based on average daily shares outstanding. | ||||||||||||||||||||||||||||||||||||||||||||||||||||||||||||||||||||||||||||||||||
| 3 | Total returns would have been lower had certain expenses not been reduced during the applicable periods. | ||||||||||||||||||||||||||||||||||||||||||||||||||||||||||||||||||||||||||||||||||
| 4 | Not annualized. | ||||||||||||||||||||||||||||||||||||||||||||||||||||||||||||||||||||||||||||||||||
| 5 | Less than $500,000. | ||||||||||||||||||||||||||||||||||||||||||||||||||||||||||||||||||||||||||||||||||
| 6 | Annualized. | ||||||||||||||||||||||||||||||||||||||||||||||||||||||||||||||||||||||||||||||||||
| Class NAV Shares Period ended | 1-31-16 | 1 | 7-31-15 | 7-31-14 | 7-31-13 | 7-31-12 | 7-31-11 | |||||||||||||||||||||||||||||||||||||||||||||||||||||||||||||||||||||||||||||||||||||||||||||||||||||||||||||||
| Per share operating performance | ||||||||||||||||||||||||||||||||||||||||||||||||||||||||||||||||||||||||||||||||||||||||||||||||||||||||||||||||||||||
| Net asset value, beginning of period | $9.33 | $10.18 | $10.09 | $10.47 | $10.67 | $10.47 | ||||||||||||||||||||||||||||||||||||||||||||||||||||||||||||||||||||||||||||||||||||||||||||||||||||||||||||||||
| Net investment income2 | 0.28 | 0.55 | 0.52 | 0.57 | 0.67 | 0.69 | ||||||||||||||||||||||||||||||||||||||||||||||||||||||||||||||||||||||||||||||||||||||||||||||||||||||||||||||||
| Net realized and unrealized gain (loss) on investments | (0.81 | ) | (0.83 | ) | 0.20 | (0.22 | ) | 0.03 | 0.42 | |||||||||||||||||||||||||||||||||||||||||||||||||||||||||||||||||||||||||||||||||||||||||||||||||||||||||||||
| Total from investment operations | (0.53 | ) | (0.28 | ) | 0.72 | 0.35 | 0.70 | 1.11 | ||||||||||||||||||||||||||||||||||||||||||||||||||||||||||||||||||||||||||||||||||||||||||||||||||||||||||||||
| Less distributions | ||||||||||||||||||||||||||||||||||||||||||||||||||||||||||||||||||||||||||||||||||||||||||||||||||||||||||||||||||||||
| From net investment income | (0.28 | ) | (0.57 | ) | (0.54 | ) | (0.61 | ) | (0.76 | ) | (0.72 | ) | ||||||||||||||||||||||||||||||||||||||||||||||||||||||||||||||||||||||||||||||||||||||||||||||||||||||||||
| From net realized gain | — | — | (0.07 | ) | (0.12 | ) | (0.14 | ) | (0.19 | ) | ||||||||||||||||||||||||||||||||||||||||||||||||||||||||||||||||||||||||||||||||||||||||||||||||||||||||||||
| From tax return of capital | — | — | (0.02 | ) | — | — | — | |||||||||||||||||||||||||||||||||||||||||||||||||||||||||||||||||||||||||||||||||||||||||||||||||||||||||||||||
| Total distributions | (0.28 | ) | (0.57 | ) | (0.63 | ) | (0.73 | ) | (0.90 | ) | (0.91 | ) | ||||||||||||||||||||||||||||||||||||||||||||||||||||||||||||||||||||||||||||||||||||||||||||||||||||||||||
| Net asset value, end of period | $8.52 | $9.33 | $10.18 | $10.09 | $10.47 | $10.67 | ||||||||||||||||||||||||||||||||||||||||||||||||||||||||||||||||||||||||||||||||||||||||||||||||||||||||||||||||
| Total return (%)3 | (5.71 | ) 4 | (2.85 | ) | 7.43 | 3.30 | 7.15 | 11.09 | ||||||||||||||||||||||||||||||||||||||||||||||||||||||||||||||||||||||||||||||||||||||||||||||||||||||||||||||
| Ratios and supplemental data | ||||||||||||||||||||||||||||||||||||||||||||||||||||||||||||||||||||||||||||||||||||||||||||||||||||||||||||||||||||||
| Net assets, end of period (in millions) | $390 | $494 | $589 | $542 | $469 | $377 | ||||||||||||||||||||||||||||||||||||||||||||||||||||||||||||||||||||||||||||||||||||||||||||||||||||||||||||||||
| Ratios (as a percentage of average net assets): | ||||||||||||||||||||||||||||||||||||||||||||||||||||||||||||||||||||||||||||||||||||||||||||||||||||||||||||||||||||||
| Expenses before reductions | 0.88 | 5 | 0.85 | 0.92 | 0.90 | 0.90 | 0.93 | |||||||||||||||||||||||||||||||||||||||||||||||||||||||||||||||||||||||||||||||||||||||||||||||||||||||||||||||
| Expenses including reductions | 0.87 | 5 | 0.84 | 0.91 | 0.90 | 0.90 | 0.92 | |||||||||||||||||||||||||||||||||||||||||||||||||||||||||||||||||||||||||||||||||||||||||||||||||||||||||||||||
| Net investment income | 6.34 | 5 | 5.66 | 5.18 | 5.44 | 6.55 | 6.50 | |||||||||||||||||||||||||||||||||||||||||||||||||||||||||||||||||||||||||||||||||||||||||||||||||||||||||||||||
| Portfolio turnover (%) | 29 | 63 | 70 | 71 | 48 | 68 | ||||||||||||||||||||||||||||||||||||||||||||||||||||||||||||||||||||||||||||||||||||||||||||||||||||||||||||||||
| 1 | Six months ended 1-31-16. Unaudited. | ||||||||||||||||||||||||||||||||||||||||||||||||||||||||||||||||||||||||||||||||||
| 2 | Based on average daily shares outstanding. | ||||||||||||||||||||||||||||||||||||||||||||||||||||||||||||||||||||||||||||||||||
| 3 | Total returns would have been lower had certain expenses not been reduced during the applicable periods. | ||||||||||||||||||||||||||||||||||||||||||||||||||||||||||||||||||||||||||||||||||
| 4 | Not annualized. | ||||||||||||||||||||||||||||||||||||||||||||||||||||||||||||||||||||||||||||||||||
| 5 | Annualized. | ||||||||||||||||||||||||||||||||||||||||||||||||||||||||||||||||||||||||||||||||||
Note 1 — Organization
John Hancock Global Income Fund (the fund) is a series of John Hancock Funds II (the Trust), an open-end management investment company organized as a Massachusetts business trust and registered under the Investment Company Act of 1940, as amended (the 1940 Act). The investment objective of the fund is to seek a high level of current income with capital appreciation as a secondary objective.
The fund may offer multiple classes of shares. The shares currently offered are detailed in the Statement of assets and liabilities. Class A shares are offered to all investors. Class I shares are offered to institutions and certain investors. Class NAV shares are offered to John Hancock affiliated funds of funds and certain 529 plans. Shareholders of each class have exclusive voting rights to matters that affect that class. The distribution and service fees, if any, and transfer agent fees, for each class may differ.
Note 2 — Significant accounting policies
The financial statements have been prepared in conformity with accounting principles generally accepted in the United States of America (US GAAP), which require management to make certain estimates and assumptions as of the date of the financial statements. Actual results could differ from those estimates and those differences could be significant. The fund qualifies as an investment company under Topic 946 of Accounting Standards Codification of US GAAP.
Events or transactions occurring after the end of the fiscal period through the date that the financial statements were issued have been evaluated in the preparation of the financial statements. The following summarizes the significant accounting policies of the fund:
Security valuation. Investments are stated at value as of the close of regular trading on the New York Stock Exchange (NYSE), normally at 4:00 p.m., Eastern Time. In order to value the securities, the fund uses the following valuation techniques: Debt obligations are valued based on the evaluated prices provided by an independent pricing vendor or from broker-dealers. Independent pricing vendors utilize matrix pricing which takes into account factors such as institutional-size trading in similar groups of securities, yield, quality, coupon rate, maturity, type of issue, trading characteristics and other market data, as well as broker supplied prices. Equity securities held by the fund are valued at the last sale price or official closing price on the exchange or principal marketwhere the security was acquired or most likely will be sold. In the event there were no sales during the day or closing prices are not available, the securities are valued using the last available bid price. Investments by the fund in underlying affiliated funds and/or other open-end management investment companies are valued at their respective net asset values each business day. Swaps are valued using evaluated prices obtained from an independent pricing vendor. Foreign securities and currencies, including forward foreign currency contracts, are valued in U.S. dollars, based on foreign currency exchange rates supplied by an independent pricing vendor. Securities that trade only in the over-the-counter (OTC) market are valued using bid prices.
Other portfolio securities and assets, for which reliable market quotations are not readily available, are valued at fair value as determined in good faith by the fund's Pricing Committee following procedures established by the Board of Trustees. The frequency with which these fair valuation procedures are used cannot be predicted and fair value of securities may differ significantly from the value that would have been used had a ready market for such securities existed. Trading in foreign securities may be completed before the daily close of trading on the NYSE. Significant events at the issuer or market level may affect the values of securities between the time when the valuation of the securities is generally determined and the close of the NYSE. If a significant event occurs, these securities may be fair valued, as determined in good faith by the fund's Pricing Committee, following procedures established by the Board of Trustees. The fund uses fair value adjustment factors provided by an independent pricing vendor to value certain foreign securities in order to adjust for events that may occur between the close of foreign exchanges or markets and the close of the NYSE.
The fund uses a three-tier hierarchy to prioritize the pricing assumptions, referred to as inputs, used in valuation techniques to measure fair value. Level 1 includes securities valued using quoted prices in active markets for identical securities. Level 2 includes securities valued using other significant observable inputs. Observable inputs may include quoted prices for similar securities, interest rates, prepayment speeds and credit risk. Prices for securities valued using these inputs are received from
independent pricing vendors and brokers and are based on an evaluation of the inputs described. Level 3 includes securities valued using significant unobservable inputs when market prices are not readily available or reliable, including the fund's own assumptions in determining the fair value of investments. Factors used in determining value may include market or issuer specific events or trends, changes in interest rates and credit quality. The inputs or methodology used for valuing securities are not necessarily an indication of the risks associated with investing in those securities. Changes in valuation techniques and related inputs may result in transfers into or out of an assigned level within the disclosure hierarchy.
The following is a summary of the values by input classification of the fund's investments as of January 31, 2016, by major security category or type:
| Total value at 1-31-16 |
Level 1 quoted price |
Level 2 significant observable inputs |
Level 3 significant unobservable inputs |
|||||||||||
| Corporate bonds | $233,743,288 | — | $233,743,288 | — | ||||||||||
| Foreign government obligations | 126,922,497 | — | 126,922,497 | — | ||||||||||
| Term loans | 20,002,773 | — | 20,002,773 | — | ||||||||||
| Common stocks | 68,148 | $68,148 | — | — | ||||||||||
| Warrants | 2 | — | 2 | — | ||||||||||
| Short-term investments | 9,409,349 | — | 9,409,349 | — | ||||||||||
| Total investments in securities | $390,146,057 | 68,148 | $390,077,909 | — | ||||||||||
| Other financial instruments | ||||||||||||||
| Forward foreign currency contracts | $110,202 | — | $110,202 | — | ||||||||||
| Interest rate swaps | ($296,239 | ) | — | ($296,239 | ) | — |
Term loans (Floating rate loans). The fund may invest in term loans, which often include debt securities that are rated below investment grade at the time of purchase. Term loans are generally subject to legal or contractual restrictions on resale and generally have longer settlement periods than conventional debt securities. Term loans involve special types of risk, including credit risk, interest-rate risk, counterparty risk, risk associated with extended settlement, and the risks of being a lender. The liquidity of term loans, including the volume and frequency of secondary market trading in such loans, varies significantly over time and among individual loans. During periods of infrequent trading, valuing a term loan can be more difficult and buying and selling a term loan at an acceptable price can be more difficult and delayed, which could result in a loss.
The fund's ability to receive payments of principal, interest and other amounts in connection with term loans will depend primarily on the financial condition of the borrower. The fund's failure to receive scheduled payments on a term loan due to a default, bankruptcy or other reason would adversely affect the fund's income and would likely reduce the value of its assets. Transactions in loan investments typically take a significant amount of time (i.e., seven days or longer) to settle. This could pose a liquidity risk to the fund and, if the fund's exposure to such investments is substantial, could impair the fund's ability to meet redemptions. Because term loans generally are not rated by independent credit rating agencies, a decision to invest in a particular loan could depend exclusively on the subadvisor's credit analysis of the borrower and/or term loan agents. There is greater risk that the fund may have limited rights to enforce the terms of an underlying loan than for other types of debt instruments.
Security transactions and related investment income. Investment security transactions are accounted for on a trade date plus one basis for daily net asset value calculations. However, for financial reporting purposes, investment transactions are reported on trade date. Interest income is accrued as earned. Interest income includes coupon interest and amortization/accretion of premiums/discounts on debt securities. Debt obligations may be placed in a non-accrual status and related interest income may be reduced by stopping current accruals and writing off interest receivable when the collection of all or a portion of interest has become doubtful. Foreign taxes are provided for based on the fund's understanding of the tax rules
and rates that exist in the foreign markets in which it invests. Gains and losses on securities sold are determined on the basis of identified cost and may include proceeds from litigation.
Foreign currency translation. Assets, including investments and liabilities denominated in foreign currencies, are translated into U.S. dollar values each day at the prevailing exchange rate. Purchases and sales of securities, income and expenses are translated into U.S. dollars at the prevailing exchange rate on the date of the transaction. The effect of changes in foreign currency exchange rates on the value of securities is reflected as a component of the realized and unrealized gains (losses) on investments.
Funds that invest internationally generally carry more risk than funds that invest strictly in U.S. securities. These risks are heightened for investments in emerging markets. Risks can result from differences in economic and political conditions, regulations, market practices (including higher transaction costs), accounting standards and other factors. Foreign investments are also subject to a decline in the value of a foreign currency versus the U.S. dollar, which reduces the dollar value of securities denominated in that currency.
Foreign taxes. The fund may be subject to withholding tax on income and/or capital gains or repatriation taxes imposed by certain countries in which the fund invests. Taxes are accrued based upon investment income, realized gains or unrealized appreciation.
Line of credit. The fund may borrow from banks for temporary or emergency purposes, including meeting redemption requests that otherwise might require the untimely sale of securities. Pursuant to the fund's custodian agreement, the custodian may loan money to the fund to make properly authorized payments. The fund is obligated to repay the custodian for any overdraft, including any related costs or expenses. The custodian may have a lien, security interest or security entitlement in any fund property that is not otherwise segregated or pledged, to the extent of any overdraft, and to the maximum extent permitted by law.
The fund and other affiliated funds entered into a syndicated line of credit agreement, with Citibank, N.A. as administrative agent, that enables them to participate in a $750 million unsecured committed line of credit. A commitment fee, payable at the end of each calendar quarter, based on the average daily unused portion of the effective line of credit, is charged to each participating fund on a pro rata basis and is reflected in Other expenses on the Statement of operations. Commitment fees for the six months ended January 31, 2016 were $399. For the six months ended January 31, 2016, the fund had no borrowings under the line of credit.
Expenses. Within the John Hancock group of funds complex, expenses that are directly attributable to an individual fund are allocated to such fund. Expenses that are not readily attributable to a specific fund are allocated among all funds in an equitable manner, taking into consideration, among other things, the nature and type of expense and the fund's relative net assets. Expense estimates are accrued in the period to which they relate and adjustments are made when actual amounts are known.
Class allocations. Income, common expenses and realized and unrealized gains (losses) are determined at the fund level and allocated daily to each class of shares based on the net assets of the class. Class-specific expenses, such as distribution and service fees, if any, and transfer agent fees, are calculated daily for each class, based on the net asset value of the class and the applicable specific expense rates.
Federal income taxes. The fund intends to continue to qualify as a regulated investment company by complying with the applicable provisions of the Internal Revenue Code and will not be subject to federal income tax on taxable income that is distributed to shareholders. Therefore, no federal income tax provision is required.
For federal income tax purposes, as of July 31, 2015, the fund has a short-term capital loss carryfoward of $12,993,565 and a long-term capital loss carryforward of $10,964,720 available to offset future net realized capital gains. These carryforwards do not expire.
As of July 31, 2015, the fund had no uncertain tax positions that would require financial statement recognition, derecognition or disclosure. The fund's federal tax returns are subject to examination by the Internal Revenue Service for a period of three years.
Distribution of income and gains. Distributions to shareholders from net investment income and net realized gains, if any, are recorded on the ex-date. The fund generally declares dividends daily and pays them monthly. Capital gain distributions, if any, are typically distributed annually.
Distributions paid by the fund with respect to each class of shares are calculated in the same manner, at the same time and in the same amount, except for the effect of class level expenses that may be applied differently to each class.
Such distributions, on a tax basis, are determined in conformity with income tax regulations, which may differ from US GAAP.
Capital accounts within the financial statements are adjusted for permanent book-tax differences. These adjustments have no impact on net assets or the results of operations. Temporary book-tax differences, if any, will reverse in a subsequent period. Book-tax differences are primarily attributable to foreign currency transactions, wash sale loss deferrals and amortization and accretion on debt securities.
Note 3 — Derivative instruments
The fund may invest in derivatives in order to meet its investment objectives. Derivatives include a variety of different instruments that may be traded in the OTC market, on a regulated exchange or through a clearing facility. The risks in using derivatives vary depending upon the structure of the instruments, including the use of leverage, optionality, the liquidity or lack of liquidity of the contract, the creditworthiness of the counterparty or clearing organization and the volatility of the position. Some derivatives involve risks that are potentially greater than the risks associated with investing directly in the referenced securities or other referenced underlying instrument. Specifically, the fund is exposed to the risk that the counterparty to an OTC derivatives contract will be unable or unwilling to make timely settlement payments or otherwise honor its obligations. OTC derivatives transactions typically can only be closed out with the other party to the transaction.
Forward foreign currency contracts and certain swaps are typically traded through the OTC market. Certain forwards and swaps are regulated by the Commodity Futures Trading Commission (the CFTC) as swaps. Derivative counterparty risk is managed through an ongoing evaluation of the creditworthiness of all potential counterparties and, if applicable, designated clearing organizations. The fund attempts to reduce its exposure to counterparty risk for derivatives traded in the OTC market, whenever possible, by entering into an International Swaps and Derivatives Association (ISDA) Master Agreement with each of its OTC counterparties. The ISDA gives each party to the agreement the right to terminate all transactions traded under the agreement if there is certain deterioration in the credit quality or contractual default of the other party, as defined in the ISDA. Upon an event of default or a termination of the ISDA, the non-defaulting party has the right to close out all transactions and to net amounts owed.
As defined by the ISDA, the fund may have collateral agreements with certain counterparties to mitigate counterparty risk on OTC derivatives. Subject to established minimum levels, collateral for OTC transactions is generally determined based on the net aggregate unrealized gain or loss on contracts with a particular counterparty. Collateral pledged to the fund is held in a segregated account by a third-party agent or held by the custodian bank for the benefit of the fund and can be in the form of cash or debt securities issued by the U.S. government or related agencies; collateral posted by the fund for OTC transactions is held in a segregated account at the fund's custodian and is noted in the accompanying Fund's investments, or if cash is posted, on the Statement of assets and liabilities. The fund's maximum risk of loss due to counterparty risk is equal to the asset value of outstanding contracts offset by collateral received.
Swaps are traded or cleared on an exchange or central clearinghouse. Exchange-traded or cleared transactions generally present less counterparty risk to a fund than OTC transactions. The exchange or clearinghouse stands between the fund and the broker to the contract and therefore, credit risk is generally limited to the failure of the exchange or clearinghouse and the clearing member.
Forward foreign currency contracts. A forward foreign currency contract is an agreement between two parties to buy and sell specific currencies at a price that is set on the date of the contract. The forward contract calls for delivery of the currencies on a future date that is specified in the contract. Risks related to the use of forwards include the possible failure of counterparties to meet the terms of the forward agreement, the failure of the counterparties to timely post collateral if applicable, the risk that currency movements will not favor the fund thereby reducing the fund's total return, and the potential for losses in excess of the amounts recognized on the Statement of assets and liabilities.
The market value of a forward foreign currency contract fluctuates with changes in foreign currency exchange rates. Forward foreign currency contracts are marked-to-market daily and the change in value is recorded by the fund as an unrealized gain or loss. Realized gains or losses, equal to the difference between the value of the contract at the time it was opened and the value at the time it was closed, are recorded upon delivery or receipt of the currency or settlement with the counterparty.
During the six months ended January 31, 2016, the fund used forward foreign currency contracts to manage against anticipated changes in currency exchange rates and to manage currency exposure. The fund held forward foreign currency contracts with U.S. dollar notional values ranging from $13.0 million to $15.2 million, as measured at each quarter end. The following table summarizes the contracts held at January 31, 2016:
| Contract to buy | Contract to sell | Counterparty | Contractual settlement date |
Unrealized appreciation |
Unrealized depreciation | Net unrealized appreciation/ (depreciation) | ||||||||||||||||||||||||||
| GBP | 44,345 | USD | 63,373 | JPMorgan Chase | 02/05/2016 | — | ($186 | ) | ($186 | ) | ||||||||||||||||||||||
| USD | 3,892,831 | GBP | 2,651,200 | JPMorgan Chase | 02/05/2016 | $115,106 | — | 115,106 | ||||||||||||||||||||||||
| USD | 9,858,887 | EUR | 9,108,187 | JPMorgan Chase | 02/05/2016 | — | (8,636 | ) | (8,636 | ) | ||||||||||||||||||||||
| USD | 1,232,630 | COP | 4,041,485,000 | Citigroup | 02/16/2016 | 2,980 | — | 2,980 | ||||||||||||||||||||||||
| USD | 153,380 | EUR | 140,678 | JPMorgan Chase | 02/05/2016 | 973 | — | 973 | ||||||||||||||||||||||||
| USD | 34,321 | GBP | 24,111 | JPMorgan Chase | 02/05/2016 | — | (35 | ) | (35 | ) | ||||||||||||||||||||||
| $119,059 | ($8,857 | ) | $110,202 | |||||||||||||||||||||||||||||
| Currency abbreviations | |
| COP | Colombian Peso |
| EUR | Euro |
| GBP | Pound Sterling |
| USD | U.S. Dollar |
Interest rate swaps. Interest rate swaps represent an agreement between the fund and a counterparty to exchange cash flows based on the difference between two interest rates applied to a notional amount. The payment flows are usually netted against each other, with the difference being paid by one party to the other. The fund settles accrued net interest receivable or payable under the swap contracts at specified, future intervals. Swap agreements are privately negotiated in the OTC market or may be executed on a registered commodities exchange (centrally cleared swaps). Swaps are marked-to-market daily and the change in value is recorded as unrealized appreciation/depreciation of swap contracts. A termination payment by the counterparty or the fund is recorded as realized gain or loss, as well as the net periodic payments received or paid by the fund. The value of the swap will typically impose collateral posting obligations on the party that is considered out-of-the-money on the swap.
During the six months ended January 31, 2016, the fund used interest rate swaps to manage duration of the fund. The following table summarizes the interest rate swap contracts held as of January 31, 2016:
| Counterparty | Notional amount |
Currency | USD notional amount |
Payments made by fund |
Payments received by fund |
Maturity date |
Unrealized appreciation (depreciation) |
Market value |
||||||||||||||||||
| Exchange Cleared Swaps | ||||||||||||||||||||||||||
| 2,216,458 | USD | $2,216,458 | Fixed 2.077% | USD LIBOR BBA | Jan 2025 | ($69,243 | ) | ($69,243 | ) | |||||||||||||||||
| 6,190,934 | USD | 6,190,934 | Fixed 2.140% | USD LIBOR BBA | Jan 2025 | (226,996 | ) | (226,996 | ) | |||||||||||||||||
| $8,407,392 | ($296,239 | ) | ($296,239 | ) | ||||||||||||||||||||||
No interest rate swap positions were entered into or closed during the six months ended January 31, 2016.
Fair value of derivative instruments by risk category
The table below summarizes the fair value of derivatives held by the fund at January 31, 2016 by risk category:
| Risk | Statement of assets and liabilities location |
Financial instruments location |
Asset derivatives fair value |
Liabilities derivative fair value |
||||||||||
| Interest rate | Swap contracts, at value | Interest rate swaps^ | — | ($296,239 | ) | |||||||||
| Foreign currency | Unrealized appreciation/depreciation on forward foreign currency exchange contracts |
Forward foreign currency contracts |
$119,059 | (8,857 | ) | |||||||||
| $119,059 | ($305,096 | ) |
^Reflects cumulative appreciation/depreciation on swap contracts. Year end variation margin for centrally cleared swaps and appreciation/depreciation for OTC swaps are shown separately in the Statement of assets and liabilities.
For financial reporting purposes, the fund does not offset OTC derivative assets or liabilities that are subject to master netting arrangements, as defined by the ISDAs, in the Statement of assets and liabilities. In the event of default by the counterparty or a termination of the agreement, the ISDA allows an offset of amounts across the various transactions between the fund and the applicable counterparty. The fund's exposure to counterparties subject to an ISDA is comprised of forward foreign currency assets and liabilities.
Effect of derivative instruments on the Statement of operations
The table below summarizes the net realized gain (loss) included in the net increase (decrease) in net assets from operations, classified by derivative instrument and risk category, for the six months ended January 31, 2016:
| Risk | Statement of operations location |
Swap contracts |
Investments and foreign currency transactions* |
Total | ||||||||||
| Interest rate | Net realized gain (loss) | ($76,322 | ) | — | ($76,322 | ) | ||||||||
| Foreign currency | Net realized gain (loss) | — | $337,318 | 337,318 | ||||||||||
| Total | ($76,322 | ) | $337,318 | $260,996 |
* Realized gain/loss associated with forward foreign currency contracts is included in this caption on the Statement of operations.
The table below summarizes the net change in unrealized appreciation (depreciation) included in the net increase (decrease) in net assets from operations, classified by derivative instrument and risk category, for the six months ended January 31, 2016:
| Risk | Statement of operations location |
Swap contracts |
Investments and translation of assets and liabilities in foreign currencies* |
Total | ||||||||||
| Foreign currency | Change in unrealized appreciation (depreciation) |
— | ($48,788 | ) | ($48,788 | ) | ||||||||
| Interest rate | Change in unrealized appreciation (depreciation) |
($365,101 | ) | — | (365,101 | ) | ||||||||
| Total | ($365,101 | ) | ($48,788 | ) | ($413,889 | ) |
* Change in unrealized appreciation/depreciation associated with forward foreign currency contracts is included in this caption on the Statement of operations.
Note 4 — Guarantees and indemnifications
Under the Trust's organizational documents, its Officers and Trustees are indemnified against certain liabilities arising out of the performance of their duties to the Trust, including the fund. Additionally, in the normal course of business, the fund enters into contracts with service providers that contain general indemnification clauses. The fund's maximum exposure under these arrangements is unknown, as this would involve future claims that may be made against the fund that have not yet occurred. The risk of material loss from such claims is considered remote.
Note 5 — Fees and transactions with affiliates
John Hancock Advisers, LLC (the Advisor) serves as investment advisor for the fund. John Hancock Funds, LLC (the Distributor), an affiliate of the Advisor, serves as principal underwriter of the fund. The Advisor and the Distributor are indirect, wholly owned subsidiaries of Manulife Financial Corporation (MFC).
Management fee. The fund has an investment management agreement with the Advisor under which the fund pays a daily management fee to the Advisor equivalent, on an annual basis, to the sum of: a) 0.785% of the first $250 million of the fund's average daily net assets, b) 0.770% of the next $500 million of the fund's average daily net assets and c) 0.750% of the fund's average daily net assets in excess of $750 million. The Advisor has a subadvisory agreement with Stone Harbor Investment Partners LP. The fund is not responsible for payment of the subadvisory fees.
The Advisor has contractually agreed to waive a portion of its management fee and/or reimburse expenses for certain funds of the John Hancock group of funds complex, including the fund (the participating portfolios). This waiver is based upon aggregate net assets of all the participating portfolios. The amount of the reimbursement is calculated daily and allocated among all the participating portfolios in proportion to the daily net assets of each fund. During the six months ended January 31, 2016, this waiver amounted to 0.01% of the fund's average net assets (on an annualized basis). This arrangement may be amended or terminated at any time by the Advisor upon notice to the fund and with the approval of the Board of Trustees.
To the extent that expenses of Class A and Class I shares exceed 1.30% and 1.00%, respectively, of average annual net assets (on an annualized basis) attributable to Class A and Class I shares (Expense Limitation), the Advisor contractually agrees to reduce its management fee or, if necessary, make payments to the classes in an amount equal to the amount by which expenses of each share class exceeds its Expense Limitation. Expenses mean all fund-level and class-specific operating expenses, excluding taxes, brokerage commissions, interest expense, acquired fund fees, litigation and indemnification expenses and other extraordinary expenses not incurred in the ordinary course of the fund's business, and short dividend expense. The Expense Limitation expires on November 30, 2016 for Class A and Class I shares, respectively, unless renewed by mutual agreement of the fund and the Advisor based upon a determination that this is appropriate under the circumstances at that time.
The Advisor has voluntarily agreed to reduce a portion of its management fee or make payments to the fund if certain expenses of the fund exceed 0.15% of average net assets (on an annual basis). Expenses excluded from this waiver include taxes, brokerage commissions, interest expense, litigation and indemnification expenses, and other extraordinary expenses not incurred in the ordinary course of the fund's business, advisory fees, class specific expenses, underlying fund expenses ("acquired fund fees") and short dividend expense, and acquired fund fees. This expense waiver will continue in effect until terminated at any time by the Advisor on notice to the fund.
The expense reductions described above amounted to $8,335, $2, and $8,204 for Class A, Class I, and Class NAV shares, respectively, for the six months ended January 31, 2016.
The investment management fees, including the impact of the waivers and reimbursements as described above, incurred for the six months ended January 31, 2016 were equivalent to a net annual effective rate of 0.77% of the fund's average daily net assets.
Accounting and legal services. Pursuant to a service agreement, the fund reimburses the Advisor for all expenses associated with providing the administrative, financial, legal, accounting and recordkeeping services to the fund, including the preparation of all tax returns, periodic reports to shareholders and regulatory reports, among other services. These expenses are allocated to each share class based on its relative net assets at the time the expense was incurred. These accounting and legal services fees incurred for the six months ended January 31, 2016 amounted to an annual rate of 0.01% of the fund's average daily net assets.
Distribution and service plans. The fund has a distribution agreement with the Distributor. The fund has adopted a distribution and service plan with respect to Class A shares pursuant to Rule 12b-1 under the 1940 Act, to pay the Distributor for services provided as the distributor of shares of the fund. The fund pays 0.30% for Class A shares distribution and service fees under this arrangement, expressed as an annual percentage of average daily net assets of the fund's Class A shares.
Sales charges. Class A shares are assessed up-front sales charges, which resulted in payments to the Distributor amounting to $9,444 for the six months ended January 31, 2016. Of this amount, $911 was retained and used for printing prospectuses, advertising, sales literature and other purposes and $8,533 was paid as sales commissions to broker-dealers.
Class A shares may be subject to contingent deferred sales charges (CDSCs). Certain Class A shares that are acquired through purchases of $1 million or more and are redeemed within one year of purchase are subject to a 1.00% sales charge. CDSCs are applied to the lesser of the current market value at the time of redemption or the original purchase cost of the shares being redeemed. Proceeds from CDSCs are used to compensate the Distributor for providing distribution-related services in connection with the sale of these shares. During the six months ended January 31, 2016, there were no CDSCs received by the Distributor for Class A shares.
Transfer agent fees. The fund has a transfer agent agreement with John Hancock Signature Services, Inc. (Signature Services), an affiliate of the Advisor. The transfer agent fees paid to Signature Services are determined based on the cost to Signature Services (Signature Services Cost) of providing recordkeeping services. It also includes out-of-pocket expenses, including payments made to third-parties for recordkeeping services provided to their clients who invest in one or more John Hancock funds. In addition, Signature Services Cost may be reduced by certain fees that Signature Services receives in connection with retirement and small accounts. Signature Services Cost is calculated monthly and allocated, as applicable, to five categories of share classes: Retail Share and Institutional Share Classes of Non-Municipal Bond Funds, Class R6 Shares, Retirement Share Classes and Municipal Bond Share Classes. Within each of these categories, the applicable costs are allocated to the affected John Hancock affiliated funds and/or classes, based on the relative average daily net assets.
Class level expenses. Class level expenses for the six months ended January 31, 2016 were:
| Class | Distribution and service fees | Transfer agent fees |
| Class A | $5,169 | $2,122 |
| Class I | — | 67 |
| Total | $5,169 | $2,189 |
Trustee expenses. The fund compensates each Trustee who is not an employee of the Advisor or its affiliates. The costs of paying Trustee compensation and expenses are allocated to each fund based on its net assets relative to other funds within the John Hancock group of funds complex.
Note 6 — Fund share transactions
Transactions in fund shares for the six months ended January 31, 2016 and for the year ended July 31, 2015 were as follows:
| Six months ended 1-31-16 | Year ended 7-31-15 | |||||||||||||||||||||||||
| Shares | Amount | Shares | Amount | |||||||||||||||||||||||
| Class A shares | ||||||||||||||||||||||||||
| Sold | 62,628 | $559,494 | 246,620 | $2,395,208 | ||||||||||||||||||||||
| Distributions reinvested | 11,138 | 98,538 | 16,377 | 158,066 | ||||||||||||||||||||||
| Repurchased | (124,684 | ) | (1,105,509 | ) | (113,773 | ) | (1,098,505 | ) | ||||||||||||||||||
| Net increase (decrease) | (50,918 | ) | ($447,477 | ) | 149,224 | $1,454,769 | ||||||||||||||||||||
| Class I shares | ||||||||||||||||||||||||||
| Sold | 6,819 | $61,410 | 441,784 | $4,297,495 | ||||||||||||||||||||||
| Distributions reinvested | 431 | 3,793 | 2,975 | 28,562 | ||||||||||||||||||||||
| Repurchased | (2,958 | ) | (27,185 | ) | (439,821 | ) | (4,171,457 | ) | ||||||||||||||||||
| Net increase | 4,292 | $38,018 | 4,938 | $154,600 | ||||||||||||||||||||||
| Class NAV shares | ||||||||||||||||||||||||||
| Sold | 190,884 | $1,663,179 | 2,755,819 | $26,857,784 | ||||||||||||||||||||||
| Distributions reinvested | 1,572,130 | 13,915,584 | 3,280,183 | 31,769,537 | ||||||||||||||||||||||
| Repurchased | (8,873,878 | ) | (79,199,456 | ) | (10,892,859 | ) | (104,946,449 | ) | ||||||||||||||||||
| Net decrease | (7,110,864 | ) | ($63,620,693 | ) | (4,856,857 | ) | ($46,319,128 | ) | ||||||||||||||||||
| Total net decrease | (7,157,490 | ) | ($64,030,152 | ) | (4,702,695 | ) | ($44,709,759 | ) | ||||||||||||||||||
Affiliates of the fund owned 100% of shares of beneficial interest of Class NAV on January 31, 2016.
Note 7 — Purchase and sale of securities
Purchases and sales of securities, other than short-term investments, amounted to $123,758,504 and $179,770,394, respectively, for the six months ended January 31, 2016.
Note 8 — Investment by affiliated funds
Certain investors in the fund are affiliated funds that are managed by the Advisor and its affiliates. The affiliated funds do not invest in the fund for the purpose of exercising management or control; however, this investment may represent a significant portion of the fund's net assets. At January 31, 2016, funds within the John Hancock group of funds complex held 99.2% of the fund's net assets. The following funds had an affiliate ownership of 5% or more of the fund's net assets:
| Fund | Affiliate concentration |
| John Hancock Funds II Lifestyle Balanced | 33.6% |
| John Hancock Funds II Lifestyle Growth | 19.6% |
| John Hancock Funds II Lifestyle Moderate | 13.4% |
| John Hancock Funds II Alternative Asset Allocation | 9.2% |
| John Hancock Funds II Lifestyle Conservative | 6.6% |
|
Trustees James M. Oates, Chairperson Officers Andrew G. Arnott John J. Danello Francis V. Knox, Jr. Charles A. Rizzo Salvatore Schiavone |
Investment advisor John Hancock Advisers, LLC Subadvisor Stone Harbor Investment Partners LP Principal distributor John Hancock Funds, LLC Custodian Citibank, N.A. Transfer agent John Hancock Signature Services, Inc. Legal counsel K&L Gates LLP |
*Member of the Audit Committee
†Non-Independent Trustee
The fund's proxy voting policies and procedures, as well as the fund proxy voting record for the most recent twelve-month period ended June 30, are available free of charge on the Securities and Exchange Commission (SEC) website at sec.gov or on our website.
The fund's complete list of portfolio holdings, for the first and third fiscal quarters, is filed with the SEC on Form N-Q. The fund's Form N-Q is available on our website and the SEC's website, sec.gov, and can be reviewed and copied (for a fee) at the SEC's Public Reference Room in Washington, DC. Call 800-SEC-0330 to receive information on the operation of the SEC's Public Reference Room.
We make this information on your fund, as well as monthly portfolio holdings, and other fund details available on our website at jhinvestments.com or by calling 800-225-5291.
| You can also contact us: | |||
| 800-225-5291 jhinvestments.com |
Regular mail: John Hancock Signature Services, Inc. |
Express mail: John Hancock Signature Services, Inc. |
|
John Hancock family of funds
|
DOMESTIC EQUITY FUNDS Balanced Blue Chip Growth Classic Value Disciplined Value Disciplined Value Mid Cap Equity Income Fundamental All Cap Core Fundamental Large Cap Core Fundamental Large Cap Value New Opportunities Select Growth Small Cap Equity Small Cap Value Small Company Strategic Growth U.S. Equity U.S. Global Leaders Growth Value Equity GLOBAL AND INTERNATIONAL EQUITY FUNDS Disciplined Value International Emerging Markets Emerging Markets Equity Global Equity Global Shareholder Yield Greater China Opportunities International Core International Growth International Small Company International Value Equity |
INCOME FUNDS Bond California Tax-Free Income Core High Yield Emerging Markets Debt Floating Rate Income Focused High Yield Global Income Government Income High Yield Municipal Bond Income Investment Grade Bond Money Market Short Duration Credit Opportunities Spectrum Income Strategic Income Opportunities Tax-Free Bond ALTERNATIVE AND SPECIALTY FUNDS Absolute Return Currency Alternative Asset Allocation Enduring Assets Financial Industries Global Absolute Return Strategies Global Conservative Absolute Return Global Real Estate Natural Resources Redwood Regional Bank Seaport Technical Opportunities |
A fund's investment objectives, risks, charges, and expenses should be considered carefully before investing. The prospectus contains this and other important information about the fund. To obtain a prospectus, contact your financial professional, call John Hancock Investments at 800-225-5291, or visit our website at jhinvestments.com. Please read the prospectus carefully before investing or sending money.
|
ASSET ALLOCATION Income Allocation Fund Lifestyle Aggressive Portfolio Lifestyle Balanced Portfolio Lifestyle Conservative Portfolio Lifestyle Growth Portfolio Lifestyle Moderate Portfolio Retirement Choices Portfolios (2010-2055) Retirement Living Portfolios (2010-2055) Retirement Living II Portfolios (2010-2055) EXCHANGE-TRADED FUNDS John Hancock Multifactor Consumer Discretionary ETF John Hancock Multifactor Financials ETF John Hancock Multifactor Healthcare ETF John Hancock Multifactor Large Cap ETF John Hancock Multifactor Mid Cap ETF John Hancock Multifactor Technology ETF CLOSED-END FUNDS Financial Opportunities Hedged Equity & Income Income Securities Trust Investors Trust Preferred Income Preferred Income II Preferred Income III Premium Dividend Tax-Advantaged Dividend Income Tax-Advantaged Global Shareholder Yield |
"As an investment firm,
upholding the proud
tradition of John Hancock
comes down to one thing:
putting shareholders
first. We believe that if
our shareholders are
successful, then we will
be successful."
Andrew G. Arnott
President and Chief Executive Officer
John Hancock Investments
John Hancock Multifactor ETF shares are bought and sold at market
price (not NAV), and are not individually redeemed
from the fund. Brokerage commissions will reduce returns.
John Hancock ETFs are distributed by Foreside Fund Services, LLC, and
are subadvised by Dimensional Fund Advisors LP.
Foreside is not affiliated with John Hancock Funds, LLC or
Dimensional Fund Advisors LP.
Dimensional Fund Advisors LP receives compensation from John Hancock
in connection with licensing rights to the
John Hancock Dimensional indexes. Dimensional Fund Advisors LP does
not sponsor, endorse, or sell, and makes no
representation as to the advisability of investing in, John Hancock
Multifactor ETFs.
John Hancock Investments
A trusted brand
John Hancock Investments is a premier asset manager representing
one of America's most trusted brands, with a heritage of financial
stewardship dating back to 1862. Helping our shareholders pursue
their financial goals is at the core of everything we do. It's why we
support the role of professional financial advice and operate with the
highest standards of conduct and integrity.
A better way to invest
We build funds based on investor needs, then search the world to find
proven portfolio teams with specialized expertise in those strategies.
As a manager of managers, we apply vigorous oversight to ensure that
they continue to meet our uncompromising standards and serve the
best interests of our shareholders.
Results for investors
Our unique approach to asset management enables us to provide
a diverse set of investments backed by some of the world's best
managers, along with strong risk-adjusted returns across asset classes.
|
|
John Hancock Funds, LLC n Member FINRA, SIPC 601 Congress Street n Boston, MA 02210-2805 800-225-5291 n jhinvestments.com |
|
| This report is for the information of the shareholders of John Hancock Global Income Fund. It is not authorized for distribution to prospective investors unless preceded or accompanied by a prospectus. | ||
| MF274538 | 352SA 1/16 3/16 |
|
John Hancock
Short Duration Credit Opportunities Fund
Semiannual report 1/31/16
A message to shareholders
Dear shareholder,
The past six months have been a challenging period for all investors, and the fixed-income markets offered no exception. Oil prices, having already dropped precipitously, continued to slide in the back half of 2015, and by January oil frequently traded at multi-year lows. Against this backdrop, corporate and high-yield bonds continued to suffer on fears of a wave of defaults from commodity-linked issuers. High yield was not the only market that faced headwinds; all risk assets struggled over the past six months, and while these types of declines are unsettling, history shows that they tend not to last.
Although volatility returned in force to the markets, the economic picture in the United States continued to offer reasons for optimism. In fact, in December, the U.S. Federal Reserve raised short-term interest rates for the first time in nine years on the evidence that the persistent strength in the labor markets warranted a somewhat less accommodative stance.
At John Hancock Investments, portfolio risk management is a critical part of our role as an asset manager, and our dedicated risk team is focused on these issues every day. We continually strive for new ways to analyze potential risks and have liquidity tools in place, such as a credit facility and an interfund lending program. In times like these, your best resource is your financial advisor, who can ensure your portfolio is sufficiently diversified to meet your long-term objectives and to withstand the inevitable bumps along the way.
On behalf of everyone at John Hancock Investments, I'd like to take this opportunity to thank you for the continued trust you've placed in us.
Sincerely,
Andrew G. Arnott
President and Chief Executive Officer
John Hancock Investments
This commentary reflects the CEO's views as of January 31, 2016. They are subject to change at any time. All investments entail risks, including the possible loss of principal. For more up-to-date information, you can visit our website at jhinvestments.com.
John Hancock
Short Duration Credit Opportunities Fund
INVESTMENT OBJECTIVE
The fund seeks to maximize total return, which consists of income on its investments and capital appreciation.
AVERAGE ANNUAL TOTAL RETURNS AS OF 1/31/16 (%)
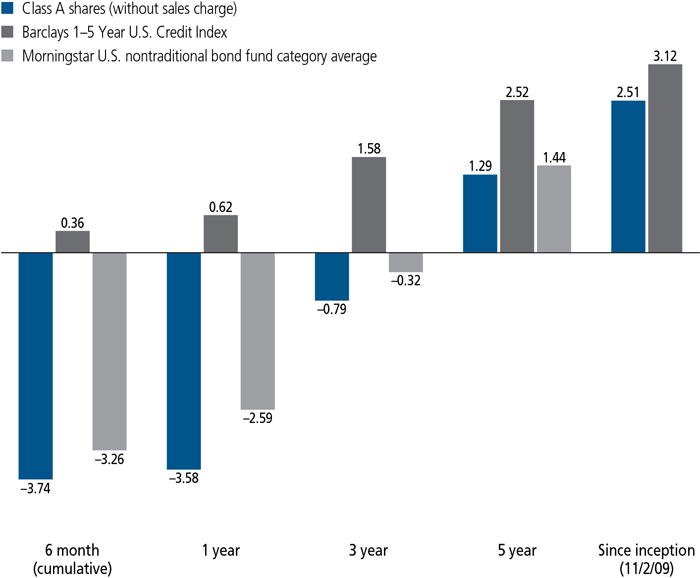
The Barclays 1-5 Year U.S. Credit Index includes investment-grade corporate and international dollar-denominated bonds with maturities of 1 to 5 years.
It is not possible to invest directly in an index. Index figures do not reflect expenses or sales charges, which would result in lower returns.
Figures from Morningstar, Inc. include reinvested distributions and do not take into account sales charges. Actual load-adjusted performance is lower. Since-inception returns for the Morningstar fund category average are not available.
The past performance shown here reflects reinvested distributions and the beneficial effect of any expense reductions, and does not guarantee future results. Returns for periods shorter than one year are cumulative. Performance of the other share classes will vary based on the difference in the fees and expenses of those classes. Shares will fluctuate in value and, when redeemed, may be worth more or less than their original cost. Current month-end performance may be lower or higher than the performance cited, and can be found at jhinvestments.com or by calling 800-225-5291. For further information on the fund's objectives, risks, and strategy, see the fund's prospectus.
PERFORMANCE HIGHLIGHTS OVER THE LAST SIX MONTHS
U.S. Treasuries gained, but credit-sensitive segments weakened
The backdrop of slowing global growth aided the performance of U.S. Treasuries, but high-yield bonds, senior loans, and emerging-market debt lagged.
The fund's emphasis on the credit sectors detracted
The fund underperformed the Barclays 1-5 Year U.S. Credit Index, which is invested entirely in investment-grade corporates, due to its investments in the higher-yielding market segments.
Security selection in investment-grade corporates also detracted
The fund's allocation to energy-related corporate bonds weighed on relative performance during the period.
PORTFOLIO COMPOSITION AS OF 1/31/16 (%)
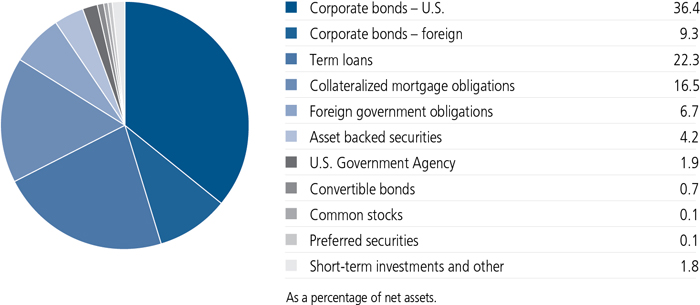
A note about risks
Investments in higher-yielding, lower-rated securities involve additional risks as these securities include a higher risk of default and loss of principal. Fixed-income investments are subject to interest-rate and credit risk; their value will normally decline as interest rates rise or if a creditor, grantor, or counterparty is unable or unwilling to make principal, interest, or settlement payments. A fund concentrated in one sector or that holds a limited number of securities may fluctuate more than a fund that invests in a wider variety of sectors. Liquidity—the extent to which a security may be sold or a derivative position closed without negatively affecting its market value, if at all—may be impaired by reduced trading volume, heightened volatility, rising interest rates, and other market conditions. Loan participations and assignments involve additional risks, including credit risk, interest-rate risk, counterparty risk, liquidity risk, extended settlement risk, and the risks of being a lender. Hedging, derivatives, and other strategic transactions may increase a fund's volatility and could produce disproportionate losses, potentially more than the fund's principal investment. Foreign investing, especially in emerging markets, has additional risks such as currency and market volatility and political and social instability. For additional information on these and other risk considerations, please see the fund's prospectuses.
From the Investment Management Team
Stone Harbor Investment Partners LP
Can you describe the market environment of the past six months?
The past half year proved to be a challenging time for fixed-income investors. While U.S. Treasuries delivered positive total returns, high-yield bonds, senior loans, and emerging-market bonds all finished in negative territory.
The backdrop of slowing global growth was the primary cause of the performance disparity among the various segments of the market. After a pickup in the global economy during the middle of 2015, the combination of sharply falling commodity prices, weaker economic data in the developed markets, and the continued slowdown in China's growth rate caused investors to question whether the world was on track for a recession in 2016. These concerns worked to the benefit of U.S. Treasuries, which rose in price (as yields fell) despite the U.S. Federal Reserve's (Fed's) decision to raise short-term interest rates by a quarter point in December. The relative strength in Treasuries provided an element of support for investment-grade corporate bonds, although the sector still finished with a slightly negative total return due to the weakening outlook for corporate earnings.
The prospect of slower growth, while a positive for government bonds, also depressed investor risk appetites and led to a sharp downturn in commodity prices. Together, these trends contributed to significant underperformance for high-yield bonds. High yield suffered the bulk of its losses in November and December, which was partially a reflection of the low market liquidity that characterized year-end trading. The prospect of less favorable credit conditions also weighed on the performance of senior loans, which sold off along with high yield late in 2015.
The emerging markets were also affected by falling commodity prices, which weighed on the growth outlook for the many countries that rely on raw material exports to fuel their economies. With that said, a low level of new issue supply enabled the emerging markets to outperform domestic, high-yield bonds.
What was the reason for the fund underperforming its benchmark, the Barclays 1-5 Year U.S. Credit Index?
The fund's allocation to the credit sectors was the primary reason for its underperformance. We allocated over 40% of the portfolio to high yield bonds, senior loans, and emerging-market debt, none of which is represented in the fund's benchmark.
The fund's positioning within its investment-grade portfolio weighed on its six-month results, as well. The portfolio was underweight to duration (meaning that it had below-average interest-rate sensitivity), which was a small detractor from performance at a time of falling yields. The fund's positions in energy-related debt also lagged considerably, offsetting the positive impact of our decision to underweight the sector. On the plus side, the fund's allocation to the securitized area, particularly nonagency residential mortgage-backed securities and commercial mortgage-backed securities (CMBS), aided relative performance within the investment-grade portfolio.
The fund was also hurt by the underperformance of its holdings in the emerging markets. Country selection was the primary source of the fund's shortfall in this area, with overweights in Brazil and Mexico, along with an underweight in Ukraine, standing out as being detractors from performance.
QUALITY COMPOSITION AS OF 1/31/16 (%)
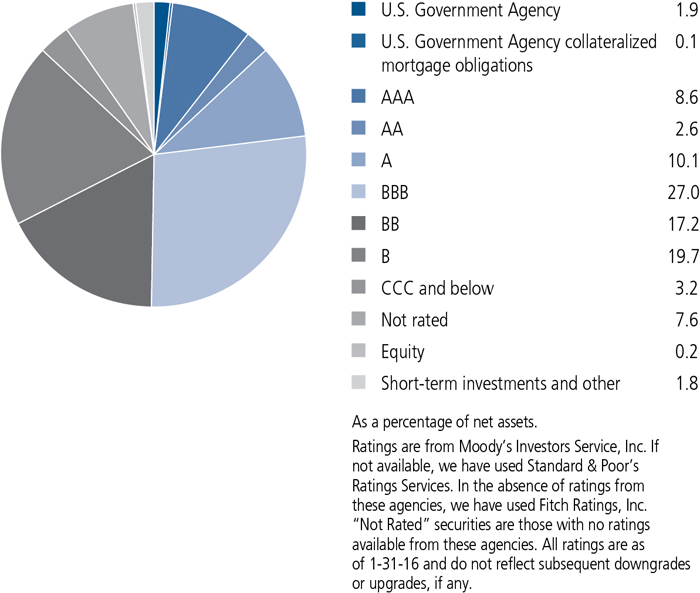
While the fund's positions in high-yield bonds and senior loans had an adverse impact on performance, we partially made up for this through our decision to underweight the energy sector in high yield. Performance was also helped by the relative strength of the fund's positions in the cable/media and food/beverage industries. We added further value through our decision to hedge a portion of the fund's position in high yield due to our concerns about the potential impact of falling oil prices. We initiated this hedge during October 2015 and increased it during November, and it remained in place at the end of January.
How was the fund positioned at the end of the period?
Following the Fed's decision to raise interest rates, investors' attention turned to the question of how many more rate increases are in store for 2016. While we anticipate that the pace of rate hikes will be very gradual due to the sluggish nature of global growth, we also think the Fed's bias toward tighter policy argues for a lower interest-rate sensitivity in the portfolio. We therefore elected to keep the fund's duration below that of the benchmark throughout the period. The fund's duration stood at 1.61 years on January 31, 2016, compared with 2.67 years for the benchmark. We also maintained a barbell strategy; i.e., an emphasis on the short- and long-term portions of the yield curve with a corresponding underweight in intermediate-term bonds (which tend to underperform
COUNTRY COMPOSITION AS OF 1/31/16 (%)
| United States | 82.6 |
| Luxembourg | 1.9 |
| United Kingdom | 1.7 |
| Canada | 1.2 |
| Mexico | 1.0 |
| Japan | 1.0 |
| Other countries | 10.6 |
| TOTAL | 100.0 |
| As a percentage of net assets. |
when rates are rising). Although this positioning did not work well in January, when rates fell, we believe it remains appropriate for the environment we anticipate in the year ahead.
Our emphasis on the credit sectors contributed to the fund's underperformance during the past six months, but we maintained the fund's allocations to these market segments. One reason for this approach was our view that rate-sensitive assets offered little value with rates already so low. At the same time, the sell-off in high-yield and emerging-market bonds has created a wider range of opportunities in these areas. We therefore continued to emphasize the credit sectors, which we believe offer both compelling value opportunities and above-average yields.
MANAGED BY
| The Short Duration Credit Opportunities Fund is managed by a five-person team at Stone Harbor Investment Partners LP. |
TOTAL RETURNS FOR THE PERIOD ENDED JANUARY 31, 2016
| Average annual total returns (%) with maximum sales charge |
Cumulative total returns (%) with maximum sales charge |
SEC 30-day yield (%) subsidized |
SEC 30-day yield (%) unsubsidized1 |
||||||||||||||||||||||||||||||||
| 1-year | 5-year | Since inception |
6-month | 5-year | Since inception |
as of 1-31-16 |
as of 1-31-16 |
||||||||||||||||||||||||||||
| Class A | -5.96 | 0.77 | 2.09 | 2 | -6.15 | 3.90 | 13.82 | 2 | 3.47 | 3.46 | |||||||||||||||||||||||||
| Class C | -5.23 | — | -4.40 | 3 | -5.02 | — | -6.95 | 3 | 2.80 | 2.79 | |||||||||||||||||||||||||
| Class I4 | -3.26 | 1.58 | 2.80 | 2 | -3.59 | 8.17 | 18.88 | 2 | 3.83 | 3.82 | |||||||||||||||||||||||||
| Class R24 | — | — | — | -3.64 | — | -4.48 | 5 | 3.65 | 3.64 | ||||||||||||||||||||||||||
| Class R44 | — | — | — | -3.59 | — | -4.40 | 5 | 3.75 | 3.64 | ||||||||||||||||||||||||||
| Class R64 | — | — | — | -3.51 | — | -4.27 | 5 | 3.89 | 3.87 | ||||||||||||||||||||||||||
| Class NAV4 | -3.24 | 1.76 | 2.99 | 2 | -3.63 | 9.12 | 20.20 | 2 | 3.92 | 3.91 | |||||||||||||||||||||||||
| Index† | 0.62 | 2.52 | 3.12 | 2 | 0.36 | 13.27 | 21.15 | 2 | — | — | |||||||||||||||||||||||||
Performance figures assume all distributions are reinvested. Figures reflect maximum sales charges on Class A shares of 2.5% and the applicable contingent deferred sales charge (CDSC) on Class C shares. The returns for Class A shares have been adjusted to reflect the reduction in the maximum sales charge from 4.5% to 2.5%, effective 2-3-14. Class C shares sold within one year of purchase are subject to a 1% CDSC. Sales charges are not applicable to Class I, Class R2, Class R4, Class R6, and Class NAV shares.
The expense ratios of the fund, both net (including any fee waivers and/or expense limitations) and gross (excluding any fee waivers and/or expense limitations), are set forth according to the most recent publicly available prospectuses for the fund and may differ from those disclosed in the Financial highlights tables in this report. Had the fee waivers and expense limitations not been in place, gross expenses would apply. The expense ratios are as follows:
| Class A | Class C | Class I | Class R2* | Class R4* | Class R6* | Class NAV | |
| Gross (%) | 1.16 | 1.86 | 0.85 | 1.26 | 1.11 | 0.76 | 0.74 |
| Net (%) | 1.16 | 1.86 | 0.85 | 1.26 | 1.01 | 0.74 | 0.74 |
Please refer to the most recent prospectus and annual or semiannual report for more information on expenses and any expense limitation arrangements for each class.
| * | Expenses have been estimated for the first year of operations for Class R2, Class R4 and Class R6 shares. |
The returns reflect past results and should not be considered indicative of future performance. The return and principal value of an investment will fluctuate so that shares, when redeemed, may be worth more or less than their original cost. Due to market volatility and other factors, the fund's current performance may be higher or lower than the performance shown. For current to the most recent month-end performance data, please call 800-225-5291 or visit the fund's website at jhinvestments.com.
The performance table above and the chart on the next page do not reflect the deduction of taxes that a shareholder would pay on fund distributions or the redemption of fund shares. The fund's performance results reflect any applicable fee waivers or expense reductions, without which the expenses would increase and results would have been less favorable.
| † | Index is the Barclays 1-5 Year U.S. Credit Index. |
See the following page for footnotes.
This chart and table show what happened to a hypothetical $10,000 investment in John Hancock Short Duration Credit Opportunities Fund for the share classes and periods indicated, assuming all distributions were reinvested. For comparison, we've shown the same investment in the Barclays 1-5 Year U.S. Credit Index.
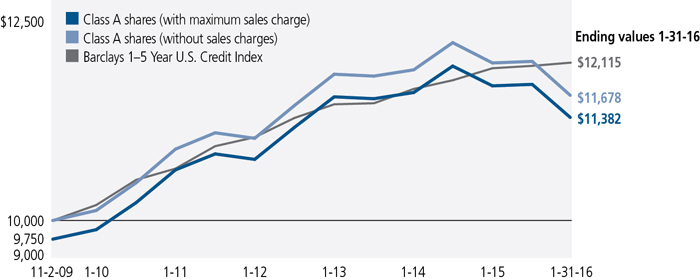
| Start date | With maximum sales charge ($) |
Without sales charge ($) |
Index ($) | |
| Class C6 | 6-27-14 | 9,305 | 9,305 | 10,186 |
| Class I4 | 11-2-09 | 11,888 | 11,888 | 12,115 |
| Class R24 | 3-27-15 | 9,552 | 9,552 | 10,071 |
| Class R44 | 3-27-15 | 9,560 | 9,560 | 10,071 |
| Class R64 | 3-27-15 | 9,573 | 9,573 | 10,071 |
| Class NAV4 | 11-2-09 | 12,020 | 12,020 | 12,115 |
The values shown in the chart for "Class A with maximum sales charge" have been adjusted to reflect the reduction in the Class A maximum sales charge from 4.5% to 2.5%, which became effective on 2-3-14.
Barclays 1-5 Year U.S. Credit Index includes investment-grade corporate and international dollar-denominated bonds with maturities of 1 to 5 years.
It is not possible to invest directly in an index. Index figures do not reflect expenses or sales charges, which would result in lower returns.
Footnotes related to performance pages
| 1 | Unsubsidized yield reflects what the yield would have been without the effects of waivers and reimbursements. |
| 2 | From 11-2-09. |
| 3 | From 6-27-14. |
| 4 | For certain types of investors as described in the fund's prospectuses. |
| 5 | From 3-27-15. |
| 6 | The contingent deferred sales charge is not applicable. |
These examples are intended to help you understand your ongoing operating expenses of investing in the fund so you can compare these costs with the ongoing costs of investing in other mutual funds.
Understanding fund expenses
As a shareholder of the fund, you incur two types of costs:
| • | Transaction costs, which include sales charges (loads) on purchases or redemptions (varies by share class), minimum account fee charge, etc. |
| • | Ongoing operating expenses, including management fees, distribution and service fees (if applicable), and other fund expenses. |
We are presenting only your ongoing operating expenses here.
Actual expenses/actual returns
This example is intended to provide information about the fund's actual ongoing operating expenses, and is based on the fund's actual return. It assumes an account value of $1,000.00 on August 1, 2015, with the same investment held until January 31, 2016.
| Account value on 8-1-2015 |
Ending value on 1-31-2016 |
Expenses paid during period ended 1-31-20161 |
Annualized expense ratio |
|
| Class A | $1,000.00 | $962.60 | $5.67 | 1.15% |
| Class C | 1,000.00 | 959.30 | 9.16 | 1.86% |
| Class I | 1,000.00 | 964.10 | 4.20 | 0.85% |
| Class R2 | 1,000.00 | 963.60 | 4.94 | 1.00% |
| Class R4 | 1,000.00 | 964.10 | 4.44 | 0.90% |
| Class R6 | 1,000.00 | 964.90 | 3.70 | 0.75% |
| Class NAV | 1,000.00 | 963.70 | 3.65 | 0.74% |
Together with the value of your account, you may use this information to estimate the operating expenses that you paid over the period. Simply divide your account value at January 31, 2016, by $1,000.00, then multiply it by the "expenses paid" for your share class from the table above. For example, for an account value of $8,600.00, the operating expenses should be calculated as follows:
Hypothetical example for comparison purposes
This table allows you to compare the fund's ongoing operating expenses with those of any other fund. It provides an example of the fund's hypothetical account values and hypothetical expenses based on each class's actual expense ratio and an assumed 5% annualized return before expenses (which is not the fund's actual return). It assumes an account value of $1,000.00 on August 1, 2015, with the same investment held until January 31, 2016. Look in any other fund shareholder report to find its hypothetical example and you will be able to compare these expenses. Please remember that these hypothetical account values and expenses may not be used to estimate the actual ending account balance or expenses you paid for the period.
| Account value on 8-1-2015 |
Ending value on 1-31-2016 |
Expenses paid during period ended 1-31-20161 |
Annualized expense ratio |
|
| Class A | $1,000.00 | $1,019.40 | $5.84 | 1.15% |
| Class C | 1,000.00 | 1,015.80 | 9.42 | 1.86% |
| Class I | 1,000.00 | 1,020.90 | 4.32 | 0.85% |
| Class R2 | 1,000.00 | 1,020.10 | 5.08 | 1.00% |
| Class R4 | 1,000.00 | 1,020.60 | 4.57 | 0.90% |
| Class R6 | 1,000.00 | 1,021.40 | 3.81 | 0.75% |
| Class NAV | 1,000.00 | 1,021.40 | 3.76 | 0.74% |
Remember, these examples do not include any transaction costs, therefore, these examples will not help you to determine the relative total costs of owning different funds. If transaction costs were included, your expenses would have been higher. See the prospectuses for details regarding transaction costs.
| 1 | Expenses are equal to the fund's annualized expense ratio, multiplied by the average account value over the period, multiplied by 184/366 (to reflect the one-half year period). |
Fund's investments
| As of 1-31-16 (unaudited) | ||||||||||||||||||||||||||||||||
| Rate (%) | Maturity date | Par value^ | Value | |||||||||||||||||||||||||||||
| Corporate bonds 45.7% | $615,739,014 | |||||||||||||||||||||||||||||||
| (Cost $654,898,464) | ||||||||||||||||||||||||||||||||
| Consumer discretionary 8.5% | 114,176,069 | |||||||||||||||||||||||||||||||
| Auto components 0.5% | ||||||||||||||||||||||||||||||||
| BorgWarner, Inc. | 3.375 | 03-15-25 | 3,710,000 | 3,527,850 | ||||||||||||||||||||||||||||
| MPG Holdco I, Inc. | 7.375 | 10-15-22 | 940,000 | 907,100 | ||||||||||||||||||||||||||||
| Schaeffler Holding Finance BV, PIK (S) | 6.250 | 11-15-19 | 420,000 | 437,850 | ||||||||||||||||||||||||||||
| The Goodyear Tire & Rubber Company | 5.125 | 11-15-23 | 410,000 | 419,225 | ||||||||||||||||||||||||||||
| The Goodyear Tire & Rubber Company | 6.500 | 03-01-21 | 530,000 | 556,500 | ||||||||||||||||||||||||||||
| ZF North America Capital, Inc. (S) | 4.750 | 04-29-25 | 800,000 | 750,000 | ||||||||||||||||||||||||||||
| Automobiles 0.6% | ||||||||||||||||||||||||||||||||
| Fiat Chrysler Automobiles NV | 5.250 | 04-15-23 | 1,210,000 | 1,128,325 | ||||||||||||||||||||||||||||
| Ford Motor Credit Company LLC | 3.157 | 08-04-20 | 3,625,000 | 3,602,804 | ||||||||||||||||||||||||||||
| Hyundai Capital America (S) | 2.550 | 02-06-19 | 3,900,000 | 3,906,088 | ||||||||||||||||||||||||||||
| Hotels, restaurants and leisure 0.8% | ||||||||||||||||||||||||||||||||
| GLP Capital LP | 5.375 | 11-01-23 | 505,000 | 483,538 | ||||||||||||||||||||||||||||
| Isle of Capri Casinos, Inc. | 5.875 | 03-15-21 | 1,560,000 | 1,595,100 | ||||||||||||||||||||||||||||
| Landry's, Inc. (S) | 9.375 | 05-01-20 | 1,050,000 | 1,109,063 | ||||||||||||||||||||||||||||
| Marriott International, Inc. | 3.000 | 03-01-19 | 3,250,000 | 3,317,314 | ||||||||||||||||||||||||||||
| McDonald's Corp. | 2.750 | 12-09-20 | 1,000,000 | 1,014,271 | ||||||||||||||||||||||||||||
| MGM Resorts International | 6.625 | 12-15-21 | 1,090,000 | 1,119,975 | ||||||||||||||||||||||||||||
| Pinnacle Entertainment, Inc. | 6.375 | 08-01-21 | 995,000 | 1,054,700 | ||||||||||||||||||||||||||||
| RHP Hotel Properties LP | 5.000 | 04-15-21 | 845,000 | 855,563 | ||||||||||||||||||||||||||||
| Household durables 0.6% | ||||||||||||||||||||||||||||||||
| Argos Merger Sub, Inc. (S) | 7.125 | 03-15-23 | 1,300,000 | 1,309,750 | ||||||||||||||||||||||||||||
| CalAtlantic Group, Inc. | 5.875 | 11-15-24 | 567,000 | 588,263 | ||||||||||||||||||||||||||||
| Jarden Corp. (S) | 5.000 | 11-15-23 | 595,000 | 609,875 | ||||||||||||||||||||||||||||
| Lennar Corp. | 4.750 | 11-15-22 | 230,000 | 224,250 | ||||||||||||||||||||||||||||
| Newell Rubbermaid, Inc. | 4.000 | 06-15-22 | 3,400,000 | 3,347,990 | ||||||||||||||||||||||||||||
| RSI Home Products, Inc. (S) | 6.500 | 03-15-23 | 990,000 | 1,017,225 | ||||||||||||||||||||||||||||
| Shea Homes LP (S) | 5.875 | 04-01-23 | 480,000 | 480,600 | ||||||||||||||||||||||||||||
| Media 4.8% | ||||||||||||||||||||||||||||||||
| 21st Century Fox America, Inc. | 6.650 | 11-15-37 | 2,750,000 | 3,131,018 | ||||||||||||||||||||||||||||
| Altice Luxembourg SA (S) | 7.750 | 05-15-22 | 1,335,000 | 1,244,888 | ||||||||||||||||||||||||||||
| Altice US Finance I Corp. (S) | 5.375 | 07-15-23 | 390,000 | 391,950 | ||||||||||||||||||||||||||||
| AMC Entertainment, Inc. | 5.750 | 06-15-25 | 1,345,000 | 1,370,219 | ||||||||||||||||||||||||||||
| Cable One, Inc. (S) | 5.750 | 06-15-22 | 695,000 | 701,950 | ||||||||||||||||||||||||||||
| Cablevision Systems Corp. | 5.875 | 09-15-22 | 2,130,000 | 1,757,250 | ||||||||||||||||||||||||||||
| CBS Corp. | 4.850 | 07-01-42 | 4,050,000 | 3,646,094 | ||||||||||||||||||||||||||||
| CCO Holdings LLC | 6.625 | 01-31-22 | 695,000 | 735,831 | ||||||||||||||||||||||||||||
| CCO Safari II LLC (S) | 3.579 | 07-23-20 | 3,425,000 | 3,444,540 | ||||||||||||||||||||||||||||
| CCO Safari II LLC (S) | 6.384 | 10-23-35 | 2,175,000 | 2,187,672 | ||||||||||||||||||||||||||||
| Rate (%) | Maturity date | Par value^ | Value | |||||||||||||||||||||||||||||
| Consumer discretionary (continued) | ||||||||||||||||||||||||||||||||
| Media (continued) | ||||||||||||||||||||||||||||||||
| CCO Safari II LLC (S) | 6.484 | 10-23-45 | 1,275,000 | $1,282,251 | ||||||||||||||||||||||||||||
| CCOH Safari LLC (S) | 5.750 | 02-15-26 | 575,000 | 572,053 | ||||||||||||||||||||||||||||
| Cequel Communications Holdings I LLC (S) | 5.125 | 12-15-21 | 905,000 | 818,482 | ||||||||||||||||||||||||||||
| Cinemark USA, Inc. | 5.125 | 12-15-22 | 500,000 | 502,500 | ||||||||||||||||||||||||||||
| Comcast Corp. | 4.250 | 01-15-33 | 4,970,000 | 4,910,579 | ||||||||||||||||||||||||||||
| DIRECTV Holdings LLC | 6.000 | 08-15-40 | 3,600,000 | 3,572,813 | ||||||||||||||||||||||||||||
| Discovery Communications LLC | 3.300 | 05-15-22 | 3,500,000 | 3,335,696 | ||||||||||||||||||||||||||||
| DISH DBS Corp. | 5.000 | 03-15-23 | 3,330,000 | 2,897,100 | ||||||||||||||||||||||||||||
| Gray Television, Inc. | 7.500 | 10-01-20 | 1,235,000 | 1,273,594 | ||||||||||||||||||||||||||||
| LIN Television Corp. | 5.875 | 11-15-22 | 1,240,000 | 1,249,300 | ||||||||||||||||||||||||||||
| Mediacom LLC | 7.250 | 02-15-22 | 1,475,000 | 1,482,375 | ||||||||||||||||||||||||||||
| Nexstar Broadcasting, Inc. | 6.875 | 11-15-20 | 1,605,000 | 1,609,013 | ||||||||||||||||||||||||||||
| Numericable-SFR SAS (S) | 6.000 | 05-15-22 | 630,000 | 620,550 | ||||||||||||||||||||||||||||
| Numericable-SFR SAS (S) | 6.250 | 05-15-24 | 350,000 | 341,250 | ||||||||||||||||||||||||||||
| Omnicom Group, Inc. | 3.625 | 05-01-22 | 3,800,000 | 3,905,397 | ||||||||||||||||||||||||||||
| Outfront Media Capital LLC | 5.250 | 02-15-22 | 740,000 | 756,650 | ||||||||||||||||||||||||||||
| Quebecor Media, Inc. | 5.750 | 01-15-23 | 1,125,000 | 1,132,031 | ||||||||||||||||||||||||||||
| Sinclair Television Group, Inc. | 6.125 | 10-01-22 | 1,610,000 | 1,662,325 | ||||||||||||||||||||||||||||
| TEGNA, Inc. | 6.375 | 10-15-23 | 1,035,000 | 1,091,925 | ||||||||||||||||||||||||||||
| The Interpublic Group of Companies, Inc. | 3.750 | 02-15-23 | 3,600,000 | 3,486,193 | ||||||||||||||||||||||||||||
| Time Warner, Inc. | 3.600 | 07-15-25 | 3,225,000 | 3,132,149 | ||||||||||||||||||||||||||||
| Time Warner, Inc. | 6.100 | 07-15-40 | 1,525,000 | 1,573,178 | ||||||||||||||||||||||||||||
| Tribune Media Company (S) | 5.875 | 07-15-22 | 1,915,000 | 1,910,213 | ||||||||||||||||||||||||||||
| Unitymedia GmbH (S) | 6.125 | 01-15-25 | 425,000 | 431,460 | ||||||||||||||||||||||||||||
| Unitymedia Hessen GmbH & Company KG (S) | 5.000 | 01-15-25 | 595,000 | 593,513 | ||||||||||||||||||||||||||||
| Virgin Media Finance PLC (S) | 6.000 | 10-15-24 | 905,000 | 911,788 | ||||||||||||||||||||||||||||
| Virgin Media Secured Finance PLC (S) | 5.250 | 01-15-26 | 775,000 | 767,250 | ||||||||||||||||||||||||||||
| VTR Finance BV (S) | 6.875 | 01-15-24 | 687,000 | 640,628 | ||||||||||||||||||||||||||||
| Multiline retail 0.3% | ||||||||||||||||||||||||||||||||
| Macy's Retail Holdings, Inc. | 2.875 | 02-15-23 | 4,100,000 | 3,683,875 | ||||||||||||||||||||||||||||
| Macy's Retail Holdings, Inc. | 6.900 | 04-01-29 | 175,000 | 190,993 | ||||||||||||||||||||||||||||
| Personal products 0.1% | ||||||||||||||||||||||||||||||||
| Sally Holdings LLC | 5.625 | 12-01-25 | 625,000 | 645,313 | ||||||||||||||||||||||||||||
| Specialty retail 0.6% | ||||||||||||||||||||||||||||||||
| L Brands, Inc. (S) | 6.875 | 11-01-35 | 815,000 | 842,506 | ||||||||||||||||||||||||||||
| Outerwall, Inc. | 6.000 | 03-15-19 | 1,010,000 | 877,438 | ||||||||||||||||||||||||||||
| Petco Holdings, Inc., PIK (S) | 8.500 | 10-15-17 | 690,000 | 702,972 | ||||||||||||||||||||||||||||
| The Home Depot, Inc. | 2.625 | 06-01-22 | 3,750,000 | 3,796,868 | ||||||||||||||||||||||||||||
| The TJX Companies, Inc. | 2.750 | 06-15-21 | 1,825,000 | 1,860,724 | ||||||||||||||||||||||||||||
| Textiles, apparel and luxury goods 0.2% | ||||||||||||||||||||||||||||||||
| Hot Topic, Inc. (S) | 9.250 | 06-15-21 | 1,125,000 | 1,006,875 | ||||||||||||||||||||||||||||
| Levi Strauss & Company | 5.000 | 05-01-25 | 600,000 | 585,000 | ||||||||||||||||||||||||||||
| Rate (%) | Maturity date | Par value^ | Value | |||||||||||||||||||||||||||||
| Consumer discretionary (continued) | ||||||||||||||||||||||||||||||||
| Textiles, apparel and luxury goods (continued) | ||||||||||||||||||||||||||||||||
| Levi Strauss & Company | 6.875 | 05-01-22 | 640,000 | $676,800 | ||||||||||||||||||||||||||||
| Quiksilver, Inc. (H)(S) | 7.875 | 08-01-18 | 655,000 | 131,000 | ||||||||||||||||||||||||||||
| Quiksilver, Inc. (H) | 10.000 | 08-01-20 | 285,000 | 17,100 | ||||||||||||||||||||||||||||
| The William Carter Company | 5.250 | 08-15-21 | 699,000 | 721,718 | ||||||||||||||||||||||||||||
| Consumer staples 3.5% | 47,771,786 | |||||||||||||||||||||||||||||||
| Beverages 0.8% | ||||||||||||||||||||||||||||||||
| Anheuser-Busch InBev Finance, Inc. | 2.650 | 02-01-21 | 2,450,000 | 2,466,567 | ||||||||||||||||||||||||||||
| Anheuser-Busch InBev Finance, Inc. | 4.900 | 02-01-46 | 3,150,000 | 3,263,113 | ||||||||||||||||||||||||||||
| Constellation Brands, Inc. | 4.750 | 12-01-25 | 380,000 | 392,350 | ||||||||||||||||||||||||||||
| JB y Cia SA de CV (S) | 3.750 | 05-13-25 | 1,875,000 | 1,807,223 | ||||||||||||||||||||||||||||
| PepsiCo, Inc. | 4.250 | 10-22-44 | 3,650,000 | 3,645,956 | ||||||||||||||||||||||||||||
| Food and staples retailing 1.5% | ||||||||||||||||||||||||||||||||
| Bakkavor Finance 2 PLC | 8.250 | 02-15-18 | GBP | 332,472 | 483,231 | |||||||||||||||||||||||||||
| Boparan Finance PLC | 5.500 | 07-15-21 | GBP | 1,150,000 | 1,451,628 | |||||||||||||||||||||||||||
| CVS Pass-Through Trust | 6.036 | 12-10-28 | 3,277,522 | 3,649,128 | ||||||||||||||||||||||||||||
| R&R PLC, PIK | 9.250 | 05-15-18 | EUR | 850,000 | 926,116 | |||||||||||||||||||||||||||
| The Kroger Company | 5.150 | 08-01-43 | 3,250,000 | 3,535,474 | ||||||||||||||||||||||||||||
| Tops Holding LLC (S) | 8.000 | 06-15-22 | 940,000 | 893,000 | ||||||||||||||||||||||||||||
| Walgreens Boots Alliance, Inc. | 3.300 | 11-18-21 | 3,650,000 | 3,651,048 | ||||||||||||||||||||||||||||
| Whole Foods Market, Inc. (S) | 5.200 | 12-03-25 | 5,700,000 | 5,710,819 | ||||||||||||||||||||||||||||
| Food products 0.7% | ||||||||||||||||||||||||||||||||
| Chiquita Brands International, Inc. | 7.875 | 02-01-21 | 703,000 | 745,180 | ||||||||||||||||||||||||||||
| Dean Foods Company (S) | 6.500 | 03-15-23 | 1,025,000 | 1,055,750 | ||||||||||||||||||||||||||||
| ESAL GmbH (S) | 6.250 | 02-05-23 | 455,000 | 357,175 | ||||||||||||||||||||||||||||
| Kraft Heinz Foods Company (S) | 4.875 | 02-15-25 | 600,000 | 641,979 | ||||||||||||||||||||||||||||
| Kraft Heinz Foods Company (S) | 5.200 | 07-15-45 | 1,200,000 | 1,259,092 | ||||||||||||||||||||||||||||
| Pilgrim's Pride Corp. (S) | 5.750 | 03-15-25 | 830,000 | 798,875 | ||||||||||||||||||||||||||||
| Pinnacle Foods, Inc. (S) | 5.875 | 01-15-24 | 600,000 | 621,000 | ||||||||||||||||||||||||||||
| Post Holdings, Inc. | 7.375 | 02-15-22 | 1,290,000 | 1,359,338 | ||||||||||||||||||||||||||||
| Premier Foods Finance PLC | 6.500 | 03-15-21 | GBP | 725,000 | 961,269 | |||||||||||||||||||||||||||
| Smithfield Foods, Inc. | 6.625 | 08-15-22 | 1,140,000 | 1,203,954 | ||||||||||||||||||||||||||||
| Household products 0.2% | ||||||||||||||||||||||||||||||||
| Energizer SpinCo, Inc. (S) | 5.500 | 06-15-25 | 800,000 | 744,000 | ||||||||||||||||||||||||||||
| Reynolds Group Issuer, Inc. | 8.250 | 02-15-21 | 275,000 | 256,438 | ||||||||||||||||||||||||||||
| Spectrum Brands, Inc. (S) | 5.750 | 07-15-25 | 922,000 | 945,050 | ||||||||||||||||||||||||||||
| Spectrum Brands, Inc. (S) | 6.125 | 12-15-24 | 600,000 | 624,000 | ||||||||||||||||||||||||||||
| The Sun Products Corp. (S) | 7.750 | 03-15-21 | 715,000 | 656,013 | ||||||||||||||||||||||||||||
| Personal products 0.1% | ||||||||||||||||||||||||||||||||
| Albea Beauty Holdings SA (S) | 8.375 | 11-01-19 | 760,000 | 792,300 | ||||||||||||||||||||||||||||
| Revlon Consumer Products Corp. | 5.750 | 02-15-21 | 715,000 | 697,125 | ||||||||||||||||||||||||||||
| Rate (%) | Maturity date | Par value^ | Value | |||||||||||||||||||||||||||||
| Consumer staples (continued) | ||||||||||||||||||||||||||||||||
| Tobacco 0.2% | ||||||||||||||||||||||||||||||||
| Philip Morris International, Inc. | 1.125 | 08-21-17 | 2,175,000 | $2,177,595 | ||||||||||||||||||||||||||||
| Energy 6.2% | 83,242,299 | |||||||||||||||||||||||||||||||
| Energy equipment and services 0.2% | ||||||||||||||||||||||||||||||||
| Hornbeck Offshore Services, Inc. | 5.000 | 03-01-21 | 725,000 | 409,625 | ||||||||||||||||||||||||||||
| Hornbeck Offshore Services, Inc. | 5.875 | 04-01-20 | 310,000 | 186,000 | ||||||||||||||||||||||||||||
| Transocean, Inc. | 7.125 | 12-15-21 | 3,275,000 | 1,924,063 | ||||||||||||||||||||||||||||
| Oil, gas and consumable fuels 6.0% | ||||||||||||||||||||||||||||||||
| Anadarko Petroleum Corp. | 6.450 | 09-15-36 | 3,450,000 | 2,762,174 | ||||||||||||||||||||||||||||
| Apache Corp. | 5.100 | 09-01-40 | 4,025,000 | 3,039,801 | ||||||||||||||||||||||||||||
| Boardwalk Pipelines LP | 3.375 | 02-01-23 | 3,950,000 | 3,089,445 | ||||||||||||||||||||||||||||
| Bonanza Creek Energy, Inc. | 5.750 | 02-01-23 | 255,000 | 91,800 | ||||||||||||||||||||||||||||
| Bonanza Creek Energy, Inc. | 6.750 | 04-15-21 | 1,025,000 | 402,313 | ||||||||||||||||||||||||||||
| Calumet Specialty Products Partners LP | 7.625 | 01-15-22 | 390,000 | 284,700 | ||||||||||||||||||||||||||||
| Calumet Specialty Products Partners LP (S) | 7.750 | 04-15-23 | 125,000 | 91,250 | ||||||||||||||||||||||||||||
| Cloud Peak Energy Resources LLC | 6.375 | 03-15-24 | 260,000 | 66,950 | ||||||||||||||||||||||||||||
| CNOOC Finance 2015 USA LLC | 3.500 | 05-05-25 | 655,000 | 630,938 | ||||||||||||||||||||||||||||
| Columbia Pipeline Group, Inc. (S) | 2.450 | 06-01-18 | 3,875,000 | 3,760,428 | ||||||||||||||||||||||||||||
| Continental Resources, Inc. | 4.500 | 04-15-23 | 4,450,000 | 3,054,627 | ||||||||||||||||||||||||||||
| Cosan Luxembourg SA (S) | 5.000 | 03-14-23 | 441,000 | 339,570 | ||||||||||||||||||||||||||||
| Denbury Resources, Inc. | 5.500 | 05-01-22 | 1,170,000 | 409,500 | ||||||||||||||||||||||||||||
| Ecopetrol SA | 4.125 | 01-16-25 | 474,000 | 360,240 | ||||||||||||||||||||||||||||
| Ecopetrol SA | 5.375 | 06-26-26 | 362,000 | 289,600 | ||||||||||||||||||||||||||||
| Ecopetrol SA | 5.875 | 05-28-45 | 401,000 | 277,572 | ||||||||||||||||||||||||||||
| Ecopetrol SA | 7.375 | 09-18-43 | 455,000 | 349,781 | ||||||||||||||||||||||||||||
| Enterprise Products Operating LLC | 3.900 | 02-15-24 | 3,550,000 | 3,299,406 | ||||||||||||||||||||||||||||
| EP Energy LLC | 6.375 | 06-15-23 | 635,000 | 222,250 | ||||||||||||||||||||||||||||
| EP Energy LLC | 9.375 | 05-01-20 | 745,000 | 316,625 | ||||||||||||||||||||||||||||
| EP PetroEcuador (P) | 6.224 | 09-24-19 | 2,284,737 | 1,764,959 | ||||||||||||||||||||||||||||
| EQT Midstream Partners LP | 4.000 | 08-01-24 | 3,650,000 | 2,824,177 | ||||||||||||||||||||||||||||
| FTS International, Inc. | 6.250 | 05-01-22 | 940,000 | 176,250 | ||||||||||||||||||||||||||||
| Gazprom Neft OAO (S) | 4.375 | 09-19-22 | 195,000 | 170,625 | ||||||||||||||||||||||||||||
| Gazprom OAO (S) | 5.999 | 01-23-21 | 175,000 | 173,753 | ||||||||||||||||||||||||||||
| Gazprom OAO (S) | 8.146 | 04-11-18 | 131,000 | 139,790 | ||||||||||||||||||||||||||||
| Gazprom OAO | 9.250 | 04-23-19 | 1,539,000 | 1,707,813 | ||||||||||||||||||||||||||||
| Halcon Resources Corp. | 9.750 | 07-15-20 | 1,145,000 | 166,025 | ||||||||||||||||||||||||||||
| Intergas Finance BV | 6.375 | 05-14-17 | 269,000 | 271,738 | ||||||||||||||||||||||||||||
| KazMunayGas National Company | 6.375 | 04-09-21 | 1,274,000 | 1,248,535 | ||||||||||||||||||||||||||||
| KazMunayGas National Company (S) | 7.000 | 05-05-20 | 910,000 | 916,825 | ||||||||||||||||||||||||||||
| Kinder Morgan, Inc. | 5.550 | 06-01-45 | 3,275,000 | 2,566,434 | ||||||||||||||||||||||||||||
| Kinder Morgan, Inc. (S) | 5.625 | 11-15-23 | 3,850,000 | 3,541,064 | ||||||||||||||||||||||||||||
| Laredo Petroleum, Inc. | 5.625 | 01-15-22 | 365,000 | 259,150 | ||||||||||||||||||||||||||||
| Laredo Petroleum, Inc. | 7.375 | 05-01-22 | 400,000 | 297,000 | ||||||||||||||||||||||||||||
| Rate (%) | Maturity date | Par value^ | Value | |||||||||||||||||||||||||||||
| Energy (continued) | ||||||||||||||||||||||||||||||||
| Oil, gas and consumable fuels (continued) | ||||||||||||||||||||||||||||||||
| Linn Energy LLC | 6.500 | 09-15-21 | 390,000 | $42,900 | ||||||||||||||||||||||||||||
| Linn Energy LLC | 7.750 | 02-01-21 | 1,235,000 | 148,200 | ||||||||||||||||||||||||||||
| Marathon Petroleum Corp. | 6.500 | 03-01-41 | 3,600,000 | 3,324,913 | ||||||||||||||||||||||||||||
| Midstates Petroleum Company, Inc. | 10.750 | 10-01-20 | 650,000 | 29,250 | ||||||||||||||||||||||||||||
| Oasis Petroleum, Inc. | 7.250 | 02-01-19 | 1,410,000 | 874,200 | ||||||||||||||||||||||||||||
| Pertamina Persero PT | 6.000 | 05-03-42 | 200,000 | 163,053 | ||||||||||||||||||||||||||||
| Petroleos de Venezuela SA | 5.125 | 10-28-16 | 1,826,333 | 1,013,615 | ||||||||||||||||||||||||||||
| Petroleos de Venezuela SA | 5.250 | 04-12-17 | 3,289,000 | 1,282,710 | ||||||||||||||||||||||||||||
| Petroleos de Venezuela SA | 8.500 | 11-02-17 | 5,502,267 | 2,269,135 | ||||||||||||||||||||||||||||
| Petroleos Mexicanos | 3.500 | 01-30-23 | 455,000 | 387,888 | ||||||||||||||||||||||||||||
| Petroleos Mexicanos (S) | 4.250 | 01-15-25 | 1,395,000 | 1,198,305 | ||||||||||||||||||||||||||||
| Petroleos Mexicanos (S) | 4.500 | 01-23-26 | 181,000 | 155,660 | ||||||||||||||||||||||||||||
| Petroleos Mexicanos | 4.875 | 01-18-24 | 479,000 | 433,438 | ||||||||||||||||||||||||||||
| Petroleos Mexicanos | 5.500 | 01-21-21 | 842,000 | 828,318 | ||||||||||||||||||||||||||||
| Petroleos Mexicanos | 5.500 | 06-27-44 | 518,000 | 389,795 | ||||||||||||||||||||||||||||
| Petroleos Mexicanos | 5.625 | 01-23-46 | 173,000 | 133,210 | ||||||||||||||||||||||||||||
| Petroleos Mexicanos (S) | 5.625 | 01-23-46 | 1,157,000 | 890,890 | ||||||||||||||||||||||||||||
| Petroleos Mexicanos | 6.000 | 03-05-20 | 65,000 | 66,138 | ||||||||||||||||||||||||||||
| Petroleos Mexicanos (S) | 6.375 | 02-04-21 | 189,000 | 190,945 | ||||||||||||||||||||||||||||
| Petroleos Mexicanos | 6.375 | 01-23-45 | 1,324,000 | 1,117,125 | ||||||||||||||||||||||||||||
| Petroleos Mexicanos | 6.500 | 06-02-41 | 649,000 | 552,948 | ||||||||||||||||||||||||||||
| Petroleos Mexicanos (S) | 6.875 | 08-04-26 | 1,057,000 | 1,068,855 | ||||||||||||||||||||||||||||
| Petroleos Mexicanos | 9.500 | 09-15-27 | 97,000 | 110,095 | ||||||||||||||||||||||||||||
| Petronas Capital, Ltd. (S) | 3.500 | 03-18-25 | 930,000 | 913,654 | ||||||||||||||||||||||||||||
| Petronas Capital, Ltd. (S) | 4.500 | 03-18-45 | 602,000 | 577,204 | ||||||||||||||||||||||||||||
| Phillips 66 | 4.650 | 11-15-34 | 1,950,000 | 1,708,660 | ||||||||||||||||||||||||||||
| Plains All American Pipeline LP | 3.600 | 11-01-24 | 3,700,000 | 2,970,371 | ||||||||||||||||||||||||||||
| QEP Resources, Inc. | 5.375 | 10-01-22 | 1,250,000 | 850,000 | ||||||||||||||||||||||||||||
| Rosneft Oil Company (S) | 4.199 | 03-06-22 | 253,000 | 222,008 | ||||||||||||||||||||||||||||
| Rosneft Oil Company | 4.199 | 03-06-22 | 473,000 | 415,843 | ||||||||||||||||||||||||||||
| Schlumberger Holdings Corp. (S) | 4.000 | 12-21-25 | 5,250,000 | 5,114,015 | ||||||||||||||||||||||||||||
| Sinopec Group Overseas Development 2012, Ltd. (S) | 4.875 | 05-17-42 | 200,000 | 209,539 | ||||||||||||||||||||||||||||
| Sinopec Group Overseas Development 2015, Ltd. (S) | 3.250 | 04-28-25 | 292,000 | 284,370 | ||||||||||||||||||||||||||||
| Spectra Energy Partners LP | 3.500 | 03-15-25 | 3,625,000 | 3,187,666 | ||||||||||||||||||||||||||||
| State Oil Company of the Azerbaijan Republic | 4.750 | 03-13-23 | 2,026,000 | 1,660,737 | ||||||||||||||||||||||||||||
| Tesoro Logistics LP | 5.875 | 10-01-20 | 274,000 | 254,820 | ||||||||||||||||||||||||||||
| Tesoro Logistics LP | 6.125 | 10-15-21 | 600,000 | 543,000 | ||||||||||||||||||||||||||||
| TransCanada PipeLines, Ltd. | 1.625 | 11-09-17 | 2,275,000 | 2,236,796 | ||||||||||||||||||||||||||||
| Williams Partners LP | 3.600 | 03-15-22 | 3,675,000 | 2,684,102 | ||||||||||||||||||||||||||||
| YPF SA (S) | 8.750 | 04-04-24 | 490,000 | 469,910 | ||||||||||||||||||||||||||||
| Zhaikmunai LLP (S) | 6.375 | 02-14-19 | 219,000 | 160,418 | ||||||||||||||||||||||||||||
| Rate (%) | Maturity date | Par value^ | Value | |||||||||||||||||||||||||||||
| Energy (continued) | ||||||||||||||||||||||||||||||||
| Oil, gas and consumable fuels (continued) | ||||||||||||||||||||||||||||||||
| Zhaikmunai LLP (S) | 7.125 | 11-13-19 | 307,000 | $224,804 | ||||||||||||||||||||||||||||
| Financials 10.5% | 141,855,497 | |||||||||||||||||||||||||||||||
| Banks 5.3% | ||||||||||||||||||||||||||||||||
| Bank of America Corp. | 3.300 | 01-11-23 | 6,625,000 | 6,524,830 | ||||||||||||||||||||||||||||
| Bank of America Corp. | 3.950 | 04-21-25 | 2,550,000 | 2,486,941 | ||||||||||||||||||||||||||||
| Bank of America Corp. | 6.050 | 05-16-16 | 3,530,000 | 3,579,067 | ||||||||||||||||||||||||||||
| Barclays PLC | 2.875 | 06-08-20 | 4,000,000 | 3,983,600 | ||||||||||||||||||||||||||||
| BPCE SA (S) | 5.700 | 10-22-23 | 3,450,000 | 3,588,887 | ||||||||||||||||||||||||||||
| CIT Group, Inc. | 5.000 | 08-15-22 | 630,000 | 637,103 | ||||||||||||||||||||||||||||
| Citigroup, Inc. | 1.800 | 02-05-18 | 950,000 | 942,410 | ||||||||||||||||||||||||||||
| Citigroup, Inc. | 3.500 | 05-15-23 | 4,950,000 | 4,781,304 | ||||||||||||||||||||||||||||
| Citigroup, Inc. | 3.875 | 03-26-25 | 5,150,000 | 4,957,720 | ||||||||||||||||||||||||||||
| HBOS PLC (S) | 6.750 | 05-21-18 | 3,175,000 | 3,469,900 | ||||||||||||||||||||||||||||
| ING Groep NV (6.500% to 4-16-25, then 5 Year U.S. Swap Rate + 4.446%) (Q) | 6.500 | 04-16-25 | 3,700,000 | 3,584,375 | ||||||||||||||||||||||||||||
| JPMorgan Chase & Co. | 2.250 | 01-23-20 | 3,875,000 | 3,843,461 | ||||||||||||||||||||||||||||
| Mizuho Bank, Ltd. (S) | 2.950 | 10-17-22 | 3,075,000 | 3,097,054 | ||||||||||||||||||||||||||||
| Mizuho Bank, Ltd. (S) | 3.600 | 09-25-24 | 2,475,000 | 2,556,918 | ||||||||||||||||||||||||||||
| MUFG Americas Holdings Corp. | 3.000 | 02-10-25 | 3,550,000 | 3,469,202 | ||||||||||||||||||||||||||||
| PNC Bank NA | 2.700 | 11-01-22 | 3,000,000 | 2,967,132 | ||||||||||||||||||||||||||||
| Royal Bank of Scotland Group PLC | 6.100 | 06-10-23 | 3,325,000 | 3,542,305 | ||||||||||||||||||||||||||||
| Santander UK PLC (S) | 5.000 | 11-07-23 | 1,950,000 | 2,033,481 | ||||||||||||||||||||||||||||
| Skandinaviska Enskilda Banken AB (S) | 2.375 | 03-25-19 | 3,725,000 | 3,776,405 | ||||||||||||||||||||||||||||
| The PNC Financial Services Group, Inc. | 3.900 | 04-29-24 | 4,155,000 | 4,324,923 | ||||||||||||||||||||||||||||
| Wells Fargo & Company | 3.450 | 02-13-23 | 3,650,000 | 3,685,978 | ||||||||||||||||||||||||||||
| Capital markets 1.0% | ||||||||||||||||||||||||||||||||
| 1MDB Global Investments, Ltd. | 4.400 | 03-09-23 | 1,000,000 | 884,797 | ||||||||||||||||||||||||||||
| Morgan Stanley | 4.875 | 11-01-22 | 3,700,000 | 3,935,971 | ||||||||||||||||||||||||||||
| Nomura Holdings, Inc. | 2.750 | 03-19-19 | 3,575,000 | 3,633,212 | ||||||||||||||||||||||||||||
| TD Ameritrade Holding Corp. | 2.950 | 04-01-22 | 5,275,000 | 5,346,249 | ||||||||||||||||||||||||||||
| Consumer finance 1.4% | ||||||||||||||||||||||||||||||||
| American Express Company | 3.625 | 12-05-24 | 3,850,000 | 3,837,276 | ||||||||||||||||||||||||||||
| Capital One Bank USA NA | 3.375 | 02-15-23 | 3,525,000 | 3,444,059 | ||||||||||||||||||||||||||||
| Capital One Financial Corp. | 6.750 | 09-15-17 | 3,650,000 | 3,926,301 | ||||||||||||||||||||||||||||
| Discover Bank | 4.250 | 03-13-26 | 3,800,000 | 3,821,044 | ||||||||||||||||||||||||||||
| Synchrony Financial | 4.250 | 08-15-24 | 3,650,000 | 3,617,190 | ||||||||||||||||||||||||||||
| Insurance 1.1% | ||||||||||||||||||||||||||||||||
| American International Group, Inc. | 3.875 | 01-15-35 | 5,575,000 | 4,600,551 | ||||||||||||||||||||||||||||
| Marsh & McLennan Companies, Inc. | 3.500 | 03-10-25 | 4,050,000 | 4,028,397 | ||||||||||||||||||||||||||||
| Nippon Life Insurance Company (5.100% to 10-16-24, then 5 Year U.S. ISDAFIX + 3.650%) (S) | 5.100 | 10-16-44 | 3,450,000 | 3,596,625 | ||||||||||||||||||||||||||||
| Rate (%) | Maturity date | Par value^ | Value | |||||||||||||||||||||||||||||
| Financials (continued) | ||||||||||||||||||||||||||||||||
| Insurance (continued) | ||||||||||||||||||||||||||||||||
| Reinsurance Group of America, Inc. | 4.700 | 09-15-23 | 3,025,000 | $3,192,183 | ||||||||||||||||||||||||||||
| Real estate investment trusts 1.6% | ||||||||||||||||||||||||||||||||
| AvalonBay Communities, Inc. | 3.450 | 06-01-25 | 3,700,000 | 3,730,862 | ||||||||||||||||||||||||||||
| Corporate Office Properties LP | 3.600 | 05-15-23 | 3,875,000 | 3,601,727 | ||||||||||||||||||||||||||||
| DDR Corp. | 3.500 | 01-15-21 | 3,695,000 | 3,731,130 | ||||||||||||||||||||||||||||
| Digital Delta Holdings LLC (S) | 4.750 | 10-01-25 | 3,300,000 | 3,414,461 | ||||||||||||||||||||||||||||
| Kimco Realty Corp. | 3.200 | 05-01-21 | 3,450,000 | 3,506,421 | ||||||||||||||||||||||||||||
| Select Income REIT | 4.150 | 02-01-22 | 3,550,000 | 3,461,545 | ||||||||||||||||||||||||||||
| Thrifts and mortgage finance 0.1% | ||||||||||||||||||||||||||||||||
| Quicken Loans, Inc. (S) | 5.750 | 05-01-25 | 760,000 | 712,500 | ||||||||||||||||||||||||||||
| Health care 3.0% | 40,150,502 | |||||||||||||||||||||||||||||||
| Biotechnology 0.5% | ||||||||||||||||||||||||||||||||
| Amgen, Inc. | 3.625 | 05-22-24 | 4,000,000 | 4,056,140 | ||||||||||||||||||||||||||||
| Gilead Sciences, Inc. | 4.500 | 02-01-45 | 3,300,000 | 3,255,358 | ||||||||||||||||||||||||||||
| Health care equipment and supplies 0.7% | ||||||||||||||||||||||||||||||||
| Kinetic Concepts, Inc. | 10.500 | 11-01-18 | 780,000 | 756,600 | ||||||||||||||||||||||||||||
| Kinetic Concepts, Inc. | 12.500 | 11-01-19 | 535,000 | 478,825 | ||||||||||||||||||||||||||||
| Medtronic, Inc. | 3.150 | 03-15-22 | 2,825,000 | 2,918,431 | ||||||||||||||||||||||||||||
| Medtronic, Inc. | 4.625 | 03-15-45 | 950,000 | 998,031 | ||||||||||||||||||||||||||||
| Zimmer Holdings, Inc. | 2.700 | 04-01-20 | 3,625,000 | 3,608,887 | ||||||||||||||||||||||||||||
| Health care providers and services 1.0% | ||||||||||||||||||||||||||||||||
| Amsurg Corp. | 5.625 | 07-15-22 | 775,000 | 778,778 | ||||||||||||||||||||||||||||
| Centene Corp. (S) | 5.625 | 02-15-21 | 475,000 | 483,313 | ||||||||||||||||||||||||||||
| Community Health Systems, Inc. | 6.875 | 02-01-22 | 995,000 | 904,082 | ||||||||||||||||||||||||||||
| DaVita HealthCare Partners, Inc. | 5.125 | 07-15-24 | 765,000 | 769,303 | ||||||||||||||||||||||||||||
| HCA, Inc. | 5.250 | 04-15-25 | 420,000 | 430,500 | ||||||||||||||||||||||||||||
| HCA, Inc. | 5.375 | 02-01-25 | 1,555,000 | 1,572,494 | ||||||||||||||||||||||||||||
| HealthSouth Corp. | 5.750 | 11-01-24 | 1,195,000 | 1,179,573 | ||||||||||||||||||||||||||||
| Humana, Inc. | 4.625 | 12-01-42 | 3,500,000 | 3,302,184 | ||||||||||||||||||||||||||||
| IASIS Healthcare LLC | 8.375 | 05-15-19 | 725,000 | 679,688 | ||||||||||||||||||||||||||||
| LifePoint Health, Inc. | 5.500 | 12-01-21 | 1,325,000 | 1,344,875 | ||||||||||||||||||||||||||||
| MEDNAX, Inc. (S) | 5.250 | 12-01-23 | 710,000 | 727,750 | ||||||||||||||||||||||||||||
| TeamHealth, Inc. (S) | 7.250 | 12-15-23 | 895,000 | 935,275 | ||||||||||||||||||||||||||||
| Tenet Healthcare Corp. | 6.000 | 10-01-20 | 240,000 | 254,400 | ||||||||||||||||||||||||||||
| Life sciences tools and services 0.3% | ||||||||||||||||||||||||||||||||
| Thermo Fisher Scientific, Inc. | 1.300 | 02-01-17 | 3,825,000 | 3,812,798 | ||||||||||||||||||||||||||||
| Pharmaceuticals 0.5% | ||||||||||||||||||||||||||||||||
| Actavis Funding SCS | 3.450 | 03-15-22 | 2,800,000 | 2,841,552 | ||||||||||||||||||||||||||||
| Actavis Funding SCS | 4.550 | 03-15-35 | 1,060,000 | 1,045,578 | ||||||||||||||||||||||||||||
| Endo Finance LLC (S) | 6.000 | 02-01-25 | 930,000 | 918,487 | ||||||||||||||||||||||||||||
| Mallinckrodt International Finance SA (S) | 5.625 | 10-15-23 | 800,000 | 750,000 | ||||||||||||||||||||||||||||
| Rate (%) | Maturity date | Par value^ | Value | |||||||||||||||||||||||||||||
| Health care (continued) | ||||||||||||||||||||||||||||||||
| Pharmaceuticals (continued) | ||||||||||||||||||||||||||||||||
| Quintiles Transnational Corp. (S) | 4.875 | 05-15-23 | 310,000 | $313,875 | ||||||||||||||||||||||||||||
| Valeant Pharmaceuticals International, Inc. (S) | 5.875 | 05-15-23 | 1,155,000 | 1,033,725 | ||||||||||||||||||||||||||||
| Industrials 4.1% | 54,918,998 | |||||||||||||||||||||||||||||||
| Aerospace and defense 0.6% | ||||||||||||||||||||||||||||||||
| Erickson, Inc. | 8.250 | 05-01-20 | 504,000 | 312,480 | ||||||||||||||||||||||||||||
| Huntington Ingalls Industries, Inc. (S) | 5.000 | 12-15-21 | 315,000 | 325,238 | ||||||||||||||||||||||||||||
| Lockheed Martin Corp. | 3.100 | 01-15-23 | 3,400,000 | 3,455,930 | ||||||||||||||||||||||||||||
| Textron, Inc. | 3.650 | 03-01-21 | 3,700,000 | 3,795,682 | ||||||||||||||||||||||||||||
| Air freight and logistics 0.2% | ||||||||||||||||||||||||||||||||
| FedEx Corp. | 5.100 | 01-15-44 | 1,800,000 | 1,856,898 | ||||||||||||||||||||||||||||
| XPO Logistics, Inc. (S) | 6.500 | 06-15-22 | 950,000 | 850,250 | ||||||||||||||||||||||||||||
| Building products 0.3% | ||||||||||||||||||||||||||||||||
| Cleaver-Brooks, Inc. (S) | 8.750 | 12-15-19 | 940,000 | 883,600 | ||||||||||||||||||||||||||||
| Griffon Corp. | 5.250 | 03-01-22 | 1,615,000 | 1,542,325 | ||||||||||||||||||||||||||||
| Masonite International Corp. (S) | 5.625 | 03-15-23 | 485,000 | 497,125 | ||||||||||||||||||||||||||||
| NCI Building Systems, Inc. (S) | 8.250 | 01-15-23 | 490,000 | 509,600 | ||||||||||||||||||||||||||||
| Commercial services and supplies 0.7% | ||||||||||||||||||||||||||||||||
| ACCO Brands Corp. | 6.750 | 04-30-20 | 1,141,000 | 1,173,804 | ||||||||||||||||||||||||||||
| Pitney Bowes, Inc. | 4.625 | 03-15-24 | 3,900,000 | 3,848,274 | ||||||||||||||||||||||||||||
| Republic Services, Inc. | 3.550 | 06-01-22 | 3,775,000 | 3,934,841 | ||||||||||||||||||||||||||||
| Construction and engineering 0.2% | ||||||||||||||||||||||||||||||||
| AECOM | 5.750 | 10-15-22 | 855,000 | 864,619 | ||||||||||||||||||||||||||||
| MasTec, Inc. | 4.875 | 03-15-23 | 1,700,000 | 1,423,750 | ||||||||||||||||||||||||||||
| Electrical equipment 0.2% | ||||||||||||||||||||||||||||||||
| Artesyn Embedded Technologies, Inc. (S) | 9.750 | 10-15-20 | 625,000 | 543,750 | ||||||||||||||||||||||||||||
| CeramTec Group GmbH | 8.250 | 08-15-21 | EUR | 800,000 | 925,005 | |||||||||||||||||||||||||||
| EnerSys (S) | 5.000 | 04-30-23 | 710,000 | 699,350 | ||||||||||||||||||||||||||||
| Industrial conglomerates 0.1% | ||||||||||||||||||||||||||||||||
| Siemens Financieringsmaatschappij NV (S) | 3.250 | 05-27-25 | 1,875,000 | 1,912,328 | ||||||||||||||||||||||||||||
| Machinery 0.0% | ||||||||||||||||||||||||||||||||
| Xerium Technologies, Inc. | 8.875 | 06-15-18 | 420,000 | 407,925 | ||||||||||||||||||||||||||||
| Road and rail 1.2% | ||||||||||||||||||||||||||||||||
| Burlington Northern Santa Fe LLC | 4.400 | 03-15-42 | 3,615,000 | 3,453,796 | ||||||||||||||||||||||||||||
| ERAC USA Finance LLC (S) | 3.850 | 11-15-24 | 3,775,000 | 3,812,180 | ||||||||||||||||||||||||||||
| Penske Truck Leasing Company LP (S) | 3.375 | 02-01-22 | 3,725,000 | 3,655,246 | ||||||||||||||||||||||||||||
| Ryder System, Inc. | 2.450 | 09-03-19 | 3,800,000 | 3,758,705 | ||||||||||||||||||||||||||||
| Ryder System, Inc. | 2.550 | 06-01-19 | 2,000,000 | 1,999,520 | ||||||||||||||||||||||||||||
| Trading companies and distributors 0.6% | ||||||||||||||||||||||||||||||||
| Air Lease Corp. | 3.875 | 04-01-21 | 3,725,000 | 3,725,000 | ||||||||||||||||||||||||||||
| Aircastle, Ltd. | 5.500 | 02-15-22 | 550,000 | 547,250 | ||||||||||||||||||||||||||||
| Rate (%) | Maturity date | Par value^ | Value | |||||||||||||||||||||||||||||
| Industrials (continued) | ||||||||||||||||||||||||||||||||
| Trading companies and distributors (continued) | ||||||||||||||||||||||||||||||||
| GATX Corp. | 2.600 | 03-30-20 | 3,875,000 | $3,779,102 | ||||||||||||||||||||||||||||
| WESCO Distribution, Inc. | 5.375 | 12-15-21 | 455,000 | 425,425 | ||||||||||||||||||||||||||||
| Information technology 1.7% | 22,183,828 | |||||||||||||||||||||||||||||||
| Communications equipment 0.3% | ||||||||||||||||||||||||||||||||
| Alcatel-Lucent USA, Inc. (S) | 6.750 | 11-15-20 | 820,000 | 881,500 | ||||||||||||||||||||||||||||
| Cisco Systems, Inc. | 2.450 | 06-15-20 | 3,700,000 | 3,782,029 | ||||||||||||||||||||||||||||
| Electronic equipment, instruments and components 0.5% | ||||||||||||||||||||||||||||||||
| Corning, Inc. | 1.500 | 05-08-18 | 2,950,000 | 2,897,407 | ||||||||||||||||||||||||||||
| Ingram Micro, Inc. | 4.950 | 12-15-24 | 3,575,000 | 3,518,186 | ||||||||||||||||||||||||||||
| Internet software and services 0.3% | ||||||||||||||||||||||||||||||||
| Tencent Holdings, Ltd. (S) | 2.875 | 02-11-20 | 3,625,000 | 3,648,360 | ||||||||||||||||||||||||||||
| IT services 0.1% | ||||||||||||||||||||||||||||||||
| First Data Corp. (S) | 7.000 | 12-01-23 | 785,000 | 792,850 | ||||||||||||||||||||||||||||
| Sixsigma Networks Mexico SA de CV (S) | 8.250 | 11-07-21 | 43,000 | 39,130 | ||||||||||||||||||||||||||||
| Software 0.1% | ||||||||||||||||||||||||||||||||
| Nuance Communications, Inc. (S) | 5.375 | 08-15-20 | 825,000 | 822,938 | ||||||||||||||||||||||||||||
| Technology hardware, storage and peripherals 0.4% | ||||||||||||||||||||||||||||||||
| Apple, Inc. | 3.850 | 05-04-43 | 5,850,000 | 5,259,928 | ||||||||||||||||||||||||||||
| NCR Corp. | 5.000 | 07-15-22 | 570,000 | 541,500 | ||||||||||||||||||||||||||||
| Materials 2.9% | 39,607,892 | |||||||||||||||||||||||||||||||
| Building materials 0.1% | ||||||||||||||||||||||||||||||||
| Building Materials Corp. of America (S) | 5.375 | 11-15-24 | 790,000 | 778,150 | ||||||||||||||||||||||||||||
| Chemicals 1.1% | ||||||||||||||||||||||||||||||||
| Chemtura Corp. | 5.750 | 07-15-21 | 2,015,000 | 1,999,888 | ||||||||||||||||||||||||||||
| Eastman Chemical Company | 4.650 | 10-15-44 | 1,700,000 | 1,407,000 | ||||||||||||||||||||||||||||
| INEOS Group Holdings SA (S) | 5.875 | 02-15-19 | 1,165,000 | 1,131,506 | ||||||||||||||||||||||||||||
| LyondellBasell Industries NV | 6.000 | 11-15-21 | 3,300,000 | 3,673,580 | ||||||||||||||||||||||||||||
| OCP SA (S) | 5.625 | 04-25-24 | 285,000 | 283,381 | ||||||||||||||||||||||||||||
| Platform Specialty Products Corp. (S) | 6.500 | 02-01-22 | 790,000 | 620,150 | ||||||||||||||||||||||||||||
| Sinochem Offshore Capital Company, Ltd. (S) | 3.250 | 04-29-19 | 1,288,000 | 1,304,712 | ||||||||||||||||||||||||||||
| Sinochem Overseas Capital Company, Ltd. (S) | 4.500 | 11-12-20 | 539,000 | 569,843 | ||||||||||||||||||||||||||||
| SPCM SA (S) | 6.000 | 01-15-22 | 565,000 | 569,238 | ||||||||||||||||||||||||||||
| The Mosaic Company | 4.250 | 11-15-23 | 3,350,000 | 3,252,130 | ||||||||||||||||||||||||||||
| Trinseo Materials Operating SCA (S) | 6.750 | 05-01-22 | 915,000 | 869,250 | ||||||||||||||||||||||||||||
| Construction materials 0.1% | ||||||||||||||||||||||||||||||||
| Cemex Finance LLC (S) | 9.375 | 10-12-22 | 361,000 | 364,502 | ||||||||||||||||||||||||||||
| Cemex SAB de CV (S) | 5.700 | 01-11-25 | 86,000 | 72,025 | ||||||||||||||||||||||||||||
| Cemex SAB de CV (S) | 6.125 | 05-05-25 | 212,000 | 181,461 | ||||||||||||||||||||||||||||
| Cemex SAB de CV (S) | 9.500 | 06-15-18 | 200,000 | 207,500 | ||||||||||||||||||||||||||||
| CIMPOR Financial Operations BV (S) | 5.750 | 07-17-24 | 97,000 | 59,655 | ||||||||||||||||||||||||||||
| Rate (%) | Maturity date | Par value^ | Value | |||||||||||||||||||||||||||||
| Materials (continued) | ||||||||||||||||||||||||||||||||
| Containers and packaging 0.4% | ||||||||||||||||||||||||||||||||
| Ball Corp. | 5.250 | 07-01-25 | 300,000 | $309,000 | ||||||||||||||||||||||||||||
| Berry Plastics Corp. (S) | 6.000 | 10-15-22 | 550,000 | 561,000 | ||||||||||||||||||||||||||||
| Cascades, Inc. (S) | 5.500 | 07-15-22 | 890,000 | 852,175 | ||||||||||||||||||||||||||||
| Owens-Brockway Glass Container, Inc. (S) | 5.875 | 08-15-23 | 905,000 | 888,031 | ||||||||||||||||||||||||||||
| Packaging Corp. of America | 3.900 | 06-15-22 | 1,850,000 | 1,920,208 | ||||||||||||||||||||||||||||
| Sealed Air Corp. (S) | 5.125 | 12-01-24 | 1,100,000 | 1,100,000 | ||||||||||||||||||||||||||||
| Metals and mining 1.0% | ||||||||||||||||||||||||||||||||
| ABJA Investment Company Pte, Ltd. | 5.950 | 07-31-24 | 380,000 | 319,517 | ||||||||||||||||||||||||||||
| ArcelorMittal | 7.250 | 02-25-22 | 360,000 | 292,500 | ||||||||||||||||||||||||||||
| ArcelorMittal | 8.000 | 10-15-39 | 625,000 | 440,625 | ||||||||||||||||||||||||||||
| BHP Billiton Finance USA, Ltd. (6.750% to 10-19-25, then 5 Year U.S. Swap Rate + 5.093%) (S) | 6.750 | 10-19-75 | 3,675,000 | 3,454,500 | ||||||||||||||||||||||||||||
| Corporacion Nacional del Cobre de Chile (S) | 3.000 | 07-17-22 | 1,692,000 | 1,557,283 | ||||||||||||||||||||||||||||
| Corporacion Nacional del Cobre de Chile (S) | 4.250 | 07-17-42 | 200,000 | 153,749 | ||||||||||||||||||||||||||||
| Corporacion Nacional del Cobre de Chile (S) | 4.500 | 08-13-23 | 2,513,000 | 2,454,535 | ||||||||||||||||||||||||||||
| Corporacion Nacional del Cobre de Chile (S) | 4.500 | 09-16-25 | 218,000 | 208,873 | ||||||||||||||||||||||||||||
| Corporacion Nacional del Cobre de Chile (S) | 4.875 | 11-04-44 | 1,045,000 | 874,838 | ||||||||||||||||||||||||||||
| GTL Trade Finance, Inc. (S) | 5.893 | 04-29-24 | 455,000 | 308,718 | ||||||||||||||||||||||||||||
| Newmont Mining Corp. | 6.250 | 10-01-39 | 3,450,000 | 2,849,866 | ||||||||||||||||||||||||||||
| Samarco Mineracao SA (S) | 4.125 | 11-01-22 | 157,000 | 65,893 | ||||||||||||||||||||||||||||
| Signode Industrial Group Lux SA (S) | 6.375 | 05-01-22 | 605,000 | 502,150 | ||||||||||||||||||||||||||||
| Vedanta Resources PLC (S) | 6.000 | 01-31-19 | 102,000 | 62,863 | ||||||||||||||||||||||||||||
| Vedanta Resources PLC (S) | 8.250 | 06-07-21 | 193,000 | 110,309 | ||||||||||||||||||||||||||||
| Paper and forest products 0.2% | ||||||||||||||||||||||||||||||||
| Louisiana-Pacific Corp. | 7.500 | 06-01-20 | 600,000 | 618,000 | ||||||||||||||||||||||||||||
| Mercer International, Inc. | 7.750 | 12-01-22 | 1,235,000 | 1,139,288 | ||||||||||||||||||||||||||||
| Norbord, Inc. (S) | 5.375 | 12-01-20 | 1,220,000 | 1,220,000 | ||||||||||||||||||||||||||||
| Telecommunication services 2.2% | 29,529,291 | |||||||||||||||||||||||||||||||
| Diversified telecommunication services 1.9% | ||||||||||||||||||||||||||||||||
| AT&T, Inc. | 2.450 | 06-30-20 | 1,850,000 | 1,824,383 | ||||||||||||||||||||||||||||
| CenturyLink, Inc. | 5.800 | 03-15-22 | 460,000 | 428,375 | ||||||||||||||||||||||||||||
| CenturyLink, Inc. | 7.650 | 03-15-42 | 885,000 | 663,750 | ||||||||||||||||||||||||||||
| Cincinnati Bell, Inc. | 8.375 | 10-15-20 | 1,095,000 | 1,114,163 | ||||||||||||||||||||||||||||
| Cogent Communications Group, Inc. (S) | 5.375 | 03-01-22 | 400,000 | 388,000 | ||||||||||||||||||||||||||||
| CyrusOne LP | 6.375 | 11-15-22 | 1,265,000 | 1,283,975 | ||||||||||||||||||||||||||||
| Frontier Communications Corp. | 6.250 | 09-15-21 | 905,000 | 762,182 | ||||||||||||||||||||||||||||
| Frontier Communications Corp. | 9.000 | 08-15-31 | 1,454,000 | 1,155,930 | ||||||||||||||||||||||||||||
| GCI, Inc. | 6.875 | 04-15-25 | 880,000 | 862,400 | ||||||||||||||||||||||||||||
| Level 3 Communications, Inc. | 5.750 | 12-01-22 | 625,000 | 643,750 | ||||||||||||||||||||||||||||
| Level 3 Financing, Inc. | 5.375 | 08-15-22 | 1,250,000 | 1,276,563 | ||||||||||||||||||||||||||||
| T-Mobile USA, Inc. | 6.500 | 01-15-26 | 1,020,000 | 1,014,900 | ||||||||||||||||||||||||||||
| Rate (%) | Maturity date | Par value^ | Value | |||||||||||||||||||||||||||||
| Telecommunication services (continued) | ||||||||||||||||||||||||||||||||
| Diversified telecommunication services (continued) | ||||||||||||||||||||||||||||||||
| T-Mobile USA, Inc. | 6.731 | 04-28-22 | 1,535,000 | $1,577,213 | ||||||||||||||||||||||||||||
| Telecom Italia SpA (S) | 5.303 | 05-30-24 | 410,000 | 399,750 | ||||||||||||||||||||||||||||
| Telefonica Emisiones SAU | 5.134 | 04-27-20 | 3,275,000 | 3,550,044 | ||||||||||||||||||||||||||||
| UPCB Finance IV, Ltd. (S) | 5.375 | 01-15-25 | 685,000 | 657,600 | ||||||||||||||||||||||||||||
| Verizon Communications, Inc. | 5.150 | 09-15-23 | 2,125,000 | 2,351,470 | ||||||||||||||||||||||||||||
| Verizon Communications, Inc. | 6.400 | 09-15-33 | 2,800,000 | 3,170,768 | ||||||||||||||||||||||||||||
| Wind Acquisition Finance SA (S) | 4.750 | 07-15-20 | 435,000 | 427,388 | ||||||||||||||||||||||||||||
| Wind Acquisition Finance SA (S) | 7.375 | 04-23-21 | 410,000 | 389,754 | ||||||||||||||||||||||||||||
| Windstream Services LLC | 7.500 | 04-01-23 | 1,460,000 | 1,120,550 | ||||||||||||||||||||||||||||
| Wireless telecommunication services 0.3% | ||||||||||||||||||||||||||||||||
| Digicel Group, Ltd. (S) | 7.125 | 04-01-22 | 661,000 | 492,776 | ||||||||||||||||||||||||||||
| Rogers Communications, Inc. | 5.450 | 10-01-43 | 1,825,000 | 1,936,157 | ||||||||||||||||||||||||||||
| Sprint Capital Corp. | 8.750 | 03-15-32 | 2,890,000 | 2,037,450 | ||||||||||||||||||||||||||||
| Utilities 3.1% | 42,302,852 | |||||||||||||||||||||||||||||||
| Electric utilities 1.6% | ||||||||||||||||||||||||||||||||
| Eskom Holdings SOC, Ltd. (S) | 7.125 | 02-11-25 | 4,386,000 | 3,779,092 | ||||||||||||||||||||||||||||
| Georgia Power Company | 4.300 | 03-15-42 | 5,550,000 | 5,364,036 | ||||||||||||||||||||||||||||
| NextEra Energy Capital Holdings, Inc. | 2.700 | 09-15-19 | 3,600,000 | 3,610,350 | ||||||||||||||||||||||||||||
| Oncor Electric Delivery Company LLC | 2.150 | 06-01-19 | 3,600,000 | 3,552,768 | ||||||||||||||||||||||||||||
| PacifiCorp | 2.950 | 02-01-22 | 3,950,000 | 3,997,064 | ||||||||||||||||||||||||||||
| Talen Energy Supply LLC (S) | 4.625 | 07-15-19 | 910,000 | 696,150 | ||||||||||||||||||||||||||||
| Talen Energy Supply LLC | 6.500 | 06-01-25 | 405,000 | 275,400 | ||||||||||||||||||||||||||||
| Independent power and renewable electricity producers 0.6% | ||||||||||||||||||||||||||||||||
| Calpine Corp. | 5.750 | 01-15-25 | 955,000 | 858,306 | ||||||||||||||||||||||||||||
| Dynegy, Inc. | 6.750 | 11-01-19 | 940,000 | 908,275 | ||||||||||||||||||||||||||||
| Dynegy, Inc. | 7.625 | 11-01-24 | 545,000 | 479,600 | ||||||||||||||||||||||||||||
| Exelon Generation Company LLC | 5.600 | 06-15-42 | 3,925,000 | 3,152,069 | ||||||||||||||||||||||||||||
| GenOn Energy, Inc. | 9.500 | 10-15-18 | 2,485,000 | 1,739,500 | ||||||||||||||||||||||||||||
| NRG Energy, Inc. | 6.250 | 07-15-22 | 1,365,000 | 1,126,125 | ||||||||||||||||||||||||||||
| Multi-utilities 0.9% | ||||||||||||||||||||||||||||||||
| Ameren Corp. | 2.700 | 11-15-20 | 3,500,000 | 3,533,814 | ||||||||||||||||||||||||||||
| Dominion Gas Holdings LLC | 4.800 | 11-01-43 | 1,850,000 | 1,807,230 | ||||||||||||||||||||||||||||
| Dominion Resources, Inc. (7.500% to 6-30-16, then 3 month LIBOR + 2.825%) | 7.500 | 06-30-66 | 1,975,000 | 1,651,594 | ||||||||||||||||||||||||||||
| DTE Energy Company | 3.850 | 12-01-23 | 3,200,000 | 3,346,790 | ||||||||||||||||||||||||||||
| WEC Energy Group, Inc. | 2.450 | 06-15-20 | 2,400,000 | 2,424,689 | ||||||||||||||||||||||||||||
| U.S. Government and Agency obligations 1.9% | $25,913,877 | |||||||||||||||||||||||||||||||
| (Cost $25,718,339) | ||||||||||||||||||||||||||||||||
| U.S. Government Agency 1.9% | 25,913,877 | |||||||||||||||||||||||||||||||
| Federal Home Loan Mortgage Corp. | ||||||||||||||||||||||||||||||||
| 30 Yr Pass Thru (P) | 2.515 | 01-01-37 | 310,515 | 327,348 | ||||||||||||||||||||||||||||
| Rate (%) | Maturity date | Par value^ | Value | |||||||||||||||||||||||||||||
| U.S. Government Agency (continued) | ||||||||||||||||||||||||||||||||
| 30 Yr Pass Thru (C) | 3.000 | TBA | 550,000 | $560,098 | ||||||||||||||||||||||||||||
| 30 Yr Pass Thru (C) | 3.500 | TBA | 1,050,000 | 1,096,758 | ||||||||||||||||||||||||||||
| 30 Yr Pass Thru (C) | 4.000 | TBA | 1,050,000 | 1,120,301 | ||||||||||||||||||||||||||||
| Federal National Mortgage Association | ||||||||||||||||||||||||||||||||
| 10 Yr Pass Thru | 5.000 | 01-01-19 | 1,587 | 1,659 | ||||||||||||||||||||||||||||
| 15 Yr Pass Thru (C) | 2.500 | TBA | 400,000 | 408,906 | ||||||||||||||||||||||||||||
| 15 Yr Pass Thru (C) | 3.000 | TBA | 2,000,000 | 2,083,281 | ||||||||||||||||||||||||||||
| 30 Yr Pass Thru (P) | 2.227 | 04-01-37 | 1,340,412 | 1,408,762 | ||||||||||||||||||||||||||||
| 30 Yr Pass Thru (P) | 2.517 | 10-01-38 | 473,483 | 501,679 | ||||||||||||||||||||||||||||
| 30 Yr Pass Thru (P) | 2.542 | 11-01-35 | 261,688 | 275,425 | ||||||||||||||||||||||||||||
| 30 Yr Pass Thru (P) | 2.782 | 01-01-37 | 98,363 | 104,010 | ||||||||||||||||||||||||||||
| 30 Yr Pass Thru (C) | 3.000 | TBA | 4,200,000 | 4,284,984 | ||||||||||||||||||||||||||||
| 30 Yr Pass Thru (C) | 3.500 | TBA | 3,800,000 | 3,977,531 | ||||||||||||||||||||||||||||
| 30 Yr Pass Thru (C) | 4.000 | TBA | 3,550,000 | 3,790,457 | ||||||||||||||||||||||||||||
| 30 Yr Pass Thru (C) | 4.500 | TBA | 1,775,000 | 1,929,203 | ||||||||||||||||||||||||||||
| 30 Yr Pass Thru (C) | 5.000 | TBA | 850,000 | 938,598 | ||||||||||||||||||||||||||||
| 30 Yr Pass Thru | 5.500 | 02-11-46 | 600,000 | 669,661 | ||||||||||||||||||||||||||||
| Government National Mortgage Association | ||||||||||||||||||||||||||||||||
| 30 Yr Pass Thru (C) | 3.500 | TBA | 1,475,000 | 1,552,438 | ||||||||||||||||||||||||||||
| 30 Yr Pass Thru (C) | 4.000 | TBA | 400,000 | 426,969 | ||||||||||||||||||||||||||||
| 30 Yr Pass Thru | 4.500 | 01-15-40 | 282,438 | 310,417 | ||||||||||||||||||||||||||||
| 30 Yr Pass Thru | 6.000 | 08-15-35 | 126,420 | 145,392 | ||||||||||||||||||||||||||||
| Foreign government obligations 6.7% | $90,549,871 | |||||||||||||||||||||||||||||||
| (Cost $98,604,814) | ||||||||||||||||||||||||||||||||
| Angola 0.1% | 1,927,164 | |||||||||||||||||||||||||||||||
| Republic of Angola | ||||||||||||||||||||||||||||||||
| Bond (S) | 9.500 | 11-12-25 | 1,226,000 | 1,023,955 | ||||||||||||||||||||||||||||
| Bond | 9.500 | 11-12-25 | 400,000 | 334,080 | ||||||||||||||||||||||||||||
| Note | 7.000 | 08-16-19 | 604,688 | 569,129 | ||||||||||||||||||||||||||||
| Argentina 0.5% | 6,200,588 | |||||||||||||||||||||||||||||||
| Republic of Argentina | ||||||||||||||||||||||||||||||||
| Bond (H) | 2.260 | 12-31-38 | EUR | 766,182 | 456,917 | |||||||||||||||||||||||||||
| Bond (H) | 5.870 | 03-31-23 | EUR | 760,000 | 420,951 | |||||||||||||||||||||||||||
| Bond (H) | 6.000 | 03-31-23 | 622,000 | 765,060 | ||||||||||||||||||||||||||||
| Bond (H) | 7.820 | 12-31-33 | EUR | 319,256 | 355,479 | |||||||||||||||||||||||||||
| Bond (H) | 7.820 | 12-31-33 | EUR | 3,208,029 | 3,606,843 | |||||||||||||||||||||||||||
| Bond (H) | 9.250 | 07-20-49 | EUR | 27,000 | 30,127 | |||||||||||||||||||||||||||
| Bond (H) | 9.750 | 11-26-49 | EUR | 4,000 | 4,767 | |||||||||||||||||||||||||||
| Bond (H) | 10.250 | 01-26-49 | EUR | 3,000 | 3,575 | |||||||||||||||||||||||||||
| Bond (H) | 11.000 | 12-04-49 | 36,000 | 72,360 | ||||||||||||||||||||||||||||
| Bond (H) | 11.375 | 01-30-17 | 3,000 | 6,270 | ||||||||||||||||||||||||||||
| Bond (H) | 11.750 | 04-07-49 | 2,000 | 4,020 | ||||||||||||||||||||||||||||
| Bond (H) | 12.250 | 06-19-18 | 3,184 | 6,654 | ||||||||||||||||||||||||||||
| Rate (%) | Maturity date | Par value^ | Value | |||||||||||||||||||||||||||||
| Argentina (continued) | ||||||||||||||||||||||||||||||||
| Bond (H) | 15.500 | 12-19-49 | 8,000 | $16,720 | ||||||||||||||||||||||||||||
| GDP-Linked Note (I) | 4.380 | * | 12-15-35 | EUR | 2,570,932 | 284,915 | ||||||||||||||||||||||||||
| GDP-Linked Note (I) | 4.435 | * | 12-15-35 | 231,000 | 24,648 | |||||||||||||||||||||||||||
| GDP-Linked Note (I) | 4.447 | * | 12-15-35 | 1,296,166 | 141,282 | |||||||||||||||||||||||||||
| Azerbaijan 0.0% | 395,378 | |||||||||||||||||||||||||||||||
| Republic of Azerbaijan Bond (S) |
4.750 | 03-18-24 | 443,000 | 395,378 | ||||||||||||||||||||||||||||
| Bahrain 0.0% | 363,854 | |||||||||||||||||||||||||||||||
| Kingdom of Bahrain Bond (S) |
7.000 | 01-26-26 | 365,000 | 363,854 | ||||||||||||||||||||||||||||
| Brazil 0.5% | 6,804,516 | |||||||||||||||||||||||||||||||
| Brazil Minas SPE Bond |
5.333 | 02-15-28 | 575,000 | 439,875 | ||||||||||||||||||||||||||||
| Federative Republic of Brazil | ||||||||||||||||||||||||||||||||
| Bond | 2.625 | 01-05-23 | 1,132,000 | 891,450 | ||||||||||||||||||||||||||||
| Bond | 4.250 | 01-07-25 | 841,000 | 704,338 | ||||||||||||||||||||||||||||
| Bond | 5.000 | 01-27-45 | 929,000 | 638,688 | ||||||||||||||||||||||||||||
| Bond | 5.625 | 01-07-41 | 2,801,000 | 2,100,750 | ||||||||||||||||||||||||||||
| Bond | 7.125 | 01-20-37 | 651,000 | 589,155 | ||||||||||||||||||||||||||||
| Bond | 8.250 | 01-20-34 | 1,426,000 | 1,440,260 | ||||||||||||||||||||||||||||
| Cameroon 0.0% | 171,500 | |||||||||||||||||||||||||||||||
| Republic of Cameroon Bond |
9.500 | 11-19-25 | 200,000 | 171,500 | ||||||||||||||||||||||||||||
| Colombia 0.5% | 7,014,077 | |||||||||||||||||||||||||||||||
| Bogota Distrito Capital Bond |
9.750 | 07-26-28 | COP | 1,355,000,000 | 432,919 | |||||||||||||||||||||||||||
| Republic of Colombia | ||||||||||||||||||||||||||||||||
| Bond | 2.625 | 03-15-23 | 1,020,000 | 890,970 | ||||||||||||||||||||||||||||
| Bond | 4.000 | 02-26-24 | 593,000 | 556,827 | ||||||||||||||||||||||||||||
| Bond | 4.375 | 03-21-23 | COP | 1,605,000,000 | 399,478 | |||||||||||||||||||||||||||
| Bond | 5.000 | 06-15-45 | 570,000 | 465,975 | ||||||||||||||||||||||||||||
| Bond | 5.625 | 02-26-44 | 687,000 | 599,408 | ||||||||||||||||||||||||||||
| Bond | 7.375 | 09-18-37 | 1,320,000 | 1,386,000 | ||||||||||||||||||||||||||||
| Bond | 7.750 | 04-14-21 | COP | 1,386,000,000 | 423,084 | |||||||||||||||||||||||||||
| Bond | 8.125 | 05-21-24 | 476,000 | 560,490 | ||||||||||||||||||||||||||||
| Bond | 9.850 | 06-28-27 | COP | 1,702,000,000 | 578,136 | |||||||||||||||||||||||||||
| Bond | 10.375 | 01-28-33 | 278,000 | 373,910 | ||||||||||||||||||||||||||||
| Bond | 11.750 | 02-25-20 | 271,000 | 346,880 | ||||||||||||||||||||||||||||
| Costa Rica 0.3% | 3,754,475 | |||||||||||||||||||||||||||||||
| Republic of Costa Rica | ||||||||||||||||||||||||||||||||
| Bond | 4.250 | 01-26-23 | 2,016,000 | 1,779,120 | ||||||||||||||||||||||||||||
| Bond (S) | 4.375 | 04-30-25 | 775,000 | 654,875 | ||||||||||||||||||||||||||||
| Rate (%) | Maturity date | Par value^ | Value | |||||||||||||||||||||||||||||
| Costa Rica (continued) | ||||||||||||||||||||||||||||||||
| Bond (S) | 7.000 | 04-04-44 | 1,128,000 | $947,520 | ||||||||||||||||||||||||||||
| Bond | 7.158 | 03-12-45 | 444,000 | 372,960 | ||||||||||||||||||||||||||||
| Croatia 0.2% | 2,512,456 | |||||||||||||||||||||||||||||||
| Republic of Croatia | ||||||||||||||||||||||||||||||||
| Bond | 5.500 | 04-04-23 | 200,000 | 208,848 | ||||||||||||||||||||||||||||
| Bond (S) | 5.500 | 04-04-23 | 368,000 | 383,824 | ||||||||||||||||||||||||||||
| Bond | 6.375 | 03-24-21 | 1,200,000 | 1,301,990 | ||||||||||||||||||||||||||||
| Bond (S) | 6.375 | 03-24-21 | 171,000 | 185,364 | ||||||||||||||||||||||||||||
| Bond | 6.625 | 07-14-20 | 396,000 | 432,430 | ||||||||||||||||||||||||||||
| Dominican Republic 0.3% | 4,373,596 | |||||||||||||||||||||||||||||||
| Government of Dominican Republic | ||||||||||||||||||||||||||||||||
| Bond (S) | 5.875 | 04-18-24 | 608,000 | 586,720 | ||||||||||||||||||||||||||||
| Bond | 6.600 | 01-28-24 | 814,000 | 820,105 | ||||||||||||||||||||||||||||
| Bond (S) | 6.850 | 01-27-45 | 179,000 | 163,338 | ||||||||||||||||||||||||||||
| Bond | 7.500 | 05-06-21 | 2,651,000 | 2,803,433 | ||||||||||||||||||||||||||||
| Egypt 0.1% | 981,543 | |||||||||||||||||||||||||||||||
| Arab Republic of Egypt Bond (S) |
5.875 | 06-11-25 | 1,177,000 | 981,543 | ||||||||||||||||||||||||||||
| El Salvador 0.2% | 2,720,647 | |||||||||||||||||||||||||||||||
| Republic of El Salvador | ||||||||||||||||||||||||||||||||
| Bond (S) | 5.875 | 01-30-25 | 239,000 | 190,005 | ||||||||||||||||||||||||||||
| Bond (S) | 7.375 | 12-01-19 | 180,000 | 173,475 | ||||||||||||||||||||||||||||
| Bond | 7.375 | 12-01-19 | 396,000 | 381,645 | ||||||||||||||||||||||||||||
| Bond | 7.650 | 06-15-35 | 1,974,000 | 1,554,525 | ||||||||||||||||||||||||||||
| Bond | 7.750 | 01-24-23 | 275,000 | 256,094 | ||||||||||||||||||||||||||||
| Bond | 8.250 | 04-10-32 | 189,000 | 164,903 | ||||||||||||||||||||||||||||
| Ethiopia 0.0% | 478,271 | |||||||||||||||||||||||||||||||
| Federal Democratic Republic of Ethiopia Bond (S) |
6.625 | 12-11-24 | 556,000 | 478,271 | ||||||||||||||||||||||||||||
| Gabon 0.1% | 673,217 | |||||||||||||||||||||||||||||||
| Republic of Gabon | ||||||||||||||||||||||||||||||||
| Bond (S) | 6.375 | 12-12-24 | 196,000 | 150,838 | ||||||||||||||||||||||||||||
| Bond (S) | 6.950 | 06-16-25 | 332,000 | 255,686 | ||||||||||||||||||||||||||||
| Bond | 8.200 | 12-12-17 | 271,000 | 266,693 | ||||||||||||||||||||||||||||
| Ghana 0.2% | 2,135,144 | |||||||||||||||||||||||||||||||
| Republic of Ghana | ||||||||||||||||||||||||||||||||
| Bond (S) | 8.125 | 01-18-26 | 682,000 | 488,394 | ||||||||||||||||||||||||||||
| Bond | 8.125 | 01-18-26 | 1,166,000 | 836,923 | ||||||||||||||||||||||||||||
| Bond | 8.500 | 10-04-17 | 231,000 | 212,535 | ||||||||||||||||||||||||||||
| Bond (S) | 10.750 | 10-14-30 | 631,000 | 597,292 | ||||||||||||||||||||||||||||
| Hungary 0.2% | 2,054,721 | |||||||||||||||||||||||||||||||
| Rate (%) | Maturity date | Par value^ | Value | |||||||||||||||||||||||||||||
| Hungary (continued) | ||||||||||||||||||||||||||||||||
| Republic of Hungary | ||||||||||||||||||||||||||||||||
| Bond | 5.375 | 02-21-23 | 1,499,000 | $1,638,707 | ||||||||||||||||||||||||||||
| Bond | 5.750 | 11-22-23 | 371,000 | 416,014 | ||||||||||||||||||||||||||||
| Indonesia 0.3% | 4,640,726 | |||||||||||||||||||||||||||||||
| Republic of Indonesia | ||||||||||||||||||||||||||||||||
| Bond (S) | 4.750 | 01-08-26 | 370,000 | 376,740 | ||||||||||||||||||||||||||||
| Bond | 4.875 | 05-05-21 | 2,300,000 | 2,414,248 | ||||||||||||||||||||||||||||
| Bond | 5.375 | 10-17-23 | 225,000 | 239,468 | ||||||||||||||||||||||||||||
| Bond (S) | 5.875 | 01-15-24 | 985,000 | 1,079,313 | ||||||||||||||||||||||||||||
| Bond | 8.500 | 10-12-35 | 420,000 | 530,957 | ||||||||||||||||||||||||||||
| Iraq 0.1% | 1,530,657 | |||||||||||||||||||||||||||||||
| Republic of Iraq Bond |
5.800 | 01-15-28 | 2,420,000 | 1,530,657 | ||||||||||||||||||||||||||||
| Ivory Coast 0.3% | 4,055,280 | |||||||||||||||||||||||||||||||
| Republic of Ivory Coast | ||||||||||||||||||||||||||||||||
| Bond (S) | 5.375 | 07-23-24 | 774,000 | 667,281 | ||||||||||||||||||||||||||||
| Bond | 5.750 | 12-31-32 | 1,677,000 | 1,456,672 | ||||||||||||||||||||||||||||
| Bond (S) | 6.375 | 03-03-28 | 2,192,000 | 1,931,327 | ||||||||||||||||||||||||||||
| Jamaica 0.1% | 1,731,313 | |||||||||||||||||||||||||||||||
| Government of Jamaica | ||||||||||||||||||||||||||||||||
| Bond | 6.750 | 04-28-28 | 1,136,000 | 1,127,480 | ||||||||||||||||||||||||||||
| Bond | 7.625 | 07-09-25 | 571,000 | 603,833 | ||||||||||||||||||||||||||||
| Kazakhstan 0.1% | 1,288,872 | |||||||||||||||||||||||||||||||
| Republic of Kazakhstan | ||||||||||||||||||||||||||||||||
| Bond | 5.125 | 07-21-25 | 690,000 | 687,771 | ||||||||||||||||||||||||||||
| Bond (S) | 5.125 | 07-21-25 | 604,000 | 601,101 | ||||||||||||||||||||||||||||
| Kenya 0.2% | 2,103,947 | |||||||||||||||||||||||||||||||
| Republic of Kenya | ||||||||||||||||||||||||||||||||
| Bond (S) | 5.875 | 06-24-19 | 505,000 | 478,336 | ||||||||||||||||||||||||||||
| Bond (S) | 6.875 | 06-24-24 | 1,487,000 | 1,323,489 | ||||||||||||||||||||||||||||
| Bond | 6.875 | 06-24-24 | 339,000 | 302,122 | ||||||||||||||||||||||||||||
| Lithuania 0.0% | 127,710 | |||||||||||||||||||||||||||||||
| Republic of Lithuania Bond (S) |
7.375 | 02-11-20 | 108,000 | 127,710 | ||||||||||||||||||||||||||||
| Mexico 0.2% | 3,068,967 | |||||||||||||||||||||||||||||||
| Government of Mexico | ||||||||||||||||||||||||||||||||
| Bond | 3.600 | 01-30-25 | 1,651,000 | 1,603,534 | ||||||||||||||||||||||||||||
| Bond | 4.600 | 01-23-46 | 1,036,000 | 919,450 | ||||||||||||||||||||||||||||
| Bond | 4.750 | 03-08-44 | 273,000 | 246,383 | ||||||||||||||||||||||||||||
| Bond | 6.050 | 01-11-40 | 280,000 | 299,600 | ||||||||||||||||||||||||||||
| Rate (%) | Maturity date | Par value^ | Value | |||||||||||||||||||||||||||||
| Morocco 0.0% | $266,367 | |||||||||||||||||||||||||||||||
| Kingdom of Morocco Bond (S) |
4.250 | 12-11-22 | 265,000 | 266,367 | ||||||||||||||||||||||||||||
| Mozambique 0.0% | 226,105 | |||||||||||||||||||||||||||||||
| Republic of Mozambique Bond |
6.305 | 09-11-20 | 285,740 | 226,105 | ||||||||||||||||||||||||||||
| Namibia 0.0% | 379,250 | |||||||||||||||||||||||||||||||
| Republic of Namibia Bond (S) |
5.250 | 10-29-25 | 410,000 | 379,250 | ||||||||||||||||||||||||||||
| Nigeria 0.1% | 1,319,052 | |||||||||||||||||||||||||||||||
| Federal Republic of Nigeria | ||||||||||||||||||||||||||||||||
| Bond (S) | 6.375 | 07-12-23 | 232,000 | 205,181 | ||||||||||||||||||||||||||||
| Bond | 6.375 | 07-12-23 | 669,000 | 593,081 | ||||||||||||||||||||||||||||
| Bond | 6.750 | 01-28-21 | 553,000 | 520,790 | ||||||||||||||||||||||||||||
| Panama 0.2% | 2,881,585 | |||||||||||||||||||||||||||||||
| Republic of Panama | ||||||||||||||||||||||||||||||||
| Bond | 4.875 | 02-05-21 | 2,000,000 | 2,132,400 | ||||||||||||||||||||||||||||
| Bond | 6.700 | 01-26-36 | 231,000 | 276,045 | ||||||||||||||||||||||||||||
| Bond | 9.375 | 04-01-29 | 328,000 | 473,140 | ||||||||||||||||||||||||||||
| Paraguay 0.1% | 1,374,323 | |||||||||||||||||||||||||||||||
| Republic of Paraguay | ||||||||||||||||||||||||||||||||
| Bond | 4.625 | 01-25-23 | 399,000 | 390,023 | ||||||||||||||||||||||||||||
| Bond (S) | 6.100 | 08-11-44 | 1,020,000 | 984,300 | ||||||||||||||||||||||||||||
| Peru 0.2% | 2,857,790 | |||||||||||||||||||||||||||||||
| Republic of Peru | ||||||||||||||||||||||||||||||||
| Bond | 4.125 | 08-25-27 | 1,192,000 | 1,178,292 | ||||||||||||||||||||||||||||
| Bond | 6.550 | 03-14-37 | 531,000 | 611,978 | ||||||||||||||||||||||||||||
| Bond | 8.750 | 11-21-33 | 768,000 | 1,067,520 | ||||||||||||||||||||||||||||
| Philippines 0.1% | 1,457,366 | |||||||||||||||||||||||||||||||
| Republic of Philippines Bond |
3.950 | 01-20-40 | 1,367,000 | 1,457,366 | ||||||||||||||||||||||||||||
| Poland 0.0% | 178,522 | |||||||||||||||||||||||||||||||
| Republic of Poland | ||||||||||||||||||||||||||||||||
| Bond | 3.000 | 03-17-23 | 161,000 | 158,649 | ||||||||||||||||||||||||||||
| Bond | 4.000 | 01-22-24 | 19,000 | 19,873 | ||||||||||||||||||||||||||||
| Romania 0.1% | 740,832 | |||||||||||||||||||||||||||||||
| Government of Romania Bond |
6.750 | 02-07-22 | 627,000 | 740,832 | ||||||||||||||||||||||||||||
| Russia 0.2% | 2,164,382 | |||||||||||||||||||||||||||||||
| Government of Russia | ||||||||||||||||||||||||||||||||
| Bond | 4.875 | 09-16-23 | 800,000 | 815,597 | ||||||||||||||||||||||||||||
| Rate (%) | Maturity date | Par value^ | Value | |||||||||||||||||||||||||||||
| Russia (continued) | ||||||||||||||||||||||||||||||||
| Bond | 5.625 | 04-04-42 | 1,200,000 | $1,152,522 | ||||||||||||||||||||||||||||
| Bond | 5.875 | 09-16-43 | 200,000 | 196,263 | ||||||||||||||||||||||||||||
| Serbia 0.1% | 758,929 | |||||||||||||||||||||||||||||||
| Republic of Serbia | ||||||||||||||||||||||||||||||||
| Bond | 4.875 | 02-25-20 | 355,000 | 361,822 | ||||||||||||||||||||||||||||
| Bond | 5.875 | 12-03-18 | 379,000 | 397,107 | ||||||||||||||||||||||||||||
| Sri Lanka 0.1% | 1,321,761 | |||||||||||||||||||||||||||||||
| Republic of Sri Lanka | ||||||||||||||||||||||||||||||||
| Bond (S) | 6.125 | 06-03-25 | 755,000 | 658,509 | ||||||||||||||||||||||||||||
| Bond (S) | 6.250 | 10-04-20 | 692,000 | 663,252 | ||||||||||||||||||||||||||||
| Trinidad And Tobago 0.0% | 209,448 | |||||||||||||||||||||||||||||||
| Republic of Trinidad & Tobago Bond (S) |
4.375 | 01-16-24 | 199,000 | 209,448 | ||||||||||||||||||||||||||||
| Turkey 0.4% | 5,276,301 | |||||||||||||||||||||||||||||||
| Republic of Turkey | ||||||||||||||||||||||||||||||||
| Bond | 3.250 | 03-23-23 | 208,000 | 192,698 | ||||||||||||||||||||||||||||
| Bond | 4.875 | 04-16-43 | 367,000 | 327,089 | ||||||||||||||||||||||||||||
| Bond | 5.125 | 03-25-22 | 226,000 | 234,535 | ||||||||||||||||||||||||||||
| Bond | 6.000 | 01-14-41 | 4,073,000 | 4,207,922 | ||||||||||||||||||||||||||||
| Bond | 6.875 | 03-17-36 | 277,000 | 314,057 | ||||||||||||||||||||||||||||
| Ukraine 0.2% | 2,648,932 | |||||||||||||||||||||||||||||||
| Republic of Ukraine | ||||||||||||||||||||||||||||||||
| Bond (S) | 7.750 | 09-01-25 | 610,000 | 553,880 | ||||||||||||||||||||||||||||
| Bond (S) | 7.750 | 09-01-26 | 100,000 | 90,520 | ||||||||||||||||||||||||||||
| Note (S) | 7.750 | 09-01-20 | 139,000 | 130,591 | ||||||||||||||||||||||||||||
| Note (S) | 7.750 | 09-01-23 | 2,038,000 | 1,873,941 | ||||||||||||||||||||||||||||
| Uruguay 0.3% | 3,822,064 | |||||||||||||||||||||||||||||||
| Republic of Uruguay | ||||||||||||||||||||||||||||||||
| Bond | 4.125 | 11-20-45 | 259,000 | 200,725 | ||||||||||||||||||||||||||||
| Bond | 4.375 | 10-27-27 | 647,000 | 630,825 | ||||||||||||||||||||||||||||
| Bond | 5.100 | 06-18-50 | 3,457,242 | 2,990,514 | ||||||||||||||||||||||||||||
| Venezuela 0.0% | 139,200 | |||||||||||||||||||||||||||||||
| Republic of Venezuela Bond |
13.625 | 08-15-18 | 320,000 | 139,200 | ||||||||||||||||||||||||||||
| Zambia 0.1% | 1,419,043 | |||||||||||||||||||||||||||||||
| Republic of Zambia | ||||||||||||||||||||||||||||||||
| Bond | 5.375 | 09-20-22 | 560,000 | 373,184 | ||||||||||||||||||||||||||||
| Bond (S) | 8.500 | 04-14-24 | 445,000 | 318,006 | ||||||||||||||||||||||||||||
| Bond (S) | 8.970 | 07-30-27 | 1,025,000 | 727,853 | ||||||||||||||||||||||||||||
| Rate (%) | Maturity date | Par value^ | Value | |||||||||||||||||||||||||||||
| Convertible bonds 0.7% | $9,028,512 | |||||||||||||||||||||||||||||||
| (Cost $15,712,846) | ||||||||||||||||||||||||||||||||
| Consumer discretionary 0.1% | 1,108,370 | |||||||||||||||||||||||||||||||
| Household durables 0.1% | ||||||||||||||||||||||||||||||||
| CalAtlantic Group, Inc. | 0.250 | 06-01-19 | 1,264,000 | 1,108,370 | ||||||||||||||||||||||||||||
| Energy 0.3% | 3,414,649 | |||||||||||||||||||||||||||||||
| Energy equipment and services 0.1% | ||||||||||||||||||||||||||||||||
| Hornbeck Offshore Services, Inc. | 1.500 | 09-01-19 | 3,236,000 | 1,700,923 | ||||||||||||||||||||||||||||
| Oil, gas and consumable fuels 0.2% | ||||||||||||||||||||||||||||||||
| Cobalt International Energy, Inc. | 2.625 | 12-01-19 | 500,000 | 252,813 | ||||||||||||||||||||||||||||
| Energy XXI, Ltd. | 3.000 | 12-15-18 | 3,589,000 | 71,780 | ||||||||||||||||||||||||||||
| Stone Energy Corp. | 1.750 | 03-01-17 | 2,367,000 | 1,389,133 | ||||||||||||||||||||||||||||
| Industrials 0.0% | 416,207 | |||||||||||||||||||||||||||||||
| Machinery 0.0% | ||||||||||||||||||||||||||||||||
| The Greenbrier Companies, Inc. | 3.500 | 04-01-18 | 399,000 | 416,207 | ||||||||||||||||||||||||||||
| Information technology 0.3% | 4,089,286 | |||||||||||||||||||||||||||||||
| Communications equipment 0.0% | ||||||||||||||||||||||||||||||||
| Brocade Communications Systems, Inc. | 1.375 | 01-01-20 | 500,000 | 463,750 | ||||||||||||||||||||||||||||
| Semiconductors and semiconductor equipment 0.0% | ||||||||||||||||||||||||||||||||
| Microchip Technology, Inc. (S) | 1.625 | 02-15-25 | 250,000 | 240,313 | ||||||||||||||||||||||||||||
| Software 0.1% | ||||||||||||||||||||||||||||||||
| NetSuite, Inc. | 0.250 | 06-01-18 | 900,000 | 843,188 | ||||||||||||||||||||||||||||
| Technology hardware, storage and peripherals 0.2% | ||||||||||||||||||||||||||||||||
| SanDisk Corp. | 0.500 | 10-15-20 | 2,474,000 | 2,542,035 | ||||||||||||||||||||||||||||
| Term loans (M) 22.3% | $300,033,838 | |||||||||||||||||||||||||||||||
| (Cost $323,914,562) | ||||||||||||||||||||||||||||||||
| Consumer discretionary 6.6% | 89,419,625 | |||||||||||||||||||||||||||||||
| Auto components 0.5% | ||||||||||||||||||||||||||||||||
| Allison Transmission, Inc. | 3.500 | 08-23-19 | 1,658,856 | 1,651,340 | ||||||||||||||||||||||||||||
| INA Beteiligungsgesellschaft mbH | 4.250 | 05-15-20 | 533,077 | 532,633 | ||||||||||||||||||||||||||||
| MPG Holdco I, Inc. | 3.750 | 10-20-21 | 1,135,461 | 1,090,043 | ||||||||||||||||||||||||||||
| The Goodyear Tire & Rubber Company | 3.750 | 04-30-19 | 1,007,000 | 1,006,686 | ||||||||||||||||||||||||||||
| TI Group Automotive Systems LLC | 4.500 | 06-30-22 | 1,871,310 | 1,812,832 | ||||||||||||||||||||||||||||
| Visteon Corp. | 3.500 | 04-09-21 | 750,746 | 744,177 | ||||||||||||||||||||||||||||
| Automobiles 0.2% | ||||||||||||||||||||||||||||||||
| FCA US LLC | 3.250 | 12-31-18 | 2,699,525 | 2,677,929 | ||||||||||||||||||||||||||||
| Diversified consumer services 0.1% | ||||||||||||||||||||||||||||||||
| The ServiceMaster Company LLC | 4.250 | 07-01-21 | 1,933,164 | 1,917,457 | ||||||||||||||||||||||||||||
| Hotels, restaurants and leisure 1.4% | ||||||||||||||||||||||||||||||||
| Boyd Gaming Corp. | 4.000 | 08-14-20 | 1,945,000 | 1,927,678 | ||||||||||||||||||||||||||||
| CityCenter Holdings LLC | 4.250 | 10-16-20 | 2,526,070 | 2,509,228 | ||||||||||||||||||||||||||||
| Rate (%) | Maturity date | Par value^ | Value | |||||||||||||||||||||||||||||
| Consumer discretionary (continued) | ||||||||||||||||||||||||||||||||
| Hotels, restaurants and leisure (continued) | ||||||||||||||||||||||||||||||||
| Four Seasons Holdings, Inc. | 3.500 | 06-27-20 | 1,171,013 | $1,151,984 | ||||||||||||||||||||||||||||
| Hilton Worldwide Finance LLC | 3.500 | 10-26-20 | 2,726,817 | 2,720,341 | ||||||||||||||||||||||||||||
| La Quinta Intermediate Holdings LLC | 3.750 | 04-14-21 | 3,729,702 | 3,605,379 | ||||||||||||||||||||||||||||
| Landry's, Inc. | 4.000 | 04-24-18 | 1,624,278 | 1,615,650 | ||||||||||||||||||||||||||||
| New Red Finance, Inc. | 3.750 | 12-10-21 | 2,243,569 | 2,227,677 | ||||||||||||||||||||||||||||
| Scientific Games International, Inc. | 6.000 | 10-18-20 | 2,849,840 | 2,546,027 | ||||||||||||||||||||||||||||
| Household durables 0.2% | ||||||||||||||||||||||||||||||||
| Libbey Glass, Inc. | 3.750 | 04-09-21 | 2,311,053 | 2,230,166 | ||||||||||||||||||||||||||||
| Leisure products 0.2% | ||||||||||||||||||||||||||||||||
| Performance Sports Group, Ltd. | 4.500 | 04-15-21 | 2,524,791 | 2,339,641 | ||||||||||||||||||||||||||||
| Media 2.9% | ||||||||||||||||||||||||||||||||
| AMC Entertainment, Inc. | 4.000 | 12-15-22 | 1,787,602 | 1,786,963 | ||||||||||||||||||||||||||||
| Atlantic Broadband Penn LLC | 3.250 | 11-30-19 | 2,264,163 | 2,249,446 | ||||||||||||||||||||||||||||
| CCO Safari III LLC | 3.500 | 01-24-23 | 1,500,000 | 1,498,125 | ||||||||||||||||||||||||||||
| Creative Artists Agency LLC | 5.500 | 12-17-21 | 1,996,836 | 1,983,108 | ||||||||||||||||||||||||||||
| Cumulus Media Holdings, Inc. | 4.250 | 12-23-20 | 2,905,725 | 2,118,758 | ||||||||||||||||||||||||||||
| Delta 2 Lux Sarl | 4.750 | 07-30-21 | 2,515,000 | 2,364,623 | ||||||||||||||||||||||||||||
| Hubbard Radio LLC | 4.250 | 05-27-22 | 3,444,500 | 3,181,857 | ||||||||||||||||||||||||||||
| MGOC, Inc. | 4.000 | 07-31-20 | 5,023,908 | 4,996,276 | ||||||||||||||||||||||||||||
| Mission Broadcasting, Inc. | 3.750 | 10-01-20 | 1,487,772 | 1,472,895 | ||||||||||||||||||||||||||||
| Neptune Finco Corp. | 5.000 | 10-09-22 | 3,565,000 | 3,554,105 | ||||||||||||||||||||||||||||
| Nexstar Broadcasting, Inc. | 3.750 | 10-01-20 | 1,686,698 | 1,669,831 | ||||||||||||||||||||||||||||
| Numericable US LLC | 4.500 | 05-21-20 | 3,502,620 | 3,361,720 | ||||||||||||||||||||||||||||
| Tribune Media Company | 3.750 | 12-27-20 | 3,029,737 | 2,970,406 | ||||||||||||||||||||||||||||
| Univision Communications, Inc. | 4.000 | 03-01-20 | 6,673,036 | 6,509,248 | ||||||||||||||||||||||||||||
| Multiline retail 0.2% | ||||||||||||||||||||||||||||||||
| Hudson's Bay Company | 4.750 | 09-30-22 | 1,110,599 | 1,107,476 | ||||||||||||||||||||||||||||
| JC Penney Corp., Inc. | 6.000 | 05-22-18 | 1,953,000 | 1,907,228 | ||||||||||||||||||||||||||||
| Specialty retail 0.9% | ||||||||||||||||||||||||||||||||
| Bass Pro Group LLC | 4.000 | 06-05-20 | 992,500 | 950,319 | ||||||||||||||||||||||||||||
| Burlington Coat Factory Warehouse Corp. | 4.250 | 08-13-21 | 2,064,588 | 2,045,879 | ||||||||||||||||||||||||||||
| J Crew Group, Inc. | 4.000 | 03-05-21 | 2,147,790 | 1,444,004 | ||||||||||||||||||||||||||||
| Michaels Stores, Inc. | 4.000 | 01-28-20 | 1,542,674 | 1,529,899 | ||||||||||||||||||||||||||||
| Party City Holdings, Inc. | 4.250 | 08-19-22 | 1,401,488 | 1,362,947 | ||||||||||||||||||||||||||||
| Petco Animal Supplies, Inc. (T) | TBD | 01-26-23 | 3,082,000 | 3,016,936 | ||||||||||||||||||||||||||||
| PetSmart, Inc. | 4.250 | 03-11-22 | 2,100,130 | 2,030,708 | ||||||||||||||||||||||||||||
| Consumer staples 2.3% | 30,828,382 | |||||||||||||||||||||||||||||||
| Food and staples retailing 0.6% | ||||||||||||||||||||||||||||||||
| Albertson's Holdings LLC | 5.500 | 08-25-21 | 5,370,775 | 5,249,095 | ||||||||||||||||||||||||||||
| Aramark Services, Inc. | 3.250 | 02-24-21 | 1,156,973 | 1,145,043 | ||||||||||||||||||||||||||||
| Hearthside Group Holdings LLC | 4.500 | 06-02-21 | 2,268,455 | 2,177,717 | ||||||||||||||||||||||||||||
| Rate (%) | Maturity date | Par value^ | Value | |||||||||||||||||||||||||||||
| Consumer staples (continued) | ||||||||||||||||||||||||||||||||
| Food products 0.8% | ||||||||||||||||||||||||||||||||
| Del Monte Foods, Inc. | 4.252 | 02-18-21 | 1,695,926 | $1,619,610 | ||||||||||||||||||||||||||||
| Diamond Foods, Inc. | 4.250 | 08-20-18 | 2,295,848 | 2,288,673 | ||||||||||||||||||||||||||||
| Dole Food Company, Inc. | 4.500 | 11-01-18 | 1,231,058 | 1,203,359 | ||||||||||||||||||||||||||||
| Hostess Brands LLC | 4.500 | 08-03-22 | 3,321,675 | 3,298,838 | ||||||||||||||||||||||||||||
| Hostess Brands LLC | 8.500 | 08-03-23 | 360,000 | 353,250 | ||||||||||||||||||||||||||||
| Shearer's Foods LLC | 4.938 | 06-30-21 | 1,688,625 | 1,644,299 | ||||||||||||||||||||||||||||
| Household products 0.7% | ||||||||||||||||||||||||||||||||
| Reynolds Group Holdings, Inc. | 4.500 | 12-01-18 | 3,869,225 | 3,848,803 | ||||||||||||||||||||||||||||
| Spectrum Brands, Inc. | 3.500 | 06-23-22 | 918,310 | 915,522 | ||||||||||||||||||||||||||||
| The Sun Products Corp. | 5.500 | 03-23-20 | 4,183,613 | 3,974,433 | ||||||||||||||||||||||||||||
| Personal products 0.2% | ||||||||||||||||||||||||||||||||
| Revlon Consumer Products Corp. | 4.000 | 10-08-19 | 3,124,384 | 3,109,740 | ||||||||||||||||||||||||||||
| Energy 0.4% | 5,515,453 | |||||||||||||||||||||||||||||||
| Energy equipment and services 0.0% | ||||||||||||||||||||||||||||||||
| Paragon Offshore Finance Company | 3.750 | 07-18-21 | 1,481,250 | 318,469 | ||||||||||||||||||||||||||||
| Oil, gas and consumable fuels 0.4% | ||||||||||||||||||||||||||||||||
| Arch Coal, Inc. | 6.250 | 05-16-18 | 2,532,642 | 728,135 | ||||||||||||||||||||||||||||
| EP Energy LLC | 3.500 | 05-24-18 | 2,207,491 | 1,401,757 | ||||||||||||||||||||||||||||
| FTS International, Inc. | 5.750 | 04-16-21 | 1,271,000 | 276,443 | ||||||||||||||||||||||||||||
| Granite Acquisition, Inc. | 5.000 | 12-19-21 | 2,645,590 | 2,397,566 | ||||||||||||||||||||||||||||
| Granite Acquisition, Inc. | 5.000 | 12-19-21 | 117,582 | 106,558 | ||||||||||||||||||||||||||||
| Southcross Holdings LP | 6.000 | 08-04-21 | 1,637,283 | 286,525 | ||||||||||||||||||||||||||||
| Financials 0.6% | 7,493,861 | |||||||||||||||||||||||||||||||
| Capital markets 0.2% | ||||||||||||||||||||||||||||||||
| Onex Wizard Acquisition Company II SCA | 4.250 | 03-13-22 | 2,984,546 | 2,946,308 | ||||||||||||||||||||||||||||
| Diversified financial services 0.1% | ||||||||||||||||||||||||||||||||
| AlixPartners LLP | 4.500 | 07-28-22 | 1,475,303 | 1,461,165 | ||||||||||||||||||||||||||||
| Real estate management and development 0.3% | ||||||||||||||||||||||||||||||||
| Realogy Group LLC | 3.750 | 03-05-20 | 3,112,323 | 3,086,388 | ||||||||||||||||||||||||||||
| Health care 2.7% | 35,793,642 | |||||||||||||||||||||||||||||||
| Health care equipment and supplies 0.8% | ||||||||||||||||||||||||||||||||
| Air Medical Group Holdings, Inc. | 4.250 | 04-28-22 | 3,363,100 | 3,189,339 | ||||||||||||||||||||||||||||
| Alere, Inc. | 4.250 | 06-18-22 | 1,606,951 | 1,588,299 | ||||||||||||||||||||||||||||
| ConvaTec, Inc. | 4.250 | 06-15-20 | 1,263,650 | 1,245,222 | ||||||||||||||||||||||||||||
| Kinetic Concepts, Inc. | 4.500 | 05-04-18 | 3,697,499 | 3,586,574 | ||||||||||||||||||||||||||||
| Sterigenics-Nordion Holdings LLC | 4.250 | 05-15-22 | 949,620 | 918,757 | ||||||||||||||||||||||||||||
| Health care providers and services 1.2% | ||||||||||||||||||||||||||||||||
| Community Health Systems, Inc. | 3.657 | 12-31-18 | 490,295 | 482,175 | ||||||||||||||||||||||||||||
| Community Health Systems, Inc. | 3.750 | 12-31-19 | 1,229,562 | 1,180,379 | ||||||||||||||||||||||||||||
| Community Health Systems, Inc. | 4.000 | 01-27-21 | 2,262,361 | 2,173,124 | ||||||||||||||||||||||||||||
| Rate (%) | Maturity date | Par value^ | Value | |||||||||||||||||||||||||||||
| Health care (continued) | ||||||||||||||||||||||||||||||||
| Health care providers and services (continued) | ||||||||||||||||||||||||||||||||
| DaVita HealthCare Partners, Inc. | 3.500 | 06-24-21 | 2,349,225 | $2,340,415 | ||||||||||||||||||||||||||||
| Drumm Investors LLC | 6.750 | 05-04-18 | 1,701,093 | 1,686,208 | ||||||||||||||||||||||||||||
| Envision Healthcare Corp. | 4.500 | 10-28-22 | 1,015,000 | 1,008,656 | ||||||||||||||||||||||||||||
| IASIS Healthcare LLC | 4.500 | 05-03-18 | 3,495,886 | 3,446,360 | ||||||||||||||||||||||||||||
| Team Health Holdings, Inc. | 4.500 | 11-23-22 | 1,520,000 | 1,511,450 | ||||||||||||||||||||||||||||
| US Renal Care, Inc. | 5.250 | 12-31-22 | 2,530,000 | 2,516,295 | ||||||||||||||||||||||||||||
| Pharmaceuticals 0.7% | ||||||||||||||||||||||||||||||||
| Endo Luxembourg Finance I Company Sarl | 3.750 | 09-26-22 | 1,511,522 | 1,491,009 | ||||||||||||||||||||||||||||
| Pharmaceutical Product Development LLC | 4.250 | 08-18-22 | 3,342,601 | 3,275,749 | ||||||||||||||||||||||||||||
| Surgical Care Affiliates LLC | 4.250 | 03-17-22 | 1,727,943 | 1,717,684 | ||||||||||||||||||||||||||||
| Valeant Pharmaceuticals International, Inc. | 4.000 | 04-01-22 | 2,540,340 | 2,435,947 | ||||||||||||||||||||||||||||
| Industrials 2.0% | 26,695,295 | |||||||||||||||||||||||||||||||
| Aerospace and defense 0.5% | ||||||||||||||||||||||||||||||||
| Accudyne Industries Borrower SCA | 4.000 | 12-13-19 | 3,620,041 | 2,977,484 | ||||||||||||||||||||||||||||
| B/E Aerospace, Inc. | 4.000 | 12-16-21 | 1,945,411 | 1,942,979 | ||||||||||||||||||||||||||||
| Sequa Corp. | 5.250 | 06-19-17 | 2,887,537 | 1,902,165 | ||||||||||||||||||||||||||||
| Air freight and logistics 0.1% | ||||||||||||||||||||||||||||||||
| XPO Logistics, Inc. | 5.500 | 11-01-21 | 1,440,000 | 1,422,600 | ||||||||||||||||||||||||||||
| Commercial services and supplies 0.1% | ||||||||||||||||||||||||||||||||
| Waste Industries USA, Inc. | 4.250 | 02-27-20 | 1,149,569 | 1,143,103 | ||||||||||||||||||||||||||||
| Construction and engineering 0.2% | ||||||||||||||||||||||||||||||||
| RBS Global, Inc. | 4.000 | 08-21-20 | 2,929,744 | 2,794,243 | ||||||||||||||||||||||||||||
| Machinery 0.9% | ||||||||||||||||||||||||||||||||
| Doosan Infracore International, Inc. | 4.500 | 05-28-21 | 2,379,162 | 2,275,073 | ||||||||||||||||||||||||||||
| Filtration Group, Inc. | 4.250 | 11-21-20 | 1,641,724 | 1,587,683 | ||||||||||||||||||||||||||||
| Gates Global LLC | 4.250 | 07-05-21 | 4,125,449 | 3,709,468 | ||||||||||||||||||||||||||||
| Husky Injection Molding Systems, Ltd. | 4.250 | 06-30-21 | 2,515,669 | 2,401,679 | ||||||||||||||||||||||||||||
| Husky Injection Molding Systems, Ltd. | 7.250 | 06-30-22 | 758,490 | 697,810 | ||||||||||||||||||||||||||||
| Milacron LLC | 4.500 | 09-28-20 | 1,795,312 | 1,754,918 | ||||||||||||||||||||||||||||
| Trading companies and distributors 0.2% | ||||||||||||||||||||||||||||||||
| Beacon Roofing Supply, Inc. | 4.000 | 10-01-22 | 1,653,855 | 1,645,070 | ||||||||||||||||||||||||||||
| HD Supply, Inc. | 3.750 | 08-13-21 | 448,875 | 441,020 | ||||||||||||||||||||||||||||
| Information technology 2.2% | 29,963,522 | |||||||||||||||||||||||||||||||
| Communications equipment 0.6% | ||||||||||||||||||||||||||||||||
| Avaya, Inc. | 5.121 | 10-26-17 | 1,340,603 | 1,048,687 | ||||||||||||||||||||||||||||
| Avaya, Inc. | 6.500 | 03-30-18 | 1,382,974 | 1,041,840 | ||||||||||||||||||||||||||||
| Ciena Corp. | 3.750 | 07-15-19 | 2,505,840 | 2,477,649 | ||||||||||||||||||||||||||||
| Integra Telecom Holdings, Inc. | 5.250 | 08-14-20 | 2,496,138 | 2,382,251 | ||||||||||||||||||||||||||||
| Riverbed Technology, Inc. | 6.000 | 04-24-22 | 1,084,580 | 1,074,122 | ||||||||||||||||||||||||||||
| Rate (%) | Maturity date | Par value^ | Value | |||||||||||||||||||||||||||||
| Information technology (continued) | ||||||||||||||||||||||||||||||||
| Electronic equipment, instruments and components 0.2% | ||||||||||||||||||||||||||||||||
| CPI International, Inc. | 4.250 | 11-17-17 | 2,171,182 | $2,127,758 | ||||||||||||||||||||||||||||
| Dell International LLC (T) | TBD | 04-29-20 | 1,035,000 | 1,031,478 | ||||||||||||||||||||||||||||
| IT services 0.4% | ||||||||||||||||||||||||||||||||
| First Data Corp. | 3.927 | 03-24-18 | 3,896,632 | 3,840,965 | ||||||||||||||||||||||||||||
| Science Applications International Corp. | 3.750 | 05-04-22 | 1,223,709 | 1,222,689 | ||||||||||||||||||||||||||||
| Semiconductors and semiconductor equipment 0.5% | ||||||||||||||||||||||||||||||||
| Avago Technologies Cayman, Ltd. (T) | TBD | 02-01-23 | 3,391,000 | 3,332,600 | ||||||||||||||||||||||||||||
| Microsemi Corp. | 5.250 | 01-15-23 | 1,517,000 | 1,503,094 | ||||||||||||||||||||||||||||
| NXP Funding LLC | 3.750 | 12-07-20 | 1,500,000 | 1,495,715 | ||||||||||||||||||||||||||||
| Software 0.5% | ||||||||||||||||||||||||||||||||
| Infor US, Inc. | 3.750 | 06-03-20 | 3,385,238 | 3,182,123 | ||||||||||||||||||||||||||||
| MA FinanceCo LLC | 5.250 | 11-19-21 | 2,720,793 | 2,682,247 | ||||||||||||||||||||||||||||
| SS&C European Holdings SARL | 4.018 | 07-08-22 | 192,159 | 190,992 | ||||||||||||||||||||||||||||
| SS&C Technologies, Inc. | 4.007 | 07-08-22 | 1,337,431 | 1,329,312 | ||||||||||||||||||||||||||||
| Materials 2.9% | 39,487,826 | |||||||||||||||||||||||||||||||
| Chemicals 1.5% | ||||||||||||||||||||||||||||||||
| Axalta Coating Systems US Holdings, Inc. | 3.750 | 02-01-20 | 3,449,748 | 3,413,402 | ||||||||||||||||||||||||||||
| Ineos US Finance LLC | 3.750 | 12-15-20 | 2,138,687 | 2,029,749 | ||||||||||||||||||||||||||||
| Ineos US Finance LLC | 4.250 | 03-31-22 | 1,205,014 | 1,150,412 | ||||||||||||||||||||||||||||
| MacDermid, Inc. | 5.500 | 06-07-20 | 4,365,421 | 4,052,606 | ||||||||||||||||||||||||||||
| OXEA Sarl | 4.250 | 01-15-20 | 3,195,631 | 3,091,773 | ||||||||||||||||||||||||||||
| Styrolution Group GmbH | 6.500 | 11-07-19 | 2,524,500 | 2,505,566 | ||||||||||||||||||||||||||||
| The Chemours Company | 3.750 | 05-12-22 | 2,149,200 | 1,903,832 | ||||||||||||||||||||||||||||
| Trinseo Materials Operating SCA | 4.250 | 11-05-21 | 1,872,590 | 1,818,753 | ||||||||||||||||||||||||||||
| Univar USA, Inc. | 4.250 | 07-01-22 | 733,163 | 709,466 | ||||||||||||||||||||||||||||
| Construction materials 0.4% | ||||||||||||||||||||||||||||||||
| Headwaters, Inc. | 4.500 | 03-24-22 | 1,579,065 | 1,575,117 | ||||||||||||||||||||||||||||
| Summit Materials LLC | 4.250 | 07-17-22 | 3,608,567 | 3,545,417 | ||||||||||||||||||||||||||||
| Containers and packaging 0.7% | ||||||||||||||||||||||||||||||||
| Berry Plastics Corp. | 4.000 | 10-01-22 | 1,868,512 | 1,858,469 | ||||||||||||||||||||||||||||
| BWAY Holding Company | 5.500 | 08-14-20 | 2,176,850 | 2,035,355 | ||||||||||||||||||||||||||||
| Hilex Poly Company LLC | 6.000 | 12-05-21 | 2,166,120 | 2,158,900 | ||||||||||||||||||||||||||||
| Kloeckner Pentaplast of America, Inc. | 5.000 | 04-28-20 | 1,049,808 | 1,045,434 | ||||||||||||||||||||||||||||
| KP Germany Erste GmbH | 5.000 | 04-28-20 | 449,523 | 447,650 | ||||||||||||||||||||||||||||
| Novelis, Inc. | 4.000 | 06-02-22 | 1,898,460 | 1,753,702 | ||||||||||||||||||||||||||||
| Metals and mining 0.3% | ||||||||||||||||||||||||||||||||
| FMG Resources August 2006 Pty, Ltd. | 4.250 | 06-30-19 | 2,478,315 | 1,719,331 | ||||||||||||||||||||||||||||
| Signode Industrial Group US, Inc. | 3.750 | 05-01-21 | 2,787,893 | 2,672,892 | ||||||||||||||||||||||||||||
| Rate (%) | Maturity date | Par value^ | Value | |||||||||||||||||||||||||||||
| Telecommunication services 1.7% | $22,499,635 | |||||||||||||||||||||||||||||||
| Diversified telecommunication services 1.4% | ||||||||||||||||||||||||||||||||
| Consolidated Communications, Inc. | 4.250 | 12-23-20 | 1,688,641 | 1,673,866 | ||||||||||||||||||||||||||||
| Intelsat Jackson Holdings SA | 3.750 | 06-30-19 | 4,185,116 | 3,999,402 | ||||||||||||||||||||||||||||
| Level 3 Financing, Inc. | 3.500 | 05-31-22 | 2,675,000 | 2,633,203 | ||||||||||||||||||||||||||||
| Level 3 Financing, Inc. | 4.000 | 01-15-20 | 3,414,000 | 3,405,465 | ||||||||||||||||||||||||||||
| Syniverse Holdings, Inc. | 4.000 | 04-23-19 | 2,991,509 | 2,056,663 | ||||||||||||||||||||||||||||
| Virgin Media Investment Holdings, Ltd. | 3.500 | 06-30-23 | 2,643,768 | 2,585,753 | ||||||||||||||||||||||||||||
| XO Communications LLC | 4.250 | 03-17-21 | 2,302,161 | 2,256,838 | ||||||||||||||||||||||||||||
| Wireless telecommunication services 0.3% | ||||||||||||||||||||||||||||||||
| LTS Buyer LLC | 4.000 | 04-13-20 | 3,979,984 | 3,888,445 | ||||||||||||||||||||||||||||
| Utilities 0.9% | 12,336,597 | |||||||||||||||||||||||||||||||
| Electric utilities 0.4% | ||||||||||||||||||||||||||||||||
| La Frontera Generation LLC | 4.500 | 09-30-20 | 2,971,942 | 2,866,685 | ||||||||||||||||||||||||||||
| Texas Competitive Electric Holdings Company LLC (H) | 4.646 | 10-10-17 | 10,931,597 | 3,265,814 | ||||||||||||||||||||||||||||
| Independent power and renewable electricity producers 0.5% | ||||||||||||||||||||||||||||||||
| Calpine Corp. | 3.500 | 05-27-22 | 3,473,645 | 3,285,488 | ||||||||||||||||||||||||||||
| Dynegy, Inc. | 4.000 | 04-23-20 | 3,035,277 | 2,918,610 | ||||||||||||||||||||||||||||
| Collateralized mortgage obligations 16.5% | $222,161,818 | |||||||||||||||||||||||||||||||
| (Cost $218,391,653) | ||||||||||||||||||||||||||||||||
| Commercial and residential 16.4% | 220,998,719 | |||||||||||||||||||||||||||||||
| 1211 Avenue of the Americas Trust Series 2015-1211, Class A1A2 (S) |
3.901 | 08-10-35 | 5,000,000 | 5,240,432 | ||||||||||||||||||||||||||||
| American Home Mortgage Assets Trust Series 2007-1, Class A1 (P) |
0.985 | 02-25-47 | 2,258,030 | 1,280,440 | ||||||||||||||||||||||||||||
| BAMLL-DB Trust Series 2012-OSI, Class A1 (S) |
2.343 | 04-13-29 | 1,027,623 | 1,030,012 | ||||||||||||||||||||||||||||
| BCAP LLC Trust | ||||||||||||||||||||||||||||||||
| Series 2011-RR11, Class 21A5 (P) (S) | 2.882 | 06-26-34 | 1,298,632 | 1,303,761 | ||||||||||||||||||||||||||||
| Series 2012-RR9, Class 2A5 (P) (S) | 0.592 | 08-26-46 | 1,071,286 | 1,048,667 | ||||||||||||||||||||||||||||
| BCRR Trust Series 2009-1, Class 2A1 (P) (S) |
5.858 | 07-17-40 | 5,795,163 | 5,837,637 | ||||||||||||||||||||||||||||
| BHMS Mortgage Trust Series 2014-ATLS, Class AFL (P) (S) |
1.930 | 07-05-33 | 9,925,000 | 9,838,402 | ||||||||||||||||||||||||||||
| BLCP Hotel Trust Series 2014-CLRN, Class A (P) (S) |
1.376 | 08-15-29 | 4,128,964 | 4,025,458 | ||||||||||||||||||||||||||||
| Carefree Portfolio Trust Series 2014-CARE, Class A (P) (S) |
1.746 | 11-15-19 | 6,675,000 | 6,665,513 | ||||||||||||||||||||||||||||
| CG-CCRE Commercial Mortgage Trust Series 2014-FL2, Class A (P) (S) |
2.280 | 11-15-31 | 4,950,017 | 4,961,010 | ||||||||||||||||||||||||||||
| Citigroup Commercial Mortgage Trust Series 2014-388G, Class B (P) (S) |
1.476 | 06-15-33 | 7,575,000 | 7,368,307 | ||||||||||||||||||||||||||||
| Citigroup Mortgage Loan Trust | ||||||||||||||||||||||||||||||||
| Series 2010-8, Class 5A6 (S) | 4.000 | 11-25-36 | 928,938 | 936,056 | ||||||||||||||||||||||||||||
| Rate (%) | Maturity date | Par value^ | Value | |||||||||||||||||||||||||||||
| Commercial and residential (continued) | ||||||||||||||||||||||||||||||||
| Series 2010-8, Class 6A6 (S) | 4.500 | 12-25-36 | 1,055,376 | $1,068,239 | ||||||||||||||||||||||||||||
| Series 2012-1, Class 1A1 (P) (S) | 0.792 | 06-25-35 | 1,263,677 | 1,250,331 | ||||||||||||||||||||||||||||
| Series 2013-2, Class 3A1 (P) (S) | 0.602 | 04-25-37 | 7,329,446 | 6,873,139 | ||||||||||||||||||||||||||||
| Series 2013-2, Class 5A1 (P) (S) | 0.562 | 07-25-36 | 3,986,697 | 3,744,856 | ||||||||||||||||||||||||||||
| Commercial Mortgage Trust (Bank of America/Barclays Capital/Deutsche Bank) | ||||||||||||||||||||||||||||||||
| Series 2006-C8, Class AJ | 5.377 | 12-10-46 | 1,075,000 | 1,064,940 | ||||||||||||||||||||||||||||
| Series 2006-C8, Class A4 | 5.306 | 12-10-46 | 2,953,486 | 3,004,489 | ||||||||||||||||||||||||||||
| Commercial Mortgage Trust (Citigroup/Deutsche Bank) Series 2013-THL, Class A2 (P) (S) |
1.474 | 06-08-30 | 4,675,000 | 4,666,623 | ||||||||||||||||||||||||||||
| Commercial Mortgage Trust (Deutsche Bank) | ||||||||||||||||||||||||||||||||
| Series 2007-C9, Class A4 (P) | 5.989 | 12-10-49 | 2,264,088 | 2,358,695 | ||||||||||||||||||||||||||||
| Series 2014-KYO, Class B (P) (S) | 1.724 | 06-11-27 | 6,025,000 | 5,892,639 | ||||||||||||||||||||||||||||
| Countrywide Home Loan Mortgage Pass Through Trust | ||||||||||||||||||||||||||||||||
| Series 2006-3, Class 3A1 (P) | 0.677 | 02-25-36 | 1,516,308 | 1,190,301 | ||||||||||||||||||||||||||||
| Series 2004-25, Class 1A1 (P) | 1.087 | 02-25-35 | 2,928,142 | 2,686,437 | ||||||||||||||||||||||||||||
| Series 2004-25, Class 2A1 (P) | 1.107 | 02-25-35 | 4,163,378 | 3,623,799 | ||||||||||||||||||||||||||||
| Credit Suisse Mortgage Capital Certificates | ||||||||||||||||||||||||||||||||
| Series 2010-16, Class A3 (P) (S) | 4.250 | 06-25-50 | 891,291 | 892,470 | ||||||||||||||||||||||||||||
| Series 2010-RR5, Class 1A (P) (S) | 5.467 | 12-16-43 | 2,202,193 | 2,209,720 | ||||||||||||||||||||||||||||
| First Horizon Alternative Mortgage Securities Trust Series 2005-AA12, Class 1A1 (P) |
2.424 | 02-25-36 | 1,792,196 | 1,429,909 | ||||||||||||||||||||||||||||
| FREMF Mortgage Trust | ||||||||||||||||||||||||||||||||
| Series 2011-K701, Class C (P) (S) | 4.436 | 07-25-48 | 5,025,000 | 5,123,194 | ||||||||||||||||||||||||||||
| Series 2012-KF01, Class B (P) (S) | 3.022 | 10-25-44 | 3,300,000 | 3,316,832 | ||||||||||||||||||||||||||||
| Series 2012-KF01, Class C (P) (S) | 4.672 | 10-25-44 | 8,500,000 | 8,749,517 | ||||||||||||||||||||||||||||
| GAHR Commercial Mortgage Trust Series 2015-NRF, Class AFL1 (P) (S) |
1.726 | 12-15-16 | 1,640,934 | 1,625,358 | ||||||||||||||||||||||||||||
| HarborView Mortgage Loan Trust Series 2007-3, Class 2A1A (P) |
0.626 | 05-19-47 | 3,190,720 | 2,735,159 | ||||||||||||||||||||||||||||
| Hilton USA Trust | ||||||||||||||||||||||||||||||||
| Series 2013-HLF, Class BFL (P) (S) | 1.930 | 11-05-30 | 4,261,558 | 4,227,280 | ||||||||||||||||||||||||||||
| Series 2013-HLT, Class BFX (S) | 3.367 | 11-05-30 | 4,825,000 | 4,838,789 | ||||||||||||||||||||||||||||
| Hudsons Bay Simon JV Trust Series 2015-HBFL, Class AFL (P) (S) |
2.010 | 08-05-34 | 3,500,000 | 3,480,750 | ||||||||||||||||||||||||||||
| IndyMac INDA Mortgage Loan Trust Series 2005-AR2, Class 1A1 (P) |
2.846 | 01-25-36 | 1,021,864 | 941,059 | ||||||||||||||||||||||||||||
| Jefferies Resecuritization Trust Series 2009-R9, Class 1A1 (P) (S) |
2.407 | 08-26-46 | 818,374 | 824,287 | ||||||||||||||||||||||||||||
| JPMorgan Chase Commercial Mortgage Securities Trust | ||||||||||||||||||||||||||||||||
| Series 2006-CB14, Class AJ (P) | 5.748 | 12-12-44 | 4,050,000 | 4,023,655 | ||||||||||||||||||||||||||||
| Series 2014-INN, Class A (P) (S) | 1.346 | 06-15-29 | 4,000,000 | 3,979,750 | ||||||||||||||||||||||||||||
| Series 2015-CSMO, Class A (P) (S) | 1.676 | 01-15-32 | 6,525,000 | 6,447,613 | ||||||||||||||||||||||||||||
| LB-UBS Commercial Mortgage Trust Series 2006-C6, Class A4 |
5.372 | 09-15-39 | 8,299,600 | 8,394,320 | ||||||||||||||||||||||||||||
| Rate (%) | Maturity date | Par value^ | Value | |||||||||||||||||||||||||||||
| Commercial and residential (continued) | ||||||||||||||||||||||||||||||||
| LSTAR Securities Investment Trust | ||||||||||||||||||||||||||||||||
| Series 2015-10, Class A1 (P) (S) | 2.244 | 11-02-20 | 3,679,884 | $3,614,338 | ||||||||||||||||||||||||||||
| Series 2015-9, Class A1 (P) (S) | 2.428 | 10-01-20 | 4,861,479 | 4,747,167 | ||||||||||||||||||||||||||||
| Merrill Lynch/Countrywide Commercial Mortgage Trust Series 2007-8, Class AMA (P) |
6.072 | 08-12-49 | 3,800,000 | 3,891,784 | ||||||||||||||||||||||||||||
| Nomura Resecuritization Trust Series 2011-1RA, Class 1A5 (P) (S) |
2.650 | 03-26-36 | 1,144,254 | 1,138,509 | ||||||||||||||||||||||||||||
| OBP Depositor LLC Trust Series 2010-OBP, Class A (S) |
4.646 | 07-15-45 | 2,500,000 | 2,721,181 | ||||||||||||||||||||||||||||
| RBS Commercial Funding, Inc. Trust Series 2013-GSP, Class A (P) (S) |
3.961 | 01-13-32 | 4,250,000 | 4,479,691 | ||||||||||||||||||||||||||||
| RBSSP Resecuritization Trust | ||||||||||||||||||||||||||||||||
| Series 2012-6, Class 10A1 (P) (S) | 0.572 | 08-26-36 | 5,257,535 | 5,020,811 | ||||||||||||||||||||||||||||
| Series 2012-6, Class 4A1 (P) (S) | 0.752 | 01-26-36 | 4,192,318 | 3,933,135 | ||||||||||||||||||||||||||||
| Series 2012-6, Class 6A1 (P) (S) | 0.762 | 11-26-35 | 6,314,123 | 5,734,075 | ||||||||||||||||||||||||||||
| Series 2012-6, Class 8A1 (P) (S) | 0.922 | 04-26-35 | 3,146,050 | 2,990,540 | ||||||||||||||||||||||||||||
| Series 2013-1, Class 4A1 (P) (S) | 0.592 | 01-26-37 | 6,437,496 | 5,918,186 | ||||||||||||||||||||||||||||
| Structured Asset Mortgage Investments II Trust Series 2005-AR6, Class 2A1 (P) |
0.737 | 09-25-45 | 2,695,981 | 2,243,899 | ||||||||||||||||||||||||||||
| Towd Point Mortgage Trust | ||||||||||||||||||||||||||||||||
| Series 2015-3, Class A1B (P) (S) | 3.000 | 03-25-54 | 3,300,238 | 3,315,255 | ||||||||||||||||||||||||||||
| Series 2015-5, Class A1B (P) (S) | 2.750 | 05-25-55 | 2,965,478 | 2,955,378 | ||||||||||||||||||||||||||||
| WaMu Mortgage Pass-Through Certificates | ||||||||||||||||||||||||||||||||
| Series 2005-11, Class A1 (P) | 0.747 | 08-25-45 | 3,324,118 | 3,083,425 | ||||||||||||||||||||||||||||
| Series 2005-AR1, Class A1A (P) | 1.067 | 01-25-45 | 1,295,886 | 1,216,637 | ||||||||||||||||||||||||||||
| Series 2005-AR19, Class A1A1 (P) | 0.697 | 12-25-45 | 3,518,282 | 3,373,586 | ||||||||||||||||||||||||||||
| Series 2005-AR6, Class 2A1A (P) | 0.657 | 04-25-45 | 3,119,837 | 2,896,119 | ||||||||||||||||||||||||||||
| Series 2005-AR8, Class 1A (P) | 0.697 | 07-25-45 | 2,633,338 | 2,476,003 | ||||||||||||||||||||||||||||
| Wells Fargo Mortgage Backed Securities Trust Series 2005-AR4, Class 2A2 (P) |
2.723 | 04-25-35 | 1,746,060 | 1,750,004 | ||||||||||||||||||||||||||||
| WFCG Commercial Mortgage Trust Series 2015-BXRP, Class A (P) (S) |
1.548 | 11-15-29 | 3,338,161 | 3,299,151 | ||||||||||||||||||||||||||||
| U.S. Government Agency 0.1% | 1,163,099 | |||||||||||||||||||||||||||||||
| Federal Home Loan Mortgage Corp. Series 2015-SC02, Class 1A |
3.000 | 09-25-45 | 440,873 | 445,475 | ||||||||||||||||||||||||||||
| Government National Mortgage Association Series 2014-80, Class XA |
3.000 | 06-20-40 | 696,403 | 717,624 | ||||||||||||||||||||||||||||
| Asset backed securities 4.2% | $56,706,134 | |||||||||||||||||||||||||||||||
| (Cost $57,057,660) | ||||||||||||||||||||||||||||||||
| AMPLIT Trust Series 2015-A, Class A (S) |
5.000 | 09-15-21 | 1,366,210 | 1,359,379 | ||||||||||||||||||||||||||||
| Brazil Loan Trust 1 Senior Secured Pass-Through Notes (S) |
5.477 | 07-24-23 | 977,742 | 838,414 | ||||||||||||||||||||||||||||
| Carrington Mortgage Loan Trust Series 2006-FRE1, Class A2 (P) |
0.537 | 07-25-36 | 1,297,662 | 1,280,041 | ||||||||||||||||||||||||||||
| Rate (%) | Maturity date | Par value^ | Value | |||||||||||||||||||||||||||||
| Colony American Homes Series 2014-2A, Class A (P) (S) |
1.377 | 07-17-31 | 3,565,222 | $3,484,320 | ||||||||||||||||||||||||||||
| Ellington Loan Acquisition Trust Series 2007-1, Class A2B (P) (S) |
1.327 | 05-28-37 | 988,383 | 977,388 | ||||||||||||||||||||||||||||
| Financial Asset Securities Corp. AAA Trust Series 2005-2, Class A3 (P) (S) |
0.726 | 11-26-35 | 3,233,951 | 3,118,127 | ||||||||||||||||||||||||||||
| GSAMP Trust Series 2006-NC1, Class A2 (P) |
0.607 | 02-25-36 | 1,520,269 | 1,480,726 | ||||||||||||||||||||||||||||
| Invitation Homes Trust | ||||||||||||||||||||||||||||||||
| Series 2013-SFR1, Class A (P) (S) | 1.576 | 12-17-30 | 8,002,724 | 7,888,749 | ||||||||||||||||||||||||||||
| Series 2014-SFR1, Class A (P) (S) | 1.426 | 06-17-31 | 4,600,000 | 4,503,104 | ||||||||||||||||||||||||||||
| Long Beach Mortgage Loan Trust Series 2005-WL2, Class M1 (P) |
1.132 | 08-25-35 | 1,214,705 | 1,203,589 | ||||||||||||||||||||||||||||
| Oak Hill Advisors Residential Loan Trust | ||||||||||||||||||||||||||||||||
| Series 2014-NPL2, Class A1 (S) | 3.352 | 04-25-54 | 1,293,013 | 1,282,603 | ||||||||||||||||||||||||||||
| Series 2015-NPL1, Class A1 (S) | 3.475 | 01-25-55 | 2,209,369 | 2,203,137 | ||||||||||||||||||||||||||||
| Series 2015-NPL2, Class A1 (S) | 3.721 | 07-25-55 | 3,326,831 | 3,307,839 | ||||||||||||||||||||||||||||
| PennyMac LLC Series 2015-NPL1, Class A1 (S) |
4.000 | 03-25-55 | 3,093,476 | 3,080,909 | ||||||||||||||||||||||||||||
| RAAC Series Trust Series 2006-SP2, Class A3 (P) |
0.697 | 02-25-36 | 1,198,753 | 1,179,904 | ||||||||||||||||||||||||||||
| SLC Private Student Loan Trust Series 2010-B, Class A1 (P) (S) |
4.000 | 07-15-42 | 775,109 | 797,537 | ||||||||||||||||||||||||||||
| SLM Private Education Loan Trust Series 2012-C, Class A1 (P) (S) |
1.526 | 08-15-23 | 344,947 | 345,139 | ||||||||||||||||||||||||||||
| SLM Student Loan Trust Series 2011-1, Class A1 (P) |
0.947 | 03-25-26 | 2,553,344 | 2,522,961 | ||||||||||||||||||||||||||||
| TAL Advantage V LLC Series 2013-2A, Class A (S) |
3.550 | 11-20-38 | 2,937,500 | 2,933,612 | ||||||||||||||||||||||||||||
| US Residential Opportunity Fund III Trust Series 2015-1III, Class A (S) |
3.721 | 01-27-35 | 2,780,265 | 2,758,950 | ||||||||||||||||||||||||||||
| VOLT XXII LLC Series 2015-NPL4, Class A1 (S) |
3.500 | 02-25-55 | 1,549,421 | 1,537,558 | ||||||||||||||||||||||||||||
| VOLT XXV LLC Series 2015-NPL8, Class A1 (S) |
3.500 | 06-26-45 | 3,536,900 | 3,487,918 | ||||||||||||||||||||||||||||
| VOLT XXXIII LLC Series 2015-NPL5, Class A1 (S) |
3.500 | 03-25-55 | 1,171,731 | 1,151,311 | ||||||||||||||||||||||||||||
| VOLT XXXIX LLC Series 2015-NP13, Class A1 (S) |
4.125 | 10-25-45 | 3,997,972 | 3,982,919 | ||||||||||||||||||||||||||||
| Shares | Value | |||||||||||||||||||||||||||||||
| Common stocks 0.1% | $1,589,683 | |||||||||||||||||||||||||||||||
| (Cost $2,546,280) | ||||||||||||||||||||||||||||||||
| Information technology 0.1% | 1,539,244 | |||||||||||||||||||||||||||||||
| Communications equipment 0.1% | ||||||||||||||||||||||||||||||||
| Ciena Corp. (I) | 65,200 | 1,158,604 | ||||||||||||||||||||||||||||||
| Comtech Telecommunications Corp. | 19,500 | 380,640 | ||||||||||||||||||||||||||||||
| Shares | Value | |||||||||||||||||||||||||||||||
| Utilities 0.0% | $50,439 | |||||||||||||||||||||||||||||||
| Electric utilities 0.0% | ||||||||||||||||||||||||||||||||
| EME Reorganization Trust | 1,327,835 | 3,984 | ||||||||||||||||||||||||||||||
| Independent power and renewable electricity producers 0.0% | ||||||||||||||||||||||||||||||||
| NRG Energy, Inc. | 4,366 | 46,455 | ||||||||||||||||||||||||||||||
| Preferred securities 0.1% | $600,400 | |||||||||||||||||||||||||||||||
| (Cost $487,500) | ||||||||||||||||||||||||||||||||
| Consumer staples 0.1% | 600,400 | |||||||||||||||||||||||||||||||
| Food products 0.1% | ||||||||||||||||||||||||||||||||
| Tyson Foods, Inc., 4.750% | 10,000 | 600,400 | ||||||||||||||||||||||||||||||
| Yield (%) | Shares | Value | ||||||||||||||||||||||||||||||
| Short-term investments 2.7% | $36,815,063 | |||||||||||||||||||||||||||||||
| (Cost $36,815,063) | ||||||||||||||||||||||||||||||||
| Money market funds 2.7% | 36,337,312 | |||||||||||||||||||||||||||||||
| State Street Institutional Liquid Reserves Fund | 0.3585(Y) | 36,337,312 | 36,337,312 | |||||||||||||||||||||||||||||
| Par value^ | Value | |||||||||||||||||||||||||||||||
| Repurchase agreement 0.0% | 477,751 | |||||||||||||||||||||||||||||||
| Repurchase Agreement with State Street Corp., dated 1-29-16 at 0.000% to be repurchased at $477,751 on 2-1-16, collateralized by $477,100 U.S. Treasury Notes, 1.500% due 8-31-18 (valued at $484,387, including interest) | 477,751 | $477,751 | ||||||||||||||||||||||||||||||
| Total investments (Cost $1,434,147,181)† 100.9% | $1,359,138,210 | |||||||||||||||||||||||||||||||
| Other assets and liabilities, net (0.9%) | ($12,312,717 | ) | ||||||||||||||||||||||||||||||
| Total net assets 100.0% | $1,346,825,493 | |||||||||||||||||||||||||||||||
| The percentage shown for each investment category is the total value of the category as a percentage of the net assets of the fund. | ||||||||||||||||||||||||||||||||
| ^All par values are denominated in U.S. dollars unless otherwise indicated. | ||||||||||||||||||||||||||||||||
| Key to Currency Abbreviations | ||||||||||||||||||||||||||||||||
| COP | Colombian Peso | |||||||||||||||||||||||||||||||
| EUR | Euro | |||||||||||||||||||||||||||||||
| GBP | Pound Sterling | |||||||||||||||||||||||||||||||
| Key to Security Abbreviations and Legend | ||||||||||||||||||||||||||||||||
| ISDAFIX | International Swaps and Derivatives Association Fixed Interest Rate Swap Rate | |||||||||||||||||||||||||||||||
| LIBOR | London Interbank Offered Rate | |||||||||||||||||||||||||||||||
| PIK | Payment-in-kind | |||||||||||||||||||||||||||||||
| TBA | To Be Announced. A forward mortgage-backed securities trade issued by a U.S. Government Agency, to be delivered at an agreed-upon future settlement date. | |||||||||||||||||||||||||||||||
| TBD | To Be Determined | |||||||||||||||||||||||||||||||
| (C) | Security purchased on a when-issued or delayed delivery basis. | |||||||||||||||||||||||||||||||
| (H) | Non-income producing - Issuer is in default. | |||||||||||||||||||||||||||||||
| (I) | Non-income producing security. | |||||||||||||||||||||||||||||||
| (M) | Term loans are variable rate obligations. The coupon rate shown represents the rate at period end. | |||||||||||||||||||||||||||||||
| (P) | Variable rate obligation. The coupon rate shown represents the rate at period end. | |||||||||||||||||||||||||||||||
| (Q) | Perpetual bonds have no stated maturity date. Date shown as maturity date is next call date. | |||||||||||||||||||||||||||||||
| (S) | These securities are exempt from registration under Rule 144A of the Securities Act of 1933. Such securities may be resold, normally to qualified institutional buyers, in transactions exempt from registration. Rule 144A securities amounted to $385,063,313 or 28.6% of the fund's net assets as of 1-31-16. | |||||||||||||||||||||||||||||||
| (T) | This position represents an unsettled loan commitment at period end. Certain details associated with this purchase are not known prior to the settlement date, including coupon rate. | |||||||||||||||||||||||||||||||
| (Y) | The rate shown is the annualized seven-day yield as of 1-31-16. | |||||||||||||||||||||||||||||||
| * | Yield represents either the annualized yield at the date of purchase, the stated coupon rate or, for floating rate securities, the rate at period end. | |||||||||||||||||||||||||||||||
| † | At 1-31-16, the aggregate cost of investment securities for federal income tax purposes was $1,437,890,967. Net unrealized depreciation aggregated $78,752,757, of which $10,451,191 related to appreciated investment securities and $89,203,948 related to depreciated investment securities. | |||||||||||||||||||||||||||||||
Financial statements
STATEMENT OF ASSETS AND LIABILITIES 1-31-16 (unaudited)
| Assets | ||||||||||||||||||||||||||||||
| Investments, at value (Cost $1,434,147,181) | $1,359,138,210 | |||||||||||||||||||||||||||||
| Cash held at broker for futures contracts | 5,465,300 | |||||||||||||||||||||||||||||
| Cash segregated at custodian for derivative contracts | 2,885,000 | |||||||||||||||||||||||||||||
| Receivable for investments sold | 5,572,307 | |||||||||||||||||||||||||||||
| Receivable for delayed delivery securities sold | 6,522,371 | |||||||||||||||||||||||||||||
| Receivable for fund shares sold | 962,468 | |||||||||||||||||||||||||||||
| Unrealized appreciation on forward foreign currency exchange contracts | 682,417 | |||||||||||||||||||||||||||||
| Dividends and interest receivable | 11,526,072 | |||||||||||||||||||||||||||||
| Receivable for exchange cleared swaps | 2,752,518 | |||||||||||||||||||||||||||||
| Other receivables and prepaid expenses | 52,352 | |||||||||||||||||||||||||||||
| Total assets | 1,395,559,015 | |||||||||||||||||||||||||||||
| Liabilities | ||||||||||||||||||||||||||||||
| Due to custodian | 358,230 | |||||||||||||||||||||||||||||
| Payable for collateral held by fund | 480,000 | |||||||||||||||||||||||||||||
| Payable for investments purchased | 5,814,417 | |||||||||||||||||||||||||||||
| Payable for delayed delivery securities purchased | 37,483,282 | |||||||||||||||||||||||||||||
| Unrealized depreciation on forward foreign currency exchange contracts | 1,556,929 | |||||||||||||||||||||||||||||
| Payable for fund shares repurchased | 167,324 | |||||||||||||||||||||||||||||
| Swap contracts, at value (including unamortized upfront payment of $1,707,068) | 1,014,515 | |||||||||||||||||||||||||||||
| Payable for futures variation margin | 1,685,284 | |||||||||||||||||||||||||||||
| Distributions payable | 1,033 | |||||||||||||||||||||||||||||
| Payable to affiliates | ||||||||||||||||||||||||||||||
| Accounting and legal services fees | 32,627 | |||||||||||||||||||||||||||||
| Transfer agent fees | 10,417 | |||||||||||||||||||||||||||||
| Trustees' fees | 2,503 | |||||||||||||||||||||||||||||
| Other liabilities and accrued expenses | 126,961 | |||||||||||||||||||||||||||||
| Total liabilities | 48,733,522 | |||||||||||||||||||||||||||||
| Net assets | $1,346,825,493 | |||||||||||||||||||||||||||||
| Net assets consist of | ||||||||||||||||||||||||||||||
| Paid-in capital | $1,493,830,698 | |||||||||||||||||||||||||||||
| Accumulated distributions in excess of net investment income | (302,001 | ) | ||||||||||||||||||||||||||||
| Accumulated net realized gain (loss) on investments, futures contracts, foreign currency transactions and swap agreements | (60,013,917 | ) | ||||||||||||||||||||||||||||
| Net unrealized appreciation (depreciation) on investments, futures contracts, translation of assets and liabilities in foreign currencies and swap agreements | (86,689,287 | ) | ||||||||||||||||||||||||||||
| Net assets | $1,346,825,493 | |||||||||||||||||||||||||||||
STATEMENT OF ASSETS AND LIABILITIES (continued)
| Net asset value per share | ||||||||||||||||||
| Based on net asset values and shares outstanding-the fund has an unlimited number of shares authorized with no par value | ||||||||||||||||||
| Class A ($25,826,028 ÷ 2,812,559 shares)1 | $9.18 | |||||||||||||||||
| Class C ($3,007,447 ÷ 327,550 shares)1 | $9.18 | |||||||||||||||||
| Class I ($22,899,141 ÷ 2,497,377 shares) | $9.17 | |||||||||||||||||
| Class R2 ($92,441 ÷ 10,070 shares) | $9.18 | |||||||||||||||||
| Class R4 ($92,441 ÷ 10,070 shares) | $9.18 | |||||||||||||||||
| Class R6 ($881,969 ÷ 96,074 shares) | $9.18 | |||||||||||||||||
| Class NAV ($1,294,026,026 ÷ 140,898,900 shares) | $9.18 | |||||||||||||||||
| Maximum offering price per share | ||||||||||||||||||
| Class A (net asset value per share ÷ 97.5%)2 | $9.42 | |||||||||||||||||
| 1 | Redemption price per share is equal to net asset value less any applicable contingent deferred sales charge. | ||||||||||||||||
| 2 | On single retail sales of less than $100,000. On sales of $100,000 or more and on group sales the offering price is reduced. | ||||||||||||||||
STATEMENT OF OPERATIONS For the six months ended 1-31-16 (unaudited)
| Investment income | ||||||||||||||||||||||||
| Interest | $30,305,545 | |||||||||||||||||||||||
| Dividends | 33,251 | |||||||||||||||||||||||
| Total investment income | 30,338,796 | |||||||||||||||||||||||
| Expenses | ||||||||||||||||||||||||
| Investment management fees | 4,892,708 | |||||||||||||||||||||||
| Distribution and service fees | 53,007 | |||||||||||||||||||||||
| Accounting and legal services fees | 93,926 | |||||||||||||||||||||||
| Transfer agent fees | 31,833 | |||||||||||||||||||||||
| Trustees' fees | 12,459 | |||||||||||||||||||||||
| State registration fees | 45,801 | |||||||||||||||||||||||
| Printing and postage | 3,390 | |||||||||||||||||||||||
| Professional fees | 55,700 | |||||||||||||||||||||||
| Custodian fees | 106,489 | |||||||||||||||||||||||
| Registration and filing fees | 46,866 | |||||||||||||||||||||||
| Other | 11,663 | |||||||||||||||||||||||
| Total expenses | 5,353,842 | |||||||||||||||||||||||
| Less expense reductions | (52,373 | ) | ||||||||||||||||||||||
| Net expenses | 5,301,469 | |||||||||||||||||||||||
| Net investment income | 25,037,327 | |||||||||||||||||||||||
| Realized and unrealized gain (loss) | ||||||||||||||||||||||||
| Net realized gain (loss) on | ||||||||||||||||||||||||
| Investments and foreign currency transactions | (16,796,044 | ) | ||||||||||||||||||||||
| Futures contracts | (1,649,678 | ) | ||||||||||||||||||||||
| Swap contracts | 1,019,382 | |||||||||||||||||||||||
| (17,426,340 | ) | |||||||||||||||||||||||
| Change in net unrealized appreciation (depreciation) of | ||||||||||||||||||||||||
| Investments and translation of assets and liabilities in foreign currencies | (46,881,288 | ) | ||||||||||||||||||||||
| Futures contracts | (10,040,452 | ) | ||||||||||||||||||||||
| Swap contracts | (1,626,464 | ) | ||||||||||||||||||||||
| (58,548,204 | ) | |||||||||||||||||||||||
| Net realized and unrealized loss | (75,974,544 | ) | ||||||||||||||||||||||
| Decrease in net assets from operations | ($50,937,217 | ) | ||||||||||||||||||||||
STATEMENTS OF CHANGES IN NET ASSETS
| Six months ended 1-31-16 | Year ended 7-31-15 | |||||||||||||||||||||||||||||||||||||||||||||||
| (unaudited) | ||||||||||||||||||||||||||||||||||||||||||||||||
| Increase (decrease) in net assets | ||||||||||||||||||||||||||||||||||||||||||||||||
| From operations | ||||||||||||||||||||||||||||||||||||||||||||||||
| Net investment income | $25,037,327 | $53,194,825 | ||||||||||||||||||||||||||||||||||||||||||||||
| Net realized loss | (17,426,340 | ) | (17,678,161 | ) | ||||||||||||||||||||||||||||||||||||||||||||
| Change in net unrealized appreciation (depreciation) | (58,548,204 | ) | (59,101,316 | ) | ||||||||||||||||||||||||||||||||||||||||||||
| Decrease in net assets resulting from operations | (50,937,217 | ) | (23,584,652 | ) | ||||||||||||||||||||||||||||||||||||||||||||
| Distributions to shareholders | ||||||||||||||||||||||||||||||||||||||||||||||||
| From net investment income | ||||||||||||||||||||||||||||||||||||||||||||||||
| Class A | (505,089 | ) | (661,087 | ) | ||||||||||||||||||||||||||||||||||||||||||||
| Class C | (47,312 | ) | (36,796 | ) | ||||||||||||||||||||||||||||||||||||||||||||
| Class I | (556,408 | ) | (856,208 | ) | ||||||||||||||||||||||||||||||||||||||||||||
| Class R21 | (2,006 | ) | (1,152 | ) | ||||||||||||||||||||||||||||||||||||||||||||
| Class R41 | (2,055 | ) | (1,186 | ) | ||||||||||||||||||||||||||||||||||||||||||||
| Class R61 | (3,265 | ) | (1,241 | ) | ||||||||||||||||||||||||||||||||||||||||||||
| Class NAV | (29,810,542 | ) | (51,698,629 | ) | ||||||||||||||||||||||||||||||||||||||||||||
| Total distributions | (30,926,677 | ) | (53,256,299 | ) | ||||||||||||||||||||||||||||||||||||||||||||
| From fund share transactions | (28,095,597 | ) | 28,899,818 | |||||||||||||||||||||||||||||||||||||||||||||
| Total decrease | (109,959,491 | ) | (47,941,133 | ) | ||||||||||||||||||||||||||||||||||||||||||||
| Net assets | ||||||||||||||||||||||||||||||||||||||||||||||||
| Beginning of period | 1,456,784,984 | 1,504,726,117 | ||||||||||||||||||||||||||||||||||||||||||||||
| End of period | $1,346,825,493 | $1,456,784,984 | ||||||||||||||||||||||||||||||||||||||||||||||
| Undistributed (accumulated distributions in excess of) net investment income | ($302,001 | ) | $5,587,349 | |||||||||||||||||||||||||||||||||||||||||||||
| 1 | The inception date for Class R2, Class R4 and Class R6 shares is 3-27-15. | ||||||||||||||||||||||||||||||||||||||||||||||||||||
Financial highlights
| Class A Shares Period ended | 1-31-16 | 1 | 7-31-15 | 7-31-14 | 7-31-13 | 7-31-12 | 7-31-11 | |||||||||||||||||||||||||||||||||||||||||||||||||||||||||||||||||||||||||||||||||||||||||||||||||||||||||||||||
| Per share operating performance | ||||||||||||||||||||||||||||||||||||||||||||||||||||||||||||||||||||||||||||||||||||||||||||||||||||||||||||||||||||||
| Net asset value, beginning of period | $9.73 | $10.25 | $10.32 | $10.30 | $10.41 | $10.25 | ||||||||||||||||||||||||||||||||||||||||||||||||||||||||||||||||||||||||||||||||||||||||||||||||||||||||||||||||
| Net investment income2 | 0.15 | 0.31 | 0.30 | 0.36 | 0.38 | 0.39 | ||||||||||||||||||||||||||||||||||||||||||||||||||||||||||||||||||||||||||||||||||||||||||||||||||||||||||||||||
| Net realized and unrealized gain (loss) on investments | (0.51 | ) | (0.52 | ) | 0.08 | (0.01 | ) | (0.05 | ) | 0.26 | ||||||||||||||||||||||||||||||||||||||||||||||||||||||||||||||||||||||||||||||||||||||||||||||||||||||||||||
| Total from investment operations | (0.36 | ) | (0.21 | ) | 0.38 | 0.35 | 0.33 | 0.65 | ||||||||||||||||||||||||||||||||||||||||||||||||||||||||||||||||||||||||||||||||||||||||||||||||||||||||||||||
| Less distributions | ||||||||||||||||||||||||||||||||||||||||||||||||||||||||||||||||||||||||||||||||||||||||||||||||||||||||||||||||||||||
| From net investment income | (0.19 | ) | (0.31 | ) | (0.32 | ) | (0.33 | ) | (0.39 | ) | (0.46 | ) | ||||||||||||||||||||||||||||||||||||||||||||||||||||||||||||||||||||||||||||||||||||||||||||||||||||||||||
| From net realized gain | — | — | (0.13 | ) | — | (0.05 | ) | (0.03 | ) | |||||||||||||||||||||||||||||||||||||||||||||||||||||||||||||||||||||||||||||||||||||||||||||||||||||||||||||
| Total distributions | (0.19 | ) | (0.31 | ) | (0.45 | ) | (0.33 | ) | (0.44 | ) | (0.49 | ) | ||||||||||||||||||||||||||||||||||||||||||||||||||||||||||||||||||||||||||||||||||||||||||||||||||||||||||
| Net asset value, end of period | $9.18 | $9.73 | $10.25 | $10.32 | $10.30 | $10.41 | ||||||||||||||||||||||||||||||||||||||||||||||||||||||||||||||||||||||||||||||||||||||||||||||||||||||||||||||||
| Total return (%)3,4 | (3.74 | ) 5 | (2.03 | ) | 3.76 | 3.41 | 3.27 | 6.37 | ||||||||||||||||||||||||||||||||||||||||||||||||||||||||||||||||||||||||||||||||||||||||||||||||||||||||||||||
| Ratios and supplemental data | ||||||||||||||||||||||||||||||||||||||||||||||||||||||||||||||||||||||||||||||||||||||||||||||||||||||||||||||||||||||
| Net assets, end of period (in millions) | $26 | $27 | $18 | $2 | — | 6 | — | 6 | ||||||||||||||||||||||||||||||||||||||||||||||||||||||||||||||||||||||||||||||||||||||||||||||||||||||||||||||
| Ratios (as a percentage of average net assets): | ||||||||||||||||||||||||||||||||||||||||||||||||||||||||||||||||||||||||||||||||||||||||||||||||||||||||||||||||||||||
| Expenses before reductions | 1.16 | 7 | 1.21 | 1.47 | 4.65 | 1.25 | 1.24 | |||||||||||||||||||||||||||||||||||||||||||||||||||||||||||||||||||||||||||||||||||||||||||||||||||||||||||||||
| Expenses including reductions | 1.15 | 7 | 1.20 | 1.21 | 1.21 | 1.25 | 1.24 | |||||||||||||||||||||||||||||||||||||||||||||||||||||||||||||||||||||||||||||||||||||||||||||||||||||||||||||||
| Net investment income | 3.07 | 7 | 3.10 | 2.93 | 3.58 | 3.81 | 3.75 | |||||||||||||||||||||||||||||||||||||||||||||||||||||||||||||||||||||||||||||||||||||||||||||||||||||||||||||||
| Portfolio turnover (%) | 23 | 61 | 65 | 77 | 60 | 80 | ||||||||||||||||||||||||||||||||||||||||||||||||||||||||||||||||||||||||||||||||||||||||||||||||||||||||||||||||
| 1 | Six months ended 1-31-16. Unaudited. | ||||||||||||||||||||||||||||||||||||||||||||||||||||||||||||||||||||||||||||||||||
| 2 | Based on average daily shares outstanding. | ||||||||||||||||||||||||||||||||||||||||||||||||||||||||||||||||||||||||||||||||||
| 3 | Does not reflect the effect of sales charges, if any. | ||||||||||||||||||||||||||||||||||||||||||||||||||||||||||||||||||||||||||||||||||
| 4 | Total returns would have been lower had certain expenses not been reduced during the applicable periods. | ||||||||||||||||||||||||||||||||||||||||||||||||||||||||||||||||||||||||||||||||||
| 5 | Not annualized. | ||||||||||||||||||||||||||||||||||||||||||||||||||||||||||||||||||||||||||||||||||
| 6 | Less than $500,000. | ||||||||||||||||||||||||||||||||||||||||||||||||||||||||||||||||||||||||||||||||||
| 7 | Annualized. | ||||||||||||||||||||||||||||||||||||||||||||||||||||||||||||||||||||||||||||||||||
| Class C Shares Period ended | 1-31-16 | 1 | 7-31-15 | 7-31-14 | 2 | ||||||||||||||||||||||||||||||||||||||||||||||||||||||||||||||||||
| Per share operating performance | |||||||||||||||||||||||||||||||||||||||||||||||||||||||||||||||||||||||
| Net asset value, beginning of period | $9.73 | $10.25 | $10.29 | ||||||||||||||||||||||||||||||||||||||||||||||||||||||||||||||||||||
| Net investment income3 | 0.12 | 0.23 | — | 4 | |||||||||||||||||||||||||||||||||||||||||||||||||||||||||||||||||||
| Net realized and unrealized loss on investments | (0.51 | ) | (0.52 | ) | (0.02 | ) | |||||||||||||||||||||||||||||||||||||||||||||||||||||||||||||||||
| Total from investment operations | (0.39 | ) | (0.29 | ) | (0.02 | ) | |||||||||||||||||||||||||||||||||||||||||||||||||||||||||||||||||
| Less distributions | |||||||||||||||||||||||||||||||||||||||||||||||||||||||||||||||||||||||
| From net investment income | (0.16 | ) | (0.23 | ) | (0.02 | ) | |||||||||||||||||||||||||||||||||||||||||||||||||||||||||||||||||
| Total distributions | (0.16 | ) | (0.23 | ) | (0.02 | ) | |||||||||||||||||||||||||||||||||||||||||||||||||||||||||||||||||
| Net asset value, end of period | $9.18 | $9.73 | $10.25 | ||||||||||||||||||||||||||||||||||||||||||||||||||||||||||||||||||||
| Total return (%)5,6 | (4.07 | ) 7 | (2.82 | ) | (0.18 | ) 7 | |||||||||||||||||||||||||||||||||||||||||||||||||||||||||||||||||
| Ratios and supplemental data | |||||||||||||||||||||||||||||||||||||||||||||||||||||||||||||||||||||||
| Net assets, end of period (in millions) | $3 | $2 | $1 | ||||||||||||||||||||||||||||||||||||||||||||||||||||||||||||||||||||
| Ratios (as a percentage of average net assets): | |||||||||||||||||||||||||||||||||||||||||||||||||||||||||||||||||||||||
| Expenses before reductions | 1.87 | 8 | 2.27 | 7.95 | 8 | ||||||||||||||||||||||||||||||||||||||||||||||||||||||||||||||||||
| Expenses including reductions | 1.86 | 8 | 2.00 | 2.00 | 8 | ||||||||||||||||||||||||||||||||||||||||||||||||||||||||||||||||||
| Net investment income (loss) | 2.43 | 8 | 2.36 | (0.52 | ) 8 | ||||||||||||||||||||||||||||||||||||||||||||||||||||||||||||||||||
| Portfolio turnover (%) | 23 | 61 | 65 | 9 | |||||||||||||||||||||||||||||||||||||||||||||||||||||||||||||||||||
| 1 | Six months ended 1-31-16. Unaudited. | |||||||||||||||||||||||||||||||||||||||||||||||||||||||||||||||||||||||||||||||
| 2 | The inception date for Class C shares is 6-27-14. | |||||||||||||||||||||||||||||||||||||||||||||||||||||||||||||||||||||||||||||||
| 3 | Based on average daily shares outstanding. | |||||||||||||||||||||||||||||||||||||||||||||||||||||||||||||||||||||||||||||||
| 4 | Less than $0.005 per share. | |||||||||||||||||||||||||||||||||||||||||||||||||||||||||||||||||||||||||||||||
| 5 | Does not reflect the effect of sales charges, if any. | |||||||||||||||||||||||||||||||||||||||||||||||||||||||||||||||||||||||||||||||
| 6 | Total returns would have been lower had certain expenses not been reduced during the applicable periods. | |||||||||||||||||||||||||||||||||||||||||||||||||||||||||||||||||||||||||||||||
| 7 | Not annualized. | |||||||||||||||||||||||||||||||||||||||||||||||||||||||||||||||||||||||||||||||
| 8 | Annualized. | |||||||||||||||||||||||||||||||||||||||||||||||||||||||||||||||||||||||||||||||
| 9 | The portfolio turnover is shown for the period from 8-1-13 to 7-31-14. | |||||||||||||||||||||||||||||||||||||||||||||||||||||||||||||||||||||||||||||||
| Class I Shares Period ended | 1-31-16 | 1 | 7-31-15 | 7-31-14 | 7-31-13 | 7-31-12 | 7-31-11 | |||||||||||||||||||||||||||||||||||||||||||||||||||||||||||||||||||||||||||||||||||||||||||||||||||||||||||||||
| Per share operating performance | ||||||||||||||||||||||||||||||||||||||||||||||||||||||||||||||||||||||||||||||||||||||||||||||||||||||||||||||||||||||
| Net asset value, beginning of period | $9.72 | $10.24 | $10.32 | $10.30 | $10.41 | $10.24 | ||||||||||||||||||||||||||||||||||||||||||||||||||||||||||||||||||||||||||||||||||||||||||||||||||||||||||||||||
| Net investment income2 | 0.17 | 0.34 | 0.32 | 0.38 | 0.42 | 0.42 | ||||||||||||||||||||||||||||||||||||||||||||||||||||||||||||||||||||||||||||||||||||||||||||||||||||||||||||||||
| Net realized and unrealized gain (loss) on investments | (0.52 | ) | (0.51 | ) | 0.08 | — | 3 | (0.06 | ) | 0.26 | ||||||||||||||||||||||||||||||||||||||||||||||||||||||||||||||||||||||||||||||||||||||||||||||||||||||||||||
| Total from investment operations | (0.35 | ) | (0.17 | ) | 0.40 | 0.38 | 0.36 | 0.68 | ||||||||||||||||||||||||||||||||||||||||||||||||||||||||||||||||||||||||||||||||||||||||||||||||||||||||||||||
| Less distributions | ||||||||||||||||||||||||||||||||||||||||||||||||||||||||||||||||||||||||||||||||||||||||||||||||||||||||||||||||||||||
| From net investment income | (0.20 | ) | (0.35 | ) | (0.35 | ) | (0.36 | ) | (0.42 | ) | (0.48 | ) | ||||||||||||||||||||||||||||||||||||||||||||||||||||||||||||||||||||||||||||||||||||||||||||||||||||||||||
| From net realized gain | — | — | (0.13 | ) | — | (0.05 | ) | (0.03 | ) | |||||||||||||||||||||||||||||||||||||||||||||||||||||||||||||||||||||||||||||||||||||||||||||||||||||||||||||
| Total distributions | (0.20 | ) | (0.35 | ) | (0.48 | ) | (0.36 | ) | (0.47 | ) | (0.51 | ) | ||||||||||||||||||||||||||||||||||||||||||||||||||||||||||||||||||||||||||||||||||||||||||||||||||||||||||
| Net asset value, end of period | $9.17 | $9.72 | $10.24 | $10.32 | $10.30 | $10.41 | ||||||||||||||||||||||||||||||||||||||||||||||||||||||||||||||||||||||||||||||||||||||||||||||||||||||||||||||||
| Total return (%)4 | (3.59 | ) 5 | (1.71 | ) | 3.98 | 3.73 | 3.64 | 6.70 | ||||||||||||||||||||||||||||||||||||||||||||||||||||||||||||||||||||||||||||||||||||||||||||||||||||||||||||||
| Ratios and supplemental data | ||||||||||||||||||||||||||||||||||||||||||||||||||||||||||||||||||||||||||||||||||||||||||||||||||||||||||||||||||||||
| Net assets, end of period (in millions) | $23 | $26 | $17 | $1 | — | 6 | — | 6 | ||||||||||||||||||||||||||||||||||||||||||||||||||||||||||||||||||||||||||||||||||||||||||||||||||||||||||||||
| Ratios (as a percentage of average net assets): | ||||||||||||||||||||||||||||||||||||||||||||||||||||||||||||||||||||||||||||||||||||||||||||||||||||||||||||||||||||||
| Expenses before reductions | 0.86 | 7 | 0.88 | 1.46 | 4.14 | 0.88 | 0.95 | |||||||||||||||||||||||||||||||||||||||||||||||||||||||||||||||||||||||||||||||||||||||||||||||||||||||||||||||
| Expenses including reductions | 0.85 | 7 | 0.87 | 0.90 | 0.90 | 0.88 | 0.95 | |||||||||||||||||||||||||||||||||||||||||||||||||||||||||||||||||||||||||||||||||||||||||||||||||||||||||||||||
| Net investment income | 3.46 | 7 | 3.46 | 3.23 | 3.76 | 4.16 | 4.01 | |||||||||||||||||||||||||||||||||||||||||||||||||||||||||||||||||||||||||||||||||||||||||||||||||||||||||||||||
| Portfolio turnover (%) | 23 | 61 | 65 | 77 | 60 | 80 | ||||||||||||||||||||||||||||||||||||||||||||||||||||||||||||||||||||||||||||||||||||||||||||||||||||||||||||||||
| 1 | Six months ended 1-31-16. Unaudited. | ||||||||||||||||||||||||||||||||||||||||||||||||||||||||||||||||||||||||||||||||||
| 2 | Based on average daily shares outstanding. | ||||||||||||||||||||||||||||||||||||||||||||||||||||||||||||||||||||||||||||||||||
| 3 | Less than $0.005 per share. | ||||||||||||||||||||||||||||||||||||||||||||||||||||||||||||||||||||||||||||||||||
| 4 | Total returns would have been lower had certain expenses not been reduced during the applicable periods. | ||||||||||||||||||||||||||||||||||||||||||||||||||||||||||||||||||||||||||||||||||
| 5 | Not annualized. | ||||||||||||||||||||||||||||||||||||||||||||||||||||||||||||||||||||||||||||||||||
| 6 | Less than $500,000. | ||||||||||||||||||||||||||||||||||||||||||||||||||||||||||||||||||||||||||||||||||
| 7 | Annualized. | ||||||||||||||||||||||||||||||||||||||||||||||||||||||||||||||||||||||||||||||||||
| Class R2 Shares Period ended | 1-31-16 | 1 | 7-31-15 | 2 | ||||||||||||||||||||||||||||||||||||||||||||||
| Per share operating performance | ||||||||||||||||||||||||||||||||||||||||||||||||||
| Net asset value, beginning of period | $9.73 | $9.93 | ||||||||||||||||||||||||||||||||||||||||||||||||
| Net investment income3 | 0.16 | 0.11 | ||||||||||||||||||||||||||||||||||||||||||||||||
| Net realized and unrealized loss on investments | (0.51 | ) | (0.20 | ) | ||||||||||||||||||||||||||||||||||||||||||||||
| Total from investment operations | (0.35 | ) | (0.09 | ) | ||||||||||||||||||||||||||||||||||||||||||||||
| Less distributions | ||||||||||||||||||||||||||||||||||||||||||||||||||
| From net investment income | (0.20 | ) | (0.11 | ) | ||||||||||||||||||||||||||||||||||||||||||||||
| Total distributions | (0.20 | ) | (0.11 | ) | ||||||||||||||||||||||||||||||||||||||||||||||
| Net asset value, end of period | $9.18 | $9.73 | ||||||||||||||||||||||||||||||||||||||||||||||||
| Total return (%)4 | (3.64 | ) 5 | (0.87 | ) 5 | ||||||||||||||||||||||||||||||||||||||||||||||
| Ratios and supplemental data | ||||||||||||||||||||||||||||||||||||||||||||||||||
| Net assets, end of period (in millions) | — | 6 | — | 6 | ||||||||||||||||||||||||||||||||||||||||||||||
| Ratios (as a percentage of average net assets): | ||||||||||||||||||||||||||||||||||||||||||||||||||
| Expenses before reductions | 1.01 | 7 | 1.01 | 7 | ||||||||||||||||||||||||||||||||||||||||||||||
| Expenses including reductions | 1.00 | 7 | 1.00 | 7 | ||||||||||||||||||||||||||||||||||||||||||||||
| Net investment income | 3.30 | 7 | 3.09 | 7 | ||||||||||||||||||||||||||||||||||||||||||||||
| Portfolio turnover (%) | 23 | 61 | 8 | |||||||||||||||||||||||||||||||||||||||||||||||
| 1 | Six months ended 1-31-16. Unaudited. | ||||||||||||||||||||||||||||||||||||||||||||||||||||||||||
| 2 | The inception date for Class R2 shares is 3-27-15. | ||||||||||||||||||||||||||||||||||||||||||||||||||||||||||
| 3 | Based on average daily shares outstanding. | ||||||||||||||||||||||||||||||||||||||||||||||||||||||||||
| 4 | Total returns would have been lower had certain expenses not been reduced during the period. | ||||||||||||||||||||||||||||||||||||||||||||||||||||||||||
| 5 | Not annualized. | ||||||||||||||||||||||||||||||||||||||||||||||||||||||||||
| 6 | Less than $500,000. | ||||||||||||||||||||||||||||||||||||||||||||||||||||||||||
| 7 | Annualized. | ||||||||||||||||||||||||||||||||||||||||||||||||||||||||||
| 8 | The portfolio turnover is shown for the period from 8-1-14 to 7-31-15. | ||||||||||||||||||||||||||||||||||||||||||||||||||||||||||
| Class R4 Shares Period ended | 1-31-16 | 1 | 7-31-15 | 2 | ||||||||||||||||||||||||||||||||||||||||||||||
| Per share operating performance | ||||||||||||||||||||||||||||||||||||||||||||||||||
| Net asset value, beginning of period | $9.73 | $9.93 | ||||||||||||||||||||||||||||||||||||||||||||||||
| Net investment income3 | 0.16 | 0.11 | ||||||||||||||||||||||||||||||||||||||||||||||||
| Net realized and unrealized loss on investments | (0.51 | ) | (0.19 | ) | ||||||||||||||||||||||||||||||||||||||||||||||
| Total from investment operations | (0.35 | ) | (0.08 | ) | ||||||||||||||||||||||||||||||||||||||||||||||
| Less distributions | ||||||||||||||||||||||||||||||||||||||||||||||||||
| From net investment income | (0.20 | ) | (0.12 | ) | ||||||||||||||||||||||||||||||||||||||||||||||
| Total distributions | (0.20 | ) | (0.12 | ) | ||||||||||||||||||||||||||||||||||||||||||||||
| Net asset value, end of period | $9.18 | $9.73 | ||||||||||||||||||||||||||||||||||||||||||||||||
| Total return (%)4 | (3.59 | ) 5 | (0.84 | ) 5 | ||||||||||||||||||||||||||||||||||||||||||||||
| Ratios and supplemental data | ||||||||||||||||||||||||||||||||||||||||||||||||||
| Net assets, end of period (in millions) | — | 6 | — | 6 | ||||||||||||||||||||||||||||||||||||||||||||||
| Ratios (as a percentage of average net assets): | ||||||||||||||||||||||||||||||||||||||||||||||||||
| Expenses before reductions | 1.01 | 7 | 1.01 | 7 | ||||||||||||||||||||||||||||||||||||||||||||||
| Expenses including reductions | 0.90 | 7 | 0.90 | 7 | ||||||||||||||||||||||||||||||||||||||||||||||
| Net investment income | 3.29 | 7 | 3.19 | 7 | ||||||||||||||||||||||||||||||||||||||||||||||
| Portfolio turnover (%) | 23 | 61 | 8 | |||||||||||||||||||||||||||||||||||||||||||||||
| 1 | Six months ended 1-31-16. Unaudited. | ||||||||||||||||||||||||||||||||||||||||||||||||||||||||||
| 2 | The inception date for Class R4 shares is 3-27-15. | ||||||||||||||||||||||||||||||||||||||||||||||||||||||||||
| 3 | Based on average daily shares outstanding. | ||||||||||||||||||||||||||||||||||||||||||||||||||||||||||
| 4 | Total returns would have been lower had certain expenses not been reduced during the applicable periods. | ||||||||||||||||||||||||||||||||||||||||||||||||||||||||||
| 5 | Not annualized. | ||||||||||||||||||||||||||||||||||||||||||||||||||||||||||
| 6 | Less than $500,000. | ||||||||||||||||||||||||||||||||||||||||||||||||||||||||||
| 7 | Annualized. | ||||||||||||||||||||||||||||||||||||||||||||||||||||||||||
| 8 | The portfolio turnover is shown for the period from 8-1-14 to 7-31-15. | ||||||||||||||||||||||||||||||||||||||||||||||||||||||||||
| Class R6 Shares Period ended | 1-31-16 | 1 | 7-31-15 | 2 | ||||||||||||||||||||||||||||||||||||||||||||||
| Per share operating performance | ||||||||||||||||||||||||||||||||||||||||||||||||||
| Net asset value, beginning of period | $9.73 | $9.93 | ||||||||||||||||||||||||||||||||||||||||||||||||
| Net investment income3 | 0.16 | 0.11 | ||||||||||||||||||||||||||||||||||||||||||||||||
| Net realized and unrealized loss on investments | (0.50 | ) | (0.19 | ) | ||||||||||||||||||||||||||||||||||||||||||||||
| Total from investment operations | (0.34 | ) | (0.08 | ) | ||||||||||||||||||||||||||||||||||||||||||||||
| Less distributions | ||||||||||||||||||||||||||||||||||||||||||||||||||
| From net investment income | (0.21 | ) | (0.12 | ) | ||||||||||||||||||||||||||||||||||||||||||||||
| Total distributions | (0.21 | ) | (0.12 | ) | ||||||||||||||||||||||||||||||||||||||||||||||
| Net asset value, end of period | $9.18 | $9.73 | ||||||||||||||||||||||||||||||||||||||||||||||||
| Total return (%)4 | (3.51 | ) 5 | (0.78 | ) 5 | ||||||||||||||||||||||||||||||||||||||||||||||
| Ratios and supplemental data | ||||||||||||||||||||||||||||||||||||||||||||||||||
| Net assets, end of period (in millions) | $1 | — | 6 | |||||||||||||||||||||||||||||||||||||||||||||||
| Ratios (as a percentage of average net assets): | ||||||||||||||||||||||||||||||||||||||||||||||||||
| Expenses before reductions | 0.77 | 7 | 0.74 | 7 | ||||||||||||||||||||||||||||||||||||||||||||||
| Expenses including reductions | 0.75 | 7 | 0.73 | 7 | ||||||||||||||||||||||||||||||||||||||||||||||
| Net investment income | 3.40 | 7 | 3.31 | 7 | ||||||||||||||||||||||||||||||||||||||||||||||
| Portfolio turnover (%) | 23 | 61 | 8 | |||||||||||||||||||||||||||||||||||||||||||||||
| 1 | Six months ended 1-31-16. Unaudited. | ||||||||||||||||||||||||||||||||||||||||||||||||||||||||||
| 2 | The inception date for Class R6 shares is 3-27-15. | ||||||||||||||||||||||||||||||||||||||||||||||||||||||||||
| 3 | Based on average daily shares outstanding. | ||||||||||||||||||||||||||||||||||||||||||||||||||||||||||
| 4 | Total returns would have been lower had certain expenses not been reduced during the applicable periods. | ||||||||||||||||||||||||||||||||||||||||||||||||||||||||||
| 5 | Not annualized. | ||||||||||||||||||||||||||||||||||||||||||||||||||||||||||
| 6 | Less than $500,000. | ||||||||||||||||||||||||||||||||||||||||||||||||||||||||||
| 7 | Annualized. | ||||||||||||||||||||||||||||||||||||||||||||||||||||||||||
| 8 | The portfolio turnover is shown for the period from 8-1-14 to 7-31-15. | ||||||||||||||||||||||||||||||||||||||||||||||||||||||||||
| Class NAV Shares Period ended | 1-31-16 | 1 | 7-31-15 | 7-31-14 | 7-31-13 | 7-31-12 | 7-31-11 | |||||||||||||||||||||||||||||||||||||||||||||||||||||||||||||||||||||||||||||||||||||||||||||||||||||||||||||||
| Per share operating performance | ||||||||||||||||||||||||||||||||||||||||||||||||||||||||||||||||||||||||||||||||||||||||||||||||||||||||||||||||||||||
| Net asset value, beginning of period | $9.74 | $10.25 | $10.32 | $10.30 | $10.41 | $10.24 | ||||||||||||||||||||||||||||||||||||||||||||||||||||||||||||||||||||||||||||||||||||||||||||||||||||||||||||||||
| Net investment income2 | 0.17 | 0.36 | 0.37 | 0.40 | 0.43 | 0.44 | ||||||||||||||||||||||||||||||||||||||||||||||||||||||||||||||||||||||||||||||||||||||||||||||||||||||||||||||||
| Net realized and unrealized gain (loss) on investments | (0.52 | ) | (0.51 | ) | 0.06 | — | 3 | (0.05 | ) | 0.26 | ||||||||||||||||||||||||||||||||||||||||||||||||||||||||||||||||||||||||||||||||||||||||||||||||||||||||||||
| Total from investment operations | (0.35 | ) | (0.15 | ) | 0.43 | 0.40 | 0.38 | 0.70 | ||||||||||||||||||||||||||||||||||||||||||||||||||||||||||||||||||||||||||||||||||||||||||||||||||||||||||||||
| Less distributions | ||||||||||||||||||||||||||||||||||||||||||||||||||||||||||||||||||||||||||||||||||||||||||||||||||||||||||||||||||||||
| From net investment income | (0.21 | ) | (0.36 | ) | (0.37 | ) | (0.38 | ) | (0.44 | ) | (0.50 | ) | ||||||||||||||||||||||||||||||||||||||||||||||||||||||||||||||||||||||||||||||||||||||||||||||||||||||||||
| From net realized gain | — | — | (0.13 | ) | — | (0.05 | ) | (0.03 | ) | |||||||||||||||||||||||||||||||||||||||||||||||||||||||||||||||||||||||||||||||||||||||||||||||||||||||||||||
| Total distributions | (0.21 | ) | (0.36 | ) | (0.50 | ) | (0.38 | ) | (0.49 | ) | (0.53 | ) | ||||||||||||||||||||||||||||||||||||||||||||||||||||||||||||||||||||||||||||||||||||||||||||||||||||||||||
| Net asset value, end of period | $9.18 | $9.74 | $10.25 | $10.32 | $10.30 | $10.41 | ||||||||||||||||||||||||||||||||||||||||||||||||||||||||||||||||||||||||||||||||||||||||||||||||||||||||||||||||
| Total return (%)4 | (3.63 | ) 5 | (1.46 | ) | 4.26 | 3.88 | 3.78 | 6.92 | ||||||||||||||||||||||||||||||||||||||||||||||||||||||||||||||||||||||||||||||||||||||||||||||||||||||||||||||
| Ratios and supplemental data | ||||||||||||||||||||||||||||||||||||||||||||||||||||||||||||||||||||||||||||||||||||||||||||||||||||||||||||||||||||||
| Net assets, end of period (in millions) | $1,294 | $1,402 | $1,469 | $1,155 | $1,070 | $1,023 | ||||||||||||||||||||||||||||||||||||||||||||||||||||||||||||||||||||||||||||||||||||||||||||||||||||||||||||||||
| Ratios (as a percentage of average net assets): | ||||||||||||||||||||||||||||||||||||||||||||||||||||||||||||||||||||||||||||||||||||||||||||||||||||||||||||||||||||||
| Expenses before reductions | 0.75 | 6 | 0.74 | 0.75 | 0.75 | 0.75 | 0.77 | |||||||||||||||||||||||||||||||||||||||||||||||||||||||||||||||||||||||||||||||||||||||||||||||||||||||||||||||
| Expenses including reductions | 0.74 | 6 | 0.73 | 0.75 | 0.74 | 0.75 | 0.77 | |||||||||||||||||||||||||||||||||||||||||||||||||||||||||||||||||||||||||||||||||||||||||||||||||||||||||||||||
| Net investment income | 3.57 | 6 | 3.63 | 3.59 | 3.79 | 4.29 | 4.21 | |||||||||||||||||||||||||||||||||||||||||||||||||||||||||||||||||||||||||||||||||||||||||||||||||||||||||||||||
| Portfolio turnover (%) | 23 | 61 | 65 | 77 | 60 | 80 | ||||||||||||||||||||||||||||||||||||||||||||||||||||||||||||||||||||||||||||||||||||||||||||||||||||||||||||||||
| 1 | Six months ended 1-31-16. Unaudited. | ||||||||||||||||||||||||||||||||||||||||||||||||||||||||||||||||||||||||||||||||||
| 2 | Based on average daily shares outstanding. | ||||||||||||||||||||||||||||||||||||||||||||||||||||||||||||||||||||||||||||||||||
| 3 | Less than $0.005 per share. | ||||||||||||||||||||||||||||||||||||||||||||||||||||||||||||||||||||||||||||||||||
| 4 | Total returns would have been lower had certain expenses not been reduced during the applicable periods. | ||||||||||||||||||||||||||||||||||||||||||||||||||||||||||||||||||||||||||||||||||
| 5 | Not annualized. | ||||||||||||||||||||||||||||||||||||||||||||||||||||||||||||||||||||||||||||||||||
| 6 | Annualized. | ||||||||||||||||||||||||||||||||||||||||||||||||||||||||||||||||||||||||||||||||||
Note 1 — Organization
John Hancock Short Duration Credit Opportunities Fund (the fund) is a series of John Hancock Funds II (the Trust), an open-end management investment company organized as a Massachusetts business trust and registered under the Investment Company Act of 1940, as amended (the 1940 Act). The investment objective of the fund is to maximize total return, which consists of income on its investments and capital appreciation.
The fund may offer multiple classes of shares. The shares currently offered are detailed in the Statement of assets and liabilities. Class A and Class C shares are offered to all investors. Class I shares are offered to institutions and certain investors. Class R2 and Class R4 are available only to certain retirement plans. Class R6 shares are available only to certain retirement plans, institutions and other investors. Class NAV shares are offered to John Hancock affiliated funds of funds and certain 529 plans. Shareholders of each class have exclusive voting rights to matters that affect that class. The distribution and service fees, if any, and transfer agent fees for each class may differ.
Note 2 — Significant accounting policies
The financial statements have been prepared in conformity with accounting principles generally accepted in the United States of America (US GAAP), which require management to make certain estimates and assumptions as of the date of the financial statements. Actual results could differ from those estimates and those differences could be significant. The fund qualifies as an investment company under Topic 946 of Accounting Standards Codification of US GAAP.
Events or transactions occurring after the end of the fiscal period through the date that the financial statements were issued have been evaluated in the preparation of the financial statements. The following summarizes the significant accounting policies of the fund:
Security valuation. Investments are stated at value as of the close of regular trading on the New York Stock Exchange (NYSE), normally at 4:00 p.m., Eastern Time. In order to value the securities, the fund uses the following valuation techniques: Debt obligations are valued based on the evaluated prices provided by an independent pricing vendor or from broker-dealers. Independent pricing vendors utilize matrix pricing which takes into account factors such as institutional-size trading in similar groups of securities, yield, quality, coupon rate, maturity, type of issue, trading characteristics and other market data, as well as broker supplied prices. Equity securities held by the fund are valued at the last sale price or official closing price on the exchange or principal market where the security was acquired or most likely will be sold. In the event there were no sales during the day or closing prices are not available, the securities are valued using the last available bid price. Investments by the fund in open-end mutual funds are valued at their respective net asset values each business day. Swaps are valued using evaluated prices obtained from an independent pricing vendor. Futures contracts are valued at settlement prices, which are the official closing prices published by the exchange on which they trade. Foreign securities, including forward foreign currency contracts, are valued in U.S. dollars, based on foreign currency exchange rates supplied by an independent pricing vendor. Securities that trade only in the over-the-counter (OTC) market are valued using bid prices.
Other portfolio securities and assets, for which reliable market quotations are not readily available, are valued at fair value as determined in good faith by the fund's Pricing Committee following procedures established by the Board of Trustees. The frequency with which these fair valuation procedures are used cannot be predicted and fair value of securities may differ significantly from the value that would have been used had a ready market for such securities existed. Trading in foreign securities may be completed before the daily close of trading on the NYSE. Significant events at the issuer or market level may affect the values of securities between the time when the valuation of the securities is generally determined and the close of the NYSE. If a significant event occurs, these securities may be fair valued, as determined in good faith by the fund's Pricing Committee, following procedures established by the Board of Trustees. The fund uses fair value adjustment factors provided by an independent pricing vendor to value certain foreign securities in order to adjust for events that may occur between the close of foreign exchanges or markets and the close of the NYSE.
The fund uses a three-tier hierarchy to prioritize the pricing assumptions, referred to as inputs, used in valuation techniques to measure fair value. Level 1 includes securities valued using quoted prices in active markets for identical securities. Level 2 includes securities valued using other significant observable inputs. Observable inputs may include quoted prices for similar
securities, interest rates, prepayment speeds and credit risk. Prices for securities valued using these inputs are received from independent pricing vendors and brokers and are based on an evaluation of the inputs described. Level 3 includes securities valued using significant unobservable inputs when market prices are not readily available or reliable, including the fund's own assumptions in determining the fair value of investments. Factors used in determining value may include market or issuer specific events or trends, changes in interest rates and credit quality. The inputs or methodology used for valuing securities are not necessarily an indication of the risks associated with investing in those securities. Changes in valuation techniques and related inputs may result in transfers into or out of an assigned level within the disclosure hierarchy.
The following is a summary of the values by input classification of the fund's investments as of January 31, 2016, by major security category or type:
| Total value at 1-31-16 |
Level 1 quoted price |
Level 2 significant observable inputs |
Level 3 significant unobservable inputs |
|||||||||||
| Corporate bonds | $615,739,014 | — | $615,739,014 | — | ||||||||||
| U.S. Government and Agency obligations | 25,913,877 | — | 25,913,877 | — | ||||||||||
| Foreign government obligations | 90,549,871 | — | 90,549,871 | — | ||||||||||
| Convertible bonds | 9,028,512 | — | 9,028,512 | — | ||||||||||
| Term loans | 300,033,838 | — | 300,033,838 | — | ||||||||||
| Collateralized mortgage obligations | 222,161,818 | — | 222,161,818 | — | ||||||||||
| Asset backed securities | 56,706,134 | — | 56,706,134 | — | ||||||||||
| Common stocks | 1,589,683 | $1,589,683 | — | — | ||||||||||
| Preferred securities | 600,400 | 600,400 | — | — | ||||||||||
| Short-term investments | 36,815,063 | 36,337,312 | 477,751 | — | ||||||||||
| Total investments in securities | $1,359,138,210 | $38,527,395 | $1,320,610,815 | — | ||||||||||
| Other financial instruments: | ||||||||||||||
| Futures | ($11,227,460 | ) | ($11,227,460 | ) | — | — | ||||||||
| Forward foreign currency contracts | (874,512 | ) | — | ($874,512 | ) | — | ||||||||
| Interest rate swaps | (252,765 | ) | — | (252,765 | ) | — | ||||||||
| Credit default swaps | (1,014,515 | ) | — | (1,014,515 | ) | — |
Repurchase agreements. The fund may enter into repurchase agreements. When the fund enters into a repurchase agreement, it receives collateral that is held in a segregated account by the fund's custodian. The collateral amount is marked-to-market and monitored on a daily basis to ensure that the collateral held is in an amount not less than the principal amount of the repurchase agreement plus any accrued interest. Collateral received by the fund for repurchase agreements is disclosed in the Fund's investments as part of the caption related to the repurchase agreement.
Repurchase agreements are typically governed by the terms and conditions of the Master Repurchase Agreement and/or Global Master Repurchase Agreement (collectively, MRA). Upon an event of default, the non-defaulting party may close out all transactions traded under the MRA and net amounts owed. Absent an event of default, assets and liabilities resulting from repurchase agreements are not offset in the Statement of assets and liabilities. In the event of a default by the counterparty, realization of the collateral proceeds could be delayed, during which time the collateral value may decline or the counterparty may have insufficient assets to pay back claims resulting from close-out of the transactions.
When-issued/delayed-delivery securities. The fund may purchase or sell debt securities on a when-issued or delayed-delivery basis, or in a "To Be Announced" (TBA) or "forward commitment" transaction, with delivery or payment to occur at a later date beyond the normal settlement period. TBA securities resulting from these transactions are included in the Fund's investments or in a schedule to the Fund's investments (Sale Commitments Outstanding). At the time the fund enters into a commitment to purchase or sell a security, the transaction is recorded and the value of the security is reflected in the fund's net asset value. The price of such security and the date that the security will be delivered and paid for are fixed at the time the
transaction is negotiated. The value of the security may vary with market fluctuations. No interest accrues to the fund until settlement takes place. At the time that the fund enters into this type of transaction, the fund is required to have sufficient cash and/or liquid securities to cover its commitments.
Certain risks may arise upon entering into when-issued or delayed-delivery securities transactions, including the potential inability of counterparties to meet the terms of their contracts, and the issuer's failure to issue the securities due to political, economic or other factors. Additionally, losses may arise due to declines in the value of the securities purchased or increase in the value of securities sold prior to settlement date.
Term loans (Floating rate loans). The fund may invest in term loans, which often include debt securities that are rated below investment grade at the time of purchase. Term loans are generally subject to legal or contractual restrictions on resale and generally have longer settlement periods than conventional debt securities. Term loans involve special types of risk, including credit risk, interest-rate risk, counterparty risk, risk associated with extended settlement, and the risks of being a lender. The liquidity of term loans, including the volume and frequency of secondary market trading in such loans, varies significantly over time and among individual loans. During periods of infrequent trading, valuing a term loan can be more difficult and buying and selling a term loan at an acceptable price can be more difficult and delayed, which could result in a loss.
The fund's ability to receive payments of principal, interest and other amounts in connection with term loans will depend primarily on the financial condition of the borrower. The fund's failure to receive scheduled payments on a term loan due to a default, bankruptcy or other reason would adversely affect the fund's income and would likely reduce the value of its assets. Transactions in loan investments typically take a significant amount of time (i.e., seven days or longer) to settle. This could pose a liquidity risk to the fund and, if the fund's exposure to such investments is substantial, could impair the fund's ability to meet redemptions. Because term loans generally are not rated by independent credit rating agencies, a decision to invest in a particular loan could depend exclusively on the subadvisor's credit analysis of the borrower and/or term loan agents. There is greater risk that the fund may have limited rights to enforce the terms of an underlying loan than for other types of debt instruments.
Security transactions and related investment income. Investment security transactions are accounted for on a trade date plus one basis for daily net asset value calculations. However, for financial reporting purposes, investment transactions are reported on trade date. Interest income is accrued as earned. Interest income includes coupon interest and amortization/accretion of premiums/discounts on debt securities. Debt obligations may be placed in a non-accrual status and related interest income may be reduced by stopping current accruals and writing off interest receivable when the collection of all or a portion of interest has become doubtful. Dividend income is recorded on the ex-date, except for dividends of foreign securities where the dividend may not be known until after the ex-date. In those cases, dividend income, net of withholding taxes, is recorded when the fund becomes aware of the dividends. Gains and losses on securities sold are determined on the basis of identified cost and may include proceeds from litigation.
Foreign currency translation. Assets, including investments and liabilities denominated in foreign currencies, are translated into U.S. dollar values each day at the prevailing exchange rate. Purchases and sales of securities, income and expenses are translated into U.S. dollars at the prevailing exchange rate on the date of the transaction. The effect of changes in foreign currency exchange rates on the value of securities is reflected as a component of the realized and unrealized gains (losses) on investments.
Funds that invest internationally generally carry more risk than funds that invest strictly in U.S. securities. These risks are heightened for investments in emerging markets. Risks can result from differences in economic and political conditions, regulations, market practices (including higher transaction costs), accounting standards and other factors. Foreign investments are also subject to a decline in the value of a foreign currency versus the U.S. dollar, which reduces the dollar value of securities denominated in that currency.
Line of credit. The fund may borrow from banks for temporary or emergency purposes, including meeting redemption requests that otherwise might require the untimely sale of securities. Pursuant to the fund's custodian agreement, the
custodian may loan money to the fund to make properly authorized payments. The fund is obligated to repay the custodian for any overdraft, including any related costs or expenses. The custodian may have a lien, security interest or security entitlement in any fund property that is not otherwise segregated or pledged, to the extent of any overdraft, and to the maximum extent permitted by law.
The fund and other affiliated funds have entered into a syndicated line of credit agreement, with Citibank, N.A. (Citibank) as the administrative agent, that enables them to participate in a $750 million unsecured committed line of credit. A commitment fee, payable at the end of each calendar quarter, based on the average daily unused portion of the effective line of credit, is charged to each participating fund on a pro rata basis and is reflected in Other expenses on the Statement of operations. Commitment fees for the six months ended January 31, 2016 were $682. The fund had no borrowings under the line of credit.
Expenses. Within the John Hancock group of funds complex, expenses that are directly attributable to an individual fund are allocated to such fund. Expenses that are not readily attributable to a specific fund are allocated among all funds in an equitable manner, taking into consideration, among other things, the nature and type of expense and the fund's relative net assets. Expense estimates are accrued in the period to which they relate and adjustments are made when actual amounts are known.
Class allocations. Income, common expenses and realized and unrealized gains (losses) are determined at the fund level and allocated daily to each class of shares based on the net assets of the class. Class-specific expenses, such as distribution and service fees, if any, and transfer agent fees, are calculated daily for each class, based on the net asset value of the class and the applicable specific expense rates.
Federal income taxes. The fund intends to continue to qualify as a regulated investment company by complying with the applicable provisions of the Internal Revenue Code and will not be subject to federal income tax on taxable income that is distributed to shareholders. Therefore, no federal income tax provision is required.
For federal income tax purposes, as of July 31, 2015, the fund has a short-term capital loss carryforward of $23,605,469 and a long-term capital loss carryforward of $16,087,476 available to offset future net realized capital gains. These carryforwards do not expire.
As of July 31, 2015, the fund had no uncertain tax positions that would require financial statement recognition, derecognition or disclosure. The fund's federal tax returns are subject to examination by the Internal Revenue Service for a period of three years.
Distribution of income and gains. Distributions to shareholders from net investment income and net realized gains, if any, are recorded on the ex-date. The fund generally declares dividends daily and pays them monthly. Capital gain distributions, if any, are distributed at least annually.
Distributions paid by the fund with respect to each class of shares are calculated in the same manner, at the same time and in the same amount, except for the effect of class level expenses that may be applied differently to each class.
Such distributions, on a tax basis, are determined in conformity with income tax regulations, which may differ from US GAAP.
Capital accounts within the financial statements are adjusted for permanent book-tax differences. These adjustments have no impact on net assets or the results of operations. Temporary book-tax differences, if any, will reverse in a subsequent period. Book-tax differences are primarily attributable to foreign currency transactions, derivative transactions, wash sale loss deferrals and amortization and accretion on debt securities.
Note 3 — Derivative instruments
The fund may invest in derivatives in order to meet its investment objective. Derivatives include a variety of different instruments that may be traded in the OTC market, on a regulated exchange or through a clearing facility. The risks in using derivatives vary depending upon the structure of the instruments, including the use of leverage, optionality, the liquidity or lack of liquidity of the contract, the creditworthiness of the counterparty or clearing organization and the volatility of the
position. Some derivatives involve risks that are potentially greater than the risks associated with investing directly in the referenced securities or other referenced underlying instrument. Specifically, the fund is exposed to the risk that the counterparty to an OTC derivatives contract will be unable or unwilling to make timely settlement payments or otherwise honor its obligations. OTC derivatives transactions typically can only be closed out with the other party to the transaction.
Forward foreign currency contracts and certain swaps are typically traded through the OTC market. Certain forwards and swaps are regulated by the Commodity Futures Trading Commission (the CFTC) as swaps. Derivative counterparty risk is managed through an ongoing evaluation of the creditworthiness of all potential counterparties and, if applicable, designated clearing organizations. The fund attempts to reduce its exposure to counterparty risk for derivatives traded in the OTC market, whenever possible, by entering into an International Swaps and Derivatives Association (ISDA) Master Agreement with each of its OTC counterparties. The ISDA gives each party to the agreement the right to terminate all transactions traded under the agreement if there is certain deterioration in the credit quality or contractual default of the other party, as defined in the ISDA. Upon an event of default or a termination of the ISDA, the non-defaulting party has the right to close out all transactions and to net amounts owed.
As defined by the ISDA, the fund may have collateral agreements with certain counterparties to mitigate counterparty risk on OTC derivatives. Subject to established minimum levels, collateral for OTC transactions is generally determined based on the net aggregate unrealized gain or loss on contracts with a particular counterparty. Collateral pledged to the fund is held in a segregated account by a third-party agent or held by the custodian bank for the benefit of the fund and can be in the form of cash or debt securities issued by the U.S. government or related agencies; collateral posted by the fund for OTC transactions is held in a segregated account at the fund's custodian and is noted in the accompanying Fund's investments, or if cash is posted, on the Statement of assets and liabilities. The fund's maximum risk of loss due to counterparty risk is equal to the asset value of outstanding contracts offset by collateral received.
Futures and cleared swaps are traded or cleared on an exchange or central clearinghouse. Exchange-traded or cleared transactions generally present less counterparty risk to a fund than OTC transactions. The exchange or clearinghouse stands between the fund and the broker to the contract and therefore, credit risk is generally limited to the failure of the exchange or clearinghouse and the clearing member.
Cleared swap contracts are subject to clearinghouse rules, including initial and variation margin requirements, daily settlement of obligations and the clearinghouse guarantee of payments to the broker. There is, however, still counterparty risk due to the potential insolvency of the broker with respect to any margin held in the brokers' customer accounts. While clearing members are required to segregate customer assets from their own assets, in the event of insolvency, there may be a shortfall in the amount of margin held by the broker for its clients. Collateral or margin requirements for exchange-traded or cleared derivatives are set by the broker or applicable clearinghouse. Margin for exchange-traded and exchange-cleared transactions are detailed in the Statement of assets and liabilities as Cash held at broker for futures contracts and Receivable for exchange cleared swaps, respectively. Securities pledged by the fund for exchange-traded and cleared transactions, if any, are identified in the Fund's investments.
Futures. A futures contract is a contractual agreement to buy or sell a particular currency or financial instrument at a pre-determined price in the future. Risks related to the use of futures contracts include possible illiquidity of the futures markets, contract prices that can be highly volatile and imperfectly correlated to movements in the underlying financial instrument and potential losses in excess of the amounts recognized on the Statement of assets and liabilities. Use of long futures contracts subjects the fund to the risk of loss up to the notional value of the futures contracts. Use of short futures contracts subjects the fund to unlimited risk of loss.
Upon entering into a futures contract, the fund is required to deposit initial margin with the broker in the form of cash or securities. The amount of required margin is generally based on a percentage of the contract value; this amount is the initial margin for the trade. The margin deposit must then be maintained at the established level over the life of the contract. Futures margin receivable / payable is included on the Statement of assets and liabilities. Futures contracts are marked-to-market daily and an appropriate payable or receivable for the change in value (variation margin) and unrealized gain or loss is
recorded by the fund. When the contract is closed, the fund records a realized gain or loss equal to the difference between the value of the contract at the time it was opened and the value at the time it was closed.
During the six months ended January 31, 2016, the fund used futures contracts to manage duration of the fund. The fund held futures contracts with notional values ranging from $419.3 million to $496.0 million, as measured at each quarter end. The following table summarizes the contracts held at January 31, 2016:
| Open contracts | Number of contracts |
Position | Expiration date |
Notional basis |
Notional value |
Unrealized appreciation (depreciation) |
||||||||||||||
| 2-Year U.S. Treasury Note Futures | 170 | Long | Mar 2016 | $36,994,236 | $37,166,250 | $172,014 | ||||||||||||||
| 5-Year U.S. Treasury Note Futures | 767 | Short | Mar 2016 | (90,891,335 | ) | (92,555,328 | ) | (1,663,993 | ) | |||||||||||
| 10-Year U.S. Treasury Note Futures | 2,045 | Short | Mar 2016 | (259,124,302 | ) | (264,987,266 | ) | (5,862,964 | ) | |||||||||||
| Ultra U.S. Treasury Bond Futures | 492 | Short | Mar 2016 | (77,891,733 | ) | (81,764,250 | ) | (3,872,517 | ) | |||||||||||
| ($11,227,460 | ) |
Notional basis refers to the contractual amount agreed upon at inception of open contracts; notional value represents the current value of the open contract.
Forward foreign currency contracts. A forward foreign currency contract is an agreement between two parties to buy and sell specific currencies at a price that is set on the date of the contract. The forward contract calls for delivery of the currencies on a future date that is specified in the contract. Risks related to the use of forwards include the possible failure of counterparties to meet the terms of the forward agreement, the failure of the counterparties to timely post collateral if applicable, the risk that currency movements will not favor the fund thereby reducing the fund's total return, and the potential for losses in excess of the amounts recognized on the Statement of assets and liabilities.
The market value of a forward foreign currency contract fluctuates with changes in foreign currency exchange rates. Forward foreign currency contracts are marked-to-market daily and the change in value is recorded by the fund as an unrealized gain or loss. Realized gains or losses, equal to the difference between the value of the contract at the time it was opened and the value at the time it was closed, are recorded upon delivery or receipt of the currency or settlement with the counterparty.
During the six months ended January 31, 2016, the fund used forward foreign currency contracts to manage against anticipated changes in currency exchange rates and to gain exposure to foreign currency. The fund held forward foreign currency contracts with U.S. Dollar notional values ranging from $78.6 million to $136.5 million, as measured at each quarter end. The following table summarizes the contracts held at January 31, 2016:
| Contract to buy | Contract to sell | Counterparty | Contractual settlement date |
Unrealized appreciation |
Unrealized depreciation |
Net unrealized appreciation/ (depreciation) | ||||||||||||||||||||||||||
| CAD | 27,300,000 | USD | 18,899,161 | JPMorgan Chase Bank N.A. | 2/22/2016 | $588,261 | — | $588,261 | ||||||||||||||||||||||||
| GBP | 33,224 | USD | 47,481 | JPMorgan Chase Bank N.A. | 2/5/2016 | — | ($140 | ) | (140 | ) | ||||||||||||||||||||||
| MXN | 594,039,400 | USD | 34,258,723 | Citibank N.A. | 2/8/2016 | — | (1,518,134 | ) | (1,518,134 | ) | ||||||||||||||||||||||
| USD | 1,852,034 | COP | 6,072,355,800 | Citibank N.A. | 2/16/2016 | 4,221 | — | 4,221 | ||||||||||||||||||||||||
| USD | 7,361,714 | EUR | 6,797,907 | JPMorgan Chase Bank N.A. | 2/5/2016 | — | (2,985 | ) | (2,985 | ) | ||||||||||||||||||||||
| USD | 3,120,555 | GBP | 2,126,894 | JPMorgan Chase Bank N.A. | 2/5/2016 | 89,935 | — | 89,935 | ||||||||||||||||||||||||
| USD | 13,014,458 | GBP | 9,158,417 | Citibank N.A. | 2/22/2016 | — | (35,670 | ) | (35,670 | ) | ||||||||||||||||||||||
| $682,417 | ($1,556,929 | ) | ($874,512 | ) | ||||||||||||||||||||||||||||
| Currency abbreviations | |||
| CAD | Canadian Dollar | GBP | British Pound |
| COP | Colombian Peso | MXN | Mexican Dollar |
| EUR | Euro | USD | U.S. Dollar |
Swaps. Swap agreements are agreements between the fund and counterparty to exchange cash flows, assets, foreign currencies or market-linked returns at specified intervals. Swap agreements are privately negotiated in the OTC market (OTC swaps) or may be executed on a registered commodities exchange (centrally cleared swaps). Swaps are marked-to-market
daily and the change in value is recorded as a component of unrealized appreciation/depreciation of swap contracts. The value of the swap will typically impose collateral posting obligations on the party that is considered out-of-the-money on the swap.
Upfront payments made/received by the fund are amortized/accreted for financial reporting purposes, with the unamortized/unaccreted portion included in the Statement of assets and liabilities. A termination payment by the counterparty or the fund is recorded as realized gain or loss, as well as the net periodic payments received or paid by the fund.
Entering into swap agreements involves, to varying degrees, elements of credit, market and documentation risk that may amount to values that are in excess of the amounts recognized on the Statement of assets and liabilities. Such risks involve the possibility that there will be no liquid market for the swap, or that a counterparty may default on its obligation or delay payment under the swap terms. The counterparty may disagree or contest the terms of the swap. Market risks may also accompany the swap, including interest rate risk. The fund may also suffer losses if it is unable to terminate or assign outstanding swaps or reduce its exposure through offsetting transactions.
Interest rate swaps. Interest rate swaps represent an agreement between the fund and a counterparty to exchange cash flows based on the difference between two interest rates applied to a notional amount. The payment flows are usually netted against each other, with the difference being paid by one party to the other. The fund settles accrued net interest receivable or payable under the swap contracts at specified, future intervals.
During the six months ended January 31, 2016, the fund used interest rate swaps to manage duration of the fund. The fund held interest rate swaps with total USD notional amounts ranging up to $7.3 million, as measured at each quarter end. The following table summarizes the interest rate swap contracts held as of January 31, 2016:
| USD notional amount |
Payments made by fund |
Payments received by fund |
Maturity date |
Unamortized upfront payment paid (received) |
Unrealized appreciation (depreciation) |
Market value |
|||||||||||||||||
| Exchange Cleared Swaps | |||||||||||||||||||||||
| $2,697,376 | Fixed 1.4625% | 3 Month LIBOR (a) | Aug 2016 | — | ($84,575 | ) | ($84,575 | ) | |||||||||||||||
| 4,592,923 | Fixed 0.875% | 3 Month LIBOR (a) | Jul 2017 | — | (168,190 | ) | (168,190 | ) | |||||||||||||||
| $7,290,299 | — | ($252,765 | ) | ($252,765 | ) | ||||||||||||||||||
(a) At 1-30-16, 3-month LIBOR was 0.61260%.
Credit default swaps. Credit default swaps (CDS) involve the exchange of a fixed rate premium (paid by the Buyer), for protection against the loss in value of an underlying debt instrument, referenced entity or index, in the event of a defined credit event (such as payment default or bankruptcy). Under the terms of the swap, one party acts as a "guarantor" (the Seller), receiving the premium and agreeing to contingent payments that are specified within the credit default agreement. The fund may enter into CDS in which it may act as either Buyer or Seller. By acting as the Seller, the fund may incur economic leverage since it would be obligated to pay the Buyer the notional amount of the contract in the event of a default. The amount of loss in such case could be significant, but would typically be reduced by any recovery value on the underlying credit.
During the six months ended January 31, 2016, the fund used CDS as a Buyer of protection to manage against potential credit events. The fund held credit default swap contracts with total USD notional amounts ranging from $33.4 million to $69.0 million, as measured at each quarter end. The following table summarizes the credit default swap contracts the fund held as of January 31, 2016 as a Buyer of protection:
| Counterparty | Reference obligation |
USD notional amount |
(Pay)/ received fixed rate |
Maturity date |
Unamortized upfront payment paid (received) |
Unrealized appreciation (depreciation) |
Market value |
||||||||||||||||||||||
| Citibank N.A. | CDX.HY.NA.25 | $69,000,000 | (0.005%) | Dec 2020 | ($1,308,789 | ) | $1,046,546 | ($262,243 | ) | ||||||||||||||||||||
| $69,000,000 | ($1,308,789 | ) | $1,046,546 | ($262,243 | ) |
Implied credit spreads are utilized in determining the market value of CDS agreements in which the fund is the Seller at period end. The implied credit spread generally represents the yield of the instrument above a credit-risk free rate, such as the
U.S. Treasury Bond Yield, and may include upfront payments required to be made to enter into the agreement. It also serves as an indicator of the current status of the payment/performance risk and represents the likelihood or risk of default for the credit derivative. Wider credit spreads represent a deterioration of the referenced entity's creditworthiness and an increased risk of default or other credit event occurring as defined under the terms of the agreement.
For CDS agreements where implied credit spreads are not reported or available, the average credit rating on the underlying index is shown. Increasing market values, in absolute terms when compared to the notional amount of the swap, represent a deterioration of the referenced entity's creditworthiness and a greater likelihood of a credit event occurring. This is also represented by a decrease in the average credit rating of the underlying index. The maximum potential amount of future payments (undiscounted) that a fund as the Seller could be required to make under any CDS agreement equals the notional amount of the agreement.
The fund used CDS as a Seller of protection during the six months ended January 31, 2016 to take a long exposure to the benchmark credit. The fund acted as Seller on credit default swap contracts with total USD notional amounts ranging from $12.9 million to $67.5 million, as measured at each quarter end. The following table summarizes the credit default swap contracts the fund held as of January 31, 2016 where the fund acted as a Seller of protection:
| Counterparty | Reference obligation |
Implied credit spread at 1-31-16 |
Currency | USD notional amount |
(Pay)/ receive fixed rate |
Maturity date |
Unamortized upfront payment paid (received) |
Unrealized appreciation (depreciation) |
Market value |
||||||||||||||||||||
| Citibank N.A. | CMBX.AAA.CDS.S7 | 1.13% | USD | $5,850,000 | 0.500% | Jan 2047 | ($251,221 | ) | ($8,718 | ) | ($259,939 | ) | |||||||||||||||||
| Citibank N.A. | CMBX AA.CDS1.S7 Deal/Short |
2.54% | USD | 7,000,000 | 1.500% | Jan 2047 | (147,058 | ) | (345,275 | ) | (492,333 | ) | |||||||||||||||||
| $12,850,000 | ($398,279 | ) | ($353,993 | ) | ($752,272 | ) |
Fair value of derivative instruments by risk category
The table below summarizes the fair value of derivatives held by the fund at January 31, 2016 by risk category:
| Risk | Statement of assets and liabilities location |
Financial instruments location |
Asset derivatives fair value |
Liabilities derivatives fair value |
||||||||||
| Interest rate | Receivable/payable for futures | Futures† | $172,014 | ($11,399,474 | ) | |||||||||
| Foreign currency | Unrealized appreciation/depreciation for forward foreign currency exchange contracts |
Forward foreign currency contracts |
682,417 | (1,556,929 | ) | |||||||||
| Interest rate | Swap contracts, at value | Interest rate swaps^ | — | (252,765 | ) | |||||||||
| Credit | Swap contracts, at value | Credit default swaps | — | (1,014,515 | ) | |||||||||
| $854,431 | ($14,223,683 | ) |
† Reflects cumulative appreciation/depreciation on futures. Only the period end variation margin is separately disclosed on the Statement of assets and liabilities.
^ Reflects cumulative appreciation/depreciation on swap contracts. Year end variation margin for centrally cleared swaps and value of OTC swaps are shown separately on the Statement of assets and liabilities.
For financial reporting purposes, the fund does not offset OTC derivative assets or liabilities that are subject to master netting arrangements, as defined by the ISDAs, in the Statement of assets and liabilities. In the event of default by the counterparty or a termination of the agreement, the ISDA allows an offset of amounts across the various transactions between the fund and the applicable counterparty.
Effect of derivative instruments on the Statement of operations
The table below summarizes the net realized gain (loss) included in the net increase (decrease) in net assets from operations, classified by derivative instrument and risk category, for the six months ended January 31, 2016:
| Statement of operations location — Net realized gain (loss) on: | ||||||||||||||
| Risk | Futures contracts |
Investments in unaffiliated issuers and foreign currency transactions* |
Swap contracts |
Total | ||||||||||
| Interest rate | ($1,649,678 | ) | — | ($71,725 | ) | ($1,721,403 | ) | |||||||
| Foreign currency | — | ($999,410 | ) | — | (999,410 | ) | ||||||||
| Credit | — | — | 1,091,107 | 1,091,107 | ||||||||||
| Total | ($1,649,678 | ) | ($999,410 | ) | $1,019,382 | ($1,629,706 | ) | |||||||
*Realized gain/loss associated with forward foreign currency contracts is included in this caption on the Statement of operations.
The table below summarizes the net change in unrealized appreciation (depreciation) included in the net increase (decrease) in net assets from operations, classified by derivative instrument and risk category, for the six months ended January 31, 2016:
| Statement of operations location - Change in unrealized appreciation (depreciation) | ||||||||||||||
| Risk | Futures contracts |
Investments in unaffiliated issuers and translation of assets and liabilities in foreign currencies* |
Swap contracts |
Total | ||||||||||
| Interest rate | ($10,040,452 | ) | — | ($317,322 | ) | ($10,357,774 | ) | |||||||
| Foreign currency | — | ($102,300 | ) | — | (102,300 | ) | ||||||||
| Credit | — | — | (1,309,142 | ) | (1,309,142 | ) | ||||||||
| Total | ($10,040,452 | ) | ($102,300 | ) | ($1,626,464 | ) | ($11,769,216 | ) | ||||||
*Change in unrealized appreciation/depreciation associated with forward foreign currency contracts is included in this caption on the Statement of operations.
Note 4 — Guarantees and indemnifications
Under the Trust's organizational documents, its Officers and Trustees are indemnified against certain liabilities arising out of the performance of their duties to the Trust, including the fund. Additionally, in the normal course of business, the fund enters into contracts with service providers that contain general indemnification clauses. The fund's maximum exposure under these arrangements is unknown, as this would involve future claims that may be made against the fund that have not yet occurred. The risk of material loss from such claims is considered remote.
Note 5 — Fees and transactions with affiliates
John Hancock Advisers, LLC (the Advisor) serves as investment advisor for the fund. John Hancock Funds, LLC (the Distributor), an affiliate of the Advisor, serves as principal underwriter of the fund. The Advisor and the Distributor are indirect, wholly owned subsidiaries of Manulife Financial Corporation (MFC).
Management fee. The fund has an investment management agreement with the Advisor under which the fund pays a daily management fee to the Advisor, equivalent on an annual basis to the sum of: a) 0.740% of the first $250 million of the fund's average daily net assets, b) 0.700% of the next $500 million of the fund's average daily net assets and c) 0.675% of the fund's average daily net assets in excess of $750 million. The fund has a subadvisory agreement with Stone Harbor Investments Partners LP. The fund is not responsible for payment of the subadvisory fees.
The Advisor has contractually agreed to waive a portion of its management fee and/or reimburse expenses for certain funds of the John Hancock group of funds complex, including the fund (the participating portfolios). This waiver is based upon aggregate net assets of all the participating portfolios. The amount of the reimbursement is calculated daily and allocated
among all the participating portfolios in proportion to the daily net assets of each fund. During the six months ended January 31, 2016, this waiver amounted to 0.01% of the fund's average net assets (on an annualized basis). This arrangement may be amended or terminated at any time by the Advisor upon notice to the fund and with the approval of the Board of Trustees.
The Advisor contractually agrees to reduce its management fee or, if necessary, make payments to the fund, in an amount equal to the amount by which expenses of Class A and Class I shares, as applicable, exceed 1.21%, or 0.90%, respectively, of average annual net assets (on an annualized basis) of the class. For purposes of this agreement, "expenses of Class A and Class I shares" means all expenses of the applicable class (including fund expenses attributable to the class), excluding (a) taxes; (b) portfolio brokerage commissions; (c) interest expense; (d) litigation and indemnification expenses and other extraordinary expenses not incurred in the ordinary course of the fund's business; (e) underlying fund expenses (acquired fund fees); and (f) short dividend expense. This agreement expires on November 30, 2016, unless renewed by mutual agreement of the fund and the advisor based upon a determination that this is appropriate under the circumstances at that time. Prior to December 1, 2015, the Advisor contractually agreed to reduce its management fee in an amount equal to the amount by which expenses for Class C shares exceeded 2.00% of average annual net assets.
The Advisor contractually agrees to waive and/or reimburse all class-specific expenses for Class R6 shares to the extent they exceed 0.00% of average annual net assets (on an annualized basis) attributable to the class. This agreement expires on November 30, 2016, unless renewed by mutual agreement of the fund and the Advisor based upon a determination that this is appropriate under the circumstances at that time.
The Advisor voluntarily agreed to reduce its management fee for the fund, or if necessary make payment to the fund, in an amount equal to the amount by which the expenses of the fund exceed 0.15% of the average annual net assets (on an annualized basis) of the fund. For purposes of this agreement, "expenses of the fund" means all the fund expenses, excluding (a) taxes, (b) brokerage commissions, (c) interest expense, (d) litigation and indemnification expenses and other extraordinary expenses not incurred in the ordinary course of the fund's business, (e) advisory fees, (f) Rule 12b-1 fees, (g) transfer agency fees and service fees, (h) underlying fund expenses (acquired fund fees) and (i) short dividend expense. This agreement will continue in effect until terminated at any time by the Advisor on notice to the fund.
For the six months ended January 31, 2016, the expense reductions described above amounted to the following:
| Class | Expense reduction | Class | Expense reduction | |
| Class A | $939 | Class R4 | $4 | |
| Class C | 104 | Class R6 | 18 | |
| Class I | 959 | Class NAV | 50,297 | |
| Class R2 | 4 | Total | $52,325 |
The investment management fees, including the impact of the waivers and reimbursements as described above, incurred for the six months ended January 31, 2016 were equivalent to a net annual effective rate of 0.69% of the fund's average daily net assets.
Accounting and legal services. Pursuant to a service agreement, the fund reimburses the Advisor for all expenses associated with providing the administrative, financial, legal, accounting and recordkeeping services to the fund, including the preparation of all tax returns, periodic reports to shareholders and regulatory reports, among other services. These expenses are allocated to each share class based on its relative net assets at the time the expense was incurred. These accounting and legal services fees incurred for the six months ended January 31, 2016 amounted to an annual rate of 0.01% of the fund's average daily net assets.
Distribution and service plans. The fund has a distribution agreement with the Distributor. The fund has adopted distribution and service plans with respect to Class A, Class C, Class R2 and Class R4 shares pursuant to Rule 12b-1 under the 1940 Act, to pay the Distributor for services provided as the distributor of shares of the fund. In addition, under a service plan for Class R2 and Class R4 shares, the fund pays for certain other services. The fund may pay up to the following contractual
rates of distribution and service fees under these arrangements, expressed as an annual percentage of average daily net assets for each class of the fund's shares:
| Class | Rule 12b-1 fee | Service fee | Class | Rule 12b-1 fee | Service fee | |
| Class A | 0.30% | — | Class R2 | 0.25% | 0.25% | |
| Class C | 1.00% | — | Class R4 | 0.25% | 0.10% |
The fund's Distributor has contractually agreed to waive 0.10% of Rule 12b-1 fees for Class R4 shares. The current waiver agreement expires on November 30, 2016, unless renewed by mutual agreement of the fund and the Distributor based upon a determination that this is appropriate under the circumstances at the time. This contractual waiver amounted to $48 for Class R4 shares for the six months ended January 31, 2016.
Sales charges. Class A shares are assessed up-front sales charges, which resulted in payments to the Distributor amounting to $87,148 for the six months ended January 31, 2016. Of this amount, $19,419 was retained and used for printing prospectuses, advertising, sales literature and other purposes, $67,608 was paid as sales commissions to broker-dealers and $121 was paid as sales commissions to sales personnel of Signator Investors, Inc., a broker-dealer affiliate of the Advisor.
Class A and Class C shares may be subject to contingent deferred sales charges (CDSCs). Certain Class A shares that are acquired through purchases of $1 million or more and are redeemed within one year of purchase are subject to a 1.00% sales charge. Class C shares that are redeemed within one year of purchase are subject to a 1.00% CDSC. CDSCs are applied to the lesser of the current market value at the time of redemption or the original purchase cost of the shares being redeemed. Proceeds from CDSCs are used to compensate the Distributor for providing distribution-related services in connection with the sale of these shares. During the six months ended January 31, 2016, CDSCs received by the Distributor amounted to $6,813 and $944 for Class A and Class C shares, respectively.
Transfer agent fees. The fund has a transfer agent agreement with John Hancock Signature Services, Inc. (Signature Services), an affiliate of the Advisor. The transfer agent fees paid to Signature Services are determined based on the cost to Signature Services (Signature Services Cost) of providing recordkeeping services. It also includes out-of-pocket expenses, including payments made to third-parties for recordkeeping services provided to their clients who invest in one or more John Hancock funds. In addition, Signature Services Cost may be reduced by certain fees that Signature Services receives in connection with retirement and small accounts. Signature Services Cost is calculated monthly and allocated, as applicable, to five categories of share classes: Retail Share and Institutional Share Classes of Non-Municipal Bond Funds, Class R6 Shares, Retirement Share Classes and Municipal Bond Share Classes. Within each of these categories, the applicable costs are allocated to the affected John Hancock affiliated funds and/or classes, based on the relative average daily net assets.
Class level expenses. Class level expenses for the six months ended January 31, 2016 were:
| Class | Distribution and service fees | Transfer agent fees |
| Class A | $38,629 | $15,864 |
| Class C | 14,138 | 1,740 |
| Class I | — | 14,201 |
| Class R2 | 120 | 8 |
| Class R4 | 120 | 8 |
| Class R6 | — | 12 |
| Total | $53,007 | $31,833 |
Trustee expenses. The fund compensates each Trustee who is not an employee of the Advisor or its affiliates. The costs of paying Trustee compensation and expenses are allocated to each fund based on its net assets relative to other funds within the John Hancock group of funds complex.
Note 6 — Fund share transactions
Transactions in fund shares for the six months ended January 31, 2016 and the year ended July 31, 2015 were as follows:
| Six months ended 1-31-16 | Year ended 7-31-15 | |||||||||||||||||||||||||
| Shares | Amount | Shares | Amount | |||||||||||||||||||||||
| Class A shares | ||||||||||||||||||||||||||
| Sold | 2,822,420 | $26,733,712 | 3,597,167 | $35,808,943 | ||||||||||||||||||||||
| Distributions reinvested | 53,351 | 502,505 | 65,649 | 653,652 | ||||||||||||||||||||||
| Repurchased | (2,807,666 | ) | (26,619,526 | ) | (2,702,630 | ) | (26,876,002 | ) | ||||||||||||||||||
| Net increase | 68,105 | $616,691 | 960,186 | $9,586,593 | ||||||||||||||||||||||
| Class C shares | ||||||||||||||||||||||||||
| Sold | 174,472 | $1,655,385 | 239,839 | $2,394,102 | ||||||||||||||||||||||
| Distributions reinvested | 5,029 | 47,302 | 3,489 | 34,663 | ||||||||||||||||||||||
| Repurchased | (84,461 | ) | (796,266 | ) | (82,240 | ) | (816,684 | ) | ||||||||||||||||||
| Net increase | 95,040 | $906,421 | 161,088 | $1,612,081 | ||||||||||||||||||||||
| Class I shares | ||||||||||||||||||||||||||
| Sold | 1,168,197 | $11,047,005 | 3,627,223 | $36,285,716 | ||||||||||||||||||||||
| Distributions reinvested | 59,092 | 556,116 | 86,076 | 855,367 | ||||||||||||||||||||||
| Repurchased | (1,378,500 | ) | (12,973,905 | ) | (2,739,695 | ) | (27,265,331 | ) | ||||||||||||||||||
| Net increase (decrease) | (151,211 | ) | ($1,370,784 | ) | 973,604 | $9,875,752 | ||||||||||||||||||||
| Class R2 shares1 | ||||||||||||||||||||||||||
| Sold | — | — | 10,070 | $100,000 | ||||||||||||||||||||||
| Net increase | — | — | 10,070 | $100,000 | ||||||||||||||||||||||
| Class R4 shares1 | ||||||||||||||||||||||||||
| Sold | — | — | 10,070 | $100,000 | ||||||||||||||||||||||
| Net increase | — | — | 10,070 | $100,000 | ||||||||||||||||||||||
| Class R6 shares1 | ||||||||||||||||||||||||||
| Sold | 85,882 | $792,626 | 10,070 | $100,000 | ||||||||||||||||||||||
| Distributions reinvested | 123 | 1,128 | — | — | ||||||||||||||||||||||
| Repurchased | (1 | ) | (10 | ) | — | — | ||||||||||||||||||||
| Net increase | 86,004 | $793,744 | 10,070 | $100,000 | ||||||||||||||||||||||
| Class NAV shares | ||||||||||||||||||||||||||
| Sold | 3,430,688 | $32,631,969 | 7,684,729 | $76,894,773 | ||||||||||||||||||||||
| Distributions reinvested | 3,161,877 | 29,810,542 | 5,184,673 | 51,698,629 | ||||||||||||||||||||||
| Repurchased | (9,664,418 | ) | (91,484,180 | ) | (12,125,479 | ) | (121,068,010 | ) | ||||||||||||||||||
| Net increase (decrease) | (3,071,853 | ) | ($29,041,669 | ) | 743,923 | $7,525,392 | ||||||||||||||||||||
| Total net increase (decrease) | (2,973,915 | ) | ($28,095,597 | ) | 2,869,011 | $28,899,818 | ||||||||||||||||||||
1 The inception date for Class R2, Class R4 and Class R6 shares is 3-27-15.
Affiliates of the fund owned 100%, 100%, 10% and 100% of shares of beneficial interest of Class R2, Class R4, Class R6 and Class NAV shares, respectively, on January 31, 2016.
Note 7 — Purchase and sale of securities
Purchases and sales of securities, other than short-term investments, amounted to $306,903,487 and $352,957,075, respectively, for the six months ended January 31, 2016.
Note 8 — Investment by affiliated funds
Certain investors in the fund are affiliated funds that are managed by the Advisor and its affiliates. The affiliated funds do not invest in the fund for the purpose of exercising management or control; however, this investment may represent a significant portion of the fund's net assets. At January 31, 2016, funds within the John Hancock group of funds complex held 96.0% of the fund's net assets. The following funds had an affiliate ownership of 5% or more of the fund's net assets:
| Fund | Affiliate concentration |
| John Hancock Lifestyle Balanced Portfolio | 37.0% |
| John Hancock Lifestyle Growth Portfolio | 15.8% |
| John Hancock Lifestyle Moderate Portfolio | 13.3% |
| John Hancock Lifestyle Conservative Portfolio | 11.6% |
| John Hancock Alternative Asset Allocation Portfolio | 7.7% |
|
Trustees James M. Oates, Chairperson Officers Andrew G. Arnott John J. Danello Francis V. Knox, Jr. Charles A. Rizzo Salvatore Schiavone |
Investment advisor John Hancock Advisers, LLC Subadvisor Stone Harbor Investment Partners LP Principal distributor John Hancock Funds, LLC Custodian State Street Bank and Trust Company Transfer agent John Hancock Signature Services, Inc. Legal counsel K&L Gates LLP |
*Member of the Audit Committee
†Non-Independent Trustee
The fund's proxy voting policies and procedures, as well as the fund proxy voting record for the most recent twelve-month period ended June 30, are available free of charge on the Securities and Exchange Commission (SEC) website at sec.gov or on our website.
The fund's complete list of portfolio holdings, for the first and third fiscal quarters, is filed with the SEC on Form N-Q. The fund's Form N-Q is available on our website and the SEC's website, sec.gov, and can be reviewed and copied (for a fee) at the SEC's Public Reference Room in Washington, DC. Call 800-SEC-0330 to receive information on the operation of the SEC's Public Reference Room.
We make this information on your fund, as well as monthly portfolio holdings, and other fund details available on our website at jhinvestments.com or by calling 800-225-5291.
| You can also contact us: | |||
| 800-225-5291 jhinvestments.com |
Regular mail: John Hancock Signature Services, Inc. |
Express mail: John Hancock Signature Services, Inc. |
|
John Hancock family of funds
|
DOMESTIC EQUITY FUNDS Balanced Blue Chip Growth Classic Value Disciplined Value Disciplined Value Mid Cap Equity Income Fundamental All Cap Core Fundamental Large Cap Core Fundamental Large Cap Value New Opportunities Select Growth Small Cap Equity Small Cap Value Small Company Strategic Growth U.S. Equity U.S. Global Leaders Growth Value Equity GLOBAL AND INTERNATIONAL EQUITY FUNDS Disciplined Value International Emerging Markets Emerging Markets Equity Global Equity Global Shareholder Yield Greater China Opportunities International Core International Growth International Small Company International Value Equity |
INCOME FUNDS Bond California Tax-Free Income Core High Yield Emerging Markets Debt Floating Rate Income Focused High Yield Global Income Government Income High Yield Municipal Bond Income Investment Grade Bond Money Market Short Duration Credit Opportunities Spectrum Income Strategic Income Opportunities Tax-Free Bond ALTERNATIVE AND SPECIALTY FUNDS Absolute Return Currency Alternative Asset Allocation Enduring Assets Financial Industries Global Absolute Return Strategies Global Conservative Absolute Return Global Real Estate Natural Resources Redwood Regional Bank Seaport Technical Opportunities |
A fund's investment objectives, risks, charges, and expenses should be considered carefully before investing. The prospectus contains this and other important information about the fund. To obtain a prospectus, contact your financial professional, call John Hancock Investments at 800-225-5291, or visit our website at jhinvestments.com. Please read the prospectus carefully before investing or sending money.
|
ASSET ALLOCATION Income Allocation Fund Lifestyle Aggressive Portfolio Lifestyle Balanced Portfolio Lifestyle Conservative Portfolio Lifestyle Growth Portfolio Lifestyle Moderate Portfolio Retirement Choices Portfolios (2010-2055) Retirement Living Portfolios (2010-2055) Retirement Living II Portfolios (2010-2055) EXCHANGE-TRADED FUNDS John Hancock Multifactor Consumer Discretionary ETF John Hancock Multifactor Financials ETF John Hancock Multifactor Healthcare ETF John Hancock Multifactor Large Cap ETF John Hancock Multifactor Mid Cap ETF John Hancock Multifactor Technology ETF CLOSED-END FUNDS Financial Opportunities Hedged Equity & Income Income Securities Trust Investors Trust Preferred Income Preferred Income II Preferred Income III Premium Dividend Tax-Advantaged Dividend Income Tax-Advantaged Global Shareholder Yield |
"As an investment firm,
upholding the proud
tradition of John Hancock
comes down to one thing:
putting shareholders
first. We believe that if
our shareholders are
successful, then we will
be successful."
Andrew G. Arnott
President and Chief Executive Officer
John Hancock Investments
John Hancock Multifactor ETF shares are bought and sold at market
price (not NAV), and are not individually redeemed
from the fund. Brokerage commissions will reduce returns.
John Hancock ETFs are distributed by Foreside Fund Services, LLC, and
are subadvised by Dimensional Fund Advisors LP.
Foreside is not affiliated with John Hancock Funds, LLC or
Dimensional Fund Advisors LP.
Dimensional Fund Advisors LP receives compensation from John Hancock
in connection with licensing rights to the
John Hancock Dimensional indexes. Dimensional Fund Advisors LP does
not sponsor, endorse, or sell, and makes no
representation as to the advisability of investing in, John Hancock
Multifactor ETFs.
John Hancock Investments
A trusted brand
John Hancock Investments is a premier asset manager representing
one of America's most trusted brands, with a heritage of financial
stewardship dating back to 1862. Helping our shareholders pursue
their financial goals is at the core of everything we do. It's why we
support the role of professional financial advice and operate with the
highest standards of conduct and integrity.
A better way to invest
We build funds based on investor needs, then search the world to find
proven portfolio teams with specialized expertise in those strategies.
As a manager of managers, we apply vigorous oversight to ensure that
they continue to meet our uncompromising standards and serve the
best interests of our shareholders.
Results for investors
Our unique approach to asset management enables us to provide
a diverse set of investments backed by some of the world's best
managers, along with strong risk-adjusted returns across asset classes.
|
|
John Hancock Funds, LLC n Member FINRA, SIPC 601 Congress Street n Boston, MA 02210-2805 800-225-5291 n jhinvestments.com |
|
| This report is for the information of the shareholders of John Hancock Short Duration Credit Opportunities Fund. It is not authorized for distribution to prospective investors unless preceded or accompanied by a prospectus. | ||
| MF274542 | 350SA 1/16 3/16 |
|
John Hancock
Absolute Return Currency Fund
Semiannual report 1/31/16
A message to shareholders
Dear shareholder,
The six-month period has been a challenging time for all investors. Oil prices, having already dropped precipitously, continued to slide in the back half of 2015, and by January oil frequently traded at multi-year lows. Concerns about slowing global growth added to negative investor psychology, and stock prices fell steeply around the world. Stocks were not the only investment that faced headwinds; all risk assets struggled over the past six months and these types of declines are unsettling.
Although volatility returned in force to the markets, much of the global economic picture continues to move in the right direction. In December, the U.S. Federal Reserve raised short-term interest rates for the first time in nine years on the evidence that the persistent strength in the labor markets warranted a somewhat less accommodative stance. Central banks outside of the United States continue to signal that they would take action to support economies and markets. Additionally, there have been pockets of strength that helped the currency markets.
At John Hancock Investments, portfolio risk management is a critical part of our role as an asset manager, and our dedicated risk team is focused on these issues every day. We continually strive for new ways to analyze potential risks and have liquidity tools in place, such as a credit facility and an interfund lending program. In times like these, your best resource is your financial advisor, who can ensure your portfolio is sufficiently diversified to meet your long-term objectives and to withstand the inevitable bumps along the way.
On behalf of everyone at John Hancock Investments, I'd like to take this opportunity to thank you for the continued trust you've placed in us.
Sincerely,
Andrew G. Arnott
President and Chief Executive Officer
John Hancock Investments
This commentary reflects the CEO's views as of January 31, 2016. They are subject to change at any time. All investments entail risks, including the possible loss of principal. For more up-to-date information, you can visit our website at jhinvestments.com.
John Hancock
Absolute Return Currency Fund
INVESTMENT OBJECTIVE
The fund seeks to achieve absolute return from investments in currency markets.
AVERAGE ANNUAL TOTAL RETURNS AS OF 1/31/16 (%)
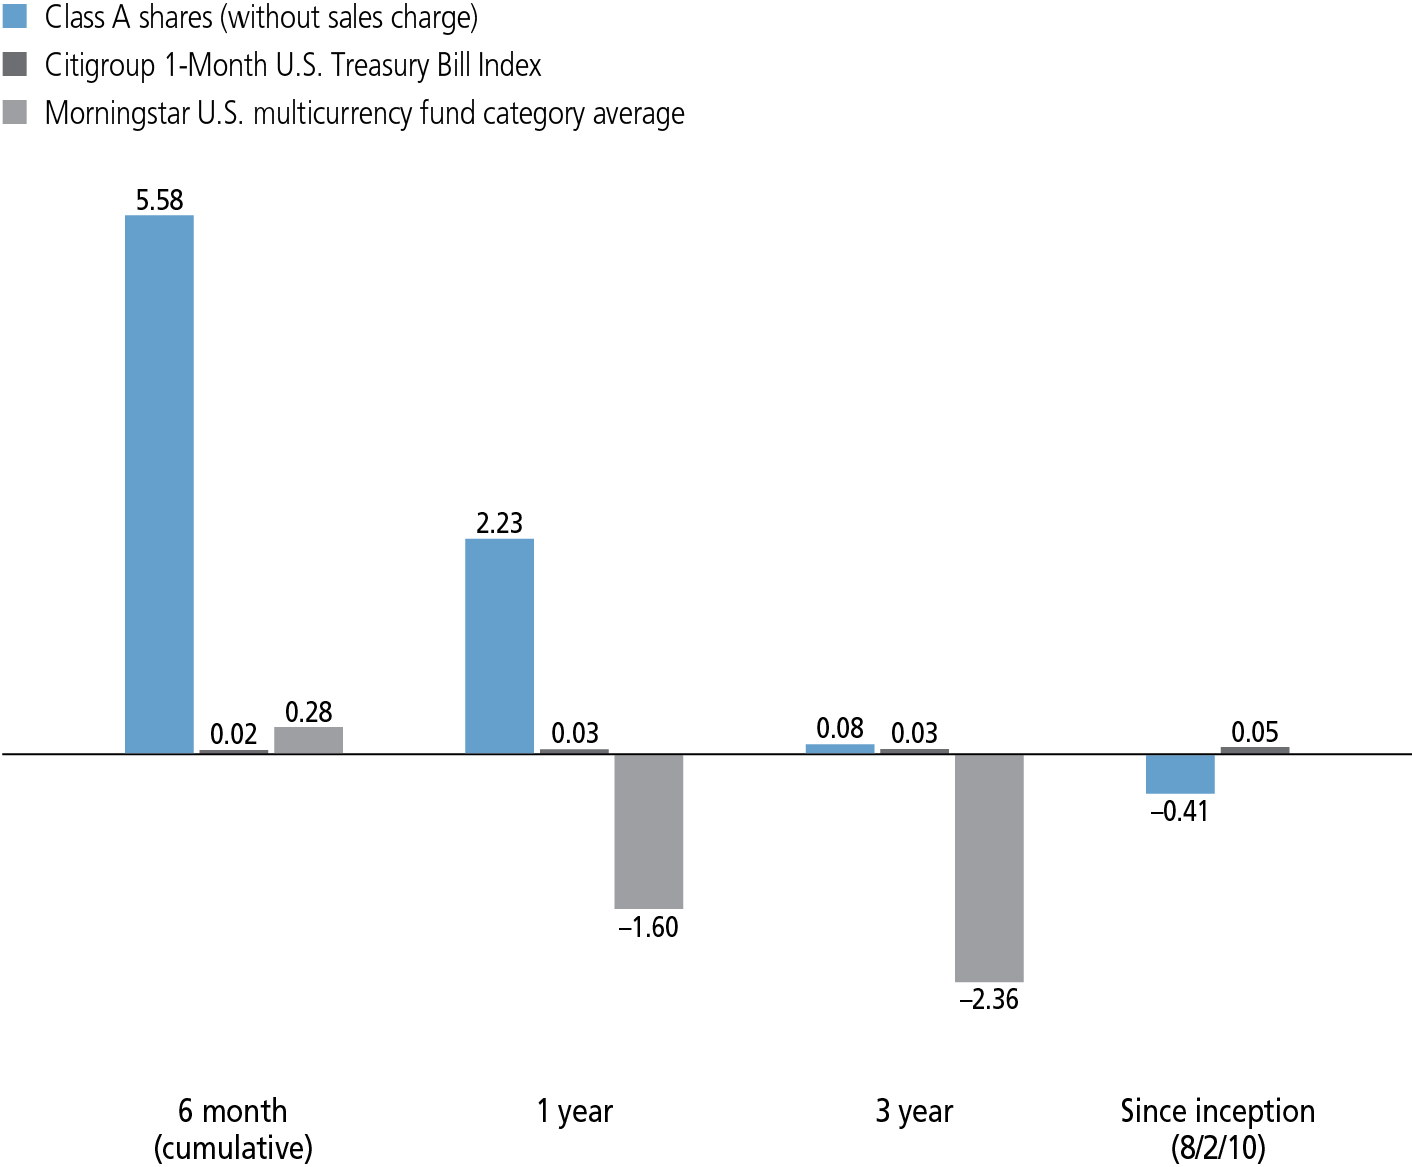
The Citigroup 1-Month U.S. Treasury Bill Index is a market value-weighted index of public obligators of the U.S. Treasury with maturities of one month.
It is not possible to invest directly in an index. Index figures do not reflect expenses or sales charges, which would result in lower returns.
Figures from Morningstar, Inc. include reinvested distributions and do not take into account sales charges. Actual load-adjusted performance is lower. Since-inception returns for the Morningstar fund category average are not available.
The past performance shown here reflects reinvested distributions and the beneficial effect of any expense reductions, and does not guarantee future results. Returns for periods shorter than one year are cumulative. Performance of the other share classes will vary based on the difference in the fees and expenses of those classes. Shares will fluctuate in value and, when redeemed, may be worth more or less than their original cost. Current month-end performance may be lower or higher than the performance cited, and can be found at jhinvestments.com or by calling 800-225-5291. For further information on the fund's objectives, risks, and strategy, see the fund's prospectus.
PERFORMANCE HIGHLIGHTS OVER THE LAST SIX MONTHS
The fund was up while many markets were down
During a volatile period for asset prices across many of the world's capital markets, the fund delivered positive returns, outpacing its benchmark, the Citigroup 1-Month U.S. Treasury Bill Index, in the process.
Short British pound exposure boosted results
A short position in the British pound sterling was among the most significant contributors to performance; long allocations to the Japanese yen and the euro were also helpful.
Norwegian krone long suffered losses
Partially offsetting the fund's favorable results was a long position in Norway's currency, the krone, which depreciated as the country's central bank cut short-term interest rates.
CURRENCY ALLOCATION AS OF 1/31/16 (%)
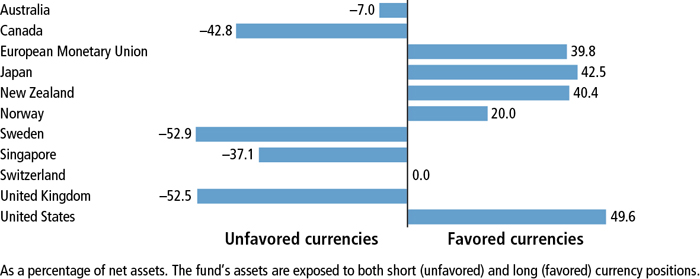
A note about risks
Absolute return funds are not designed to outperform stocks and bonds in strong markets and there is no guarantee of positive returns. They employ certain techniques, which are intended to reduce risk and volatility in the portfolio and provide protection against a decline in the fund's assets. However, there is no guarantee that any investment strategy will be successful or that the fund's objectives will be achieved. Currency transactions are affected by fluctuations in exchange rates. The fund's losses could exceed the amount invested in its currency instruments. Currency rates in foreign countries may fluctuate significantly for a number of reasons, including the forces of supply and demand in the foreign exchange markets, actual or perceived changes in interest rates, and intervention (or the failure to intervene) by U.S. or foreign governments or central banks, or by currency controls or political developments in the United States or abroad. Stock prices can be volatile and are affected by both general economic conditions and the financial prospects of individual companies. Fixed-income investments are subject to interest-rate and credit risk; their value will normally decline as interest rates rise or if a creditor, grantor, or counterparty is unable or unwilling to make principal, interest, or settlement payments. Liquidity—the extent to which a security may be sold or a derivative position closed without negatively affecting its market value, if at all—may be impaired by reduced trading volume, heightened volatility, rising interest rates, and other market conditions.Foreign investing, especially in emerging markets, has additional risks, such as currency and market volatility and political and social instability. Hedging, derivatives, and other strategic transactions may increase a fund's volatility and could produce disproportionate losses, potentially more than the fund's principal investment. Please see the fund's prospectuses for additional risks.

Dori S. Levanoni
Portfolio Manager
First Quadrant, LP
We saw elevated levels of stresses influencing the behavior of financial assets throughout the first half of the fund's fiscal year—particularly during August, the period's opening month, and again during January, the period's final month. Would you please share your observations on the market action?
Commodity prices exhibited a number of weaknesses as low oil demand, relative to the supply, persisted throughout the period. Global stock market gyrations also shared in the attention as anxiety around the developments in China sparked more than one dramatic equity sell-off during the six months that ended on January 31, 2016.
The August equity drawdown was particularly sharp, prompting market volatility spikes and S&P 500 Index declines, which were, up to that point, unrivaled since the summer of 2011, a period that featured questions about the viability of the eurozone, on the one hand, and the perceived quality of U.S. government debt, on the other hand.
For the period as a whole, emerging-market equities suffered steep losses along with further commodity price declines. The MSCI Emerging Markets Index fell 16.83%, and the S&P/Goldman Sachs Commodity Index lost more than a quarter of its market value. High-yield debt markets also declined. The U.S. Federal Reserve implemented its first interest-rate hike since 2006, exacerbating global monetary policy divergence, as the European Central Bank continued to ease its stance. On balance, sovereign debt markets offered modestly positive performance.
For some investors with international exposure, currency hedging policy could have determined the difference between a net gain and loss. Across developed-market currencies, where the fund's investments are focused, the Japanese yen was among the relative winners, and the British
How did the fund perform for the period? Did it behave as you would have expected it to behave in such an environment?
While drivers of markets (and sharp sell-offs in particular) are always difficult to parse, a significant source of instability in the period came from the increasingly manifest realization that economic policymakers across the globe lack the ability to engineer growth. In this kind of backdrop, we witnessed opportunities related to directionality of underlying markets, expressed through relative value positions in currencies, as well as opportunities related to the market's perceived overreaction (or underreaction) to different changes in the risk landscape.
In light of its mandate to seek an absolute return, the fund delivered what we would view as a strong gain during the period, outperforming its benchmark, the Citigroup 1-Month U.S. Treasury Bill Index, in the process. Achieving a persistently low correlation with the broader market, the fund behaved as we would have expected it to behave during a period of declining equity prices and widening credit spreads—that is, the fund posted a relatively good return in an environment that was not so favorable for stocks, corporate bonds, and many other risk-oriented assets.
What were the key contributors to the fund's success during the period?
Our relative valuation model, which informs our investment decisions through suggestions based on market exchange rates that deviate from a hypothetical purchasing power parity across the world's currencies, made a favorable contribution to the fund's results for the period.
Looking at individual currency positions, short exposure to the British pound, driven by the relative valuation and unhedged export flow models, delivered notable gains. The pound continued its depreciation trend following a Bank of England announcement in December that tempered expectations of an interest-rate hike. Meanwhile, uncertainty around the upcoming referendum on
Distress in the equity and commodity markets prompted flight-to-safety transactions that benefited the fund's long positions in the Japanese yen and the euro.
How about detractors from the fund's performance?
Detractors from the fund's performance during the period were limited in number and magnitude. By currency, a long position in the Norwegian krone suffered losses that rendered it the worst performer in the fund. In September, the country's central bank, the Norges Bank, announced it was cutting short-term interest rates, although speculators had leaned toward an unchanged policy stance. Following the announcement, the currency depreciated.
A small but notable loss came from the New Zealand dollar, in which the fund was initially short, and later long. Late in the period, with decreased global demand for dairy products putting downward pressure on general price levels in the country, the Reserve Bank of New Zealand hinted at further interest-rate cuts, which led to a depreciation of the currency and the fund's long exposure to it.
How was the fund positioned as this period drew to a close?
As of the end of the period, we positioned the fund with meaningful long positions in the U.S. dollar, the Japanese yen, the euro, and the New Zealand dollar. These were offset by short exposure to the British pound, the Swedish krona, and the Canadian dollar.
At this moment, monetary policy is diverging among developed markets, between developed markets and emerging markets, and between commodity exporters and commodity importers. Uncertainty about the growth trajectory in China, in Europe, and in the United States has continued to fuel volatility.
Weakness in commodities in general, and oil in particular, along with the effect that weakness has on inflation and economic activity, may continue to strain the patience of market participants.
Dramatic currency policy changes and the related impact on relative competitiveness and inflation around the globe add to the fray, as does the impact of two consecutive years of double-digit appreciation of the trade-weighted U.S. dollar.
Markets also face continued or increased skepticism regarding the ability of policymakers to competently engineer desirable outcomes. Fueling this anxiety is the suspect ability of central bankers to achieve policy goals, a lack of meaningful fiscal policies, the viability of the European Union itself, and the Chinese government's ability to stabilize its markets and its economy.
In the context of the fund, these kinds of macrodynamics provide significant opportunities for both shorter- and longer-term investment horizons. As expectations give way to outcomes, and as markets fall in line with the underlying data, the fundamentals will be the ultimate arbiter.
MANAGED BY
| |
Dori S. Levanoni On the fund since 2010 Investing since 1991 |
 |
Jeppe F. Ladekarl On the fund since 2012 Investing since 1995 |
![]()
TOTAL RETURNS FOR THE PERIOD ENDED JANUARY 31, 2016
| Average annual total returns (%) with maximum sales charge |
Cumulative total returns (%) with maximum sales charge |
||||||
| 1-year | 5-year | Since inception1 |
6-month | 5-year | Since inception1 |
||
| Class A | -0.80 | -0.23 | -0.96 | 2.47 | -1.15 | -5.18 | |
| Class C2 | 0.49 | -0.31 | -1.10 | 4.24 | -1.56 | -5.89 | |
| Class I3 | 2.53 | 0.78 | -0.01 | 5.82 | 3.99 | -0.07 | |
| Class R22,3 | 2.40 | 0.51 | -0.28 | 5.79 | 2.60 | -1.53 | |
| Class R42,3 | 2.54 | 0.66 | -0.13 | 5.79 | 3.36 | -0.73 | |
| Class R62,3 | 2.86 | 0.91 | 0.11 | 5.90 | 4.62 | 0.62 | |
| Class NAV3 | 2.85 | 0.97 | 0.17 | 5.88 | 4.95 | 0.96 | |
| Index† | 0.03 | 0.04 | 0.05 | 0.02 | 0.19 | 0.25 | |
Performance figures assume all distributions have been reinvested. Figures reflect maximum sales charges on Class A shares of 3.00% and the applicable contingent deferred sales charge (CDSC) on Class C shares. Class C shares sold within one year of purchase are subject to a 1% CDSC. Sales charges are not applicable to Class I, Class R2, Class R4, Class R6, and NAV shares.
The expense ratios of the fund, both net (including any fee waivers and/or expense limitations) and gross (excluding any fee waivers and/or expense limitations), are set forth according to the most recent publicly available prospectuses for the fund and may differ from those disclosed in the Financial highlights tables in this report. Had the fee waivers and expense limitations not been in place, gross expenses would apply. The expense ratios are as follows:
| Class A | Class C | Class I | Class R2* | Class R4* | Class R6 | Class NAV | |
| Gross (%) | 1.35 | 2.05 | 1.03 | 1.44 | 1.29 | 0.94 | 0.92 |
| Net (%) | 1.35 | 2.05 | 1.03 | 1.44 | 1.19 | 0.92 | 0.92 |
Please refer to the most recent prospectus and annual or semiannual report for more information on expenses and any expense limitation arrangements for each class.
| * | Expenses have been estimated for the first year of operations for Class R2 and Class R4 shares. |
The returns reflect past results and should not be considered indicative of future performance. The return and principal value of an investment will fluctuate so that shares, when redeemed, may be worth more or less than their original cost. Due to market volatility and other factors, the fund's current performance may be higher or lower than the performance shown. For current to the most recent month-end performance data, please call 800-225-5291 or visit the fund's website at jhinvestments.com.
The performance table above and the chart on the next page do not reflect the deduction of taxes that a shareholder would pay on fund distributions or the redemption of fund shares. The fund's performance results reflect any applicable fee waivers or expense reductions, without which the expenses would increase and results would have been less favorable.
| † | Index is the Citigroup 1-Month U.S. Treasury Bill Index. |
See the following page for footnotes.
This chart and table show what happened to a hypothetical $10,000 investment in John Hancock Absolute Return Currency Fund for the share classes and periods indicated, assuming all distributions were reinvested. For comparison, we've shown the same investment in the Citigroup 1-Month U.S. Treasury Bill Index.
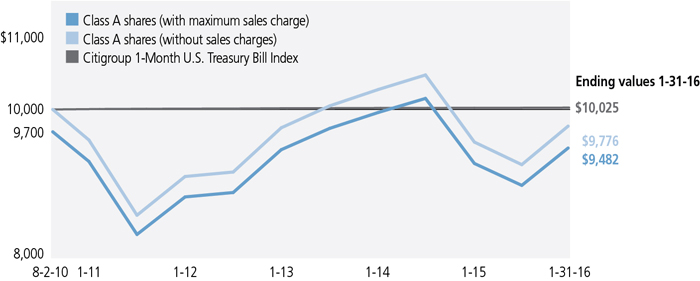
| Start date | With maximum sales charge ($) |
Without sales charge ($) |
Index ($) | |
| Class C2,4 | 8-2-10 | 9,411 | 9,411 | 10,025 |
| Class I3 | 8-2-10 | 9,993 | 9,993 | 10,025 |
| Class R22,3 | 8-2-10 | 9,847 | 9,847 | 10,025 |
| Class R42,3 | 8-2-10 | 9,927 | 9,927 | 10,025 |
| Class R62,3 | 8-2-10 | 10,062 | 10,062 | 10,025 |
| Class NAV3 | 8-2-10 | 10,096 | 10,096 | 10,025 |
The Citigroup 1-Month U.S. Treasury Bill Index is a market value-weighted index of public obligators of the U.S. Treasury with maturities of one month.
It is not possible to invest directly in an index. Index figures do not reflect expenses or sales charges, which would result in lower returns.
Footnotes related to performance pages
| 1 | From 8-2-10. |
| 2 | Class C shares were first offered on 8-28-14; Class R2 and Class R4 shares were first offered on 3-27-15; Class R6 shares were first offered on 11-1-11. The returns prior to these dates are those of Class A shares that have been recalculated to apply the gross fees and expenses of Class C, Class R2, Class R4, and Class R6 shares, as applicable. |
| 3 | For certain types of investors as described in the fund's prospectuses. |
| 4 | The contingent deferred sales charge is not applicable. |
These examples are intended to help you understand your ongoing operating expenses of investing in the fund so you can compare these costs with the ongoing costs of investing in other mutual funds.
Understanding fund expenses
As a shareholder of the fund, you incur two types of costs:
| • | Transaction costs, which include sales charges (loads) on purchases or redemptions (varies by share class), minimum account fee charge, etc. |
| • | Ongoing operating expenses, including management fees, distribution and service fees (if applicable), and other fund expenses. |
We are presenting only your ongoing operating expenses here.
Actual expenses/actual returns
This example is intended to provide information about the fund's actual ongoing operating expenses, and is based on the fund's actual return. It assumes an account value of $1,000.00 on August 1, 2015, with the same investment held until January 31, 2016.
| Account value on 8-1-2015 |
Ending value on 1-31-2016 |
Expenses paid during period ended 1-31-20161 |
Annualized expense ratio |
|
| Class A | $1,000.00 | $1,055.80 | $6.98 | 1.35% |
| Class C | 1,000.00 | 1,052.40 | 10.58 | 2.05% |
| Class I | 1,000.00 | 1,058.20 | 5.33 | 1.03% |
| Class R2 | 1,000.00 | 1,057.90 | 6.16 | 1.19% |
| Class R4 | 1,000.00 | 1,057.90 | 5.64 | 1.09% |
| Class R6 | 1,000.00 | 1,059.00 | 4.76 | 0.92% |
| Class NAV | 1,000.00 | 1,058.80 | 4.81 | 0.93% |
Together with the value of your account, you may use this information to estimate the operating expenses that you paid over the period. Simply divide your account value at January 31, 2016, by $1,000.00, then multiply it by the "expenses paid" for your share class from the table above. For example, for an account value of $8,600.00, the operating expenses should be calculated as follows:
Hypothetical example for comparison purposes
This table allows you to compare the fund's ongoing operating expenses with those of any other fund. It provides an example of the fund's hypothetical account values and hypothetical expenses based on each class's actual expense ratio and an assumed 5% annualized return before expenses (which is not the fund's actual return). It assumes an account value of $1,000.00 on August 1, 2015, with the same investment held until January 31, 2016. Look in any other fund shareholder report to find its hypothetical example and you will be able to compare these expenses. Please remember that these hypothetical account values and expenses may not be used to estimate the actual ending account balance or expenses you paid for the period.
| Account value on 8-1-2015 |
Ending value on 1-31-2016 |
Expenses paid during period ended 1-31-20161 |
Annualized expense ratio |
|
| Class A | $1,000.00 | $1,018.30 | $6.85 | 1.35% |
| Class C | 1,000.00 | 1,014.80 | 10.38 | 2.05% |
| Class I | 1,000.00 | 1,020.00 | 5.23 | 1.03% |
| Class R2 | 1,000.00 | 1,019.20 | 6.04 | 1.19% |
| Class R4 | 1,000.00 | 1,019.70 | 5.53 | 1.09% |
| Class R6 | 1,000.00 | 1,020.50 | 4.67 | 0.92% |
| Class NAV | 1,000.00 | 1,020.50 | 4.72 | 0.93% |
Remember, these examples do not include any transaction costs, therefore, these examples will not help you to determine the relative total costs of owning different funds. If transaction costs were included, your expenses would have been higher. See the prospectuses for details regarding transaction costs.
| 1 | Expenses are equal to the fund's annualized expense ratio, multiplied by the average account value over the period, multiplied by 184/366 (to reflect the one-half year period). |
Fund's investments
| As of 1-31-16 (unaudited) | |||||||||||||||||||||||
| Short-term investments 95.3% | $977,735,045 | ||||||||||||||||||||||
| (Cost $978,000,820) | |||||||||||||||||||||||
| Yield* (%) | Maturity date | Par value^ | Value | ||||||||||||||||||||
| U.S. Government 93.9% | 962,916,997 | ||||||||||||||||||||||
| U.S. Treasury Bills (D) | 0.070 | 03-31-16 | 47,654,000 | 47,630,888 | |||||||||||||||||||
| U.S. Treasury Bills | 0.090 | 04-28-16 | 138,000,000 | 137,895,648 | |||||||||||||||||||
| U.S. Treasury Bills | 0.191 | 05-26-16 | 143,000,000 | 142,840,412 | |||||||||||||||||||
| U.S. Treasury Bills | 0.206 | 06-23-16 | 143,000,000 | 142,789,218 | |||||||||||||||||||
| U.S. Treasury Bills | 0.246 | 07-21-16 | 128,000,000 | 127,759,616 | |||||||||||||||||||
| U.S. Treasury Bills | 0.399 | 08-18-16 | 125,000,000 | 124,696,975 | |||||||||||||||||||
| U.S. Treasury Bills | 0.430 | 10-13-16 | 80,000,000 | 79,761,840 | |||||||||||||||||||
| U.S. Treasury Bills | 0.450 | 09-15-16 | 80,000,000 | 79,783,040 | |||||||||||||||||||
| U.S. Treasury Bills (D) | 0.488 | 11-10-16 | 80,000,000 | 79,759,360 | |||||||||||||||||||
| Yield (%) | Shares | Value | |||||||||||||||||||||
| Money market funds 1.4% | 14,818,048 | ||||||||||||||||||||||
| State Street Institutional Liquid Reserves Fund | 0.3585(Y) | 14,818,048 | 14,818,048 | ||||||||||||||||||||
| Total investments (Cost $978,000,820)† 95.3% | $977,735,045 | ||||||||||||||||||||||
| Other assets and liabilities, net 4.7% | $48,030,325 | ||||||||||||||||||||||
| Total net assets 100.0% | $1,025,765,370 | ||||||||||||||||||||||
| The percentage shown for each investment category is the total value of the category as a percentage of the net assets of the fund. | |||||||||||||||||||||||
| ^All par values are denominated in U.S. dollars unless otherwise indicated. | |||||||||||||||||||||||
| Key to Security Abbreviations and Legend | |||||||||||||||||||||||
| (D) | All or a portion of this security is segregated at the custodian as collateral pursuant to certain derivative instrument contracts. | ||||||||||||||||||||||
| (Y) | The rate shown is the annualized seven-day yield as of 1-31-16. | ||||||||||||||||||||||
| * | Yield represents the annualized yield at the date of purchase. | ||||||||||||||||||||||
| † | At 1-31-16, the aggregate cost of investment securities for federal income tax purposes was $978,000,820. Net unrealized depreciation aggregated $265,775, of which $81,490 related to appreciated investment securities and $347,265 related to depreciated investment securities. | ||||||||||||||||||||||
The following table summarizes the forward foreign currency contracts held at January 31, 2016:
| Contract to buy | Contract to sell | Counterparty | Contractual settlement date |
Unrealized appreciation |
Unrealized depreciation |
Net unrealized appreciation/ (depreciation) |
||||||||||||||||||||||||||
| AUD | 121,673,848 | USD | 87,205,076 | Barclays Bank PLC Wholesale | 3/16/2016 | — | ($1,265,948 | ) | (1,265,948 | ) | ||||||||||||||||||||||
| AUD | 464,902,248 | USD | 334,514,238 | J. Aron & Company | 3/16/2016 | — | (6,150,382 | ) | (6,150,382 | ) | ||||||||||||||||||||||
| AUD | 98,440,159 | USD | 69,834,417 | Morgan Stanley Capital Services, Inc. | 3/16/2016 | — | (305,413 | ) | (305,413 | ) | ||||||||||||||||||||||
| AUD | 173,892,481 | USD | 124,418,750 | State Street Bank and Trust Company | 3/16/2016 | — | (1,597,219 | ) | (1,597,219 | ) | ||||||||||||||||||||||
| CAD | 321,647,313 | USD | 231,840,146 | Barclays Bank PLC Wholesale | 3/16/2016 | — | (2,238,078 | ) | (2,238,078 | ) | ||||||||||||||||||||||
| CAD | 151,654,072 | USD | 108,337,634 | Deutsche Bank AG London | 3/16/2016 | — | (82,141 | ) | (82,141 | ) | ||||||||||||||||||||||
| CAD | 290,422,364 | USD | 210,652,404 | J. Aron & Company | 3/16/2016 | — | (3,339,698 | ) | (3,339,698 | ) | ||||||||||||||||||||||
| CAD | 457,627,648 | USD | 336,192,709 | Morgan Stanley Capital Services, Inc. | 3/16/2016 | — | (9,523,563 | ) | (9,523,563 | ) | ||||||||||||||||||||||
| CAD | 264,324,972 | USD | 192,890,136 | State Street Bank and Trust Company | 3/16/2016 | — | (4,206,577 | ) | (4,206,577 | ) | ||||||||||||||||||||||
| EUR | 532,230,104 | USD | 579,975,316 | Barclays Bank PLC Wholesale | 3/16/2016 | — | (2,779,441 | ) | (2,779,441 | ) | ||||||||||||||||||||||
| EUR | 161,743,102 | USD | 176,296,296 | Deutsche Bank AG London | 3/16/2016 | — | (888,235 | ) | (888,235 | ) | ||||||||||||||||||||||
| Contract to buy | Contract to sell | Counterparty | Contractual settlement date |
Unrealized appreciation |
Unrealized depreciation |
Net unrealized appreciation/ (depreciation) |
||||||||||||||||||||||||||
| EUR | 132,573,699 | USD | 144,440,397 | J. Aron & Company | 3/16/2016 | — | (666,133 | ) | (666,133 | ) | ||||||||||||||||||||||
| EUR | 30,194,865 | USD | 32,667,506 | Morgan Stanley Capital Services, Inc. | 3/16/2016 | $78,391 | — | 78,391 | ||||||||||||||||||||||||
| EUR | 103,186,643 | USD | 111,882,626 | State Street Bank and Trust Company | 3/16/2016 | 21,802 | — | 21,802 | ||||||||||||||||||||||||
| GBP | 262,029,411 | USD | 381,243,396 | Barclays Bank PLC Wholesale | 3/16/2016 | — | (7,850,326 | ) | (7,850,326 | ) | ||||||||||||||||||||||
| GBP | 29,147,773 | USD | 42,365,967 | Deutsche Bank AG London | 3/16/2016 | — | (830,262 | ) | (830,262 | ) | ||||||||||||||||||||||
| GBP | 69,723,875 | USD | 102,851,356 | J. Aron & Company | 3/16/2016 | — | (3,494,528 | ) | (3,494,528 | ) | ||||||||||||||||||||||
| GBP | 48,463,788 | USD | 72,812,207 | Morgan Stanley Capital Services, Inc. | 3/16/2016 | — | (3,751,095 | ) | (3,751,095 | ) | ||||||||||||||||||||||
| GBP | 63,071,879 | USD | 91,420,829 | State Street Bank and Trust Company | 3/16/2016 | — | (1,543,123 | ) | (1,543,123 | ) | ||||||||||||||||||||||
| JPY | 12,913,638,744 | USD | 109,333,969 | Barclays Bank PLC Wholesale | 3/16/2016 | — | (2,560,203 | ) | (2,560,203 | ) | ||||||||||||||||||||||
| JPY | 14,859,030,972 | USD | 121,309,038 | Deutsche Bank AG London | 3/16/2016 | 1,549,804 | — | 1,549,804 | ||||||||||||||||||||||||
| JPY | 70,114,910,081 | USD | 578,524,917 | J. Aron & Company | 3/16/2016 | 1,205,805 | — | 1,205,805 | ||||||||||||||||||||||||
| JPY | 23,461,950,674 | USD | 196,731,000 | Morgan Stanley Capital Services, Inc. | 3/16/2016 | — | (2,740,682 | ) | (2,740,682 | ) | ||||||||||||||||||||||
| JPY | 17,871,466,883 | USD | 151,187,191 | State Street Bank and Trust Company | 3/16/2016 | — | (3,420,642 | ) | (3,420,642 | ) | ||||||||||||||||||||||
| NOK | 537,682,432 | USD | 61,172,223 | Barclays Bank PLC Wholesale | 3/16/2016 | 734,391 | — | 734,391 | ||||||||||||||||||||||||
| NOK | 1,208,375,162 | USD | 137,717,187 | Deutsche Bank AG London | 3/16/2016 | 1,410,318 | — | 1,410,318 | ||||||||||||||||||||||||
| NOK | 2,022,437,381 | USD | 230,278,919 | J. Aron & Company | 3/16/2016 | 2,576,467 | — | 2,576,467 | ||||||||||||||||||||||||
| NOK | 1,755,579,170 | USD | 199,495,564 | Morgan Stanley Capital Services, Inc. | 3/16/2016 | 2,634,829 | — | 2,634,829 | ||||||||||||||||||||||||
| NOK | 811,133,763 | USD | 93,562,153 | State Street Bank and Trust Company | 3/16/2016 | — | (171,441 | ) | (171,441 | ) | ||||||||||||||||||||||
| NZD | 135,508,034 | USD | 89,319,649 | Barclays Bank PLC Wholesale | 3/16/2016 | — | (1,792,016 | ) | (1,792,016 | ) | ||||||||||||||||||||||
| NZD | 292,931,588 | USD | 192,953,062 | Deutsche Bank AG London | 3/16/2016 | — | (3,742,078 | ) | (3,742,078 | ) | ||||||||||||||||||||||
| NZD | 348,303,230 | USD | 226,468,196 | J. Aron & Company | 3/16/2016 | — | (1,491,449 | ) | (1,491,449 | ) | ||||||||||||||||||||||
| NZD | 572,528,493 | USD | 377,050,258 | Morgan Stanley Capital Services, Inc. | 3/16/2016 | — | (7,241,456 | ) | (7,241,456 | ) | ||||||||||||||||||||||
| NZD | 188,673,055 | USD | 124,999,222 | State Street Bank and Trust Company | 3/16/2016 | — | (3,131,128 | ) | (3,131,128 | ) | ||||||||||||||||||||||
| SEK | 694,533,429 | USD | 81,668,487 | Deutsche Bank AG London | 3/16/2016 | — | (647,823 | ) | (647,823 | ) | ||||||||||||||||||||||
| SEK | 1,190,588,500 | USD | 139,824,698 | J. Aron & Company | 3/16/2016 | — | (936,827 | ) | (936,827 | ) | ||||||||||||||||||||||
| SEK | 522,638,598 | USD | 61,614,783 | Morgan Stanley Capital Services, Inc. | 3/16/2016 | — | (646,479 | ) | (646,479 | ) | ||||||||||||||||||||||
| SGD | 30,283,215 | USD | 21,215,573 | Barclays Bank PLC Wholesale | 3/16/2016 | 22,975 | — | 22,975 | ||||||||||||||||||||||||
| SGD | 137,382,963 | USD | 96,547,045 | J. Aron & Company | 3/16/2016 | — | (196,159 | ) | (196,159 | ) | ||||||||||||||||||||||
| SGD | 270,317,692 | USD | 189,038,331 | Morgan Stanley Capital Services, Inc. | 3/16/2016 | 543,761 | — | 543,761 | ||||||||||||||||||||||||
| USD | 244,969,150 | AUD | 344,352,215 | Barclays Bank PLC Wholesale | 3/16/2016 | 1,750,661 | — | 1,750,661 | ||||||||||||||||||||||||
| USD | 94,881,122 | AUD | 130,882,519 | Deutsche Bank AG London | 3/16/2016 | 2,437,842 | — | 2,437,842 | ||||||||||||||||||||||||
| USD | 166,626,866 | AUD | 232,842,434 | J. Aron & Company | 3/16/2016 | 2,168,553 | — | 2,168,553 | ||||||||||||||||||||||||
| USD | 174,168,060 | AUD | 243,648,218 | Morgan Stanley Capital Services, Inc. | 3/16/2016 | 2,077,542 | — | 2,077,542 | ||||||||||||||||||||||||
| USD | 6,935,608 | AUD | 9,526,989 | State Street Bank and Trust Company | 3/16/2016 | 206,626 | — | 206,626 | ||||||||||||||||||||||||
| USD | 590,917,155 | CAD | 809,926,252 | Barclays Bank PLC Wholesale | 3/16/2016 | 12,766,078 | — | 12,766,078 | ||||||||||||||||||||||||
| USD | 185,039,177 | CAD | 257,751,094 | Deutsche Bank AG London | 3/16/2016 | 1,048,261 | — | 1,048,261 | ||||||||||||||||||||||||
| USD | 208,320,114 | CAD | 291,843,594 | J. Aron & Company | 3/16/2016 | — | (7,107 | ) | (7,107 | ) | ||||||||||||||||||||||
| USD | 323,814,919 | CAD | 452,378,281 | Morgan Stanley Capital Services, Inc. | 3/16/2016 | 892,938 | — | 892,938 | ||||||||||||||||||||||||
| USD | 210,209,918 | CAD | 289,356,306 | State Street Bank and Trust Company | 3/16/2016 | 3,658,197 | — | 3,658,197 | ||||||||||||||||||||||||
| USD | 153,910,506 | EUR | 140,659,490 | Barclays Bank PLC Wholesale | 3/16/2016 | 1,367,318 | — | 1,367,318 | ||||||||||||||||||||||||
| USD | 132,428,232 | EUR | 120,835,316 | Deutsche Bank AG London | 3/16/2016 | 1,384,075 | — | 1,384,075 | ||||||||||||||||||||||||
| USD | 150,382,431 | EUR | 137,689,379 | J. Aron & Company | 3/16/2016 | 1,060,281 | — | 1,060,281 | ||||||||||||||||||||||||
| USD | 136,555,641 | EUR | 125,404,442 | Morgan Stanley Capital Services, Inc. | 3/16/2016 | 556,330 | — | 556,330 | ||||||||||||||||||||||||
| USD | 63,825,018 | EUR | 58,461,432 | State Street Bank and Trust Company | 3/16/2016 | 424,437 | — | 424,437 | ||||||||||||||||||||||||
| USD | 748,758,193 | GBP | 503,980,969 | Barclays Bank PLC Wholesale | 3/16/2016 | 30,583,090 | — | 30,583,090 | ||||||||||||||||||||||||
| USD | 210,937,132 | GBP | 141,768,280 | Deutsche Bank AG London | 3/16/2016 | 8,916,707 | — | 8,916,707 | ||||||||||||||||||||||||
| USD | 190,688,908 | GBP | 127,158,666 | J. Aron & Company | 3/16/2016 | 9,487,247 | — | 9,487,247 | ||||||||||||||||||||||||
| USD | 115,386,571 | GBP | 78,075,125 | State Street Bank and Trust Company | 3/16/2016 | 4,129,174 | — | 4,129,174 | ||||||||||||||||||||||||
| USD | 137,422,518 | JPY | 16,357,693,001 | Barclays Bank PLC Wholesale | 3/16/2016 | 2,172,297 | — | 2,172,297 | ||||||||||||||||||||||||
| USD | 71,236,238 | JPY | 8,644,443,367 | J. Aron & Company | 3/16/2016 | — | (238,565 | ) | (238,565 | ) | ||||||||||||||||||||||
| Contract to buy | Contract to sell | Counterparty | Contractual settlement date |
Unrealized appreciation |
Unrealized depreciation |
Net unrealized appreciation/ (depreciation) |
||||||||||||||||||||||||||
| USD | 393,579,351 | JPY | 48,240,336,520 | Morgan Stanley Capital Services, Inc. | 3/16/2016 | — | (5,285,956 | ) | (5,285,956 | ) | ||||||||||||||||||||||
| USD | 109,819,584 | JPY | 13,165,937,035 | State Street Bank and Trust Company | 3/16/2016 | 959,740 | — | 959,740 | ||||||||||||||||||||||||
| USD | 223,634,143 | NOK | 1,955,277,508 | Deutsche Bank AG London | 3/16/2016 | — | (1,488,723 | ) | (1,488,723 | ) | ||||||||||||||||||||||
| USD | 45,302,082 | NOK | 400,989,375 | J. Aron & Company | 3/16/2016 | — | (866,238 | ) | (866,238 | ) | ||||||||||||||||||||||
| USD | 164,588,191 | NOK | 1,449,118,309 | Morgan Stanley Capital Services, Inc. | 3/16/2016 | — | (2,257,520 | ) | (2,257,520 | ) | ||||||||||||||||||||||
| USD | 83,928,263 | NOK | 741,026,768 | State Street Bank and Trust Company | 3/16/2016 | — | (1,390,610 | ) | (1,390,610 | ) | ||||||||||||||||||||||
| USD | 210,653,733 | NZD | 319,019,585 | Barclays Bank PLC Wholesale | 3/16/2016 | 4,591,939 | — | 4,591,939 | ||||||||||||||||||||||||
| USD | 38,094,296 | NZD | 56,726,446 | Deutsche Bank AG London | 3/16/2016 | 1,453,433 | — | 1,453,433 | ||||||||||||||||||||||||
| USD | 268,971,546 | NZD | 404,557,879 | J. Aron & Company | 3/16/2016 | 7,658,677 | — | 7,658,677 | ||||||||||||||||||||||||
| USD | 76,357,843 | NZD | 115,484,497 | Morgan Stanley Capital Services, Inc. | 3/16/2016 | 1,763,854 | — | 1,763,854 | ||||||||||||||||||||||||
| USD | 185,697,892 | SEK | 1,573,641,080 | Barclays Bank PLC Wholesale | 3/16/2016 | 2,125,096 | — | 2,125,096 | ||||||||||||||||||||||||
| USD | 304,535,093 | SEK | 2,587,093,890 | Deutsche Bank AG London | 3/16/2016 | 2,738,154 | — | 2,738,154 | ||||||||||||||||||||||||
| USD | 36,057,090 | SEK | 305,740,327 | J. Aron & Company | 3/16/2016 | 391,011 | — | 391,011 | ||||||||||||||||||||||||
| USD | 182,771,391 | SEK | 1,546,421,614 | Morgan Stanley Capital Services, Inc. | 3/16/2016 | 2,373,877 | — | 2,373,877 | ||||||||||||||||||||||||
| USD | 124,096,749 | SEK | 1,046,845,232 | State Street Bank and Trust Company | 3/16/2016 | 1,977,221 | — | 1,977,221 | ||||||||||||||||||||||||
| USD | 170,381,562 | SGD | 240,969,792 | Barclays Bank PLC Wholesale | 3/16/2016 | 1,382,053 | — | 1,382,053 | ||||||||||||||||||||||||
| USD | 13,918,399 | SGD | 19,614,504 | Deutsche Bank AG London | 3/16/2016 | 162,146 | — | 162,146 | ||||||||||||||||||||||||
| USD | 165,438,690 | SGD | 236,735,466 | J. Aron & Company | 3/16/2016 | — | (591,158 | ) | (591,158 | ) | ||||||||||||||||||||||
| USD | 257,914,334 | SGD | 367,283,904 | Morgan Stanley Capital Services, Inc. | 3/16/2016 | 326,865 | — | 326,865 | ||||||||||||||||||||||||
| USD | 82,409,492 | SGD | 116,967,149 | State Street Bank and Trust Company | 3/16/2016 | 376,838 | — | 376,838 | ||||||||||||||||||||||||
| $126,147,101 | ($91,356,422 | ) | $34,790,679 | |||||||||||||||||||||||||||||
| Currency Abbreviations | |||
| AUD | Australian Dollar | NOK | Norwegian Krone |
| CAD | Canadian Dollar | NZD | New Zealand Dollar |
| EUR | Euro | SEK | Swedish Krona |
| GBP | Pound Sterling | SGD | Singapore Dollar |
| JPY | Japanese Yen | USD | United States Dollar |
Financial statements
STATEMENT OF ASSETS AND LIABILITIES 1-31-16 (unaudited)
| Assets | ||||||||||||||||||||||||||||||
| Investments, at value (Cost $978,000,820) | $977,735,045 | |||||||||||||||||||||||||||||
| Cash | 13,053,914 | |||||||||||||||||||||||||||||
| Receivable for fund shares sold | 1,102,795 | |||||||||||||||||||||||||||||
| Unrealized appreciation on forward foreign currency exchange contracts | 126,147,101 | |||||||||||||||||||||||||||||
| Interest receivable | 6,376 | |||||||||||||||||||||||||||||
| Other receivables and prepaid expenses | 59,968 | |||||||||||||||||||||||||||||
| Total assets | 1,118,105,199 | |||||||||||||||||||||||||||||
| Liabilities | ||||||||||||||||||||||||||||||
| Unrealized depreciation on forward foreign currency exchange contracts | 91,356,422 | |||||||||||||||||||||||||||||
| Payable for fund shares repurchased | 824,001 | |||||||||||||||||||||||||||||
| Payable to affiliates | ||||||||||||||||||||||||||||||
| Accounting and legal services fees | 27,522 | |||||||||||||||||||||||||||||
| Transfer agent fees | 43,115 | |||||||||||||||||||||||||||||
| Trustees' fees | 3,506 | |||||||||||||||||||||||||||||
| Other liabilities and accrued expenses | 85,263 | |||||||||||||||||||||||||||||
| Total liabilities | 92,339,829 | |||||||||||||||||||||||||||||
| Net assets | $1,025,765,370 | |||||||||||||||||||||||||||||
| Net assets consist of | ||||||||||||||||||||||||||||||
| Paid-in capital | $1,173,123,045 | |||||||||||||||||||||||||||||
| Accumulated net investment loss | (12,760,335 | ) | ||||||||||||||||||||||||||||
| Accumulated net realized gain (loss) on investments and foreign currency transactions | (169,122,244 | ) | ||||||||||||||||||||||||||||
| Net unrealized appreciation (depreciation) on investments and translation of assets and liabilities in foreign currencies | 34,524,904 | |||||||||||||||||||||||||||||
| Net assets | $1,025,765,370 | |||||||||||||||||||||||||||||
| Net asset value per share | ||||||||||||||||||||||||||||||
| Based on net asset values and shares outstanding-the fund has an unlimited number of shares authorized with no par value | ||||||||||||||||||||||||||||||
| Class A ($19,229,730 ÷ 2,208,797 shares)1 | $8.71 | |||||||||||||||||||||||||||||
| Class C ($654,014 ÷ 73,906 shares)1 | $8.85 | |||||||||||||||||||||||||||||
| Class I ($215,843,717 ÷ 24,201,178 shares) | $8.92 | |||||||||||||||||||||||||||||
| Class R2 ($111,486 ÷ 12,450 shares) | $8.95 | |||||||||||||||||||||||||||||
| Class R4 ($103,014 ÷ 11,494 shares) | $8.96 | |||||||||||||||||||||||||||||
| Class R6 ($31,922,929 ÷ 3,553,907 shares) | $8.98 | |||||||||||||||||||||||||||||
| Class NAV ($757,900,480 ÷ 84,108,037 shares) | $9.01 | |||||||||||||||||||||||||||||
| Maximum offering price per share | ||||||||||||||||||||||||||||||
| Class A (net asset value per share ÷ 97%)2 | $8.98 | |||||||||||||||||||||||||||||
| 1 | Redemption price per share is equal to net asset value less any applicable contingent deferred sales charge. | ||||||||||||||||
| 2 | On single retail sales of less than $100,000. On sales of $100,000 or more and on group sales the offering price is reduced. | ||||||||||||||||
STATEMENT OF OPERATIONS For the six months ended 1-31-16 (unaudited)
| Investment income | ||||||||||||||||||||||||
| Interest | $808,802 | |||||||||||||||||||||||
| Expenses | ||||||||||||||||||||||||
| Investment management fees | 4,928,164 | |||||||||||||||||||||||
| Distribution and service fees | 34,030 | |||||||||||||||||||||||
| Accounting and legal services fees | 70,103 | |||||||||||||||||||||||
| Transfer agent fees | 141,735 | |||||||||||||||||||||||
| Trustees' fees | 12,365 | |||||||||||||||||||||||
| State registration fees | 46,663 | |||||||||||||||||||||||
| Printing and postage | 23,756 | |||||||||||||||||||||||
| Professional fees | 45,685 | |||||||||||||||||||||||
| Custodian fees | 63,533 | |||||||||||||||||||||||
| Registration and filing fees | 41,529 | |||||||||||||||||||||||
| Other | 12,477 | |||||||||||||||||||||||
| Total expenses | 5,420,040 | |||||||||||||||||||||||
| Less expense reductions | (89,398 | ) | ||||||||||||||||||||||
| Net expenses | 5,330,642 | |||||||||||||||||||||||
| Net investment loss | (4,521,840 | ) | ||||||||||||||||||||||
| Realized and unrealized gain (loss) | ||||||||||||||||||||||||
| Net realized gain (loss) on | ||||||||||||||||||||||||
| Investments and foreign currency transactions | 35,753,197 | |||||||||||||||||||||||
| 35,753,197 | ||||||||||||||||||||||||
| Change in net unrealized appreciation (depreciation) of | ||||||||||||||||||||||||
| Investments and translation of assets and liabilities in foreign currencies | 35,533,974 | |||||||||||||||||||||||
| 35,533,974 | ||||||||||||||||||||||||
| Net realized and unrealized gain | 71,287,171 | |||||||||||||||||||||||
| Increase in net assets from operations | $66,765,331 | |||||||||||||||||||||||
STATEMENTS OF CHANGES IN NET ASSETS
| Six months ended 1-31-16 | Year ended 7-31-15 | |||||||||||||||||||||||||||||||||||||||||||||||
| (unaudited) | ||||||||||||||||||||||||||||||||||||||||||||||||
| Increase (decrease) in net assets | ||||||||||||||||||||||||||||||||||||||||||||||||
| From operations | ||||||||||||||||||||||||||||||||||||||||||||||||
| Net investment loss | ($4,521,840 | ) | ($15,453,235 | ) | ||||||||||||||||||||||||||||||||||||||||||||
| Net realized gain (loss) | 35,753,197 | (174,699,969 | ) | |||||||||||||||||||||||||||||||||||||||||||||
| Change in net unrealized appreciation (depreciation) | 35,533,974 | (28,175,258 | ) | |||||||||||||||||||||||||||||||||||||||||||||
| Increase (decrease) in net assets resulting from operations | 66,765,331 | (218,328,462 | ) | |||||||||||||||||||||||||||||||||||||||||||||
| Distributions to shareholders | ||||||||||||||||||||||||||||||||||||||||||||||||
| From net realized gain | ||||||||||||||||||||||||||||||||||||||||||||||||
| Class A | — | (1,637,943 | ) | |||||||||||||||||||||||||||||||||||||||||||||
| Class C1 | — | (24,236 | ) | |||||||||||||||||||||||||||||||||||||||||||||
| Class I | — | (12,995,769 | ) | |||||||||||||||||||||||||||||||||||||||||||||
| Class R6 | — | (3,057,072 | ) | |||||||||||||||||||||||||||||||||||||||||||||
| Class NAV | — | (42,076,790 | ) | |||||||||||||||||||||||||||||||||||||||||||||
| Total distributions | — | (59,791,810 | ) | |||||||||||||||||||||||||||||||||||||||||||||
| From fund share transactions | (356,980,895 | ) | (289,921,671 | ) | ||||||||||||||||||||||||||||||||||||||||||||
| Total decrease | (290,215,564 | ) | (568,041,943 | ) | ||||||||||||||||||||||||||||||||||||||||||||
| Net assets | ||||||||||||||||||||||||||||||||||||||||||||||||
| Beginning of period | 1,315,980,934 | 1,884,022,877 | ||||||||||||||||||||||||||||||||||||||||||||||
| End of period | $1,025,765,370 | $1,315,980,934 | ||||||||||||||||||||||||||||||||||||||||||||||
| Accumulated net investment loss | ($12,760,335 | ) | ($8,238,495 | ) | ||||||||||||||||||||||||||||||||||||||||||||
| 1 | The inception date for Class C shares is 8-28-14. | ||||||||||||||||||||||||||||||||||||||||||||||||||||
Financial highlights
| Class A Shares Period ended | 1-31-16 | 1 | 7-31-15 | 7-31-14 | 7-31-13 | 7-31-12 | 7-31-11 | 2 | ||||||||||||||||||||||||||||||||||||||||||||||||||||||||||||||||||||||||||||||||||||||||||||||||||||||||||||||
| Per share operating performance | ||||||||||||||||||||||||||||||||||||||||||||||||||||||||||||||||||||||||||||||||||||||||||||||||||||||||||||||||||||||
| Net asset value, beginning of period | $8.23 | $9.63 | $9.91 | $9.16 | $8.58 | $10.00 | ||||||||||||||||||||||||||||||||||||||||||||||||||||||||||||||||||||||||||||||||||||||||||||||||||||||||||||||||
| Net investment loss3 | (0.05 | ) | (0.12 | ) | (0.13 | ) | (0.14 | ) | (0.14 | ) | (0.14 | ) | ||||||||||||||||||||||||||||||||||||||||||||||||||||||||||||||||||||||||||||||||||||||||||||||||||||||||||
| Net realized and unrealized gain (loss) on investments | 0.53 | (0.98 | ) | 0.50 | 1.02 | 0.72 | (1.28 | ) | ||||||||||||||||||||||||||||||||||||||||||||||||||||||||||||||||||||||||||||||||||||||||||||||||||||||||||||||
| Total from investment operations | 0.48 | (1.10 | ) | 0.37 | 0.88 | 0.58 | (1.42 | ) | ||||||||||||||||||||||||||||||||||||||||||||||||||||||||||||||||||||||||||||||||||||||||||||||||||||||||||||||
| Less distributions | ||||||||||||||||||||||||||||||||||||||||||||||||||||||||||||||||||||||||||||||||||||||||||||||||||||||||||||||||||||||
| From net realized gain | — | (0.30 | ) | (0.65 | ) | (0.13 | ) | — | — | |||||||||||||||||||||||||||||||||||||||||||||||||||||||||||||||||||||||||||||||||||||||||||||||||||||||||||||
| Net asset value, end of period | $8.71 | $8.23 | $9.63 | $9.91 | $9.16 | $8.58 | ||||||||||||||||||||||||||||||||||||||||||||||||||||||||||||||||||||||||||||||||||||||||||||||||||||||||||||||||
| Total return (%)4,5 | 5.58 | 6 | (11.51 | ) | 4.13 | 9.69 | 6.76 | (14.20 | ) 6 | |||||||||||||||||||||||||||||||||||||||||||||||||||||||||||||||||||||||||||||||||||||||||||||||||||||||||||||
| Ratios and supplemental data | ||||||||||||||||||||||||||||||||||||||||||||||||||||||||||||||||||||||||||||||||||||||||||||||||||||||||||||||||||||||
| Net assets, end of period (in millions) | $19 | $22 | $48 | $28 | $11 | $6 | ||||||||||||||||||||||||||||||||||||||||||||||||||||||||||||||||||||||||||||||||||||||||||||||||||||||||||||||||
| Ratios (as a percentage of average net assets): | ||||||||||||||||||||||||||||||||||||||||||||||||||||||||||||||||||||||||||||||||||||||||||||||||||||||||||||||||||||||
| Expenses before reductions | 1.36 | 7 | 1.37 | 1.42 | 1.61 | 1.74 | 1.56 | 7 | ||||||||||||||||||||||||||||||||||||||||||||||||||||||||||||||||||||||||||||||||||||||||||||||||||||||||||||||
| Expenses including reductions | 1.35 | 7 | 1.35 | 1.42 | 1.60 | 1.60 | 1.56 | 7 | ||||||||||||||||||||||||||||||||||||||||||||||||||||||||||||||||||||||||||||||||||||||||||||||||||||||||||||||
| Net investment loss | (1.21 | ) 7 | (1.29 | ) | (1.36 | ) | (1.50 | ) | (1.53 | ) | (1.48 | ) 7 | ||||||||||||||||||||||||||||||||||||||||||||||||||||||||||||||||||||||||||||||||||||||||||||||||||||||||||
| Portfolio turnover (%)8 | 0 | 0 | 0 | 0 | 0 | 0 | ||||||||||||||||||||||||||||||||||||||||||||||||||||||||||||||||||||||||||||||||||||||||||||||||||||||||||||||||
| 1 | Six months ended 1-31-16. Unaudited. | ||||||||||||||||||||||||||||||||||||||||||||||||||||||||||||||||||||||||||||||||||
| 2 | Period from 8-2-10 (commencement of operations) to 7-31-11. | ||||||||||||||||||||||||||||||||||||||||||||||||||||||||||||||||||||||||||||||||||
| 3 | Based on average daily shares outstanding. | ||||||||||||||||||||||||||||||||||||||||||||||||||||||||||||||||||||||||||||||||||
| 4 | Total returns would have been lower had certain expenses not been reduced during the applicable periods. | ||||||||||||||||||||||||||||||||||||||||||||||||||||||||||||||||||||||||||||||||||
| 5 | Does not reflect the effect of sales charges, if any. | ||||||||||||||||||||||||||||||||||||||||||||||||||||||||||||||||||||||||||||||||||
| 6 | Not annualized. | ||||||||||||||||||||||||||||||||||||||||||||||||||||||||||||||||||||||||||||||||||
| 7 | Annualized. | ||||||||||||||||||||||||||||||||||||||||||||||||||||||||||||||||||||||||||||||||||
| 8 | The calculation of portfolio turnover excludes amounts from securities whose maturities or expiration dates at the time of acquisition were one year or less, which represents a significant amount of the investments held by the fund. As a result, the portfolio turnover is 0%. | ||||||||||||||||||||||||||||||||||||||||||||||||||||||||||||||||||||||||||||||||||
| Class C Shares Period ended | 1-31-16 | 1 | 7-31-15 | 2 | ||||||||||||||||||||||||||||||||||||||||||||||
| Per share operating performance | ||||||||||||||||||||||||||||||||||||||||||||||||||
| Net asset value, beginning of period | $8.40 | $10.01 | ||||||||||||||||||||||||||||||||||||||||||||||||
| Net investment loss3 | (0.08 | ) | (0.18 | ) | ||||||||||||||||||||||||||||||||||||||||||||||
| Net realized and unrealized gain (loss) on investments | 0.53 | (1.13 | ) | |||||||||||||||||||||||||||||||||||||||||||||||
| Total from investment operations | 0.45 | (1.31 | ) | |||||||||||||||||||||||||||||||||||||||||||||||
| Less distributions | ||||||||||||||||||||||||||||||||||||||||||||||||||
| From net realized gain | — | (0.30 | ) | |||||||||||||||||||||||||||||||||||||||||||||||
| Net asset value, end of period | $8.85 | $8.40 | ||||||||||||||||||||||||||||||||||||||||||||||||
| Total return (%)4,5 | 5.24 | 6 | (13.29 | ) 6 | ||||||||||||||||||||||||||||||||||||||||||||||
| Ratios and supplemental data | ||||||||||||||||||||||||||||||||||||||||||||||||||
| Net assets, end of period (in millions) | $1 | — | 7 | |||||||||||||||||||||||||||||||||||||||||||||||
| Ratios (as a percentage of average net assets): | ||||||||||||||||||||||||||||||||||||||||||||||||||
| Expenses before reductions | 2.06 | 8 | 3.04 | 8 | ||||||||||||||||||||||||||||||||||||||||||||||
| Expenses including reductions | 2.05 | 8 | 2.25 | 8 | ||||||||||||||||||||||||||||||||||||||||||||||
| Net investment loss | (1.90 | ) 8 | (2.19 | ) 8 | ||||||||||||||||||||||||||||||||||||||||||||||
| Portfolio turnover (%)9 | 0 | 0 | ||||||||||||||||||||||||||||||||||||||||||||||||
| 1 | Six months ended 1-31-16. Unaudited. | ||||||||||||||||||||||||||||||||||||||||||||||||||||||||||
| 2 | The inception date for Class C shares is 8-28-14. | ||||||||||||||||||||||||||||||||||||||||||||||||||||||||||
| 3 | Based on average daily shares outstanding. | ||||||||||||||||||||||||||||||||||||||||||||||||||||||||||
| 4 | Total returns would have been lower had certain expenses not been reduced during the period. | ||||||||||||||||||||||||||||||||||||||||||||||||||||||||||
| 5 | Does not reflect the effect of sales charges, if any. | ||||||||||||||||||||||||||||||||||||||||||||||||||||||||||
| 6 | Not annualized. | ||||||||||||||||||||||||||||||||||||||||||||||||||||||||||
| 7 | Less than $500,000. | ||||||||||||||||||||||||||||||||||||||||||||||||||||||||||
| 8 | Annualized. | ||||||||||||||||||||||||||||||||||||||||||||||||||||||||||
| 9 | The calculation of portfolio turnover excludes amounts from securities whose maturities or expiration dates at the time of acquisition were one year or less, which represents a significant amount of the investments held by the fund. As a result, the portfolio turnover is 0%. | ||||||||||||||||||||||||||||||||||||||||||||||||||||||||||
| Class I Shares Period ended | 1-31-16 | 1 | 7-31-15 | 7-31-14 | 7-31-13 | 7-31-12 | 7-31-11 | 2 | ||||||||||||||||||||||||||||||||||||||||||||||||||||||||||||||||||||||||||||||||||||||||||||||||||||||||||||||
| Per share operating performance | ||||||||||||||||||||||||||||||||||||||||||||||||||||||||||||||||||||||||||||||||||||||||||||||||||||||||||||||||||||||
| Net asset value, beginning of period | $8.42 | $9.81 | $10.05 | $9.24 | $8.61 | $10.00 | ||||||||||||||||||||||||||||||||||||||||||||||||||||||||||||||||||||||||||||||||||||||||||||||||||||||||||||||||
| Net investment loss3 | (0.04 | ) | (0.09 | ) | (0.10 | ) | (0.10 | ) | (0.10 | ) | (0.09 | ) | ||||||||||||||||||||||||||||||||||||||||||||||||||||||||||||||||||||||||||||||||||||||||||||||||||||||||||
| Net realized and unrealized gain (loss) on investments | 0.54 | (1.00 | ) | 0.51 | 1.04 | 0.73 | (1.30 | ) | ||||||||||||||||||||||||||||||||||||||||||||||||||||||||||||||||||||||||||||||||||||||||||||||||||||||||||||||
| Total from investment operations | 0.50 | (1.09 | ) | 0.41 | 0.94 | 0.63 | (1.39 | ) | ||||||||||||||||||||||||||||||||||||||||||||||||||||||||||||||||||||||||||||||||||||||||||||||||||||||||||||||
| Less distributions | ||||||||||||||||||||||||||||||||||||||||||||||||||||||||||||||||||||||||||||||||||||||||||||||||||||||||||||||||||||||
| From net realized gain | — | (0.30 | ) | (0.65 | ) | (0.13 | ) | — | — | |||||||||||||||||||||||||||||||||||||||||||||||||||||||||||||||||||||||||||||||||||||||||||||||||||||||||||||
| Net asset value, end of period | $8.92 | $8.42 | $9.81 | $10.05 | $9.24 | $8.61 | ||||||||||||||||||||||||||||||||||||||||||||||||||||||||||||||||||||||||||||||||||||||||||||||||||||||||||||||||
| Total return (%)4 | 5.82 | 5 | (11.29 | ) | 4.49 | 10.26 | 7.32 | (13.90 | ) 5 | |||||||||||||||||||||||||||||||||||||||||||||||||||||||||||||||||||||||||||||||||||||||||||||||||||||||||||||
| Ratios and supplemental data | ||||||||||||||||||||||||||||||||||||||||||||||||||||||||||||||||||||||||||||||||||||||||||||||||||||||||||||||||||||||
| Net assets, end of period (in millions) | $216 | $371 | $392 | $65 | $43 | $26 | ||||||||||||||||||||||||||||||||||||||||||||||||||||||||||||||||||||||||||||||||||||||||||||||||||||||||||||||||
| Ratios (as a percentage of average net assets): | ||||||||||||||||||||||||||||||||||||||||||||||||||||||||||||||||||||||||||||||||||||||||||||||||||||||||||||||||||||||
| Expenses before reductions | 1.05 | 6 | 1.03 | 1.05 | 1.11 | 1.17 | 1.05 | 6 | ||||||||||||||||||||||||||||||||||||||||||||||||||||||||||||||||||||||||||||||||||||||||||||||||||||||||||||||
| Expenses including reductions | 1.03 | 6 | 1.02 | 1.05 | 1.11 | 1.17 | 1.05 | 6 | ||||||||||||||||||||||||||||||||||||||||||||||||||||||||||||||||||||||||||||||||||||||||||||||||||||||||||||||
| Net investment loss | (0.89 | ) 6 | (0.96 | ) | (1.00 | ) | (1.01 | ) | (1.10 | ) | (0.98 | ) 6 | ||||||||||||||||||||||||||||||||||||||||||||||||||||||||||||||||||||||||||||||||||||||||||||||||||||||||||
| Portfolio turnover (%)7 | 0 | 0 | 0 | 0 | 0 | 0 | ||||||||||||||||||||||||||||||||||||||||||||||||||||||||||||||||||||||||||||||||||||||||||||||||||||||||||||||||
| 1 | Six months ended 1-31-16. Unaudited. | ||||||||||||||||||||||||||||||||||||||||||||||||||||||||||||||||||||||||||||||||||
| 2 | Period from 8-2-10 (commencement of operations) to 7-31-11. | ||||||||||||||||||||||||||||||||||||||||||||||||||||||||||||||||||||||||||||||||||
| 3 | Based on average daily shares outstanding. | ||||||||||||||||||||||||||||||||||||||||||||||||||||||||||||||||||||||||||||||||||
| 4 | Total returns would have been lower had certain expenses not been reduced during the applicable periods. | ||||||||||||||||||||||||||||||||||||||||||||||||||||||||||||||||||||||||||||||||||
| 5 | Not annualized. | ||||||||||||||||||||||||||||||||||||||||||||||||||||||||||||||||||||||||||||||||||
| 6 | Annualized. | ||||||||||||||||||||||||||||||||||||||||||||||||||||||||||||||||||||||||||||||||||
| 7 | The calculation of portfolio turnover excludes amounts from securities whose maturities or expiration dates at the time of acquisition were one year or less, which represents a significant amount of the investments held by the fund. As a result, the portfolio turnover is 0%. | ||||||||||||||||||||||||||||||||||||||||||||||||||||||||||||||||||||||||||||||||||
| Class R2 Shares Period ended | 1-31-16 | 1 | 7-31-15 | 2 | ||||||||||||||||||||||||||||||||||||||||||||||
| Per share operating performance | ||||||||||||||||||||||||||||||||||||||||||||||||||
| Net asset value, beginning of period | $8.46 | $8.70 | ||||||||||||||||||||||||||||||||||||||||||||||||
| Net investment loss3 | (0.05 | ) | (0.03 | ) | ||||||||||||||||||||||||||||||||||||||||||||||
| Net realized and unrealized gain (loss) on investments | 0.54 | (0.21 | ) | |||||||||||||||||||||||||||||||||||||||||||||||
| Total from investment operations | 0.49 | (0.24 | ) | |||||||||||||||||||||||||||||||||||||||||||||||
| Net asset value, end of period | $8.95 | $8.46 | ||||||||||||||||||||||||||||||||||||||||||||||||
| Total return (%)4 | 5.79 | 5 | (2.76 | ) 5 | ||||||||||||||||||||||||||||||||||||||||||||||
| Ratios and supplemental data | ||||||||||||||||||||||||||||||||||||||||||||||||||
| Net assets, end of period (in millions) | — | 6 | — | 6 | ||||||||||||||||||||||||||||||||||||||||||||||
| Ratios (as a percentage of average net assets): | ||||||||||||||||||||||||||||||||||||||||||||||||||
| Expenses before reductions | 1.21 | 7 | 1.18 | 7 | ||||||||||||||||||||||||||||||||||||||||||||||
| Expenses including reductions | 1.19 | 7 | 1.16 | 7 | ||||||||||||||||||||||||||||||||||||||||||||||
| Net investment loss | (1.05 | ) 7 | (1.08 | ) 7 | ||||||||||||||||||||||||||||||||||||||||||||||
| Portfolio turnover (%)8 | 0 | 0 | ||||||||||||||||||||||||||||||||||||||||||||||||
| 1 | Six months ended 1-31-16. Unaudited. | ||||||||||||||||||||||||||||||||||||||||||||||||||||||||||
| 2 | The inception date for Class R2 shares is 3-27-15. | ||||||||||||||||||||||||||||||||||||||||||||||||||||||||||
| 3 | Based on average daily shares outstanding. | ||||||||||||||||||||||||||||||||||||||||||||||||||||||||||
| 4 | Total returns would have been lower had certain expenses not been reduced during the period. | ||||||||||||||||||||||||||||||||||||||||||||||||||||||||||
| 5 | Not annualized. | ||||||||||||||||||||||||||||||||||||||||||||||||||||||||||
| 6 | Less than $500,000. | ||||||||||||||||||||||||||||||||||||||||||||||||||||||||||
| 7 | Annualized. | ||||||||||||||||||||||||||||||||||||||||||||||||||||||||||
| 8 | The calculation of portfolio turnover excludes amounts from securities whose maturities or expiration dates at the time of acquisition were one year or less, which represents a significant amount of the investments held by the fund. As a result, the portfolio turnover is 0%. | ||||||||||||||||||||||||||||||||||||||||||||||||||||||||||
| Class R4 Shares Period ended | 1-31-16 | 1 | 7-31-15 | 2 | ||||||||||||||||||||||||||||||||||||||||||||||
| Per share operating performance | ||||||||||||||||||||||||||||||||||||||||||||||||||
| Net asset value, beginning of period | $8.47 | $8.70 | ||||||||||||||||||||||||||||||||||||||||||||||||
| Net investment loss3 | (0.04 | ) | (0.03 | ) | ||||||||||||||||||||||||||||||||||||||||||||||
| Net realized and unrealized gain (loss) on investments | 0.53 | (0.20 | ) | |||||||||||||||||||||||||||||||||||||||||||||||
| Total from investment operations | 0.49 | (0.23 | ) | |||||||||||||||||||||||||||||||||||||||||||||||
| Net asset value, end of period | $8.96 | $8.47 | ||||||||||||||||||||||||||||||||||||||||||||||||
| Total return (%)4 | 5.79 | 5 | (2.64 | ) 5 | ||||||||||||||||||||||||||||||||||||||||||||||
| Ratios and supplemental data | ||||||||||||||||||||||||||||||||||||||||||||||||||
| Net assets, end of period (in millions) | — | 6 | — | 6 | ||||||||||||||||||||||||||||||||||||||||||||||
| Ratios (as a percentage of average net assets): | ||||||||||||||||||||||||||||||||||||||||||||||||||
| Expenses before reductions | 1.21 | 7 | 1.18 | 7 | ||||||||||||||||||||||||||||||||||||||||||||||
| Expenses including reductions | 1.09 | 7 | 1.06 | 7 | ||||||||||||||||||||||||||||||||||||||||||||||
| Net investment loss | (0.94 | ) 7 | (0.98 | ) 7 | ||||||||||||||||||||||||||||||||||||||||||||||
| Portfolio turnover (%)8 | 0 | 0 | ||||||||||||||||||||||||||||||||||||||||||||||||
| 1 | Six months ended 1-31-16. Unaudited. | ||||||||||||||||||||||||||||||||||||||||||||||||||||||||||
| 2 | The inception date for Class R4 shares is 3-27-15. | ||||||||||||||||||||||||||||||||||||||||||||||||||||||||||
| 3 | Based on average daily shares outstanding. | ||||||||||||||||||||||||||||||||||||||||||||||||||||||||||
| 4 | Total returns would have been lower had certain expenses not been reduced during the period. | ||||||||||||||||||||||||||||||||||||||||||||||||||||||||||
| 5 | Not annualized. | ||||||||||||||||||||||||||||||||||||||||||||||||||||||||||
| 6 | Less than $500,000. | ||||||||||||||||||||||||||||||||||||||||||||||||||||||||||
| 7 | Annualized. | ||||||||||||||||||||||||||||||||||||||||||||||||||||||||||
| 8 | The calculation of portfolio turnover excludes amounts from securities whose maturities or expiration dates at the time of acquisition were one year or less, which represents a significant amount of the investments held by the fund. As a result, the portfolio turnover is 0%. | ||||||||||||||||||||||||||||||||||||||||||||||||||||||||||
| Class R6 Shares Period ended | 1-31-16 | 1 | 7-31-15 | 7-31-14 | 7-31-13 | 7-31-12 | 2 | ||||||||||||||||||||||||||||||||||||||||||||||||||||||||||||||||||||||||||||||||||||||||||||||||
| Per share operating performance | |||||||||||||||||||||||||||||||||||||||||||||||||||||||||||||||||||||||||||||||||||||||||||||||||||||||
| Net asset value, beginning of period | $8.48 | $9.86 | $10.09 | $9.27 | $9.29 | ||||||||||||||||||||||||||||||||||||||||||||||||||||||||||||||||||||||||||||||||||||||||||||||||||
| Net investment loss3 | (0.03 | ) | (0.08 | ) | (0.09 | ) | (0.09 | ) | (0.07 | ) | |||||||||||||||||||||||||||||||||||||||||||||||||||||||||||||||||||||||||||||||||||||||||||||
| Net realized and unrealized gain (loss) on investments | 0.53 | (1.00 | ) | 0.51 | 1.04 | 0.05 | |||||||||||||||||||||||||||||||||||||||||||||||||||||||||||||||||||||||||||||||||||||||||||||||||
| Total from investment operations | 0.50 | (1.08 | ) | 0.42 | 0.95 | (0.02 | ) | ||||||||||||||||||||||||||||||||||||||||||||||||||||||||||||||||||||||||||||||||||||||||||||||||
| Less distributions | |||||||||||||||||||||||||||||||||||||||||||||||||||||||||||||||||||||||||||||||||||||||||||||||||||||||
| From net realized gain | — | (0.30 | ) | (0.65 | ) | (0.13 | ) | — | |||||||||||||||||||||||||||||||||||||||||||||||||||||||||||||||||||||||||||||||||||||||||||||||
| Net asset value, end of period | $8.98 | $8.48 | $9.86 | $10.09 | $9.27 | ||||||||||||||||||||||||||||||||||||||||||||||||||||||||||||||||||||||||||||||||||||||||||||||||||
| Total return (%)4 | 5.90 | 5 | (11.13 | ) | 4.58 | 10.34 | (0.22 | ) 5 | |||||||||||||||||||||||||||||||||||||||||||||||||||||||||||||||||||||||||||||||||||||||||||||||
| Ratios and supplemental data | |||||||||||||||||||||||||||||||||||||||||||||||||||||||||||||||||||||||||||||||||||||||||||||||||||||||
| Net assets, end of period (in millions) | $32 | $37 | $81 | $4 | $3 | ||||||||||||||||||||||||||||||||||||||||||||||||||||||||||||||||||||||||||||||||||||||||||||||||||
| Ratios (as a percentage of average net assets): | |||||||||||||||||||||||||||||||||||||||||||||||||||||||||||||||||||||||||||||||||||||||||||||||||||||||
| Expenses before reductions | 0.96 | 6 | 0.94 | 1.04 | 1.52 | 1.40 | 6 | ||||||||||||||||||||||||||||||||||||||||||||||||||||||||||||||||||||||||||||||||||||||||||||||||
| Expenses including reductions | 0.92 | 6 | 0.90 | 0.99 | 1.05 | 1.05 | 6 | ||||||||||||||||||||||||||||||||||||||||||||||||||||||||||||||||||||||||||||||||||||||||||||||||
| Net investment loss | (0.79 | ) 6 | (0.84 | ) | (0.94 | ) | (0.95 | ) | (0.97 | ) 6 | |||||||||||||||||||||||||||||||||||||||||||||||||||||||||||||||||||||||||||||||||||||||||||||
| Portfolio turnover (%)7 | 0 | 0 | 0 | 0 | 0 | ||||||||||||||||||||||||||||||||||||||||||||||||||||||||||||||||||||||||||||||||||||||||||||||||||
| 1 | Six months ended 1-31-16. Unaudited. | ||||||||||||||||||||||||||||||||||||||||||||||||||||||||||||||||||||||||||||||||||
| 2 | The inception date for Class R6 shares is 11-1-11. | ||||||||||||||||||||||||||||||||||||||||||||||||||||||||||||||||||||||||||||||||||
| 3 | Based on average daily shares outstanding. | ||||||||||||||||||||||||||||||||||||||||||||||||||||||||||||||||||||||||||||||||||
| 4 | Total returns would have been lower had certain expenses not been reduced during the applicable periods. | ||||||||||||||||||||||||||||||||||||||||||||||||||||||||||||||||||||||||||||||||||
| 5 | Not annualized. | ||||||||||||||||||||||||||||||||||||||||||||||||||||||||||||||||||||||||||||||||||
| 6 | Annualized. | ||||||||||||||||||||||||||||||||||||||||||||||||||||||||||||||||||||||||||||||||||
| 7 | The calculation of portfolio turnover excludes amounts from securities whose maturities or expiration dates at the time of acquisition were one year or less, which represents a significant amount of the investments held by the fund. As a result, the portfolio turnover is 0%. | ||||||||||||||||||||||||||||||||||||||||||||||||||||||||||||||||||||||||||||||||||
| Class NAV Shares Period ended | 1-31-16 | 1 | 7-31-15 | 7-31-14 | 7-31-13 | 7-31-12 | 7-31-11 | 2 | ||||||||||||||||||||||||||||||||||||||||||||||||||||||||||||||||||||||||||||||||||||||||||||||||||||||||||||||
| Per share operating performance | ||||||||||||||||||||||||||||||||||||||||||||||||||||||||||||||||||||||||||||||||||||||||||||||||||||||||||||||||||||||
| Net asset value, beginning of period | $8.50 | $9.89 | $10.11 | $9.28 | $8.63 | $10.00 | ||||||||||||||||||||||||||||||||||||||||||||||||||||||||||||||||||||||||||||||||||||||||||||||||||||||||||||||||
| Net investment loss3 | (0.03 | ) | (0.08 | ) | (0.08 | ) | (0.08 | ) | (0.08 | ) | (0.08 | ) | ||||||||||||||||||||||||||||||||||||||||||||||||||||||||||||||||||||||||||||||||||||||||||||||||||||||||||
| Net realized and unrealized gain (loss) on investments | 0.54 | (1.01 | ) | 0.51 | 1.04 | 0.73 | (1.29 | ) | ||||||||||||||||||||||||||||||||||||||||||||||||||||||||||||||||||||||||||||||||||||||||||||||||||||||||||||||
| Total from investment operations | 0.51 | (1.09 | ) | 0.43 | 0.96 | 0.65 | (1.37 | ) | ||||||||||||||||||||||||||||||||||||||||||||||||||||||||||||||||||||||||||||||||||||||||||||||||||||||||||||||
| Less distributions | ||||||||||||||||||||||||||||||||||||||||||||||||||||||||||||||||||||||||||||||||||||||||||||||||||||||||||||||||||||||
| From net realized gain | — | (0.30 | ) | (0.65 | ) | (0.13 | ) | — | — | |||||||||||||||||||||||||||||||||||||||||||||||||||||||||||||||||||||||||||||||||||||||||||||||||||||||||||||
| Net asset value, end of period | $9.01 | $8.50 | $9.89 | $10.11 | $9.28 | $8.63 | ||||||||||||||||||||||||||||||||||||||||||||||||||||||||||||||||||||||||||||||||||||||||||||||||||||||||||||||||
| Total return (%)4 | 5.88 | 5 | (11.10 | ) | 4.66 | 10.43 | 7.53 | (13.70 | ) 5 | |||||||||||||||||||||||||||||||||||||||||||||||||||||||||||||||||||||||||||||||||||||||||||||||||||||||||||||
| Ratios and supplemental data | ||||||||||||||||||||||||||||||||||||||||||||||||||||||||||||||||||||||||||||||||||||||||||||||||||||||||||||||||||||||
| Net assets, end of period (in millions) | $758 | $886 | $1,363 | $1,098 | $901 | $878 | ||||||||||||||||||||||||||||||||||||||||||||||||||||||||||||||||||||||||||||||||||||||||||||||||||||||||||||||||
| Ratios (as a percentage of average net assets): | ||||||||||||||||||||||||||||||||||||||||||||||||||||||||||||||||||||||||||||||||||||||||||||||||||||||||||||||||||||||
| Expenses before reductions | 0.94 | 6 | 0.91 | 0.91 | 0.92 | 0.94 | 0.95 | 6 | ||||||||||||||||||||||||||||||||||||||||||||||||||||||||||||||||||||||||||||||||||||||||||||||||||||||||||||||
| Expenses including reductions | 0.93 | 6 | 0.90 | 0.91 | 0.92 | 0.93 | 0.95 | 6 | ||||||||||||||||||||||||||||||||||||||||||||||||||||||||||||||||||||||||||||||||||||||||||||||||||||||||||||||
| Net investment loss | (0.78 | ) 6 | (0.84 | ) | (0.85 | ) | (0.82 | ) | (0.86 | ) | (0.86 | ) 6 | ||||||||||||||||||||||||||||||||||||||||||||||||||||||||||||||||||||||||||||||||||||||||||||||||||||||||||
| Portfolio turnover (%)7 | 0 | 0 | 0 | 0 | 0 | 0 | ||||||||||||||||||||||||||||||||||||||||||||||||||||||||||||||||||||||||||||||||||||||||||||||||||||||||||||||||
| 1 | Six months ended 1-31-16. Unaudited. | ||||||||||||||||||||||||||||||||||||||||||||||||||||||||||||||||||||||||||||||||||
| 2 | Period from 8-2-10 (commencement of operations) to 7-31-11. | ||||||||||||||||||||||||||||||||||||||||||||||||||||||||||||||||||||||||||||||||||
| 3 | Based on average daily shares outstanding. | ||||||||||||||||||||||||||||||||||||||||||||||||||||||||||||||||||||||||||||||||||
| 4 | Total returns would have been lower had certain expenses not been reduced during the applicable periods. | ||||||||||||||||||||||||||||||||||||||||||||||||||||||||||||||||||||||||||||||||||
| 5 | Not annualized. | ||||||||||||||||||||||||||||||||||||||||||||||||||||||||||||||||||||||||||||||||||
| 6 | Annualized. | ||||||||||||||||||||||||||||||||||||||||||||||||||||||||||||||||||||||||||||||||||
| 7 | The calculation of portfolio turnover excludes amounts from securities whose maturities or expiration dates at the time of acquisition were one year or less, which represents a significant amount of the investments held by the fund. As a result, the portfolio turnover is 0%. | ||||||||||||||||||||||||||||||||||||||||||||||||||||||||||||||||||||||||||||||||||
Note 1 — Organization
John Hancock Absolute Return Currency Fund (the fund) is a series of John Hancock Funds II (the Trust), an open-end management investment company organized as a Massachusetts business trust and registered under the Investment Company Act of 1940, as amended (the 1940 Act). The investment objective of the fund is to seek to achieve absolute return from investments in currency markets.
The fund may offer multiple classes of shares. The shares currently offered are detailed in the Statement of assets and liabilities. Class A and Class C shares are offered to all investors. Class I shares are offered to institutions and certain investors. Class R2 and R4 shares are available only to certain retirement plans. Class R6 shares are available only to certain retirement plans, institutions and other investors. Class NAV shares are offered to John Hancock affiliated funds of funds and certain 529 plans. Shareholders of each class have exclusive voting rights to matters that affect that class. The distribution and service fees, if any, and transfer agent fees, for each class may differ.
Note 2 — Significant accounting policies
The financial statements have been prepared in conformity with accounting principles generally accepted in the United States of America (US GAAP), which require management to make certain estimates and assumptions as of the date of the financial statements. Actual results could differ from those estimates and those differences could be significant. The fund qualifies as an investment company under Topic 946 of Accounting Standards Codification of US GAAP.
Events or transactions occurring after the end of the fiscal period through the date that the financial statements were issued have been evaluated in the preparation of the financial statements. The following summarizes the significant accounting policies of the fund:
Security valuation. Investments are stated at value as of the close of regular trading on the New York Stock Exchange (NYSE), normally at 4:00 p.m., Eastern Time. In order to value the securities, the fund uses the following valuation techniques: Investments by the fund in open-end mutual funds are valued at their respective net asset values each business day. Debt obligations are valued based on the evaluated prices provided by an independent pricing vendor or from broker-dealers. Independent pricing vendors utilize matrix pricing which takes into account factors such as institutional-size trading in similar groups of securities, yield, quality, coupon rate, maturity, type of issue, trading characteristics and other market data, as well as broker supplied prices. Foreign securities and currencies, including forward foreign currency contracts, are valued in U.S. dollars, based on foreign currency exchange rates supplied by an independent pricing vendor. Securities that trade only in the over-the-counter (OTC) market are valued using bid prices. Other portfolio securities and assets, for which reliable market quotations are not readily available, are valued at fair value as determined in good faith by the fund's Pricing Committee following procedures established by the Board of Trustees. The frequency with which these fair valuation procedures are used cannot be predicted and fair value securities may differ significantly from the value that would have been used had a ready market for such securities existed.
The fund uses a three-tier hierarchy to prioritize the pricing assumptions, referred to as inputs, used in valuation techniques to measure fair value. Level 1 includes securities valued using quoted prices in active markets for identical securities. Level 2 includes securities valued using other significant observable inputs. Observable inputs may include quoted prices for similar securities, interest rates, prepayment speeds and credit risk. Prices for securities valued using these inputs are received from independent pricing vendors and brokers and are based on an evaluation of the inputs described. Level 3 includes securities valued using significant unobservable inputs when market prices are not readily available or reliable, including the fund's own assumptions in determining the fair value of investments. Factors used in determining value may include market or issuer specific events or trends, changes in interest rates and credit quality. The inputs or methodology used for valuing securities are not necessarily an indication of the risks associated with investing in those securities. Changes in valuation techniques and related inputs may result in transfers into or out of an assigned level within the disclosure hierarchy.
As of January 31, 2016, all investments are categorized as Level 2 under the hierarchy described above, except for the money market fund, which is categorized as Level 1.
Security transactions and related investment income. Investment security transactions are accounted for on a trade date plus one basis for daily net asset value calculations. However, for financial reporting purposes, investment transactions are reported on trade date. Interest income is accrued as earned. Interest income includes coupon interest and amortization/accretion of premiums/discounts on debt securities. Debt obligations may be placed in a non-accrual status and related interest income may be reduced by stopping current accruals and writing off interest receivable when the collection of all or a portion of interest has become doubtful. Gains and losses on securities sold are determined on the basis of identified cost and may include proceeds from litigation.
Foreign currency translation. Assets, including investments and liabilities denominated in foreign currencies, are translated into U.S. dollar values each day at the prevailing exchange rate. Purchases and sales of securities, income and expenses are translated into U.S. dollars at the prevailing exchange rate on the date of the transaction. The effect of changes in foreign currency exchange rates on the value of securities is reflected as a component of the realized and unrealized gains (losses) on investments.
Funds that invest internationally generally carry more risk than funds that invest strictly in U.S. securities. Risks can result from differences in economic and political conditions, regulations, market practices (including higher transaction costs), accounting standards and other factors. Foreign investments are also subject to a decline in the value of a foreign currency versus the U.S. dollar, which reduces the dollar value of securities denominated in that currency.
Line of credit. The fund may borrow from banks for temporary or emergency purposes, including meeting redemption requests that otherwise might require the untimely sale of securities. Pursuant to the fund's custodian agreement, the custodian may loan money to funds to make properly authorized payments. The fund is obligated to repay the custodian for any overdraft, including any related costs or expenses. The custodian may have a lien, security interest or security entitlement in any fund property that is not otherwise segregated or pledged, to the extent of any overdraft, and to the maximum extent permitted by law.
The fund and other affiliated funds have entered into a syndicated line of credit agreement, with Citibank, N.A. as the administrative agent, that enables them to participate in a $750 million unsecured committed line of credit. A commitment fee, payable at the end of each calendar quarter, based on the average daily unused portion of the effective line of credit, is charged to each participating fund on a pro rata basis and is reflected in Other expenses on the Statement of operations. Commitment fees for the six months ended January 31, 2016 were $708. For the six months ended January 31, 2016, the fund had no borrowings under the line of credit.
Expenses. Within the John Hancock group of funds complex, expenses that are directly attributable to an individual fund are allocated to such fund. Expenses that are not readily attributable to a specific fund are allocated among all funds in an equitable manner, taking into consideration, among other things, the nature and type of expense and the fund's relative net assets. Expense estimates are accrued in the period to which they relate and adjustments are made when actual amounts are known.
Class allocations. Income, common expenses and realized and unrealized gains (losses) are determined at the fund level and allocated daily to each class of shares based on the net assets of the class. Class-specific expenses, such as distribution and service fees, if any, and transfer agent fees, for all classes, are calculated daily at the class level based on the net assets of each class and the specific expense rates applicable to each class.
Federal income taxes. The fund intends to continue to qualify as a regulated investment company by complying with the applicable provisions of the Internal Revenue Code and will not be subject to federal income tax on taxable income that is distributed to shareholders. Therefore, no federal income tax provision is required.
For federal income tax purposes, as of July 31, 2015, the fund has a short-term capital loss carryfoward of $62,479,939 and a long-term capital loss carryforward of $150,700,240 available to offset future net realized capital gains. These carryforwards do not expire.
As of July 31, 2015, the fund had no uncertain tax positions that would require financial statement recognition, derecognition or disclosure. The fund's federal tax returns are subject to examination by the Internal Revenue Service for a period of three years.
Distribution of income and gains. Distributions to shareholders from net investment income and net realized gains, if any, are recorded on the ex-date. The fund generally declares and pays dividends and capital gain distributions, if any, annually.
Distributions paid by the fund with respect to each class of shares are calculated in the same manner, at the same time and in the same amount, except for the effect of class level expenses that may be applied differently to each class.
Such distributions, on a tax basis, are determined in conformity with income tax regulations, which may differ from US GAAP.
Capital accounts within the financial statements are adjusted for permanent book-tax differences. These adjustments have no impact on net assets or the results of operations. Temporary book-tax differences, if any, will reverse in a subsequent period. Book-tax differences are primarily attributable to net operating losses and derivative transactions.
Note 3 — Derivative instruments
The fund may invest in derivatives in order to meet its investment objective. Derivatives include a variety of different instruments that may be traded in the OTC market, on a regulated exchange or through a clearing facility. The risks in using derivatives vary depending upon the structure of the instruments, including the use of leverage, optionality, the liquidity or lack of liquidity of the contract, the creditworthiness of the counterparty or clearing organization and the volatility of the position. Some derivatives involve risks that are potentially greater than the risks associated with investing directly in the referenced securities or other referenced underlying instrument. Specifically, the fund is exposed to the risk that the counterparty to an OTC derivatives contract will be unable or unwilling to make timely settlement payments or otherwise honor its obligations. OTC derivatives transactions typically can only be closed out with the other party to the transaction.
Forward foreign currency contracts are typically traded through the OTC market. Certain forwards are regulated by the Commodity Futures Trading Commission as swaps. Derivative counterparty risk is managed through an ongoing evaluation of the creditworthiness of all potential counterparties and, if applicable, designated clearing organizations. The fund attempts to reduce its exposure to counterparty risk for derivatives traded in the OTC market, whenever possible, by entering into an International Swaps and Derivatives Association (ISDA) Master Agreement with each of its OTC counterparties. The ISDA gives each party to the agreement the right to terminate all transactions traded under the agreement if there is certain deterioration in the credit quality or contractual default of the other party, as defined in the ISDA. Upon an event of default or a termination of the ISDA, the non-defaulting party has the right to close out all transactions and to net amounts owed.
As defined by the ISDA, the fund may have collateral agreements with certain counterparties to mitigate counterparty risk on OTC derivatives. Subject to established minimum levels, collateral for OTC transactions is generally determined based on the net aggregate unrealized gain or loss on contracts with a particular counterparty. Collateral pledged to the fund is held in a segregated account by a third-party agent or held by the custodian bank for the benefit of the fund and can be in the form of cash or debt securities issued by the U.S. government or related agencies; collateral posted by the fund for OTC transactions is held in a segregated account at the fund's custodian and is noted in the accompanying Fund's investments. The fund's maximum risk of loss due to counterparty risk is equal to the asset value of outstanding contracts offset by collateral received.
Forward foreign currency contracts. A forward foreign currency contract is an agreement between two parties to buy and sell specific currencies at a price that is set on the date of the contract. The forward contract calls for delivery of the currencies on a future date that is specified in the contract. Risks related to the use of forwards include the possible failure of counterparties to meet the terms of the forward agreement, the failure of the counterparties to timely post collateral if applicable, the risk that currency movements will not favor the fund thereby reducing the fund's total return, and the potential for losses in excess of the amounts recognized on the Statement of assets and liabilities.
The market value of a forward foreign currency contract fluctuates with changes in foreign currency exchange rates. Forward foreign currency contracts are marked-to-market daily and the change in value is recorded by the fund as an unrealized gain or loss. Realized gains or losses, equal to the difference between the value of the contract at the time it was opened and the value at the time it was closed, are recorded upon delivery or receipt of the currency or settlement with the counterparty.
During the six months ended January 31, 2016, the fund used forward foreign currency contracts to manage and gain exposure to foreign currencies. During the six months ended January 31, 2016, the fund held forward foreign currency contracts with U.S. dollar notional values ranging from $8.4 billion to $14.8 billion, as measured at each quarter end. The contracts held by the fund at January 31, 2016 are presented in the Fund's investments.
Fair value of derivative instruments by risk category
The table below summarizes the fair value of derivatives held by the fund at January 31, 2016 by risk category:
| Risk | Statement of assets and liabilities location |
Financial instruments location |
Asset derivatives fair value |
Liabilities derivatives fair value |
||||||||||
| Foreign currency | Unrealized appreciation/depreciation on forward foreign currency exchange contracts |
Forward foreign currency contracts |
$126,147,101 | ($91,356,422 | ) |
For financial reporting purposes, the fund does not offset OTC derivative assets or liabilities that are subject to master netting arrangements, as defined by the ISDAs, in the Statement of assets and liabilities. In the event of default by the counterparty or a termination of the agreement, the ISDA allows an offset of amounts across the various transactions between the fund and the applicable counterparty. The table below reflects the fund's exposure to counterparties subject to an ISDA for OTC derivative transactions:
| Counterparty | Total market value of OTC derivatives |
Collateral posted by counterparty |
Collateral posted by fund |
Net exposure |
||||||||||
| Barclays Bank PLC Wholesale | $39,009,886 | $39,697,000 | — | ($687,114 | ) | |||||||||
| Deutsche Bank AG London | 13,421,478 | 12,530,000 | — | 891,478 | ||||||||||
| J. Aron & Company | 6,569,797 | 18,810,000 | — | (12,240,203 | ) | |||||||||
| Morgan Stanley Capital Services, Inc. | (20,503,777 | ) | — | $26,214,367 | 5,710,590 | |||||||||
| State Street Bank and Trust Company | (3,706,705 | ) | — | 3,463,801 | (242,904 | ) | ||||||||
| Totals | $34,790,679 | $71,037,000 | $29,678,168 | ($6,568,153 | ) |
Effect of derivative instruments on the Statement of operations
The table below summarizes the net realized gain (loss) included in the net increase (decrease) in net assets from operations, classified by derivative instrument and risk category, for the six months ended January 31, 2016:
| Risk | Statement of operations location | Investments and foreign currency transactions* |
| Foreign currency | Net realized gain (loss) on | $35,909,276 |
*Realized gain/loss associated with forward foreign currency contracts is included in this caption on the Statement of operations.
The table below summarizes the net change in unrealized appreciation (depreciation) included in the net increase (decrease) in net assets from operations, classified by derivative instrument and risk category, for the six months ended January 31, 2016:
| Risk | Statement of operations location | Investments and translation of assets and liabilities in foreign currencies* |
| Foreign currency | Change in unrealized appreciation (depreciation) |
$35,838,508 |
*Change in unrealized appreciation/depreciation associated with forward foreign currency contracts is included in this caption on the Statement of operations.
Note 4 — Guarantees and indemnifications
Under the Trust's organizational documents, its Officers and Trustees are indemnified against certain liabilities arising out of the performance of their duties to the Trust, including the fund. Additionally, in the normal course of business, the fund enters into contracts with service providers that contain general indemnification clauses. The fund's maximum exposure under these arrangements is unknown, as this would involve future claims that may be made against the fund that have not yet occurred. The risk of material loss from such claims is considered remote.
Note 5 — Fees and transactions with affiliates
John Hancock Advisers, LLC (the Advisor) serves as investment advisor for the fund. John Hancock Funds, LLC (the Distributor), an affiliate of the Advisor, serves as principal underwriter of the fund. The Advisor and the Distributor are indirect, wholly owned subsidiaries of Manulife Financial Corporation (MFC).
Management fee. The fund has an investment management agreement with the Advisor under which the fund pays a daily management fee to the Advisor. on an annual basis, equal to the sum of: a) 0.95% of the first $250 million of the fund's average daily net assets; b) 0.90% of the next $250 million of the fund's average daily net assets; and c) 0.85% of the fund's average daily net assets in excess of $500 million. The Advisor has a subadvisory agreement with First Quadrant, L.P. The fund is not responsible for payment of the subadvisory fees.
The Advisor has contractually agreed to waive a portion of its management fee and/or reimburse expenses for certain funds of the John Hancock funds complex, including the fund (the participating portfolios). This waiver is based upon aggregate net assets of all the participating portfolios. The amount of the reimbursement is calculated daily and allocated among all the participating portfolios in proportion to the daily net assets of each fund. During the six months ended January 31, 2016, this waiver amounted to 0.01% of the fund's average net assets on an annualized basis. This arrangement may be amended or terminated at any time by the Advisor upon notice to the fund and with the approval of the Board of Trustees.
Prior to December 1, 2015, the Advisor had contractually agreed to reduce all or a portion of its management fee and/or make payment to the fund to the extent necessary to maintain the fund's total operating expenses at 2.25% for Class C shares, excluding certain expenses such as taxes, brokerage commissions, interest expense, litigation and indemnification expenses and other extraordinary expenses not incurred in the ordinary course of the fund's business, underlying fund expenses (acquired fund fees) and short dividend expense.
The Advisor has contractually agreed to waive and/or reimburse all class-specific expenses for Class R6 shares of the fund to the extent they exceed 0.00% of average annual net assets (on an annualized basis) attributable to Class R6 shares (the class expense waiver). The class expense waiver expires on November 30, 2016, unless renewed by mutual agreement of the fund and the Advisor based upon a determination that this is appropriate under the circumstances at that time.
Prior to December 1, 2015, the Advisor had voluntarily agreed to waive and/or reimburse all blue sky fees and printing and postage for the fund. Effective December 1, 2015 the Advisor has voluntarily agreed to reduce its management fee for the fund, or if necessary make payment to the fund, in an amount equal to the amount by which the expenses of the fund exceed 0.15% of the average annual net assets (on an annualized basis) of the fund. For purposes of this agreement, "expenses of the fund" means all fund expenses, excluding taxes, brokerage commissions, interest expense, litigation and indemnification expenses and other extraordinary expenses not incurred in the ordinary course of the fund's business, advisory fees, Rule 12b-1 fees, transfer agency fees and service fees, underlying fund expenses (acquired fund fees) and short dividend expense. This agreement will continue in effect until terminated at any time by the advisor on notice to the fund.
The expense reductions described above amounted to the following for the six months ended January 31, 2016:
| Class | Expense reductions | Class | Expense reductions | |
| Class A | $1,597 | Class R4 | $4 | |
| Class C | 47 | Class R6 | 5,738 | |
| Class I | 17,792 | Class NAV | 64,161 | |
| Class R2 | 8 | Total | $89,347 |
The investment management fees, including the impact of the waivers and reimbursements as described above, incurred for the six months ended January 31, 2016 were equivalent to a net annual effective rate of 0.87% of the fund's average daily net assets.
Accounting and legal services. Pursuant to a service agreement, the fund reimburses the Advisor for all expenses associated with providing the administrative, financial, legal, accounting and recordkeeping services to the fund, including the preparation of all tax returns, periodic reports to shareholders and regulatory reports, among other services. These expenses are allocated to each share class based on its relative net assets at the time the expense was incurred. These accounting and legal services fees incurred for the period ended January 31, 2016 amounted to an annual rate of 0.01% of the fund's average daily net assets.
Distribution and service plans. The fund has a distribution agreement with the Distributor. The fund has adopted distribution and service plans with respect to Class A, Class C, Class R2 and Class R4 shares pursuant to Rule 12b-1 under the 1940 Act, to pay the Distributor for services provided as the distributor of shares of the fund. In addition, under a service plan for Class R2 and Class R4 shares, the fund pays for certain other services. The fund may pay up to the following contractual rates of distribution and service fees under these arrangements, expressed as an annual percentage of average daily net assets for each class of the fund's shares.
| Class | Rule 12b-1 fee | Service fee | Class | Rule 12b-1 fee | Service fee | |
| Class A | 0.30% | — | Class R2 | 0.25% | 0.25% | |
| Class C | 1.00% | — | Class R4 | 0.25% | 0.10% |
The fund's Distributor has contractually agreed to waive 0.10% of Rule 12b-1 fees for Class R4 shares. The current waiver agreement expires on November 30, 2016, unless renewed by mutual agreement of the fund and the Distributor based upon a determination that this is appropriate under the circumstances at the time. Reimbursements related to this contractual waiver amounted to $51 for Class R4 shares for the six months ended January 31, 2016.
Sales charges. Class A shares are assessed up-front sales charges, which resulted in payments to the Distributor amounting to $10,557 for the period ended January 31, 2016. Of this amount, $2,516 was retained and used for printing prospectuses, advertising, sales literature and other purposes, $8,041 was paid as sales commissions to broker-dealers and $0 was paid as sales commissions to sales personnel of Signator Investors, Inc., a broker-dealer affiliate of the Advisor.
Class A and Class C shares may be subject to contingent deferred sales charges (CDSCs). Certain Class A shares that are acquired through purchases of $1 million or more and are redeemed within one year of purchase are subject to a 1.00% sales charge. Class C shares that are redeemed within one year of purchase are subject to a 1.00% CDSC. CDSCs are applied to the lesser of the current market value at the time of redemption or the original purchase cost of the shares being redeemed. Proceeds from CDSCs are used to compensate the Distributor for providing distribution-related services in connection with the sale of these shares. During the period ended January 31, 2016, CDSCs received by the Distributor amounted to $0 and $231 for Class A and Class C shares, respectively.
Transfer agent fees. The fund has a transfer agent agreement with John Hancock Signature Services, Inc. (Signature Services), an affiliate of the Advisor. The transfer agent fees paid to Signature Services are determined based on the cost to Signature Services (Signature Services Cost) of providing recordkeeping services. It also includes out-of-pocket expenses, including payments made to third-parties for recordkeeping services provided to their clients who invest in one or more John Hancock funds. In addition, Signature Services Cost may be reduced by certain fees that Signature Services receives in
connection with retirement and small accounts. Signature Services Cost is calculated monthly and allocated, as applicable, to five categories of share classes: Retail Share and Institutional Share Classes of Non-Municipal Bond Funds, Class R6 Shares, Retirement Share Classes and Municipal Bond Share Classes. Within each of these categories, the applicable costs are allocated to the affected John Hancock affiliated funds and/or classes, based on the relative average daily net assets.
Class level expenses. Class level expenses for the six months ended January 31, 2016 were:
| Class | Distribution and service fees | Transfer agent fees |
| Class A | $30,686 | $12,602 |
| Class C | 3,086 | 380 |
| Class I | — | 125,848 |
| Class R2 | 132 | 9 |
| Class R4 | 126 | 8 |
| Class R6 | — | 2,888 |
| Total | $34,030 | $141,735 |
Trustee expenses. The fund compensates each Trustee who is not an employee of the Advisor or its affiliates. The costs of paying Trustee compensation and expenses are allocated to each fund based on its net assets relative to other funds within the John Hancock group of funds complex.
Note 6 — Fund share transactions
Transactions in fund shares for the six months ended January 31, 2016 and for the year ended July 31, 2015 were as follows:
| Six months ended 1-31-16 | Year ended 7-31-15 | |||||||||||||||||||||||||
| Shares | Amount | Shares | Amount | |||||||||||||||||||||||
| Class A shares | ||||||||||||||||||||||||||
| Sold | 549,820 | $4,687,687 | 2,012,498 | $18,688,878 | ||||||||||||||||||||||
| Distributions reinvested | — | — | 184,097 | 1,634,783 | ||||||||||||||||||||||
| Repurchased | (996,725 | ) | (8,434,657 | ) | (4,525,325 | ) | (38,916,466 | ) | ||||||||||||||||||
| Net decrease | (446,905 | ) | ($3,746,970 | ) | (2,328,730 | ) | ($18,592,805 | ) | ||||||||||||||||||
| Class C shares1 | ||||||||||||||||||||||||||
| Sold | 34,397 | $300,946 | 116,676 | $1,102,452 | ||||||||||||||||||||||
| Distributions reinvested | — | — | 2,327 | 21,201 | ||||||||||||||||||||||
| Repurchased | (16,172 | ) | (139,778 | ) | (63,322 | ) | (538,099 | ) | ||||||||||||||||||
| Net increase | 18,225 | $161,168 | 55,681 | $585,554 | ||||||||||||||||||||||
| Class I shares | ||||||||||||||||||||||||||
| Sold | 2,493,311 | $21,872,757 | 19,351,101 | $175,981,368 | ||||||||||||||||||||||
| Distributions reinvested | — | — | 1,408,003 | 12,756,508 | ||||||||||||||||||||||
| Repurchased | (22,304,872 | ) | (189,588,869 | ) | (16,750,813 | ) | (149,411,252 | ) | ||||||||||||||||||
| Net increase (decrease) | (19,811,561 | ) | ($167,716,112 | ) | 4,008,291 | $39,326,624 | ||||||||||||||||||||
| Class R2 shares2 | ||||||||||||||||||||||||||
| Sold | 956 | $8,342 | 11,494 | $100,000 | ||||||||||||||||||||||
| Net increase | 956 | $8,342 | 11,494 | $100,000 | ||||||||||||||||||||||
| Class R4 shares2 | ||||||||||||||||||||||||||
| Sold | — | — | 11,494 | $100,000 | ||||||||||||||||||||||
| Net increase | — | — | 11,494 | $100,000 | ||||||||||||||||||||||
| Six months ended 1-31-16 | Year ended 7-31-15 | |||||||||||||||||||||||||
| Shares | Amount | Shares | Amount | |||||||||||||||||||||||
| Class R6 shares | ||||||||||||||||||||||||||
| Sold | 765,020 | $6,694,263 | 5,547,249 | $55,100,978 | ||||||||||||||||||||||
| Distributions reinvested | — | — | 79,635 | 726,268 | ||||||||||||||||||||||
| Repurchased | (1,522,441 | ) | (13,107,917 | ) | (9,535,499 | ) | (84,689,379 | ) | ||||||||||||||||||
| Net decrease | (757,421 | ) | ($6,413,654 | ) | (3,908,615 | ) | ($28,862,133 | ) | ||||||||||||||||||
| Class NAV shares | ||||||||||||||||||||||||||
| Sold | 1,146,059 | $9,991,558 | 16,335,709 | $148,509,774 | ||||||||||||||||||||||
| Distributions reinvested | — | — | 4,598,556 | 42,076,790 | ||||||||||||||||||||||
| Repurchased | (21,245,453 | ) | (189,265,227 | ) | (54,520,853 | ) | (473,165,475 | ) | ||||||||||||||||||
| Net decrease | (20,099,394 | ) | ($179,273,669 | ) | (33,586,588 | ) | ($282,578,911 | ) | ||||||||||||||||||
| Total net decrease | (41,096,100 | ) | ($356,980,895 | ) | (35,736,973 | ) | ($289,921,671 | ) | ||||||||||||||||||
1 The inception date for Class C shares is 8-28-14.
2 The inception date for Class R2 and Class R4 shares is 3-27-15.
Affiliates of the fund owned 92%, 100%, and 100% of shares of beneficial interest of Class R2, Class R4, and Class NAV, respectively, on January 31, 2016.
Note 7 — Purchase and sale of securities
For the six months ended January 31, 2016, all purchases and sales of investments were short-term.
Note 8 — Investment by affiliated funds
Certain investors in the fund are affiliated funds that are managed by the Advisor and its affiliates. The affiliated funds do not invest in the fund for the purpose of exercising management or control; however, this investment may represent a significant portion of the fund's net assets. At January 31, 2016, funds within the John Hancock group of funds complex held 73.9% of the fund's net assets. The following funds had an affiliate ownership of 5% or more of the fund's net assets:
| Fund | Affiliate concentation |
| John Hancock Lifestyle Balanced Portfolio | 20.6% |
| John Hancock Lifestyle Growth Portfolio | 18.2% |
| John Hancock Lifestyle Conservative Portfolio | 8.2% |
| John Hancock Alternative Asset Allocation Portfolio | 7.5% |
| John Hancock Lifestyle Moderate Portfolio | 7.1% |
|
Trustees James M. Oates, Chairperson Officers Andrew G. Arnott John J. Danello Francis V. Knox, Jr. Charles A. Rizzo Salvatore Schiavone |
Investment advisor John Hancock Advisers, LLC Subadvisor First Quadrant, L.P. Principal distributor John Hancock Funds, LLC Custodian State Street Bank and Trust Company Transfer agent John Hancock Signature Services, Inc. Legal counsel K&L Gates LLP |
*Member of the Audit Committee
†Non-Independent Trustee
The fund's proxy voting policies and procedures, as well as the fund proxy voting record for the most recent twelve-month period ended June 30, are available free of charge on the Securities and Exchange Commission (SEC) website at sec.gov or on our website.
The fund's complete list of portfolio holdings, for the first and third fiscal quarters, is filed with the SEC on Form N-Q. The fund's Form N-Q is available on our website and the SEC's website, sec.gov, and can be reviewed and copied (for a fee) at the SEC's Public Reference Room in Washington, DC. Call 800-SEC-0330 to receive information on the operation of the SEC's Public Reference Room.
We make this information on your fund, as well as monthly portfolio holdings, and other fund details available on our website at jhinvestments.com or by calling 800-225-5291.
| You can also contact us: | |||
| 800-225-5291 jhinvestments.com |
Regular mail: John Hancock Signature Services, Inc. |
Express mail: John Hancock Signature Services, Inc. |
|
John Hancock family of funds
|
DOMESTIC EQUITY FUNDS Balanced Blue Chip Growth Classic Value Disciplined Value Disciplined Value Mid Cap Equity Income Fundamental All Cap Core Fundamental Large Cap Core Fundamental Large Cap Value New Opportunities Select Growth Small Cap Equity Small Cap Value Small Company Strategic Growth U.S. Equity U.S. Global Leaders Growth Value Equity GLOBAL AND INTERNATIONAL EQUITY FUNDS Disciplined Value International Emerging Markets Emerging Markets Equity Global Equity Global Shareholder Yield Greater China Opportunities International Core International Growth International Small Company International Value Equity |
INCOME FUNDS Bond California Tax-Free Income Core High Yield Emerging Markets Debt Floating Rate Income Focused High Yield Global Income Government Income High Yield Municipal Bond Income Investment Grade Bond Money Market Short Duration Credit Opportunities Spectrum Income Strategic Income Opportunities Tax-Free Bond ALTERNATIVE AND SPECIALTY FUNDS Absolute Return Currency Alternative Asset Allocation Enduring Assets Financial Industries Global Absolute Return Strategies Global Conservative Absolute Return Global Real Estate Natural Resources Redwood Regional Bank Seaport Technical Opportunities |
A fund's investment objectives, risks, charges, and expenses should be considered carefully before investing. The prospectus contains this and other important information about the fund. To obtain a prospectus, contact your financial professional, call John Hancock Investments at 800-225-5291, or visit our website at jhinvestments.com. Please read the prospectus carefully before investing or sending money.
|
ASSET ALLOCATION Income Allocation Fund Lifestyle Aggressive Portfolio Lifestyle Balanced Portfolio Lifestyle Conservative Portfolio Lifestyle Growth Portfolio Lifestyle Moderate Portfolio Retirement Choices Portfolios (2010-2055) Retirement Living Portfolios (2010-2055) Retirement Living II Portfolios (2010-2055) EXCHANGE-TRADED FUNDS John Hancock Multifactor Consumer Discretionary ETF John Hancock Multifactor Financials ETF John Hancock Multifactor Healthcare ETF John Hancock Multifactor Large Cap ETF John Hancock Multifactor Mid Cap ETF John Hancock Multifactor Technology ETF CLOSED-END FUNDS Financial Opportunities Hedged Equity & Income Income Securities Trust Investors Trust Preferred Income Preferred Income II Preferred Income III Premium Dividend Tax-Advantaged Dividend Income Tax-Advantaged Global Shareholder Yield |
"As an investment firm,
upholding the proud
tradition of John Hancock
comes down to one thing:
putting shareholders
first. We believe that if
our shareholders are
successful, then we will
be successful."
Andrew G. Arnott
President and Chief Executive Officer
John Hancock Investments
John Hancock Multifactor ETF shares are bought and sold at market
price (not NAV), and are not individually redeemed
from the fund. Brokerage commissions will reduce returns.
John Hancock ETFs are distributed by Foreside Fund Services, LLC, and
are subadvised by Dimensional Fund Advisors LP.
Foreside is not affiliated with John Hancock Funds, LLC or
Dimensional Fund Advisors LP.
Dimensional Fund Advisors LP receives compensation from John Hancock
in connection with licensing rights to the
John Hancock Dimensional indexes. Dimensional Fund Advisors LP does
not sponsor, endorse, or sell, and makes no
representation as to the advisability of investing in, John Hancock
Multifactor ETFs.
John Hancock Investments
A trusted brand
John Hancock Investments is a premier asset manager representing
one of America's most trusted brands, with a heritage of financial
stewardship dating back to 1862. Helping our shareholders pursue
their financial goals is at the core of everything we do. It's why we
support the role of professional financial advice and operate with the
highest standards of conduct and integrity.
A better way to invest
We build funds based on investor needs, then search the world to find
proven portfolio teams with specialized expertise in those strategies.
As a manager of managers, we apply vigorous oversight to ensure that
they continue to meet our uncompromising standards and serve the
best interests of our shareholders.
Results for investors
Our unique approach to asset management enables us to provide
a diverse set of investments backed by some of the world's best
managers, along with strong risk-adjusted returns across asset classes.
|
|
John Hancock Funds, LLC n Member FINRA, SIPC 601 Congress Street n Boston, MA 02210-2805 800-225-5291 n jhinvestments.com |
|
| This report is for the information of the shareholders of John Hancock Absolute Return Currency Fund. It is not authorized for distribution to prospective investors unless preceded or accompanied by a prospectus. | ||
| MF2274533 | 364SA 1/16 3/16 |
|
John Hancock
Fundamental All Cap Core Fund
Semiannual report 1/31/16

A message to shareholders
Dear shareholder,
The six-month period has been a challenging time for all investors. Oil prices, having already dropped precipitously, continued to slide in the back half of 2015, and by January oil frequently traded at multi-year lows. Concerns about slowing global growth added to negative investor psychology, and stock prices fell steeply around the world. Stocks were not the only investment that faced headwinds; all risk assets struggled over the past six months and these types of declines are unsettling.
Although volatility returned in force to the markets, much of the global economic picture continues to move in the right direction. In December, the U.S. Federal Reserve raised short-term interest rates for the first time in nine years on the evidence that the persistent strength in the labor markets warranted a somewhat less accommodative stance. Central banks outside of the United States continue to signal that they would take action to support economies and markets.
At John Hancock Investments, portfolio risk management is a critical part of our role as an asset manager, and our dedicated risk team is focused on these issues every day. We continually strive for new ways to analyze potential risks and have liquidity tools in place, such as a credit facility and an interfund lending program. In times like these, your best resource is your financial advisor, who can ensure your portfolio is sufficiently diversified to meet your long-term objectives and to withstand the inevitable bumps along the way.
On behalf of everyone at John Hancock Investments, I'd like to take this opportunity to thank you for the continued trust you've placed in us.
Sincerely,
Andrew G. Arnott
President and Chief Executive Officer
John Hancock Investments
This commentary reflects the CEO's views as of January 31, 2016. They are subject to change at any time. All investments entail risks, including the possible loss of principal. For more up-to-date information, you can visit our website at jhinvestments.com.
John Hancock
Fundamental All Cap Core Fund
INVESTMENT OBJECTIVE
The fund seeks long-term capital appreciation.
AVERAGE ANNUAL TOTAL RETURNS AS OF 1/31/16 (%)
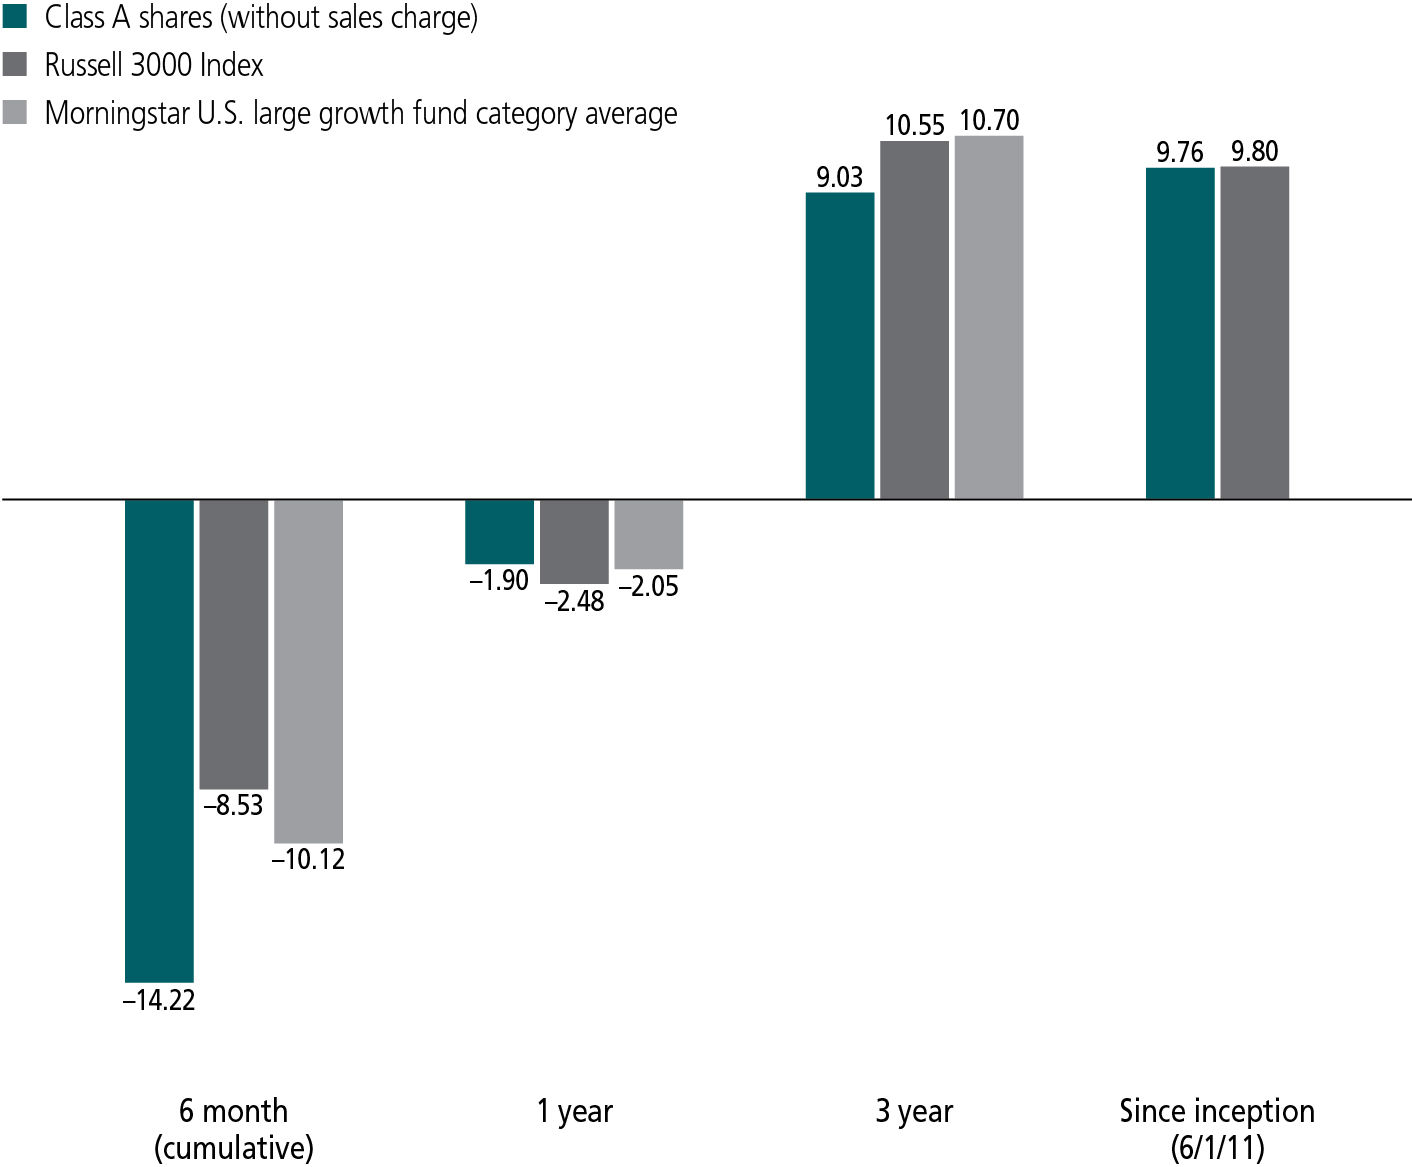
The Russell 3000 Index is an unmanaged index of the 3,000 largest U.S. companies based on total market capitalization, which represents approximately 98% of the investable U.S. equity market.
It is not possible to invest directly in an index. Index figures do not reflect expenses or sales charges, which would result in lower returns.
Figures from Morningstar, Inc. include reinvested distributions and do not take into account sales charges. Actual load-adjusted performance is lower. Since-inception returns for the Morningstar fund category average are not available.
The past performance shown here reflects reinvested distributions and the beneficial effect of any expense reductions, and does not guarantee future results. Returns for periods shorter than one year are cumulative. Performance of the other share classes will vary based on the difference in the fees and expenses of those classes. Shares will fluctuate in value and, when redeemed, may be worth more or less than their original cost. Current month-end performance may be lower or higher than the performance cited, and can be found at jhinvestments.com or by calling 800-225-5291. For further information on the fund's objectives, risks, and strategy, see the fund's prospectus.
PERFORMANCE HIGHLIGHTS OVER THE LAST SIX MONTHS
U.S. stocks gave up ground
U.S. stocks were pressured by sliding energy prices, concern over slowing economic growth in China, a strong U.S. dollar, and uncertainty around U.S. interest rates.
Energy, healthcare, materials, and financials were the weakest performers
Within the fund's broad-based benchmark, the Russell 3000 Index, the energy, healthcare, materials, and financials sectors posted the biggest declines.
Security selection detracted from relative performance
Stock picks in the financials sector accounted for most of the fund's underperformance versus its benchmark, with added disappointments from security selection in industrials and energy.
SECTOR COMPOSITION AS OF 1/31/16 (%)
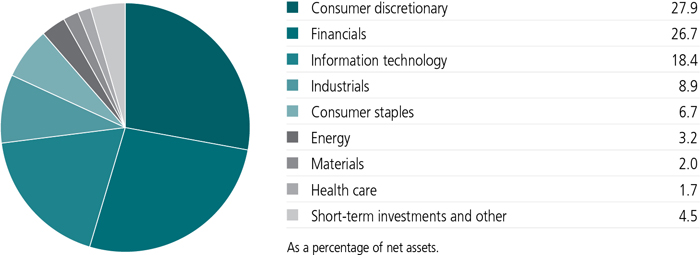
A note about risks
A fund concentrated in one sector or that holds a limited number of securities may fluctuate more than a fund that invests in a wider variety of sectors. Stock prices can be volatile and are affected by both general economic conditions and the financial prospects of individual companies. Large company stocks could fall out of favor. The stock prices of midsize and small companies can change more frequently and dramatically than those of large companies. The value of a company's equity securities is subject to changes in the company's financial condition and overall market and economic conditions. Foreign investing, especially in emerging markets, has additional risks, such as currency and market volatility and political and social instability. Hedging, derivatives, and other strategic transactions may increase a fund's volatility and could produce disproportionate losses, potentially more than the fund's principal investment. Please see the fund's prospectus for additional risks.
An interview with Portfolio Manager Emory W. (Sandy) Sanders, Jr., CFA, John Hancock Asset Management a division of Manulife Asset Management (US) LLC

Emory W. (Sandy) Sanders, Jr., CFA
Portfolio Manager
John Hancock Asset Management
How would you describe the market backdrop for the six months ended January 31, 2016?
It was volatile. Stocks sank early in the period amid worries over China's slowing economic growth, declining commodity prices, and uncertainty around U.S. interest rates. The market, however, rebounded in October as fears around China eased and the U.S. Federal Reserve (Fed) postponed an interest-rate hike. But volatility mounted heading into year end, with China's issues moving to the forefront again, commodity prices sliding further, and the junk bond market moving sharply lower. These concerns overshadowed a brief stock market rally following the Fed's mid-December decision to hike interest rates for the first time since 2006. The market retreated even further in January, as oil prices collapsed to their lowest level in over a decade, global economic growth slowed, and the pace of the U.S. economic recovery was uneven.
Which sectors were hardest hit?
Within the fund's benchmark, the Russell 3000 Index, energy and materials stocks plunged due to weak commodity prices. Healthcare stocks took a beating, as politicians began discussing the possibility of capping drug prices. In addition, the financials sector turned in a sizable loss, hurt by the prospect of lower-for-longer interest rates, weak energy prices, and declines in the junk bond and equity markets. Only the more defensive utilities, telecommunication services, and consumer staples sectors posted gains.
What was your approach to investing in this environment?
Regardless of market conditions, we try to steer a steady course that focuses on financially sound companies across all market caps that we believe have competitive advantages and the ability to generate substantial cash flow over sustained periods. We try to buy these types of stocks when they're selling at a discount to our estimate of intrinsic value. Often we find attractive buying opportunities when fundamentals, such as sales growth and profit margins, are temporarily
What caused the fund to lag its benchmark?
Security selection accounted for all of the underperformance, with particularly disappointing results in financials—which on average represented about 27% of the fund's assets—followed by industrials and energy. Individual detractors included an out-of-index stake in asset manager AllianceBernstein Holding LP, which plunged as declines in the junk bond and equity markets depressed total assets under management, a key driver of revenues. An investment in auto finance company Santander Consumer USA Holdings, Inc., which targets credit-impaired buyers, fell amid concern over slowing auto sales, weakening economic conditions, and worries that the credit cycle had bottomed.
Sizable overweights in Citigroup, Inc., Morgan Stanley, and Bank of America Corp. all cost the fund ground. Citigroup, which has significant international exposure, saw its stock slide as investors worried about the impact of slowing global growth and declining oil prices on the business. In fact, the company's exposure was limited, with its latest quarterly report showing mid-single-digit loan growth and improved credit metrics. We maintained an overweighted position because we thought the reality was a lot better than investor sentiment was suggesting. Shares of Morgan Stanley and
TOP 10 HOLDINGS AS OF 1/31/16 (%)
| Amazon.com, Inc. | 6.4 |
| Apple, Inc. | 5.1 |
| Facebook, Inc., Class A | 4.8 |
| Citigroup, Inc. | 4.6 |
| Ralph Lauren Corp. | 4.2 |
| Bank of America Corp. | 3.9 |
| Lennar Corp., Class A | 3.3 |
| AllianceBernstein Holding LP | 2.8 |
| Alphabet, Inc., Class A | 2.7 |
| adidas AG | 2.7 |
| TOTAL | 40.5 |
| As a percentage of net assets. | |
| Cash and cash equivalents are not included. | |
Bank of America fell as continued low interest rates hampered net interest margins, the difference between what they earn on loans and what they pay out on deposits. Added headwinds included declining commodity prices, which hurt Morgan Stanley's trading volumes, and slowing global economic growth, which dogged Bank of America. Both companies reported strong fourth-quarter earnings in January, but investors continued to punish the stocks.
CIT Group, Inc., a financial holding company that offers loans and leases to small and midsize businesses, saw its stock hurt by continued low interest rates. In consumer discretionary, shares of auto dealer Group 1 Automotive, Inc. and used car retailer CarMax, Inc. were pressured by late-period concern over the strength of the U.S. consumer. Group 1 faced added headwinds from concern that auto sales might be slowing. Its exposure to Texas, a heavily energy-focused economy that in the past has driven about 40% of the company's revenue, also hurt. CarMax's inadequate inventory of sport-utility vehicles and trucks also led to weaker-than-expected sales growth as low gas prices boosted demand.
Where did the fund gain ground?
Having a sizable underweight in healthcare, where many stocks seemed to us to be overvalued, and a small cash position in a down market helped relative performance. Security selection in materials and consumer staples also gave a modest boost. However, the biggest individual standouts came from consumer discretionary and information technology, two of the fund's biggest sector allocations. In consumer discretionary, e-commerce leader Amazon.com, Inc., Germany-based sports apparel company adidas AG, and home builder NVR, Inc. stood out. The fund had a huge overweight and over 6% of its assets in Amazon, which saw its shares lifted by increased financial disclosure that revealed fast growth in the company's cloud services division and continued dominance in the online retail space. Adidas's shares rallied nicely, buoyed by early signs of progress in the company's turnaround, a new CEO, and a share buyback. Adidas was an out-of-index position. NVR benefited from the U.S. housing market's recovery, especially in the mid-Atlantic region where the company operates.
The fund owned social network service Facebook, Inc., which benefited as advertising on mobile devices drove better-than-expected earnings and revenue growth. In addition, shares of Alphabet, Inc., the recently formed parent of online search engine Google, climbed as enhanced financial disclosure revealed results at Google that exceeded investor expectations. News that Alphabet would buy back $5 billion in shares also helped. Facebook and Alphabet were sizable overweights relative to the index.
How was the fund positioned at period end?
As always, we remained focused on higher-quality companies with the potential for sustainable cash flow growth and attractive valuations. We continued to favor large-cap stocks and to have an economically sensitive bias with sizable overweights in financials, where we think many companies stand to benefit from higher interest rates, and consumer discretionary, where we've targeted companies with exposure to the U.S. housing recovery.
Are there any management changes upcoming?
Effective April 1, 2016, Walter T. McCormick will be retiring. The fund will continue to be managed by Jonathan White and me. We wish Walter well.
MANAGED BY
| |
Emory W. (Sandy) Sanders, Jr., CFA On the fund since 2011 Investing since 1997 |
 |
Walter T. McCormick, CFA On the fund since 2011 Investing since 1970 |
 |
Jonathan White, CFA On the fund since 2015 Investing since 1997 |
![]()
TOTAL RETURNS FOR THE PERIOD ENDED JANUARY 31, 2016
| Average annual total returns (%) with maximum sales charge |
Cumulative total returns (%) with maximum sales charge |
||||||||||||||||
| 1-year | Since inception |
6-month | Since inception |
||||||||||||||
| Class A | -6.81 | 8.56 | 1 | -18.51 | 46.80 | 1 | |||||||||||
| Class C | -3.46 | -1.74 | 2 | -15.33 | -2.77 | 2 | |||||||||||
| Class I3 | -1.53 | 10.20 | 1 | -14.06 | 57.44 | 1 | |||||||||||
| Class R23,4 | -1.84 | 9.47 | 1 | -14.20 | 52.60 | 1 | |||||||||||
| Class R43,4 | -1.66 | 9.94 | 1 | -14.15 | 55.70 | 1 | |||||||||||
| Class R63,4 | -1.51 | 9.98 | 1 | -14.08 | 55.93 | 1 | |||||||||||
| Class NAV3,4 | -1.47 | 9.85 | 1 | -14.06 | 55.08 | 1 | |||||||||||
| Index† | -2.48 | 9.80 | 1 | -8.53 | 54.77 | 1 | |||||||||||
Performance figures assume all distributions have been reinvested. Figures reflect maximum sales charges on Class A shares of 5.00% and the applicable contingent deferred sales charge (CDSC) on Class C shares. Class C shares sold within one year of purchase are subject to a 1% CDSC. Sales charges are not applicable to Class I, Class R2, Class R4, Class R6, and Class NAV shares.
The expense ratios of the fund, both net (including any fee waivers and/or expense limitations) and gross (excluding any fee waivers and/or expense limitations), are set forth according to the most recent publicly available prospectuses for the fund and may differ from those disclosed in the Financial highlights tables in this report. Had the fee waivers and expense limitations not been in place, gross expenses would apply. The expense ratios are as follows:
| Class A | Class C | Class I | Class R2* | Class R4* | Class R6* | Class NAV | |
| Gross (%) | 1.25 | 1.96 | 0.94 | 1.35 | 1.20 | 0.85 | 0.83 |
| Net (%) | 1.25 | 1.96 | 0.94 | 1.35 | 1.10 | 0.83 | 0.83 |
| * | Expenses have been estimated for the first year of operations of the fund's Class R2, Class R4 and Class R6 shares, respectively. |
Please refer to the most recent prospectus and annual or semiannual report for more information on expenses and any expense limitation arrangements for each class.
The returns reflect past results and should not be considered indicative of future performance. The return and principal value of an investment will fluctuate so that shares, when redeemed, may be worth more or less than their original cost. Due to market volatility and other factors, the fund's current performance may be higher or lower than the performance shown. For current to the most recent month-end performance data, please call 800-225-5291 or visit the fund's website at jhinvestments.com.
The performance table above and the chart on the next page do not reflect the deduction of taxes that a shareholder would pay on fund distributions or the redemption of fund shares. The fund's performance results reflect any applicable fee waivers or expense reductions, without which the expenses would increase and results would have been less favorable.
| † | Index is the Russell 3000 Index. |
See the following page for footnotes.
This chart and table show what happened to a hypothetical $10,000 investment in John Hancock Fundamental All Cap Core Fund for the share classes and periods indicated, assuming all distributions were reinvested. For comparison, we've shown the same investment in the Russell 3000 Index.
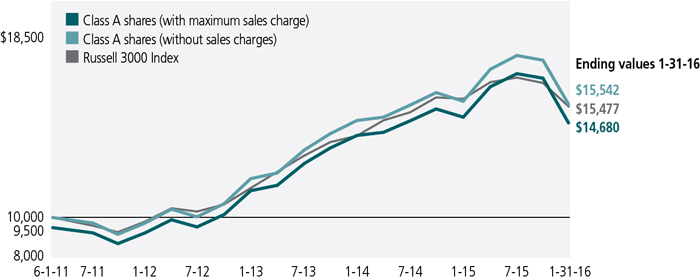
| Start date | With maximum sales charge ($) |
Without sales charge ($) |
Index ($) | |
| Class C5 | 6-27-14 | 9,723 | 9,723 | 10,011 |
| Class I3 | 6-1-11 | 15,744 | 15,744 | 15,477 |
| Class R23,4 | 6-1-11 | 15,260 | 15,260 | 15,477 |
| Class R43,4 | 6-1-11 | 15,570 | 15,570 | 15,477 |
| Class R63,4 | 6-1-11 | 15,593 | 15,593 | 15,477 |
| Class NAV3,4 | 6-1-11 | 15,508 | 15,508 | 15,477 |
The Russell 3000 Index is an unmanaged index of the 3,000 largest U.S. companies based on total market capitalization, which represents approximately 98% of the investable U.S. equity market.
It is not possible to invest directly in an index. Index figures do not reflect expenses or sales charges, which would result in lower returns.
Footnotes related to performance pages
| 1 | From 6-1-11. |
| 2 | From 6-27-14. |
| 3 | For certain types of investors as described in the fund's prospectuses. |
| 4 | Class R2, Class R4, and Class R6 shares were first offered on 3-27-15; Class NAV shares were first offered on 6-26-14. Returns prior to this date are that of Class A shares that have been recalculated to apply the gross fees and expenses of Class R2, Class R4, Class R6, and Class NAV shares, as applicable. |
| 5 | The contingent deferred sales charge is not applicable. |
These examples are intended to help you understand your ongoing operating expenses of investing in the fund so you can compare these costs with the ongoing costs of investing in other mutual funds.
Understanding fund expenses
As a shareholder of the fund, you incur two types of costs:
| • | Transaction costs, which include sales charges (loads) on purchases or redemptions (varies by share class), minimum account fee charge, etc. |
| • | Ongoing operating expenses, including management fees, distribution and service fees (if applicable), and other fund expenses. |
We are presenting only your ongoing operating expenses here.
Actual expenses/actual returns
This example is intended to provide information about the fund's actual ongoing operating expenses, and is based on the fund's actual return. It assumes an account value of $1,000.00 on August 1, 2015, with the same investment held until January 31, 2016.
| Account value on 8-1-2015 |
Ending value on 1-31-2016 |
Expenses paid during period ended 1-31-20161 |
Annualized expense ratio |
|
| Class A | $1,000.00 | $857.80 | $5.98 | 1.28% |
| Class C | 1,000.00 | 854.80 | 9.23 | 1.98% |
| Class I | 1,000.00 | 859.40 | 4.44 | 0.95% |
| Class R2 | 1,000.00 | 858.00 | 5.23 | 1.12% |
| Class R4 | 1,000.00 | 858.50 | 4.72 | 1.01% |
| Class R6 | 1,000.00 | 859.20 | 3.97 | 0.85% |
| Class NAV | 1,000.00 | 859.40 | 3.97 | 0.85% |
Together with the value of your account, you may use this information to estimate the operating expenses that you paid over the period. Simply divide your account value at January 31, 2016, by $1,000.00, then multiply it by the "expenses paid" for your share class from the table above. For example, for an account value of $8,600.00, the operating expenses should be calculated as follows:

Hypothetical example for comparison purposes
This table allows you to compare the fund's ongoing operating expenses with those of any other fund. It provides an example of the fund's hypothetical account values and hypothetical expenses based on each class's actual expense ratio and an assumed 5% annualized return before expenses (which is not the fund's actual return). It assumes an account value of $1,000.00 on August 1, 2015, with the same investment held until January 31, 2016. Look in any other fund shareholder report to find its hypothetical example and you will be able to compare these expenses. Please remember that these hypothetical account values and expenses may not be used to estimate the actual ending account balance or expenses you paid for the period.
| Account value on 8-1-2015 |
Ending value on 1-31-2016 |
Expenses paid during period ended 1-31-20161 |
Annualized expense ratio |
|
| Class A | $1,000.00 | $1,018.70 | $6.50 | 1.28% |
| Class C | 1,000.00 | 1,015.20 | 10.03 | 1.98% |
| Class I | 1,000.00 | 1,020.40 | 4.82 | 0.95% |
| Class R2 | 1,000.00 | 1,019.50 | 5.69 | 1.12% |
| Class R4 | 1,000.00 | 1,020.10 | 5.13 | 1.01% |
| Class R6 | 1,000.00 | 1,020.90 | 4.32 | 0.85% |
| Class NAV | 1,000.00 | 1,020.90 | 4.32 | 0.85% |
Remember, these examples do not include any transaction costs, therefore, these examples will not help you to determine the relative total costs of owning different funds. If transaction costs were included, your expenses would have been higher. See the prospectuses for details regarding transaction costs.
| 1 | Expenses are equal to the fund's annualized expense ratio, multiplied by the average account value over the period, multiplied by 184/366 (to reflect the one-half year period). |
Fund's investments
| As of 1-31-16 (unaudited) | ||||||||||||||
| Shares | Value | |||||||||||||
| Common stocks 95.5% | $137,903,479 | |||||||||||||
| (Cost $145,695,569) | ||||||||||||||
| Consumer discretionary 27.9% | 40,270,564 | |||||||||||||
| Diversified consumer services 1.3% | ||||||||||||||
| DeVry Education Group, Inc. | 92,781 | 1,846,342 | ||||||||||||
| Household durables 8.1% | ||||||||||||||
| Lennar Corp., Class A | 114,158 | 4,811,760 | ||||||||||||
| NVR, Inc. (I) | 2,083 | 3,439,033 | ||||||||||||
| Tempur Sealy International, Inc. (I) | 57,593 | 3,475,162 | ||||||||||||
| Internet and catalog retail 6.4% | ||||||||||||||
| Amazon.com, Inc. (I) | 15,806 | 9,278,122 | ||||||||||||
| Specialty retail 5.2% | ||||||||||||||
| CarMax, Inc. (I) | 76,659 | 3,386,795 | ||||||||||||
| Group 1 Automotive, Inc. | 32,172 | 1,726,028 | ||||||||||||
| Lowe's Companies, Inc. | 33,188 | 2,378,252 | ||||||||||||
| Textiles, apparel and luxury goods 6.9% | ||||||||||||||
| adidas AG | 37,179 | 3,828,420 | ||||||||||||
| Ralph Lauren Corp. | 54,228 | 6,100,650 | ||||||||||||
| Consumer staples 6.7% | 9,688,409 | |||||||||||||
| Beverages 0.8% | ||||||||||||||
| Diageo PLC, ADR | 10,116 | 1,089,190 | ||||||||||||
| Food products 3.6% | ||||||||||||||
| Danone SA | 48,143 | 3,315,866 | ||||||||||||
| Mead Johnson Nutrition Company | 26,446 | 1,917,071 | ||||||||||||
| Household products 2.3% | ||||||||||||||
| The Procter & Gamble Company | 41,208 | 3,366,282 | ||||||||||||
| Energy 3.2% | 4,684,858 | |||||||||||||
| Energy equipment and services 1.3% | ||||||||||||||
| Schlumberger, Ltd. | 25,422 | 1,837,248 | ||||||||||||
| Oil, gas and consumable fuels 1.9% | ||||||||||||||
| Kinder Morgan, Inc. | 173,107 | 2,847,610 | ||||||||||||
| Financials 26.7% | 38,472,371 | |||||||||||||
| Banks 9.7% | ||||||||||||||
| Bank of America Corp. | 401,262 | 5,673,845 | ||||||||||||
| CIT Group, Inc. | 55,309 | 1,623,319 | ||||||||||||
| Citigroup, Inc. | 155,127 | 6,605,308 | ||||||||||||
| Capital markets 12.9% | ||||||||||||||
| Affiliated Managers Group, Inc. (I) | 25,901 | 3,475,655 | ||||||||||||
| AllianceBernstein Holding LP | 221,940 | 4,092,574 | ||||||||||||
| Shares | Value | |||||||||||||
| Financials (continued) | ||||||||||||||
| Capital markets (continued) | ||||||||||||||
| BlackRock, Inc. | 9,699 | $3,048,008 | ||||||||||||
| Morgan Stanley | 122,108 | 3,160,155 | ||||||||||||
| T. Rowe Price Group, Inc. | 36,630 | 2,598,899 | ||||||||||||
| The Goldman Sachs Group, Inc. | 13,853 | 2,238,091 | ||||||||||||
| Consumer finance 1.6% | ||||||||||||||
| American Express Company | 22,622 | 1,210,277 | ||||||||||||
| Santander Consumer USA Holdings, Inc. (I) | 108,479 | 1,133,606 | ||||||||||||
| Insurance 1.0% | ||||||||||||||
| American International Group, Inc. | 25,417 | 1,435,552 | ||||||||||||
| Real estate investment trusts 1.5% | ||||||||||||||
| American Tower Corp. | 23,077 | 2,177,082 | ||||||||||||
| Health care 1.7% | 2,516,685 | |||||||||||||
| Biotechnology 1.7% | ||||||||||||||
| Amgen, Inc. | 16,478 | 2,516,685 | ||||||||||||
| Industrials 8.9% | 12,787,549 | |||||||||||||
| Aerospace and defense 1.7% | ||||||||||||||
| TransDigm Group, Inc. (I) | 10,576 | 2,376,744 | ||||||||||||
| Electrical equipment 2.4% | ||||||||||||||
| Regal Beloit Corp. | 35,033 | 1,969,205 | ||||||||||||
| Sensata Technologies Holding NV (I) | 41,697 | 1,530,280 | ||||||||||||
| Machinery 0.7% | ||||||||||||||
| The Manitowoc Company, Inc. | 59,187 | 931,603 | ||||||||||||
| Professional services 1.3% | ||||||||||||||
| IHS, Inc., Class A (I) | 18,522 | 1,937,772 | ||||||||||||
| Trading companies and distributors 2.8% | ||||||||||||||
| United Rentals, Inc. (I) | 18,821 | 901,714 | ||||||||||||
| WESCO International, Inc. (I) | 77,767 | 3,140,231 | ||||||||||||
| Information technology 18.4% | 26,553,983 | |||||||||||||
| Communications equipment 1.2% | ||||||||||||||
| QUALCOMM, Inc. | 38,073 | 1,726,230 | ||||||||||||
| Internet software and services 10.9% | ||||||||||||||
| Alibaba Group Holding, Ltd., ADR (I) | 28,708 | 1,924,297 | ||||||||||||
| Alphabet, Inc., Class A (I) | 5,141 | 3,914,100 | ||||||||||||
| Facebook, Inc., Class A (I) | 61,721 | 6,925,713 | ||||||||||||
| LinkedIn Corp., Class A (I) | 14,800 | 2,929,068 | ||||||||||||
| Software 1.2% | ||||||||||||||
| Workday, Inc., Class A (I) | 28,326 | 1,784,821 | ||||||||||||
| Technology hardware, storage and peripherals 5.1% | ||||||||||||||
| Apple, Inc. | 75,506 | 7,349,754 | ||||||||||||
| Shares | Value | |||||||||||||
| Materials 2.0% | $2,929,060 | |||||||||||||
| Paper and forest products 2.0% | ||||||||||||||
| Louisiana-Pacific Corp. (I) | 186,327 | 2,929,060 | ||||||||||||
| Par value^ | Value | |||||||||||||
| Short-term investments 4.7% | $6,791,000 | |||||||||||||
| (Cost $6,791,000) | ||||||||||||||
| Repurchase agreement 4.7% | 6,791,000 | |||||||||||||
| Barclays Tri-Party Repurchase Agreement dated 1-29-16 at 0.330% to be repurchased at $6,791,187 on 2-1-16, collateralized by $5,733,500 U.S. Treasury Inflation Indexed Notes, 2.375% due 1-15-17 (valued at $6,927,070, including interest) | 6,791,000 | 6,791,000 | ||||||||||||
| Total investments (Cost $152,486,569)† 100.2% | $144,694,479 | |||||||||||||
| Other assets and liabilities, net (0.2%) | ($309,921 | ) | ||||||||||||
| Total net assets 100.0% | $144,384,558 | |||||||||||||
| The percentage shown for each investment category is the total value of the category as a percentage of the net assets of the fund. | ||||||||||||||
| ^All par values are denominated in U.S. dollars unless otherwise indicated. | ||||||||||||||
| Key to Security Abbreviations and Legend | ||||||||||||||
| ADR | American Depositary Receipts | |||||||||||||
| (I) | Non-income producing security. | |||||||||||||
| † | At 1-31-16, the aggregate cost of investment securities for federal income tax purposes was $152,513,328. Net unrealized depreciation aggregated $7,818,849, of which $11,046,499 related to appreciated investment securities and $18,865,348 related to depreciated investment securities. | |||||||||||||
Financial statements
STATEMENT OF ASSETS AND LIABILITIES 1-31-16 (unaudited)
| Assets | ||||||||||||||||||||||||||||||
| Investments, at value (Cost $152,486,569) | $144,694,479 | |||||||||||||||||||||||||||||
| Cash | 491,972 | |||||||||||||||||||||||||||||
| Foreign currency, at value (Cost $2,158) | 1,583 | |||||||||||||||||||||||||||||
| Receivable for fund shares sold | 103,060 | |||||||||||||||||||||||||||||
| Dividends and interest receivable | 104,506 | |||||||||||||||||||||||||||||
| Other receivables and prepaid expenses | 47,222 | |||||||||||||||||||||||||||||
| Total assets | 145,442,822 | |||||||||||||||||||||||||||||
| Liabilities | ||||||||||||||||||||||||||||||
| Payable for investments purchased | 907,475 | |||||||||||||||||||||||||||||
| Payable for fund shares repurchased | 94,915 | |||||||||||||||||||||||||||||
| Payable to affiliates | ||||||||||||||||||||||||||||||
| Accounting and legal services fees | 3,575 | |||||||||||||||||||||||||||||
| Transfer agent fees | 8,453 | |||||||||||||||||||||||||||||
| Trustees' fees | 166 | |||||||||||||||||||||||||||||
| Other liabilities and accrued expenses | 43,680 | |||||||||||||||||||||||||||||
| Total liabilities | 1,058,264 | |||||||||||||||||||||||||||||
| Net assets | $144,384,558 | |||||||||||||||||||||||||||||
| Net assets consist of | ||||||||||||||||||||||||||||||
| Paid-in capital | $154,499,011 | |||||||||||||||||||||||||||||
| Accumulated distributions in excess of net investment income | (51,342 | ) | ||||||||||||||||||||||||||||
| Accumulated net realized gain (loss) on investments and foreign currency transactions | (2,270,093 | ) | ||||||||||||||||||||||||||||
| Net unrealized appreciation (depreciation) on investments and translation of assets and liabilities in foreign currencies | (7,793,018 | ) | ||||||||||||||||||||||||||||
| Net assets | $144,384,558 | |||||||||||||||||||||||||||||
| Net asset value per share | ||||||||||||||||||||||||||||||
| Based on net asset values and shares outstanding-the fund has an unlimited number of shares authorized with no par value | ||||||||||||||||||||||||||||||
| Class A ($26,710,865 ÷ 2,029,096 shares)1 | $13.16 | |||||||||||||||||||||||||||||
| Class C ($2,568,687 ÷ 196,536 shares)1 | $13.07 | |||||||||||||||||||||||||||||
| Class I ($9,959,230 ÷ 750,579 shares) | $13.27 | |||||||||||||||||||||||||||||
| Class R2 ($87,666 ÷ 6,614 shares) | $13.26 | |||||||||||||||||||||||||||||
| Class R4 ($87,721 ÷ 6,614 shares) | $13.26 | |||||||||||||||||||||||||||||
| Class R6 ($385,241 ÷ 29,028 shares) | $13.27 | |||||||||||||||||||||||||||||
| Class NAV ($104,585,148 ÷ 7,880,705 shares) | $13.27 | |||||||||||||||||||||||||||||
| Maximum offering price per share | ||||||||||||||||||||||||||||||
| Class A (net asset value per share ÷ 95%)2 | $13.85 | |||||||||||||||||||||||||||||
| 1 | Redemption price per share is equal to net asset value less any applicable contingent deferred sales charge. | ||||||||||||||||
| 2 | On single retail sales of less than $50,000. On sales of $50,000 or more and on group sales the offering price is reduced. | ||||||||||||||||
STATEMENT OF OPERATIONS For the six months ended 1-31-16 (unaudited)
| Investment income | ||||||||||||||||||||||||
| Dividends | $858,180 | |||||||||||||||||||||||
| Interest | 4,102 | |||||||||||||||||||||||
| Total investment income | 862,282 | |||||||||||||||||||||||
| Expenses | ||||||||||||||||||||||||
| Investment management fees | 529,011 | |||||||||||||||||||||||
| Distribution and service fees | 52,752 | |||||||||||||||||||||||
| Accounting and legal services fees | 10,476 | |||||||||||||||||||||||
| Transfer agent fees | 24,389 | |||||||||||||||||||||||
| Trustees' fees | 1,255 | |||||||||||||||||||||||
| State registration fees | 40,281 | |||||||||||||||||||||||
| Printing and postage | 3,455 | |||||||||||||||||||||||
| Professional fees | 26,928 | |||||||||||||||||||||||
| Custodian fees | 10,731 | |||||||||||||||||||||||
| Registration and filing fees | 44,950 | |||||||||||||||||||||||
| Other | 5,143 | |||||||||||||||||||||||
| Total expenses | 749,371 | |||||||||||||||||||||||
| Less expense reductions | (6,812 | ) | ||||||||||||||||||||||
| Net expenses | 742,559 | |||||||||||||||||||||||
| Net investment income | 119,723 | |||||||||||||||||||||||
| Realized and unrealized gain (loss) | ||||||||||||||||||||||||
| Net realized gain (loss) on | ||||||||||||||||||||||||
| Investments and foreign currency transactions | 858,585 | |||||||||||||||||||||||
| 858,585 | ||||||||||||||||||||||||
| Change in net unrealized appreciation (depreciation) of | ||||||||||||||||||||||||
| Investments and translation of assets and liabilities in foreign currencies | (23,879,795 | ) | ||||||||||||||||||||||
| (23,879,795 | ) | |||||||||||||||||||||||
| Net realized and unrealized loss | (23,021,210 | ) | ||||||||||||||||||||||
| Decrease in net assets from operations | ($22,901,487 | ) | ||||||||||||||||||||||
STATEMENTS OF CHANGES IN NET ASSETS
| Six months ended 1-31-16 | Year ended 7-31-15 | ||||||||||||||||||||||||||||||||||||||||||||
| (unaudited) | |||||||||||||||||||||||||||||||||||||||||||||
| Increase (decrease) in net assets | |||||||||||||||||||||||||||||||||||||||||||||
| From operations | |||||||||||||||||||||||||||||||||||||||||||||
| Net investment income | $119,723 | $188,044 | |||||||||||||||||||||||||||||||||||||||||||
| Net realized gain | 858,585 | 6,890,112 | |||||||||||||||||||||||||||||||||||||||||||
| Change in net unrealized appreciation (depreciation) | (23,879,795 | ) | 16,047,717 | ||||||||||||||||||||||||||||||||||||||||||
| Increase (decrease) in net assets resulting from operations | (22,901,487 | ) | 23,125,873 | ||||||||||||||||||||||||||||||||||||||||||
| Distributions to shareholders | |||||||||||||||||||||||||||||||||||||||||||||
| From net investment income | |||||||||||||||||||||||||||||||||||||||||||||
| Class I | (10,025 | ) | (9,284 | ) | |||||||||||||||||||||||||||||||||||||||||
| Class R4 | (40 | ) | — | ||||||||||||||||||||||||||||||||||||||||||
| Class R6 | (493 | ) | — | ||||||||||||||||||||||||||||||||||||||||||
| Class NAV | (160,507 | ) | (267,757 | ) | |||||||||||||||||||||||||||||||||||||||||
| From net realized gain | |||||||||||||||||||||||||||||||||||||||||||||
| Class A | (1,493,512 | ) | (451,524 | ) | |||||||||||||||||||||||||||||||||||||||||
| Class C | (166,569 | ) | (14,747 | ) | |||||||||||||||||||||||||||||||||||||||||
| Class I | (656,047 | ) | (194,076 | ) | |||||||||||||||||||||||||||||||||||||||||
| Class R2 | (6,073 | ) | — | ||||||||||||||||||||||||||||||||||||||||||
| Class R4 | (5,211 | ) | — | ||||||||||||||||||||||||||||||||||||||||||
| Class R6 | (21,668 | ) | — | ||||||||||||||||||||||||||||||||||||||||||
| Class NAV | (5,734,995 | ) | (3,226,759 | ) | |||||||||||||||||||||||||||||||||||||||||
| Total distributions | (8,255,140 | ) | (4,164,147 | ) | |||||||||||||||||||||||||||||||||||||||||
| From fund share transactions | 17,555,824 | (9,608,992 | ) | ||||||||||||||||||||||||||||||||||||||||||
| Total increase (decrease) | (13,600,803 | ) | 9,352,734 | ||||||||||||||||||||||||||||||||||||||||||
| Net assets | |||||||||||||||||||||||||||||||||||||||||||||
| Beginning of period | 157,985,361 | 148,632,627 | |||||||||||||||||||||||||||||||||||||||||||
| End of period | $144,384,558 | $157,985,361 | |||||||||||||||||||||||||||||||||||||||||||
| Accumulated distribution in excess of net investment income | ($51,342 | ) | — | ||||||||||||||||||||||||||||||||||||||||||
Financial highlights
| Class A Shares Period ended | 1-31-16 | 1 | 7-31-15 | 7-31-14 | 7-31-13 | 7-31-12 | 7-31-11 | 2 | ||||||||||||||||||||||||||||||||||||||||||||||||||||||||||||||||||||||||||||||||||||||||||||||||||||||||||||||
| Per share operating performance | ||||||||||||||||||||||||||||||||||||||||||||||||||||||||||||||||||||||||||||||||||||||||||||||||||||||||||||||||||||||
| Net asset value, beginning of period | $16.16 | $14.33 | $12.88 | $9.96 | $9.73 | $10.00 | ||||||||||||||||||||||||||||||||||||||||||||||||||||||||||||||||||||||||||||||||||||||||||||||||||||||||||||||||
| Net investment income (loss)3 | (0.01 | ) | (0.04 | ) | — | 4 | 0.06 | 0.02 | (0.01 | ) | ||||||||||||||||||||||||||||||||||||||||||||||||||||||||||||||||||||||||||||||||||||||||||||||||||||||||||||
| Net realized and unrealized gain (loss) on investments | (2.20 | ) | 2.27 | 2.12 | 3.16 | 0.28 | (0.26 | ) | ||||||||||||||||||||||||||||||||||||||||||||||||||||||||||||||||||||||||||||||||||||||||||||||||||||||||||||||
| Total from investment operations | (2.21 | ) | 2.23 | 2.12 | 3.22 | 0.30 | (0.27 | ) | ||||||||||||||||||||||||||||||||||||||||||||||||||||||||||||||||||||||||||||||||||||||||||||||||||||||||||||||
| Less distributions | ||||||||||||||||||||||||||||||||||||||||||||||||||||||||||||||||||||||||||||||||||||||||||||||||||||||||||||||||||||||
| From net investment income | — | — | (0.01 | ) | (0.06 | ) | (0.02 | ) | — | |||||||||||||||||||||||||||||||||||||||||||||||||||||||||||||||||||||||||||||||||||||||||||||||||||||||||||||
| From net realized gain | (0.79 | ) | (0.40 | ) | (0.66 | ) | (0.24 | ) | (0.05 | ) | — | |||||||||||||||||||||||||||||||||||||||||||||||||||||||||||||||||||||||||||||||||||||||||||||||||||||||||||
| Total distributions | (0.79 | ) | (0.40 | ) | (0.67 | ) | (0.30 | ) | (0.07 | ) | — | |||||||||||||||||||||||||||||||||||||||||||||||||||||||||||||||||||||||||||||||||||||||||||||||||||||||||||
| Net asset value, end of period | $13.16 | $16.16 | $14.33 | $12.88 | $9.96 | $9.73 | ||||||||||||||||||||||||||||||||||||||||||||||||||||||||||||||||||||||||||||||||||||||||||||||||||||||||||||||||
| Total return (%)5,6 | (14.22 | ) 7 | 15.77 | 16.62 | 32.93 | 3.15 | (2.70 | ) 7 | ||||||||||||||||||||||||||||||||||||||||||||||||||||||||||||||||||||||||||||||||||||||||||||||||||||||||||||||
| Ratios and supplemental data | ||||||||||||||||||||||||||||||||||||||||||||||||||||||||||||||||||||||||||||||||||||||||||||||||||||||||||||||||||||||
| Net assets, end of period (in millions) | $27 | $23 | $14 | $9 | $4 | $2 | ||||||||||||||||||||||||||||||||||||||||||||||||||||||||||||||||||||||||||||||||||||||||||||||||||||||||||||||||
| Ratios (as a percentage of average net assets): | ||||||||||||||||||||||||||||||||||||||||||||||||||||||||||||||||||||||||||||||||||||||||||||||||||||||||||||||||||||||
| Expenses before reductions | 1.28 | 8 | 1.30 | 1.78 | 2.78 | 5.62 | 5.77 | 8 | ||||||||||||||||||||||||||||||||||||||||||||||||||||||||||||||||||||||||||||||||||||||||||||||||||||||||||||||
| Expenses including reductions | 1.28 | 8 | 1.29 | 1.30 | 1.30 | 1.30 | 1.30 | 8 | ||||||||||||||||||||||||||||||||||||||||||||||||||||||||||||||||||||||||||||||||||||||||||||||||||||||||||||||
| Net investment income (loss) | (0.19 | ) 8 | (0.29 | ) | (0.02 | ) | 0.51 | 0.24 | (0.33 | ) 8 | ||||||||||||||||||||||||||||||||||||||||||||||||||||||||||||||||||||||||||||||||||||||||||||||||||||||||||||
| Portfolio turnover (%) | 23 | 42 | 44 | 59 | 47 | 8 | ||||||||||||||||||||||||||||||||||||||||||||||||||||||||||||||||||||||||||||||||||||||||||||||||||||||||||||||||
| 1 | Six months ended 1-31-16. Unaudited. | ||||||||||||||||||||||||||||||||||||||||||||||||||||||||||||||||||||||||||||||||||
| 2 | Period from 6-1-11 (commencement of operations) to 7-31-11. | ||||||||||||||||||||||||||||||||||||||||||||||||||||||||||||||||||||||||||||||||||
| 3 | Based on average daily shares outstanding. | ||||||||||||||||||||||||||||||||||||||||||||||||||||||||||||||||||||||||||||||||||
| 4 | Less than $0.005 per share. | ||||||||||||||||||||||||||||||||||||||||||||||||||||||||||||||||||||||||||||||||||
| 5 | Does not reflect the effect of sales charges, if any. | ||||||||||||||||||||||||||||||||||||||||||||||||||||||||||||||||||||||||||||||||||
| 6 | Total returns would have been lower had certain expenses not been reduced during the applicable periods. | ||||||||||||||||||||||||||||||||||||||||||||||||||||||||||||||||||||||||||||||||||
| 7 | Not annualized. | ||||||||||||||||||||||||||||||||||||||||||||||||||||||||||||||||||||||||||||||||||
| 8 | Annualized. | ||||||||||||||||||||||||||||||||||||||||||||||||||||||||||||||||||||||||||||||||||
| Class C Shares Period ended | 1-31-16 | 1 | 7-31-15 | 7-31-14 | 2 | ||||||||||||||||||||||||||||||||||||||||||||||||||||||||||||||||||
| Per share operating performance | |||||||||||||||||||||||||||||||||||||||||||||||||||||||||||||||||||||||
| Net asset value, beginning of period | $16.11 | $14.37 | $14.54 | ||||||||||||||||||||||||||||||||||||||||||||||||||||||||||||||||||||
| Net investment loss3 | (0.07 | ) | (0.16 | ) | (0.02 | ) | |||||||||||||||||||||||||||||||||||||||||||||||||||||||||||||||||
| Net realized and unrealized gain (loss) on investments | (2.18 | ) | 2.30 | (0.15 | ) | ||||||||||||||||||||||||||||||||||||||||||||||||||||||||||||||||||
| Total from investment operations | (2.25 | ) | 2.14 | (0.17 | ) | ||||||||||||||||||||||||||||||||||||||||||||||||||||||||||||||||||
| Less distributions | |||||||||||||||||||||||||||||||||||||||||||||||||||||||||||||||||||||||
| From net investment income | — | — | — | ||||||||||||||||||||||||||||||||||||||||||||||||||||||||||||||||||||
| From net realized gain | (0.79 | ) | (0.40 | ) | — | ||||||||||||||||||||||||||||||||||||||||||||||||||||||||||||||||||
| Total distributions | (0.79 | ) | (0.40 | ) | — | ||||||||||||||||||||||||||||||||||||||||||||||||||||||||||||||||||
| Net asset value, end of period | $13.07 | $16.11 | $14.37 | ||||||||||||||||||||||||||||||||||||||||||||||||||||||||||||||||||||
| Total return (%)4,5 | (14.52 | ) 6 | 15.09 | (1.17 | ) 6 | ||||||||||||||||||||||||||||||||||||||||||||||||||||||||||||||||||
| Ratios and supplemental data | |||||||||||||||||||||||||||||||||||||||||||||||||||||||||||||||||||||||
| Net assets, end of period (in millions) | $3 | $2 | — | 7 | |||||||||||||||||||||||||||||||||||||||||||||||||||||||||||||||||||
| Ratios (as a percentage of average net assets): | |||||||||||||||||||||||||||||||||||||||||||||||||||||||||||||||||||||||
| Expenses before reductions | 1.98 | 8 | 2.69 | 17.05 | 8 | ||||||||||||||||||||||||||||||||||||||||||||||||||||||||||||||||||
| Expenses including reductions | 1.98 | 8 | 2.00 | 2.00 | 8 | ||||||||||||||||||||||||||||||||||||||||||||||||||||||||||||||||||
| Net investment loss | (0.92 | ) 8 | (1.06 | ) | (1.39 | ) 8 | |||||||||||||||||||||||||||||||||||||||||||||||||||||||||||||||||
| Portfolio turnover (%) | 23 | 42 | 44 | 9 | |||||||||||||||||||||||||||||||||||||||||||||||||||||||||||||||||||
| 1 | Six months ended 1-31-16. Unaudited. | |||||||||||||||||||||||||||||||||||||||||||||||||||||||||||||||||||||||||||||||
| 2 | The inception date for Class C shares is 6-27-14. | |||||||||||||||||||||||||||||||||||||||||||||||||||||||||||||||||||||||||||||||
| 3 | Based on average daily shares outstanding. | |||||||||||||||||||||||||||||||||||||||||||||||||||||||||||||||||||||||||||||||
| 4 | Does not reflect the effect of sales charges, if any. | |||||||||||||||||||||||||||||||||||||||||||||||||||||||||||||||||||||||||||||||
| 5 | Total returns would have been lower had certain expenses not been reduced during the applicable periods. | |||||||||||||||||||||||||||||||||||||||||||||||||||||||||||||||||||||||||||||||
| 6 | Not annualized. | |||||||||||||||||||||||||||||||||||||||||||||||||||||||||||||||||||||||||||||||
| 7 | Less than $500,000. | |||||||||||||||||||||||||||||||||||||||||||||||||||||||||||||||||||||||||||||||
| 8 | Annualized. | |||||||||||||||||||||||||||||||||||||||||||||||||||||||||||||||||||||||||||||||
| 9 | The portfolio turnover is shown for the period from 8-1-13 to 7-31-14. | |||||||||||||||||||||||||||||||||||||||||||||||||||||||||||||||||||||||||||||||
| Class I Shares Period ended | 1-31-16 | 1 | 7-31-15 | 7-31-14 | 7-31-13 | 7-31-12 | 7-31-11 | 2 | ||||||||||||||||||||||||||||||||||||||||||||||||||||||||||||||||||||||||||||||||||||||||||||||||||||||||||||||
| Per share operating performance | ||||||||||||||||||||||||||||||||||||||||||||||||||||||||||||||||||||||||||||||||||||||||||||||||||||||||||||||||||||||
| Net asset value, beginning of period | $16.27 | $14.39 | $12.93 | $9.99 | $9.74 | $10.00 | ||||||||||||||||||||||||||||||||||||||||||||||||||||||||||||||||||||||||||||||||||||||||||||||||||||||||||||||||
| Net investment income3 | 0.01 | 0.01 | 0.05 | 0.09 | 0.07 | — | 4 | |||||||||||||||||||||||||||||||||||||||||||||||||||||||||||||||||||||||||||||||||||||||||||||||||||||||||||||||
| Net realized and unrealized gain (loss) on investments | (2.21 | ) | 2.29 | 2.12 | 3.19 | 0.28 | (0.26 | ) | ||||||||||||||||||||||||||||||||||||||||||||||||||||||||||||||||||||||||||||||||||||||||||||||||||||||||||||||
| Total from investment operations | (2.20 | ) | 2.30 | 2.17 | 3.28 | 0.35 | (0.26 | ) | ||||||||||||||||||||||||||||||||||||||||||||||||||||||||||||||||||||||||||||||||||||||||||||||||||||||||||||||
| Less distributions | ||||||||||||||||||||||||||||||||||||||||||||||||||||||||||||||||||||||||||||||||||||||||||||||||||||||||||||||||||||||
| From net investment income | (0.01 | ) | (0.02 | ) | (0.05 | ) | (0.10 | ) | (0.05 | ) | — | |||||||||||||||||||||||||||||||||||||||||||||||||||||||||||||||||||||||||||||||||||||||||||||||||||||||||||
| From net realized gain | (0.79 | ) | (0.40 | ) | (0.66 | ) | (0.24 | ) | (0.05 | ) | — | |||||||||||||||||||||||||||||||||||||||||||||||||||||||||||||||||||||||||||||||||||||||||||||||||||||||||||
| Total distributions | (0.80 | ) | (0.42 | ) | (0.71 | ) | (0.34 | ) | (0.10 | ) | — | |||||||||||||||||||||||||||||||||||||||||||||||||||||||||||||||||||||||||||||||||||||||||||||||||||||||||||
| Net asset value, end of period | $13.27 | $16.27 | $14.39 | $12.93 | $9.99 | $9.74 | ||||||||||||||||||||||||||||||||||||||||||||||||||||||||||||||||||||||||||||||||||||||||||||||||||||||||||||||||
| Total return (%)5 | (14.06 | ) 6 | 16.20 | 17.01 | 34.48 | 3.63 | (2.60 | ) 6 | ||||||||||||||||||||||||||||||||||||||||||||||||||||||||||||||||||||||||||||||||||||||||||||||||||||||||||||||
| Ratios and supplemental data | ||||||||||||||||||||||||||||||||||||||||||||||||||||||||||||||||||||||||||||||||||||||||||||||||||||||||||||||||||||||
| Net assets, end of period (in millions) | $10 | $11 | $6 | $3 | $1 | $1 | ||||||||||||||||||||||||||||||||||||||||||||||||||||||||||||||||||||||||||||||||||||||||||||||||||||||||||||||||
| Ratios (as a percentage of average net assets): | ||||||||||||||||||||||||||||||||||||||||||||||||||||||||||||||||||||||||||||||||||||||||||||||||||||||||||||||||||||||
| Expenses before reductions | 0.97 | 7 | 1.05 | 1.76 | 3.18 | 7.00 | 5.45 | 7 | ||||||||||||||||||||||||||||||||||||||||||||||||||||||||||||||||||||||||||||||||||||||||||||||||||||||||||||||
| Expenses including reductions | 0.95 | 7 | 0.94 | 0.94 | 0.91 | 0.84 | 0.84 | 7 | ||||||||||||||||||||||||||||||||||||||||||||||||||||||||||||||||||||||||||||||||||||||||||||||||||||||||||||||
| Net investment income | 0.13 | 7 | 0.07 | 0.37 | 0.80 | 0.75 | 0.14 | 7 | ||||||||||||||||||||||||||||||||||||||||||||||||||||||||||||||||||||||||||||||||||||||||||||||||||||||||||||||
| Portfolio turnover (%) | 23 | 42 | 44 | 59 | 47 | 8 | ||||||||||||||||||||||||||||||||||||||||||||||||||||||||||||||||||||||||||||||||||||||||||||||||||||||||||||||||
| 1 | Six months ended 1-31-16. Unaudited. | ||||||||||||||||||||||||||||||||||||||||||||||||||||||||||||||||||||||||||||||||||
| 2 | Period from 6-1-11 (commencement of operations) to 7-31-11. | ||||||||||||||||||||||||||||||||||||||||||||||||||||||||||||||||||||||||||||||||||
| 3 | Based on average daily shares outstanding. | ||||||||||||||||||||||||||||||||||||||||||||||||||||||||||||||||||||||||||||||||||
| 4 | Less than $0.005 per share. | ||||||||||||||||||||||||||||||||||||||||||||||||||||||||||||||||||||||||||||||||||
| 5 | Total returns would have been lower had certain expenses not been reduced during the applicable periods. | ||||||||||||||||||||||||||||||||||||||||||||||||||||||||||||||||||||||||||||||||||
| 6 | Not annualized. | ||||||||||||||||||||||||||||||||||||||||||||||||||||||||||||||||||||||||||||||||||
| 7 | Annualized | ||||||||||||||||||||||||||||||||||||||||||||||||||||||||||||||||||||||||||||||||||
| Class R2 Shares Period ended | 1-31-16 | 1 | 7-31-15 | 2 | ||||||||||||||||||||||||||||||||||||||||||||||
| Per share operating performance | ||||||||||||||||||||||||||||||||||||||||||||||||||
| Net asset value, beginning of period | $16.26 | $15.12 | ||||||||||||||||||||||||||||||||||||||||||||||||
| Net investment income (loss)3 | — | (0.01 | ) | |||||||||||||||||||||||||||||||||||||||||||||||
| Net realized and unrealized gain (loss) on investments | (2.21 | ) | 1.15 | |||||||||||||||||||||||||||||||||||||||||||||||
| Total from investment operations | (2.21 | ) | 1.14 | |||||||||||||||||||||||||||||||||||||||||||||||
| Less distributions | ||||||||||||||||||||||||||||||||||||||||||||||||||
| From net realized gain | (0.79 | ) | — | |||||||||||||||||||||||||||||||||||||||||||||||
| Total distributions | (0.79 | ) | — | |||||||||||||||||||||||||||||||||||||||||||||||
| Net asset value, end of period | $13.26 | $16.26 | ||||||||||||||||||||||||||||||||||||||||||||||||
| Total return (%)4 | (14.20 | ) 5 | 7.54 | 5 | ||||||||||||||||||||||||||||||||||||||||||||||
| Ratios and supplemental data | ||||||||||||||||||||||||||||||||||||||||||||||||||
| Net assets, end of period (in millions) | — | 6 | — | 6 | ||||||||||||||||||||||||||||||||||||||||||||||
| Ratios (as a percentage of average net assets): | ||||||||||||||||||||||||||||||||||||||||||||||||||
| Expenses before reductions | 1.13 | 7 | 1.10 | 7 | ||||||||||||||||||||||||||||||||||||||||||||||
| Expenses including reductions | 1.12 | 7 | 1.10 | 7 | ||||||||||||||||||||||||||||||||||||||||||||||
| Net investment loss | (0.01 | ) 7 | (0.19 | ) 7 | ||||||||||||||||||||||||||||||||||||||||||||||
| Portfolio turnover (%) | 23 | 42 | 8 | |||||||||||||||||||||||||||||||||||||||||||||||
| 1 | Six months ended 1-31-16. Unaudited. | ||||||||||||||||||||||||||||||||||||||||||||||||||||||||||
| 2 | The inception date for Class R2 shares is 3-27-15. | ||||||||||||||||||||||||||||||||||||||||||||||||||||||||||
| 3 | Based on average daily shares outstanding. | ||||||||||||||||||||||||||||||||||||||||||||||||||||||||||
| 4 | Total returns would have been lower had certain expenses not been reduced during the applicable periods. | ||||||||||||||||||||||||||||||||||||||||||||||||||||||||||
| 5 | Not annualized. | ||||||||||||||||||||||||||||||||||||||||||||||||||||||||||
| 6 | Less than $500,000. | ||||||||||||||||||||||||||||||||||||||||||||||||||||||||||
| 7 | Annualized. | ||||||||||||||||||||||||||||||||||||||||||||||||||||||||||
| 8 | The portfolio turnover is shown for the period from 8-1-14 to 7-31-15. | ||||||||||||||||||||||||||||||||||||||||||||||||||||||||||
| Class R4 Shares Period ended | 1-31-16 | 1 | 7-31-15 | 2 | ||||||||||||||||||||||||||||||||||||||||||||||
| Per share operating performance | ||||||||||||||||||||||||||||||||||||||||||||||||||
| Net asset value, beginning of period | $16.27 | $15.12 | ||||||||||||||||||||||||||||||||||||||||||||||||
| Net investment income3 | 0.01 | (0.01 | ) | |||||||||||||||||||||||||||||||||||||||||||||||
| Net realized and unrealized gain (loss) on investments | (2.22 | ) | 1.16 | |||||||||||||||||||||||||||||||||||||||||||||||
| Total from investment operations | (2.21 | ) | 1.15 | |||||||||||||||||||||||||||||||||||||||||||||||
| Less distributions | ||||||||||||||||||||||||||||||||||||||||||||||||||
| From net investment income | (0.01 | ) | — | |||||||||||||||||||||||||||||||||||||||||||||||
| From net realized gain | (0.79 | ) | — | |||||||||||||||||||||||||||||||||||||||||||||||
| Total distributions | (0.80 | ) | — | |||||||||||||||||||||||||||||||||||||||||||||||
| Net asset value, end of period | $13.26 | $16.27 | ||||||||||||||||||||||||||||||||||||||||||||||||
| Total return (%)4 | (14.15 | ) 5 | 7.61 | 5 | ||||||||||||||||||||||||||||||||||||||||||||||
| Ratios and supplemental data | ||||||||||||||||||||||||||||||||||||||||||||||||||
| Net assets, end of period (in millions) | — | 6 | — | 6 | ||||||||||||||||||||||||||||||||||||||||||||||
| Ratios (as a percentage of average net assets): | ||||||||||||||||||||||||||||||||||||||||||||||||||
| Expenses before reductions | 1.12 | 7 | 1.10 | 7 | ||||||||||||||||||||||||||||||||||||||||||||||
| Expenses including reductions | 1.01 | 7 | 1.00 | 7 | ||||||||||||||||||||||||||||||||||||||||||||||
| Net investment income (loss) | 0.10 | 7 | (0.09 | ) 7 | ||||||||||||||||||||||||||||||||||||||||||||||
| Portfolio turnover (%) | 23 | 42 | 8 | |||||||||||||||||||||||||||||||||||||||||||||||
| 1 | Six months ended 1-31-16. Unaudited. | ||||||||||||||||||||||||||||||||||||||||||||||||||||||||||
| 2 | The inception date for Class R4 shares is 3-27-15. | ||||||||||||||||||||||||||||||||||||||||||||||||||||||||||
| 3 | Based on average daily shares outstanding. | ||||||||||||||||||||||||||||||||||||||||||||||||||||||||||
| 4 | Total returns would have been lower had certain expenses not been reduced during the applicable periods. | ||||||||||||||||||||||||||||||||||||||||||||||||||||||||||
| 5 | Not annualized. | ||||||||||||||||||||||||||||||||||||||||||||||||||||||||||
| 6 | Less than $500,000. | ||||||||||||||||||||||||||||||||||||||||||||||||||||||||||
| 7 | Annualized. | ||||||||||||||||||||||||||||||||||||||||||||||||||||||||||
| 8 | The portfolio turnover is shown for the period from 8-1-14 to 7-31-15. | ||||||||||||||||||||||||||||||||||||||||||||||||||||||||||
| Class R6 Shares Period ended | 1-31-16 | 1 | 7-31-15 | 2 | ||||||||||||||||||||||||||||||||||||||||||||||
| Per share operating performance | ||||||||||||||||||||||||||||||||||||||||||||||||||
| Net asset value, beginning of period | $16.28 | $15.12 | ||||||||||||||||||||||||||||||||||||||||||||||||
| Net investment income3 | 0.01 | — | 4 | |||||||||||||||||||||||||||||||||||||||||||||||
| Net realized and unrealized gain (loss) on investments | (2.21 | ) | 1.16 | |||||||||||||||||||||||||||||||||||||||||||||||
| Total from investment operations | (2.20 | ) | 1.16 | |||||||||||||||||||||||||||||||||||||||||||||||
| Less distributions | ||||||||||||||||||||||||||||||||||||||||||||||||||
| From net investment income | (0.02 | ) | — | |||||||||||||||||||||||||||||||||||||||||||||||
| From net realized gain | (0.79 | ) | — | |||||||||||||||||||||||||||||||||||||||||||||||
| Total distributions | (0.81 | ) | — | |||||||||||||||||||||||||||||||||||||||||||||||
| Net asset value, end of period | $13.27 | $16.28 | ||||||||||||||||||||||||||||||||||||||||||||||||
| Total return (%)5 | (14.08 | ) 6 | 7.67 | 6 | ||||||||||||||||||||||||||||||||||||||||||||||
| Ratios and supplemental data | ||||||||||||||||||||||||||||||||||||||||||||||||||
| Net assets, end of period (in millions) | — | 7 | — | 7 | ||||||||||||||||||||||||||||||||||||||||||||||
| Ratios (as a percentage of average net assets): | ||||||||||||||||||||||||||||||||||||||||||||||||||
| Expenses before reductions | 0.88 | 8 | 0.85 | 8 | ||||||||||||||||||||||||||||||||||||||||||||||
| Expenses including reductions | 0.85 | 8 | 0.83 | 8 | ||||||||||||||||||||||||||||||||||||||||||||||
| Net investment income | 0.18 | 8 | 0.01 | 8 | ||||||||||||||||||||||||||||||||||||||||||||||
| Portfolio turnover (%) | 23 | 42 | 9 | |||||||||||||||||||||||||||||||||||||||||||||||
| 1 | Six months ended 1-31-16. Unaudited. | ||||||||||||||||||||||||||||||||||||||||||||||||||||||||||
| 2 | The inception date for Class R6 shares is 3-27-15. | ||||||||||||||||||||||||||||||||||||||||||||||||||||||||||
| 3 | Based on average daily shares outstanding. | ||||||||||||||||||||||||||||||||||||||||||||||||||||||||||
| 4 | Less than $0.005 per share. | ||||||||||||||||||||||||||||||||||||||||||||||||||||||||||
| 5 | Total returns would have been lower had certain expenses not been reduced during the applicable periods. | ||||||||||||||||||||||||||||||||||||||||||||||||||||||||||
| 6 | Not annualized. | ||||||||||||||||||||||||||||||||||||||||||||||||||||||||||
| 7 | Less than $500,000. | ||||||||||||||||||||||||||||||||||||||||||||||||||||||||||
| 8 | Annualized. | ||||||||||||||||||||||||||||||||||||||||||||||||||||||||||
| 9 | The portfolio turnover is shown for the period from 8-1-14 to 7-31-15. | ||||||||||||||||||||||||||||||||||||||||||||||||||||||||||
| Class NAV Shares Period ended | 1-31-16 | 1 | 7-31-15 | 7-31-14 | 2 | ||||||||||||||||||||||||||||||||||||||||||||||||||||||||||||||||||
| Per share operating performance | |||||||||||||||||||||||||||||||||||||||||||||||||||||||||||||||||||||||
| Net asset value, beginning of period | $16.28 | $14.39 | $14.54 | ||||||||||||||||||||||||||||||||||||||||||||||||||||||||||||||||||||
| Net investment income3 | 0.02 | 0.03 | — | 4 | |||||||||||||||||||||||||||||||||||||||||||||||||||||||||||||||||||
| Net realized and unrealized gain (loss) on investments | (2.22 | ) | 2.29 | (0.15 | ) | ||||||||||||||||||||||||||||||||||||||||||||||||||||||||||||||||||
| Total from investment operations | (2.20 | ) | 2.32 | (0.15 | ) | ||||||||||||||||||||||||||||||||||||||||||||||||||||||||||||||||||
| Less distributions | |||||||||||||||||||||||||||||||||||||||||||||||||||||||||||||||||||||||
| From net investment income | (0.02 | ) | (0.03 | ) | — | ||||||||||||||||||||||||||||||||||||||||||||||||||||||||||||||||||
| From net realized gain | (0.79 | ) | (0.40 | ) | — | ||||||||||||||||||||||||||||||||||||||||||||||||||||||||||||||||||
| Total distributions | (0.81 | ) | (0.43 | ) | — | ||||||||||||||||||||||||||||||||||||||||||||||||||||||||||||||||||
| Net asset value, end of period | $13.27 | $16.28 | $14.39 | ||||||||||||||||||||||||||||||||||||||||||||||||||||||||||||||||||||
| Total return (%)5 | (14.06 | ) 6 | 16.38 | (1.03 | ) 6 | ||||||||||||||||||||||||||||||||||||||||||||||||||||||||||||||||||
| Ratios and supplemental data | |||||||||||||||||||||||||||||||||||||||||||||||||||||||||||||||||||||||
| Net assets, end of period (in millions) | $105 | $122 | $128 | ||||||||||||||||||||||||||||||||||||||||||||||||||||||||||||||||||||
| Ratios (as a percentage of average net assets): | |||||||||||||||||||||||||||||||||||||||||||||||||||||||||||||||||||||||
| Expenses before reductions | 0.86 | 7 | 0.84 | 0.87 | 7 | ||||||||||||||||||||||||||||||||||||||||||||||||||||||||||||||||||
| Expenses including reductions | 0.85 | 7 | 0.83 | 0.87 | 7 | ||||||||||||||||||||||||||||||||||||||||||||||||||||||||||||||||||
| Net investment income (loss) | 0.26 | 7 | 0.20 | (0.26 | ) 7 | ||||||||||||||||||||||||||||||||||||||||||||||||||||||||||||||||||
| Portfolio turnover (%) | 23 | 42 | 44 | 8 | |||||||||||||||||||||||||||||||||||||||||||||||||||||||||||||||||||
| 1 | Six months ended 1-31-16. Unaudited. | |||||||||||||||||||||||||||||||||||||||||||||||||||||||||||||||||||||||||||||||
| 2 | The inception date for Class NAV shares is 6-26-14. | |||||||||||||||||||||||||||||||||||||||||||||||||||||||||||||||||||||||||||||||
| 3 | Based on average daily shares outstanding. | |||||||||||||||||||||||||||||||||||||||||||||||||||||||||||||||||||||||||||||||
| 4 | Less than $0.005 per share. | |||||||||||||||||||||||||||||||||||||||||||||||||||||||||||||||||||||||||||||||
| 5 | Total returns would have been lower had certain expenses not been reduced during the applicable periods. | |||||||||||||||||||||||||||||||||||||||||||||||||||||||||||||||||||||||||||||||
| 6 | Not annualized. | |||||||||||||||||||||||||||||||||||||||||||||||||||||||||||||||||||||||||||||||
| 7 | Annualized. | |||||||||||||||||||||||||||||||||||||||||||||||||||||||||||||||||||||||||||||||
| 8 | The portfolio turnover is shown for the period from 8-1-13 to 7-31-14. | |||||||||||||||||||||||||||||||||||||||||||||||||||||||||||||||||||||||||||||||
Note 1 — Organization
John Hancock Fundamental All Cap Core Fund (the fund) is a series of John Hancock Funds II (the Trust), an open-end management investment company organized as a Massachusetts business trust and registered under the Investment Company Act of 1940, as amended (the 1940 Act). The investment objective of the fund is to seek long-term capital appreciation.
The fund may offer multiple classes of shares. The shares currently offered are detailed in the Statement of assets and liabilities. Class A and Class C shares are offered to all investors. Class I shares are offered to institutions and certain investors. Class R2 and Class R4 shares are available only to certain retirement plans. Class R6 shares are available only to certain retirement plans, institutions and other investors. Class NAV shares are offered to John Hancock affiliated funds of funds and certain 529 plans. Shareholders of each class have exclusive voting rights to matters that affect that class. The distribution and service fees, if any, and transfer agent fees, for each class may differ.
Note 2 — Significant accounting policies
The financial statements have been prepared in conformity with accounting principles generally accepted in the United States of America (US GAAP), which require management to make certain estimates and assumptions as of the date of the financial statements. Actual results could differ from those estimates and those differences could be significant. The fund qualifies as an investment company under Topic 946 of Accounting Standards Codification of US GAAP.
Events or transactions occurring after the end of the fiscal period through the date that the financial statements were issued have been evaluated in the preparation of the financial statements. The following summarizes the significant accounting policies of the fund:
Security valuation. Investments are stated at value as of the close of regular trading on the New York Stock Exchange (NYSE), normally at 4:00 p.m., Eastern Time. In order to value the securities, the fund uses the following valuation techniques: Equity securities held by the fund are valued at the last sale price or official closing price on the exchange or principal market where the security was acquired or most likely will be sold. In the event there were no sales during the day or closing prices are not available, the securities are valued using the last available bid price. Foreign securities and currencies are valued in U.S. dollars, based on foreign currency exchange rates supplied by an independent pricing vendor. Securities that trade only in the over-the-counter (OTC) market are valued using bid prices. Other portfolio securities and assets, for which reliable market quotations are not readily available, are valued at fair value as determined in good faith by the fund's Pricing Committee following procedures established by the Board of Trustees. The frequency with which these fair valuation procedures are used cannot be predicted and fair value securities may differ significantly from the value that would have been used had a ready market for such securities existed.
The fund uses a three-tier hierarchy to prioritize the pricing assumptions, referred to as inputs, used in valuation techniques to measure fair value. Level 1 includes securities valued using quoted prices in active markets for identical securities. Level 2 includes securities valued using other significant observable inputs. Observable inputs may include quoted prices for similar securities, interest rates, prepayment speeds and credit risk. Prices for securities valued using these inputs are received from independent pricing vendors and brokers and are based on an evaluation of the inputs described. Level 3 includes securities valued using significant unobservable inputs when market prices are not readily available or reliable, including the fund's own assumptions in determining the fair value of investments. Factors used in determining value may include market or issuer specific events or trends, changes in interest rates and credit quality. The inputs or methodology used for valuing securities are not necessarily an indication of the risks associated with investing in those securities. Changes in valuation techniques may result in transfers into or out of an assigned level within the disclosure hierarchy.
The following is a summary of the values by input classification of the fund's investments as of January 31, 2016, by major security category or type:
| Total value at 1-31-16 |
Level 1 quoted price |
Level 2 significant observable inputs |
Level 3 significant unobservable inputs |
||
| Common stocks | |||||
| Consumer discretionary | $40,270,564 | $36,442,144 | $3,828,420 | — | |
| Consumer staples | 9,688,409 | 6,372,543 | 3,315,866 | — | |
| Energy | 4,684,858 | 4,684,858 | — | — | |
| Financials | 38,472,371 | 38,472,371 | — | — | |
| Health care | 2,516,685 | 2,516,685 | — | — | |
| Industrials | 12,787,549 | 12,787,549 | — | — | |
| Information technology | 26,553,983 | 26,553,983 | — | — | |
| Materials | 2,929,060 | 2,929,060 | — | — | |
| Short-term investments | 6,791,000 | — | 6,791,000 | — | |
| Total investments in securities | $144,694,479 | $130,759,193 | $13,935,286 | — | |
Repurchase agreements. The fund may enter into repurchase agreements. When the fund enters into a repurchase agreement, it receives collateral that is held in a segregated account by the fund's custodian, or for tri-party repurchase agreements, collateral is held at a third-party custodian bank in a segregated account for the benefit of the fund. The collateral amount is marked-to-market and monitored on a daily basis to ensure that the collateral held is in an amount not less than the principal amount of the repurchase agreement plus any accrued interest. Collateral received by the fund for repurchase agreements is disclosed in the Fund's investments as part of the caption related to the repurchase agreement.
Repurchase agreements are typically governed by the terms and conditions of the Master Repurchase Agreement and/or Global Master Repurchase Agreement (collectively, MRA). Upon an event of default, the non-defaulting party may close out all transactions traded under the MRA and net amounts owed. Absent an event of default, assets and liabilities resulting from repurchase agreements are not offset in the Statement of assets and liabilities. In the event of a default by the counterparty, realization of the collateral proceeds could be delayed, during which time the collateral value may decline or the counterparty may have insufficient assets to pay back claims resulting from close-out of the transactions.
Security transactions and related investment income. Investment security transactions are accounted for on a trade date plus one basis for daily net asset value calculations. However, for financial reporting purposes, investment transactions are reported on trade date. Interest income is accrued as earned. Dividend income is recorded on the ex-date, except for dividends of foreign securities where the dividend may not be known until after the ex-date. In those cases, dividend income, net of withholding taxes, is recorded when the fund becomes aware of the dividends. Gains and losses on securities sold are determined on the basis of identified cost and may include proceeds from litigation.
Foreign currency translation. Assets, including investments and liabilities denominated in foreign currencies, are translated into U.S. dollar values each day at the prevailing exchange rate. Purchases and sales of securities, income and expenses are translated into U.S. dollars at the prevailing exchange rate on the date of the transaction. The effect of changes in foreign currency exchange rates on the value of securities is reflected as a component of the realized and unrealized gains (losses) on investments.
Funds that invest internationally generally carry more risk than funds that invest strictly in U.S. securities. Risks can result from differences in economic and political conditions, regulations, market practices (including higher transaction costs), accounting standards and other factors. Foreign investments are also subject to a decline in the value of a foreign currency versus the U.S. dollar, which reduces the dollar value of securities denominated in that currency.
Line of credit. The fund may borrow from banks for temporary or emergency purposes, including meeting redemption requests that otherwise might require the untimely sale of securities. Pursuant to the fund's custodian agreement, the
custodian may loan money to the fund to make properly authorized payments. The fund is obligated to repay the custodian for any overdraft, including any related costs or expenses. The custodian may have a lien, security interest or security entitlement in any fund property that is not otherwise segregated or pledged, to the extent of any overdraft, and to the maximum extent permitted by law.
The fund and other affiliated funds have entered into a syndicated line of credit agreement, with Citibank, N.A. as the administrative agent, that enables them to participate in a $750 million unsecured committed line of credit. A commitment fee, payable at the end of each calendar quarter, based on the average daily unused portion of the effective line of credit, is charged to each participating fund on a pro rata basis and is reflected in Other expenses on the Statement of operations. Commitment fees for the six months ended January 31, 2016 were $295. For the six months ended January 31, 2016, the fund had no borrowings under the line of credit.
Expenses. Within the John Hancock group of funds complex, expenses that are directly attributable to an individual fund are allocated to such fund. Expenses that are not readily attributable to a specific fund are allocated among all funds in an equitable manner, taking into consideration, among other things, the nature and type of expense and the fund's relative net assets. Expense estimates are accrued in the period to which they relate and adjustments are made when actual amounts are known.
Class allocations. Income, common expenses and realized and unrealized gains (losses) are determined at the fund level and allocated daily to each class of shares based on the net assets of the class. Class-specific expenses, such as distribution and service fees, if any, and transfer agent fees, are calculated daily for each class, based on the net asset value of the class and the applicable specific expense rates.
Federal income taxes. The fund intends to continue to qualify as a regulated investment company by complying with the applicable provisions of the Internal Revenue Code and will not be subject to federal income tax on taxable income that is distributed to shareholders. Therefore, no federal income tax provision is required.
As of July 31, 2015, the fund had no uncertain tax positions that would require financial statement recognition, derecognition or disclosure. The fund's federal tax returns are subject to examination by the Internal Revenue Service for a period of three years.
Distribution of income and gains. Distributions to shareholders from net investment income and net realized gains, if any, are recorded on the ex-date. The fund generally declares and pays dividends and capital gain distributions, if any, annually.
Distributions paid by the fund with respect to each class of shares are calculated in the same manner, at the same time and in the same amount, except for the effect of class level expenses that may be applied differently to each class.
Such distributions, on a tax basis, are determined in conformity with income tax regulations, which may differ from US GAAP.
Capital accounts within the financial statements are adjusted for permanent book-tax differences. These adjustments have no impact on net assets or the results of operations. Temporary book-tax differences, if any, will reverse in a subsequent period. Book-tax differences are primarily attributable to wash sale loss deferrals, partnerships and characterization of distributions.
Note 3 — Guarantees and indemnifications
Under the Trust's organizational documents, its Officers and Trustees are indemnified against certain liabilities arising out of the performance of their duties to the Trust, including the fund. Additionally, in the normal course of business, the fund enters into contracts with service providers that contain general indemnification clauses. The fund's maximum exposure under these arrangements is unknown, as this would involve future claims that may be made against the fund that have not yet occurred. The risk of material loss from such claims is considered remote.
Note 4 — Fees and transactions with affiliates
John Hancock Advisers, LLC (the Advisor) serves as investment advisor for the fund. John Hancock Funds, LLC (the Distributor), an affiliate of the Advisor, serves as principal underwriter of the fund. The Advisor and the Distributor are indirect, wholly owned subsidiaries of Manulife Financial Corporation (MFC).
Management fee. The fund has an investment management agreement with the Advisor under which the fund pays a daily management fee to the Advisor equivalent, on an annual basis, to the sum of: a) 0.675% of the first $2.5 billion of the fund's aggregate average daily net assets together with the net assets of Fundamental All Cap Core Trust, a series of John Hancock Variable Insurance Trust (combined aggregate average daily net assets); and b) 0.650% of the combined aggregate average daily net assets in excess of $2.5 billion. The Advisor has a subadvisory agreement with John Hancock Asset Management a division of Manulife Asset Management (US) LLC, an indirectly owned subsidiary of MFC and an affiliate of the Advisor. The fund is not responsible for payment of the subadvisory fees.
The Advisor has contractually agreed to waive a portion of its management fee and/or reimburse expenses for certain funds of the John Hancock group of funds complex, including the fund (the participating portfolios). This waiver is based upon aggregate net assets of all the participating portfolios. The amount of the reimbursement is calculated daily and allocated among all the participating portfolios in proportion to the daily net assets of each fund. During the six months ended January 31, 2016, this waiver amounted to 0.01% of the fund's average net assets. This arrangement may be amended or terminated at any time by the Advisor upon notice to the fund and with the approval of the Board of Trustees.
The Advisor contractually agreed to reduce its management fee or, if necessary, make payments to the fund in an amount equal to the amount by which expenses of the fund exceed 0.20% of the average annual net assets (on an annualized basis) of the fund. For purposes of this agreement, "expenses of the fund" means all of the expenses of the fund, excluding (a) advisory fees; (b) taxes; (c) brokerage commissions; (d) interest expense; (e) litigation and indemnification expenses and other extraordinary expenses not incurred in the ordinary course of the fund's business; (f) class specific expenses; (g) underlying fund expenses (acquired fund fees); and (h) short dividend expense. This agreement expires on November 30, 2016, unless renewed by mutual agreement of the Advisor and the fund based upon a determination that this is appropriate under the circumstances at that time.
Prior to December 1, 2015, the Advisor contractually agreed to waive all or a portion of its management fee and reimburse or pay operating expenses of the fund to the extent necessary to maintain the fund's total operating expense at 1.30%, 2.00% and 0.94% for Class A, Class C and Class I shares, respectively, excluding certain expenses such as taxes, brokerage commissions, interest expense, litigation and indemnification expenses and other extraordinary expenses.
The Advisor has contractually agreed to waive and/or reimburse all class-specific expenses for Class R6 shares of the fund to the extent they exceed 0.00% of average annual net assets attributable to Class R6 shares (the class expense waiver). The class expense waiver expires on November 30, 2016, unless renewed by mutual agreement of the fund and the Advisor based upon a determination that this is appropriate under the circumstances at that time.
The expense reductions described above amounted to the following for the six months ended January 31, 2016;
| Class | Expense reductions | Class | Expense reductions | |
| Class A | $984 | Class R4 | $4 | |
| Class C | 96 | Class R6 | 46 | |
| Class I | 1,339 | Class NAV | 4,288 | |
| Class R2 | 4 | Total | $6,761 |
The investment management fees, including the impact of the waivers and reimbursement described above, incurred for the six months ended January 31, 2016 were equivalent to a net annual effective rate of 0.67% of the fund's average daily net assets.
Accounting and legal services. Pursuant to a service agreement, the fund reimburses the Advisor for all expenses associated with providing the administrative, financial, legal, accounting and recordkeeping services to the fund, including
the preparation of all tax returns, periodic reports to shareholders and regulatory reports, among other services. These expenses are allocated to each share class based on its relative net assets at the time the expense was incurred. These accounting and legal services fees incurred for the six months ended January 31, 2016 amounted to an annual rate of 0.01% of the fund's average daily net assets.
Distribution and service plans. The fund has a distribution agreement with the Distributor. The fund has adopted distribution and service plans with respect to Class A, Class C, Class R2 and Class R4 shares pursuant to Rule 12b-1 under the 1940 Act, to pay the Distributor for services provided as the distributor of shares of the fund. In addition, under a service plan for Class R2 and Class R4 shares, the fund pays for certain other services. The fund may pay up to the following contractual rates of distribution and service fees under these arrangements, expressed as an annual percentage of average daily net assets for each class of the fund's shares.
| Class | Rule 12b-1 fee | Service fee |
| Class A | 0.30% | - |
| Class C | 1.00% | - |
| Class R2 | 0.25% | 0.25% |
| Class R4 | 0.25% | 0.10% |
The fund's Distributor has contractually agreed to waive 0.10% of Rule 12b-1 fees for Class R4 shares. This agreement expires on November 30, 2016, unless renewed by mutual agreement of the fund and the Distributor based upon a determination that this is appropriate under the circumstances at the time. This contractual waiver amounted to $51 for Class R4 shares for the six months ended January 31, 2016.
Sales charges. Class A shares are assessed up-front sales charges, which resulted in payments to the Distributor amounting to $116,104 for the six months ended January 31, 2016. Of this amount, $18,879 was retained and used for printing prospectuses, advertising, sales literature and other purposes and $94,676 was paid as sales commissions to broker-dealers and $2,549 was paid as sales commissions to sales personnel of Signator Investors, Inc., a broker-dealer affiliate of the Advisor.
Class A and Class C shares may be subject to contingent deferred sales charges (CDSCs). Certain Class A shares that are acquired through purchases of $1 million or more and are redeemed within one year of purchase are subject to a 1.00% sales charge. Class C shares that are redeemed within one year of purchase are subject to a 1.00% CDSC. CDSCs are applied to the lesser of the current market value at the time of redemption or the original purchase cost of the shares being redeemed. Proceeds from CDSCs are used to compensate the Distributor for providing distribution-related services in connection with the sale of these shares. During the six months ended January 31, 2016, CDSCs received by the distributor amounted to $0 and $897 for Class A and Class C shares, respectively.
Transfer agent fees. The fund has a transfer agent agreement with John Hancock Signature Services, Inc. (Signature Services), an affiliate of the Advisor. The transfer agent fees paid to Signature Services are determined based on the cost to Signature Services (Signature Services Cost) of providing recordkeeping services. It also includes out-of-pocket expenses, including payments made to third-parties for recordkeeping services provided to their clients who invest in one or more John Hancock funds. In addition, Signature Services Cost may be reduced by certain fees that Signature Services receives in connection with retirement and small accounts. Signature Services Cost is calculated monthly and allocated, as applicable, to five categories of share classes: Retail Share and Institutional Share Classes of Non-Municipal Bond Funds, Class R6 Shares, Retirement Share Classes and Municipal Bond Share Classes. Within each of these categories, the applicable costs are allocated to the affected John Hancock affiliated funds and/or classes, based on the relative average daily net assets.
Class level expenses. Class level expenses for the six months ended January 31, 2016 were:
| Class | Distribution and service fees | Transfer agent fees | ||||||
| Class A | $39,645 | $16,241 | ||||||
| Class C | 12,850 | 1,576 |
| Class | Distribution and service fees | Transfer agent fees | ||||||
| Class I | — | 6,524 | ||||||
| Class R2 | 130 | 8 | ||||||
| Class R4 | 127 | 8 | ||||||
| Class R6 | — | 32 | ||||||
| Total | $52,752 | $24,389 |
Trustee expenses. The fund compensates each Trustee who is not an employee of the Advisor or its affiliates. The costs of paying Trustee compensation and expenses are allocated to each fund based on its net assets relative to other funds within the John Hancock group of funds complex.
Note 5 — Fund share transactions
Transactions in fund shares for the six months ended January 31, 2016 and for the year ended July 31, 2015 were as follows:
| Six months ended 1-31-16 | Year ended 7-31-15 | |||||||||||||||||||||||||
| Shares | Amount | Shares | Amount | |||||||||||||||||||||||
| Class A shares | ||||||||||||||||||||||||||
| Sold | 735,232 | $11,216,478 | 884,735 | $13,579,734 | ||||||||||||||||||||||
| Distributions reinvested | 100,945 | 1,491,961 | 25,236 | 376,013 | ||||||||||||||||||||||
| Repurchased | (242,065 | ) | (3,538,671 | ) | (478,493 | ) | (7,319,133 | ) | ||||||||||||||||||
| Net increase | 594,112 | $9,169,768 | 431,478 | $6,636,614 | ||||||||||||||||||||||
| Class C shares | ||||||||||||||||||||||||||
| Sold | 122,070 | $1,885,576 | 121,241 | $1,858,832 | ||||||||||||||||||||||
| Distributions reinvested | 11,347 | 166,569 | 716 | 10,683 | ||||||||||||||||||||||
| Repurchased | (50,739 | ) | (678,205 | ) | (16,486 | ) | (251,768 | ) | ||||||||||||||||||
| Net increase | 82,678 | $1,373,940 | 105,471 | $1,617,747 | ||||||||||||||||||||||
| Class I shares | ||||||||||||||||||||||||||
| Sold | 453,936 | $7,106,166 | 785,393 | $11,927,565 | ||||||||||||||||||||||
| Distributions reinvested | 44,733 | 666,073 | 13,585 | 203,360 | ||||||||||||||||||||||
| Repurchased | (393,357 | ) | (5,920,588 | ) | (551,723 | ) | (8,283,059 | ) | ||||||||||||||||||
| Net increase | 105,312 | $1,851,651 | 247,255 | $3,847,866 | ||||||||||||||||||||||
| Class R2 shares1 | ||||||||||||||||||||||||||
| Sold | 1,094 | $16,802 | 6,822 | $103,250 | ||||||||||||||||||||||
| Distributions reinvested | 58 | 862 | — | — | ||||||||||||||||||||||
| Repurchased | (1,152 | ) | (17,058 | ) | (208 | ) | (3,296 | ) | ||||||||||||||||||
| Net increase (decrease) | — | $606 | 6,614 | $99,954 | ||||||||||||||||||||||
| Class R4 shares1 | ||||||||||||||||||||||||||
| Sold | — | — | 6,614 | $100,000 | ||||||||||||||||||||||
| Net increase | — | — | 6,614 | $100,000 | ||||||||||||||||||||||
| Class R6 shares1 | ||||||||||||||||||||||||||
| Sold | 17,669 | $274,100 | 10,228 | $157,480 | ||||||||||||||||||||||
| Distributions reinvested | 1,131 | 16,832 | — | — | ||||||||||||||||||||||
| Net increase | 18,800 | $290,932 | 10,228 | $157,480 | ||||||||||||||||||||||
| Six months ended 1-31-16 | Year ended 7-31-15 | |||||||||||||||||||||||||
| Shares | Amount | Shares | Amount | |||||||||||||||||||||||
| Class NAV shares | ||||||||||||||||||||||||||
| Sold | 358,029 | $5,016,874 | 315,770 | $4,684,625 | ||||||||||||||||||||||
| Distributions reinvested | 395,936 | 5,895,497 | 233,435 | 3,494,516 | ||||||||||||||||||||||
| Repurchased | (372,589 | ) | (6,043,444 | ) | (1,975,230 | ) | (30,247,794 | ) | ||||||||||||||||||
| Net increase (decrease) | 381,376 | $4,868,927 | (1,426,025 | ) | ($22,068,653 | ) | ||||||||||||||||||||
| Total net increase (decrease) | 1,182,278 | $17,555,824 | (618,365 | ) | ($9,608,992 | ) | ||||||||||||||||||||
1 The inception date for Class R2, Class R4 and Class R6 shares is 3-27-15.
Affiliates of the fund owned 100%, 100%, 23% and 100% of shares of beneficial interest of Class R2, Class R4, Class R6 and Class NAV, respectively, on January 31, 2016.
Note 6 — Purchase and sale of securities
Purchases and sales of securities, other than short-term investments, amounted to $47,961,165 and $34,247,102 respectively, for the six months ended January 31, 2016.
Note 7 — Industry or sector risk
The fund may invest a large percentage of its assets in one or more particular industries or sectors of the economy. If a large percentage of the fund's assets are economically tied to a single or small number of industries or sectors of the economy, the fund will be less diversified than a more broadly diversified fund, and it may cause the fund to underperform if that industry or sector underperforms. In addition, focusing on a particular industry or sector may make the fund's net asset value more volatile. Further, a fund that invests in particular industries or sectors is particularly susceptible to the impact of market, economic, regulatory and other factors affecting those industries or sectors.
Note 8 — Investment by affiliated funds
Certain investors in the fund are affiliated funds that are managed by the Advisor and its affiliates. The affiliated funds do not invest in the fund for the purpose of exercising management or control; however, this investment may represent a significant portion of the fund's net assets. At January 31, 2016, funds within the John Hancock group of funds complex held 72.4% of the fund's net assets. The following funds had an affiliate ownership of 5% or more of the fund's net assets:
| Fund | Affiliated concentration |
| JHVIT Lifestyle Moderate MVP | 47.8% |
| JHVIT Lifestyle Conservative MVP | 24.6% |
|
Trustees James M. Oates, Chairperson Officers Andrew G. Arnott John J. Danello Francis V. Knox, Jr. Charles A. Rizzo Salvatore Schiavone |
Investment advisor John Hancock Advisers, LLC Subadvisor John Hancock Asset Management a division of Manulife Asset Management (US) LLC Principal distributor John Hancock Funds, LLC Custodian State Street Bank and Trust Company Transfer agent John Hancock Signature Services, Inc. Legal counsel K&L Gates LLP |
*Member of the Audit Committee
†Non-Independent Trustee
The fund's proxy voting policies and procedures, as well as the fund proxy voting record for the most recent twelve-month period ended June 30, are available free of charge on the Securities and Exchange Commission (SEC) website at sec.gov or on our website.
The fund's complete list of portfolio holdings, for the first and third fiscal quarters, is filed with the SEC on Form N-Q. The fund's Form N-Q is available on our website and the SEC's website, sec.gov, and can be reviewed and copied (for a fee) at the SEC's Public Reference Room in Washington, DC. Call 800-SEC-0330 to receive information on the operation of the SEC's Public Reference Room.
We make this information on your fund, as well as monthly portfolio holdings, and other fund details available on our website at jhinvestments.com or by calling 800-225-5291.
| You can also contact us: | |||
| 800-225-5291 jhinvestments.com |
Regular mail: John Hancock Signature Services, Inc. |
Express mail: John Hancock Signature Services, Inc. |
|
John Hancock family of funds
|
DOMESTIC EQUITY FUNDS Balanced Blue Chip Growth Classic Value Disciplined Value Disciplined Value Mid Cap Equity Income Fundamental All Cap Core Fundamental Large Cap Core Fundamental Large Cap Value New Opportunities Select Growth Small Cap Equity Small Cap Value Small Company Strategic Growth U.S. Equity U.S. Global Leaders Growth Value Equity GLOBAL AND INTERNATIONAL EQUITY FUNDS Disciplined Value International Emerging Markets Emerging Markets Equity Global Equity Global Shareholder Yield Greater China Opportunities International Core International Growth International Small Company International Value Equity |
INCOME FUNDS Bond California Tax-Free Income Core High Yield Emerging Markets Debt Floating Rate Income Focused High Yield Global Income Government Income High Yield Municipal Bond Income Investment Grade Bond Money Market Short Duration Credit Opportunities Spectrum Income Strategic Income Opportunities Tax-Free Bond ALTERNATIVE AND SPECIALTY FUNDS Absolute Return Currency Alternative Asset Allocation Enduring Assets Financial Industries Global Absolute Return Strategies Global Conservative Absolute Return Global Real Estate Natural Resources Redwood Regional Bank Seaport Technical Opportunities |
A fund's investment objectives, risks, charges, and expenses should be considered carefully before investing. The prospectus contains this and other important information about the fund. To obtain a prospectus, contact your financial professional, call John Hancock Investments at 800-225-5291, or visit our website at jhinvestments.com. Please read the prospectus carefully before investing or sending money.
|
ASSET ALLOCATION Income Allocation Fund Lifestyle Aggressive Portfolio Lifestyle Balanced Portfolio Lifestyle Conservative Portfolio Lifestyle Growth Portfolio Lifestyle Moderate Portfolio Retirement Choices Portfolios (2010-2055) Retirement Living Portfolios (2010-2055) Retirement Living II Portfolios (2010-2055) EXCHANGE-TRADED FUNDS John Hancock Multifactor Consumer Discretionary ETF John Hancock Multifactor Financials ETF John Hancock Multifactor Healthcare ETF John Hancock Multifactor Large Cap ETF John Hancock Multifactor Mid Cap ETF John Hancock Multifactor Technology ETF CLOSED-END FUNDS Financial Opportunities Hedged Equity & Income Income Securities Trust Investors Trust Preferred Income Preferred Income II Preferred Income III Premium Dividend Tax-Advantaged Dividend Income Tax-Advantaged Global Shareholder Yield |
"As an investment firm,
upholding the proud
tradition of John Hancock
comes down to one thing:
putting shareholders
first. We believe that if
our shareholders are
successful, then we will
be successful."
Andrew G. Arnott
President and Chief Executive Officer
John Hancock Investments
John Hancock Multifactor ETF shares are bought and sold at market
price (not NAV), and are not individually redeemed
from the fund. Brokerage commissions will reduce returns.
John Hancock ETFs are distributed by Foreside Fund Services, LLC, and
are subadvised by Dimensional Fund Advisors LP.
Foreside is not affiliated with John Hancock Funds, LLC or
Dimensional Fund Advisors LP.
Dimensional Fund Advisors LP receives compensation from John Hancock
in connection with licensing rights to the
John Hancock Dimensional indexes. Dimensional Fund Advisors LP does
not sponsor, endorse, or sell, and makes no
representation as to the advisability of investing in, John Hancock
Multifactor ETFs.
John Hancock Investments
A trusted brand
John Hancock Investments is a premier asset manager representing
one of America's most trusted brands, with a heritage of financial
stewardship dating back to 1862. Helping our shareholders pursue
their financial goals is at the core of everything we do. It's why we
support the role of professional financial advice and operate with the
highest standards of conduct and integrity.
A better way to invest
We build funds based on investor needs, then search the world to find
proven portfolio teams with specialized expertise in those strategies.
As a manager of managers, we apply vigorous oversight to ensure that
they continue to meet our uncompromising standards and serve the
best interests of our shareholders.
Results for investors
Our unique approach to asset management enables us to provide
a diverse set of investments backed by some of the world's best
managers, along with strong risk-adjusted returns across asset classes.
|
|
John Hancock Funds, LLC n Member FINRA, SIPC 601 Congress Street n Boston, MA 02210-2805 800-225-5291 n jhinvestments.com |
|
| This report is for the information of the shareholders of John Hancock Fundamental All Cap Core Fund. It is not authorized for distribution to prospective investors unless preceded or accompanied by a prospectus. | ||
| MF274534 | 376SA 1/16 3/16 |
|
John Hancock
Fundamental Large Cap Core Fund
Semiannual report 1/31/16
A message to shareholders
Dear shareholder,
The six-month period has been a challenging time for all investors. Oil prices, having already dropped precipitously, continued to slide in the back half of 2015, and by January oil frequently traded at multi-year lows. Concerns about slowing global growth added to negative investor psychology, and stock prices fell steeply around the world. Stocks were not the only investment that faced headwinds; all risk assets struggled over the past six months and these types of declines are unsettling.
Although volatility returned in force to the markets, much of the global economic picture continues to move in the right direction. In December, the U.S. Federal Reserve raised short-term interest rates for the first time in nine years on the evidence that the persistent strength in the labor markets warranted a somewhat less accommodative stance. Central banks outside of the United States continue to signal that they would take action to support economies and markets.
At John Hancock Investments, portfolio risk management is a critical part of our role as an asset manager, and our dedicated risk team is focused on these issues every day. We continually strive for new ways to analyze potential risks and have liquidity tools in place, such as a credit facility and an interfund lending program. In times like these, your best resource is your financial advisor, who can ensure your portfolio is sufficiently diversified to meet your long-term objectives and to withstand the inevitable bumps along the way.
On behalf of everyone at John Hancock Investments, I'd like to take this opportunity to thank you for the continued trust you've placed in us.
Sincerely,
Andrew G. Arnott
President and Chief Executive Officer
John Hancock Investments
This commentary reflects the CEO's views as of January 31, 2016. They are subject to change at any time. All investments entail risks, including the possible loss of principal. For more up-to-date information, you can visit our website at jhinvestments.com.
John Hancock
Fundamental Large Cap Core Fund
INVESTMENT OBJECTIVE
The fund seeks long-term capital appreciation.
AVERAGE ANNUAL TOTAL RETURNS AS OF 1/31/16 (%)
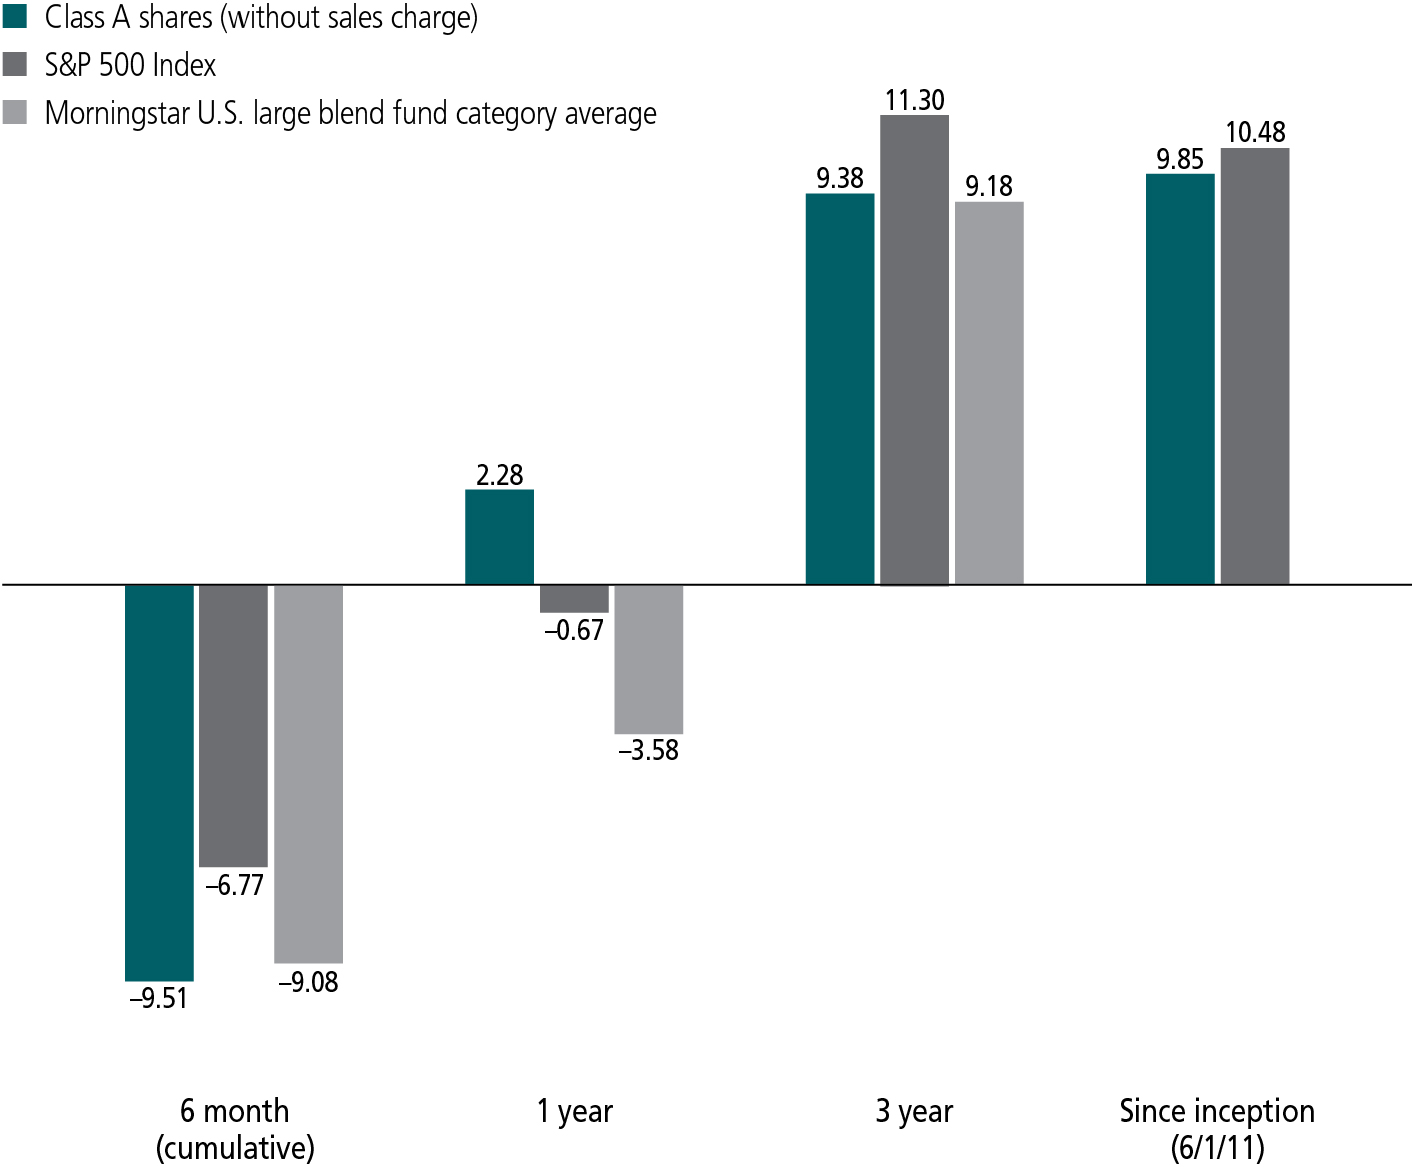
The S&P 500 Index is an unmanaged index that includes 500 widely traded common stocks.
It is not possible to invest directly in an index. Index figures do not reflect expenses or sales charges, which would result in lower returns.
Figures from Morningstar, Inc. include reinvested distributions and do not take into account sales charges. Actual load-adjusted performance is lower. Since-inception returns for the Morningstar fund category average are not available.
The past performance shown here reflects reinvested distributions and the beneficial effect of any expense reductions, and does not guarantee future results. Returns for periods shorter than one year are cumulative. Performance of the other share classes will vary based on the difference in the fees and expenses of those classes. Shares will fluctuate in value and, when redeemed, may be worth more or less than their original cost. Current month-end performance may be lower or higher than the performance cited, and can be found at jhinvestments.com or by calling 800-225-5291. For further information on the fund's objectives, risks, and strategy, see the fund's prospectus.
PERFORMANCE HIGHLIGHTS OVER THE LAST SIX MONTHS
U.S. stocks gave up ground
U.S. stocks were pressured by sliding energy prices, concern over slowing economic growth in China, a strong U.S. dollar, and uncertainty around U.S. interest rates.
Materials, energy, financials, and healthcare were the weakest performers
Within the broad-based S&P 500 Index, materials and energy stocks posted the biggest declines, followed closely by financials and healthcare.
Security selection detracted from relative performance
Stock picks in the financials sector accounted for a significant portion of the fund's underperformance versus its benchmark, the S&P 500 Index.
SECTOR COMPOSITION AS OF 1/31/16 (%)
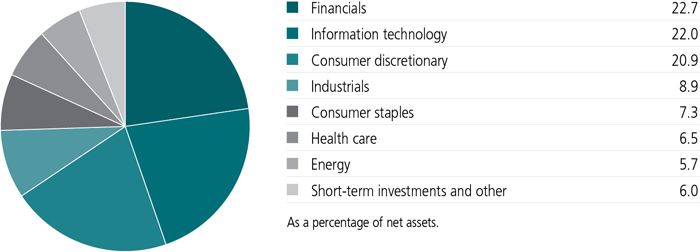
A note about risks
A fund concentrated in one sector or that holds a limited number of securities may fluctuate more than a fund that invests in a wider variety of sectors. Stock prices can be volatile and are affected by both general economic conditions and the financial prospects of individual companies. Large company stocks could fall out of favor. The value of a company's equity securities is subject to changes in the company's financial condition and overall market and economic conditions. Because the fund may focus on particular sectors of the economy, its performance may depend on the performance of those sectors, and investments focused in one sector may fluctuate more widely than investments diversified across sectors. Foreign investing has additional risks, such as currency and market volatility and political and social instability. Hedging, derivatives, and other strategic transactions may increase a fund's volatility and could produce disproportionate losses, potentially more than the fund's principal investment. Please see the fund's prospectus for additional risks.
An interview with Portfolio Manager Emory W. (Sandy) Sanders, Jr., CFA, John Hancock Asset Management a division of Manulife Asset Management (US) LLC
Emory W. (Sandy) Sanders, Jr., CFA
Portfolio Manager
John Hancock Asset Management
How would you describe the market backdrop for the six months ended January 31, 2016?
It was volatile. The market sank early in the period amid worries over China's slowing economic growth, declining commodity prices, and uncertainty around U.S. interest rates. Stocks, however, rebounded in October as fears around China eased and the U.S. Federal Reserve (Fed) postponed an interest-rate hike. But volatility mounted heading into year end, with China's issues moving to the forefront again, commodity prices sliding further, and the junk bond market moving sharply lower. These concerns overshadowed a brief stock market rally following the Fed's mid-December decision to hike interest rates for the first time since 2006. The market retreated even further in January, as oil prices collapsed to their lowest level in over a decade, global economic growth slowed, and the U.S. economic recovery was uneven.
Which sectors were hardest hit?
Within the fund's benchmark, the S&P 500 Index, materials and energy stocks fell the most due to their exposure to weak commodity prices. The financials sector also turned in a sizable loss, hurt in part by the prospect of lower-for-longer interest rates, weak energy prices, and declines in the junk bond and equity markets. In addition, healthcare stocks took a beating, as politicians began discussing the possibility of capping drug prices. Only the more defensive telecommunication services, utilities, and consumer staples sectors posted gains.
What was your approach to investing in this environment?
Regardless of market conditions, we try to steer a steady course that focuses on financially sound large-cap companies with competitive advantages and the ability to generate substantial cash flow over sustained periods. We look for opportunities to buy these types of higher-quality stocks when they're selling at a discount to our estimate of intrinsic value, which often occurs when fundamentals—such as sales growth and profit margins—are temporarily depressed or investor sentiment is weak.
What caused the fund to lag its benchmark this period?
Security selection was the biggest detractor, particularly in the financials sector. Among the biggest disappointments was Citigroup, Inc., a diversified bank with significant international exposure. Its stock slid as investors worried about the impact that slowing global growth and declining oil prices would have on its business. In fact, the company's exposure was limited, with its latest quarterly report showing mid-single-digit loan growth and improved credit metrics. Citigroup was one of the fund's largest holdings and a sizable overweight at period end because we thought the reality was a lot better than current investor sentiment was suggesting.
Bank of America Corp., another top position, also saw its stock unduly pressured by slowing global economic growth. In addition, continued low interest rates hampered the company's net interest margins, the difference between what it earns on loans and what it pays out on deposits. We thought the stock looked undervalued and believed the bank's recent cost-cutting initiatives could aid future earnings growth. An overweight in diversified financial company Morgan Stanley fell due to continued low interest rates and a slump in bond and commodity trading activity. Bank of America and Morgan Stanley both reported strong fourth-quarter earnings in January, but investors continued to punish the stocks.
TOP 10 HOLDINGS AS OF 1/31/16 (%)
| Amazon.com, Inc. | 4.8 |
| Apple, Inc. | 4.8 |
| Facebook, Inc., Class A | 4.5 |
| JPMorgan Chase & Co. | 4.2 |
| Bank of America Corp. | 3.9 |
| Citigroup, Inc. | 3.5 |
| Ralph Lauren Corp. | 3.2 |
| American International Group, Inc. | 2.9 |
| Lennar Corp., Class A | 2.8 |
| Alphabet, Inc., Class A | 2.6 |
| TOTAL | 37.2 |
| As a percentage of net assets. | |
| Cash and cash equivalents are not included. | |
Where were other disappointments?
Several individual detractors came from the consumer discretionary sector. Disappointments included used car retailer CarMax, Inc., home builder Lennar Corp., and premium mattress company Tempur Sealy International, Inc. Concern over the strength of the U.S. consumer triggered investor selling late in the period, hurting all three stocks. In addition, CarMax saw slowing sales growth because it did not have an adequate inventory of sport-utility vehicles and trucks as low gas prices boosted demand. Lennar faced headwinds from being more economically sensitive than some of its peers, while Tempur Sealy's stock was depressed by investors' year-end profit taking. Elsewhere, a small position in natural gas exploration and production company Southwestern Energy Company proved costly, as the combination of declining energy prices and the company's debt burden caused investors to sell the stock.
Where did the fund gain ground?
Having a sizable underweight in healthcare, where many stocks seemed to us to be overvalued, helped, as did security selection in consumer discretionary, where individual standouts included e-commerce leader Amazon.com, Inc., home builder NVR, Inc., and Germany-based sports apparel company Adidas AG. The fund had a huge overweight (on average about 5% of its assets) in Amazon, which saw its shares lifted by increased financial disclosure that revealed fast growth in the company's cloud services division and continued dominance in the online retail space. NVR benefited from the U.S. housing market's continued recovery, especially in the mid-Atlantic region where the company operates. Adidas's shares gained from signs of progress in the company's turnaround, a share buyback, and a new CEO appointment. Adidas and NVR were out-of-index positions.
Additionally, some of the most notable gains were from information technology. An investment in social network service Facebook, Inc. rallied nicely, as advertising on mobile devices drove better-than-expected earnings and revenue growth. Shares of Alphabet, Inc., the recently formed parent of online search engine Google, gained as enhanced financial disclosure revealed results at Google that exceeded investor expectations. News that Alphabet would buy back $5 billion in shares also helped. Facebook and Alphabet were sizable overweights and top holdings and, along with Amazon, some of the best-performing stocks in the index over the past six months.
How was the fund positioned at period end?
As always, we remained focused on higher-quality companies with the potential for sustainable cash flow growth and attractive valuations. We maintained the fund's economically sensitive bias with sizable overweights in financials, where we think many companies stand to benefit from higher interest rates, and consumer discretionary, where we've targeted companies with exposure to the U.S. housing recovery.
MANAGED BY
| |
Emory W. (Sandy) Sanders, Jr., CFA On the fund since 2011 Investing since 1997 |
| |
Walter T. McCormick, CFA On the fund since 2011 Investing since 1970 |
| |
Jonathan White, CFA On the fund since 2015 Investing since 1997 |
![]()
TOTAL RETURNS FOR THE PERIOD ENDED JANUARY 31, 2016
| Average annual total returns (%) with maximum sales charge |
Cumulative total returns (%) with maximum sales charge |
||||
| 1-year | Since inception1 |
6-month | Since inception1 |
||
| Class A | -2.83 | 8.65 | -14.03 | 47.34 | |
| Class I2 | 2.64 | 10.29 | -9.33 | 58.02 | |
| Index† | -0.67 | 10.48 | -6.77 | 59.32 | |
Performance figures assume all distributions have been reinvested. Figures reflect maximum sales charges on Class A shares of 5.00%. Sales charges are not applicable to Class I shares.
The expense ratios of the fund, both net (including any fee waivers and/or expense limitations) and gross (excluding any fee waivers and/or expense limitations), are set forth according to the most recent publicly available prospectuses for the fund and may differ from those disclosed in the Financial highlights tables in this report. Had the fee waivers and expense limitations not been in place, gross expenses would apply. The expense ratios are as follows:
| Class A | Class I | |
| Gross (%) | 1.45 | 1.14 |
| Net (%) | 1.30 | 0.94 |
Please refer to the most recent prospectus and annual or semiannual report for more information on expenses and any expense limitation arrangements for each class.
The returns reflect past results and should not be considered indicative of future performance. The return and principal value of an investment will fluctuate so that shares, when redeemed, may be worth more or less than their original cost. Due to market volatility and other factors, the fund's current performance may be higher or lower than the performance shown. For current to the most recent month-end performance data, please call 800-225-5291 or visit the fund's website at jhinvestments.com.
The performance table above and the chart on the next page do not reflect the deduction of taxes that a shareholder would pay on fund distributions or the redemption of fund shares. The fund's performance results reflect any applicable fee waivers or expense reductions, without which the expenses would increase and results would have been less favorable.
| † | Index is the S&P 500 Index. |
See the following page for footnotes.
This chart and table show what happened to a hypothetical $10,000 investment in John Hancock Fundamental Large Cap Core Fund for the share classes and periods indicated, assuming all distributions were reinvested. For comparison, we've shown the same investment in the S&P 500 Index.
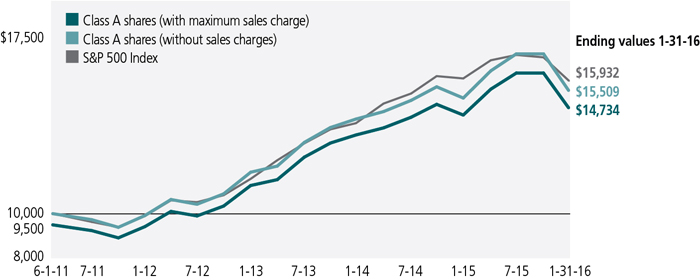
| Start date | With maximum sales charge ($) |
Without sales charge ($) |
Index ($) | |
| Class I2 | 6-1-11 | 15,802 | 15,802 | 15,932 |
The S&P 500 Index is an unmanaged index that includes 500 widely traded common stocks.
It is not possible to invest directly in an index. Index figures do not reflect expenses or sales charges, which would result in lower returns.
Footnotes related to performance pages
| 1 | From 6-1-11. |
| 2 | For certain types of investors as described in the fund's prospectus. |
These examples are intended to help you understand your ongoing operating expenses of investing in the fund so you can compare these costs with the ongoing costs of investing in other mutual funds.
Understanding fund expenses
As a shareholder of the fund, you incur two types of costs:
| • | Transaction costs, which include sales charges (loads) on purchases or redemptions (varies by share class), minimum account fee charge, etc. |
| • | Ongoing operating expenses, including management fees, distribution and service fees (if applicable), and other fund expenses. |
We are presenting only your ongoing operating expenses here.
Actual expenses/actual returns
This example is intended to provide information about the fund's actual ongoing operating expenses, and is based on the fund's actual return. It assumes an account value of $1,000.00 on August 1, 2015, with the same investment held until January 31, 2016.
| Account value on 8-1-2015 |
Ending value on 1-31-2016 |
Expenses paid during period ended 1-31-20161 |
Annualized expense ratio |
|
| Class A | $1,000.00 | $904.90 | $6.22 | 1.30% |
| Class I | 1,000.00 | 906.70 | 4.51 | 0.94% |
Together with the value of your account, you may use this information to estimate the operating expenses that you paid over the period. Simply divide your account value at January 31, 2016, by $1,000.00, then multiply it by the "expenses paid" for your share class from the table above. For example, for an account value of $8,600.00, the operating expenses should be calculated as follows:
Hypothetical example for comparison purposes
This table allows you to compare the fund's ongoing operating expenses with those of any other fund. It provides an example of the fund's hypothetical account values and hypothetical expenses based on each class's actual expense ratio and an assumed 5% annualized return before expenses (which is not the fund's actual return). It assumes an account value of $1,000.00 on August 1, 2015, with the same investment held until January 31, 2016. Look in any other fund shareholder report to find its hypothetical example and you will be able to compare these expenses. Please remember that these hypothetical account values and expenses may not be used to estimate the actual ending account balance or expenses you paid for the period.
| Account value on 8-1-2015 |
Ending value on 1-31-2016 |
Expenses paid during period ended 1-31-20161 |
Annualized expense ratio |
|
| Class A | $1,000.00 | $1,018.60 | $6.60 | 1.30% |
| Class I | 1,000.00 | 1,020.40 | 4.77 | 0.94% |
Remember, these examples do not include any transaction costs, therefore, these examples will not help you to determine the relative total costs of owning different funds. If transaction costs were included, your expenses would have been higher. See the prospectus for details regarding transaction costs.
| 1 | Expenses are equal to the fund's annualized expense ratio, multiplied by the average account value over the period, multiplied by 184/366 (to reflect the one-half year period). |
Fund's investments
| As of 1-31-16 (unaudited) | ||||||||||||||
| Shares | Value | |||||||||||||
| Common stocks 94.0% | $52,041,336 | |||||||||||||
| (Cost $47,686,740) | ||||||||||||||
| Consumer discretionary 20.9% | 11,580,195 | |||||||||||||
| Household durables 7.4% | ||||||||||||||
| Lennar Corp., Class A | 37,315 | 1,572,827 | ||||||||||||
| NVR, Inc. (I) | 810 | 1,337,310 | ||||||||||||
| Tempur Sealy International, Inc. (I) | 20,185 | 1,217,963 | ||||||||||||
| Internet and catalog retail 4.8% | ||||||||||||||
| Amazon.com, Inc. (I) | 4,523 | 2,655,001 | ||||||||||||
| Specialty retail 4.0% | ||||||||||||||
| CarMax, Inc. (I) | 23,007 | 1,016,449 | ||||||||||||
| Lowe's Companies, Inc. | 16,510 | 1,183,107 | ||||||||||||
| Textiles, apparel and luxury goods 4.7% | ||||||||||||||
| adidas AG | 7,838 | 807,100 | ||||||||||||
| Ralph Lauren Corp. | 15,915 | 1,790,438 | ||||||||||||
| Consumer staples 7.3% | 4,021,623 | |||||||||||||
| Beverages 2.9% | ||||||||||||||
| Diageo PLC, ADR | 6,003 | 646,343 | ||||||||||||
| PepsiCo, Inc. | 9,481 | 941,463 | ||||||||||||
| Food products 2.7% | ||||||||||||||
| Danone SA | 13,705 | 943,937 | ||||||||||||
| Mead Johnson Nutrition Company | 7,652 | 554,693 | ||||||||||||
| Household products 1.7% | ||||||||||||||
| The Procter & Gamble Company | 11,448 | 935,187 | ||||||||||||
| Energy 5.7% | 3,157,116 | |||||||||||||
| Energy equipment and services 2.2% | ||||||||||||||
| Schlumberger, Ltd. | 16,655 | 1,203,657 | ||||||||||||
| Oil, gas and consumable fuels 3.5% | ||||||||||||||
| Apache Corp. | 8,892 | 378,266 | ||||||||||||
| Chevron Corp. | 4,294 | 371,302 | ||||||||||||
| Exxon Mobil Corp. | 5,485 | 427,007 | ||||||||||||
| Occidental Petroleum Corp. | 11,287 | 776,884 | ||||||||||||
| Financials 22.7% | 12,578,041 | |||||||||||||
| Banks 12.6% | ||||||||||||||
| Bank of America Corp. | 153,512 | 2,170,657 | ||||||||||||
| Citigroup, Inc. | 45,531 | 1,938,710 | ||||||||||||
| JPMorgan Chase & Co. | 38,775 | 2,307,113 | ||||||||||||
| Wells Fargo & Company | 10,693 | 537,109 | ||||||||||||
| Shares | Value | |||||||||||||
| Financials (continued) | ||||||||||||||
| Capital markets 5.6% | ||||||||||||||
| BlackRock, Inc. | 1,835 | $576,667 | ||||||||||||
| Morgan Stanley | 27,053 | 700,132 | ||||||||||||
| T. Rowe Price Group, Inc. | 7,001 | 496,721 | ||||||||||||
| The Goldman Sachs Group, Inc. | 8,367 | 1,351,773 | ||||||||||||
| Consumer finance 0.9% | ||||||||||||||
| American Express Company | 9,876 | 528,366 | ||||||||||||
| Insurance 3.6% | ||||||||||||||
| American International Group, Inc. | 28,511 | 1,610,301 | ||||||||||||
| Prudential Financial, Inc. | 5,144 | 360,492 | ||||||||||||
| Health care 6.5% | 3,576,493 | |||||||||||||
| Biotechnology 2.0% | ||||||||||||||
| Amgen, Inc. | 7,034 | 1,074,303 | ||||||||||||
| Health care equipment and supplies 1.6% | ||||||||||||||
| Medtronic PLC | 11,757 | 892,591 | ||||||||||||
| Pharmaceuticals 2.9% | ||||||||||||||
| Merck & Company, Inc. | 16,934 | 858,046 | ||||||||||||
| Novartis AG, ADR | 9,639 | 751,553 | ||||||||||||
| Industrials 8.9% | 4,949,330 | |||||||||||||
| Aerospace and defense 1.4% | ||||||||||||||
| United Technologies Corp. | 9,009 | 789,999 | ||||||||||||
| Air freight and logistics 1.2% | ||||||||||||||
| United Parcel Service, Inc., Class B | 7,112 | 662,838 | ||||||||||||
| Industrial conglomerates 3.2% | ||||||||||||||
| Danaher Corp. | 9,182 | 795,620 | ||||||||||||
| General Electric Company | 33,411 | 972,260 | ||||||||||||
| Machinery 0.8% | ||||||||||||||
| Caterpillar, Inc. | 7,473 | 465,120 | ||||||||||||
| Professional services 1.6% | ||||||||||||||
| IHS, Inc., Class A (I) | 8,331 | 871,589 | ||||||||||||
| Trading companies and distributors 0.7% | ||||||||||||||
| United Rentals, Inc. (I) | 8,180 | 391,904 | ||||||||||||
| Information technology 22.0% | 12,178,538 | |||||||||||||
| Communications equipment 2.9% | ||||||||||||||
| Cisco Systems, Inc. | 39,969 | 950,863 | ||||||||||||
| QUALCOMM, Inc. | 15,118 | 685,450 | ||||||||||||
| Internet software and services 12.5% | ||||||||||||||
| Alibaba Group Holding, Ltd., ADR (I) | 10,858 | 727,812 | ||||||||||||
| Alphabet, Inc., Class A (I) | 1,906 | 1,451,133 | ||||||||||||
| Alphabet, Inc., Class C (I) | 1,763 | 1,309,821 | ||||||||||||
| Shares | Value | |||||||||||||
| Information technology (continued) | ||||||||||||||
| Internet software and services (continued) | ||||||||||||||
| Facebook, Inc., Class A (I) | 22,273 | $2,499,253 | ||||||||||||
| LinkedIn Corp., Class A (I) | 4,613 | 912,959 | ||||||||||||
| IT services 1.0% | ||||||||||||||
| Visa, Inc., Class A | 7,473 | 556,664 | ||||||||||||
| Software 0.8% | ||||||||||||||
| Oracle Corp. | 11,886 | 431,581 | ||||||||||||
| Technology hardware, storage and peripherals 4.8% | ||||||||||||||
| Apple, Inc. | 27,255 | 2,653,002 | ||||||||||||
| Par value^ | Value | |||||||||||||
| Short-term investments 5.6% | $3,113,000 | |||||||||||||
| (Cost $3,113,000) | ||||||||||||||
| Repurchase agreement 5.6% | 3,113,000 | |||||||||||||
| Barclays Tri-Party Repurchase Agreement dated 1-29-16 at 0.330% to be repurchased at $3,113,086 on 2-1-16, collateralized by $2,628,300 U.S. Treasury Inflation Indexed Notes, 2.375% due 1-15-17 (valued at $3,175,446, including interest) | 3,113,000 | 3,113,000 | ||||||||||||
| Total investments (Cost $50,799,740)† 99.6% | $55,154,336 | |||||||||||||
| Other assets and liabilities, net 0.4% | $234,709 | |||||||||||||
| Total net assets 100.0% | $55,389,045 | |||||||||||||
| The percentage shown for each investment category is the total value of the category as a percentage of the net assets of the fund. | ||||||||||||||
| ^All par values are denominated in U.S. dollars unless otherwise indicated. | ||||||||||||||
| Key to Security Abbreviations and Legend | ||||||||||||||
| ADR | American Depositary Receipts | |||||||||||||
| (I) | Non-income producing security. | |||||||||||||
| † | At 1-31-16, the aggregate cost of investment securities for federal income tax purposes was $50,972,701. Net unrealized appreciation aggregated $4,181,635, of which $7,298,497 related to appreciated investment securities and $3,116,862 related to depreciated investment securities. | |||||||||||||
Financial statements
STATEMENT OF ASSETS AND LIABILITIES 1-31-16 (unaudited)
| Assets | ||||||||||||||||||||||||||||||
| Investments, at value (Cost $50,799,740) | $55,154,336 | |||||||||||||||||||||||||||||
| Cash | 225,840 | |||||||||||||||||||||||||||||
| Receivable for fund shares sold | 9,097 | |||||||||||||||||||||||||||||
| Dividends and interest receivable | 49,782 | |||||||||||||||||||||||||||||
| Receivable due from advisor | 6,084 | |||||||||||||||||||||||||||||
| Other receivables and prepaid expenses | 912 | |||||||||||||||||||||||||||||
| Total assets | 55,446,051 | |||||||||||||||||||||||||||||
| Liabilities | ||||||||||||||||||||||||||||||
| Payable for fund shares repurchased | 17,135 | |||||||||||||||||||||||||||||
| Payable to affiliates | ||||||||||||||||||||||||||||||
| Accounting and legal services fees | 1,404 | |||||||||||||||||||||||||||||
| Transfer agent fees | 10,332 | |||||||||||||||||||||||||||||
| Other liabilities and accrued expenses | 28,135 | |||||||||||||||||||||||||||||
| Total liabilities | 57,006 | |||||||||||||||||||||||||||||
| Net assets | $55,389,045 | |||||||||||||||||||||||||||||
| Net assets consist of | ||||||||||||||||||||||||||||||
| Paid-in capital | $51,756,848 | |||||||||||||||||||||||||||||
| Accumulated distributions in excess of net investment income | (113,009 | ) | ||||||||||||||||||||||||||||
| Accumulated net realized gain (loss) on investments and foreign currency transactions | (609,337 | ) | ||||||||||||||||||||||||||||
| Net unrealized appreciation (depreciation) on investments and translation of assets and liabilities in foreign currencies | 4,354,543 | |||||||||||||||||||||||||||||
| Net assets | $55,389,045 | |||||||||||||||||||||||||||||
| Net asset value per share | ||||||||||||||||||||||||||||||
| Based on net asset values and shares outstanding-the fund has an unlimited number of shares authorized with no par value | ||||||||||||||||||||||||||||||
| Class A ($7,881,796 ÷ 568,149 shares)1 | $13.87 | |||||||||||||||||||||||||||||
| Class I ($47,507,249 ÷ 3,414,621 shares) | $13.91 | |||||||||||||||||||||||||||||
| Maximum offering price per share | ||||||||||||||||||||||||||||||
| Class A (net asset value per share ÷ 95%)2 | $14.60 | |||||||||||||||||||||||||||||
| 1 | Redemption price per share is equal to net asset value less any applicable contingent deferred sales charge. | ||||||||||||||||
| 2 | On single retail sales of less than $50,000. On sales of $50,000 or more and on group sales the offering price is reduced. | ||||||||||||||||
STATEMENT OF OPERATIONS For the six months ended 1-31-16 (unaudited)
| Investment income | ||||||||||||||||||||||||
| Dividends | $415,686 | |||||||||||||||||||||||
| Interest | 1,073 | |||||||||||||||||||||||
| Total investment income | 416,759 | |||||||||||||||||||||||
| Expenses | ||||||||||||||||||||||||
| Investment management fees | 210,183 | |||||||||||||||||||||||
| Distribution and service fees | 12,736 | |||||||||||||||||||||||
| Accounting and legal services fees | 4,019 | |||||||||||||||||||||||
| Transfer agent fees | 32,354 | |||||||||||||||||||||||
| Trustees' fees | 742 | |||||||||||||||||||||||
| State registration fees | 35,027 | |||||||||||||||||||||||
| Printing and postage | 22,514 | |||||||||||||||||||||||
| Professional fees | 116,687 | |||||||||||||||||||||||
| Custodian fees | 4,475 | |||||||||||||||||||||||
| Registration and filing fees | 9,405 | |||||||||||||||||||||||
| Other | 4,684 | |||||||||||||||||||||||
| Total expenses | 452,826 | |||||||||||||||||||||||
| Less expense reductions | (165,006 | ) | ||||||||||||||||||||||
| Net expenses | 287,820 | |||||||||||||||||||||||
| Net investment income | 128,939 | |||||||||||||||||||||||
| Realized and unrealized gain (loss) | ||||||||||||||||||||||||
| Net realized gain (loss) on | ||||||||||||||||||||||||
| Investments and foreign currency transactions | (174,480 | ) | ||||||||||||||||||||||
| (174,480 | ) | |||||||||||||||||||||||
| Change in net unrealized appreciation (depreciation) of | ||||||||||||||||||||||||
| Investments and translation of assets and liabilities in foreign currencies | (5,370,185 | ) | ||||||||||||||||||||||
| (5,370,185 | ) | |||||||||||||||||||||||
| Net realized and unrealized loss | (5,544,665 | ) | ||||||||||||||||||||||
| Decrease in net assets from operations | ($5,415,726 | ) | ||||||||||||||||||||||
STATEMENTS OF CHANGES IN NET ASSETS
| Six months ended 1-31-16 | Year ended 7-31-15 | ||||||||||||||||||||||||||||||||||||||||||||
| (unaudited) | |||||||||||||||||||||||||||||||||||||||||||||
| Increase (decrease) in net assets | |||||||||||||||||||||||||||||||||||||||||||||
| From operations | |||||||||||||||||||||||||||||||||||||||||||||
| Net investment income | $128,939 | $220,333 | |||||||||||||||||||||||||||||||||||||||||||
| Net realized gain (loss) | (174,480 | ) | 2,418,574 | ||||||||||||||||||||||||||||||||||||||||||
| Change in net unrealized appreciation (depreciation) | (5,370,185 | ) | 4,210,126 | ||||||||||||||||||||||||||||||||||||||||||
| Increase (decrease) in net assets resulting from operations | (5,415,726 | ) | 6,849,033 | ||||||||||||||||||||||||||||||||||||||||||
| Distributions to shareholders | |||||||||||||||||||||||||||||||||||||||||||||
| From net investment income | |||||||||||||||||||||||||||||||||||||||||||||
| Class A | (26,390 | ) | (6,695 | ) | |||||||||||||||||||||||||||||||||||||||||
| Class I | (319,620 | ) | (178,315 | ) | |||||||||||||||||||||||||||||||||||||||||
| From net realized gain | |||||||||||||||||||||||||||||||||||||||||||||
| Class A | (384,220 | ) | (192,002 | ) | |||||||||||||||||||||||||||||||||||||||||
| Class I | (2,108,816 | ) | (939,045 | ) | |||||||||||||||||||||||||||||||||||||||||
| Total distributions | (2,839,046 | ) | (1,316,057 | ) | |||||||||||||||||||||||||||||||||||||||||
| From fund share transactions | 4,301,399 | 13,080,923 | |||||||||||||||||||||||||||||||||||||||||||
| Total increase (decrease) | (3,953,373 | ) | 18,613,899 | ||||||||||||||||||||||||||||||||||||||||||
| Net assets | |||||||||||||||||||||||||||||||||||||||||||||
| Beginning of period | 59,342,418 | 40,728,519 | |||||||||||||||||||||||||||||||||||||||||||
| End of period | $55,389,045 | $59,342,418 | |||||||||||||||||||||||||||||||||||||||||||
| Undistributed (accumulated distributions in excess of) net investment income | ($113,009 | ) | $104,062 | ||||||||||||||||||||||||||||||||||||||||||
Financial highlights
| Class A Shares Period ended | 1-31-16 | 1 | 7-31-15 | 7-31-14 | 7-31-13 | 7-31-12 | 7-31-11 | 2 | ||||||||||||||||||||||||||||||||||||||||||||||||||||||||||||||||||||||||||||||||||||||||||||||||||||||||||||||
| Per share operating performance | ||||||||||||||||||||||||||||||||||||||||||||||||||||||||||||||||||||||||||||||||||||||||||||||||||||||||||||||||||||||
| Net asset value, beginning of period | $16.05 | $14.43 | $12.95 | $10.35 | $9.73 | $10.00 | ||||||||||||||||||||||||||||||||||||||||||||||||||||||||||||||||||||||||||||||||||||||||||||||||||||||||||||||||
| Net investment income3 | 0.01 | 0.02 | 0.03 | 0.06 | 0.04 | — | 4 | |||||||||||||||||||||||||||||||||||||||||||||||||||||||||||||||||||||||||||||||||||||||||||||||||||||||||||||||
| Net realized and unrealized gain (loss) on investments | (1.47 | ) | 1.95 | 1.80 | 2.67 | 0.64 | (0.27 | ) | ||||||||||||||||||||||||||||||||||||||||||||||||||||||||||||||||||||||||||||||||||||||||||||||||||||||||||||||
| Total from investment operations | (1.46 | ) | 1.97 | 1.83 | 2.73 | 0.68 | (0.27 | ) | ||||||||||||||||||||||||||||||||||||||||||||||||||||||||||||||||||||||||||||||||||||||||||||||||||||||||||||||
| Less distributions | ||||||||||||||||||||||||||||||||||||||||||||||||||||||||||||||||||||||||||||||||||||||||||||||||||||||||||||||||||||||
| From net investment income | (0.05 | ) | (0.01 | ) | (0.04 | ) | (0.02 | ) | (0.03 | ) | — | |||||||||||||||||||||||||||||||||||||||||||||||||||||||||||||||||||||||||||||||||||||||||||||||||||||||||||
| From net realized gain | (0.67 | ) | (0.34 | ) | (0.31 | ) | (0.11 | ) | (0.03 | ) | — | |||||||||||||||||||||||||||||||||||||||||||||||||||||||||||||||||||||||||||||||||||||||||||||||||||||||||||
| Total distributions | (0.72 | ) | (0.35 | ) | (0.35 | ) | (0.13 | ) | (0.06 | ) | — | |||||||||||||||||||||||||||||||||||||||||||||||||||||||||||||||||||||||||||||||||||||||||||||||||||||||||||
| Net asset value, end of period | $13.87 | $16.05 | $14.43 | $12.95 | $10.35 | $9.73 | ||||||||||||||||||||||||||||||||||||||||||||||||||||||||||||||||||||||||||||||||||||||||||||||||||||||||||||||||
| Total return (%)5,6 | (9.51 | ) 7 | 13.81 | 14.23 | 26.53 | 7.09 | (2.70 | ) 7 | ||||||||||||||||||||||||||||||||||||||||||||||||||||||||||||||||||||||||||||||||||||||||||||||||||||||||||||||
| Ratios and supplemental data | ||||||||||||||||||||||||||||||||||||||||||||||||||||||||||||||||||||||||||||||||||||||||||||||||||||||||||||||||||||||
| Net assets, end of period (in millions) | $8 | $8 | $7 | $5 | $3 | $2 | ||||||||||||||||||||||||||||||||||||||||||||||||||||||||||||||||||||||||||||||||||||||||||||||||||||||||||||||||
| Ratios (as a percentage of average net assets): | ||||||||||||||||||||||||||||||||||||||||||||||||||||||||||||||||||||||||||||||||||||||||||||||||||||||||||||||||||||||
| Expenses before reductions | 1.83 | 8 | 1.50 | 1.73 | 2.45 | 6.29 | 5.95 | 8 | ||||||||||||||||||||||||||||||||||||||||||||||||||||||||||||||||||||||||||||||||||||||||||||||||||||||||||||||
| Expenses including reductions | 1.30 | 8 | 1.30 | 1.30 | 1.30 | 1.30 | 1.30 | 8 | ||||||||||||||||||||||||||||||||||||||||||||||||||||||||||||||||||||||||||||||||||||||||||||||||||||||||||||||
| Net investment income (loss) | 0.13 | 8 | 0.14 | 0.22 | 0.56 | 0.46 | (0.12 | ) 8 | ||||||||||||||||||||||||||||||||||||||||||||||||||||||||||||||||||||||||||||||||||||||||||||||||||||||||||||||
| Portfolio turnover (%) | 9 | 27 | 23 | 31 | 40 | 4 | ||||||||||||||||||||||||||||||||||||||||||||||||||||||||||||||||||||||||||||||||||||||||||||||||||||||||||||||||
| 1 | Six months ended 1-31-16. Unaudited. | ||||||||||||||||||||||||||||||||||||||||||||||||||||||||||||||||||||||||||||||||||
| 2 | Period from 6-1-11 (commencement of operations) to 7-31-11. | ||||||||||||||||||||||||||||||||||||||||||||||||||||||||||||||||||||||||||||||||||
| 3 | Based on average daily shares outstanding. | ||||||||||||||||||||||||||||||||||||||||||||||||||||||||||||||||||||||||||||||||||
| 4 | Less than $0.005 per share. | ||||||||||||||||||||||||||||||||||||||||||||||||||||||||||||||||||||||||||||||||||
| 5 | Total returns would have been lower had certain expenses not been reduced during the applicable periods. | ||||||||||||||||||||||||||||||||||||||||||||||||||||||||||||||||||||||||||||||||||
| 6 | Does not reflect the effect of sales charges, if any. | ||||||||||||||||||||||||||||||||||||||||||||||||||||||||||||||||||||||||||||||||||
| 7 | Not annualized. | ||||||||||||||||||||||||||||||||||||||||||||||||||||||||||||||||||||||||||||||||||
| 8 | Annualized. | ||||||||||||||||||||||||||||||||||||||||||||||||||||||||||||||||||||||||||||||||||
| Class I Shares Period ended | 1-31-16 | 1 | 7-31-15 | 7-31-14 | 7-31-13 | 7-31-12 | 7-31-11 | 2 | ||||||||||||||||||||||||||||||||||||||||||||||||||||||||||||||||||||||||||||||||||||||||||||||||||||||||||||||
| Per share operating performance | ||||||||||||||||||||||||||||||||||||||||||||||||||||||||||||||||||||||||||||||||||||||||||||||||||||||||||||||||||||||
| Net asset value, beginning of period | $16.12 | $14.49 | $13.00 | $10.38 | $9.74 | $10.00 | ||||||||||||||||||||||||||||||||||||||||||||||||||||||||||||||||||||||||||||||||||||||||||||||||||||||||||||||||
| Net investment income3 | 0.04 | 0.07 | 0.08 | 0.11 | 0.09 | 0.01 | ||||||||||||||||||||||||||||||||||||||||||||||||||||||||||||||||||||||||||||||||||||||||||||||||||||||||||||||||
| Net realized and unrealized gain (loss) on investments | (1.48 | ) | 1.96 | 1.80 | 2.67 | 0.64 | (0.27 | ) | ||||||||||||||||||||||||||||||||||||||||||||||||||||||||||||||||||||||||||||||||||||||||||||||||||||||||||||||
| Total from investment operations | (1.44 | ) | 2.03 | 1.88 | 2.78 | 0.73 | (0.26 | ) | ||||||||||||||||||||||||||||||||||||||||||||||||||||||||||||||||||||||||||||||||||||||||||||||||||||||||||||||
| Less distributions | ||||||||||||||||||||||||||||||||||||||||||||||||||||||||||||||||||||||||||||||||||||||||||||||||||||||||||||||||||||||
| From net investment income | (0.10 | ) | (0.06 | ) | (0.08 | ) | (0.05 | ) | (0.06 | ) | — | |||||||||||||||||||||||||||||||||||||||||||||||||||||||||||||||||||||||||||||||||||||||||||||||||||||||||||
| From net realized gain | (0.67 | ) | (0.34 | ) | (0.31 | ) | (0.11 | ) | (0.03 | ) | — | |||||||||||||||||||||||||||||||||||||||||||||||||||||||||||||||||||||||||||||||||||||||||||||||||||||||||||
| Total distributions | (0.77 | ) | (0.40 | ) | (0.39 | ) | (0.16 | ) | (0.09 | ) | — | |||||||||||||||||||||||||||||||||||||||||||||||||||||||||||||||||||||||||||||||||||||||||||||||||||||||||||
| Net asset value, end of period | $13.91 | $16.12 | $14.49 | $13.00 | $10.38 | $9.74 | ||||||||||||||||||||||||||||||||||||||||||||||||||||||||||||||||||||||||||||||||||||||||||||||||||||||||||||||||
| Total return (%)4 | (9.33 | ) 5 | 14.21 | 14.62 | 27.07 | 7.58 | (2.60 | ) 5 | ||||||||||||||||||||||||||||||||||||||||||||||||||||||||||||||||||||||||||||||||||||||||||||||||||||||||||||||
| Ratios and supplemental data | ||||||||||||||||||||||||||||||||||||||||||||||||||||||||||||||||||||||||||||||||||||||||||||||||||||||||||||||||||||||
| Net assets, end of period (in millions) | $48 | $51 | $34 | $18 | $1 | $1 | ||||||||||||||||||||||||||||||||||||||||||||||||||||||||||||||||||||||||||||||||||||||||||||||||||||||||||||||||
| Ratios (as a percentage of average net assets): | ||||||||||||||||||||||||||||||||||||||||||||||||||||||||||||||||||||||||||||||||||||||||||||||||||||||||||||||||||||||
| Expenses before reductions | 1.52 | 6 | 1.13 | 1.22 | 1.80 | 7.53 | 5.61 | 6 | ||||||||||||||||||||||||||||||||||||||||||||||||||||||||||||||||||||||||||||||||||||||||||||||||||||||||||||||
| Expenses including reductions | 0.94 | 6 | 0.94 | 0.94 | 0.92 | 0.84 | 0.84 | 6 | ||||||||||||||||||||||||||||||||||||||||||||||||||||||||||||||||||||||||||||||||||||||||||||||||||||||||||||||
| Net investment income | 0.50 | 6 | 0.48 | 0.58 | 0.89 | 0.93 | 0.36 | 6 | ||||||||||||||||||||||||||||||||||||||||||||||||||||||||||||||||||||||||||||||||||||||||||||||||||||||||||||||
| Portfolio turnover (%) | 9 | 27 | 23 | 31 | 40 | 4 | ||||||||||||||||||||||||||||||||||||||||||||||||||||||||||||||||||||||||||||||||||||||||||||||||||||||||||||||||
| 1 | Six months ended 1-31-16. Unaudited. | ||||||||||||||||||||||||||||||||||||||||||||||||||||||||||||||||||||||||||||||||||
| 2 | Period from 6-1-11 (commencement of operations) to 7-31-11. | ||||||||||||||||||||||||||||||||||||||||||||||||||||||||||||||||||||||||||||||||||
| 3 | Based on average daily shares outstanding. | ||||||||||||||||||||||||||||||||||||||||||||||||||||||||||||||||||||||||||||||||||
| 4 | Total returns would have been lower had certain expenses not been reduced during the applicable periods. | ||||||||||||||||||||||||||||||||||||||||||||||||||||||||||||||||||||||||||||||||||
| 5 | Not annualized. | ||||||||||||||||||||||||||||||||||||||||||||||||||||||||||||||||||||||||||||||||||
| 6 | Annualized. | ||||||||||||||||||||||||||||||||||||||||||||||||||||||||||||||||||||||||||||||||||
Note 1 — Organization
John Hancock Fundamental Large Cap Core Fund (the fund) is a series of John Hancock Funds II (the Trust), an open-end management investment company organized as a Massachusetts business trust and registered under the Investment Company Act of 1940, as amended (the 1940 Act). The investment objective of the fund is to seek long-term capital appreciation.
The fund may offer multiple classes of shares. The shares currently offered are detailed in the Statement of assets and liabilities. Class A shares are offered to all investors. Class I shares are offered to institutions and certain investors. Shareholders of each class have exclusive voting rights to matters that affect that class. The distribution and service fees, if any, and transfer agent fees for each class may differ.
Effective after the close of business on October 23, 2015, the fund was closed to new investors.
Note 2 — Significant accounting policies
The financial statements have been prepared in conformity with accounting principles generally accepted in the United States of America (US GAAP), which require management to make certain estimates and assumptions as of the date of the financial statements. Actual results could differ from those estimates and those differences could be significant. The fund qualifies as an investment company under Topic 946 of Accounting Standards Codification of US GAAP.
Events or transactions occurring after the end of the fiscal period through the date that the financial statements were issued have been evaluated in the preparation of the financial statements. The following summarizes the significant accounting policies of the fund:
Security valuation. Investments are stated at value as of the close of regular trading on the New York Stock Exchange (NYSE), normally at 4:00 p.m., Eastern Time. In order to value the securities, the fund uses the following valuation techniques: Equity securities held by the fund are valued at the last sale price or official closing price on the exchange or principal market where the security was acquired or most likely will be sold. In the event there were no sales during the day or closing prices are not available, the securities are valued using the last available bid price. Foreign securities and currencies are valued in U.S. dollars, based on foreign currency exchange rates supplied by an independent pricing vendor. Securities that trade only in the over-the-counter (OTC) market are valued using bid prices. Other portfolio securities and assets, for which reliable market quotations are not readily available, are valued at fair value as determined in good faith by the fund's Pricing Committee following procedures established by the Board of Trustees. The frequency with which these fair valuation procedures are used cannot be predicted and fair value securities may differ significantly from the value that would have been used had a ready market for such securities existed.
The fund uses a three-tier hierarchy to prioritize the pricing assumptions, referred to as inputs, used in valuation techniques to measure fair value. Level 1 includes securities valued using quoted prices in active markets for identical securities. Level 2 includes securities valued using other significant observable inputs. Observable inputs may include quoted prices for similar securities, interest rates, prepayment speeds and credit risk. Prices for securities valued using these inputs are received from independent pricing vendors and brokers and are based on an evaluation of the inputs described. Level 3 includes securities valued using significant unobservable inputs when market prices are not readily available or reliable, including the fund's own assumptions in determining the fair value of investments. Factors used in determining value may include market or issuer specific events or trends, changes in interest rates and credit quality. The inputs or methodology used for valuing securities are not necessarily an indication of the risks associated with investing in those securities. Changes in valuation techniques and related inputs may result in transfers into or out of an assigned level within the disclosure hierarchy.
The following is a summary of the values by input classification of the fund's investments as of January 31, 2016, by major security category or type:
| Total value at 1-31-16 |
Level 1 quoted price |
Level 2 significant observable inputs |
Level 3 significant unobservable inputs |
||
| Common stocks | |||||
| Consumer discretionary | $11,580,195 | $10,773,095 | $807,100 | — | |
| Consumer staples | 4,021,623 | 3,077,686 | 943,937 | — | |
| Energy | 3,157,116 | 3,157,116 | — | — | |
| Financials | 12,578,041 | 12,578,041 | — | — | |
| Health care | 3,576,493 | 3,576,493 | — | — | |
| Industrials | 4,949,330 | 4,949,330 | — | — | |
| Information technology | 12,178,538 | 12,178,538 | — | — | |
| Short-term investments | 3,113,000 | — | 3,113,000 | — | |
| Total investments in securities | $55,154,336 | $50,290,299 | $4,864,037 | — | |
Repurchase agreements. The fund may enter into repurchase agreements. When the fund enters into a repurchase agreement, it receives collateral that is held in a segregated account by the fund's custodian, or for tri-party repurchase agreements, collateral is held at a third-party custodian bank in a segregated account for the benefit of the fund. The collateral amount is marked-to-market and monitored on a daily basis to ensure that the collateral held is in an amount not less than the principal amount of the repurchase agreement plus any accrued interest. Collateral received by the fund for repurchase agreements is disclosed in the Fund's investments as part of the caption related to the repurchase agreement.
Repurchase agreements are typically governed by the terms and conditions of the Master Repurchase Agreement and/or Global Master Repurchase Agreement (collectively, MRA). Upon an event of default, the non-defaulting party may close out all transactions traded under the MRA and net amounts owed. Absent an event of default, assets and liabilities resulting from repurchase agreements are not offset in the Statement of assets and liabilities. In the event of a default by the counterparty, realization of the collateral proceeds could be delayed, during which time the collateral value may decline or the counterparty may have insufficient assets to pay back claims resulting from close-out of the transactions.
Security transactions and related investment income. Investment security transactions are accounted for on a trade date plus one basis for daily net asset value calculations. However, for financial reporting purposes, investment transactions are reported on trade date. Interest income is accrued as earned. Dividend income is recorded on the ex-date, except for dividends of foreign securities where the dividend may not be known until after the ex-date. In those cases, dividend income, net of withholding taxes, is recorded when the fund becomes aware of the dividends. Gains and losses on securities sold are determined on the basis of identified cost and may include proceeds from litigation.
Foreign currency translation. Assets, including investments and liabilities denominated in foreign currencies, are translated into U.S. dollar values each day at the prevailing exchange rate. Purchases and sales of securities, income and expenses are translated into U.S. dollars at the prevailing exchange rate on the date of the transaction. The effect of changes in foreign currency exchange rates on the value of securities is reflected as a component of the realized and unrealized gains (losses) on investments.
Funds that invest internationally generally carry more risk than funds that invest strictly in U.S. securities. Risks can result from differences in economic and political conditions, regulations, market practices (including higher transaction costs), accounting standards and other factors. Foreign investments are also subject to a decline in the value of a foreign currency versus the U.S. dollar, which reduces the dollar value of securities denominated in that currency.
Line of credit. The fund may borrow from banks for temporary or emergency purposes, including meeting redemption requests that otherwise might require the untimely sale of securities. Pursuant to the fund's custodian agreement, the custodian may loan money to the fund to make properly authorized payments. The fund is obligated to repay the custodian
for any overdraft, including any related costs or expenses. The custodian may have a lien, security interest or security entitlement in any fund property that is not otherwise segregated or pledged, to the extent of any overdraft, and to the maximum extent permitted by law.
The fund and other affiliated funds have entered into a syndicated line of credit agreement, with Citibank, N.A. as the administrative agent, that enables them to participate in a $750 million unsecured committed line of credit. A commitment fee, payable at the end of each calendar quarter, based on the average daily unused portion of the effective line of credit, is charged to each participating fund on a pro rata basis and is reflected in Other expenses on the Statement of operations. Commitment fees for the six months ended January 31, 2016 were $743. For the six months ended January 31, 2016, the fund had no borrowings under the line of credit.
Expenses. Within the John Hancock group of funds complex, expenses that are directly attributable to an individual fund are allocated to such fund. Expenses that are not readily attributable to a specific fund are allocated among all funds in an equitable manner, taking into consideration, among other things, the nature and type of expense and the fund's relative net assets. Expense estimates are accrued in the period to which they relate and adjustments are made when actual amounts are known.
Class allocations. Income, common expenses and realized and unrealized gains (losses) are determined at the fund level and allocated daily to each class of shares based on the net assets of the class. Class-specific expenses, such as distribution and service fees, if any, and transfer agent fees, are calculated daily for each class, based on the net asset value of the class and the applicable specific expense rates.
Federal income taxes. The fund intends to continue to qualify as a regulated investment company by complying with the applicable provisions of the Internal Revenue Code and will not be subject to federal income tax on taxable income that is distributed to shareholders. Therefore, no federal income tax provision is required.
As of July 31, 2015, the fund had no uncertain tax positions that would require financial statement recognition, derecognition or disclosure. The fund's federal tax returns are subject to examination by the Internal Revenue Service for a period of three years.
Distribution of income and gains. Distributions to shareholders from net investment income and net realized gains, if any, are recorded on the ex-date. The fund generally declares and pays dividends and capital gain distributions, if any, annually.
Distributions paid by the fund with respect to each class of shares are calculated in the same manner, at the same time and in the same amount, except for the effect of class level expenses that may be applied differently to each class.
Such distributions, on a tax basis, are determined in conformity with income tax regulations, which may differ from US GAAP.
Capital accounts within the financial statements are adjusted for permanent book-tax differences. These adjustments have no impact on net assets or the results of operations. Temporary book-tax differences, if any, will reverse in a subsequent period. Book-tax differences are primarily attributable to wash sale loss deferrals.
Note 3 — Guarantees and indemnifications
Under the Trust's organizational documents, its Officers and Trustees are indemnified against certain liabilities arising out of the performance of their duties to the Trust, including the fund. Additionally, in the normal course of business, the fund enters into contracts with service providers that contain general indemnification clauses. The fund's maximum exposure under these arrangements is unknown, as this would involve future claims that may be made against the fund that have not yet occurred. The risk of material loss from such claims is considered remote.
Note 4 — Fees and transactions with affiliates
John Hancock Advisers, LLC (the Advisor) serves as investment advisor for the fund. John Hancock Funds, LLC (the Distributor), an affiliate of the Advisor, serves as principal underwriter of the fund. The Advisor and the Distributor are indirect, wholly owned subsidiaries of Manulife Financial Corporation (MFC).
Management fee. The fund has an investment management agreement with the Advisor under which the fund pays a daily management fee to the Advisor equivalent, on an annual basis, to the sum of: a) 0.725% of the first $500 million of the fund's average daily net assets; b) 0.700% of the next $500 million of the fund's average daily net assets; c) 0.675% of the next $500 million of the fund's average daily net assets; and d) 0.650% of the fund's average daily net assets in excess of $1.5 billion. The Advisor has a subadvisory agreement with John Hancock Asset Management a division of Manulife Asset Management (US) LLC, an indirectly owned subsidiary of MFC and an affiliate of the Advisor. The fund is not responsible for payment of the subadvisory fees.
The Advisor has contractually agreed to waive a portion of its management fee and/or reimburse expenses for certain funds of the John Hancock group of funds complex, including the fund (the participating portfolios). This waiver is based upon aggregate net assets of all the participating portfolios. The amount of the reimbursement is calculated daily and allocated among all the participating portfolios in proportion to the daily net assets of each fund. During the six months ended January 31, 2016, this waiver amounted to 0.01% of the fund's average net assets. This arrangement may be amended or terminated at any time by the Advisor upon notice to the fund and with the approval of the Board of Trustees.
The Advisor has contractually agreed to waive all or a portion of its management fee and reimburse or pay operating expenses of the fund to the extent necessary to maintain the fund's total operating expense at 1.30% and 0.94% for Class A and Class I shares respectively, excluding certain expenses such as taxes, brokerage commissions, interest expense, litigation and indemnification expenses and other extraordinary expenses not incurred in the ordinary course of the fund's business, underlying fund expenses, and short dividend expense. The current expense limitation agreement expires on November 30, 2016 for Class A and Class I shares, unless renewed by mutual agreement of the fund and the Advisor based upon determination that this is appropriate under the circumstances at the time.
The Advisor has voluntarily agreed to reduce a portion of its management fee or make payments to the fund if certain expenses of the fund exceed 0.20% of average net assets. Expenses excluded from this waiver include taxes, brokerage commissions, interest expense, litigation and indemnification expenses, and other extraordinary expenses not incurred in the ordinary course of the fund's business, advisory fees, Rule 12b-1 fees, transfer agent and service fees, short dividend expense, and acquired fund fees. This expense reduction will continue in effect until terminated at any time by the Advisor on notice of the fund.
The expense reductions described above amounted to $22,364 and $142,642 for Class A and Class I shares, respectively, for the six months ended January 31, 2016.
The investment management fees, including the impact of the waivers and reimbursements as described above, incurred for the six months ended January 31, 2016 were equivalent to a net annual effective rate of 0.16% of the fund's average daily net assets.
Accounting and legal services. Pursuant to a service agreement, the fund reimburses the Advisor for all expenses associated with providing the administrative, financial, legal, accounting and recordkeeping services to the fund, including the preparation of all tax returns, periodic reports to shareholders and regulatory reports, among other services. These expenses are allocated to each share class based on its relative net assets at the time the expense was incurred. These accounting and legal services fees incurred for the six months ended January 31, 2016 amounted to an annual rate of 0.01% of the fund's average daily net assets.
Distribution and service plans. The fund has a distribution agreement with the Distributor. The fund has adopted distribution and service plans with respect to Class A shares pursuant to Rule 12b-1 under the 1940 Act, to pay the Distributor for services provided as the distributor of shares of the fund. The fund may pay 0.30% for Class A shares for distribution and service fees under these arrangements, expressed as an annual percentage of average daily net assets for each class of the fund's shares.
Sales charges. Class A shares are assessed up-front sales charges, which resulted in payments to the Distributor amounting to $8,543 for the six months ended January 31, 2016. Of this amount, $1,446 was retained and used for printing prospectuses, advertising, sales literature and other purposes and $7,097 was paid as sales commissions to broker-dealers.
Class A shares may be subject to contingent deferred sales charges (CDSCs). Certain Class A shares that are acquired through purchases of $1 million or more and are redeemed within one year of purchase are subject to a 1.00% sales charge. CDSCs are applied to the lesser of the current market value at the time of redemption or the original purchase cost of the shares being redeemed. Proceeds from CDSCs are used to compensate the Distributor for providing distribution-related services in connection with the sale of these shares. During the six months ended January 31, 2016, there were no CDSCs received by the Distributor for Class A shares.
Transfer agent fees. The fund has a transfer agent agreement with John Hancock Signature Services, Inc. (Signature Services), an affiliate of the Advisor. The transfer agent fees paid to Signature Services are determined based on the cost to Signature Services (Signature Services Cost) of providing recordkeeping services. It also includes out-of-pocket expenses, including payments made to third-parties for recordkeeping services provided to their clients who invest in one or more John Hancock funds. In addition, Signature Services Cost may be reduced by certain fees that Signature Services receives in connection with retirement and small accounts. Signature Services Cost is calculated monthly and allocated, as applicable, to five categories of share classes: Retail Share and Institutional Share Classes of Non-Municipal Bond Funds, Class R6 Shares, Retirement Share Classes and Municipal Bond Share Classes. Within each of these categories, the applicable costs are allocated to the affected John Hancock affiliated funds and/or classes, based on the relative average daily net assets.
Class level expenses. Class level expenses for the six months ended January 31, 2016 were:
| Class | Distribution and service fees | Transfer agent fees |
| Class A | $12,736 | $5,222 |
| Class I | — | 27,132 |
| Total | $12,736 | $32,354 |
Trustee expenses. The fund compensates each Trustee who is not an employee of the Advisor or its affiliates. The costs of paying Trustee compensation and expenses are allocated to each fund based on its net assets relative to other funds within the John Hancock group of funds complex.
Note 5 — Fund share transactions
Transactions in fund shares for the six months ended January 31, 2016 and for the year ended July 31, 2015 were as follows:
| Six months ended 1-31-16 | Year ended 7-31-15 | |||||||||||||||||||||||||
| Shares | Amount | Shares | Amount | |||||||||||||||||||||||
| Class A shares | ||||||||||||||||||||||||||
| Sold | 136,901 | $2,120,571 | 278,791 | $4,222,703 | ||||||||||||||||||||||
| Distributions reinvested | 27,067 | 410,610 | 8,847 | 132,614 | ||||||||||||||||||||||
| Repurchased | (97,207 | ) | (1,459,591 | ) | (277,473 | ) | (4,213,719 | ) | ||||||||||||||||||
| Net increase | 66,761 | $1,071,590 | 10,165 | $141,598 | ||||||||||||||||||||||
| Class I shares | ||||||||||||||||||||||||||
| Sold | 546,203 | $8,085,976 | 1,314,366 | $19,848,958 | ||||||||||||||||||||||
| Distributions reinvested | 159,722 | 2,427,778 | 74,368 | 1,117,014 | ||||||||||||||||||||||
| Repurchased | (472,651 | ) | (7,283,945 | ) | (529,806 | ) | (8,026,647 | ) | ||||||||||||||||||
| Net increase | 233,274 | $3,229,809 | 858,928 | $12,939,325 | ||||||||||||||||||||||
| Total net increase | 300,035 | $4,301,399 | 869,093 | $13,080,923 | ||||||||||||||||||||||
Note 6 — Purchase and sale of securities
Purchases and sales of securities, other than short-term investments, amounted to $6,708,872 and $5,118,203, respectively, for the six months ended January 31, 2016.
Note 7 — Subsequent events
On February 5, 2016, the fund merged into John Hancock Large Cap Equity Fund (the Acquiring Fund). Based on the opinion of tax counsel, the reorganization qualified as a tax-free reorganization for federal income tax purposes with no gain or loss recognized by the Acquired Fund or its shareholders. Thus, the investments were transferred to the Acquiring Fund at the Acquired Fund's identified cost. All distributable amounts of net income and realized gains from the Acquired Fund were distributed prior to the reorganization. In addition, the expenses of the reorganization were borne by the Acquired Fund.
Effective March 1, 2016, John Hancock Large Cap Equity Fund's name changed to John Hancock Fundamental Large Cap Core Fund.
Special shareholder meeting
The fund held a Special Meeting of Shareholders on January 19, 2016. The following proposal was considered by the shareholders:
Proposal: To approve an Agreement and Plan of Reorganization between Fundamental Large Cap Core Fund and John Hancock Large Cap Equity Fund (the "Acquiring Fund"}}}}. Under this agreement, Fundamental Large Cap Core Fund would transfer all of its assets to the Acquiring Fund in exchange for corresponding shares of the Acquiring Fund. These shares would be distributed, as described in the accompanying proxy statement and prospectus, proportionately to you and the other shareholders of the Fundamental Large Cap Core Fund. The Acquiring Fund would also assume substantially all of Fundamental Large Cap Core Fund's liabilities.
| FOR | AGAINST | ABSTAIN |
| 1,696,727.6361 | 37,845.0163 | 221,250.1616 |
|
Trustees James M. Oates, Chairperson Officers Andrew G. Arnott John J. Danello Francis V. Knox, Jr. Charles A. Rizzo Salvatore Schiavone |
Investment advisor John Hancock Advisers, LLC Subadvisor John Hancock Asset Management a division of Manulife Asset Management (US) LLC Principal distributor John Hancock Funds, LLC Custodian State Street Bank and Trust Company Transfer agent John Hancock Signature Services, Inc. Legal counsel K&L Gates LLP |
*Member of the Audit Committee
†Non-Independent Trustee
The fund's proxy voting policies and procedures, as well as the fund proxy voting record for the most recent twelve-month period ended June 30, are available free of charge on the Securities and Exchange Commission (SEC) website at sec.gov or on our website.
The fund's complete list of portfolio holdings, for the first and third fiscal quarters, is filed with the SEC on Form N-Q. The fund's Form N-Q is available on our website and the SEC's website, sec.gov, and can be reviewed and copied (for a fee) at the SEC's Public Reference Room in Washington, DC. Call 800-SEC-0330 to receive information on the operation of the SEC's Public Reference Room.
We make this information on your fund, as well as monthly portfolio holdings, and other fund details available on our website at jhinvestments.com or by calling 800-225-5291.
| You can also contact us: | |||
| 800-225-5291 jhinvestments.com |
Regular mail: John Hancock Signature Services, Inc. |
Express mail: John Hancock Signature Services, Inc. |
|
John Hancock family of funds
|
DOMESTIC EQUITY FUNDS Balanced Blue Chip Growth Classic Value Disciplined Value Disciplined Value Mid Cap Equity Income Fundamental All Cap Core Fundamental Large Cap Core Fundamental Large Cap Value New Opportunities Select Growth Small Cap Equity Small Cap Value Small Company Strategic Growth U.S. Equity U.S. Global Leaders Growth Value Equity GLOBAL AND INTERNATIONAL EQUITY FUNDS Disciplined Value International Emerging Markets Emerging Markets Equity Global Equity Global Shareholder Yield Greater China Opportunities International Core International Growth International Small Company International Value Equity |
INCOME FUNDS Bond California Tax-Free Income Core High Yield Emerging Markets Debt Floating Rate Income Focused High Yield Global Income Government Income High Yield Municipal Bond Income Investment Grade Bond Money Market Short Duration Credit Opportunities Spectrum Income Strategic Income Opportunities Tax-Free Bond ALTERNATIVE AND SPECIALTY FUNDS Absolute Return Currency Alternative Asset Allocation Enduring Assets Financial Industries Global Absolute Return Strategies Global Conservative Absolute Return Global Real Estate Natural Resources Redwood Regional Bank Seaport Technical Opportunities |
A fund's investment objectives, risks, charges, and expenses should be considered carefully before investing. The prospectus contains this and other important information about the fund. To obtain a prospectus, contact your financial professional, call John Hancock Investments at 800-225-5291, or visit our website at jhinvestments.com. Please read the prospectus carefully before investing or sending money.
|
ASSET ALLOCATION Income Allocation Fund Lifestyle Aggressive Portfolio Lifestyle Balanced Portfolio Lifestyle Conservative Portfolio Lifestyle Growth Portfolio Lifestyle Moderate Portfolio Retirement Choices Portfolios (2010-2055) Retirement Living Portfolios (2010-2055) Retirement Living II Portfolios (2010-2055) EXCHANGE-TRADED FUNDS John Hancock Multifactor Consumer Discretionary ETF John Hancock Multifactor Financials ETF John Hancock Multifactor Healthcare ETF John Hancock Multifactor Large Cap ETF John Hancock Multifactor Mid Cap ETF John Hancock Multifactor Technology ETF CLOSED-END FUNDS Financial Opportunities Hedged Equity & Income Income Securities Trust Investors Trust Preferred Income Preferred Income II Preferred Income III Premium Dividend Tax-Advantaged Dividend Income Tax-Advantaged Global Shareholder Yield |
"As an investment firm,
upholding the proud
tradition of John Hancock
comes down to one thing:
putting shareholders
first. We believe that if
our shareholders are
successful, then we will
be successful."
Andrew G. Arnott
President and Chief Executive Officer
John Hancock Investments
John Hancock Multifactor ETF shares are bought and sold at market
price (not NAV), and are not individually redeemed
from the fund. Brokerage commissions will reduce returns.
John Hancock ETFs are distributed by Foreside Fund Services, LLC, and
are subadvised by Dimensional Fund Advisors LP.
Foreside is not affiliated with John Hancock Funds, LLC or
Dimensional Fund Advisors LP.
Dimensional Fund Advisors LP receives compensation from John Hancock
in connection with licensing rights to the
John Hancock Dimensional indexes. Dimensional Fund Advisors LP does
not sponsor, endorse, or sell, and makes no
representation as to the advisability of investing in, John Hancock
Multifactor ETFs.
John Hancock Investments
A trusted brand
John Hancock Investments is a premier asset manager representing
one of America's most trusted brands, with a heritage of financial
stewardship dating back to 1862. Helping our shareholders pursue
their financial goals is at the core of everything we do. It's why we
support the role of professional financial advice and operate with the
highest standards of conduct and integrity.
A better way to invest
We build funds based on investor needs, then search the world to find
proven portfolio teams with specialized expertise in those strategies.
As a manager of managers, we apply vigorous oversight to ensure that
they continue to meet our uncompromising standards and serve the
best interests of our shareholders.
Results for investors
Our unique approach to asset management enables us to provide
a diverse set of investments backed by some of the world's best
managers, along with strong risk-adjusted returns across asset classes.
|
|
John Hancock Funds, LLC n Member FINRA, SIPC 601 Congress Street n Boston, MA 02210-2805 800-225-5291 n jhinvestments.com |
|
| This report is for the information of the shareholders of John Hancock Fundamental Large Cap Core Fund. It is not authorized for distribution to prospective investors unless preceded or accompanied by a prospectus. | ||
| MF274535 | 372SA 1/16 3/16 |
|
John Hancock
Fundamental Large Cap Value Fund
Semiannual report 1/31/16
A message to shareholders
Dear shareholder,
The six-month period has been a challenging time for all investors. Oil prices, having already dropped precipitously, continued to slide in the back half of 2015, and by January oil frequently traded at multi-year lows. Concerns about slowing global growth added to negative investor psychology, and stock prices fell steeply around the world. Stocks were not the only investment that faced headwinds; all risk assets struggled over the past six months and these types of declines are unsettling.
Although volatility returned in force to the markets, much of the global economic picture continues to move in the right direction. In December, the U.S. Federal Reserve raised short-term interest rates for the first time in nine years on the evidence that the persistent strength in the labor markets warranted a somewhat less accommodative stance. Central banks outside of the United States continue to signal that they would take action to support economies and markets.
At John Hancock Investments, portfolio risk management is a critical part of our role as an asset manager, and our dedicated risk team is focused on these issues every day. We continually strive for new ways to analyze potential risks and have liquidity tools in place, such as a credit facility and an interfund lending program. In times like these, your best resource is your financial advisor, who can ensure your portfolio is sufficiently diversified to meet your long-term objectives and to withstand the inevitable bumps along the way.
On behalf of everyone at John Hancock Investments, I'd like to take this opportunity to thank you for the continued trust you've placed in us.
Sincerely,
Andrew G. Arnott
President and Chief Executive Officer
John Hancock Investments
This commentary reflects the CEO's views as of January 31, 2016. They are subject to change at any time. All investments entail risks, including the possible loss of principal. For more up-to-date information, you can visit our website at jhinvestments.com.
John Hancock
Fundamental Large Cap Value Fund
INVESTMENT OBJECTIVE
The fund seeks long-term capital appreciation.
AVERAGE ANNUAL TOTAL RETURNS AS OF 1/31/16 (%)
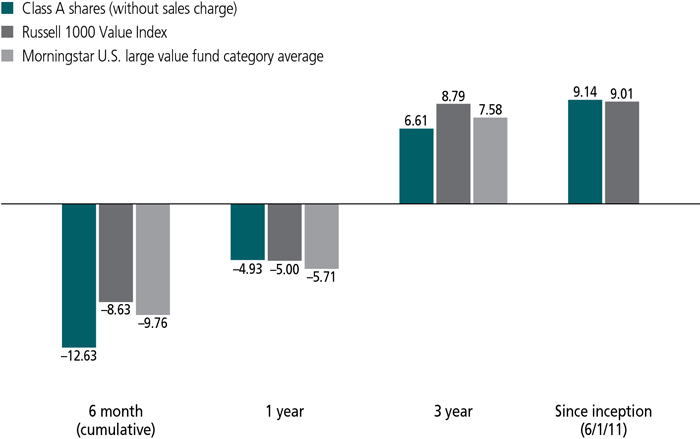
The Russell 1000 Value Index is an unmanaged index containing those securities in the Russell 1000 Index with a less-than-average growth orientation.
It is not possible to invest directly in an index. Index figures do not reflect expenses or sales charges, which would result in lower returns.
Figures from Morningstar, Inc. include reinvested distributions and do not take into account sales charges. Actual load-adjusted performance is lower. Since-inception returns for the Morningstar fund category average are not available.
The past performance shown here reflects reinvested distributions and the beneficial effect of any expense reductions, and does not guarantee future results. Returns for periods shorter than one year are cumulative. Performance of the other share classes will vary based on the difference in the fees and expenses of those classes. Shares will fluctuate in value and, when redeemed, may be worth more or less than their original cost. Current month-end performance may be lower or higher than the performance cited, and can be found at jhinvestments.com or by calling 800-225-5291. For further information on the fund's objectives, risks, and strategy, see the fund's prospectus.
PERFORMANCE HIGHLIGHTS OVER THE LAST SIX MONTHS
U.S. stocks gave up ground
U.S. stocks were pressured by sliding energy prices, concern over slowing economic growth in China, uncertainty around U.S. interest rates, and a strong U.S. dollar.
Materials, consumer discretionary, energy, and financials posted notable losses
Within the fund's benchmark Russell 1000 Value Index, materials, consumer discretionary, energy, and financials were sizable laggards, while the more defensive utilities and telecommunication services sectors were the only gainers.
Security selection detracted the most from relative performance
Stock picks and sector allocations hampered the fund's performance versus its benchmark, with the biggest losses coming from security selection in the financials sector.
SECTOR COMPOSITION AS OF 1/31/16 (%)
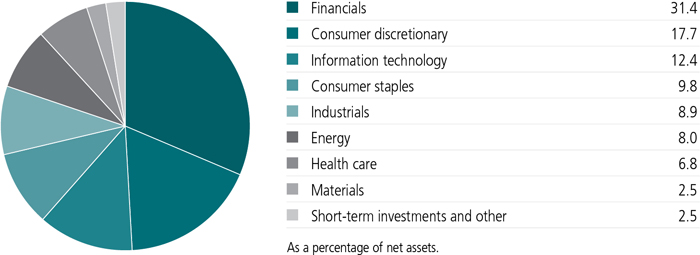
A note about risks
A fund concentrated in one sector or that holds a limited number of securities may fluctuate more than a fund that invests in a wider variety of sectors. Stock prices can be volatile and are affected by both general economic conditions and the financial prospects of individual companies. Large company stocks could fall out of favor. Value stocks may perform differently from the market as a whole, and following a value-oriented investment strategy may cause a fund to, at times, underperform equity funds that use other investment strategies. Foreign investing has additional risks, such as currency and market volatility and political and social instability. Hedging, derivatives, and other strategic transactions may increase a fund's volatility and could produce disproportionate losses, potentially more than the fund's principal investment. Please see the fund's prospectus for additional risks.
An interview with Portfolio Manager Emory W. (Sandy) Sanders, Jr., CFA, John Hancock Asset Management a division of Manulife Asset Management (US) LLC
Emory W. (Sandy) Sanders, Jr., CFA
Portfolio Manager
John Hancock Asset Management
How would you describe the market backdrop for the six months ended January 31, 2016?
It was volatile. The market sank early in the period amid worries over China's slowing economic growth, declining commodity prices, and uncertainty around U.S. interest rates. Stocks, however, rebounded in October as fears around China eased and the U.S. Federal Reserve (Fed) postponed an interest-rate hike. But volatility mounted heading into year end, with China's issues moving to the forefront again, commodity prices sliding further, and the junk bond market moving sharply lower. These concerns overshadowed a brief stock market rally following the Fed's mid-December decision to hike interest rates for the first time since 2006. The market retreated even further in January, as oil prices collapsed to their lowest level in over a decade, global economic growth slowed, and the pace of the U.S. economic recovery was uneven.
How did large-cap stocks fare in this environment?
As volatility increased and investors became more risk averse, large-cap stocks held up better than small- and mid-cap stocks. However, within the large-cap segment, value trailed growth. Most sectors in the fund's benchmark, the Russell 1000 Value Index, declined, most notably materials, consumer discretionary, energy, and financials. Materials and energy stocks fell due to weak commodity prices. Consumer discretionary stocks took a hit from late-period concern about the strength of the U.S. consumer. The financials sector, which represents nearly one-third of the index, was knocked down by continued low interest rates, declining oil prices, and sluggish economic growth here and abroad. Only the more defensive utilities and telecommunication services sectors posted gains.
What was your approach to investing in this environment?
Regardless of market conditions, we try to invest the fund in financially sound large-cap companies with competitive advantages and the ability to generate substantial cash flow over sustained periods. We look to buy these types of stocks when they're priced at a discount to our estimate of intrinsic value; essentially, when they appear to us to be on sale. Often we find attractive buying
What caused the fund to lag the index this period?
Security selection in the financials sector was the biggest detractor by far, as the fund had overweights in a number of positions that declined even more than the average return for the sector. Disappointments included auto finance company Santander Consumer USA Holdings, Inc., which targets credit-impaired buyers. Its stock slid amid concern over slowing auto sales and weakening economic conditions. Worries that the credit cycle had bottomed and delinquencies and defaults would increase also caused investors to move away from the stock. Another detractor was CIT Group, Inc., a financial holding company that offers loans and leases to small and midsize businesses. Its profitability was hindered by continued low interest rates.
One of the fund's largest holdings was Citigroup, Inc., a diversified financial company with significant international exposure. Its stock slid as investors, in our opinion, overreacted to the impact that slowing global growth and declining oil prices would have on Citi's business. We kept a sizable overweight because we thought the reality was a lot better than current investor sentiment was suggesting. In fact, the company's latest quarterly report showed mid-single-digit loan growth and improved credit metrics. Shares of investment bank Morgan Stanley were pressured by continued low interest rates and a slump in bond and commodity trading volumes. In addition, an
TOP 10 HOLDINGS AS OF 1/31/16 (%)
| JPMorgan Chase & Co. | 5.0 |
| American International Group, Inc. | 4.7 |
| Citigroup, Inc. | 4.5 |
| Bank of America Corp. | 4.4 |
| General Electric Company | 3.9 |
| adidas AG | 3.5 |
| The Goldman Sachs Group, Inc. | 3.4 |
| Apple, Inc. | 3.3 |
| Lennar Corp., Class A | 3.3 |
| Lowe's Companies, Inc. | 2.9 |
| TOTAL | 38.9 |
| As a percentage of net assets. | |
| Cash and cash equivalents are not included. | |
Having no exposure to the better-performing utilities sector, where we typically find few opportunities that meet our investment criteria, detracted, as did stock picks in information technology. However, other sizable individual disappointments came from consumer discretionary, the fund's second-largest sector allocation and a significant overweight. Here, home builder Lennar Corp. and premium mattress company Tempur Sealy International, Inc. saw their stocks pressured by concern over the strength of the U.S. consumer. Lennar faced added headwinds because it tends to be more economically sensitive than some of its peers, while Tempur Sealy was hurt by investors' year-end profit taking.
Were there any bright spots for the period?
Security selection in consumer discretionary, consumer staples and materials helped relative performance. In consumer discretionary, winners included Germany-based sports apparel company adidas AG, which posted a sizable gain, thanks to restructuring efforts that led to better-than-expected sales, a stock buyback, and the appointment of a new CEO. Shares of mid-Atlantic-based home builder NVR, Inc. were lifted by strong new home orders, while an investment in home improvement company Lowe's Companies, Inc. climbed as consumers continued to spend on renovating and repairing their homes.
In consumer staples, U.K.-based global brewer SABMiller PLC was a standout, buoyed by a premium buyout offer in October from Belgium-based rival Anheuser-Busch InBev SA. We locked in profits and sold SAB before period end. In materials, top contributors included Louisiana-Pacific Corp., a company that makes an engineered wood particleboard called oriented strand board. All of the top contributors we've mentioned were out-of-index positions.
COUNTRY COMPOSITION AS OF 1/31/16 (%)
| United States | 85.6 |
| Germany | 3.4 |
| United Kingdom | 2.6 |
| Switzerland | 2.3 |
| Ireland | 2.2 |
| Netherlands | 1.4 |
| South Korea | 1.3 |
| France | 1.2 |
| TOTAL | 100.0 |
| As a percentage of net assets. |
In light of recent market volatility, have you changed the fund's positioning?
Not really. We always keep the fund focused on attractively valued, higher-quality companies with the potential for sustainable cash flow growth. At period end, the portfolio still had an economically sensitive bias with a notable overweight in consumer discretionary, where we continued to target companies with exposure to the U.S. housing recovery. The fund also ended the period with a sizable stake in financials, where we think valuations look very attractive, especially given recent cost-cutting efforts and improved capital positions at many companies. Notable underweights included energy, a sector that continues to battle weak commodity prices, and healthcare, where many stocks look expensive to us. The fund continued to have no exposure to utilities and telecommunication services, sectors that typically don't meet our investment criteria because they tend to be capital intensive with low profit margins.
Are there any management changes upcoming?
Effective April 1, 2016, Walter T. McCormick will be retiring. The fund will continue to be managed by Nicholas Renart and me. We wish Walter well.
MANAGED BY
| |
Emory W. (Sandy) Sanders, Jr., CFA On the fund since 2011 Investing since 1997 |
| |
Walter T. McCormick, CFA On the fund since 2011 Investing since 1970 |
 |
Nicholas P. Renart On the fund since 2015 Investing since 2005 |
![]()
TOTAL RETURNS FOR THE PERIOD ENDED JANUARY 31, 2016
| Average annual total returns (%) with maximum sales charge |
Cumulative total returns (%) with maximum sales charge |
||||||||||||||||
| 1-year | Since inception |
6-month | Since inception |
||||||||||||||
| Class A | -9.69 | 7.94 | 1 | -17.00 | 42.92 | 1 | |||||||||||
| Class C | -6.61 | -5.39 | 2 | -13.77 | -8.48 | 2 | |||||||||||
| Class I3 | -4.67 | 9.54 | 1 | -12.48 | 53.09 | 1 | |||||||||||
| Class R23,4 | -4.72 | 9.29 | 1 | -12.56 | 51.45 | 1 | |||||||||||
| Class R43,4 | -4.62 | 9.32 | 1 | -12.47 | 51.60 | 1 | |||||||||||
| Class R63,4 | -4.47 | 9.78 | 1 | -12.46 | 54.63 | 1 | |||||||||||
| Class NAV3 | -4.58 | 15.49 | 5 | -12.46 | 89.66 | 5 | |||||||||||
| Index† | -5.00 | 9.01 | 1 | -8.63 | 49.60 | 1 | |||||||||||
Performance figures assume all distributions have been reinvested. Figures reflect maximum sales charges on Class A shares of 5.00% and the applicable contingent deferred sales charge (CDSC) on Class C shares. Class C shares sold within one year of purchase are subject to a 1% CDSC. Sales charges are not applicable to Class I, Class R2, Class R4, Class R6, and Class NAV shares.
The expense ratios of the fund, both net (including any fee waivers and/or expense limitations) and gross (excluding any fee waivers and/or expense limitations), are set forth according to the most recent publicly available prospectuses for the fund and may differ from those disclosed in the Financial highlights tables in this report. Had the fee waivers and expense limitations not been in place, gross expenses would apply. The expense ratios are as follows:
| Class A | Class C | Class I | Class R2* | Class R4* | Class R6* | Class NAV | |
| Gross (%) | 1.08 | 1.79 | 0.77 | 1.19 | 1.04 | 0.69 | 0.67 |
| Net (%) | 1.08 | 1.79 | 0.77 | 1.19 | 0.94 | 0.67 | 0.67 |
*Expenses have been estimated for the first year of operations of Class R2, Class R4 and Class R6.
Please refer to the most recent prospectus and annual or semiannual report for more information on expenses and any expense limitation arrangements for each class.
The returns reflect past results and should not be considered indicative of future performance. The return and principal value of an investment will fluctuate so that shares, when redeemed, may be worth more or less than their original cost. Due to market volatility and other factors, the fund's current performance may be higher or lower than the performance shown. For current to the most recent month-end performance data, please call 800-225-5291 or visit the fund's website at jhinvestments.com.
The performance table above and the chart on the next page do not reflect the deduction of taxes that a shareholder would pay on fund distributions or the redemption of fund shares. The fund's performance results reflect any applicable fee waivers or expense reductions, without which the expenses would increase and results would have been less favorable.
| † | Index is the Russell 1000 Value Index. |
See the following page for footnotes.
This chart and table show what happened to a hypothetical $10,000 investment in John Hancock Fundamental Large Cap Value Fund for the share classes and periods indicated, assuming all distributions were reinvested. For comparison, we've shown the same investment in the Russell 1000 Value Index.
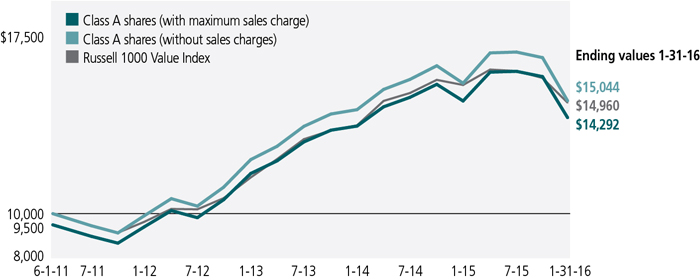
| Start date | With maximum sales charge ($) |
Without sales charge ($) |
Index ($) | |
| Class C6 | 6-27-14 | 9,152 | 9,152 | 9,568 |
| Class I3 | 6-1-11 | 15,309 | 15,309 | 14,960 |
| Class R23,4 | 6-1-11 | 15,145 | 15,145 | 14,960 |
| Class R43,4 | 6-1-11 | 15,160 | 15,160 | 14,960 |
| Class R63,4 | 6-1-11 | 15,463 | 15,463 | 14,960 |
| Class NAV3 | 8-23-11 | 18,966 | 18,966 | 18,258 |
The Russell 1000 Value Index is an unmanaged index containing those securities in the Russell 1000 Index with a less-than-average growth orientation.
It is not possible to invest directly in an index. Index figures do not reflect expenses or sales charges, which would result in lower returns.
Footnotes related to performance pages
| 1 | From 6-1-11. |
| 2 | From 6-27-14. |
| 3 | For certain types of investors as described in the fund's prospectuses. |
| 4 | Class R2, Class R4, and Class R6 shares were first offered on 3-27-15. Returns prior to this date are that of Class A shares that have been recalculated to apply gross fees and expenses of Class R2, Class R4, and Class R6 shares, as applicable. |
| 5 | From 8-23-11. |
| 6 | The contingent deferred sales charge is not applicable. |
These examples are intended to help you understand your ongoing operating expenses of investing in the fund so you can compare these costs with the ongoing costs of investing in other mutual funds.
Understanding fund expenses
As a shareholder of the fund, you incur two types of costs:
| • | Transaction costs, which include sales charges (loads) on purchases or redemptions (varies by share class), minimum account fee charge, etc. |
| • | Ongoing operating expenses, including management fees, distribution and service fees (if applicable), and other fund expenses. |
We are presenting only your ongoing operating expenses here.
Actual expenses/actual returns
This example is intended to provide information about the fund's actual ongoing operating expenses, and is based on the fund's actual return. It assumes an account value of $1,000.00 on August 1, 2015, with the same investment held until January 31, 2016.
| Account value on 8-1-2015 |
Ending value on 1-31-2016 |
Expenses paid during period ended 1-31-20161 |
Annualized expense ratio |
|
| Class A | $1,000.00 | $873.70 | $5.13 | 1.09% |
| Class C | 1,000.00 | 870.70 | 8.42 | 1.79% |
| Class I | 1,000.00 | 875.20 | 3.68 | 0.78% |
| Class R2 | 1,000.00 | 874.40 | 4.43 | 0.94% |
| Class R4 | 1,000.00 | 875.30 | 3.96 | 0.84% |
| Class R6 | 1,000.00 | 875.40 | 3.16 | 0.67% |
| Class NAV | 1,000.00 | 875.40 | 3.16 | 0.67% |
Together with the value of your account, you may use this information to estimate the operating expenses that you paid over the period. Simply divide your account value at January 31, 2016, by $1,000.00, then multiply it by the "expenses paid" for your share class from the table above. For example, for an account value of $8,600.00, the operating expenses should be calculated as follows:
Hypothetical example for comparison purposes
This table allows you to compare the fund's ongoing operating expenses with those of any other fund. It provides an example of the fund's hypothetical account values and hypothetical expenses based on each class's actual expense ratio and an assumed 5% annualized return before expenses (which is not the fund's actual return). It assumes an account value of $1,000.00 on August 1, 2015, with the same investment held until January 31, 2016. Look in any other fund shareholder report to find its hypothetical example and you will be able to compare these expenses. Please remember that these hypothetical account values and expenses may not be used to estimate the actual ending account balance or expenses you paid for the period.
| Account value on 8-1-2015 |
Ending value on 1-31-2016 |
Expenses paid during period ended 1-31-20161 |
Annualized expense ratio |
|
| Class A | $1,000.00 | $1,019.70 | $5.53 | 1.09% |
| Class C | 1,000.00 | 1,016.10 | 9.07 | 1.79% |
| Class I | 1,000.00 | 1,021.20 | 3.96 | 0.78% |
| Class R2 | 1,000.00 | 1,020.40 | 4.77 | 0.94% |
| Class R4 | 1,000.00 | 1,020.90 | 4.27 | 0.84% |
| Class R6 | 1,000.00 | 1,021.80 | 3.41 | 0.67% |
| Class NAV | 1,000.00 | 1,021.80 | 3.41 | 0.67% |
Remember, these examples do not include any transaction costs, therefore, these examples will not help you to determine the relative total costs of owning different funds. If transaction costs were included, your expenses would have been higher. See the prospectuses for details regarding transaction costs.
| 1 | Expenses are equal to the fund's annualized expense ratio, multiplied by the average account value over the period, multiplied by 184/366 (to reflect the one-half year period). |
Fund's investments
| As of 1-31-16 (unaudited) | ||||||||||||||
| Shares | Value | |||||||||||||
| Common stocks 97.5% | $1,095,953,189 | |||||||||||||
| (Cost $960,964,676) | ||||||||||||||
| Consumer discretionary 17.7% | 199,532,989 | |||||||||||||
| Diversified consumer services 0.8% | ||||||||||||||
| DeVry Education Group, Inc. | 473,635 | 9,425,337 | ||||||||||||
| Household durables 8.6% | ||||||||||||||
| Lennar Corp., Class A | 867,820 | 36,578,613 | ||||||||||||
| NVR, Inc. (I) | 16,868 | 27,849,068 | ||||||||||||
| Tempur Sealy International, Inc. (I) | 528,800 | 31,907,792 | ||||||||||||
| Specialty retail 2.9% | ||||||||||||||
| Lowe's Companies, Inc. | 460,245 | 32,981,157 | ||||||||||||
| Textiles, apparel and luxury goods 5.4% | ||||||||||||||
| adidas AG | 376,411 | 38,760,034 | ||||||||||||
| Ralph Lauren Corp. | 195,831 | 22,030,988 | ||||||||||||
| Consumer staples 9.8% | 110,118,714 | |||||||||||||
| Beverages 4.7% | ||||||||||||||
| Diageo PLC, ADR | 134,018 | 14,429,718 | ||||||||||||
| Heineken Holding NV | 199,569 | 15,272,612 | ||||||||||||
| PepsiCo, Inc. | 232,943 | 23,131,240 | ||||||||||||
| Food products 1.2% | ||||||||||||||
| Danone SA | 187,539 | 12,916,815 | ||||||||||||
| Household products 1.4% | ||||||||||||||
| The Procter & Gamble Company | 193,074 | 15,772,215 | ||||||||||||
| Tobacco 2.5% | ||||||||||||||
| Imperial Tobacco Group PLC | 266,126 | 14,409,548 | ||||||||||||
| Philip Morris International, Inc. | 157,611 | 14,186,566 | ||||||||||||
| Energy 8.0% | 89,600,584 | |||||||||||||
| Energy equipment and services 0.7% | ||||||||||||||
| Weatherford International PLC (I) | 1,168,096 | 7,872,967 | ||||||||||||
| Oil, gas and consumable fuels 7.3% | ||||||||||||||
| Apache Corp. | 295,928 | 12,588,777 | ||||||||||||
| Chevron Corp. | 179,327 | 15,506,406 | ||||||||||||
| Exxon Mobil Corp. | 170,390 | 13,264,862 | ||||||||||||
| Kinder Morgan, Inc. | 787,935 | 12,961,531 | ||||||||||||
| Occidental Petroleum Corp. | 398,170 | 27,406,041 | ||||||||||||
| Financials 31.4% | 352,958,084 | |||||||||||||
| Banks 17.1% | ||||||||||||||
| Bank of America Corp. | 3,459,303 | 48,914,544 | ||||||||||||
| CIT Group, Inc. | 572,214 | 16,794,481 | ||||||||||||
| Shares | Value | |||||||||||||
| Financials (continued) | ||||||||||||||
| Banks (continued) | ||||||||||||||
| Citigroup, Inc. | 1,196,205 | $50,934,409 | ||||||||||||
| JPMorgan Chase & Co. | 945,578 | 56,261,890 | ||||||||||||
| Wells Fargo & Company | 370,518 | 18,611,119 | ||||||||||||
| Capital markets 8.8% | ||||||||||||||
| AllianceBernstein Holding LP | 1,157,151 | 21,337,864 | ||||||||||||
| Morgan Stanley | 964,856 | 24,970,473 | ||||||||||||
| State Street Corp. | 256,429 | 14,290,788 | ||||||||||||
| The Goldman Sachs Group, Inc. | 239,575 | 38,705,737 | ||||||||||||
| Consumer finance 0.8% | ||||||||||||||
| Santander Consumer USA Holdings, Inc. (I) | 893,089 | 9,332,780 | ||||||||||||
| Insurance 4.7% | ||||||||||||||
| American International Group, Inc. | 934,915 | 52,803,999 | ||||||||||||
| Health care 6.8% | 76,141,507 | |||||||||||||
| Biotechnology 1.4% | ||||||||||||||
| Amgen, Inc. | 102,019 | 15,581,362 | ||||||||||||
| Health care equipment and supplies 2.2% | ||||||||||||||
| Medtronic PLC | 330,526 | 25,093,534 | ||||||||||||
| Pharmaceuticals 3.2% | ||||||||||||||
| Merck & Company, Inc. | 355,383 | 18,007,257 | ||||||||||||
| Novartis AG, ADR | 223,924 | 17,459,354 | ||||||||||||
| Industrials 8.9% | 100,086,302 | |||||||||||||
| Air freight and logistics 1.3% | ||||||||||||||
| FedEx Corp. | 112,331 | 14,926,543 | ||||||||||||
| Electrical equipment 1.2% | ||||||||||||||
| Sensata Technologies Holding NV (I) | 354,677 | 13,016,646 | ||||||||||||
| Industrial conglomerates 5.6% | ||||||||||||||
| Danaher Corp. | 214,586 | 18,593,877 | ||||||||||||
| General Electric Company | 1,518,526 | 44,189,107 | ||||||||||||
| Trading companies and distributors 0.8% | ||||||||||||||
| United Rentals, Inc. (I) | 195,369 | 9,360,129 | ||||||||||||
| Information technology 12.4% | 139,014,696 | |||||||||||||
| Communications equipment 3.3% | ||||||||||||||
| Cisco Systems, Inc. | 881,601 | 20,973,288 | ||||||||||||
| QUALCOMM, Inc. | 367,073 | 16,643,090 | ||||||||||||
| Internet software and services 1.2% | ||||||||||||||
| eBay, Inc. (I) | 565,690 | 13,271,087 | ||||||||||||
| Software 3.3% | ||||||||||||||
| Microsoft Corp. | 474,631 | 26,147,422 | ||||||||||||
| Oracle Corp. | 291,741 | 10,593,116 | ||||||||||||
| Shares | Value | |||||||||||||
| Information technology (continued) | ||||||||||||||
| Technology hardware, storage and peripherals 4.6% | ||||||||||||||
| Apple, Inc. | 379,780 | $36,967,785 | ||||||||||||
| Samsung Electronics Company, Ltd. | 14,904 | 14,418,908 | ||||||||||||
| Materials 2.5% | 28,500,313 | |||||||||||||
| Paper and forest products 2.5% | ||||||||||||||
| Louisiana-Pacific Corp. (I) | 1,812,997 | 28,500,313 | ||||||||||||
| Par value^ | Value | |||||||||||||
| Short-term investments 2.7% | $30,049,000 | |||||||||||||
| (Cost $30,049,000) | ||||||||||||||
| Repurchase agreement 2.7% | 30,049,000 | |||||||||||||
| Barclays Tri-Party Repurchase Agreement dated 1-29-16 at 0.330% to be repurchased at $29,279,805 on 2-1-16, collateralized by $29,461,800 U.S. Treasury Inflation Indexed Notes, 0.125% due 4-15-20 (valued at $29,865,467, including interest) | 29,279,000 | 29,279,000 | ||||||||||||
| Repurchase Agreement with State Street Corp. dated 1-29-16 at 0.030% to be repurchased at $770,002 on 2-1-16, collateralized by $790,000 U.S. Treasury Notes, 0.625% due 6-30-17 (valued at $788,025, including interest) | 770,000 | 770,000 | ||||||||||||
| Total investments (Cost $991,013,676)† 100.2% | $1,126,002,189 | |||||||||||||
| Other assets and liabilities, net (0.2%) | ($2,697,454 | ) | ||||||||||||
| Total net assets 100.0% | $1,123,304,735 | |||||||||||||
| The percentage shown for each investment is the total value of the category at a percentage of net assets of the fund. | ||||||||||||||
| ^All par values are denominated in U.S. dollars unless otherwise indicated. | ||||||||||||||
| Key to Security Abbreviations and Legend | ||||||||||||||
| ADR | American Depositary Receipts | |||||||||||||
| (I) | Non-income producing security. | |||||||||||||
| † | At 1-31-16, the aggregate cost of investment securities for federal income tax purposes was $989,219,320. Net unrealized appreciation aggregated $136,782,869, of which $217,911,815 related to appreciated investment securities and $81,128,946 related to depreciated investment securities. | |||||||||||||
Financial statements
STATEMENT OF ASSETS AND LIABILITIES 1-31-16 (unaudited)
| Assets | ||||||||||||||||||||||||||||||
| Investments, at value (Cost $991,013,676) | $1,126,002,189 | |||||||||||||||||||||||||||||
| Cash | 1,351,023 | |||||||||||||||||||||||||||||
| Foreign currency, at value (Cost $61) | 59 | |||||||||||||||||||||||||||||
| Receivable for fund shares sold | 86,429 | |||||||||||||||||||||||||||||
| Dividends and interest receivable | 1,611,068 | |||||||||||||||||||||||||||||
| Other receivables and prepaid expenses | 43,238 | |||||||||||||||||||||||||||||
| Total assets | 1,129,094,006 | |||||||||||||||||||||||||||||
| Liabilities | ||||||||||||||||||||||||||||||
| Payable for investments purchased | 5,633,295 | |||||||||||||||||||||||||||||
| Payable for fund shares repurchased | 53,252 | |||||||||||||||||||||||||||||
| Payable to affiliates | ||||||||||||||||||||||||||||||
| Accounting and legal services fees | 28,224 | |||||||||||||||||||||||||||||
| Transfer agent fees | 4,009 | |||||||||||||||||||||||||||||
| Trustees' fees | 2,262 | |||||||||||||||||||||||||||||
| Other liabilities and accrued expenses | 68,229 | |||||||||||||||||||||||||||||
| Total liabilities | 5,789,271 | |||||||||||||||||||||||||||||
| Net assets | $1,123,304,735 | |||||||||||||||||||||||||||||
| Net assets consist of | ||||||||||||||||||||||||||||||
| Paid-in capital | $989,495,690 | |||||||||||||||||||||||||||||
| Undistributed net investment income | 862,029 | |||||||||||||||||||||||||||||
| Accumulated net realized gain (loss) on investments and foreign currency transactions | (2,033,716 | ) | ||||||||||||||||||||||||||||
| Net unrealized appreciation (depreciation) on investments and translation of assets and liabilities in foreign currencies | 134,980,732 | |||||||||||||||||||||||||||||
| Net assets | $1,123,304,735 | |||||||||||||||||||||||||||||
| Net asset value per share | ||||||||||||||||||||||||||||||
| Based on net asset values and shares outstanding-the fund has an unlimited number of shares authorized with no par value | ||||||||||||||||||||||||||||||
| Class A ($15,421,355 ÷ 1,338,078 shares)1 | $11.53 | |||||||||||||||||||||||||||||
| Class C ($1,141,153 ÷ 98,765 shares)1 | $11.55 | |||||||||||||||||||||||||||||
| Class I ($2,577,738 ÷ 222,858 shares) | $11.57 | |||||||||||||||||||||||||||||
| Class R2 ($169,697 ÷ 14,681 shares) | $11.56 | |||||||||||||||||||||||||||||
| Class R4 ($86,179 ÷ 7,457 shares) | $11.56 | |||||||||||||||||||||||||||||
| Class R6 ($144,313 ÷ 12,493 shares) | $11.55 | |||||||||||||||||||||||||||||
| Class NAV ($1,103,764,300 ÷ 95,527,591 shares) | $11.55 | |||||||||||||||||||||||||||||
| Maximum offering price per share | ||||||||||||||||||||||||||||||
| Class A (net asset value per share ÷ 95%)2 | $12.14 | |||||||||||||||||||||||||||||
| 1 | Redemption price per share is equal to net asset value less any applicable contingent deferred sales charge. | ||||||||||||||||
| 2 | On single retail sales of less than $50,000. On sales of $50,000 or more and on group sales the offering price is reduced. | ||||||||||||||||
STATEMENT OF OPERATIONS For the six months ended 1-31-16 (unaudited)
| Investment income | ||||||||||||||||||||||||
| Dividends | $11,547,042 | |||||||||||||||||||||||
| Interest | 12,894 | |||||||||||||||||||||||
| Less foreign taxes withheld | (70,520 | ) | ||||||||||||||||||||||
| Total investment income | 11,489,416 | |||||||||||||||||||||||
| Expenses | ||||||||||||||||||||||||
| Investment management fees | 3,837,236 | |||||||||||||||||||||||
| Distribution and service fees | 30,320 | |||||||||||||||||||||||
| Accounting and legal services fees | 81,187 | |||||||||||||||||||||||
| Transfer agent fees | 12,237 | |||||||||||||||||||||||
| Trustees' fees | 11,251 | |||||||||||||||||||||||
| State registration fees | 39,114 | |||||||||||||||||||||||
| Printing and postage | 3,093 | |||||||||||||||||||||||
| Professional fees | 32,736 | |||||||||||||||||||||||
| Custodian fees | 81,657 | |||||||||||||||||||||||
| Registration and filing fees | 48,424 | |||||||||||||||||||||||
| Other | 10,835 | |||||||||||||||||||||||
| Total expenses | 4,188,090 | |||||||||||||||||||||||
| Less expense reductions | (45,643 | ) | ||||||||||||||||||||||
| Net expenses | 4,142,447 | |||||||||||||||||||||||
| Net investment income | 7,346,969 | |||||||||||||||||||||||
| Realized and unrealized gain (loss) | ||||||||||||||||||||||||
| Net realized gain (loss) on | ||||||||||||||||||||||||
| Investments and foreign currency transactions | (3,261,234 | ) | ||||||||||||||||||||||
| (3,261,234 | ) | |||||||||||||||||||||||
| Change in net unrealized appreciation (depreciation) of | ||||||||||||||||||||||||
| Investments and translation of assets and liabilities in foreign currencies | (162,828,825 | ) | ||||||||||||||||||||||
| (162,828,825 | ) | |||||||||||||||||||||||
| Net realized and unrealized loss | (166,090,059 | ) | ||||||||||||||||||||||
| Decrease in net assets from operations | ($158,743,090 | ) | ||||||||||||||||||||||
STATEMENTS OF CHANGES IN NET ASSETS
| Six months ended 1-31-16 | Year ended 7-31-15 | ||||||||||||||||||||||||||||||||||||||||||||
| (unaudited) | |||||||||||||||||||||||||||||||||||||||||||||
| Increase (decrease) in net assets | |||||||||||||||||||||||||||||||||||||||||||||
| From operations | |||||||||||||||||||||||||||||||||||||||||||||
| Net investment income | $7,346,969 | $14,955,128 | |||||||||||||||||||||||||||||||||||||||||||
| Net realized gain (loss) | (3,261,234 | ) | 68,811,513 | ||||||||||||||||||||||||||||||||||||||||||
| Change in net unrealized appreciation (depreciation) | (162,828,825 | ) | 26,916,056 | ||||||||||||||||||||||||||||||||||||||||||
| Increase (decrease) in net assets resulting from operations | (158,743,090 | ) | 110,682,697 | ||||||||||||||||||||||||||||||||||||||||||
| Distributions to shareholders | |||||||||||||||||||||||||||||||||||||||||||||
| From net investment income | |||||||||||||||||||||||||||||||||||||||||||||
| Class A | (109,710 | ) | (84,816 | ) | |||||||||||||||||||||||||||||||||||||||||
| Class I | (30,733 | ) | (45,603 | ) | |||||||||||||||||||||||||||||||||||||||||
| Class R2 | (868 | ) | — | ||||||||||||||||||||||||||||||||||||||||||
| Class R4 | (948 | ) | — | ||||||||||||||||||||||||||||||||||||||||||
| Class R6 | (1,761 | ) | — | ||||||||||||||||||||||||||||||||||||||||||
| Class NAV | (13,323,131 | ) | (12,196,828 | ) | |||||||||||||||||||||||||||||||||||||||||
| From net realized gain | |||||||||||||||||||||||||||||||||||||||||||||
| Class A | (669,154 | ) | (942,378 | ) | |||||||||||||||||||||||||||||||||||||||||
| Class C | (52,284 | ) | (36,198 | ) | |||||||||||||||||||||||||||||||||||||||||
| Class I | (124,953 | ) | (381,695 | ) | |||||||||||||||||||||||||||||||||||||||||
| Class R2 | (4,189 | ) | — | ||||||||||||||||||||||||||||||||||||||||||
| Class R4 | (4,087 | ) | — | ||||||||||||||||||||||||||||||||||||||||||
| Class R6 | (6,443 | ) | — | ||||||||||||||||||||||||||||||||||||||||||
| Class NAV | (48,753,619 | ) | (71,295,344 | ) | |||||||||||||||||||||||||||||||||||||||||
| Total distributions | (63,081,880 | ) | (84,982,862 | ) | |||||||||||||||||||||||||||||||||||||||||
| From fund share transactions | 35,166,647 | 69,360,401 | |||||||||||||||||||||||||||||||||||||||||||
| Total increase (decrease) | (186,658,323 | ) | 95,060,236 | ||||||||||||||||||||||||||||||||||||||||||
| Net assets | |||||||||||||||||||||||||||||||||||||||||||||
| Beginning of period | 1,309,963,058 | 1,214,902,822 | |||||||||||||||||||||||||||||||||||||||||||
| End of period | $1,123,304,735 | $1,309,963,058 | |||||||||||||||||||||||||||||||||||||||||||
| Undistributed net investment income | $862,029 | $6,982,211 | |||||||||||||||||||||||||||||||||||||||||||
Financial highlights
| Class A Shares Period ended | 1-31-16 | 1 | 7-31-15 | 7-31-14 | 7-31-13 | 7-31-12 | 7-31-11 | 2 | ||||||||||||||||||||||||||||||||||||||||||||||||||||||||||||||||||||||||||||||||||||||||||||||||||||||||||||||
| Per share operating performance | ||||||||||||||||||||||||||||||||||||||||||||||||||||||||||||||||||||||||||||||||||||||||||||||||||||||||||||||||||||||
| Net asset value, beginning of period | $13.84 | $13.62 | $13.11 | $10.27 | $9.46 | $10.00 | ||||||||||||||||||||||||||||||||||||||||||||||||||||||||||||||||||||||||||||||||||||||||||||||||||||||||||||||||
| Net investment income3 | 0.05 | 0.09 | 0.07 | 0.11 | 0.09 | — | 4 | |||||||||||||||||||||||||||||||||||||||||||||||||||||||||||||||||||||||||||||||||||||||||||||||||||||||||||||||
| Net realized and unrealized gain (loss) on investments | (1.72 | ) | 0.94 | 1.82 | 3.32 | 0.78 | (0.54 | ) | ||||||||||||||||||||||||||||||||||||||||||||||||||||||||||||||||||||||||||||||||||||||||||||||||||||||||||||||
| Total from investment operations | (1.67 | ) | 1.03 | 1.89 | 3.43 | 0.87 | (0.54 | ) | ||||||||||||||||||||||||||||||||||||||||||||||||||||||||||||||||||||||||||||||||||||||||||||||||||||||||||||||
| Less distributions | ||||||||||||||||||||||||||||||||||||||||||||||||||||||||||||||||||||||||||||||||||||||||||||||||||||||||||||||||||||||
| From net investment income | (0.09 | ) | (0.07 | ) | (0.09 | ) | (0.10 | ) | (0.03 | ) | — | |||||||||||||||||||||||||||||||||||||||||||||||||||||||||||||||||||||||||||||||||||||||||||||||||||||||||||
| From net realized gain | (0.55 | ) | (0.74 | ) | (1.29 | ) | (0.49 | ) | (0.03 | ) | — | |||||||||||||||||||||||||||||||||||||||||||||||||||||||||||||||||||||||||||||||||||||||||||||||||||||||||||
| Total distributions | (0.64 | ) | (0.81 | ) | (1.38 | ) | (0.59 | ) | (0.06 | ) | — | |||||||||||||||||||||||||||||||||||||||||||||||||||||||||||||||||||||||||||||||||||||||||||||||||||||||||||
| Net asset value, end of period | $11.53 | $13.84 | $13.62 | $13.11 | $10.27 | $9.46 | ||||||||||||||||||||||||||||||||||||||||||||||||||||||||||||||||||||||||||||||||||||||||||||||||||||||||||||||||
| Total return (%)5,6 | (12.63 | ) 7 | 7.64 | 15.08 | 34.46 | 9.28 | (5.40 | ) 7 | ||||||||||||||||||||||||||||||||||||||||||||||||||||||||||||||||||||||||||||||||||||||||||||||||||||||||||||||
| Ratios and supplemental data | ||||||||||||||||||||||||||||||||||||||||||||||||||||||||||||||||||||||||||||||||||||||||||||||||||||||||||||||||||||||
| Net assets, end of period (in millions) | $15 | $16 | $12 | $9 | $3 | $2 | ||||||||||||||||||||||||||||||||||||||||||||||||||||||||||||||||||||||||||||||||||||||||||||||||||||||||||||||||
| Ratios (as a percentage of average net assets): | ||||||||||||||||||||||||||||||||||||||||||||||||||||||||||||||||||||||||||||||||||||||||||||||||||||||||||||||||||||||
| Expenses before reductions | 1.10 | 8 | 1.14 | 1.34 | 1.53 | 2.80 | 5.95 | 8 | ||||||||||||||||||||||||||||||||||||||||||||||||||||||||||||||||||||||||||||||||||||||||||||||||||||||||||||||
| Expenses including reductions | 1.09 | 8 | 1.13 | 1.30 | 1.30 | 1.30 | 1.30 | 8 | ||||||||||||||||||||||||||||||||||||||||||||||||||||||||||||||||||||||||||||||||||||||||||||||||||||||||||||||
| Net investment income | 0.78 | 8 | 0.62 | 0.54 | 0.96 | 0.94 | 0.26 | 8 | ||||||||||||||||||||||||||||||||||||||||||||||||||||||||||||||||||||||||||||||||||||||||||||||||||||||||||||||
| Portfolio turnover (%) | 6 | 20 | 24 | 38 | 26 | 5 | ||||||||||||||||||||||||||||||||||||||||||||||||||||||||||||||||||||||||||||||||||||||||||||||||||||||||||||||||
| 1 | Six months ended 1-31-16. Unaudited. | ||||||||||||||||||||||||||||||||||||||||||||||||||||||||||||||||||||||||||||||||||
| 2 | Period from 6-1-11 (commencement of operations) to 7-31-11. | ||||||||||||||||||||||||||||||||||||||||||||||||||||||||||||||||||||||||||||||||||
| 3 | Based on average daily shares outstanding. | ||||||||||||||||||||||||||||||||||||||||||||||||||||||||||||||||||||||||||||||||||
| 4 | Less than $0.005 per share. | ||||||||||||||||||||||||||||||||||||||||||||||||||||||||||||||||||||||||||||||||||
| 5 | Does not reflect the effect of sales charges, if any. | ||||||||||||||||||||||||||||||||||||||||||||||||||||||||||||||||||||||||||||||||||
| 6 | Total returns would have been lower had certain expenses not been reduced during the applicable periods. | ||||||||||||||||||||||||||||||||||||||||||||||||||||||||||||||||||||||||||||||||||
| 7 | Not annualized. | ||||||||||||||||||||||||||||||||||||||||||||||||||||||||||||||||||||||||||||||||||
| 8 | Annualized. | ||||||||||||||||||||||||||||||||||||||||||||||||||||||||||||||||||||||||||||||||||
| Class C Shares Period ended | 1-31-16 | 1 | 7-31-15 | 7-31-14 | 2 | ||||||||||||||||||||||||||||||||||||||||||||||||||||||||||||||||||
| Per share operating performance | |||||||||||||||||||||||||||||||||||||||||||||||||||||||||||||||||||||||
| Net asset value, beginning of period | $13.83 | $13.66 | $13.87 | ||||||||||||||||||||||||||||||||||||||||||||||||||||||||||||||||||||
| Net investment income (loss)3 | — | 4 | (0.04 | ) | (0.01 | ) | |||||||||||||||||||||||||||||||||||||||||||||||||||||||||||||||||
| Net realized and unrealized gain (loss) on investments | (1.73 | ) | 0.95 | (0.20 | ) | ||||||||||||||||||||||||||||||||||||||||||||||||||||||||||||||||||
| Total from investment operations | (1.73 | ) | 0.91 | (0.21 | ) | ||||||||||||||||||||||||||||||||||||||||||||||||||||||||||||||||||
| Less distributions | |||||||||||||||||||||||||||||||||||||||||||||||||||||||||||||||||||||||
| From net realized gain | (0.55 | ) | (0.74 | ) | — | ||||||||||||||||||||||||||||||||||||||||||||||||||||||||||||||||||
| Net asset value, end of period | $11.55 | $13.83 | $13.66 | ||||||||||||||||||||||||||||||||||||||||||||||||||||||||||||||||||||
| Total return (%)5,6 | (12.93 | ) 7 | 6.73 | (1.51 | ) 7 | ||||||||||||||||||||||||||||||||||||||||||||||||||||||||||||||||||
| Ratios and supplemental data | |||||||||||||||||||||||||||||||||||||||||||||||||||||||||||||||||||||||
| Net assets, end of period (in millions) | $1 | $1 | — | 8 | |||||||||||||||||||||||||||||||||||||||||||||||||||||||||||||||||||
| Ratios (as a percentage of average net assets): | |||||||||||||||||||||||||||||||||||||||||||||||||||||||||||||||||||||||
| Expenses before reductions | 1.80 | 9 | 2.60 | 17.11 | 9 | ||||||||||||||||||||||||||||||||||||||||||||||||||||||||||||||||||
| Expenses including reductions | 1.79 | 9 | 2.00 | 2.00 | 9 | ||||||||||||||||||||||||||||||||||||||||||||||||||||||||||||||||||
| Net investment income (loss) | 0.06 | 9 | (0.26 | ) | (0.69 | ) 9 | |||||||||||||||||||||||||||||||||||||||||||||||||||||||||||||||||
| Portfolio turnover (%) | 6 | 20 | 24 | 10 | |||||||||||||||||||||||||||||||||||||||||||||||||||||||||||||||||||
| 1 | Six months ended 1-31-16. Unaudited. | |||||||||||||||||||||||||||||||||||||||||||||||||||||||||||||||||||||||||||||||
| 2 | The inception date for Class C shares is 6-27-14. | |||||||||||||||||||||||||||||||||||||||||||||||||||||||||||||||||||||||||||||||
| 3 | Based on average daily shares outstanding. | |||||||||||||||||||||||||||||||||||||||||||||||||||||||||||||||||||||||||||||||
| 4 | Less than $0.005 per share. | |||||||||||||||||||||||||||||||||||||||||||||||||||||||||||||||||||||||||||||||
| 5 | Does not reflect the effect of sales charges, if any. | |||||||||||||||||||||||||||||||||||||||||||||||||||||||||||||||||||||||||||||||
| 6 | Total returns would have been lower had certain expenses not been reduced during the applicable periods. | |||||||||||||||||||||||||||||||||||||||||||||||||||||||||||||||||||||||||||||||
| 7 | Not annualized. | |||||||||||||||||||||||||||||||||||||||||||||||||||||||||||||||||||||||||||||||
| 8 | Less than $500,000. | |||||||||||||||||||||||||||||||||||||||||||||||||||||||||||||||||||||||||||||||
| 9 | Annualized. | |||||||||||||||||||||||||||||||||||||||||||||||||||||||||||||||||||||||||||||||
| 10 | The portfolio turnover is shown for the period from 8-1-13 to 7-31-14. | |||||||||||||||||||||||||||||||||||||||||||||||||||||||||||||||||||||||||||||||
| Class I Shares Period ended | 1-31-16 | 1 | 7-31-15 | 7-31-14 | 7-31-13 | 7-31-12 | 7-31-11 | 2 | ||||||||||||||||||||||||||||||||||||||||||||||||||||||||||||||||||||||||||||||||||||||||||||||||||||||||||||||
| Per share operating performance | ||||||||||||||||||||||||||||||||||||||||||||||||||||||||||||||||||||||||||||||||||||||||||||||||||||||||||||||||||||||
| Net asset value, beginning of period | $13.92 | $13.68 | $13.17 | $10.30 | $9.46 | $10.00 | ||||||||||||||||||||||||||||||||||||||||||||||||||||||||||||||||||||||||||||||||||||||||||||||||||||||||||||||||
| Net investment income3 | 0.07 | 0.11 | 0.13 | 0.18 | 0.14 | 0.01 | ||||||||||||||||||||||||||||||||||||||||||||||||||||||||||||||||||||||||||||||||||||||||||||||||||||||||||||||||
| Net realized and unrealized gain (loss) on investments | (1.74 | ) | 0.96 | 1.81 | 3.32 | 0.79 | (0.55 | ) | ||||||||||||||||||||||||||||||||||||||||||||||||||||||||||||||||||||||||||||||||||||||||||||||||||||||||||||||
| Total from investment operations | (1.67 | ) | 1.07 | 1.94 | 3.50 | 0.93 | (0.54 | ) | ||||||||||||||||||||||||||||||||||||||||||||||||||||||||||||||||||||||||||||||||||||||||||||||||||||||||||||||
| Less distributions | ||||||||||||||||||||||||||||||||||||||||||||||||||||||||||||||||||||||||||||||||||||||||||||||||||||||||||||||||||||||
| From net investment income | (0.13 | ) | (0.09 | ) | (0.14 | ) | (0.14 | ) | (0.06 | ) | — | |||||||||||||||||||||||||||||||||||||||||||||||||||||||||||||||||||||||||||||||||||||||||||||||||||||||||||
| From net realized gain | (0.55 | ) | (0.74 | ) | (1.29 | ) | (0.49 | ) | (0.03 | ) | — | |||||||||||||||||||||||||||||||||||||||||||||||||||||||||||||||||||||||||||||||||||||||||||||||||||||||||||
| Total distributions | (0.68 | ) | (0.83 | ) | (1.43 | ) | (0.63 | ) | (0.09 | ) | — | |||||||||||||||||||||||||||||||||||||||||||||||||||||||||||||||||||||||||||||||||||||||||||||||||||||||||||
| Net asset value, end of period | $11.57 | $13.92 | $13.68 | $13.17 | $10.30 | $9.46 | ||||||||||||||||||||||||||||||||||||||||||||||||||||||||||||||||||||||||||||||||||||||||||||||||||||||||||||||||
| Total return (%)4 | (12.48 | ) 5 | 7.93 | 15.40 | 35.11 | 9.87 | (5.40 | ) 5 | ||||||||||||||||||||||||||||||||||||||||||||||||||||||||||||||||||||||||||||||||||||||||||||||||||||||||||||||
| Ratios and supplemental data | ||||||||||||||||||||||||||||||||||||||||||||||||||||||||||||||||||||||||||||||||||||||||||||||||||||||||||||||||||||||
| Net assets, end of period (in millions) | $3 | $3 | $2 | $4 | $1 | $1 | ||||||||||||||||||||||||||||||||||||||||||||||||||||||||||||||||||||||||||||||||||||||||||||||||||||||||||||||||
| Ratios (as a percentage of average net assets): | ||||||||||||||||||||||||||||||||||||||||||||||||||||||||||||||||||||||||||||||||||||||||||||||||||||||||||||||||||||||
| Expenses before reductions | 0.79 | 6 | 0.94 | 1.53 | 1.09 | 4.03 | 5.61 | 6 | ||||||||||||||||||||||||||||||||||||||||||||||||||||||||||||||||||||||||||||||||||||||||||||||||||||||||||||||
| Expenses including reductions | 0.78 | 6 | 0.93 | 0.94 | 0.92 | 0.84 | 0.84 | 6 | ||||||||||||||||||||||||||||||||||||||||||||||||||||||||||||||||||||||||||||||||||||||||||||||||||||||||||||||
| Net investment income | 1.10 | 6 | 0.76 | 0.96 | 1.50 | 1.44 | 0.74 | 6 | ||||||||||||||||||||||||||||||||||||||||||||||||||||||||||||||||||||||||||||||||||||||||||||||||||||||||||||||
| Portfolio turnover (%) | 6 | 20 | 24 | 38 | 26 | 5 | ||||||||||||||||||||||||||||||||||||||||||||||||||||||||||||||||||||||||||||||||||||||||||||||||||||||||||||||||
| 1 | Six months ended 1-31-16. Unaudited. | ||||||||||||||||||||||||||||||||||||||||||||||||||||||||||||||||||||||||||||||||||
| 2 | Period from 6-1-11 (commencement of operations) to 7-31-11. | ||||||||||||||||||||||||||||||||||||||||||||||||||||||||||||||||||||||||||||||||||
| 3 | Based on average daily shares outstanding. | ||||||||||||||||||||||||||||||||||||||||||||||||||||||||||||||||||||||||||||||||||
| 4 | Total returns would have been lower had certain expenses not been reduced during the applicable periods. | ||||||||||||||||||||||||||||||||||||||||||||||||||||||||||||||||||||||||||||||||||
| 5 | Not annualized. | ||||||||||||||||||||||||||||||||||||||||||||||||||||||||||||||||||||||||||||||||||
| 6 | Annualized. | ||||||||||||||||||||||||||||||||||||||||||||||||||||||||||||||||||||||||||||||||||
| Class R2 Shares Period ended | 1-31-16 | 1 | 7-31-15 | 2 | ||||||||||||||||||||||||||||||||||||||||||||||
| Per share operating performance | ||||||||||||||||||||||||||||||||||||||||||||||||||
| Net asset value, beginning of period | $13.90 | $13.41 | ||||||||||||||||||||||||||||||||||||||||||||||||
| Net investment income3 | 0.06 | 0.03 | ||||||||||||||||||||||||||||||||||||||||||||||||
| Net realized and unrealized gain (loss) on investments | (1.74 | ) | 0.46 | |||||||||||||||||||||||||||||||||||||||||||||||
| Total from investment operations | (1.68 | ) | 0.49 | |||||||||||||||||||||||||||||||||||||||||||||||
| Less distributions | ||||||||||||||||||||||||||||||||||||||||||||||||||
| From net investment income | (0.11 | ) | — | |||||||||||||||||||||||||||||||||||||||||||||||
| From net realized gain | (0.55 | ) | — | |||||||||||||||||||||||||||||||||||||||||||||||
| Total distributions | (0.66 | ) | — | |||||||||||||||||||||||||||||||||||||||||||||||
| Net asset value, end of period | $11.56 | $13.90 | ||||||||||||||||||||||||||||||||||||||||||||||||
| Total return (%)4 | (12.56 | ) 5 | 3.65 | 5 | ||||||||||||||||||||||||||||||||||||||||||||||
| Ratios and supplemental data | ||||||||||||||||||||||||||||||||||||||||||||||||||
| Net assets, end of period (in millions) | — | 6 | — | 6 | ||||||||||||||||||||||||||||||||||||||||||||||
| Ratios (as a percentage of average net assets): | ||||||||||||||||||||||||||||||||||||||||||||||||||
| Expenses before reductions | 0.94 | 7 | 0.93 | 7 | ||||||||||||||||||||||||||||||||||||||||||||||
| Expenses including reductions | 0.94 | 7 | 0.92 | 7 | ||||||||||||||||||||||||||||||||||||||||||||||
| Net investment income | 0.95 | 7 | 0.67 | 7 | ||||||||||||||||||||||||||||||||||||||||||||||
| Portfolio turnover (%) | 6 | 20 | 8 | |||||||||||||||||||||||||||||||||||||||||||||||
| 1 | Six months ended 1-31-16. Unaudited. | ||||||||||||||||||||||||||||||||||||||||||||||||||||||||||
| 2 | The inception date for Class R2 shares is 3-27-15. | ||||||||||||||||||||||||||||||||||||||||||||||||||||||||||
| 3 | Based on average daily shares outstanding. | ||||||||||||||||||||||||||||||||||||||||||||||||||||||||||
| 4 | Total returns would have been lower had certain expenses not been reduced during the applicable periods. | ||||||||||||||||||||||||||||||||||||||||||||||||||||||||||
| 5 | Not annualized. | ||||||||||||||||||||||||||||||||||||||||||||||||||||||||||
| 6 | Less than $500,000. | ||||||||||||||||||||||||||||||||||||||||||||||||||||||||||
| 7 | Annualized. | ||||||||||||||||||||||||||||||||||||||||||||||||||||||||||
| 8 | The portfolio turnover is shown for the period from 8-1-14 to 7-31-15. | ||||||||||||||||||||||||||||||||||||||||||||||||||||||||||
| Class R4 Shares Period ended | 1-31-16 | 1 | 7-31-15 | 2 | ||||||||||||||||||||||||||||||||||||||||||||||
| Per share operating performance | ||||||||||||||||||||||||||||||||||||||||||||||||||
| Net asset value, beginning of period | $13.90 | $13.41 | ||||||||||||||||||||||||||||||||||||||||||||||||
| Net investment income3 | 0.07 | 0.04 | ||||||||||||||||||||||||||||||||||||||||||||||||
| Net realized and unrealized gain (loss) on investments | (1.73 | ) | 0.45 | |||||||||||||||||||||||||||||||||||||||||||||||
| Total from investment operations | (1.66 | ) | 0.49 | |||||||||||||||||||||||||||||||||||||||||||||||
| Less distributions | ||||||||||||||||||||||||||||||||||||||||||||||||||
| From net investment income | (0.13 | ) | — | |||||||||||||||||||||||||||||||||||||||||||||||
| From net realized gain | (0.55 | ) | — | |||||||||||||||||||||||||||||||||||||||||||||||
| Total distributions | (0.68 | ) | — | |||||||||||||||||||||||||||||||||||||||||||||||
| Net asset value, end of period | $11.56 | $13.90 | ||||||||||||||||||||||||||||||||||||||||||||||||
| Total return (%)4 | (12.47 | ) 5 | 3.65 | 5 | ||||||||||||||||||||||||||||||||||||||||||||||
| Ratios and supplemental data | ||||||||||||||||||||||||||||||||||||||||||||||||||
| Net assets, end of period (in millions) | — | 6 | — | 6 | ||||||||||||||||||||||||||||||||||||||||||||||
| Ratios (as a percentage of average net assets): | ||||||||||||||||||||||||||||||||||||||||||||||||||
| Expenses before reductions | 0.94 | 7 | 0.93 | 7 | ||||||||||||||||||||||||||||||||||||||||||||||
| Expenses including reductions | 0.84 | 7 | 0.82 | 7 | ||||||||||||||||||||||||||||||||||||||||||||||
| Net investment income | 1.05 | 7 | 0.77 | 7 | ||||||||||||||||||||||||||||||||||||||||||||||
| Portfolio turnover (%) | 6 | 20 | 8 | |||||||||||||||||||||||||||||||||||||||||||||||
| 1 | Six months ended 1-31-16. Unaudited. | ||||||||||||||||||||||||||||||||||||||||||||||||||||||||||
| 2 | The inception date for Class R4 shares is 3-27-15. | ||||||||||||||||||||||||||||||||||||||||||||||||||||||||||
| 3 | Based on average daily shares outstanding. | ||||||||||||||||||||||||||||||||||||||||||||||||||||||||||
| 4 | Total returns would have been lower had certain expenses not been reduced during the applicable periods. | ||||||||||||||||||||||||||||||||||||||||||||||||||||||||||
| 5 | Not annualized. | ||||||||||||||||||||||||||||||||||||||||||||||||||||||||||
| 6 | Less than $500,000. | ||||||||||||||||||||||||||||||||||||||||||||||||||||||||||
| 7 | Annualized. | ||||||||||||||||||||||||||||||||||||||||||||||||||||||||||
| 8 | The portfolio turnover is shown for the period from 8-1-14 to 7-31-15. | ||||||||||||||||||||||||||||||||||||||||||||||||||||||||||
| Class R6 Shares Period ended | 1-31-16 | 1 | 7-31-15 | 2 | ||||||||||||||||||||||||||||||||||||||||||||||
| Per share operating performance | ||||||||||||||||||||||||||||||||||||||||||||||||||
| Net asset value, beginning of period | $13.91 | $13.41 | ||||||||||||||||||||||||||||||||||||||||||||||||
| Net investment income3 | 0.08 | 0.05 | ||||||||||||||||||||||||||||||||||||||||||||||||
| Net realized and unrealized gain (loss) on investments | (1.74 | ) | 0.45 | |||||||||||||||||||||||||||||||||||||||||||||||
| Total from investment operations | (1.66 | ) | 0.50 | |||||||||||||||||||||||||||||||||||||||||||||||
| Less distributions | ||||||||||||||||||||||||||||||||||||||||||||||||||
| From net investment income | (0.15 | ) | — | |||||||||||||||||||||||||||||||||||||||||||||||
| From net realized gain | (0.55 | ) | — | |||||||||||||||||||||||||||||||||||||||||||||||
| Total distributions | (0.70 | ) | — | |||||||||||||||||||||||||||||||||||||||||||||||
| Net asset value, end of period | $11.55 | $13.91 | ||||||||||||||||||||||||||||||||||||||||||||||||
| Total return (%)4 | (12.46 | ) 5 | 3.73 | 5 | ||||||||||||||||||||||||||||||||||||||||||||||
| Ratios and supplemental data | ||||||||||||||||||||||||||||||||||||||||||||||||||
| Net assets, end of period (in millions) | — | 6 | — | 6 | ||||||||||||||||||||||||||||||||||||||||||||||
| Ratios (as a percentage of average net assets): | ||||||||||||||||||||||||||||||||||||||||||||||||||
| Expenses before reductions | 0.69 | 7 | 0.68 | 7 | ||||||||||||||||||||||||||||||||||||||||||||||
| Expenses including reductions | 0.67 | 7 | 0.66 | 7 | ||||||||||||||||||||||||||||||||||||||||||||||
| Net investment income | 1.20 | 7 | 0.94 | 7 | ||||||||||||||||||||||||||||||||||||||||||||||
| Portfolio turnover (%) | 6 | 20 | 8 | |||||||||||||||||||||||||||||||||||||||||||||||
| 1 | Six months ended 1-31-16. Unaudited. | ||||||||||||||||||||||||||||||||||||||||||||||||||||||||||
| 2 | The inception date for Class R6 shares is 3-27-15. | ||||||||||||||||||||||||||||||||||||||||||||||||||||||||||
| 3 | Based on average daily shares outstanding. | ||||||||||||||||||||||||||||||||||||||||||||||||||||||||||
| 4 | Total returns would have been lower had certain expenses not been reduced during the applicable periods. | ||||||||||||||||||||||||||||||||||||||||||||||||||||||||||
| 5 | Not annualized. | ||||||||||||||||||||||||||||||||||||||||||||||||||||||||||
| 6 | Less than $500,000. | ||||||||||||||||||||||||||||||||||||||||||||||||||||||||||
| 7 | Annualized. | ||||||||||||||||||||||||||||||||||||||||||||||||||||||||||
| 8 | The portfolio turnover is shown for the period from 8-1-14 to 7-31-15. | ||||||||||||||||||||||||||||||||||||||||||||||||||||||||||
| Class NAV Shares Period ended | 1-31-16 | 1 | 7-31-15 | 7-31-14 | 7-31-13 | 7-31-12 | 2 | ||||||||||||||||||||||||||||||||||||||||||||||||||||||||||||||||||||||||||||||||||||||||||||||||
| Per share operating performance | |||||||||||||||||||||||||||||||||||||||||||||||||||||||||||||||||||||||||||||||||||||||||||||||||||||||
| Net asset value, beginning of period | $13.91 | $13.67 | $13.16 | $10.30 | $8.13 | ||||||||||||||||||||||||||||||||||||||||||||||||||||||||||||||||||||||||||||||||||||||||||||||||||
| Net investment income3 | 0.08 | 0.15 | 0.15 | 0.20 | 0.13 | ||||||||||||||||||||||||||||||||||||||||||||||||||||||||||||||||||||||||||||||||||||||||||||||||||
| Net realized and unrealized gain (loss) on investments | (1.74 | ) | 0.96 | 1.82 | 3.31 | 2.13 | |||||||||||||||||||||||||||||||||||||||||||||||||||||||||||||||||||||||||||||||||||||||||||||||||
| Total from investment operations | (1.66 | ) | 1.11 | 1.97 | 3.51 | 2.26 | |||||||||||||||||||||||||||||||||||||||||||||||||||||||||||||||||||||||||||||||||||||||||||||||||
| Less distributions | |||||||||||||||||||||||||||||||||||||||||||||||||||||||||||||||||||||||||||||||||||||||||||||||||||||||
| From net investment income | (0.15 | ) | (0.13 | ) | (0.17 | ) | (0.16 | ) | (0.06 | ) | |||||||||||||||||||||||||||||||||||||||||||||||||||||||||||||||||||||||||||||||||||||||||||||
| From net realized gain | (0.55 | ) | (0.74 | ) | (1.29 | ) | (0.49 | ) | (0.03 | ) | |||||||||||||||||||||||||||||||||||||||||||||||||||||||||||||||||||||||||||||||||||||||||||||
| Total distributions | (0.70 | ) | (0.87 | ) | (1.46 | ) | (0.65 | ) | (0.09 | ) | |||||||||||||||||||||||||||||||||||||||||||||||||||||||||||||||||||||||||||||||||||||||||||||
| Net asset value, end of period | $11.55 | $13.91 | $13.67 | $13.16 | $10.30 | ||||||||||||||||||||||||||||||||||||||||||||||||||||||||||||||||||||||||||||||||||||||||||||||||||
| Total return (%)4 | (12.46 | ) 5 | 8.23 | 15.69 | 35.33 | 27.86 | 5 | ||||||||||||||||||||||||||||||||||||||||||||||||||||||||||||||||||||||||||||||||||||||||||||||||
| Ratios and supplemental data | |||||||||||||||||||||||||||||||||||||||||||||||||||||||||||||||||||||||||||||||||||||||||||||||||||||||
| Net assets, end of period (in millions) | $1,104 | $1,289 | $1,201 | $924 | $789 | ||||||||||||||||||||||||||||||||||||||||||||||||||||||||||||||||||||||||||||||||||||||||||||||||||
| Ratios (as a percentage of average net assets): | |||||||||||||||||||||||||||||||||||||||||||||||||||||||||||||||||||||||||||||||||||||||||||||||||||||||
| Expenses before reductions | 0.68 | 6 | 0.67 | 0.68 | 0.70 | 0.75 | 6 | ||||||||||||||||||||||||||||||||||||||||||||||||||||||||||||||||||||||||||||||||||||||||||||||||
| Expenses including reductions | 0.67 | 6 | 0.66 | 0.67 | 0.69 | 0.75 | 6 | ||||||||||||||||||||||||||||||||||||||||||||||||||||||||||||||||||||||||||||||||||||||||||||||||
| Net investment income | 1.21 | 6 | 1.10 | 1.16 | 1.69 | 1.40 | 6 | ||||||||||||||||||||||||||||||||||||||||||||||||||||||||||||||||||||||||||||||||||||||||||||||||
| Portfolio turnover (%) | 6 | 20 | 24 | 38 | 26 | 7 | |||||||||||||||||||||||||||||||||||||||||||||||||||||||||||||||||||||||||||||||||||||||||||||||||
| 1 | Six months ended 1-31-16. Unaudited. | ||||||||||||||||||||||||||||||||||||||||||||||||||||||||||||||||||||||||||||||||||
| 2 | The inception date for Class NAV shares is 8-23-11. | ||||||||||||||||||||||||||||||||||||||||||||||||||||||||||||||||||||||||||||||||||
| 3 | Based on average daily shares outstanding. | ||||||||||||||||||||||||||||||||||||||||||||||||||||||||||||||||||||||||||||||||||
| 4 | Total returns would have been lower had certain expenses not been reduced during the applicable periods. | ||||||||||||||||||||||||||||||||||||||||||||||||||||||||||||||||||||||||||||||||||
| 5 | Not annualized. | ||||||||||||||||||||||||||||||||||||||||||||||||||||||||||||||||||||||||||||||||||
| 6 | Annualized. | ||||||||||||||||||||||||||||||||||||||||||||||||||||||||||||||||||||||||||||||||||
| 7 | The portfolio turnover is shown for the period from 8-1-11 to 7-31-12. | ||||||||||||||||||||||||||||||||||||||||||||||||||||||||||||||||||||||||||||||||||
Note 1 — Organization
John Hancock Fundamental Large Cap Value Fund (the fund) is a series of John Hancock Funds II (the Trust), an open-end management investment company organized as a Massachusetts business trust and registered under the Investment Company Act of 1940, as amended (the 1940 Act). The investment objective of the fund is to seek long-term capital appreciation.
The fund may offer multiple classes of shares. The shares currently offered are detailed in the Statement of assets and liabilities. Class A and Class C shares are offered to all investors. Class I shares are offered to institutions and certain investors. Class R2 and Class R4 shares are available only to certain retirement plans. Class R6 shares are available only to certain retirement plans, institutions and other investors. Class NAV shares are offered to John Hancock affiliated funds of funds and certain 529 plans. Shareholders of each class have exclusive voting rights to matters that affect that class. The distribution and service fees, if any, and transfer agent fees for each class may differ.
Note 2 — Significant accounting policies
The financial statements have been prepared in conformity with accounting principles generally accepted in the United States of America (US GAAP), which require management to make certain estimates and assumptions as of the date of the financial statements. Actual results could differ from those estimates and those differences could be significant. The fund qualifies as an investment company under Topic 946 of Accounting Standards Codification of US GAAP.
Events or transactions occurring after the end of the fiscal period through the date that the financial statements were issued have been evaluated in the preparation of the financial statements. The following summarizes the significant accounting policies of the fund.
Security valuation. Investments are stated at value as of the close of regular trading on the New York Stock Exchange (NYSE), normally at 4:00 p.m., Eastern Time. In order to value the securities, the fund uses the following valuation techniques: Equity securities held by the fund are valued at the last sale price or official closing price on the exchange or principal market where the security was acquired or most likely will be sold. In the event there were no sales during the day or closing prices are not available, the securities are valued using the last available bid price. Foreign securities and currencies are valued in U.S. dollars, based on foreign currency exchange rates supplied by an independent pricing vendor. Securities that trade only in the over-the-counter (OTC) market are valued using bid prices.
Other portfolio securities and assets, for which reliable market quotations are not readily available, are valued at fair value as determined in good faith by the fund's Pricing Committee following procedures established by the Board of Trustees. The frequency with which these fair valuation procedures are used cannot be predicted and fair value of securities may differ significantly from the value that would have been used had a ready market for such securities existed. Trading in foreign securities may be completed before the daily close of trading on the NYSE. Significant events at the issuer or market level may affect the values of securities between the time when the valuation of the securities is generally determined and the close of the NYSE. If a significant event occurs, these securities may be fair valued, as determined in good faith by the fund's Pricing Committee, following procedures established by the Board of Trustees. The fund uses fair value adjustment factors provided by an independent pricing vendor to value certain foreign securities in order to adjust for events that may occur between the close of foreign exchanges or markets and the close of the NYSE.
The fund uses a three-tier hierarchy to prioritize the pricing assumptions, referred to as inputs, used in valuation techniques to measure fair value. Level 1 includes securities valued using quoted prices in active markets for identical securities. Level 2 includes securities valued using other significant observable inputs. Observable inputs may include quoted prices for similar securities, interest rates, prepayment speeds and credit risk. Prices for securities valued using these inputs are received from independent pricing vendors and brokers and are based on an evaluation of the inputs described. Level 3 includes securities valued using significant unobservable inputs when market prices are not readily available or reliable, including the fund's own assumptions in determining the fair value of investments. Factors used in determining value may include market or issuer specific events or trends, changes in interest rates and credit quality. The inputs or methodology used for valuing
securities are not necessarily an indication of the risks associated with investing in those securities. Changes in valuation techniques and related inputs may result in transfers into or out of an assigned level within the disclosure hierarchy.
The following is a summary of the values by input classification of the fund's investments as of January 31, 2016, by major security category or type:
| Total value at 1-31-16 |
Level 1 quoted price |
Level 2 significant observable inputs |
Level 3 significant unobservable inputs |
||
| Common stocks | |||||
| Consumer discretionary | $199,532,989 | $160,772,955 | $38,760,034 | — | |
| Consumer staples | 110,118,714 | 67,519,739 | 42,598,975 | — | |
| Energy | 89,600,584 | 89,600,584 | — | — | |
| Financials | 352,958,084 | 352,958,084 | — | — | |
| Health care | 76,141,507 | 76,141,507 | — | — | |
| Industrials | 100,086,302 | 100,086,302 | — | — | |
| Information technology | 139,014,696 | 124,595,788 | 14,418,908 | — | |
| Materials | 28,500,313 | 28,500,313 | — | — | |
| Short-term investments | 30,049,000 | — | 30,049,000 | — | |
| Total investments in securities | $1,126,002,189 | $1,000,175,272 | $125,826,917 | — | |
Repurchase agreements. The fund may enter into repurchase agreements. When the fund enters into a repurchase agreement, it receives collateral that is held in a segregated account by the fund's custodian or for tri-party repurchase agreements, collateral is held at a third-party custodian bank in a segregated account for the benefit of the fund. The collateral amount is marked-to-market and monitored on a daily basis to ensure that the collateral held is in an amount not less than the principal amount of the repurchase agreement plus any accrued interest. Collateral received by the fund for repurchase agreements is disclosed in the Fund's investments as part of the caption related to the repurchase agreement.
Repurchase agreements are typically governed by the terms and conditions of the Master Repurchase Agreement and/or Global Master Repurchase Agreement (collectively, MRA). Upon an event of default, the non-defaulting party may close out all transactions traded under the MRA and net amounts owed. Absent an event of default, assets and liabilities resulting from repurchase agreements are not offset in the Statement of assets and liabilities. In the event of a default by the counterparty, realization of the collateral proceeds could be delayed, during which time the collateral value may decline or the counterparty may have insufficient assets to pay back claims resulting from close-out of the transactions.
Security transactions and related investment income. Investment security transactions are accounted for on a trade date plus one basis for daily net asset value calculations. However, for financial reporting purposes, investment transactions are reported on trade date. Interest income is accrued as earned. Dividend income is recorded on the ex-date, except for dividends of foreign securities where the dividend may not be known until after the ex-date. In those cases, dividend income, net of withholding taxes, is recorded when the fund becomes aware of the dividends. Foreign taxes are provided for based on the fund's understanding of the tax rules and rates that exist in the foreign markets in which it invests. Gains and losses on securities sold are determined on the basis of identified cost and may include proceeds from litigation.
Foreign currency translation. Assets, including investments and liabilities denominated in foreign currencies, are translated into U.S. dollar values each day at the prevailing exchange rate. Purchases and sales of securities, income and expenses are translated into U.S. dollars at the prevailing exchange rate on the date of the transaction. The effect of changes in foreign currency exchange rates on the value of securities is reflected as a component of the realized and unrealized gains (losses) on investments.
Funds that invest internationally generally carry more risk than funds that invest strictly in U.S. securities. Risks can result from differences in economic and political conditions, regulations, market practices (including higher transaction costs),
accounting standards and other factors. Foreign investments are also subject to a decline in the value of a foreign currency versus the U.S. dollar, which reduces the dollar value of securities denominated in that currency.
Foreign taxes. The fund may be subject to withholding tax on income and/or capital gains or repatriation taxes imposed by certain countries in which the fund invests. Taxes are accrued based upon investment income, realized gains or unrealized appreciation.
Line of credit. The fund may borrow from banks for temporary or emergency purposes, including meeting redemption requests that otherwise might require the untimely sale of securities. Pursuant to the fund's custodian agreement, the custodian may loan money to the fund to make properly authorized payments. The fund is obligated to repay the custodian for any overdraft, including any related costs or expenses. The custodian may have a lien, security interest or security entitlement in any fund property that is not otherwise segregated or pledged, to the extent of any overdraft, and to the maximum extent permitted by law.
The fund and other affiliated funds have entered into a syndicated line of credit agreement, with Citibank, N.A. as the administrative agent, that enables them to participate in a $750 million unsecured committed line of credit. A commitment fee, payable at the end of each calendar quarter, based on the average daily unused portion of the effective line of credit, is charged to each participating fund on a pro rata basis and is reflected in Other expenses on the Statement of operations. Commitment fees for the six months ended January 31, 2016 were $653. For the six months ended January 31, 2016, the fund had no borrowings under the line of credit.
Expenses. Within the John Hancock group of funds complex, expenses that are directly attributable to an individual fund are allocated to such fund. Expenses that are not readily attributable to a specific fund are allocated among all funds in an equitable manner, taking into consideration, among other things, the nature and type of expense and the fund's relative net assets. Expense estimates are accrued in the period to which they relate and adjustments are made when actual amounts are known.
Class allocations. Income, common expenses and realized and unrealized gains (losses) are determined at the fund level and allocated daily to each class of shares based on the net assets of the class. Class-specific expenses, such as distribution and service fees, if any, and transfer agent fees, are calculated daily for each class, based on the net asset value of the class and the applicable specific expense rates.
Federal income taxes. The fund intends to continue to qualify as a regulated investment company by complying with the applicable provisions of the Internal Revenue Code and will not be subject to federal income tax on taxable income that is distributed to shareholders. Therefore, no federal income tax provision is required.
As of July 31, 2015, the fund had no uncertain tax positions that would require financial statement recognition, derecognition or disclosure. The fund's federal tax returns are subject to examination by the Internal Revenue Service for a period of three years.
Distribution of income and gains. Distributions to shareholders from net investment income and net realized gains, if any, are recorded on the ex-date. The fund generally declares and pays dividends and capital gain distributions, if any, annually.
Distributions paid by the fund with respect to each class of shares are calculated in the same manner, at the same time and in the same amount, except for the effect of class level expenses that may be applied differently to each class.
Such distributions, on a tax basis, are determined in conformity with income tax regulations, which may differ from US GAAP.
Capital accounts within the financial statements are adjusted for permanent book-tax differences. These adjustments have no impact on net assets or the results of operations. Temporary book-tax differences, if any, will reverse in a subsequent period. Book-tax differences are primarily attributable to foreign currency transactions, partnerships and wash sale loss deferrals.
Note 3 — Guarantees and indemnifications
Under the Trust's organizational documents, its Officers and Trustees are indemnified against certain liabilities arising out of the performance of their duties to the Trust, including the fund. Additionally, in the normal course of business, the fund enters into contracts with service providers that contain general indemnification clauses. The fund's maximum exposure under these arrangements is unknown, as this would involve future claims that may be made against the fund that have not yet occurred. The risk of material loss from such claims is considered remote.
Note 4 — Fees and transactions with affiliates
John Hancock Advisers, LLC (the Advisor) serves as investment advisor for the fund. John Hancock Funds, LLC (the Distributor), an affiliate of the Advisor, serves as principal underwriter of the fund. The Advisor and the Distributor are indirect, wholly owned subsidiaries of Manulife Financial Corporation (MFC).
Management fee. The fund has an investment management agreement with the Advisor under which the fund pays a daily management fee to the Advisor equivalent, on an annual basis, to the sum of: a) 0.70% of the first $500 million of the fund's aggregate daily net assets together with the net assets of Fundamental Value Trust and Fundamental Large Cap Value Trust, both series of John Hancock Variable Insurance Trust (combined aggregate average daily net assets); (b) 0.65% of the next $500 million of the combined aggregate average daily net assets; and (c) 0.60% of the combined aggregate average daily net assets in excess of $1 billion. The Advisor has a subadvisory agreement with John Hancock Asset Management a division of Manulife Asset Management (US) LLC, an indirectly owned subsidiary of MFC and an affiliate of the Advisor. The fund is not responsible for payment of the subadvisory fees.
The Advisor has contractually agreed to waive a portion of its management fee and/or reimburse expenses for certain funds of the John Hancock group of funds complex, including the fund (the participating portfolios). This waiver is based upon aggregate net assets of all the participating portfolios. The amount of the reimbursement is calculated daily and allocated among all the participating portfolios in proportion to the daily net assets of each fund. During the six months ended January 31, 2016, this waiver amounted to 0.01% of the fund's average net assets. This arrangement may be amended or terminated at any time by the Advisor upon notice to the fund and with the approval of the Board of Trustees.
Effective December 1, 2015, the Advisor voluntarily agreed to reduce its management fee for the fund, or if necessary make payment to the fund, in an amount equal to the amount by which the expenses of the fund exceed 0.20% of the average annual net assets (on an annualized basis) of the fund. For purposes of this agreement, "expenses of the fund" means all fund expenses, excluding taxes, brokerage commissions, interest expense, litigation and indemnification expenses and other extraordinary expenses not incurred in the ordinary course of the fund's business, advisory fees, Rule 12b-1 fees, transfer agency fees and service fees, underlying fund expenses and short dividend expense. This agreement will continue in effect until terminated at any time by the Advisor on notice to the fund.
Prior to December 1, 2015, the Advisor contractually agreed to waive all or a portion of its management fee and reimburse or pay operating expenses of the fund to the extent necessary to maintain the total operating expenses at 1.30%,2.00% and 0.94% for Class A, Class C and Class I shares, respectively, excluding certain expenses such as taxes, brokerage commissions, interest expense, litigation and indemnification expenses and other extraordinary expenses not incurred in the ordinary course of the fund's business.
The Advisor has contractually agreed to waive and/or reimburse all class-specific expenses for Class R6 shares of the fund to the extent they exceed 0.00% of average annual net assets attributable to Class R6 shares. This waiver expires on November 30, 2016, unless renewed by mutual agreement of the fund and the Advisor based upon a determination that this is appropriate under the circumstances at that time.
The expense reductions described above amounted to the following for the six months ended January 31, 2016:
| Class | Expense reduction | Class | Expense reduction | |||||||||||
| Class A | $599 | Class R4 | $4 | |||||||||||
| Class C | 44 | Class R6 | 18 |
| Class | Expense reduction | Class | Expense reduction | |||||||||||
| Class I | 108 | Class NAV | 44,817 | |||||||||||
| Class R2 | 4 | Total | $45,594 |
The investment management fees, including the impact of the waivers and reimbursements as described above, incurred for the six months ended January 31, 2016 were equivalent to a net annual effective rate of 0.62%of the fund's average daily net assets.
Accounting and legal services. Pursuant to a service agreement, the fund reimburses the Advisor for all expenses associated with providing the administrative, financial, legal, accounting and recordkeeping services to the fund, including the preparation of all tax returns, periodic reports to shareholders and regulatory reports, among other services. These expenses are allocated to each share class based on its relative net assets at the time the expense was incurred. These accounting and legal services fees incurred for the six months ended January 31, 2016 amounted to an annual rate of 0.01% of the fund's average daily net assets.
Distribution and service plans. The fund has a distribution agreement with the Distributor. The fund has adopted distribution and service plans with respect to Class A, Class C, Class R2 and Class R4 shares pursuant to Rule 12b-1 under the 1940 Act, to pay the Distributor for services provided as the distributor of shares of the fund. In addition, under a service plan for Class R2 and Class R4, the fund pays for certain other services. The fund may pay up to the following contractual rates of distribution and service fees under these arrangements, expressed as an annual percentage of average daily net assets for each class of the fund's shares.
| Class | Rule 12b-1 fee | Service fee |
| Class A | 0.30% | — |
| Class C | 1.00% | — |
| Class R2 | 0.25% | 0.25% |
| Class R4 | 0.25% | 0.10% |
The fund's Distributor has contractually agreed to waive 0.10% of Rule 12b-1 fees for Class R4 shares. The current waiver agreement expires on November 30, 2016, unless renewed by mutual agreement of the fund and the Distributor based upon a determination that this is appropriate under the circumstances at the time. This contractual waiver amounted to $49 for Class R4 shares for the six months ended January 31, 2016.
Sales charges. Class A shares are assessed up-front sales charges, which resulted in payments to the Distributor amounting to $32,153 for the six months ended January 31, 2016. Of this amount, $5,217 was retained and used for printing prospectuses, advertising, sales literature and other purposes, $26,849 was paid as sales commissions to broker-dealers and $87 was paid as sales commissions to sales personnel of Signator Investors, Inc., a broker-dealer affiliate of the Advisor.
Class A and Class C shares may be subject to contingent deferred sales charges (CDSCs). Certain Class A shares that are acquired through purchases of $1 million or more and are redeemed within one year of purchase are subject to a 1.00% sales charge. Class C shares that are redeemed within one year of purchase are subject to a 1.00% CDSC. CDSCs are applied to the lesser of the current market value at the time of redemption or the original purchase cost of the shares being redeemed. Proceeds from CDSCs are used to compensate the Distributor for providing distribution-related services in connection with the sale of these shares. During the six months ended January 31, 2016, there were no CDSCs received by the Distributor for Class A and Class C shares.
Transfer agent fees. The fund has a transfer agent agreement with John Hancock Signature Services, Inc. (Signature Services), an affiliate of the Advisor. The transfer agent fees paid to Signature Services are determined based on the cost to Signature Services (Signature Services Cost) of providing recordkeeping services. It also includes out-of-pocket expenses, including payments made to third-parties for recordkeeping services provided to their clients who invest in one or more John Hancock funds. In addition, Signature Services Cost may be reduced by certain fees that Signature Services receives in
connection with retirement and small accounts. Signature Services Cost is calculated monthly and allocated, as applicable, to five categories of share classes: Retail Share and Institutional Share Classes of Non-Municipal Bond Funds, Class R6 Shares, Retirement Share Classes and Municipal Bond Share Classes. Within each of these categories, the applicable costs are allocated to the affected John Hancock affiliated funds and/or classes, based on the relative average daily net assets.
Class level expenses. Class level expenses for the six months ended January 31, 2016 were:
| Class | Distribution and service fees | Transfer agent fees |
| Class A | $24,121 | $9,893 |
| Class C | 5,952 | 732 |
| Class I | — | 1,584 |
| Class R2 | 124 | 8 |
| Class R4 | 123 | 8 |
| Class R6 | — | 12 |
| Total | $30,320 | $12,237 |
Trustee expenses. The fund compensates each Trustee who is not an employee of the Advisor or its affiliates. The costs of paying Trustee compensation and expenses are allocated to each fund based on its net assets relative to other funds within the John Hancock group of funds complex.
Note 5 — Fund share transactions
Transactions in fund shares for the six months ended January 31, 2016 and for the year ended July 31, 2015 were as follows:
| Six months ended 1-31-16 | Year ended 7-31-15 | |||||||||||||||||||||||||
| Shares | Amount | Shares | Amount | |||||||||||||||||||||||
| Class A shares | ||||||||||||||||||||||||||
| Sold | 279,184 | $3,610,556 | 816,272 | $11,285,885 | ||||||||||||||||||||||
| Distributions reinvested | 60,618 | 778,341 | 64,207 | 873,211 | ||||||||||||||||||||||
| Repurchased | (168,840 | ) | (2,203,728 | ) | (573,720 | ) | (7,788,795 | ) | ||||||||||||||||||
| Net increase | 170,962 | $2,185,169 | 306,759 | $4,370,301 | ||||||||||||||||||||||
| Class C shares | ||||||||||||||||||||||||||
| Sold | 30,739 | $408,174 | 77,399 | $1,064,817 | ||||||||||||||||||||||
| Distributions reinvested | 4,059 | 52,284 | 2,259 | 30,861 | ||||||||||||||||||||||
| Repurchased | (9,496 | ) | (118,212 | ) | (19,511 | ) | (266,837 | ) | ||||||||||||||||||
| Net increase | 25,302 | $342,246 | 60,147 | $828,841 | ||||||||||||||||||||||
| Class I shares | ||||||||||||||||||||||||||
| Sold | 35,393 | $457,220 | 447,953 | $6,299,124 | ||||||||||||||||||||||
| Distributions reinvested | 12,087 | 155,687 | 31,281 | 427,298 | ||||||||||||||||||||||
| Repurchased | (42,042 | ) | (529,201 | ) | (435,918 | ) | (5,796,325 | ) | ||||||||||||||||||
| Net increase | 5,438 | $83,706 | 43,316 | $930,097 | ||||||||||||||||||||||
| Class R2 shares1 | ||||||||||||||||||||||||||
| Sold | 7,214 | $83,780 | 7,457 | $100,000 | ||||||||||||||||||||||
| Distributions reinvested | 10 | 124 | — | — | ||||||||||||||||||||||
| Net increase | 7,224 | $83,904 | 7,457 | $100,000 | ||||||||||||||||||||||
| Class R4 shares1 | ||||||||||||||||||||||||||
| Sold | — | — | 7,457 | $100,000 | ||||||||||||||||||||||
| Net increase | — | — | 7,457 | $100,000 | ||||||||||||||||||||||
| Six months ended 1-31-16 | Year ended 7-31-15 | |||||||||||||||||||||||||
| Shares | Amount | Shares | Amount | |||||||||||||||||||||||
| Class R6 shares1 | ||||||||||||||||||||||||||
| Sold | 1,098 | $14,050 | 11,162 | $150,828 | ||||||||||||||||||||||
| Distributions reinvested | 233 | 3,000 | — | — | ||||||||||||||||||||||
| Net increase | 1,331 | $17,050 | 11,162 | $150,828 | ||||||||||||||||||||||
| Class NAV shares | ||||||||||||||||||||||||||
| Sold | 3,891,867 | $49,972,374 | 9,806,232 | $133,060,641 | ||||||||||||||||||||||
| Distributions reinvested | 4,823,368 | 62,076,750 | 6,125,618 | 83,492,172 | ||||||||||||||||||||||
| Repurchased | (5,887,822 | ) | (79,594,552 | ) | (11,032,118 | ) | (153,672,479 | ) | ||||||||||||||||||
| Net increase | 2,827,413 | $32,454,572 | 4,899,732 | $62,880,334 | ||||||||||||||||||||||
| Total net increase | 3,037,670 | $35,166,647 | 5,336,030 | $69,360,401 | ||||||||||||||||||||||
1. The inception date for Class R2, Class R4 and Class R6 shares is 3-27-15.
Affiliates of the fund owned 97%, 100%, 60% and 100% of shares of beneficial interest of Class R2, Class R4, Class R6 and Class NAV, respectively, on January 31, 2016.
Note 6 — Purchase and sale of securities
Purchases and sales of securities, other than short-term investments, amounted to $69,557,577 and $104,842,976, respectively, for the six months ended January 31, 2016.
Note 7 — Industry or sector risk
The fund may invest a large percentage of its assets in one or more particular industries or sectors of the economy. If a large percentage of the fund's assets are economically tied to a single or small number of industries or sectors of the economy, the fund will be less diversified than a more broadly diversified fund, and it may cause the fund to underperform if that industry or sector underperforms. In addition, focusing on a particular industry or sector may make the fund's net asset value more volatile. Further, a fund that invests in particular industries or sectors is particularly susceptible to the impact of market, economic, regulatory and other factors affecting those industries or sectors.
Note 8 — Investment by affiliated funds
Certain investors in the fund are affiliated funds that are managed by the Advisor and its affiliates. The affiliated funds do not invest in the fund for the purpose of exercising management or control; however, this investment may represent a significant portion of the fund's net assets. At January 31, 2016, funds within the John Hancock group of funds complex held 98.2% of the fund's net assets. The following funds had an affiliate ownership of 5% or more of the fund's net assets:
| Fund | Affiliate concentration |
| John Hancock Funds II Lifestyle Growth Fund | 35.0% |
| John Hancock Funds II Lifestyle Balanced Fund | 26.1% |
| John Hancock Funds II Lifestyle Aggressive Fund | 14.3% |
| John Hancock Funds II Lifestyle Moderate Fund | 10.4% |
|
Trustees James M. Oates, Chairperson Officers Andrew G. Arnott John J. Danello Francis V. Knox, Jr. Charles A. Rizzo Salvatore Schiavone |
Investment advisor John Hancock Advisers, LLC Subadvisor John Hancock Asset Management a division of Manulife Asset Management (US) LLC Principal distributor John Hancock Funds, LLC Custodian State Street Bank and Trust Company Transfer agent John Hancock Signature Services, Inc. Legal counsel K&L Gates LLP |
*Member of the Audit Committee
†Non-Independent Trustee
The fund's proxy voting policies and procedures, as well as the fund proxy voting record for the most recent twelve-month period ended June 30, are available free of charge on the Securities and Exchange Commission (SEC) website at sec.gov or on our website.
The fund's complete list of portfolio holdings, for the first and third fiscal quarters, is filed with the SEC on Form N-Q. The fund's Form N-Q is available on our website and the SEC's website, sec.gov, and can be reviewed and copied (for a fee) at the SEC's Public Reference Room in Washington, DC. Call 800-SEC-0330 to receive information on the operation of the SEC's Public Reference Room.
We make this information on your fund, as well as monthly portfolio holdings, and other fund details available on our website at jhinvestments.com or by calling 800-225-5291.
| You can also contact us: | |||
| 800-225-5291 jhinvestments.com |
Regular mail: John Hancock Signature Services, Inc. |
Express mail: John Hancock Signature Services, Inc. |
|
John Hancock family of funds
|
DOMESTIC EQUITY FUNDS Balanced Blue Chip Growth Classic Value Disciplined Value Disciplined Value Mid Cap Equity Income Fundamental All Cap Core Fundamental Large Cap Core Fundamental Large Cap Value New Opportunities Select Growth Small Cap Equity Small Cap Value Small Company Strategic Growth U.S. Equity U.S. Global Leaders Growth Value Equity GLOBAL AND INTERNATIONAL EQUITY FUNDS Disciplined Value International Emerging Markets Emerging Markets Equity Global Equity Global Shareholder Yield Greater China Opportunities International Core International Growth International Small Company International Value Equity |
INCOME FUNDS Bond California Tax-Free Income Core High Yield Emerging Markets Debt Floating Rate Income Focused High Yield Global Income Government Income High Yield Municipal Bond Income Investment Grade Bond Money Market Short Duration Credit Opportunities Spectrum Income Strategic Income Opportunities Tax-Free Bond ALTERNATIVE AND SPECIALTY FUNDS Absolute Return Currency Alternative Asset Allocation Enduring Assets Financial Industries Global Absolute Return Strategies Global Conservative Absolute Return Global Real Estate Natural Resources Redwood Regional Bank Seaport Technical Opportunities |
A fund's investment objectives, risks, charges, and expenses should be considered carefully before investing. The prospectus contains this and other important information about the fund. To obtain a prospectus, contact your financial professional, call John Hancock Investments at 800-225-5291, or visit our website at jhinvestments.com. Please read the prospectus carefully before investing or sending money.
|
ASSET ALLOCATION Income Allocation Fund Lifestyle Aggressive Portfolio Lifestyle Balanced Portfolio Lifestyle Conservative Portfolio Lifestyle Growth Portfolio Lifestyle Moderate Portfolio Retirement Choices Portfolios (2010-2055) Retirement Living Portfolios (2010-2055) Retirement Living II Portfolios (2010-2055) EXCHANGE-TRADED FUNDS John Hancock Multifactor Consumer Discretionary ETF John Hancock Multifactor Financials ETF John Hancock Multifactor Healthcare ETF John Hancock Multifactor Large Cap ETF John Hancock Multifactor Mid Cap ETF John Hancock Multifactor Technology ETF CLOSED-END FUNDS Financial Opportunities Hedged Equity & Income Income Securities Trust Investors Trust Preferred Income Preferred Income II Preferred Income III Premium Dividend Tax-Advantaged Dividend Income Tax-Advantaged Global Shareholder Yield |
"As an investment firm,
upholding the proud
tradition of John Hancock
comes down to one thing:
putting shareholders
first. We believe that if
our shareholders are
successful, then we will
be successful."
Andrew G. Arnott
President and Chief Executive Officer
John Hancock Investments
John Hancock Multifactor ETF shares are bought and sold at market
price (not NAV), and are not individually redeemed
from the fund. Brokerage commissions will reduce returns.
John Hancock ETFs are distributed by Foreside Fund Services, LLC, and
are subadvised by Dimensional Fund Advisors LP.
Foreside is not affiliated with John Hancock Funds, LLC or
Dimensional Fund Advisors LP.
Dimensional Fund Advisors LP receives compensation from John Hancock
in connection with licensing rights to the
John Hancock Dimensional indexes. Dimensional Fund Advisors LP does
not sponsor, endorse, or sell, and makes no
representation as to the advisability of investing in, John Hancock
Multifactor ETFs.
John Hancock Investments
A trusted brand
John Hancock Investments is a premier asset manager representing
one of America's most trusted brands, with a heritage of financial
stewardship dating back to 1862. Helping our shareholders pursue
their financial goals is at the core of everything we do. It's why we
support the role of professional financial advice and operate with the
highest standards of conduct and integrity.
A better way to invest
We build funds based on investor needs, then search the world to find
proven portfolio teams with specialized expertise in those strategies.
As a manager of managers, we apply vigorous oversight to ensure that
they continue to meet our uncompromising standards and serve the
best interests of our shareholders.
Results for investors
Our unique approach to asset management enables us to provide
a diverse set of investments backed by some of the world's best
managers, along with strong risk-adjusted returns across asset classes.
|
|
John Hancock Funds, LLC n Member FINRA, SIPC 601 Congress Street n Boston, MA 02210-2805 800-225-5291 n jhinvestments.com |
|
| This report is for the information of the shareholders of John Hancock Fundamental Large Cap Value Fund. It is not authorized for distribution to prospective investors unless preceded or accompanied by a prospectus. | ||
| MF274536 | 374SA 1/16 3/16 |
|
John Hancock
Diversified Strategies Fund
Semiannual report 1/31/16
A message to shareholders
Dear shareholder,
The six-month period has been a challenging time for all investors. Oil prices, having already dropped precipitously, continued to slide in the back half of 2015, and by January oil frequently traded at multi-year lows. Concerns about slowing global growth added to negative investor psychology, and stock prices fell steeply around the world. Stocks were not the only investment that faced headwinds; all risk assets struggled over the past six months and these types of declines are unsettling.
Although volatility returned in force to the markets, much of the global economic picture continues to move in the right direction. In December, the U.S. Federal Reserve raised short-term interest rates for the first time in nine years on the evidence that the persistent strength in the labor markets warranted a somewhat less accommodative stance. Central banks outside of the United States continue to signal that they would take action to support economies and markets.
At John Hancock Investments, portfolio risk management is a critical part of our role as an asset manager, and our dedicated risk team is focused on these issues every day. We continually strive for new ways to analyze potential risks and have liquidity tools in place, such as a credit facility and an interfund lending program. In times like these, your best resource is your financial advisor, who can ensure your portfolio is sufficiently diversified to meet your long-term objectives and to withstand the inevitable bumps along the way.
On behalf of everyone at John Hancock Investments, I'd like to take this opportunity to thank you for the continued trust you've placed in us.
Sincerely,
Andrew G. Arnott
President and Chief Executive Officer
John Hancock Investments
This commentary reflects the CEO's views as of January 31, 2016. They are subject to change at any time. All investments entail risks, including the possible loss of principal. For more up-to-date information, you can visit our website at jhinvestments.com.
John Hancock
Diversified Strategies Fund
Portfolio summary
INVESTMENT OBJECTIVE
The fund seeks long-term total return.
PORTFOLIO COMPOSITION AS OF 1/31/16 (%)
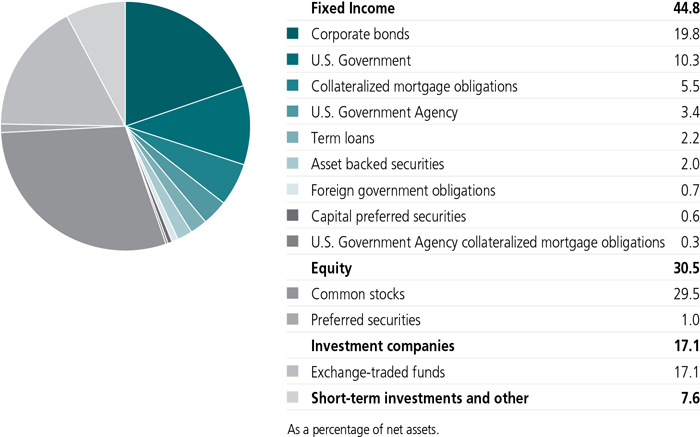
A note about risks
A fund concentrated in one sector or that holds a limited number of securities may fluctuate more than a fund that invests in a wider variety of sectors. Stock prices can be volatile and are affected by both general economic conditions and the financial prospects of individual companies. Large company stocks could fall out of favor. The stock prices of midsize and small companies can change more frequently and dramatically than those of large companies. Fixed-income investments are subject to interest-rate and credit-rate risk; their value will normally decline as interest rates rise or if a creditor, grantor, or counterparty is unable or unwilling to make principal, interest, or settlement payments. Foreign investing, especially in emerging markets, has additional risks, such as currency and market volatility and political and social instability. Hedging, derivatives, and other strategic transactions may increase a fund's volatility and could produce disproportionate losses, potentially more than the fund's principal investment. Liquidity—the extent to which a security may be sold or a derivative position closed without negatively affecting its market value, if at all—may be impaired by reduced trading volume, heightened volatility, rising interest rates, and other market conditions. Please see the fund's prospectuses for additional risks.
QUALITY COMPOSITION AS OF 1/31/16 (%)
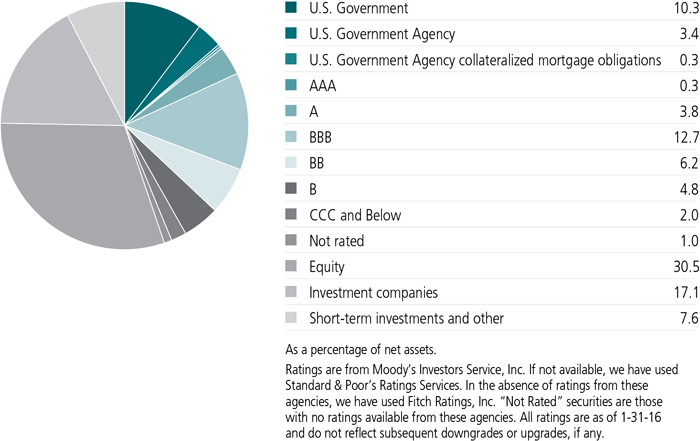
COUNTRY COMPOSITION AS OF 1/31/16 (%)
| United States | 83.2 |
| Japan | 2.7 |
| United Kingdom | 2.2 |
| Netherlands | 2.1 |
| France | 1.5 |
| Mexico | 1.1 |
| Switzerland | 1.0 |
| Luxembourg | 1.0 |
| Other countries | 5.2 |
| TOTAL | 100.0 |
| As a percentage of net assets. |
These examples are intended to help you understand your ongoing operating expenses of investing in the fund so you can compare these costs with the ongoing costs of investing in other mutual funds.
Understanding fund expenses
As a shareholder of the fund, you incur two types of costs:
| • | Transaction costs, which include sales charges (loads) on purchases or redemptions (varies by share class), minimum account fee charge, etc. |
| • | Ongoing operating expenses, including management fees, distribution and service fees (if applicable), and other fund expenses. |
We are presenting only your ongoing operating expenses here.
Actual expenses/actual returns
This example is intended to provide information about the fund's actual ongoing operating expenses, and is based on the fund's actual return. It assumes an account value of $1,000.00 on August 1, 2015, with the same investment held until January 31, 2016.
| Account value on 8-1-2015 |
Ending value on 1-31-2016 |
Expenses paid during period ended 1-31-20161 |
Annualized expense ratio |
|
| Class A | $1,000.00 | $940.30 | $8.15 | 1.67% |
| Class I | 1,000.00 | 941.70 | 6.64 | 1.36% |
Together with the value of your account, you may use this information to estimate the operating expenses that you paid over the period. Simply divide your account value at January 31, 2016, by $1,000.00, then multiply it by the "expenses paid" for your share class from the table above. For example, for an account value of $8,600.00, the operating expenses should be calculated as follows:
Hypothetical example for comparison purposes
This table allows you to compare the fund's ongoing operating expenses with those of any other fund. It provides an example of the fund's hypothetical account values and hypothetical expenses based on each class's actual expense ratio and an assumed 5% annualized return before expenses (which is not the fund's actual return). It assumes an account value of $1,000.00 on August 1, 2015, with the same investment held until January 31, 2016. Look in any other fund shareholder report to find its hypothetical example and you will be able to compare these expenses. Please remember that these hypothetical account values and expenses may not be used to estimate the actual ending account balance or expenses you paid for the period.
| Account value on 8-1-2015 |
Ending value on 1-31-2016 |
Expenses paid during period ended 1-31-20161 |
Annualized expense ratio |
|
| Class A | $1,000.00 | $1,016.70 | $8.47 | 1.67% |
| Class I | 1,000.00 | 1,018.30 | 6.90 | 1.36% |
Remember, these examples do not include any transaction costs, therefore, these examples will not help you to determine the relative total costs of owning different funds. If transaction costs were included, your expenses would have been higher. See the prospectus for details regarding transaction costs.
| 1 | Expenses are equal to the fund's annualized expense ratio multiplied by the average account value over the period, multiplied by 184/366 (to reflect the one-half year period). |
Fund's investments
| As of 1-31-16 (unaudited) | |||||||||||||||||||||||||||||
| Rate (%) | Maturity date | Par value^ | Value | ||||||||||||||||||||||||||
| Corporate bonds 19.8% | $7,420,314 | ||||||||||||||||||||||||||||
| (Cost $7,769,058) | |||||||||||||||||||||||||||||
| Consumer discretionary 2.7% | 994,120 | ||||||||||||||||||||||||||||
| Auto components 0.3% | |||||||||||||||||||||||||||||
| Dana Holding Corp. | 6.000 | 09-15-23 | 50,000 | 47,625 | |||||||||||||||||||||||||
| Delphi Corp. | 5.000 | 02-15-23 | 50,000 | 52,250 | |||||||||||||||||||||||||
| Nemak SAB de CV (S) | 5.500 | 02-28-23 | 20,000 | 19,900 | |||||||||||||||||||||||||
| Automobiles 0.4% | |||||||||||||||||||||||||||||
| Ford Motor Company | 4.750 | 01-15-43 | 10,000 | 9,146 | |||||||||||||||||||||||||
| Ford Motor Credit Company LLC | 5.875 | 08-02-21 | 60,000 | 66,141 | |||||||||||||||||||||||||
| General Motors Financial Company, Inc. | 4.000 | 01-15-25 | 40,000 | 37,350 | |||||||||||||||||||||||||
| General Motors Financial Company, Inc. | 4.375 | 09-25-21 | 40,000 | 40,653 | |||||||||||||||||||||||||
| Diversified consumer services 0.1% | |||||||||||||||||||||||||||||
| Service Corp. International | 5.375 | 05-15-24 | 15,000 | 15,825 | |||||||||||||||||||||||||
| Hotels, restaurants and leisure 0.5% | |||||||||||||||||||||||||||||
| CCM Merger, Inc. (S) | 9.125 | 05-01-19 | 150,000 | 154,500 | |||||||||||||||||||||||||
| Mohegan Tribal Gaming Authority (S) | 9.750 | 09-01-21 | 15,000 | 14,731 | |||||||||||||||||||||||||
| Internet and catalog retail 0.1% | |||||||||||||||||||||||||||||
| Amazon.com, Inc. | 4.950 | 12-05-44 | 45,000 | 47,548 | |||||||||||||||||||||||||
| Media 0.6% | |||||||||||||||||||||||||||||
| AMC Entertainment, Inc. | 5.875 | 02-15-22 | 23,000 | 23,690 | |||||||||||||||||||||||||
| Carmike Cinemas, Inc. (S) | 6.000 | 06-15-23 | 10,000 | 10,363 | |||||||||||||||||||||||||
| CCO Safari II LLC (S) | 6.484 | 10-23-45 | 25,000 | 25,142 | |||||||||||||||||||||||||
| Clear Channel Worldwide Holdings, Inc. | 6.500 | 11-15-22 | 15,000 | 13,894 | |||||||||||||||||||||||||
| Radio One, Inc. (S) | 9.250 | 02-15-20 | 15,000 | 11,850 | |||||||||||||||||||||||||
| Scripps Networks Interactive, Inc. | 3.950 | 06-15-25 | 25,000 | 24,116 | |||||||||||||||||||||||||
| Sinclair Television Group, Inc. (S) | 5.625 | 08-01-24 | 5,000 | 4,894 | |||||||||||||||||||||||||
| Sirius XM Radio, Inc. (S) | 5.250 | 08-15-22 | 70,000 | 73,850 | |||||||||||||||||||||||||
| Time Warner, Inc. | 3.875 | 01-15-26 | 40,000 | 39,587 | |||||||||||||||||||||||||
| Multiline retail 0.5% | |||||||||||||||||||||||||||||
| Macy's Retail Holdings, Inc. | 7.875 | 08-15-36 | 175,000 | 180,340 | |||||||||||||||||||||||||
| Specialty retail 0.1% | |||||||||||||||||||||||||||||
| Jo-Ann Stores Holdings, Inc., PIK (S) | 9.750 | 10-15-19 | 50,000 | 31,500 | |||||||||||||||||||||||||
| Textiles, apparel and luxury goods 0.1% | |||||||||||||||||||||||||||||
| Hot Topic, Inc. (S) | 9.250 | 06-15-21 | 55,000 | 49,225 | |||||||||||||||||||||||||
| Consumer staples 0.8% | 307,909 | ||||||||||||||||||||||||||||
| Food and staples retailing 0.1% | |||||||||||||||||||||||||||||
| SUPERVALU, Inc. | 7.750 | 11-15-22 | 20,000 | 17,000 | |||||||||||||||||||||||||
| Tops Holding LLC (S) | 8.000 | 06-15-22 | 30,000 | 28,500 | |||||||||||||||||||||||||
| Food products 0.1% | |||||||||||||||||||||||||||||
| Kraft Heinz Foods Company (S) | 4.875 | 02-15-25 | 18,000 | 19,259 | |||||||||||||||||||||||||
| Rate (%) | Maturity date | Par value^ | Value | ||||||||||||||||||||||||||
| Consumer staples (continued) | |||||||||||||||||||||||||||||
| Food products (continued) | |||||||||||||||||||||||||||||
| Post Holdings, Inc. (S) | 7.750 | 03-15-24 | 10,000 | $10,650 | |||||||||||||||||||||||||
| Personal products 0.1% | |||||||||||||||||||||||||||||
| Revlon Consumer Products Corp. | 5.750 | 02-15-21 | 50,000 | 48,750 | |||||||||||||||||||||||||
| Tobacco 0.5% | |||||||||||||||||||||||||||||
| Alliance One International, Inc. | 9.875 | 07-15-21 | 100,000 | 79,250 | |||||||||||||||||||||||||
| Vector Group, Ltd. | 7.750 | 02-15-21 | 100,000 | 104,500 | |||||||||||||||||||||||||
| Energy 1.5% | 576,674 | ||||||||||||||||||||||||||||
| Energy equipment and services 0.0% | |||||||||||||||||||||||||||||
| Teine Energy, Ltd. (S) | 6.875 | 09-30-22 | 20,000 | 15,975 | |||||||||||||||||||||||||
| Oil, gas and consumable fuels 1.5% | |||||||||||||||||||||||||||||
| Cimarex Energy Company | 4.375 | 06-01-24 | 35,000 | 30,638 | |||||||||||||||||||||||||
| Columbia Pipeline Group, Inc. (S) | 4.500 | 06-01-25 | 25,000 | 22,557 | |||||||||||||||||||||||||
| Enterprise Products Operating LLC (8.375% to 8-1-16, then 3 month LIBOR + 3.708%) | 8.375 | 08-01-66 | 35,000 | 28,000 | |||||||||||||||||||||||||
| EP Energy LLC | 7.750 | 09-01-22 | 20,000 | 7,000 | |||||||||||||||||||||||||
| Kinder Morgan, Inc. | 5.550 | 06-01-45 | 25,000 | 19,591 | |||||||||||||||||||||||||
| Newfield Exploration Company | 5.750 | 01-30-22 | 100,000 | 85,784 | |||||||||||||||||||||||||
| Pertamina Persero PT (S) | 6.450 | 05-30-44 | 200,000 | 172,073 | |||||||||||||||||||||||||
| Petroleos Mexicanos | 5.500 | 01-21-21 | 75,000 | 73,781 | |||||||||||||||||||||||||
| Summit Midstream Holdings LLC | 7.500 | 07-01-21 | 30,000 | 21,900 | |||||||||||||||||||||||||
| Tesoro Logistics LP | 6.125 | 10-15-21 | 20,000 | 18,100 | |||||||||||||||||||||||||
| Whiting Petroleum Corp. | 6.250 | 04-01-23 | 20,000 | 12,500 | |||||||||||||||||||||||||
| Williams Partners LP | 4.875 | 05-15-23 | 15,000 | 11,400 | |||||||||||||||||||||||||
| Williams Partners LP | 4.875 | 03-15-24 | 38,000 | 28,500 | |||||||||||||||||||||||||
| WPX Energy, Inc. | 6.000 | 01-15-22 | 50,000 | 28,875 | |||||||||||||||||||||||||
| Financials 6.1% | 2,290,999 | ||||||||||||||||||||||||||||
| Banks 2.8% | |||||||||||||||||||||||||||||
| Bank of America Corp. | 4.200 | 08-26-24 | 25,000 | 24,824 | |||||||||||||||||||||||||
| Bank of America Corp. (6.250% to 9-5-24, then 3 month LIBOR +3.705%) (Q) | 6.250 | 09-05-24 | 35,000 | 35,000 | |||||||||||||||||||||||||
| Bank of America Corp. (8.000% to 1-30-18, then 3 month LIBOR + 3.630%) (Q) | 8.000 | 01-30-18 | 35,000 | 35,339 | |||||||||||||||||||||||||
| BankUnited, Inc. | 4.875 | 11-17-25 | 25,000 | 24,775 | |||||||||||||||||||||||||
| Citigroup, Inc. (5.950% to 8-15-20, then 3 month LIBOR + 4.095%) (Q) | 5.950 | 08-15-20 | 15,000 | 14,738 | |||||||||||||||||||||||||
| Credit Agricole SA (7.875% to 1-23-24, then 5 Year U.S. Swap Rate + 4.898%) (Q)(S) | 7.875 | 01-23-24 | 200,000 | 194,720 | |||||||||||||||||||||||||
| Fifth Third Bancorp (5.100% to 6-30-23, then 3 month LIBOR + 3.033%) (Q) | 5.100 | 06-30-23 | 60,000 | 53,813 | |||||||||||||||||||||||||
| HBOS PLC (S) | 6.000 | 11-01-33 | 95,000 | 111,453 | |||||||||||||||||||||||||
| JPMorgan Chase & Co. (6.750% to 2-1-24, then 3 month LIBOR + 3.780%) (Q) | 6.750 | 02-01-24 | 65,000 | 70,363 | |||||||||||||||||||||||||
| Rate (%) | Maturity date | Par value^ | Value | ||||||||||||||||||||||||||
| Financials (continued) | |||||||||||||||||||||||||||||
| Banks (continued) | |||||||||||||||||||||||||||||
| JPMorgan Chase & Co. (7.900% to 4-30-18, then 3 month LIBOR + 3.470%) (Q) | 7.900 | 04-30-18 | 100,000 | $100,938 | |||||||||||||||||||||||||
| Rabobank Nederland NV (11.000% to 6-30-19, then 3 month LIBOR + 10.868%) (Q)(S) | 11.000 | 06-30-19 | 100,000 | 121,520 | |||||||||||||||||||||||||
| Russian Agricultural Bank OJSC (S) | 5.100 | 07-25-18 | 200,000 | 197,559 | |||||||||||||||||||||||||
| The PNC Financial Services Group, Inc. (4.850% to 6-1-23, then 3 month LIBOR + 3.040%) (Q) | 4.850 | 06-01-23 | 30,000 | 27,975 | |||||||||||||||||||||||||
| Wells Fargo & Company, Series K (7.980% to 3-15-18, then 3 month LIBOR + 3.770%) (Q) | 7.980 | 03-15-18 | 30,000 | 31,350 | |||||||||||||||||||||||||
| Capital markets 0.3% | |||||||||||||||||||||||||||||
| Ares Capital Corp. | 3.875 | 01-15-20 | 35,000 | 35,655 | |||||||||||||||||||||||||
| FS Investment Corp. | 4.000 | 07-15-19 | 35,000 | 35,372 | |||||||||||||||||||||||||
| Morgan Stanley (5.550% to 7-15-20, then 3 month LIBOR + 3.810%) (Q) | 5.550 | 07-15-20 | 20,000 | 19,788 | |||||||||||||||||||||||||
| The Goldman Sachs Group, Inc. | 5.750 | 01-24-22 | 10,000 | 11,354 | |||||||||||||||||||||||||
| Consumer finance 0.4% | |||||||||||||||||||||||||||||
| Ally Financial, Inc. | 5.125 | 09-30-24 | 65,000 | 65,894 | |||||||||||||||||||||||||
| Capital One Financial Corp. | 4.200 | 10-29-25 | 30,000 | 30,060 | |||||||||||||||||||||||||
| Capital One Financial Corp. (5.550% to 6-1-20, then 3 month LIBOR + 3.800%) (Q) | 5.550 | 06-01-20 | 25,000 | 24,859 | |||||||||||||||||||||||||
| Credit Acceptance Corp. | 6.125 | 02-15-21 | 40,000 | 38,300 | |||||||||||||||||||||||||
| Diversified financial services 0.3% | |||||||||||||||||||||||||||||
| McGraw Hill Financial, Inc. | 4.000 | 06-15-25 | 25,000 | 25,232 | |||||||||||||||||||||||||
| NewStar Financial, Inc. | 7.250 | 05-01-20 | 25,000 | 23,250 | |||||||||||||||||||||||||
| Voya Financial, Inc. (5.650% to 5-15-23, then 3 month LIBOR + 3.580%) | 5.650 | 05-15-53 | 54,000 | 52,380 | |||||||||||||||||||||||||
| Insurance 1.1% | |||||||||||||||||||||||||||||
| Assured Guaranty US Holdings, Inc. | 5.000 | 07-01-24 | 40,000 | 42,131 | |||||||||||||||||||||||||
| AXA SA | 8.600 | 12-15-30 | 100,000 | 133,785 | |||||||||||||||||||||||||
| CNA Financial Corp. | 7.250 | 11-15-23 | 75,000 | 89,804 | |||||||||||||||||||||||||
| Liberty Mutual Group, Inc. (7.800% to 3-15-37, then 3 month LIBOR + 3.576%) (S) | 7.800 | 03-07-87 | 100,000 | 114,000 | |||||||||||||||||||||||||
| Pacific LifeCorp. (S) | 6.000 | 02-10-20 | 10,000 | 11,182 | |||||||||||||||||||||||||
| Prudential Financial, Inc. (5.200% to 3-15-24, then 3 month LIBOR + 3.040%) | 5.200 | 03-15-44 | 15,000 | 14,569 | |||||||||||||||||||||||||
| Prudential Financial, Inc. (5.875% to 9-15-22, then 3 month LIBOR + 4.175%) | 5.875 | 09-15-42 | 15,000 | 15,731 | |||||||||||||||||||||||||
| Sirius International Group, Ltd. (7.506% to 6-30-17, then 3 month LIBOR + 3.200%) (Q)(S) | 7.506 | 06-30-17 | 10,000 | 10,014 | |||||||||||||||||||||||||
| Real estate investment trusts 1.1% | |||||||||||||||||||||||||||||
| American Tower Corp. | 4.700 | 03-15-22 | 40,000 | 42,217 | |||||||||||||||||||||||||
| Corrections Corp. of America | 5.000 | 10-15-22 | 10,000 | 10,138 | |||||||||||||||||||||||||
| Crown Castle International Corp. | 4.450 | 02-15-26 | 20,000 | 20,121 | |||||||||||||||||||||||||
| Crown Castle Towers LLC (S) | 6.113 | 01-15-40 | 100,000 | 109,915 | |||||||||||||||||||||||||
| Rate (%) | Maturity date | Par value^ | Value | ||||||||||||||||||||||||||
| Financials (continued) | |||||||||||||||||||||||||||||
| Real estate investment trusts (continued) | |||||||||||||||||||||||||||||
| Iron Mountain, Inc. | 5.750 | 08-15-24 | 45,000 | $44,438 | |||||||||||||||||||||||||
| MPT Operating Partnership LP | 6.875 | 05-01-21 | 100,000 | 103,500 | |||||||||||||||||||||||||
| Omega Healthcare Investors, Inc. | 4.500 | 01-15-25 | 25,000 | 24,612 | |||||||||||||||||||||||||
| Vereit Operating Partnership LP | 4.600 | 02-06-24 | 45,000 | 42,356 | |||||||||||||||||||||||||
| Thrifts and mortgage finance 0.1% | |||||||||||||||||||||||||||||
| Nationstar Mortgage LLC | 6.500 | 07-01-21 | 20,000 | 17,650 | |||||||||||||||||||||||||
| Nationstar Mortgage LLC | 7.875 | 10-01-20 | 30,000 | 28,575 | |||||||||||||||||||||||||
| Stearns Holdings, Inc. (S) | 9.375 | 08-15-20 | 10,000 | 9,750 | |||||||||||||||||||||||||
| Health care 0.5% | 183,262 | ||||||||||||||||||||||||||||
| Biotechnology 0.1% | |||||||||||||||||||||||||||||
| AbbVie, Inc. | 3.600 | 05-14-25 | 40,000 | 40,069 | |||||||||||||||||||||||||
| Health care providers and services 0.2% | |||||||||||||||||||||||||||||
| Fresenius US Finance II, Inc. (S) | 4.500 | 01-15-23 | 10,000 | 10,025 | |||||||||||||||||||||||||
| HCA, Inc. | 7.500 | 02-15-22 | 50,000 | 55,500 | |||||||||||||||||||||||||
| Molina Healthcare, Inc. (S) | 5.375 | 11-15-22 | 15,000 | 15,000 | |||||||||||||||||||||||||
| Pharmaceuticals 0.2% | |||||||||||||||||||||||||||||
| Actavis Funding SCS | 3.800 | 03-15-25 | 20,000 | 20,292 | |||||||||||||||||||||||||
| Mallinckrodt International Finance SA (S) | 5.500 | 04-15-25 | 5,000 | 4,450 | |||||||||||||||||||||||||
| Mallinckrodt International Finance SA (S) | 5.750 | 08-01-22 | 25,000 | 23,875 | |||||||||||||||||||||||||
| Quintiles Transnational Corp. (S) | 4.875 | 05-15-23 | 5,000 | 5,063 | |||||||||||||||||||||||||
| Valeant Pharmaceuticals International, Inc. (S) | 6.125 | 04-15-25 | 10,000 | 8,988 | |||||||||||||||||||||||||
| Industrials 3.4% | 1,268,367 | ||||||||||||||||||||||||||||
| Aerospace and defense 0.4% | |||||||||||||||||||||||||||||
| Lockheed Martin Corp. | 2.900 | 03-01-25 | 28,000 | 27,305 | |||||||||||||||||||||||||
| Lockheed Martin Corp. | 4.700 | 05-15-46 | 20,000 | 21,170 | |||||||||||||||||||||||||
| Textron Financial Corp. (6.000% to 2-15-17, then 3 month LIBOR + 1.735%) (S) | 6.000 | 02-15-67 | 150,000 | 106,500 | |||||||||||||||||||||||||
| Air freight and logistics 0.1% | |||||||||||||||||||||||||||||
| XPO Logistics, Inc. (S) | 6.500 | 06-15-22 | 35,000 | 31,325 | |||||||||||||||||||||||||
| Airlines 1.0% | |||||||||||||||||||||||||||||
| American Airlines 2011-1 Class B Pass Through Trust (S) | 7.000 | 07-31-19 | 70,485 | 73,304 | |||||||||||||||||||||||||
| British Airways 2013-1 Class B Pass Through Trust (S) | 5.625 | 12-20-21 | 19,712 | 20,254 | |||||||||||||||||||||||||
| Continental Airlines 1997-4 Class A Pass Through Trust | 6.900 | 07-02-19 | 6,583 | 6,727 | |||||||||||||||||||||||||
| Delta Air Lines 2002-1 Class G-1 Pass Through Trust | 6.718 | 07-02-24 | 58,108 | 65,662 | |||||||||||||||||||||||||
| Delta Air Lines 2010-1 Class A Pass Through Trust | 6.200 | 01-02-20 | 105,417 | 112,807 | |||||||||||||||||||||||||
| Northwest Airlines 2007-1 Class A Pass Through Trust | 7.027 | 05-01-21 | 11,008 | 12,238 | |||||||||||||||||||||||||
| United Airlines 2014-2 Class A Pass Through Trust | 3.750 | 03-03-28 | 35,000 | 35,394 | |||||||||||||||||||||||||
| Rate (%) | Maturity date | Par value^ | Value | ||||||||||||||||||||||||||
| Industrials (continued) | |||||||||||||||||||||||||||||
| Airlines (continued) | |||||||||||||||||||||||||||||
| United Airlines 2014-2 Class B Pass Through Trust | 4.625 | 03-03-24 | 30,000 | $30,150 | |||||||||||||||||||||||||
| US Airways 2012-1 Class A Pass Through Trust | 5.900 | 04-01-26 | 20,762 | 23,046 | |||||||||||||||||||||||||
| Building products 0.0% | |||||||||||||||||||||||||||||
| Builders FirstSource, Inc. (S) | 10.750 | 08-15-23 | 10,000 | 9,363 | |||||||||||||||||||||||||
| Commercial services and supplies 0.4% | |||||||||||||||||||||||||||||
| Casella Waste Systems, Inc. | 7.750 | 02-15-19 | 40,000 | 38,800 | |||||||||||||||||||||||||
| Safway Group Holding LLC (S) | 7.000 | 05-15-18 | 100,000 | 98,000 | |||||||||||||||||||||||||
| Construction and engineering 0.1% | |||||||||||||||||||||||||||||
| Tutor Perini Corp. | 7.625 | 11-01-18 | 50,000 | 50,000 | |||||||||||||||||||||||||
| Electrical equipment 0.0% | |||||||||||||||||||||||||||||
| EnerSys (S) | 5.000 | 04-30-23 | 5,000 | 4,925 | |||||||||||||||||||||||||
| Industrial conglomerates 0.3% | |||||||||||||||||||||||||||||
| General Electric Company (5.000% to 1-21-21, then 3 month LIBOR + 3.330%) (Q) | 5.000 | 01-21-21 | 29,000 | 29,798 | |||||||||||||||||||||||||
| Odebrecht Finance, Ltd. (Q)(S) | 7.500 | 03-07-16 | 200,000 | 93,500 | |||||||||||||||||||||||||
| Machinery 0.2% | |||||||||||||||||||||||||||||
| Optimas OE Solutions Holding LLC (S) | 8.625 | 06-01-21 | 10,000 | 8,100 | |||||||||||||||||||||||||
| SPL Logistics Escrow LLC (S) | 8.875 | 08-01-20 | 24,000 | 21,840 | |||||||||||||||||||||||||
| Trinity Industries, Inc. | 4.550 | 10-01-24 | 30,000 | 26,827 | |||||||||||||||||||||||||
| Road and rail 0.1% | |||||||||||||||||||||||||||||
| Penske Truck Leasing Company LP (S) | 3.375 | 02-01-22 | 45,000 | 44,157 | |||||||||||||||||||||||||
| Trading companies and distributors 0.5% | |||||||||||||||||||||||||||||
| Ahern Rentals, Inc. (S) | 7.375 | 05-15-23 | 25,000 | 18,250 | |||||||||||||||||||||||||
| Aircastle, Ltd. | 5.500 | 02-15-22 | 15,000 | 14,925 | |||||||||||||||||||||||||
| Aircastle, Ltd. | 6.250 | 12-01-19 | 25,000 | 26,375 | |||||||||||||||||||||||||
| International Lease Finance Corp. (S) | 7.125 | 09-01-18 | 100,000 | 108,250 | |||||||||||||||||||||||||
| United Rentals North America, Inc. | 5.500 | 07-15-25 | 20,000 | 17,875 | |||||||||||||||||||||||||
| Transportation infrastructure 0.3% | |||||||||||||||||||||||||||||
| Florida East Coast Holdings Corp. (S) | 6.750 | 05-01-19 | 100,000 | 91,500 | |||||||||||||||||||||||||
| Information technology 1.0% | 374,511 | ||||||||||||||||||||||||||||
| Electronic equipment, instruments and components 0.1% | |||||||||||||||||||||||||||||
| Zebra Technologies Corp. | 7.250 | 10-15-22 | 20,000 | 20,800 | |||||||||||||||||||||||||
| Internet software and services 0.2% | |||||||||||||||||||||||||||||
| Ancestry.com, Inc. | 11.000 | 12-15-20 | 45,000 | 47,700 | |||||||||||||||||||||||||
| Rackspace Hosting, Inc. (S) | 6.500 | 01-15-24 | 25,000 | 22,813 | |||||||||||||||||||||||||
| VeriSign, Inc. | 5.250 | 04-01-25 | 20,000 | 19,782 | |||||||||||||||||||||||||
| IT services 0.6% | |||||||||||||||||||||||||||||
| Sixsigma Networks Mexico SA de CV (S) | 8.250 | 11-07-21 | 200,000 | 182,000 | |||||||||||||||||||||||||
| Visa, Inc. | 3.150 | 12-14-25 | 30,000 | 30,508 | |||||||||||||||||||||||||
| Visa, Inc. | 4.300 | 12-14-45 | 30,000 | 31,108 | |||||||||||||||||||||||||
| Rate (%) | Maturity date | Par value^ | Value | ||||||||||||||||||||||||||
| Information technology (continued) | |||||||||||||||||||||||||||||
| Semiconductors and semiconductor equipment 0.1% | |||||||||||||||||||||||||||||
| Qorvo, Inc. (S) | 6.750 | 12-01-23 | 10,000 | $9,875 | |||||||||||||||||||||||||
| Qorvo, Inc. (S) | 7.000 | 12-01-25 | 10,000 | 9,925 | |||||||||||||||||||||||||
| Materials 0.5% | 183,751 | ||||||||||||||||||||||||||||
| Chemicals 0.5% | |||||||||||||||||||||||||||||
| Braskem Finance, Ltd. (S) | 7.000 | 05-07-20 | 100,000 | 99,500 | |||||||||||||||||||||||||
| NOVA Chemicals Corp. (S) | 5.000 | 05-01-25 | 45,000 | 42,188 | |||||||||||||||||||||||||
| Platform Specialty Products Corp. (S) | 6.500 | 02-01-22 | 35,000 | 27,475 | |||||||||||||||||||||||||
| Paper and forest products 0.0% | |||||||||||||||||||||||||||||
| Norbord, Inc. (S) | 6.250 | 04-15-23 | 15,000 | 14,588 | |||||||||||||||||||||||||
| Telecommunication services 1.3% | 484,962 | ||||||||||||||||||||||||||||
| Diversified telecommunication services 0.4% | |||||||||||||||||||||||||||||
| AT&T, Inc. | 4.750 | 05-15-46 | 20,000 | 17,687 | |||||||||||||||||||||||||
| GCI, Inc. | 6.875 | 04-15-25 | 15,000 | 14,700 | |||||||||||||||||||||||||
| T-Mobile USA, Inc. | 6.250 | 04-01-21 | 15,000 | 15,300 | |||||||||||||||||||||||||
| Telecom Italia Capital SA | 7.200 | 07-18-36 | 100,000 | 97,500 | |||||||||||||||||||||||||
| Wireless telecommunication services 0.9% | |||||||||||||||||||||||||||||
| Digicel Group, Ltd. (S) | 8.250 | 09-30-20 | 200,000 | 161,775 | |||||||||||||||||||||||||
| Millicom International Cellular SA (S) | 6.625 | 10-15-21 | 200,000 | 178,000 | |||||||||||||||||||||||||
| Utilities 2.0% | 755,759 | ||||||||||||||||||||||||||||
| Electric utilities 1.8% | |||||||||||||||||||||||||||||
| Electricite de France SA (5.250% to 1-29-23, then 10 Year U.S. Swap Rate + 3.709%) (Q)(S) | 5.250 | 01-29-23 | 100,000 | 89,625 | |||||||||||||||||||||||||
| Empresa Electrica Angamos SA (S) | 4.875 | 05-25-29 | 200,000 | 173,210 | |||||||||||||||||||||||||
| Israel Electric Corp., Ltd. (S) | 5.625 | 06-21-18 | 200,000 | 210,024 | |||||||||||||||||||||||||
| Majapahit Holding BV (S) | 7.750 | 01-20-20 | 150,000 | 167,400 | |||||||||||||||||||||||||
| Southern California Edison Company (6.250% to 2-1-22, then 3 month LIBOR + 4.199%) (Q) | 6.250 | 02-01-22 | 35,000 | 38,500 | |||||||||||||||||||||||||
| Independent power and renewable electricity producers 0.2% | |||||||||||||||||||||||||||||
| Dynegy, Inc. | 7.625 | 11-01-24 | 35,000 | 30,800 | |||||||||||||||||||||||||
| NRG Yield Operating LLC | 5.375 | 08-15-24 | 55,000 | 46,200 | |||||||||||||||||||||||||
| U.S. Government and Agency obligations 13.7% |
$5,139,453 | ||||||||||||||||||||||||||||
| (Cost $5,103,132) | |||||||||||||||||||||||||||||
| U.S. Government 10.3% | 3,874,237 | ||||||||||||||||||||||||||||
| U.S. Treasury | |||||||||||||||||||||||||||||
| Bond | 2.875 | 08-15-45 | 592,000 | 606,222 | |||||||||||||||||||||||||
| Bond | 3.375 | 05-15-44 | 240,000 | 271,275 | |||||||||||||||||||||||||
| Note | 1.000 | 03-15-18 | 930,000 | 933,342 | |||||||||||||||||||||||||
| Note | 2.250 | 11-15-25 | 379,000 | 389,955 | |||||||||||||||||||||||||
| Treasury Inflation Protected Security | 0.125 | 04-15-17 | 226,765 | 226,954 | |||||||||||||||||||||||||
| Treasury Inflation Protected Security | 0.250 | 01-15-25 | 916,922 | 892,757 | |||||||||||||||||||||||||
| Rate (%) | Maturity date | Par value^ | Value | ||||||||||||||||||||||||||
| U.S. Government (continued) | |||||||||||||||||||||||||||||
| Treasury Inflation Protected Security | 0.375 | 07-15-25 | 175,154 | $172,974 | |||||||||||||||||||||||||
| Treasury Inflation Protected Security | 1.250 | 07-15-20 | 168,694 | 178,131 | |||||||||||||||||||||||||
| Treasury Inflation Protected Security | 2.500 | 07-15-16 | 199,799 | 202,627 | |||||||||||||||||||||||||
| U.S. Government Agency 3.4% | 1,265,216 | ||||||||||||||||||||||||||||
| Federal Home Loan Mortgage Corp. | |||||||||||||||||||||||||||||
| 30 Yr Pass Thru | 4.000 | 12-01-40 | 400,148 | 433,347 | |||||||||||||||||||||||||
| 30 Yr Pass Thru | 4.500 | 12-01-40 | 286,921 | 313,703 | |||||||||||||||||||||||||
| Federal National Mortgage Association 30 Yr Pass Thru |
3.500 | 03-01-44 | 492,703 | 518,166 | |||||||||||||||||||||||||
| Foreign government obligations 0.7% |
$267,969 | ||||||||||||||||||||||||||||
| (Cost $361,119) | |||||||||||||||||||||||||||||
| Argentina 0.1% | 39,432 | ||||||||||||||||||||||||||||
| Republic of Argentina Bond (H) |
8.280 | 12-31-33 | 35,051 | 39,432 | |||||||||||||||||||||||||
| Brazil 0.2% | 77,673 | ||||||||||||||||||||||||||||
| Federative Republic of Brazil Note |
10.000 | 01-01-21 | BRL | 375,000 | 77,673 | ||||||||||||||||||||||||
| Mexico 0.4% | 150,864 | ||||||||||||||||||||||||||||
| Government of Mexico | |||||||||||||||||||||||||||||
| Bond | 7.750 | 05-29-31 | MXN | 1,200,000 | 73,347 | ||||||||||||||||||||||||
| Bond | 10.000 | 12-05-24 | MXN | 1,100,000 | 77,517 | ||||||||||||||||||||||||
| Capital preferred securities 0.6% | $207,463 | ||||||||||||||||||||||||||||
| (Cost $197,609) | |||||||||||||||||||||||||||||
| Financials 0.6% | 207,463 | ||||||||||||||||||||||||||||
| MetLife Capital Trust IV (7.875% to 12-15-32, then 3 month LIBOR + 3.960%) (S) | 7.875 | 12-15-67 | 35,000 | 42,000 | |||||||||||||||||||||||||
| MetLife Capital Trust X (9.250% to 4-8-33 then 3 month LIBOR + 5.540%) (S) | 9.250 | 04-08-68 | 30,000 | 40,200 | |||||||||||||||||||||||||
| ZFS Finance USA Trust II (6.450% to 6-15-16 then 3 month LIBOR + 2.000%) (S) | 6.450 | 12-15-65 | 100,000 | 100,125 | |||||||||||||||||||||||||
| ZFS Finance USA Trust V (6.500% to 5-9-17, then 3 month LIBOR + 2.285%) (S) | 6.500 | 05-09-67 | 25,000 | 25,138 | |||||||||||||||||||||||||
| Convertible bonds 0.0% | $12,300 | ||||||||||||||||||||||||||||
| (Cost $15,000) | |||||||||||||||||||||||||||||
| Utilities 0.0% | 12,300 | ||||||||||||||||||||||||||||
| Independent power and renewable electricity producers 0.0% | |||||||||||||||||||||||||||||
| NRG Yield, Inc. (S) | 3.250 | 06-01-20 | 15,000 | 12,300 | |||||||||||||||||||||||||
| Term loans (M) 2.2% | $824,304 | ||||||||||||||||||||||||||||
| (Cost $870,538) | |||||||||||||||||||||||||||||
| Consumer discretionary 0.3% | 96,192 | ||||||||||||||||||||||||||||
| Media 0.3% | |||||||||||||||||||||||||||||
| iHeartCommunications, Inc. | 7.178 | 01-30-19 | 110,259 | 72,817 | |||||||||||||||||||||||||
| Rate (%) | Maturity date | Par value^ | Value | ||||||||||||||||||||||||||
| Consumer discretionary (continued) | |||||||||||||||||||||||||||||
| Media (continued) | |||||||||||||||||||||||||||||
| iHeartCommunications, Inc. | 7.928 | 07-30-19 | 35,461 | $23,375 | |||||||||||||||||||||||||
| Consumer staples 0.2% | 92,444 | ||||||||||||||||||||||||||||
| Household products 0.2% | |||||||||||||||||||||||||||||
| The Sun Products Corp. | 5.500 | 03-23-20 | 97,310 | 92,444 | |||||||||||||||||||||||||
| Health care 0.4% | 155,082 | ||||||||||||||||||||||||||||
| Health care providers and services 0.4% | |||||||||||||||||||||||||||||
| National Mentor Holdings, Inc. | 4.250 | 01-31-21 | 57,969 | 56,990 | |||||||||||||||||||||||||
| Surgery Center Holdings, Inc. | 5.250 | 11-03-20 | 99,000 | 98,092 | |||||||||||||||||||||||||
| Industrials 0.5% | 200,642 | ||||||||||||||||||||||||||||
| Aerospace and defense 0.2% | |||||||||||||||||||||||||||||
| WP CPP Holdings LLC | 4.500 | 12-28-19 | 97,000 | 89,725 | |||||||||||||||||||||||||
| Airlines 0.3% | |||||||||||||||||||||||||||||
| Delta Air Lines, Inc. | 3.250 | 10-18-18 | 97,000 | 96,742 | |||||||||||||||||||||||||
| GOL LuxCo SA | 6.500 | 08-31-20 | 15,000 | 14,175 | |||||||||||||||||||||||||
| Utilities 0.8% | 279,944 | ||||||||||||||||||||||||||||
| Electric utilities 0.8% | |||||||||||||||||||||||||||||
| Texas Competitive Electric Holdings Company LLC | 3.750 | 11-07-16 | 282,178 | 279,944 | |||||||||||||||||||||||||
| Collateralized mortgage obligations 5.8% |
$2,152,307 | ||||||||||||||||||||||||||||
| (Cost $2,149,550) | |||||||||||||||||||||||||||||
| Commercial and residential 5.5% | 2,041,825 | ||||||||||||||||||||||||||||
| Adjustable Rate Mortgage Trust Series 2005-4, Class 7A12 (P) |
1.006 | 08-25-35 | 21,902 | 21,030 | |||||||||||||||||||||||||
| American Home Mortgage Investment Trust | |||||||||||||||||||||||||||||
| Series 2005-1, Class 1A1 (P) | 0.646 | 06-25-45 | 41,391 | 38,503 | |||||||||||||||||||||||||
| Series 2005-1, Class AHM (P) | 2.844 | 06-25-45 | 23,036 | 22,777 | |||||||||||||||||||||||||
| Americold 2010 LLC Trust Series 2010-ARTA, Class D (S) |
7.443 | 01-14-29 | 100,000 | 111,494 | |||||||||||||||||||||||||
| BAMLL Commercial Mortgage Securities Trust | |||||||||||||||||||||||||||||
| Series 2013-DSNY, Class E (P) (S) | 3.026 | 09-15-26 | 100,000 | 98,809 | |||||||||||||||||||||||||
| Series 2015-200P, Class F (P) (S) | 3.716 | 04-14-33 | 25,000 | 21,450 | |||||||||||||||||||||||||
| Bear Stearns Adjustable Rate Mortgage Trust Series 2005-5, Class A2 (P) |
2.480 | 08-25-35 | 35,551 | 35,559 | |||||||||||||||||||||||||
| CDGJ Commercial Mortgage Trust Series 2014-BXCH, Class D (P) (S) |
3.426 | 12-15-27 | 100,000 | 96,615 | |||||||||||||||||||||||||
| Commercial Mortgage (Cantor Fitzgerald/Deutsche Bank AG) Series 2013-CR6, Class XA IO |
1.638 | 03-10-46 | 289,321 | 15,059 | |||||||||||||||||||||||||
| Commercial Mortgage Trust (Deutsche Bank) | |||||||||||||||||||||||||||||
| Series 2012-CR3, Class XA IO | 2.269 | 10-15-45 | 301,165 | 27,608 | |||||||||||||||||||||||||
| Series 2014-FL4, Class D (P) (S) | 2.874 | 07-13-31 | 50,000 | 48,787 | |||||||||||||||||||||||||
| Rate (%) | Maturity date | Par value^ | Value | ||||||||||||||||||||||||||
| Commercial and residential (continued) | |||||||||||||||||||||||||||||
| Commercial Mortgage Trust (Wells Fargo) Series 2014-CR16, Class C (P) |
5.069 | 04-10-47 | 45,000 | $44,986 | |||||||||||||||||||||||||
| Countrywide Alternative Loan Trust Series 2007-16CB, Class 4A7 |
6.000 | 08-25-37 | 69,095 | 67,785 | |||||||||||||||||||||||||
| Credit Suisse Commercial Mortgage Trust Series 2014-ICE, Class D (P) (S) |
2.576 | 04-15-27 | 35,000 | 34,705 | |||||||||||||||||||||||||
| HILT Mortgage Trust Series 2014-ORL, Class D (P) (S) |
2.481 | 07-15-29 | 100,000 | 95,650 | |||||||||||||||||||||||||
| Hilton USA Trust | |||||||||||||||||||||||||||||
| Series 2013-HLF, Class EFL (P) (S) | 4.180 | 11-05-30 | 90,671 | 90,052 | |||||||||||||||||||||||||
| Series 2013-HLT, Class DFX (S) | 4.407 | 11-05-30 | 100,000 | 100,284 | |||||||||||||||||||||||||
| IndyMac Index Mortgage Loan Trust | |||||||||||||||||||||||||||||
| Series 2005-AR12, Class AX2 IO | 2.224 | 07-25-35 | 587,701 | 44,412 | |||||||||||||||||||||||||
| Series 2005-AR8, Class AX2 IO | 2.257 | 05-25-35 | 492,083 | 37,186 | |||||||||||||||||||||||||
| JPMBB Commercial Mortgage Securities Trust Series 2014-C19, Class C (P) |
4.831 | 04-15-47 | 55,000 | 53,824 | |||||||||||||||||||||||||
| JPMorgan Chase Commercial Mortgage Securities Trust | |||||||||||||||||||||||||||||
| Series 2014-FBLU, Class C (P) (S) | 2.426 | 12-15-28 | 100,000 | 99,985 | |||||||||||||||||||||||||
| Series 2014-FBLU, Class D (P) (S) | 3.026 | 12-15-28 | 100,000 | 99,970 | |||||||||||||||||||||||||
| Series 2014-FL5, Class C (P) (S) | 2.526 | 07-15-31 | 85,000 | 82,754 | |||||||||||||||||||||||||
| Series 2014-INN, Class F (P) (S) | 4.426 | 06-15-29 | 100,000 | 97,920 | |||||||||||||||||||||||||
| Series 2014-PHH, Class C (P) (S) | 2.526 | 08-15-27 | 100,000 | 98,571 | |||||||||||||||||||||||||
| Merrill Lynch Mortgage Investors Trust Series 2005-2, Class 1A (P) |
1.904 | 10-25-35 | 35,379 | 34,228 | |||||||||||||||||||||||||
| Morgan Stanley Capital I Trust Series 2014-150E, Class D (P) (S) |
4.438 | 09-09-32 | 85,000 | 85,680 | |||||||||||||||||||||||||
| Morgan Stanley Mortgage Loan Trust Series 2004-6AR, Class 2A2 (P) |
2.862 | 08-25-34 | 46,092 | 45,436 | |||||||||||||||||||||||||
| Thornburg Mortgage Securities Trust Series 2004-1, Class II2A (P) |
1.690 | 03-25-44 | 26,707 | 26,004 | |||||||||||||||||||||||||
| UBS-Barclays Commercial Mortgage Trust Series 2012-C2, Class XA IO (S) |
1.866 | 05-10-63 | 518,094 | 32,785 | |||||||||||||||||||||||||
| VNDO Mortgage Trust Series 2013-PENN, Class D (P) (S) |
4.079 | 12-13-29 | 100,000 | 99,978 | |||||||||||||||||||||||||
| WaMu Mortgage Pass Through Certificates Series 2005-AR2, Class 2A1B (P) |
0.796 | 01-25-45 | 19,373 | 17,522 | |||||||||||||||||||||||||
| Wells Fargo Commercial Mortgage Trust | |||||||||||||||||||||||||||||
| Series 2013-120B, Class C (P) (S) | 2.800 | 03-18-28 | 80,000 | 78,074 | |||||||||||||||||||||||||
| Series 2013-BTC, Class E (P) (S) | 3.668 | 04-16-35 | 40,000 | 36,343 | |||||||||||||||||||||||||
| U.S. Government Agency 0.3% | 110,482 | ||||||||||||||||||||||||||||
| Federal Home Loan Mortgage Corp. | |||||||||||||||||||||||||||||
| Series 288, Class IO | 3.000 | 10-15-27 | 256,349 | 26,585 | |||||||||||||||||||||||||
| Series K018, Class X1 IO | 1.554 | 01-25-22 | 386,541 | 26,032 | |||||||||||||||||||||||||
| Series K710, Class X1 IO | 1.897 | 05-25-19 | 265,360 | 12,983 | |||||||||||||||||||||||||
| Federal National Mortgage Association Series 2012-137, Class WI IO |
3.500 | 12-25-32 | 185,809 | 31,721 | |||||||||||||||||||||||||
| Rate (%) | Maturity date | Par value^ | Value | ||||||||||||||||||||||||||
| U.S. Government Agency (continued) | |||||||||||||||||||||||||||||
| Government National Mortgage Association Series 2012-114, Class IO |
0.927 | 01-16-53 | 186,350 | $13,161 | |||||||||||||||||||||||||
| Asset backed securities 2.0% | $741,167 | ||||||||||||||||||||||||||||
| (Cost $731,078) | |||||||||||||||||||||||||||||
| Aegis Asset Backed Securities Trust Series 2005-4, Class M1 (P) |
0.877 | 10-25-35 | 75,000 | 67,963 | |||||||||||||||||||||||||
| Bravo Mortgage Asset Trust Series 2006-1A, Class A3 (P) (S) |
0.776 | 07-25-36 | 30,000 | 25,482 | |||||||||||||||||||||||||
| Citicorp Residential Mortgage Trust Series 2007-2, Class A6 |
6.265 | 06-25-37 | 12,182 | 12,573 | |||||||||||||||||||||||||
| Countrywide Asset-Backed Certificates Series 2004-10, Class AF5B |
5.613 | 02-25-35 | 43,985 | 44,468 | |||||||||||||||||||||||||
| DB Master Finance LLC Series 2015-1A, Class A2II (S) |
3.980 | 02-20-45 | 59,550 | 59,383 | |||||||||||||||||||||||||
| Driven Brands Funding LLC Series 2015-1A, Class A2 (S) |
5.216 | 07-20-45 | 29,925 | 29,803 | |||||||||||||||||||||||||
| EquiFirst Mortgage Loan Trust Series 2004-3, Class M3 (P) |
1.402 | 12-25-34 | 23,457 | 20,941 | |||||||||||||||||||||||||
| Merrill Lynch Mortgage Investors Trust Series 2004-OPT1, Class A1A (P) |
0.946 | 06-25-35 | 22,767 | 21,768 | |||||||||||||||||||||||||
| Nationstar Home Equity Loan Trust Series 2006-B, Class AV4 (P) |
0.706 | 09-25-36 | 40,000 | 37,121 | |||||||||||||||||||||||||
| New Century Home Equity Loan Trust Series 2005-2, Class M2 (P) |
0.876 | 06-25-35 | 65,000 | 61,067 | |||||||||||||||||||||||||
| Saxon Asset Securities Trust Series 2006-2, Class A3C (P) |
0.576 | 09-25-36 | 41,379 | 38,161 | |||||||||||||||||||||||||
| Sierra Timeshare Receivables Funding LLC Series 2014-2A, Class A (S) |
2.050 | 06-20-31 | 26,320 | 26,419 | |||||||||||||||||||||||||
| Soundview Home Loan Trust Series 2005-CTX1, Class M2 (P) |
0.866 | 11-25-35 | 35,000 | 33,023 | |||||||||||||||||||||||||
| Structured Asset Investment Loan Trust | |||||||||||||||||||||||||||||
| Series 2005-1, Class M2 (P) (S) | 1.146 | 02-25-35 | 45,000 | 42,249 | |||||||||||||||||||||||||
| Series 2005-2, Class M2 (P) | 1.162 | 03-25-35 | 45,000 | 41,986 | |||||||||||||||||||||||||
| Structured Asset Securities Corp. Mortgage Loan Trust Series 2005-2XS, Class 2A2 (P) |
1.928 | 02-25-35 | 42,234 | 40,458 | |||||||||||||||||||||||||
| TAL Advantage V LLC Series 2014-1A, Class A (S) |
3.510 | 02-22-39 | 24,250 | 24,271 | |||||||||||||||||||||||||
| Wendys Funding LLC Series 2015-1A, Class A2I (S) |
3.371 | 06-15-45 | 59,850 | 59,102 | |||||||||||||||||||||||||
| Westgate Resorts LLC Series 2014-AA, Class A (S) |
6.250 | 10-20-26 | 55,322 | 54,929 | |||||||||||||||||||||||||
| Shares | Value | ||||||||||||||||||||||||||||
| Common stocks 29.5% | $11,043,966 | ||||||||||||||||||||||||||||
| (Cost $11,695,001) | |||||||||||||||||||||||||||||
| Consumer discretionary 6.1% | 2,286,567 | ||||||||||||||||||||||||||||
| Auto components 0.7% | |||||||||||||||||||||||||||||
| Bridgestone Corp. | 2,700 | 98,366 | |||||||||||||||||||||||||||
| Delphi Automotive PLC | 1,728 | 112,216 | |||||||||||||||||||||||||||
| Magna International, Inc., Class A | 1,352 | 46,766 | |||||||||||||||||||||||||||
| Automobiles 1.0% | |||||||||||||||||||||||||||||
| Ford Motor Company | 6,811 | 81,323 | |||||||||||||||||||||||||||
| Honda Motor Company, Ltd. | 2,400 | 65,057 | |||||||||||||||||||||||||||
| Nissan Motor Company, Ltd. | 11,400 | 113,381 | |||||||||||||||||||||||||||
| Toyota Motor Corp. | 2,000 | 120,459 | |||||||||||||||||||||||||||
| Hotels, restaurants and leisure 0.9% | |||||||||||||||||||||||||||||
| Del Frisco's Restaurant Group, Inc. (I) | 5,710 | 90,446 | |||||||||||||||||||||||||||
| McDonald's Corp. | 905 | 112,021 | |||||||||||||||||||||||||||
| Sonic Corp. | 1,400 | 41,132 | |||||||||||||||||||||||||||
| Starbucks Corp. | 1,481 | 90,000 | |||||||||||||||||||||||||||
| Household durables 0.1% | |||||||||||||||||||||||||||||
| Lennar Corp., Class A | 546 | 23,014 | |||||||||||||||||||||||||||
| NVR, Inc. (I) | 20 | 33,020 | |||||||||||||||||||||||||||
| Internet and catalog retail 0.6% | |||||||||||||||||||||||||||||
| Amazon.com, Inc. (I) | 284 | 166,708 | |||||||||||||||||||||||||||
| The Priceline Group, Inc. (I) | 47 | 50,054 | |||||||||||||||||||||||||||
| Media 0.4% | |||||||||||||||||||||||||||||
| Lions Gate Entertainment Corp. | 2,147 | 56,144 | |||||||||||||||||||||||||||
| The Walt Disney Company | 1,045 | 100,132 | |||||||||||||||||||||||||||
| Multiline retail 0.2% | |||||||||||||||||||||||||||||
| Macy's, Inc. | 1,803 | 72,859 | |||||||||||||||||||||||||||
| Specialty retail 1.5% | |||||||||||||||||||||||||||||
| Best Buy Company, Inc. | 1,915 | 53,486 | |||||||||||||||||||||||||||
| CarMax, Inc. (I) | 727 | 32,119 | |||||||||||||||||||||||||||
| Foot Locker, Inc. | 522 | 35,266 | |||||||||||||||||||||||||||
| Lowe's Companies, Inc. | 1,695 | 121,464 | |||||||||||||||||||||||||||
| O'Reilly Automotive, Inc. (I) | 123 | 32,091 | |||||||||||||||||||||||||||
| Restoration Hardware Holdings, Inc. (I) | 864 | 53,240 | |||||||||||||||||||||||||||
| Select Comfort Corp. (I) | 2,244 | 47,259 | |||||||||||||||||||||||||||
| The Finish Line, Inc., Class A | 2,349 | 44,490 | |||||||||||||||||||||||||||
| The Home Depot, Inc. | 185 | 23,266 | |||||||||||||||||||||||||||
| The TJX Companies, Inc. | 1,084 | 77,224 | |||||||||||||||||||||||||||
| Williams-Sonoma, Inc. | 626 | 32,339 | |||||||||||||||||||||||||||
| Textiles, apparel and luxury goods 0.7% | |||||||||||||||||||||||||||||
| adidas AG | 595 | 61,269 | |||||||||||||||||||||||||||
| Michael Kors Holdings, Ltd. (I) | 2,471 | 98,593 | |||||||||||||||||||||||||||
| Ralph Lauren Corp. | 901 | 101,363 | |||||||||||||||||||||||||||
| Shares | Value | ||||||||||||||||||||||||||||
| Consumer staples 3.0% | $1,130,291 | ||||||||||||||||||||||||||||
| Beverages 0.3% | |||||||||||||||||||||||||||||
| Heineken NV | 328 | 28,481 | |||||||||||||||||||||||||||
| PepsiCo, Inc. | 1,027 | 101,981 | |||||||||||||||||||||||||||
| Food and staples retailing 0.8% | |||||||||||||||||||||||||||||
| Costco Wholesale Corp. | 300 | 45,336 | |||||||||||||||||||||||||||
| CVS Health Corp. | 892 | 86,158 | |||||||||||||||||||||||||||
| Koninklijke Ahold NV | 4,696 | 106,222 | |||||||||||||||||||||||||||
| Wal-Mart Stores, Inc. | 764 | 50,699 | |||||||||||||||||||||||||||
| Food products 0.3% | |||||||||||||||||||||||||||||
| Danone SA | 519 | 35,746 | |||||||||||||||||||||||||||
| Mondelez International, Inc., Class A | 1,794 | 77,321 | |||||||||||||||||||||||||||
| Household products 0.5% | |||||||||||||||||||||||||||||
| The Procter & Gamble Company | 2,291 | 187,152 | |||||||||||||||||||||||||||
| Personal products 0.3% | |||||||||||||||||||||||||||||
| Pola Orbis Holdings, Inc. | 1,400 | 96,265 | |||||||||||||||||||||||||||
| Tobacco 0.8% | |||||||||||||||||||||||||||||
| British American Tobacco PLC | 1,865 | 103,924 | |||||||||||||||||||||||||||
| Japan Tobacco, Inc. | 2,400 | 93,993 | |||||||||||||||||||||||||||
| Philip Morris International, Inc. | 1,300 | 117,013 | |||||||||||||||||||||||||||
| Energy 1.6% | 608,036 | ||||||||||||||||||||||||||||
| Energy equipment and services 0.4% | |||||||||||||||||||||||||||||
| Schlumberger, Ltd. | 1,115 | 80,581 | |||||||||||||||||||||||||||
| Weatherford International PLC (I) | 9,458 | 63,747 | |||||||||||||||||||||||||||
| Oil, gas and consumable fuels 1.2% | |||||||||||||||||||||||||||||
| Apache Corp. | 2,168 | 92,227 | |||||||||||||||||||||||||||
| California Resources Corp. | 407 | 582 | |||||||||||||||||||||||||||
| Denbury Resources, Inc. | 11,724 | 18,289 | |||||||||||||||||||||||||||
| Devon Energy Corp. | 1,400 | 39,060 | |||||||||||||||||||||||||||
| EOG Resources, Inc. | 673 | 47,796 | |||||||||||||||||||||||||||
| Occidental Petroleum Corp. | 1,018 | 70,069 | |||||||||||||||||||||||||||
| Range Resources Corp. | 1,854 | 54,804 | |||||||||||||||||||||||||||
| Royal Dutch Shell PLC, A Shares | 3,470 | 75,804 | |||||||||||||||||||||||||||
| Total SA | 1,465 | 65,077 | |||||||||||||||||||||||||||
| Financials 5.6% | 2,094,265 | ||||||||||||||||||||||||||||
| Banks 4.7% | |||||||||||||||||||||||||||||
| Bank of America Corp. | 16,151 | 228,375 | |||||||||||||||||||||||||||
| Barclays PLC | 26,590 | 71,151 | |||||||||||||||||||||||||||
| BB&T Corp. | 1,687 | 55,097 | |||||||||||||||||||||||||||
| Citigroup, Inc. | 4,564 | 194,335 | |||||||||||||||||||||||||||
| HSBC Holdings PLC | 14,525 | 102,438 | |||||||||||||||||||||||||||
| ICICI Bank, Ltd., ADR | 8,126 | 54,038 | |||||||||||||||||||||||||||
| JPMorgan Chase & Co. | 4,161 | 247,580 | |||||||||||||||||||||||||||
| Shares | Value | ||||||||||||||||||||||||||||
| Financials (continued) | |||||||||||||||||||||||||||||
| Banks (continued) | |||||||||||||||||||||||||||||
| KeyCorp | 4,308 | $48,077 | |||||||||||||||||||||||||||
| Regions Financial Corp. | 5,339 | 43,353 | |||||||||||||||||||||||||||
| Sumitomo Mitsui Financial Group, Inc. | 2,700 | 90,581 | |||||||||||||||||||||||||||
| SVB Financial Group (I) | 1,132 | 114,694 | |||||||||||||||||||||||||||
| U.S. Bancorp | 4,985 | 199,699 | |||||||||||||||||||||||||||
| UniCredit SpA | 12,126 | 46,877 | |||||||||||||||||||||||||||
| Wells Fargo & Company | 5,046 | 253,461 | |||||||||||||||||||||||||||
| Capital markets 0.6% | |||||||||||||||||||||||||||||
| Morgan Stanley | 1,812 | 46,895 | |||||||||||||||||||||||||||
| The Blackstone Group LP | 1,916 | 50,333 | |||||||||||||||||||||||||||
| The Goldman Sachs Group, Inc. | 698 | 112,769 | |||||||||||||||||||||||||||
| Consumer finance 0.1% | |||||||||||||||||||||||||||||
| Discover Financial Services | 885 | 40,524 | |||||||||||||||||||||||||||
| Insurance 0.2% | |||||||||||||||||||||||||||||
| The Dai-ichi Life Insurance Company, Ltd. | 6,800 | 93,988 | |||||||||||||||||||||||||||
| Health care 4.5% | 1,677,586 | ||||||||||||||||||||||||||||
| Biotechnology 1.2% | |||||||||||||||||||||||||||||
| Alexion Pharmaceuticals, Inc. (I) | 388 | 56,621 | |||||||||||||||||||||||||||
| Amgen, Inc. | 591 | 90,263 | |||||||||||||||||||||||||||
| Biogen, Inc. (I) | 528 | 144,176 | |||||||||||||||||||||||||||
| Celgene Corp. (I) | 498 | 49,959 | |||||||||||||||||||||||||||
| Gilead Sciences, Inc. | 1,329 | 110,307 | |||||||||||||||||||||||||||
| Health care equipment and supplies 0.3% | |||||||||||||||||||||||||||||
| Medtronic PLC | 1,375 | 104,390 | |||||||||||||||||||||||||||
| Health care providers and services 0.1% | |||||||||||||||||||||||||||||
| McKesson Corp. | 268 | 43,143 | |||||||||||||||||||||||||||
| Life sciences tools and services 0.2% | |||||||||||||||||||||||||||||
| Thermo Fisher Scientific, Inc. | 595 | 78,576 | |||||||||||||||||||||||||||
| Pharmaceuticals 2.7% | |||||||||||||||||||||||||||||
| Allergan PLC (I) | 382 | 108,652 | |||||||||||||||||||||||||||
| Bristol-Myers Squibb Company | 652 | 40,528 | |||||||||||||||||||||||||||
| GlaxoSmithKline PLC | 4,373 | 90,086 | |||||||||||||||||||||||||||
| Johnson & Johnson | 2,025 | 211,491 | |||||||||||||||||||||||||||
| Merck & Company, Inc. | 1,820 | 92,219 | |||||||||||||||||||||||||||
| Novartis AG | 2,405 | 186,324 | |||||||||||||||||||||||||||
| Pfizer, Inc. | 3,324 | 101,349 | |||||||||||||||||||||||||||
| Roche Holding AG | 490 | 126,922 | |||||||||||||||||||||||||||
| Shire PLC, ADR | 253 | 42,580 | |||||||||||||||||||||||||||
| Industrials 2.0% | 748,072 | ||||||||||||||||||||||||||||
| Aerospace and defense 0.9% | |||||||||||||||||||||||||||||
| General Dynamics Corp. | 748 | 100,060 | |||||||||||||||||||||||||||
| Shares | Value | ||||||||||||||||||||||||||||
| Industrials (continued) | |||||||||||||||||||||||||||||
| Aerospace and defense (continued) | |||||||||||||||||||||||||||||
| Safran SA | 702 | $45,477 | |||||||||||||||||||||||||||
| The Boeing Company | 519 | 62,347 | |||||||||||||||||||||||||||
| TransDigm Group, Inc. (I) | 238 | 53,486 | |||||||||||||||||||||||||||
| United Technologies Corp. | 575 | 50,422 | |||||||||||||||||||||||||||
| Air freight and logistics 0.1% | |||||||||||||||||||||||||||||
| FedEx Corp. | 296 | 39,332 | |||||||||||||||||||||||||||
| Airlines 0.1% | |||||||||||||||||||||||||||||
| American Airlines Group, Inc. | 1,034 | 40,316 | |||||||||||||||||||||||||||
| Industrial conglomerates 0.7% | |||||||||||||||||||||||||||||
| Danaher Corp. | 954 | 82,664 | |||||||||||||||||||||||||||
| General Electric Company | 4,089 | 118,990 | |||||||||||||||||||||||||||
| Rheinmetall AG | 970 | 69,306 | |||||||||||||||||||||||||||
| Machinery 0.1% | |||||||||||||||||||||||||||||
| Hoshizaki Electric Company, Ltd. | 700 | 48,952 | |||||||||||||||||||||||||||
| Road and rail 0.1% | |||||||||||||||||||||||||||||
| Union Pacific Corp. | 510 | 36,720 | |||||||||||||||||||||||||||
| Information technology 4.8% | 1,790,487 | ||||||||||||||||||||||||||||
| Communications equipment 0.4% | |||||||||||||||||||||||||||||
| Cisco Systems, Inc. | 4,122 | 98,062 | |||||||||||||||||||||||||||
| QUALCOMM, Inc. | 1,446 | 65,562 | |||||||||||||||||||||||||||
| Internet software and services 1.0% | |||||||||||||||||||||||||||||
| Alphabet, Inc., Class A (I) | 289 | 220,030 | |||||||||||||||||||||||||||
| Alphabet, Inc., Class C (I) | 89 | 66,123 | |||||||||||||||||||||||||||
| Facebook, Inc., Class A (I) | 916 | 102,784 | |||||||||||||||||||||||||||
| IT services 0.5% | |||||||||||||||||||||||||||||
| Automatic Data Processing, Inc. | 384 | 31,907 | |||||||||||||||||||||||||||
| Visa, Inc., Class A | 1,912 | 142,425 | |||||||||||||||||||||||||||
| Semiconductors and semiconductor equipment 0.7% | |||||||||||||||||||||||||||||
| Applied Materials, Inc. | 7,465 | 131,757 | |||||||||||||||||||||||||||
| NXP Semiconductors NV (I) | 1,505 | 112,544 | |||||||||||||||||||||||||||
| Software 0.8% | |||||||||||||||||||||||||||||
| Electronic Arts, Inc. (I) | 413 | 26,657 | |||||||||||||||||||||||||||
| Microsoft Corp. | 4,280 | 235,785 | |||||||||||||||||||||||||||
| Synchronoss Technologies, Inc. (I) | 1,481 | 45,378 | |||||||||||||||||||||||||||
| Technology hardware, storage and peripherals 1.4% | |||||||||||||||||||||||||||||
| Apple, Inc. | 3,380 | 329,009 | |||||||||||||||||||||||||||
| Lenovo Group, Ltd. | 54,000 | 48,472 | |||||||||||||||||||||||||||
| Samsung Electronics Company, Ltd., GDR | 112 | 53,146 | |||||||||||||||||||||||||||
| Seagate Technology PLC | 2,783 | 80,846 | |||||||||||||||||||||||||||
| Shares | Value | ||||||||||||||||||||||||||||
| Materials 0.6% | $235,183 | ||||||||||||||||||||||||||||
| Chemicals 0.2% | |||||||||||||||||||||||||||||
| Akzo Nobel NV | 628 | 40,284 | |||||||||||||||||||||||||||
| The Sherwin-Williams Company | 191 | 48,833 | |||||||||||||||||||||||||||
| Containers and packaging 0.4% | |||||||||||||||||||||||||||||
| Amcor, Ltd. | 5,924 | 56,491 | |||||||||||||||||||||||||||
| Avery Dennison Corp. | 1,209 | 73,616 | |||||||||||||||||||||||||||
| Metals and mining 0.0% | |||||||||||||||||||||||||||||
| Anglo American PLC | 1,773 | 7,072 | |||||||||||||||||||||||||||
| Freeport-McMoRan, Inc. | 1,932 | 8,887 | |||||||||||||||||||||||||||
| Telecommunication services 1.3% | 473,479 | ||||||||||||||||||||||||||||
| Diversified telecommunication services 1.0% | |||||||||||||||||||||||||||||
| Koninklijke KPN NV | 30,467 | 117,897 | |||||||||||||||||||||||||||
| Nippon Telegraph & Telephone Corp. | 4,200 | 178,805 | |||||||||||||||||||||||||||
| Telefonica SA | 8,046 | 84,921 | |||||||||||||||||||||||||||
| Wireless telecommunication services 0.3% | |||||||||||||||||||||||||||||
| Vodafone Group PLC | 28,577 | 91,856 | |||||||||||||||||||||||||||
| Preferred securities 1.0% | $386,195 | ||||||||||||||||||||||||||||
| (Cost $466,767) | |||||||||||||||||||||||||||||
| Financials 0.8% | 311,456 | ||||||||||||||||||||||||||||
| Banks 0.4% | |||||||||||||||||||||||||||||
| Regions Financial Corp., 6.375% | 1,935 | 50,465 | |||||||||||||||||||||||||||
| The PNC Financial Services Group, Inc. (6.125% to 5-1-22, then 3 month LIBOR + 4.067%) | 2,150 | 59,942 | |||||||||||||||||||||||||||
| U.S. Bancorp (6.000% to 4-15-17, then 3 month LIBOR + 4.861%) | 1,700 | 44,982 | |||||||||||||||||||||||||||
| Wells Fargo & Company, Series L, 7.500% | 18 | 21,096 | |||||||||||||||||||||||||||
| Capital markets 0.1% | |||||||||||||||||||||||||||||
| The Goldman Sachs Group, Inc. (5.500% to 5-10-23, then 3 month LIBOR + 3.640%) | 1,200 | 29,964 | |||||||||||||||||||||||||||
| Consumer finance 0.1% | |||||||||||||||||||||||||||||
| Discover Financial Services, 6.500% | 1,100 | 28,545 | |||||||||||||||||||||||||||
| Diversified financial services 0.1% | |||||||||||||||||||||||||||||
| GMAC Capital Trust I (8.125% to 2-15-16, then 3 month LIBOR + 5.785%) | 2,104 | 53,547 | |||||||||||||||||||||||||||
| Real estate investment trusts 0.1% | |||||||||||||||||||||||||||||
| Weyerhaeuser Company, 6.375% | 500 | 22,915 | |||||||||||||||||||||||||||
| Telecommunication services 0.1% | 19,620 | ||||||||||||||||||||||||||||
| Diversified telecommunication services 0.1% | |||||||||||||||||||||||||||||
| Intelsat SA, 5.750% | 2,000 | 19,620 | |||||||||||||||||||||||||||
| Shares | Value | ||||||||||||||||||||||||||||
| Utilities 0.1% | $55,119 | ||||||||||||||||||||||||||||
| Electric utilities 0.0% | |||||||||||||||||||||||||||||
| Exelon Corp., 6.500% | 364 | 15,659 | |||||||||||||||||||||||||||
| Multi-utilities 0.1% | |||||||||||||||||||||||||||||
| Dominion Resources, Inc., 6.375% | 793 | 39,460 | |||||||||||||||||||||||||||
| Investment companies 17.1% | $6,387,532 | ||||||||||||||||||||||||||||
| (Cost $7,124,862) | |||||||||||||||||||||||||||||
| Exchange-traded funds 17.1% | 6,387,532 | ||||||||||||||||||||||||||||
| Energy Select Sector SPDR Fund | 717 | 41,758 | |||||||||||||||||||||||||||
| Financial Select Sector SPDR Fund | 26,900 | 583,999 | |||||||||||||||||||||||||||
| iShares Global Infrastructure ETF | 3,400 | 122,094 | |||||||||||||||||||||||||||
| iShares MSCI India ETF | 8,460 | 220,298 | |||||||||||||||||||||||||||
| iShares MSCI India Small-Cap ETF | 2,885 | 87,271 | |||||||||||||||||||||||||||
| iShares MSCI Ireland Capped ETF | 5,005 | 194,094 | |||||||||||||||||||||||||||
| iShares MSCI South Korea Capped ETF | 7,325 | 349,696 | |||||||||||||||||||||||||||
| iShares MSCI Taiwan ETF | 28,850 | 356,009 | |||||||||||||||||||||||||||
| iShares MSCI USA Quality Factor ETF | 1,650 | 101,673 | |||||||||||||||||||||||||||
| iShares TIPS Bond ETF | 324 | 36,094 | |||||||||||||||||||||||||||
| iShares U.S. Oil & Gas Exploration & Production ETF | 1,478 | 72,555 | |||||||||||||||||||||||||||
| Market Vectors Oil Services ETF | 2,925 | 71,019 | |||||||||||||||||||||||||||
| Materials Select Sector SPDR Fund | 1,390 | 53,876 | |||||||||||||||||||||||||||
| PowerShares DB Agriculture Fund (I) | 2,609 | 52,154 | |||||||||||||||||||||||||||
| PowerShares DB Commodity Index Tracking Fund (I) | 3,551 | 45,382 | |||||||||||||||||||||||||||
| PowerShares DB Energy Fund (I) | 8,044 | 82,531 | |||||||||||||||||||||||||||
| PowerShares DB Gold Fund (I) | 3,937 | 143,622 | |||||||||||||||||||||||||||
| PowerShares S&P 500 High Quality Portfolio | 13,700 | 310,442 | |||||||||||||||||||||||||||
| SPDR Barclays High Yield Bond ETF | 21,000 | 697,410 | |||||||||||||||||||||||||||
| SPDR EURO STOXX 50 ETF | 3,620 | 117,035 | |||||||||||||||||||||||||||
| SPDR S&P China ETF | 1,925 | 123,412 | |||||||||||||||||||||||||||
| SPDR S&P Global Natural Resources ETF | 1,654 | 49,670 | |||||||||||||||||||||||||||
| SPDR S&P Homebuilders ETF | 10,450 | 318,934 | |||||||||||||||||||||||||||
| The Health Care Select Sector SPDR Fund | 675 | 44,867 | |||||||||||||||||||||||||||
| Vanguard Consumer Discretionary ETF | 2,925 | 337,633 | |||||||||||||||||||||||||||
| Vanguard Dividend Appreciation ETF | 4,100 | 311,600 | |||||||||||||||||||||||||||
| Vanguard Global ex-U.S. Real Estate ETF | 1,175 | 57,176 | |||||||||||||||||||||||||||
| Vanguard Information Technology ETF | 6,750 | 687,825 | |||||||||||||||||||||||||||
| Vanguard REIT ETF | 866 | 66,656 | |||||||||||||||||||||||||||
| Vanguard Telecommunication Services ETF | 2,815 | 239,191 | |||||||||||||||||||||||||||
| WisdomTree Europe SmallCap Dividend Fund | 4,715 | 249,235 | |||||||||||||||||||||||||||
| WisdomTree Germany Hedged Equity Fund | 545 | 13,647 | |||||||||||||||||||||||||||
| WisdomTree International SmallCap Dividend Fund | 2,290 | 125,607 | |||||||||||||||||||||||||||
| WisdomTree Japan Hedged Equity Fund | 485 | 23,067 | |||||||||||||||||||||||||||
| Rate (%) | Maturity date | Par value^ | Value | ||||||||||||||||||||||||||
| Short-term investments 1.3% | $499,869 | ||||||||||||||||||||||||||||
| (Cost $499,854) | |||||||||||||||||||||||||||||
| Commercial paper 1.3% | 499,869 | ||||||||||||||||||||||||||||
| Intercontinental Exchange, Inc. | 0.500 | 03-14-16 | 250,000 | 249,872 | |||||||||||||||||||||||||
| Washington Gas Light Company | 0.400 | 02-01-16 | 250,000 | 249,997 | |||||||||||||||||||||||||
| Total investments (Cost $36,983,568)† 93.7% | $35,082,839 | ||||||||||||||||||||||||||||
| Other assets and liabilities, net 6.3% | $2,350,456 | ||||||||||||||||||||||||||||
| Total net assets 100.0% | $37,433,295 | ||||||||||||||||||||||||||||
| The percentage shown for each investment category is the total value of the category as a percentage of the net assets of the fund. | |||||||||||||||||||||||||||||
| ^All par values are denominated in U.S. dollars unless otherwise indicated. | |||||||||||||||||||||||||||||
| Key to Currency Abbreviations | |||||||||||||||||||||||||||||
| BRL | Brazilian Real | ||||||||||||||||||||||||||||
| MXN | Mexican Peso | ||||||||||||||||||||||||||||
| Key to Security Abbreviations and Legend | |||||||||||||||||||||||||||||
| ADR | American Depositary Receipts | ||||||||||||||||||||||||||||
| ETF | Exchange-Traded Fund | ||||||||||||||||||||||||||||
| GDR | Global Depositary Receipts | ||||||||||||||||||||||||||||
| IO | Interest Only Security — (Interest Tranche of Stripped Mortgage Pool). Rate shown is the effective yield at period end. | ||||||||||||||||||||||||||||
| LIBOR | London Interbank Offered Rate | ||||||||||||||||||||||||||||
| PIK | Payment-in-kind | ||||||||||||||||||||||||||||
| (H) | Non-income producing - Issuer is in default. | ||||||||||||||||||||||||||||
| (I) | Non-income producing security. | ||||||||||||||||||||||||||||
| (M) | Term loans are variable rate obligations. The coupon rate shown represents the rate at period end. | ||||||||||||||||||||||||||||
| (P) | Variable rate obligation. The coupon rate shown represents the rate at period end. | ||||||||||||||||||||||||||||
| (Q) | Perpetual bonds have no stated maturity date. Date shown as maturity date is next call date. | ||||||||||||||||||||||||||||
| (S) | These securities are exempt from registration under Rule 144A of the Securities Act of 1933. Such securities may be resold, normally to qualified institutional buyers, in transactions exempt from registration. Rule 144A securities amounted to $5,781,456 or 15.4% of the fund's net assets as of 1-31-16. | ||||||||||||||||||||||||||||
| * | Yield represents either the annualized yield at the date of purchase, the stated coupon rate or, for floating rate securities, the rate at period end. | ||||||||||||||||||||||||||||
| † | At 1-31-16, the aggregate cost of investment securities for federal income tax purposes was $37,035,489. Net unrealized depreciation aggregated $1,952,650, of which $1,340,995 related to appreciated investment securities and $3,293,645 related to depreciated investment securities. | ||||||||||||||||||||||||||||
Financial statements
STATEMENT OF ASSETS AND LIABILITIES 1-31-16 (unaudited)
| Assets | ||||||||||||||||||||||||||||||
| Investments, at value (Cost $36,983,568) | $35,082,839 | |||||||||||||||||||||||||||||
| Cash | 1,952,859 | |||||||||||||||||||||||||||||
| Cash held at broker for futures contracts | 323,600 | |||||||||||||||||||||||||||||
| Receivable for investments sold | 586,194 | |||||||||||||||||||||||||||||
| Unrealized appreciation on forward foreign currency exchange contracts | 27,946 | |||||||||||||||||||||||||||||
| Dividends and interest receivable | 187,159 | |||||||||||||||||||||||||||||
| Other receivables and prepaid expenses | 150 | |||||||||||||||||||||||||||||
| Total assets | 38,160,747 | |||||||||||||||||||||||||||||
| Liabilities | ||||||||||||||||||||||||||||||
| Foreign currency overdraft, at value (cost $16) | 18 | |||||||||||||||||||||||||||||
| Payable for investments purchased | 536,339 | |||||||||||||||||||||||||||||
| Unrealized depreciation on forward foreign currency exchange contracts | 24,805 | |||||||||||||||||||||||||||||
| Payable for futures variation margin | 129,032 | |||||||||||||||||||||||||||||
| Payable to affiliates | ||||||||||||||||||||||||||||||
| Accounting and legal services fees | 911 | |||||||||||||||||||||||||||||
| Transfer agent fees | 7,613 | |||||||||||||||||||||||||||||
| Trustees' fees | 78 | |||||||||||||||||||||||||||||
| Other liabilities and accrued expenses | 28,656 | |||||||||||||||||||||||||||||
| Total liabilities | 727,452 | |||||||||||||||||||||||||||||
| Net assets | $37,433,295 | |||||||||||||||||||||||||||||
| Net assets consist of | ||||||||||||||||||||||||||||||
| Paid-in capital | $39,048,874 | |||||||||||||||||||||||||||||
| Undistributed net investment income | 48,902 | |||||||||||||||||||||||||||||
| Accumulated net realized gain (loss) on investments, futures contracts and foreign currency transactions | 203,846 | |||||||||||||||||||||||||||||
| Net unrealized appreciation (depreciation) on investments, futures contracts and translation of assets and liabilities in foreign currencies | (1,868,327 | ) | ||||||||||||||||||||||||||||
| Net assets | $37,433,295 | |||||||||||||||||||||||||||||
| Net asset value per share | ||||||||||||||||||||||||||||||
| Based on net asset values and shares outstanding-the fund has an unlimited number of shares authorized with no par value | ||||||||||||||||||||||||||||||
| Class A ($28,737,700 ÷ 3,000,000 shares)1 | $9.58 | |||||||||||||||||||||||||||||
| Class I ($8,695,595 ÷ 906,906 shares) | $9.59 | |||||||||||||||||||||||||||||
| Maximum offering price per share | ||||||||||||||||||||||||||||||
| Class A (net asset value per share ÷ 95%)2 | $10.08 | |||||||||||||||||||||||||||||
| 1 | Redemption price per share is equal to net asset value less any applicable contingent deferred sales charge. | ||||||||||||||||
| 2 | On single retail sales of less than $50,000. On sales of $50,000 or more and on group sales the offering price is reduced. | ||||||||||||||||
STATEMENT OF OPERATIONS For the six months ended 1-31-16 (unaudited)
| Investment income | ||||||||||||||||||||||||
| Interest | $416,428 | |||||||||||||||||||||||
| Dividends | 249,896 | |||||||||||||||||||||||
| Less foreign taxes withheld | (2,953 | ) | ||||||||||||||||||||||
| Total investment income | 663,371 | |||||||||||||||||||||||
| Expenses | ||||||||||||||||||||||||
| Investment management fees | 197,527 | |||||||||||||||||||||||
| Distribution and service fees | 45,475 | |||||||||||||||||||||||
| Accounting and legal services fees | 2,642 | |||||||||||||||||||||||
| Transfer agent fees | 23,704 | |||||||||||||||||||||||
| Trustees' fees | 350 | |||||||||||||||||||||||
| Professional fees | 22,014 | |||||||||||||||||||||||
| Custodian fees | 13,899 | |||||||||||||||||||||||
| Registration and filing fees | 7,522 | |||||||||||||||||||||||
| Other | 3,888 | |||||||||||||||||||||||
| Total expenses | 317,021 | |||||||||||||||||||||||
| Less expense reductions | (1,470 | ) | ||||||||||||||||||||||
| Net expenses | 315,551 | |||||||||||||||||||||||
| Net investment income | 347,820 | |||||||||||||||||||||||
| Realized and unrealized gain (loss) | ||||||||||||||||||||||||
| Net realized gain (loss) on | ||||||||||||||||||||||||
| Investments and foreign currency transactions | (63,084 | ) | ||||||||||||||||||||||
| Capital gain distributions received from unaffiliated underlying funds | 200 | |||||||||||||||||||||||
| Futures contracts | 376,385 | |||||||||||||||||||||||
| 313,501 | ||||||||||||||||||||||||
| Change in net unrealized appreciation (depreciation) of | ||||||||||||||||||||||||
| Investments and translation of assets and liabilities in foreign currencies | (3,052,588 | ) | ||||||||||||||||||||||
| Futures contracts | 1,597 | |||||||||||||||||||||||
| (3,050,991 | ) | |||||||||||||||||||||||
| Net realized and unrealized loss | (2,737,490 | ) | ||||||||||||||||||||||
| Decrease in net assets from operations | ($2,389,670 | ) | ||||||||||||||||||||||
STATEMENTS OF CHANGES IN NET ASSETS
| Six months ended 1-31-16 | Year ended 7-31-15 | ||||||||||||||||||||||||||||||||||||||||||||
| (unaudited) | |||||||||||||||||||||||||||||||||||||||||||||
| Increase (decrease) in net assets | |||||||||||||||||||||||||||||||||||||||||||||
| From operations | |||||||||||||||||||||||||||||||||||||||||||||
| Net investment income | $347,820 | $829,791 | |||||||||||||||||||||||||||||||||||||||||||
| Net realized gain | 313,501 | 408,471 | |||||||||||||||||||||||||||||||||||||||||||
| Change in net unrealized appreciation (depreciation) | (3,050,991 | ) | (809,011 | ) | |||||||||||||||||||||||||||||||||||||||||
| Increase (decrease) in net assets resulting from operations | (2,389,670 | ) | 429,251 | ||||||||||||||||||||||||||||||||||||||||||
| Distributions to shareholders | |||||||||||||||||||||||||||||||||||||||||||||
| From net investment income | |||||||||||||||||||||||||||||||||||||||||||||
| Class A | (676,620 | ) | (939,060 | ) | |||||||||||||||||||||||||||||||||||||||||
| Class I | (234,406 | ) | (312,957 | ) | |||||||||||||||||||||||||||||||||||||||||
| From net realized gain | |||||||||||||||||||||||||||||||||||||||||||||
| Class A | (26,880 | ) | (846,960 | ) | |||||||||||||||||||||||||||||||||||||||||
| Class I | (8,124 | ) | (254,088 | ) | |||||||||||||||||||||||||||||||||||||||||
| Total distributions | (946,030 | ) | (2,353,065 | ) | |||||||||||||||||||||||||||||||||||||||||
| From fund share transactions | 1,797 | 70,264 | |||||||||||||||||||||||||||||||||||||||||||
| Total decrease | (3,333,903 | ) | (1,853,550 | ) | |||||||||||||||||||||||||||||||||||||||||
| Net assets | |||||||||||||||||||||||||||||||||||||||||||||
| Beginning of period | 40,767,198 | 42,620,748 | |||||||||||||||||||||||||||||||||||||||||||
| End of period | $37,433,295 | $40,767,198 | |||||||||||||||||||||||||||||||||||||||||||
| Undistributed net investment income | $48,902 | $612,108 | |||||||||||||||||||||||||||||||||||||||||||
Financial highlights
| Class A Shares Period ended | 1-31-16 | 1 | 7-31-15 | 7-31-14 | 7-31-13 | 7-31-12 | 2 | ||||||||||||||||||||||||||||||||||||||||||||||||||||||||||||||||||||||||||||||||||||||||||||||||
| Per share operating performance | |||||||||||||||||||||||||||||||||||||||||||||||||||||||||||||||||||||||||||||||||||||||||||||||||||||||
| Net asset value, beginning of period | $10.43 | $10.92 | $11.07 | $11.04 | $10.00 | ||||||||||||||||||||||||||||||||||||||||||||||||||||||||||||||||||||||||||||||||||||||||||||||||||
| Net investment income3 | 0.09 | 0.21 | 0.31 | 0.39 | 0.32 | ||||||||||||||||||||||||||||||||||||||||||||||||||||||||||||||||||||||||||||||||||||||||||||||||||
| Net realized and unrealized gain (loss) on investments | (0.70 | ) | (0.10 | ) | 0.42 | 0.24 | 0.84 | ||||||||||||||||||||||||||||||||||||||||||||||||||||||||||||||||||||||||||||||||||||||||||||||||
| Total from investment operations | (0.61 | ) | 0.11 | 0.73 | 0.63 | 1.16 | |||||||||||||||||||||||||||||||||||||||||||||||||||||||||||||||||||||||||||||||||||||||||||||||||
| Less distributions | |||||||||||||||||||||||||||||||||||||||||||||||||||||||||||||||||||||||||||||||||||||||||||||||||||||||
| From net investment income | (0.23 | ) | (0.32 | ) | (0.35 | ) | (0.42 | ) | (0.10 | ) | |||||||||||||||||||||||||||||||||||||||||||||||||||||||||||||||||||||||||||||||||||||||||||||
| From net realized gain | (0.01 | ) | (0.28 | ) | (0.53 | ) | (0.18 | ) | (0.02 | ) | |||||||||||||||||||||||||||||||||||||||||||||||||||||||||||||||||||||||||||||||||||||||||||||
| Total distributions | (0.24 | ) | (0.60 | ) | (0.88 | ) | (0.60 | ) | (0.12 | ) | |||||||||||||||||||||||||||||||||||||||||||||||||||||||||||||||||||||||||||||||||||||||||||||
| Net asset value, end of period | $9.58 | $10.43 | $10.92 | $11.07 | $11.04 | ||||||||||||||||||||||||||||||||||||||||||||||||||||||||||||||||||||||||||||||||||||||||||||||||||
| Total return (%)4,5 | (5.97 | ) 6 | 1.07 | 6.89 | 5.81 | 11.65 | 6 | ||||||||||||||||||||||||||||||||||||||||||||||||||||||||||||||||||||||||||||||||||||||||||||||||
| Ratios and supplemental data | |||||||||||||||||||||||||||||||||||||||||||||||||||||||||||||||||||||||||||||||||||||||||||||||||||||||
| Net assets, end of period (in millions) | $29 | $31 | $33 | $33 | $33 | ||||||||||||||||||||||||||||||||||||||||||||||||||||||||||||||||||||||||||||||||||||||||||||||||||
| Ratios (as a percentage of average net assets): | |||||||||||||||||||||||||||||||||||||||||||||||||||||||||||||||||||||||||||||||||||||||||||||||||||||||
| Expenses before reductions7 | 1.68 | 8 | 1.66 | 1.62 | 1.23 | 1.35 | 8 | ||||||||||||||||||||||||||||||||||||||||||||||||||||||||||||||||||||||||||||||||||||||||||||||||
| Expenses including reductions7 | 1.67 | 8 | 1.66 | 1.60 | 1.14 | 1.17 | 8 | ||||||||||||||||||||||||||||||||||||||||||||||||||||||||||||||||||||||||||||||||||||||||||||||||
| Net investment income | 1.69 | 8 | 1.93 | 2.87 | 3.50 | 3.60 | 8 | ||||||||||||||||||||||||||||||||||||||||||||||||||||||||||||||||||||||||||||||||||||||||||||||||
| Portfolio turnover (%) | 23 | 62 | 119 | 40 | 21 | ||||||||||||||||||||||||||||||||||||||||||||||||||||||||||||||||||||||||||||||||||||||||||||||||||
| 1 | Six months ended 1-31-16. Unaudited. | ||||||||||||||||||||||||||||||||||||||||||||||||||||||||||||||||||||||||||||||||||
| 2 | Period from 9-30-11 (commencement of operations) to 7-31-12. | ||||||||||||||||||||||||||||||||||||||||||||||||||||||||||||||||||||||||||||||||||
| 3 | Based on average daily shares outstanding. | ||||||||||||||||||||||||||||||||||||||||||||||||||||||||||||||||||||||||||||||||||
| 4 | Total returns would have been lower had certain expenses not been reduced during the applicable periods. | ||||||||||||||||||||||||||||||||||||||||||||||||||||||||||||||||||||||||||||||||||
| 5 | Does not reflect the effect of sales charges, if any. | ||||||||||||||||||||||||||||||||||||||||||||||||||||||||||||||||||||||||||||||||||
| 6 | Not annualized. | ||||||||||||||||||||||||||||||||||||||||||||||||||||||||||||||||||||||||||||||||||
| 7 | Ratios do not include expenses indirectly incurred from underlying funds whose expense ratios can vary based on the mix of underlying funds held by the fund. The range of expense ratios of the underlying funds held by the fund was as follows: 0.10%-0.89%, 0.10%-0.93%, 0.10%-1.01%, 0.74%-1.42%, and 0.75%-1.43% for the periods ended 1-31-16, 7-31-15, 7-31-14, 7-31-13, and 7-31-12, respectively. | ||||||||||||||||||||||||||||||||||||||||||||||||||||||||||||||||||||||||||||||||||
| 8 | Annualized. | ||||||||||||||||||||||||||||||||||||||||||||||||||||||||||||||||||||||||||||||||||
| Class I Shares Period ended | 1-31-16 | 1 | 7-31-15 | 7-31-14 | 7-31-13 | 7-31-12 | 2 | ||||||||||||||||||||||||||||||||||||||||||||||||||||||||||||||||||||||||||||||||||||||||||||||||
| Per share operating performance | |||||||||||||||||||||||||||||||||||||||||||||||||||||||||||||||||||||||||||||||||||||||||||||||||||||||
| Net asset value, beginning of period | $10.46 | $10.95 | $11.10 | $11.06 | $10.00 | ||||||||||||||||||||||||||||||||||||||||||||||||||||||||||||||||||||||||||||||||||||||||||||||||||
| Net investment income3 | 0.10 | 0.24 | 0.35 | 0.43 | 0.35 | ||||||||||||||||||||||||||||||||||||||||||||||||||||||||||||||||||||||||||||||||||||||||||||||||||
| Net realized and unrealized gain (loss) on investments | (0.70 | ) | (0.10 | ) | 0.42 | 0.25 | 0.84 | ||||||||||||||||||||||||||||||||||||||||||||||||||||||||||||||||||||||||||||||||||||||||||||||||
| Total from investment operations | (0.60 | ) | 0.14 | 0.77 | 0.68 | 1.19 | |||||||||||||||||||||||||||||||||||||||||||||||||||||||||||||||||||||||||||||||||||||||||||||||||
| Less distributions | |||||||||||||||||||||||||||||||||||||||||||||||||||||||||||||||||||||||||||||||||||||||||||||||||||||||
| From net investment income | (0.26 | ) | (0.35 | ) | (0.39 | ) | (0.46 | ) | (0.11 | ) | |||||||||||||||||||||||||||||||||||||||||||||||||||||||||||||||||||||||||||||||||||||||||||||
| From net realized gain | (0.01 | ) | (0.28 | ) | (0.53 | ) | (0.18 | ) | (0.02 | ) | |||||||||||||||||||||||||||||||||||||||||||||||||||||||||||||||||||||||||||||||||||||||||||||
| Total distributions | (0.27 | ) | (0.63 | ) | (0.92 | ) | (0.64 | ) | (0.13 | ) | |||||||||||||||||||||||||||||||||||||||||||||||||||||||||||||||||||||||||||||||||||||||||||||
| Net asset value, end of period | $9.59 | $10.46 | $10.95 | $11.10 | $11.06 | ||||||||||||||||||||||||||||||||||||||||||||||||||||||||||||||||||||||||||||||||||||||||||||||||||
| Total return (%)4 | (5.83 | ) 5 | 1.40 | 7.19 | 6.30 | 11.96 | 5 | ||||||||||||||||||||||||||||||||||||||||||||||||||||||||||||||||||||||||||||||||||||||||||||||||
| Ratios and supplemental data | |||||||||||||||||||||||||||||||||||||||||||||||||||||||||||||||||||||||||||||||||||||||||||||||||||||||
| Net assets, end of period (in millions) | $9 | $9 | $10 | $10 | $10 | ||||||||||||||||||||||||||||||||||||||||||||||||||||||||||||||||||||||||||||||||||||||||||||||||||
| Ratios (as a percentage of average net assets): | |||||||||||||||||||||||||||||||||||||||||||||||||||||||||||||||||||||||||||||||||||||||||||||||||||||||
| Expenses before reductions6 | 1.36 | 7 | 1.35 | 1.30 | 0.86 | 0.95 | 7 | ||||||||||||||||||||||||||||||||||||||||||||||||||||||||||||||||||||||||||||||||||||||||||||||||
| Expenses including reductions6 | 1.36 | 7 | 1.35 | 1.28 | 0.77 | 0.78 | 7 | ||||||||||||||||||||||||||||||||||||||||||||||||||||||||||||||||||||||||||||||||||||||||||||||||
| Net investment income | 2.00 | 7 | 2.24 | 3.19 | 3.87 | 3.99 | 7 | ||||||||||||||||||||||||||||||||||||||||||||||||||||||||||||||||||||||||||||||||||||||||||||||||
| Portfolio turnover (%) | 23 | 62 | 119 | 40 | 21 | ||||||||||||||||||||||||||||||||||||||||||||||||||||||||||||||||||||||||||||||||||||||||||||||||||
| 1 | Six months ended 1-31-16. Unaudited. | ||||||||||||||||||||||||||||||||||||||||||||||||||||||||||||||||||||||||||||||||||
| 2 | Period from 9-30-11 (commencement of operations) to 7-31-12. | ||||||||||||||||||||||||||||||||||||||||||||||||||||||||||||||||||||||||||||||||||
| 3 | Based on average daily shares outstanding. | ||||||||||||||||||||||||||||||||||||||||||||||||||||||||||||||||||||||||||||||||||
| 4 | Total returns would have been lower had certain expenses not been reduced during the applicable periods. | ||||||||||||||||||||||||||||||||||||||||||||||||||||||||||||||||||||||||||||||||||
| 5 | Not annualized. | ||||||||||||||||||||||||||||||||||||||||||||||||||||||||||||||||||||||||||||||||||
| 6 | Ratios do not include expenses indirectly incurred from underlying funds whose expense ratios can vary based on the mix of underlying funds held by the fund. The range of expense ratios of the underlying funds held by the fund was as follows: 0.10%-0.89%, 0.10%-0.93%, 0.10%-1.01%, 0.74%-1.42%, and 0.75%-1.43% for the periods ended 1-31-16, 7-31-15, 7-31-14, 7-31-13, and 7-31-12, respectively. | ||||||||||||||||||||||||||||||||||||||||||||||||||||||||||||||||||||||||||||||||||
| 7 | Annualized. | ||||||||||||||||||||||||||||||||||||||||||||||||||||||||||||||||||||||||||||||||||
Note 1 — Organization
John Hancock Diversified Strategies Fund (the fund) is a series of John Hancock Funds II (the Trust), an open-end management investment company organized as a Massachusetts business trust and registered under the Investment Company Act of 1940, as amended (the 1940 Act). The investment objective of the fund is to seek long-term total return.
The fund may offer multiple classes of shares. The shares currently offered are detailed in the Statement of assets and liabilities. Class A shares are offered to all investors. Class I shares are offered to institutions and certain investors. Shareholders of each class have exclusive voting rights to matters that affect that class. The distribution and service fees, if any, and transfer agent fees, for each class may differ.
Note 2 — Significant accounting policies
The financial statements have been prepared in conformity with accounting principles generally accepted in the United States of America (US GAAP), which require management to make certain estimates and assumptions as of the date of the financial statements. Actual results could differ from those estimates and those differences could be significant. The fund qualifies as an investment company under Topic 946 of Accounting Standards Codification of US GAAP.
Events or transactions occurring after the end of the fiscal period through the date that the financial statements were issued have been evaluated in the preparation of the financial statements. The following summarizes the significant accounting policies of the fund:
Security valuation. Investments are stated at value as of the close of regular trading on the New York Stock Exchange (NYSE), normally at 4:00 p.m., Eastern Time. In order to value the securities, the fund uses the following valuation techniques: Equity securities, including exchange-traded funds, held by the fund are valued at the last sale price or official closing price on the exchange or principal market where the security was acquired or most likely will be sold. In the event there were no sales during the day or closing prices are not available, the securities are valued using the last available bid price. Debt obligations are valued based on the evaluated prices provided by an independent pricing vendor or from broker-dealers. Independent pricing vendors utilize matrix pricing which takes into account factors such as institutional-size trading in similar groups of securities, yield, quality, coupon rate, maturity, type of issue, trading characteristics and other market data, as well as broker supplied prices. Futures contracts are valued at settlement prices, which are the official closing prices published by the exchange on which they trade. Foreign index futures that trade in the electronic trading market subsequent to the close of regular trading and have sufficient liquidity will be valued at the last traded price in the electronic trading market as of 4:00 p.m ET. Foreign securities and currencies, including forward foreign currency contracts, are valued in U.S. dollars, based on foreign currency exchange rates supplied by an independent pricing vendor. Securities that trade only in the over-the-counter (OTC) market are valued using bid prices.
Other portfolio securities and assets, for which reliable market quotations are not readily available, are valued at fair value as determined in good faith by the fund's Pricing Committee following procedures established by the Board of Trustees. The frequency with which these fair valuation procedures are used cannot be predicted and fair value securities may differ significantly from the value that would have been used had a ready market for such securities existed. Trading in foreign securities may be completed before the daily close of trading on the NYSE. Significant events at the issuer or market level may affect the values of securities between the time when the valuation of the securities is generally determined and the close of the NYSE. If a significant event occurs, these securities may be fair valued, as determined in good faith by the fund's Pricing Committee, following procedures established by the Board of Trustees. The fund uses fair value adjustment factors provided by an independent pricing vendor to value certain foreign securities in order to adjust for events that may occur between the close of foreign exchanges or markets and the close of the NYSE.
The fund uses a three-tier hierarchy to prioritize the pricing assumptions, referred to as inputs, used in valuation techniques to measure fair value. Level 1 includes securities valued using quoted prices in active markets for identical securities. Level 2 includes securities valued using other significant observable inputs. Observable inputs may include quoted prices for similar securities, interest rates, prepayment speeds and credit risk. Prices for securities valued using these inputs are received from independent pricing vendors and brokers and are based on an evaluation of the inputs described. Level 3 includes securities
valued using significant unobservable inputs when market prices are not readily available or reliable, including the fund's own assumptions in determining the fair value of investments. Factors used in determining value may include market or issuer specific events or trends, changes in interest rates and credit quality. The inputs or methodology used for valuing securities are not necessarily an indication of the risks associated with investing in those securities. Changes in valuation techniques and related inputs may result in transfers into or out of an assigned level within the disclosure hierarchy.
The following is a summary of the values by input classification of the fund's investments as of January 31, 2016, by major security category or type:
| Total value at 1-31-16 |
Level 1 quoted price |
Level 2 significant observable inputs |
Level 3 significant unobservable inputs |
|
| Corporate bonds | $7,420,314 | — | $7,420,314 | — |
| U.S. Government and Agency obligations | 5,139,453 | — | 5,139,453 | — |
| Foreign government obligations | 267,969 | — | 267,969 | — |
| Capital preferred securities | 207,463 | — | 207,463 | — |
| Convertible bonds | 12,300 | — | 12,300 | — |
| Term loans | 824,304 | — | 824,304 | — |
| Collateralized mortgage obligations | 2,152,307 | — | 2,152,307 | — |
| Asset backed securities | 741,167 | — | 741,167 | — |
| Common stocks | 11,043,966 | $8,328,876 | 2,715,090 | — |
| Preferred securities | 386,195 | 386,195 | — | — |
| Investment companies | 6,387,532 | 6,387,532 | — | — |
| Short-term investments | 499,869 | — | 499,869 | — |
| Total investments in securities | $35,082,839 | $15,102,603 | $19,980,236 | — |
| Other financial instruments | ||||
| Futures | $32,564 | $32,564 | — | — |
| Forward foreign currency contracts | $3,141 | — | $3,141 | — |
Security transactions and related investment income. Investment security transactions are accounted for on a trade date plus one basis for daily net asset value calculations. However, for financial reporting purposes, investment transactions are reported on trade date. Interest income is accrued as earned. Interest income includes coupon interest and amortization/accretion of premiums/discounts on debt securities. Debt obligations may be placed in a non-accrual status and related interest income may be reduced by stopping current accruals and writing off interest receivable when the collection of all or a portion of interest has become doubtful. Dividend income is recorded on the ex-date, except for dividends of foreign securities where the dividend may not be known until after the ex-date. In those cases, dividend income, net of withholding taxes, is recorded when the fund becomes aware of the dividends. Foreign taxes are provided for based on the fund's understanding of the tax rules and rates that exist in the foreign markets in which it invests. Gains and losses on securities sold are determined on the basis of identified cost and may include proceeds from litigation.
Inflation-indexed bonds. Inflation-indexed bonds are securities that generally have a lower coupon interest rate fixed at issuance but whose principal value is periodically adjusted based on a rate of inflation, such as the Consumer Price Index. Over the life of an inflation-indexed bond, interest is paid on the inflation adjusted principal value as described above. Increases in the principal amount of these securities are recorded as interest income. Decreases in the principal amount of these securities may reduce interest income to the extent of income previously recorded. Excess amounts are recorded as an adjustment to cost.
Foreign currency translation. Assets, including investments and liabilities denominated in foreign currencies, are translated into U.S. dollar values each day at the prevailing exchange rate. Purchases and sales of securities, income and expenses are translated into U.S. dollars at the prevailing exchange rate on the date of the transaction. The effect of changes
in foreign currency exchange rates on the value of securities is reflected as a component of the realized and unrealized gains (losses) on investments.
Funds that invest internationally generally carry more risk than funds that invest strictly in U.S. securities. These risks are heightened for investments in emerging markets. Risks can result from differences in economic and political conditions, regulations, market practices (including higher transaction costs), accounting standards and other factors. Foreign investments are also subject to a decline in the value of a foreign currency versus the U.S. dollar, which reduces the dollar value of securities denominated in that currency.
Foreign taxes. The fund may be subject to withholding tax on income and/or capital gains or repatriation taxes imposed by certain countries in which the fund invests. Taxes are accrued based upon investment income, realized gains or unrealized appreciation.
Line of credit. The fund may borrow from banks for temporary or emergency purposes, including meeting redemption requests that otherwise might require the untimely sale of securities. Pursuant to the fund's custodian agreement, the custodian may loan money to funds to make properly authorized payments. The fund is obligated to repay the custodian for any overdraft, including any related costs or expenses. The custodian may have a lien, security interest or security entitlement in any fund property that is not otherwise segregated or pledged, to the extent of any overdraft, and to the maximum extent permitted by law.
The fund and other affiliated funds have entered into a syndicated line of credit agreement, with Citibank, N.A. as the administrative agent, that enables them to participate in a $750 million unsecured committed line of credit. A commitment fee, payable at the end of each calendar quarter, based on the average daily unused portion of the effective line of credit, is charged to each participating fund on a pro rata basis and is reflected in Other expenses on the Statement of operations. Commitment fees for the six months ended January 31, 2016 were $262. For the six months ended January 31, 2016, the fund had no borrowings under the line of credit.
Expenses. Within the John Hancock group of funds complex, expenses that are directly attributable to an individual fund are allocated to such fund. Expenses that are not readily attributable to a specific fund are allocated among all funds in an equitable manner, taking into consideration, among other things, the nature and type of expense and the fund's relative net assets. Expense estimates are accrued in the period to which they relate and adjustments are made when actual amounts are known.
Class allocations. Income, common expenses and realized and unrealized gains (losses) are determined at the fund level and allocated daily to each class of shares based on the net assets of the class. Class-specific expenses, such as distribution and service fees, if any, and transfer agent fees, are calculated daily for each class, based on the net asset value of the class and the specific expense rates applicable to each class.
Federal income taxes. The fund intends to continue to qualify as a regulated investment company by complying with the applicable provisions of the Internal Revenue Code and will not be subject to federal income tax on taxable income that is distributed to shareholders. Therefore, no federal income tax provision is required.
As of July 31, 2015, the fund had no uncertain tax positions that would require financial statement recognition, derecognition or disclosure. The fund's federal tax returns are subject to examination by the Internal Revenue Service for a period of three years.
Distribution of income and gains. Distributions to shareholders from net investment income and net realized gains, if any, are recorded on the ex-date. The fund generally declares and pays dividends and capital gain distributions, if any, annually.
Distributions paid by the fund with respect to each class of shares are calculated in the same manner, at the same time and in the same amount, except for the effect of class level expenses that may be applied differently to each class.
Such distributions, on a tax basis, are determined in conformity with income tax regulations, which may differ from US GAAP.
Capital accounts within the financial statements are adjusted for permanent book-tax differences. These adjustments have no impact on net assets or the results of operations. Temporary book-tax differences, if any, will reverse in a subsequent period. Book-tax differences are primarily attributable to derivative transactions, foreign currency transactions, amortization and accretion on debt securities and wash sale loss deferrals.
Note 3 — Derivative instruments
The fund may invest in derivatives in order to meet its investment objective. Derivatives include a variety of different instruments that may be traded in the OTC market, on a regulated exchange or through a clearing facility. The risks in using derivatives vary depending upon the structure of the instruments, including the use of leverage, optionality, the liquidity or lack of liquidity of the contract, the creditworthiness of the counterparty or clearing organization and the volatility of the position. Some derivatives involve risks that are potentially greater than the risks associated with investing directly in the referenced securities or other referenced underlying instrument. Specifically, the fund is exposed to the risk that the counterparty to an OTC derivatives contract will be unable or unwilling to make timely settlement payments or otherwise honor its obligations. OTC derivatives transactions typically can only be closed out with the other party to the transaction.
Forward foreign currency contracts are typically traded through the OTC market. Certain forwards are regulated by the Commodity Futures Trading Commission as swaps. Derivative counterparty risk is managed through an ongoing evaluation of the creditworthiness of all potential counterparties and, if applicable, designated clearing organizations. The fund attempts to reduce its exposure to counterparty risk for derivatives traded in the OTC market, whenever possible, by entering into an International Swaps and Derivatives Association (ISDA) Master Agreement with each of its OTC counterparties. The ISDA gives each party to the agreement the right to terminate all transactions traded under the agreement if there is certain deterioration in the credit quality or contractual default of the other party, as defined in the ISDA. Upon an event of default or a termination of the ISDA, the non-defaulting party has the right to close out all transactions and to net amounts owed.
As defined by the ISDA, the fund may have collateral agreements with certain counterparties to mitigate counterparty risk on OTC derivatives. Subject to established minimum levels, collateral for OTC transactions is generally determined based on the net aggregate unrealized gain or loss on contracts with a particular counterparty. Collateral pledged to the fund is held in a segregated account by a third-party agent or held by the custodian bank for the benefit of the fund and can be in the form of cash or debt securities issued by the U.S. government or related agencies; collateral posted by the fund for OTC transactions is held in a segregated account at the fund's custodian and is noted in the accompanying Fund's investments, or if cash is posted, on the Statement of assets and liabilities. The fund's maximum risk of loss due to counterparty risk is equal to the asset value of outstanding contracts offset by collateral received.
Futures are traded on an exchange. Exchange-traded transactions generally present less counterparty risk to a fund than OTC transactions. The exchange or clearinghouse stands between the fund and the broker to the contract and therefore, credit risk is generally limited to the failure of the exchange.
Margin requirements for exchange-traded derivatives are set by the broker. Margin for exchange-traded transactions is detailed in the Statement of assets and liabilities as Cash held at broker for futures contracts.
Futures. A futures contract is a contractual agreement to buy or sell a particular currency or financial instrument at a predetermined price in the future. Risks related to the use of futures contracts include possible illiquidity of the futures markets, contract prices that can be highly volatile and imperfectly correlated to movements in the underlying financial instrument and potential losses in excess of the amounts recognized on the Statement of assets and liabilities. Use of long futures contracts subjects the fund to the risk of loss up to the notional value of the futures contracts. Use of short futures contracts subjects the fund to unlimited risk of loss.
Upon entering into a futures contract, the fund is required to deposit initial margin with the broker in the form of cash or securities. The amount of required margin is generally based on a percentage of the contract value; this amount is the initial margin for the trade. The margin deposit must then be maintained at the established level over the life of the contract. Futures margin receivable / payable is included on the Statement of assets and liabilities. Futures contracts are marked-to-market daily and an appropriate payable or receivable for the change in value (variation margin) and unrealized gain or loss is
recorded by the fund. When the contract is closed, the fund records a realized gain or loss equal to the difference between the value of the contract at the time it was opened and the value at the time it was closed.
During the six months ended January 31, 2016, the fund used futures contracts to manage against anticipated changes in securities markets and maintain diversity and liquidity of the portfolio. During the six months ended January 31, 2016, the fund held futures contracts with notional values ranging from $10.6 million to $11.6 million, as measured at each quarter end. The following table summarizes the contracts held at January 31, 2016:
| Open Contracts | Number of Contracts |
Position | Expiration Date |
Notional Basis |
Notional Value |
Unrealized Appreciation (Depreciation) |
||||||||||||||
| 3-Year Australian Treasury Bond Futures | 8 | Long | Mar 2016 | $629,218 | $634,113 | $4,895 | ||||||||||||||
| DAX Index Futures | 1 | Long | Mar 2016 | 274,523 | 264,217 | (10,306 | ) | |||||||||||||
| Euro-BTP Italian Government Bond Futures | 2 | Long | Mar 2016 | 298,780 | 303,194 | 4,414 | ||||||||||||||
| OMX Stockholm 30 Index Futures | 8 | Long | Feb 2016 | 124,882 | 126,119 | 1,237 | ||||||||||||||
| Ultra U.S. Treasury Bond Futures | 3 | Long | Mar 2016 | 473,280 | 498,562 | 25,282 | ||||||||||||||
| Nikkei 225 Index Futures | 1 | Long | Mar 2016 | 162,652 | 145,707 | (16,945 | ) | |||||||||||||
| CME E-mini Technology Sector Futures | 3 | Long | Mar 2016 | 128,830 | 123,660 | (5,170 | ) | |||||||||||||
| CME E-mini Consumer Staples Sector Futures | 4 | Long | Mar 2016 | 197,743 | 203,240 | 5,497 | ||||||||||||||
| CME E-mini Health Care Sector Futures | 1 | Long | Mar 2016 | 67,473 | 66,530 | (943 | ) | |||||||||||||
| 10-Year U.S. Treasury Note Futures | 11 | Short | Mar 2016 | (1,388,985 | ) | (1,425,359 | ) | (36,374 | ) | |||||||||||
| 2-Year U.S. Treasury Note Futures | 4 | Short | Mar 2016 | (870,116 | ) | (874,500 | ) | (4,384 | ) | |||||||||||
| 5-Year U.S. Treasury Note Futures | 5 | Short | Mar 2016 | (592,974 | ) | (603,359 | ) | (10,385 | ) | |||||||||||
| CAC 40 Index Futures | 5 | Short | Feb 2016 | (236,722 | ) | (238,922 | ) | (2,200 | ) | |||||||||||
| CME E-mini Utilities Sector Futures | 9 | Short | Mar 2016 | (373,841 | ) | (409,770 | ) | (35,929 | ) | |||||||||||
| Euro STOXX 50 Index Futures | 4 | Short | Mar 2016 | (134,215 | ) | (131,209 | ) | 3,006 | ||||||||||||
| German Euro BUND Futures | 5 | Short | Mar 2016 | (856,234 | ) | (884,786 | ) | (28,552 | ) | |||||||||||
| Mini MSCI EAFE Index Futures | 1 | Short | Mar 2016 | (80,155 | ) | (80,080 | ) | 75 | ||||||||||||
| Mini MSCI Emerging Markets Index Futures | 31 | Short | Mar 2016 | (1,178,354 | ) | (1,159,090 | ) | 19,264 | ||||||||||||
| MSCI Singapore Index Futures | 5 | Short | Feb 2016 | (101,457 | ) | (103,503 | ) | (2,046 | ) | |||||||||||
| Russell 2000 Mini Index Futures | 3 | Short | Mar 2016 | (335,318 | ) | (309,420 | ) | 25,898 | ||||||||||||
| S&P 500 Index E-Mini Futures | 30 | Short | Mar 2016 | (2,991,379 | ) | (2,895,149 | ) | 96,230 | ||||||||||||
| $32,564 |
Notional basis refers to the contractual amount agreed upon at inception of open contracts; notional value represents the current value of the open contract.
Forward foreign currency contracts. A forward foreign currency contract is an agreement between two parties to buy and sell specific currencies at a price that is set on the date of the contract. The forward contract calls for delivery of the currencies on a future date that is specified in the contract. Risks related to the use of forwards include the possible failure of counterparties to meet the terms of the forward agreement, the failure of the counterparties to timely post collateral if applicable, the risk that currency movements will not favor the fund thereby reducing the fund's total return, and the potential for losses in excess of the amounts recognized on the Statement of assets and liabilities.
The market value of a forward foreign currency contract fluctuates with changes in foreign currency exchange rates. Forward foreign currency contracts are marked-to-market daily and the change in value is recorded by the fund as an unrealized gain or loss. Realized gains or losses, equal to the difference between the value of the contract at the time it was opened and the value at the time it was closed, are recorded upon delivery or receipt of the currency or settlement with the counterparty.
During the six months ended January 31, 2016, the fund used forward foreign currency contracts to manage against anticipated currency exchange rates and to gain exposure to foreign currencies. During the six months ended January 31, 2016, the fund held forward foreign currency contracts with U.S. dollar notional values ranging from approximately $3.3
million to $4.4 million, as measured at each quarter end. The following table summarizes the contracts held at January 31, 2016:
| Contract to buy | Contract to sell | Counterparty | Contractual settlement date |
Unrealized appreciation |
Unrealized depreciation |
Net unrealized appreciation/ (depreciation) | ||||||||||||||||||||||||||
| CAD | 184,161 | USD | 130,000 | Royal Bank of Canada | 3/2/2016 | $1,459 | — | $1,459 | ||||||||||||||||||||||||
| EUR | 145,000 | USD | 157,540 | State Street Bank and Trust Company | 3/2/2016 | — | ($354 | ) | (354 | ) | ||||||||||||||||||||||
| GBP | 84,215 | USD | 126,335 | State Street Bank and Trust Company | 3/2/2016 | — | (6,333 | ) | (6,333 | ) | ||||||||||||||||||||||
| JPY | 32,590,318 | USD | 270,623 | Goldman Sachs Bank USA | 3/2/2016 | — | (1,287 | ) | (1,287 | ) | ||||||||||||||||||||||
| MXN | 2,932,246 | USD | 171,568 | Citibank N.A. | 3/2/2016 | — | (10,214 | ) | (10,214 | ) | ||||||||||||||||||||||
| NOK | 658,746 | USD | 74,998 | Goldman Sachs Bank USA | 3/2/2016 | 858 | — | 858 | ||||||||||||||||||||||||
| NZD | 11,211 | USD | 7,549 | State Street Bank and Trust Company | 3/2/2016 | — | (301 | ) | (301 | ) | ||||||||||||||||||||||
| SEK | 2,084,980 | USD | 245,581 | Citibank N.A. | 3/2/2016 | — | (2,477 | ) | (2,477 | ) | ||||||||||||||||||||||
| USD | 43,975 | AUD | 61,246 | Australia And New Zealand Banking Group | 3/2/2016 | 688 | — | 688 | ||||||||||||||||||||||||
| USD | 310,202 | CAD | 421,874 | Royal Bank of Canada | 3/2/2016 | 9,056 | — | 9,056 | ||||||||||||||||||||||||
| USD | 838,891 | EUR | 768,796 | State Street Bank and Trust Company | 3/2/2016 | 5,485 | — | 5,485 | ||||||||||||||||||||||||
| USD | 68,149 | GBP | 45,021 | State Street Bank and Trust Company | 3/2/2016 | 3,997 | — | 3,997 | ||||||||||||||||||||||||
| USD | 312,796 | INR | 21,179,420 | Royal Bank of Canada | 3/2/2016 | 2,293 | — | 2,293 | ||||||||||||||||||||||||
| USD | 147,163 | JPY | 18,058,318 | Goldman Sachs Bank USA | 3/2/2016 | — | (2,077 | ) | (2,077 | ) | ||||||||||||||||||||||
| USD | 103,983 | KRW | 123,167,750 | State Street Bank and Trust Company | 3/2/2016 | 1,326 | — | 1,326 | ||||||||||||||||||||||||
| USD | 74,093 | NOK | 658,746 | Goldman Sachs Bank USA | 3/2/2016 | — | (1,762 | ) | (1,762 | ) | ||||||||||||||||||||||
| USD | 7,399 | NZD | 11,211 | State Street Bank and Trust Company | 3/2/2016 | 152 | — | 152 | ||||||||||||||||||||||||
| USD | 182,621 | TWD | 6,000,000 | State Street Bank and Trust Company | 3/2/2016 | 2,632 | — | 2,632 | ||||||||||||||||||||||||
| $27,946 | ($24,805 | ) | $3,141 | |||||||||||||||||||||||||||||
| Currency abbreviations | |
| AUD | Australian Dollar |
| CAD | Canadian Dollar |
| EUR | Euro |
| GBP | British Pound |
| INR | Indian Rupee |
| JPY | Japanese Yen |
| KRW | Korean Won |
| MXN | Mexican Peso |
| NOK | Norwegian Krone |
| NZD | New Zealand Dollar |
| SEK | Swedish Krona |
| TWD | New Taiwan Dollar |
| USD | US Dollar |
Fair value of derivative instruments by risk category
The table below summarizes the fair value of derivatives held by the fund at January 31, 2016 by risk category:
| Risk | Statement of assets and liabilities location |
Financial instruments location |
Asset derivatives fair value |
Liabilities derivatives fair value |
||||||||||
| Equity | Receivable/payable for futures | Futures† | $151,207 | ($73,539 | ) | |||||||||
| Interest rate | Receivable/payable for futures | Futures† | 34,591 | (79,695 | ) |
| Risk | Statement of assets and liabilities location |
Financial instruments location |
Asset derivatives fair value |
Liabilities derivatives fair value |
||||||||||
| Foreign currency | Unrealized appreciation/depreciation on forward foreign currency exchange contracts |
Forward foreign currency contracts |
27,946 | (24,805 | ) | |||||||||
| $213,744 | ($178,039 | ) |
† Reflects cumulative appreciation/depreciation on futures as disclosed in Note 3. Only the period end variation margin is separately disclosed on the Statement of assets and liabilities.
Effect of derivative instruments on the Statement of operations
The table below summarizes the net realized gain (loss) included in the net increase (decrease) in net assets from operations, classified by derivative instrument and risk category, for the six months ended January 31, 2016:
| Statement of operations location - Net realized gain (loss) on: | |||||||||||
| Risk | Futures contracts | Investments and foreign currency transactions* |
Total | ||||||||
| Interest rate | ($15,914 | ) | - | ($15,914 | ) | ||||||
| Equity | 392,300 | - | 392,300 | ||||||||
| Foreign currency | - | ($34,630 | ) | (34,630 | ) | ||||||
| Total | $376,386 | ($34,630 | ) | $341,756 | |||||||
*Realized gain/loss associated with forward foreign currency contracts is included in the caption on the Statement of operations.
The table below summarizes the net change in unrealized appreciation (depreciation) included in the net increase (decrease) in net assets from operations, classified by derivative instrument and risk category, for the six months ended January 31, 2016:
| Statement of operations location - Change in unrealized appreciation (depreciation) | |||||||||||
| Risk | Futures contracts | Investments and translation of assets and liabilities in foreign currencies* |
Total | ||||||||
| Interest rate | ($34,786 | ) | - | ($34,786 | ) | ||||||
| Equity | 36,383 | - | 36,383 | ||||||||
| Foreign currency | - | $8,539 | 8,539 | ||||||||
| Total | $1,597 | $8,539 | $10,136 | ||||||||
*Change in unrealized appreciation/depreciation associated with forward foreign currency contracts is included in this caption of the Statement of operations.
Note 4 — Guarantees and indemnifications
Under the Trust's organizational documents, its Officers and Trustees are indemnified against certain liabilities arising out of the performance of their duties to the Trust, including the fund. Additionally, in the normal course of business, the fund enters into contracts with service providers that contain general indemnification clauses. The fund's maximum exposure under these arrangements is unknown, as this would involve future claims that may be made against the fund that have not yet occurred. The risk of material loss from such claims is considered remote.
Note 5 — Fees and transactions with affiliates
John Hancock Advisers, LLC (the Advisor) serves as investment advisor for the fund. John Hancock Funds, LLC (the Distributor), an affiliate of the Advisor, serves as principal underwriter of the fund. The Advisor and the Distributor are indirect, wholly owned subsidiaries of Manulife Financial Corporation (MFC).
Management fee. The fund has an investment management agreement with the Advisor under which the fund pays a daily management fee to the Advisor equivalent, on an annual basis, to the sum of: (a) 1.00% of the first $500 million of the fund's average daily net assets and (b) 0.95% of the fund's average daily net assets in excess of $500 million. The Advisor
has a subadvisory agreement with John Hancock Asset Management a division of Manulife Asset Management (US) LLC, an indirectly owned subsidiary of MFC and an affiliate of the Advisor. The fund is not responsible for payment of the subadvisory fees.
The Advisor has contractually agreed to waive a portion of its management fee and/or reimburse expenses for certain funds of the John Hancock funds complex, including the fund (the participating portfolios). This waiver is based upon aggregate net assets of all the participating portfolios. The amount of the reimbursement is calculated daily and allocated among all the participating portfolios in proportion to the daily net assets of each fund. During the six months ended January 31, 2016, this waiver amounted to 0.01% of the fund's average net assets on an annualized basis. This arrangement may be amended or terminated at any time by the Advisor upon notice to the fund and with the approval of the Board of Trustees.
The expense reductions described above amounted to $1,128 and $342 for Class A and Class I shares, respectively, for the six months ended January 31, 2016.
The investment management fees, including the impact of the waivers and reimbursements as described above, incurred for the six months ended January 31, 2016 were equivalent to a net annual effective rate of 0.99% of the fund's average daily net assets.
Accounting and legal services. Pursuant to a service agreement, the fund reimburses the Advisor for all expenses associated with providing the administrative, financial, legal, accounting and recordkeeping services to the fund, including the preparation of all tax returns, periodic reports to shareholders and regulatory reports, among other services. These expenses are allocated to each share class based on its relative net assets at the time the expense was incurred. These accounting and legal services fees incurred for the six months ended January 31, 2016 amounted to an annual rate of 0.01% of the fund's average daily net assets.
Distribution and service plans. The fund has a distribution agreement with the Distributor. The fund has adopted distribution and service plans with respect to Class A shares pursuant to Rule 12b-1 under the 1940 Act, to pay the Distributor for services provided as the distributor of shares of the fund. The fund pays 0.30% for Class A distribution and services fees under these arrangements, expressed as an annual percentage of average daily net assets.
Sales charges. Class A shares are assessed up-front sales charges. During the six months ended January 31, 2016 there were no up-front sales charges assessed for Class A shares.
Class A shares may be subject to contingent deferred sales charges (CDSCs). Certain Class A shares that are acquired through purchases of $1 million or more and are redeemed within one year of purchase are subject to a 1.00% sales charge. Proceeds from CDSCs are used to compensate the Distributor for providing distribution-related services in connection with the sale of these shares. During the six months ended January 31, 2016 there were no CDSCs received by the Distributor for Class A.
Transfer agent fees. The fund has a transfer agent agreement with John Hancock Signature Services, Inc. (Signature Services), an affiliate of the Advisor. The transfer agent fees paid to Signature Services are determined based on the cost to Signature Services (Signature Services Cost) of providing recordkeeping services. It also includes out-of-pocket expenses, including payments made to third-parties for recordkeeping services provided to their clients who invest in one or more John Hancock funds. In addition, Signature Services Cost may be reduced by certain fees that Signature Services receives in connection with retirement and small accounts. Signature Services Cost is calculated monthly and allocated, as applicable, to five categories of share classes: Retail Share and Institutional Share Classes of Non-Municipal Bond Funds, Class R6 Shares, Retirement Share Classes and Municipal Bond Share Classes. Within each of these categories, the applicable costs are allocated to the affected John Hancock affiliated funds and/or classes, based on the relative average daily net assets.
Class level expenses. Class level expenses for the six months ended January 31, 2016 were:
| Class | Distribution and service fees | Transfer agent fees | ||||||
| Class A | $45,475 | $18,663 | ||||||
| Class I | — | 5,041 |
| Class | Distribution and service fees | Transfer agent fees | ||||||
| Total | $45,475 | $23,704 |
Trustee expenses. The fund compensates each Trustee who is not an employee of the Advisor or its affiliates. The costs of paying Trustee compensation and expenses are allocated to each fund based on its net assets relative to other funds within the John Hancock group of funds complex.
Note 6 — Fund share transactions
Transactions in fund shares for the six months ended January 31, 2016 and for the year ended July 31, 2015 were as follows:
| Six months ended 1-31-16 | Year ended 7-31-15 | |||||||
| Shares | Amount | Shares | Amount | |||||
| Class I shares | ||||||||
| Sold | — | — | 6,724 | $70,264 | ||||
| Distributions reinvested | 182 | 1,797 | — | — | ||||
| Net increase | 182 | $1,797 | 6,724 | $70,264 | ||||
| Total net increase | 182 | $1,797 | 6,724 | $70,264 | ||||
There were no fund share transactions for Class A for the six months ended January 31, 2016 and for the year ended July 31, 2015.
Affiliates of the fund owned 100% of shares of beneficial interest of Class A and Class I on January 31, 2016.
Note 7 — Purchase and sale of securities
Purchases and sales of securities, other than short-term securities and U.S. Treasury obligations, amounted to $5,679,645 and $7,237,189, respectively, for the six months ended January 31, 2016. Purchases and sales of U.S. Treasury obligations aggregated $2,596,762 and $1,533,295, respectively, for the six months ended January 31, 2016.
|
Trustees James M. Oates, Chairperson Officers Andrew G. Arnott John J. Danello Francis V. Knox, Jr. Charles A. Rizzo Salvatore Schiavone |
Investment advisor John Hancock Advisers, LLC Subadvisor John Hancock Asset Management a division of Manulife Asset Management (US) LLC Principal distributor John Hancock Funds, LLC Custodian State Street Bank and Trust Company Transfer agent John Hancock Signature Services, Inc. Legal counsel K&L Gates LLP |
*Member of the Audit Committee
†Non-Independent Trustee
The fund's proxy voting policies and procedures, as well as the fund proxy voting record for the most recent twelve-month period ended June 30, are available free of charge on the Securities and Exchange Commission (SEC) website at sec.gov or on our website.
The fund's complete list of portfolio holdings, for the first and third fiscal quarters, is filed with the SEC on Form N-Q. The fund's Form N-Q is available on our website and the SEC's website, sec.gov, and can be reviewed and copied (for a fee) at the SEC's Public Reference Room in Washington, DC. Call 800-SEC-0330 to receive information on the operation of the SEC's Public Reference Room.
We make this information on your fund, as well as monthly portfolio holdings, and other fund details available on our website at jhinvestments.com or by calling 800-225-5291.
| You can also contact us: | |||
| 800-225-5291 jhinvestments.com |
Regular mail: John Hancock Signature Services, Inc. |
Express mail: John Hancock Signature Services, Inc. |
|
John Hancock family of funds
|
DOMESTIC EQUITY FUNDS Balanced Blue Chip Growth Classic Value Disciplined Value Disciplined Value Mid Cap Equity Income Fundamental All Cap Core Fundamental Large Cap Core Fundamental Large Cap Value New Opportunities Select Growth Small Cap Equity Small Cap Value Small Company Strategic Growth U.S. Equity U.S. Global Leaders Growth Value Equity GLOBAL AND INTERNATIONAL EQUITY FUNDS Disciplined Value International Emerging Markets Emerging Markets Equity Global Equity Global Shareholder Yield Greater China Opportunities International Core International Growth International Small Company International Value Equity |
INCOME FUNDS Bond California Tax-Free Income Core High Yield Emerging Markets Debt Floating Rate Income Focused High Yield Global Income Government Income High Yield Municipal Bond Income Investment Grade Bond Money Market Short Duration Credit Opportunities Spectrum Income Strategic Income Opportunities Tax-Free Bond ALTERNATIVE AND SPECIALTY FUNDS Absolute Return Currency Alternative Asset Allocation Enduring Assets Financial Industries Global Absolute Return Strategies Global Conservative Absolute Return Global Real Estate Natural Resources Redwood Regional Bank Seaport Technical Opportunities |
A fund's investment objectives, risks, charges, and expenses should be considered carefully before investing. The prospectus contains this and other important information about the fund. To obtain a prospectus, contact your financial professional, call John Hancock Investments at 800-225-5291, or visit our website at jhinvestments.com. Please read the prospectus carefully before investing or sending money.
|
ASSET ALLOCATION Income Allocation Fund Lifestyle Aggressive Portfolio Lifestyle Balanced Portfolio Lifestyle Conservative Portfolio Lifestyle Growth Portfolio Lifestyle Moderate Portfolio Retirement Choices Portfolios (2010-2055) Retirement Living Portfolios (2010-2055) Retirement Living II Portfolios (2010-2055) EXCHANGE-TRADED FUNDS John Hancock Multifactor Consumer Discretionary ETF John Hancock Multifactor Financials ETF John Hancock Multifactor Healthcare ETF John Hancock Multifactor Large Cap ETF John Hancock Multifactor Mid Cap ETF John Hancock Multifactor Technology ETF CLOSED-END FUNDS Financial Opportunities Hedged Equity & Income Income Securities Trust Investors Trust Preferred Income Preferred Income II Preferred Income III Premium Dividend Tax-Advantaged Dividend Income Tax-Advantaged Global Shareholder Yield |
"As an investment firm,
upholding the proud
tradition of John Hancock
comes down to one thing:
putting shareholders
first. We believe that if
our shareholders are
successful, then we will
be successful."
Andrew G. Arnott
President and Chief Executive Officer
John Hancock Investments
John Hancock Multifactor ETF shares are bought and sold at market
price (not NAV), and are not individually redeemed
from the fund. Brokerage commissions will reduce returns.
John Hancock ETFs are distributed by Foreside Fund Services, LLC, and
are subadvised by Dimensional Fund Advisors LP.
Foreside is not affiliated with John Hancock Funds, LLC or
Dimensional Fund Advisors LP.
Dimensional Fund Advisors LP receives compensation from John Hancock
in connection with licensing rights to the
John Hancock Dimensional indexes. Dimensional Fund Advisors LP does
not sponsor, endorse, or sell, and makes no
representation as to the advisability of investing in, John Hancock
Multifactor ETFs.
John Hancock Investments
A trusted brand
John Hancock Investments is a premier asset manager representing
one of America's most trusted brands, with a heritage of financial
stewardship dating back to 1862. Helping our shareholders pursue
their financial goals is at the core of everything we do. It's why we
support the role of professional financial advice and operate with the
highest standards of conduct and integrity.
A better way to invest
We build funds based on investor needs, then search the world to find
proven portfolio teams with specialized expertise in those strategies.
As a manager of managers, we apply vigorous oversight to ensure that
they continue to meet our uncompromising standards and serve the
best interests of our shareholders.
Results for investors
Our unique approach to asset management enables us to provide
a diverse set of investments backed by some of the world's best
managers, along with strong risk-adjusted returns across asset classes.
|
|
John Hancock Funds, LLC n Member FINRA, SIPC 601 Congress Street n Boston, MA 02210-2805 800-225-5291 n jhinvestments.com |
|
| This report is for the information of the shareholders of John Hancock Diversified Strategies Fund. It is not authorized for distribution to prospective investors unless preceded or accompanied by a prospectus. | ||
| 392SA 1/16 3/16 |
||
John Hancock
Global Absolute Return Strategies Fund
Semiannual report 1/31/16
A message to shareholders
Dear shareholder,
The six-month period has been a challenging time for all investors. Oil prices, having already dropped precipitously, continued to slide in the back half of 2015, and by January oil frequently traded at multi-year lows. Concerns about slowing global growth added to negative investor psychology, and stock prices fell steeply around the world. Stocks were not the only investment that faced headwinds; all risk assets struggled over the past six months and these types of declines are unsettling.
Although volatility returned in force to the markets, much of the global economic picture continues to move in the right direction. In December, the U.S. Federal Reserve raised short-term interest rates for the first time in nine years on the evidence that the persistent strength in the labor markets warranted a somewhat less accommodative stance. Central banks outside of the United States continue to signal that they would take action to support economies and markets.
At John Hancock Investments, portfolio risk management is a critical part of our role as an asset manager, and our dedicated risk team is focused on these issues every day. We continually strive for new ways to analyze potential risks and have liquidity tools in place, such as a credit facility and an interfund lending program. In times like these, your best resource is your financial advisor, who can ensure your portfolio is sufficiently diversified to meet your long-term objectives and to withstand the inevitable bumps along the way.
On behalf of everyone at John Hancock Investments, I'd like to take this opportunity to thank you for the continued trust you've placed in us.
Sincerely,
Andrew G. Arnott
President and Chief Executive Officer
John Hancock Investments
This commentary reflects the CEO's views as of January 31, 2016. They are subject to change at any time. All investments entail risks, including the possible loss of principal. For more up-to-date information, you can visit our website at jhinvestments.com.
John Hancock
Global Absolute Return Strategies Fund
INVESTMENT OBJECTIVE
The fund seeks long-term total return.
AVERAGE ANNUAL TOTAL RETURNS AS OF 1/31/16 (%)
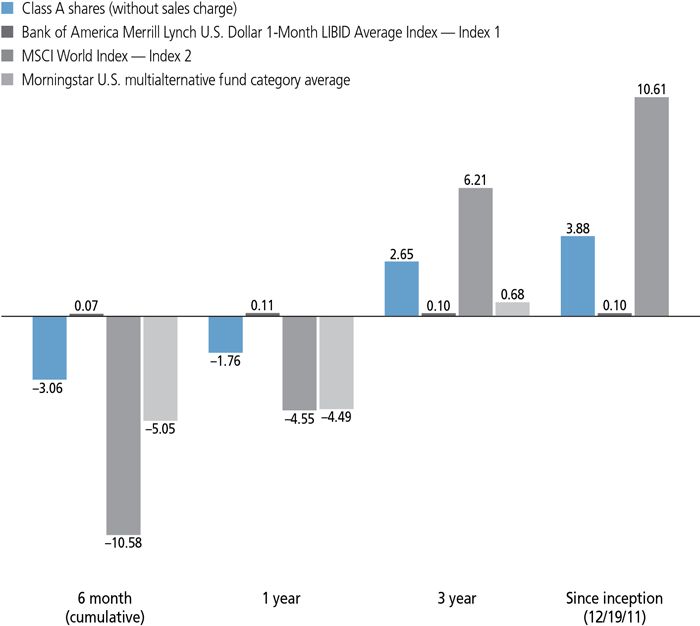
The Bank of America Merrill Lynch U.S. Dollar 1-Month LIBID Average Index tracks the performance of a synthetic asset paying LIBID (London Interbank Bid Rate) to a stated maturity.
The MSCI World Index is a free float-adjusted market-capitalization-weighted index that is designed to measure equity market performance of developed markets.
It is not possible to invest directly in an index. Index figures do not reflect expenses or sales charges, which would result in lower returns.
Figures from Morningstar, Inc. include reinvested distributions and do not take into account sales charges. Actual load-adjusted performance is lower. Since-inception returns for the Morningstar fund category average are not available.
The past performance shown here reflects reinvested distributions and the beneficial effect of any expense reductions, and does not guarantee future results. Returns for periods shorter than one year are cumulative. Performance of the other share classes will vary based on the difference in the fees and expenses of those classes. Shares will fluctuate in value and, when redeemed, may be worth more or less than their original cost. Current month-end performance may be lower or higher than the performance cited, and can be found at jhinvestments.com or by calling 800-225-5291. For further information on the fund's objectives, risks, and strategy, see the fund's prospectus.
PERFORMANCE HIGHLIGHTS OVER THE LAST SIX MONTHS
Equity and credit markets declined, as did the fund
In a difficult period for risk assets, the fund posted a negative total return; it's Morningstar multialternative fund category average declined as well.
Market exposure weighed down results
Allocations to European equity, Japanese equity, high-yield credit, and other market returns strategies detracted from performance, driving overall results for the period.
Certain relative value strategies fared better
Smaller-cap stocks underperformed larger caps, benefiting the fund's U.S. equity technology versus small cap and U.S. equity large cap versus small cap relative value strategies.
PORTFOLIO ALLOCATION AS OF 1/31/16 (%)
| Common stocks | 24.4 | |
| Financials | 10.7 | |
| Industrials | 2.5 | |
| Health care | 2.2 | |
| Information technology | 1.9 | |
| Consumer discretionary | 1.7 | |
| Consumer staples | 1.6 | |
| Telecommunication services | 1.2 | |
| Materials | 1.0 | |
| Energy | 0.8 | |
| Utilities | 0.8 | |
| Corporate bonds | 11.8 | |
| Foreign government obligations | 5.3 | |
| Purchased options | 1.1 | |
| Short-term investments and other | 57.4 | |
| Time deposits | 15.3 | |
| U.S. Government | 14.0 | |
| Certificate of deposit | 13.5 | |
| Commercial paper | 11.1 | |
| Money market funds | 0.6 | |
| Other assets and liabilities, net | 2.9 | |
| TOTAL | 100.0 | |
| As a percentage of net assets. | ||
A note about risks
Absolute return funds are not designed to outperform stocks and bonds in strong markets and there is no guarantee of positive returns. They employ certain techniques, which are intended to reduce risk and volatility in the portfolio and provide protection against a decline in the fund's assets. However, there is no guarantee that any investment strategy will be successful or that the fund's objective will be achieved. Stock prices can be volatile and are affected by both general economic conditions and the financial prospects of individual companies. A fund concentrated in one sector or that holds a limited number of securities may fluctuate more than a fund that invests in a wider variety of sectors. Fixed-income investments are subject to interest-rate and credit risk; their value will normally decline as interest rates rise or if a creditor, grantor, or counterparty is unable or unwilling to make principal, interest, or settlement payments. Liquidity—the extent to which a security may be sold or a derivative position closed without negatively affecting its market value, if at all—may be impaired by reduced trading volume, heightened volatility, rising interest rates, and other market conditions. Hedging, derivatives, and other strategic transactions may increase a fund's volatility and could produce disproportionate losses, potentially more than the fund's principal investment. Currency transactions are impacted by fluctuations in exchange rates, which may adversely affect the U.S. dollar value of a fund's investments. Currency rates in foreign countries may fluctuate significantly for a number of reasons, including the forces of supply and demand in the foreign exchange markets, actual or perceived changes in interest rates, and intervention (or the failure to intervene) by U.S. or foreign governments or central banks, or by currency controls or political developments in the United States or abroad.Foreign investing, especially in emerging markets, has additional risks such as currency and market volatility and political and social instability. Investments in higher-yielding, lower-rated securities involve additional risks as these securities include a higher risk of default and loss of principal. The prices of medium and small company stocks can change more frequently and dramatically than those of large company stocks. Please see the fund's prospectus for additional risks.
An interview with Portfolio Manager Guy Stern, CFA, Standard Life Investments (Corporate Funds) Limited

Guy Stern, CFA
Portfolio Manager
Standard Life Investments
We saw elevated levels of stress influencing the behavior of financial assets throughout the first half of the fund's fiscal year. Would you please share your high-level observations on the market action during the six months that ended on January 31, 2016?
During a period of volatile price movements, equities fell across most of the world—particularly sharply in August, and then again in January—as worries of a slowdown in global growth and mixed economic data prompted investors to seek the relative safety of other assets, such as developed-market sovereign bonds. Broadly speaking, emerging-market stocks and U.S. small-caps were among the worst asset classes for the period. Larger-cap defensively oriented U.S. equity sectors fared better.
Monetary policy divergence also remained dominant during the period. The U.S. Federal Reserve's (Fed's) December decision to increase interest rates (the first hike since 2006) proved beneficial for the U.S. dollar. Meanwhile, additional easing measures by the European Central Bank (ECB) weighed on the euro.
Aside from a late-period rebound in precious metals, persistent weakness across the commodity complex was another ongoing theme. In particular, oil prices declined amid weak demand from China and global oversupply concerns. High-yield corporate debt, a market with heavy issuance from the energy sector, also came under pressure. Assets linked to prices of industrial metals, agriculture, and livestock declined, too. On the whole, commodity-sensitive currencies also struggled throughout the period.
How did the fund perform? Did it behave as you would have expected it to behave in such an environment?
While negative returns are always disappointing for absolute return investors, in a six-month period that saw many assets post double-digit percentage declines, we believe the fund held up relatively well. The fund's Class A shares, excluding sales charges, declined 3.06%, and its peer group,
Indeed, the fund behaved much like we might have expected it to behave during this difficult capital market environment. While the fund is not exclusively dependent upon favorable results from the broader credit and equity markets to generate returns, market exposure is a component of our long-term investment strategy. We make investment decisions for the fund with a multi-year horizon in mind, and weak market returns will generally weigh on the fund's results during shorter time periods, just as they did during this period.
However, the fund's security selection, relative value, and directional strategies have the potential to provide shareholders with a degree of insulation against such adverse market movements. During the period, security selection decisions produced a positive contribution to the fund's results. Certain relative value strategies (such as the fund's U.S. equity technology versus small cap) and directional strategies (such as the fund's U.S. butterfly strategy) also produced positive contributions.
What were the key detractors from the fund's performance during the period?
The most significant detractor was an allocation to European equity. Other equity market returns strategies weighing on results included those with a focus on Japan's broad market and the global
PORTFOLIO COMPOSITION AS OF 1/31/16 (%)
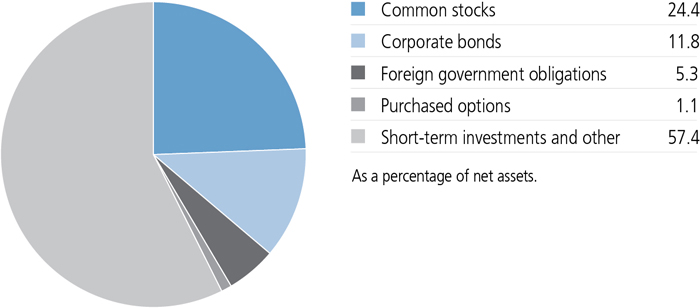
The fund's European equity banks versus insurers strategy (which we exited prior to the end of the period) and its U.S. equity banks versus consumer staples strategy also declined during this particularly difficult environment for banking shares.
U.S. Treasury securities benefited from increased demand amid heightened price volatility in the equity, credit, and commodity markets. This pushed down bond yields, which, in turn, was a negative for the fund's short U.S. duration strategy, a position implemented with swaps and designed to exploit rising interest rates in the United States.
An ongoing global commodity glut pressured the currencies of commodity exporting countries. Oil price weakness in particular was a negative for the fund's long Mexican peso versus Australian dollar strategy, implemented with currency forward contracts.
How about the strategies that generated positive contributions?
Small-cap stocks underperformed large caps, and this was beneficial for the fund's U.S. equity technology versus small-cap and U.S. large-cap versus small-cap relative value strategies. These approaches tend to offer the fund a measure of protection during periods of equity market downturns, as small-cap stocks tend to suffer disproportionately during such environments.
The build-up of expectations for higher interest rates in the United States proved beneficial for the fund's U.S. butterfly strategy, which we established through the swap market. We implemented the position in anticipation of changes in the shape of the U.S. Treasury yield curve, a measure of the
COUNTRY COMPOSITION AS OF 1/31/16 (%)
| United States | 71.0 |
| United Kingdom | 5.3 |
| Mexico | 5.1 |
| Germany | 3.6 |
| France | 2.7 |
| Switzerland | 2.6 |
| Italy | 1.5 |
| Netherlands | 1.5 |
| Finland | 1.0 |
| Ireland | 0.9 |
| Other countries | 4.8 |
| TOTAL | 100.0 |
| As a percentage of net assets. | |
| The percentages above do not reflect country exposure gained through certain currency derivatives. |
term structure of interest rates at a given point in time. The monetary policy sensitive leg of the strategy, with short exposure to duration, received a boost from an increase in the fed funds rate. This was complemented by strong performance derived from long exposure to duration in the strategy's middle leg, which benefited from a decline in medium-term interest rates. (The long end leg, which was positioned for a rise in long-term rates, suffered a loss.)
The Fed's rate hike was also positive for the fund's long U.S. dollar directional currency strategies versus the euro, and versus the Korean won, both implemented in the foreign exchange forward market. The fund's long equity variance strategy benefited from elevated price volatility in global equity markets.
The flight to safety was also positive for the fund's Australian duration strategy (implemented through government bond futures) and its Australian forward-start interest-rate strategy (implemented through swaps).
Any recent strategy change examples you'd like to highlight?
We closed the fund's Brazilian government bonds strategy prior to the close of the period. We also closed the fund's European equity banks versus insurers strategy. The challenging earnings and capital outlook is now expected to persist for longer than we'd previously thought. Regulatory pressures, which are lowering returns on equity for banks, continue to overwhelm central bank monetary policies. Actually, ECB policy has proven less supportive than expected as negative deposit rates have reduced bank revenues. We still believe that low European interest rates are a negative driver for the capital position of European life insurance companies, but we no longer believe this is significant enough to cause underperformance in the insurance sector. Continued earnings and dividend growth, absent from many other areas of the market, are likely continue to support insurance stocks in Europe.
MANAGED BY
| |
Guy Stern, CFA On the fund since 2008 Investing since 1983 |
![]()
TOTAL RETURNS FOR THE PERIOD ENDED JANUARY 31, 2016
| Average annual total returns (%) with maximum sales charge |
Cumulative total returns (%) with maximum sales charge |
||||
| 1-year | Since inception1 |
6-month | Since inception1 |
||
| Class A | -6.67 | 2.59 | -7.91 | 11.14 | |
| Class C2 | -3.28 | 3.17 | -4.32 | 13.72 | |
| Class I3 | -1.35 | 4.26 | -2.83 | 18.76 | |
| Class R23,4 | -1.91 | 3.65 | -3.05 | 15.93 | |
| Class R62,4 | -1.32 | 4.29 | -2.81 | 18.92 | |
| Class NAV4 | -1.32 | 4.33 | -2.81 | 19.12 | |
| Index 1† | 0.11 | 0.10 | 0.07 | 0.43 | |
| Index 2† | -4.55 | 10.61 | -10.58 | 51.54 | |
Performance figures assume all distributions have been reinvested. Figures reflect maximum sales charges on Class A shares of 5.00% and the applicable contingent deferred sales charge (CDSC) on Class C shares. Class C shares sold within one year of purchase are subject to a 1% CDSC. Sales charges are not applicable to Class I, Class R2, Class R6, and Class NAV shares.
The expense ratios of the fund, both net (including any fee waivers and/or expense limitations) and gross (excluding any fee waivers and/or expense limitations), are set forth according to the most recent publicly available prospectuses for the fund and may differ from those disclosed in the Financial highlights tables in this report. Had the fee waivers and expense limitations not been in place, gross expenses would apply. The expense ratios are as follows:
| Class A | Class C | Class I | Class R2 | Class R6 | Class NAV | |
| Gross (%) | 1.63 | 2.33 | 1.33 | 1.73 | 1.23 | 1.21 |
| Net (%) | 1.63 | 2.33 | 1.33 | 1.73 | 1.21 | 1.21 |
Please refer to the most recent prospectus and annual report for more information on expenses and any expense limitation arrangements for each class.
The returns reflect past results and should not be considered indicative of future performance. The return and principal value of an investment will fluctuate so that shares, when redeemed, may be worth more or less than their original cost. Due to market volatility and other factors, the fund's current performance may be higher or lower than the performance shown. For current to the most recent month-end performance data, please call 800-225-5291 or visit the fund's website at jhinvestments.com.
The performance table above and the chart on the next page do not reflect the deduction of taxes that a shareholder would pay on fund distributions or the redemption of fund shares. The fund's performance results reflect any applicable fee waivers or expense reductions, without which the expenses would increase and results would have been less favorable.
| † | Index 1 is the Bank of America Merrill Lynch U.S. Dollar 1-Month LIBID Average Index; Index 2 is the MSCI World Index. |
See the following page for footnotes.
This chart and table show what happened to a hypothetical $10,000 investment in John Hancock Global Absolute Return Strategies Fund for the share classes and periods indicated, assuming all distributions were reinvested. For comparison, we've shown the same investment in two separate indexes.
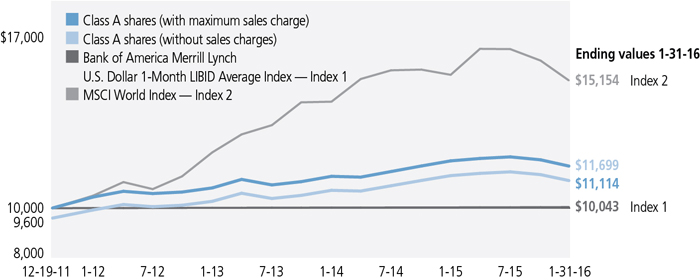
| Start date | With maximum sales charge ($) |
Without sales charge ($) |
Index 1 ($) | Index 2 ($) | |
| Class C2,5 | 12-19-11 | 11,372 | 11,372 | 10,043 | 15,154 |
| Class I3 | 12-19-11 | 11,876 | 11,876 | 10,043 | 15,154 |
| Class R23,4 | 12-19-11 | 11,593 | 11,593 | 10,043 | 15,154 |
| Class R62,3 | 12-19-11 | 11,892 | 11,892 | 10,043 | 15,154 |
| Class NAV3 | 12-19-11 | 11,912 | 11,912 | 10,043 | 15,154 |
The Bank of America Merrill Lynch U.S. Dollar 1-Month LIBID Average Index tracks the performance of a synthetic asset paying LIBID (London Interbank Bid Rate) to a stated maturity.
The MSCI World Index (gross of foreign withholding taxes on dividends) is a free float-adjusted market-capitalization weighted index that is designed to measure equity market performance of developed markets.
It is not possible to invest directly in an index. Index figures do not reflect expenses or sales charges, which would result in lower returns.
Footnotes related to performance pages
| 1 | From 12-19-11. |
| 2 | Class C and Class R6 shares were first offered on 8-1-12 and 3-1-12, respectively. The returns prior to these dates are those of Class A shares that have been recalculated to apply the gross fees and expenses of Class C and Class R6 shares, as applicable. |
| 3 | For certain types of investors as described in the fund's prospectuses. |
| 4 | Class R2 shares were first offered on 3-1-12. The returns prior to this date are those of Class A shares, which have lower expenses than Class R2. Had the returns reflected Class R2 expenses, returns would be lower. |
| 5 | The contingent deferred sales charge is not applicable. |
These examples are intended to help you understand your ongoing operating expenses of investing in the fund so you can compare these costs with the ongoing costs of investing in other mutual funds.
Understanding fund expenses
As a shareholder of the fund, you incur two types of costs:
| • | Transaction costs, which include sales charges (loads) on purchases or redemptions (varies by share class), minimum account fee charge, etc. |
| • | Ongoing operating expenses, including management fees, distribution and service fees (if applicable), and other fund expenses. |
We are presenting only your ongoing operating expenses here.
Actual expenses/actual returns
This example is intended to provide information about the fund's actual ongoing operating expenses, and is based on the fund's actual return. It assumes an account value of $1,000.00 on August 1, 2015, with the same investment held until January 31, 2016.
| Account value on 8-1-2015 |
Ending value on 1-31-2016 |
Expenses paid during period ended 1-31-20161 |
Annualized expense ratio |
|
| Class A | $1,000.00 | $969.40 | $7.97 | 1.61% |
| Class C | 1,000.00 | 966.00 | 11.42 | 2.31% |
| Class I | 1,000.00 | 971.70 | 6.44 | 1.30% |
| Class R2 | 1,000.00 | 969.50 | 8.42 | 1.70% |
| Class R6 | 1,000.00 | 971.90 | 5.90 | 1.19% |
| Class NAV | 1,000.00 | 971.90 | 5.90 | 1.19% |
Together with the value of your account, you may use this information to estimate the operating expenses that you paid over the period. Simply divide your account value at January 31, 2016, by $1,000.00, then multiply it by the "expenses paid" for your share class from the table above. For example, for an account value of $8,600.00, the operating expenses should be calculated as follows:
Hypothetical example for comparison purposes
This table allows you to compare the fund's ongoing operating expenses with those of any other fund. It provides an example of the fund's hypothetical account values and hypothetical expenses based on each class's actual expense ratio and an assumed 5% annualized return before expenses (which is not the fund's actual return). It assumes an account value of $1,000.00 on August 1, 2015, with the same investment held until January 31, 2016. Look in any other fund shareholder report to find its hypothetical example and you will be able to compare these expenses. Please remember that these hypothetical account values and expenses may not be used to estimate the actual ending account balance or expenses you paid for the period.
| Account value on 8-1-2015 |
Ending value on 1-31-2016 |
Expenses paid during period ended 1-31-20161 |
Annualized expense ratio |
|
| Class A | $1,000.00 | $1,017.00 | $8.16 | 1.61% |
| Class C | 1,000.00 | 1,013.50 | 11.69 | 2.31% |
| Class I | 1,000.00 | 1,018.60 | 6.60 | 1.30% |
| Class R2 | 1,000.00 | 1,016.60 | 8.62 | 1.70% |
| Class R6 | 1,000.00 | 1,019.20 | 6.04 | 1.19% |
| Class NAV | 1,000.00 | 1,019.20 | 6.04 | 1.19% |
Remember, these examples do not include any transaction costs, therefore, these examples will not help you to determine the relative total costs of owning different funds. If transaction costs were included, your expenses would have been higher. See the prospectuses for details regarding transaction costs.
| 1 | Expenses are equal to the fund's annualized expense ratio, multiplied by the average account value over the period, multiplied by 184/366 (to reflect the one-half year period). |
Fund's investments
| As of 1-31-16 (unaudited) | |||||||||||||||||||||||
| Rate (%) | Maturity date | Par value^ | Value | ||||||||||||||||||||
| Corporate bonds 11.8% | $1,072,444,400 | ||||||||||||||||||||||
| (Cost $1,150,362,179) | |||||||||||||||||||||||
| Australia 0.2% | 17,747,962 | ||||||||||||||||||||||
| APT Pipelines, Ltd. | 1.375 | 03-22-22 | EUR | 900,000 | 889,702 | ||||||||||||||||||
| APT Pipelines, Ltd. | 2.000 | 03-22-27 | EUR | 1,500,000 | 1,382,138 | ||||||||||||||||||
| Australia Pacific Airports Melbourne Pty, Ltd. | 1.750 | 10-15-24 | EUR | 800,000 | 861,107 | ||||||||||||||||||
| BHP Billiton Finance USA, Ltd. | 5.000 | 09-30-43 | 4,200,000 | 3,752,456 | |||||||||||||||||||
| Commonwealth Bank of Australia (S) | 4.500 | 12-09-25 | 1,395,000 | 1,402,752 | |||||||||||||||||||
| FMG Resources August 2006 Pty, Ltd. (S) | 9.750 | 03-01-22 | 455,000 | 394,713 | |||||||||||||||||||
| National Australia Bank, Ltd. (2.000% to 11-12-19, then 5 Year Euro Swap Rate + 1.650%) | 2.000 | 11-12-24 | EUR | 2,064,000 | 2,202,978 | ||||||||||||||||||
| Origin Energy Finance, Ltd. | 3.500 | 10-04-21 | EUR | 900,000 | 845,458 | ||||||||||||||||||
| Rio Tinto Finance USA, Ltd. | 5.200 | 11-02-40 | 868,000 | 768,118 | |||||||||||||||||||
| Santos Finance, Ltd. (8.250% to 9-22-17, then 3 month EURIBOR + 6.851%) | 8.250 | 09-22-70 | EUR | 1,660,000 | 1,587,059 | ||||||||||||||||||
| Scentre Group Trust 1 | 1.500 | 07-16-20 | EUR | 1,800,000 | 1,993,870 | ||||||||||||||||||
| Scentre Group Trust 2 | 3.250 | 09-11-23 | EUR | 1,360,000 | 1,667,611 | ||||||||||||||||||
| Austria 0.0% | 1,928,486 | ||||||||||||||||||||||
| JBS Investments GmbH (S) | 7.750 | 10-28-20 | 282,000 | 249,570 | |||||||||||||||||||
| UniCredit Bank Austria AG | 2.625 | 01-30-18 | EUR | 1,500,000 | 1,678,916 | ||||||||||||||||||
| Belgium 0.1% | 4,720,522 | ||||||||||||||||||||||
| Belfius Bank SA | 1.125 | 05-22-17 | EUR | 100,000 | 109,609 | ||||||||||||||||||
| Belfius Bank SA | 2.250 | 09-26-18 | EUR | 2,300,000 | 2,611,156 | ||||||||||||||||||
| KBC Groep NV (1.875% to 3-11-22, then 5 Year Euro Swap Rate + 1.500%) | 1.875 | 03-11-27 | EUR | 1,500,000 | 1,571,566 | ||||||||||||||||||
| KBC Groep NV (5.625% to 3-19-19, then 5 Year Euro Swap Rate + 4.759%) (Q) | 5.625 | 03-19-19 | EUR | 400,000 | 428,191 | ||||||||||||||||||
| Brazil 0.0% | 2,461,224 | ||||||||||||||||||||||
| Petrobras Global Finance BV | 2.750 | 01-15-18 | EUR | 1,300,000 | 1,164,236 | ||||||||||||||||||
| Vale SA | 3.750 | 01-10-23 | EUR | 380,000 | 288,001 | ||||||||||||||||||
| Vale SA | 4.375 | 03-24-18 | EUR | 980,000 | 1,008,987 | ||||||||||||||||||
| Canada 0.3% | 24,197,520 | ||||||||||||||||||||||
| Air Canada (S) | 8.750 | 04-01-20 | 1,166,000 | 1,237,418 | |||||||||||||||||||
| Air Canada 2013-1 Class B Pass Through Trust (S) | 5.375 | 05-15-21 | 612,757 | 602,034 | |||||||||||||||||||
| Cascades, Inc. (S) | 5.500 | 07-15-22 | 1,170,000 | 1,120,275 | |||||||||||||||||||
| Cascades, Inc. (S) | 5.750 | 07-15-23 | 260,000 | 248,300 | |||||||||||||||||||
| CHC Helicopter SA | 9.250 | 10-15-20 | 900,000 | 396,000 | |||||||||||||||||||
| CHC Helicopter SA | 9.375 | 06-01-21 | 808,516 | 149,575 | |||||||||||||||||||
| First Quantum Minerals, Ltd. (S) | 7.000 | 02-15-21 | 618,000 | 279,645 | |||||||||||||||||||
| Rate (%) | Maturity date | Par value^ | Value | ||||||||||||||||||||
| Canada (continued) | |||||||||||||||||||||||
| First Quantum Minerals, Ltd. (S) | 7.250 | 05-15-22 | 800,000 | $360,000 | |||||||||||||||||||
| Garda World Security Corp. (S) | 7.250 | 11-15-21 | 746,000 | 589,340 | |||||||||||||||||||
| Great-West Lifeco, Inc. | 2.500 | 04-18-23 | EUR | 2,360,000 | 2,733,314 | ||||||||||||||||||
| Mercer International, Inc. | 7.000 | 12-01-19 | 420,000 | 403,200 | |||||||||||||||||||
| Mercer International, Inc. | 7.750 | 12-01-22 | 850,000 | 784,125 | |||||||||||||||||||
| New Red Finance, Inc. (S) | 6.000 | 04-01-22 | 1,070,000 | 1,109,456 | |||||||||||||||||||
| NOVA Chemicals Corp. (S) | 5.000 | 05-01-25 | 1,010,000 | 946,875 | |||||||||||||||||||
| Open Text Corp. (S) | 5.625 | 01-15-23 | 885,000 | 880,575 | |||||||||||||||||||
| Potash Corp. of Saskatchewan, Inc. | 3.000 | 04-01-25 | 2,320,000 | 2,159,869 | |||||||||||||||||||
| Rogers Communications, Inc. | 5.000 | 03-15-44 | 5,088,000 | 5,050,807 | |||||||||||||||||||
| Total Capital Canada, Ltd. | 1.125 | 03-18-22 | EUR | 1,400,000 | 1,539,512 | ||||||||||||||||||
| TransCanada PipeLines, Ltd. | 7.625 | 01-15-39 | 3,030,000 | 3,607,200 | |||||||||||||||||||
| Cayman Islands 0.0% | 4,097,591 | ||||||||||||||||||||||
| IPIC GMTN, Ltd. | 2.375 | 05-30-18 | EUR | 700,000 | 780,526 | ||||||||||||||||||
| IPIC GMTN, Ltd. | 5.875 | 03-14-21 | EUR | 2,530,000 | 3,317,065 | ||||||||||||||||||
| Denmark 0.1% | 7,366,917 | ||||||||||||||||||||||
| Danske Bank A/S (3.875% to 10-4-18, then 5 Year Euro Swap Rate + 2.625%) | 3.875 | 10-04-23 | EUR | 500,000 | 573,217 | ||||||||||||||||||
| DONG Energy A/S | 4.875 | 12-16-21 | EUR | 129,000 | 168,759 | ||||||||||||||||||
| DONG Energy A/S | 4.875 | 01-12-32 | GBP | 1,200,000 | 1,873,034 | ||||||||||||||||||
| DONG Energy A/S | 6.500 | 05-07-19 | EUR | 800,000 | 1,031,305 | ||||||||||||||||||
| DONG Energy A/S (4.875% to 7-8-18, then 5 Year Euro Swap Rate + 3.800%) | 4.875 | 07-08-99 | EUR | 1,350,000 | 1,474,197 | ||||||||||||||||||
| DONG Energy A/S (6.250% to 6-26-23, then 5 Year Euro Swap Rate + 4.750%) | 6.250 | 06-26-99 | EUR | 636,000 | 704,031 | ||||||||||||||||||
| Nykredit Holding AS (2.750% to 11-17-22, then 5 Year Euro Swap Rate + 2.200%) | 2.750 | 11-17-27 | EUR | 1,450,000 | 1,542,374 | ||||||||||||||||||
| Finland 0.0% | 373,096 | ||||||||||||||||||||||
| Fortum OYJ | 4.000 | 05-24-21 | EUR | 300,000 | 373,096 | ||||||||||||||||||
| France 0.9% | 80,009,341 | ||||||||||||||||||||||
| Aeroports de Paris | 1.500 | 07-24-23 | EUR | 1,100,000 | 1,236,487 | ||||||||||||||||||
| Aeroports de Paris | 1.500 | 04-07-25 | EUR | 1,400,000 | 1,557,289 | ||||||||||||||||||
| Alstom SA | 3.625 | 10-05-18 | EUR | 700,000 | 815,542 | ||||||||||||||||||
| Areva SA | 3.250 | 09-04-20 | EUR | 400,000 | 386,216 | ||||||||||||||||||
| Arkema SA | 1.500 | 01-20-25 | EUR | 600,000 | 633,971 | ||||||||||||||||||
| Autoroutes du Sud de la France SA | 2.950 | 01-17-24 | EUR | 200,000 | 244,277 | ||||||||||||||||||
| Autoroutes du Sud de la France SA | 7.375 | 03-20-19 | EUR | 750,000 | 987,644 | ||||||||||||||||||
| Banque Federative du Credit Mutuel SA | 3.000 | 11-28-23 | EUR | 500,000 | 618,454 | ||||||||||||||||||
| BNP Paribas SA | 2.250 | 01-13-21 | EUR | 1,000,000 | 1,168,716 | ||||||||||||||||||
| BNP Paribas SA | 2.500 | 08-23-19 | EUR | 500,000 | 584,228 | ||||||||||||||||||
| BNP Paribas SA (7.781% to 7-2-18, then 3 month EURIBOR + 3.750%) (Q) | 7.781 | 07-02-18 | EUR | 400,000 | 487,435 | ||||||||||||||||||
| BPCE SA | 0.625 | 04-20-20 | EUR | 1,900,000 | 2,066,521 | ||||||||||||||||||
| Rate (%) | Maturity date | Par value^ | Value | ||||||||||||||||||||
| France (continued) | |||||||||||||||||||||||
| BPCE SA | 2.000 | 04-24-18 | EUR | 800,000 | $902,493 | ||||||||||||||||||
| BPCE SA | 5.150 | 07-21-24 | 1,300,000 | 1,302,579 | |||||||||||||||||||
| Casino Guichard Perrachon SA | 2.798 | 08-05-26 | EUR | 1,000,000 | 897,685 | ||||||||||||||||||
| Casino Guichard Perrachon SA | 3.311 | 01-25-23 | EUR | 1,000,000 | 979,435 | ||||||||||||||||||
| Casino Guichard Perrachon SA | 4.472 | 04-04-16 | EUR | 700,000 | 763,046 | ||||||||||||||||||
| Casino Guichard Perrachon SA | 4.726 | 05-26-21 | EUR | 1,300,000 | 1,412,181 | ||||||||||||||||||
| Christian Dior SE | 4.000 | 05-12-16 | EUR | 800,000 | 875,059 | ||||||||||||||||||
| Cie Financiere et Industrielle des Autoroutes SA | 5.000 | 05-24-21 | EUR | 300,000 | 395,503 | ||||||||||||||||||
| Credit Agricole SA | 2.625 | 03-17-27 | EUR | 1,100,000 | 1,139,890 | ||||||||||||||||||
| Credit Agricole SA (6.500% to 6-23-21, then 5 Year U.S. Swap Rate + 5.120%) (Q) | 6.500 | 06-23-21 | EUR | 700,000 | 751,302 | ||||||||||||||||||
| Credit Agricole SA (6.637% to 5-31-17, then 3 month LIBOR + 1.232%) (Q) | 6.637 | 05-31-17 | 500,000 | 500,978 | |||||||||||||||||||
| Credit Logement SA (P) (Q) | 1.021 | 03-16-16 | EUR | 1,450,000 | 1,232,143 | ||||||||||||||||||
| Dexia Credit Local SA (P) | 0.508 | 07-10-17 | EUR | 600,000 | 605,700 | ||||||||||||||||||
| Electricite de France SA (S) | 3.625 | 10-13-25 | 2,166,000 | 2,159,502 | |||||||||||||||||||
| Electricite de France SA | 4.625 | 04-26-30 | EUR | 950,000 | 1,285,696 | ||||||||||||||||||
| Electricite de France SA | 5.625 | 02-21-33 | EUR | 790,000 | 1,185,725 | ||||||||||||||||||
| Electricite de France SA | 6.125 | 06-02-34 | GBP | 850,000 | 1,434,700 | ||||||||||||||||||
| Electricite de France SA (4.125% to 1-22-22, then 8 Year Euro Swap Rate + 2.441% (Q) | 4.125 | 01-22-22 | EUR | 1,400,000 | 1,392,311 | ||||||||||||||||||
| Electricite de France SA (5.000% to 1-22-26, then 12 Year Euro Swap Rate + 3.043%) (Q) | 5.000 | 01-22-26 | EUR | 1,400,000 | 1,368,847 | ||||||||||||||||||
| Engie SA (3.875% to 6-2-24, then 10 Year Euro Swap Rate + 2.895%) (Q) | 3.875 | 06-02-24 | EUR | 900,000 | 939,025 | ||||||||||||||||||
| Eutelsat SA | 2.625 | 01-13-20 | EUR | 2,800,000 | 3,233,323 | ||||||||||||||||||
| Eutelsat SA | 5.000 | 01-14-19 | EUR | 100,000 | 122,072 | ||||||||||||||||||
| Holding d'Infrastructures de Transport SAS | 2.250 | 03-24-25 | EUR | 1,200,000 | 1,318,792 | ||||||||||||||||||
| Infra Park SAS | 1.250 | 10-16-20 | EUR | 1,500,000 | 1,652,304 | ||||||||||||||||||
| Infra Park SAS | 2.125 | 04-16-25 | EUR | 500,000 | 558,589 | ||||||||||||||||||
| Ingenico Group SA | 2.500 | 05-20-21 | EUR | 1,400,000 | 1,553,210 | ||||||||||||||||||
| Klepierre | 1.000 | 04-17-23 | EUR | 1,100,000 | 1,164,517 | ||||||||||||||||||
| Lafarge SA | 4.750 | 09-30-20 | EUR | 810,000 | 1,006,607 | ||||||||||||||||||
| Lagardere SCA | 4.125 | 10-31-17 | EUR | 900,000 | 1,021,412 | ||||||||||||||||||
| Legrand SA | 4.375 | 03-21-18 | EUR | 600,000 | 705,563 | ||||||||||||||||||
| Mercialys SA | 1.787 | 03-31-23 | EUR | 1,400,000 | 1,360,093 | ||||||||||||||||||
| Numericable-SFR SAS | 5.375 | 05-15-22 | EUR | 200,000 | 222,355 | ||||||||||||||||||
| Numericable-SFR SAS | 5.625 | 05-15-24 | EUR | 250,000 | 274,786 | ||||||||||||||||||
| Numericable-SFR SAS (S) | 6.000 | 05-15-22 | 850,000 | 837,250 | |||||||||||||||||||
| Numericable-SFR SAS (S) | 6.250 | 05-15-24 | 1,175,000 | 1,145,625 | |||||||||||||||||||
| Orange SA | 3.875 | 01-14-21 | EUR | 1,300,000 | 1,628,710 | ||||||||||||||||||
| Orange SA | 8.125 | 01-28-33 | EUR | 790,000 | 1,452,520 | ||||||||||||||||||
| Orange SA | 9.000 | 03-01-31 | 3,359,000 | 4,833,645 | |||||||||||||||||||
| Orange SA (5.000% to 10-1-26, then 5 Year Euro Swap Rate + 3.990%) (Q) | 5.000 | 10-01-26 | EUR | 1,850,000 | 1,949,397 | ||||||||||||||||||
| Rate (%) | Maturity date | Par value^ | Value | ||||||||||||||||||||
| France (continued) | |||||||||||||||||||||||
| Pernod Ricard SA | 5.000 | 03-15-17 | EUR | 1,100,000 | $1,254,208 | ||||||||||||||||||
| RCI Banque SA | 1.750 | 07-06-16 | EUR | 540,000 | 587,676 | ||||||||||||||||||
| RCI Banque SA | 4.250 | 04-27-17 | EUR | 780,000 | 880,988 | ||||||||||||||||||
| Renault SA | 4.625 | 09-18-17 | EUR | 600,000 | 687,402 | ||||||||||||||||||
| RTE Reseau de Transport d'Electricite SA | 1.625 | 11-27-25 | EUR | 1,700,000 | 1,826,052 | ||||||||||||||||||
| Sanofi | 2.500 | 11-14-23 | EUR | 700,000 | 850,564 | ||||||||||||||||||
| SGD Group SAS | 5.625 | 05-15-19 | EUR | 580,000 | 617,844 | ||||||||||||||||||
| Societe Des Autoroutes Paris-Rhin-Rhone | 1.125 | 01-15-21 | EUR | 1,800,000 | 1,979,154 | ||||||||||||||||||
| Societe Des Autoroutes Paris-Rhin-Rhone | 1.875 | 01-15-25 | EUR | 1,900,000 | 2,143,735 | ||||||||||||||||||
| Societe Des Autoroutes Paris-Rhin-Rhone | 4.875 | 01-21-19 | EUR | 400,000 | 489,446 | ||||||||||||||||||
| Societe Fonciere Lyonnaise SA | 1.875 | 11-26-21 | EUR | 600,000 | 651,645 | ||||||||||||||||||
| Societe Generale SA | 4.000 | 06-07-23 | EUR | 400,000 | 469,138 | ||||||||||||||||||
| Societe Generale SA (2.500% to 9-16-21, then 5 Year Euro Swap Rate + 1.830%) | 2.500 | 09-16-26 | EUR | 1,500,000 | 1,594,083 | ||||||||||||||||||
| Societe Generale SA (6.750% to 4-7-21, then 5 Year Euro Swap Rate + 5.538%) (Q) | 6.750 | 04-07-21 | EUR | 460,000 | 492,693 | ||||||||||||||||||
| Societe Generale SA (8.250% to 11-29-18, then 5 Year U.S. Swap Rate + 6.394%) (Q) | 8.250 | 11-29-18 | 750,000 | 782,186 | |||||||||||||||||||
| Societe Generale SA (9.375% to 9-4-19, then 3 month EURIBOR + 8.901%) (Q) | 9.375 | 09-04-19 | EUR | 500,000 | 652,722 | ||||||||||||||||||
| SPCM SA | 2.875 | 06-15-23 | EUR | 575,000 | 585,473 | ||||||||||||||||||
| SPCM SA (S) | 6.000 | 01-15-22 | 1,050,000 | 1,057,875 | |||||||||||||||||||
| Suez Environnement Company | 1.750 | 09-10-25 | EUR | 1,100,000 | 1,232,970 | ||||||||||||||||||
| Total SA (2.250% to 2-26-21, then 5 Year Euro Swap Rate + 1.861%) (Q) | 2.250 | 02-26-21 | EUR | 1,400,000 | 1,392,928 | ||||||||||||||||||
| Transport et Infrastructures Gaz France SA | 2.200 | 08-05-25 | EUR | 1,300,000 | 1,429,209 | ||||||||||||||||||
| Germany 0.4% | 39,806,261 | ||||||||||||||||||||||
| Aareal Bank AG (4.250% to 3-18-21, then 5 Year Euro Swap Rate + 2.900%) | 4.250 | 03-18-26 | EUR | 1,250,000 | 1,395,655 | ||||||||||||||||||
| Allianz SE (2.241% to 7-7-25, then 3 month EURIBOR + 2.650%) | 2.241 | 07-07-45 | EUR | 2,400,000 | 2,405,494 | ||||||||||||||||||
| Allianz SE (3.375% to 9-18-24, then 10 Year EURIBOR Swap Rate + 3.200%) (Q) | 3.375 | 09-18-24 | EUR | 1,400,000 | 1,473,020 | ||||||||||||||||||
| Allianz SE (4.750% to 10-24-23, then 3 month EURIBOR + 3.600%) (Q) | 4.750 | 10-24-23 | EUR | 2,600,000 | 3,004,003 | ||||||||||||||||||
| Commerzbank AG | 7.750 | 03-16-21 | EUR | 1,500,000 | 1,916,177 | ||||||||||||||||||
| Daimler AG | 1.400 | 01-12-24 | EUR | 1,900,000 | 2,091,830 | ||||||||||||||||||
| Deutsche Bank AG | 1.250 | 09-08-21 | EUR | 1,100,000 | 1,184,172 | ||||||||||||||||||
| Fresenius Finance BV | 3.000 | 02-01-21 | EUR | 700,000 | 808,612 | ||||||||||||||||||
| HT1 Funding GmbH (6.352% to 6-30-17, then 12 month EURIBOR + 2.000%) (Q) | 6.352 | 06-30-17 | EUR | 550,000 | 600,727 | ||||||||||||||||||
| Muenchener Rueckversicherungs-Gesellschaft AG (6.250% to 5-26-22, then 3 month EURIBOR + 4.950%) | 6.250 | 05-26-42 | EUR | 500,000 | 657,609 | ||||||||||||||||||
| RWE Finance BV | 6.500 | 08-10-21 | EUR | 320,000 | 434,680 | ||||||||||||||||||
| Rate (%) | Maturity date | Par value^ | Value | ||||||||||||||||||||
| Germany (continued) | |||||||||||||||||||||||
| Schaeffler Finance BV | 4.250 | 05-15-18 | EUR | 520,000 | $571,530 | ||||||||||||||||||
| Unitymedia Hessen GmbH & Company KG | 4.000 | 01-15-25 | EUR | 900,000 | 952,660 | ||||||||||||||||||
| Unitymedia Hessen GmbH & Company KG | 5.750 | 01-15-23 | EUR | 81,000 | 92,725 | ||||||||||||||||||
| Volkswagen International Finance NV | 0.875 | 01-16-23 | EUR | 2,523,000 | 2,519,772 | ||||||||||||||||||
| Volkswagen International Finance NV | 1.625 | 01-16-30 | EUR | 166,000 | 156,383 | ||||||||||||||||||
| Volkswagen International Finance NV | 2.000 | 03-26-21 | EUR | 718,000 | 789,669 | ||||||||||||||||||
| Volkswagen International Finance NV | 3.250 | 01-21-19 | EUR | 600,000 | 684,623 | ||||||||||||||||||
| Volkswagen International Finance NV (3.500% to 3-20-30, then 15 Year Euro Swap Rate + 3.060%) (Q) | 3.500 | 03-20-30 | EUR | 2,452,000 | 2,129,219 | ||||||||||||||||||
| Volkswagen International Finance NV (3.750% to 3-24-21, then 7 Year Euro Swap Rate + 2.534%) (Q) | 3.750 | 03-24-21 | EUR | 1,550,000 | 1,525,347 | ||||||||||||||||||
| Volkswagen International Finance NV (3.875% to 9-4-18, then 5 Year Euro Swap Rate + 2.700%) (Q) | 3.875 | 09-04-18 | EUR | 390,000 | 406,843 | ||||||||||||||||||
| Volkswagen International Finance NV (4.625% to 3-24-26, then 12 Year Euro Swap Rate + 2.967%) (Q) | 4.625 | 03-24-26 | EUR | 1,733,000 | 1,735,748 | ||||||||||||||||||
| Volkswagen Leasing GmbH | 2.625 | 01-15-24 | EUR | 1,464,000 | 1,627,696 | ||||||||||||||||||
| Volkswagen Leasing GmbH | 3.250 | 05-10-18 | EUR | 1,100,000 | 1,243,308 | ||||||||||||||||||
| Vonovia Finance BV | 2.125 | 07-25-16 | EUR | 1,300,000 | 1,420,591 | ||||||||||||||||||
| Vonovia Finance BV | 2.250 | 12-15-23 | EUR | 1,800,000 | 1,977,641 | ||||||||||||||||||
| Vonovia Finance BV | 3.125 | 07-25-19 | EUR | 1,100,000 | 1,274,233 | ||||||||||||||||||
| Vonovia Finance BV | 3.625 | 10-08-21 | EUR | 1,100,000 | 1,317,575 | ||||||||||||||||||
| Vonovia Finance BV (4.000% to 12-17-21, then 5 Year Euro Swap Rate + 3.390%) (Q) | 4.000 | 12-17-21 | EUR | 2,600,000 | 2,649,752 | ||||||||||||||||||
| Vonovia Finance BV (4.625% to 4-8-19, then 5 Year Euro Swap Rate + 3.696%) | 4.625 | 04-08-74 | EUR | 700,000 | 758,967 | ||||||||||||||||||
| Guernsey, Channel Islands 0.0% | 2,453,503 | ||||||||||||||||||||||
| Credit Suisse Group Guernsey I, Ltd. (7.875% to 8-24-16, then 5 Year U.S. Swap Rate + 5.220%) | 7.875 | 02-24-41 | 2,400,000 | 2,453,503 | |||||||||||||||||||
| Hong Kong 0.0% | 3,597,383 | ||||||||||||||||||||||
| Hutchison Whampoa Finance 14, Ltd. | 1.375 | 10-31-21 | EUR | 3,300,000 | 3,597,383 | ||||||||||||||||||
| India 0.0% | 611,047 | ||||||||||||||||||||||
| Samvardhana Motherson Automotive Systems Group BV | 4.125 | 07-15-21 | EUR | 600,000 | 611,047 | ||||||||||||||||||
| Ireland 0.4% | 39,172,459 | ||||||||||||||||||||||
| Actavis Funding SCS | 4.750 | 03-15-45 | 3,010,000 | 3,015,129 | |||||||||||||||||||
| AerCap Ireland Capital, Ltd. | 4.250 | 07-01-20 | 739,000 | 720,433 | |||||||||||||||||||
| AerCap Ireland Capital, Ltd. | 5.000 | 10-01-21 | 2,353,000 | 2,347,118 | |||||||||||||||||||
| Aquarius & Investments PLC (4.250% to 10-2-23, then 3 month EURIBOR + 3.450%) | 4.250 | 10-02-43 | EUR | 137,000 | 159,836 | ||||||||||||||||||
| Rate (%) | Maturity date | Par value^ | Value | ||||||||||||||||||||
| Ireland (continued) | |||||||||||||||||||||||
| Aquarius & Investments PLC (6.375% to 9-1-19, then 5 Year U.S. Swap Rate + 5.210%) | 6.375 | 09-01-24 | 560,000 | $574,197 | |||||||||||||||||||
| Ardagh Packaging Finance PLC | 4.250 | 01-15-22 | EUR | 400,000 | 428,631 | ||||||||||||||||||
| Ardagh Packaging Finance PLC (S) | 7.000 | 11-15-20 | 70,588 | 66,882 | |||||||||||||||||||
| Ardagh Packaging Finance PLC (S) | 9.125 | 10-15-20 | 505,000 | 506,263 | |||||||||||||||||||
| Bank of Ireland | 1.250 | 04-09-20 | EUR | 1,500,000 | 1,635,850 | ||||||||||||||||||
| Bank of Ireland | 2.000 | 05-08-17 | EUR | 3,100,000 | 3,423,114 | ||||||||||||||||||
| Bank of Ireland | 3.250 | 01-15-19 | EUR | 300,000 | 347,116 | ||||||||||||||||||
| Bank of Ireland (7.375% to 6-18-20, then 5 Year Euro Swap Rate + 6.956%) (Q) | 7.375 | 06-18-20 | EUR | 550,000 | 604,771 | ||||||||||||||||||
| Cloverie PLC | 1.750 | 09-16-24 | EUR | 400,000 | 443,453 | ||||||||||||||||||
| ESB Finance, Ltd. | 2.125 | 06-08-27 | EUR | 2,100,000 | 2,359,311 | ||||||||||||||||||
| ESB Finance, Ltd. | 3.494 | 01-12-24 | EUR | 500,000 | 631,281 | ||||||||||||||||||
| ESB Finance, Ltd. | 4.375 | 11-21-19 | EUR | 1,100,000 | 1,367,079 | ||||||||||||||||||
| ESB Finance, Ltd. | 6.250 | 09-11-17 | EUR | 464,000 | 551,110 | ||||||||||||||||||
| FCA Capital Ireland PLC | 2.000 | 10-23-19 | EUR | 1,500,000 | 1,636,836 | ||||||||||||||||||
| FCA Capital Ireland PLC | 2.875 | 01-26-18 | EUR | 400,000 | 445,076 | ||||||||||||||||||
| FCA Capital Ireland PLC | 4.000 | 10-17-18 | EUR | 750,000 | 862,422 | ||||||||||||||||||
| Fly Leasing, Ltd. | 6.375 | 10-15-21 | 878,000 | 849,465 | |||||||||||||||||||
| GAS Networks Ireland | 3.625 | 12-04-17 | EUR | 450,000 | 517,949 | ||||||||||||||||||
| GE Capital European Funding | 0.800 | 01-21-22 | EUR | 4,373,000 | 4,749,431 | ||||||||||||||||||
| GE Capital European Funding | 2.625 | 03-15-23 | EUR | 400,000 | 483,238 | ||||||||||||||||||
| GE Capital European Funding | 4.625 | 02-22-27 | EUR | 500,000 | 722,334 | ||||||||||||||||||
| GE Capital International Funding Company (S) | 4.418 | 11-15-35 | 7,925,000 | 8,145,157 | |||||||||||||||||||
| Smurfit Kappa Acquisitions | 4.125 | 01-30-20 | EUR | 615,000 | 716,776 | ||||||||||||||||||
| Willow No 2 Ireland PLC | 3.375 | 06-27-22 | EUR | 700,000 | 862,201 | ||||||||||||||||||
| Israel 0.0% | 3,252,231 | ||||||||||||||||||||||
| Teva Pharmaceutical Finance IV BV | 2.875 | 04-15-19 | EUR | 1,700,000 | 1,941,196 | ||||||||||||||||||
| Teva Pharmaceutical Finance Netherlands II BV | 1.250 | 03-31-23 | EUR | 1,300,000 | 1,311,035 | ||||||||||||||||||
| Italy 0.3% | 29,867,692 | ||||||||||||||||||||||
| 2i Rete Gas SpA | 1.125 | 01-02-20 | EUR | 2,400,000 | 2,615,145 | ||||||||||||||||||
| Assicurazioni Generali SpA | 5.125 | 09-16-24 | EUR | 500,000 | 674,705 | ||||||||||||||||||
| Assicurazioni Generali SpA (7.750% to 12-12-22, then 3 month EURIBOR + 7.113%) | 7.750 | 12-12-42 | EUR | 1,800,000 | 2,315,191 | ||||||||||||||||||
| Edison SpA | 3.875 | 11-10-17 | EUR | 1,020,000 | 1,172,691 | ||||||||||||||||||
| Enel Finance International NV | 1.966 | 01-27-25 | EUR | 1,879,000 | 2,107,673 | ||||||||||||||||||
| Enel Finance International NV | 5.000 | 09-14-22 | EUR | 900,000 | 1,207,640 | ||||||||||||||||||
| Enel Finance International NV (S) | 6.800 | 09-15-37 | 3,733,000 | 4,558,811 | |||||||||||||||||||
| Enel SpA (5.000% to 1-15-20, then 5 Year Euro Swap Rate + 3.648%) | 5.000 | 01-15-75 | EUR | 1,080,000 | 1,198,547 | ||||||||||||||||||
| Eni SpA | 4.000 | 06-29-20 | EUR | 100,000 | 122,563 | ||||||||||||||||||
| Eni SpA (S) | 5.700 | 10-01-40 | 300,000 | 280,946 | |||||||||||||||||||
| Intesa Sanpaolo SpA | 1.125 | 03-04-22 | EUR | 700,000 | 743,526 | ||||||||||||||||||
| Intesa Sanpaolo SpA | 2.000 | 06-18-21 | EUR | 1,200,000 | 1,346,145 | ||||||||||||||||||
| Rate (%) | Maturity date | Par value^ | Value | ||||||||||||||||||||
| Italy (continued) | |||||||||||||||||||||||
| Intesa Sanpaolo SpA | 3.000 | 01-28-19 | EUR | 1,100,000 | $1,269,753 | ||||||||||||||||||
| Intesa Sanpaolo SpA | 3.928 | 09-15-26 | EUR | 1,000,000 | 1,090,049 | ||||||||||||||||||
| Intesa Sanpaolo SpA | 4.000 | 11-09-17 | EUR | 100,000 | 115,381 | ||||||||||||||||||
| Intesa Sanpaolo SpA | 4.125 | 09-19-16 | EUR | 200,000 | 222,049 | ||||||||||||||||||
| Intesa Sanpaolo SpA | 4.375 | 10-15-19 | EUR | 1,200,000 | 1,462,942 | ||||||||||||||||||
| Intesa Sanpaolo SpA | 5.000 | 02-28-17 | EUR | 2,300,000 | 2,618,311 | ||||||||||||||||||
| Intesa Sanpaolo SpA | 6.625 | 09-13-23 | EUR | 530,000 | 677,552 | ||||||||||||||||||
| Intesa Sanpaolo SpA (7.700% to 9-17-25, then 5 Year U.S. Swap Rate + 5.462%) (Q) (S) | 7.700 | 09-17-25 | 450,000 | 437,090 | |||||||||||||||||||
| UniCredit SpA | 5.650 | 07-24-18 | EUR | 1,500,000 | 1,804,499 | ||||||||||||||||||
| UniCredit SpA | 5.650 | 08-24-18 | EUR | 900,000 | 1,087,905 | ||||||||||||||||||
| Wind Acquisition Finance SA | 4.000 | 07-15-20 | EUR | 400,000 | 423,855 | ||||||||||||||||||
| Wind Acquisition Finance SA | 7.000 | 04-23-21 | EUR | 300,000 | 314,723 | ||||||||||||||||||
| Jamaica 0.0% | 1,044,634 | ||||||||||||||||||||||
| Digicel Group, Ltd. (S) | 8.250 | 09-30-20 | 308,000 | 249,134 | |||||||||||||||||||
| Digicel, Ltd. (S) | 6.750 | 03-01-23 | 925,000 | 795,500 | |||||||||||||||||||
| Japan 0.0% | 2,812,000 | ||||||||||||||||||||||
| Sumitomo Mitsui Banking Corp. | 1.000 | 01-19-22 | EUR | 2,600,000 | 2,812,000 | ||||||||||||||||||
| Jersey, Channel Islands 0.1% | 4,801,056 | ||||||||||||||||||||||
| AA Bond Company, Ltd. | 4.720 | 07-02-43 | GBP | 1,850,000 | 2,740,293 | ||||||||||||||||||
| CPUK Finance, Ltd. | 7.000 | 08-28-20 | GBP | 600,000 | 865,631 | ||||||||||||||||||
| ProSecure Funding LP | 4.668 | 06-30-16 | EUR | 1,100,000 | 1,195,132 | ||||||||||||||||||
| Luxembourg 0.1% | 12,505,591 | ||||||||||||||||||||||
| Altice Financing SA | 5.250 | 02-15-23 | EUR | 450,000 | 474,124 | ||||||||||||||||||
| Altice Luxembourg SA | 7.250 | 05-15-22 | EUR | 320,000 | 328,498 | ||||||||||||||||||
| Altice Luxembourg SA (S) | 7.750 | 05-15-22 | 1,105,000 | 1,030,413 | |||||||||||||||||||
| Ardagh Finance Holdings SA, PIK | 8.375 | 06-15-19 | EUR | 182,328 | 187,855 | ||||||||||||||||||
| Bilbao Luxembourg SA, PIK | 10.500 | 12-01-18 | EUR | 481,996 | 401,633 | ||||||||||||||||||
| Cabot Financial Luxembourg SA | 6.500 | 04-01-21 | GBP | 100,000 | 131,619 | ||||||||||||||||||
| Cabot Financial Luxembourg SA | 8.375 | 08-01-20 | GBP | 250,000 | 359,041 | ||||||||||||||||||
| Garfunkelux Holdco 2 SA | 11.000 | 11-01-23 | GBP | 250,000 | 337,140 | ||||||||||||||||||
| Garfunkelux Holdco 3 SA | 8.500 | 11-01-22 | GBP | 425,000 | 594,632 | ||||||||||||||||||
| GELF Bond Issuer I SA | 1.750 | 11-22-21 | EUR | 1,750,000 | 1,883,369 | ||||||||||||||||||
| Glencore Finance Europe SA | 1.250 | 03-17-21 | EUR | 700,000 | 552,324 | ||||||||||||||||||
| Glencore Finance Europe SA | 2.750 | 04-01-21 | EUR | 110,000 | 92,128 | ||||||||||||||||||
| Glencore Finance Europe SA | 3.375 | 09-30-20 | EUR | 1,600,000 | 1,396,361 | ||||||||||||||||||
| Glencore Finance Europe SA | 5.250 | 03-22-17 | EUR | 1,200,000 | 1,287,135 | ||||||||||||||||||
| INEOS Group Holdings SA | 5.750 | 02-15-19 | EUR | 350,000 | 369,931 | ||||||||||||||||||
| INEOS Group Holdings SA (S) | 5.875 | 02-15-19 | 520,000 | 505,050 | |||||||||||||||||||
| INEOS Group Holdings SA (S) | 6.125 | 08-15-18 | 545,000 | 544,319 | |||||||||||||||||||
| Prologis International Funding II SA | 2.750 | 10-23-18 | EUR | 300,000 | 341,539 | ||||||||||||||||||
| Prologis International Funding II SA | 2.875 | 04-04-22 | EUR | 1,475,000 | 1,688,480 | ||||||||||||||||||
| Rate (%) | Maturity date | Par value^ | Value | ||||||||||||||||||||
| Mexico 0.1% | $13,174,137 | ||||||||||||||||||||||
| America Movil SAB de CV | 3.000 | 07-12-21 | EUR | 1,660,000 | 1,976,975 | ||||||||||||||||||
| America Movil SAB de CV | 4.125 | 10-25-19 | EUR | 400,000 | 486,417 | ||||||||||||||||||
| America Movil SAB de CV | 4.750 | 06-28-22 | EUR | 600,000 | 789,243 | ||||||||||||||||||
| America Movil SAB de CV (5.125% to 9-6-18, then 5 Year Euro Swap Rate + 3.850%) | 5.125 | 09-06-73 | EUR | 900,000 | 998,134 | ||||||||||||||||||
| America Movil SAB de CV (6.375% to 9-6-23, then 5 Year Euro Swap Rate + 4.550%) | 6.375 | 09-06-73 | EUR | 600,000 | 663,802 | ||||||||||||||||||
| Cemex SAB de CV (S) | 7.250 | 01-15-21 | 375,000 | 357,188 | |||||||||||||||||||
| Grupo Televisa SAB | 5.000 | 05-13-45 | 2,380,000 | 2,011,750 | |||||||||||||||||||
| Mexichem SAB de CV (S) | 5.875 | 09-17-44 | 2,490,000 | 2,023,125 | |||||||||||||||||||
| Petroleos Mexicanos | 3.125 | 11-27-20 | EUR | 2,000,000 | 2,079,382 | ||||||||||||||||||
| Petroleos Mexicanos | 5.500 | 01-09-17 | EUR | 630,000 | 707,640 | ||||||||||||||||||
| Petroleos Mexicanos | 6.375 | 08-05-16 | EUR | 973,000 | 1,080,481 | ||||||||||||||||||
| Netherlands 0.6% | 52,400,659 | ||||||||||||||||||||||
| ABN AMRO Bank NV (2.875% to 1-18-23, then 5 Year Euro Swap Rate + 2.450%) | 2.875 | 01-18-28 | EUR | 1,500,000 | 1,628,377 | ||||||||||||||||||
| Achmea BV | 2.500 | 11-19-20 | EUR | 2,460,000 | 2,845,812 | ||||||||||||||||||
| Alliander NV (3.250% to 11-27-18, then 5 Year Euro Swap Rate + 2.295%) (Q) | 3.250 | 11-27-18 | EUR | 1,000,000 | 1,119,695 | ||||||||||||||||||
| Allianz Finance II BV | 3.000 | 03-13-28 | EUR | 500,000 | 630,594 | ||||||||||||||||||
| BAT Netherlands Finance BV | 3.125 | 03-06-29 | EUR | 1,620,000 | 1,945,743 | ||||||||||||||||||
| Bharti Airtel International Netherlands BV | 4.000 | 12-10-18 | EUR | 2,505,000 | 2,876,811 | ||||||||||||||||||
| BMW Finance NV | 2.625 | 01-17-24 | EUR | 600,000 | 719,558 | ||||||||||||||||||
| Cooperatieve Rabobank UA | 3.375 | 05-21-25 | 1,406,000 | 1,417,470 | |||||||||||||||||||
| Cooperatieve Rabobank UA | 4.375 | 08-04-25 | 3,586,000 | 3,650,957 | |||||||||||||||||||
| Cooperatieve Rabobank UA (2.500% to 5-26-21, then 5 Year Euro Swap Rate + 1.400%) | 2.500 | 05-26-26 | EUR | 3,830,000 | 4,165,730 | ||||||||||||||||||
| Deutsche Telekom International Finance BV (S) | 4.875 | 03-06-42 | 868,000 | 897,055 | |||||||||||||||||||
| Deutsche Telekom International Finance BV | 8.750 | 06-15-30 | 1,200,000 | 1,668,466 | |||||||||||||||||||
| E.ON International Finance BV | 6.750 | 01-27-39 | GBP | 750,000 | 1,322,987 | ||||||||||||||||||
| EDP Finance BV | 2.625 | 01-18-22 | EUR | 1,000,000 | 1,069,155 | ||||||||||||||||||
| EDP Finance BV | 4.125 | 01-20-21 | EUR | 1,210,000 | 1,401,873 | ||||||||||||||||||
| EDP Finance BV | 4.875 | 09-14-20 | EUR | 190,000 | 226,728 | ||||||||||||||||||
| General Motors Financial International BV | 0.850 | 02-23-18 | EUR | 1,900,000 | 2,048,298 | ||||||||||||||||||
| General Motors Financial International BV | 1.875 | 10-15-19 | EUR | 600,000 | 660,151 | ||||||||||||||||||
| ING Bank NV (3.500% to 11-21-18, then 5 Year Euro Swap Rate + 2.450%) | 3.500 | 11-21-23 | EUR | 785,000 | 895,753 | ||||||||||||||||||
| InterXion Holding NV | 6.000 | 07-15-20 | EUR | 475,000 | 535,765 | ||||||||||||||||||
| JAB Holdings BV | 1.500 | 11-24-21 | EUR | 1,400,000 | 1,485,673 | ||||||||||||||||||
| JAB Holdings BV | 2.125 | 09-16-22 | EUR | 900,000 | 971,804 | ||||||||||||||||||
| Koninklijke KPN NV | 7.500 | 02-04-19 | EUR | 778,000 | 1,016,186 | ||||||||||||||||||
| LeasePlan Corp. NV | 2.375 | 04-23-19 | EUR | 730,000 | 823,435 | ||||||||||||||||||
| LGE HoldCo VI BV | 7.125 | 05-15-24 | EUR | 560,000 | 652,518 | ||||||||||||||||||
| Rate (%) | Maturity date | Par value^ | Value | ||||||||||||||||||||
| Netherlands (continued) | |||||||||||||||||||||||
| Linde Finance BV (7.375% to 7-14-16, then 3 month EURIBOR + 4.125%) | 7.375 | 07-14-66 | EUR | 1,020,000 | $1,134,741 | ||||||||||||||||||
| NN Group NV (4.500% to 1-15-26, then 3 month EURIBOR + 4.000%) (Q) | 4.500 | 01-15-26 | EUR | 1,200,000 | 1,238,286 | ||||||||||||||||||
| Playa Resorts Holding BV (S) | 8.000 | 08-15-20 | 880,000 | 895,400 | |||||||||||||||||||
| Roche Finance Europe BV | 0.875 | 02-25-25 | EUR | 1,500,000 | 1,636,667 | ||||||||||||||||||
| Shell International Finance BV | 1.625 | 01-20-27 | EUR | 700,000 | 746,851 | ||||||||||||||||||
| Shell International Finance BV | 4.125 | 05-11-35 | 5,918,000 | 5,457,077 | |||||||||||||||||||
| Siemens Financieringsmaatschappij NV (S) | 3.250 | 05-27-25 | 1,487,000 | 1,516,603 | |||||||||||||||||||
| Siemens Financieringsmaatschappij NV (S) | 6.125 | 08-17-26 | 1,240,000 | 1,556,191 | |||||||||||||||||||
| Swiss Reinsurance Company (2.600% to 9-1-25, then 6 month EURIBOR + 3.050%) (Q) | 2.600 | 09-01-25 | EUR | 1,300,000 | 1,268,742 | ||||||||||||||||||
| Swiss Reinsurance Company (5.252% to 5-25-16, then 6 month EURIBOR + 2.090%) (Q) | 5.252 | 05-25-16 | EUR | 250,000 | 273,507 | ||||||||||||||||||
| Norway 0.1% | 5,269,695 | ||||||||||||||||||||||
| DNB Bank ASA | 4.375 | 02-24-21 | EUR | 610,000 | 783,301 | ||||||||||||||||||
| DNB Bank ASA (3.000% to 9-26-18, then 5 Year Euro Swap Rate + 1.770%) | 3.000 | 09-26-23 | EUR | 540,000 | 601,516 | ||||||||||||||||||
| Lock Lower Holding AS | 9.500 | 08-15-22 | EUR | 325,000 | 350,677 | ||||||||||||||||||
| Silk Bidco AS | 7.500 | 02-01-22 | EUR | 650,000 | 711,646 | ||||||||||||||||||
| Statkraft AS | 2.500 | 11-28-22 | EUR | 1,304,000 | 1,544,587 | ||||||||||||||||||
| Statkraft AS | 6.625 | 04-02-19 | EUR | 990,000 | 1,277,968 | ||||||||||||||||||
| Portugal 0.0% | 120,011 | ||||||||||||||||||||||
| Portugal Telecom International Finance BV | 5.875 | 04-17-18 | EUR | 200,000 | 120,011 | ||||||||||||||||||
| Spain 0.3% | 26,529,889 | ||||||||||||||||||||||
| Amadeus Capital Markets SA Sociedad Unipersonal | 4.875 | 07-15-16 | EUR | 1,130,000 | 1,249,208 | ||||||||||||||||||
| Banco Bilbao Vizcaya Argentaria SA (6.750% to 2-18-20, then 5 Year Euro Swap Rate + 6.604%) (Q) | 6.750 | 02-18-20 | EUR | 1,000,000 | 1,011,935 | ||||||||||||||||||
| BBVA Subordinated Capital SAU (3.500% to 4-11-19, then 5 Year Euro Swap Rate + 2.550%) | 3.500 | 04-11-24 | EUR | 2,100,000 | 2,332,569 | ||||||||||||||||||
| Enagas Financiaciones SAU | 1.250 | 02-06-25 | EUR | 1,400,000 | 1,488,705 | ||||||||||||||||||
| Ferrovial Emisiones SA | 3.375 | 01-30-18 | EUR | 1,100,000 | 1,260,315 | ||||||||||||||||||
| Gas Natural Capital Markets SA | 6.000 | 01-27-20 | EUR | 1,100,000 | 1,435,030 | ||||||||||||||||||
| Gas Natural Fenosa Finance BV | 3.875 | 04-11-22 | EUR | 600,000 | 745,796 | ||||||||||||||||||
| Gas Natural Fenosa Finance BV (4.125% to 11-18-22, then 8 Year Euro Swap Rate + 3.353%) (Q) | 4.125 | 11-18-22 | EUR | 900,000 | 877,074 | ||||||||||||||||||
| Iberdrola International BV | 3.000 | 01-31-22 | EUR | 900,000 | 1,087,331 | ||||||||||||||||||
| Inmobiliaria Colonial SA | 1.863 | 06-05-19 | EUR | 1,200,000 | 1,304,902 | ||||||||||||||||||
| Telefonica Emisiones SAU | 3.661 | 09-18-17 | EUR | 850,000 | 971,028 | ||||||||||||||||||
| Rate (%) | Maturity date | Par value^ | Value | ||||||||||||||||||||
| Spain (continued) | |||||||||||||||||||||||
| Telefonica Emisiones SAU | 3.987 | 01-23-23 | EUR | 100,000 | $124,173 | ||||||||||||||||||
| Telefonica Emisiones SAU | 4.710 | 01-20-20 | EUR | 600,000 | 745,458 | ||||||||||||||||||
| Telefonica Emisiones SAU | 4.967 | 02-03-16 | EUR | 1,100,000 | 1,191,779 | ||||||||||||||||||
| Telefonica Emisiones SAU | 5.811 | 09-05-17 | EUR | 700,000 | 824,546 | ||||||||||||||||||
| Telefonica Europe BV | 5.875 | 02-14-33 | EUR | 230,000 | 344,560 | ||||||||||||||||||
| Telefonica Europe BV | 8.250 | 09-15-30 | 3,712,000 | 4,795,563 | |||||||||||||||||||
| Telefonica Europe BV (4.200% to 12-4-19, then 5 Year Euro Swap Rate + 3.806%) (Q) | 4.200 | 12-04-19 | EUR | 4,300,000 | 4,425,920 | ||||||||||||||||||
| Telefonica Europe BV (5.000% to 3-31-20, then 6 Year Euro Swap Rate + 3.804%) (Q) | 5.000 | 03-31-20 | EUR | 300,000 | 313,997 | ||||||||||||||||||
| Sweden 0.1% | 5,259,187 | ||||||||||||||||||||||
| Investor AB | 3.250 | 09-17-18 | EUR | 550,000 | 642,671 | ||||||||||||||||||
| Svenska Handelsbanken AB | 1.125 | 12-14-22 | EUR | 1,650,000 | 1,815,320 | ||||||||||||||||||
| Svenska Handelsbanken AB | 4.375 | 10-20-21 | EUR | 570,000 | 746,060 | ||||||||||||||||||
| Swedbank AB | 0.625 | 01-04-21 | EUR | 1,450,000 | 1,576,605 | ||||||||||||||||||
| Vattenfall AB (3.000% to 3-19-27, then 5 Year Euro Swap Rate + 2.511%) | 3.000 | 03-19-77 | EUR | 583,000 | 478,531 | ||||||||||||||||||
| Switzerland 0.2% | 13,287,849 | ||||||||||||||||||||||
| Coca-Cola HBC Finance BV | 4.250 | 11-16-16 | EUR | 238,000 | 265,774 | ||||||||||||||||||
| Credit Suisse AG | 0.500 | 03-29-18 | EUR | 2,050,000 | 2,235,251 | ||||||||||||||||||
| Credit Suisse AG | 0.625 | 11-20-18 | EUR | 1,700,000 | 1,862,225 | ||||||||||||||||||
| Credit Suisse AG | 1.125 | 09-15-20 | EUR | 1,600,000 | 1,771,738 | ||||||||||||||||||
| Lunar Funding V for Swisscom AG | 2.000 | 09-30-20 | EUR | 800,000 | 924,934 | ||||||||||||||||||
| UBS AG | 0.500 | 05-15-18 | EUR | 2,000,000 | 2,185,742 | ||||||||||||||||||
| UBS AG (4.750% to 2-12-21, then 5 Year Euro Swap Rate + 3.400%) | 4.750 | 02-12-26 | EUR | 3,050,000 | 3,482,295 | ||||||||||||||||||
| UBS Group AG (5.750% to 2-19-22, then 5 Year Euro Swap Rate + 5.287%) (Q) | 5.750 | 02-19-22 | EUR | 500,000 | 559,890 | ||||||||||||||||||
| United Arab Emirates 0.0% | 279,967 | ||||||||||||||||||||||
| Glencore Finance Dubai, Ltd. | 1.750 | 05-19-16 | EUR | 260,000 | 279,967 | ||||||||||||||||||
| United Kingdom 1.4% | 122,890,541 | ||||||||||||||||||||||
| Abbey National Treasury Services PLC | 0.875 | 01-13-20 | EUR | 900,000 | 979,483 | ||||||||||||||||||
| Abbey National Treasury Services PLC | 0.875 | 11-25-20 | EUR | 2,150,000 | 2,329,398 | ||||||||||||||||||
| Abbey National Treasury Services PLC | 1.125 | 01-14-22 | EUR | 2,100,000 | 2,270,771 | ||||||||||||||||||
| Abbey National Treasury Services PLC | 1.750 | 01-15-18 | EUR | 280,000 | 312,417 | ||||||||||||||||||
| Abbey National Treasury Services PLC | 2.000 | 01-14-19 | EUR | 800,000 | 903,739 | ||||||||||||||||||
| Abbey National Treasury Services PLC | 2.625 | 07-16-20 | EUR | 1,240,000 | 1,449,339 | ||||||||||||||||||
| Abbey National Treasury Services PLC | 3.875 | 10-15-29 | GBP | 1,200,000 | 1,812,364 | ||||||||||||||||||
| Abbey National Treasury Services PLC | 4.000 | 03-13-24 | 2,063,000 | 2,192,049 | |||||||||||||||||||
| Anglo American Capital PLC | 1.750 | 04-03-18 | EUR | 500,000 | 435,997 | ||||||||||||||||||
| Anglo American Capital PLC | 2.750 | 06-07-19 | EUR | 2,500,000 | 1,993,809 | ||||||||||||||||||
| Anglo American Capital PLC | 3.250 | 04-03-23 | EUR | 850,000 | 593,897 | ||||||||||||||||||
| Arqiva Broadcast Finance PLC | 9.500 | 03-31-20 | GBP | 395,000 | 602,237 | ||||||||||||||||||
| Rate (%) | Maturity date | Par value^ | Value | ||||||||||||||||||||
| United Kingdom (continued) | |||||||||||||||||||||||
| Aspire Defence Finance PLC | 4.674 | 03-31-40 | GBP | 879,021 | $1,412,716 | ||||||||||||||||||
| Aviva PLC (3.375% to 12-4-25, then 3 month EURIBOR + 3.550%) | 3.375 | 12-04-45 | EUR | 700,000 | 706,044 | ||||||||||||||||||
| Aviva PLC (3.875% to 7-3-24, then 5 Year Euro Swap Rate + 3.480%) | 3.875 | 07-03-44 | EUR | 400,000 | 422,922 | ||||||||||||||||||
| Aviva PLC (6.125% to 7-5-23, then 5 Year Euro Swap Rate + 5.130%) | 6.125 | 07-05-43 | EUR | 1,110,000 | 1,368,955 | ||||||||||||||||||
| Babcock International Group PLC | 1.750 | 10-06-22 | EUR | 1,024,000 | 1,122,080 | ||||||||||||||||||
| Barclays Bank PLC | 7.625 | 11-21-22 | 1,180,000 | 1,318,713 | |||||||||||||||||||
| Barclays Bank PLC | 10.000 | 05-21-21 | GBP | 210,000 | 384,009 | ||||||||||||||||||
| Barclays PLC | 3.650 | 03-16-25 | 3,250,000 | 3,108,866 | |||||||||||||||||||
| Barclays PLC (2.625% to 11-11-20, then 5 Year Euro Swap Rate + 2.450%) | 2.625 | 11-11-25 | EUR | 900,000 | 961,958 | ||||||||||||||||||
| Barclays PLC (7.875% to 9-15-22, the 5 Year British Pound Swap Rate + 6.099%) (Q) | 7.875 | 09-15-22 | GBP | 400,000 | 544,959 | ||||||||||||||||||
| BIBBY Offshore Services PLC | 7.500 | 06-15-21 | GBP | 425,000 | 375,730 | ||||||||||||||||||
| BP Capital Markets PLC | 1.109 | 02-16-23 | EUR | 1,150,000 | 1,217,152 | ||||||||||||||||||
| BP Capital Markets PLC | 1.573 | 02-16-27 | EUR | 950,000 | 971,628 | ||||||||||||||||||
| BP Capital Markets PLC | 2.213 | 09-25-26 | EUR | 525,000 | 579,148 | ||||||||||||||||||
| Brambles Finance PLC | 4.625 | 04-20-18 | EUR | 530,000 | 626,492 | ||||||||||||||||||
| British Telecommunications PLC | 9.625 | 12-15-30 | 2,738,000 | 3,943,988 | |||||||||||||||||||
| Centrica PLC (3.000% to 4-10-21, then 5 Year Euro Swap Rate + 2.687%) | 3.000 | 04-10-76 | EUR | 1,400,000 | 1,299,405 | ||||||||||||||||||
| CNH Industrial Finance Europe SA | 2.750 | 03-18-19 | EUR | 120,000 | 127,566 | ||||||||||||||||||
| Co-Operative Bank PLC | 5.125 | 09-20-17 | GBP | 560,000 | 781,864 | ||||||||||||||||||
| Coventry Building Society | 2.250 | 12-04-17 | EUR | 1,480,000 | 1,662,268 | ||||||||||||||||||
| Coventry Building Society | 2.500 | 11-18-20 | EUR | 1,400,000 | 1,630,781 | ||||||||||||||||||
| Eversholt Funding PLC | 6.359 | 12-02-25 | GBP | 600,000 | 1,066,452 | ||||||||||||||||||
| Experian Finance PLC | 4.750 | 02-04-20 | EUR | 1,540,000 | 1,928,191 | ||||||||||||||||||
| FCE Bank PLC | 1.875 | 04-18-19 | EUR | 2,400,000 | 2,680,366 | ||||||||||||||||||
| FCE Bank PLC | 1.875 | 06-24-21 | EUR | 2,650,000 | 2,917,173 | ||||||||||||||||||
| FCE Bank PLC | 2.875 | 10-03-17 | EUR | 470,000 | 529,768 | ||||||||||||||||||
| Fiat Chrysler Automobiles NV | 5.250 | 04-15-23 | 370,000 | 345,025 | |||||||||||||||||||
| Fiat Chrysler Finance Europe | 4.750 | 07-15-22 | EUR | 330,000 | 370,505 | ||||||||||||||||||
| Fiat Chrysler Finance Europe | 6.750 | 10-14-19 | EUR | 600,000 | 723,880 | ||||||||||||||||||
| Fiat Chrysler Finance Europe | 7.000 | 03-23-17 | EUR | 1,200,000 | 1,366,229 | ||||||||||||||||||
| Firstgroup PLC | 8.125 | 09-19-18 | GBP | 270,000 | 438,032 | ||||||||||||||||||
| G4S International Finance PLC | 2.625 | 12-06-18 | EUR | 400,000 | 455,806 | ||||||||||||||||||
| G4S International Finance PLC | 2.875 | 05-02-17 | EUR | 881,000 | 981,708 | ||||||||||||||||||
| Grainger PLC | 5.000 | 12-16-20 | GBP | 525,000 | 777,146 | ||||||||||||||||||
| Hammerson PLC | 2.000 | 07-01-22 | EUR | 1,300,000 | 1,443,510 | ||||||||||||||||||
| Hammerson PLC | 2.750 | 09-26-19 | EUR | 760,000 | 879,242 | ||||||||||||||||||
| HBOS Capital Funding LP (6.461% to 11-30-18, then 5 Year U.K. Treasury + 2.850%) (Q) | 6.461 | 11-30-18 | GBP | 400,000 | 597,093 | ||||||||||||||||||
| Heathrow Finance PLC | 7.125 | 03-01-17 | GBP | 1,480,000 | 2,185,554 | ||||||||||||||||||
| Rate (%) | Maturity date | Par value^ | Value | ||||||||||||||||||||
| United Kingdom (continued) | |||||||||||||||||||||||
| Heathrow Funding, Ltd. | 1.500 | 02-11-32 | EUR | 1,300,000 | $1,286,976 | ||||||||||||||||||
| Heathrow Funding, Ltd. | 1.875 | 05-23-22 | EUR | 700,000 | 797,290 | ||||||||||||||||||
| Heathrow Funding, Ltd. | 4.375 | 01-25-17 | EUR | 560,000 | 630,935 | ||||||||||||||||||
| Heathrow Funding, Ltd. | 4.600 | 02-15-18 | EUR | 1,260,000 | 1,483,640 | ||||||||||||||||||
| Heathrow Funding, Ltd. | 6.450 | 12-10-31 | GBP | 1,100,000 | 2,089,826 | ||||||||||||||||||
| HSBC Holdings PLC (3.375% to 1-10-19, then 5 Year Euro Swap Rate + 1.950%) | 3.375 | 01-10-24 | EUR | 380,000 | 429,451 | ||||||||||||||||||
| Imperial Tobacco Finance PLC | 2.250 | 02-26-21 | EUR | 500,000 | 569,998 | ||||||||||||||||||
| Imperial Tobacco Finance PLC | 3.375 | 02-26-26 | EUR | 900,000 | 1,088,269 | ||||||||||||||||||
| Imperial Tobacco Finance PLC | 5.000 | 12-02-19 | EUR | 1,420,000 | 1,784,461 | ||||||||||||||||||
| Imperial Tobacco Finance PLC | 8.375 | 02-17-16 | EUR | 525,000 | 570,618 | ||||||||||||||||||
| Jaguar Land Rover Automotive PLC | 3.875 | 03-01-23 | GBP | 1,210,000 | 1,552,848 | ||||||||||||||||||
| Jaguar Land Rover Automotive PLC | 5.000 | 02-15-22 | GBP | 375,000 | 529,371 | ||||||||||||||||||
| Jaguar Land Rover Automotive PLC (S) | 5.625 | 02-01-23 | 150,000 | 147,750 | |||||||||||||||||||
| LBG Capital No.2 PLC | 15.000 | 12-21-19 | EUR | 1,495,000 | 2,246,858 | ||||||||||||||||||
| Leeds Building Society | 1.375 | 05-05-22 | EUR | 1,300,000 | 1,384,662 | ||||||||||||||||||
| Leeds Building Society | 2.625 | 04-01-21 | EUR | 1,720,000 | 1,969,493 | ||||||||||||||||||
| Lloyds Bank PLC | 3.500 | 05-14-25 | 2,170,000 | 2,206,708 | |||||||||||||||||||
| Lloyds Bank PLC | 6.500 | 03-24-20 | EUR | 1,420,000 | 1,839,312 | ||||||||||||||||||
| Lloyds Bank PLC | 6.500 | 09-17-40 | GBP | 600,000 | 1,214,702 | ||||||||||||||||||
| Lloyds Bank PLC | 9.625 | 04-06-23 | GBP | 400,000 | 763,571 | ||||||||||||||||||
| Lloyds Bank PLC (5.750% to 7-9-20, then 3 month British Pound LIBOR + 1.390%) | 5.750 | 07-09-25 | GBP | 500,000 | 770,608 | ||||||||||||||||||
| Lloyds Banking Group PLC (7.000% to 6-27-19, then 5 Year British Pound Swap Rate + 5.060%) (Q) | 7.000 | 06-27-19 | GBP | 325,000 | 454,870 | ||||||||||||||||||
| Mondi Finance PLC | 3.375 | 09-28-20 | EUR | 850,000 | 1,010,132 | ||||||||||||||||||
| Mondi Finance PLC | 5.750 | 04-03-17 | EUR | 310,000 | 356,048 | ||||||||||||||||||
| Motability Operations Group PLC | 1.625 | 06-09-23 | EUR | 1,500,000 | 1,699,569 | ||||||||||||||||||
| Motability Operations Group PLC | 3.250 | 11-30-18 | EUR | 710,000 | 835,108 | ||||||||||||||||||
| National Grid PLC | 5.000 | 07-02-18 | EUR | 861,000 | 1,038,195 | ||||||||||||||||||
| Nationwide Building Society (S) | 3.900 | 07-21-25 | 2,120,000 | 2,226,670 | |||||||||||||||||||
| Nationwide Building Society | 6.750 | 07-22-20 | EUR | 450,000 | 591,151 | ||||||||||||||||||
| NGG Finance PLC (4.250% to 6-18-20, then 7 Year Euro Swap Rate + 2.880%) | 4.250 | 06-18-76 | EUR | 980,000 | 1,080,911 | ||||||||||||||||||
| Provident Financial PLC | 8.000 | 10-23-19 | GBP | 610,000 | 975,040 | ||||||||||||||||||
| Rentokil Initial PLC | 3.250 | 10-07-21 | EUR | 1,200,000 | 1,435,962 | ||||||||||||||||||
| Rio Tinto Finance USA PLC | 4.750 | 03-22-42 | 880,000 | 735,547 | |||||||||||||||||||
| Santander UK Group Holdings PLC (7.375% to 6-24-22, then 5 Year British Pound Swap Rate + 5.543%) (Q) | 7.375 | 06-24-22 | GBP | 400,000 | 558,362 | ||||||||||||||||||
| Sensata Technologies UK Financing Company PLC (S) | 6.250 | 02-15-26 | 1,400,000 | 1,428,000 | |||||||||||||||||||
| SSE PLC | 1.750 | 09-08-23 | EUR | 1,150,000 | 1,272,161 | ||||||||||||||||||
| Rate (%) | Maturity date | Par value^ | Value | ||||||||||||||||||||
| United Kingdom (continued) | |||||||||||||||||||||||
| SSE PLC (2.375% to 4-1-21, then 5 Year Euro Swap Rate + 1.989%) (Q) | 2.375 | 04-01-21 | EUR | 1,100,000 | $1,080,503 | ||||||||||||||||||
| SSE PLC (5.625% to 10-1-17, then 5 Year Euro Swap Rate + 4.620%) (Q) | 5.625 | 10-01-17 | EUR | 760,000 | 858,395 | ||||||||||||||||||
| Tesco Corporate Treasury Services PLC | 1.375 | 07-01-19 | EUR | 350,000 | 367,933 | ||||||||||||||||||
| Tesco PLC | 3.375 | 11-02-18 | EUR | 1,000,000 | 1,120,444 | ||||||||||||||||||
| The Royal Bank of Scotland Group PLC | 1.625 | 06-25-19 | EUR | 1,600,000 | 1,762,662 | ||||||||||||||||||
| The Royal Bank of Scotland Group PLC | 5.375 | 09-30-19 | EUR | 164,000 | 209,057 | ||||||||||||||||||
| The Royal Bank of Scotland Group PLC | 6.934 | 04-09-18 | EUR | 642,000 | 768,258 | ||||||||||||||||||
| The Royal Bank of Scotland Group PLC (3.625% to 3-25-19, then 5 Year Euro Swap Rate + 2.650%) | 3.625 | 03-25-24 | EUR | 760,000 | 839,076 | ||||||||||||||||||
| The Royal Bank of Scotland Group PLC (4.625% to 9-22-16, then 3 month EURIBOR + 1.300%) | 4.625 | 09-22-21 | EUR | 1,374,000 | 1,492,303 | ||||||||||||||||||
| The Royal Bank of Scotland Group PLC (7.500% to 8-10-20, then 5 Year U.S. Swap Rate + 5.800%) (Q) | 7.500 | 08-10-20 | 896,000 | 909,440 | |||||||||||||||||||
| Thomas Cook Group PLC | 7.750 | 06-22-17 | GBP | 475,000 | 700,634 | ||||||||||||||||||
| Tullow Oil PLC (S) | 6.000 | 11-01-20 | 675,000 | 428,625 | |||||||||||||||||||
| Tullow Oil PLC | 6.250 | 04-15-22 | 200,000 | 123,980 | |||||||||||||||||||
| United Utilities Water, Ltd. | 4.250 | 01-24-20 | EUR | 1,500,000 | 1,857,814 | ||||||||||||||||||
| Urenco Finance NV | 2.375 | 12-02-24 | EUR | 1,100,000 | 1,158,157 | ||||||||||||||||||
| Virgin Media Finance PLC (S) | 6.000 | 10-15-24 | 900,000 | 906,750 | |||||||||||||||||||
| Virgin Media Secured Finance PLC | 6.000 | 04-15-21 | GBP | 585,000 | 864,120 | ||||||||||||||||||
| Vodafone Group PLC | 0.875 | 11-17-20 | EUR | 942,000 | 1,019,661 | ||||||||||||||||||
| WPP Finance 2010 | 5.625 | 11-15-43 | 2,000,000 | 2,003,046 | |||||||||||||||||||
| WPP Finance SA | 2.250 | 09-22-26 | EUR | 527,000 | 589,154 | ||||||||||||||||||
| Yorkshire Building Society | 2.125 | 03-18-19 | EUR | 2,350,000 | 2,647,032 | ||||||||||||||||||
| United States 6.1% | 550,405,949 | ||||||||||||||||||||||
| 21st Century Fox America, Inc. | 4.750 | 09-15-44 | 2,210,000 | 2,092,253 | |||||||||||||||||||
| A Schulman, Inc. (S) | 6.875 | 06-01-23 | 731,000 | 657,900 | |||||||||||||||||||
| ACE INA Holdings, Inc. | 4.350 | 11-03-45 | 965,000 | 1,013,111 | |||||||||||||||||||
| Affinia Group, Inc. | 7.750 | 05-01-21 | 1,010,000 | 1,035,250 | |||||||||||||||||||
| Ahern Rentals, Inc. (S) | 7.375 | 05-15-23 | 900,000 | 657,000 | |||||||||||||||||||
| AK Steel Corp. | 7.625 | 10-01-21 | 800,000 | 290,000 | |||||||||||||||||||
| Alcoa, Inc. | 5.125 | 10-01-24 | 94,000 | 76,963 | |||||||||||||||||||
| Alcoa, Inc. | 5.900 | 02-01-27 | 1,526,000 | 1,251,320 | |||||||||||||||||||
| Altria Group, Inc. | 5.375 | 01-31-44 | 4,513,000 | 4,912,473 | |||||||||||||||||||
| American Airlines 2013-1 Class B Pass Through Trust (S) | 5.625 | 01-15-21 | 727,672 | 733,130 | |||||||||||||||||||
| American Airlines 2015-2 Class AA Pass Through Trust | 3.600 | 03-22-29 | 947,000 | 951,735 | |||||||||||||||||||
| American International Group, Inc. | 4.500 | 07-16-44 | 3,540,000 | 3,087,595 | |||||||||||||||||||
| Rate (%) | Maturity date | Par value^ | Value | ||||||||||||||||||||
| United States (continued) | |||||||||||||||||||||||
| American International Group, Inc. (4.875% to 3-15-17, then 3 month EURIBOR + 1.730%) | 4.875 | 03-15-67 | EUR | 300,000 | $324,176 | ||||||||||||||||||
| Amgen, Inc. | 3.125 | 05-01-25 | 1,478,000 | 1,431,215 | |||||||||||||||||||
| Amgen, Inc. | 5.150 | 11-15-41 | 921,000 | 946,093 | |||||||||||||||||||
| Amsurg Corp. | 5.625 | 07-15-22 | 930,000 | 934,534 | |||||||||||||||||||
| Anadarko Petroleum Corp. | 6.450 | 09-15-36 | 2,950,000 | 2,361,859 | |||||||||||||||||||
| Anheuser-Busch InBev Finance, Inc. | 4.700 | 02-01-36 | 2,000,000 | 2,033,218 | |||||||||||||||||||
| Anheuser-Busch InBev Finance, Inc. | 4.900 | 02-01-46 | 1,630,000 | 1,688,532 | |||||||||||||||||||
| Anthem, Inc. | 3.500 | 08-15-24 | 3,290,000 | 3,259,791 | |||||||||||||||||||
| Approach Resources, Inc. | 7.000 | 06-15-21 | 370,000 | 74,000 | |||||||||||||||||||
| Aramark Services, Inc. (S) | 5.125 | 01-15-24 | 218,000 | 225,085 | |||||||||||||||||||
| Asbury Automotive Group, Inc. (S) | 6.000 | 12-15-24 | 210,000 | 205,275 | |||||||||||||||||||
| Asbury Automotive Group, Inc. | 6.000 | 12-15-24 | 660,000 | 645,150 | |||||||||||||||||||
| Ashland, Inc. | 4.750 | 08-15-22 | 890,000 | 846,613 | |||||||||||||||||||
| AT&T, Inc. | 1.450 | 06-01-22 | EUR | 3,500,000 | 3,818,648 | ||||||||||||||||||
| AT&T, Inc. | 2.400 | 03-15-24 | EUR | 289,000 | 327,355 | ||||||||||||||||||
| AT&T, Inc. | 2.650 | 12-17-21 | EUR | 800,000 | 939,322 | ||||||||||||||||||
| AT&T, Inc. | 3.400 | 05-15-25 | 6,065,000 | 5,807,195 | |||||||||||||||||||
| AT&T, Inc. | 3.550 | 12-17-32 | EUR | 380,000 | 447,657 | ||||||||||||||||||
| Avis Budget Car Rental LLC | 5.500 | 04-01-23 | 1,255,000 | 1,192,250 | |||||||||||||||||||
| Bank of America Corp. (P) | 0.709 | 03-28-18 | EUR | 850,000 | 912,704 | ||||||||||||||||||
| Bank of America Corp. | 1.375 | 09-10-21 | EUR | 1,900,000 | 2,072,618 | ||||||||||||||||||
| Bank of America Corp. | 1.625 | 09-14-22 | EUR | 1,800,000 | 1,972,233 | ||||||||||||||||||
| Bank of America Corp. | 2.500 | 07-27-20 | EUR | 1,040,000 | 1,206,429 | ||||||||||||||||||
| Bank of America Corp. | 4.750 | 04-03-17 | EUR | 1,400,000 | 1,597,510 | ||||||||||||||||||
| Bank of America Corp. | 5.875 | 02-07-42 | 4,676,000 | 5,405,250 | |||||||||||||||||||
| Bank of America Corp. | 7.750 | 05-14-38 | 4,111,000 | 5,546,047 | |||||||||||||||||||
| Baxalta, Inc. (S) | 5.250 | 06-23-45 | 4,210,000 | 4,176,451 | |||||||||||||||||||
| Berry Plastics Corp. (S) | 6.000 | 10-15-22 | 1,120,000 | 1,142,400 | |||||||||||||||||||
| Blue Coat Holdings, Inc. (S) | 8.375 | 06-01-23 | 1,219,000 | 1,231,190 | |||||||||||||||||||
| Boston Scientific Corp. | 3.850 | 05-15-25 | 3,318,000 | 3,298,381 | |||||||||||||||||||
| Brixmor Operating Partnership LP | 3.850 | 02-01-25 | 2,250,000 | 2,207,466 | |||||||||||||||||||
| Burlington Northern Santa Fe LLC | 4.150 | 04-01-45 | 5,315,000 | 4,927,733 | |||||||||||||||||||
| BWAY Holding Company (S) | 9.125 | 08-15-21 | 990,000 | 816,750 | |||||||||||||||||||
| Calpine Corp. (S) | 7.875 | 01-15-23 | 900,000 | 960,750 | |||||||||||||||||||
| Cardinal Health, Inc. | 4.900 | 09-15-45 | 1,141,000 | 1,169,741 | |||||||||||||||||||
| Casella Waste Systems, Inc. | 7.750 | 02-15-19 | 1,454,000 | 1,410,380 | |||||||||||||||||||
| CCM Merger, Inc. (S) | 9.125 | 05-01-19 | 1,186,000 | 1,221,580 | |||||||||||||||||||
| CCO Holdings LLC (S) | 5.125 | 05-01-23 | 744,000 | 742,047 | |||||||||||||||||||
| CCO Holdings LLC | 5.750 | 01-15-24 | 455,000 | 468,081 | |||||||||||||||||||
| CCO Safari II LLC (S) | 6.384 | 10-23-35 | 866,000 | 871,045 | |||||||||||||||||||
| CCOH Safari LLC (S) | 5.750 | 02-15-26 | 470,000 | 467,591 | |||||||||||||||||||
| Celgene Corp. | 5.000 | 08-15-45 | 2,150,000 | 2,147,512 | |||||||||||||||||||
| Cemex Finance LLC (S) | 9.375 | 10-12-22 | 1,320,000 | 1,332,804 | |||||||||||||||||||
| Rate (%) | Maturity date | Par value^ | Value | ||||||||||||||||||||
| United States (continued) | |||||||||||||||||||||||
| Centene Escrow Corp. (S) | 5.625 | 02-15-21 | 256,000 | $260,800 | |||||||||||||||||||
| Centene Escrow Corp. (S) | 6.125 | 02-15-24 | 340,000 | 347,225 | |||||||||||||||||||
| CenturyLink, Inc. | 5.625 | 04-01-20 | 1,096,000 | 1,068,463 | |||||||||||||||||||
| CenturyLink, Inc. | 7.600 | 09-15-39 | 850,000 | 637,500 | |||||||||||||||||||
| Cequel Communications Holdings I LLC (S) | 6.375 | 09-15-20 | 530,000 | 512,113 | |||||||||||||||||||
| Chaparral Energy, Inc. | 8.250 | 09-01-21 | 441,000 | 74,970 | |||||||||||||||||||
| Citigroup, Inc. (P) | 1.327 | 02-10-19 | EUR | 1,550,000 | 1,670,315 | ||||||||||||||||||
| Citigroup, Inc. | 1.375 | 10-27-21 | EUR | 600,000 | 657,604 | ||||||||||||||||||
| Citigroup, Inc. | 1.750 | 01-28-25 | EUR | 448,000 | 483,071 | ||||||||||||||||||
| Citigroup, Inc. | 5.000 | 08-02-19 | EUR | 620,000 | 774,141 | ||||||||||||||||||
| Citigroup, Inc. | 5.500 | 09-13-25 | 3,970,000 | 4,260,767 | |||||||||||||||||||
| Citigroup, Inc. | 7.375 | 09-04-19 | EUR | 2,000,000 | 2,685,329 | ||||||||||||||||||
| Citigroup, Inc. | 8.125 | 07-15-39 | 2,029,000 | 2,923,647 | |||||||||||||||||||
| Citigroup, Inc. (6.125% to 11-15-20, then 3 month EURIBOR + 4.478%) (Q) | 6.125 | 11-15-20 | 1,431,000 | 1,439,486 | |||||||||||||||||||
| Clear Channel Worldwide Holdings, Inc. | 7.625 | 03-15-20 | 770,000 | 634,288 | |||||||||||||||||||
| Cloud Peak Energy Resources LLC | 6.375 | 03-15-24 | 869,000 | 223,768 | |||||||||||||||||||
| Comcast Corp. | 3.375 | 08-15-25 | 1,300,000 | 1,323,491 | |||||||||||||||||||
| Comcast Corp. | 4.750 | 03-01-44 | 4,649,000 | 4,759,451 | |||||||||||||||||||
| Community Health Systems, Inc. | 5.125 | 08-01-21 | 885,000 | 878,363 | |||||||||||||||||||
| Crestwood Midstream Partners LP (S) | 6.250 | 04-01-23 | 1,175,000 | 713,813 | |||||||||||||||||||
| CRH America, Inc. (S) | 5.125 | 05-18-45 | 2,140,000 | 2,168,582 | |||||||||||||||||||
| CVS Health Corp. | 5.125 | 07-20-45 | 4,552,000 | 4,905,763 | |||||||||||||||||||
| Daimler Finance North America LLC | 8.500 | 01-18-31 | 3,338,000 | 4,922,061 | |||||||||||||||||||
| DIRECTV Holdings LLC | 2.750 | 05-19-23 | EUR | 1,030,000 | 1,203,924 | ||||||||||||||||||
| DIRECTV Holdings LLC | 5.150 | 03-15-42 | 3,910,000 | 3,548,868 | |||||||||||||||||||
| DISH DBS Corp. | 6.750 | 06-01-21 | 800,000 | 816,000 | |||||||||||||||||||
| DJO Finco, Inc. (S) | 8.125 | 06-15-21 | 869,000 | 729,960 | |||||||||||||||||||
| Dollar Tree, Inc. (S) | 5.250 | 03-01-20 | 794,000 | 833,700 | |||||||||||||||||||
| Dollar Tree, Inc. (S) | 5.750 | 03-01-23 | 605,000 | 637,519 | |||||||||||||||||||
| Dominion Resources, Inc. | 7.000 | 06-15-38 | 1,140,000 | 1,392,236 | |||||||||||||||||||
| DR Horton, Inc. | 4.000 | 02-15-20 | 427,000 | 432,338 | |||||||||||||||||||
| DR Horton, Inc. | 4.375 | 09-15-22 | 1,111,000 | 1,105,445 | |||||||||||||||||||
| Dr. Pepper Snapple Group, Inc. | 3.400 | 11-15-25 | 1,010,000 | 1,009,298 | |||||||||||||||||||
| Duke Energy Progress LLC | 3.250 | 08-15-25 | 1,084,000 | 1,108,313 | |||||||||||||||||||
| Duke Energy Progress LLC | 4.200 | 08-15-45 | 5,163,000 | 5,235,907 | |||||||||||||||||||
| Eastman Chemical Company | 4.650 | 10-15-44 | 2,260,000 | 1,870,482 | |||||||||||||||||||
| Eli Lilly & Company | 2.750 | 06-01-25 | 991,000 | 997,039 | |||||||||||||||||||
| EMD Finance LLC (S) | 3.250 | 03-19-25 | 4,357,000 | 4,214,770 | |||||||||||||||||||
| Endo Finance LLC (S) | 5.750 | 01-15-22 | 281,000 | 279,595 | |||||||||||||||||||
| Endo Finance LLC (S) | 6.000 | 07-15-23 | 245,000 | 246,225 | |||||||||||||||||||
| Energy Transfer Equity LP | 5.500 | 06-01-27 | 1,123,000 | 794,523 | |||||||||||||||||||
| Energy Transfer Partners LP | 6.125 | 12-15-45 | 2,300,000 | 1,815,185 | |||||||||||||||||||
| Ensemble S Merger Sub, Inc. (S) | 9.000 | 09-30-23 | 635,000 | 590,471 | |||||||||||||||||||
| Rate (%) | Maturity date | Par value^ | Value | ||||||||||||||||||||
| United States (continued) | |||||||||||||||||||||||
| Enterprise Products Operating LLC | 4.900 | 05-15-46 | 3,470,000 | $2,885,812 | |||||||||||||||||||
| EOG Resources, Inc. | 3.150 | 04-01-25 | 558,000 | 513,060 | |||||||||||||||||||
| EOG Resources, Inc. | 3.900 | 04-01-35 | 2,455,000 | 2,106,913 | |||||||||||||||||||
| EP Energy LLC | 7.750 | 09-01-22 | 672,000 | 235,200 | |||||||||||||||||||
| Equinix, Inc. | 5.875 | 01-15-26 | 871,000 | 901,485 | |||||||||||||||||||
| ERP Operating LP | 4.500 | 07-01-44 | 2,123,000 | 2,172,965 | |||||||||||||||||||
| Essex Portfolio LP | 3.875 | 05-01-24 | 1,053,000 | 1,076,988 | |||||||||||||||||||
| Exelon Corp. | 5.100 | 06-15-45 | 4,180,000 | 4,211,881 | |||||||||||||||||||
| Exxon Mobil Corp. | 3.567 | 03-06-45 | 3,430,000 | 3,105,584 | |||||||||||||||||||
| FedEx Corp. | 4.750 | 11-15-45 | 2,220,000 | 2,191,568 | |||||||||||||||||||
| First Data Corp. (S) | 5.000 | 01-15-24 | 188,000 | 188,940 | |||||||||||||||||||
| First Data Corp. (S) | 5.750 | 01-15-24 | 282,000 | 280,590 | |||||||||||||||||||
| First Data Corp. (S) | 7.000 | 12-01-23 | 741,000 | 748,410 | |||||||||||||||||||
| Florida Power & Light Company | 3.250 | 06-01-24 | 1,601,000 | 1,663,338 | |||||||||||||||||||
| Florida Power & Light Company | 5.690 | 03-01-40 | 3,956,000 | 4,930,300 | |||||||||||||||||||
| Ford Motor Company | 4.750 | 01-15-43 | 4,111,000 | 3,759,949 | |||||||||||||||||||
| Fresenius Medical Care US Finance II, Inc. (S) | 5.625 | 07-31-19 | 491,000 | 531,508 | |||||||||||||||||||
| Fresenius Medical Care US Finance II, Inc. (S) | 5.875 | 01-31-22 | 425,000 | 460,063 | |||||||||||||||||||
| Frontier Communications Corp. | 6.875 | 01-15-25 | 425,000 | 337,875 | |||||||||||||||||||
| Frontier Communications Corp. | 7.625 | 04-15-24 | 805,000 | 678,213 | |||||||||||||||||||
| Frontier Communications Corp. | 9.000 | 08-15-31 | 1,300,000 | 1,033,500 | |||||||||||||||||||
| Frontier Communications Corp. (S) | 10.500 | 09-15-22 | 105,000 | 102,638 | |||||||||||||||||||
| GCP Applied Technologies, Inc. (S) | 9.500 | 02-01-23 | 532,000 | 562,590 | |||||||||||||||||||
| General Electric Company | 1.250 | 05-26-23 | EUR | 1,900,000 | 2,103,356 | ||||||||||||||||||
| GenOn Energy, Inc. | 9.500 | 10-15-18 | 1,920,000 | 1,344,000 | |||||||||||||||||||
| Georgia-Pacific LLC (S) | 3.600 | 03-01-25 | 1,415,000 | 1,404,969 | |||||||||||||||||||
| Georgia-Pacific LLC | 7.750 | 11-15-29 | 2,600,000 | 3,393,502 | |||||||||||||||||||
| Gilead Sciences, Inc. | 3.500 | 02-01-25 | 4,844,000 | 4,977,486 | |||||||||||||||||||
| GlaxoSmithKline Capital, Inc. | 6.375 | 05-15-38 | 1,670,000 | 2,124,288 | |||||||||||||||||||
| Golden Nugget Escrow, Inc. (S) | 8.500 | 12-01-21 | 796,000 | 772,120 | |||||||||||||||||||
| Graphic Packaging International, Inc. | 4.875 | 11-15-22 | 1,108,000 | 1,108,000 | |||||||||||||||||||
| Greektown Holdings LLC (S) | 8.875 | 03-15-19 | 1,042,000 | 1,026,370 | |||||||||||||||||||
| Halcon Resources Corp. (S) | 12.000 | 02-15-22 | 681,000 | 401,790 | |||||||||||||||||||
| Halliburton Company | 5.000 | 11-15-45 | 1,918,000 | 1,711,541 | |||||||||||||||||||
| Harland Clarke Holdings Corp. (S) | 6.875 | 03-01-20 | 1,000,000 | 832,500 | |||||||||||||||||||
| Harland Clarke Holdings Corp. (S) | 9.250 | 03-01-21 | 253,000 | 174,886 | |||||||||||||||||||
| HCA, Inc. | 5.250 | 04-15-25 | 900,000 | 922,500 | |||||||||||||||||||
| HCA, Inc. | 7.500 | 11-15-95 | 1,685,000 | 1,609,175 | |||||||||||||||||||
| HealthSouth Corp. (S) | 5.750 | 11-01-24 | 875,000 | 863,704 | |||||||||||||||||||
| Hess Corp. | 5.600 | 02-15-41 | 2,109,000 | 1,503,373 | |||||||||||||||||||
| Hiland Partners LP (S) | 7.250 | 10-01-20 | 2,010,000 | 1,989,900 | |||||||||||||||||||
| Host Hotels & Resorts LP | 4.000 | 06-15-25 | 2,190,000 | 2,127,585 | |||||||||||||||||||
| HP Enterprise Company (S) | 4.900 | 10-15-25 | 3,670,000 | 3,481,032 | |||||||||||||||||||
| Innovation Ventures LLC (S) | 9.500 | 08-15-19 | 735,000 | 752,916 | |||||||||||||||||||
| Rate (%) | Maturity date | Par value^ | Value | ||||||||||||||||||||
| United States (continued) | |||||||||||||||||||||||
| Intel Corp. | 3.700 | 07-29-25 | 4,923,000 | $5,191,377 | |||||||||||||||||||
| International Paper Company | 5.150 | 05-15-46 | 3,290,000 | 3,005,277 | |||||||||||||||||||
| Interval Acquisition Corp. (S) | 5.625 | 04-15-23 | 955,000 | 950,225 | |||||||||||||||||||
| JBS USA LLC (S) | 5.750 | 06-15-25 | 70,000 | 53,550 | |||||||||||||||||||
| JBS USA LLC (S) | 7.250 | 06-01-21 | 224,000 | 203,000 | |||||||||||||||||||
| Johnson & Johnson | 4.500 | 12-05-43 | 4,610,000 | 5,185,365 | |||||||||||||||||||
| JPMorgan Chase & Co. | 1.375 | 09-16-21 | EUR | 1,950,000 | 2,154,616 | ||||||||||||||||||
| JPMorgan Chase & Co. | 1.500 | 10-26-22 | EUR | 1,400,000 | 1,548,675 | ||||||||||||||||||
| JPMorgan Chase & Co. | 1.500 | 01-27-25 | EUR | 1,700,000 | 1,843,757 | ||||||||||||||||||
| JPMorgan Chase & Co. | 2.625 | 04-23-21 | EUR | 4,350,000 | 5,118,148 | ||||||||||||||||||
| JPMorgan Chase & Co. | 5.625 | 08-16-43 | 3,375,000 | 3,689,567 | |||||||||||||||||||
| JPMorgan Chase & Co. | 6.400 | 05-15-38 | 3,390,000 | 4,143,190 | |||||||||||||||||||
| Kansas City Southern (S) | 4.950 | 08-15-45 | 2,210,000 | 2,174,684 | |||||||||||||||||||
| Kilroy Realty LP | 4.250 | 08-15-29 | 2,250,000 | 2,257,652 | |||||||||||||||||||
| Kinder Morgan, Inc. | 1.500 | 03-16-22 | EUR | 1,000,000 | 924,354 | ||||||||||||||||||
| Kinder Morgan, Inc. | 3.050 | 12-01-19 | 1,600,000 | 1,481,112 | |||||||||||||||||||
| Kinder Morgan, Inc. | 4.300 | 06-01-25 | 2,350,000 | 2,035,737 | |||||||||||||||||||
| Kinder Morgan, Inc. | 5.550 | 06-01-45 | 925,000 | 724,871 | |||||||||||||||||||
| Kindred Healthcare, Inc. | 8.000 | 01-15-20 | 460,000 | 419,750 | |||||||||||||||||||
| Kindred Healthcare, Inc. | 8.750 | 01-15-23 | 600,000 | 537,000 | |||||||||||||||||||
| Kinetic Concepts, Inc. | 10.500 | 11-01-18 | 1,336,000 | 1,295,920 | |||||||||||||||||||
| Kraft Heinz Foods Company (S) | 3.950 | 07-15-25 | 2,100,000 | 2,153,103 | |||||||||||||||||||
| L Brands, Inc. (S) | 6.875 | 11-01-35 | 540,000 | 558,225 | |||||||||||||||||||
| Level 3 Financing, Inc. (S) | 5.375 | 01-15-24 | 222,000 | 224,220 | |||||||||||||||||||
| Light Tower Rentals, Inc. (S) | 8.125 | 08-01-19 | 500,000 | 221,250 | |||||||||||||||||||
| Lockheed Martin Corp. | 4.700 | 05-15-46 | 1,940,000 | 2,053,506 | |||||||||||||||||||
| M/I Homes, Inc. (S) | 6.750 | 01-15-21 | 872,000 | 845,840 | |||||||||||||||||||
| Marriott International, Inc. | 3.750 | 10-01-25 | 1,419,000 | 1,430,424 | |||||||||||||||||||
| McDonald's Corp. | 3.375 | 05-26-25 | 1,241,000 | 1,235,231 | |||||||||||||||||||
| McDonald's Corp. | 4.875 | 12-09-45 | 1,520,000 | 1,537,893 | |||||||||||||||||||
| McGraw Hill Financial, Inc. | 4.400 | 02-15-26 | 4,240,000 | 4,391,101 | |||||||||||||||||||
| McGraw-Hill Global Education Holdings LLC | 9.750 | 04-01-21 | 415,000 | 440,938 | |||||||||||||||||||
| McKesson Corp. | 4.883 | 03-15-44 | 2,476,000 | 2,491,636 | |||||||||||||||||||
| MeadWestvaco Corp. | 8.200 | 01-15-30 | 2,420,000 | 3,068,032 | |||||||||||||||||||
| Medtronic, Inc. | 3.500 | 03-15-25 | 1,487,000 | 1,527,256 | |||||||||||||||||||
| Medtronic, Inc. | 4.375 | 03-15-35 | 3,432,000 | 3,506,347 | |||||||||||||||||||
| Merck & Company, Inc. | 1.875 | 10-15-26 | EUR | 1,500,000 | 1,712,474 | ||||||||||||||||||
| Merck & Company, Inc. | 4.150 | 05-18-43 | 4,742,000 | 4,793,873 | |||||||||||||||||||
| MetLife, Inc. | 4.600 | 05-13-46 | 1,580,000 | 1,547,267 | |||||||||||||||||||
| MetLife, Inc. | 5.875 | 02-06-41 | 2,720,000 | 3,209,916 | |||||||||||||||||||
| Metropolitan Life Global Funding I | 0.875 | 01-20-22 | EUR | 2,400,000 | 2,575,091 | ||||||||||||||||||
| Metropolitan Life Global Funding I | 1.250 | 09-17-21 | EUR | 1,400,000 | 1,543,468 | ||||||||||||||||||
| Metropolitan Life Global Funding I | 2.375 | 09-30-19 | EUR | 1,900,000 | 2,200,008 | ||||||||||||||||||
| MGM Resorts International | 6.000 | 03-15-23 | 904,000 | 901,175 | |||||||||||||||||||
| Rate (%) | Maturity date | Par value^ | Value | ||||||||||||||||||||
| United States (continued) | |||||||||||||||||||||||
| MHGE Parent LLC (S) | 8.500 | 08-01-19 | 1,170,000 | $1,150,988 | |||||||||||||||||||
| Microsoft Corp. | 3.750 | 02-12-45 | 5,331,000 | 4,907,671 | |||||||||||||||||||
| Microsoft Corp. | 4.450 | 11-03-45 | 681,000 | 698,876 | |||||||||||||||||||
| Milacron LLC (S) | 7.750 | 02-15-21 | 858,000 | 759,330 | |||||||||||||||||||
| Molex Electronic Technologies LLC (S) | 3.900 | 04-15-25 | 2,811,000 | 2,661,986 | |||||||||||||||||||
| Moody's Corp. | 1.750 | 03-09-27 | EUR | 580,000 | 616,357 | ||||||||||||||||||
| Morgan Stanley | 1.875 | 03-30-23 | EUR | 500,000 | 556,556 | ||||||||||||||||||
| Morgan Stanley | 2.375 | 03-31-21 | EUR | 1,600,000 | 1,848,501 | ||||||||||||||||||
| Morgan Stanley | 4.000 | 07-23-25 | 4,230,000 | 4,308,851 | |||||||||||||||||||
| Morgan Stanley | 4.350 | 09-08-26 | 5,734,000 | 5,751,844 | |||||||||||||||||||
| Morgan Stanley | 4.500 | 02-23-16 | EUR | 1,450,000 | 1,574,830 | ||||||||||||||||||
| Morgan Stanley | 5.375 | 08-10-20 | EUR | 500,000 | 649,271 | ||||||||||||||||||
| Morgan Stanley | 5.500 | 10-02-17 | EUR | 1,240,000 | 1,461,676 | ||||||||||||||||||
| Morgan Stanley (5.550% to 7-15-20, then 3 month LIBOR + 3.810%) (Q) | 5.550 | 07-15-20 | 1,942,000 | 1,921,366 | |||||||||||||||||||
| MPG Holdco I, Inc. | 7.375 | 10-15-22 | 590,000 | 569,350 | |||||||||||||||||||
| National Grid North America, Inc. | 0.750 | 02-11-22 | EUR | 1,700,000 | 1,815,754 | ||||||||||||||||||
| NCI Building Systems, Inc. (S) | 8.250 | 01-15-23 | 1,178,000 | 1,225,120 | |||||||||||||||||||
| Neptune Finco Corp. (S) | 6.625 | 10-15-25 | 617,000 | 640,060 | |||||||||||||||||||
| Neptune Finco Corp. (S) | 10.125 | 01-15-23 | 200,000 | 211,500 | |||||||||||||||||||
| Neptune Finco Corp. (S) | 10.875 | 10-15-25 | 448,000 | 474,824 | |||||||||||||||||||
| Netflix, Inc. (S) | 5.500 | 02-15-22 | 1,190,000 | 1,225,700 | |||||||||||||||||||
| Nordstrom, Inc. | 5.000 | 01-15-44 | 2,020,000 | 1,995,172 | |||||||||||||||||||
| NPC International, Inc. | 10.500 | 01-15-20 | 880,000 | 903,100 | |||||||||||||||||||
| NRG Energy, Inc. | 7.875 | 05-15-21 | 1,050,000 | 913,500 | |||||||||||||||||||
| NRG Energy, Inc. | 8.250 | 09-01-20 | 350,000 | 317,625 | |||||||||||||||||||
| Oasis Petroleum, Inc. | 6.875 | 03-15-22 | 700,000 | 406,000 | |||||||||||||||||||
| Occidental Petroleum Corp. | 3.500 | 06-15-25 | 4,330,000 | 4,127,958 | |||||||||||||||||||
| Oncor Electric Delivery Company LLC | 3.750 | 04-01-45 | 2,480,000 | 2,167,012 | |||||||||||||||||||
| Oncor Electric Delivery Company LLC | 5.250 | 09-30-40 | 993,000 | 1,064,018 | |||||||||||||||||||
| Oracle Corp. | 4.300 | 07-08-34 | 4,310,000 | 4,228,912 | |||||||||||||||||||
| Owens-Brockway Glass Container, Inc. (S) | 5.875 | 08-15-23 | 497,000 | 487,681 | |||||||||||||||||||
| Pacific Gas & Electric Company | 4.300 | 03-15-45 | 4,986,000 | 4,995,623 | |||||||||||||||||||
| Pacific LifeCorp (S) | 5.125 | 01-30-43 | 2,090,000 | 2,135,593 | |||||||||||||||||||
| PaperWorks Industries, Inc. (S) | 9.500 | 08-15-19 | 950,000 | 874,000 | |||||||||||||||||||
| PepsiCo, Inc. | 4.600 | 07-17-45 | 3,257,000 | 3,482,179 | |||||||||||||||||||
| Philip Morris International, Inc. | 1.875 | 03-03-21 | EUR | 1,800,000 | 2,060,680 | ||||||||||||||||||
| Philip Morris International, Inc. | 2.750 | 03-19-25 | EUR | 450,000 | 542,763 | ||||||||||||||||||
| Philip Morris International, Inc. | 2.875 | 03-03-26 | EUR | 600,000 | 730,821 | ||||||||||||||||||
| Philip Morris International, Inc. | 3.125 | 06-03-33 | EUR | 480,000 | 589,232 | ||||||||||||||||||
| Philip Morris International, Inc. | 3.375 | 08-11-25 | 1,374,000 | 1,427,188 | |||||||||||||||||||
| Philip Morris International, Inc. | 6.375 | 05-16-38 | 1,786,000 | 2,241,775 | |||||||||||||||||||
| Praxair, Inc. | 1.625 | 12-01-25 | EUR | 1,700,000 | 1,892,293 | ||||||||||||||||||
| Praxair, Inc. | 3.200 | 01-30-26 | 623,000 | 639,939 | |||||||||||||||||||
| Rate (%) | Maturity date | Par value^ | Value | ||||||||||||||||||||
| United States (continued) | |||||||||||||||||||||||
| Prologis LP | 3.000 | 01-18-22 | EUR | 1,300,000 | $1,497,631 | ||||||||||||||||||
| Prologis LP | 3.375 | 02-20-24 | EUR | 800,000 | 932,085 | ||||||||||||||||||
| Prospect Medical Holdings, Inc. (S) | 8.375 | 05-01-19 | 1,725,000 | 1,774,335 | |||||||||||||||||||
| Prudential Financial, Inc. | 4.600 | 05-15-44 | 2,100,000 | 2,017,428 | |||||||||||||||||||
| Prudential Financial, Inc. | 6.200 | 11-15-40 | 1,680,000 | 1,968,570 | |||||||||||||||||||
| PulteGroup, Inc. | 6.000 | 02-15-35 | 409,000 | 397,753 | |||||||||||||||||||
| PulteGroup, Inc. | 7.875 | 06-15-32 | 615,000 | 691,875 | |||||||||||||||||||
| Quad/Graphics, Inc. | 7.000 | 05-01-22 | 1,159,000 | 759,145 | |||||||||||||||||||
| Rain CII Carbon LLC | 8.500 | 01-15-21 | EUR | 675,000 | 521,107 | ||||||||||||||||||
| RELX Capital, Inc. | 1.300 | 05-12-25 | EUR | 1,500,000 | 1,595,693 | ||||||||||||||||||
| Republic Services, Inc. | 5.700 | 05-15-41 | 2,308,000 | 2,652,301 | |||||||||||||||||||
| Reynolds American, Inc. | 5.850 | 08-15-45 | 3,108,000 | 3,471,170 | |||||||||||||||||||
| Riverbed Technology, Inc. (S) | 8.875 | 03-01-23 | 1,075,000 | 982,281 | |||||||||||||||||||
| Roche Holdings, Inc. (S) | 3.000 | 11-10-25 | 924,000 | 932,839 | |||||||||||||||||||
| Roche Holdings, Inc. (S) | 4.000 | 11-28-44 | 3,729,000 | 3,858,001 | |||||||||||||||||||
| Sabine Pass Liquefaction LLC | 5.625 | 02-01-21 | 1,288,000 | 1,178,520 | |||||||||||||||||||
| SABMiller Holdings, Inc. (S) | 4.950 | 01-15-42 | 4,528,000 | 4,585,574 | |||||||||||||||||||
| Schlumberger BV (S) | 4.000 | 12-21-25 | 2,995,000 | 2,917,424 | |||||||||||||||||||
| Service Corp. International | 5.375 | 05-15-24 | 1,249,000 | 1,317,695 | |||||||||||||||||||
| Shea Homes LP (S) | 5.875 | 04-01-23 | 274,000 | 274,343 | |||||||||||||||||||
| Simmons Foods, Inc. (S) | 7.875 | 10-01-21 | 915,000 | 809,775 | |||||||||||||||||||
| Simon Property Group LP | 4.250 | 10-01-44 | 2,802,000 | 2,823,592 | |||||||||||||||||||
| Sinclair Television Group, Inc. | 6.125 | 10-01-22 | 860,000 | 887,950 | |||||||||||||||||||
| Sirius XM Radio, Inc. (S) | 5.375 | 04-15-25 | 1,340,000 | 1,346,700 | |||||||||||||||||||
| Six Flags Entertainment Corp. (S) | 5.250 | 01-15-21 | 980,000 | 1,002,050 | |||||||||||||||||||
| Spectrum Brands, Inc. (S) | 5.750 | 07-15-25 | 910,000 | 932,750 | |||||||||||||||||||
| Sprint Capital Corp. | 6.875 | 11-15-28 | 1,847,000 | 1,219,020 | |||||||||||||||||||
| Sprint Communications, Inc. | 6.000 | 11-15-22 | 1,861,000 | 1,251,523 | |||||||||||||||||||
| Sprint Corp. | 7.250 | 09-15-21 | 675,000 | 486,000 | |||||||||||||||||||
| Sprint Corp. | 7.625 | 02-15-25 | 830,000 | 566,994 | |||||||||||||||||||
| Summit Materials LLC | 6.125 | 07-15-23 | 600,000 | 579,000 | |||||||||||||||||||
| Swiss Re Treasury US Corp. (S) | 4.250 | 12-06-42 | 2,230,000 | 2,193,856 | |||||||||||||||||||
| T-Mobile USA, Inc. | 6.125 | 01-15-22 | 1,525,000 | 1,551,688 | |||||||||||||||||||
| T-Mobile USA, Inc. | 6.500 | 01-15-26 | 150,000 | 149,250 | |||||||||||||||||||
| T-Mobile USA, Inc. | 6.836 | 04-28-23 | 415,000 | 428,488 | |||||||||||||||||||
| Target Corp. | 4.000 | 07-01-42 | 3,829,000 | 3,796,224 | |||||||||||||||||||
| Tenet Healthcare Corp. | 4.500 | 04-01-21 | 913,000 | 894,740 | |||||||||||||||||||
| Tenet Healthcare Corp. | 6.250 | 11-01-18 | 520,000 | 549,900 | |||||||||||||||||||
| Tenet Healthcare Corp. | 6.750 | 06-15-23 | 480,000 | 441,000 | |||||||||||||||||||
| The ADT Corp. | 6.250 | 10-15-21 | 1,028,000 | 1,066,550 | |||||||||||||||||||
| The Boeing Company | 5.875 | 02-15-40 | 621,000 | 799,033 | |||||||||||||||||||
| The Dow Chemical Company | 3.500 | 10-01-24 | 3,395,000 | 3,297,088 | |||||||||||||||||||
| The Dow Chemical Company | 4.625 | 10-01-44 | 1,012,000 | 898,969 | |||||||||||||||||||
| The Goodyear Tire & Rubber Company | 5.125 | 11-15-23 | 480,000 | 490,800 | |||||||||||||||||||
| Rate (%) | Maturity date | Par value^ | Value | ||||||||||||||||||||
| United States (continued) | |||||||||||||||||||||||
| The Home Depot, Inc. | 4.400 | 03-15-45 | 4,968,000 | $5,123,628 | |||||||||||||||||||
| The JM Smucker Company | 4.375 | 03-15-45 | 4,769,000 | 4,648,297 | |||||||||||||||||||
| The Men's Wearhouse, Inc. (S) | 7.000 | 07-01-22 | 879,000 | 628,485 | |||||||||||||||||||
| The Procter & Gamble Company | 4.875 | 05-11-27 | EUR | 100,000 | 147,995 | ||||||||||||||||||
| The Scotts Miracle-Gro Company (S) | 6.000 | 10-15-23 | 310,000 | 323,950 | |||||||||||||||||||
| The Travelers Companies, Inc. | 4.600 | 08-01-43 | 480,000 | 522,380 | |||||||||||||||||||
| The Walt Disney Company | 3.150 | 09-17-25 | 2,026,000 | 2,087,222 | |||||||||||||||||||
| The Williams Companies, Inc. | 4.550 | 06-24-24 | 1,234,000 | 805,295 | |||||||||||||||||||
| Time Warner, Inc. | 3.600 | 07-15-25 | 1,083,000 | 1,051,819 | |||||||||||||||||||
| Time Warner, Inc. | 4.850 | 07-15-45 | 2,190,000 | 1,976,878 | |||||||||||||||||||
| Toyota Motor Credit Corp. | 1.000 | 03-09-21 | EUR | 1,150,000 | 1,270,378 | ||||||||||||||||||
| UAL 2007-1 Pass Through Trust | 6.636 | 07-02-22 | 1,060,411 | 1,121,384 | |||||||||||||||||||
| Union Pacific Corp. | 4.821 | 02-01-44 | 3,190,000 | 3,427,349 | |||||||||||||||||||
| United Airlines 2015-1 Class AA Pass Through Trust | 3.450 | 06-01-29 | 1,231,000 | 1,241,771 | |||||||||||||||||||
| United Parcel Service, Inc. | 6.200 | 01-15-38 | 1,696,000 | 2,213,226 | |||||||||||||||||||
| United Rentals North America, Inc. | 7.625 | 04-15-22 | 1,466,000 | 1,506,315 | |||||||||||||||||||
| United Technologies Corp. | 4.500 | 06-01-42 | 4,926,000 | 5,036,175 | |||||||||||||||||||
| UnitedHealth Group, Inc. | 3.750 | 07-15-25 | 866,000 | 901,464 | |||||||||||||||||||
| UnitedHealth Group, Inc. | 4.750 | 07-15-45 | 4,860,000 | 5,212,141 | |||||||||||||||||||
| US Airways 2011-1 Class A Pass Through Trust | 7.125 | 10-22-23 | 1,297,565 | 1,490,578 | |||||||||||||||||||
| Valeant Pharmaceuticals International, Inc. | 4.500 | 05-15-23 | EUR | 800,000 | 743,504 | ||||||||||||||||||
| Valeant Pharmaceuticals International, Inc. (S) | 6.125 | 04-15-25 | 400,000 | 359,500 | |||||||||||||||||||
| Valeant Pharmaceuticals International, Inc. (S) | 6.750 | 08-15-21 | 1,420,000 | 1,377,400 | |||||||||||||||||||
| Valeant Pharmaceuticals International, Inc. (S) | 7.000 | 10-01-20 | 610,000 | 600,850 | |||||||||||||||||||
| Vander Intermediate Holding II Corp., PIK (S) | 9.750 | 02-01-19 | 1,419,000 | 684,668 | |||||||||||||||||||
| Vector Group, Ltd. | 7.750 | 02-15-21 | 1,076,000 | 1,124,420 | |||||||||||||||||||
| Verizon Communications, Inc. | 2.375 | 02-17-22 | EUR | 776,000 | 903,869 | ||||||||||||||||||
| Verizon Communications, Inc. | 3.250 | 02-17-26 | EUR | 1,180,000 | 1,446,639 | ||||||||||||||||||
| Verizon Communications, Inc. | 3.500 | 11-01-24 | 2,140,000 | 2,127,205 | |||||||||||||||||||
| Verizon Communications, Inc. | 4.672 | 03-15-55 | 2,520,000 | 2,122,195 | |||||||||||||||||||
| Verizon Communications, Inc. | 6.550 | 09-15-43 | 3,103,000 | 3,595,846 | |||||||||||||||||||
| Viking Cruises, Ltd. (S) | 6.250 | 05-15-25 | 800,000 | 668,000 | |||||||||||||||||||
| Virginia Electric & Power Company | 4.650 | 08-15-43 | 2,771,000 | 2,993,342 | |||||||||||||||||||
| Voya Financial, Inc. | 5.700 | 07-15-43 | 1,890,000 | 2,220,247 | |||||||||||||||||||
| Wachovia Corp. | 4.375 | 11-27-18 | EUR | 1,100,000 | 1,316,659 | ||||||||||||||||||
| Wal-Mart Stores, Inc. | 3.300 | 04-22-24 | 1,590,000 | 1,666,840 | |||||||||||||||||||
| Wal-Mart Stores, Inc. | 4.875 | 09-21-29 | EUR | 200,000 | 299,827 | ||||||||||||||||||
| Wal-Mart Stores, Inc. | 5.250 | 09-01-35 | 1,890,000 | 2,204,732 | |||||||||||||||||||
| Wal-Mart Stores, Inc. | 6.500 | 08-15-37 | 4,920,000 | 6,435,326 | |||||||||||||||||||
| Waste Management, Inc. | 4.100 | 03-01-45 | 4,023,000 | 3,869,977 | |||||||||||||||||||
| Waterjet Holdings, Inc. (S) | 7.625 | 02-01-20 | 519,000 | 513,810 | |||||||||||||||||||
| Wells Fargo & Company | 1.500 | 09-12-22 | EUR | 1,200,000 | 1,331,853 | ||||||||||||||||||
| Wells Fargo & Company | 2.000 | 04-27-26 | EUR | 2,100,000 | 2,367,123 | ||||||||||||||||||
| Rate (%) | Maturity date | Par value^ | Value | ||||||||||||||||||||
| United States (continued) | |||||||||||||||||||||||
| Wells Fargo & Company | 2.125 | 06-04-24 | EUR | 327,000 | $375,548 | ||||||||||||||||||
| Wells Fargo & Company | 2.250 | 09-03-20 | EUR | 430,000 | 499,877 | ||||||||||||||||||
| Wells Fargo & Company | 2.625 | 08-16-22 | EUR | 1,600,000 | 1,900,561 | ||||||||||||||||||
| Wells Fargo & Company | 4.100 | 06-03-26 | 5,572,000 | 5,655,307 | |||||||||||||||||||
| Wells Fargo & Company | 5.375 | 02-07-35 | 1,333,000 | 1,520,318 | |||||||||||||||||||
| Windstream Services LLC | 6.375 | 08-01-23 | 1,620,000 | 1,170,450 | |||||||||||||||||||
| XPO Logistics, Inc. | 5.750 | 06-15-21 | EUR | 275,000 | 265,157 | ||||||||||||||||||
| XPO Logistics, Inc. (S) | 6.500 | 06-15-22 | 1,488,000 | 1,331,760 | |||||||||||||||||||
| ZF North America Capital, Inc. | 2.250 | 04-26-19 | EUR | 1,400,000 | 1,494,840 | ||||||||||||||||||
| ZF North America Capital, Inc. | 2.750 | 04-27-23 | EUR | 700,000 | 698,845 | ||||||||||||||||||
| ZF North America Capital, Inc. (S) | 4.750 | 04-29-25 | 610,000 | 571,875 | |||||||||||||||||||
| Capital preferred securities 0.0% | $1,557,134 | ||||||||||||||||||||||
| (Cost $1,656,460) | |||||||||||||||||||||||
| United States 0.0% | 1,557,134 | ||||||||||||||||||||||
| GE Capital Trust II (5.500% to 9-15-17, then 3 month EURIBOR + 2.000%) | 5.500 | 09-15-67 | EUR | 500,000 | 577,321 | ||||||||||||||||||
| GE Capital Trust IV (4.625% to 9-15-16, then 3 month EURIBOR + 1.600%) | 4.625 | 09-15-66 | EUR | 895,000 | 979,813 | ||||||||||||||||||
| Foreign government obligations 5.3% | $482,675,049 | ||||||||||||||||||||||
| (Cost $599,100,985) | |||||||||||||||||||||||
| Germany 0.3% | 24,053,978 | ||||||||||||||||||||||
| Federal Republic of Germany | 0.500 | 02-15-25 | EUR | 19,598,000 | 21,773,841 | ||||||||||||||||||
| Federal Republic of Germany | 1.000 | 08-15-24 | EUR | 1,450,000 | 1,687,084 | ||||||||||||||||||
| Federal Republic of Germany | 1.500 | 05-15-24 | EUR | 490,000 | 593,053 | ||||||||||||||||||
| Mexico 5.0% | 458,621,071 | ||||||||||||||||||||||
| Government of Mexico | 6.500 | 06-10-21 | MXN | 1,976,974,800 | 114,338,036 | ||||||||||||||||||
| Government of Mexico | 7.500 | 06-03-27 | MXN | 1,892,930,200 | 114,561,427 | ||||||||||||||||||
| Government of Mexico | 8.500 | 05-31-29 | MXN | 1,766,707,700 | 114,960,508 | ||||||||||||||||||
| Government of Mexico | 10.000 | 12-05-24 | MXN | 1,628,501,400 | 114,761,100 | ||||||||||||||||||
| Shares | Value | ||||||||||||||||||||||
| Common stocks 24.4% | $2,218,837,444 | ||||||||||||||||||||||
| (Cost $2,314,120,088) | |||||||||||||||||||||||
| Australia 0.1% | 5,158,176 | ||||||||||||||||||||||
| BHP Billiton PLC | 254,227 | 2,468,592 | |||||||||||||||||||||
| Oil Search, Ltd. | 572,339 | 2,689,584 | |||||||||||||||||||||
| Austria 0.0% | 4,463,328 | ||||||||||||||||||||||
| Oesterreichische Post AG | 125,761 | 4,463,328 | |||||||||||||||||||||
| Belgium 0.3% | 27,773,903 | ||||||||||||||||||||||
| Anheuser-Busch InBev NV | 142,564 | 17,929,685 | |||||||||||||||||||||
| Umicore SA | 267,759 | 9,844,218 | |||||||||||||||||||||
| Shares | Value | ||||||||||||||||||||||
| Bermuda 0.1% | $9,647,094 | ||||||||||||||||||||||
| Lazard, Ltd., Class A | 209,415 | 7,536,846 | |||||||||||||||||||||
| Validus Holdings, Ltd. | 47,700 | 2,110,248 | |||||||||||||||||||||
| Canada 0.1% | 11,862,423 | ||||||||||||||||||||||
| Africa Oil Corp. (I) | 310,616 | 434,823 | |||||||||||||||||||||
| Alimentation Couche-Tard, Inc., Class B | 184,448 | 8,028,866 | |||||||||||||||||||||
| Element Financial Corp. | 322,362 | 3,398,734 | |||||||||||||||||||||
| China 0.1% | 9,086,306 | ||||||||||||||||||||||
| Baidu, Inc., ADR (I) | 26,942 | 4,398,820 | |||||||||||||||||||||
| China Mengniu Dairy Company, Ltd. | 282,000 | 393,418 | |||||||||||||||||||||
| JD.com, Inc., ADR (I) | 136,958 | 3,565,017 | |||||||||||||||||||||
| Tianhe Chemicals Group, Ltd. (I) (S) | 4,848,409 | 729,051 | |||||||||||||||||||||
| Denmark 0.8% | 69,707,568 | ||||||||||||||||||||||
| Coloplast A/S, B Shares | 113,818 | 9,344,268 | |||||||||||||||||||||
| Danske Bank A/S | 1,045,768 | 28,143,136 | |||||||||||||||||||||
| ISS A/S | 190,416 | 6,731,824 | |||||||||||||||||||||
| Novo Nordisk A/S, B Shares | 456,221 | 25,488,340 | |||||||||||||||||||||
| Finland 1.0% | 87,897,584 | ||||||||||||||||||||||
| Kesko OYJ, B Shares | 188,000 | 7,542,579 | |||||||||||||||||||||
| Kone OYJ, B Shares | 261,761 | 11,505,420 | |||||||||||||||||||||
| Nokia OYJ | 4,297,195 | 30,954,524 | |||||||||||||||||||||
| Sampo OYJ, A Shares | 375,869 | 18,201,091 | |||||||||||||||||||||
| Stora Enso OYJ, R Shares | 593,600 | 4,837,664 | |||||||||||||||||||||
| Wartsila OYJ ABP | 330,749 | 14,856,306 | |||||||||||||||||||||
| France 1.8% | 165,726,648 | ||||||||||||||||||||||
| AXA SA | 2,793,558 | 69,036,108 | |||||||||||||||||||||
| Klepierre | 161,981 | 7,020,547 | |||||||||||||||||||||
| Orange SA | 1,012,395 | 17,975,641 | |||||||||||||||||||||
| Orpea | 83,306 | 6,594,401 | |||||||||||||||||||||
| Societe BIC SA | 102,797 | 16,742,092 | |||||||||||||||||||||
| Total SA | 342,667 | 15,221,508 | |||||||||||||||||||||
| Veolia Environnement SA | 821,832 | 19,813,528 | |||||||||||||||||||||
| Vivendi SA | 612,826 | 13,322,823 | |||||||||||||||||||||
| Germany 2.0% | 183,261,860 | ||||||||||||||||||||||
| Allianz SE | 382,436 | 61,891,753 | |||||||||||||||||||||
| Bayer AG | 146,737 | 16,514,620 | |||||||||||||||||||||
| Covestro AG (I) (S) | 166,976 | 5,561,835 | |||||||||||||||||||||
| Deutsche Post AG | 467,470 | 11,329,920 | |||||||||||||||||||||
| Deutsche Telekom AG | 1,337,635 | 23,291,951 | |||||||||||||||||||||
| GEA Group AG | 157,853 | 6,622,392 | |||||||||||||||||||||
| Muenchener Rueckversicherungs-Gesellschaft AG | 275,900 | 53,157,775 | |||||||||||||||||||||
| TUI AG | 288,032 | 4,891,614 | |||||||||||||||||||||
| Shares | Value | ||||||||||||||||||||||
| Gibraltar 0.0% | $524,491 | ||||||||||||||||||||||
| Bwin Party Digital Entertainment PLC | 292,793 | 524,491 | |||||||||||||||||||||
| Hong Kong 0.0% | 206,671 | ||||||||||||||||||||||
| China Metal Recycling Holdings, Ltd. (I) | 1,799,400 | 0 | |||||||||||||||||||||
| China Overseas Property Holdings, Ltd. (I) | 142,666 | 17,232 | |||||||||||||||||||||
| REXLot Holdings, Ltd. | 3,350,000 | 189,439 | |||||||||||||||||||||
| India 0.0% | 842,643 | ||||||||||||||||||||||
| Vedanta Resources PLC | 240,303 | 842,643 | |||||||||||||||||||||
| Ireland 0.5% | 44,866,903 | ||||||||||||||||||||||
| Allegion PLC | 163,586 | 9,906,768 | |||||||||||||||||||||
| CRH PLC (I) | 256,582 | 6,805,689 | |||||||||||||||||||||
| Glanbia PLC | 300,824 | 5,711,229 | |||||||||||||||||||||
| Ryanair Holdings PLC, ADR | 233,168 | 18,268,713 | |||||||||||||||||||||
| Shire PLC | 74,422 | 4,174,504 | |||||||||||||||||||||
| Italy 1.2% | 109,957,477 | ||||||||||||||||||||||
| Assicurazioni Generali SpA | 2,772,450 | 41,627,444 | |||||||||||||||||||||
| Atlantia SpA | 525,882 | 13,779,287 | |||||||||||||||||||||
| Banca Popolare di Milano Scarl | 5,843,202 | 4,797,240 | |||||||||||||||||||||
| Enel SpA | 3,311,859 | 13,597,364 | |||||||||||||||||||||
| Intesa Sanpaolo SpA | 4,883,321 | 13,913,334 | |||||||||||||||||||||
| Mediobanca SpA | 1,112,065 | 8,912,487 | |||||||||||||||||||||
| Telecom Italia SpA | 14,812,160 | 13,330,321 | |||||||||||||||||||||
| Japan 0.3% | 25,873,522 | ||||||||||||||||||||||
| Kumagai Gumi Company, Ltd. | 566,136 | 1,673,812 | |||||||||||||||||||||
| Mitsubishi UFJ Financial Group, Inc. | 818,128 | 4,195,278 | |||||||||||||||||||||
| Mitsui Fudosan Company, Ltd. | 249,733 | 5,878,936 | |||||||||||||||||||||
| Resorttrust, Inc. | 203,854 | 5,136,029 | |||||||||||||||||||||
| Seven & I Holdings Company, Ltd. | 126,279 | 5,632,356 | |||||||||||||||||||||
| Taiheiyo Cement Corp. | 1,164,477 | 3,357,111 | |||||||||||||||||||||
| Luxembourg 0.1% | 4,913,803 | ||||||||||||||||||||||
| RTL Group SA | 60,666 | 4,913,803 | |||||||||||||||||||||
| Macau 0.0% | 3,259,304 | ||||||||||||||||||||||
| Sands China, Ltd. | 933,164 | 3,259,304 | |||||||||||||||||||||
| Netherlands 0.9% | 84,970,700 | ||||||||||||||||||||||
| Aegon NV | 5,235,020 | 29,603,761 | |||||||||||||||||||||
| Delta Lloyd NV | 1,160,265 | 6,863,787 | |||||||||||||||||||||
| ING Groep NV | 783,474 | 8,925,518 | |||||||||||||||||||||
| Koninklijke KPN NV | 4,275,830 | 16,545,882 | |||||||||||||||||||||
| NN Group NV | 363,547 | 12,316,540 | |||||||||||||||||||||
| Royal Dutch Shell PLC, A Shares | 304,246 | 6,646,445 | |||||||||||||||||||||
| Royal Dutch Shell PLC, B Shares | 186,743 | 4,068,767 | |||||||||||||||||||||
| Shares | Value | ||||||||||||||||||||||
| Norway 0.0% | $4,144,705 | ||||||||||||||||||||||
| Storebrand ASA (I) | 1,017,540 | 4,144,705 | |||||||||||||||||||||
| Portugal 0.2% | 15,563,490 | ||||||||||||||||||||||
| CTT-Correios de Portugal SA | 590,015 | 5,125,212 | |||||||||||||||||||||
| Galp Energia SGPS SA | 564,382 | 6,696,151 | |||||||||||||||||||||
| Jeronimo Martins SGPS SA | 268,325 | 3,742,127 | |||||||||||||||||||||
| Singapore 0.2% | 14,942,761 | ||||||||||||||||||||||
| Avago Technologies, Ltd. | 111,755 | 14,942,761 | |||||||||||||||||||||
| Spain 0.5% | 45,817,556 | ||||||||||||||||||||||
| ACS Actividades de Construccion y Servicios SA | 240,425 | 6,108,086 | |||||||||||||||||||||
| Amadeus IT Holding SA, A Shares | 142,469 | 5,818,225 | |||||||||||||||||||||
| Bankinter SA | 1,857,532 | 12,962,454 | |||||||||||||||||||||
| Endesa SA | 708,230 | 13,710,745 | |||||||||||||||||||||
| Industria de Diseno Textil SA | 219,333 | 7,218,046 | |||||||||||||||||||||
| Sweden 0.6% | 52,223,127 | ||||||||||||||||||||||
| Lundin Petroleum AB (I) | 154,315 | 2,218,681 | |||||||||||||||||||||
| Securitas AB, B Shares | 629,482 | 9,278,635 | |||||||||||||||||||||
| Svenska Handelsbanken AB, A Shares | 748,216 | 9,414,355 | |||||||||||||||||||||
| Swedbank AB, A Shares | 693,697 | 14,548,778 | |||||||||||||||||||||
| Swedish Match AB | 471,222 | 16,762,678 | |||||||||||||||||||||
| Switzerland 2.3% | 213,000,016 | ||||||||||||||||||||||
| Baloise Holding AG | 117,620 | 14,418,434 | |||||||||||||||||||||
| Glencore PLC (I) | 3,811,857 | 4,914,632 | |||||||||||||||||||||
| Nestle SA | 147,257 | 10,848,781 | |||||||||||||||||||||
| Novartis AG | 211,371 | 16,375,641 | |||||||||||||||||||||
| Partners Group Holding AG | 37,335 | 13,465,043 | |||||||||||||||||||||
| Roche Holding AG | 126,761 | 32,834,181 | |||||||||||||||||||||
| Swiss Life Holding AG (I) | 74,955 | 19,106,374 | |||||||||||||||||||||
| Syngenta AG | 33,651 | 12,390,813 | |||||||||||||||||||||
| UBS Group AG | 1,268,174 | 20,956,794 | |||||||||||||||||||||
| Zurich Insurance Group AG (I) | 305,367 | 67,689,323 | |||||||||||||||||||||
| United Kingdom 3.9% | 350,455,281 | ||||||||||||||||||||||
| AA PLC | 1,436,264 | 6,054,299 | |||||||||||||||||||||
| Anglo American PLC | 201,352 | 803,141 | |||||||||||||||||||||
| ARM Holdings PLC | 737,662 | 10,523,081 | |||||||||||||||||||||
| Ashtead Group PLC | 251,351 | 3,242,517 | |||||||||||||||||||||
| AstraZeneca PLC | 120,705 | 7,772,303 | |||||||||||||||||||||
| Aviva PLC | 640,886 | 4,420,065 | |||||||||||||||||||||
| Babcock International Group PLC | 952,322 | 12,479,835 | |||||||||||||||||||||
| Barclays PLC | 4,311,060 | 11,535,913 | |||||||||||||||||||||
| Barratt Developments PLC | 512,237 | 4,393,849 | |||||||||||||||||||||
| Bellway PLC | 255,692 | 10,152,997 | |||||||||||||||||||||
| Shares | Value | ||||||||||||||||||||||
| United Kingdom (continued) | |||||||||||||||||||||||
| Berkeley Group Holdings PLC | 68,894 | $3,483,066 | |||||||||||||||||||||
| BG Group PLC | 275,923 | 4,175,513 | |||||||||||||||||||||
| BP PLC | 2,301,117 | 12,426,608 | |||||||||||||||||||||
| British American Tobacco PLC | 155,445 | 8,661,984 | |||||||||||||||||||||
| BT Group PLC | 3,274,359 | 22,788,372 | |||||||||||||||||||||
| BTG PLC (I) | 199,642 | 1,673,118 | |||||||||||||||||||||
| Burberry Group PLC | 189,651 | 3,250,071 | |||||||||||||||||||||
| Capita PLC | 162,632 | 2,737,564 | |||||||||||||||||||||
| Carillion PLC | 585,792 | 2,302,226 | |||||||||||||||||||||
| Close Brothers Group PLC | 121,523 | 2,239,045 | |||||||||||||||||||||
| Crest Nicholson Holdings PLC | 139,721 | 1,142,583 | |||||||||||||||||||||
| Derwent London PLC | 47,407 | 2,198,777 | |||||||||||||||||||||
| Direct Line Insurance Group PLC | 801,438 | 4,304,944 | |||||||||||||||||||||
| Dixons Carphone PLC | 284,632 | 1,930,361 | |||||||||||||||||||||
| DS Smith PLC | 1,277,917 | 6,686,402 | |||||||||||||||||||||
| Enterprise Inns PLC (I) | 399,400 | 525,963 | |||||||||||||||||||||
| Essentra PLC | 242,540 | 2,548,821 | |||||||||||||||||||||
| esure Group PLC | 287,454 | 1,030,041 | |||||||||||||||||||||
| Galliford Try PLC | 139,186 | 2,958,196 | |||||||||||||||||||||
| GKN PLC | 1,255,735 | 5,024,422 | |||||||||||||||||||||
| GlaxoSmithKline PLC | 539,859 | 11,121,412 | |||||||||||||||||||||
| Greene King PLC | 171,377 | 2,158,788 | |||||||||||||||||||||
| Howden Joinery Group PLC | 506,418 | 3,627,353 | |||||||||||||||||||||
| HSBC Holdings PLC | 2,638,016 | 18,604,770 | |||||||||||||||||||||
| IMI PLC | 334,044 | 3,857,278 | |||||||||||||||||||||
| Imperial Tobacco Group PLC | 152,657 | 8,265,755 | |||||||||||||||||||||
| Inchcape PLC | 535,850 | 5,509,799 | |||||||||||||||||||||
| International Consolidated Airlines Group SA | 498,228 | 3,845,216 | |||||||||||||||||||||
| International Consolidated Airlines Group SA | 1,076,670 | 8,325,579 | |||||||||||||||||||||
| Interserve PLC | 99,857 | 667,885 | |||||||||||||||||||||
| ITV PLC | 860,526 | 3,289,699 | |||||||||||||||||||||
| Jardine Lloyd Thompson Group PLC | 234,255 | 2,792,722 | |||||||||||||||||||||
| Johnson Matthey PLC | 62,366 | 2,206,180 | |||||||||||||||||||||
| Kier Group PLC | 136,029 | 2,593,945 | |||||||||||||||||||||
| Legal & General Group PLC | 1,592,793 | 5,559,390 | |||||||||||||||||||||
| Lloyds Banking Group PLC | 8,342,735 | 7,816,000 | |||||||||||||||||||||
| McCarthy & Stone PLC (I) (S) | 602,976 | 2,384,238 | |||||||||||||||||||||
| National Grid PLC | 481,675 | 6,786,215 | |||||||||||||||||||||
| Petrofac, Ltd. | 169,036 | 1,926,359 | |||||||||||||||||||||
| Prudential PLC | 524,143 | 10,297,464 | |||||||||||||||||||||
| Reckitt Benckiser Group PLC | 49,397 | 4,393,446 | |||||||||||||||||||||
| RELX PLC | 324,573 | 5,710,719 | |||||||||||||||||||||
| Rio Tinto PLC | 223,082 | 5,470,394 | |||||||||||||||||||||
| SABMiller PLC | 114,749 | 6,871,535 | |||||||||||||||||||||
| Shares | Value | ||||||||||||||||||||||
| United Kingdom (continued) | |||||||||||||||||||||||
| Senior PLC | 351,611 | $1,100,135 | |||||||||||||||||||||
| Severn Trent PLC | 110,077 | 3,454,349 | |||||||||||||||||||||
| Standard Chartered PLC | 137,475 | 927,411 | |||||||||||||||||||||
| SVG Capital PLC (I) | 230,885 | 1,618,250 | |||||||||||||||||||||
| Telecom Plus PLC | 113,828 | 1,636,430 | |||||||||||||||||||||
| The Restaurant Group PLC | 440,751 | 3,357,880 | |||||||||||||||||||||
| The Sage Group PLC | 1,169,471 | 10,424,832 | |||||||||||||||||||||
| Thomas Cook Group PLC (I) | 2,890,067 | 4,421,052 | |||||||||||||||||||||
| Tullow Oil PLC (I) | 164,314 | 407,258 | |||||||||||||||||||||
| Unilever PLC | 99,542 | 4,376,366 | |||||||||||||||||||||
| United Utilities Group PLC | 218,659 | 2,991,629 | |||||||||||||||||||||
| Vodafone Group PLC | 4,247,875 | 13,654,237 | |||||||||||||||||||||
| W.S. Atkins PLC | 219,684 | 4,537,234 | |||||||||||||||||||||
| United States 7.4% | 672,690,104 | ||||||||||||||||||||||
| AbbVie, Inc. | 48,029 | 2,636,792 | |||||||||||||||||||||
| Activision Blizzard, Inc. | 173,667 | 6,047,085 | |||||||||||||||||||||
| Acuity Brands, Inc. | 28,234 | 5,715,409 | |||||||||||||||||||||
| Advance Auto Parts, Inc. | 49,466 | 7,521,305 | |||||||||||||||||||||
| Aetna, Inc. | 25,626 | 2,609,752 | |||||||||||||||||||||
| Alliance Data Systems Corp. (I) | 33,192 | 6,631,430 | |||||||||||||||||||||
| Alphabet, Inc., Class A (I) | 5,263 | 4,006,985 | |||||||||||||||||||||
| Alphabet, Inc., Class C (I) | 15,186 | 11,282,418 | |||||||||||||||||||||
| Altria Group, Inc. | 65,826 | 4,022,627 | |||||||||||||||||||||
| Amazon.com, Inc. (I) | 5,848 | 3,432,776 | |||||||||||||||||||||
| American International Group, Inc. | 87,761 | 4,956,741 | |||||||||||||||||||||
| American Tower Corp. | 155,746 | 14,693,078 | |||||||||||||||||||||
| Amgen, Inc. | 49,085 | 7,496,752 | |||||||||||||||||||||
| Apple, Inc. | 66,774 | 6,499,781 | |||||||||||||||||||||
| Arthur J. Gallagher & Company | 63,405 | 2,386,564 | |||||||||||||||||||||
| Avis Budget Group, Inc. (I) | 64,221 | 1,687,086 | |||||||||||||||||||||
| Bank of America Corp. | 2,843,263 | 40,203,739 | |||||||||||||||||||||
| BB&T Corp. | 336,464 | 10,988,914 | |||||||||||||||||||||
| Blackhawk Network Holdings, Inc. (I) | 164,083 | 6,184,288 | |||||||||||||||||||||
| Boston Scientific Corp. (I) | 645,653 | 11,318,297 | |||||||||||||||||||||
| Bristol-Myers Squibb Company | 48,222 | 2,997,480 | |||||||||||||||||||||
| CalAtlantic Group, Inc. | 82,053 | 2,665,902 | |||||||||||||||||||||
| Cardinal Health, Inc. | 55,718 | 4,533,774 | |||||||||||||||||||||
| Cavium, Inc. (I) | 87,198 | 5,037,428 | |||||||||||||||||||||
| CBRE Group, Inc., Class A (I) | 211,093 | 5,904,271 | |||||||||||||||||||||
| Celgene Corp. (I) | 135,117 | 13,554,937 | |||||||||||||||||||||
| Citigroup, Inc. | 1,100,314 | 46,851,370 | |||||||||||||||||||||
| CMS Energy Corp. | 202,993 | 7,892,368 | |||||||||||||||||||||
| Cognizant Technology Solutions Corp., Class A (I) | 60,556 | 3,833,800 | |||||||||||||||||||||
| Shares | Value | ||||||||||||||||||||||
| United States (continued) | |||||||||||||||||||||||
| Comerica, Inc. | 129,646 | $4,446,858 | |||||||||||||||||||||
| Concho Resources, Inc. (I) | 16,880 | 1,605,794 | |||||||||||||||||||||
| CVS Health Corp. | 144,932 | 13,998,982 | |||||||||||||||||||||
| Delta Air Lines, Inc. | 165,233 | 7,318,170 | |||||||||||||||||||||
| Electronic Arts, Inc. (I) | 126,280 | 8,150,743 | |||||||||||||||||||||
| Eli Lilly & Company | 32,289 | 2,554,060 | |||||||||||||||||||||
| EOG Resources, Inc. | 50,215 | 3,566,269 | |||||||||||||||||||||
| Equifax, Inc. | 13,998 | 1,480,988 | |||||||||||||||||||||
| Equinix, Inc. | 23,081 | 7,168,266 | |||||||||||||||||||||
| Evercore Partners, Inc., Class A | 111,020 | 5,014,773 | |||||||||||||||||||||
| Exxon Mobil Corp. | 34,373 | 2,675,938 | |||||||||||||||||||||
| Facebook, Inc., Class A (I) | 150,024 | 16,834,193 | |||||||||||||||||||||
| Fifth Third Bancorp | 425,426 | 6,721,731 | |||||||||||||||||||||
| First Republic Bank | 195,159 | 13,270,812 | |||||||||||||||||||||
| FleetCor Technologies, Inc. (I) | 58,293 | 7,160,712 | |||||||||||||||||||||
| Fortune Brands Home & Security, Inc. | 270,718 | 13,154,188 | |||||||||||||||||||||
| Gilead Sciences, Inc. | 39,614 | 3,287,962 | |||||||||||||||||||||
| Gulfport Energy Corp. (I) | 48,076 | 1,420,646 | |||||||||||||||||||||
| Halliburton Company | 225,108 | 7,156,183 | |||||||||||||||||||||
| Hanesbrands, Inc. | 395,762 | 12,098,444 | |||||||||||||||||||||
| Hewlett Packard Enterprise Company | 492,916 | 6,782,524 | |||||||||||||||||||||
| Huntington Bancshares, Inc. | 377,331 | 3,237,500 | |||||||||||||||||||||
| Ingersoll-Rand PLC | 28,841 | 1,484,446 | |||||||||||||||||||||
| JPMorgan Chase & Co. | 657,268 | 39,107,446 | |||||||||||||||||||||
| Kansas City Southern | 40,408 | 2,864,119 | |||||||||||||||||||||
| KeyCorp. | 620,654 | 6,926,499 | |||||||||||||||||||||
| Kimberly-Clark Corp. | 15,379 | 1,974,971 | |||||||||||||||||||||
| LyondellBasell Industries NV, Class A | 56,242 | 4,385,189 | |||||||||||||||||||||
| M&T Bank Corp. | 56,494 | 6,224,509 | |||||||||||||||||||||
| Martin Marietta Materials, Inc. | 72,120 | 9,056,830 | |||||||||||||||||||||
| McKesson Corp. | 23,381 | 3,763,873 | |||||||||||||||||||||
| Microsoft Corp. | 59,118 | 3,256,811 | |||||||||||||||||||||
| Mondelez International, Inc., Class A | 104,883 | 4,520,457 | |||||||||||||||||||||
| Morgan Stanley | 64,260 | 1,663,049 | |||||||||||||||||||||
| Newell Rubbermaid, Inc. | 296,694 | 11,505,793 | |||||||||||||||||||||
| OneMain Holdings, Inc. (I) | 44,845 | 1,185,253 | |||||||||||||||||||||
| People's United Financial, Inc. | 256,999 | 3,693,076 | |||||||||||||||||||||
| PepsiCo, Inc. | 43,575 | 4,326,998 | |||||||||||||||||||||
| Pfizer, Inc. | 134,062 | 4,087,550 | |||||||||||||||||||||
| Regions Financial Corp. | 899,051 | 7,300,294 | |||||||||||||||||||||
| salesforce.com, Inc. (I) | 40,564 | 2,760,786 | |||||||||||||||||||||
| Steel Dynamics, Inc. | 75,000 | 1,376,250 | |||||||||||||||||||||
| Stillwater Mining Company (I) | 415,550 | 2,721,853 | |||||||||||||||||||||
| SunTrust Banks, Inc. | 244,093 | 8,928,922 | |||||||||||||||||||||
| Shares | Value | ||||||||||||||||||||||
| United States (continued) | |||||||||||||||||||||||
| The Charles Schwab Corp. | 367,495 | $9,382,147 | |||||||||||||||||||||
| The Hartford Financial Services Group, Inc. | 140,853 | 5,659,474 | |||||||||||||||||||||
| The Home Depot, Inc. | 42,527 | 5,348,196 | |||||||||||||||||||||
| The Kraft Heinz Company | 103,946 | 8,114,025 | |||||||||||||||||||||
| The PNC Financial Services Group, Inc. | 196,064 | 16,988,946 | |||||||||||||||||||||
| The TJX Companies, Inc. | 143,681 | 10,235,834 | |||||||||||||||||||||
| Union Pacific Corp. | 37,654 | 2,711,088 | |||||||||||||||||||||
| UnitedHealth Group, Inc. | 33,059 | 3,807,074 | |||||||||||||||||||||
| US Bancorp | 458,692 | 18,375,202 | |||||||||||||||||||||
| Verizon Communications, Inc. | 62,024 | 3,099,339 | |||||||||||||||||||||
| Vertex Pharmaceuticals, Inc. (I) | 15,799 | 1,433,759 | |||||||||||||||||||||
| Visteon Corp. | 96,036 | 6,422,888 | |||||||||||||||||||||
| Wells Fargo & Company | 777,835 | 39,070,652 | |||||||||||||||||||||
| WR Grace & Company (I) | 22,176 | 1,803,796 | |||||||||||||||||||||
| Zions Bancorporation | 195,054 | 4,423,825 | |||||||||||||||||||||
| Rights 0.0% | $106,785 | ||||||||||||||||||||||
| (Cost $0) | |||||||||||||||||||||||
| ACS Actividades de Construccion y Servicios SA (Expiration Date: 2-12-16) (I) (N) | 240,425 | 106,785 | |||||||||||||||||||||
| Shares/Par | Value | ||||||||||||||||||||||
| Purchased options 1.1% | $99,446,884 | ||||||||||||||||||||||
| (Cost $85,342,214) | |||||||||||||||||||||||
| Put options 1.1% | 99,446,884 | ||||||||||||||||||||||
| Exchange Traded on Euro STOXX 50 Index (Expiration Date: 12-15-17; Strike Price: EUR 3,400) (I) | 4,166 | 31,830,224 | |||||||||||||||||||||
| Exchange Traded on Euro STOXX 50 Index (Expiration Date: 12-16-16; Strike Price: EUR 3,000) (I) | 67,000 | 21,251,638 | |||||||||||||||||||||
| Exchange Traded on Euro STOXX 50 Index (Expiration Date: 12-21-18; Strike Price: EUR 3,000) (I) | 3,671 | 22,385,262 | |||||||||||||||||||||
| Over the Counter on 20 Year Interest Rate Swap (Expiration Date: 12-11-33; Underlying Swap: Pay Fixed 4.000%, receive EURIBOR, maturing 12-14-53; Counterparty: Morgan Stanley) (I) | 30,000,000 | 1,052,767 | |||||||||||||||||||||
| Over the Counter on 20 Year Interest Rate Swap (Expiration Date: 12-17-33; Underlying Swap: Pay Fixed 4.000%, receive EURIBOR, maturing 12-21-53; Counterparty: Morgan Stanley) (I) | 10,000,000 | 350,927 | |||||||||||||||||||||
| Over the Counter on 20 Year Interest Rate Swap (Expiration Date: 12-4-33; Underlying Swap: Pay Fixed 4.000%, receive EURIBOR, maturing 12-7-53; Counterparty: Morgan Stanley) (I) | 25,000,000 | 877,298 | |||||||||||||||||||||
| Over the Counter on 20 Year Interest Rate Swap (Expiration Date: 4-1-34; Underlying Swap: Pay Fixed 4.000%, receive EURIBOR, maturing 4-5-54; Counterparty: Morgan Stanley) (I) | 25,000,000 | 877,431 | |||||||||||||||||||||
| Over the Counter on 20 Year Interest Rate Swap (Expiration Date: 5-8-34; Underlying Swap: Pay Fixed 4.000%, receive EURIBOR, maturing 5-10-54; Counterparty: Morgan Stanley) (I) | 56,000,000 | 1,965,499 | |||||||||||||||||||||
| Over the Counter on Apple CBOE FLEX Options (Expiration Date: 6-17-16; Strike Price: $125.00; Counterparty: Morgan Stanley) (I) | 3,130 | 9,108,367 | |||||||||||||||||||||
| Shares/Par | Value | ||||||||||||||||||||||
| Put options (continued) | |||||||||||||||||||||||
| Over the Counter on Swiss Market Index (Expiration Date: 3-18-16; Strike Price: CHF 8,700; Counterparty: Morgan Stanley) (I) | 19,140 | $9,747,471 | |||||||||||||||||||||
| Yield* (%) | Maturity date | Par value^ | Value | ||||||||||||||||||||
| Short-term investments 54.5% | $4,950,169,907 | ||||||||||||||||||||||
| (Cost $4,950,513,067) | |||||||||||||||||||||||
| Certificate of deposit 13.5% | 1,225,531,673 | ||||||||||||||||||||||
| Abbey National Treasury Services PLC | 0.850 | 07-15-16 | 100,000,000 | 99,979,400 | |||||||||||||||||||
| Commerzbank AG | 1.000 | 03-04-16 | 100,000,000 | 100,077,732 | |||||||||||||||||||
| Commonwealth Bank of Australia | 0.410 | 03-10-16 | 40,000,000 | 39,998,360 | |||||||||||||||||||
| Credit Agricole SA | 0.450 | 03-03-16 | 60,000,000 | 59,993,040 | |||||||||||||||||||
| Credit Suisse Group AG | 0.530 | 04-14-16 | 100,000,000 | 99,964,000 | |||||||||||||||||||
| Goldman Sachs International Bank | 0.550 | 03-10-16 | 100,000,000 | 100,010,200 | |||||||||||||||||||
| Industrial & Commercial Bank of China, Ltd. | 0.560 | 02-25-16 | 100,000,000 | 99,997,600 | |||||||||||||||||||
| Mitsubishi UFJ Trust & Banking Corp. | 0.679 | 04-20-16 | 100,000,000 | 99,851,200 | |||||||||||||||||||
| Mizuho Corporate Bank | 0.650 | 04-15-16 | 100,000,000 | 99,987,400 | |||||||||||||||||||
| National Australia Bank, Ltd. | 0.410 | 03-11-16 | 50,000,000 | 49,997,650 | |||||||||||||||||||
| Nationwide Building Society | 0.420 | 02-16-16 | 76,000,000 | 76,009,491 | |||||||||||||||||||
| Natixis SA | 0.760 | 06-01-16 | 100,000,000 | 99,766,000 | |||||||||||||||||||
| Qatar National Bank London | 0.489 | 03-16-16 | 100,000,000 | 99,924,200 | |||||||||||||||||||
| Societe Generale SA | 0.580 | 04-21-16 | 100,000,000 | 99,975,400 | |||||||||||||||||||
| Commercial paper 11.1% | 1,005,473,347 | ||||||||||||||||||||||
| Asian Development Bank | 0.450 | 04-11-16 | 100,000,000 | 99,902,000 | |||||||||||||||||||
| Banque Federative du Credit Mutuel SA | 0.449 | 02-03-16 | 100,000,000 | 99,998,600 | |||||||||||||||||||
| Caisse des Depots et Consignations | 0.300 | 02-22-16 | 100,000,000 | 99,978,467 | |||||||||||||||||||
| Commonwealth Bank of Australia | 0.360 | 02-10-16 | 64,000,000 | 63,994,304 | |||||||||||||||||||
| Deutsche Bank AG | 0.549 | 03-10-16 | 100,000,000 | 99,937,600 | |||||||||||||||||||
| European Investment Bank | 0.260 | 02-08-16 | 100,000,000 | 99,998,854 | |||||||||||||||||||
| KFW | 0.325 | 02-19-16 | 100,000,000 | 99,983,900 | |||||||||||||||||||
| Landwirtschaftliche Rentenbank | 0.579 | 04-26-16 | 100,000,000 | 99,907,900 | |||||||||||||||||||
| Nordea Bank AB | 0.399 | 02-10-16 | 42,000,000 | 41,995,422 | |||||||||||||||||||
| NRW.BANK | 0.410 | 02-09-16 | 100,000,000 | 99,994,600 | |||||||||||||||||||
| Pohjola Bank PLC | 0.669 | 05-25-16 | 100,000,000 | 99,781,700 | |||||||||||||||||||
| Time deposits 15.3% | 1,389,245,945 | ||||||||||||||||||||||
| BNP Paribas SA | 0.300 | 02-01-16 | 183,572,453 | 183,572,453 | |||||||||||||||||||
| Danske Bank A/S | 0.350 | 02-01-16 | 180,142,501 | 180,142,501 | |||||||||||||||||||
| DBS Bank, Ltd. | 0.650 | 05-03-16 | 50,040,000 | 50,040,000 | |||||||||||||||||||
| DZ Bank AG | 0.370 | 02-01-16 | 315,611,611 | 315,611,611 | |||||||||||||||||||
| KBC Bank NV | 0.250 | 02-01-16 | 305,836,726 | 305,836,726 | |||||||||||||||||||
| Lloyds Bank PLC | 0.300 | 02-01-16 | 154,661,895 | 154,661,895 | |||||||||||||||||||
| Standard Chartered Bank PLC | 0.350 | 02-01-16 | 199,380,759 | 199,380,759 | |||||||||||||||||||
| U.S. Government 14.0% | 1,274,440,300 | ||||||||||||||||||||||
| U.S. Treasury Bill | 0.005 | 02-11-16 | 100,000,000 | 99,994,000 | |||||||||||||||||||
| Yield* (%) | Maturity date | Par value^ | Value | ||||||||||||||||||||
| U.S. Government (continued) | |||||||||||||||||||||||
| U.S. Treasury Bill | 0.010 | 02-18-16 | 100,000,000 | $99,989,900 | |||||||||||||||||||
| U.S. Treasury Bill (D) | 0.015 | 03-17-16 | 30,000,000 | 29,991,300 | |||||||||||||||||||
| U.S. Treasury Bill (D) | 0.079 | 02-25-16 | 120,000,000 | 119,981,280 | |||||||||||||||||||
| U.S. Treasury Bill | 0.086 | 02-04-16 | 100,000,000 | 99,998,500 | |||||||||||||||||||
| U.S. Treasury Bill | 0.130 | 03-03-16 | 150,000,000 | 149,969,700 | |||||||||||||||||||
| U.S. Treasury Bill (D) | 0.150 | 03-10-16 | 25,000,000 | 24,993,600 | |||||||||||||||||||
| U.S. Treasury Bill (D) | 0.216 | 04-14-16 | 130,000,000 | 129,925,380 | |||||||||||||||||||
| U.S. Treasury Bill (D) | 0.238 | 04-07-16 | 120,000,000 | 119,941,200 | |||||||||||||||||||
| U.S. Treasury Bill | 0.251 | 04-21-16 | 150,000,000 | 149,902,800 | |||||||||||||||||||
| U.S. Treasury Bill | 0.297 | 05-05-16 | 130,000,000 | 129,885,600 | |||||||||||||||||||
| U.S. Treasury Bill | 0.330 | 05-26-16 | 120,000,000 | 119,867,040 | |||||||||||||||||||
| Yield (%) | Shares | Value | |||||||||||||||||||||
| Money market funds 0.6% | 55,478,642 | ||||||||||||||||||||||
| BlackRock Cash Funds - Prime | 0.4157(Y) | 55,478,642 | $55,478,642 | ||||||||||||||||||||
| Total investments (Cost $9,101,094,993)† 97.1% | $8,825,237,603 | ||||||||||||||||||||||
| Other assets and liabilities, net 2.9% | $266,795,274 | ||||||||||||||||||||||
| Total net assets 100.0% | $9,092,032,877 | ||||||||||||||||||||||
| The percentage shown for each investment category is the total value
of the category as a percentage of the net assets of the fund.
^All par values are denominated in U.S. dollars unless otherwise indicated. |
|||||||||||||||||||||||
| Key to Currency Abbreviations | |||||||||||||||||||||||
| CHF | Swiss Franc | ||||||||||||||||||||||
| EUR | Euro | ||||||||||||||||||||||
| GBP | Pound Sterling | ||||||||||||||||||||||
| MXN | Mexican Peso | ||||||||||||||||||||||
| Key to Security Abbreviations and Legend | |||||||||||||||||||||||
| ADR | American Depositary Receipts | ||||||||||||||||||||||
| EURIBOR | Euro Interbank Offered Rate | ||||||||||||||||||||||
| LIBOR | London Interbank Offered Rate | ||||||||||||||||||||||
| PIK | Payment-in-kind | ||||||||||||||||||||||
| (D) | All or a portion of this security is segregated at the custodian as collateral pursuant to certain derivative instrument contracts. | ||||||||||||||||||||||
| (I) | Non-income producing security. | ||||||||||||||||||||||
| (N) | Strike price and/or expiration date not available. | ||||||||||||||||||||||
| (P) | Variable rate obligation. The coupon rate shown represents the rate at period end. | ||||||||||||||||||||||
| (Q) | Perpetual bonds have no stated maturity date. Date shown as maturity date is next call date. | ||||||||||||||||||||||
| (S) | These securities are exempt from registration under Rule 144A of the Securities Act of 1933. Such securities may be resold, normally to qualified institutional buyers, in transactions exempt from registration. | ||||||||||||||||||||||
| (Y) | The rate shown is the annualized seven-day yield as of 1-31-16. | ||||||||||||||||||||||
| * | Yield represents either the annualized yield at the date of purchase, the stated coupon rate or, for floating rate securities, the rate at period end. | ||||||||||||||||||||||
| † | At 1-31-16, the aggregate cost of investment securities for federal income tax purposes was $9,117,187,692. Net unrealized depreciation aggregated $291,950,089, of which $177,635,635 related to appreciated investment securities and $469,585,724 related to depreciated investment securities. | ||||||||||||||||||||||
Financial statements
STATEMENT OF ASSETS AND LIABILITIES 1-31-16 (unaudited)
| Assets | |||||||||||||||||||||||||||||||||
| Investments, at value (Cost $9,101,094,993) | $8,825,237,603 | ||||||||||||||||||||||||||||||||
| Cash | 246,641 | ||||||||||||||||||||||||||||||||
| Foreign currency, at value (Cost $792,706) | 792,434 | ||||||||||||||||||||||||||||||||
| Cash held at broker for futures contracts | 165,405,729 | ||||||||||||||||||||||||||||||||
| Cash collateral for derivative contracts | 3,090,116 | ||||||||||||||||||||||||||||||||
| Receivable for investments sold | 6,601,869 | ||||||||||||||||||||||||||||||||
| Receivable for fund shares sold | 66,996,931 | ||||||||||||||||||||||||||||||||
| Unrealized appreciation on forward foreign currency exchange contracts | 86,259,391 | ||||||||||||||||||||||||||||||||
| Dividends and interest receivable | 30,965,197 | ||||||||||||||||||||||||||||||||
| Swap contracts, at value (including net unamortized upfront payment of $85,847) | 75,175,117 | ||||||||||||||||||||||||||||||||
| Receivable for futures variation margin | 2,225,390 | ||||||||||||||||||||||||||||||||
| Other receivables and prepaid expenses | 531,912 | ||||||||||||||||||||||||||||||||
| Total assets | 9,263,528,330 | ||||||||||||||||||||||||||||||||
| Liabilities | |||||||||||||||||||||||||||||||||
| Payable for investments purchased | 15,990,546 | ||||||||||||||||||||||||||||||||
| Payable for delayed delivery securities purchased | 596,000 | ||||||||||||||||||||||||||||||||
| Unrealized depreciation on forward foreign currency exchange contracts | 123,360,681 | ||||||||||||||||||||||||||||||||
| Payable for fund shares repurchased | 17,452,024 | ||||||||||||||||||||||||||||||||
| Written options, at value (Premium received $8,355,635) | 1,175,507 | ||||||||||||||||||||||||||||||||
| Swap contracts, at value | 5,980,595 | ||||||||||||||||||||||||||||||||
| Payable for exchange cleared swaps | 4,525,390 | ||||||||||||||||||||||||||||||||
| Payable to affiliates | |||||||||||||||||||||||||||||||||
| Accounting and legal services fees | 213,623 | ||||||||||||||||||||||||||||||||
| Transfer agent fees | 1,349,048 | ||||||||||||||||||||||||||||||||
| Distribution and service fees | 1,766 | ||||||||||||||||||||||||||||||||
| Trustees' fees | 8,756 | ||||||||||||||||||||||||||||||||
| Other liabilities and accrued expenses | 841,517 | ||||||||||||||||||||||||||||||||
| Total liabilities | 171,495,453 | ||||||||||||||||||||||||||||||||
| Net assets | $9,092,032,877 | ||||||||||||||||||||||||||||||||
| Net assets consist of | |||||||||||||||||||||||||||||||||
| Paid-in capital | $9,690,846,758 | ||||||||||||||||||||||||||||||||
| Accumulated distributions in excess of net investment income | (76,793,952 | ) | |||||||||||||||||||||||||||||||
| Accumulated net realized gain (loss) on investments, futures contracts, options written, foreign currency transactions and swap agreements | (230,144,968 | ) | |||||||||||||||||||||||||||||||
| Net unrealized appreciation (depreciation) on investments, futures contracts, options written, translation of assets and liabilities in foreign currencies and swap agreements | (291,874,961 | ) | |||||||||||||||||||||||||||||||
| Net assets | $9,092,032,877 | ||||||||||||||||||||||||||||||||
STATEMENT OF ASSETS AND LIABILITIES (continued)
| Net asset value per share | |||||||||||||||||||||
| Based on net asset values and shares outstanding - The fund has an unlimited number of shares authorized with no par value | |||||||||||||||||||||
| Class A ($1,284,308,048 ÷ 125,277,815 shares)1 | $10.25 | ||||||||||||||||||||
| Class C ($342,075,416 ÷ 33,368,011 shares)1 | $10.25 | ||||||||||||||||||||
| Class I ($5,660,092,422 ÷ 551,355,932 shares) | $10.27 | ||||||||||||||||||||
| Class R2 ($7,180,598 ÷ 701,107 shares) | $10.24 | ||||||||||||||||||||
| Class R6 ($626,086,818 ÷ 61,012,411 shares) | $10.26 | ||||||||||||||||||||
| Class NAV ($1,172,289,575 ÷ 114,368,920 shares) | $10.25 | ||||||||||||||||||||
| Maximum offering price per share | |||||||||||||||||||||
| Class A (net assets value per share ÷ 95%)2 | $10.79 | ||||||||||||||||||||
| 1 | Redemption price per share is equal to net asset value less any applicable contingent deferred sales charge. | |||||||||||||||||||
| 2 | On single retail sales of less than $50,000. On sales of $50,000 or more and on group sales the offering price is reduced. | |||||||||||||||||||
STATEMENT OF OPERATIONS For the six months ended 1-31-16 (unaudited)
| Investment income | ||||||||||||||||||||||||
| Interest | $38,733,976 | |||||||||||||||||||||||
| Dividends | 28,645,883 | |||||||||||||||||||||||
| Less foreign taxes withheld | (5,213,011 | ) | ||||||||||||||||||||||
| Total investment income | 62,166,848 | |||||||||||||||||||||||
| Expenses | ||||||||||||||||||||||||
| Investment management fees | 50,415,659 | |||||||||||||||||||||||
| Distribution and service fees | 3,413,315 | |||||||||||||||||||||||
| Accounting and legal services fees | 584,618 | |||||||||||||||||||||||
| Transfer agent fees | 3,966,034 | |||||||||||||||||||||||
| Trustees' fees | 65,880 | |||||||||||||||||||||||
| State registration fees | 148,616 | |||||||||||||||||||||||
| Printing and postage | 139,135 | |||||||||||||||||||||||
| Professional fees | 244,858 | |||||||||||||||||||||||
| Custodian fees | 869,273 | |||||||||||||||||||||||
| Registration and filing fees | 94,883 | |||||||||||||||||||||||
| Other | 78,206 | |||||||||||||||||||||||
| Total expenses | 60,020,477 | |||||||||||||||||||||||
| Less expense reductions | (551,184 | ) | ||||||||||||||||||||||
| Net expenses | 59,469,293 | |||||||||||||||||||||||
| Net investment income | 2,697,555 | |||||||||||||||||||||||
| Realized and unrealized gain (loss) | ||||||||||||||||||||||||
| Net realized gain (loss) on | ||||||||||||||||||||||||
| Investments | (185,422,242 | ) | ||||||||||||||||||||||
| Futures contracts | 173,194,715 | |||||||||||||||||||||||
| Written options | 7,870,769 | |||||||||||||||||||||||
| Swap contracts | 10,236,705 | |||||||||||||||||||||||
| 5,879,947 | ||||||||||||||||||||||||
| Change in net unrealized appreciation (depreciation) of | ||||||||||||||||||||||||
| Investments and translation of assets and liabilities in foreign currencies | (272,773,846 | ) | ||||||||||||||||||||||
| Futures contracts | (40,211,910 | ) | ||||||||||||||||||||||
| Written options | 1,969,508 | |||||||||||||||||||||||
| Swap contracts | 47,356,720 | |||||||||||||||||||||||
| (263,659,528 | ) | |||||||||||||||||||||||
| Net realized and unrealized loss | (257,779,581 | ) | ||||||||||||||||||||||
| Decrease in net assets from operations | ($255,082,026 | ) | ||||||||||||||||||||||
STATEMENTS OF CHANGES IN NET ASSETS
| Six months ended 1-31-16 | Year ended 7-31-15 | |||||||||||||||||||||||||||||||||||||||||||||||
| (unaudited) | ||||||||||||||||||||||||||||||||||||||||||||||||
| Increase (decrease) in net assets | ||||||||||||||||||||||||||||||||||||||||||||||||
| From operations | ||||||||||||||||||||||||||||||||||||||||||||||||
| Net investment income | $2,697,555 | $33,312,756 | ||||||||||||||||||||||||||||||||||||||||||||||
| Net realized gain | 5,879,947 | 699,061,708 | ||||||||||||||||||||||||||||||||||||||||||||||
| Change in net unrealized appreciation (depreciation) | (263,659,528 | ) | (407,316,110 | ) | ||||||||||||||||||||||||||||||||||||||||||||
| Increase (decrease) in net assets resulting from operations | (255,082,026 | ) | 325,058,354 | |||||||||||||||||||||||||||||||||||||||||||||
| Distributions to shareholders | ||||||||||||||||||||||||||||||||||||||||||||||||
| From net investment income | ||||||||||||||||||||||||||||||||||||||||||||||||
| Class A | (78,898,528 | ) | (41,547,133 | ) | ||||||||||||||||||||||||||||||||||||||||||||
| Class C | (18,561,949 | ) | (8,817,304 | ) | ||||||||||||||||||||||||||||||||||||||||||||
| Class I | (361,871,430 | ) | (199,982,330 | ) | ||||||||||||||||||||||||||||||||||||||||||||
| Class R2 | (400,307 | ) | (77,097 | ) | ||||||||||||||||||||||||||||||||||||||||||||
| Class R6 | (37,773,858 | ) | (13,840,784 | ) | ||||||||||||||||||||||||||||||||||||||||||||
| Class NAV | (79,816,666 | ) | (43,278,341 | ) | ||||||||||||||||||||||||||||||||||||||||||||
| Total distributions | (577,322,738 | ) | (307,542,989 | ) | ||||||||||||||||||||||||||||||||||||||||||||
| From fund share transactions | 1,636,180,292 | 2,569,879,994 | ||||||||||||||||||||||||||||||||||||||||||||||
| Total increase | 803,775,528 | 2,587,395,359 | ||||||||||||||||||||||||||||||||||||||||||||||
| Net assets | ||||||||||||||||||||||||||||||||||||||||||||||||
| Beginning of period | 8,288,257,349 | 5,700,861,990 | ||||||||||||||||||||||||||||||||||||||||||||||
| End of period | $9,092,032,877 | $8,288,257,349 | ||||||||||||||||||||||||||||||||||||||||||||||
| Undistributed (accumulated distributions in excess of) net investment income | ($76,793,952 | ) | $497,831,231 | |||||||||||||||||||||||||||||||||||||||||||||
Financial highlights
| Class A Shares Period ended | 1-31-16 | 1 | 7-31-15 | 7-31-14 | 7-31-13 | 7-31-12 | 2 | ||||||||||||||||||||||||||||||||||||||||||||||||||||||||||||||||||||||||||||||||||||||||||||||||
| Per share operating performance | |||||||||||||||||||||||||||||||||||||||||||||||||||||||||||||||||||||||||||||||||||||||||||||||||||||||
| Net asset value, beginning of period | $11.27 | $11.25 | $10.84 | $10.59 | $10.00 | ||||||||||||||||||||||||||||||||||||||||||||||||||||||||||||||||||||||||||||||||||||||||||||||||||
| Net investment income (loss)3 | (0.01 | ) | 0.03 | 0.03 | 0.02 | — | 4 | ||||||||||||||||||||||||||||||||||||||||||||||||||||||||||||||||||||||||||||||||||||||||||||||||
| Net realized and unrealized gain (loss) on investments | (0.33 | ) | 0.53 | 0.50 | 0.33 | 0.59 | |||||||||||||||||||||||||||||||||||||||||||||||||||||||||||||||||||||||||||||||||||||||||||||||||
| Total from investment operations | (0.34 | ) | 0.56 | 0.53 | 0.35 | 0.59 | |||||||||||||||||||||||||||||||||||||||||||||||||||||||||||||||||||||||||||||||||||||||||||||||||
| Less distributions | |||||||||||||||||||||||||||||||||||||||||||||||||||||||||||||||||||||||||||||||||||||||||||||||||||||||
| From net investment income | (0.68 | ) | (0.54 | ) | (0.12 | ) | (0.03 | ) | — | ||||||||||||||||||||||||||||||||||||||||||||||||||||||||||||||||||||||||||||||||||||||||||||||
| From net realized gain | — | — | — | (0.07 | ) | — | |||||||||||||||||||||||||||||||||||||||||||||||||||||||||||||||||||||||||||||||||||||||||||||||||
| Total distributions | (0.68 | ) | (0.54 | ) | (0.12 | ) | (0.10 | ) | — | ||||||||||||||||||||||||||||||||||||||||||||||||||||||||||||||||||||||||||||||||||||||||||||||
| Net asset value, end of period | $10.25 | $11.27 | $11.25 | $10.84 | $10.59 | ||||||||||||||||||||||||||||||||||||||||||||||||||||||||||||||||||||||||||||||||||||||||||||||||||
| Total return (%)5,6 | (3.06 | ) 7 | 5.15 | 4.94 | 3.28 | 5.90 | 7 | ||||||||||||||||||||||||||||||||||||||||||||||||||||||||||||||||||||||||||||||||||||||||||||||||
| Ratios and supplemental data | |||||||||||||||||||||||||||||||||||||||||||||||||||||||||||||||||||||||||||||||||||||||||||||||||||||||
| Net assets, end of period (in millions) | $1,284 | $1,080 | $971 | $1,161 | $175 | ||||||||||||||||||||||||||||||||||||||||||||||||||||||||||||||||||||||||||||||||||||||||||||||||||
| Ratios (as a percentage of average net assets): | |||||||||||||||||||||||||||||||||||||||||||||||||||||||||||||||||||||||||||||||||||||||||||||||||||||||
| Expenses before reductions | 1.63 | 8 | 1.67 | 1.72 | 1.80 | 1.97 | 8 | ||||||||||||||||||||||||||||||||||||||||||||||||||||||||||||||||||||||||||||||||||||||||||||||||
| Expenses including reductions | 1.61 | 8 | 1.66 | 1.71 | 1.80 | 1.95 | 8 | ||||||||||||||||||||||||||||||||||||||||||||||||||||||||||||||||||||||||||||||||||||||||||||||||
| Net investment income (loss) | (0.19 | ) 8 | 0.23 | 0.27 | 0.18 | (0.01 | ) 8 | ||||||||||||||||||||||||||||||||||||||||||||||||||||||||||||||||||||||||||||||||||||||||||||||||
| Portfolio turnover (%) | 37 | 80 | 56 | 106 | 33 | ||||||||||||||||||||||||||||||||||||||||||||||||||||||||||||||||||||||||||||||||||||||||||||||||||
| 1 | Six months ended 1-31-16. Unaudited. | ||||||||||||||||||||||||||||||||||||||||||||||||||||||||||||||||||||||||||||||||||
| 2 | Period from 12-19-11 (commencement of operations) to 7-31-12. | ||||||||||||||||||||||||||||||||||||||||||||||||||||||||||||||||||||||||||||||||||
| 3 | Based on average daily shares outstanding. | ||||||||||||||||||||||||||||||||||||||||||||||||||||||||||||||||||||||||||||||||||
| 4 | Less than $0.005 per share. | ||||||||||||||||||||||||||||||||||||||||||||||||||||||||||||||||||||||||||||||||||
| 5 | Does not reflect the effect of sales charges, if any. | ||||||||||||||||||||||||||||||||||||||||||||||||||||||||||||||||||||||||||||||||||
| 6 | Total returns would have been lower had certain expenses not been reduced during the applicable periods. | ||||||||||||||||||||||||||||||||||||||||||||||||||||||||||||||||||||||||||||||||||
| 7 | Not annualized. | ||||||||||||||||||||||||||||||||||||||||||||||||||||||||||||||||||||||||||||||||||
| 8 | Annualized. | ||||||||||||||||||||||||||||||||||||||||||||||||||||||||||||||||||||||||||||||||||
| Class C Shares Period ended | 1-31-16 | 1 | 7-31-15 | 7-31-14 | 7-31-13 | 2 | ||||||||||||||||||||||||||||||||||||||||||||||||||||||||||||||||||||||||||||||||||
| Per share operating performance | ||||||||||||||||||||||||||||||||||||||||||||||||||||||||||||||||||||||||||||||||||||||||
| Net asset value, beginning of period | $11.23 | $11.21 | $10.80 | $10.61 | ||||||||||||||||||||||||||||||||||||||||||||||||||||||||||||||||||||||||||||||||||||
| Net investment loss3 | (0.05 | ) | (0.05 | ) | (0.05 | ) | (0.06 | ) | ||||||||||||||||||||||||||||||||||||||||||||||||||||||||||||||||||||||||||||||||
| Net realized and unrealized gain (loss) on investments | (0.32 | ) | 0.53 | 0.51 | 0.32 | |||||||||||||||||||||||||||||||||||||||||||||||||||||||||||||||||||||||||||||||||||
| Total from investment operations | (0.37 | ) | 0.48 | 0.46 | 0.26 | |||||||||||||||||||||||||||||||||||||||||||||||||||||||||||||||||||||||||||||||||||
| Less distributions | ||||||||||||||||||||||||||||||||||||||||||||||||||||||||||||||||||||||||||||||||||||||||
| From net investment income | (0.61 | ) | (0.46 | ) | (0.05 | ) | — | |||||||||||||||||||||||||||||||||||||||||||||||||||||||||||||||||||||||||||||||||
| From net realized gain | — | — | — | (0.07 | ) | |||||||||||||||||||||||||||||||||||||||||||||||||||||||||||||||||||||||||||||||||||
| Total distributions | (0.61 | ) | (0.46 | ) | (0.05 | ) | (0.07 | ) | ||||||||||||||||||||||||||||||||||||||||||||||||||||||||||||||||||||||||||||||||
| Net asset value, end of period | $10.25 | $11.23 | $11.21 | $10.80 | ||||||||||||||||||||||||||||||||||||||||||||||||||||||||||||||||||||||||||||||||||||
| Total return (%)4,5 | (3.40 | ) 6 | 4.43 | 4.24 | 2.50 | |||||||||||||||||||||||||||||||||||||||||||||||||||||||||||||||||||||||||||||||||||
| Ratios and supplemental data | ||||||||||||||||||||||||||||||||||||||||||||||||||||||||||||||||||||||||||||||||||||||||
| Net assets, end of period (in millions) | $342 | $293 | $203 | $146 | ||||||||||||||||||||||||||||||||||||||||||||||||||||||||||||||||||||||||||||||||||||
| Ratios (as a percentage of average net assets): | ||||||||||||||||||||||||||||||||||||||||||||||||||||||||||||||||||||||||||||||||||||||||
| Expenses before reductions | 2.33 | 7 | 2.37 | 2.42 | 2.53 | |||||||||||||||||||||||||||||||||||||||||||||||||||||||||||||||||||||||||||||||||||
| Expenses including reductions | 2.31 | 7 | 2.36 | 2.41 | 2.52 | |||||||||||||||||||||||||||||||||||||||||||||||||||||||||||||||||||||||||||||||||||
| Net investment loss | (0.90 | ) 7 | (0.45 | ) | (0.43 | ) | (0.55 | ) | ||||||||||||||||||||||||||||||||||||||||||||||||||||||||||||||||||||||||||||||||
| Portfolio turnover (%) | 37 | 80 | 56 | 106 | ||||||||||||||||||||||||||||||||||||||||||||||||||||||||||||||||||||||||||||||||||||
| 1 | Six months ended 1-31-16. Unaudited. | ||||||||||||||||||||||||||||||||||||||||||||||||||||||||||||||||||||||||||||||||||
| 2 | The inception date for Class C shares is 8-1-12. | ||||||||||||||||||||||||||||||||||||||||||||||||||||||||||||||||||||||||||||||||||
| 3 | Based on average daily shares outstanding. | ||||||||||||||||||||||||||||||||||||||||||||||||||||||||||||||||||||||||||||||||||
| 4 | Does not reflect the effect of sales charges, if any. | ||||||||||||||||||||||||||||||||||||||||||||||||||||||||||||||||||||||||||||||||||
| 5 | Total returns would have been lower had certain expenses not been reduced during the applicable periods. | ||||||||||||||||||||||||||||||||||||||||||||||||||||||||||||||||||||||||||||||||||
| 6 | Not annualized. | ||||||||||||||||||||||||||||||||||||||||||||||||||||||||||||||||||||||||||||||||||
| 7 | Annualized. | ||||||||||||||||||||||||||||||||||||||||||||||||||||||||||||||||||||||||||||||||||
| Class I Shares Period ended | 1-31-16 | 1 | 7-31-15 | 7-31-14 | 7-31-13 | 7-31-12 | 2 | ||||||||||||||||||||||||||||||||||||||||||||||||||||||||||||||||||||||||||||||||||||||||||||||||
| Per share operating performance | |||||||||||||||||||||||||||||||||||||||||||||||||||||||||||||||||||||||||||||||||||||||||||||||||||||||
| Net asset value, beginning of period | $11.30 | $11.29 | $10.87 | $10.62 | $10.00 | ||||||||||||||||||||||||||||||||||||||||||||||||||||||||||||||||||||||||||||||||||||||||||||||||||
| Net investment income3 | 0.01 | 0.06 | 0.07 | 0.06 | 0.04 | ||||||||||||||||||||||||||||||||||||||||||||||||||||||||||||||||||||||||||||||||||||||||||||||||||
| Net realized and unrealized gain (loss) on investments | (0.32 | ) | 0.53 | 0.51 | 0.33 | 0.58 | |||||||||||||||||||||||||||||||||||||||||||||||||||||||||||||||||||||||||||||||||||||||||||||||||
| Total from investment operations | (0.31 | ) | 0.59 | 0.58 | 0.39 | 0.62 | |||||||||||||||||||||||||||||||||||||||||||||||||||||||||||||||||||||||||||||||||||||||||||||||||
| Less distributions | |||||||||||||||||||||||||||||||||||||||||||||||||||||||||||||||||||||||||||||||||||||||||||||||||||||||
| From net investment income | (0.72 | ) | (0.58 | ) | (0.16 | ) | (0.07 | ) | — | ||||||||||||||||||||||||||||||||||||||||||||||||||||||||||||||||||||||||||||||||||||||||||||||
| From net realized gain | — | — | — | (0.07 | ) | — | |||||||||||||||||||||||||||||||||||||||||||||||||||||||||||||||||||||||||||||||||||||||||||||||||
| Total distributions | (0.72 | ) | (0.58 | ) | (0.16 | ) | (0.14 | ) | — | ||||||||||||||||||||||||||||||||||||||||||||||||||||||||||||||||||||||||||||||||||||||||||||||
| Net asset value, end of period | $10.27 | $11.30 | $11.29 | $10.87 | $10.62 | ||||||||||||||||||||||||||||||||||||||||||||||||||||||||||||||||||||||||||||||||||||||||||||||||||
| Total return (%)4 | (2.83 | ) 5 | 5.38 | 5.37 | 3.65 | 6.20 | 5 | ||||||||||||||||||||||||||||||||||||||||||||||||||||||||||||||||||||||||||||||||||||||||||||||||
| Ratios and supplemental data | |||||||||||||||||||||||||||||||||||||||||||||||||||||||||||||||||||||||||||||||||||||||||||||||||||||||
| Net assets, end of period (in millions) | $5,660 | $5,093 | $3,495 | $1,740 | $167 | ||||||||||||||||||||||||||||||||||||||||||||||||||||||||||||||||||||||||||||||||||||||||||||||||||
| Ratios (as a percentage of average net assets): | |||||||||||||||||||||||||||||||||||||||||||||||||||||||||||||||||||||||||||||||||||||||||||||||||||||||
| Expenses before reductions | 1.31 | 6 | 1.36 | 1.39 | 1.43 | 1.60 | 6 | ||||||||||||||||||||||||||||||||||||||||||||||||||||||||||||||||||||||||||||||||||||||||||||||||
| Expenses including reductions | 1.30 | 6 | 1.34 | 1.38 | 1.42 | 1.59 | 6 | ||||||||||||||||||||||||||||||||||||||||||||||||||||||||||||||||||||||||||||||||||||||||||||||||
| Net investment income | 0.12 | 6 | 0.56 | 0.63 | 0.58 | 0.58 | 6 | ||||||||||||||||||||||||||||||||||||||||||||||||||||||||||||||||||||||||||||||||||||||||||||||||
| Portfolio turnover (%) | 37 | 80 | 56 | 106 | 33 | ||||||||||||||||||||||||||||||||||||||||||||||||||||||||||||||||||||||||||||||||||||||||||||||||||
| 1 | Six months ended 1-31-16. Unaudited. | ||||||||||||||||||||||||||||||||||||||||||||||||||||||||||||||||||||||||||||||||||
| 2 | Period from 12-19-11 (commencement of operations) to 7-31-12. | ||||||||||||||||||||||||||||||||||||||||||||||||||||||||||||||||||||||||||||||||||
| 3 | Based on average daily shares outstanding. | ||||||||||||||||||||||||||||||||||||||||||||||||||||||||||||||||||||||||||||||||||
| 4 | Total returns would have been lower had certain expenses not been reduced during the applicable periods. | ||||||||||||||||||||||||||||||||||||||||||||||||||||||||||||||||||||||||||||||||||
| 5 | Not annualized. | ||||||||||||||||||||||||||||||||||||||||||||||||||||||||||||||||||||||||||||||||||
| 6 | Annualized. | ||||||||||||||||||||||||||||||||||||||||||||||||||||||||||||||||||||||||||||||||||
| Class R2 Shares Period ended | 1-31-16 | 1 | 7-31-15 | 7-31-14 | 7-31-13 | 7-31-12 | 2 | ||||||||||||||||||||||||||||||||||||||||||||||||||||||||||||||||||||||||||||||||||||||||||||||||
| Per share operating performance | |||||||||||||||||||||||||||||||||||||||||||||||||||||||||||||||||||||||||||||||||||||||||||||||||||||||
| Net asset value, beginning of period | $11.25 | $11.24 | $10.83 | $10.58 | $10.67 | ||||||||||||||||||||||||||||||||||||||||||||||||||||||||||||||||||||||||||||||||||||||||||||||||||
| Net investment income (loss)3 | (0.02 | ) | (0.01 | ) | — | 4 | — | 4 | 0.01 | ||||||||||||||||||||||||||||||||||||||||||||||||||||||||||||||||||||||||||||||||||||||||||||||
| Net realized and unrealized gain (loss) on investments | (0.31 | ) | 0.53 | 0.50 | 0.32 | (0.10 | ) | ||||||||||||||||||||||||||||||||||||||||||||||||||||||||||||||||||||||||||||||||||||||||||||||||
| Total from investment operations | (0.33 | ) | 0.52 | 0.50 | 0.32 | (0.09 | ) | ||||||||||||||||||||||||||||||||||||||||||||||||||||||||||||||||||||||||||||||||||||||||||||||||
| Less distributions | |||||||||||||||||||||||||||||||||||||||||||||||||||||||||||||||||||||||||||||||||||||||||||||||||||||||
| From net investment income | (0.68 | ) | (0.51 | ) | (0.09 | ) | — | — | |||||||||||||||||||||||||||||||||||||||||||||||||||||||||||||||||||||||||||||||||||||||||||||||
| From net realized gain | — | — | — | (0.07 | ) | — | |||||||||||||||||||||||||||||||||||||||||||||||||||||||||||||||||||||||||||||||||||||||||||||||||
| Total distributions | (0.68 | ) | (0.51 | ) | (0.09 | ) | (0.07 | ) | — | ||||||||||||||||||||||||||||||||||||||||||||||||||||||||||||||||||||||||||||||||||||||||||||||
| Net asset value, end of period | $10.24 | $11.25 | $11.24 | $10.83 | $10.58 | ||||||||||||||||||||||||||||||||||||||||||||||||||||||||||||||||||||||||||||||||||||||||||||||||||
| Total return (%)5 | (3.05 | ) 6 | 4.75 | 4.67 | 3.08 | (0.84 | ) 6 | ||||||||||||||||||||||||||||||||||||||||||||||||||||||||||||||||||||||||||||||||||||||||||||||||
| Ratios and supplemental data | |||||||||||||||||||||||||||||||||||||||||||||||||||||||||||||||||||||||||||||||||||||||||||||||||||||||
| Net assets, end of period (in millions) | $7 | $5 | $1 | $1 | — | 7 | |||||||||||||||||||||||||||||||||||||||||||||||||||||||||||||||||||||||||||||||||||||||||||||||||
| Ratios (as a percentage of average net assets): | |||||||||||||||||||||||||||||||||||||||||||||||||||||||||||||||||||||||||||||||||||||||||||||||||||||||
| Expenses before reductions | 1.71 | 8 | 1.99 | 2.85 | 8.88 | 18.31 | 8 | ||||||||||||||||||||||||||||||||||||||||||||||||||||||||||||||||||||||||||||||||||||||||||||||||
| Expenses including reductions | 1.70 | 8 | 1.97 | 2.00 | 2.00 | 2.00 | 8 | ||||||||||||||||||||||||||||||||||||||||||||||||||||||||||||||||||||||||||||||||||||||||||||||||
| Net investment income (loss) | (0.29 | ) 8 | (0.06 | ) | 0.02 | (0.01 | ) | 0.19 | 8 | ||||||||||||||||||||||||||||||||||||||||||||||||||||||||||||||||||||||||||||||||||||||||||||||
| Portfolio turnover (%) | 37 | 80 | 56 | 106 | 33 | ||||||||||||||||||||||||||||||||||||||||||||||||||||||||||||||||||||||||||||||||||||||||||||||||||
| 1 | Six months ended 1-31-16. Unaudited. | ||||||||||||||||||||||||||||||||||||||||||||||||||||||||||||||||||||||||||||||||||
| 2 | The inception date for Class R2 shares is 3-1-12. | ||||||||||||||||||||||||||||||||||||||||||||||||||||||||||||||||||||||||||||||||||
| 3 | Based on average daily shares outstanding. | ||||||||||||||||||||||||||||||||||||||||||||||||||||||||||||||||||||||||||||||||||
| 4 | Less than $0.005 per share. | ||||||||||||||||||||||||||||||||||||||||||||||||||||||||||||||||||||||||||||||||||
| 5 | Total returns would have been lower had certain expenses not been reduced during the applicable periods. | ||||||||||||||||||||||||||||||||||||||||||||||||||||||||||||||||||||||||||||||||||
| 6 | Not annualized. | ||||||||||||||||||||||||||||||||||||||||||||||||||||||||||||||||||||||||||||||||||
| 7 | Less than $500,000. | ||||||||||||||||||||||||||||||||||||||||||||||||||||||||||||||||||||||||||||||||||
| 8 | Annualized. | ||||||||||||||||||||||||||||||||||||||||||||||||||||||||||||||||||||||||||||||||||
| Class R6 Shares Period ended | 1-31-16 | 1 | 7-31-15 | 7-31-14 | 7-31-13 | 7-31-12 | 2 | ||||||||||||||||||||||||||||||||||||||||||||||||||||||||||||||||||||||||||||||||||||||||||||||||
| Per share operating performance | |||||||||||||||||||||||||||||||||||||||||||||||||||||||||||||||||||||||||||||||||||||||||||||||||||||||
| Net asset value, beginning of period | $11.30 | $11.29 | $10.86 | $10.60 | $10.67 | ||||||||||||||||||||||||||||||||||||||||||||||||||||||||||||||||||||||||||||||||||||||||||||||||||
| Net investment income3 | 0.01 | 0.09 | 0.09 | 0.05 | 0.03 | ||||||||||||||||||||||||||||||||||||||||||||||||||||||||||||||||||||||||||||||||||||||||||||||||||
| Net realized and unrealized gain (loss) on investments | (0.32 | ) | 0.51 | 0.50 | 0.34 | (0.10 | ) | ||||||||||||||||||||||||||||||||||||||||||||||||||||||||||||||||||||||||||||||||||||||||||||||||
| Total from investment operations | (0.31 | ) | 0.60 | 0.59 | 0.39 | (0.07 | ) | ||||||||||||||||||||||||||||||||||||||||||||||||||||||||||||||||||||||||||||||||||||||||||||||||
| Less distributions | |||||||||||||||||||||||||||||||||||||||||||||||||||||||||||||||||||||||||||||||||||||||||||||||||||||||
| From net investment income | (0.73 | ) | (0.59 | ) | (0.16 | ) | (0.06 | ) | — | ||||||||||||||||||||||||||||||||||||||||||||||||||||||||||||||||||||||||||||||||||||||||||||||
| From net realized gain | — | — | — | (0.07 | ) | — | |||||||||||||||||||||||||||||||||||||||||||||||||||||||||||||||||||||||||||||||||||||||||||||||||
| Total distributions | (0.73 | ) | (0.59 | ) | (0.16 | ) | (0.13 | ) | — | ||||||||||||||||||||||||||||||||||||||||||||||||||||||||||||||||||||||||||||||||||||||||||||||
| Net asset value, end of period | $10.26 | $11.30 | $11.29 | $10.86 | $10.60 | ||||||||||||||||||||||||||||||||||||||||||||||||||||||||||||||||||||||||||||||||||||||||||||||||||
| Total return (%)4 | (2.81 | ) 5 | 5.51 | 5.44 | 3.66 | (0.66 | ) 5 | ||||||||||||||||||||||||||||||||||||||||||||||||||||||||||||||||||||||||||||||||||||||||||||||||
| Ratios and supplemental data | |||||||||||||||||||||||||||||||||||||||||||||||||||||||||||||||||||||||||||||||||||||||||||||||||||||||
| Net assets, end of period (in millions) | $626 | $557 | $196 | $39 | — | 6 | |||||||||||||||||||||||||||||||||||||||||||||||||||||||||||||||||||||||||||||||||||||||||||||||||
| Ratios (as a percentage of average net assets): | |||||||||||||||||||||||||||||||||||||||||||||||||||||||||||||||||||||||||||||||||||||||||||||||||||||||
| Expenses before reductions | 1.22 | 7 | 1.26 | 1.33 | 1.51 | 18.04 | 7 | ||||||||||||||||||||||||||||||||||||||||||||||||||||||||||||||||||||||||||||||||||||||||||||||||
| Expenses including reductions | 1.19 | 7 | 1.23 | 1.28 | 1.50 | 1.50 | 7 | ||||||||||||||||||||||||||||||||||||||||||||||||||||||||||||||||||||||||||||||||||||||||||||||||
| Net investment income | 0.23 | 7 | 0.77 | 0.78 | 0.51 | 0.69 | 7 | ||||||||||||||||||||||||||||||||||||||||||||||||||||||||||||||||||||||||||||||||||||||||||||||||
| Portfolio turnover (%) | 37 | 80 | 56 | 106 | 33 | ||||||||||||||||||||||||||||||||||||||||||||||||||||||||||||||||||||||||||||||||||||||||||||||||||
| 1 | Six months ended 1-31-16. Unaudited. | ||||||||||||||||||||||||||||||||||||||||||||||||||||||||||||||||||||||||||||||||||
| 2 | The inception date for Class R6 shares is 3-1-12. | ||||||||||||||||||||||||||||||||||||||||||||||||||||||||||||||||||||||||||||||||||
| 3 | Based on average daily shares outstanding. | ||||||||||||||||||||||||||||||||||||||||||||||||||||||||||||||||||||||||||||||||||
| 4 | Total returns would have been lower had certain expenses not been reduced during the applicable periods. | ||||||||||||||||||||||||||||||||||||||||||||||||||||||||||||||||||||||||||||||||||
| 5 | Not annualized. | ||||||||||||||||||||||||||||||||||||||||||||||||||||||||||||||||||||||||||||||||||
| 6 | Less than $500,000. | ||||||||||||||||||||||||||||||||||||||||||||||||||||||||||||||||||||||||||||||||||
| 7 | Annualized. | ||||||||||||||||||||||||||||||||||||||||||||||||||||||||||||||||||||||||||||||||||
| Class NAV Shares Period ended | 1-31-16 | 1 | 7-31-15 | 7-31-14 | 7-31-13 | 7-31-12 | 2 | ||||||||||||||||||||||||||||||||||||||||||||||||||||||||||||||||||||||||||||||||||||||||||||||||
| Per share operating performance | |||||||||||||||||||||||||||||||||||||||||||||||||||||||||||||||||||||||||||||||||||||||||||||||||||||||
| Net asset value, beginning of period | $11.29 | $11.28 | $10.86 | $10.61 | $10.00 | ||||||||||||||||||||||||||||||||||||||||||||||||||||||||||||||||||||||||||||||||||||||||||||||||||
| Net investment income3 | 0.01 | 0.08 | 0.08 | 0.08 | 0.04 | ||||||||||||||||||||||||||||||||||||||||||||||||||||||||||||||||||||||||||||||||||||||||||||||||||
| Net realized and unrealized gain (loss) on investments | (0.32 | ) | 0.52 | 0.51 | 0.32 | 0.57 | |||||||||||||||||||||||||||||||||||||||||||||||||||||||||||||||||||||||||||||||||||||||||||||||||
| Total from investment operations | (0.31 | ) | 0.60 | 0.59 | 0.40 | 0.61 | |||||||||||||||||||||||||||||||||||||||||||||||||||||||||||||||||||||||||||||||||||||||||||||||||
| Less distributions | |||||||||||||||||||||||||||||||||||||||||||||||||||||||||||||||||||||||||||||||||||||||||||||||||||||||
| From net investment income | (0.73 | ) | (0.59 | ) | (0.17 | ) | (0.08 | ) | — | ||||||||||||||||||||||||||||||||||||||||||||||||||||||||||||||||||||||||||||||||||||||||||||||
| From net realized gain | — | — | — | (0.07 | ) | — | |||||||||||||||||||||||||||||||||||||||||||||||||||||||||||||||||||||||||||||||||||||||||||||||||
| Total distributions | (0.73 | ) | (0.59 | ) | (0.17 | ) | (0.15 | ) | — | ||||||||||||||||||||||||||||||||||||||||||||||||||||||||||||||||||||||||||||||||||||||||||||||
| Net asset value, end of period | $10.25 | $11.29 | $11.28 | $10.86 | $10.61 | ||||||||||||||||||||||||||||||||||||||||||||||||||||||||||||||||||||||||||||||||||||||||||||||||||
| Total return (%)4 | (2.81 | ) 5 | 5.51 | 5.50 | 3.78 | 6.10 | 5 | ||||||||||||||||||||||||||||||||||||||||||||||||||||||||||||||||||||||||||||||||||||||||||||||||
| Ratios and supplemental data | |||||||||||||||||||||||||||||||||||||||||||||||||||||||||||||||||||||||||||||||||||||||||||||||||||||||
| Net assets, end of period (in millions) | $1,172 | $1,260 | $835 | $673 | $497 | ||||||||||||||||||||||||||||||||||||||||||||||||||||||||||||||||||||||||||||||||||||||||||||||||||
| Ratios (as a percentage of average net assets): | |||||||||||||||||||||||||||||||||||||||||||||||||||||||||||||||||||||||||||||||||||||||||||||||||||||||
| Expenses before reductions | 1.20 | 6 | 1.24 | 1.26 | 1.29 | 1.43 | 6 | ||||||||||||||||||||||||||||||||||||||||||||||||||||||||||||||||||||||||||||||||||||||||||||||||
| Expenses including reductions | 1.19 | 6 | 1.23 | 1.26 | 1.29 | 1.43 | 6 | ||||||||||||||||||||||||||||||||||||||||||||||||||||||||||||||||||||||||||||||||||||||||||||||||
| Net investment income | 0.23 | 6 | 0.68 | 0.72 | 0.73 | 0.69 | 6 | ||||||||||||||||||||||||||||||||||||||||||||||||||||||||||||||||||||||||||||||||||||||||||||||||
| Portfolio turnover (%) | 37 | 80 | 56 | 106 | 33 | ||||||||||||||||||||||||||||||||||||||||||||||||||||||||||||||||||||||||||||||||||||||||||||||||||
| 1 | Six months ended 1-31-16. Unaudited. | ||||||||||||||||||||||||||||||||||||||||||||||||||||||||||||||||||||||||||||||||||
| 2 | Period from 12-19-11 (commencement of operations) to 7-31-12. | ||||||||||||||||||||||||||||||||||||||||||||||||||||||||||||||||||||||||||||||||||
| 3 | Based on average daily shares outstanding. | ||||||||||||||||||||||||||||||||||||||||||||||||||||||||||||||||||||||||||||||||||
| 4 | Total returns would have been lower had certain expenses not been reduced during the applicable periods. | ||||||||||||||||||||||||||||||||||||||||||||||||||||||||||||||||||||||||||||||||||
| 5 | Not annualized. | ||||||||||||||||||||||||||||||||||||||||||||||||||||||||||||||||||||||||||||||||||
| 6 | Annualized. | ||||||||||||||||||||||||||||||||||||||||||||||||||||||||||||||||||||||||||||||||||
Note 1 — Organization
John Hancock Global Absolute Return Strategies Fund (the fund) is a series of John Hancock Funds II (the Trust), an open-end management investment company organized as a Massachusetts business trust and registered under the Investment Company Act of 1940, as amended (the 1940 Act). The investment objective of the fund is to seek long-term total return.
The fund may offer multiple classes of shares. The shares currently offered are detailed in the Statement of assets and liabilities. Class A and Class C shares are offered to all investors. Class I shares are offered to institutions and certain investors. Class R2 shares are available only to certain retirement plans. Class R6 shares are available only to certain retirement plans, institutions and other investors. Class NAV shares are offered to John Hancock affiliated funds of funds and certain 529 plans. Shareholders of each class have exclusive voting rights to matters that affect that class. The distribution and service fees, if any, and transfer agent fees, for each class may differ.
Note 2 — Significant accounting policies
The financial statements have been prepared in conformity with accounting principles generally accepted in the United States of America (US GAAP), which require management to make certain estimates and assumptions as of the date of the financial statements. Actual results could differ from those estimates and those differences could be significant. The fund qualifies as an investment company under Topic 946 of Accounting Standards Codification of US GAAP.
Events or transactions occurring after the end of the fiscal period through the date that the financial statements were issued have been evaluated in the preparation of the financial statements. The following summarizes the significant accounting policies of the fund:
Security valuation. Investments are stated at value as of the close of regular trading on the New York Stock Exchange (NYSE), normally at 4:00 p.m., Eastern Time. In order to value the securities, the fund uses the following valuation techniques: Debt obligations are valued based on the evaluated prices provided by an independent pricing vendor or from broker-dealers. Independent pricing vendors utilize matrix pricing which takes into account factors such as institutional-size trading in similar groups of securities, yield, quality, coupon rate, maturity, type of issue, trading characteristics and other market data, as well as broker supplied prices. Equity securities held by the fund are valued at the last sale price or official closing price on the exchange or principal market where the security was acquired or most likely will be sold. In the event there were no sales during the day or closing prices are not available, the securities are valued using the last available bid price. Options listed on an exchange are valued at the mean of the most recent bid and ask prices from the exchange where the option was acquired or most likely will be sold. Swaps and unlisted options are valued using evaluated prices obtained from an independent pricing vendor. Futures contracts are valued at settlement prices, which are the official closing prices published by the exchange on which they trade. Foreign index futures that trade in the electronic trading market subsequent to the close of regular trading and have sufficient liquidity will be valued at the last traded price in the electronic trading market as of 4:00 p.m ET. Foreign securities and currencies, including forward foreign currency contracts, are valued in U.S. dollars, based on foreign currency exchange rates supplied by an independent pricing vendor. Securities that trade only in the over-the-counter (OTC) market are valued using bid prices.
Other portfolio securities and assets, for which reliable market quotations are not readily available, are valued at fair value as determined in good faith by the fund's Pricing Committee following procedures established by the Board of Trustees. The frequency with which these fair valuation procedures are used cannot be predicted and fair value of securities may differ significantly from the value that would have been used had a ready market for such securities existed. Trading in foreign securities may be completed before the daily close of trading on the NYSE. Significant events at the issuer or market level may affect the values of securities between the time when the valuation of the securities is generally determined and the close of the NYSE. If a significant event occurs, these securities may be fair valued, as determined in good faith by the fund's Pricing Committee, following procedures established by the Board of Trustees. The fund uses fair value adjustment factors provided by an independent pricing vendor to value certain foreign securities in order to adjust for events that may occur between the close of foreign exchanges or markets and the close of the NYSE.
The fund uses a three-tier hierarchy to prioritize the pricing assumptions, referred to as inputs, used in valuation techniques to measure fair value. Level 1 includes securities valued using quoted prices in active markets for identical securities. Level 2 includes securities valued using other significant observable inputs. Observable inputs may include quoted prices for similar securities, interest rates, prepayment speeds and credit risk. Prices for securities valued using these inputs are received from independent pricing vendors and brokers and are based on an evaluation of the inputs described. Level 3 includes securities valued using significant unobservable inputs when market prices are not readily available or reliable, including the fund's own assumptions in determining the fair value of investments. Factors used in determining value may include market or issuer specific events or trends, changes in interest rates and credit quality. The inputs or methodology used for valuing securities are not necessarily an indication of the risks associated with investing in those securities. Changes in valuation techniques and related inputs may result in transfers into or out of an assigned level within the disclosure hierarchy.
The following is a summary of the values by input classification of the fund's investments as of January 31, 2016, by major security category or type:
| Total value at 1-31-16 |
Level 1 quoted price |
Level 2 significant observable inputs |
Level 3 significant unobservable inputs |
|||||||||||
| Corporate bonds | $1,072,444,400 | — | $1,072,444,400 | — | ||||||||||
| Capital preferred securities | 1,557,134 | — | 1,557,134 | — | ||||||||||
| Foreign government obligations | 482,675,049 | — | 482,675,049 | — | ||||||||||
| Common stocks | 2,218,837,444 | $744,846,877 | 1,473,072,077 | $918,490 | ||||||||||
| Rights | 106,785 | 106,785 | — | — | ||||||||||
| Purchased options | 99,446,884 | 75,467,124 | 23,979,760 | — | ||||||||||
| Short-term investments | 4,950,169,907 | 55,478,642 | 4,894,691,265 | — | ||||||||||
| Total investments in securities | $8,825,237,603 | $875,899,428 | $7,948,419,685 | $918,490 | ||||||||||
| Other financial instruments: | ||||||||||||||
| Futures | $2,225,390 | $2,225,390 | — | — | ||||||||||
| Forward foreign currency contracts | (37,101,290 | ) | — | ($37,101,290 | ) | — | ||||||||
| Written options | (1,175,507 | ) | — | (1,175,507 | ) | — | ||||||||
| Interest rate swaps | (54,216,350 | ) | — | (54,216,350 | ) | — | ||||||||
| Credit default swaps | 7,271,522 | — | 7,271,522 | — | ||||||||||
| Total return swaps | 62,800,453 | — | 62,800,453 | — | ||||||||||
| Variance swaps | 6,394,069 | — | 6,394,069 | — |
Security transactions and related investment income. Investment security transactions are accounted for on a trade date plus one basis for daily net asset value calculations. However, for financial reporting purposes, investment transactions are reported on trade date. Interest income is accrued as earned. Interest income includes coupon interest and amortization/accretion of premiums/discounts on debt securities. Debt obligations may be placed in a non-accrual status and related interest income may be reduced by stopping current accruals and writing off interest receivable when the collection of all or a portion of interest has become doubtful. Dividend income is recorded on the ex-date, except for dividends of foreign securities where the dividend may not be known until after the ex-date. In those cases, dividend income, net of withholding taxes, is recorded when the fund becomes aware of the dividends. Foreign taxes are provided for based on the fund's understanding of the tax rules and rates that exist in the foreign markets in which it invests. Gains and losses on securities sold are determined on the basis of identified cost and may include proceeds from litigation.
Foreign currency translation. Assets, including investments and liabilities denominated in foreign currencies, are translated into U.S. dollar values each day at the prevailing exchange rate. Purchases and sales of securities, income and expenses are translated into U.S. dollars at the prevailing exchange rate on the date of the transaction. The effect of changes in foreign currency exchange rates on the value of securities is reflected as a component of the realized and unrealized gains (losses) on investments.
Funds that invest internationally generally carry more risk than funds that invest strictly in U.S. securities. These risks are heightened for investments in emerging markets. Risks can result from differences in economic and political conditions, regulations, market practices (including higher transaction costs), accounting standards and other factors. Foreign investments are also subject to a decline in the value of a foreign currency versus the U.S. dollar, which reduces the dollar value of securities denominated in that currency.
Foreign taxes. The fund may be subject to withholding tax on income and/or capital gains or repatriation taxes imposed by certain countries in which the fund invests. Taxes are accrued based upon investment income, realized gains or unrealized appreciation.
Line of credit. The fund may borrow from banks for temporary or emergency purposes, including meeting redemption requests that otherwise might require the untimely sale of securities. Pursuant to the fund's custodian agreement, the custodian may loan money to the fund to make properly authorized payments. The fund is obligated to repay the custodian for any overdraft, including any related costs or expenses. The custodian may have a lien, security interest or security entitlement in any fund property that is not otherwise segregated or pledged, to the extent of any overdraft, and to the maximum extent permitted by law.
The fund and other affiliated funds have a syndicated line of credit agreement, with Citibank, N.A. (Citibank) as the administrative agent, that enables them to participate in a $750 million unsecured committed line of credit. A commitment fee, payable at the end of each calendar quarter, based on the average daily unused portion of the effective line of credit, is charged to each participating fund on a pro rata basis and is reflected in Other expenses on the Statement of operations. Commitment fees for the six months ended were $2,439. For the six months ended January 31, 2016, the fund had no borrowings under the line of credit.
Expenses. Within the John Hancock group of funds complex, expenses that are directly attributable to an individual fund are allocated to such fund. Expenses that are not readily attributable to a specific fund are allocated among all funds in an equitable manner, taking into consideration, among other things, the nature and type of expense and the fund's relative net assets. Expense estimates are accrued in the period to which they relate and adjustments are made when actual amounts are known.
Class allocations. Income, common expenses and realized and unrealized gains (losses) are determined at the fund level and allocated daily to each class of shares based on the net assets of the class. Class-specific expenses, such as distribution and service fees, if any, and transfer agent fees, are calculated daily for each class, based on the net asset value of the class and the applicable specific expense rates.
Federal income taxes. The fund intends to continue to qualify as a regulated investment company by complying with the applicable provisions of the Internal Revenue Code and will not be subject to federal income tax on taxable income that is distributed to shareholders. Therefore, no federal income tax provision is required.
For federal income tax purposes, as of July 31, 2015, the fund has a short-term capital loss carryfoward of $204,714,898 available to offset future net realized capital gains. This carryforward does not expire.
As of July 31, 2015, the fund had no uncertain tax positions that would require financial statement recognition, derecognition or disclosure. The fund's federal tax returns are subject to examination by the Internal Revenue Service for a period of three years.
Distribution of income and gains. Distributions to shareholders from net investment income and net realized gains, if any, are recorded on the ex-date. The fund generally declares and pays dividends and capital gain distributions, if any, annually.
Distributions paid by the fund with respect to each class of shares are calculated in the same manner, at the same time and in the same amount, except for the effect of class level expenses that may be applied differently to each class.
Such distributions, on a tax basis, are determined in conformity with income tax regulations, which may differ from US GAAP.
Capital accounts within the financial statements are adjusted for permanent book-tax differences. These adjustments have no impact on net assets or the results of operations. Temporary book-tax differences, if any, will reverse in a subsequent period. Book-tax differences are primarily attributable to foreign currency transactions, derivative transactions and amortization and accretion on debt securities.
Note 3 — Derivative instruments
The fund may invest in derivatives in order to meet its investment objective. Derivatives include a variety of different instruments that may be traded in the OTC market, on a regulated exchange or through a clearing facility. The risks in using derivatives vary depending upon the structure of the instruments, including the use of leverage, optionality, the liquidity or lack of liquidity of the contract, the creditworthiness of the counterparty or clearing organization and the volatility of the position. Some derivatives involve risks that are potentially greater than the risks associated with investing directly in the referenced securities or other referenced underlying instrument. Specifically, the fund is exposed to the risk that the counterparty to an OTC derivatives contract will be unable or unwilling to make timely settlement payments or otherwise honor its obligations. OTC derivatives transactions typically can only be closed out with the other party to the transaction.
Forward foreign currency contracts, certain options and certain swaps are typically traded through the OTC market. Certain forwards, options and swaps are regulated by the Commodity Futures Trading Commission (the CFTC) as swaps. Derivative counterparty risk is managed through an ongoing evaluation of the creditworthiness of all potential counterparties and, if applicable, designated clearing organizations. The fund attempts to reduce its exposure to counterparty risk for derivatives traded in the OTC market, whenever possible, by entering into an International Swaps and Derivatives Association (ISDA) Master Agreement with each of its OTC counterparties. The ISDA gives each party to the agreement the right to terminate all transactions traded under the agreement if there is certain deterioration in the credit quality or contractual default of the other party, as defined in the ISDA. Upon an event of default or a termination of the ISDA, the non-defaulting party has the right to close out all transactions and to net amounts owed.
As defined by the ISDA, the fund may have collateral agreements with certain counterparties to mitigate counterparty risk on OTC derivatives. Subject to established minimum levels, collateral for OTC transactions is generally determined based on the net aggregate unrealized gain or loss on contracts with a particular counterparty. Collateral pledged to the fund is held in a segregated account by a third-party agent or held by the custodian bank for the benefit of the fund and can be in the form of cash or debt securities issued by the U.S. government or related agencies; collateral posted by the fund for OTC transactions is held in a segregated account at the fund's custodian and is noted in the accompanying Fund's investments, or if cash is posted, on the Statement of assets and liabilities. The fund's maximum risk of loss due to counterparty risk is equal to the asset value of outstanding contracts offset by collateral received.
Futures, certain options and cleared swaps are traded or cleared on an exchange or central clearinghouse. Exchange-traded or cleared transactions generally present less counterparty risk to a fund than OTC transactions. The exchange or clearinghouse stands between the fund and the broker to the contract and therefore, credit risk is generally limited to the failure of the exchange or clearinghouse and the clearing member.
Margin requirements for exchange-traded derivatives are set by the broker or applicable clearinghouse. Margin for exchange-traded transactions is detailed in the Statement of assets and liabilities as Cash held at broker for futures contracts.
Cleared swap contracts are subject to clearinghouse rules, including initial and variation margin requirements, daily settlement of obligations and the clearinghouse guarantee of payments to the broker. There is, however, still counterparty risk due to the potential insolvency of the broker with respect to any margin held in the brokers' customer accounts. While clearing members are required to segregate customer assets from their own assets, in the event of insolvency, there may be a shortfall in the amount of margin held by the broker for its clients. Collateral or margin requirements for exchange-traded or cleared derivatives are set by the broker or applicable clearinghouse. Margin for exchange-traded and exchange-cleared transactions are detailed in the Statement of assets and liabilities as Cash held at broker for futures contracts and receivable
for exchange-cleared swaps, respectively. Securities pledged by the fund for exchange-traded and cleared transactions, if any, are identified in the Fund's investments.
Futures. A futures contract is a contractual agreement to buy or sell a particular currency or financial instrument at a pre-determined price in the future. Risks related to the use of futures contracts include possible illiquidity of the futures markets, contract prices that can be highly volatile and imperfectly correlated to movements in the underlying financial instrument and potential losses in excess of the amounts recognized on the Statement of assets and liabilities. Use of long futures contracts subjects the fund to the risk of loss up to the notional value of the futures contracts. Use of short futures contracts subjects the fund to unlimited risk of loss.
Upon entering into a futures contract, the fund is required to deposit initial margin with the broker in the form of cash or securities. The amount of required margin is generally based on a percentage of the contract value; this amount is the initial margin for the trade. The margin deposit must then be maintained at the established level over the life of the contract. Futures margin receivable / payable is included on the Statement of assets and liabilities. Futures contracts are marked-to-market daily and an appropriate payable or receivable for the change in value (variation margin) and unrealized gain or loss is recorded by the fund. When the contract is closed, the fund records a realized gain or loss equal to the difference between the value of the contract at the time it was opened and the value at the time it was closed.
During the six months ended January 31, 2016, the fund used futures contracts to manage against anticipated changes in securities markets and interest rate changes, gain exposure to certain securities markets and foreign bond markets, and to maintain diversity and liquidity of the fund. The fund held futures contracts with notional values ranging from $3.3 billion to $4.6 billion, as measured at each quarter end. The following table summarizes the contracts held at January 31, 2016:
| Open contracts | Number of contracts |
Position | Expiration date |
Notional basis |
Notional value |
Unrealized appreciation (depreciation) |
||||||||||||||
| Australian 10-year Treasury Bond Futures | 8,539 | Long | Mar 2016 | $767,634,311 | $782,101,643 | $14,467,332 | ||||||||||||||
| Euro STOXX 50 Index Futures | 8,432 | Long | Mar 2016 | 296,619,996 | 279,054,067 | (17,565,929 | ) | |||||||||||||
| Hang Seng Index Futures | 192 | Long | Feb 2016 | 23,392,295 | 24,542,212 | 1,149,917 | ||||||||||||||
| NASDAQ 100 E-Mini Futures | 8,516 | Long | Mar 2016 | 776,211,892 | 726,074,160 | (50,137,732 | ) | |||||||||||||
| NIKKEI 225 Futures | 1,406 | Long | Mar 2016 | 229,090,409 | 207,302,689 | (21,787,720 | ) | |||||||||||||
| ASX SPI 200 Futures | 150 | Short | Mar 2016 | (13,113,707 | ) | (13,275,605 | ) | (161,898 | ) | |||||||||||
| FTSE 100 Index Futures | 1,903 | Short | Mar 2016 | (163,536,449 | ) | (164,648,276 | ) | (1,111,827 | ) | |||||||||||
| FTSE 250 Index Futures | 1,099 | Short | Mar 2016 | (53,206,059 | ) | (51,798,488 | ) | 1,407,571 | ||||||||||||
| OMX Stockholm 30 Index Futures | 5,131 | Short | Feb 2016 | (81,006,914 | ) | (81,408,355 | ) | (401,441 | ) | |||||||||||
| Russell 2000 Index Futures | 8,765 | Short | Mar 2016 | (975,050,609 | ) | (904,022,100 | ) | 71,028,509 | ||||||||||||
| S&P 500 Index E-Mini Futures | 1,155 | Short | Mar 2016 | (116,801,883 | ) | (111,463,275 | ) | 5,338,608 | ||||||||||||
| $2,225,390 |
Forward foreign currency contracts. A forward foreign currency contract is an agreement between two parties to buy and sell specific currencies at a price that is set on the date of the contract. The forward contract calls for delivery of the currencies on a future date that is specified in the contract. Risks related to the use of forwards include the possible failure of counterparties to meet the terms of the forward agreement, the failure of the counterparties to timely post collateral if applicable, the risk that currency movements will not favor the fund thereby reducing the fund's total return, and the potential for losses in excess of the amounts recognized on the Statement of assets and liabilities.
The market value of a forward foreign currency contract fluctuates with changes in foreign currency exchange rates. Forward foreign currency contracts are marked-to-market daily and the change in value is recorded by the fund as an unrealized gain or loss. Realized gains or losses, equal to the difference between the value of the contract at the time it was opened and the value at the time it was closed, are recorded upon delivery or receipt of the currency or settlement with the counterparty.
During the six months ended January 31, 2016, the fund used forward foreign currency contracts to manage against anticipated changes in currency exchange rates, gain exposure to foreign currencies and maintain diversity and liquidity of
the fund. The fund held forward foreign currency contracts with U.S. Dollar notional values ranging from $8.4 billion to $11.9 billion, as measured at each quarter end. The following table summarizes the contracts held at January 31, 2016:
| Contract to buy | Contract to sell | Counterparty | Contractual settlement date |
Unrealized appreciation |
Unrealized depreciation |
Net unrealized appreciation/ (depreciation) | ||||||||||||||||||||||||||
| AUD | 213,000,000 | USD | 148,667,823 | Bank National Paris | 2/1/2016 | $2,082,745 | — | $2,082,745 | ||||||||||||||||||||||||
| AUD | 29,319,994 | USD | 20,415,101 | Bank National Paris | 2/2/2016 | 336,099 | — | 336,099 | ||||||||||||||||||||||||
| AUD | 188,116,853 | USD | 132,402,605 | Citigroup | 2/3/2016 | 730,852 | — | 730,852 | ||||||||||||||||||||||||
| AUD | 185,000,000 | USD | 130,195,785 | HSBC | 2/3/2016 | 731,822 | — | 731,822 | ||||||||||||||||||||||||
| AUD | 31,000,000 | USD | 22,595,531 | Goldman Sachs | 2/4/2016 | — | ($657,313 | ) | (657,313 | ) | ||||||||||||||||||||||
| AUD | 12,000,000 | USD | 8,464,272 | Citigroup | 5/4/2016 | — | (7,647 | ) | (7,647 | ) | ||||||||||||||||||||||
| CAD | 3,000,000 | USD | 2,132,937 | Merrill Lynch | 2/4/2016 | 8,542 | — | 8,542 | ||||||||||||||||||||||||
| CHF | 18,460,000 | GBP | 12,609,901 | Barclays Capital | 2/16/2016 | 62,538 | — | 62,538 | ||||||||||||||||||||||||
| CHF | 18,460,000 | GBP | 12,764,822 | Deutsche Bank | 2/16/2016 | — | (158,212 | ) | (158,212 | ) | ||||||||||||||||||||||
| CHF | 18,460,000 | GBP | 12,684,835 | HSBC | 2/16/2016 | — | (44,237 | ) | (44,237 | ) | ||||||||||||||||||||||
| CHF | 18,460,000 | GBP | 12,741,447 | JPMorgan Chase | 2/16/2016 | — | (124,905 | ) | (124,905 | ) | ||||||||||||||||||||||
| CHF | 18,460,000 | GBP | 12,755,446 | Merrill Lynch | 2/16/2016 | — | (144,852 | ) | (144,852 | ) | ||||||||||||||||||||||
| CHF | 18,440,000 | GBP | 12,868,414 | Royal Bank of Scotland | 2/16/2016 | — | (325,359 | ) | (325,359 | ) | ||||||||||||||||||||||
| CHF | 18,460,000 | GBP | 12,794,469 | UBS Warburg | 2/16/2016 | — | (200,457 | ) | (200,457 | ) | ||||||||||||||||||||||
| CHF | 20,060,000 | GBP | 13,709,780 | Barclays Capital | 2/29/2016 | 67,463 | — | 67,463 | ||||||||||||||||||||||||
| CHF | 20,060,000 | GBP | 13,877,964 | Deutsche Bank | 2/29/2016 | — | (172,189 | ) | (172,189 | ) | ||||||||||||||||||||||
| CHF | 20,060,000 | GBP | 13,790,913 | HSBC | 2/29/2016 | — | (48,146 | ) | (48,146 | ) | ||||||||||||||||||||||
| CHF | 20,060,000 | GBP | 13,852,778 | JPMorgan Chase | 2/29/2016 | — | (136,300 | ) | (136,300 | ) | ||||||||||||||||||||||
| CHF | 20,060,000 | GBP | 13,868,293 | Merrill Lynch | 2/29/2016 | — | (158,408 | ) | (158,408 | ) | ||||||||||||||||||||||
| CHF | 20,040,000 | GBP | 13,992,303 | Royal Bank of Scotland | 2/29/2016 | — | (354,660 | ) | (354,660 | ) | ||||||||||||||||||||||
| CHF | 20,060,000 | GBP | 13,910,405 | UBS Warburg | 2/29/2016 | — | (218,415 | ) | (218,415 | ) | ||||||||||||||||||||||
| CHF | 26,360,000 | GBP | 18,016,860 | Barclays Capital | 3/2/2016 | 88,529 | — | 88,529 | ||||||||||||||||||||||||
| CHF | 26,360,000 | GBP | 18,237,961 | Deutsche Bank | 3/2/2016 | — | (226,528 | ) | (226,528 | ) | ||||||||||||||||||||||
| CHF | 26,360,000 | GBP | 18,123,428 | HSBC | 3/2/2016 | — | (63,324 | ) | (63,324 | ) | ||||||||||||||||||||||
| CHF | 26,360,000 | GBP | 18,204,734 | JPMorgan Chase | 3/2/2016 | — | (179,181 | ) | (179,181 | ) | ||||||||||||||||||||||
| CHF | 26,360,000 | GBP | 18,225,251 | Merrill Lynch | 3/2/2016 | — | (208,416 | ) | (208,416 | ) | ||||||||||||||||||||||
| CHF | 26,340,000 | GBP | 18,392,493 | Royal Bank of Scotland | 3/2/2016 | — | (466,274 | ) | (466,274 | ) | ||||||||||||||||||||||
| CHF | 26,360,000 | GBP | 18,280,597 | UBS Warburg | 3/2/2016 | — | (287,282 | ) | (287,282 | ) | ||||||||||||||||||||||
| EUR | 47,000,000 | USD | 51,353,876 | Goldman Sachs | 2/4/2016 | — | (436,716 | ) | (436,716 | ) | ||||||||||||||||||||||
| EUR | 11,000,000 | USD | 11,932,668 | HSBC | 2/4/2016 | — | (15,886 | ) | (15,886 | ) | ||||||||||||||||||||||
| EUR | 44,000,000 | USD | 47,842,363 | Bank National Paris | 2/8/2016 | — | (170,893 | ) | (170,893 | ) | ||||||||||||||||||||||
| EUR | 4,400,000 | USD | 4,786,669 | Citigroup | 2/8/2016 | — | (19,522 | ) | (19,522 | ) | ||||||||||||||||||||||
| EUR | 53,700,000 | USD | 58,129,445 | Deutsche Bank | 2/8/2016 | 51,417 | — | 51,417 | ||||||||||||||||||||||||
| EUR | 53,500,000 | USD | 57,933,813 | JPMorgan Chase | 2/8/2016 | 30,360 | — | 30,360 | ||||||||||||||||||||||||
| EUR | 54,400,000 | USD | 58,958,720 | Royal Bank of Scotland | 2/8/2016 | — | (19,449 | ) | (19,449 | ) | ||||||||||||||||||||||
| EUR | 21,000,000 | USD | 22,861,572 | Goldman Sachs | 2/12/2016 | — | (107,209 | ) | (107,209 | ) | ||||||||||||||||||||||
| EUR | 21,000,000 | USD | 22,876,518 | Royal Bank of Scotland | 2/12/2016 | — | (122,154 | ) | (122,154 | ) | ||||||||||||||||||||||
| EUR | 38,000,000 | USD | 41,491,402 | UBS Warburg | 2/12/2016 | — | (316,839 | ) | (316,839 | ) | ||||||||||||||||||||||
| EUR | 61,900,000 | USD | 67,449,182 | Bank National Paris | 3/4/2016 | — | (345,272 | ) | (345,272 | ) | ||||||||||||||||||||||
| EUR | 54,900,000 | USD | 59,929,115 | Barclays Capital | 3/4/2016 | — | (413,692 | ) | (413,692 | ) | ||||||||||||||||||||||
| EUR | 40,900,000 | USD | 44,676,829 | UBS Warburg | 3/4/2016 | — | (338,381 | ) | (338,381 | ) | ||||||||||||||||||||||
| EUR | 1,900,000 | USD | 2,079,398 | JPMorgan Chase | 4/14/2016 | — | (17,023 | ) | (17,023 | ) | ||||||||||||||||||||||
| EUR | 100,000 | USD | 109,392 | Bank National Paris | 4/15/2016 | — | (843 | ) | (843 | ) | ||||||||||||||||||||||
| EUR | 319,607 | USD | 349,643 | Barclays Capital | 4/15/2016 | — | (2,712 | ) | (2,712 | ) | ||||||||||||||||||||||
| EUR | 3,025,067 | USD | 3,290,458 | Citigroup | 4/15/2016 | — | (6,774 | ) | (6,774 | ) | ||||||||||||||||||||||
| EUR | 2,422,072 | USD | 2,646,254 | HSBC | 4/15/2016 | — | (17,116 | ) | (17,116 | ) | ||||||||||||||||||||||
| EUR | 1,377,858 | USD | 1,494,547 | Merrill Lynch | 4/15/2016 | 1,105 | — | 1,105 | ||||||||||||||||||||||||
| EUR | 261,731 | USD | 284,627 | UBS Warburg | 4/15/2016 | — | (520 | ) | (520 | ) | ||||||||||||||||||||||
| Contract to buy | Contract to sell | Counterparty | Contractual settlement date |
Unrealized appreciation |
Unrealized depreciation |
Net unrealized appreciation/ (depreciation) | ||||||||||||||||||||||||||
| EUR | 39,500,000 | USD | 43,171,920 | Citigroup | 4/19/2016 | — | (290,173 | ) | (290,173 | ) | ||||||||||||||||||||||
| EUR | 11,900,000 | USD | 12,999,608 | UBS Warburg | 4/19/2016 | — | (80,803 | ) | (80,803 | ) | ||||||||||||||||||||||
| GBP | 85,782,198 | CHF | 129,200,000 | UBS Warburg | 2/16/2016 | — | (3,962,182 | ) | (3,962,182 | ) | ||||||||||||||||||||||
| GBP | 91,680,815 | CHF | 140,400,000 | Barclays Capital | 2/29/2016 | — | (6,562,357 | ) | (6,562,357 | ) | ||||||||||||||||||||||
| GBP | 29,687,933 | CHF | 44,100,000 | Deutsche Bank | 3/2/2016 | — | (795,152 | ) | (795,152 | ) | ||||||||||||||||||||||
| GBP | 91,610,883 | CHF | 140,400,000 | Merrill Lynch | 3/2/2016 | — | (6,672,117 | ) | (6,672,117 | ) | ||||||||||||||||||||||
| GBP | 45,000,000 | USD | 66,410,540 | Goldman Sachs | 3/9/2016 | — | (2,286,601 | ) | (2,286,601 | ) | ||||||||||||||||||||||
| GBP | 44,000,000 | USD | 62,724,788 | HSBC | 3/9/2016 | — | (25,826 | ) | (25,826 | ) | ||||||||||||||||||||||
| GBP | 346,341 | USD | 495,965 | Citigroup | 4/21/2016 | — | (2,370 | ) | (2,370 | ) | ||||||||||||||||||||||
| INR | 4,500,000,000 | USD | 66,703,230 | Bank National Paris | 2/18/2016 | — | (579,685 | ) | (579,685 | ) | ||||||||||||||||||||||
| INR | 21,930,000,000 | USD | 326,736,876 | Bank National Paris | 2/23/2016 | — | (4,757,305 | ) | (4,757,305 | ) | ||||||||||||||||||||||
| INR | 4,500,000,000 | USD | 66,436,354 | Bank National Paris | 4/18/2016 | — | (1,013,077 | ) | (1,013,077 | ) | ||||||||||||||||||||||
| INR | 4,500,000,000 | USD | 65,616,798 | Bank National Paris | 4/20/2016 | — | (216,516 | ) | (216,516 | ) | ||||||||||||||||||||||
| INR | 4,500,000,000 | USD | 64,937,876 | Bank National Paris | 5/18/2016 | 153,679 | — | 153,679 | ||||||||||||||||||||||||
| INR | 17,600,000,000 | USD | 254,339,276 | Bank National Paris | 5/26/2016 | — | (92,896 | ) | (92,896 | ) | ||||||||||||||||||||||
| INR | 4,330,000,000 | USD | 62,651,021 | Bank National Paris | 5/26/2016 | — | (100,633 | ) | (100,633 | ) | ||||||||||||||||||||||
| KRW | 145,604,712,241 | USD | 121,135,368 | Barclays Capital | 2/5/2016 | 304,058 | — | 304,058 | ||||||||||||||||||||||||
| KRW | 20,900,000,000 | USD | 17,915,309 | Deutsche Bank | 3/9/2016 | — | (498,357 | ) | (498,357 | ) | ||||||||||||||||||||||
| MXN | 1,690,000,000 | USD | 100,745,156 | UBS Warburg | 2/2/2016 | — | (7,569,322 | ) | (7,569,322 | ) | ||||||||||||||||||||||
| MXN | 420,000,000 | USD | 24,250,123 | Bank National Paris | 2/17/2016 | — | (1,117,124 | ) | (1,117,124 | ) | ||||||||||||||||||||||
| MXN | 1,058,600,000 | USD | 62,750,694 | Merrill Lynch | 2/22/2016 | — | (4,463,949 | ) | (4,463,949 | ) | ||||||||||||||||||||||
| MXN | 1,522,000,000 | USD | 90,179,233 | UBS Warburg | 2/23/2016 | — | (6,383,171 | ) | (6,383,171 | ) | ||||||||||||||||||||||
| MXN | 3,150,400,000 | USD | 186,580,910 | Royal Bank of Scotland | 2/24/2016 | — | (13,142,332 | ) | (13,142,332 | ) | ||||||||||||||||||||||
| MXN | 890,000,000 | USD | 53,086,788 | Goldman Sachs | 2/25/2016 | — | (4,092,996 | ) | (4,092,996 | ) | ||||||||||||||||||||||
| MXN | 2,030,000,000 | USD | 117,087,239 | Bank National Paris | 3/3/2016 | — | (5,389,516 | ) | (5,389,516 | ) | ||||||||||||||||||||||
| MXN | 1,631,000,000 | USD | 97,931,490 | Deutsche Bank | 3/3/2016 | — | (8,188,147 | ) | (8,188,147 | ) | ||||||||||||||||||||||
| MXN | 1,690,000,000 | USD | 90,739,946 | Goldman Sachs | 5/3/2016 | 1,847,210 | — | 1,847,210 | ||||||||||||||||||||||||
| USD | 153,026,016 | AUD | 213,000,000 | Deutsche Bank | 2/1/2016 | 2,275,448 | — | 2,275,448 | ||||||||||||||||||||||||
| USD | 21,063,836 | AUD | 29,319,994 | Bank National Paris | 2/2/2016 | 312,635 | — | 312,635 | ||||||||||||||||||||||||
| USD | 86,003,680 | AUD | 119,000,000 | JPMorgan Chase | 2/3/2016 | 1,785,381 | — | 1,785,381 | ||||||||||||||||||||||||
| USD | 180,351,305 | AUD | 254,116,853 | Royal Bank of Scotland | 2/3/2016 | 508,539 | — | 508,539 | ||||||||||||||||||||||||
| USD | 13,492,489 | AUD | 19,000,000 | Bank National Paris | 2/4/2016 | 46,484 | — | 46,484 | ||||||||||||||||||||||||
| USD | 8,500,211 | AUD | 12,000,000 | Citigroup | 2/4/2016 | 7,997 | — | 7,997 | ||||||||||||||||||||||||
| USD | 42,280,411 | AUD | 58,000,000 | Royal Bank of Scotland | 3/9/2016 | 1,299,974 | — | 1,299,974 | ||||||||||||||||||||||||
| USD | 96,034,722 | AUD | 140,000,000 | Goldman Sachs | 4/26/2016 | — | (2,659,857 | ) | (2,659,857 | ) | ||||||||||||||||||||||
| USD | 94,680,152 | AUD | 138,035,623 | UBS Warburg | 4/26/2016 | — | (2,629,617 | ) | (2,629,617 | ) | ||||||||||||||||||||||
| USD | 43,623,735 | AUD | 62,295,717 | Goldman Sachs | 4/29/2016 | — | (286,725 | ) | (286,725 | ) | ||||||||||||||||||||||
| USD | 148,039,047 | AUD | 213,000,000 | Bank National Paris | 5/3/2016 | — | (2,072,706 | ) | (2,072,706 | ) | ||||||||||||||||||||||
| USD | 20,329,018 | AUD | 29,319,994 | Bank National Paris | 5/4/2016 | — | (333,333 | ) | (333,333 | ) | ||||||||||||||||||||||
| USD | 131,830,409 | AUD | 188,116,853 | Citigroup | 5/5/2016 | — | (733,198 | ) | (733,198 | ) | ||||||||||||||||||||||
| USD | 129,634,310 | AUD | 185,000,000 | HSBC | 5/5/2016 | — | (732,889 | ) | (732,889 | ) | ||||||||||||||||||||||
| USD | 2,266,222 | CAD | 3,000,000 | Bank National Paris | 2/4/2016 | 124,743 | — | 124,743 | ||||||||||||||||||||||||
| USD | 13,501,225 | CAD | 18,050,000 | HSBC | 3/9/2016 | 616,706 | — | 616,706 | ||||||||||||||||||||||||
| USD | 2,133,159 | CAD | 3,000,000 | Merrill Lynch | 5/4/2016 | — | (8,523 | ) | (8,523 | ) | ||||||||||||||||||||||
| USD | 26,348,895 | CHF | 27,000,000 | Goldman Sachs | 2/12/2016 | — | (19,244 | ) | (19,244 | ) | ||||||||||||||||||||||
| USD | 50,671,232 | CHF | 50,000,000 | Royal Bank of Scotland | 2/12/2016 | 1,841,344 | — | 1,841,344 | ||||||||||||||||||||||||
| USD | 25,866,246 | CHF | 26,000,000 | Bank National Paris | 3/9/2016 | 448,009 | — | 448,009 | ||||||||||||||||||||||||
| USD | 24,370,794 | CHF | 24,000,000 | Goldman Sachs | 3/9/2016 | 907,807 | — | 907,807 | ||||||||||||||||||||||||
| USD | 25,900,568 | CHF | 26,000,000 | Royal Bank of Scotland | 3/9/2016 | 482,331 | — | 482,331 | ||||||||||||||||||||||||
| USD | 94,124,199 | CHF | 96,000,000 | UBS Warburg | 3/9/2016 | 272,249 | — | 272,249 | ||||||||||||||||||||||||
| Contract to buy | Contract to sell | Counterparty | Contractual settlement date |
Unrealized appreciation |
Unrealized depreciation |
Net unrealized appreciation/ (depreciation) | ||||||||||||||||||||||||||
| USD | 15,977,678 | CHF | 16,320,000 | Barclays Capital | 4/5/2016 | 1,859 | — | 1,859 | ||||||||||||||||||||||||
| USD | 16,080,164 | CHF | 16,320,000 | Deutsche Bank | 4/5/2016 | 104,345 | — | 104,345 | ||||||||||||||||||||||||
| USD | 16,077,234 | CHF | 16,320,000 | HSBC | 4/5/2016 | 101,414 | — | 101,414 | ||||||||||||||||||||||||
| USD | 16,147,864 | CHF | 16,320,000 | JPMorgan Chase | 4/5/2016 | 172,044 | — | 172,044 | ||||||||||||||||||||||||
| USD | 16,163,937 | CHF | 16,320,000 | Merrill Lynch | 4/5/2016 | 188,118 | — | 188,118 | ||||||||||||||||||||||||
| USD | 16,157,758 | CHF | 16,330,000 | Royal Bank of Scotland | 4/5/2016 | 172,150 | — | 172,150 | ||||||||||||||||||||||||
| USD | 16,153,618 | CHF | 16,320,000 | UBS Warburg | 4/5/2016 | 177,798 | — | 177,798 | ||||||||||||||||||||||||
| USD | 15,982,842 | CHF | 16,320,000 | Barclays Capital | 4/12/2016 | 2,054 | — | 2,054 | ||||||||||||||||||||||||
| USD | 16,085,791 | CHF | 16,320,000 | Deutsche Bank | 4/12/2016 | 105,003 | — | 105,003 | ||||||||||||||||||||||||
| USD | 16,082,462 | CHF | 16,320,000 | HSBC | 4/12/2016 | 101,674 | — | 101,674 | ||||||||||||||||||||||||
| USD | 16,152,978 | CHF | 16,320,000 | JPMorgan Chase | 4/12/2016 | 172,191 | — | 172,191 | ||||||||||||||||||||||||
| USD | 16,169,783 | CHF | 16,320,000 | Merrill Lynch | 4/12/2016 | 188,995 | — | 188,995 | ||||||||||||||||||||||||
| USD | 16,163,676 | CHF | 16,330,000 | Royal Bank of Scotland | 4/12/2016 | 173,096 | — | 173,096 | ||||||||||||||||||||||||
| USD | 16,159,056 | CHF | 16,320,000 | UBS Warburg | 4/12/2016 | 178,268 | — | 178,268 | ||||||||||||||||||||||||
| USD | 15,987,774 | CHF | 16,320,000 | Barclays Capital | 4/19/2016 | 2,018 | — | 2,018 | ||||||||||||||||||||||||
| USD | 16,091,580 | CHF | 16,320,000 | Deutsche Bank | 4/19/2016 | 105,824 | — | 105,824 | ||||||||||||||||||||||||
| USD | 16,087,852 | CHF | 16,320,000 | HSBC | 4/19/2016 | 102,097 | — | 102,097 | ||||||||||||||||||||||||
| USD | 16,158,096 | CHF | 16,320,000 | JPMorgan Chase | 4/19/2016 | 172,340 | — | 172,340 | ||||||||||||||||||||||||
| USD | 16,175,392 | CHF | 16,320,000 | Merrill Lynch | 4/19/2016 | 189,636 | — | 189,636 | ||||||||||||||||||||||||
| USD | 16,169,437 | CHF | 16,330,000 | Royal Bank of Scotland | 4/19/2016 | 173,887 | — | 173,887 | ||||||||||||||||||||||||
| USD | 16,164,578 | CHF | 16,320,000 | UBS Warburg | 4/19/2016 | 178,822 | — | 178,822 | ||||||||||||||||||||||||
| USD | 15,992,944 | CHF | 16,320,000 | Barclays Capital | 4/26/2016 | 2,221 | — | 2,221 | ||||||||||||||||||||||||
| USD | 16,097,294 | CHF | 16,320,000 | Deutsche Bank | 4/26/2016 | 106,570 | — | 106,570 | ||||||||||||||||||||||||
| USD | 16,093,087 | CHF | 16,320,000 | HSBC | 4/26/2016 | 102,364 | — | 102,364 | ||||||||||||||||||||||||
| USD | 16,163,217 | CHF | 16,320,000 | JPMorgan Chase | 4/26/2016 | 172,493 | — | 172,493 | ||||||||||||||||||||||||
| USD | 16,181,486 | CHF | 16,320,000 | Merrill Lynch | 4/26/2016 | 190,763 | — | 190,763 | ||||||||||||||||||||||||
| USD | 16,175,203 | CHF | 16,330,000 | Royal Bank of Scotland | 4/26/2016 | 174,681 | — | 174,681 | ||||||||||||||||||||||||
| USD | 16,170,103 | CHF | 16,320,000 | UBS Warburg | 4/26/2016 | 179,380 | — | 179,380 | ||||||||||||||||||||||||
| USD | 9,395,932 | DKK | 64,000,000 | Goldman Sachs | 2/12/2016 | 103,361 | — | 103,361 | ||||||||||||||||||||||||
| USD | 19,378,379 | DKK | 136,000,000 | Royal Bank of Scotland | 3/9/2016 | — | (382,770 | ) | (382,770 | ) | ||||||||||||||||||||||
| USD | 21,959,480 | EUR | 20,000,000 | Merrill Lynch | 2/4/2016 | 292,603 | — | 292,603 | ||||||||||||||||||||||||
| USD | 42,118,098 | EUR | 38,000,000 | UBS Warburg | 2/4/2016 | 951,032 | — | 951,032 | ||||||||||||||||||||||||
| USD | 231,669,774 | EUR | 210,000,000 | Goldman Sachs | 2/8/2016 | 4,146,853 | — | 4,146,853 | ||||||||||||||||||||||||
| USD | 23,414,554 | EUR | 22,000,000 | Citigroup | 2/12/2016 | — | (423,351 | ) | (423,351 | ) | ||||||||||||||||||||||
| USD | 199,196,962 | EUR | 182,000,000 | Royal Bank of Scotland | 2/12/2016 | 1,992,477 | — | 1,992,477 | ||||||||||||||||||||||||
| USD | 125,603,832 | EUR | 114,000,000 | Merrill Lynch | 2/19/2016 | 2,060,465 | — | 2,060,465 | ||||||||||||||||||||||||
| USD | 54,227,010 | EUR | 49,200,000 | Merrill Lynch | 3/4/2016 | 890,784 | — | 890,784 | ||||||||||||||||||||||||
| USD | 115,050,340 | EUR | 108,500,000 | Royal Bank of Scotland | 3/4/2016 | — | (2,571,215 | ) | (2,571,215 | ) | ||||||||||||||||||||||
| USD | 29,612,005 | EUR | 28,000,000 | Citigroup | 3/9/2016 | — | (746,885 | ) | (746,885 | ) | ||||||||||||||||||||||
| USD | 180,495,460 | EUR | 170,000,000 | Deutsche Bank | 3/9/2016 | — | (3,826,372 | ) | (3,826,372 | ) | ||||||||||||||||||||||
| USD | 28,298,582 | EUR | 26,000,000 | Merrill Lynch | 3/9/2016 | 108,184 | — | 108,184 | ||||||||||||||||||||||||
| USD | 383,289,006 | EUR | 360,873,992 | Royal Bank of Scotland | 3/9/2016 | — | (7,987,203 | ) | (7,987,203 | ) | ||||||||||||||||||||||
| USD | 229,187,887 | EUR | 212,904,919 | Bank National Paris | 4/14/2016 | — | (1,912,027 | ) | (1,912,027 | ) | ||||||||||||||||||||||
| USD | 2,077,063 | EUR | 1,913,506 | Citigroup | 4/15/2016 | — | (31 | ) | (31 | ) | ||||||||||||||||||||||
| USD | 472,340,049 | EUR | 434,349,657 | HSBC | 4/15/2016 | 857,277 | — | 857,277 | ||||||||||||||||||||||||
| USD | 2,064,422 | EUR | 1,897,340 | Royal Bank of Scotland | 4/15/2016 | 4,876 | — | 4,876 | ||||||||||||||||||||||||
| USD | 55,926,510 | EUR | 51,400,000 | Citigroup | 4/19/2016 | 125,958 | — | 125,958 | ||||||||||||||||||||||||
| USD | 104,465,568 | EUR | 96,000,000 | HSBC | 4/19/2016 | 246,638 | — | 246,638 | ||||||||||||||||||||||||
| USD | 79,644,034 | EUR | 72,730,976 | Bank National Paris | 4/21/2016 | 681,822 | — | 681,822 | ||||||||||||||||||||||||
| USD | 332,548 | EUR | 304,567 | HSBC | 4/21/2016 | 1,887 | — | 1,887 | ||||||||||||||||||||||||
| Contract to buy | Contract to sell | Counterparty | Contractual settlement date |
Unrealized appreciation |
Unrealized depreciation |
Net unrealized appreciation/ (depreciation) | ||||||||||||||||||||||||||
| USD | 239,501,935 | EUR | 218,962,788 | UBS Warburg | 4/27/2016 | 1,739,228 | — | 1,739,228 | ||||||||||||||||||||||||
| USD | 156,018,629 | EUR | 143,883,137 | Goldman Sachs | 4/28/2016 | — | (222,574 | ) | (222,574 | ) | ||||||||||||||||||||||
| USD | 192,688,512 | GBP | 128,000,000 | Bank National Paris | 3/9/2016 | 10,291,530 | — | 10,291,530 | ||||||||||||||||||||||||
| USD | 25,609,965 | GBP | 17,000,000 | Goldman Sachs | 3/9/2016 | 1,385,365 | — | 1,385,365 | ||||||||||||||||||||||||
| USD | 28,279,830 | GBP | 19,000,000 | Goldman Sachs | 3/9/2016 | 1,205,278 | — | 1,205,278 | ||||||||||||||||||||||||
| USD | 195,715,130 | GBP | 130,000,000 | Merrill Lynch | 3/9/2016 | 10,468,196 | — | 10,468,196 | ||||||||||||||||||||||||
| USD | 35,614,400 | GBP | 25,000,000 | Royal Bank of Scotland | 3/9/2016 | — | (10,010 | ) | (10,010 | ) | ||||||||||||||||||||||
| USD | 9,100,486 | GBP | 6,245,448 | Deutsche Bank | 4/15/2016 | 199,830 | — | 199,830 | ||||||||||||||||||||||||
| USD | 1,161,283 | GBP | 797,373 | HSBC | 4/15/2016 | 24,913 | — | 24,913 | ||||||||||||||||||||||||
| USD | 10,011,706 | GBP | 6,946,139 | UBS Warburg | 4/21/2016 | 112,296 | — | 112,296 | ||||||||||||||||||||||||
| USD | 12,359,069 | GBP | 8,604,107 | Merrill Lynch | 4/22/2016 | 96,741 | — | 96,741 | ||||||||||||||||||||||||
| USD | 20,261,638 | HKD | 157,000,000 | UBS Warburg | 2/12/2016 | 83,462 | — | 83,462 | ||||||||||||||||||||||||
| USD | 65,837,601 | INR | 4,500,000,000 | Bank National Paris | 2/18/2016 | — | (285,944 | ) | (285,944 | ) | ||||||||||||||||||||||
| USD | 321,317,175 | INR | 21,930,000,000 | Bank National Paris | 2/23/2016 | — | (662,396 | ) | (662,396 | ) | ||||||||||||||||||||||
| USD | 65,626,367 | INR | 4,500,000,000 | Bank National Paris | 4/18/2016 | 203,090 | — | 203,090 | ||||||||||||||||||||||||
| USD | 16,532,451 | JPY | 2,000,000,000 | Bank National Paris | 2/12/2016 | 9,559 | — | 9,559 | ||||||||||||||||||||||||
| USD | 32,767,624 | JPY | 4,025,000,000 | Royal Bank of Scotland | 3/9/2016 | — | (503,734 | ) | (503,734 | ) | ||||||||||||||||||||||
| USD | 126,597,386 | KRW | 145,604,712,241 | Barclays Capital | 2/5/2016 | 5,157,960 | — | 5,157,960 | ||||||||||||||||||||||||
| USD | 85,821,733 | KRW | 104,404,712,241 | Barclays Capital | 2/29/2016 | — | (1,203,249 | ) | (1,203,249 | ) | ||||||||||||||||||||||
| USD | 120,881,938 | KRW | 145,604,712,241 | Barclays Capital | 4/5/2016 | — | (377,083 | ) | (377,083 | ) | ||||||||||||||||||||||
| USD | 66,586,208 | KRW | 80,000,000,000 | JPMorgan Chase | 4/6/2016 | — | (36,112 | ) | (36,112 | ) | ||||||||||||||||||||||
| USD | 87,540,844 | KRW | 104,404,712,241 | Barclays Capital | 4/12/2016 | 605,650 | — | 605,650 | ||||||||||||||||||||||||
| USD | 60,236,092 | KRW | 72,250,000,000 | Merrill Lynch | 4/15/2016 | 79,080 | — | 79,080 | ||||||||||||||||||||||||
| USD | 59,871,556 | KRW | 72,250,000,000 | Merrill Lynch | 4/19/2016 | — | (280,398 | ) | (280,398 | ) | ||||||||||||||||||||||
| USD | 91,864,308 | KRW | 110,985,863,277 | Barclays Capital | 4/21/2016 | — | (533,532 | ) | (533,532 | ) | ||||||||||||||||||||||
| USD | 59,550,793 | KRW | 72,250,000,000 | Merrill Lynch | 4/25/2016 | — | (593,647 | ) | (593,647 | ) | ||||||||||||||||||||||
| USD | 59,528,714 | KRW | 72,250,000,000 | Merrill Lynch | 5/10/2016 | — | (599,614 | ) | (599,614 | ) | ||||||||||||||||||||||
| USD | 91,324,443 | MXN | 1,690,000,000 | Goldman Sachs | 2/2/2016 | — | (1,851,392 | ) | (1,851,392 | ) | ||||||||||||||||||||||
| USD | 52,943,016 | MXN | 880,000,000 | Bank National Paris | 2/17/2016 | 4,473,876 | — | 4,473,876 | ||||||||||||||||||||||||
| USD | 163,820,876 | MXN | 2,784,954,900 | Citigroup | 2/17/2016 | 10,429,546 | — | 10,429,546 | ||||||||||||||||||||||||
| USD | 7,014,565 | MXN | 130,000,000 | HSBC | 2/17/2016 | — | (145,649 | ) | (145,649 | ) | ||||||||||||||||||||||
| USD | 45,108,696 | MXN | 830,000,000 | JPMorgan Chase | 2/17/2016 | — | (606,517 | ) | (606,517 | ) | ||||||||||||||||||||||
| USD | 4,129,685 | NOK | 35,262,413 | Bank National Paris | 2/12/2016 | 68,344 | — | 68,344 | ||||||||||||||||||||||||
| USD | 6,061,889 | NOK | 52,350,000 | HSBC | 3/9/2016 | 34,065 | — | 34,065 | ||||||||||||||||||||||||
| USD | 3,657,022 | RUB | 249,959,300 | Bank National Paris | 2/12/2016 | 354,441 | — | 354,441 | ||||||||||||||||||||||||
| USD | 42,165,072 | SEK | 360,000,000 | Royal Bank of Scotland | 2/12/2016 | 214,227 | — | 214,227 | ||||||||||||||||||||||||
| USD | 8,655,698 | SEK | 75,000,000 | Deutsche Bank | 3/9/2016 | — | (91,130 | ) | (91,130 | ) | ||||||||||||||||||||||
| USD | 1,568,963 | SGD | 2,200,000 | Deutsche Bank | 2/12/2016 | 24,955 | — | 24,955 | ||||||||||||||||||||||||
| USD | 65,645,491 | SGD | 91,840,000 | Bank National Paris | 2/25/2016 | 1,205,665 | — | 1,205,665 | ||||||||||||||||||||||||
| USD | 65,364,725 | SGD | 91,840,000 | Bank National Paris | 2/26/2016 | 926,091 | — | 926,091 | ||||||||||||||||||||||||
| USD | 65,404,254 | SGD | 91,840,000 | Bank National Paris | 2/29/2016 | 969,193 | — | 969,193 | ||||||||||||||||||||||||
| USD | 65,520,907 | SGD | 91,840,000 | Bank National Paris | 3/1/2016 | 1,087,036 | — | 1,087,036 | ||||||||||||||||||||||||
| USD | 65,102,893 | SGD | 91,840,000 | Bank National Paris | 3/2/2016 | 670,213 | — | 670,213 | ||||||||||||||||||||||||
| USD | 951,189 | SGD | 1,345,000 | HSBC | 3/9/2016 | 7,735 | — | 7,735 | ||||||||||||||||||||||||
| USD | 48,796,686 | SGD | 69,800,000 | Citigroup | 3/14/2016 | — | (158,396 | ) | (158,396 | ) | ||||||||||||||||||||||
| USD | 48,870,141 | SGD | 69,800,000 | Citigroup | 3/15/2016 | — | (83,672 | ) | (83,672 | ) | ||||||||||||||||||||||
| USD | 48,913,805 | SGD | 69,800,000 | Citigroup | 3/17/2016 | — | (37,467 | ) | (37,467 | ) | ||||||||||||||||||||||
| USD | 48,896,810 | SGD | 69,800,000 | Citigroup | 3/18/2016 | — | (53,192 | ) | (53,192 | ) | ||||||||||||||||||||||
| USD | 16,086,600 | SGD | 22,960,000 | Goldman Sachs | 3/29/2016 | — | (10,410 | ) | (10,410 | ) | ||||||||||||||||||||||
| USD | 16,091,304 | SGD | 22,960,000 | Royal Bank of Scotland | 3/30/2016 | — | (5,287 | ) | (5,287 | ) | ||||||||||||||||||||||
| Contract to buy | Contract to sell | Counterparty | Contractual settlement date |
Unrealized appreciation |
Unrealized depreciation |
Net unrealized appreciation/ (depreciation) | ||||||||||||||||||||||||||
| USD | 64,903,454 | SGD | 92,760,000 | Royal Bank of Scotland | 3/31/2016 | — | (126,210 | ) | (126,210 | ) | ||||||||||||||||||||||
| USD | 16,148,249 | SGD | 22,960,000 | Royal Bank of Scotland | 4/1/2016 | 52,493 | — | 52,493 | ||||||||||||||||||||||||
| USD | 35,991,866 | SGD | 50,800,000 | Deutsche Bank | 4/5/2016 | 382,724 | — | 382,724 | ||||||||||||||||||||||||
| USD | 16,208,431 | SGD | 22,960,000 | Goldman Sachs | 4/5/2016 | 114,221 | — | 114,221 | ||||||||||||||||||||||||
| USD | 62,954,770 | SGD | 90,500,000 | JPMorgan Chase | 4/11/2016 | — | (473,888 | ) | (473,888 | ) | ||||||||||||||||||||||
| USD | 62,685,485 | SGD | 90,500,000 | JPMorgan Chase | 4/14/2016 | — | (738,728 | ) | (738,728 | ) | ||||||||||||||||||||||
| USD | 62,618,924 | SGD | 90,500,000 | JPMorgan Chase | 4/18/2016 | — | (799,364 | ) | (799,364 | ) | ||||||||||||||||||||||
| USD | 62,684,417 | SGD | 90,500,000 | JPMorgan Chase | 4/21/2016 | — | (729,427 | ) | (729,427 | ) | ||||||||||||||||||||||
| $86,259,391 | ($123,360,681 | ) | ($37,101,290 | ) | ||||||||||||||||||||||||||||
| Currency abbreviation | |||||
| AUD | Australian Dollar | HKD | Hong Kong Dollar | NOK | Norwegian Krone |
| CAD | Canadian Dollar | INR | Indian Rupee | SEK | Swedish Krona |
| CHF | Swiss Franc | JPY | Japanese Yen | SGD | Singapore Dollar |
| EUR | Euro | KRW | Korean Won | USD | U.S. Dollar |
| GBP | Pound Sterling | MXN | Mexican Peso | ||
Options. There are two types of options, put options and call options. Options are traded either OTC or on an exchange. A call option gives the purchaser of the option the right to buy (and the seller the obligation to sell) the underlying instrument at the exercise price. A put option gives the purchaser of the option the right to sell (and the writer the obligation to buy) the underlying instrument at the exercise price. Writing puts and buying calls may increase the fund's exposure to changes in the value of the underlying instrument. Buying puts and writing calls may decrease the fund's exposure to such changes. Risks related to the use of options include the loss of premiums, possible illiquidity of the options markets, trading restrictions imposed by an exchange and movements in underlying security values, and for written options, potential losses in excess of the amounts recognized on the Statement of assets and liabilities. In addition, OTC options are subject to the risks of all OTC derivatives contracts.
When the fund purchases an option, the premium paid by the fund is included in the Fund's investments and subsequently "marked-to-market" to reflect current market value. If the purchased option expires, the fund realizes a loss equal to the cost of the option. If the fund exercises a call option, the cost of the securities acquired by exercising the call is increased by the premium paid to buy the call. If the fund exercises a put option, it realizes a gain or loss from the sale of the underlying security and the proceeds from such sale are decreased by the premium paid. If the fund enters into a closing sale transaction, the fund realizes a gain or loss, depending on whether proceeds from the closing sale are greater or less than the original cost. When the fund writes an option, the premium received is included as a liability and subsequently "marked-to-market" to reflect the current market value of the option written. Premiums received from writing options that expire unexercised are recorded as realized gains. Premiums received from writing options which are exercised or are closed are added to or offset against the proceeds or amount paid on the transaction to determine the realized gain or loss. If a put option on a security is exercised, the premium received reduces the cost basis of the securities purchased by the fund.
During the six months ended January 31, 2016, the fund used purchased options to manage duration of the fund, to manage against anticipated changes in securities markets, gain exposure to certain securities markets, to manage against anticipated interest rate changes and to maintain diversity and liquidity of the fund. The fund held purchased options with market values ranging from $35.3 million to $99.4 million, as measured at each quarter end.
During the six months ended January 31, 2016, the fund wrote option contracts to manage against anticipated changes in securities markets and changes in currency exchange rates, gain exposure to certain securities markets and foreign currencies, and to maintain diversity and liquidity of the fund. The following tables summarize the fund's written options activities during the six months ended January 31, 2016 and the contracts held at January 31, 2016:
| Number of contracts* | Notional amount* | Premiums received | ||||||||||||
| Outstanding, beginning of period | 2,659 | 282,423,935 | $12,829,557 | |||||||||||
| Options written | 19,611 | — | 5,216,554 | |||||||||||
| Option closed | — | (282,423,935 | ) | (9,690,476 | ) | |||||||||
| Options exercised | — | — | — | |||||||||||
| Options expired | — | — | — | |||||||||||
| Outstanding, end of period | 22,270 | — | $8,355,635 | |||||||||||
*The amounts for options on securities represent number of contracts. The amounts for over the counter index options and foreign currency options represent notional amount.
Options on securities (OTC)
| Name of issuer | Counterparty | Exercise price |
Expiration date |
Number of contracts |
Premium | Value | ||||||||||||||
| Calls | ||||||||||||||||||||
| Apple, Inc. CBOE FLEX | Morgan Stanley | $125 | Jun 2016 | 3,130 | $3,397,236 | ($139,353 | ) |
Index options (OTC)
| Name of issuer | Counterparty | Exercise price |
Expiration date |
Number of contracts |
Premium | Value | ||||||||||||||
| Calls | ||||||||||||||||||||
| Swiss Market Index | Morgan Stanley | 8,700 | Mar 2016 | 19,140 | $4,958,399 | ($1,036,154 | ) |
Swaps. Swap agreements are agreements between the fund and counterparty to exchange cash flows, assets, foreign currencies or market-linked returns at specified intervals. Swap agreements are privately negotiated in the OTC market (OTC swaps) or may be executed on a registered commodities exchange (centrally cleared swaps). Swaps are marked-to-market daily and the change in value is recorded as a component of unrealized appreciation/depreciation of swap contracts. The value of the swap will typically impose collateral posting obligations on the party that is considered out-of-the-money on the swap.
Upfront payments made/received by the fund are amortized/accreted for financial reporting purposes, with the unamortized/unaccreted portion included in the Statement of assets and liabilities. A termination payment by the counterparty or the fund is recorded as realized gain or loss, as well as the net periodic payments received or paid by the fund.
Entering into swap agreements involves, to varying degrees, elements of credit, market and documentation risk that may amount to values that are in excess of the amounts recognized on the Statement of assets and liabilities. Such risks involve the possibility that there will be no liquid market for the swap, or that a counterparty may default on its obligation or delay payment under the swap terms. The counterparty may disagree or contest the terms of the swap. Market risks may also accompany the swap, including interest rate risk. The fund may also suffer losses if it is unable to terminate or assign outstanding swaps or reduce its exposure through offsetting transactions.
Interest rate swaps. Interest rate swaps represent an agreement between the fund and a counterparty to exchange cash flows based on the difference between two interest rates applied to a notional amount. The payment flows are usually netted against each other, with the difference being paid by one party to the other. The fund settles accrued net interest receivable or payable under the swap contracts at specified, future intervals.
During the six months ended January 31, 2016, the fund used interest rate swaps to manage duration of the fund, manage against anticipated interest rate changes, maintain diversity and liquidity of the fund and gain exposure to treasuries market. The fund held interest rate swaps with total USD notional amounts ranging from $14.0 billion to $24.1 billion, as measured at each quarter end. The following table summarizes the interest rate swap contracts held as of January 31, 2016:
| Counterparty | Notional amount |
Currency | USD notional amount |
Payments made by fund |
Payments received by fund |
Maturity date |
Unamortized upfront payment paid (received) |
Unrealized appreciation (depreciation) |
Market value |
|||||||||||||||||||||||
| Exchange Cleared Swaps | ||||||||||||||||||||||||||||||||
| 193,000,000 | AUD | $175,398,418 | 6 Month BBSW | Fixed 4.0150% | Mar 2018 | — | $4,903,303 | $4,903,303 | ||||||||||||||||||||||||
| 374,000,000 | AUD | 342,694,828 | 3 Month BBSW | Fixed 3.5200% | Sep 2018 | — | 7,881,207 | 7,881,207 | ||||||||||||||||||||||||
| 38,372,000 | AUD | 33,504,471 | 6 Month BBSW | Fixed 3.4825% | Oct 2018 | — | 710,004 | 710,004 | ||||||||||||||||||||||||
| 117,248,000 | AUD | 101,689,506 | 6 Month BBSW | Fixed 3.4450% | Oct 2018 | — | 2,111,863 | 2,111,863 | ||||||||||||||||||||||||
| 42,280,000 | AUD | 37,337,619 | 6 Month BBSW | Fixed 3.2775% | Oct 2018 | — | 663,551 | 663,551 | ||||||||||||||||||||||||
| 25,535,000 | AUD | 22,044,287 | 6 Month BBSW | Fixed 3.2750% | Nov 2018 | — | 400,469 | 400,469 | ||||||||||||||||||||||||
| 24,684,000 | AUD | 21,467,708 | 6 Month BBSW | Fixed 3.2650% | Nov 2018 | — | 382,668 | 382,668 | ||||||||||||||||||||||||
| 25,535,000 | AUD | 22,260,095 | 6 Month BBSW | Fixed 3.2875% | Nov 2018 | — | 403,706 | 403,706 | ||||||||||||||||||||||||
| 42,558,000 | AUD | 37,089,198 | 6 Month BBSW | Fixed 3.2750% | Nov 2018 | — | 665,573 | 665,573 | ||||||||||||||||||||||||
| 25,535,000 | AUD | 22,253,693 | 6 Month BBSW | Fixed 3.2700% | Nov 2018 | — | 397,603 | 397,603 | ||||||||||||||||||||||||
| 42,558,000 | AUD | 37,276,645 | 6 Month BBSW | Fixed 3.2525% | Nov 2018 | — | 653,887 | 653,887 | ||||||||||||||||||||||||
| 75,116,000 | AUD | 65,422,368 | 6 Month BBSW | Fixed 3.2280% | Nov 2018 | — | 1,127,439 | 1,127,439 | ||||||||||||||||||||||||
| 24,258,000 | AUD | 21,167,539 | 6 Month BBSW | Fixed 3.2350% | Nov 2018 | — | 365,876 | 365,876 | ||||||||||||||||||||||||
| 42,558,000 | AUD | 37,136,126 | 6 Month BBSW | Fixed 3.2300% | Nov 2018 | — | 638,983 | 638,983 | ||||||||||||||||||||||||
| 42,558,000 | AUD | 26,461,481 | 6 Month BBSW | Fixed 3.2000% | Nov 2018 | — | 621,552 | 621,552 | ||||||||||||||||||||||||
| 42,558,000 | AUD | 36,723,388 | 6 Month BBSW | Fixed 3.2025% | Nov 2018 | — | 623,007 | 623,007 | ||||||||||||||||||||||||
| 138,798,000 | AUD | 110,649,798 | 6 Month BBSW | Fixed 2.8900% | May 2019 | — | 1,356,024 | 1,356,024 | ||||||||||||||||||||||||
| 92,532,000 | AUD | 73,488,838 | 6 Month BBSW | Fixed 2.7750% | May 2019 | — | 759,933 | 759,933 | ||||||||||||||||||||||||
| 138,798,000 | AUD | 109,692,257 | 6 Month BBSW | Fixed 2.9075% | May 2019 | — | 1,388,913 | 1,388,913 | ||||||||||||||||||||||||
| 46,266,000 | AUD | 36,689,056 | 6 Month BBSW | Fixed 2.8350% | May 2019 | — | 417,282 | 417,282 | ||||||||||||||||||||||||
| 92,532,000 | AUD | 73,378,112 | 6 Month BBSW | Fixed 2.8325% | May 2019 | — | 831,428 | 831,428 | ||||||||||||||||||||||||
| 46,266,000 | AUD | 36,517,621 | 6 Month BBSW | Fixed 2.8225% | May 2019 | — | 408,680 | 408,680 | ||||||||||||||||||||||||
| 76,808,000 | AUD | 61,338,934 | 6 Month BBSW | Fixed 2.9612% | May 2019 | — | 820,935 | 820,935 | ||||||||||||||||||||||||
| 48,150,000 | AUD | 37,361,553 | 6 Month BBSW | Fixed 2.9983% | Jun 2019 | — | 529,547 | 529,547 | ||||||||||||||||||||||||
| 48,148,050 | AUD | 37,389,284 | 6 Month BBSW | Fixed 2.9008% | Jun 2019 | — | 465,478 | 465,478 | ||||||||||||||||||||||||
| 16,049,350 | AUD | 12,427,773 | 6 Month BBSW | Fixed 2.9000% | Jun 2019 | — | 154,562 | 154,562 | ||||||||||||||||||||||||
| 48,148,100 | AUD | 37,240,102 | 6 Month BBSW | Fixed 2.9000% | Jun 2019 | — | 461,410 | 461,410 | ||||||||||||||||||||||||
| 16,049,400 | AUD | 12,413,393 | 6 Month BBSW | Fixed 2.9025% | Jun 2019 | — | 154,345 | 154,345 | ||||||||||||||||||||||||
| 16,049,400 | AUD | 12,364,429 | 6 Month BBSW | Fixed 2.9000% | Jun 2019 | — | 153,804 | 153,804 | ||||||||||||||||||||||||
| 27,746,800 | AUD | 21,476,018 | 6 Month BBSW | Fixed 2.9000% | Jun 2019 | — | 265,901 | 265,901 | ||||||||||||||||||||||||
| 160,493,570 | AUD | 122,873,416 | 6 Month BBSW | Fixed 2.9040% | Jun 2019 | — | 1,542,553 | 1,542,553 | ||||||||||||||||||||||||
| 32,099,000 | AUD | 24,555,726 | 6 Month BBSW | Fixed 2.9000% | Jul 2019 | — | 306,216 | 306,216 | ||||||||||||||||||||||||
| 32,099,000 | AUD | 23,435,401 | 6 Month BBSW | Fixed 2.7500% | Aug 2019 | — | 232,006 | 232,006 | ||||||||||||||||||||||||
| 386,506,000 | AUD | 280,603,451 | 6 Month BBSW | Fixed 2.4550% | Oct 2019 | — | 1,094,717 | 1,094,717 | ||||||||||||||||||||||||
| 310,494,000 | AUD | 224,083,082 | 6 Month BBSW | Fixed 2.4250% | Oct 2019 | — | 714,172 | 714,172 | ||||||||||||||||||||||||
| 81,758,000 | AUD | 59,327,901 | 6 Month BBSW | Fixed 2.6500% | Nov 2019 | — | 412,699 | 412,699 | ||||||||||||||||||||||||
| 40,507,000 | AUD | 29,724,018 | 6 Month BBSW | Fixed 2.6500% | Dec 2019 | — | 201,060 | 201,060 | ||||||||||||||||||||||||
| 40,879,000 | AUD | 29,996,991 | 6 Month BBSW | Fixed 2.6500% | Dec 2019 | — | 202,906 | 202,906 | ||||||||||||||||||||||||
| 40,879,000 | AUD | 29,996,991 | 6 Month BBSW | Fixed 2.6700% | Dec 2019 | — | 213,883 | 213,883 | ||||||||||||||||||||||||
| 40,879,000 | AUD | 29,996,991 | 6 Month BBSW | Fixed 2.6500% | Dec 2019 | — | 202,906 | 202,906 | ||||||||||||||||||||||||
| 40,879,000 | AUD | 29,702,747 | 6 Month BBSW | Fixed 2.6500% | Dec 2019 | — | 202,400 | 202,400 | ||||||||||||||||||||||||
| 122,061,000 | AUD | 87,731,618 | 6 Month BBSW | Fixed 2.6517% | Dec 2019 | — | 601,584 | 601,584 | ||||||||||||||||||||||||
| 81,374,000 | AUD | 58,564,777 | 6 Month BBSW | Fixed 2.6500% | Dec 2019 | — | 396,397 | 396,397 | ||||||||||||||||||||||||
| 40,687,000 | AUD | 29,001,654 | 6 Month BBSW | Fixed 2.6500% | Dec 2019 | — | 198,198 | 198,198 | ||||||||||||||||||||||||
| 122,061,000 | AUD | 88,262,602 | 6 Month BBSW | Fixed 2.6500% | Dec 2019 | — | 594,595 | 594,595 | ||||||||||||||||||||||||
| 71,946,000 | EUR | 80,928,224 | 6 Month EURIBOR | Fixed 1.6077% | Oct 2025 | — | 1,532,018 | 1,532,018 | ||||||||||||||||||||||||
| 23,982,000 | EUR | 26,833,607 | 6 Month EURIBOR | Fixed 1.6133% | Oct 2025 | — | 514,596 | 514,596 | ||||||||||||||||||||||||
| 39,970,000 | EUR | 44,784,314 | 6 Month EURIBOR | Fixed 1.5272% | Oct 2025 | — | 672,641 | 672,641 | ||||||||||||||||||||||||
| Counterparty | Notional amount |
Currency | USD notional amount |
Payments made by fund |
Payments received by fund |
Maturity date |
Unamortized upfront payment paid (received) |
Unrealized appreciation (depreciation) |
Market value |
|||||||||||||||||||||||
| 47,964,000 | EUR | 54,096,364 | 6 Month EURIBOR | Fixed 1.5935% | Oct 2025 | — | 973,725 | 973,725 | ||||||||||||||||||||||||
| 15,988,000 | EUR | 17,974,547 | 6 Month EURIBOR | Fixed 1.6245% | Oct 2025 | — | 350,502 | 350,502 | ||||||||||||||||||||||||
| 31,976,000 | EUR | 36,051,231 | 6 Month EURIBOR | Fixed 1.5728% | Oct 2025 | — | 609,533 | 609,533 | ||||||||||||||||||||||||
| 23,982,000 | EUR | 27,232,777 | 6 Month EURIBOR | Fixed 1.6227% | Oct 2025 | — | 520,293 | 520,293 | ||||||||||||||||||||||||
| 71,946,000 | EUR | 81,914,131 | 6 Month EURIBOR | Fixed 1.5761% | Oct 2025 | — | 1,376,865 | 1,376,865 | ||||||||||||||||||||||||
| 15,988,000 | EUR | 18,355,070 | 6 Month EURIBOR | Fixed 1.5600% | Oct 2025 | — | 291,716 | 291,716 | ||||||||||||||||||||||||
| 7,994,000 | EUR | 9,094,012 | 6 Month EURIBOR | Fixed 1.5520% | Oct 2025 | — | 141,635 | 141,635 | ||||||||||||||||||||||||
| 31,976,000 | EUR | 36,262,191 | 6 Month EURIBOR | Fixed 1.6460% | Oct 2025 | — | 723,891 | 723,891 | ||||||||||||||||||||||||
| 63,952,000 | EUR | 72,518,625 | 6 Month EURIBOR | Fixed 1.6149% | Oct 2025 | — | 1,339,396 | 1,339,396 | ||||||||||||||||||||||||
| 7,994,000 | EUR | 8,880,150 | 6 Month EURIBOR | Fixed 1.5820% | Oct 2025 | — | 152,588 | 152,588 | ||||||||||||||||||||||||
| 23,982,000 | EUR | 26,045,592 | 6 Month EURIBOR | Fixed 1.6190% | Nov 2025 | — | 496,192 | 496,192 | ||||||||||||||||||||||||
| 31,976,000 | EUR | 34,778,826 | 6 Month EURIBOR | Fixed 1.6368% | Nov 2025 | — | 689,002 | 689,002 | ||||||||||||||||||||||||
| 31,976,000 | EUR | 34,356,566 | 6 Month EURIBOR | Fixed 1.6628% | Nov 2025 | — | 732,551 | 732,551 | ||||||||||||||||||||||||
| 31,612,400 | EUR | 33,877,446 | 6 Month EURIBOR | Fixed 1.6883% | Nov 2025 | — | 765,004 | 765,004 | ||||||||||||||||||||||||
| 31,612,400 | EUR | 34,180,741 | 6 Month EURIBOR | Fixed 1.6663% | Nov 2025 | — | 723,810 | 723,810 | ||||||||||||||||||||||||
| 31,612,400 | EUR | 33,984,885 | 6 Month EURIBOR | Fixed 1.6195% | Nov 2025 | — | 644,076 | 644,076 | ||||||||||||||||||||||||
| 18,660,800 | EUR | 19,868,190 | 6 Month EURIBOR | Fixed 1.5970% | Nov 2025 | — | 356,508 | 356,508 | ||||||||||||||||||||||||
| 37,321,600 | EUR | 39,753,310 | 6 Month EURIBOR | Fixed 1.5707% | Nov 2025 | — | 659,386 | 659,386 | ||||||||||||||||||||||||
| 18,660,800 | EUR | 20,033,280 | 6 Month EURIBOR | Fixed 1.5395% | Nov 2025 | — | 296,815 | 296,815 | ||||||||||||||||||||||||
| 18,660,800 | EUR | 19,866,286 | 6 Month EURIBOR | Fixed 1.506% | Nov 2025 | — | 263,060 | 263,060 | ||||||||||||||||||||||||
| 50,479,585 | EUR | 53,742,851 | 6 Month EURIBOR | Fixed 1.5174% | Nov 2025 | — | 738,806 | 738,806 | ||||||||||||||||||||||||
| 30,287,400 | EUR | 32,159,057 | 6 Month EURIBOR | Fixed 1.5037% | Nov 2025 | — | 420,049 | 420,049 | ||||||||||||||||||||||||
| 20,191,600 | EUR | 21,439,371 | 6 Month EURIBOR | Fixed 1.5120% | Nov 2025 | — | 288,968 | 288,968 | ||||||||||||||||||||||||
| 40,383,200 | EUR | 42,804,206 | 6 Month EURIBOR | Fixed 1.5010% | Dec 2025 | — | 549,461 | 549,461 | ||||||||||||||||||||||||
| 30,287,400 | EUR | 32,000,042 | 6 Month EURIBOR | Fixed 1.5290% | Dec 2025 | — | 456,321 | 456,321 | ||||||||||||||||||||||||
| 10,095,800 | EUR | 10,666,681 | 6 Month EURIBOR | Fixed 1.5270% | Dec 2025 | — | 151,031 | 151,031 | ||||||||||||||||||||||||
| 40,383,200 | EUR | 42,935,273 | 6 Month EURIBOR | Fixed 1.5500% | Dec 2025 | — | 652,332 | 652,332 | ||||||||||||||||||||||||
| 50,479,000 | EUR | 53,585,911 | 6 Month EURIBOR | Fixed 1.5222% | Dec 2025 | — | 738,973 | 738,973 | ||||||||||||||||||||||||
| 30,287,400 | EUR | 33,161,508 | 6 Month EURIBOR | Fixed 1.5634% | Dec 2025 | — | 506,943 | 506,943 | ||||||||||||||||||||||||
| 60,574,800 | EUR | 65,865,800 | 6 Month EURIBOR | Fixed 1.7020% | Dec 2025 | — | 1,459,580 | 1,459,580 | ||||||||||||||||||||||||
| 40,383,200 | EUR | 43,795,766 | 6 Month EURIBOR | Fixed 1.6285% | Dec 2025 | — | 813,539 | 813,539 | ||||||||||||||||||||||||
| 29,075,700 | EUR | 31,673,566 | 6 Month EURIBOR | Fixed 1.5763% | Dec 2025 | — | 503,914 | 503,914 | ||||||||||||||||||||||||
| 38,767,600 | EUR | 42,718,177 | 6 Month EURIBOR | Fixed 1.5790% | Dec 2025 | — | 676,206 | 676,206 | ||||||||||||||||||||||||
| 58,151,400 | EUR | 63,641,080 | 6 Month EURIBOR | Fixed 1.5975% | Dec 2025 | — | 1,065,997 | 1,065,997 | ||||||||||||||||||||||||
| 29,075,700 | EUR | 31,949,914 | 6 Month EURIBOR | Fixed 1.5593% | Dec 2025 | — | 472,933 | 472,933 | ||||||||||||||||||||||||
| 29,075,700 | EUR | 31,945,351 | 6 Month EURIBOR | Fixed 1.5723% | Dec 2025 | — | 492,130 | 492,130 | ||||||||||||||||||||||||
| 29,075,700 | EUR | 31,756,591 | 6 Month EURIBOR | Fixed 1.6743% | Dec 2025 | — | 649,218 | 649,218 | ||||||||||||||||||||||||
| 29,075,700 | EUR | 31,734,755 | 6 Month EURIBOR | Fixed 1.6787% | Dec 2025 | — | 655,086 | 655,086 | ||||||||||||||||||||||||
| 29,075,700 | EUR | 31,452,571 | 6 Month EURIBOR | Fixed 1.6203% | Dec 2025 | — | 561,803 | 561,803 | ||||||||||||||||||||||||
| 29,075,700 | EUR | 31,608,145 | 6 Month EURIBOR | Fixed 1.5523% | Dec 2025 | — | 455,571 | 455,571 | ||||||||||||||||||||||||
| 38,767,600 | EUR | 41,983,539 | 6 Month EURIBOR | Fixed 1.6108% | Jan 2026 | — | 709,547 | 709,547 | ||||||||||||||||||||||||
| 67,843,300 | EUR | 72,938,021 | 6 Month EURIBOR | Fixed 1.5823% | Jan 2026 | — | 1,136,457 | 1,136,457 | ||||||||||||||||||||||||
| 20,910,800 | EUR | 22,867,079 | 6 Month EURIBOR | Fixed 1.5738% | Jan 2026 | — | 338,064 | 338,064 | ||||||||||||||||||||||||
| 41,821,600 | EUR | 45,671,228 | 6 Month EURIBOR | Fixed 1.5462% | Jan 2026 | — | 613,721 | 613,721 | ||||||||||||||||||||||||
| 41,821,600 | EUR | 45,384,757 | 6 Month EURIBOR | Fixed 1.5519% | Jan 2026 | — | 624,916 | 624,916 | ||||||||||||||||||||||||
| 41,821,600 | EUR | 45,391,161 | 6 Month EURIBOR | Fixed 1.5831% | Jan 2026 | — | 692,978 | 692,978 | ||||||||||||||||||||||||
| 31,366,200 | EUR | 34,134,137 | 6 Month EURIBOR | Fixed 1.5200% | Jan 2026 | — | 413,288 | 413,288 | ||||||||||||||||||||||||
| 31,365,815 | EUR | 34,077,350 | 6 Month EURIBOR | Fixed 1.4992% | Jan 2026 | — | 375,451 | 375,451 | ||||||||||||||||||||||||
| 38,123,400 | GBP | 57,688,432 | Fixed 2.2773% | 6 Month LIBOR | Oct 2025 | — | (615,504 | ) | (615,504 | ) |
| Counterparty | Notional amount |
Currency | USD notional amount |
Payments made by fund |
Payments received by fund |
Maturity date |
Unamortized upfront payment paid (received) |
Unrealized appreciation (depreciation) |
Market value |
|||||||||||||||||||||||
| 114,370,200 | GBP | 173,303,937 | Fixed 2.2981% | 6 Month LIBOR | Oct 2025 | — | (2,003,190 | ) | (2,003,190 | ) | ||||||||||||||||||||||
| 63,539,000 | GBP | 96,458,283 | Fixed 2.2026% | 6 Month LIBOR | Oct 2025 | — | (711,677 | ) | (711,677 | ) | ||||||||||||||||||||||
| 76,246,800 | GBP | 116,215,705 | Fixed 2.3090% | 6 Month LIBOR | Oct 2025 | — | (1,382,101 | ) | (1,382,101 | ) | ||||||||||||||||||||||
| 25,415,600 | GBP | 38,957,082 | Fixed 2.3355% | 6 Month LIBOR | Oct 2025 | — | (504,455 | ) | (504,455 | ) | ||||||||||||||||||||||
| 50,831,200 | GBP | 78,068,529 | Fixed 2.3045% | 6 Month LIBOR | Oct 2025 | — | (904,119 | ) | (904,119 | ) | ||||||||||||||||||||||
| 38,123,400 | GBP | 58,403,395 | Fixed 2.3653% | 6 Month LIBOR | Oct 2025 | — | (829,866 | ) | (829,866 | ) | ||||||||||||||||||||||
| 114,370,200 | GBP | 174,552,364 | Fixed 2.3100% | 6 Month LIBOR | Oct 2025 | — | (2,063,618 | ) | (2,063,618 | ) | ||||||||||||||||||||||
| 25,415,600 | GBP | 39,357,047 | Fixed 2.2915% | 6 Month LIBOR | Oct 2025 | — | (427,089 | ) | (427,089 | ) | ||||||||||||||||||||||
| 12,707,800 | GBP | 19,677,914 | Fixed 2.2640% | 6 Month LIBOR | Oct 2025 | — | (190,248 | ) | (190,248 | ) | ||||||||||||||||||||||
| 50,831,200 | GBP | 78,503,784 | Fixed 2.3935% | 6 Month LIBOR | Oct 2025 | — | (1,188,855 | ) | (1,188,855 | ) | ||||||||||||||||||||||
| 101,662,400 | GBP | 156,748,539 | Fixed 2.3561% | 6 Month LIBOR | Oct 2025 | — | (2,125,495 | ) | (2,125,495 | ) | ||||||||||||||||||||||
| 12,707,800 | GBP | 19,561,898 | Fixed 2.3320% | 6 Month LIBOR | Oct 2025 | — | (245,251 | ) | (245,251 | ) | ||||||||||||||||||||||
| 38,123,400 | GBP | 58,654,994 | Fixed 2.4525% | 6 Month LIBOR | Nov 2025 | — | (1,027,507 | ) | (1,027,507 | ) | ||||||||||||||||||||||
| 50,831,200 | GBP | 77,308,634 | Fixed 2.4294% | 6 Month LIBOR | Nov 2025 | — | (1,291,676 | ) | (1,291,676 | ) | ||||||||||||||||||||||
| 50,831,200 | GBP | 76,498,864 | Fixed 2.4491% | 6 Month LIBOR | Nov 2025 | — | (1,356,370 | ) | (1,356,370 | ) | ||||||||||||||||||||||
| 50,257,200 | GBP | 75,975,752 | Fixed 2.5234% | 6 Month LIBOR | Nov 2025 | — | (1,583,037 | ) | (1,583,037 | ) | ||||||||||||||||||||||
| 50,257,200 | GBP | 76,528,757 | Fixed 2.4925% | 6 Month LIBOR | Nov 2025 | — | (1,478,749 | ) | (1,478,749 | ) | ||||||||||||||||||||||
| 50,257,200 | GBP | 76,549,739 | Fixed 2.4362% | 6 Month LIBOR | Nov 2025 | — | (1,291,778 | ) | (1,291,778 | ) | ||||||||||||||||||||||
| 29,666,000 | GBP | 45,136,554 | Fixed 2.4425% | 6 Month LIBOR | Nov 2025 | — | (772,605 | ) | (772,605 | ) | ||||||||||||||||||||||
| 59,332,000 | GBP | 90,390,006 | Fixed 2.3837% | 6 Month LIBOR | Nov 2025 | — | (1,314,883 | ) | (1,314,883 | ) | ||||||||||||||||||||||
| 29,666,000 | GBP | 45,353,228 | Fixed 2.3287% | 6 Month LIBOR | Nov 2025 | — | (549,586 | ) | (549,586 | ) | ||||||||||||||||||||||
| 29,666,000 | GBP | 45,072,776 | Fixed 2.3025% | 6 Month LIBOR | Nov 2025 | — | (497,753 | ) | (497,753 | ) | ||||||||||||||||||||||
| 74,234,000 | GBP | 111,944,868 | Fixed 2.2562% | 6 Month LIBOR | Nov 2025 | — | (1,014,567 | ) | (1,014,567 | ) | ||||||||||||||||||||||
| 44,540,400 | GBP | 67,362,976 | Fixed 2.2920% | 6 Month LIBOR | Nov 2025 | — | (712,513 | ) | (712,513 | ) | ||||||||||||||||||||||
| 29,693,600 | GBP | 44,908,651 | Fixed 2.3200% | 6 Month LIBOR | Nov 2025 | — | (529,623 | ) | (529,623 | ) | ||||||||||||||||||||||
| 59,387,200 | GBP | 89,368,567 | Fixed 2.2750% | 6 Month LIBOR | Nov 2025 | — | (880,983 | ) | (880,983 | ) | ||||||||||||||||||||||
| 44,540,400 | GBP | 67,081,946 | Fixed 2.3090% | 6 Month LIBOR | Nov 2025 | — | (757,853 | ) | (757,853 | ) | ||||||||||||||||||||||
| 14,846,800 | GBP | 22,360,649 | Fixed 2.3160% | 6 Month LIBOR | Nov 2025 | — | (259,436 | ) | (259,436 | ) | ||||||||||||||||||||||
| 59,387,200 | GBP | 89,565,349 | Fixed 2.3394% | 6 Month LIBOR | Dec 2025 | — | (1,128,238 | ) | (1,128,238 | ) | ||||||||||||||||||||||
| 74,234,000 | GBP | 110,942,731 | Fixed 2.2861% | 6 Month LIBOR | Dec 2025 | — | (1,149,009 | ) | (1,149,009 | ) | ||||||||||||||||||||||
| 44,540,400 | GBP | 67,500,796 | Fixed 2.3223% | 6 Month LIBOR | Dec 2025 | — | (794,429 | ) | (794,429 | ) | ||||||||||||||||||||||
| 89,080,800 | GBP | 134,569,240 | Fixed 2.4760% | 6 Month LIBOR | Dec 2025 | — | (2,486,139 | ) | (2,486,139 | ) | ||||||||||||||||||||||
| 59,387,200 | GBP | 89,386,053 | Fixed 2.3990% | 6 Month LIBOR | Dec 2025 | — | (1,354,152 | ) | (1,354,152 | ) | ||||||||||||||||||||||
| 42,758,400 | GBP | 64,165,191 | Fixed 2.3488% | 6 Month LIBOR | Dec 2025 | — | (832,954 | ) | (832,954 | ) | ||||||||||||||||||||||
| 57,011,200 | GBP | 86,545,830 | Fixed 2.3733% | 6 Month LIBOR | Dec 2025 | — | (1,201,175 | ) | (1,201,175 | ) | ||||||||||||||||||||||
| 85,516,800 | GBP | 129,629,832 | Fixed 2.3915% | 6 Month LIBOR | Dec 2025 | — | (1,902,280 | ) | (1,902,280 | ) | ||||||||||||||||||||||
| 42,758,400 | GBP | 65,102,087 | Fixed 2.3673% | 6 Month LIBOR | Dec 2025 | — | (882,366 | ) | (882,366 | ) | ||||||||||||||||||||||
| 42,758,400 | GBP | 64,716,816 | Fixed 2.3907% | 6 Month LIBOR | Dec 2025 | — | (945,864 | ) | (945,864 | ) | ||||||||||||||||||||||
| 42,758,400 | GBP | 64,298,346 | Fixed 2.4668% | 6 Month LIBOR | Dec 2025 | — | (1,158,309 | ) | (1,158,309 | ) | ||||||||||||||||||||||
| 42,758,400 | GBP | 64,140,166 | Fixed 2.4578% | 6 Month LIBOR | Dec 2025 | — | (1,132,202 | ) | (1,132,202 | ) | ||||||||||||||||||||||
| 42,758,400 | GBP | 63,691,125 | Fixed 2.3960% | 6 Month LIBOR | Dec 2025 | — | (957,964 | ) | (957,964 | ) | ||||||||||||||||||||||
| 42,758,400 | GBP | 63,788,993 | Fixed 2.3575% | 6 Month LIBOR | Dec 2025 | — | (849,094 | ) | (849,094 | ) | ||||||||||||||||||||||
| 57,011,200 | GBP | 83,931,337 | Fixed 2.4095% | 6 Month LIBOR | Jan 2026 | — | (1,308,065 | ) | (1,308,065 | ) | ||||||||||||||||||||||
| 99,769,600 | GBP | 146,377,734 | Fixed 2.3901% | 6 Month LIBOR | Jan 2026 | — | (2,159,988 | ) | (2,159,988 | ) | ||||||||||||||||||||||
| 30,751,000 | GBP | 44,960,889 | Fixed 2.3368% | 6 Month LIBOR | Jan 2026 | — | (557,032 | ) | (557,032 | ) | ||||||||||||||||||||||
| 61,502,000 | GBP | 89,349,585 | Fixed 2.2975% | 6 Month LIBOR | Jan 2026 | — | (954,324 | ) | (954,324 | ) | ||||||||||||||||||||||
| 61,502,000 | GBP | 89,461,358 | Fixed 2.3156% | 6 Month LIBOR | Jan 2026 | — | (1,024,046 | ) | (1,024,046 | ) | ||||||||||||||||||||||
| 61,502,000 | GBP | 88,808,987 | Fixed 2.3294% | 6 Month LIBOR | Jan 2026 | — | (1,078,502 | ) | (1,078,502 | ) | ||||||||||||||||||||||
| 46,126,500 | GBP | 66,578,860 | Fixed 2.2883% | 6 Month LIBOR | Jan 2026 | — | (683,695 | ) | (683,695 | ) |
| Counterparty | Notional amount |
Currency | USD notional amount |
Payments made by fund |
Payments received by fund |
Maturity date |
Unamortized upfront payment paid (received) |
Unrealized appreciation (depreciation) |
Market value |
|||||||||||||||||||||||
| 46,126,900 | GBP | 66,482,517 | Fixed 2.2392% | 6 Month LIBOR | Jan 2026 | — | (534,337 | ) | (534,337 | ) | ||||||||||||||||||||||
| 49,743,000 | USD | 49,743,000 | Fixed 1.2400% | 3 Month LIBOR | Dec 2016 | — | (299,953 | ) | (299,953 | ) | ||||||||||||||||||||||
| 126,049,000 | USD | 126,049,000 | Fixed 1.2725% | 3 Month LIBOR | Dec 2016 | — | (794,392 | ) | (794,392 | ) | ||||||||||||||||||||||
| 126,049,000 | USD | 126,049,000 | Fixed 1.2725% | 3 Month LIBOR | Dec 2016 | — | (794,392 | ) | (794,392 | ) | ||||||||||||||||||||||
| 126,049,000 | USD | 126,049,000 | Fixed 1.2280% | 3 Month LIBOR | Dec 2016 | — | (731,683 | ) | (731,683 | ) | ||||||||||||||||||||||
| 252,098,000 | USD | 252,098,000 | Fixed 1.2280% | 3 Month LIBOR | Dec 2016 | — | (1,463,366 | ) | (1,463,366 | ) | ||||||||||||||||||||||
| 126,049,000 | USD | 126,049,000 | Fixed 1.2250% | 3 Month LIBOR | Dec 2016 | — | (727,836 | ) | (727,836 | ) | ||||||||||||||||||||||
| 126,049,000 | USD | 126,049,000 | Fixed 1.2250% | 3 Month LIBOR | Dec 2016 | — | (727,836 | ) | (727,836 | ) | ||||||||||||||||||||||
| 126,049,000 | USD | 126,049,000 | Fixed 1.1575% | 3 Month LIBOR | Dec 2016 | — | (637,801 | ) | (637,801 | ) | ||||||||||||||||||||||
| 126,049,000 | USD | 126,049,000 | Fixed 1.1850% | 3 Month LIBOR | Dec 2016 | — | (672,647 | ) | (672,647 | ) | ||||||||||||||||||||||
| 126,049,000 | USD | 126,049,000 | Fixed 1.2050% | 3 Month LIBOR | Dec 2016 | — | (682,602 | ) | (682,602 | ) | ||||||||||||||||||||||
| 126,049,000 | USD | 126,049,000 | Fixed 1.2850% | 3 Month LIBOR | Dec 2016 | — | (777,844 | ) | (777,844 | ) | ||||||||||||||||||||||
| 120,285,000 | USD | 120,285,000 | Fixed 1.2850% | 3 Month LIBOR | Dec 2016 | — | (739,306 | ) | (739,306 | ) | ||||||||||||||||||||||
| 120,285,000 | USD | 120,285,000 | Fixed 1.3000% | 3 Month LIBOR | Dec 2016 | — | (757,389 | ) | (757,389 | ) | ||||||||||||||||||||||
| 240,570,000 | USD | 240,570,000 | Fixed 1.3300% | 3 Month LIBOR | Dec 2016 | — | (1,599,879 | ) | (1,599,879 | ) | ||||||||||||||||||||||
| 134,430,000 | USD | 134,430,000 | Fixed 1.2450% | 3 Month LIBOR | Jan 2017 | — | (748,013 | ) | (748,013 | ) | ||||||||||||||||||||||
| 134,430,000 | USD | 134,430,000 | Fixed 1.2700% | 3 Month LIBOR | Jan 2017 | — | (781,700 | ) | (781,700 | ) | ||||||||||||||||||||||
| 148,046,000 | USD | 148,046,000 | Fixed 1.1475% | 3 Month LIBOR | Jan 2017 | — | (679,261 | ) | (679,261 | ) | ||||||||||||||||||||||
| 271,954,000 | USD | 271,954,000 | Fixed 1.0765% | 3 Month LIBOR | Jan 2017 | — | (1,044,707 | ) | (1,044,707 | ) | ||||||||||||||||||||||
| 175,236,000 | USD | 175,236,000 | Fixed 1.0380% | 3 Month LIBOR | Jan 2017 | — | (602,695 | ) | (602,695 | ) | ||||||||||||||||||||||
| 175,236,000 | USD | 175,236,000 | Fixed 1.0428% | 3 Month LIBOR | Jan 2017 | — | (611,718 | ) | (611,718 | ) | ||||||||||||||||||||||
| 116,824,000 | USD | 116,824,000 | Fixed 1.0575% | 3 Month LIBOR | Jan 2017 | — | (423,542 | ) | (423,542 | ) | ||||||||||||||||||||||
| 116,824,000 | USD | 116,824,000 | Fixed 1.1250% | 3 Month LIBOR | Jan 2017 | — | (501,872 | ) | (501,872 | ) | ||||||||||||||||||||||
| 56,064,000 | USD | 56,064,000 | Fixed 1.0830% | 3 Month LIBOR | Feb 2017 | — | (214,630 | ) | (214,630 | ) | ||||||||||||||||||||||
| 262,120,000 | USD | 262,120,000 | Fixed 1.3700% | 3 Month LIBOR | Feb 2017 | — | (1,734,710 | ) | (1,734,710 | ) | ||||||||||||||||||||||
| 56,064,000 | USD | 56,064,000 | Fixed 1.4100% | 3 Month LIBOR | Feb 2017 | — | (393,373 | ) | (393,373 | ) | ||||||||||||||||||||||
| 209,696,000 | USD | 209,696,000 | Fixed 1.3075% | 3 Month LIBOR | Feb 2017 | — | (1,255,890 | ) | (1,255,890 | ) | ||||||||||||||||||||||
| 40,866,000 | USD | 40,866,000 | Fixed 1.3170% | 3 Month LIBOR | Feb 2017 | — | (249,156 | ) | (249,156 | ) | ||||||||||||||||||||||
| 48,823,000 | USD | 48,823,000 | Fixed 1.3250% | 3 Month LIBOR | Feb 2017 | — | (301,580 | ) | (301,580 | ) | ||||||||||||||||||||||
| 81,732,000 | USD | 81,732,000 | Fixed 1.2850% | 3 Month LIBOR | Feb 2017 | — | (470,433 | ) | (470,433 | ) | ||||||||||||||||||||||
| 81,732,000 | USD | 81,732,000 | Fixed 1.2615% | 3 Month LIBOR | Mar 2017 | — | (449,395 | ) | (449,395 | ) | ||||||||||||||||||||||
| 122,598,000 | USD | 122,598,000 | Fixed 1.3070% | 3 Month LIBOR | Mar 2017 | — | (731,003 | ) | (731,003 | ) | ||||||||||||||||||||||
| 163,464,000 | USD | 163,464,000 | Fixed 1.3480% | 3 Month LIBOR | Mar 2017 | — | (1,033,877 | ) | (1,033,877 | ) | ||||||||||||||||||||||
| 81,732,000 | USD | 81,732,000 | Fixed 1.3300% | 3 Month LIBOR | Mar 2017 | — | (501,115 | ) | (501,115 | ) | ||||||||||||||||||||||
| 81,732,000 | USD | 81,732,000 | Fixed 1.4110% | 3 Month LIBOR | Mar 2017 | — | (566,207 | ) | (566,207 | ) | ||||||||||||||||||||||
| 81,732,000 | USD | 81,732,000 | Fixed 1.4072% | 3 Month LIBOR | Mar 2017 | — | (561,033 | ) | (561,033 | ) | ||||||||||||||||||||||
| 127,589,000 | USD | 127,589,000 | Fixed 1.3520% | 3 Month LIBOR | Mar 2017 | — | (803,721 | ) | (803,721 | ) | ||||||||||||||||||||||
| 500,000,000 | USD | 500,000,000 | Fixed 1.2980% | 3 Month LIBOR | May 2017 | — | (2,611,050 | ) | (2,611,050 | ) | ||||||||||||||||||||||
| 158,650,000 | USD | 158,650,000 | Fixed 1.4150% | 3 Month LIBOR | Jun 2017 | — | (994,053 | ) | (994,053 | ) | ||||||||||||||||||||||
| 1,660,000,000 | USD | 1,660,000,000 | Fixed 1.0780% | 3 Month LIBOR | Feb 2018 | — | (1,451,006 | ) | (1,451,006 | ) | ||||||||||||||||||||||
| 22,854,000 | USD | 22,854,000 | 3 Month LIBOR | Fixed 2.9650% | Dec 2024 | — | 816,697 | 816,697 | ||||||||||||||||||||||||
| 58,120,000 | USD | 58,120,000 | 3 Month LIBOR | Fixed 2.9775% | Dec 2024 | — | 2,109,018 | 2,109,018 | ||||||||||||||||||||||||
| 58,120,000 | USD | 58,120,000 | 3 Month LIBOR | Fixed 2.9762% | Dec 2024 | — | 2,105,676 | 2,105,676 | ||||||||||||||||||||||||
| 58,120,000 | USD | 58,120,000 | 3 Month LIBOR | Fixed 2.8750% | Dec 2024 | — | 1,830,001 | 1,830,001 | ||||||||||||||||||||||||
| 116,240,000 | USD | 116,240,000 | 3 Month LIBOR | Fixed 2.8750% | Dec 2024 | — | 3,660,002 | 3,660,002 | ||||||||||||||||||||||||
| 58,120,000 | USD | 58,120,000 | 3 Month LIBOR | Fixed 2.8600% | Dec 2024 | — | 1,788,509 | 1,788,509 | ||||||||||||||||||||||||
| 58,120,000 | USD | 58,120,000 | 3 Month LIBOR | Fixed 2.8550% | Dec 2024 | — | 1,775,136 | 1,775,136 | ||||||||||||||||||||||||
| 58,120,000 | USD | 58,120,000 | 3 Month LIBOR | Fixed 2.7800% | Dec 2024 | — | 1,573,204 | 1,573,204 | ||||||||||||||||||||||||
| 58,120,000 | USD | 58,120,000 | 3 Month LIBOR | Fixed 2.7800% | Dec 2024 | — | 1,573,204 | 1,573,204 |
| Counterparty | Notional amount |
Currency | USD notional amount |
Payments made by fund |
Payments received by fund |
Maturity date |
Unamortized upfront payment paid (received) |
Unrealized appreciation (depreciation) |
Market value |
|||||||||||||||||||||||
| 58,120,000 | USD | 58,120,000 | 3 Month LIBOR | Fixed 2.7850% | Dec 2024 | — | 1,585,240 | 1,585,240 | ||||||||||||||||||||||||
| 58,120,000 | USD | 58,120,000 | 3 Month LIBOR | Fixed 2.9000% | Dec 2024 | — | 1,888,046 | 1,888,046 | ||||||||||||||||||||||||
| 55,423,000 | USD | 55,423,000 | 3 Month LIBOR | Fixed 2.9200% | Dec 2024 | — | 1,851,439 | 1,851,439 | ||||||||||||||||||||||||
| 55,423,000 | USD | 55,423,000 | 3 Month LIBOR | Fixed 2.9100% | Dec 2024 | — | 1,825,933 | 1,825,933 | ||||||||||||||||||||||||
| 110,846,000 | USD | 110,846,000 | 3 Month LIBOR | Fixed 2.8800% | Dec 2024 | — | 3,496,205 | 3,496,205 | ||||||||||||||||||||||||
| 93,064,000 | USD | 93,064,000 | 3 Month LIBOR | Fixed 2.7522% | Mar 2025 | — | 2,253,387 | 2,253,387 | ||||||||||||||||||||||||
| 46,532,000 | USD | 46,532,000 | 3 Month LIBOR | Fixed 2.9110% | Mar 2025 | — | 1,460,528 | 1,460,528 | ||||||||||||||||||||||||
| 46,532,000 | USD | 46,532,000 | 3 Month LIBOR | Fixed 2.8060% | Mar 2025 | — | 1,235,648 | 1,235,648 | ||||||||||||||||||||||||
| 46,532,000 | USD | 46,532,000 | 3 Month LIBOR | Fixed 2.7852% | Mar 2025 | — | 1,189,516 | 1,189,516 | ||||||||||||||||||||||||
| 40,334,000 | USD | 40,334,000 | 3 Month LIBOR | Fixed 2.7150% | Mar 2025 | — | 899,097 | 899,097 | ||||||||||||||||||||||||
| 78,200,000 | USD | 78,200,000 | 3 Month LIBOR | Fixed 3.1542% | Jun 2025 | — | 3,165,215 | 3,165,215 | ||||||||||||||||||||||||
| 77,781,000 | USD | 77,781,000 | 3 Month LIBOR | Fixed 3.2842% | Jul 2025 | — | 3,563,762 | 3,563,762 | ||||||||||||||||||||||||
| 104,003,000 | USD | 104,003,000 | 3 Month LIBOR | Fixed 3.3137% | Jul 2025 | — | 4,902,857 | 4,902,857 | ||||||||||||||||||||||||
| 156,004,000 | USD | 156,004,000 | 3 Month LIBOR | Fixed 3.2908% | Jul 2025 | — | 7,188,212 | 7,188,212 | ||||||||||||||||||||||||
| 130,004,000 | USD | 130,004,000 | 3 Month LIBOR | Fixed 3.2560% | Jul 2025 | — | 5,781,876 | 5,781,876 | ||||||||||||||||||||||||
| 52,748,000 | USD | 52,748,000 | 3 Month LIBOR | Fixed 3.2062% | Jul 2025 | — | 2,224,209 | 2,224,209 | ||||||||||||||||||||||||
| 50,895,000 | USD | 50,895,000 | 3 Month LIBOR | Fixed 3.1612% | Jul 2025 | — | 2,038,961 | 2,038,961 | ||||||||||||||||||||||||
| 208,006,000 | USD | 208,006,000 | 3 Month LIBOR | Fixed 3.1769% | Jul 2025 | — | 8,476,494 | 8,476,494 | ||||||||||||||||||||||||
| 82,459,000 | USD | 82,459,000 | 3 Month LIBOR | Fixed 3.0583% | Aug 2025 | — | 2,690,992 | 2,690,992 | ||||||||||||||||||||||||
| 189,928,000 | USD | 189,928,000 | 3 Month LIBOR | Fixed 2.9414% | Sep 2025 | — | 5,564,625 | 5,564,625 | ||||||||||||||||||||||||
| 59,746,000 | USD | 59,746,000 | 3 Month LIBOR | Fixed 2.9075% | Sep 2025 | — | 1,656,745 | 1,656,745 | ||||||||||||||||||||||||
| 127,238,000 | USD | 127,238,000 | 3 Month LIBOR | Fixed 2.8937% | Sep 2025 | — | 3,446,318 | 3,446,318 | ||||||||||||||||||||||||
| 102,688,000 | USD | 102,688,000 | 3 Month LIBOR | Fixed 2.8878% | Sep 2025 | — | 2,751,607 | 2,751,607 | ||||||||||||||||||||||||
| 87,621,300 | USD | 87,621,300 | 3 Month LIBOR | Fixed 2.7456% | Oct 2025 | — | 1,738,757 | 1,738,757 | ||||||||||||||||||||||||
| 29,207,100 | USD | 29,207,100 | 3 Month LIBOR | Fixed 2.6977% | Oct 2025 | — | 514,410 | 514,410 | ||||||||||||||||||||||||
| 63,600,000 | USD | 63,600,000 | Fixed 2.0112% | 3 Month LIBOR | Oct 2025 | — | (1,757,052 | ) | (1,757,052 | ) | ||||||||||||||||||||||
| 48,678,500 | USD | 48,678,500 | 3 Month LIBOR | Fixed 2.6484% | Oct 2025 | — | 747,629 | 747,629 | ||||||||||||||||||||||||
| 58,414,200 | USD | 58,414,200 | 3 Month LIBOR | Fixed 2.7426% | Oct 2025 | — | 1,144,106 | 1,144,106 | ||||||||||||||||||||||||
| 19,471,400 | USD | 19,471,400 | 3 Month LIBOR | Fixed 2.7585% | Oct 2025 | — | 395,010 | 395,010 | ||||||||||||||||||||||||
| 38,942,800 | USD | 38,942,800 | 3 Month LIBOR | Fixed 2.7170% | Oct 2025 | — | 714,386 | 714,386 | ||||||||||||||||||||||||
| 29,207,100 | USD | 29,207,100 | 3 Month LIBOR | Fixed 2.7740% | Oct 2025 | — | 611,202 | 611,202 | ||||||||||||||||||||||||
| 87,621,300 | USD | 87,621,300 | 3 Month LIBOR | Fixed 2.7111% | Oct 2025 | — | 1,580,338 | 1,580,338 | ||||||||||||||||||||||||
| 19,471,400 | USD | 19,471,400 | 3 Month LIBOR | Fixed 2.6755% | Oct 2025 | — | 319,440 | 319,440 | ||||||||||||||||||||||||
| 79,400,000 | USD | 79,400,000 | Fixed 2.0057% | 3 Month LIBOR | Oct 2025 | — | (2,110,810 | ) | (2,110,810 | ) | ||||||||||||||||||||||
| 9,735,700 | USD | 9,735,700 | 3 Month LIBOR | Fixed 2.6130% | Oct 2025 | — | 131,715 | 131,715 | ||||||||||||||||||||||||
| 38,942,800 | USD | 38,942,800 | 3 Month LIBOR | Fixed 2.7185% | Oct 2025 | — | 710,581 | 710,581 | ||||||||||||||||||||||||
| 77,885,600 | USD | 77,885,600 | 3 Month LIBOR | Fixed 2.6850% | Oct 2025 | — | 1,301,616 | 1,301,616 | ||||||||||||||||||||||||
| 9,735,700 | USD | 9,735,700 | 3 Month LIBOR | Fixed 2.6720% | Oct 2025 | — | 156,530 | 156,530 | ||||||||||||||||||||||||
| 29,207,100 | USD | 29,207,100 | 3 Month LIBOR | Fixed 2.7310% | Nov 2025 | — | 541,689 | 541,689 | ||||||||||||||||||||||||
| 38,942,800 | USD | 38,942,800 | 3 Month LIBOR | Fixed 2.7081% | Nov 2025 | — | 680,229 | 680,229 | ||||||||||||||||||||||||
| 38,942,800 | USD | 38,942,800 | 3 Month LIBOR | Fixed 2.7748% | Nov 2025 | — | 796,855 | 796,855 | ||||||||||||||||||||||||
| 38,503,600 | USD | 38,503,600 | 3 Month LIBOR | Fixed 2.8360% | Nov 2025 | — | 892,902 | 892,902 | ||||||||||||||||||||||||
| 38,503,600 | USD | 38,503,600 | 3 Month LIBOR | Fixed 2.8321% | Nov 2025 | — | 883,796 | 883,796 | ||||||||||||||||||||||||
| 38,503,600 | USD | 38,503,600 | 3 Month LIBOR | Fixed 2.7642% | Nov 2025 | — | 764,832 | 764,832 | ||||||||||||||||||||||||
| 22,728,000 | USD | 22,728,000 | 3 Month LIBOR | Fixed 2.7582% | Nov 2025 | — | 444,446 | 444,446 | ||||||||||||||||||||||||
| 45,456,000 | USD | 45,456,000 | 3 Month LIBOR | Fixed 2.7237% | Nov 2025 | — | 817,172 | 817,172 | ||||||||||||||||||||||||
| 22,728,000 | USD | 22,728,000 | 3 Month LIBOR | Fixed 2.6587% | Nov 2025 | — | 340,788 | 340,788 | ||||||||||||||||||||||||
| 22,728,000 | USD | 22,728,000 | 3 Month LIBOR | Fixed 2.6292% | Nov 2025 | — | 310,039 | 310,039 | ||||||||||||||||||||||||
| 34,741,500 | USD | 34,741,500 | 3 Month LIBOR | Fixed 2.6480% | Nov 2025 | — | 501,664 | 501,664 |
| Counterparty | Notional amount |
Currency | USD notional amount |
Payments made by fund |
Payments received by fund |
Maturity date |
Unamortized upfront payment paid (received) |
Unrealized appreciation (depreciation) |
Market value |
|||||||||||||||||||||||
| 57,902,604 | USD | 57,902,604 | 3 Month LIBOR | Fixed 2.6468% | Nov 2025 | — | 832,969 | 832,969 | ||||||||||||||||||||||||
| 23,161,000 | USD | 23,161,000 | 3 Month LIBOR | Fixed 2.6620% | Nov 2025 | — | 349,094 | 349,094 | ||||||||||||||||||||||||
| 46,322,000 | USD | 46,322,000 | 3 Month LIBOR | Fixed 2.6300% | Dec 2025 | — | 628,029 | 628,029 | ||||||||||||||||||||||||
| 34,741,500 | USD | 34,741,500 | 3 Month LIBOR | Fixed 2.6450% | Dec 2025 | — | 493,948 | 493,948 | ||||||||||||||||||||||||
| 11,580,500 | USD | 11,580,500 | 3 Month LIBOR | Fixed 2.6135% | Dec 2025 | — | 148,181 | 148,181 | ||||||||||||||||||||||||
| 46,322,000 | USD | 46,322,000 | 3 Month LIBOR | Fixed 2.6417% | Dec 2025 | — | 650,958 | 650,958 | ||||||||||||||||||||||||
| 57,902,500 | USD | 57,902,500 | 3 Month LIBOR | Fixed 2.6044% | Dec 2025 | — | 715,032 | 715,032 | ||||||||||||||||||||||||
| 34,741,500 | USD | 34,741,500 | 3 Month LIBOR | Fixed 2.6576% | Dec 2025 | — | 510,818 | 510,818 | ||||||||||||||||||||||||
| 69,483,000 | USD | 69,483,000 | 3 Month LIBOR | Fixed 2.7885% | Dec 2025 | — | 1,430,891 | 1,430,891 | ||||||||||||||||||||||||
| 46,322,000 | USD | 46,322,000 | 3 Month LIBOR | Fixed 2.7260% | Dec 2025 | — | 822,480 | 822,480 | ||||||||||||||||||||||||
| 33,351,900 | USD | 33,351,900 | 3 Month LIBOR | Fixed 2.6443% | Dec 2025 | — | 468,614 | 468,614 | ||||||||||||||||||||||||
| 44,469,200 | USD | 44,469,200 | 3 Month LIBOR | Fixed 2.6806% | Dec 2025 | — | 696,868 | 696,868 | ||||||||||||||||||||||||
| 66,703,800 | USD | 66,703,800 | 3 Month LIBOR | Fixed 2.6914% | Dec 2025 | — | 1,074,705 | 1,074,705 | ||||||||||||||||||||||||
| 33,351,900 | USD | 33,351,900 | 3 Month LIBOR | Fixed 2.6667% | Dec 2025 | — | 499,575 | 499,575 | ||||||||||||||||||||||||
| 33,351,900 | USD | 33,351,900 | 3 Month LIBOR | Fixed 2.6760% | Dec 2025 | — | 513,006 | 513,006 | ||||||||||||||||||||||||
| 33,351,900 | USD | 33,351,900 | 3 Month LIBOR | Fixed 2.7225% | Dec 2025 | — | 582,354 | 582,354 | ||||||||||||||||||||||||
| 33,351,900 | USD | 33,351,900 | 3 Month LIBOR | Fixed 2.7353% | Dec 2025 | — | 601,015 | 601,015 | ||||||||||||||||||||||||
| 33,351,900 | USD | 33,351,900 | 3 Month LIBOR | Fixed 2.7040% | Dec 2025 | — | 552,394 | 552,394 | ||||||||||||||||||||||||
| 33,351,900 | USD | 33,351,900 | 3 Month LIBOR | Fixed 2.6460% | Dec 2025 | — | 464,542 | 464,542 | ||||||||||||||||||||||||
| 44,469,200 | USD | 44,469,200 | 3 Month LIBOR | Fixed 2.6480% | Jan 2026 | — | 612,559 | 612,559 | ||||||||||||||||||||||||
| 77,821,100 | USD | 77,821,100 | 3 Month LIBOR | Fixed 2.6621% | Jan 2026 | — | 1,119,993 | 1,119,993 | ||||||||||||||||||||||||
| 23,985,400 | USD | 23,985,400 | 3 Month LIBOR | Fixed 2.6060% | Jan 2026 | — | 283,052 | 283,052 | ||||||||||||||||||||||||
| 47,970,800 | USD | 47,970,800 | 3 Month LIBOR | Fixed 2.5810% | Jan 2026 | — | 511,316 | 511,316 | ||||||||||||||||||||||||
| 47,970,800 | USD | 47,970,800 | 3 Month LIBOR | Fixed 2.5385% | Jan 2026 | — | 418,718 | 418,718 | ||||||||||||||||||||||||
| 47,970,800 | USD | 47,970,800 | 3 Month LIBOR | Fixed 2.5509% | Jan 2026 | — | 444,685 | 444,685 | ||||||||||||||||||||||||
| 35,978,100 | USD | 35,978,100 | 3 Month LIBOR | Fixed 2.5117% | Jan 2026 | — | 269,408 | 269,408 | ||||||||||||||||||||||||
| 35,977,396 | USD | 35,977,396 | 3 Month LIBOR | Fixed 2.4453% | Jan 2026 | — | 159,556 | 159,556 | ||||||||||||||||||||||||
| 36,700,000 | USD | 36,700,000 | Fixed 2.4167% | 3 Month LIBOR | Oct 2035 | — | (1,779,154 | ) | (1,779,154 | ) | ||||||||||||||||||||||
| 44,700,000 | USD | 44,700,000 | Fixed 2.4032% | 3 Month LIBOR | Oct 2035 | — | (2,039,370 | ) | (2,039,370 | ) | ||||||||||||||||||||||
| 62,500,000 | USD | 62,500,000 | Fixed 3.6975% | 3 Month LIBOR | Sep 2044 | — | (4,394,775 | ) | (4,394,775 | ) | ||||||||||||||||||||||
| 62,500,000 | USD | 62,500,000 | Fixed 3.7150% | 3 Month LIBOR | Sep 2044 | — | (4,462,575 | ) | (4,462,575 | ) | ||||||||||||||||||||||
| 31,250,000 | USD | 31,250,000 | Fixed 3.7350% | 3 Month LIBOR | Sep 2044 | — | (2,270,031 | ) | (2,270,031 | ) | ||||||||||||||||||||||
| 62,500,000 | USD | 62,500,000 | Fixed 3.7360% | 3 Month LIBOR | Sep 2044 | — | (4,543,938 | ) | (4,543,938 | ) | ||||||||||||||||||||||
| 62,500,000 | USD | 62,500,000 | Fixed 3.7445% | 3 Month LIBOR | Sep 2044 | — | (4,575,513 | ) | (4,575,513 | ) | ||||||||||||||||||||||
| 31,250,000 | USD | 31,250,000 | Fixed 3.7550% | 3 Month LIBOR | Sep 2044 | — | (2,308,088 | ) | (2,308,088 | ) | ||||||||||||||||||||||
| 156,250,000 | USD | 156,250,000 | Fixed 3.7357% | 3 Month LIBOR | Sep 2044 | — | (11,352,734 | ) | (11,352,734 | ) | ||||||||||||||||||||||
| 31,250,000 | USD | 31,250,000 | Fixed 3.6450% | 3 Month LIBOR | Sep 2044 | — | (2,095,078 | ) | (2,095,078 | ) | ||||||||||||||||||||||
| 62,500,000 | USD | 62,500,000 | Fixed 3.6450% | 3 Month LIBOR | Sep 2044 | — | (4,190,156 | ) | (4,190,156 | ) | ||||||||||||||||||||||
| 62,500,000 | USD | 62,500,000 | Fixed 3.6495% | 3 Month LIBOR | Sep 2044 | — | (4,207,588 | ) | (4,207,588 | ) | ||||||||||||||||||||||
| 125,000,000 | USD | 125,000,000 | Fixed 3.7412% | 3 Month LIBOR | Sep 2044 | — | (9,125,788 | ) | (9,125,788 | ) | ||||||||||||||||||||||
| 93,750,000 | USD | 93,750,000 | Fixed 3.6192% | 3 Month LIBOR | Sep 2044 | — | (6,133,500 | ) | (6,133,500 | ) | ||||||||||||||||||||||
| 93,750,000 | USD | 93,750,000 | Fixed 3.6317% | 3 Month LIBOR | Sep 2044 | — | (6,217,331 | ) | (6,217,331 | ) | ||||||||||||||||||||||
| 26,250,000 | USD | 26,250,000 | Fixed 3.5125% | 3 Month LIBOR | Oct 2044 | — | (1,543,453 | ) | (1,543,453 | ) | ||||||||||||||||||||||
| 26,250,000 | USD | 26,250,000 | Fixed 3.4750% | 3 Month LIBOR | Oct 2044 | — | (1,482,380 | ) | (1,482,380 | ) | ||||||||||||||||||||||
| 26,250,000 | USD | 26,250,000 | Fixed 3.5075% | 3 Month LIBOR | Oct 2044 | — | (1,535,189 | ) | (1,535,189 | ) | ||||||||||||||||||||||
| 6,044,000 | USD | 6,044,000 | Fixed 3.2050% | 3 Month LIBOR | Dec 2044 | — | (362,986 | ) | (362,986 | ) | ||||||||||||||||||||||
| 15,724,000 | USD | 15,724,000 | Fixed 3.2000% | 3 Month LIBOR | Dec 2044 | — | (936,430 | ) | (936,430 | ) | ||||||||||||||||||||||
| 15,724,000 | USD | 15,724,000 | Fixed 3.2000% | 3 Month LIBOR | Dec 2044 | — | (936,430 | ) | (936,430 | ) | ||||||||||||||||||||||
| 15,724,000 | USD | 15,724,000 | Fixed 3.0850% | 3 Month LIBOR | Dec 2044 | — | (758,996 | ) | (758,996 | ) |
| Counterparty | Notional amount |
Currency | USD notional amount |
Payments made by fund |
Payments received by fund |
Maturity date |
Unamortized upfront payment paid (received) |
Unrealized appreciation (depreciation) |
Market value |
|||||||||||||||||||||||
| 15,724,000 | USD | 15,724,000 | Fixed 3.0850% | 3 Month LIBOR | Dec 2044 | — | (758,996 | ) | (758,996 | ) | ||||||||||||||||||||||
| 15,724,000 | USD | 15,724,000 | Fixed 3.1220% | 3 Month LIBOR | Dec 2044 | — | (816,161 | ) | (816,161 | ) | ||||||||||||||||||||||
| 31,448,000 | USD | 31,448,000 | Fixed 3.1220% | 3 Month LIBOR | Dec 2044 | — | (1,632,321 | ) | (1,632,321 | ) | ||||||||||||||||||||||
| 15,724,000 | USD | 15,724,000 | 3 Month LIBOR | Fixed 2.9900% | Dec 2044 | $536,177 | 75,922 | 612,099 | ||||||||||||||||||||||||
| 15,724,000 | USD | 15,724,000 | Fixed 2.9900% | 3 Month LIBOR | Dec 2044 | — | (612,099 | ) | (612,099 | ) | ||||||||||||||||||||||
| 15,724,000 | USD | 15,724,000 | Fixed 3.0150% | 3 Month LIBOR | Dec 2044 | — | (650,716 | ) | (650,716 | ) | ||||||||||||||||||||||
| 15,724,000 | USD | 15,724,000 | Fixed 3.000% | 3 Month LIBOR | Dec 2044 | — | (627,430 | ) | (627,430 | ) | ||||||||||||||||||||||
| 15,724,000 | USD | 15,724,000 | Fixed 3.0400% | 3 Month LIBOR | Dec 2044 | — | (689,696 | ) | (689,696 | ) | ||||||||||||||||||||||
| 23,214,000 | USD | 23,214,000 | Fixed 3.0400% | 3 Month LIBOR | Dec 2044 | — | (1,018,226 | ) | (1,018,226 | ) | ||||||||||||||||||||||
| 11,607,000 | USD | 11,607,000 | Fixed 3.0700% | 3 Month LIBOR | Dec 2044 | — | (543,323 | ) | (543,323 | ) | ||||||||||||||||||||||
| 11,607,000 | USD | 11,607,000 | Fixed 3.0950% | 3 Month LIBOR | Dec 2044 | — | (571,830 | ) | (571,830 | ) | ||||||||||||||||||||||
| 9,286,000 | USD | 9,286,000 | Fixed 2.8000% | 3 Month LIBOR | Jan 2045 | — | (188,646 | ) | (188,646 | ) | ||||||||||||||||||||||
| 9,286,000 | USD | 9,286,000 | Fixed 2.8150% | 3 Month LIBOR | Jan 2045 | — | (202,311 | ) | (202,311 | ) | ||||||||||||||||||||||
| 4,237,000 | USD | 4,237,000 | Fixed 2.7170% | 3 Month LIBOR | Jan 2045 | — | (51,569 | ) | (51,569 | ) | ||||||||||||||||||||||
| 7,763,000 | USD | 7,763,000 | 3 Month LIBOR | Fixed 2.6481% | Jan 2045 | 16,293 | 25,772 | 42,065 | ||||||||||||||||||||||||
| 7,763,000 | USD | 7,763,000 | Fixed 2.6481% | 3 Month LIBOR | Jan 2045 | — | (42,065 | ) | (42,065 | ) | ||||||||||||||||||||||
| 14,604,000 | USD | 14,604,000 | 3 Month LIBOR | Fixed 2.6552% | Jan 2045 | 41,616 | 47,758 | 89,374 | ||||||||||||||||||||||||
| 14,604,000 | USD | 14,604,000 | Fixed 2.6552% | 3 Month LIBOR | Jan 2045 | — | (89,374 | ) | (89,374 | ) | ||||||||||||||||||||||
| 14,604,000 | USD | 14,604,000 | 3 Month LIBOR | Fixed 2.5988% | Jan 2045 | (44,327 | ) | 53,044 | 8,717 | |||||||||||||||||||||||
| 14,604,000 | USD | 14,604,000 | Fixed 2.5988% | 3 Month LIBOR | Jan 2045 | — | (8,717 | ) | (8,717 | ) | ||||||||||||||||||||||
| 9,736,000 | USD | 9,736,000 | Fixed 2.5750% | 3 Month LIBOR | Jan 2045 | — | 16,866 | 16,866 | ||||||||||||||||||||||||
| 9,736,000 | USD | 9,736,000 | 3 Month LIBOR | Fixed 2.7030% | Jan 2045 | 76,517 | 28,859 | 105,376 | ||||||||||||||||||||||||
| 9,736,000 | USD | 9,736,000 | Fixed 2.7030% | 3 Month LIBOR | Jan 2045 | — | (105,376 | ) | (105,376 | ) | ||||||||||||||||||||||
| 4,445,000 | USD | 4,445,000 | Fixed 2.5270% | 3 Month LIBOR | Feb 2045 | — | 28,454 | 28,454 | ||||||||||||||||||||||||
| 24,196,000 | USD | 24,196,000 | 3 Month LIBOR | Fixed 2.8200% | Feb 2045 | 430,426 | 109,377 | 539,803 | ||||||||||||||||||||||||
| 4,445,000 | USD | 4,445,000 | Fixed 2.8200% | 3 Month LIBOR | Feb 2045 | — | (99,166 | ) | (99,166 | ) | ||||||||||||||||||||||
| 24,196,000 | USD | 24,196,000 | Fixed 2.8200% | 3 Month LIBOR | Feb 2045 | — | (539,803 | ) | (539,803 | ) | ||||||||||||||||||||||
| 7,129,000 | USD | 7,129,000 | Fixed 2.8270% | 3 Month LIBOR | Feb 2045 | — | (163,984 | ) | (163,984 | ) | ||||||||||||||||||||||
| 4,566,000 | USD | 4,566,000 | Fixed 2.8500% | 3 Month LIBOR | Feb 2045 | — | (115,302 | ) | (115,302 | ) | ||||||||||||||||||||||
| 19,357,000 | USD | 19,357,000 | Fixed 2.8887% | 3 Month LIBOR | Feb 2045 | — | (562,187 | ) | (562,187 | ) | ||||||||||||||||||||||
| 14,258,000 | USD | 14,258,000 | Fixed 2.8200% | 3 Month LIBOR | Feb 2045 | — | (318,160 | ) | (318,160 | ) | ||||||||||||||||||||||
| 14,258,000 | USD | 14,258,000 | Fixed 2.7640% | 3 Month LIBOR | Mar 2045 | — | (239,892 | ) | (239,892 | ) | ||||||||||||||||||||||
| 21,387,000 | USD | 21,387,000 | Fixed 2.7761% | 3 Month LIBOR | Mar 2045 | — | (385,139 | ) | (385,139 | ) | ||||||||||||||||||||||
| 28,516,000 | USD | 28,516,000 | Fixed 2.8362% | 3 Month LIBOR | Mar 2045 | — | (681,113 | ) | (681,113 | ) | ||||||||||||||||||||||
| 14,258,000 | USD | 14,258,000 | Fixed 2.8632% | 3 Month LIBOR | Mar 2045 | — | (378,345 | ) | (378,345 | ) | ||||||||||||||||||||||
| 14,258,000 | USD | 14,258,000 | Fixed 2.9560% | 3 Month LIBOR | Mar 2045 | — | (507,585 | ) | (507,585 | ) | ||||||||||||||||||||||
| 102,200,000 | USD | 102,200,000 | Fixed 2.8170% | 3 Month LIBOR | Mar 2045 | — | (1,621,648 | ) | (1,621,648 | ) | ||||||||||||||||||||||
| 51,100,000 | USD | 51,100,000 | Fixed 2.8662% | 3 Month LIBOR | Mar 2045 | — | (965,115 | ) | (965,115 | ) | ||||||||||||||||||||||
| 51,100,000 | USD | 51,100,000 | Fixed 2.8812% | 3 Month LIBOR | Mar 2045 | — | (1,012,107 | ) | (1,012,107 | ) | ||||||||||||||||||||||
| 51,100,000 | USD | 51,100,000 | Fixed 2.9000% | 3 Month LIBOR | Mar 2045 | — | (1,070,846 | ) | (1,070,846 | ) | ||||||||||||||||||||||
| 14,258,000 | USD | 14,258,000 | Fixed 2.8295% | 3 Month LIBOR | Mar 2045 | — | (331,203 | ) | (331,203 | ) | ||||||||||||||||||||||
| 17,112,000 | USD | 17,112,000 | Fixed 2.7655% | 3 Month LIBOR | Mar 2045 | — | (290,791 | ) | (290,791 | ) | ||||||||||||||||||||||
| 75,000,000 | USD | 75,000,000 | Fixed 2.9800% | 3 Month LIBOR | May 2045 | — | (2,855,445 | ) | (2,855,445 | ) | ||||||||||||||||||||||
| 219,000,000 | USD | 219,000,000 | Fixed 3.1375% | 3 Month LIBOR | Jun 2045 | — | (7,771,500 | ) | (7,771,500 | ) | ||||||||||||||||||||||
| 109,500,000 | USD | 109,500,000 | Fixed 3.1378% | 3 Month LIBOR | Jun 2045 | — | (3,887,841 | ) | (3,887,841 | ) | ||||||||||||||||||||||
| 109,500,000 | USD | 109,500,000 | Fixed 3.2259% | 3 Month LIBOR | Jun 2045 | — | (4,474,794 | ) | (4,474,794 | ) | ||||||||||||||||||||||
| 80,000,000 | USD | 80,000,000 | Fixed 3.1800% | 3 Month LIBOR | Jun 2045 | — | (3,045,128 | ) | (3,045,128 | ) | ||||||||||||||||||||||
| 79,300,000 | USD | 79,300,000 | Fixed 3.1870% | 3 Month LIBOR | Jun 2045 | — | (4,605,934 | ) | (4,605,934 | ) | ||||||||||||||||||||||
| 116,500,000 | USD | 116,500,000 | Fixed 3.2355% | 3 Month LIBOR | Jun 2045 | — | (4,828,506 | ) | (4,828,506 | ) |
| Counterparty | Notional amount |
Currency | USD notional amount |
Payments made by fund |
Payments received by fund |
Maturity date |
Unamortized upfront payment paid (received) |
Unrealized appreciation (depreciation) |
Market value |
|||||||||||||||||||||||
| 120,400,000 | USD | 120,400,000 | Fixed 3.2524% | 3 Month LIBOR | Jun 2045 | — | (5,112,750 | ) | (5,112,750 | ) | ||||||||||||||||||||||
| 58,300,000 | USD | 58,300,000 | Fixed 3.2450% | 3 Month LIBOR | Jun 2045 | — | (2,456,115 | ) | (2,456,115 | ) | ||||||||||||||||||||||
| 43,700,000 | USD | 43,700,000 | Fixed 3.2083% | 3 Month LIBOR | Jul 2045 | — | (1,738,552 | ) | (1,738,552 | ) | ||||||||||||||||||||||
| 72,800,000 | USD | 72,800,000 | Fixed 3.2226% | 3 Month LIBOR | Jul 2045 | — | (2,959,509 | ) | (2,959,509 | ) | ||||||||||||||||||||||
| 14,600,000 | USD | 14,600,000 | Fixed 3.2500% | 3 Month LIBOR | Jul 2045 | — | (617,882 | ) | (617,882 | ) | ||||||||||||||||||||||
| 80,000,000 | USD | 80,000,000 | Fixed 3.1700% | 3 Month LIBOR | Jul 2045 | — | (2,995,704 | ) | (2,995,704 | ) | ||||||||||||||||||||||
| 85,800,000 | USD | 85,800,000 | Fixed 2.5352% | 3 Month LIBOR | Oct 2045 | — | (5,808,845 | ) | (5,808,845 | ) | ||||||||||||||||||||||
| 56,300,000 | USD | 56,300,000 | Fixed 2.5012% | 3 Month LIBOR | Oct 2045 | — | (3,338,698 | ) | (3,338,698 | ) | ||||||||||||||||||||||
| 293,000,000 | USD | 293,000,000 | Fixed 2.9226% | 6 Month LIBOR | Dec 2045 | — | (6,581,659 | ) | (6,581,659 | ) | ||||||||||||||||||||||
| $24,133,296,249 | $1,056,702 | ($55,273,052 | ) | ($54,216,350 | ) |
| The following are abbreviations for the table above: | |
| BBSW | Bank Bill Swap Rate |
| EURIBOR | Euro Interbank Offered Rate |
| LIBOR | London Interbank Offered Rate |
Credit default swaps. Credit default swaps (CDS) involve the exchange of a fixed rate premium (paid by the Buyer), for protection against the loss in value of an underlying debt instrument, referenced entity or index, in the event of a defined credit event (such as payment default or bankruptcy). Under the terms of the swap, one party acts as a "guarantor" (the Seller), receiving the premium and agreeing to contingent payments that are specified within the credit default agreement. The fund may enter into CDS in which it may act as either Buyer or Seller. By acting as the Seller, the fund may incur economic leverage since it would be obligated to pay the Buyer the notional amount of the contract in the event of a default. The amount of loss in such case could be significant, but would typically be reduced by any recovery value on the underlying credit.
Implied credit spreads are utilized in determining the market value of CDS agreements in which the fund is the Seller at period end. The implied credit spread generally represents the yield of the instrument above a credit-risk free rate, such as the U.S. Treasury Bond Yield, and may include upfront payments required to be made to enter into the agreement. It also serves as an indicator of the current status of the payment/performance risk and represents the likelihood or risk of default for the credit derivative. Wider credit spreads represent a deterioration of the referenced entity's creditworthiness and an increased risk of default or other credit event occurring as defined under the terms of the agreement.
For CDS agreements where implied credit spreads are not reported or available, the average credit rating on the underlying index is shown. Increasing market values, in absolute terms when compared to the notional amount of the swap, represent a deterioration of the referenced entity's creditworthiness and a greater likelihood of a credit event occurring. This is also represented by a decrease in the average credit rating of the underlying index. The maximum potential amount of future payments (undiscounted) that a fund as the Seller could be required to make under any CDS agreement equals the notional amount of the agreement.
The fund used CDS as a Seller of protection during the six months ended January 31, 2016 to take a long position in the exposure of the benchmark credit. The fund acted as Seller on credit default swap contracts with total USD notional amounts up to $256.9 million, as measured at each quarter end. The following table summarizes the credit default swap contracts the fund held as of January 31, 2016 where the fund acted as a Seller of protection:
| Counterparty | Reference obligation |
Implied credit spread 1-31-16 |
Notional amount |
Currency | USD notional amount |
(Pay)/ received fixed rate |
Maturity date |
Unamortized upfront payment paid (received) |
Unrealized appreciation (depreciation) |
Market value |
||||||||||||||||||||||
| Exchange Cleared Swaps | ||||||||||||||||||||||||||||||||
| Counterparty | Reference obligation |
Implied credit spread 1-31-16 |
Notional amount |
Currency | USD notional amount |
(Pay)/ received fixed rate |
Maturity date |
Unamortized upfront payment paid (received) |
Unrealized appreciation (depreciation) |
Market value |
||||||||||||||||||||||
| CDX.iTraxx 5Y | 2.89% | 98,100,000 | EUR | $109,336,504 | 5.000% | Dec 2020 | $9,087,525 | ($2,381,862 | ) | $6,705,663 | ||||||||||||||||||||||
| CDX.North America High Yield 25 5Y |
4.50% | 147,600,000 | USD | 147,600,000 | 5.000% | Dec 2020 | 58,037 | 507,822 | 565,859 | |||||||||||||||||||||||
| $256,936,504 | $9,145,562 | ($1,874,040 | ) | $7,271,522 |
Total Return Swaps Total return swaps are commitments where one party pays a fixed or variable rate premium (the Buyer) in exchange for a market-linked return (the Seller). The Seller pays the total return of a specific reference asset or index and in return receives interest payments from the Buyer To the extent the total return of the underlying asset or index exceeds or falls short of the offsetting interest rate obligation, the Buyer will receive or make a payment to the Seller. The fund may enter into total return swaps in which it may act as either the Buyer of the Seller.
During the six months ended January 31, 2016, the fund used total return swaps to manage against anticipated changes in securities, gain exposure to certain securities markets, and maintain diversity and liquidity of the fund. The fund held total return swaps with total USD notional amounts from $448.1 million to $1.3 billion, as measured at each quarter end. The following table summarizes the total return swap contracts held as of January 31, 2016:
| Pay/ receive |
Reference entity |
Floating rate |
Currency | Notional amount/ contract amount |
Maturity date |
Counterparty | Unamortized upfront payment paid (received) |
Unrealized appreciation (depreciation) | Market value |
||||||||||||||||||||
| Pay | Aegon | EURIBOR | EUR | 2,176,619 | Oct 2016 | Morgan Stanley | $467 | ($56,907 | ) | ($56,440 | ) | ||||||||||||||||||
| Pay | Aegon | EURIBOR | EUR | 5,730,128 | Oct 2016 | Morgan Stanley | 1,247 | (149,830 | ) | (148,583 | ) | ||||||||||||||||||
| Pay | Aegon | EURIBOR | EUR | 18,692,389 | Jun 2016 | Morgan Stanley | 2,655 | (487,350 | ) | (484,695 | ) | ||||||||||||||||||
| Pay | Allianz SE | EURIBOR | EUR | 45,990,360 | Jun 2016 | Morgan Stanley | 4,863 | 2,326,590 | 2,331,453 | ||||||||||||||||||||
| Pay | Allianz SE | EURIBOR | EUR | 4,163,640 | Oct 2016 | Morgan Stanley | 855 | 210,218 | 211,073 | ||||||||||||||||||||
| Pay | Assicurazi | EURIBOR | EUR | 3,547,800 | Oct 2016 | Morgan Stanley | 789 | 569,737 | 570,526 | ||||||||||||||||||||
| Pay | Assicurazioni | EURIBOR | EUR | 40,134,690 | Jun 2016 | Morgan Stanley | 4,760 | 6,449,353 | 6,454,113 | ||||||||||||||||||||
| Pay | Assicurazioni | EURIBOR | EUR | 1,231,200 | Oct 2016 | Morgan Stanley | 274 | 197,717 | 197,991 | ||||||||||||||||||||
| Pay | AXA SA | EURIBOR | EUR | 45,254,096 | Jun 2016 | Morgan Stanley | 4,915 | 3,132,187 | 3,137,102 | ||||||||||||||||||||
| Pay | AXA SA | EURIBOR | EUR | 4,918,834 | Oct 2016 | Morgan Stanley | 1,025 | 339,958 | 340,983 | ||||||||||||||||||||
| Pay | Baloise | LIBOR | CHF | 12,605,220 | Jun 2016 | Morgan Stanley | 1,391 | 38,083 | 39,474 | ||||||||||||||||||||
| Pay | Baloise | LIBOR | CHF | 885,654 | Oct 2016 | Morgan Stanley | 173 | 2,601 | 2,774 | ||||||||||||||||||||
| Pay | Baloise | LIBOR | CHF | 1,270,437 | Oct 2016 | Morgan Stanley | 247 | 3,731 | 3,978 | ||||||||||||||||||||
| Pay | Consumer Staple Select Sector Total Return |
LIBOR | USD | 56,624,631 | Sep 2016 | Deutsche Bank | 9,487 | 293,765 | 303,252 | ||||||||||||||||||||
| Pay | Consumer Staple Select Sector Total Return |
LIBOR | USD | 67,562,640 | Sep 2016 | Deutsche Bank | 11,096 | 349,327 | 360,423 | ||||||||||||||||||||
| Pay | Consumer Staple Select Sector Total Return |
LIBOR | USD | 56,235,915 | Sep 2016 | Citibank N.A. | 9,389 | 292,563 | 301,952 | ||||||||||||||||||||
| Pay | Consumer Staple Select Sector Total Return |
LIBOR | USD | 39,464,968 | Sep 2016 | Citibank N.A. | 6,598 | 205,304 | 211,902 | ||||||||||||||||||||
| Pay | Consumer Staple Select Sector Total Return |
LIBOR | USD | 44,933,273 | Sep 2016 | Citibank N.A. | 7,550 | 233,714 | 241,264 | ||||||||||||||||||||
| Pay | Delta Lloyd NV | EURIBOR | EUR | 686,016 | Jun 2016 | Morgan Stanley | 147 | (23,634 | ) | (23,487 | ) | ||||||||||||||||||
| Pay | Delta Lloyd NV | EURIBOR | EUR | 3,131,654 | Jun 2016 | Morgan Stanley | 654 | (107,872 | ) | (107,218 | ) | ||||||||||||||||||
| Pay | Delta Lloyd NV | EURIBOR | EUR | 1,062,342 | Oct 2016 | Morgan Stanley | 249 | (36,620 | ) | (36,371 | ) |
| Pay/ receive |
Reference entity |
Floating rate |
Currency | Notional amount/ contract amount |
Maturity date |
Counterparty | Unamortized upfront payment paid (received) |
Unrealized appreciation (depreciation) | Market value |
||||||||||||||||||||
| Pay | Delta Lloyd NV | EURIBOR | EUR | 476,147 | Oct 2016 | Morgan Stanley | 113 | (16,415 | ) | (16,302 | ) | ||||||||||||||||||
| Pay | Deltalloyd | EURIBOR | EUR | 763,079 | Oct 2016 | Morgan Stanley | 178 | (26,303 | ) | (26,125 | ) | ||||||||||||||||||
| Pay | Hang Seng Index | HIBOR | HKD | 289,499,655 | Jul 2016 | BNP Paribas | — | 4,924,387 | 4,924,387 | ||||||||||||||||||||
| Pay | Muenchener | EURIBOR | EUR | 45,364,116 | Jun 2016 | Morgan Stanley | 4,882 | 338,052 | 342,934 | ||||||||||||||||||||
| Pay | Muenchener | EURIBOR | EUR | 3,787,469 | Oct 2016 | Morgan Stanley | 789 | 27,843 | 28,632 | ||||||||||||||||||||
| Pay | NN Group | EURIBOR | EUR | 7,067,810 | Jun 2016 | Morgan Stanley | 685 | 167,445 | 168,130 | ||||||||||||||||||||
| Pay | NN Group | EURIBOR | EUR | 308,183 | Oct 2016 | Morgan Stanley | 60 | 7,271 | 7,331 | ||||||||||||||||||||
| Pay | Russell 2000 Total Return Index |
LIBOR | USD | 91,703,849 | Jun 2016 | BNP Paribas | — | 7,940,553 | 7,940,553 | ||||||||||||||||||||
| Pay | Russell 2000 Total Return Index |
LIBOR | USD | 121,033,324 | Dec 2016 | Goldman Sachs | — | 9,063,291 | 9,063,291 | ||||||||||||||||||||
| Pay | Russell 2000 Total Return Index |
LIBOR | USD | 223,466,324 | Dec 2016 | Goldman Sachs | — | 16,751,992 | 16,751,992 | ||||||||||||||||||||
| Pay | Storebrand | NIBOR | NOK | 27,504,147 | Jun 2016 | Morgan Stanley | 377 | 39,083 | 39,460 | ||||||||||||||||||||
| Pay | Storebrand | NIBOR | NOK | 3,742,511 | Oct 2016 | Morgan Stanley | 75 | 5,294 | 5,369 | ||||||||||||||||||||
| Pay | Storebrand | NIBOR | NOK | 4,628,279 | Oct 2016 | Morgan Stanley | 101 | (18,200 | ) | (18,099 | ) | ||||||||||||||||||
| Pay | Swiss Life | LIBOR | CHF | 17,756,893 | Jun 2016 | Morgan Stanley | 1,794 | 439,902 | 441,696 | ||||||||||||||||||||
| Pay | Swiss Life | LIBOR | CHF | 2,226,110 | Oct 2016 | Morgan Stanley | 406 | 54,968 | 55,374 | ||||||||||||||||||||
| Pay | Zurich Ins | LIBOR | CHF | 7,781,220 | Oct 2016 | Morgan Stanley | 1,563 | 733,342 | 734,905 | ||||||||||||||||||||
| Pay | Zurich Insurance Group AG |
LIBOR | CHF | 37,299,816 | Jun 2016 | Morgan Stanley | 4,771 | 3,518,047 | 3,522,818 | ||||||||||||||||||||
| Pay | Zurich Insurance Group AG |
LIBOR | CHF | 6,089,868 | Oct 2016 | Morgan Stanley | 1,222 | 573,942 | 575,164 | ||||||||||||||||||||
| Receive | Nasdaq100 | LIBOR | USD | 222,332,268 | Jan 2017 | BNP Paribas | — | 4,407,477 | 4,407,477 | ||||||||||||||||||||
| $85,847 | $62,714,606 | $62,800,453 |
| The following are abbreviations for the table above: | |
| EURIBOR | Euro Interbank Offered Rate |
| HIBOR | Hong Kong Interbank Offered Rate |
| LIBOR | London Interbank Offered Rate |
| NIBOR | Norwegian Interbank Offered Rate |
Variance Swaps. Variance swap agreements involve two parties agreeing to exchange cash flows based on the measured variance (or square of volatility) of a specified underlying asset. One party agrees to exchange a "fixed rate" or strike price payment for the "floating rate" or realized price variance on the underlying asset with respect to the notional amount. At inception, the strike price is generally chosen such that the fair value of the swap is zero. At the maturity date, a net cash flow is exchanged, where the payoff amount is equivalent to the difference between the realized price variance of the underlying asset and the strike price multiplied by the notional amount. As a receiver of the realized price variance, the fund would receive the payoff amount when the realized price variance of the underlying asset is greater than the strike price and would owe the payoff amount when the price variance is less than the strike price. As a payer of the realized price variance the fund would owe the payoff amount when the realized price variance of the underlying asset is greater than the strike price and would receive the payoff amount when the variance is less than the strike price.
During the six months ended January 31, 2016, the fund used variance swaps to maintain diversity and liquidity of the fund and manage against anticipated changes in securities markets/volatility. The fund held variance swaps with total USD notional amounts ranging from $8.7 million to $17.2 million, as measured at each quarter end. The following table summarizes the variance swap contracts held as of January 31, 2016:
| Counterparty | Reference entity | Currency | Notional amount |
USD notional amount |
Pay/ receive variance |
Maturity date |
Volatility strike price |
Unrealized appreciation (depreciation) |
Market value |
||||||||||||||||||||
| Barclays Capital | KOSPI 200 | KRW | 220,000,000 | $194,716 | Receive | Dec 2016 | 20.70% | ($175,992 | ) | ($175,992 | ) | ||||||||||||||||||
| Barclays Capital | S&P 500 Index | USD | 195,000 | 195,000 | Pay | Dec 2016 | 20.80% | 147,036 | 147,036 | ||||||||||||||||||||
| Barclays Capital | FTSE 100 | GBP | 129,000 | 192,667 | Pay | Dec 2016 | 19.85% | (359,343 | ) | (359,343 | ) | ||||||||||||||||||
| Barclays Capital | Hang Seng Index | HKD | 1,500,000 | 193,001 | Receive | Dec 2016 | 27.75% | 1,107,227 | 1,107,227 | ||||||||||||||||||||
| BNP Paribas | KOSPI 200 | KRW | 452,261,307 | 404,581 | Receive | Dec 2016 | 20.00% | 373,193 | 373,193 | ||||||||||||||||||||
| BNP Paribas | KOSPI 200 | KRW | 151,515,152 | 137,885 | Receive | Dec 2016 | 20.00% | 148,088 | 148,088 | ||||||||||||||||||||
| BNP Paribas | S&P 500 Index | USD | 136,000 | 136,000 | Pay | Dec 2016 | 19.95% | (189,295 | ) | (189,295 | ) | ||||||||||||||||||
| BNP Paribas | FTSE 100 | GBP | 156,000 | 258,788 | Pay | Dec 2016 | 18.60% | (387,116 | ) | (387,116 | ) | ||||||||||||||||||
| BNP Paribas | FTSE 100 | GBP | 50,000 | 82,728 | Pay | Dec 2016 | 18.65% | (117,663 | ) | (117,663 | ) | ||||||||||||||||||
| BNP Paribas | FTSE 100 | GBP | 109,000 | 179,545 | Pay | Dec 2016 | 18.60% | (279,200 | ) | (279,200 | ) | ||||||||||||||||||
| BNP Paribas | FTSE 100 | GBP | 141,044 | 220,467 | Pay | Dec 2016 | 19.20% | (361,343 | ) | (361,343 | ) | ||||||||||||||||||
| BNP Paribas | S&P 500 Index | USD | 128,000 | 128,000 | Pay | Dec 2016 | 19.20% | 124,069 | 124,069 | ||||||||||||||||||||
| BNP Paribas | S&P 500 Index | USD | 402,000 | 402,000 | Pay | Dec 2016 | 20.25% | (407,701 | ) | (407,701 | ) | ||||||||||||||||||
| BNP Paribas | Hang Seng Index | HKD | 2,000,000 | 258,061 | Receive | Dec 2016 | 27.50% | 930,527 | 930,527 | ||||||||||||||||||||
| BNP Paribas | Hang Seng Index | HKD | 621,000 | 80,123 | Receive | Dec 2016 | 27.25% | 307,808 | 307,808 | ||||||||||||||||||||
| BNP Paribas | Hang Seng Index | HKD | 1,400,000 | 180,638 | Receive | Dec 2016 | 27.40% | 687,707 | 687,707 | ||||||||||||||||||||
| BNP Paribas | Hang Seng Index | HKD | 1,712,500 | 220,824 | Receive | Dec 2016 | 28.20% | 898,801 | 898,801 | ||||||||||||||||||||
| BNP Paribas Securities Corp. |
KOSPI 200 | KRW | 300,000,000 | 281,386 | Receive | Dec 2016 | 21.40% | (700,427 | ) | (700,427 | ) | ||||||||||||||||||
| BNP Paribas Securities Corp. |
S&P 500 Index | USD | 279,000 | 279,000 | Pay | Dec 2016 | 21.10% | 556,833 | 556,833 | ||||||||||||||||||||
| BNP Paribas Securities Corp. |
S&P 500 Index | USD | 120,000 | 120,000 | Pay | Dec 2016 | 22.55% | 395,865 | 395,865 | ||||||||||||||||||||
| BNP Paribas Securities Corp. |
Hang Seng Index | HKD | 775,000 | 99,912 | Receive | Dec 2016 | 25.20% | (28,458 | ) | (28,458 | ) | ||||||||||||||||||
| Goldman Sachs | KOSPI 200 | KRW | 125,125,000 | 122,617 | Receive | Dec 2016 | 20.45% | (282,355 | ) | (282,355 | ) | ||||||||||||||||||
| Goldman Sachs | KOSPI 200 | KRW | 200,000,000 | 191,516 | Receive | Dec 2016 | 21.00% | (416,404 | ) | (416,404 | ) | ||||||||||||||||||
| Goldman Sachs | KOSPI 200 | KRW | 100,000,000 | 93,550 | Receive | Dec 2016 | 21.00% | (205,736 | ) | (205,736 | ) | ||||||||||||||||||
| Goldman Sachs | KOSPI 200 | KRW | 150,000,000 | 132,556 | Receive | Dec 2016 | 20.00% | (32,430 | ) | (32,430 | ) | ||||||||||||||||||
| Goldman Sachs | FTSE 100 | GBP | 75,000 | 119,812 | Pay | Dec 2016 | 20.00% | (66,668 | ) | (66,668 | ) | ||||||||||||||||||
| Goldman Sachs | FTSE 100 | GBP | 51,280 | 82,535 | Pay | Dec 2016 | 19.60% | (77,582 | ) | (77,582 | ) | ||||||||||||||||||
| Goldman Sachs | FTSE 100 | GBP | 72,000 | 113,012 | Pay | Dec 2016 | 19.20% | (188,815 | ) | (188,815 | ) | ||||||||||||||||||
| Goldman Sachs | FTSE 100 | GBP | 85,000 | 126,068 | Pay | Dec 2016 | 19.70% | (263,908 | ) | (263,908 | ) | ||||||||||||||||||
| Goldman Sachs | S&P 500 Index | USD | 120,000 | 120,000 | Pay | Dec 2016 | 18.70% | 82,490 | 82,490 | ||||||||||||||||||||
| Goldman Sachs | S&P 500 Index | USD | 191,000 | 191,000 | Pay | Dec 2016 | 20.50% | 286,232 | 286,232 | ||||||||||||||||||||
| Goldman Sachs | S&P 500 Index | USD | 93,000 | 93,000 | Pay | Dec 2016 | 20.30% | 116,599 | 116,599 | ||||||||||||||||||||
| Goldman Sachs | S&P 500 Index | USD | 230,000 | 230,000 | Pay | Dec 2016 | 22.25% | 701,762 | 701,762 | ||||||||||||||||||||
| Goldman Sachs | S&P 500 Index | USD | 270,000 | 270,000 | Pay | Dec 2016 | 20.10% | 25,628 | 25,628 | ||||||||||||||||||||
| Goldman Sachs | Hang Seng Index | HKD | 800,000 | 103,102 | Receive | Dec 2016 | 28.70% | 280,499 | 280,499 | ||||||||||||||||||||
| Goldman Sachs | Hang Seng Index | HKD | 638,625 | $82,345 | Receive | Dec 2016 | 28.30% | 264,459 | 264,459 | ||||||||||||||||||||
| Goldman Sachs | Hang Seng Index | HKD | 1,300,000 | 167,577 | Receive | Dec 2016 | 24.70% | 31,238 | 31,238 | ||||||||||||||||||||
| Goldman Sachs | Hang Seng Index | HKD | 876,800 | 113,042 | Receive | Dec 2016 | 28.10% | 480,653 | 480,653 | ||||||||||||||||||||
| Goldman Sachs | Hang Seng Index | HKD | 1,300,000 | 167,424 | Receive | Dec 2016 | 28.15% | 895,349 | 895,349 | ||||||||||||||||||||
| JPMorgan Chase Bank |
KOSPI 200 | KRW | 197,424,893 | 167,643 | Receive | Dec 2017 | 23.00% | 381,769 | 381,769 | ||||||||||||||||||||
| JPMorgan Chase Bank |
S&P 500 Index | USD | 170,000 | 170,000 | Pay | Dec 2017 | 23.60% | 12,752 | 12,752 | ||||||||||||||||||||
| Morgan Stanley & Company, Inc. |
KOSPI 200 | KRW | 100,000,000 | 97,135 | Receive | Dec 2016 | 21.70% | (293,545 | ) | (293,545 | ) | ||||||||||||||||||
| Morgan Stanley & Company, Inc. |
FTSE 100 | GBP | 40,000 | 67,514 | Pay | Dec 2016 | 19.10% | (54,989 | ) | (54,989 | ) | ||||||||||||||||||
| Morgan Stanley & Company, Inc. |
FTSE 100 | GBP | 62,000 | 104,526 | Pay | Dec 2016 | 19.45% | (51,685 | ) | (51,685 | ) |
| Counterparty | Reference entity | Currency | Notional amount |
USD notional amount |
Pay/ receive variance |
Maturity date |
Volatility strike price |
Unrealized appreciation (depreciation) |
Market value |
||||||||||||||||||||
| Morgan Stanley & Company, Inc. |
S&P 500 Index | USD | 97,000 | 97,000 | Pay | Dec 2016 | 20.00% | 152,202 | 152,202 | ||||||||||||||||||||
| Morgan Stanley & Company, Inc. |
S&P 500 Index | USD | 250,000 | 250,000 | Pay | Dec 2016 | 21.40% | 676,103 | 676,103 | ||||||||||||||||||||
| Morgan Stanley & Company, Inc. |
S&P 500 Index | USD | 250,000 | 250,000 | Pay | Dec 2016 | 21.75% | 745,740 | 745,740 | ||||||||||||||||||||
| Morgan Stanley & Company, Inc. |
Hang Seng Index | HKD | 500,000 | 64,516 | Receive | Dec 2016 | 28.00% | 171,604 | 171,604 | ||||||||||||||||||||
| Morgan Stanley & Company, Inc. |
Hang Seng Index | HKD | 1,937,600 | 249,992 | Receive | Dec 2016 | 23.90% | 75,991 | 75,991 | ||||||||||||||||||||
| Morgan Stanley & Company, Inc. |
Hang Seng Index | HKD | 1,250,000 | 161,148 | Receive | Dec 2016 | 28.15% | 399,120 | 399,120 | ||||||||||||||||||||
| Morgan Stanley & Company, Inc. |
Hang Seng Index | HKD | 1,937,825 | 249,998 | Receive | Dec 2016 | 24.75% | (122,620 | ) | (122,620 | ) | ||||||||||||||||||
| $8,693,950 | $6,394,069 | $6,394,069 |
Fair value of derivative instruments by risk category
The table below summarizes the fair value of derivatives held by the fund at January 31, 2016 by risk category:
| Risk | Statement of assets and liabilities location |
Financial instruments location |
Asset derivatives fair value |
Liability derivatives fair value |
||||||||||
| Interest rate | Investments, at value* | Purchased options | $5,123,922 | — | ||||||||||
| Interest rate | Swap contracts, at value | Interest rate swaps^ | 192,580,316 | ($246,796,666 | ) | |||||||||
| Interest rate | Receivable/payable for futures | Futures† | 14,467,332 | — | ||||||||||
| Foreign currency | Unrealized appreciation / depreciation on forward foreign currency exchange contracts |
Forward foreign currency contracts |
86,259,391 | (123,360,681 | ) | |||||||||
| Equity | Investments, at value* | Purchased options | 94,322,962 | — | ||||||||||
| Equity | Written options, at value | Written options | — | (1,175,507 | ) | |||||||||
| Equity | Receivable/payable for futures | Futures† | 78,924,605 | (91,166,547 | ) | |||||||||
| Equity | Swap contracts, at value | Variance swaps^ | 11,457,344 | (5,063,275 | ) | |||||||||
| Equity | Swap contracts, at value | Total return swaps^ | 63,717,773 | (917,320 | ) | |||||||||
| Credit | Swap contracts, at value | Credit default swaps^ | 7,271,522 | — |
* Purchased options are included in the Fund's investments.
† Reflects cumulative appreciation/depreciation on futures as disclosed in Note 3. Only the period end variation margin is separately disclosed on the Statement of assets and liabilities.
^ Reflects cumulative appreciation/depreciation on swap contracts. Variation margin for centrally cleared swaps and appreciation/depreciation for OTC swaps are shown separately in the Statement of assets and liabilities.
For financial reporting purposes, the fund does not offset OTC derivative assets or liabilities that are subject to master netting arrangements, as defined by the ISDAs, in the Statement of assets and liabilities. In the event of default by the counterparty or a termination of the agreement, the ISDA allows an offset of amounts across the various transactions between the fund and the applicable counterparty. The table below reflects certain fund's exposure to counterparties subject to an ISDA for OTC derivative transactions:
| Asset | Liability | |||||||
| Foreign forward currency contracts | $86,259,391 | ($123,360,681 | ) | |||||
| Purchased options | 23,979,760 | — | ||||||
| Total return swaps | 63,717,773 | (917,320 | ) | |||||
| Variance swaps | 11,457,344 | (5,063,275 | ) | |||||
| Written options | — | (1,175,507 | ) | |||||
| Totals | $185,414,268 | ($130,516,783 | ) |
| Counterparty | Total market value of OTC derivatives |
Collateral posted by counterparty |
Collateral posted by fund |
Net exposure |
||||||||||
| Barclays Capital | ($2,079,347 | ) | $6,151,776 | — | ($8,231,123 | ) | ||||||||
| BNP Paribas | 24,619,193 | 19,766,880 | — | 4,852,313 | ||||||||||
| Citibank N.A. | 755,118 | 21,586,759 | — | (20,831,641 | ) | |||||||||
| Citigroup | 8,731,675 | — | — | 8,731,675 | ||||||||||
| Deutsche Bank | (9,936,296 | ) | — | $10,479,826 | 543,530 | |||||||||
| Goldman Sachs | 24,525,352 | 36,735,091 | — | (12,209,739 | ) | |||||||||
| HSBC Bank USA | 1,835,519 | — | — | 1,835,519 | ||||||||||
| JPMorgan Chase | (942,115 | ) | 10,420,000 | — | (11,362,115 | ) | ||||||||
| Merrill Lynch | 1,633,288 | — | 609,450 | 2,242,738 | ||||||||||
| Morgan Stanley | 42,796,134 | 30,190,000 | — | 12,606,134 | ||||||||||
| Royal Bank of Scotland | (18,926,582 | ) | — | 23,901,821 | 4,975,239 | |||||||||
| UBS Warburg | (18,114,454 | ) | — | 22,978,368 | 4,863,914 | |||||||||
| Totals | $54,897,485 | $124,850,506 | $57,969,465 | ($11,983,556 | ) |
Effect of derivative instruments on the Statement of operations
The table below summarizes the net realized gain (loss) included in the net increase (decrease) in net assets from operations, classified by derivative instrument and risk category, for the six months ended January 31, 2016:
| Risk | Statement of operations location |
Investments and foreign currency transactions1 |
Written options |
Futures contracts |
Swap contracts |
Investments and foreign currency transactions2 |
Total | ||||||||||||||||
| Interest rate |
Net realized gain (loss) |
($5,393,374 | ) | — | $12,066,508 | ($10,631,445 | ) | — | ($3,958,311 | ) | |||||||||||||
| Foreign currency |
Net realized gain (loss) |
— | $7,181,974 | — | — | $178,163,349 | 185,345,323 | ||||||||||||||||
| Equity | Net realized gain (loss) |
(12,068,570 | ) | 688,795 | 161,128,207 | 17,742,677 | — | 167,491,109 | |||||||||||||||
| Credit | Net realized gain (loss) |
— | — | — | 3,125,473 | — | 3,125,473 | ||||||||||||||||
| Total | ($17,461,944 | ) | $7,870,769 | $173,194,715 | $10,236,705 | $178,163,349 | $352,003,594 |
1 Realized gain/loss associated with purchased options is included in this caption on the Statement of operations.
2 Realized gain/loss associated with forward foreign currency contracts is included in this caption on the Statement of operations.
The table below summarizes the net change in unrealized appreciation (depreciation) included in the net increase (decrease) in net assets from operations, classified by derivative instrument and risk category, for the six months ended January 31, 2016:
| Risk | Statement of operation location |
Investments and translation of assets and liabilites in foreign currencies1 |
Written options |
Futures contracts |
Swap contracts |
Investments and translation of assets and liabilites in foreign currencies2 |
Total | ||||||||||||||||
| Interest rate |
Change in unrealized appreciation (depreciation) |
$3,045,800 | — | $13,202,290 | ($36,619,915 | ) | — | ($20,371,825 | ) | ||||||||||||||
| Foreign currency |
Change in unrealized appreciation (depreciation) |
— | ($4,113,209 | ) | — | — | ($130,819,039 | ) | (134,932,248 | ) | |||||||||||||
| Equity | Change in unrealized appreciation (depreciation) |
46,766,124 | 6,082,717 | (53,414,200 | ) | 85,850,675 | — | 85,285,316 |
| Risk | Statement of operation location |
Investments and translation of assets and liabilites in foreign currencies1 |
Written options |
Futures contracts |
Swap contracts |
Investments and translation of assets and liabilites in foreign currencies2 |
Total | ||||||||||||||||
| Credit | Change in unrealized appreciation (depreciation) |
— | — | — | (1,874,040 | ) | — | (1,874,040 | ) | ||||||||||||||
| Total | $49,811,924 | $1,969,508 | ($40,211,910 | ) | $47,356,720 | ($130,819,039 | ) | ($71,892,797 | ) |
1 Change in unrealized appreciation/depreciation associated with purchased options is included in this caption on the Statment of operations.
2 Change in unrealized appreciation/depreciation associated with forward foreign currency contracts is included in this caption on the Statement of operations.
Note 4 — Guarantees and indemnifications
Under the Trust's organizational documents, its Officers and Trustees are indemnified against certain liabilities arising out of the performance of their duties to the Trust, including the fund. Additionally, in the normal course of business, the fund enters into contracts with service providers that contain general indemnification clauses. The fund's maximum exposure under these arrangements is unknown, as this would involve future claims that may be made against the fund that have not yet occurred. The risk of material loss from such claims is considered remote.
Note 5 — Fees and transactions with affiliates
John Hancock Advisers, LLC (the Advisor) serves as investment advisor for the fund. John Hancock Funds, LLC (the Distributor), an affiliate of the Advisor, serves as principal underwriter of the fund. The Advisor and the Distributor are indirect, wholly owned subsidiaries of Manulife Financial Corporation (MFC).
Management fee. The fund has an investment management contract with the Advisor under which the fund pays a daily management fee to the Advisor, equivalent on an annual basis, to the sum of: (a) 1.300% of the first $200 million of the fund's average daily net assets; and (b) 1.250% of the next $300 million of the fund's average daily net assets provided that net assets are less than or equal to $500 million. If net assets exceed $500 million, the following rates apply; (a) 1.200% of the first $3.0 billion of the fund's average daily net assets; (b) 1.150% of the next $2.5 billion of the fund's average daily net assets; (c) 1.120% of the next $1.5 billion of the fund's average daily net assets; (d) 1.100% of the next $3.0 billion of the fund's average daily net assets; and (e) 1.070% of the fund's average daily net assets in excess of $10.0 billion. The Advisor has a subadvisory agreement with Standard Life Investment (Corporate Funds) Limited. The fund is not responsible for payment of the subadvisory fees.
The Advisor has contractually agreed to waive a portion of its management fee and/or reimburse expenses for certain funds of the John Hancock group of funds complex, including the fund (the participating portfolios). This waiver is based upon aggregate net assets of all the participating portfolios. The amount of the reimbursement is calculated daily and allocated among all the participating portfolios in proportion to the daily net assets of each fund. During the six months ended January 31, 2016, this waiver amounted to 0.01% of the fund's average net assets (on an annualized basis). This arrangement may be amended or terminated at any time by the Advisor upon notice to the fund and with the approval of the Board of Trustees.
The Advisor has contractually agreed to waive and/or reimburse all class-specific expenses for Class R6 shares of the fund to the extent they exceed 0.00% of average annual net assets (on an annualized basis) attributable to Class R6 shares (the class expense waiver). The class expense waiver expires on November 30, 2016, unless renewed by mutual agreement of the fund and the Advisor based upon a determination that this is appropriate under the circumstances at that time. Prior to December 1, 2015, blue-sky fees and printing and postage fees were reimbursed.
The Advisor has voluntarily agreed to reduce a portion of its management fee or make payments to the fund if certain expenses of the fund exceed 0.20% of average net assets. Expenses excluded from this waiver include taxes, brokerage commissions, interest expense, litigation and indemnification expenses, and other extraordinary expenses not incurred in the ordinary course of the fund's business, advisory fees, Rule 12b-1 fees, short dividend expense, and acquired fund fees.
For the six months ended January 31, 2016, the expense reductions described above amounted to the following:
| Class | Expense reduction | Class | Expense reduction | |
| Class A | $68,701 | Class R6 | $77,076 | |
| Class C | 18,500 | Class NAV | 70,979 | |
| Class I | 315,567 | Total | $551,184 | |
| Class R2 | 361 |
The investment management fees incurred for the six months ended January 31, 2016 were equivalent to a net annual effective rate of 1.14% of the fund's average daily net assets.
Accounting and legal services. Pursuant to a service agreement, the fund reimburses the Advisor for all expenses associated with providing the administrative, financial, legal, accounting and recordkeeping services to the fund, including the preparation of all tax returns, periodic reports to shareholders and regulatory reports, among other services. These expenses are allocated to each share class based on its relative net assets at the time the expense was incurred. These accounting and legal services fees incurred for the six months ended January 31, 2016 amounted to an annual rate of 0.01% of the fund's average daily net assets.
Distribution and service plans. The fund has a distribution agreement with the Distributor. The fund has adopted distribution and service plans with respect to Class A, Class C and Class R2 shares pursuant to Rule 12b-1 under the 1940 Act, to pay the Distributor for services provided as the distributor of shares of the fund. In addition, under a service plan for Class R2 shares, the fund pays for certain other services. The fund may pay up to the following contractual rates of distribution and service fees under these arrangements, expressed as an annual percentage of average daily net assets for each class of the fund's shares.
| Class | Rule 12b-1 fee | Service fee |
| Class A | 0.30% | — |
| Class C | 1.00% | — |
| Class R2 | 0.25% | 0.25% |
Sales charges. Class A shares are assessed up-front sales charges, which resulted in payments to the Distributor amounting to $595,605 for the six months ended January 31, 2016. Of this amount, $98,712 was retained and used for printing prospectuses, advertising, sales literature and other purposes, $494,213 was paid as sales commissions to broker-dealers and $2,680 was paid as sales commissions to sales personnel of Signator Investors, Inc., a broker-dealer affiliate of the Advisor.
Class A and Class C shares may be subject to contingent deferred sales charges (CDSCs). Certain Class A shares that are acquired through purchases of $1 million or more and are redeemed within one year of purchase are subject to a 1.00% sales charge. Class C shares that are redeemed within one year of purchase are subject to a 1.00% CDSC. CDSCs are applied to the lesser of the current market value at the time of redemption or the original purchase cost of the shares being redeemed. Proceeds from CDSCs are used to compensate the Distributor for providing distribution-related services in connection with the sale of these shares. During the six months ended January 31, 2016, CDSCs received by the Distributor amounted to $4,390 and $35,642 for Class A and Class C shares, respectively.
Transfer agent fees. The fund has a transfer agent agreement with John Hancock Signature Services, Inc. (Signature Services), an affiliate of the Advisor. The transfer agent fees paid to Signature Services are determined based on the cost to Signature Services (Signature Services Cost) of providing recordkeeping services. It also includes out-of-pocket expenses, including payments made to third-parties for recordkeeping services provided to their clients who invest in one or more John Hancock funds. In addition, Signature Services Cost may be reduced by certain fees that Signature Services receives in connection with retirement and small accounts. Signature Services Cost is calculated monthly and allocated, as applicable, to five categories of share classes: Retail Share and Institutional Share Classes of Non-Municipal Bond Funds, Class R6 Shares, Retirement Share Classes and Municipal Bond Share Classes. Within each of these categories, the applicable costs are allocated to the affected John Hancock affiliated funds and/or classes, based on the relative average daily net assets.
Class level expenses. Class level expenses for the six months ended January 31, 2016 were:
| Class | Distribution and service fees | Transfer agent fees |
| Class A | $1,793,998 | $734,897 |
| Class C | 1,604,074 | 197,279 |
| Class I | — | 2,988,404 |
| Class R2 | 15,243 | 508 |
| Class R6 | — | 44,946 |
| Total | $3,413,315 | $3,966,034 |
Trustee expenses. The fund compensates each Trustee who is not an employee of the Advisor or its affiliates. The costs of paying Trustee compensation and expenses are allocated to each fund based on its net assets relative to other funds within the John Hancock group of funds complex.
Note 6 — Fund share transactions
Transactions in fund shares for the six months ended January 31, 2016 and for the year ended July 31, 2015 were as follows:
| Six months ended 1-31-16 | Year ended 7-31-15 | |||||||||||||||||||||||||
| Shares | Amount | Shares | Amount | |||||||||||||||||||||||
| Class A shares | ||||||||||||||||||||||||||
| Sold | 46,229,636 | $505,574,966 | 37,675,450 | $424,004,284 | ||||||||||||||||||||||
| Distributions reinvested | 7,475,287 | 77,742,983 | 3,736,468 | 40,876,964 | ||||||||||||||||||||||
| Repurchased | (24,250,592 | ) | (262,867,725 | ) | (31,877,856 | ) | (359,107,125 | ) | ||||||||||||||||||
| Net increase | 29,454,331 | $320,450,224 | 9,534,062 | $105,774,123 | ||||||||||||||||||||||
| Class C shares | ||||||||||||||||||||||||||
| Sold | 8,855,086 | $96,090,566 | 10,658,933 | $119,761,297 | ||||||||||||||||||||||
| Distributions reinvested | 1,682,163 | 17,494,495 | 749,921 | 8,211,635 | ||||||||||||||||||||||
| Repurchased | (3,249,588 | ) | (34,976,324 | ) | (3,407,187 | ) | (38,271,255 | ) | ||||||||||||||||||
| Net increase | 7,287,661 | $78,608,737 | 8,001,667 | $89,701,677 | ||||||||||||||||||||||
| Class I shares | ||||||||||||||||||||||||||
| Sold | 163,921,713 | $1,788,708,377 | 227,301,808 | $2,565,685,954 | ||||||||||||||||||||||
| Distributions reinvested | 31,623,650 | 329,202,198 | 16,810,982 | 184,080,248 | ||||||||||||||||||||||
| Repurchased | (95,018,914 | ) | (1,033,503,493 | ) | (102,999,491 | ) | (1,159,570,641 | ) | ||||||||||||||||||
| Net increase | 100,526,449 | $1,084,407,082 | 141,113,299 | $1,590,195,561 | ||||||||||||||||||||||
| Class R2 shares | ||||||||||||||||||||||||||
| Sold | 227,022 | $2,437,665 | 414,852 | $4,640,491 | ||||||||||||||||||||||
| Distributions reinvested | 32,170 | 333,929 | 3,846 | 42,113 | ||||||||||||||||||||||
| Repurchased | (40,957 | ) | (448,129 | ) | (34,391 | ) | (386,811 | ) | ||||||||||||||||||
| Net increase | 218,235 | $2,323,465 | 384,307 | $4,295,793 | ||||||||||||||||||||||
| Class R6 shares | ||||||||||||||||||||||||||
| Sold | 16,856,433 | $181,128,139 | 39,799,457 | $446,749,435 | ||||||||||||||||||||||
| Distributions reinvested | 3,331,379 | 34,646,345 | 1,167,550 | 12,784,671 | ||||||||||||||||||||||
| Repurchased | (8,451,094 | ) | (92,439,079 | ) | (9,059,720 | ) | (102,160,683 | ) | ||||||||||||||||||
| Net increase | 11,736,718 | $123,335,405 | 31,907,287 | $357,373,423 | ||||||||||||||||||||||
| Six months ended 1-31-16 | Year ended 7-31-15 | |||||||||||||||||||||||||
| Shares | Amount | Shares | Amount | |||||||||||||||||||||||
| Class NAV shares | ||||||||||||||||||||||||||
| Sold | 4,477,344 | $49,527,692 | 37,179,692 | $418,815,461 | ||||||||||||||||||||||
| Distributions reinvested | 7,682,066 | 79,816,666 | 3,955,973 | 43,278,341 | ||||||||||||||||||||||
| Repurchased | (9,416,231 | ) | (102,288,979 | ) | (3,497,210 | ) | (39,554,385 | ) | ||||||||||||||||||
| Net increase | 2,743,179 | $27,055,379 | 37,638,455 | $422,539,417 | ||||||||||||||||||||||
| Total net increase | 151,966,573 | $1,636,180,292 | 228,579,077 | $2,569,879,994 | ||||||||||||||||||||||
Affiliates of the fund owned 100% of shares of beneficial interest of Class NAV on January 31, 2016.
Note 7 — Purchase and sale of securities
Purchases and sales of securities, other than short-term investments, amounted to $1,922,844,915 and $1,414,184,832, respectively, for the six months ended January 31, 2016.
Note 8 — Investment by affiliated funds
Certain investors in the fund are affiliated funds that are managed by the Advisor and its affiliates. The affiliated funds do not invest in the fund for the purpose of exercising management or control; however, this investment may represent a significant portion of the fund's net assets. At January 31, 2016, funds within the John Hancock group of funds complex held 12.8% of the fund's net assets. At January 31, 2016, the fund had no affiliate ownership of 5% or more of the fund's net assets.
|
Trustees James M. Oates, Chairperson Officers Andrew G. Arnott John J. Danello Francis V. Knox, Jr. Charles A. Rizzo Salvatore Schiavone |
Investment advisor John Hancock Advisers, LLC Subadvisor Standard Life Investments (Corporate Funds) Limited Principal distributor John Hancock Funds, LLC Custodian Citibank, N.A. Transfer agent John Hancock Signature Services, Inc. Legal counsel K&L Gates LLP |
*Member of the Audit Committee
†Non-Independent Trustee
The fund's proxy voting policies and procedures, as well as the fund proxy voting record for the most recent twelve-month period ended June 30, are available free of charge on the Securities and Exchange Commission (SEC) website at sec.gov or on our website.
The fund's complete list of portfolio holdings, for the first and third fiscal quarters, is filed with the SEC on Form N-Q. The fund's Form N-Q is available on our website and the SEC's website, sec.gov, and can be reviewed and copied (for a fee) at the SEC's Public Reference Room in Washington, DC. Call 800-SEC-0330 to receive information on the operation of the SEC's Public Reference Room.
We make this information on your fund, as well as monthly portfolio holdings, and other fund details available on our website at jhinvestments.com or by calling 800-225-5291.
| You can also contact us: | |||
| 800-225-5291 jhinvestments.com |
Regular mail: John Hancock Signature Services, Inc. |
Express mail: John Hancock Signature Services, Inc. |
|
John Hancock family of funds
|
DOMESTIC EQUITY FUNDS Balanced Blue Chip Growth Classic Value Disciplined Value Disciplined Value Mid Cap Equity Income Fundamental All Cap Core Fundamental Large Cap Core Fundamental Large Cap Value New Opportunities Select Growth Small Cap Equity Small Cap Value Small Company Strategic Growth U.S. Equity U.S. Global Leaders Growth Value Equity GLOBAL AND INTERNATIONAL EQUITY FUNDS Disciplined Value International Emerging Markets Emerging Markets Equity Global Equity Global Shareholder Yield Greater China Opportunities International Core International Growth International Small Company International Value Equity |
INCOME FUNDS Bond California Tax-Free Income Core High Yield Emerging Markets Debt Floating Rate Income Focused High Yield Global Income Government Income High Yield Municipal Bond Income Investment Grade Bond Money Market Short Duration Credit Opportunities Spectrum Income Strategic Income Opportunities Tax-Free Bond ALTERNATIVE AND SPECIALTY FUNDS Absolute Return Currency Alternative Asset Allocation Enduring Assets Financial Industries Global Absolute Return Strategies Global Conservative Absolute Return Global Real Estate Natural Resources Redwood Regional Bank Seaport Technical Opportunities |
A fund's investment objectives, risks, charges, and expenses should be considered carefully before investing. The prospectus contains this and other important information about the fund. To obtain a prospectus, contact your financial professional, call John Hancock Investments at 800-225-5291, or visit our website at jhinvestments.com. Please read the prospectus carefully before investing or sending money.
|
ASSET ALLOCATION Income Allocation Fund Lifestyle Aggressive Portfolio Lifestyle Balanced Portfolio Lifestyle Conservative Portfolio Lifestyle Growth Portfolio Lifestyle Moderate Portfolio Retirement Choices Portfolios (2010-2055) Retirement Living Portfolios (2010-2055) Retirement Living II Portfolios (2010-2055) EXCHANGE-TRADED FUNDS John Hancock Multifactor Consumer Discretionary ETF John Hancock Multifactor Financials ETF John Hancock Multifactor Healthcare ETF John Hancock Multifactor Large Cap ETF John Hancock Multifactor Mid Cap ETF John Hancock Multifactor Technology ETF CLOSED-END FUNDS Financial Opportunities Hedged Equity & Income Income Securities Trust Investors Trust Preferred Income Preferred Income II Preferred Income III Premium Dividend Tax-Advantaged Dividend Income Tax-Advantaged Global Shareholder Yield |
"As an investment firm,
upholding the proud
tradition of John Hancock
comes down to one thing:
putting shareholders
first. We believe that if
our shareholders are
successful, then we will
be successful."
Andrew G. Arnott
President and Chief Executive Officer
John Hancock Investments
John Hancock Multifactor ETF shares are bought and sold at market
price (not NAV), and are not individually redeemed
from the fund. Brokerage commissions will reduce returns.
John Hancock ETFs are distributed by Foreside Fund Services, LLC, and
are subadvised by Dimensional Fund Advisors LP.
Foreside is not affiliated with John Hancock Funds, LLC or
Dimensional Fund Advisors LP.
Dimensional Fund Advisors LP receives compensation from John Hancock
in connection with licensing rights to the
John Hancock Dimensional indexes. Dimensional Fund Advisors LP does
not sponsor, endorse, or sell, and makes no
representation as to the advisability of investing in, John Hancock
Multifactor ETFs.
John Hancock Investments
A trusted brand
John Hancock Investments is a premier asset manager representing
one of America's most trusted brands, with a heritage of financial
stewardship dating back to 1862. Helping our shareholders pursue
their financial goals is at the core of everything we do. It's why we
support the role of professional financial advice and operate with the
highest standards of conduct and integrity.
A better way to invest
We build funds based on investor needs, then search the world to find
proven portfolio teams with specialized expertise in those strategies.
As a manager of managers, we apply vigorous oversight to ensure that
they continue to meet our uncompromising standards and serve the
best interests of our shareholders.
Results for investors
Our unique approach to asset management enables us to provide
a diverse set of investments backed by some of the world's best
managers, along with strong risk-adjusted returns across asset classes.
|
|
John Hancock Funds, LLC n Member FINRA, SIPC 601 Congress Street n Boston, MA 02210-2805 800-225-5291 n jhinvestments.com |
|
| This report is for the information of the shareholders of John Hancock Global Absolute Return Strategies Fund. It is not authorized for distribution to prospective investors unless preceded or accompanied by a prospectus. | ||
| MF274537 | 395SA 1/16 3/16 |
|
ITEM 2. CODE OF ETHICS.
| (a) | Not Applicable | |
| (b) | Not Applicable | |
| (c) | Not Applicable | |
| (d) | Not Applicable | |
| (e) | Not Applicable | |
| (f) | Not Applicable |
ITEM 3. AUDIT COMMITTEE FINANCIAL EXPERT.
Not Applicable
ITEM 4. PRINCIPAL ACCOUNTANT FEES AND SERVICES.
| (a) | Not Applicable | |
| (b) | Not Applicable | |
| (c) | Not Applicable | |
| (d) | Not Applicable | |
| (e) | Not Applicable | |
| (f) | Not Applicable. | |
| (g) | Not Applicable | |
| (h) | Not Applicable |
ITEM 5. AUDIT COMMITTEE OF LISTED REGISTRANTS
Not Applicable.
ITEM 6. SCHEDULE OF INVESTMENTS.
| (a) | Included with Item 1. |
| (b) | Not Applicable. |
ITEM 7. DISCLOSURE OF PROXY VOTING POLICIES AND PROCEDURES FOR CLOSED-END MANAGEMENT INVESTMENT COMPANIES.
Not Applicable.
ITEM 8. PORTFOLIO MANAGERS OF CLOSED-END MANAGEMENT INVESTMENT COMPANIES.
Not Applicable.
ITEM 9. PURCHASE OF EQUITY SECURITIES BY CLOSED-END MANAGEMENT INVESTMENT COMPANIES AND AFFILIATED PURCHASERS.
Not Applicable.
ITEM 10. SUBMISSION OF MATTERS TO VOTE OF SECURITY HOLDERS.
Not Applicable.
ITEM 11. CONTROLS AND PROCEDURES.
| (a) | EVALUATION OF DISCLOSURE CONTROLS AND PROCEDURES. The Registrant maintains disclosure controls and procedures that are designed to ensure that information required to be disclosed in this Form N-CSR is recorded, processed, summarized and reported within the periods specified in the rules and forms of the Securities and Exchange Commission. Such disclosure controls and procedures include controls and procedures designed to ensure that such information is accumulated and communicated to the Registrant’s management, including its principal executive officer and principal financial officer, as appropriate, to allow timely decisions regarding required disclosure. |
Within 90 days prior to the filing date of this Form N-CSR, the Registrant had carried out an evaluation, under the supervision and with the participation of the Registrant’s management, including the Registrant’s principal executive officer and the Registrant’s principal financial officer, of the effectiveness of the design and operation of the Registrant’s disclosure controls and procedures relating to information required to be disclosed on Form N-CSR. Based on such evaluation, the Registrant’s principal executive officer and principal financial officer concluded that the Registrant’s disclosure controls and procedures are operating effectively to ensure that:
(i) information required to be disclosed in this Form N-CSR is recorded, processed, summarized and reported within the periods specified in the rules and forms of the Securities and Exchange Commission, and
(ii) information is accumulated and communicated to the Registrant’s management, including its principal executive officer and principal financial officer, as appropriate, to allow timely decisions regarding required disclosure.
(b) CHANGE IN REGISTRANT’S INTERNAL CONTROL: Not Applicable.
ITEM 12. EXHIBITS.
(a)(1) Not applicable
(a)(2)(i) CERTIFICATION OF PRINCIPAL EXECUTIVE OFFICER.
(a)(2)(ii) CERTIFICATION OF PRINCIPAL FINANCIAL OFFICER.
(b) CERTIFICATION PURSUANT TO Rule 30a-2(b) OF THE INVESTMENT COMPANY ACT OF 1940
SIGNATURES
Pursuant to the requirements of the Securities Exchange Act of 1934 and the Investment Company Act of 1940, the registrant has duly caused this report to be signed on its behalf by the undersigned, thereunto duly authorized.
JOHN HANCOCK FUNDS II
| /s/ Andrew G. Arnott |
| Andrew G. Arnott |
| President |
| Date: March 18, 2016 |
Pursuant to the requirements of the Securities Exchange Act of 1934 and the Investment Company Act of 1940, this report has been signed below by the following persons on behalf of the registrant and in the capacities and on the dates indicated.
| /s/ Andrew G. Arnott |
| President |
| Date: March 18, 2016 |
| /s/ Charles A. Rizzo |
| Charles A. Rizzo |
| Chief Financial Officer |
| Date: March 18, 2016 |