UNITED STATES
SECURITIES AND EXCHANGE COMMISSION
Washington, D.C. 20549
FORM 10-Q
––––––––––––––––––––––––––––––––––––––––––––––––––––
x | QUARTERLY REPORT PURSUANT TO SECTION 13 OR 15(d) OF THE SECURITIES EXCHANGE ACT OF 1934 |
For the quarterly period ended September 30, 2012
OR
o | TRANSITION REPORT PURSUANT TO SECTION 13 OR 15(d) OF THE SECURITIES EXCHANGE ACT OF 1934 |
Commission File Number: 000-51402
––––––––––––––––––––––––––––––––––––––––––––––––––––––––––
FEDERAL HOME LOAN BANK OF BOSTON
(Exact name of registrant as specified in its charter)
Federally chartered corporation (State or other jurisdiction of incorporation or organization) | 04-6002575 (I.R.S. employer identification number) | |||
800 Boylston Street Boston, MA (Address of principal executive offices) | 02199 (Zip code) | |||
(617) 292-9600
(Registrant's telephone number, including area code)
Indicate by check mark whether the registrant (1) has filed all reports required to be filed by Section 13 or 15(d) of the Securities Exchange Act of 1934 during the preceding 12 months (or for such shorter period that the registrant was required to file such reports), and (2) has been subject to such filing requirements for the past 90 days. x Yes o No
Indicate by check mark whether the registrant has submitted electronically and posted on its corporate Web site, if any, every Interactive Data File required to be submitted and posted pursuant to Rule 405 of Regulation S-T (§232.405 of this chapter) during the preceding 12 months (or for such shorter period that the registrant was required to submit and post such files). x Yes o No
Indicate by check mark whether the registrant is a large accelerated filer, an accelerated filer, or a non-accelerated filer. See definition of “accelerated filer and large accelerated filer” in Rule 12b-2 of the Exchange Act. (Check one):
Large accelerated filer o | Accelerated filer o | |
Non-accelerated filer x (Do not check if a smaller reporting company) | Smaller reporting company o | |
Indicate by check mark whether the registrant is a shell company (as defined in Rule 12b-2 of the Exchange Act). o Yes x No
Indicate the number of shares outstanding of each of the issuer's classes of common stock, as of the latest practicable date.
Shares outstanding as of October 31, 2012 | ||
Class A Stock, par value $100 | zero | |
Class B Stock, par value $100 | 36,542,526 | |
Federal Home Loan Bank of Boston
Form 10-Q
Table of Contents
2
PART I. FINANCIAL INFORMATION
ITEM 1. FINANCIAL STATEMENTS
FEDERAL HOME LOAN BANK OF BOSTON STATEMENTS OF CONDITION (dollars and shares in thousands, except par value) (unaudited) | |||||||
September 30, 2012 | December 31, 2011 | ||||||
ASSETS | |||||||
Cash and due from banks | $ | 306,166 | $ | 112,094 | |||
Interest-bearing deposits | 261 | 177 | |||||
Securities purchased under agreements to resell | 5,125,000 | 6,900,000 | |||||
Federal funds sold | 1,100,000 | 2,270,000 | |||||
Investment securities: | |||||||
Trading securities | 279,420 | 274,164 | |||||
Available-for-sale securities - includes $8,313 and $119,118 pledged as collateral at September 30, 2012, and December 31, 2011, respectively that may be repledged | 5,764,096 | 5,280,199 | |||||
Held-to-maturity securities - includes $105,687 and $128,073 pledged as collateral at September 30, 2012, and December 31, 2011, respectively that may be repledged (a) | 5,679,296 | 6,655,008 | |||||
Total investment securities | 11,722,812 | 12,209,371 | |||||
Advances | 23,915,687 | 25,194,898 | |||||
Mortgage loans held for portfolio, net of allowance for credit losses of $5,514 and $7,800 at September 30, 2012, and December 31, 2011, respectively | 3,431,534 | 3,109,223 | |||||
Accrued interest receivable | 95,950 | 116,517 | |||||
Premises, software, and equipment, net | 3,907 | 4,518 | |||||
Derivative assets, net | 529 | 16,521 | |||||
Other assets | 40,689 | 35,018 | |||||
Total Assets | $ | 45,742,535 | $ | 49,968,337 | |||
LIABILITIES | |||||||
Deposits: | |||||||
Interest-bearing | $ | 648,781 | $ | 627,127 | |||
Non-interest-bearing | 36,547 | 27,119 | |||||
Total deposits | 685,328 | 654,246 | |||||
Consolidated obligations: | |||||||
Bonds | 28,238,899 | 29,879,460 | |||||
Discount notes | 11,993,572 | 14,651,793 | |||||
Total consolidated obligations | 40,232,471 | 44,531,253 | |||||
Mandatorily redeemable capital stock | 215,863 | 227,429 | |||||
Accrued interest payable | 128,966 | 110,782 | |||||
Affordable Housing Program (AHP) payable | 45,733 | 34,241 | |||||
Derivative liabilities, net | 949,735 | 905,304 | |||||
Other liabilities | 17,863 | 16,048 | |||||
Total liabilities | 42,275,959 | 46,479,303 | |||||
Commitments and contingencies (Note 18) | |||||||
CAPITAL | |||||||
Capital stock – Class B – putable ($100 par value), 34,330 shares and 36,253 shares issued and outstanding at September 30, 2012, and December 31, 2011, respectively | 3,433,016 | 3,625,348 | |||||
Retained earnings: | |||||||
Unrestricted | 484,574 | 375,158 | |||||
Restricted | 53,660 | 22,939 | |||||
Total retained earnings | 538,234 | 398,097 | |||||
Accumulated other comprehensive loss | (504,674 | ) | (534,411 | ) | |||
Total capital | 3,466,576 | 3,489,034 | |||||
Total Liabilities and Capital | $ | 45,742,535 | $ | 49,968,337 | |||
_______________________________________
(a) Fair values of held-to-maturity securities were $5,915,270 and $6,663,066 at September 30, 2012, and December 31, 2011, respectively.
The accompanying notes are an integral part of these financial statements.
3
FEDERAL HOME LOAN BANK OF BOSTON STATEMENTS OF OPERATIONS (dollars in thousands) (unaudited) | |||||||||||||||
For the Three Months Ended September 30, | For the Nine Months Ended September 30, | ||||||||||||||
2012 | 2011 | 2012 | 2011 | ||||||||||||
INTEREST INCOME | |||||||||||||||
Advances | $ | 72,551 | $ | 80,163 | $ | 225,037 | $ | 249,670 | |||||||
Prepayment fees on advances, net | 11,874 | 9,066 | 44,348 | 20,393 | |||||||||||
Securities purchased under agreements to resell | 2,455 | 502 | 7,069 | 1,447 | |||||||||||
Federal funds sold | 463 | 2,211 | 1,491 | 5,969 | |||||||||||
Trading securities | 2,522 | 3,034 | 7,608 | 13,270 | |||||||||||
Available-for-sale securities | 19,106 | 15,374 | 50,869 | 49,425 | |||||||||||
Held-to-maturity securities | 35,057 | 42,647 | 111,445 | 123,476 | |||||||||||
Prepayment fees on investments | 139 | 806 | 341 | 1,355 | |||||||||||
Mortgage loans held for portfolio | 34,214 | 37,267 | 103,527 | 113,456 | |||||||||||
Other | 2 | 1 | 3 | 2 | |||||||||||
Total interest income | 178,383 | 191,071 | 551,738 | 578,463 | |||||||||||
INTEREST EXPENSE | |||||||||||||||
Consolidated obligations - bonds | 101,584 | 108,896 | 311,943 | 345,012 | |||||||||||
Consolidated obligations - discount notes | 3,726 | 1,546 | 8,222 | 8,808 | |||||||||||
Deposits | 11 | 42 | 42 | 244 | |||||||||||
Mandatorily redeemable capital stock | 260 | 177 | 834 | 446 | |||||||||||
Other borrowings | 1 | — | 2 | 3 | |||||||||||
Total interest expense | 105,582 | 110,661 | 321,043 | 354,513 | |||||||||||
NET INTEREST INCOME | 72,801 | 80,410 | 230,695 | 223,950 | |||||||||||
Reduction of provision for credit losses | (523 | ) | — | (2,057 | ) | (1,458 | ) | ||||||||
NET INTEREST INCOME AFTER REDUCTION OF PROVISION FOR CREDIT LOSSES | 73,324 | 80,410 | 232,752 | 225,408 | |||||||||||
OTHER INCOME (LOSS) | |||||||||||||||
Total other-than-temporary impairment losses on investment securities | (2,077 | ) | (8,336 | ) | (14,218 | ) | (31,982 | ) | |||||||
Net amount of impairment losses reclassified to (from) accumulated other comprehensive loss | 985 | 1,126 | 8,674 | (41,606 | ) | ||||||||||
Net other-than-temporary impairment losses on investment securities, credit portion | (1,092 | ) | (7,210 | ) | (5,544 | ) | (73,588 | ) | |||||||
Loss on early extinguishment of debt | (4,992 | ) | — | (16,993 | ) | — | |||||||||
Service fees | 1,483 | 2,046 | 4,474 | 6,503 | |||||||||||
Net unrealized gains on trading securities | 4,669 | 13,638 | 8,291 | 17,594 | |||||||||||
Net losses on derivatives and hedging activities | (2,086 | ) | (17,474 | ) | (8,509 | ) | (23,527 | ) | |||||||
Realized net gain from sale of available-for-sale securities | — | — | — | 12,801 | |||||||||||
Other | 228 | 131 | 2,753 | 469 | |||||||||||
Total other loss | (1,790 | ) | (8,869 | ) | (15,528 | ) | (59,748 | ) | |||||||
OTHER EXPENSE | |||||||||||||||
Compensation and benefits | 8,405 | 8,111 | 25,723 | 24,366 | |||||||||||
Other operating expenses | 4,380 | 5,656 | 13,442 | 14,974 | |||||||||||
Federal Housing Finance Agency | 1,073 | 1,162 | 3,472 | 3,622 | |||||||||||
Office of Finance | 625 | 665 | 2,066 | 2,156 | |||||||||||
Other | 556 | 388 | 1,753 | 3,987 | |||||||||||
Total other expense | 15,039 | 15,982 | 46,456 | 49,105 | |||||||||||
INCOME BEFORE ASSESSMENTS | 56,495 | 55,559 | 170,768 | 116,555 | |||||||||||
AHP | 5,675 | 5,573 | 17,160 | 10,592 | |||||||||||
Resolution Funding Corporation (REFCorp) | — | — | — | 11,078 | |||||||||||
Total assessments | 5,675 | 5,573 | 17,160 | 21,670 | |||||||||||
NET INCOME | $ | 50,820 | $ | 49,986 | $ | 153,608 | $ | 94,885 | |||||||
The accompanying notes are an integral part of these financial statements.
4
FEDERAL HOME LOAN BANK OF BOSTON STATEMENTS OF COMPREHENSIVE INCOME THREE AND NINE MONTHS ENDED SEPTEMBER 30, 2012 and 2011 (dollars in thousands) (unaudited) | ||||||||||||||||
For the Three Months Ended September 30, | For the Nine Months Ended September 30, | |||||||||||||||
2012 | 2011 | 2012 | 2011 | |||||||||||||
Net income | $ | 50,820 | $ | 49,986 | $ | 153,608 | $ | 94,885 | ||||||||
Other comprehensive income: | ||||||||||||||||
Net unrealized gains (losses) on available-for-sale securities | ||||||||||||||||
Net unrealized gains (losses) | 17,525 | (30,389 | ) | 15,643 | (5,552 | ) | ||||||||||
Reclassification adjustment for realized gains included in net income | — | — | — | (12,801 | ) | |||||||||||
Total net unrealized gains (losses) on available-for-sale securities | 17,525 | (30,389 | ) | 15,643 | (18,353 | ) | ||||||||||
Net noncredit portion of other-than-temporary impairment losses on held-to-maturity securities | ||||||||||||||||
Noncredit portion | (2,013 | ) | (5,231 | ) | (10,931 | ) | (16,910 | ) | ||||||||
Reclassification adjustment for noncredit portion of other-than-temporary impairment losses recognized as credit losses included in net income | 1,028 | 4,105 | 2,257 | 58,516 | ||||||||||||
Accretion of noncredit portion | 17,838 | 35,288 | 56,131 | 125,197 | ||||||||||||
Total net noncredit portion of other-than-temporary impairment losses on held-to-maturity securities | 16,853 | 34,162 | 47,457 | 166,803 | ||||||||||||
Net unrealized (losses) gains relating to hedging activities | ||||||||||||||||
Unrealized losses | (10,448 | ) | (25,158 | ) | (32,874 | ) | (26,843 | ) | ||||||||
Reclassification adjustment for previously deferred hedging gains and losses included in net income | 4 | 4 | 11 | 11 | ||||||||||||
Total net unrealized losses relating to hedging activities | (10,444 | ) | (25,154 | ) | (32,863 | ) | (26,832 | ) | ||||||||
Pension and postretirement benefits | (166 | ) | (75 | ) | (500 | ) | (224 | ) | ||||||||
Total other comprehensive income (loss) | 23,768 | (21,456 | ) | 29,737 | 121,394 | |||||||||||
Total comprehensive income | $ | 74,588 | $ | 28,530 | $ | 183,345 | $ | 216,279 | ||||||||
The accompanying notes are an integral part of these financial statements.
5
FEDERAL HOME LOAN BANK OF BOSTON STATEMENTS OF CAPITAL NINE MONTHS ENDED SEPTEMBER 30, 2012 AND 2011 (dollars and shares in thousands) (unaudited) | ||||||||||||||||||||||||||
Capital Stock Class B – Putable | Retained Earnings | Accumulated Other Comprehensive Loss | ||||||||||||||||||||||||
Shares | Par Value | Unrestricted | Restricted | Total | Total Capital | |||||||||||||||||||||
BALANCE, DECEMBER 31, 2010 | 36,644 | $ | 3,664,425 | $ | 249,191 | $ | — | $ | 249,191 | $ | (638,111 | ) | $ | 3,275,505 | ||||||||||||
Proceeds from sale of capital stock | 601 | 60,145 | 60,145 | |||||||||||||||||||||||
Shares reclassified to mandatorily redeemable capital stock | (1,408 | ) | (140,821 | ) | (140,821 | ) | ||||||||||||||||||||
Comprehensive income | 84,888 | 9,997 | 94,885 | 121,394 | 216,279 | |||||||||||||||||||||
Cash dividends on capital stock | (7,980 | ) | (7,980 | ) | (7,980 | ) | ||||||||||||||||||||
BALANCE, SEPTEMBER 30, 2011 | 35,837 | $ | 3,583,749 | $ | 326,099 | $ | 9,997 | $ | 336,096 | $ | (516,717 | ) | $ | 3,403,128 | ||||||||||||
BALANCE, DECEMBER 31, 2011 | 36,253 | $ | 3,625,348 | $ | 375,158 | $ | 22,939 | $ | 398,097 | $ | (534,411 | ) | $ | 3,489,034 | ||||||||||||
Proceeds from sale of capital stock | 461 | 46,094 | 46,094 | |||||||||||||||||||||||
Repurchase of capital stock | (2,374 | ) | (237,412 | ) | (237,412 | ) | ||||||||||||||||||||
Shares reclassified to mandatorily redeemable capital stock | (10 | ) | (1,014 | ) | (1,014 | ) | ||||||||||||||||||||
Comprehensive income | 122,887 | 30,721 | 153,608 | 29,737 | 183,345 | |||||||||||||||||||||
Cash dividends on capital stock | (13,471 | ) | (13,471 | ) | (13,471 | ) | ||||||||||||||||||||
BALANCE, SEPTEMBER 30, 2012 | 34,330 | $ | 3,433,016 | $ | 484,574 | $ | 53,660 | $ | 538,234 | $ | (504,674 | ) | $ | 3,466,576 | ||||||||||||
The accompanying notes are an integral part of these financial statements.
6
FEDERAL HOME LOAN BANK OF BOSTON STATEMENTS OF CASH FLOWS (dollars in thousands) (unaudited) | |||||||
For the Nine Months Ended September 30, | |||||||
2012 | 2011 | ||||||
OPERATING ACTIVITIES | |||||||
Net income | $ | 153,608 | $ | 94,885 | |||
Adjustments to reconcile net income to net cash provided by operating activities: | |||||||
Depreciation and amortization | (13,299 | ) | (2,779 | ) | |||
Reduction of provision for credit losses | (2,057 | ) | (1,458 | ) | |||
Change in net fair-value adjustments on derivatives and hedging activities | 85,822 | 62,316 | |||||
Net other-than-temporary impairment losses on investment securities, credit portion | 5,544 | 73,588 | |||||
Loss on early extinguishment of debt | 16,993 | — | |||||
Realized net gain from sale of available-for-sale securities | — | (12,801 | ) | ||||
Other adjustments | (312 | ) | (400 | ) | |||
Net change in: | |||||||
Market value of trading securities | (8,291 | ) | (17,594 | ) | |||
Accrued interest receivable | 20,567 | 34,883 | |||||
Other assets | 2,150 | 2,114 | |||||
Accrued interest payable | 18,181 | 1,929 | |||||
Other liabilities | 12,393 | 17,620 | |||||
Total adjustments | 137,691 | 157,418 | |||||
Net cash provided by operating activities | 291,299 | 252,303 | |||||
INVESTING ACTIVITIES | |||||||
Net change in: | |||||||
Interest-bearing deposits | (84 | ) | (74 | ) | |||
Securities purchased under agreements to resell | 1,775,000 | (1,325,000 | ) | ||||
Federal funds sold | 1,170,000 | 2,205,000 | |||||
Premises, software, and equipment | (784 | ) | (2,168 | ) | |||
Trading securities: | |||||||
Net decrease in short-term | — | 5,320,000 | |||||
Proceeds from long-term | 3,035 | 3,433 | |||||
Available-for-sale securities: | |||||||
Proceeds from long-term | 1,128,619 | 2,510,471 | |||||
Purchases of long-term | (1,615,479 | ) | (492,011 | ) | |||
Held-to-maturity securities: | |||||||
Proceeds from long-term | 1,016,930 | 1,046,077 | |||||
Purchases of long-term | — | (1,814,412 | ) | ||||
Advances to members: | |||||||
Proceeds | 110,843,079 | 101,596,921 | |||||
Disbursements | (109,610,045 | ) | (98,566,753 | ) | |||
Mortgage loans held for portfolio: | |||||||
Proceeds | 610,854 | 459,510 | |||||
Purchases | (947,759 | ) | (352,182 | ) | |||
Proceeds from sale of foreclosed assets | 7,904 | 8,721 | |||||
Net cash provided by investing activities | 4,381,270 | 10,597,533 | |||||
FINANCING ACTIVITIES | |||||||
Net change in deposits | 12,079 | 4,686 | |||||
7
Net payments on derivatives with a financing element | (27,101 | ) | (29,768 | ) | |||
Net proceeds from issuance of consolidated obligations: | |||||||
Discount notes | 101,912,981 | 439,183,592 | |||||
Bonds | 7,879,848 | 11,234,003 | |||||
Bonds transferred from other FHLBanks | 130,276 | — | |||||
Payments for maturing and retiring consolidated obligations: | |||||||
Discount notes | (104,572,190 | ) | (447,033,139 | ) | |||
Bonds | (9,597,021 | ) | (13,925,150 | ) | |||
Proceeds from issuance of capital stock | 46,094 | 60,145 | |||||
Payments for redemption of mandatorily redeemable capital stock | (12,580 | ) | (3,469 | ) | |||
Payments for repurchase of capital stock | (237,412 | ) | — | ||||
Cash dividends paid | (13,471 | ) | (7,980 | ) | |||
Net cash used in financing activities | (4,478,497 | ) | (10,517,080 | ) | |||
Net increase in cash and due from banks | 194,072 | 332,756 | |||||
Cash and due from banks at beginning of the year | 112,094 | 6,151 | |||||
Cash and due from banks at period end | $ | 306,166 | $ | 338,907 | |||
Supplemental disclosures: | |||||||
Interest paid | $ | 357,257 | $ | 391,404 | |||
AHP payments | $ | 4,313 | $ | 4,707 | |||
REFCorp assessments refunded, net | $ | — | $ | (2,512 | ) | ||
Noncash transfers of mortgage loans held for portfolio to real estate owned (REO) | $ | 10,435 | $ | 8,533 | |||
The accompanying notes are an integral part of these financial statements.
8
FEDERAL HOME LOAN BANK OF BOSTON
NOTES TO FINANCIAL STATEMENTS
Note 1 — Basis of Presentation
The accompanying unaudited financial statements have been prepared in accordance with accounting principles generally accepted in the United States of America (GAAP) for interim financial information. Accordingly, they do not include all of the information and footnotes required by GAAP for complete annual financial statements. In the opinion of management, all adjustments considered necessary have been included. All such adjustments consist of normal recurring accruals. The presentation of financial statements in conformity with GAAP requires us to make estimates and assumptions that affect the amounts reported in the financial statements and accompanying notes. Actual results could differ from those estimates. The results of operations for interim periods are not necessarily indicative of the results to be expected for the year ending December 31, 2012. The unaudited financial statements should be read in conjunction with the Federal Home Loan Bank of Boston's audited financial statements and related notes in our Annual Report on Form 10-K for the year ended December 31, 2011, filed with the Securities and Exchange Commission (the SEC) on March 23, 2012 (the 2011 Annual Report). Unless otherwise indicated or the context requires otherwise, all references in this discussion to “the Bank,” "we," "us," "our," or similar references mean the Federal Home Loan Bank of Boston.
Note 2 — Recently Issued Accounting Standards and Interpretations
Disclosures about Offsetting Assets and Liabilities. On December 16, 2011, the Financial Accounting Standards Board (the FASB) and the International Accounting Standards Board (the IASB) issued common disclosure requirements intended to help investors and other financial statement users better assess the effect or potential effect of offsetting arrangements on a company's financial position, whether a company's financial statements are prepared on the basis of GAAP or International Financial Reporting Standards (IFRS). This guidance will require us to disclose both gross and net information about financial instruments, including derivative instruments, which are either offset on our statement of condition or subject to an enforceable master netting arrangement or similar agreement. This guidance will be effective for interim and annual periods beginning on January 1, 2013, and will be applied retrospectively for all comparative periods presented. The adoption of this guidance will result in increased interim and annual financial statement disclosures, but will not affect our financial condition, results of operations, or cash flows.
Presentation of Comprehensive Income. On June 16, 2011, the FASB issued guidance to increase the prominence of other comprehensive income in financial statements. This guidance requires an entity that reports items of other comprehensive income to present comprehensive income in either a single financial statement or in two consecutive financial statements. In a single continuous statement, an entity is required to present the components of net income and total net income, the components of other comprehensive income, and a total for other comprehensive income, as well as a total for comprehensive income. In a two-statement approach, an entity is required to present the components of net income and total net income in its statement of net income. The statement of other comprehensive income should follow immediately and include the components of other comprehensive income as well as totals for both other comprehensive income and comprehensive income. This guidance eliminates the option to present other comprehensive income in the statement of changes in stockholders' equity. We have elected the two-statement approach for interim and annual periods beginning on January 1, 2012, and we have applied this guidance retrospectively for all periods presented. The adoption of this guidance is limited to the presentation of our interim and annual financial statements and did not affect our financial condition, results of operations, or cash flows. See Note 15 — Accumulated Other Comprehensive Loss for disclosures required under this amended guidance.
On December 23, 2011, the FASB issued guidance to defer the effective date of the new requirement to present
reclassifications of items out of accumulated other comprehensive income in the income statement. This guidance was effective
for interim and annual periods beginning on January 1, 2012. We adopted the remaining guidance contained in the new accounting standard for the presentation of comprehensive income.
Common Fair Value Measurement and Disclosure Requirements in GAAP and IFRS. On May 12, 2011, the FASB and the IASB issued substantially converged guidance on fair-value measurement and disclosure requirements. This guidance clarifies how fair-value accounting should be applied where its use is already required or permitted by other guidance within GAAP or IFRS. These amendments do not require additional fair-value measurements. This guidance generally represents clarifications to the application of existing fair-value measurement and disclosure requirements, as well as some instances where a particular principle or requirement for measuring fair value or disclosing information about fair-value measurements has changed. This guidance became effective for interim and annual periods beginning on January 1, 2012, and was applied prospectively. The adoption of this guidance resulted in additional interim and annual financial statement disclosures, but did not have a material effect on our financial condition, results of operations, or cash flows. See Note 17 — Fair Value for disclosures under this
9
amended guidance.
Reconsideration of Effective Control for Repurchase Agreements. On April 29, 2011, the FASB issued guidance to improve the accounting for repurchase agreements and other agreements that both entitle and obligate a transferor to repurchase or redeem financial assets before their maturity. This guidance amends the existing criteria for determining whether or not a transferor has retained effective control over financial assets transferred under a repurchase agreement. A secured borrowing is recorded when effective control over the transferred financial assets is maintained while a sale is recorded when effective control over the transferred financial assets has not been maintained. The new guidance removes from the assessment of effective control: (1) the criterion requiring the transferor to have the ability to repurchase or redeem financial assets before their maturity on substantially the agreed terms, even in the event of the transferee's default, and (2) the collateral maintenance implementation guidance related to that criterion. This guidance was effective for interim and annual periods beginning on January 1, 2012, and was applied prospectively to transactions or modifications of existing transactions that occurred on or after the effective date. The adoption of this guidance did not have a material effect on our financial condition, results of operations, or cash flows.
Recently Issued Regulatory Guidance
Framework for Adversely Classifying Loans, Other Real Estate Owned, and Other Assets and Listing Assets for Special Mention. On April 9, 2012, the Federal Housing Finance Agency (the Finance Agency) issued Advisory Bulletin 2012-02, Framework for Adversely Classifying Loans, Other Real Estate Owned, and Other Assets and Listing Assets for Special Mention (AB 2012-02). AB 2012-02 establishes a standard and uniform methodology for classifying certain assets other than investment securities, and prescribes the timing of asset charge-offs based on these classifications. The guidance in AB 2012-02 is generally consistent with the Uniform Retail Credit Classification and Account Management Policy issued by the federal banking regulators in June 2000. AB 2012-02 states that it was effective upon issuance. The Federal Home Loan Banks (the FHLBanks or the FHLBank System) are currently assessing the provisions of AB 2012-02 in coordination with the Finance Agency and therefore, we have not yet determined either when we will implement the guidance or its effect on our financial condition, results of operations, and cash flows.
Note 3 — Trading Securities
Major Security Types. Our trading securities as of September 30, 2012, and December 31, 2011, were (dollars in thousands):
September 30, 2012 | December 31, 2011 | ||||||
Mortgage-backed-securities (MBS) | |||||||
United States (U.S.) government-guaranteed – residential | $ | 17,496 | $ | 18,880 | |||
Government sponsored enterprises (GSEs) – residential | 5,380 | 6,663 | |||||
GSEs – commercial | 256,544 | 248,621 | |||||
Total | $ | 279,420 | $ | 274,164 | |||
Net unrealized gains on trading securities for the nine months ended September 30, 2012 and 2011, amounted to $8.3 million and $17.6 million for securities held on September 30, 2012 and 2011, respectively.
We do not participate in speculative trading practices and typically hold these investments over a longer time horizon.
Note 4 — Available-for-Sale Securities
Major Security Types. Our available-for-sale securities as of September 30, 2012, were (dollars in thousands):
10
Amounts Recorded in Accumulated Other Comprehensive Loss | |||||||||||||||
Amortized Cost (1) | Unrealized Gains | Unrealized Losses | Fair Value | ||||||||||||
Supranational institutions | $ | 510,971 | $ | — | $ | (37,555 | ) | $ | 473,416 | ||||||
Corporate bonds (2) | 307,859 | 366 | — | 308,225 | |||||||||||
U.S. government-owned corporations | 339,598 | — | (45,998 | ) | 293,600 | ||||||||||
GSEs | 2,132,594 | 33,577 | (17,705 | ) | 2,148,466 | ||||||||||
3,291,022 | 33,943 | (101,258 | ) | 3,223,707 | |||||||||||
MBS | |||||||||||||||
U.S. government guaranteed – residential | 76,397 | 560 | — | 76,957 | |||||||||||
GSEs – residential | 2,328,012 | 33,505 | — | 2,361,517 | |||||||||||
GSEs – commercial | 101,582 | 333 | — | 101,915 | |||||||||||
2,505,991 | 34,398 | — | 2,540,389 | ||||||||||||
Total | $ | 5,797,013 | $ | 68,341 | $ | (101,258 | ) | $ | 5,764,096 | ||||||
_______________________
(1) Amortized cost of available-for-sale securities includes adjustments made to the cost basis of an investment for accretion, amortization, collection of cash, and fair-value hedge accounting adjustments.
(2) | Consists of corporate debentures guaranteed by the Federal Deposit Insurance Corporation (the FDIC) under the FDIC's Temporary Liquidity Guarantee Program. The FDIC guarantee carries the full faith and credit of the U.S. government. |
Our available-for-sale securities as of December 31, 2011, were (dollars in thousands):
Amounts Recorded in Accumulated Other Comprehensive Loss | |||||||||||||||
Amortized Cost (1) | Unrealized Gains | Unrealized Losses | Fair Value | ||||||||||||
Supranational institutions | $ | 504,630 | $ | — | $ | (35,388 | ) | $ | 469,242 | ||||||
Corporate bonds (2) | 561,942 | 2,370 | — | 564,312 | |||||||||||
U.S. government-owned corporations | 338,169 | — | (53,325 | ) | 284,844 | ||||||||||
GSEs | 2,750,131 | 52,020 | (19,730 | ) | 2,782,421 | ||||||||||
4,154,872 | 54,390 | (108,443 | ) | 4,100,819 | |||||||||||
MBS | |||||||||||||||
U.S. government guaranteed – residential | 90,882 | 346 | — | 91,228 | |||||||||||
GSEs – residential | 978,998 | 5,810 | — | 984,808 | |||||||||||
GSEs – commercial | 104,007 | — | (663 | ) | 103,344 | ||||||||||
1,173,887 | 6,156 | (663 | ) | 1,179,380 | |||||||||||
Total | $ | 5,328,759 | $ | 60,546 | $ | (109,106 | ) | $ | 5,280,199 | ||||||
_______________________
(1) Amortized cost of available-for-sale securities includes adjustments made to the cost basis of an investment for accretion, amortization, collection of cash, and fair-value hedge accounting adjustments.
(2) Consists of corporate debentures guaranteed by the FDIC under the FDIC's Temporary Liquidity Guarantee Program. The FDIC guarantee carries the full faith and credit of the U.S. government.
As of September 30, 2012, the amortized cost of our available-for-sale securities included net premiums of $75.3 million. Of that amount, $57.5 million of net premiums related to non-MBS and $17.8 million of net premiums related to MBS. As of December 31, 2011, the amortized cost of our available-for-sale securities included net premiums of $77.2 million. Of that amount, $81.0 million of net premiums related to non-MBS and $3.8 million of net discounts related to MBS.
At September 30, 2012, and December 31, 2011, 22.0 percent and 25.4 percent, respectively, of our fixed-rate available-for-sale securities were swapped to a floating rate.
11
The following table summarizes our available-for-sale securities with unrealized losses as of September 30, 2012, which are aggregated by major security type and length of time that individual securities have been in a continuous unrealized loss position (dollars in thousands):
Less than 12 Months | 12 Months or More | Total | |||||||||||||||||||||
Fair Value | Unrealized Losses | Fair Value | Unrealized Losses | Fair Value | Unrealized Losses | ||||||||||||||||||
Supranational institutions | $ | — | $ | — | $ | 473,416 | $ | (37,555 | ) | $ | 473,416 | $ | (37,555 | ) | |||||||||
U.S. government-owned corporations | — | — | 293,600 | (45,998 | ) | 293,600 | (45,998 | ) | |||||||||||||||
GSEs | — | — | 124,026 | (17,705 | ) | 124,026 | (17,705 | ) | |||||||||||||||
Total temporarily impaired | $ | — | $ | — | $ | 891,042 | $ | (101,258 | ) | $ | 891,042 | $ | (101,258 | ) | |||||||||
The following table summarizes our available-for-sale securities with unrealized losses as of December 31, 2011, which are aggregated by major security type and length of time that individual securities have been in a continuous unrealized loss position (dollars in thousands):
Less than 12 Months | 12 Months or More | Total | |||||||||||||||||||||
Fair Value | Unrealized Losses | Fair Value | Unrealized Losses | Fair Value | Unrealized Losses | ||||||||||||||||||
Supranational institutions | $ | — | $ | — | $ | 469,242 | $ | (35,388 | ) | $ | 469,242 | $ | (35,388 | ) | |||||||||
U.S. government-owned corporations | — | — | 284,844 | (53,325 | ) | 284,844 | (53,325 | ) | |||||||||||||||
GSEs | — | — | 121,025 | (19,730 | ) | 121,025 | (19,730 | ) | |||||||||||||||
— | — | 875,111 | (108,443 | ) | 875,111 | (108,443 | ) | ||||||||||||||||
MBS | |||||||||||||||||||||||
GSEs – commercial | — | — | 103,344 | (663 | ) | 103,344 | (663 | ) | |||||||||||||||
Total temporarily impaired | $ | — | $ | — | $ | 978,455 | $ | (109,106 | ) | $ | 978,455 | $ | (109,106 | ) | |||||||||
Redemption Terms. The amortized cost and fair value of our available-for-sale securities by contractual maturity at September 30, 2012 and December 31, 2011, were (dollars in thousands):
September 30, 2012 | December 31, 2011 | ||||||||||||||
Year of Maturity | Amortized Cost | Fair Value | Amortized Cost | Fair Value | |||||||||||
Due in one year or less | $ | 1,357,937 | $ | 1,367,719 | $ | 1,213,636 | $ | 1,217,440 | |||||||
Due after one year through five years | 940,786 | 964,947 | 1,957,683 | 2,008,268 | |||||||||||
Due after five years through 10 years | — | — | — | — | |||||||||||
Due after 10 years | 992,299 | 891,041 | 983,553 | 875,111 | |||||||||||
3,291,022 | 3,223,707 | 4,154,872 | 4,100,819 | ||||||||||||
MBS (1) | 2,505,991 | 2,540,389 | 1,173,887 | 1,179,380 | |||||||||||
Total | $ | 5,797,013 | $ | 5,764,096 | $ | 5,328,759 | $ | 5,280,199 | |||||||
_______________________
(1) | MBS are not presented by contractual maturity because their expected maturities will likely differ from contractual maturities because borrowers of the underlying loans may have the right to call or prepay obligations with or without call or prepayment fees. |
Sale of Available-for-Sale Securities. The following table shows the proceeds from sale and gross gains and losses realized on the sale of our available-for-sale securities (dollars in thousands):
12
For the Three Months Ended September 30, | For the Nine Months Ended September 30, | ||||||||||||||
2012 | 2011 | 2012 | 2011 | ||||||||||||
Proceeds from sale of available-for-sale securities | $ | — | $ | — | $ | — | $ | 2,127,944 | |||||||
Gross realized gains from sale of available-for-sale securities | $ | — | $ | — | $ | — | $ | 14,415 | |||||||
Gross realized losses from sale of available-for-sale securities | — | — | — | (1,614 | ) | ||||||||||
Net realized gains from sale of available-for-sale securities | $ | — | $ | — | $ | — | $ | 12,801 | |||||||
Note 5 — Held-to-Maturity Securities
Major Security Types. Our held-to-maturity securities as of September 30, 2012, were (dollars in thousands):
Amortized Cost | Other-Than-Temporary Impairment Recognized in Accumulated Other Comprehensive Loss | Carrying Value | Gross Unrecognized Holding Gains | Gross Unrecognized Holding Losses | Fair Value | ||||||||||||||||||
U.S. agency obligations | $ | 14,666 | $ | — | $ | 14,666 | $ | 1,435 | $ | — | $ | 16,101 | |||||||||||
State or local housing-finance-agency obligations (HFA securities) | 191,969 | — | 191,969 | 70 | (28,402 | ) | 163,637 | ||||||||||||||||
GSEs | 69,676 | — | 69,676 | 1,857 | — | 71,533 | |||||||||||||||||
276,311 | — | 276,311 | 3,362 | (28,402 | ) | 251,271 | |||||||||||||||||
MBS | |||||||||||||||||||||||
U.S. government guaranteed – residential | 41,469 | — | 41,469 | 948 | — | 42,417 | |||||||||||||||||
U.S. government guaranteed – commercial | 463,211 | — | 463,211 | 9,021 | — | 472,232 | |||||||||||||||||
GSEs – residential | 2,523,565 | — | 2,523,565 | 84,931 | (379 | ) | 2,608,117 | ||||||||||||||||
GSEs – commercial | 1,016,514 | — | 1,016,514 | 92,621 | — | 1,109,135 | |||||||||||||||||
Private-label – residential | 1,725,069 | (402,366 | ) | 1,322,703 | 123,849 | (47,017 | ) | 1,399,535 | |||||||||||||||
Private-label – commercial | 10,335 | — | 10,335 | 419 | — | 10,754 | |||||||||||||||||
Asset-backed securities (ABS) backed by home equity loans | 26,361 | (1,173 | ) | 25,188 | 509 | (3,888 | ) | 21,809 | |||||||||||||||
5,806,524 | (403,539 | ) | 5,402,985 | 312,298 | (51,284 | ) | 5,663,999 | ||||||||||||||||
Total | $ | 6,082,835 | $ | (403,539 | ) | $ | 5,679,296 | $ | 315,660 | $ | (79,686 | ) | $ | 5,915,270 | |||||||||
Our held-to-maturity securities as of December 31, 2011, were (dollars in thousands):
13
Amortized Cost | Other-Than-Temporary Impairment Recognized in Accumulated Other Comprehensive Loss | Carrying Value | Gross Unrecognized Holding Gains | Gross Unrecognized Holding Losses | Fair Value | ||||||||||||||||||
U.S. agency obligations | $ | 18,721 | $ | — | $ | 18,721 | $ | 1,697 | $ | — | $ | 20,418 | |||||||||||
HFA securities | 202,438 | — | 202,438 | 61 | (34,459 | ) | 168,040 | ||||||||||||||||
GSEs | 70,950 | — | 70,950 | 2,510 | — | 73,460 | |||||||||||||||||
292,109 | — | 292,109 | 4,268 | (34,459 | ) | 261,918 | |||||||||||||||||
MBS | |||||||||||||||||||||||
U.S. government guaranteed – residential | 50,912 | — | 50,912 | 934 | — | 51,846 | |||||||||||||||||
U.S. government guaranteed – commercial | 483,938 | — | 483,938 | 4,685 | — | 488,623 | |||||||||||||||||
GSEs – residential | 3,024,212 | — | 3,024,212 | 78,548 | (1,105 | ) | 3,101,655 | ||||||||||||||||
GSEs – commercial | 1,247,688 | — | 1,247,688 | 86,252 | — | 1,333,940 | |||||||||||||||||
Private-label – residential | 1,969,237 | (449,654 | ) | 1,519,583 | 18,789 | (145,285 | ) | 1,393,087 | |||||||||||||||
Private-label – commercial | 10,541 | — | 10,541 | 549 | — | 11,090 | |||||||||||||||||
ABS backed by home equity loans | 27,367 | (1,342 | ) | 26,025 | 128 | (5,246 | ) | 20,907 | |||||||||||||||
6,813,895 | (450,996 | ) | 6,362,899 | 189,885 | (151,636 | ) | 6,401,148 | ||||||||||||||||
Total | $ | 7,106,004 | $ | (450,996 | ) | $ | 6,655,008 | $ | 194,153 | $ | (186,095 | ) | $ | 6,663,066 | |||||||||
As of September 30, 2012, the amortized cost of our held-to-maturity securities included net discounts of $507.8 million. Of that amount, net premiums of $2.4 million related to non-MBS and net discounts of $510.1 million related to MBS. As of December 31, 2011, the amortized cost of our held-to-maturity securities included net discounts of $536.4 million. Of that amount, net premiums of $3.6 million related to non-MBS and net discounts of $540.0 million related to MBS.
The following table summarizes our held-to-maturity securities with unrealized losses as of September 30, 2012, which are aggregated by major security type and length of time that individual securities have been in a continuous unrealized loss position (dollars in thousands).
Less than 12 Months | 12 Months or More | Total | |||||||||||||||||||||
Fair Value | Unrealized Losses | Fair Value | Unrealized Losses | Fair Value | Unrealized Losses | ||||||||||||||||||
HFA securities | $ | 334 | $ | (1 | ) | $ | 153,689 | $ | (28,401 | ) | $ | 154,023 | $ | (28,402 | ) | ||||||||
MBS | |||||||||||||||||||||||
GSEs – residential | 30,146 | (46 | ) | 65,930 | (333 | ) | 96,076 | (379 | ) | ||||||||||||||
Private-label – residential | — | — | 1,364,825 | (330,538 | ) | 1,364,825 | (330,538 | ) | |||||||||||||||
ABS backed by home equity loans | — | — | 21,118 | (4,593 | ) | 21,118 | (4,593 | ) | |||||||||||||||
30,146 | (46 | ) | 1,451,873 | (335,464 | ) | 1,482,019 | (335,510 | ) | |||||||||||||||
Total | $ | 30,480 | $ | (47 | ) | $ | 1,605,562 | $ | (363,865 | ) | $ | 1,636,042 | $ | (363,912 | ) | ||||||||
The following table summarizes our held-to-maturity securities with unrealized losses as of December 31, 2011, which are aggregated by major security type and length of time that individual securities have been in a continuous unrealized loss position (dollars in thousands).
14
Less than 12 Months | 12 Months or More | Total | |||||||||||||||||||||
Fair Value | Unrealized Losses | Fair Value | Unrealized Losses | Fair Value | Unrealized Losses | ||||||||||||||||||
HFA securities | $ | 418 | $ | (2 | ) | $ | 150,968 | $ | (34,457 | ) | $ | 151,386 | $ | (34,459 | ) | ||||||||
MBS | |||||||||||||||||||||||
GSEs – residential | 239,995 | (558 | ) | 41,723 | (547 | ) | 281,718 | (1,105 | ) | ||||||||||||||
Private-label – residential | 18,922 | (4,138 | ) | 1,369,550 | (572,326 | ) | 1,388,472 | (576,464 | ) | ||||||||||||||
ABS backed by home equity loans | — | — | 20,906 | (6,463 | ) | 20,906 | (6,463 | ) | |||||||||||||||
258,917 | (4,696 | ) | 1,432,179 | (579,336 | ) | 1,691,096 | (584,032 | ) | |||||||||||||||
Total | $ | 259,335 | $ | (4,698 | ) | $ | 1,583,147 | $ | (613,793 | ) | $ | 1,842,482 | $ | (618,491 | ) | ||||||||
Redemption Terms. The amortized cost and fair value of our held-to-maturity securities by contractual maturity at September 30, 2012, and December 31, 2011, are shown below (dollars in thousands). Expected maturities of some securities and MBS may differ from contractual maturities because borrowers of the underlying loans may have the right to call or prepay their obligations with or without call or prepayment fees.
September 30, 2012 | December 31, 2011 | ||||||||||||||||||||||
Year of Maturity | Amortized Cost | Carrying Value (1) | Fair Value | Amortized Cost | Carrying Value (1) | Fair Value | |||||||||||||||||
Due in one year or less | $ | — | $ | — | $ | — | $ | 1,360 | $ | 1,360 | $ | 1,369 | |||||||||||
Due after one year through five years | 70,010 | 70,010 | 71,868 | 71,370 | 71,370 | 73,878 | |||||||||||||||||
Due after five years through 10 years | 34,351 | 34,351 | 35,436 | 38,405 | 38,405 | 39,733 | |||||||||||||||||
Due after 10 years | 171,950 | 171,950 | 143,967 | 180,974 | 180,974 | 146,938 | |||||||||||||||||
276,311 | 276,311 | 251,271 | 292,109 | 292,109 | 261,918 | ||||||||||||||||||
MBS (2) | 5,806,524 | 5,402,985 | 5,663,999 | 6,813,895 | 6,362,899 | 6,401,148 | |||||||||||||||||
Total | $ | 6,082,835 | $ | 5,679,296 | $ | 5,915,270 | $ | 7,106,004 | $ | 6,655,008 | $ | 6,663,066 | |||||||||||
_______________________
(1) Carrying value of held-to-maturity securities represents the sum of amortized cost and the amount of noncredit-related other-than-temporary impairment recognized in accumulated other comprehensive loss.
(2) | MBS are not presented by contractual maturity because their expected maturities will likely differ from contractual maturities because borrowers of the underlying loans may have the right to call or prepay their obligations with or without call or prepayment fees. |
Note 6 — Other-Than-Temporary Impairment
We evaluate our individual available-for-sale and held-to-maturity securities for other-than-temporary impairment each quarter. As part of our evaluation of securities for other-than-temporary impairment, we consider whether we intend to sell each security for which fair value is less than amortized cost or whether it is more likely than not that we will be required to sell the security before the anticipated recovery of the remaining amortized cost. If either of these conditions is met, we recognize an other-than-temporary impairment charge in earnings equal to the entire difference between the security's amortized cost basis and its fair value at the statement of condition date. For securities in an unrealized loss position that meet neither of these conditions and for all residential private-label MBS, we perform a cash-flow analysis to determine whether the entire amortized cost basis of these impaired securities, including all previously other-than-temporarily impaired securities, will be recovered. If we do not expect to recover the entire amount, the unrealized loss position is considered to be other-than-temporarily impaired. We evaluate the security's other-than-temporary impairment to determine the amount of credit loss to be recognized in earnings, which is limited to the amount of that security's unrealized loss.
In performing a detailed cash-flow analysis, we identify the best estimate of the cash flows expected to be collected. If this estimate results in a present value of expected cash flows (discounted at the security's effective yield) that is less than the amortized cost basis of a security (that is, a credit loss exists), other-than-temporary impairment is considered to have occurred. For determining the present value of variable-rate and hybrid private-label residential MBS, we use the effective interest rate derived from a variable-rate index, such as one-month London Interbank Offered Rate (LIBOR), plus the contractual spread, plus or minus a fixed-spread adjustment when there is an existing discount or premium on the security. As the implied forward curve of a selected variable-rate index changes over time, the effective interest rates derived from that index will also change over time and would therefore impact the present value of the subject security.
15
Available-for-Sale Securities
As a result of these evaluations, we determined that none of our available-for-sale securities were other-than-temporarily impaired at September 30, 2012. At September 30, 2012, we held certain available-for-sale securities in an unrealized loss position. These unrealized losses reflect the impact of normal yield and spread fluctuations attendant with security markets. These losses are considered temporary as we expect to recover the entire amortized cost basis on these available-for-sale securities in an unrealized loss position and neither intend to sell these securities nor is it more likely than not that we will be required to sell these securities before the anticipated recovery of each security's remaining amortized cost basis. Additionally, there have been no shortfalls of principal or interest on any available-for-sale security. Regarding securities that were in an unrealized loss position as of September 30, 2012:
• | Debentures issued by a supranational institution that were in an unrealized loss position as of September 30, 2012, are expected to return contractual principal and interest, based on our review and analysis of independent third-party credit reports on the supranational institution, and such supranational institution is rated triple-A (or equivalent) by each of the nationally recognized statistical rating organizations (NRSROs). |
• | Debentures issued by U.S. government corporations are not obligations of the U.S. government and not guaranteed by the U.S. government. However, these securities are rated at the same level as the U.S. government by the NRSROs. These ratings reflect the U.S. government's implicit support of the government corporation as well as the entity's underlying business and financial risk. |
• | We have concluded that the probability of default on debt issued by the Federal National Mortgage Association (Fannie Mae) and the Federal Home Loan Mortgage Corporation (Freddie Mac) is remote given their status as GSEs and their support from the U.S. government. |
Held-to-Maturity Securities
HFA Securities. We have reviewed our investments in HFA securities and have determined that unrealized losses reflect the impact of normal market yield and spread fluctuations and illiquidity in the credit markets. We have determined that all unrealized losses are temporary given the creditworthiness of the issuers and the underlying collateral, including an assessment of past payment history (no shortfalls of principal or interest), property vacancy rates, debt service ratios, over-collateralization and other credit enhancement, and third-party bond insurance as applicable. As of September 30, 2012, none of our held-to-maturity investments in HFA securities were rated below investment grade by an NRSRO. Because the decline in market value is attributable to changes in interest rates and credit spreads and illiquidity in the credit markets and not to a significant deterioration in the fundamental credit quality of these obligations, and because we do not intend to sell the investments nor is it more likely than not that we will be required to sell the investments before recovery of the amortized cost basis, we do not consider these investments to be other-than-temporarily impaired at September 30, 2012.
Agency MBS. For MBS issued by Fannie Mae and Freddie Mac, which we sometimes refer to as agency MBS in this report, we determined that the strength of the issuers' guarantees through direct obligation or support from the U.S. government is sufficient to protect us from losses based on current expectations. Additionally, there have been no shortfalls of principal or interest on any such security. As a result, we have determined that, as of September 30, 2012, all of the gross unrealized losses on such MBS are temporary. We do not believe that the declines in market value of these securities are attributable to credit quality, and because we do not intend to sell the investments, nor is it more likely than not that we will be required to sell the investments before recovery of the amortized cost basis, we do not consider any of these investments to be other-than-temporarily impaired at September 30, 2012.
Private-Label Residential MBS and ABS Backed by Home Equity Loans. To ensure consistency in determination of the other-than-temporary impairment for private-label residential MBS and certain home equity loan investments (including home equity ABS) among all FHLBanks, the FHLBanks enhanced their overall other-than-temporary impairment process in 2009 by implementing a FHLBank Systemwide governance committee (the OTTI Governance Committee) and establishing a formal process to ensure consistency in key other-than-temporary impairment modeling assumptions used for purposes of their cash-flow analyses for the majority of these securities. We use the FHLBanks' common framework and approved assumptions for purposes of our other-than-temporary impairment cash-flow analyses of our private-label residential MBS and certain home equity loan investments. For certain private-label residential MBS and home equity loan investments where underlying collateral data is not available, we have used alternative procedures to assess these securities for other-than-temporary impairment. We are responsible for making our own determination of impairment and the reasonableness of assumptions, inputs, and methodologies used and for performing the required present value calculations using appropriate historical cost
16
bases and yields.
Our evaluation includes estimating the projected cash flows that we are likely to collect based on an assessment of all available information, including the structure of the applicable security and certain assumptions to determine whether we will recover the entire amortized cost basis of the security, such as:
• | the remaining payment terms for the security; |
• | prepayment speeds; |
• | default rates; |
• | loss severity on the collateral supporting each security based on underlying loan-level borrower and loan characteristics; |
• | expected housing price changes; and |
• | interest-rate assumptions. |
In accordance with related guidance from the Finance Agency, our primary regulator, we have contracted with the FHLBanks of San Francisco and Chicago to perform the cash-flow analysis underlying our other-than-temporary impairment decisions in certain instances. In the event that neither the FHLBank of San Francisco or the FHLBank of Chicago has the ability to model a particular MBS that we own, we project the expected cash flows for that security based on our expectations as to how the underlying collateral and impact on deal structure resultant from collateral cash flows are forecasted to occur over time. These assumptions are based on factors including, but not limited to loan-level data for each security and modeling variables expectations for securities similar in nature modeled by either the FHLBank of San Francisco or the FHLBank of Chicago. We form these expectations for those securities by reviewing, when available, loan-level data for each such security, and, when such loan-level data is not available for a security, by reviewing loan-level data for similar loan pools as a proxy for such data.
Specifically, we have contracted with the FHLBank of San Francisco to perform cash-flow analyses for our residential private-label MBS other than subprime private-label MBS, and with the FHLBank of Chicago to perform cash-flow analyses for our subprime private-label MBS. The following table provides additional data on who performs these cash-flow analyses for us (dollars in thousands).
September 30, 2012 | |||||||||||||||||
Number of Securities | Par Value | Amortized Cost | Carrying Value | Fair Value | |||||||||||||
FHLBank of San Francisco | 166 | $ | 2,166,292 | $ | 1,673,141 | $ | 1,283,775 | $ | 1,357,009 | ||||||||
FHLBank of Chicago | 16 | 22,728 | 22,095 | 21,014 | 18,319 | ||||||||||||
Our own cash-flow projections | 12 | 65,071 | 52,846 | 39,754 | 42,573 | ||||||||||||
To assess whether the entire amortized cost basis of private-label residential MBS will be recovered, cash-flow analyses for each of our private-label residential MBS were performed. These analyses use two third-party models.
The first third-party model considers borrower characteristics and the particular attributes of the loans underlying our securities, in conjunction with assumptions about current home prices and future changes in home prices and interest rates, producing monthly projections of prepayments, defaults, and loss severities. A significant input to the first model is the forecast of future housing-price changes for the relevant states and core-based statistical areas (CBSAs), based on an assessment of the individual housing markets. The term CBSA refers collectively to metropolitan and micropolitan statistical areas as defined by the United States Office of Management and Budget. As currently defined, a CBSA must contain at least one core urban area with a population of 10,000 or more people, plus adjacent territory that has a high degree of social and economic integration with the core as measured by commuting ties. Our housing-price forecast as of September 30, 2012, assumed current-to-trough home price declines ranging from 0.0 percent (for those housing markets that are believed to have reached their trough) to 4.0 percent. For those markets for which further home price declines are anticipated, such declines were projected to occur over the three- to nine-month period beginning July 1, 2012. For the vast majority of markets where further home price declines are anticipated, the declines were projected to range from 1.0 percent to 2.0 percent over the three-month period beginning July 1, 2012. From the trough, home prices were projected to recover using one of five different recovery paths that vary by housing market. Under those recovery paths, home prices were projected to increase as follows:
17
Months | Recovery Range of | ||||
1-6 | 0.0 | % | to | 2.8% | |
7-18 | 0.0 | % | to | 3.0% | |
19-24 | 1.0 | % | to | 4.0% | |
25-30 | 2.0 | % | to | 4.0% | |
31-42 | 2.0 | % | to | 5.0% | |
43-66 | 2.0 | % | to | 6.0% | |
Thereafter | 2.3 | % | to | 5.6% | |
The month-by-month projections of future loan performance are derived from the first model to determine projected prepayments, defaults, and loss severities. These projections are then input into a second model that calculates the projected loan-level cash flows and then allocates those cash flows and losses among the various classes in the securitization structure in accordance with the cash-flow and loss-allocation rules prescribed by the securitization structure. In a securitization in which the credit enhancement for the senior securities is derived from the presence of subordinate securities, losses are generally allocated first to the subordinate securities until their principal balance is reduced to zero. The projected cash flows are based on a number of assumptions and expectations and the results of these models can vary significantly with changes in assumptions and expectations. The scenario of cash flows determined based on the model approach described above reflects a best estimate scenario and includes a base case current-to-trough housing price forecast and a base case housing price recovery path described in the prior paragraph.
We do not intend to sell these securities and believe it is not more likely than not that we will be required to sell these securities before the anticipated recovery of each security's remaining amortized cost basis. We recorded other-than-temporary impairment credit losses of $1.1 million for the three months ended September 30, 2012. For held-to-maturity securities, the noncredit portion of an other-than-temporary impairment charge that is recognized in other comprehensive income is accreted from accumulated other comprehensive loss to the carrying value of the security over the remaining life of the security in a prospective manner based on the amount and timing of estimated cash flows. This accretion continues until the security is sold or matures, or an additional other-than-temporary impairment charge is recorded in earnings, which could result in a reclassification adjustment and the establishment of a new amount to be accreted. For the three months ended September 30, 2012, we accreted $17.8 million of noncredit impairment from accumulated other comprehensive loss to the carrying value of held-to-maturity securities. For certain other-than-temporarily impaired securities that were previously impaired and have subsequently incurred additional credit losses during the three months ended September 30, 2012, the additional credit losses, up to the amount in accumulated other comprehensive loss, were reclassified out of noncredit-related losses in accumulated other comprehensive loss and charged to earnings. This amount was $1.0 million for the three months ended September 30, 2012.
For those securities for which an other-than-temporary impairment was determined to have occurred during the three months ended September 30, 2012 (that is, a determination was made that less than the entire amortized cost basis is expected to be recovered), the following table presents a summary of the average projected values over the remaining lives of the securities for the significant inputs used to measure the amount of the credit loss recognized in earnings, as well as related current credit enhancement. Credit enhancement is defined as the percentage of subordinated tranches, over-collateralization, and other credit enhancement, if any, in a security structure that will generally absorb losses before we will experience a loss on the security. The calculated averages represent the dollar-weighted averages of all the private-label residential MBS and home equity loan investments in each category shown (dollars in thousands). We note that we have instituted litigation in relation to certain of the private-label MBS in which we invested. Our complaint asserts, among others, claims for untrue or misleading statements in the sale of securities. It is possible that classifications of private-label MBS as provided herein when based on classification at the time of issuance (as per the following tables in this Note 6, for example) as disclosed by those securities' issuance documents, as well as other statements made by or on behalf of the issuers about the securities, are inaccurate.
18
Significant Inputs | ||||||||||||||||||||||||||||
Projected Prepayment Rates | Projected Default Rates | Projected Loss Severities | Current Credit Enhancement | |||||||||||||||||||||||||
Private-label MBS by Year of Securitization | Par Value | Weighted Average Percent | Range Percent | Weighted Average Percent | Range Percent | Weighted Average Percent | Range Percent | Weighted Average Percent | Range Percent | |||||||||||||||||||
Private-label residential MBS | ||||||||||||||||||||||||||||
Prime (1) | ||||||||||||||||||||||||||||
2004 and prior | $ | 1,411 | 6.3 | % | 6.3 | % | 30.0 | % | 30.0 | % | 47.7 | % | 47.7 | % | 19.1 | % | 19.1 | % | ||||||||||
Alt-A (1) | ||||||||||||||||||||||||||||
2007 | $ | 11,310 | 2.8 | % | 2.8 | % | 74.8 | % | 74.8 | % | 50.8 | % | 50.8 | % | 36.4 | % | 36.4 | % | ||||||||||
2006 | 153,662 | 4.0 | 2.8 - 6.5 | 69.4 | 52.1 - 79.6 | 53.1 | 50.8 - 55.7 | 21.2 | 0.0 - 35.5 | |||||||||||||||||||
2005 | 34,117 | 5.7 | 5.7 | 54.3 | 54.3 | 55.3 | 55.3 | — | — | |||||||||||||||||||
Total Alt-A | $ | 199,089 | 4.3 | % | 2.8 - 6.5 | 67.1 | % | 52.1 - 79.6 | 53.4 | % | 50.8 - 55.7 | 18.4 | % | 0.0 - 36.4 | ||||||||||||||
_______________________
(1) Securities are classified in the table above based upon the current performance characteristics of the underlying loan pool and therefore the manner in which the loan pool backing the security has been modeled (as prime, Alt-A, or subprime), rather than their classification of the security at the time of issuance.
We own certain private-label MBS that are insured by third-party bond insurers (monoline insurers). Together with the other FHLBanks, we have performed analyses to assess the financial strength of these monoline insurers to establish an expected case regarding the time horizon of the bond insurers' ability to fulfill their financial obligations and provide credit support. The projected time horizon of credit protection provided by an insurer is a function of claims-paying resources and anticipated claims in the future. This assumption is referred to as the “burnout period” and is expressed in months. Of the five monoline insurers, the financial guarantee from Assured Guaranty Municipal Corp. is considered sufficient to cover all future claims and, therefore, the burnout analysis is not applicable as discussed above. Conversely, the burnout period for three monoline insurers, Syncora Guarantee Inc., Financial Guaranty Insurance Corp., and Ambac Assurance Corp., is not considered applicable due to regulatory intervention that has generally suspended all claims payments to effectively zero. One of these insurers, Ambac Assurance Corp., has recently received permission from a Wisconsin Circuit Court to start paying 25 percent of policy claims in cash that have arisen since Ambac ceased paying claims in March 2010 at the direction of the Wisconsin Commissioner of Insurance. While these cash payments commenced in the third quarter of 2012, uncertainty surrounding other aspects of the company's rehabilitation plan is currently preventing us from including these payments in our cash flow modeling. For the remaining monoline insurer, MBIA Insurance Corp., the burnout period as of September 30, 2012, is three months, ending December 31, 2012. None of our securities that are guaranteed by MBIA Insurance Corp. were determined to have an other-than-temporary impairment credit loss at September 30, 2012.
The following table sets forth our securities for which other-than-temporary impairment credit losses were recognized in the three months ending September 30, 2012 (dollars in thousands). Securities are classified in the table below based on their classifications at the time of issuance.
September 30, 2012 | |||||||||||||||
Other-Than-Temporarily Impaired Investment | Par Value | Amortized Cost | Carrying Value | Fair Value | |||||||||||
Private-label residential MBS – Prime | $ | 1,411 | $ | 1,411 | $ | 1,040 | $ | 1,040 | |||||||
Private-label residential MBS – Alt-A | 199,089 | 145,328 | 103,488 | 114,646 | |||||||||||
Total other-than-temporarily impaired securities | $ | 200,500 | $ | 146,739 | $ | 104,528 | $ | 115,686 | |||||||
The following table sets forth our securities for which other-than-temporary impairment credit losses were recognized during the life of the security through September 30, 2012 (dollars in thousands). Securities are classified in the table below based on their classifications at the time of issuance.
19
September 30, 2012 | |||||||||||||||
Other-Than-Temporarily Impaired Investment | Par Value | Amortized Cost | Carrying Value | Fair Value | |||||||||||
Private-label residential MBS – Prime | $ | 73,848 | $ | 63,484 | $ | 47,198 | $ | 55,612 | |||||||
Private-label residential MBS – Alt-A | 1,814,813 | 1,320,029 | 933,949 | 1,045,635 | |||||||||||
ABS backed by home equity loans – Subprime | 5,685 | 5,040 | 3,867 | 4,376 | |||||||||||
Total other-than-temporarily impaired securities | $ | 1,894,346 | $ | 1,388,553 | $ | 985,014 | $ | 1,105,623 | |||||||
The following table sets forth other-than-temporary impairment credit losses that were recognized for the three and nine months ended September 30, 2012, by investment classification (dollars in thousands). Securities are classified in the table below based on the classification at the time of issuance.
For the Three Months Ended September 30, 2012 | For the Nine Months Ended September 30, 2012 | ||||||||||||||||||||||
Other-Than-Temporarily Impaired Investment | Total Other-Than-Temporary Impairment Losses on Investment Securities | Net Amount of Impairment Losses Reclassified to Accumulated Other Comprehensive Loss | Net Other-Than-Temporary Impairment Losses on Investment Securities, Credit Portion | Total Other-Than-Temporary Impairment Losses on Investment Securities | Net Amount of Impairment Losses Reclassified to (from) Accumulated Other Comprehensive Loss | Net Other-Than-Temporary Impairment Losses on Investment Securities, Credit Portion | |||||||||||||||||
Private-label residential MBS – Prime | $ | (371 | ) | $ | 371 | $ | — | $ | (371 | ) | $ | 371 | $ | — | |||||||||
Private-label residential MBS – Alt-A | (1,706 | ) | 614 | (1,092 | ) | (13,847 | ) | 8,306 | (5,541 | ) | |||||||||||||
ABS backed by home equity loans – Subprime | — | — | — | — | (3 | ) | (3 | ) | |||||||||||||||
Total other-than-temporarily impaired securities | $ | (2,077 | ) | $ | 985 | $ | (1,092 | ) | $ | (14,218 | ) | $ | 8,674 | $ | (5,544 | ) | |||||||
The following table presents a roll-forward of the amounts related to credit losses recognized into earnings. The roll-forward is the amount of credit losses on investment securities on which we recognized a portion of other-than-temporary impairment charges into accumulated other comprehensive loss (dollars in thousands).
For the Three Months Ended September 30, | For the Nine Months Ended September 30, | ||||||||||||||
2012 | 2011 | 2012 | 2011 | ||||||||||||
Balance at beginning of period | $ | 520,654 | $ | 562,358 | $ | 544,833 | $ | 523,881 | |||||||
Additions: | |||||||||||||||
Credit losses for which other-than-temporary impairment was not previously recognized | — | — | — | 46 | |||||||||||
Additional credit losses for which an other-than-temporary impairment charge was previously recognized(1) | 1,092 | 7,210 | 5,544 | 73,542 | |||||||||||
Reductions: | |||||||||||||||
Securities matured during the period | (8,065 | ) | (15,889 | ) | (32,697 | ) | (42,089 | ) | |||||||
Increase in cash flows expected to be collected which are recognized over the remaining life of the security | (2,609 | ) | (731 | ) | (6,608 | ) | (2,432 | ) | |||||||
Balance at end of period | $ | 511,072 | $ | 552,948 | $ | 511,072 | $ | 552,948 | |||||||
_______________________
(1) | For the three months ended September 30, 2012, and 2011, additional credit losses for which an other-than-temporary impairment charge was previously recognized relate to all securities that were also previously impaired prior to July 1, 2012 and 2011. For the nine months ended September 30, 2012 and 2011, additional credit losses for which an other-than-temporary impairment charge was previously recognized relate to all securities that were also previously impaired prior to January 1, 2012 and 2011. |
20
The following table presents a roll-forward of the amounts related to the net noncredit portion of other-than-temporary impairment losses on held-to-maturity securities included in accumulated other comprehensive loss (dollars in thousands).
For the Three Months Ended September 30, | For the Nine Months Ended September 30, | ||||||||||||||
2012 | 2011 | 2012 | 2011 | ||||||||||||
Balance at beginning of period | $ | (420,392 | ) | $ | (488,887 | ) | $ | (450,996 | ) | $ | (621,528 | ) | |||
Amounts reclassified (to) from accumulated other comprehensive loss: | |||||||||||||||
Noncredit portion of other-than-temporary impairment losses on held-to-maturity securities | (2,013 | ) | (5,231 | ) | (10,931 | ) | (16,910 | ) | |||||||
Reclassification adjustment of noncredit component of impairment losses included in net income relating to held-to-maturity securities | 1,028 | 4,105 | 2,257 | 58,516 | |||||||||||
Net amount of impairment losses reclassified (to) from accumulated other comprehensive loss | (985 | ) | (1,126 | ) | (8,674 | ) | 41,606 | ||||||||
Accretion of noncredit portion of impairment losses on held-to-maturity securities | 17,838 | 35,288 | 56,131 | 125,197 | |||||||||||
Balance at end of period | $ | (403,539 | ) | $ | (454,725 | ) | $ | (403,539 | ) | $ | (454,725 | ) | |||
Note 7 — Advances
General Terms. At September 30, 2012 and December 31, 2011, we had advances outstanding with interest rates ranging from (0.03) percent to 8.37 percent and 0.00 percent to 8.37 percent, respectively, as summarized below (dollars in thousands). Advances with negative interest rates contain embedded interest rate features that have met the requirements to be separated from the host contract and are recorded as stand-alone derivatives, and which we economically hedge with derivatives containing offsetting interest rate features.
September 30, 2012 | December 31, 2011 | ||||||||||||
Year of Contractual Maturity | Amount | Weighted Average Rate | Amount | Weighted Average Rate | |||||||||
Overdrawn demand-deposit accounts | $ | 13,013 | 0.54 | % | $ | 7,683 | 0.45 | % | |||||
Due in one year or less | 11,087,724 | 0.88 | 8,266,384 | 1.15 | |||||||||
Due after one year through two years | 2,209,838 | 2.75 | 5,563,728 | 1.98 | |||||||||
Due after two years through three years | 2,341,603 | 2.71 | 2,721,354 | 2.88 | |||||||||
Due after three years through four years | 2,003,841 | 2.72 | 1,997,587 | 2.96 | |||||||||
Due after four years through five years | 3,094,195 | 3.01 | 2,151,231 | 2.90 | |||||||||
Thereafter | 2,594,097 | 3.23 | 3,873,205 | 3.71 | |||||||||
Total par value | 23,344,311 | 1.94 | % | 24,581,172 | 2.23 | % | |||||||
Premiums | 50,035 | 37,378 | |||||||||||
Discounts | (22,965 | ) | (23,748 | ) | |||||||||
Market value of embedded derivatives (1) | 1,008 | — | |||||||||||
Hedging adjustments | 543,298 | 600,096 | |||||||||||
Total | $ | 23,915,687 | $ | 25,194,898 | |||||||||
_________________________
(1) At September 30, 2012, the Bank had certain advances with embedded features that met the requirements to be separated from the host contract and designate the embedded features as a stand-alone derivative.
We offer putable advances that provide us with the right to put the fixed-rate advance to the borrower (and thereby extinguish the advance) on predetermined exercise dates (put dates), and offer, subject to certain conditions, replacement funding at then-current advances rates. Generally, we would exercise the put options when interest rates increase. At September 30, 2012, and December 31, 2011, we had putable advances outstanding totaling $3.6 billion and $4.7 billion, respectively.
21
The following table sets forth our advances outstanding by the year of contractual maturity or next put date for putable advances (dollars in thousands):
September 30, 2012 | December 31, 2011 | ||||||||||||
Year of Contractual Maturity or Next Put Date | Par Value | Percentage of Total | Par Value | Percentage of Total | |||||||||
Overdrawn demand-deposit accounts | $ | 13,013 | 0.1 | % | $ | 7,683 | 0.0 | % | |||||
Due in one year or less | 14,311,649 | 61.3 | 12,244,459 | 49.8 | |||||||||
Due after one year through two years | 1,848,588 | 7.9 | 4,975,328 | 20.2 | |||||||||
Due after two years through three years | 2,065,353 | 8.8 | 2,231,354 | 9.1 | |||||||||
Due after three years through four years | 1,707,941 | 7.3 | 1,797,337 | 7.3 | |||||||||
Due after four years through five years | 1,541,670 | 6.6 | 1,713,831 | 7.0 | |||||||||
Thereafter | 1,856,097 | 8.0 | 1,611,180 | 6.6 | |||||||||
Total par value | $ | 23,344,311 | 100.0 | % | $ | 24,581,172 | 100.0 | % | |||||
We also offer callable advances that provide borrowers with the right to call, on predetermined option exercise dates, the advance prior to maturity without incurring prepayment or termination fees (callable advances). In exchange for receiving the right to call the advance on a predetermined call schedule, the borrower pays a higher fixed rate for the advance relative to an equivalent maturity, noncallable, fixed-rate advance. If the call option is exercised, replacement funding may be available. Other advances may only be prepaid by paying a fee (a prepayment fee) that makes us financially indifferent to the prepayment of the advance. At September 30, 2012, and December 31, 2011, we had callable advances outstanding totaling $32.5 million and $2.5 million, respectively.
Interest-Rate-Payment Terms. The following table details interest-rate-payment types for our outstanding advances (dollars in thousands):
Par value of advances | September 30, 2012 | December 31, 2011 | |||||
Fixed-rate | $ | 19,272,798 | $ | 20,096,489 | |||
Variable-rate | 4,071,513 | 4,484,683 | |||||
Total par value | $ | 23,344,311 | $ | 24,581,172 | |||
At September 30, 2012, 32.8 percent of our fixed-rate advances were swapped to a floating rate and 3.7 percent of our variable-rate advances were swapped to a different variable-rate index. At December 31, 2011, 39.0 percent of our fixed-rate advances were swapped to a floating rate and 0.5 percent of our variable-rate advances were swapped to a different variable-rate index.
Credit Risk Exposure and Security Terms.
Our potential credit risk from advances is principally concentrated in commercial banks, insurance companies, savings institutions, and credit unions. At September 30, 2012, and December 31, 2011, we had $5.0 billion and $7.4 billion, respectively, of advances issued to members with at least $1.0 billion of advances outstanding. These advances were made to two borrowers at September 30, 2012, and three borrowers at December 31, 2011, representing 21.3 percent and 30.0 percent, respectively, of total par value of outstanding advances.
We lend to our members and certain nonmember institutions that are eligible to borrow from us (referred to as housing associates) chartered within the six New England states in accordance with federal statutes, including the Federal Home Loan Bank Act of 1932, as amended (the FHLBank Act). The FHLBank Act generally requires us to hold, or have access to, collateral to secure our advances. We maintain policies and procedures that are intended to manage credit risk including, without limitation, requirements for physical possession or control of pledged collateral, restrictions on borrowing, specific review of each advance request, verifications of collateral, and continuous monitoring of borrowings and the borrower's financial condition. Based on the collateral pledged as security for advances, management's credit analysis of the borrower's financial condition, and credit extension and collateral policies, we do not expect any losses on advances and expect to collect all amounts due according to the contractual terms of the advances. Therefore, we have not provided any allowance for losses on advances. For information related to our credit risk on advances and allowance for credit losses, see Note 9 — Allowance for Credit Losses.
22
Prepayment Fees. We record prepayment fees received from borrowers on prepaid advances net of any associated basis adjustments related to hedging activities on those advances and net of deferred prepayment fees on advance prepayments considered to be loan modifications. Additionally, under certain advances products the prepayment-fee provisions of the advance agreement could result in either a payment from the borrower or to the borrower when such an advance is prepaid, based upon market conditions at the time of prepayment (referred to as a symmetrical prepayment fee). Advances with a symmetrical prepayment fee provision are hedged with derivatives containing offsetting terms, so that we are financially indifferent to the borrower's decision to prepay such advances. The net amount of prepayment fees is reflected as interest income in the statement of operations.
For the three and nine months ended September 30, 2012 and 2011, net advance prepayment fees recognized in income are reflected in the following table (dollars in thousands):
For the Three Months Ended September 30, | For the Nine Months Ended September 30, | |||||||||||||||
2012 | 2011 | 2012 | 2011 | |||||||||||||
Prepayment fees received from borrowers | $ | 23,247 | $ | 49,976 | $ | 91,471 | $ | 68,641 | ||||||||
Less: hedging fair-value adjustments on prepaid advances | (11,125 | ) | (45,848 | ) | (50,270 | ) | (52,822 | ) | ||||||||
Less: net premiums associated with prepaid advances | (1,433 | ) | (1,218 | ) | (1,770 | ) | (1,781 | ) | ||||||||
Less: deferred recognition of prepayment fees received from borrowers on advance prepayments deemed to be loan modifications | (2,893 | ) | (1,084 | ) | (4,580 | ) | (2,461 | ) | ||||||||
Prepayment fees recognized in income on advance restructurings deemed to be extinguishments | 4,078 | 7,240 | 9,497 | 8,816 | ||||||||||||
Net prepayment fees recognized in income | $ | 11,874 | $ | 9,066 | $ | 44,348 | $ | 20,393 | ||||||||
Note 8 — Mortgage Loans Held for Portfolio
We invest in mortgage loans through the Mortgage Partnership Finance® (MPF®) program. These investments are either guaranteed or insured by federal agencies (government mortgage loans) or are credit-enhanced by the related participating financial institution (conventional mortgage loans). All such investments are held for portfolio. The mortgage loans are typically originated, credit-enhanced, and serviced by the related participating financial institution. The majority of these loans are serviced by the originating institution. However, a portion of these loans are sold servicing-released by the participating financial institution and serviced by a third-party servicer.
The following table presents certain characteristics of the mortgage loans in which we have invested (dollars in thousands):
September 30, 2012 | December 31, 2011 | ||||||
Real estate | |||||||
Fixed-rate 15-year single-family mortgages | $ | 681,720 | $ | 646,539 | |||
Fixed-rate 20- and 30-year single-family mortgages | 2,700,404 | 2,439,475 | |||||
Premiums | 55,931 | 35,420 | |||||
Discounts | (4,415 | ) | (5,708 | ) | |||
Deferred derivative gains and losses, net | 3,408 | 1,297 | |||||
Total mortgage loans held for portfolio | 3,437,048 | 3,117,023 | |||||
Less: allowance for credit losses | (5,514 | ) | (7,800 | ) | |||
Total mortgage loans, net of allowance for credit losses | $ | 3,431,534 | $ | 3,109,223 | |||
The following table details the par value of mortgage loans held for portfolio (dollars in thousands):
September 30, 2012 | December 31, 2011 | ||||||
Conventional mortgage loans | $ | 2,982,391 | $ | 2,777,100 | |||
Government mortgage loans | 399,733 | 308,914 | |||||
Total par value | $ | 3,382,124 | $ | 3,086,014 | |||
"Mortgage Partnership Finance," and "MPF," are registered trademarks of the FHLBank of Chicago.
23
See Note 9 — Allowance for Credit Losses for information related to our credit risk from our investments in mortgage loans and allowance for credit losses based on these investments.
Note 9 — Allowance for Credit Losses
We have developed and documented a systematic methodology for determining an allowance for credit losses for our:
• | extensions of credit, such as our advances and letters of credit; |
• | investments in government mortgage loans held for portfolio; |
• | investments in conventional mortgage loans held for portfolio; |
• | investments via term securities purchased under agreements to resell; and |
• | investments via term federal funds sold. |
An allowance for credit losses is a valuation allowance separately established for each identified portfolio segment, if necessary, to provide for probable losses inherent in our portfolio as of the statement of condition date. To the extent necessary, an allowance for credit losses for off-balance-sheet credit exposure is recorded as a liability.
Portfolio Segments. We have established an allowance methodology for each of our portfolio segments. A portfolio segment is defined as the level at which an entity develops and documents a systematic method for determining its allowance for credit losses.
Classes of Financing Receivables. Classes of financing receivables generally are a disaggregation of a portfolio segment to the extent that is needed to understand the exposure to credit risk arising from these financing receivables. We determined that no further disaggregation of portfolio segments identified above is needed as we assessed and measured the credit risk arising from these financing receivables at the portfolio segment level.
Credit Products
We manage our credit exposure to credit products through an integrated approach that generally provides for a credit limit to be established for each borrower, includes an ongoing review of each borrower's financial condition, and is coupled with collateral and lending policies that are intended to limit risk of loss while balancing borrowers' needs for a reliable source of funding. In addition, we lend in accordance with the FHLBank Act, Finance Agency regulations, and other applicable laws. The FHLBank Act requires us to obtain sufficient collateral to secure our credit products. The estimated value of the collateral pledged to secure each borrower's credit products is calculated by applying collateral discounts, or haircuts, to the value of the collateral. We accept certain investment securities, residential mortgage loans, deposits, and other assets as collateral. We require all borrowers that pledge securities collateral to place physical possession of such securities collateral with our safekeeping agent or the borrower's securities corporation, subject to a control agreement giving us appropriate control over such collateral. In addition, community financial institutions are eligible to use expanded statutory collateral provisions for small-business and agriculture loans. Members also pledge their Bank capital stock as collateral. Collateral arrangements may vary depending upon borrower credit quality, financial condition, performance, borrowing capacity, and overall credit exposure to the borrower. We can call for additional or substitute collateral to further safeguard our security interest. We believe our policies appropriately manage our credit risks arising from our credit products.
Depending on the financial condition of the borrower, we may allow the borrower to retain possession of loan collateral pledged to us while agreeing to hold such collateral for our benefit or require the borrower to specifically assign or place physical possession of such loan collateral with us or a third-party custodian that we approve.
We are provided an additional safeguard for our security interests by Section 10(e) of the FHLBank Act, which generally affords any security interest granted by a borrower to the Bank priority over the claims and rights of any other party. The exceptions to this prioritization are limited to claims that would be entitled to priority under otherwise applicable law and are held by bona fide purchasers for value or by secured parties with higher priority perfected security interests. However, the priority granted to our security interests under Section 10(e) of the FHLBank Act may not apply when lending to insurance company members. This is due to the anti-preemption provision contained in the McCarran-Ferguson Act, which provides that federal law does not preempt state insurance law unless the federal law expressly regulates the business of insurance. Thus, if state law conflicts with Section 10(e) of the FHLBank Act, the protection afforded by this provision may not be available to us. However, we perfect our security interests in the collateral pledged by our members, including insurance company members, by filing UCC-1 financing statements, taking possession or control of such collateral, or taking other appropriate steps.
Using a risk-based approach and taking into consideration each borrower's financial strength, we consider the types and level of collateral to be the primary indicator of credit quality on our credit products. At September 30, 2012, and December 31, 2011, we had rights to collateral, on a borrower-by-borrower basis, with an estimated value in excess of our outstanding extensions of
24
credit. The estimated value of the collateral required to secure each borrower's obligations is calculated by applying collateral discounts or haircuts.
We continue to evaluate and make changes to our collateral guidelines based on market conditions. At September 30, 2012, and December 31, 2011, we did not have any credit products that were past due, on nonaccrual status, or considered impaired. In addition, there were no troubled debt restructurings related to credit products during the nine months ended September 30, 2012, and September 30, 2011.
Based upon the collateral held as security, our credit extension and collateral policies, management's credit analysis, and the repayment history on credit products, we have not recorded any allowance for credit losses on credit products at September 30, 2012, and December 31, 2011. At September 30, 2012, and December 31, 2011, no liability to reflect an allowance for credit losses for off-balance-sheet credit exposures was recorded. See Note 18 — Commitments and Contingencies for additional information on our off-balance-sheet credit exposure.
Government Mortgage Loans Held for Portfolio
We invest in government mortgage loans secured by one- to four-family residential properties. Government mortgage loans are mortgage loans insured or guaranteed by the Federal Housing Administration, the Department of Veterans Affairs, the Rural Housing Service of the Department of Agriculture, or by the U.S. Department of Housing and Urban Development.
The servicer provides and maintains insurance or a guarantee from the applicable government agency. The servicer is responsible for compliance with all government agency requirements and for obtaining the benefit of the applicable insurance or guaranty with respect to defaulted government-guaranteed mortgage loans. Any losses incurred on such loans that are not recovered from the insurer or guarantor are absorbed by the related servicer. Therefore, we only have credit risk for these loans if the servicer fails to pay for losses not covered by insurance or guarantees. Based on our assessment of our servicers for these loans, there is no allowance for credit losses for the government mortgage loan portfolio as of September 30, 2012, and December 31, 2011. In addition, these mortgage loans are not placed on nonaccrual status due to the government guarantee or insurance on these loans and the contractual obligation of the loan servicers to repurchase their related loans when certain criteria are met.
Conventional Mortgage Loans Held for Portfolio
We use a model to determine our allowance for credit losses based on our investments in conventional mortgage loans. We periodically adjust the key inputs to this model in an effort intended to properly align our loss projections with the market conditions that are relevant to these loans. The key inputs to the model include past and current performance of these loans (including portfolio delinquency and default migration statistics), overall loan portfolio performance characteristics (including loss-mitigation features, especially credit enhancements, as discussed below under — Credit Enhancements), and loss-severity estimates for these loans. We update the following inputs at least once per quarter: current outstanding loan amounts, delinquency statistics of the portfolio, and related loss-mitigation features (including credit-enhancement and estimated credit-enhancement fee-recovery amounts) for all master commitments. A master commitment is a document which provides the general terms under which the participating financial institution will deliver mortgage loans, including a maximum loan delivery amount, maximum credit enhancement, if applicable, and expiration date. Additionally, we review the model's default migration factor on a quarterly basis to determine if the portfolio has exhibited any change in loans migrating from current to delinquent or from delinquent to default and make adjustments as appropriate.
We use a third-party loan-loss projection model to determine our loss-severity estimates for our master commitments. We update our loss-severity estimates periodically as we determine appropriate, but not less than once per year. The inputs to this model include loan-related characteristics (such as property types and locations), industry data (such as foreclosure timelines and associated costs), and current and projected housing prices.
Nonaccrual Loans. We place conventional mortgage loans on nonaccrual status when the collection of the contractual principal or interest is 90 days or more past due. When a conventional mortgage loan is placed on nonaccrual status, accrued but uncollected interest is reversed against interest income in the current period. We generally record cash payments received on nonaccrual loans first as interest income and then as a reduction of principal as specified in the contractual agreement, unless the collection of the remaining principal amount due is considered doubtful. If the collection of the remaining principal amount due is considered doubtful, cash payments received would be applied first solely to principal until the remaining principal amount due is expected to be collected and then as a recovery of any charge-off, if applicable, followed by recording interest income. A loan on nonaccrual status may be restored to accrual status when the collection of the contractual principal and interest is less than 90 days past due.
25
Impairment Methodology. A loan is considered impaired when, based on current information and events, it is probable that we will be unable to collect all amounts due according to the contractual terms of the loan agreement.
Loans that are on nonaccrual status and that are considered collateral-dependent are measured for impairment based on the fair value of the underlying property less estimated selling costs. Loans are considered collateral-dependent if repayment is expected to be provided solely by the sale of the underlying property, that is, there is no other available and reliable source of repayment. Collateral-dependent loans are impaired if the fair value of the underlying collateral less estimated selling costs is insufficient to recover the unpaid principal balance on the loan. Interest income on impaired loans is recognized in the same manner as nonaccrual loans as discussed above.
Charge-Off Policy. We evaluate whether to record a charge-off on a conventional mortgage loan upon the occurrence of a confirming event. Confirming events include, but are not limited to, the occurrence of foreclosure or notification of a claim against any of the credit enhancements. A charge-off is recorded if we determine that the recorded investment in the loan is not likely to be recovered.
Collectively Evaluated Mortgage Loans. We evaluate the credit risk of our investments in conventional mortgage loans for impairment on a collective basis that considers loan-pool-specific attribute data at the master commitment pool level, applies estimated loss severities, and incorporates available credit enhancements to establish our best estimate of probable incurred losses. Migration analysis is a methodology for estimating the rate of default experienced on pools of similar loans based on our historical experience. We apply migration analysis to conventional loans that are currently not past due, loans that are 30 to 59 days past due, 60 to 89 days past due, and 90 or more days past due. We then estimate the dollar amount of loans in these categories that we believe are likely to migrate to a realized loss position and apply a loss severity factor to estimate losses that would be incurred at the statement of condition date. Additionally, for our investments in loans modified under our temporary loan modification plan, on the effective date of a loan modification we measure the present value of expected future cash flows discounted at the loan's effective interest rate and reduce the carrying value of the loan accordingly. See — Troubled Debt Restructurings below for information on our temporary loan modification program.
Estimating a Margin of Imprecision. We also assess a factor for the margin for imprecision to the estimation of credit losses for the homogeneous population. The margin for imprecision is a factor in the allowance for credit losses that recognizes the imprecise nature of the measurement process and is included as part of the mortgage loan allowance for credit loss. This amount represents a subjective management judgment based on facts and circumstances that exist as of the reporting date that is unallocated to any specific measurable economic or credit event and is intended to cover other inherent losses that may not be captured in our methodology. The actual loss that may occur on homogeneous populations of mortgage loans may differ from the estimated loss.
Roll-Forward of Allowance for Credit Losses on Mortgage Loans. The following table presents a roll-forward of the allowance for credit losses on conventional mortgage loans for the three and nine months ended September 30, 2012, and 2011, as well as the recorded investment in mortgage loans by impairment methodology at September 30, 2012, and September 30, 2011 (dollars in thousands). The recorded investment in a loan is the par amount of the loan, adjusted for accrued interest, unamortized premiums or discounts, deferred derivative gains and losses, and direct write-downs. The recorded investment is net of any valuation allowance.
For the Three Months Ended September 30, | For the Nine Months Ended September 30, | ||||||||||||||
2012 | 2011 | 2012 | 2011 | ||||||||||||
Allowance for credit losses | |||||||||||||||
Balance at beginning of period | $ | 6,114 | $ | 7,181 | $ | 7,800 | $ | 8,653 | |||||||
Charge-offs | (77 | ) | — | (229 | ) | (14 | ) | ||||||||
Reduction of provision for credit losses | (523 | ) | — | (2,057 | ) | (1,458 | ) | ||||||||
Balance at end of period | $ | 5,514 | $ | 7,181 | $ | 5,514 | $ | 7,181 | |||||||
Ending balance, individually evaluated for impairment | $ | — | $ | — | $ | — | $ | — | |||||||
Ending balance, collectively evaluated for impairment | $ | 5,514 | $ | 7,181 | $ | 5,514 | $ | 7,181 | |||||||
Recorded investment, end of period (1) | |||||||||||||||
Individually evaluated for impairment | $ | — | $ | — | $ | — | $ | — | |||||||
Collectively evaluated for impairment | $ | 3,043,457 | $ | 2,832,696 | $ | 3,043,457 | $ | 2,832,696 | |||||||
_________________________
(1) | This amount excludes government mortgage loans because we make no allowance for credit losses based on our |
26
investments in government mortgage loans, as discussed above under — Government Mortgage Loans Held for Portfolio.
Credit Quality Indicators. Key credit quality indicators for mortgage loans include the migration of past due loans, nonaccrual loans, loans in process of foreclosure and impaired loans. The tables below set forth certain key credit quality indicators for our investments in mortgage loans at September 30, 2012, and December 31, 2011 (dollars in thousands):
September 30, 2012 | |||||||||||
Recorded Investment in Conventional Mortgage Loans | Recorded Investment in Government Mortgage Loans | Total | |||||||||
Past due 30-59 days delinquent | $ | 38,867 | $ | 15,481 | $ | 54,348 | |||||
Past due 60-89 days delinquent | 12,907 | 3,746 | 16,653 | ||||||||
Past due 90 days or more delinquent | 51,240 | 24,754 | 75,994 | ||||||||
Total past due | 103,014 | 43,981 | 146,995 | ||||||||
Total current loans | 2,940,443 | 367,540 | 3,307,983 | ||||||||
Total mortgage loans | $ | 3,043,457 | $ | 411,521 | $ | 3,454,978 | |||||
Other delinquency statistics | |||||||||||
In process of foreclosure, included above (1) | $ | 22,784 | $ | 11,326 | $ | 34,110 | |||||
Serious delinquency rate (2) | 1.70 | % | 6.02 | % | 2.21 | % | |||||
Past due 90 days or more still accruing interest | $ | — | $ | 24,754 | $ | 24,754 | |||||
Loans on nonaccrual status (3) | $ | 51,240 | $ | — | $ | 51,240 | |||||
_______________________
(1) | Includes loans where the decision of foreclosure or similar alternative such as pursuit of deed-in-lieu of foreclosure has been reported. |
(2) | Loans that are 90 days or more past due or in the process of foreclosure expressed as a percentage of the recorded investment in the total loan portfolio class. |
(3) | Includes conventional mortgage loans with contractual principal or interest payments 90 days or more past due and not accruing interest. |
December 31, 2011 | |||||||||||
Recorded Investment in Conventional Mortgage Loans | Recorded Investment in Government Mortgage Loans | Total | |||||||||
Past due 30-59 days delinquent | $ | 41,311 | $ | 15,477 | $ | 56,788 | |||||
Past due 60-89 days delinquent | 11,656 | 5,973 | 17,629 | ||||||||
Past due 90 days or more delinquent | 55,876 | 24,925 | 80,801 | ||||||||
Total past due | 108,843 | 46,375 | 155,218 | ||||||||
Total current loans | 2,710,526 | 269,101 | 2,979,627 | ||||||||
Total mortgage loans | $ | 2,819,369 | $ | 315,476 | $ | 3,134,845 | |||||
Other delinquency statistics | |||||||||||
In process of foreclosure, included above (1) | $ | 32,344 | $ | 7,413 | $ | 39,757 | |||||
Serious delinquency rate (2) | 1.99 | % | 7.90 | % | 2.59 | % | |||||
Past due 90 days or more still accruing interest | $ | — | $ | 24,925 | $ | 24,925 | |||||
Loans on nonaccrual status (3) | $ | 55,876 | $ | — | $ | 55,876 | |||||
_______________________
(1) | Includes loans where the decision of foreclosure or similar alternative such as pursuit of deed-in-lieu of foreclosure has been reported. |
(2) | Loans that are 90 days or more past due or in the process of foreclosure expressed as a percentage of the recorded investment in the total loan portfolio class. |
(3) | Includes conventional mortgage loans with contractual principal or interest payments 90 days or more past due and not accruing interest. |
27
Credit Enhancements. Our allowance for credit losses factors in the credit enhancements associated with conventional mortgage loans under the MPF program. These credit enhancements apply after the homeowner's equity is exhausted and can include primary and/or supplemental mortgage insurance or other kinds of credit enhancement. Any incurred losses that would be recovered from the credit enhancements are not reserved as part of our allowance for loan losses. In such cases, a receivable is generally established to reflect the expected recovery from credit-enhancement arrangements.
The conventional mortgage loans are required to be credit enhanced so that the risk of loss is limited to the losses equivalent to an investor in a double-A rated MBS at the time of purchase. We share the risk of credit losses on our investments in mortgage loans with the related participating financial institution by structuring potential losses on these investments into layers with respect to each master commitment. We analyze the risk characteristics of our mortgage loans using a model from an NRSRO to determine the amount of credit enhancement. This credit-enhancement amount is broken into a first-loss account and a credit-enhancement obligation of a participating financial institution, which is calculated based on the risk analysis to equal the difference between the amounts needed for the master commitment to have a rating equivalent to a double-A rated MBS and our initial first-loss account exposure.
The first-loss account represents the first layer or portion of credit losses which we incur with respect to our investments in mortgage loans after considering the borrower's equity and primary mortgage insurance. The participating financial institution is required to cover the next layer of losses up to an agreed-upon credit-enhancement obligation amount, which may consist of a direct liability of the participating financial institution to pay credit losses up to a specified amount, a contractual obligation of a participating financial institution to provide supplemental mortgage insurance, or a combination of both. We absorb any remaining unallocated losses.
The aggregate amount of the first-loss account is documented and tracked but is neither recorded nor reported as an allowance for loan losses in our financial statements. As credit and special hazard losses are realized that are not covered by the liquidation value of the real property or primary mortgage insurance, they are first charged to us, with a corresponding reduction of the first-loss account for that master commitment up to the amount in the first-loss account at that time. Over time, the first-loss account may cover the expected credit losses on a master commitment, although losses that are greater than expected or that occur early in the life of a master commitment could exceed the amount in the first-loss account. In that case, the excess losses would be charged to the participating financial institution's credit-enhancement amount, then to us after the participating financial institution's credit-enhancement amount has been exhausted.
For loans in which we buy or sell participations from or to other FHLBanks that participate in the MPF program (MPF Banks), the amount of the first-loss account remaining to absorb losses for loans that we own is partly dependent on the percentage of our participation in such loans. Assuming losses occur on a proportional basis between loans that we own and loans owned by other MPF Banks, at September 30, 2012, and December 31, 2011, the amount of first-loss account remaining for losses attributable to us was $20.8 million and $23.8 million, respectively.
Participating financial institutions are paid a credit-enhancement fee for assuming credit risk and in some instances all or a
portion of the credit-enhancement fee may be performance-based. For certain MPF products, our losses incurred under the first-loss account can be mitigated by withholding future performance credit-enhancement fees that would otherwise be payable to the participating financial institutions. We record credit-enhancement fees paid to participating financial institutions as a reduction to mortgage-loan-interest income. We incurred credit-enhancement fees of $782,000 and $762,000 for the three months ended September 30, 2012, and 2011, respectively. For both the nine months ended September 30, 2012, and 2011, we incurred credit-enhancement fees of $2.3 million .
Withheld credit-enhancement fees can mitigate losses from our investments in mortgage loans and therefore we consider our expectations by each master commitment for such withheld fees in determining the allowance for loan losses. More specifically, we determine the amount of credit-enhancement fees available to mitigate losses as follows: accrued credit-enhancement fees to be paid to participating financial institutions; plus projected credit-enhancement fees to be paid to the participating financial institutions over the next 12 months; minus any losses incurred or expected to be incurred. Available credit-enhancement fees cannot be shared between master commitments and, as a result, some master commitments may have sufficient credit-enhancement fees to recover all losses while other master commitments may not.
The following table demonstrates the impact on our estimate of the allowance for credit losses resulting from the loss-mitigating features of conventional mortgage loans (dollars in thousands).
28
September 30, 2012 | December 31, 2011 | ||||||
Total estimated losses | $ | 10,077 | $ | 10,274 | |||
Less: estimated losses in excess of the first-loss account, to be absorbed by participating financial institutions | (3,879 | ) | (1,622 | ) | |||
Less: estimated performance-based credit-enhancement fees available for recapture | (684 | ) | (852 | ) | |||
Net allowance for credit losses | $ | 5,514 | $ | 7,800 | |||
Troubled Debt Restructurings. A troubled debt restructuring is considered to have occurred when a concession is granted to a borrower for economic or legal reasons related to the borrower's financial difficulties and that concession would not have been considered otherwise.
Our program under MPF for mortgage loan troubled debt restructurings primarily involves modifying the borrower's monthly payment for a period of up to 36 months to achieve a housing expense ratio of no more than 31 percent of their qualifying monthly income. The outstanding principal balance is first re-amortized to reflect a principal and interest payment for a term not to exceed 40 years. This would result in a balloon payment at the original maturity date of the loan as the maturity date and number of remaining monthly payments are not adjusted. If the 31 percent housing expense ratio is not achieved through re-amortization, the interest rate is reduced for the temporary modification period of up to 36 months in 0.125 percent increments below the original note rate, to a floor rate of 3.00 percent, resulting in reduced principal and interest payments, until the desired 31 percent housing expense ratio is met.
During the three months ended September 30, 2012, we had four troubled debt restructurings. The recorded investment in the troubled debt restructurings pre-modification and post-modification was $734,000 and $715,000, respectively as of the modification date. During the nine months ended September 30, 2012, we had ten troubled debt restructurings. The recorded investment in the troubled debt restructurings for the pre-modification and post-modification was $2.0 million and $1.9 million as of the modification date.
As of September 30, 2012, and December 31, 2011, we had mortgage loans with a recorded investment of $2.3 million and $446,000, respectively that are considered a troubled debt restructuring. As of September 30, 2012, and 2011, our troubled debt restructurings were performing and have not re-defaulted.
REO. At each of September 30, 2012, and December 31, 2011, we had $7.9 million and $6.3 million, respectively in assets classified as REO. During the nine months ended September 30, 2012, and 2011, we sold REO assets with a recorded carrying value of $8.2 million and $7.5 million, respectively. Upon the sale of these properties, and inclusive of any proceeds received from primary mortgage-insurance coverage, we recognized net gains totaling $308,000 and $400,000 on the sale of REO assets during the nine months ended September 30, 2012, and 2011 respectively. Gains and losses on the sale of REO assets are recorded in other income.
Federal Funds Sold and Securities Purchased Under Agreements to Resell.
These investments are all short-term (less than three months). We invest in federal funds sold with investment-grade counterparties and we only evaluate these investments for purposes of an allowance for credit losses if the investment is not paid when due. All investments in federal funds sold as of September 30, 2012, and December 31, 2011, were repaid according to their contractual terms.
Securities purchased under agreements to resell are considered collateralized financing arrangements and effectively represent short-term loans to investment-grade counterparties. The terms of these loans are structured such that if the market value of the underlying securities decreases below the market value required as collateral, the counterparty must provide additional securities as collateral in an amount equal to the decrease or remit cash in such amount, or we will decrease the dollar value of the resale agreement accordingly. If we determine that an agreement to resell is impaired, the difference between the fair value of the collateral and the amortized cost of the agreement is charged to earnings. Based upon the collateral held as security, we determined that no allowance for credit losses was needed for the securities purchased under agreements to resell at September 30, 2012, and December 31, 2011.
Note 10 — Derivatives and Hedging Activities
All derivatives are recognized on the statement of condition at fair value. We offset fair-value amounts recognized for derivative instruments and fair-value amounts recognized for the right to reclaim cash collateral (a receivable) or the obligation to return cash collateral (a payable) arising from derivative instruments recognized at fair value executed with the same counterparty under a master-netting arrangement. Derivative assets and derivative liabilities reported on the statement of
29
condition also include net accrued interest. Cash flows associated with derivatives are reflected as cash flows from operating activities in the statement of cash flows unless the derivative meets the criteria to be a financing derivative.
Each derivative is designated as one of the following:
• | a qualifying hedge of the change in fair value of a recognized asset or liability or an unrecognized firm commitment (a fair value hedge); |
• | a qualifying hedge of a forecasted transaction or the variability of cash flows that are to be received or paid in connection with a recognized asset or liability (a cash-flow hedge); or |
• | a nonqualifying hedge of an asset or liability (an economic hedge) for asset-liability-management purposes. |
Accounting for Fair-Value or Cash-Flow Hedges. If hedging relationships meet certain criteria, including, but not limited to, formal documentation of the hedging relationship and an expectation to be highly effective, they qualify for fair-value or cash-flow hedge accounting and the offsetting changes in fair value of the hedged items are recorded either in earnings in the case of fair-value hedges or accumulated other comprehensive loss in the case of cash-flow hedges. Our approaches to hedge accounting are:
• | long-haul hedge accounting, which generally requires us to formally assess (both at the hedge's inception and at least quarterly) whether the derivatives that are used in hedging transactions have been effective in offsetting changes in the fair value or cash flows of hedged items or forecasted transactions and whether those derivatives may be expected to remain effective in future periods; and |
• | short-cut hedge accounting, which can be used for transactions for which the assumption can be made that the change in fair value of a hedged item, due to changes in the benchmark rate, exactly offsets the change in fair value of the related derivative. Under the short-cut method, the entire change in fair value of the interest-rate swap is considered to be effective at achieving offsetting changes in fair values or cash flows of the hedged asset or liability. |
Derivatives that are used in fair-value hedges are typically executed at the same time as the hedged items, and we designate the hedged item in a qualifying hedge relationship as of the trade date. In many hedging relationships that use the short-cut method, we may designate the hedging relationship upon our commitment to disburse an advance or trade a consolidated obligation (CO) that settles within the shortest period of time possible for the type of instrument based on market-settlement conventions. In such circumstances, although the advance or CO will not be recognized in the financial statements until settlement date, the hedge meets the criteria for applying the short-cut method, provided all other short-cut criteria are also met. We then record the changes in fair value of the derivative and the hedged item beginning on the trade date.
Changes in the fair value of a derivative that is designated and qualifies as a fair-value hedge, along with changes in the fair value of the hedged asset or liability that are attributable to the hedged risk (including changes that reflect losses or gains on firm commitments), are recorded in other income (loss) as net (losses) gains on derivatives and hedging activities.
Changes in the fair value of a derivative that is designated and qualifies as a cash-flow hedge, to the extent that the hedge is effective, are recorded in accumulated other comprehensive loss, a component of capital, until earnings are affected by the variability of the cash flows of the hedged transaction.
For both fair-value and cash-flow hedges, any hedge ineffectiveness (which represents the amount by which the changes in the fair value of the derivative differ from the change in the fair value of the hedged item or the variability in the cash flows of the forecasted transaction) is recorded in other income (loss) as net (losses) gains on derivatives and hedging activities.
Accounting for Economic Hedges. An economic hedge is defined as a derivative hedging specific or nonspecific assets, liabilities, or firm commitments that does not qualify or was not designated for fair-value or cash-flow hedge accounting, but is an acceptable hedging strategy under our risk-management policy. These economic hedging strategies also comply with Finance Agency regulatory requirements prohibiting speculative derivative transactions. An economic hedge by definition introduces the potential for earnings variability caused by the changes in fair value of the derivatives that are recorded in income but not offset by corresponding changes in the fair value of the economically hedged assets, liabilities, or firm commitments. As a result, we recognize only the net interest and the change in fair value of these derivatives in other income (loss) as net (losses) gains on derivatives and hedging activities with no offsetting fair-value adjustments for the economically hedged assets, liabilities, or firm commitments.
Accrued Interest Receivable and Payable. The differential between accrual of interest receivable and payable on derivatives designated as a fair-value hedge or as a cash-flow hedge is recognized through adjustments to the interest income or interest
30
expense of the designated hedged investment securities, advances, COs, deposits, or other financial instruments. The differential between accrual of interest receivable and payable on economic hedges is recognized in other income (loss), along with changes in fair value of these derivatives, as net (losses) gains on derivatives and hedging activities.
Discontinuance of Hedge Accounting. We may discontinue hedge accounting prospectively when:
• | we determine that the derivative is no longer effective in offsetting changes in the fair value or cash flows of a hedged item (including hedged items such as firm commitments or forecasted transactions); |
• | the derivative and/or the hedged item expires or is sold, terminated, or exercised; |
• | it is no longer probable that the forecasted transaction will occur in the originally expected period; |
• | a hedged firm commitment no longer meets the definition of a firm commitment; or |
• | we determine that designating the derivative as a hedging instrument is no longer appropriate. |
When hedge accounting is discontinued because we determine that the derivative no longer qualifies as an effective fair-value hedge of an existing hedged item, we either terminate the derivative or continue to carry the derivative on the statement of condition at its fair value and cease to adjust the hedged asset or liability for changes in fair value, and begin to amortize the cumulative basis adjustment on the hedged item into earnings over the remaining life of the hedged item using the level-yield method.
When hedge accounting is discontinued because we determine that the derivative no longer qualifies as an effective cash-flow hedge of an existing hedged item, we continue to carry the derivative on the statement of condition at its fair value and amortize the cumulative other comprehensive loss adjustment to earnings when earnings are affected by the existing hedged item.
If it is no longer probable that a forecasted transaction will occur by the end of the originally expected period or within two months thereafter, we immediately recognize the gain or loss that was in accumulated other comprehensive loss in earnings. In rare cases we may discontinue cash-flow hedge accounting, but the existence of extenuating circumstances related to the nature of the forecasted transaction and that are outside of our control or influence may make it probable that the forecasted transaction occurs in the future, on a date that is beyond the additional two-month period of time. In such cases, the gain or loss on the derivative remains in accumulated other comprehensive loss and is recognized in earnings when the forecasted transaction occurs.
When hedge accounting is discontinued because the hedged item no longer meets the definition of a firm commitment, we continue to carry the derivative on the statement of condition at its fair value, removing from the statement of condition any asset or liability that was recorded to recognize the firm commitment and recording it as a gain or loss in current period earnings.
Embedded Derivatives. We may issue debt, make advances, or purchase financial instruments in which a derivative instrument is embedded. Upon execution of these transactions, we assess whether the economic characteristics of the embedded derivative are clearly and closely related to the economic characteristics of the remaining component of the advance, debt, deposit, or other financial instrument (the host contract) and whether a separate, nonembedded instrument with the same terms as the embedded instrument would meet the definition of a derivative instrument. When we determine that (1) the embedded derivative has economic characteristics that are not clearly and closely related to the economic characteristics of the host contract and (2) a separate, stand-alone instrument with the same terms would qualify as a derivative instrument, the embedded derivative is separated from the host contract, carried at fair value, and designated as a stand-alone derivative instrument. If the entire contract (the host contract and the embedded derivative) is to be measured at fair value, with changes in fair value reported in current earnings (for example, an investment security classified as trading, as well as hybrid financial instruments) or if we cannot reliably identify and measure the embedded derivative for purposes of separating that derivative from its host contract, the entire contract is carried on the statement of condition at fair value and no portion of the contract is designated as a hedging instrument. At September 30, 2012, the Bank had certain advances with embedded features that met the requirement to be separated from the host contract and designate the embedded features as a stand-alone derivative. The value of the embedded derivatives is included in total advances on the Statement of Condition. See Note 7 — Advances for the fair value of the embedded derivatives. The Bank did not have any advances with embedded features that met the requirements to separate the embedded feature from the host contract and designate the embedded feature as a stand-alone derivative as of December 31, 2011.
Financial Statement Impact and Additional Financial Information. The notional amount of derivatives is a factor in determining periodic interest payments or cash flows received and paid. However, the notional amount of derivatives represents
31
neither the actual amounts exchanged nor our overall exposure to credit and market risk. The risks of derivatives can be measured meaningfully on a portfolio basis that takes into account the derivatives, the item being hedged, and any offsets between the two.
The following table presents the fair value of derivative instruments as of September 30, 2012 (dollars in thousands):
Notional Amount of Derivatives | Derivative Assets | Derivative Liabilities | |||||||||
Derivatives designated as hedging instruments | |||||||||||
Interest-rate swaps | $ | 14,840,400 | $ | 115,475 | $ | (964,100 | ) | ||||
Interest-rate futures / forwards | 1,250,000 | — | (64,855 | ) | |||||||
Total derivatives designated as hedging instruments | 16,090,400 | 115,475 | (1,028,955 | ) | |||||||
Derivatives not designated as hedging instruments | |||||||||||
Interest-rate swaps | 1,165,250 | 537 | (35,932 | ) | |||||||
Interest-rate caps or floors | 300,000 | 42 | — | ||||||||
Mortgage-delivery commitments (1) | 41,506 | 85 | (128 | ) | |||||||
Total derivatives not designated as hedging instruments | 1,506,756 | 664 | (36,060 | ) | |||||||
Total notional amount of derivatives | $ | 17,597,156 | |||||||||
Total derivatives before netting and collateral adjustments | 116,139 | (1,065,015 | ) | ||||||||
Netting adjustments (2) | (115,280 | ) | 115,280 | ||||||||
Cash collateral received from counterparties, including accrued interest | (330 | ) | — | ||||||||
Derivative assets and derivative liabilities | $ | 529 | $ | (949,735 | ) | ||||||
_______________________
(1) Mortgage-delivery commitments are classified as derivatives with changes in fair value recorded in other income.
(2) Amounts represent the effect of master-netting agreements intended to allow us to settle positive and negative positions.
The following table presents the fair value of derivative instruments as of December 31, 2011 (dollars in thousands):
Notional Amount of Derivatives | Derivative Assets | Derivative Liabilities | |||||||||
Derivatives designated as hedging instruments | |||||||||||
Interest-rate swaps | $ | 19,326,022 | $ | 229,091 | $ | (1,036,060 | ) | ||||
Interest-rate futures / forwards | 700,000 | — | (31,981 | ) | |||||||
Total derivatives designated as hedging instruments | 20,026,022 | 229,091 | (1,068,041 | ) | |||||||
Derivatives not designated as hedging instruments | |||||||||||
Interest-rate swaps | 235,750 | — | (30,506 | ) | |||||||
Interest-rate caps or floors | 300,000 | 786 | — | ||||||||
Mortgage-delivery commitments (1) | 17,734 | 128 | — | ||||||||
Total derivatives not designated as hedging instruments | 553,484 | 914 | (30,506 | ) | |||||||
Total notional amount of derivatives | $ | 20,579,506 | |||||||||
Total derivatives before netting and collateral adjustments | 230,005 | (1,098,547 | ) | ||||||||
Netting adjustments (2) | (193,438 | ) | 193,438 | ||||||||
Cash collateral received from counterparties, including accrued interest | (20,046 | ) | (195 | ) | |||||||
Derivative assets and derivative liabilities | $ | 16,521 | $ | (905,304 | ) | ||||||
_______________________
(1) Mortgage-delivery commitments are classified as derivatives with changes in fair value recorded in other income.
(2) Amounts represent the effect of master-netting agreements intended to allow us to settle positive and negative positions.
32
Net (losses) gains on derivatives and hedging activities recorded in Other Income (Loss) for the three and nine months ended September 30, 2012, and 2011, were as follows (dollars in thousands).
For the Three Months Ended September 30, | For the Nine Months Ended September 30, | |||||||||||||||
2012 | 2011 | 2012 | 2011 | |||||||||||||
Derivatives and hedged items in fair-value hedging relationships: | ||||||||||||||||
Interest-rate swaps | $ | 597 | $ | 445 | $ | 255 | $ | 1,846 | ||||||||
Derivatives not designated as hedging instruments: | ||||||||||||||||
Economic hedges: | ||||||||||||||||
Interest-rate swaps | (3,243 | ) | (17,952 | ) | (10,105 | ) | (24,674 | ) | ||||||||
Interest-rate caps or floors | (207 | ) | (1,147 | ) | (745 | ) | (2,298 | ) | ||||||||
Mortgage-delivery commitments | 767 | 1,180 | 2,086 | 1,599 | ||||||||||||
Total net losses related to derivatives not designated as hedging instruments | (2,683 | ) | (17,919 | ) | (8,764 | ) | (25,373 | ) | ||||||||
Net losses on derivatives and hedging activities | $ | (2,086 | ) | $ | (17,474 | ) | $ | (8,509 | ) | $ | (23,527 | ) | ||||
The following tables present, by type of hedged item, the gains (losses) on derivatives and the related hedged items in fair-value hedge relationships and the impact of those derivatives on our net interest income for the three and nine months ended September 30, 2012, and 2011 (dollars in thousands):
For the Three Months Ended September 30, 2012 | |||||||||||||||
Gain/(Loss) on Derivative | Gain/(Loss) on Hedged Item | Net Fair-Value Hedge Ineffectiveness | Effect of Derivatives on Net Interest Income (1) | ||||||||||||
Hedged Item: | |||||||||||||||
Advances | $ | 1,375 | $ | (1,116 | ) | $ | 259 | $ | (45,869 | ) | |||||
Investments | 7,645 | (7,183 | ) | 462 | (10,256 | ) | |||||||||
Deposits | (293 | ) | 293 | — | 385 | ||||||||||
COs – bonds | (6,947 | ) | 6,823 | (124 | ) | 21,003 | |||||||||
$ | 1,780 | $ | (1,183 | ) | $ | 597 | $ | (34,737 | ) | ||||||
For the Three Months Ended September 30, 2011 | |||||||||||||||
Gain/(Loss) on Derivative | Gain/(Loss) on Hedged Item | Net Fair-Value Hedge Ineffectiveness | Effect of Derivatives on Net Interest Income (1) | ||||||||||||
Hedged Item: | |||||||||||||||
Advances | $ | (68,999 | ) | $ | 68,954 | $ | (45 | ) | $ | (68,212 | ) | ||||
Investments | (146,239 | ) | 145,812 | (427 | ) | (11,751 | ) | ||||||||
Deposits | (23 | ) | 23 | — | 396 | ||||||||||
COs – bonds | 28,819 | (27,902 | ) | 917 | 37,594 | ||||||||||
$ | (186,442 | ) | $ | 186,887 | $ | 445 | $ | (41,973 | ) | ||||||
_______________________
(1) The net interest on derivatives in fair-value hedge relationships is presented in the interest income or interest expense of the respective hedged item in the statement of operations.
33
For the Nine Months Ended September 30, 2012 | |||||||||||||||
Gain/(Loss) on Derivative | Gain/(Loss) on Hedged Item | Net Fair-Value Hedge Ineffectiveness | Effect of Derivatives on Net Interest Income (1) | ||||||||||||
Hedged Item: | |||||||||||||||
Advances | $ | 55,505 | $ | (56,798 | ) | $ | (1,293 | ) | $ | (149,548 | ) | ||||
Investments | (5,066 | ) | 6,321 | 1,255 | (30,626 | ) | |||||||||
Deposits | (908 | ) | 908 | — | 1,151 | ||||||||||
COs – bonds | (109,114 | ) | 109,407 | 293 | 68,893 | ||||||||||
$ | (59,583 | ) | $ | 59,838 | $ | 255 | $ | (110,130 | ) | ||||||
For the Nine Months Ended September 30, 2011 | |||||||||||||||
Gain/(Loss) on Derivative | Gain/(Loss) on Hedged Item | Net Fair-Value Hedge Ineffectiveness | Effect of Derivatives on Net Interest Income (1) | ||||||||||||
Hedged Item: | |||||||||||||||
Advances | $ | (20,049 | ) | $ | 20,472 | $ | 423 | $ | (218,021 | ) | |||||
Investments | (145,876 | ) | 146,158 | 282 | (35,973 | ) | |||||||||
Deposits | (381 | ) | 381 | — | 1,183 | ||||||||||
COs – bonds | 29,952 | (28,811 | ) | 1,141 | 122,699 | ||||||||||
$ | (136,354 | ) | $ | 138,200 | $ | 1,846 | $ | (130,112 | ) | ||||||
______________
(1) The net interest on derivatives in fair-value hedge relationships is presented in the interest income or interest expense of the respective hedged item in the statement of operations.
The loss recognized in other comprehensive income for hedged items in cash-flow hedging relationships was $10.4 million and $25.2 million for the three months ended September 30, 2012, and 2011, respectively.
The loss recognized in other comprehensive income for hedged items in cash-flow hedging relationships was $32.9 million and $26.8 million for the nine months ended September 30, 2012, and 2011, respectively.
For the nine months ended September 30, 2012, there were no reclassifications from accumulated other comprehensive loss into earnings as a result of the discontinuance of cash-flow hedges because the original forecasted transactions were not expected to occur by the end of the originally specified time period or within a two-month period thereafter. The maximum length of time over which we are hedging our exposure to the variability in future cash flows for forecasted transactions is six years.
Managing Credit Risk on Derivatives. We are subject to credit risk on our hedging activities due to the risk of nonperformance by counterparties to the derivative agreements. The amount of potential counterparty risk depends on the extent to which master-netting arrangements are included in such contracts to mitigate the risk. We try to limit counterparty credit risk through our ongoing monitoring of counterparty creditworthiness and adherence to the requirements set forth in our policies and Finance Agency regulations. We require collateral agreements in connection with our derivatives transactions. These collateral agreements include collateral delivery thresholds. All counterparties must execute master-netting agreements prior to entering into any interest-rate-exchange agreement with us. These master-netting agreements contain bilateral-collateral exchange agreements that require that credit exposure beyond a defined threshold amount be secured by readily marketable, U.S. Treasury or GSE securities, or cash. The level of these collateral threshold amounts varies according to the counterparty's Standard & Poor's Ratings Services (S&P) or Moody's Investors Service (Moody's) long-term credit ratings. Credit exposures are then measured daily and adjustments to collateral positions are made in accordance with the terms of the master-netting agreements. These master-netting agreements also contain bilateral ratings-tied termination events permitting us to terminate all outstanding agreements with a counterparty in the event of a specified rating downgrade by Moody's or S&P. Based on credit analyses and collateral requirements, we do not anticipate any credit losses on our derivative agreements.
The table below presents credit-risk exposure on derivative instruments, excluding the amount of excess cash collateral received from counterparties in instances where a counterparty's pledged cash collateral to us exceeds our net position (dollars in thousands).
34
September 30, 2012 | December 31, 2011 | |||||||
Total net exposure at fair value(1) | $ | 859 | $ | 36,567 | ||||
Less: cash collateral received from counterparties, including accrued interest | (330 | ) | (20,046 | ) | ||||
Net exposure after cash collateral | $ | 529 | $ | 16,521 | ||||
_______________________
(1) Includes net accrued interest receivable of $1.7 million and $988,000 at September 30, 2012, and December 31, 2011, respectively.
Certain of our master-netting agreements contain provisions that require us to post additional collateral with our counterparties if there is deterioration in our credit ratings. Under the terms that govern such agreements, if our credit rating is lowered by Moody's or S&P to a certain level, we are required to deliver additional collateral on derivative instruments in a net liability position. In the event of a split among such credit ratings, the lower ratings govern. The aggregate fair value of all derivative instruments with these provisions that were in a net-liability position (before cash collateral and related accrued interest) at September 30, 2012, was $949.6 million for which we had delivered collateral with a post-haircut value of $800.9 million in accordance with the terms of the master-netting agreements. The following table sets forth the post-haircut value of incremental collateral that certain swap counterparties could have required us to deliver based on incremental credit rating downgrades at September 30, 2012 (dollars in thousands).
Post-haircut Value of Incremental Collateral to be Delivered as of September 30, 2012 | |||||
Ratings Downgrade (1) | |||||
From | To | Incremental Collateral(2) | |||
AA+ | AA or AA- | $ | 39,664 | ||
AA- | A+, A or A- | 79,106 | |||
A- | below A- | 14,000 | |||
_______________________
(1) | Ratings are expressed in this table according to S&P's conventions but include the equivalent of such rating by Moody's and they represent the lower of our S&P and Moody's ratings. |
(2) Additional collateral of $15.9 million could be called by counterparties as of September 30, 2012, at our current credit rating of AA+ (based on the lower of our credit ratings from S&P and Moody's) and is not included in the table.
We execute derivatives with nonmember counterparties with long-term ratings of single-A (or equivalent) or better by S&P, Moody's, and Fitch, Inc. (Fitch) at the time of the transaction, although risk-reducing trades are permitted for counterparties whose ratings have fallen below these ratings. Some of these counterparties or their affiliates buy, sell, and distribute COs. See Note 12 — Consolidated Obligations for additional information. See also Note 18 — Commitments and Contingencies for a discussion of assets we have pledged to these counterparties. We are not a derivatives dealer and do not trade derivatives for short-term profit.
Note 11 — Deposits
We offer demand and overnight deposits for members and qualifying nonmembers. In addition, we offer short-term interest-bearing deposit programs to members. Members that service mortgage loans may deposit funds collected in connection with mortgage loans pending disbursement of such funds to the owners of the mortgage loans. We classify these items as "other" in the following table.
Deposits at September 30, 2012, and December 31, 2011, include hedging adjustments of $3.1 million and $4.0 million, respectively.
The following table details interest-bearing and non-interest-bearing deposits (dollars in thousands):
35
September 30, 2012 | December 31, 2011 | ||||||
Interest bearing | |||||||
Demand and overnight | $ | 623,302 | $ | 600,155 | |||
Term | 21,894 | 22,401 | |||||
Other | 3,585 | 4,571 | |||||
Non-interest bearing | |||||||
Other | 36,547 | 27,119 | |||||
Total deposits | $ | 685,328 | $ | 654,246 | |||
The aggregate amount of time deposits with a denomination of $100,000 or more was $20.0 million as of September 30, 2012, and December 31, 2011.
Note 12 — Consolidated Obligations
COs consist of CO bonds and CO discount notes. CO bonds are issued primarily to raise intermediate- and long-term funds and are not subject to any statutory or regulatory limits on maturity. CO discount notes are issued to raise short-term funds and have original maturities of up to one year. These notes sell at less than their face amount and are redeemed at par value when they mature.
The following table sets forth the outstanding CO bonds for which we were primarily liable at September 30, 2012, and December 31, 2011, by year of contractual maturity (dollars in thousands):
September 30, 2012 | December 31, 2011 | ||||||||||||
Year of Contractual Maturity | Amount | Weighted Average Rate (1) | Amount | Weighted Average Rate (1) | |||||||||
Due in one year or less | $ | 10,501,520 | 1.60 | % | $ | 12,825,580 | 1.27 | % | |||||
Due after one year through two years | 6,133,520 | 1.49 | 7,196,250 | 2.04 | |||||||||
Due after two years through three years | 2,697,160 | 2.25 | 2,776,845 | 2.42 | |||||||||
Due after three years through four years | 2,771,570 | 2.48 | 1,964,000 | 3.20 | |||||||||
Due after four years through five years | 2,350,255 | 2.03 | 1,832,350 | 2.34 | |||||||||
Thereafter | 3,474,230 | 3.10 | 2,938,350 | 3.90 | |||||||||
Total par value | 27,928,255 | 1.95 | % | 29,533,375 | 2.03 | % | |||||||
Premiums | 248,542 | 179,113 | |||||||||||
Discounts | (25,296 | ) | (29,833 | ) | |||||||||
Hedging adjustments | 87,398 | 196,805 | |||||||||||
$ | 28,238,899 | $ | 29,879,460 | ||||||||||
_______________________
(1) The CO bonds' weighted-average rate excludes concession fees.
Our CO bonds outstanding at September 30, 2012, and December 31, 2011, included (dollars in thousands):
September 30, 2012 | December 31, 2011 | ||||||
Par value of CO bonds | |||||||
Noncallable and non-putable | $ | 26,195,255 | $ | 26,535,375 | |||
Callable | 1,733,000 | 2,998,000 | |||||
Total par value | $ | 27,928,255 | $ | 29,533,375 | |||
The following is a summary of the CO Bonds for which we are primarily liable at September 30, 2012, and December 31, 2011, by year of contractual maturity or next call date for callable CO bonds (dollars in thousands):
36
Year of Contractual Maturity or Next Call Date | September 30, 2012 | December 31, 2011 | ||||||
Due in one year or less | $ | 12,041,520 | $ | 14,425,580 | ||||
Due after one year through two years | 6,196,520 | 7,234,250 | ||||||
Due after two years through three years | 2,627,160 | 2,531,845 | ||||||
Due after three years through four years | 2,786,570 | 1,849,000 | ||||||
Due after four years through five years | 2,300,255 | 1,387,350 | ||||||
Thereafter | 1,976,230 | 2,105,350 | ||||||
Total par value | $ | 27,928,255 | $ | 29,533,375 | ||||
The following table sets forth the CO bonds for which we were primarily liable by interest-rate-payment type at September 30, 2012, and December 31, 2011 (dollars in thousands):
September 30, 2012 | December 31, 2011 | ||||||
Par value of CO bonds | |||||||
Fixed-rate | $ | 22,803,255 | $ | 25,473,375 | |||
Simple variable-rate | 4,760,000 | 3,350,000 | |||||
Step-up | 365,000 | 710,000 | |||||
Total par value | $ | 27,928,255 | $ | 29,533,375 | |||
At September 30, 2012, and December 31, 2011, 33.5 percent and 42.5 percent, respectively, of our fixed-rate CO bonds were swapped to a floating rate. At September 30, 2012, 11.6 percent of our variable-rate bonds were swapped to a different variable-rate index. We did not have any swapped variable rate bonds at December 31, 2011.
COs – Discount Notes. Outstanding CO discount notes for which we were primarily liable, all of which are due within one year, were as follows (dollars in thousands):
Book Value | Par Value | Weighted Average Rate (1) | ||||||||
September 30, 2012 | $ | 11,993,572 | $ | 11,995,000 | 0.12 | % | ||||
December 31, 2011 | $ | 14,651,793 | $ | 14,652,040 | 0.01 | % | ||||
_______________________
(1) The CO discount notes' weighted-average rate represents a yield to maturity excluding concession fees.
Note 13 — Affordable Housing Program
We charge the amount set aside for the AHP to income and recognize it as a liability. We then reduce the AHP liability as the funds are disbursed. We had outstanding principal in AHP advances of $98.7 million and $97.9 million at September 30, 2012, and December 31, 2011, respectively.
The following table is a roll-forward of the AHP liability for the nine months ended September 30, 2012, and the year ended December 31, 2011 (dollars in thousands):
September 30, 2012 | December 31, 2011 | ||||||
Balance at beginning of year | $ | 34,241 | $ | 23,138 | |||
AHP expense for the period | 17,160 | 17,812 | |||||
AHP direct grant disbursements | (4,313 | ) | (5,775 | ) | |||
AHP subsidy for AHP advance disbursements | (1,427 | ) | (1,371 | ) | |||
Return of previously disbursed grants and subsidies | 72 | 437 | |||||
Balance at end of period | $ | 45,733 | $ | 34,241 | |||
Note 14 — Capital
We are subject to capital requirements under our capital plan, the FHLBank Act and Finance Agency regulations:
1. Risk-based capital. We are required to maintain at all times permanent capital, defined as Class B stock and retained
37
earnings, in an amount at least equal to the sum of our credit-risk capital requirement, market-risk capital requirement, and operations-risk capital requirement, calculated in accordance with Finance Agency rules and regulations, referred to herein as the risk-based capital requirement. Only permanent capital satisfies this risk-based capital requirement. The Finance Agency may require us to maintain a greater amount of permanent capital than is required as defined by the risk-based capital requirements.
2. Total regulatory capital. We are required to maintain at all times a total capital-to-assets ratio of at least four percent. Total regulatory capital is the sum of permanent capital, any general loss allowance if consistent with GAAP and not established for specific assets, and other amounts from sources determined by the Finance Agency as available to absorb losses.
3. Leverage capital. We are required to maintain at all times a leverage capital-to-assets ratio of at least five percent. A leverage capital-to-assets ratio is defined as permanent capital weighted 1.5 times divided by total assets.
Mandatorily redeemable capital stock, which is classified as a liability under GAAP, is considered capital for determining our compliance with our regulatory capital requirements.
The following tables demonstrate our compliance with our regulatory capital requirements at September 30, 2012, and December 31, 2011 (dollars in thousands):
Risk-Based Capital Requirements | September 30, 2012 | December 31, 2011 | |||||
Permanent capital | |||||||
Class B capital stock | $ | 3,433,016 | $ | 3,625,348 | |||
Mandatorily redeemable capital stock | 215,863 | 227,429 | |||||
Retained earnings | 538,234 | 398,097 | |||||
Total permanent capital | $ | 4,187,113 | $ | 4,250,874 | |||
Risk-based capital requirement | |||||||
Credit-risk capital | $ | 494,777 | $ | 582,879 | |||
Market-risk capital | 71,865 | 91,337 | |||||
Operations-risk capital | 169,993 | 202,265 | |||||
Total risk-based capital requirement | $ | 736,635 | $ | 876,481 | |||
Excess of risk-based capital requirement | $ | 3,450,478 | $ | 3,374,393 | |||
September 30, 2012 | December 31, 2011 | |||||||||||||||
Required | Actual | Required | Actual | |||||||||||||
Capital Ratio | ||||||||||||||||
Risk-based capital | $ | 736,635 | $ | 4,187,113 | $ | 876,481 | $ | 4,250,874 | ||||||||
Total regulatory capital | $ | 1,829,701 | $ | 4,187,113 | $ | 1,998,733 | $ | 4,250,874 | ||||||||
Total capital-to-asset ratio | 4.0 | % | 9.2 | % | 4.0 | % | 8.5 | % | ||||||||
Leverage Ratio | ||||||||||||||||
Leverage capital | $ | 2,287,127 | $ | 6,280,670 | $ | 2,498,417 | $ | 6,376,311 | ||||||||
Leverage capital-to-assets ratio | 5.0 | % | 13.7 | % | 5.0 | % | 12.8 | % | ||||||||
Restricted Retained Earnings. Pursuant to a joint capital enhancement agreement among the FHLBanks, as amended (the Joint Capital Agreement), and our capital plan, we, together with the other FHLBanks, are required to contribute 20 percent of our quarterly net income to a restricted retained earnings account until the balance of that account equals at least one percent of the FHLBank's average balance of outstanding COs (excluding fair-value adjustments) for the calendar quarter. At September 30, 2012, our contribution requirement totaled $417.8 million. As of September 30, 2012, and December 31, 2011, restricted retained earnings totaled $53.7 million and $22.9 million, respectively.
Note 15 — Accumulated Other Comprehensive Loss
38
The following table presents a summary of changes in accumulated other comprehensive loss for the nine months ended September 30, 2012, and 2011 (dollars in thousands):
Net Unrealized Loss on Available-for-Sale Securities | Net Noncredit Portion of Other-Than-Temporary Impairment Losses on Held-to-Maturity Securities | Net Unrealized Loss Relating to Hedging Activities | Pension and Postretirement Benefits | Total Accumulated Other Comprehensive Loss | ||||||||||||||||
Balance, December 31, 2010 | $ | (15,193 | ) | $ | (621,528 | ) | $ | (341 | ) | $ | (1,049 | ) | $ | (638,111 | ) | |||||
Other comprehensive income (loss) | (18,353 | ) | 166,803 | (26,832 | ) | (224 | ) | 121,394 | ||||||||||||
Balance, September 30, 2011 | $ | (33,546 | ) | $ | (454,725 | ) | $ | (27,173 | ) | $ | (1,273 | ) | $ | (516,717 | ) | |||||
Balance, December 31, 2011 | $ | (48,560 | ) | $ | (450,996 | ) | $ | (32,308 | ) | $ | (2,547 | ) | $ | (534,411 | ) | |||||
Other comprehensive (loss) income | 15,643 | 47,457 | (32,863 | ) | (500 | ) | 29,737 | |||||||||||||
Balance, September 30, 2012 | $ | (32,917 | ) | $ | (403,539 | ) | $ | (65,171 | ) | $ | (3,047 | ) | $ | (504,674 | ) | |||||
Note 16 — Employee Retirement Plans
Qualified Defined Benefit Multiemployer Plan. We participate in the Pentegra Defined Benefit Plan for Financial Institutions (the Pentegra Defined Benefit Plan), a funded, tax-qualified, noncontributory defined-benefit pension plan. The Pentegra Defined Benefit Plan is treated as a multiemployer plan for accounting purposes, but operates as a multiple-employer plan under the Employee Retirement Income Security Act of 1974, as amended, and the Internal Revenue Code. Accordingly, certain multiemployer plan disclosures, including the certified zone status, are not applicable to the Pentegra Defined Benefit Plan. Under the Pentegra Defined Benefit Plan, contributions made by a participating employer may be used to provide benefits to employees of other participating employers since assets contributed by an employer are not segregated in a separate account or restricted to provide benefits only to employees of that employer. Also, in the event a participating employer is unable to meet its contribution requirements, the required contributions for the other participating employers could increase proportionately. The plan covers substantially all of our officers and employees. The following table shows the net pension cost charged to compensation and benefits expense (dollars in thousands).
For the Three Months Ended September 30, | For the Nine Months Ended September 30, | ||||||||||||||
2012 | 2011 | 2012 | 2011 | ||||||||||||
Net pension cost | $ | 1,104 | $ | 1,250 | $ | 3,212 | $ | 3,098 | |||||||
Qualified Defined Contribution Plan. We also participate in the Pentegra Defined Contribution Plan for Financial
Institutions, a tax-qualified defined contribution plan. The plan covers substantially all of our officers and employees. We contribute a percentage of the participants' compensation by making a matching contribution equal to a percentage of voluntary employee contributions, subject to certain limitations. Our matching contributions are charged to compensation and benefits expense.
Nonqualified Defined Contribution Plan. We also maintain the Thrift Benefit Equalization Plan, a nonqualified, unfunded deferred compensation plan covering certain of our senior officers and directors. The plan's liability consists of the accumulated compensation deferrals and the accumulated earnings on these deferrals. Our obligation from this plan, was $3.6 million and $3.2 million at September 30, 2012, and December 31, 2011, respectively. We maintain a rabbi trust intended to satisfy future benefit obligations.
The following table sets forth expenses relating to our defined contribution plans (dollars in thousands):
39
For the Three Months Ended September 30, | For the Nine Months Ended September 30, | ||||||||||||||
2012 | 2011 | 2012 | 2011 | ||||||||||||
Qualified Defined Contribution Plan - Pentegra Defined Contribution Plan | $ | 232 | $ | 212 | $ | 713 | $ | 646 | |||||||
Nonqualified Defined Contribution Plan - Thrift Benefit Equalization Plan | 11 | 16 | 80 | 68 | |||||||||||
Nonqualified Supplemental Defined Benefit Retirement Plan. We also maintain a nonqualified, unfunded defined-benefit plan covering certain senior officers. We maintain a rabbi trust intended to meet future benefit obligations.
Postretirement Benefits. We sponsor a fully insured postretirement benefit program that includes life insurance benefits for eligible retirees. We provide life insurance to all employees who retire on or after age 55 after completing six years of service. No contributions are required from the retirees. There are no funded plan assets that have been designated to provide postretirement benefits.
In connection with the nonqualified supplemental defined benefit retirement plan and postretirement benefits, we recorded the following amounts as of September 30, 2012, and December 31, 2011 (dollars in thousands):
Nonqualified Supplemental Defined Benefit Retirement Plan | Postretirement Benefits | ||||||||||||||
September 30, 2012 | December 31, 2011 | September 30, 2012 | December 31, 2011 | ||||||||||||
Change in benefit obligation (1) | |||||||||||||||
Benefit obligation at beginning of year | $ | 5,901 | $ | 3,859 | $ | 634 | $ | 499 | |||||||
Service cost | 299 | 261 | 24 | 25 | |||||||||||
Interest cost | 209 | 238 | 21 | 26 | |||||||||||
Actuarial loss (gain) | 860 | 1,543 | (4 | ) | 97 | ||||||||||
Benefits paid | (301 | ) | — | (13 | ) | (13 | ) | ||||||||
Benefit obligation at end of period | 6,968 | 5,901 | 662 | 634 | |||||||||||
Change in plan assets | |||||||||||||||
Fair value of plan assets at beginning of year | — | — | — | — | |||||||||||
Employer contribution | 301 | — | 13 | 13 | |||||||||||
Benefits paid | (301 | ) | — | (13 | ) | (13 | ) | ||||||||
Fair value of plan assets at end of period | — | — | — | — | |||||||||||
Funded status at end of period | $ | (6,968 | ) | $ | (5,901 | ) | $ | (662 | ) | $ | (634 | ) | |||
______________________
(1) This represents projected benefit obligation for the nonqualified supplemental defined benefit retirement plan and accumulated postretirement benefit obligation for postretirement benefits.
The following table presents the components of net periodic benefit cost and other amounts recognized in accumulated other comprehensive loss for our nonqualified supplemental defined benefit retirement plan and postretirement benefits for the three and nine months ended September 30, 2012, and 2011 (dollars in thousands):
40
Nonqualified Supplemental Defined Benefit Retirement Plan For the Three Months Ended September 30, | Postretirement Benefits For the Three Months Ended September 30, | |||||||||||||||
2012 | 2011 | 2012 | 2011 | |||||||||||||
Net Periodic Benefit Cost | ||||||||||||||||
Service cost | $ | 120 | $ | 71 | $ | 8 | $ | 6 | ||||||||
Interest cost | 83 | 64 | 7 | 7 | ||||||||||||
Amortization of net actuarial loss | 116 | 35 | 3 | — | ||||||||||||
Net periodic benefit cost | $ | 319 | $ | 170 | $ | 18 | $ | 13 | ||||||||
Nonqualified Supplemental Defined Benefit Retirement Plan For the Nine Months Ended September 30, | Postretirement Benefits For the Nine Months Ended September 30, | |||||||||||||||
2012 | 2011 | 2012 | 2011 | |||||||||||||
Net Periodic Benefit Cost | ||||||||||||||||
Service cost | $ | 299 | $ | 191 | $ | 24 | $ | 19 | ||||||||
Interest cost | 209 | 173 | 21 | 20 | ||||||||||||
Amortization of net actuarial loss | 349 | 106 | 7 | 1 | ||||||||||||
Net periodic benefit cost | $ | 857 | $ | 470 | $ | 52 | $ | 40 | ||||||||
Note 17 — Fair Values
The carrying values, fair values and fair-value hierarchy of our financial instruments at September 30, 2012 were as follows (dollars in thousands):
41
September 30, 2012 | |||||||||||||||||||||||
Carrying Value | Total Fair Value | Level 1 | Level 2 | Level 3 | Netting Adjustments and Cash Collateral | ||||||||||||||||||
Financial instruments | |||||||||||||||||||||||
Assets: | |||||||||||||||||||||||
Cash and due from banks | $ | 306,166 | $ | 306,166 | $ | 306,166 | $ | — | $ | — | $ | — | |||||||||||
Interest-bearing deposits | 261 | 261 | 261 | — | — | — | |||||||||||||||||
Securities purchased under agreements to resell | 5,125,000 | 5,124,986 | — | 5,124,986 | — | — | |||||||||||||||||
Federal funds sold | 1,100,000 | 1,099,996 | — | 1,099,996 | — | — | |||||||||||||||||
Trading securities(1) | 279,420 | 279,420 | — | 279,420 | — | — | |||||||||||||||||
Available-for-sale securities(1) | 5,764,096 | 5,764,096 | — | 5,764,096 | — | — | |||||||||||||||||
Held-to-maturity securities(2) | 5,679,296 | 5,915,270 | — | 4,319,536 | 1,595,734 | — | |||||||||||||||||
Advances | 23,915,687 | 24,362,020 | — | 24,362,020 | — | — | |||||||||||||||||
Mortgage loans, net | 3,431,534 | 3,674,029 | — | 3,674,029 | — | — | |||||||||||||||||
Accrued interest receivable | 95,950 | 95,950 | — | 95,950 | — | — | |||||||||||||||||
Derivative assets(1) | 529 | 529 | — | 116,139 | — | (115,610 | ) | ||||||||||||||||
Liabilities: | |||||||||||||||||||||||
Deposits | (685,328 | ) | (685,177 | ) | — | (685,177 | ) | — | — | ||||||||||||||
COs: | |||||||||||||||||||||||
Bonds | (28,238,899 | ) | (29,024,692 | ) | — | (29,024,692 | ) | — | — | ||||||||||||||
Discount notes | (11,993,572 | ) | (11,993,960 | ) | — | (11,993,960 | ) | — | — | ||||||||||||||
Mandatorily redeemable capital stock | (215,863 | ) | (215,863 | ) | (215,863 | ) | — | — | — | ||||||||||||||
Accrued interest payable | (128,966 | ) | (128,966 | ) | — | (128,966 | ) | — | — | ||||||||||||||
Derivative liabilities(1) | (949,735 | ) | (949,735 | ) | — | (1,065,015 | ) | — | 115,280 | ||||||||||||||
Other: | |||||||||||||||||||||||
Commitments to extend credit for advances | — | 996 | — | 996 | — | — | |||||||||||||||||
Standby bond-purchase agreements | — | 641 | — | 641 | — | — | |||||||||||||||||
Standby letters of credit | (531 | ) | (531 | ) | — | (531 | ) | — | — | ||||||||||||||
_______________________
(1) | Carried at fair value on a recurring basis. |
(2) | Private-label residential MBS and HFA securities are categorized as Level 3. Private-label residential MBS that have suffered other than temporary impairments are measured at fair value on a nonrecurring basis. See the recurring and nonrecurring tables below for more details. |
The carrying values and fair values of our financial instruments at December 31, 2011, were as follows (dollars in thousands):
42
December 31, 2011 | |||||||
Carrying Value | Fair Value | ||||||
Financial instruments | |||||||
Assets: | |||||||
Cash and due from banks | $ | 112,094 | $ | 112,094 | |||
Interest-bearing deposits | 177 | 177 | |||||
Securities purchased under agreements to resell | 6,900,000 | 6,899,645 | |||||
Federal funds sold | 2,270,000 | 2,269,951 | |||||
Trading securities | 274,164 | 274,164 | |||||
Available-for-sale securities | 5,280,199 | 5,280,199 | |||||
Held-to-maturity securities | 6,655,008 | 6,663,066 | |||||
Advances | 25,194,898 | 25,718,265 | |||||
Mortgage loans, net | 3,109,223 | 3,305,265 | |||||
Accrued interest receivable | 116,517 | 116,517 | |||||
Derivative assets | 16,521 | 16,521 | |||||
Liabilities: | |||||||
Deposits | (654,246 | ) | (654,094 | ) | |||
COs: | |||||||
Bonds | (29,879,460 | ) | (30,655,174 | ) | |||
Discount notes | (14,651,793 | ) | (14,651,926 | ) | |||
Mandatorily redeemable capital stock | (227,429 | ) | (227,429 | ) | |||
Accrued interest payable | (110,782 | ) | (110,782 | ) | |||
Derivative liabilities | (905,304 | ) | (905,304 | ) | |||
Other: | |||||||
Commitments to extend credit for advances | — | 2,612 | |||||
Standby bond-purchase agreements | — | 1,814 | |||||
Standby letters of credit | (625 | ) | (625 | ) | |||
Fair-Value Methodologies and Techniques.
We have determined the fair-value amounts above using available market and other pertinent information and our best judgment of appropriate valuation methods. Although we use our best judgment in estimating the fair value of these financial instruments, there are inherent limitations in any estimation technique or valuation methodology. For example, because an active secondary market does not exist for a portion of our financial instruments, in certain cases, fair values are not subject to precise quantification or verification and may change as economic and market factors and evaluation of those factors change. Therefore, these fair values are not necessarily indicative of the amounts that would be realized in current market transactions, although they do reflect our judgment of how a market participant would estimate the fair values.
Fair-Value Hierarchy. Fair value is the price in an orderly transaction between market participants to sell an asset or transfer a liability in the principal (or most advantageous) market for the asset or liability at the measurement date (an exit price).
We record trading securities, available-for-sale securities, derivative assets, and derivative liabilities at fair value on a recurring basis and on occasion, certain private-label MBS and REO on a nonrecurring basis. The fair value hierarchy requires an entity to maximize the use of observable inputs and minimize the use of unobservable inputs when measuring fair value. The inputs are evaluated and an overall level for the fair-value measurement is determined. This overall level is an indication of market observability of the fair-value measurement for the asset or liability.
The fair-value hierarchy prioritizes the inputs used to measure fair value into three broad levels:
Level 1 Quoted prices (unadjusted) for identical assets or liabilities in an active market that the reporting entity
can access on the measurement date.
Level 2 Inputs other than quoted prices included in Level 1 that are observable for the asset or liability, either directly or indirectly. If the asset or liability has a specified or contractual term, a Level 2 input must be observable for
43
substantially the full term of the asset or liability. Level 2 inputs include the following: (1) quoted prices for similar assets or liabilities in active markets; (2) quoted prices for identical or similar assets or liabilities in markets that are not active; (3) inputs other than quoted prices that are observable for the asset or liability (e.g., interest rates and yield curves that are observable at commonly quoted intervals, volatilities, and prepayment speeds); and (4) inputs that are derived principally from or corroborated by observable market data (e.g., implied spreads).
Level 3 Unobservable inputs for the asset or liability.
We review the fair-value hierarchy classifications on a quarterly basis. Changes in the observability of the valuation inputs may result in a reclassification of certain assets or liabilities. These reclassifications are reported as transfers in/out as of the beginning of the quarter in which the changes occur. There were no such transfers during the nine months ended September 30, 2012 and 2011.
Summary of Valuation Methodologies and Primary Inputs
Cash and Due from Banks. The fair value approximates the recorded carrying value.
Interest-Bearing Deposits. The fair value approximates the recorded carrying value.
Securities Purchased under Agreements to Resell. The fair value is determined by calculating the present value of expected future cash flows. The discount rates used in these calculations are the rates for securities with similar terms.
Federal Funds Sold. The fair value is determined by calculating the present value of the expected future cash flows. The discount rates used in these calculations are the rates for federal funds with similar terms.
Investment Securities. We determine the fair values of our investment securities, other than HFA floating-rate securities, based on prices obtained for each of these securities that we request from four designated third-party pricing vendors. The fair value of each such security is the average of such vendor prices that are within a cluster pricing tolerance range. A cluster is defined as a group of available vendor prices for a given security that is within a defined price tolerance range of the median vendor price depending on the security type. An outlier is any vendor price that is outside of the defined cluster and is evaluated for reasonableness. The use of the average of available vendor prices within a cluster and the evaluation of reasonableness of outlier prices does not discard available information. In addition, we review the fair values the method produces for reasonableness.
We request prices on each of our securities subject to this fair-value method from four third-party vendors, when available. These pricing vendors use methods that generally employ, but are not limited to, benchmark yields, recent trades, dealer estimates, valuation models, benchmarking of like securities, sector groupings, and/or matrix pricing. We establish a median price for each security using a formula that is based on the number of prices received:
• | if four prices are received, the average of the two middle prices is used; |
• | if three prices are received, the middle price is used; |
• | if two prices are received, the average of the two prices is used; and |
• | if one price is received, it is used subject to validation as described below. |
Vendor prices that are outside of a defined cluster are identified as outliers and are subject to additional review including, but not limited to, comparison to prices provided by an additional third-party valuation service, prices for similar securities, and/or non-binding dealer estimates, or use of internal model prices, which we believe reflect the facts and circumstances that a market participant would consider. We also perform this analysis in those limited instances where no third-party vendor price or only one third-party vendor price is available to determine fair value. If the analysis indicates that an outlier (or outliers) is (are) not representative of fair value and that the average of the vendor prices within the tolerance threshold of the median price is the best estimate, then we use the average of the vendor prices within the tolerance threshold of the median price as the final price. If, on the other hand, we determine that an outlier (or some other price identified in the analysis) is a better estimate of fair value, then the outlier (or the other price as appropriate) is used as the final price. In all cases, the final price is used to determine the fair value of the security.
As of September 30, 2012, four vendor prices were received for 93 percent of our investment securities and the final prices for substantially all of those securities were computed by averaging the four prices. Substantially all of our securities were priced
44
by at least three vendors. The relative proximity of the prices received supports our conclusion that the final computed prices are reasonable estimates of fair value. Based on the current lack of market activity for private-label residential MBS, the nonrecurring fair-value measurements for such securities as of September 30, 2012, and December 31, 2011, fell within Level 3 of the fair-value hierarchy. Our fixed-rate HFA securities also fall within Level 3 of the fair-value hierarchy due to the current lack of market activities for these bonds.
Investment Securities – HFA Floating Rate Securities. The fair value is determined by calculating the present value of the expected future cash flows. The discount rates used in these calculations are the rates for securities with similar terms. Our floating rate HFA securities also fall within level 3 of the fair-value hierarchy due to the current lack of market activities for these bonds.
Advances. We determine the fair value of advances by calculating the present value of expected future cash flows from the advances and excluding the amount of accrued interest receivable. The discount rates used in these calculations are the current replacement rates for advances with similar terms. We calculate our replacement advance rates at a spread to our cost of funds. Our cost of funds approximates the CO curve. See — COs within this note for a discussion of the CO curve. We use market-based expectations of future interest-rate volatility implied from current market prices for similar options to estimate the fair values of advances with optionality. In accordance with the Finance Agency's advances regulations, advances with a maturity or repricing period greater than six months require a prepayment fee sufficient to make us financially indifferent to the borrower's decision to prepay the advances. Therefore, the fair value of advances does not assume prepayment risk. We do not account for credit risk in determining the fair value of our advances due to the strong credit protections that mitigate the credit risk associated with advances. Collateral requirements for advances provide surety for the repayment such that the probability of credit losses on advances is very low. We have the ability to establish a blanket lien on all financial assets of most members, and in the case of federally insured depository institutions, our lien has a statutory priority over all other creditors with respect to collateral that has not been perfected by other parties. All of these factors serve to mitigate credit risk on advances.
Mortgage Loans. The fair values for mortgage loans are determined based on quoted market prices of similar mortgage-loans adjusted for credit and liquidity risk.
REO. Fair value is derived from third-party valuations of the property, which fall within level 3 of the fair-value hierarchy.
Accrued Interest Receivable and Payable. The fair value approximates the recorded carrying value.
Derivative Assets/Liabilities – Interest-Rate-Exchange Agreements. We base the fair values of interest-rate-exchange agreements on available market prices of derivatives having similar terms, including accrued interest receivable and payable. The fair value is based on the LIBOR swap curve and forward rates at period-end and, for agreements containing options, the market's expectations of future interest-rate volatility implied from current market prices of similar options. The fair-value methodology uses standard valuation techniques for derivatives such as discounted cash-flow analysis and comparisons with similar instruments. The discounted cash-flow model uses market-observable inputs (inputs that are actively quoted and can be validated to external sources). The fair values are netted by counterparty, including cash collateral received from or delivered to the counterparty, where an offset right exists. If these netted amounts are positive, they are classified as an asset, and if negative, they are classified as a liability. We enter into master-netting agreements for interest-rate-exchange agreements with institutions that have long-term senior unsecured credit ratings that are at or above single-A (or equivalent) by S&P and Moody's. We maintain master-netting agreements, which include bilateral collateral agreements, to reduce our exposure to counterparty defaults. These bilateral-collateral agreements require credit exposures beyond a defined threshold amount to be secured by U.S. government or GSE-issued securities or cash. All of these factors serve to mitigate credit and nonperformance risk to us. We generally use a midmarket pricing convention based on the bid-ask spread as a practical expedient for fair-value measurements. Because these estimates are made at a specific point in time, they are susceptible to material near-term changes. We have evaluated the potential for the fair value of the instruments to be affected by counterparty risk and our own credit risk and have determined that no adjustments were significant to the overall fair-value measurements.
Derivative Assets/Liabilities – Commitments to Invest in Mortgage Loans. Commitments to invest in mortgage loans are recorded as derivatives in the statement of condition. The fair values of such commitments are based on the end-of-day delivery commitment prices provided by the FHLBank of Chicago and a spread, which are derived from MBS to-be-announced delivery commitment prices with adjustment for the contractual features of the MPF program, such as servicing and credit-enhancement features.
Deposits. We determine the fair values of term deposits by calculating the present value of expected future cash flows from the deposits and reducing this amount by any accrued interest payable. The discount rates used in these calculations are the costs of currently issued deposits with similar terms.
45
COs. We estimate fair values based on the cost of issuing comparable term debt, excluding non-interest selling costs. Fair values of COs without embedded options are determined based on internal valuation models that use market-based yield curve inputs obtained from the Office of Finance (the FHLBanks' agent that issues and services COs). Fair values of COs with embedded options are determined by internal valuation models with market-based inputs obtained from the Office of Finance and derivative dealers. Our internal valuation models use standard valuation techniques and estimate fair values based on the following inputs.
• | CO Curve. The Office of Finance constructs an internal yield curve, referred to as the CO curve, using the U.S. Treasury curve as a base yield curve that is then adjusted by adding indicative spreads obtained from market observable sources. These market indications are generally derived from pricing indications from dealers, historical pricing relationships, recent GSE debt trades, and secondary market activity. |
• | Volatility Assumption. To estimate the fair values of consolidated obligations with optionality, we use market-based expectations of future interest-rate volatility implied from current market prices for similar options. |
Mandatorily Redeemable Capital Stock. The fair value of capital stock subject to mandatory redemption is generally equal to its par as indicated by contemporaneous member purchases and sales at par value. Fair value also includes an estimated dividend earned at the time of reclassification from equity to liabilities, until such amount is paid, and any subsequently declared dividend. Capital stock can only be acquired by our members at par value and redeemed at par value. Our capital stock is not traded and no market mechanism exists for the exchange of capital stock outside of our cooperative structure.
Commitments. The fair value of our standby bond-purchase agreements is based on the present value of the estimated fees we receive for providing these agreements discounted at yields comparable to those of the related bonds, taking into account the remaining terms of such agreements. For fixed-rate advance commitments, fair value also considers the difference between current levels of interest rates and the committed rates.
Subjectivity of Estimates. Estimates of the fair value of financial assets and liabilities using the methodologies described
above are highly subjective and require judgments regarding significant matters such as the amount and timing of future cash
flows, prepayment speed assumptions, expected interest rate volatility, possible distributions of future interest rates used to
value options, and the selection of discount rates that appropriately reflect market and credit risks. The use of different
assumptions could have a material effect on the fair-value estimates. Since these estimates are made as of a specific point in time, they are susceptible to material near-term changes.
Fair Value Measured on a Recurring Basis.
The following tables present our assets and liabilities that are measured at fair value on the statement of condition, which are recorded on a recurring basis at September 30, 2012, and December 31, 2011, by fair-value hierarchy level (dollars in thousands):
46
September 30, 2012 | |||||||||||||||||||
Level 1 | Level 2 | Level 3 | Netting Adjustment (1) | Total | |||||||||||||||
Assets: | |||||||||||||||||||
Trading securities: | |||||||||||||||||||
U.S. government-guaranteed – residential MBS | $ | — | $ | 17,496 | $ | — | $ | — | $ | 17,496 | |||||||||
GSEs – residential MBS | — | 5,380 | — | — | 5,380 | ||||||||||||||
GSEs – commercial MBS | — | 256,544 | — | — | 256,544 | ||||||||||||||
Total trading securities | — | 279,420 | — | — | 279,420 | ||||||||||||||
Available-for-sale securities: | |||||||||||||||||||
Supranational institutions | — | 473,416 | — | — | 473,416 | ||||||||||||||
Corporate bonds (2) | — | 308,225 | — | — | 308,225 | ||||||||||||||
U.S. government-owned corporations | — | 293,600 | — | — | 293,600 | ||||||||||||||
GSEs | — | 2,148,466 | — | — | 2,148,466 | ||||||||||||||
U.S. government guaranteed – residential MBS | — | 76,957 | — | — | 76,957 | ||||||||||||||
GSEs – residential MBS | — | 2,361,517 | — | — | 2,361,517 | ||||||||||||||
GSEs – commercial MBS | — | 101,915 | — | — | 101,915 | ||||||||||||||
Total available-for-sale securities | — | 5,764,096 | — | — | 5,764,096 | ||||||||||||||
Derivative assets: | |||||||||||||||||||
Interest-rate-exchange agreements | — | 116,054 | — | (115,610 | ) | 444 | |||||||||||||
Mortgage delivery commitments | — | 85 | — | — | 85 | ||||||||||||||
Total derivative assets | — | 116,139 | — | (115,610 | ) | 529 | |||||||||||||
Total assets at fair value | $ | — | $ | 6,159,655 | $ | — | $ | (115,610 | ) | $ | 6,044,045 | ||||||||
Liabilities: | |||||||||||||||||||
Derivative liabilities | |||||||||||||||||||
Interest-rate-exchange agreements | $ | — | $ | (1,064,887 | ) | $ | — | $ | 115,280 | $ | (949,607 | ) | |||||||
Mortgage delivery commitments | — | (128 | ) | — | — | (128 | ) | ||||||||||||
Total liabilities at fair value | $ | — | $ | (1,065,015 | ) | $ | — | $ | 115,280 | $ | (949,735 | ) | |||||||
_______________________
(1) These amounts represent the effect of master-netting agreements intended to allow us to settle positive and negative positions and also cash collateral held or placed with the same counterparty. Net cash collateral associated with derivatives, including accrued interest, as of September 30, 2012, totaled $330,000.
(2) | These securities are corporate debentures guaranteed by the FDIC under the FDIC's Temporary Liquidity Guarantee Program. The FDIC guarantee carries the full faith and credit of the U.S. Government. |
47
December 31, 2011 | |||||||||||||||||||
Level 1 | Level 2 | Level 3 | Netting Adjustment (1) | Total | |||||||||||||||
Assets: | |||||||||||||||||||
Trading securities: | |||||||||||||||||||
U.S. government-guaranteed – residential MBS | $ | — | $ | 18,880 | $ | — | $ | — | $ | 18,880 | |||||||||
GSEs – residential MBS | — | 6,663 | — | — | 6,663 | ||||||||||||||
GSEs – commercial MBS | — | 248,621 | — | — | 248,621 | ||||||||||||||
Total trading securities | — | 274,164 | — | — | 274,164 | ||||||||||||||
Available-for-sale securities: | |||||||||||||||||||
Supranational institutions | — | 469,242 | — | — | 469,242 | ||||||||||||||
Corporate bonds (2) | — | 564,312 | — | — | 564,312 | ||||||||||||||
U.S. government-owned corporations | — | 284,844 | — | — | 284,844 | ||||||||||||||
GSEs | — | 2,782,421 | — | — | 2,782,421 | ||||||||||||||
U.S. government guaranteed – residential MBS | — | 91,228 | — | — | 91,228 | ||||||||||||||
GSEs – residential MBS | — | 984,808 | — | — | 984,808 | ||||||||||||||
GSEs – commercial MBS | — | 103,344 | — | — | 103,344 | ||||||||||||||
Total available-for-sale securities | — | 5,280,199 | — | — | 5,280,199 | ||||||||||||||
Derivative assets: | |||||||||||||||||||
Interest-rate-exchange agreements | — | 229,877 | — | (213,484 | ) | 16,393 | |||||||||||||
Mortgage delivery commitments | — | 128 | — | — | 128 | ||||||||||||||
Total derivative assets | — | 230,005 | — | (213,484 | ) | 16,521 | |||||||||||||
Total assets at fair value | $ | — | $ | 5,784,368 | $ | — | $ | (213,484 | ) | $ | 5,570,884 | ||||||||
Liabilities: | |||||||||||||||||||
Derivative liabilities | |||||||||||||||||||
Interest-rate-exchange agreements | $ | — | $ | (1,098,547 | ) | $ | — | $ | 193,243 | $ | (905,304 | ) | |||||||
Total liabilities at fair value | $ | — | $ | (1,098,547 | ) | $ | — | $ | 193,243 | $ | (905,304 | ) | |||||||
_______________________
(1) These amounts represent the effect of master-netting agreements intended to allow us to settle positive and negative positions and also cash collateral held or placed with the same counterparty. Net cash collateral associated with derivatives, including accrued interest, as of December 31, 2011, totaled $20.2 million.
(2) | These securities are corporate debentures guaranteed by the FDIC under the FDIC's Temporary Liquidity Guarantee Program. The FDIC guarantee carries the full faith and credit of the U.S. Government. |
Fair Value on a Nonrecurring Basis
We measure certain held-to-maturity investment securities and REO at fair value on a nonrecurring basis, that is, they are not measured at fair value on an ongoing basis but are subject to fair-value adjustments only in certain circumstances (for example, upon recognizing an other-than-temporary impairment on a held-to-maturity security).
The following tables present the fair value of financial assets by level within the fair-value hierarchy which are recorded on a nonrecurring basis at September 30, 2012, and December 31, 2011 (dollars in thousands).
48
September 30, 2012 | |||||||||||||||
Level 1 | Level 2 | Level 3 | Total | ||||||||||||
Held-to-maturity securities: | |||||||||||||||
Private-label residential MBS | $ | — | $ | — | $ | 19,403 | $ | 19,403 | |||||||
REO | — | — | 356 | 356 | |||||||||||
Total assets recorded at fair value on a nonrecurring basis | $ | — | $ | — | $ | 19,759 | $ | 19,759 | |||||||
December 31, 2011 | |||||||||||||||
Level 1 | Level 2 | Level 3 | Total | ||||||||||||
Held-to-maturity securities: | |||||||||||||||
Private-label residential MBS | $ | — | $ | — | $ | 148,952 | $ | 148,952 | |||||||
REO | — | — | 905 | 905 | |||||||||||
Total assets recorded at fair value on a nonrecurring basis | $ | — | $ | — | $ | 149,857 | $ | 149,857 | |||||||
Note 18 — Commitments and Contingencies
Joint and Several Liability. COs are backed by the financial resources of the FHLBanks. The Finance Agency has authority to require any FHLBank to repay all or a portion of the principal and interest on COs for which another FHLBank is the primary obligor. No FHLBank has ever been asked or required to repay the principal or interest on any CO on behalf of another FHLBank. We evaluate the financial condition of the other FHLBanks primarily based on known regulatory actions, publicly available financial information, and individual long-term credit-rating action as of each period-end presented. Based on this evaluation, as of September 30, 2012, and through the filing of this report, we do not believe that it is reasonably likely that we will be required to repay the principal or interest on any CO on behalf of another FHLBank.
We have considered applicable FASB guidance and determined it is not necessary to recognize a liability for the fair value of our joint and several liability for all of the COs. The joint and several obligation is mandated by Finance Agency regulations and is not the result of an arms-length transaction among the FHLBanks. The FHLBanks have no control over the amount of the guaranty or the determination of how each FHLBank would perform under the joint and several obligation. Because the FHLBanks are subject to the authority of the Finance Agency as it relates to decisions involving the allocation of the joint and several liability for the FHLBanks' COs, the FHLBanks' joint and several obligation is excluded from the initial recognition and measurement provisions. Accordingly, we have not recognized a liability for our joint and several obligation related to other FHLBanks' COs at September 30, 2012, and December 31, 2011. The par amounts of other FHLBanks' outstanding COs for which we are jointly and severally liable totaled approximately $634.6 billion and $647.7 billion at September 30, 2012, and December 31, 2011, respectively. See Note 12 — COs for additional information.
Off-Balance-Sheet Commitments
The following table sets forth our off-balance-sheet commitments as of September 30, 2012, and December 31, 2011 (dollars in thousands):
49
September 30, 2012 | December 31, 2011 | |||||||||||||||||||||||
Expire within one year | Expire after one year | Total | Expire within one year | Expire after one year | Total | |||||||||||||||||||
Standby letters of credit outstanding (1) | $ | 848,249 | $ | 377,808 | $ | 1,226,057 | $ | 832,140 | $ | 402,932 | $ | 1,235,072 | ||||||||||||
Commitments for standby bond purchases | 151,615 | 10,000 | 161,615 | — | 191,065 | 191,065 | ||||||||||||||||||
Commitments for unused lines of credit - advances (2) | 1,304,244 | — | 1,304,244 | 1,287,084 | — | 1,287,084 | ||||||||||||||||||
Commitments to make additional advances | 67,838 | 61,895 | 129,733 | 26,264 | 54,281 | 80,545 | ||||||||||||||||||
Commitments to invest in mortgage loans | 41,506 | — | 41,506 | 17,734 | — | 17,734 | ||||||||||||||||||
Unsettled CO bonds, at par (3) | 475,000 | — | 475,000 | 165,300 | — | 165,300 | ||||||||||||||||||
__________________________
(1) | This row excludes commitments to issue standby letters of credit that expire within one year totaling $26.4 million and commitments that expire after one year totaling $900,000 as of September 30, 2012. Also excluded are commitments to issue standby letters of credit that expire within one year totaling $21.1 million at December 31, 2011. |
(2) | Commitments for unused line-of-credit advances are generally for periods of up to 12 months. Since many of these commitments are not expected to be drawn upon, the total commitment amount does not necessarily indicate future liquidity requirements. |
(3) We had $265.0 million in unsettled CO bonds that were hedged with associated interest-rate swaps at September 30, 2012. We had $15.0 million in unsettled CO bonds that were hedged with associated interest-rate swaps at December 31, 2011.
Standby Letters of Credit. Standby letters of credit are executed with members or housing associates for a fee. A standby letter of credit is a financing arrangement between us and a member or housing associate pursuant to which we agree to fund the associated member's or housing associate's obligation to a third-party beneficiary should that member or housing associate fail to fund such obligation. If we are required to make payment for a beneficiary's draw, the payment amount is converted into a collateralized advance to the member or housing associate. The original terms of these standby letters of credit range from final expiries in two months to 20 years. Our unearned fees for the value of the guarantees related to standby letters of credit are recorded in other liabilities and totaled $531,000 and $625,000 at September 30, 2012, and December 31, 2011, respectively.
We monitor the creditworthiness of our members and housing associates that have standby letter of credit agreements outstanding based on our evaluations of the financial condition of the member or housing associate. We review available financial data, which can include regulatory call reports filed by depository institution members, regulatory financial statements filed with the appropriate state insurance department by insurance company members, audited financial statements of housing associates, SEC filings, and rating-agency reports to ensure that potentially troubled members are identified as soon as possible. In addition, we have access to most members' regulatory examination reports. We analyze this information on a regular basis.
Standby letters of credit are fully collateralized at the time of issuance. Based on our credit analyses and collateral requirements, we have not deemed it necessary to record any additional liability on these commitments.
Standby Bond-Purchase Agreements. We enter into standby bond-purchase agreements with state housing authorities whereby we, for a fee, agree to purchase and hold the housing authority’s bonds until the designated remarketing agent can find an investor or the housing authority repurchases the bonds according to a schedule established by the standby bond-purchase agreement. Each standby bond-purchase agreement specifies the terms that would require us to purchase the bonds. The standby bond-purchase commitments we entered into expire between one and three years following the start of the commitment, currently no later than 2013. At each of September 30, 2012, and December 31, 2011, we had standby bond-purchase agreements with one state housing authority. During the nine months ended September 30, 2012, and year ended December 31, 2011, we were not required to purchase any bonds under these agreements.
Commitments to Invest in Mortgage Loans. Commitments to invest in mortgage loans are generally for periods not to exceed 45 business days. Such commitments are recorded as derivatives at their fair values on the statement of condition.
Pledged Collateral. We execute new derivatives with counterparties with long-term ratings of single-A (or equivalent) or better by both S&P and Moody’s. All derivatives are subject to master-netting agreements which include bilateral-collateral agreements. Derivatives with counterparties rated lower than single-A (or equivalent) are permitted only if they reduce exposure to that counterparty. As of September 30, 2012, and December 31, 2011, we had pledged as collateral securities with a
50
carrying value, including accrued interest, of $791.1 million and $765.7 million, respectively, to counterparties that have credit-risk exposure to us related to derivatives. These amounts pledged as collateral were subject to contractual agreements whereby some counterparties had the right to sell or repledge the collateral.
Legal Proceedings. We are subject to various legal proceedings arising in the normal course of business from time to time. Management does not anticipate that the ultimate liability, if any, arising out of these matters will have a material effect on the Bank’s financial condition, results of operations, or cash flows.
Note 19 — Transactions with Related Parties
We define related parties as those members whose capital stock holdings are in excess of 10 percent of total capital stock outstanding. The following table presents member holdings of 10 percent or more of total capital stock outstanding at September 30, 2012, and December 31, 2011 (dollars in thousands):
September 30, 2012 | December 31, 2011 | ||||||||||||
Capital Stock Outstanding | Percent of Total | Capital Stock Outstanding | Percent of Total | ||||||||||
Bank of America Rhode Island, N.A. (1) | $ | 978,084 | 26.8 | % | $ | 1,084,710 | 28.2 | % | |||||
RBS Citizens N.A. | 484,517 | 13.3 | 515,748 | 13.4 | |||||||||
_________________________
(1) | Capital stock outstanding at September 30, 2012, and December 31, 2011, includes $1.9 million and $2.2 million, respectively, held by CW Reinsurance Company, a subsidiary of Bank of America Corporation. |
The following table presents outstanding advances to related parties and total accrued interest receivable from those advances as of September 30, 2012, and December 31, 2011 (dollars in thousands):
Par Value of Advances | Percent of Total Par Value of Advances | Total Accrued Interest Receivable | Percent of Total Accrued Interest Receivable on Advances | ||||||||||
As of September 30, 2012 | |||||||||||||
RBS Citizens N.A. | $ | 3,520,085 | 15.1 | % | $ | 646 | 1.6 | % | |||||
Bank of America Rhode Island, N.A. | 600,323 | 2.6 | 893 | 2.2 | |||||||||
As of December 31, 2011 | |||||||||||||
RBS Citizens N.A. | $ | 4,620,022 | 18.8 | % | $ | 335 | 0.7 | % | |||||
Bank of America Rhode Island, N.A. | 96,261 | 0.4 | 454 | 1.0 | |||||||||
The following table presents an analysis of advances activity with related parties for the nine months ended September 30, 2012 (dollars in thousands):
For the Nine Months Ended September 30, 2012 | |||||||||||||||
Balance at December 31, 2011 | Disbursements to Members | Payments from Members | Balance at September 30, 2012 | ||||||||||||
RBS Citizens N.A. | $ | 4,620,022 | $ | 12,250,570 | $ | (13,350,507 | ) | $ | 3,520,085 | ||||||
Bank of America Rhode Island, N.A. | 96,261 | 1,511,042 | (1,006,980 | ) | 600,323 | ||||||||||
We recognized interest income on outstanding advances from the above members during the three and nine months ended September 30, 2012, and 2011, as follows (dollars in thousands):
51
For the Three Months Ended September 30, | For the Nine Months Ended September 30, | |||||||||||||||
2012 | 2011 | 2012 | 2011 | |||||||||||||
RBS Citizens N.A. | $ | 3,155 | $ | 2,645 | $ | 8,367 | $ | 9,158 | ||||||||
Bank of America Rhode Island, N.A. | 2,137 | 3,175 | 5,114 | 11,142 | ||||||||||||
The following table presents an analysis of outstanding derivatives with affiliates of related parties at September 30, 2012, and December 31, 2011 (dollars in thousands):
September 30, 2012 | December 31, 2011 | |||||||||||||||||
Derivatives Counterparty | Affiliate Member | Primary Relationship | Notional Amount | Percent of Total Derivatives (1) | Notional Amount | Percent of Total Derivatives (1) | ||||||||||||
Bank of America, N.A. | Bank of America Rhode Island, N.A. | Dealer | $ | 1,041,150 | 5.9 | % | $ | 973,750 | 4.7 | % | ||||||||
Royal Bank of Scotland, PLC | RBS Citizens, N.A. | Dealer | 95,000 | 0.5 | 96,300 | 0.5 | ||||||||||||
_________________________
(1) The percent of total derivatives outstanding is based on the stated notional amount of all derivatives outstanding.
Note 20 — Transactions with Other FHLBanks
We may occasionally enter into transactions with other FHLBanks. These transactions are summarized below.
Overnight Funds. We may borrow or lend unsecured overnight funds from or to other FHLBanks. All such transactions are at current market rates. Interest income and interest expense related to these transactions with other FHLBanks are included within other interest income and interest expense from other borrowings in the statement of operations.
MPF Mortgage Loans. We pay a transaction-services fee to the FHLBank of Chicago for our participation in the MPF program. This fee is assessed monthly, and is based upon the amount of mortgage loans which we invested in after January 1, 2004, and which remain outstanding on our statement of condition. We recorded $347,000 and $285,000 in MPF transaction-services fee expense to the FHLBank of Chicago during the three months ended September 30, 2012 and September 30, 2011, respectively, which has been recorded in the statement of operations as other expense. We recorded $966,000 and $843,000 in MPF transaction-services fee expense to the FHLBank of Chicago during the nine months ended September 30, 2012, and September 30, 2011, respectively.
COs. From time to time, one FHLBank may transfer to another FHLBank the COs for which the transferring FHLBank was originally the primary obligor but upon transfer the assuming FHLBank becomes the primary obligor. During the nine months ended September 30, 2012, we assumed debt obligations with a par amount of $112.0 million and a fair value of approximately $130.3 million on the day they were assumed, which had been the obligations of another FHLBank. There were no transfers of COs between us and other FHLBanks during the nine months ended September 30, 2011.
Note 21 — Subsequent Events
On October 18, 2012, the board of directors declared a cash dividend at an annualized rate of 0.48 percent based on capital stock balances outstanding during the third quarter of 2012. The dividend, including dividends on mandatorily redeemable capital stock, amounted to $4.4 million and was paid on November 2, 2012.
52
ITEM 2. MANAGEMENT'S DISCUSSION AND ANALYSIS OF FINANCIAL CONDITION AND RESULTS OF OPERATIONS
Forward-Looking Statements
This report includes statements describing anticipated developments, projections, estimates, or future predictions of ours that are “forward-looking statements.” These statements may use forward-looking terminology such as, but not limited to, “anticipates,” “believes,” “expects,” “plans,” “intends,” “may,” “could,” “estimates,” “assumes,” “should,” “will,” “likely,” or their negatives or other variations on these terms. We caution that, by their nature, forward-looking statements are subject to a number of risks or uncertainties, including the risk factors set forth in Item 1A — Risk Factors in the 2011 Annual Report and Part II — Item 1A — Risk Factors of this quarterly report, and the risks set forth below. Accordingly, we caution that actual results could differ materially from those expressed or implied in these forward-looking statements or could impact the extent to which a particular objective, projection, estimate, or prediction is realized. As a result, you are cautioned not to place undue reliance on such statements. We do not undertake to update any forward-looking statement herein or that may be made from time to time on our behalf.
Forward-looking statements in this report may include, among others, our expectations for:
• | income, retained earnings, and dividend payouts; |
• | repurchases of our stock held in excess of the owner's total stock investment requirement (excess stock); |
• | credit losses on advances and investments in mortgage loans and ABS, particularly private-label MBS; |
• | balance-sheet changes and components thereof, such as changes in advances balances and the size of our portfolio of investments in mortgage loans; |
• | our retained earnings target; and |
• | the interest-rate environment in which we do business. |
Actual results may differ from forward-looking statements for many reasons, including, but not limited to:
• | changes in interest rates, the rate of inflation (or deflation), housing prices, employment rates, and the general economy, including changes resulting from changes in U.S. fiscal policy, the European sovereign debt crisis, and/or the downgrade of the U.S. federal government; |
• | changes in the size of the residential mortgage market; |
• | changes in demand for our advances and other products resulting from changes in members' deposit flows and credit demands or otherwise; |
• | the willingness of our members to do business with us despite limited repurchases of excess stock and modest dividend payments; |
• | changes in the financial health of our members; |
• | insolvencies of our members; |
• | increases in borrower defaults on mortgage loans; |
• | deterioration in the credit performance of our private-label MBS portfolio beyond forecasted assumptions concerning loan default rates, loss severities, and prepayment speeds resulting in the realization of additional other-than-temporary impairment charges; |
• | deterioration in the credit performance of our investments in mortgage loans and increases in loss severities from those investments; |
• | an increase in advance prepayments as a result of changes in interest rates or other factors; |
• | the volatility of market prices, rates, and indices that could affect the value of collateral we hold as security for obligations of our members and counterparties to interest-rate-exchange agreements and similar agreements; |
53
• | issues and events across the FHLBank System and in the political arena that may lead to regulatory, judicial, or other developments may affect the marketability of the COs, our financial obligations with respect to COs, our ability to access the capital markets, our members, the manner in which we operate, or the organization and structure of the FHLBank System; |
• | competitive forces including, without limitation, other sources of funding available to our members, other entities borrowing funds in the capital markets, and the ability to attract and retain skilled employees; |
• | the pace of technological change and our ability to develop and support technology and information systems sufficient to manage the risks of our business effectively; |
• | the loss of large members through mergers and similar activities; |
• | changes in investor demand for COs and/or the terms of interest-rate-exchange-agreements and similar agreements; |
• | the timing and volume of market activity; |
• | the volatility of reported results due to changes in the fair value of certain assets and liabilities, including, but not limited to, private-label MBS; |
• | the ability to introduce new (or adequately adapt current) products and services and successfully manage the risks associated with those products and services, including new types of collateral used to secure advances; |
• | the availability of derivative financial instruments of the types and in the quantities needed for risk-management purposes from acceptable counterparties; |
• | the realization of losses arising from litigation filed against us or one or more of the other FHLBanks; |
• | the realization of losses arising from our joint and several liability on COs; |
• | significant business disruptions resulting from natural or other disasters, acts of war, or terrorism; and |
• | the effect of new accounting standards, including the development of supporting systems. |
These risk factors are not exhaustive. We operate in a changing economic and regulatory environment, and new risk factors will emerge from time to time. We cannot predict such new risk factors nor can we assess the impact, if any, of such new risk factors on our business or the extent to which any factor, or combination of factors, may cause actual results to differ materially from those implied by any forward-looking statements.
The Management's Discussion and Analysis of Financial Condition and Results of Operations should be read in conjunction with our interim financial statements and notes, which begin on page three, and the 2011 Annual Report.
EXECUTIVE SUMMARY
Our financial condition continued to strengthen during the quarter ended September 30, 2012, as we recognized net income of $50.8 million for the three months ended September 30, 2012, versus $50.0 million for the same period in 2011. Credit losses from the other-than-temporary impairment of investments in private-label MBS totaled $1.1 million for the three months ended September 30, 2012, compared with such credit losses of $7.2 million for the comparable period of 2011. Additionally:
• | retained earnings increased from $398.1 million at December 31, 2011, to $538.2 million at September 30, 2012; |
• | accumulated other comprehensive loss related to the noncredit portion of other-than-temporary impairment losses on held-to-maturity securities improved from an accumulated other comprehensive loss of $451.0 million at December 31, 2011, to an accumulated other comprehensive loss of $403.5 million at September 30, 2012; |
• | we continue to be in compliance with all regulatory capital requirements, as of September 30, 2012; and |
• | on October 18, 2012, our board of directors declared a cash dividend that was equivalent to an annual yield of 0.48 percent. |
We note that retained earnings now exceed accumulated other comprehensive loss for the first time since the third quarter of 2008, and we believe this is an important milestone as our financial condition continues to improve. Nonetheless, we continue to face certain challenges, the foremost of which arises from the continuing, prolonged low-interest rate environment. We continue to believe that this factor is likely to negatively impact future earnings, absent unpredictable events such as
54
prepayment fee income, and we remain focused on achieving our retained earnings target through the payment of modest dividends.
• | Investments in Private-Label MBS. Although the amortized cost of our total investments in private-label MBS and ABS backed by home equity loans has fallen to $1.8 billion at September 30, 2012, compared with $6.4 billion at September 30, 2007, additional losses from that portfolio are possible. We have determined that 10 of our private-label MBS, representing an aggregated par value of $200.5 million, incurred additional other-than-temporary impairment credit losses of $1.1 million for the three months ended September 30, 2012. We continue to update our modeling assumptions to reflect current developments impacting the loan performance of the mortgage loans that back our investments in these securities, particularly Alt-A mortgage loans originated from 2005 to 2007 that comprise a significant portion of the loans backing these securities. Such developments include continuing elevated unemployment rates and generally slow economic growth, high levels of foreclosures and troubled real estate loans, slow housing price recovery, and limited refinancing opportunities for many borrowers, especially those whose houses are now worth less than the balance of their mortgages. |
We also update our modeling assumptions based on non-economic factors that impact or could impact the performance of these investments, including certain federal programs (and proposed programs) intended to assist and/or protect borrowers, and related developments that could result in further losses. We continue to monitor these and related developments, including litigation involving private-label MBS, which could result in loss severities beyond current expectations due to disruptions of cash flows from impacted securities and further depression in real estate prices.
• | Advances Balances. The outstanding par balance of advances decreased from $24.6 billion at December 31, 2011, to $23.3 billion at September 30, 2012. Demand for advances continues to be muted, as our members continue to experience high levels of deposits. Generally, deposits serve as liquidity alternatives to advances. |
The trend in advances balances is illustrated by the following graph: |
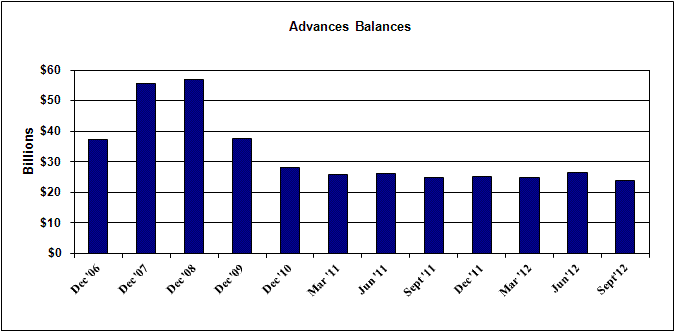
• | Low-Interest Rate Environment and U.S. Fiscal Policy. We continue to operate in a prolonged, historically low-interest rate environment for short- and long-term financial instruments. We expect the current historically low-interest rate environment to persist based on actions by the Federal Reserve to maintain low interest rates, including affecting a third round of its quantitative easing program, combined with other potential threats that could slow or reverse economic growth, such as the European sovereign debt crisis, which has raised concerns that a Eurozone recession could slow the U.S. economy. These factors are discussed in greater detail under Item 7 — Management's Discussion and Analysis of Financial Condition and Results of Operations — Executive Summary — Continuing and Prolonged Low-Interest Rate Environment in the 2011 Annual Report. In addition, some economists predict the U.S. economy could fall into recession if the U.S. Federal Government fails to achieve a plan to avoid the “fiscal cliff,” which refers to certain tax increases and automatic spending cuts that are scheduled to become effective at the end of 2012. Further, Moody's has warned that it may |
55
downgrade the U.S. Federal Government's rating if the federal debt is not stabilized.
The European sovereign debt crisis, failure to avoid the fiscal cliff, and/or a downgrade of the U.S. Federal Government's rating could result in further continuation of the low-interest rate environment. The Federal Reserve's Federal Open Market Committee has stated that it anticipates that exceptionally low levels for the federal funds rate are likely to be warranted at least through mid-2015. A prolonged low-interest rate environment continues to adversely impact us in various ways such as members experiencing sufficient or excess liquidity through deposits as investors face fewer attractive investment alternatives; members significantly increasing their reliance on short-term advances that typically have lower market yields for us than longer-term advances; lower market yields on investments (as we continue to experience), including money market investments in which our capital is deployed; and faster prepayments on our mortgage-related assets, with resultant reinvestment risk. The most recent round of quantitative easing by the Federal Reserve, announced in September 2012, is directed at purchasing agency MBS, reducing yields on these securities to levels that are generally not profitable for us as an investor, and as a result, balances in our investment portfolios are likely to decline in the near term. Accordingly, our net income and, in turn, our financial condition and results of operations, are likely to be adversely impacted by a prolonged low-interest rate environment.
The following chart demonstrates the persistent low-interest rate environment.
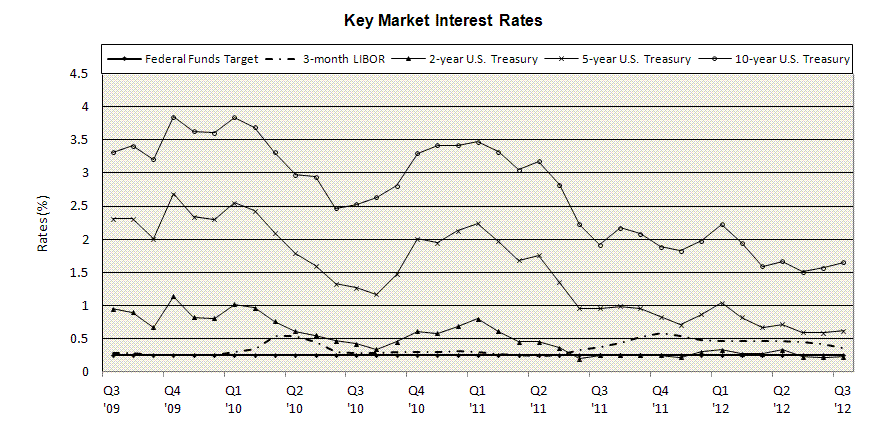
Other significant trends and developments include the following:
• | Strong Net Interest Margin. Despite the historically low-interest rate environment, we continue to achieve a favorable net interest margin. Net interest margin is expressed as the percentage of net-interest income to average earning assets. Net interest margin for the three months ended September 30, 2012, was 0.61 percent, a two basis point decrease from net interest margin for the three months ended September 30, 2011. Prepayment-fee income was an important contributor to net interest margin for the three months ended September 30, 2012, as demonstrated by the tables captioned “Net Interest Spread and Margin without Prepayment-Fee Income” under — Results of Operations — Rate and Volume Analysis. These prepayment fees represent a substantial contribution to our net income that should not be counted on to recur every year. Further, the increase in net-interest margin was achieved despite the continuing low-interest rate environment due in part to continued low average funding costs. Demand for COs remained strong and funding costs remained low throughout the first nine months of 2012. Other factors behind the improvement in net interest margin include an increase in yields on certain previously other-than-temporarily impaired private-label MBS for which a significant improvement in cash flows has been projected and lower than expected prepayment activity on fixed-rate mortgage-related assets. |
Notwithstanding our success in achieving strong net interest margin and strong net interest spread for the quarter, we expect these measurements to modestly decline in the remaining quarter of 2012 and to continue to decline in 2013 based
56
on the sustained low-interest rate environment noted above combined with the fact that we face limited opportunities to redeem and refinance our debt, while our seasoned investments in mortgage loans (including fixed-rate agency MBS) will continue to amortize.
• | Legislative and Regulatory Developments. We continue to operate in a legislative and regulatory environment undergoing profound change with additional changes occurring during the period covered by this report. These changes are likely to have multiple important impacts on us, as discussed under — Legislative and Regulatory Developments. |
• | Key Management Changes. On July 17, 2012, Michael C. Clifton joined us as senior vice president and chief information officer, and as a member of our senior management team. Most recently, Mr. Clifton was vice president and chief information officer with The Hanover Insurance Group, where he had been employed since 2003 in progressively expansive roles. Mr. Clifton is a graduate of the University of Massachusetts Lowell with a B.S. in Industrial Engineering. |
SELECTED FINANCIAL DATA
The following financial highlights for the statement of condition for December 31, 2011, have been derived from our audited financial statements. Financial highlights for the quarter-ends have been derived from our unaudited financial statements.
SELECTED FINANCIAL DATA STATEMENT OF CONDITION (dollars in thousands) | |||||||||||||||||||
September 30, 2012 | June 30, 2012 | March 31, 2012 | December 31, 2011 | September 30, 2011 | |||||||||||||||
Statement of Condition Data at Quarter End | |||||||||||||||||||
Total assets | $ | 45,742,535 | $ | 49,763,227 | $ | 46,911,899 | $ | 49,968,337 | $ | 48,574,433 | |||||||||
Investments (1) | 17,948,073 | 19,363,944 | 18,589,831 | 21,379,548 | 19,916,085 | ||||||||||||||
Advances | 23,915,687 | 26,456,739 | 24,891,964 | 25,194,898 | 25,024,689 | ||||||||||||||
Mortgage loans held for portfolio (2) | 3,431,534 | 3,311,457 | 3,166,457 | 3,109,223 | 3,128,725 | ||||||||||||||
Deposits | 685,328 | 668,836 | 760,374 | 654,246 | 740,946 | ||||||||||||||
Consolidated obligations | |||||||||||||||||||
Bonds | 28,238,899 | 27,622,744 | 28,533,735 | 29,879,460 | 32,446,525 | ||||||||||||||
Discount notes | 11,993,572 | 16,610,160 | 12,834,056 | 14,651,793 | 10,673,491 | ||||||||||||||
Total consolidated obligations | 40,232,471 | 44,232,904 | 41,367,791 | 44,531,253 | 43,120,016 | ||||||||||||||
Mandatorily redeemable capital stock | 215,863 | 215,863 | 214,859 | 227,429 | 227,429 | ||||||||||||||
Class B capital stock outstanding - putable (3) | 3,433,016 | 3,420,870 | 3,402,556 | 3,625,348 | 3,583,749 | ||||||||||||||
Unrestricted retained earnings | 484,574 | 448,330 | 408,154 | 375,158 | 326,099 | ||||||||||||||
Restricted retained earnings | 53,660 | 43,496 | 32,299 | 22,939 | 9,997 | ||||||||||||||
Total retained earnings | 538,234 | 491,826 | 440,453 | 398,097 | 336,096 | ||||||||||||||
Accumulated other comprehensive loss | (504,674 | ) | (528,442 | ) | (519,832 | ) | (534,411 | ) | (516,717 | ) | |||||||||
Total capital | 3,466,576 | 3,384,254 | 3,323,177 | 3,489,034 | 3,403,128 | ||||||||||||||
Other Information | |||||||||||||||||||
Total regulatory capital ratio (4) | 9.2 | % | 8.3 | % | 8.7 | % | 8.5 | % | 8.5 | % | |||||||||
_________________________
(1) | Investments include available-for-sale securities, held-to-maturity securities, trading securities, interest-bearing deposits, securities purchased under agreements to resell, and federal funds sold. |
(2) | The allowance for credit losses amounted to $5.5 million, $6.1 million, $6.6 million, $7.8 million, and $7.2 million, as of September 30, 2012, June 30, 2012, March 31, 2012, December 31, 2011, and September 30, 2011, respectively. |
(3) | Capital stock is putable at the option of a member. |
(4) Total regulatory capital ratio is capital stock (including mandatorily redeemable capital stock) plus retained earnings as a percentage of total assets. See — Liquidity and Capital Resources — Capital regarding our regulatory capital ratios.
57
SELECTED FINANCIAL DATA RESULTS OF OPERATIONS AND OTHER INFORMATION (dollars in thousands) | |||||||||||||||||||
For the Three Months Ended | |||||||||||||||||||
September 30, 2012 | June 30, 2012 | March 31, 2012 | December 31, 2011 | September 30, 2011 | |||||||||||||||
Results of Operations | |||||||||||||||||||
Net interest income | $ | 72,801 | $ | 89,552 | $ | 68,342 | $ | 82,026 | $ | 80,410 | |||||||||
(Reduction of) provision for credit losses | (523 | ) | (383 | ) | (1,151 | ) | 627 | — | |||||||||||
Net impairment losses on held-to-maturity securities recognized in income | (1,092 | ) | (1,492 | ) | (2,960 | ) | (3,479 | ) | (7,210 | ) | |||||||||
Other (loss) income | (698 | ) | (10,531 | ) | 1,245 | 10,001 | (1,659 | ) | |||||||||||
Other expense | 15,039 | 15,671 | 15,746 | 15,994 | 15,982 | ||||||||||||||
AHP assessments | 5,675 | 6,253 | 5,232 | 7,220 | 5,573 | ||||||||||||||
Net income | $ | 50,820 | $ | 55,988 | $ | 46,800 | $ | 64,707 | $ | 49,986 | |||||||||
Other Information | |||||||||||||||||||
Dividends declared | $ | 4,413 | $ | 4,615 | $ | 4,444 | $ | 2,706 | $ | 2,410 | |||||||||
Dividend payout ratio | 8.68 | % | 8.24 | % | 9.49 | % | 4.18 | % | 4.82 | % | |||||||||
Weighted average dividend rate (1) | 0.52 | 0.52 | 0.49 | 0.30 | 0.27 | ||||||||||||||
Return on average equity (2) | 5.92 | 6.70 | 5.44 | 7.43 | 5.84 | ||||||||||||||
Return on average assets | 0.43 | 0.49 | 0.38 | 0.51 | 0.39 | ||||||||||||||
Net interest margin (3) | 0.61 | 0.78 | 0.56 | 0.65 | 0.63 | ||||||||||||||
Average equity to average assets | 7.19 | 7.25 | 7.06 | 6.88 | 6.64 | ||||||||||||||
___________________________
(1) | Weighted-average dividend rate is dividend amount declared divided by the average daily balance of capital stock. |
(2) | Return on average equity is net income divided by the total of the average daily balance of outstanding Class B capital stock, accumulated other comprehensive loss, and retained earnings. |
(3) | Net interest margin is net interest income before provision for credit losses as a percentage of average earning assets. |
RESULTS OF OPERATIONS
Third Quarter of 2012 Compared with Third Quarter of 2011
For the three months ended September 30, 2012, and 2011, we recognized net income of $50.8 million and $50.0 million, respectively. This $834,000 increase was driven by a reduction in net losses on derivatives and hedging activities of $15.4 million, a decrease of $6.1 million in other-than-temporary impairment losses of certain private-label MBS, and a reduction of other expense of $943,000. These increases to net income were offset by a decline in the net unrealized gains on trading securities of $9.0 million, a $7.6 million decrease in net interest income, and a $5.0 million expense for the early retirement of debt in the third quarter of 2012.
Nine Months Ended September 30, 2012, Compared with Nine Months Ended September 30, 2011
For the nine months ended September 30, 2012, and 2011, we recognized net income of $153.6 million and $94.9 million, respectively. This $58.7 million increase was driven by a decrease of $68.0 million in other-than-temporary impairment losses of certain private-label MBS, a reduction in net losses on derivatives and hedging activities of $15.0 million, a $6.7 million increase in net interest income, a decrease in assessments of $4.5 million due to the fulfillment of the REFCorp obligation, and a decline of $2.6 million in other expense. The increases to net income were partially offset by a loss on early extinguishment of debt of $17.0 million, a decline of $12.8 million in realized gains on sales of available-for-sale securities, and a decline in the net unrealized gains on trading securities of $9.3 million.
Net Interest Income
Third Quarter of 2012 Compared with Third Quarter of 2011
58
Net interest income for the three months ended September 30, 2012 decreased $7.6 million from $80.4 million in the third quarter of 2011 to $72.8 million in the third quarter of 2012. This decrease was primarily attributable to the decline in average earning assets from $50.9 billion for the third quarter of 2011, to $47.1 billion for the third quarter of 2012. This decline in average earning assets was driven by a $4.2 billion drop in average investments balances partially offset by an increase of $249.6 million in average advances balances. Offsetting the effects of the decline in average earning assets was a $2.1 million increase in prepayment fee income.
Net interest margin for the three months ended September 30, 2012, in comparison with the same period in 2011, decreased to 61 basis points from 63 basis points, and net interest spread decreased to 53 basis points from 55 basis points for the same period in 2011. Net interest spread is the difference between the yields on interest-earning assets and interest-bearing liabilities.
Contributing to the decrease in net interest spread was a decrease in average earning assets, which declined by $3.8 billion. Also contributing to the decrease in net interest spread was the fact that the yield on interest earning assets increased by two basis points to 1.51 percent while the average cost of interest-bearing liabilities increased by four basis points to 0.98 percent.
Nine Months Ended September 30, 2012, Compared with Nine Months Ended September 30, 2011
Net interest income for the nine months ended September 30, 2012, was $230.7 million, compared with $224.0 million for the same period in 2011. This increase was primarily attributable to the $22.9 million increase in prepayment-fee income, which partly contributed to an increase of 11 basis points in the yield on interest earning assets to 1.56 percent. In addition, the average cost of interest-bearing liabilities increased three basis points to 1.00 percent.
Net interest margin for the nine months ended September 30, 2012, increased to 65 basis points compared with 56 basis points in the same period in 2011, and net interest spread increased to 56 basis points compared with 48 basis points in the same period in 2011. Partially offsetting the increase in net interest spread was a decrease in average earning assets, which declined by $6.0 billion from $53.3 billion for the nine months ended September 30, 2011, to $47.3 billion for the nine months ended September 30, 2012.
The following tables present major categories of average balances, related interest income/expense, and average yields for interest-earning assets and interest-bearing liabilities. Our primary source of earnings is net interest income, which is the interest earned on advances, mortgage loans, and investments less interest paid on COs, deposits, and other sources of funds.
59
Net Interest Spread and Margin (dollars in thousands) | ||||||||||||||||||||||
For the Three Months Ended September 30, | ||||||||||||||||||||||
2012 | 2011 | |||||||||||||||||||||
Average Balance | Interest Income / Expense | Average Yield (1) | Average Balance | Interest Income / Expense | Average Yield (1) | |||||||||||||||||
Assets | ||||||||||||||||||||||
Advances | $ | 25,044,543 | $ | 84,425 | 1.34 | % | $ | 24,794,945 | $ | 89,229 | 1.43 | % | ||||||||||
Interest-bearing deposits | 548 | 1 | 1.13 | 250 | — | 0.14 | ||||||||||||||||
Securities purchased under agreements to resell | 5,293,478 | 2,455 | 0.18 | 1,673,913 | 502 | 0.12 | ||||||||||||||||
Federal funds sold | 1,241,522 | 463 | 0.15 | 7,075,380 | 2,211 | 0.12 | ||||||||||||||||
Investment securities(2) | 12,170,446 | 56,824 | 1.86 | 14,201,298 | 61,861 | 1.73 | ||||||||||||||||
Mortgage loans | 3,376,986 | 34,214 | 4.03 | 3,133,432 | 37,267 | 4.72 | ||||||||||||||||
Other earning assets | 2,446 | 1 | 0.14 | 1,121 | 1 | 0.07 | ||||||||||||||||
Total interest-earning assets | 47,129,969 | 178,383 | 1.51 | % | 50,880,339 | 191,071 | 1.49 | % | ||||||||||||||
Other non-interest-earning assets | 480,852 | 496,829 | ||||||||||||||||||||
Fair-value adjustments on investment securities | (96,817 | ) | (257,560 | ) | ||||||||||||||||||
Total assets | $ | 47,514,004 | $ | 178,383 | 1.49 | % | $ | 51,119,608 | $ | 191,071 | 1.48 | % | ||||||||||
Liabilities and capital | ||||||||||||||||||||||
Consolidated obligations | ||||||||||||||||||||||
Discount notes | $ | 13,599,121 | $ | 3,726 | 0.11 | % | $ | 12,261,313 | $ | 1,546 | 0.05 | % | ||||||||||
Bonds | 28,272,767 | 101,584 | 1.43 | 33,390,223 | 108,896 | 1.29 | ||||||||||||||||
Deposits | 702,319 | 11 | 0.01 | 750,855 | 42 | 0.02 | ||||||||||||||||
Mandatorily redeemable capital stock | 215,862 | 260 | 0.48 | 227,429 | 177 | 0.31 | ||||||||||||||||
Other borrowings | 1,755 | 1 | 0.23 | 924 | — | 0.09 | ||||||||||||||||
Total interest-bearing liabilities | 42,791,824 | 105,582 | 0.98 | % | 46,630,744 | 110,661 | 0.94 | % | ||||||||||||||
Other non-interest-bearing liabilities | 1,307,329 | 1,093,026 | ||||||||||||||||||||
Total capital | 3,414,851 | 3,395,838 | ||||||||||||||||||||
Total liabilities and capital | $ | 47,514,004 | $ | 105,582 | 0.88 | % | $ | 51,119,608 | $ | 110,661 | 0.86 | % | ||||||||||
Net interest income | $ | 72,801 | $ | 80,410 | ||||||||||||||||||
Net interest spread | 0.53 | % | 0.55 | % | ||||||||||||||||||
Net interest margin | 0.61 | % | 0.63 | % | ||||||||||||||||||
_________________________
(1) Yields are annualized.
(2) The average balances of held-to-maturity securities and available-for-sale securities are reflected at amortized cost; therefore the resulting yields do not give effect to changes in fair value or the noncredit component of a previously recognized other-than-temporary impairment reflected in accumulated other comprehensive loss.
60
Net Interest Spread and Margin (dollars in thousands) | ||||||||||||||||||||||
For the Nine Months Ended September 30, | ||||||||||||||||||||||
2012 | 2011 | |||||||||||||||||||||
Average Balance | Interest Income / Expense | Average Yield (1) | Average Balance | Interest Income / Expense | Average Yield (1) | |||||||||||||||||
Assets | ||||||||||||||||||||||
Advances | $ | 24,540,660 | $ | 269,385 | 1.47 | % | $ | 25,795,091 | $ | 270,063 | 1.40 | % | ||||||||||
Interest-bearing deposits | 360 | 2 | 0.91 | 216 | 1 | 0.33 | ||||||||||||||||
Securities purchased under agreements to resell | 5,850,000 | 7,069 | 0.16 | 1,436,996 | 1,447 | 0.13 | ||||||||||||||||
Federal funds sold | 1,530,777 | 1,491 | 0.13 | 5,999,905 | 5,969 | 0.13 | ||||||||||||||||
Investment securities(2) | 12,124,453 | 170,263 | 1.88 | 16,897,493 | 187,526 | 1.48 | ||||||||||||||||
Mortgage loans | 3,248,559 | 103,527 | 4.26 | 3,160,936 | 113,456 | 4.80 | ||||||||||||||||
Other earning assets | 821 | 1 | 0.14 | 1,385 | 1 | 0.10 | ||||||||||||||||
Total interest-earning assets | 47,295,630 | 551,738 | 1.56 | % | 53,292,022 | 578,463 | 1.45 | % | ||||||||||||||
Other non-interest-earning assets | 489,056 | 476,824 | ||||||||||||||||||||
Fair-value adjustments on investment securities | (134,758 | ) | (357,326 | ) | ||||||||||||||||||
Total assets | $ | 47,649,928 | $ | 551,738 | 1.55 | % | $ | 53,411,520 | $ | 578,463 | 1.45 | % | ||||||||||
Liabilities and capital | ||||||||||||||||||||||
Consolidated obligations | ||||||||||||||||||||||
Discount notes | $ | 13,235,691 | $ | 8,222 | 0.08 | % | $ | 13,429,658 | $ | 8,808 | 0.09 | % | ||||||||||
Bonds | 28,766,309 | 311,943 | 1.45 | 34,643,773 | 345,012 | 1.33 | ||||||||||||||||
Deposits | 739,617 | 42 | 0.01 | 766,785 | 244 | 0.04 | ||||||||||||||||
Mandatorily redeemable capital stock | 218,388 | 834 | 0.51 | 174,884 | 446 | 0.34 | ||||||||||||||||
Other borrowings | 1,979 | 2 | 0.13 | 2,806 | 3 | 0.14 | ||||||||||||||||
Total interest-bearing liabilities | 42,961,984 | 321,043 | 1.00 | % | 49,017,906 | 354,513 | 0.97 | % | ||||||||||||||
Other non-interest-bearing liabilities | 1,274,886 | 1,048,923 | ||||||||||||||||||||
Total capital | 3,413,058 | 3,344,691 | ||||||||||||||||||||
Total liabilities and capital | $ | 47,649,928 | $ | 321,043 | 0.90 | % | $ | 53,411,520 | $ | 354,513 | 0.89 | % | ||||||||||
Net interest income | $ | 230,695 | $ | 223,950 | ||||||||||||||||||
Net interest spread | 0.56 | % | 0.48 | % | ||||||||||||||||||
Net interest margin | 0.65 | % | 0.56 | % | ||||||||||||||||||
_________________________
(1) Yields are annualized.
(2) The average balances of held-to-maturity securities and available-for-sale securities are reflected at amortized cost; therefore the resulting yields do not give effect to changes in fair value or the noncredit component of a previously recognized other-than-temporary impairment reflected in accumulated other comprehensive loss.
Rate and Volume Analysis
Changes in both average balances (volume) and interest rates influence changes in net interest income and net interest margin. The following table summarizes changes in interest income and interest expense for the three and nine months ended September 30, 2012, and 2011. Changes in interest income and interest expense that are not identifiable as either volume-related or rate-related, but are equally attributable to both volume and rate changes, have been allocated to the volume and rate categories based upon the proportion of the absolute value of the volume and rate changes.
61
Rate and Volume Analysis (dollars in thousands) | ||||||||||||||||||||||||
For the Three Months Ended September 30, 2012 vs. September 30, 2011 | For the Nine Months Ended September 30, 2012 vs. September 30, 2011 | |||||||||||||||||||||||
Increase (Decrease) due to | Increase (Decrease) due to | |||||||||||||||||||||||
Volume | Rate | Total | Volume | Rate | Total | |||||||||||||||||||
Interest income | ||||||||||||||||||||||||
Advances | $ | 890 | $ | (5,694 | ) | $ | (4,804 | ) | $ | (13,452 | ) | $ | 12,774 | $ | (678 | ) | ||||||||
Interest-bearing deposits | — | — | — | 1 | 1 | 2 | ||||||||||||||||||
Securities purchased under agreements to resell | 1,559 | 394 | 1,953 | 5,278 | 344 | 5,622 | ||||||||||||||||||
Federal funds sold | (2,109 | ) | 361 | (1,748 | ) | (4,356 | ) | (122 | ) | (4,478 | ) | |||||||||||||
Investment securities | (9,269 | ) | 4,232 | (5,037 | ) | (60,218 | ) | 42,955 | (17,263 | ) | ||||||||||||||
Mortgage loans | 2,749 | (5,802 | ) | (3,053 | ) | 3,075 | (13,004 | ) | (9,929 | ) | ||||||||||||||
Other earning assets | — | — | — | (1 | ) | 1 | — | |||||||||||||||||
Total interest income | (6,180 | ) | (6,509 | ) | (12,689 | ) | (69,673 | ) | 42,949 | (26,724 | ) | |||||||||||||
Interest expense | ||||||||||||||||||||||||
Consolidated obligations | ||||||||||||||||||||||||
Discount notes | 186 | 1,994 | 2,180 | (126 | ) | (460 | ) | (586 | ) | |||||||||||||||
Bonds | (17,710 | ) | 10,398 | (7,312 | ) | (61,947 | ) | 28,878 | (33,069 | ) | ||||||||||||||
Deposits | (3 | ) | (28 | ) | (31 | ) | (8 | ) | (194 | ) | (202 | ) | ||||||||||||
Mandatorily redeemable capital stock | (9 | ) | 92 | 83 | 129 | 259 | 388 | |||||||||||||||||
Other borrowings | — | — | — | (1 | ) | — | (1 | ) | ||||||||||||||||
Total interest expense | (17,536 | ) | 12,456 | (5,080 | ) | (61,953 | ) | 28,483 | (33,470 | ) | ||||||||||||||
Change in net interest income | $ | 11,356 | $ | (18,965 | ) | $ | (7,609 | ) | $ | (7,720 | ) | $ | 14,466 | $ | 6,746 | |||||||||
The average balance of total advances decreased $1.3 billion, or 4.9 percent, for the nine months ended September 30, 2012, compared with the same period in 2011. The trend of muted demand for advances is discussed under — Executive Summary — Advances Balances. The following table summarizes average balances of advances outstanding during the nine months ended September 30, 2012 and 2011, by product type.
62
Average Balance of Advances Outstanding by Product Type (dollars in thousands) | ||||||||
For the Nine Months Ended September 30, | ||||||||
2012 | 2011 | |||||||
Fixed-rate advances—par value | ||||||||
Long-term | $ | 9,907,681 | $ | 11,324,083 | ||||
Short-term | 4,514,645 | 2,264,447 | ||||||
Putable | 4,197,669 | 5,184,843 | ||||||
Amortizing | 1,145,053 | 1,592,077 | ||||||
Overnight | 357,762 | 406,037 | ||||||
Expander | 23,759 | 10,000 | ||||||
Callable | 16,186 | 6,518 | ||||||
Fixed-rate plus cap | 10,000 | 3,480 | ||||||
20,172,755 | 20,791,485 | |||||||
Variable-rate indexed advances—par value | ||||||||
Simple variable | 3,692,996 | 4,373,293 | ||||||
Putable | 63,586 | — | ||||||
Overnight | 10,095 | 9,673 | ||||||
Floating rate advances with embedded caps and / or floors | 10,000 | 11,151 | ||||||
3,776,677 | 4,394,117 | |||||||
Total average par value | 23,949,432 | 25,185,602 | ||||||
Net premiums and (discounts) | 17,434 | 7,470 | ||||||
Market value of embedded derivatives | 107 | — | ||||||
Hedging adjustments | 573,687 | 602,019 | ||||||
Total average balance of advances | $ | 24,540,660 | $ | 25,795,091 | ||||
Putable advances that are classified as fixed-rate advances in the table above are typically hedged with interest-rate-exchange agreements in which a short-term rate is received, typically three-month LIBOR. In addition, approximately 23.7 percent of average long-term fixed-rate advances were similarly hedged with interest-rate swaps. Therefore, a significant portion of our advances, including overnight advances, short-term fixed-rate advances, fixed-rate putable advances, certain fixed-rate bullet advances, and variable-rate advances, either earn a short-term interest rate or are swapped to a short-term index, resulting in yields that closely follow short-term market interest-rate trends. The average balance of all such advances totaled $15.2 billion for the nine months ended September 30, 2012, representing 61.9 percent of the total average balance of advances outstanding during the nine months ended September 30, 2012. The average balance of all such advances totaled $15.1 billion for the nine months ended September 30, 2011, representing 60.1 percent of the total average balance of advances outstanding during the nine months ended September 30, 2011.
For the nine months ended September 30, 2012 and 2011, net prepayment fees on advances were $44.3 million and $20.4 million, respectively. For the nine months ended September 30, 2012 and 2011, prepayment fees on investments were $341,000 and $1.4 million, respectively. Prepayment-fee income is unpredictable and inconsistent from period to period, occurring only when advances and investments are prepaid prior to the scheduled maturity or repricing dates.
Because prepayment-fee income recognized during these periods does not necessarily represent a trend that will continue in future periods, and due to the fact that prepayment-fee income represents a one-time fee that is generally recognized in the period in which the corresponding advance or investment security is prepaid, we believe it is important to review the results of net interest spread and net interest margin excluding the impact of prepayment-fee income. These results are presented in the following table.
63
Net Interest Spread and Margin without Prepayment-Fee Income (dollars in thousands) | ||||||||||||||||||||||||||||
For the Three Months Ended September 30, | For the Nine Months Ended September 30, | |||||||||||||||||||||||||||
2012 | 2011 | 2012 | 2011 | |||||||||||||||||||||||||
Interest Income | Average Yield | Interest Income | Average Yield | Interest Income | Average Yield | Interest Income | Average Yield | |||||||||||||||||||||
Advances | $ | 72,551 | 1.15 | % | $ | 80,163 | 1.28 | % | $ | 225,037 | 1.22 | % | $ | 249,670 | 1.29 | % | ||||||||||||
Investment securities | 56,685 | 1.85 | 61,055 | 1.71 | 169,922 | 1.87 | 186,171 | 1.47 | ||||||||||||||||||||
Total interest-earning assets | 166,370 | 1.40 | 181,199 | 1.41 | 507,049 | 1.43 | 556,715 | 1.40 | ||||||||||||||||||||
Net interest income | 60,788 | 70,538 | 186,006 | 202,202 | ||||||||||||||||||||||||
Net interest spread | 0.42 | % | 0.47 | % | 0.43 | % | 0.43 | % | ||||||||||||||||||||
Net interest margin | 0.51 | % | 0.55 | % | 0.53 | % | 0.51 | % | ||||||||||||||||||||
Average short-term money-market investments, consisting of interest-bearing deposits, securities purchased under agreements to resell, and federal funds sold, decreased $56.0 million, or 0.8 percent, for the nine months ended September 30, 2012, compared with the same period in 2011. The yield earned on short-term money-market investments is highly correlated to short-term market interest rates. These investments are used for liquidity management and to manage our leverage ratio in response to fluctuations in other asset balances. For the nine months ended September 30, 2012, average balances of federal funds sold decreased $4.5 billion and average balances of securities purchased under agreements to resell increased $4.4 billion in comparison to the nine months ended September 30, 2011.
Average investment-securities balances decreased $4.8 billion, or 28.2 percent for the nine months ended September 30, 2012, compared with the same period in 2011, which occurred in the following investment categories:
• | $3.5 billion decline in certificates of deposit; |
• | $547.3 million decline in agency and supranational banks; |
• | $500.0 million decline in MBS; and |
• | $186.7 million decline in corporate bonds. |
The average aggregate balance of our investments in mortgage loans for the nine months ended September 30, 2012, was $87.6 million higher than the average aggregate balance of these investments for the nine months ended September 30, 2011, representing an increase of 2.8 percent.
Average CO balances decreased $6.1 billion, or 12.6 percent, for the nine months ended September 30, 2012, compared with the same period in 2011, resulting from our reduced funding needs principally due to the decline in our investments and member demand for advances. This overall decline consisted of a decrease of $194.0 million in CO discount notes and a decrease of $5.9 billion in CO bonds.
The average balance of term CO discount notes increased $1.6 billion and overnight CO discount notes decreased $1.8 billion for the nine months ended September 30, 2012, in comparison with the same period in 2011. The average balance of CO discount notes represented approximately 31.5 percent of total average COs during the nine months ended September 30, 2012, as compared with 27.9 percent of total average COs during the nine months ended September 30, 2011. The average balance of bonds represented 68.5 percent and 72.1 percent of total average COs outstanding during the nine months ended September 30, 2012 and 2011, respectively.
Impact of Derivatives and Hedging Activities
Net interest income includes interest accrued on interest-rate-exchange agreements that are associated with advances, investments, deposits, and debt instruments that qualify for hedge accounting. We generally use derivative instruments that qualify for hedge accounting as interest-rate-risk-management tools. These derivatives serve to stabilize net interest income and
64
net interest margin when interest rates fluctuate. Accordingly, the impact of derivatives on net interest income and net interest margin should be viewed in the overall context of our risk-management strategy. The following tables show the net effect of derivatives and hedging activities on net interest income, net gains (losses) on derivatives and hedging activities, and net unrealized gains (losses) on trading securities for the three and nine months ended September 30, 2012 and 2011 (dollars in thousands).
For the Three Months Ended September 30, 2012 | ||||||||||||||||||||||||
Net Effect of Derivatives and Hedging Activities | Advances | Investments | Mortgage Loans | Deposits | CO Bonds | Total | ||||||||||||||||||
Net interest income | ||||||||||||||||||||||||
Amortization/accretion of hedging activities in net interest income (1) | $ | (2,683 | ) | $ | — | $ | (60 | ) | $ | — | $ | 6,160 | $ | 3,417 | ||||||||||
Net interest settlements included in net interest income (2) | (45,869 | ) | (10,256 | ) | — | 385 | 21,049 | (34,691 | ) | |||||||||||||||
Total effect on net interest income | (48,552 | ) | (10,256 | ) | (60 | ) | 385 | 27,209 | (31,274 | ) | ||||||||||||||
Net gains (losses) on derivatives and hedging activities | ||||||||||||||||||||||||
Gains (losses) on fair-value hedges | 259 | 462 | — | — | (124 | ) | 597 | |||||||||||||||||
Gains (losses) on derivatives not receiving hedge accounting | 545 | (4,376 | ) | — | — | 381 | (3,450 | ) | ||||||||||||||||
Other | — | — | 767 | — | — | 767 | ||||||||||||||||||
Net gains (losses) on derivatives and hedging activities | 804 | (3,914 | ) | 767 | — | 257 | (2,086 | ) | ||||||||||||||||
Subtotal | (47,748 | ) | (14,170 | ) | 707 | 385 | 27,466 | (33,360 | ) | |||||||||||||||
Net gains on trading securities | — | 4,669 | — | — | — | 4,669 | ||||||||||||||||||
Total net effect of derivatives and hedging activities | $ | (47,748 | ) | $ | (9,501 | ) | $ | 707 | $ | 385 | $ | 27,466 | $ | (28,691 | ) | |||||||||
_____________________
(1) | Represents the amortization/accretion of hedging fair-value adjustments for closed hedge positions. |
(2) | Represents interest income/expense on derivatives included in net interest income. |
65
For the Three Months Ended September 30, 2011 | |||||||||||||||||||||||||
Net Effect of Derivatives and Hedging Activities | Advances | Investments | Mortgage Loans | Deposits | CO Bonds | Total | |||||||||||||||||||
Net interest income | |||||||||||||||||||||||||
Amortization / accretion of hedging activities in net interest income (1) | $ | (4,210 | ) | $ | — | $ | 38 | $ | — | $ | 3,691 | $ | (481 | ) | |||||||||||
Net interest settlements included in net interest income (2) | (68,212 | ) | (11,724 | ) | — | 397 | 37,975 | (41,564 | ) | ||||||||||||||||
Total net interest income | (72,422 | ) | (11,724 | ) | 38 | 397 | 41,666 | (42,045 | ) | ||||||||||||||||
Net gains (losses) on derivatives and hedging activities | |||||||||||||||||||||||||
(Losses) gains on fair-value hedges | (45 | ) | (426 | ) | — | — | 916 | 445 | |||||||||||||||||
Gains (losses) on derivatives not receiving hedge accounting | 1,130 | (20,229 | ) | — | — | — | (19,099 | ) | |||||||||||||||||
Other | — | — | 1,180 | — | — | 1,180 | |||||||||||||||||||
Net gains (losses) on derivatives and hedging activities | 1,085 | (20,655 | ) | 1,180 | — | 916 | (17,474 | ) | |||||||||||||||||
Subtotal | (71,337 | ) | (32,379 | ) | 1,218 | 397 | 42,582 | (59,519 | ) | ||||||||||||||||
Net gains on trading securities (3) | — | 13,552 | — | — | — | 13,552 | |||||||||||||||||||
Total net effect of derivatives and hedging activities | $ | (71,337 | ) | $ | (18,827 | ) | $ | 1,218 | $ | 397 | $ | 42,582 | $ | (45,967 | ) | ||||||||||
_____________________
(1) Represents the amortization/accretion of hedging fair-value adjustments for closed hedge positions.
(2) Represents interest income/expense on derivatives included in net interest income.
(3) Includes only those gains or losses on trading securities that have an economic derivative assigned, and therefore, this line does not reconcile with the statement of operations.
66
For the Nine Months Ended September 30, 2012 | ||||||||||||||||||||||||
Net Effect of Derivatives and Hedging Activities | Advances | Investments | Mortgage Loans | Deposits | CO Bonds | Total | ||||||||||||||||||
Net interest income | ||||||||||||||||||||||||
Amortization/accretion of hedging activities in net interest income (1) | $ | (7,480 | ) | $ | — | $ | (150 | ) | $ | — | $ | 15,745 | $ | 8,115 | ||||||||||
Net interest settlements included in net interest income (2) | (149,548 | ) | (30,626 | ) | — | 1,151 | 69,054 | (109,969 | ) | |||||||||||||||
Total effect on net interest income | (157,028 | ) | (30,626 | ) | (150 | ) | 1,151 | 84,799 | (101,854 | ) | ||||||||||||||
Net (losses) gains on derivatives and hedging activities | ||||||||||||||||||||||||
(Losses) gains on fair-value hedges | (1,293 | ) | 1,255 | — | — | 293 | 255 | |||||||||||||||||
Gains (losses) on derivatives not receiving hedge accounting | 6 | (11,228 | ) | — | — | 372 | (10,850 | ) | ||||||||||||||||
Other | — | — | 2,086 | — | — | 2,086 | ||||||||||||||||||
Net (losses) gains on derivatives and hedging activities | (1,287 | ) | (9,973 | ) | 2,086 | — | 665 | (8,509 | ) | |||||||||||||||
Subtotal | (158,315 | ) | (40,599 | ) | 1,936 | 1,151 | 85,464 | (110,363 | ) | |||||||||||||||
Net gains on trading securities | — | 8,291 | — | — | — | 8,291 | ||||||||||||||||||
Total net effect of derivatives and hedging activities | $ | (158,315 | ) | $ | (32,308 | ) | $ | 1,936 | $ | 1,151 | $ | 85,464 | $ | (102,072 | ) | |||||||||
_____________________
(1) | Represents the amortization/accretion of hedging fair-value adjustments for closed hedge positions. |
(2) | Represents interest income/expense on derivatives included in net interest income. |
For the Nine Months Ended September 30, 2011 | |||||||||||||||||||||||||
Net Effect of Derivatives and Hedging Activities | Advances | Investments | Mortgage Loans | Deposits | CO Bonds | Total | |||||||||||||||||||
Net interest income | |||||||||||||||||||||||||
Amortization / accretion of hedging activities in net interest income (1) | $ | (10,031 | ) | $ | — | $ | 167 | $ | — | $ | 5,283 | $ | (4,581 | ) | |||||||||||
Net interest settlements included in net interest income (2) | (218,021 | ) | (35,658 | ) | — | 1,183 | 123,553 | (128,943 | ) | ||||||||||||||||
Total net interest income | (228,052 | ) | (35,658 | ) | 167 | 1,183 | 128,836 | (133,524 | ) | ||||||||||||||||
Net gains (losses) on derivatives and hedging activities | |||||||||||||||||||||||||
Gains on fair-value hedges | 423 | 282 | — | — | 1,141 | 1,846 | |||||||||||||||||||
Losses on derivatives not receiving hedge accounting | (88 | ) | (26,884 | ) | — | — | — | (26,972 | ) | ||||||||||||||||
Other | — | — | 1,599 | — | — | 1,599 | |||||||||||||||||||
Net gains (losses) on derivatives and hedging activities | 335 | (26,602 | ) | 1,599 | — | 1,141 | (23,527 | ) | |||||||||||||||||
Subtotal | (227,717 | ) | (62,260 | ) | 1,766 | 1,183 | 129,977 | (157,051 | ) | ||||||||||||||||
Net gains on trading securities (3) | — | 17,514 | — | — | — | 17,514 | |||||||||||||||||||
Total net effect of derivatives and hedging activities | $ | (227,717 | ) | $ | (44,746 | ) | $ | 1,766 | $ | 1,183 | $ | 129,977 | $ | (139,537 | ) | ||||||||||
67
_____________________
(1) Represents the amortization/accretion of hedging fair-value adjustments for closed hedge positions.
(2) Represents interest income/expense on derivatives included in net interest income.
(3) Includes only those gains or losses on trading securities that have an economic derivative assigned, and therefore, this line does not reconcile with the statement of operations.
Net interest margin for the three months ended September 30, 2012 and 2011, was 0.61 percent and 0.63 percent, respectively. If derivative instruments had not been used as hedges to mitigate the impact of interest-rate fluctuations, net interest margin would have been 0.91 percent and 0.95 percent, respectively.
Net interest margin for the nine months ended September 30, 2012 and 2011, was 0.65 percent and 0.56 percent, respectively. If derivative instruments had not been used as hedges to mitigate the impact of interest-rate fluctuations, net interest margin would have been 0.96 percent and 0.89 percent, respectively.
Interest paid and received on interest-rate-exchange agreements that are used in asset and liability management, but which do not meet hedge-accounting requirements (economic hedges), are classified as net losses on derivatives and hedging activities in other income. As shown under — Other Income (Loss) and Operating Expenses below, interest accruals on derivatives classified as economic hedges totaled a net expense of $1.9 million and $2.1 million, respectively for the three months ended September 30, 2012 and 2011. For the nine months ended September 30, 2012 and 2011, interest accruals on derivatives classified as economic hedges totaled a net expense of $5.7 million and $7.0 million, respectively.
For more information about our use of derivative instruments to manage interest-rate risk, see Item 3 — Quantitative and Qualitative Disclosures about Market Risk — Strategies to Manage Market and Interest-Rate Risk.
Other Income (Loss) and Operating Expenses
The following table presents a summary of other income (loss) for the three and nine months ended September 30, 2012 and 2011. Additionally, detail on the components of net gains (losses) on derivatives and hedging activities is provided, indicating the source of these gains and losses by type of hedging relationship and hedge accounting treatment.
68
Other Income (Loss) (dollars in thousands) | ||||||||||||||||
For the Three Months Ended September 30, | For the Nine Months Ended September 30, | |||||||||||||||
2012 | 2011 | 2012 | 2011 | |||||||||||||
Gains (losses) on derivatives and hedging activities: | ||||||||||||||||
Net gains related to fair-value hedge ineffectiveness | $ | 597 | $ | 445 | $ | 255 | $ | 1,846 | ||||||||
Net unrealized (losses) gains related to derivatives not receiving hedge accounting associated with: | ||||||||||||||||
Advances | 231 | (931 | ) | (166 | ) | (1,132 | ) | |||||||||
Trading securities | (1,778 | ) | (16,019 | ) | (4,955 | ) | (18,818 | ) | ||||||||
Mortgage delivery commitments | 767 | 1,180 | 2,086 | 1,599 | ||||||||||||
Net interest-accruals related to derivatives not receiving hedge accounting | (1,903 | ) | (2,149 | ) | (5,729 | ) | (7,022 | ) | ||||||||
Net losses on derivatives and hedging activities | (2,086 | ) | (17,474 | ) | (8,509 | ) | (23,527 | ) | ||||||||
Net impairment losses on held-to-maturity securities recognized in income | (1,092 | ) | (7,210 | ) | (5,544 | ) | (73,588 | ) | ||||||||
Loss on early extinguishment of debt | (4,992 | ) | — | (16,993 | ) | — | ||||||||||
Service-fee income | 1,483 | 2,046 | 4,474 | 6,503 | ||||||||||||
Net unrealized gains on trading securities | 4,669 | 13,638 | 8,291 | 17,594 | ||||||||||||
Realized net gain from sale of available-for-sale securities | — | — | — | 12,801 | ||||||||||||
Other | 228 | 131 | 2,753 | 469 | ||||||||||||
Total other loss | $ | (1,790 | ) | $ | (8,869 | ) | $ | (15,528 | ) | $ | (59,748 | ) | ||||
The following tables display held-to-maturity securities for which other-than-temporary impairment was recognized in the three and nine months ending September 30, 2012 and 2011, based on whether the security is newly impaired or previously impaired (dollars in thousands).
For the Three Months Ended September 30, 2012 | For the Three Months Ended September 30, 2011 | ||||||||||||||||||||||
Other-Than-Temporarily Impaired Investment: | Total Other-Than-Temporary Impairment Losses on Investment Securities | Net Amount of Impairment Losses Reclassified to Accumulated Other Comprehensive Loss | Net Impairment Losses on Investment Securities Recognized in Income | Total Other-Than-Temporary Impairment Losses on Investment Securities | Net Amount of Impairment Losses Reclassified to Accumulated Other Comprehensive Loss | Net Impairment Losses on Investment Securities Recognized in Income | |||||||||||||||||
Securities newly impaired during the period specified | $ | (371 | ) | $ | 371 | $ | — | $ | — | $ | — | $ | — | ||||||||||
Securities previously impaired prior to the period specified | (1,706 | ) | 614 | (1,092 | ) | (8,336 | ) | 1,126 | (7,210 | ) | |||||||||||||
Total other-than-temporarily impaired securities | $ | (2,077 | ) | $ | 985 | $ | (1,092 | ) | $ | (8,336 | ) | $ | 1,126 | $ | (7,210 | ) | |||||||
69
For the Nine Months Ended September 30, 2012 | For the Nine Months Ended September 30, 2011 | ||||||||||||||||||||||
Other-Than-Temporarily Impaired Investment: | Total Other-Than-Temporary Impairment Losses on Investment Securities | Net Amount of Impairment Losses Reclassified to Accumulated Other Comprehensive Loss | Net Impairment Losses on Investment Securities Recognized in Income | Total Other-Than-Temporary Impairment Losses on Investment Securities | Net Amount of Impairment Losses Reclassified to (from) Accumulated Other Comprehensive Loss | Net Impairment Losses on Investment Securities Recognized in Income | |||||||||||||||||
Securities newly impaired during the period specified | $ | (951 | ) | $ | 951 | $ | — | $ | (6,072 | ) | $ | 6,026 | $ | (46 | ) | ||||||||
Securities previously impaired prior to the period specified | (13,267 | ) | 7,723 | (5,544 | ) | (25,910 | ) | (47,632 | ) | (73,542 | ) | ||||||||||||
Total other-than-temporarily impaired securities | $ | (14,218 | ) | $ | 8,674 | $ | (5,544 | ) | $ | (31,982 | ) | $ | (41,606 | ) | $ | (73,588 | ) | ||||||
The following table displays held-to-maturity securities for which other-than-temporary impairment was recognized in the quarter ending September 30, 2012 (dollars in thousands). Securities are classified in the table below based on the classification at the time of issuance. We have instituted litigation on certain of the private-label MBS in which we have invested, as discussed in Part II — Item 1 — Legal Proceedings. Our complaint asserts, among others, claims for untrue or misleading statements in the sale of securities, and it is possible that classifications of private-label MBS as provided herein when based on classification at the time of issuance as disclosed by those securities' issuance documents, as well as other statements made by or on behalf of the issuers about the securities, are inaccurate.
At September 30, 2012 | For the Three Months Ended September 30, 2012 | ||||||||||||||||||
Other-Than-Temporarily Impaired Investment: | Par Value | Amortized Cost | Carrying Value | Fair Value | Other-than-Temporary Impairment Related to Credit Loss | ||||||||||||||
Private-label residential MBS - Prime | $ | 1,411 | $ | 1,411 | $ | 1,040 | $ | 1,040 | $ | — | |||||||||
Private-label residential MBS - Alt-A | $ | 199,089 | $ | 145,328 | $ | 103,488 | $ | 114,646 | $ | (1,092 | ) | ||||||||
Total other-than-temporarily impaired securities | $ | 200,500 | $ | 146,739 | $ | 104,528 | $ | 115,686 | $ | (1,092 | ) | ||||||||
See Item 1 — Notes to the Financial Statements — Note 5 — Held-to-Maturity Securities, Note 6 — Other-Than-Temporary Impairment, and — Financial Condition — Investments Credit Risk below for additional detail and analysis of our portfolio of held-to-maturity investments in private-label MBS.
Changes in the fair value of trading securities are recorded in other loss. For the three months ended September 30, 2012 and 2011, we recorded net unrealized gains on trading securities of $4.7 million and $13.6 million, respectively. Changes in the fair value of the associated economic hedges amounted to net losses of $1.8 million and $16.0 million for the three months ended September 30, 2012 and 2011, respectively. Also included in other loss are interest accruals on these economic hedges, which resulted in a net expense of $1.9 million for both the three months ended September 30, 2012 and 2011.
For the nine months ended September 30, 2012 and 2011, we recorded net unrealized gains on trading securities of $8.3 million and $17.6 million, respectively. Changes in the fair value of the associated economic hedges amounted to net losses of $5.0 million and $18.8 million for the nine months ended September 30, 2012 and 2011, respectively. Also included in other loss are interest accruals on these economic hedges, which resulted in a net expense of $5.5 million and $5.8 million for the nine months ended September 30, 2012 and 2011, respectively.
For the three months ended September 30, 2012, compensation and benefits expense and other operating expenses amounted to $12.8 million, a decrease of $982,000 from the September 30, 2011 amount of $13.8 million.
For the nine months ended September 30, 2012, compensation and benefits expense and other operating expenses amounted to $39.2 million, a decrease of $175,000 from the September 30, 2011 amount of $39.3 million.
Our share of the costs and expenses of operating the Finance Agency and the Office of Finance totaled $1.7 million and $1.8
70
million for the three months ended September 30, 2012 and 2011, respectively, and totaled $5.5 million and $5.8 million for the nine months ended September 30, 2012 and 2011, respectively.
FINANCIAL CONDITION
Advances
At September 30, 2012, the advances portfolio totaled $23.9 billion, a decrease of $1.3 billion compared with $25.2 billion at December 31, 2011.
The following table summarizes advances outstanding by product type at September 30, 2012, and December 31, 2011.
Advances Outstanding by Product Type (dollars in thousands) | |||||||||||||
September 30, 2012 | December 31, 2011 | ||||||||||||
Par Value | Percent of Total | Par Value | Percent of Total | ||||||||||
Fixed-rate advances | |||||||||||||
Overnight | $ | 388,246 | 1.7 | % | $ | 268,888 | 1.1 | % | |||||
Long-term | 9,743,415 | 41.8 | 10,546,190 | 42.9 | |||||||||
Short-term | 4,488,282 | 19.2 | 3,161,265 | 12.9 | |||||||||
Putable | 3,578,325 | 15.3 | 4,693,575 | 19.1 | |||||||||
Amortizing | 1,002,030 | 4.3 | 1,394,071 | 5.7 | |||||||||
Callable | 32,500 | 0.1 | 2,500 | — | |||||||||
Expander | 30,000 | 0.1 | 20,000 | 0.1 | |||||||||
Fixed-rate plus cap | 10,000 | 0.1 | 10,000 | — | |||||||||
19,272,798 | 82.6 | 20,096,489 | 81.8 | ||||||||||
Variable-rate advances | |||||||||||||
Overnight | 13,013 | — | 7,683 | — | |||||||||
Simple variable | 3,920,000 | 16.8 | 4,457,000 | 18.1 | |||||||||
Putable | 118,500 | 0.5 | — | — | |||||||||
Floating rate advances with embedded caps and / or floors | 20,000 | 0.1 | 20,000 | 0.1 | |||||||||
4,071,513 | 17.4 | 4,484,683 | 18.2 | ||||||||||
Total par value | $ | 23,344,311 | 100.0 | % | $ | 24,581,172 | 100.0 | % | |||||
See Item 1 — Notes to the Financial Statements — Note 7 — Advances for disclosures relating to redemption terms of the advances portfolio.
We lend to members and housing associates with principal places of business within our district, which consists of the six New England states. Outstanding advances are generally diversified among our borrowers throughout our district, with some concentrations, as set forth in the table below. At September 30, 2012, we had advances outstanding to 305, or 66.7 percent, of our 457 members. At December 31, 2011, we had advances outstanding to 317, or 68.6 percent, of our 462 members.
The following table presents the top five advance-borrowing institutions at September 30, 2012, and the interest earned on outstanding advances to such institutions for the three and nine months ended September 30, 2012.
71
Top Five Advance-Borrowing Institutions (dollars in thousands) | |||||||||||||||||
September 30, 2012 | |||||||||||||||||
Name | Par Value of Advances | Percent of Total Par Value of Advances | Weighted-Average Rate (1) | Advances Interest Income for the Three Months Ended September 30, 2012 | Advances Interest Income for the Nine Months Ended September 30, 2012 | ||||||||||||
RBS Citizens, N.A. | $ | 3,520,085 | 15.1 | % | 0.32 | % | $ | 3,155 | $ | 8,367 | |||||||
Webster Bank, N.A. | 1,452,569 | 6.2 | 0.62 | 2,459 | 8,655 | ||||||||||||
Salem Five Cents Savings Bank | 659,551 | 2.8 | 1.87 | 3,219 | 9,905 | ||||||||||||
Bank of America Rhode Island, N.A. | 600,323 | 2.6 | 1.13 | 2,137 | 5,114 | ||||||||||||
Massachusetts Mutual Life Insurance Company | 600,000 | 2.6 | 1.96 | 3,008 | 8,958 | ||||||||||||
_______________________
(1) | Weighted-average rates are based on the contract rate of each advance without taking into consideration the effects of interest-rate-exchange agreements that may be used as a hedging instrument. |
The financial services industry continues to undergo a period of rapid change based on economic, regulatory, political and other factors that had their inception with the financial crisis in 2008. Given these factors, we believe it is reasonably possible that one or more of our largest members, either by outstanding advances or by capital stock investment, could be acquired by or merge with an institution that is ineligible for Bank membership. The loss of significant members could lower overall demand for our products and services and, thereby, adversely impact our performance. See the 2011 Annual Report — Item 1A — Risk Factors — Strategic Risks — The loss of significant members could result in lower demand for our products and services.
Advances Credit Risk
We endeavor to minimize credit risk on advances by monitoring the financial condition of our borrowers and by holding sufficient collateral to protect us from credit losses. Our approaches to credit risk on advances are described under Item 7 — Management's Discussion and Analysis of Financial Condition and Results of Operations — Financial Condition — Advances Credit Risk in the 2011 Annual Report. We have never experienced a credit loss on an advance.
Our members continue to be challenged by the continuing weak economic conditions, although there have been some measures of improvement. Aggregate nonperforming assets for depository institution members declined from 1.12 percent of assets as of December 31, 2011, to 1.02 percent of assets as of June 30, 2012. The aggregate ratio of tangible capital to assets among the membership increased from 8.67 percent of assets as of December 31, 2011, to 8.98 percent as of June 30, 2012. (June 30, 2012 is the date of our most recent data on our membership for this report.) As of September 30, 2012, there have been no member failures during 2012, and there were no failures during 2011. All of our extensions of credit to members are secured by eligible collateral as noted herein. However we could incur losses, if a member were to default, the value of the collateral pledged by the member declined to a point such that we were unable to realize sufficient value from the pledged collateral to cover the member's obligations, and we were unable to obtain additional collateral to make up for the reduction in value of such collateral. Although not expected, a default by a member with significant obligations to us could result in significant financial losses, which would adversely impact our results of operations and financial condition.
We assign each borrower to one of the following three credit status categories based primarily on our assessment of the borrower's overall financial condition and other factors:
• | Category-1: members that are generally in satisfactory financial condition; |
• | Category-2: members that show weakening financial trends in key financial indices and/or regulatory findings; and |
• | Category-3: members with financial weaknesses that present an elevated level of concern. In addition, we generally place insurance company members in Category-3 status because, unlike other members, insurance companies are subject to different laws and regulations in their particular states that could expose us to unique risks. We place housing associates in Category-3. |
For additional information on the Bank's classification of its borrowers, see the 2011 Annual Report under Item 7 — Management's Discussion and Analysis of Financial Condition and Results of Operations — Financial Condition — Advances
72
Credit Risk in the 2011 Annual Report.
Advances outstanding to borrowers in Category-1 status at September 30, 2012, totaled $17.1 billion. For these advances, we have access to collateral through security agreements, where the borrower agrees to hold such collateral for our benefit, totaling $45.8 billion as of September 30, 2012. Of this total, $9.6 billion of securities have been delivered to us or to an approved third-party custodian, an additional $1.8 billion of securities are held by borrowers' securities corporations, and $6.6 billion of residential mortgage loans have been pledged by borrowers' real-estate-investment trusts.
The following table provides information regarding advances outstanding with our borrowers in Category-1, Category-2, and Category-3 status at September 30, 2012, along with their corresponding collateral balances.
Advances Outstanding by Borrower Collateral Status As of September 30, 2012 (dollars in thousands) | |||||||||||||
Number of Borrowers | Par Value of Advances Outstanding | Discounted Collateral | Ratio of Discounted Collateral to Advances | ||||||||||
Category-1 status | 260 | $ | 17,128,039 | $ | 45,750,283 | 267.1 | % | ||||||
Category-2 status | 25 | 4,767,206 | 17,131,401 | 359.4 | |||||||||
Category-3 status | 25 | 1,449,066 | 1,814,899 | 125.2 | |||||||||
Total | 310 | $ | 23,344,311 | $ | 64,696,583 | 277.1 | % | ||||||
The method by which a borrower pledges collateral is dependent upon the category status to which it is assigned based on its financial condition and on the type of collateral that the borrower pledges. Based upon the method by which borrowers pledge collateral to us, the following table shows the total potential lending value of the collateral that borrowers have pledged to us, net of our collateral valuation discounts as of September 30, 2012.
Collateral by Pledge Type (dollars in thousands) | |||
Discounted Collateral | |||
Collateral not specifically listed and identified | $ | 36,932,450 | |
Collateral specifically listed and identified | 21,485,957 | ||
Collateral delivered to us | 16,560,057 | ||
For additional information on our collateral policies and practices, see Item 7 — Management's Discussion and Analysis of Financial Condition and Results of Operations — Financial Condition — Advances Credit Risk in the 2011 Annual Report.
We accept nontraditional and subprime loans that are underwritten in accordance with applicable regulatory guidance as eligible collateral for our advances as discussed under Item 7 — Management's Discussion and Analysis of Financial Condition and Results of Operations — Financial Condition — Advances Credit Risk in the 2011 Annual Report. At September 30, 2012, and December 31, 2011, the amount of pledged nontraditional and subprime loan collateral was 10 percent and nine percent, respectively, of total member borrowing capacity.
We have not recorded any allowance for credit losses on credit products at September 30, 2012, and December 31, 2011, for the reasons discussed in Item 1 — Notes to the Financial Statements — Note 9 — Allowance for Credit Losses.
Investments
At September 30, 2012, investment securities and short-term money market instruments totaled $17.9 billion, compared with $21.4 billion at December 31, 2011.
Investment securities declined $486.6 million to $11.7 billion at September 30, 2012, compared with December 31, 2011.
Short-term money market investments totaled $6.2 billion at September 30, 2012, compared with $9.2 billion at December 31, 2011. This $2.9 billion net decrease resulted from a $1.8 billion decrease in securities purchased under agreements to resell and
73
a $1.2 billion decrease in federal funds sold.
Under our regulatory authority to purchase MBS, additional investments in MBS, ABS, and certain securities issued by the Small Business Administration (SBA) are prohibited if our investments in such securities exceed 300 percent of capital. Capital for this calculation is defined as capital stock, mandatorily redeemable capital stock, and retained earnings. At September 30, 2012, and December 31, 2011, our MBS, ABS, and SBA holdings represented 206 percent and 195 percent of capital, respectively.
We endeavor to maintain our total investments at a level no greater than 50 percent of our total assets because investing activities are generally incidental to our mission. Our total investments were 39.2 percent of our total assets at September 30, 2012, versus 42.8 percent at December 31, 2011. We have been able to satisfy this investment objective without a material impact on our results of operations or financial condition because the reduction in investments has been principally concentrated in short-term, very low-yielding investments and because other components of our assets have maintained a strong net interest spread to funding costs. We expect to continue to be able to satisfy this investment objective for the foreseeable future without a material impact on our results of operations or financial condition by continuing this approach, as necessary.
Our MBS investment portfolio consists of the following categories of securities as of September 30, 2012, and December 31, 2011. The percentages in the table below are based on carrying value.
Mortgage-Backed Securities | |||||
September 30, 2012 | December 31, 2011 | ||||
Residential MBS - U.S. government-guaranteed and GSE | 61.1 | % | 53.4 | % | |
Commercial MBS - U.S. government-guaranteed and GSE | 22.4 | 26.7 | |||
Private-label residential MBS | 16.1 | 19.5 | |||
ABS backed by home-equity loans | 0.3 | 0.3 | |||
Private-label commercial MBS | 0.1 | 0.1 | |||
Total MBS | 100.0 | % | 100.0 | % | |
See Item 1 — Notes to the Financial Statements — Note 3 — Trading Securities, Note 4 — Available-for-Sale Securities, Note 5 — Held-to-Maturity Securities, and Note 6 — Other-Than-Temporary Impairment for additional information on our investment securities.
Investments Credit Risk
We are subject to credit risk on unsecured investments consisting primarily of short-term (under one year to maturity) money market instruments issued by high-quality financial institutions and long-term (generally at least one year to maturity) debentures issued or guaranteed by U.S. agencies, the FDIC under the FDIC's Temporary Liquidity Guarantee Program, U.S government-owned corporations, GSEs, and supranational institutions. We place short-term funds with large, high-quality financial institutions with long-term credit ratings no lower than single-A (or equivalent) on an unsecured basis; currently all such placements expire within one day. We have counterparty exposure on these short-term investments.
In addition to these unsecured short-term investments, we also make secured investments in the form of reverse repurchase agreements secured by U.S. agency obligations, whose terms to maturity are up to 35 days. We have also invested in and are subject to secured credit risk related to MBS, ABS, and HFA securities that are directly or indirectly supported by underlying mortgage loans. Finance Agency regulations require our investments in MBS and ABS to be rated triple-A (or equivalent) at the time of purchase and our investments in HFA securities to be rated double-A (or equivalent) or higher as of the date of purchase.
Credit ratings on total investments are provided in the following table.
74
Credit Ratings of Investments at Carrying Value As of September 30, 2012 (dollars in thousands) | ||||||||||||||||||||||||
Long-Term Credit Rating (1) | ||||||||||||||||||||||||
Investment Category | Triple-A | Double-A | Single-A | Triple-B | Below Triple-B | Unrated | ||||||||||||||||||
Money market instruments: (2) | ||||||||||||||||||||||||
Interest-bearing deposits | $ | — | $ | 261 | $ | — | $ | — | $ | — | $ | — | ||||||||||||
Securities purchased under agreements to resell | — | — | 4,625,000 | 500,000 | — | — | ||||||||||||||||||
Federal funds sold | — | 650,000 | 450,000 | — | — | — | ||||||||||||||||||
Total money market instruments | — | 650,261 | 5,075,000 | 500,000 | — | — | ||||||||||||||||||
Investment securities: | ||||||||||||||||||||||||
Non-MBS: | ||||||||||||||||||||||||
U.S. agency obligations | — | 14,666 | — | — | — | — | ||||||||||||||||||
U.S. government-owned corporations | — | 293,600 | — | — | — | — | ||||||||||||||||||
GSEs | — | 2,218,142 | — | — | — | — | ||||||||||||||||||
Supranational institutions | 473,416 | — | — | — | — | — | ||||||||||||||||||
Corporate bonds (3) | — | 308,225 | — | — | — | — | ||||||||||||||||||
HFA securities | 24,525 | 115,549 | — | 49,780 | — | 2,115 | ||||||||||||||||||
Total non-MBS | 497,941 | 2,950,182 | — | 49,780 | — | 2,115 | ||||||||||||||||||
MBS: | ||||||||||||||||||||||||
U.S. government guaranteed - residential (2) | — | 135,922 | — | — | — | — | ||||||||||||||||||
U.S. government guaranteed - commercial (2) | — | 463,211 | — | — | — | — | ||||||||||||||||||
GSE - residential (2) | — | 4,890,462 | — | — | — | — | ||||||||||||||||||
GSE - commercial (2) | — | 1,374,973 | — | — | — | — | ||||||||||||||||||
Private-label - residential | 13,872 | 10,174 | 103,237 | 64,077 | 1,131,325 | 18 | ||||||||||||||||||
Private-label - commercial | 10,335 | — | — | — | — | — | ||||||||||||||||||
ABS backed by home-equity loans | 6,676 | 5,287 | 7,839 | — | 5,386 | — | ||||||||||||||||||
Total MBS | 30,883 | 6,880,029 | 111,076 | 64,077 | 1,136,711 | 18 | ||||||||||||||||||
Total investment securities | 528,824 | 9,830,211 | 111,076 | 113,857 | 1,136,711 | 2,133 | ||||||||||||||||||
Total investments | $ | 528,824 | $ | 10,480,472 | $ | 5,186,076 | $ | 613,857 | $ | 1,136,711 | $ | 2,133 | ||||||||||||
_______________________
(1) | Ratings are obtained from Moody's, Fitch, and S&P and are each as of September 30, 2012. If there is a split rating, the lowest rating is used. |
(2) | The issuer rating is used for these investments, and if a rating is on negative credit watch, the rating in the next lower rating category is used and then the lowest rating is determined. |
(3) | Consists of corporate debentures guaranteed by the FDIC under the FDIC's Temporary Liquidity Guarantee Program. The FDIC guarantee carries the full faith and credit of the U.S. government. |
The following table details our investment securities with a long-term credit rating below investment grade as of September 30, 2012.
75
Credit Ratings of Investments Below Investment Grade at Carrying Value As of September 30, 2012 (dollars in thousands) | ||||||||||||||||||||||||||||
Investment Category | Double-B | Single-B | Triple-C | Double-C | Single-C | Single-D | Total Below Investment Grade | |||||||||||||||||||||
Private-label residential MBS | $ | 45,410 | $ | 119,598 | $ | 553,611 | $ | 94,642 | $ | 54,592 | $ | 263,472 | $ | 1,131,325 | ||||||||||||||
ABS backed by home-equity loans | — | 3,578 | 1,334 | — | — | 474 | 5,386 | |||||||||||||||||||||
Total | $ | 45,410 | $ | 123,176 | $ | 554,945 | $ | 94,642 | $ | 54,592 | $ | 263,946 | $ | 1,136,711 | ||||||||||||||
Finance Agency regulations include limits on the amount of unsecured credit an individual FHLBank may extend to a counterparty or to a group of affiliated counterparties. This limit is based on a percentage of eligible regulatory capital and the counterparty's long-term unsecured credit rating. Under these regulations, the level of eligible regulatory capital is determined as the lesser of our total regulatory capital or the eligible amount of regulatory capital of the counterparty. The eligible amount of regulatory capital is then multiplied by a specified percentage for each counterparty, which product is our maximum amount of unsecured credit exposure to that counterparty. The percentage that we may offer for term extensions of unsecured credit ranges from 1 percent to 15 percent based on the counterparty's credit rating. Term extensions of unsecured credit include on- and off-balance sheet and derivative transactions. See — Derivative Instruments Credit Risk for additional information related to derivatives exposure.
Finance Agency regulations further allow additional unsecured credit for overnight sales of federal funds. The specified percentage of eligible regulatory capital for determining the maximum amount of unsecured credit exposure which we may offer to a counterparty for overnight sales of federal funds ranges from 2 percent to 30 percent based on the counterparty's credit rating. However, per Finance Agency regulations our total unsecured exposure to a single counterparty may not exceed twice the regulatory limit for term exposures, or a total of 2 percent to 30 percent of the eligible amount of regulatory capital, based on the counterparty's credit rating. During the quarter ended September 30, 2012, we were in compliance with Finance Agency regulatory limits established for unsecured credit.
We are prohibited by Finance Agency regulations from investing in financial instruments issued by non-U.S. entities, including foreign sovereign governments, other than those issued by U.S. branches and agency offices of foreign commercial banks. Our unsecured credit exposures to U.S. branches and agency offices of foreign commercial banks include, among other things, the risk that, as a result of political or economic conditions in a country, the counterparty may be unable to meet their contractual repayment obligations. Our unsecured credit exposures to domestic counterparties and U.S. subsidiaries of foreign commercial banks include the risk that these counterparties have extended credit to foreign counterparties. We are in compliance with the Finance Agency regulation and did not own any financial instruments issued by foreign sovereign governments, including those countries that are members of the European Union, as of September 30, 2012.
For information on how we mitigate our investments' credit risks, see Item 7 — Management's Discussion and Analysis of Financial Condition and Results of Operations — Financial Condition — Investments Credit Risk in the 2011 Annual Report.
The table below presents our short-term unsecured money-market credit exposure with counterparties by investment type. At September 30, 2012, we did not have any aggregate unsecured credit exposure from investments of $1 billion or more to any individual counterparty.
Short-term Unsecured Money-market Credit Exposure by Investment Type (dollars in thousands) | ||||||||
Carrying Value (1) | ||||||||
September 30, 2012 | December 31, 2011 | |||||||
Federal funds sold | $ | 1,100,000 | $ | 2,270,000 | ||||
_______________________
(1) | Excludes unsecured investment credit exposure to U.S. Government, GSEs, U.S. government agencies and instrumentalities, corporate debentures guaranteed by the FDIC under the FDIC's Temporary Liquidity Guarantee Program, and triple-A rated supranational institutions and does not include related accrued interest as of September 30, 2012. |
As of September 30, 2012, our unsecured investment credit exposure to U.S. branches and agency offices of foreign
76
commercial banks was limited to overnight federal funds sold. As of September 30, 2012, all of our unsecured investment credit exposure in federal funds sold was to U.S. branches and agency offices of foreign commercial banks.
The table below presents the September 30, 2012, carrying values and average balances for the three months ended September 30, 2012, of the short-term unsecured money market credit exposures presented by the domicile of the counterparty or the domicile of the counterparty's parent for U.S. branches and agency offices of foreign commercial banks. We endeavor to mitigate this credit risk by investing in unsecured investments of highly rated counterparties. At September 30, 2012, all of our short-term unsecured money market investments were rated at least single-A.
Period-End and Average Balance of Unsecured Credit Exposure, by Country of Domicile of Counterparty (1) (dollars in thousands) | ||||||||
Country of Domicile of Counterparty | Carrying Value as of September 30, 2012 | Average Balance for the Nine Months ended September 30, 2012 | ||||||
Domestic | $ | — | $ | 8,175 | ||||
U.S branches and agency offices of foreign commercial banks | ||||||||
Sweden | 650,000 | 581,518 | ||||||
Canada | 350,000 | 305,737 | ||||||
United Kingdom | 100,000 | 190,511 | ||||||
Norway | — | 113,449 | ||||||
Germany | — | 148,230 | ||||||
Finland | — | 84,799 | ||||||
Switzerland | — | 44,982 | ||||||
Australia | — | 40,055 | ||||||
Netherlands | — | 13,321 | ||||||
Total U.S branches and agency offices of foreign commercial banks | 1,100,000 | 1,522,602 | ||||||
Total unsecured credit exposure | $ | 1,100,000 | $ | 1,530,777 | ||||
_______________________
(1) | Excludes unsecured investment credit exposure to U.S. Government, GSEs, U.S. government agencies and instrumentalities, corporate debentures guaranteed by the FDIC under the FDIC's Temporary Liquidity Guarantee Program, and triple-A rated supranational institutions and does not include related accrued interest as of September 30, 2012. |
The table below presents the contractual maturity of short-term unsecured money market credit exposure by the domicile of the counterparty or the domicile of the counterparty's parent for U.S. branches and agency offices of foreign commercial banks. We also endeavor to mitigate the credit risk on short-term unsecured money market investments by investing in investments that have short-term maturities. At September 30, 2012, all of our outstanding unsecured money market investments had overnight maturities.
77
Contractual Maturity of Unsecured Credit Exposure, by Country of Domicile of Counterparty (dollars in thousands) | ||||||||||||||||||||||||||||
Carrying Value (1) as of September 30, 2012 | ||||||||||||||||||||||||||||
Country of Domicile of Counterparty | Overnight | Due 2 days through 30 days | Due 31 days through 90 days | Due 91 days through 180 days | Due 181 days through 270 days | Due after 270 days | Total | |||||||||||||||||||||
U.S branches and agency offices of foreign commercial banks | ||||||||||||||||||||||||||||
Sweden | $ | 650,000 | $ | — | $ | — | $ | — | $ | — | $ | — | $ | 650,000 | ||||||||||||||
Canada | 350,000 | — | — | — | — | — | 350,000 | |||||||||||||||||||||
United Kingdom | 100,000 | — | — | — | — | — | 100,000 | |||||||||||||||||||||
Total unsecured investment credit exposure | $ | 1,100,000 | $ | — | $ | — | $ | — | $ | — | $ | — | $ | 1,100,000 | ||||||||||||||
_______________________
(1) | Excludes unsecured investment credit exposure to U.S. Government, GSEs, U.S. Government agencies and instrumentalities, corporate debentures guaranteed by the FDIC under the FDIC's Temporary Liquidity Guarantee Program, and triple-A rated supranational institutions and does not include related accrued interest as of September 30, 2012. |
During the quarter ended September 30, 2012, we continued to invest in unsecured overnight money market instruments issued by certain Eurozone financial institutions rated at least single-A or higher by the three major NRSROs and domiciled in Finland, Germany, and the Netherlands from time to time. We continued to use the same safeguards and approaches to these counterparties to protect against unanticipated exposures arising from possible contagion from the Eurozone financial crisis that are discussed under Item 7 — Management's Discussion and Analysis of Financial Condition and Results of Operations — Financial Market Conditions — European Sovereign Debt Crisis in the 2011 Annual Report. On September 30, 2012, we had no unsecured money market exposure to Eurozone financial institutions. Our maximum unsecured money market exposure to any single Eurozone financial institution was $500.0 million on any day during the quarter ended September 30, 2012.
At September 30, 2012, our unsecured credit exposure related to money market instruments and debentures, including accrued interest, was $4.4 billion to 11 counterparties and issuers, of which $1.1 billion was for federal funds sold, and $3.3 billion was for debentures. The following issuers/counterparties individually accounted for greater than 10 percent of total unsecured credit exposure as of September 30, 2012:
Issuers / Counterparties Representing Greater Than 10 Percent of Total Unsecured Credit As of September 30, 2012 | |||
Issuer / counterparty | Percent | ||
Fannie Mae | 34.9 | % | |
Freddie Mac | 15.5 | ||
Inter-American Development Bank (a supranational institution) | 10.8 | ||
The following table presents a summary of the average projected values over the remaining lives of the securities for the significant inputs relating to our cash flow analysis of private-label MBS during the quarter ended September 30, 2012, as well as related current credit enhancement. Credit enhancement is defined as the percentage of subordinated tranches, over-collateralization, and other accounts or cash flows that provide additional credit support such as reserve funds, insurance policies, and/or excess interest, if any, in a security structure that will generally absorb losses before we will experience a loss on the security. Subordinated tranches can serve as credit enhancement, because losses are generally allocated to the subordinate tranches until their principal balances have been reduced to zero before senior tranches are allocated losses. Over-collateralization means available collateral in excess of the principal balance of the related security. The calculated averages represent the dollar-weighted averages of all the private-label residential MBS and home equity loan investments in each category shown, regardless of whether or not the securities have incurred an other-than-temporary impairment credit loss (dollars in thousands).
78
Significant Inputs | ||||||||||||||||||||||||||||
Projected Prepayment Rates | Projected Default Rates | Projected Loss Severities | Current Credit Enhancement | |||||||||||||||||||||||||
Private-label MBS by Year of Securitization | Par Value (1) | Weighted Average Percent | Range Percent | Weighted Average Percent | Range Percent | Weighted Average Percent | Range Percent | Weighted Average Percent | Range Percent | |||||||||||||||||||
Private-label residential MBS | ||||||||||||||||||||||||||||
Prime (2) | ||||||||||||||||||||||||||||
2007 | $ | 21,977 | 8.1 | % | 8.1 | % | 6.1 | % | 6.1 | % | 29.2 | % | 29.2 | % | 7.6 | % | 7.6 | % | ||||||||||
2006 | 15,346 | 7.7 | 7.7 | 34.4 | 34.4 | 39.7 | 39.7 | 0.0 | 0.0 | |||||||||||||||||||
2005 | 56,389 | 9.0 | 5.6 - 11.2 | 28.9 | 15.7 - 47.7 | 44.5 | 32.3 - 50.4 | 13.7 | 2.6 - 47.5 | |||||||||||||||||||
2004 and prior | 137,159 | 11.2 | 4.3 - 26.2 | 16.1 | 2.9 - 59.5 | 30.7 | 21.2 - 47.7 | 15.6 | 6.2 - 70.7 | |||||||||||||||||||
Total | $ | 230,871 | 10.1 | % | 4.3 - 26.2 | 19.5 | % | 2.9 - 59.5 | 34.5 | % | 21.2 - 50.4 | 13.4 | % | 0.0 - 70.7 | ||||||||||||||
Alt-A (2) | ||||||||||||||||||||||||||||
2007 | $ | 518,697 | 3.8 | % | 1.9 - 9.6 | 74.0 | % | 32.7 - 87.6 | 50.5 | % | 40.8 - 59.0 | 12.0 | % | 0.0 - 42.9 | ||||||||||||||
2006 | 859,238 | 4.3 | 2.1 - 7.5 | 70.0 | 37.9 - 85.6 | 52.9 | 39.2 - 58.4 | 13.4 | 0.0 - 48.9 | |||||||||||||||||||
2005 | 564,050 | 6.6 | 3.3 - 13.1 | 47.7 | 23.3 - 73.1 | 44.8 | 32.1 - 64.0 | 20.1 | 0.0 - 62.9 | |||||||||||||||||||
2004 and prior | 54,202 | 10.6 | 7.8 - 18.0 | 33.3 | 1.7 - 54.0 | 38.1 | 19.5 - 47.9 | 24.5 | 7.4 - 40.1 | |||||||||||||||||||
Total | $ | 1,996,187 | 5.0 | % | 1.9 - 18.0 | 63.7 | % | 1.7 - 87.6 | 49.6 | % | 19.5 - 64.0 | 15.2 | % | 0.0 - 62.9 | ||||||||||||||
ABS backed by home equity loans | ||||||||||||||||||||||||||||
Subprime (2) | ||||||||||||||||||||||||||||
2004 and prior | $ | 27,032 | 6.3 | % | 1.0 - 7.8 | 30.1 | % | 25.9 - 43.4 | 76.2 | % | 63.5 - 95.1 | 35.1 | % | 0.0 - 99.8 | ||||||||||||||
_______________________
(1) Commercial private-label MBS with a par value of $10.4 million and a private-label residential MBS with a par value of $3.3 million that are backed by the Federal Housing Administration and the Department of Veteran Affairs loans are not included in this table.
(2) | Securities are classified in the table above based upon the current performance characteristics of the underlying pool and therefore the manner in which the collateral pool group backing the security has been modeled (as prime, Alt-A, or subprime), rather than the classification of the security at the time of issuance. |
For purposes of the tables below we classify private-label residential and commercial MBS and ABS backed by home equity loans as prime, Alt-A, or subprime based on the originator's classification at the time of origination or based on the classification by an NRSRO upon issuance of the MBS. In some instances, the NRSROs may have changed their classification subsequent to origination, which would not necessarily be reflected in the following tables.
Of our $9.0 billion in par value of MBS and ABS investments at September 30, 2012, $2.3 billion in par value are private-label MBS. These private-label MBS are comprised of the following:
• | $2.0 billion in par value are securities backed primarily by Alt-A loans; |
• | $244.6 million in par value are backed primarily by prime residential and/or commercial loans; and |
• | $27.0 million in par value of these investments are backed primarily by subprime mortgages. |
While there are no universally accepted classifications of mortgage loans based on underwriting standards, in general, subprime underwriting implies a credit-impaired borrower with a FICO® score below 660, prime underwriting implies a borrower without a history of delinquent payments as well as documented income and a loan amount that is at or less than 80 percent of the market value of the house, while Alt-A underwriting implies a prime borrower with limited income documentation and/or a loan-to-value ratio of higher than 80 percent. FICO® is a widely used credit-industry model developed by Fair Isaac and Company, Inc. to assess borrower credit quality with scores ranging from a low of 300 to a high of 850. While we generally follow the collateral type definitions provided by S&P, we do review the credit performance of the underlying collateral, and revise the classification where appropriate, an approach that is likewise incorporated into the modeling assumptions provided by the OTTI Governance Committee. For additional information on the OTTI Governance Committee, see Item 7 — Management's Discussion and Analysis of Financial Condition and Results of Operations — Critical Accounting Estimates of the 2011 Annual Report.
79
The third-party collateral loan performance platform used by the FHLBank of San Francisco, with whom we have contracted to perform these analyses, assesses eight bonds that we own, totaling $73.2 million in par value as of September 30, 2012, to have collateral that is Alt-A in nature, while that same collateral is classified as prime by S&P. Accordingly, these bonds have been modeled using the same credit assumptions applied to Alt-A collateral. However, these bonds are reported as prime in the various tables below in this section.
Additionally, one bond classified as Alt-A collateral by S&P, of which we held $4.5 million in par value as of September 30, 2012, is classified and modeled as prime by the third-party modeling software. However this bond is reported as Alt-A in the various tables below in this section in accordance with S&P's classification. See — Item 7 — Management's Discussion and Analysis of Financial Condition and Results of Operations — Critical Accounting Estimates of the 2011 Annual Report for information on our key inputs, assumptions, and modeling employed by us in our other-than-temporary impairment assessments.
Unpaid Principal Balance of Private-Label MBS and ABS Backed by Home Equity Loans by Fixed Rate or Variable Rate (dollars in thousands) | |||||||||||||||||||||||
September 30, 2012 | December 31, 2011 | ||||||||||||||||||||||
Private-label MBS | Fixed Rate (1) | Variable Rate (1) | Total | Fixed Rate (1) | Variable Rate (1) | Total | |||||||||||||||||
Private-label residential MBS | |||||||||||||||||||||||
Prime | $ | 20,586 | $ | 213,633 | $ | 234,219 | $ | 23,846 | $ | 292,663 | $ | 316,509 | |||||||||||
Alt-A | 38,221 | 1,957,966 | 1,996,187 | 42,153 | 2,147,908 | 2,190,061 | |||||||||||||||||
Total private-label residential MBS | 58,807 | 2,171,599 | 2,230,406 | 65,999 | 2,440,571 | 2,506,570 | |||||||||||||||||
Private-label commercial MBS | |||||||||||||||||||||||
Prime | 10,367 | — | 10,367 | 10,586 | — | 10,586 | |||||||||||||||||
ABS backed by home equity loans | |||||||||||||||||||||||
Subprime | — | 27,032 | 27,032 | — | 28,114 | 28,114 | |||||||||||||||||
Total par value of private-label MBS | $ | 69,174 | $ | 2,198,631 | $ | 2,267,805 | $ | 76,585 | $ | 2,468,685 | $ | 2,545,270 | |||||||||||
_______________________
(1) | The determination of fixed or variable rate is based upon the contractual coupon type of the security. |
The following tables provide additional information related to our investments in MBS issued by private trusts and ABS backed by home-equity loans, indicating whether the underlying mortgage collateral is considered to be prime, Alt-A, or subprime at the time of issuance. Additionally, the amounts outstanding as of September 30, 2012, are stratified by year of issuance of the security. The tables also set forth the credit ratings and summary credit enhancements associated with our private-label MBS and ABS, stratified by collateral type and year of securitization. Average current credit enhancements as of September 30, 2012, reflect the percentage of subordinated class outstanding balances as of September 30, 2012, to our senior class outstanding balances as of September 30, 2012, weighted by the par value of our respective senior class securities, and shown by underlying loan collateral type and year of securitization. Average current credit enhancements as of September 30, 2012, are indicative of the ability of subordinated classes to absorb loan collateral lost principal and interest shortfall before senior classes are impacted.
80
Private-Label MBS and ABS Backed by Home Equity Loans by Year of Securitization - Prime At September 30, 2012 (dollars in thousands) | |||||||||||||||||||
Private-label residential MBS - Prime | Total | 2007 | 2006 | 2005 | 2004 and prior | ||||||||||||||
Par value by credit rating | |||||||||||||||||||
Triple-A | $ | 2,295 | $ | — | $ | — | $ | — | $ | 2,295 | |||||||||
Double-A | 5,422 | — | — | — | 5,422 | ||||||||||||||
Single-A | 34,787 | — | — | — | 34,787 | ||||||||||||||
Triple-B | 50,211 | — | — | — | 50,211 | ||||||||||||||
Below Investment Grade | |||||||||||||||||||
Double-B | 28,870 | — | — | — | 28,870 | ||||||||||||||
Single-B | 41,727 | 21,977 | — | 15,088 | 4,662 | ||||||||||||||
Triple-C | 48,508 | — | — | 34,266 | 14,242 | ||||||||||||||
Single-C | 7,035 | — | — | 7,035 | — | ||||||||||||||
Single-D | 15,346 | — | 15,346 | — | — | ||||||||||||||
Unrated | 18 | — | — | — | 18 | ||||||||||||||
Total | $ | 234,219 | $ | 21,977 | $ | 15,346 | $ | 56,389 | $ | 140,507 | |||||||||
Amortized cost | $ | 223,683 | $ | 21,977 | $ | 12,135 | $ | 49,600 | $ | 139,971 | |||||||||
Gross unrealized losses | (21,440 | ) | (2,869 | ) | (259 | ) | (5,847 | ) | (12,465 | ) | |||||||||
Fair value | 202,338 | 19,108 | 11,876 | 43,753 | 127,601 | ||||||||||||||
Other-than-temporary impairment for the nine months ended September 30, 2012: | |||||||||||||||||||
Total other-than-temporary impairment losses on held-to-maturity securities | $ | (371 | ) | $ | — | $ | — | $ | — | $ | (371 | ) | |||||||
Net amount of impairment losses reclassified to (from) accumulated other comprehensive loss | 371 | — | — | — | 371 | ||||||||||||||
Net impairment losses on held-to-maturity securities recognized in income | $ | — | $ | — | $ | — | $ | — | $ | — | |||||||||
Weighted average percentage of fair value to par value | 86.39 | % | 86.95 | % | 77.39 | % | 77.59 | % | 90.81 | % | |||||||||
Original weighted average credit support | 11.00 | 6.41 | 8.32 | 20.98 | 8.00 | ||||||||||||||
Weighted average credit support | 13.29 | 7.62 | — | 13.74 | 15.44 | ||||||||||||||
Weighted average collateral delinquency (1) | 12.30 | 5.24 | 16.36 | 18.11 | 10.63 | ||||||||||||||
Private-label commercial MBS - Prime | Total | 2007 | 2006 | 2005 | 2004 and prior | ||||||||||||||
Par value by credit rating | |||||||||||||||||||
Triple-A | $ | 10,367 | $ | — | $ | — | $ | — | $ | 10,367 | |||||||||
Amortized cost | 10,335 | — | — | — | 10,335 | ||||||||||||||
Fair value | 10,754 | — | — | — | 10,754 | ||||||||||||||
Weighted average percentage of fair value to par value | 103.73 | % | — | % | — | % | — | % | 103.73 | % | |||||||||
Original weighted average credit support | 12.50 | — | — | — | 12.50 | ||||||||||||||
Weighted average credit support | 16.09 | — | — | — | 16.09 | ||||||||||||||
Weighted average collateral delinquency (1) | 0.24 | — | — | — | 0.24 | ||||||||||||||
_______________________
81
(1) Represents loans that are 60 days or more delinquent.
Private-Label MBS and ABS Backed by Home Equity Loans by Year of Securitization - Alt-A At September 30, 2012 (dollars in thousands) | |||||||||||||||||||
Private-label residential MBS - Alt-A | Total | 2007 | 2006 | 2005 | 2004 and prior | ||||||||||||||
Par value by credit rating | |||||||||||||||||||
Triple-A | $ | 11,576 | $ | — | $ | — | $ | 11,576 | $ | — | |||||||||
Double-A | 4,752 | — | — | — | 4,752 | ||||||||||||||
Single-A | 68,993 | — | — | 49,346 | 19,647 | ||||||||||||||
Triple-B | 13,866 | — | — | 7,825 | 6,041 | ||||||||||||||
Below Investment Grade | |||||||||||||||||||
Double-B | 17,308 | — | — | 4,449 | 12,859 | ||||||||||||||
Single-B | 83,049 | 964 | — | 71,182 | 10,903 | ||||||||||||||
Triple-C | 947,126 | 216,730 | 484,698 | 245,698 | — | ||||||||||||||
Double-C | 214,547 | 83,053 | 59,773 | 71,721 | — | ||||||||||||||
Single-C | 88,327 | 9,265 | 37,132 | 41,930 | — | ||||||||||||||
Single-D | 546,643 | 208,685 | 277,635 | 60,323 | — | ||||||||||||||
Total | $ | 1,996,187 | $ | 518,697 | $ | 859,238 | $ | 564,050 | $ | 54,202 | |||||||||
Amortized cost | $ | 1,501,386 | $ | 354,971 | $ | 598,341 | $ | 493,873 | 54,201 | ||||||||||
Gross unrealized losses | (309,098 | ) | (70,187 | ) | (130,626 | ) | (100,859 | ) | (7,426 | ) | |||||||||
Fair value | 1,197,197 | 289,079 | 468,329 | 393,014 | 46,775 | ||||||||||||||
Other-than-temporary impairment for the nine months ended September 30, 2012: | |||||||||||||||||||
Total other-than-temporary impairment losses on held-to-maturity securities | $ | (13,847 | ) | $ | (290 | ) | $ | (8,743 | ) | $ | (4,235 | ) | $ | (579 | ) | ||||
Net amount of impairment losses reclassified to (from) accumulated other comprehensive loss | 8,306 | (156 | ) | 3,712 | 4,171 | 579 | |||||||||||||
Net impairment losses on held-to-maturity securities recognized in income | $ | (5,541 | ) | $ | (446 | ) | $ | (5,031 | ) | $ | (64 | ) | $ | — | |||||
Weighted average percentage of fair value to par value | 59.97 | % | 55.73 | % | 54.51 | % | 69.68 | % | 86.30 | % | |||||||||
Original weighted average credit support | 27.69 | 28.66 | 28.65 | 26.72 | 13.13 | ||||||||||||||
Weighted average credit support | 15.23 | 11.99 | 13.40 | 20.12 | 24.49 | ||||||||||||||
Weighted average collateral delinquency (1) | 36.25 | 42.65 | 40.44 | 25.75 | 17.65 | ||||||||||||||
_______________________
(1) Represents loans that are 60 days or more delinquent.
82
Private-Label MBS and ABS Backed by Home Equity Loans by Year of Securitization - Subprime At September 30, 2012 (dollars in thousands) | ||||
ABS backed by home equity loans – Subprime | 2004 and prior | |||
Par value by credit rating | ||||
Triple-A | $ | 6,702 | ||
Double-A | 5,288 | |||
Single-A | 7,839 | |||
Below Investment Grade | ||||
Single-B | 4,493 | |||
Triple-C | 1,793 | |||
Single-D | 917 | |||
Total | $ | 27,032 | ||
Amortized cost | $ | 26,361 | ||
Gross unrealized losses | (4,593 | ) | ||
Fair value | 21,809 | |||
Other-than-temporary impairment for the nine months ended September 30, 2012: | ||||
Total other-than-temporary impairment losses on held-to-maturity securities | $ | — | ||
Net amount of impairment losses reclassified to (from) accumulated other comprehensive loss | (3 | ) | ||
Net impairment losses on held-to-maturity securities recognized in income | $ | (3 | ) | |
Weighted average percentage of fair value to par value | 80.68 | % | ||
Original weighted average credit support | 10.08 | |||
Weighted average credit support | 35.10 | |||
Weighted average collateral delinquency (1) | 20.03 | |||
_______________________
(1) Represents loans that are 60 days or more delinquent.
Carrying values and fair values in the table below are as of September 30, 2012.
Rating Agency Actions (1) Investments on Negative Watch as of October 31, 2012 (dollars in thousands) | ||||||||||||||||||||||||
Private-Label Residential MBS | ABS Backed by Home Equity Loans | HFA Securities | ||||||||||||||||||||||
Investment Ratings | Carrying Value | Fair Value | Carrying Value | Fair Value | Carrying Value | Fair Value | ||||||||||||||||||
Triple-A | $ | 13,871 | $ | 12,959 | $ | 1,708 | $ | 1,327 | $ | — | $ | — | ||||||||||||
Double-A | 2,528 | 2,310 | 5,288 | 4,132 | 80,275 | 69,606 | ||||||||||||||||||
Single-A | 3,205 | 3,046 | — | — | — | — | ||||||||||||||||||
Double-B | 2,977 | 2,674 | — | — | — | — | ||||||||||||||||||
_______________________
(1) | Represents the lowest rating as of October 31, 2012, available for each security based on the NRSROs we use. |
The following table provides a summary of credit-rating downgrades that have occurred during the period from October 1,
83
2012, through October 31, 2012, for our investments. Carrying values and fair values are as of September 30, 2012.
Rating Agency Actions (1) Ratings Downgrades from October 1, 2012, through October 31, 2012 (dollars in thousands) | |||||||||||
Credit Rating as of | Carrying | Fair | |||||||||
Investment Category | September 30, 2012 | October 31, 2012 | Value | Value | |||||||
Private-label - residential | Double-C | Single-D | $ | 7,514 | $ | 7,983 | |||||
_______________________
(1) | Represents the lowest rating available for each security based on the NRSROs we use. |
The following table provides certain characteristics our private-label MBS that are in a gross unrealized position by collateral
type.
Characteristics of Private-Label MBS in a Gross Unrealized Loss Position As of September 30, 2012 (dollars in thousands) | |||||||||||||||||||||||||||||
September 30, 2012 | October 31, 2012, Private-label MBS ratings based on September 30, 2012, par value | ||||||||||||||||||||||||||||
Par Value | Amortized Cost | Gross Unrealized Losses | Weighted Average Collateral Delinquency Rates | Percent AAA | Percent AAA | Percent Investment Grade | Percent Below Investment Grade | Percent Watch List | |||||||||||||||||||||
Private-label residential MBS backed by: | |||||||||||||||||||||||||||||
Prime first lien | $ | 230,871 | $ | 220,335 | $ | (21,439 | ) | 12.08 | % | 1.0 | % | 1.0 | % | 39.2 | % | 60.8 | % | 2.4 | % | ||||||||||
Alt-A option ARM | 799,224 | 657,160 | (162,136 | ) | 41.08 | — | — | — | 100.0 | — | |||||||||||||||||||
Alt-A other | 1,150,307 | 817,867 | (146,963 | ) | 32.38 | 1.0 | 1.0 | 7.6 | 92.4 | 1.5 | |||||||||||||||||||
Total private-label residential MBS | 2,180,402 | 1,695,362 | (330,538 | ) | 33.42 | 0.6 | 0.6 | 8.2 | 91.8 | 1.0 | |||||||||||||||||||
ABS backed by home equity loans: | |||||||||||||||||||||||||||||
Subprime first lien | 26,107 | 25,711 | (4,593 | ) | 19.78 | 25.7 | 25.7 | 50.3 | 49.7 | 26.9 | |||||||||||||||||||
Total private-label MBS | $ | 2,206,509 | $ | 1,721,073 | $ | (335,131 | ) | 33.26 | % | 0.9 | % | 0.9 | % | 8.7 | % | 91.3 | % | 1.3 | % | ||||||||||
The following table provides the geographic concentrations by state and by metropolitan statistical area of the loans underlying our private-label MBS and ABS as of September 30, 2012, where such concentrations are five percent or greater of all loans underlying these investments.
84
Geographic Concentrations of Loans Underlying our Private-Label MBS and ABS | ||
State concentrations | Percentage of Total Private-Label MBS and ABS | |
California | 39.3 | % |
Florida | 12.6 | |
New York | 5.1 | |
All Other | 43.0 | |
100.0 | % | |
Metropolitan Statistical Area | ||
Los Angeles - Long Beach, CA | 10.1 | % |
Washington, D.C.-MD-VA-WV | 6.0 | |
All Other | 83.9 | |
100.0 | % | |
Since 2008, actual and projected delinquency, foreclosure, and loss rates for prime, subprime, and Alt-A mortgage loans have increased significantly nationwide. While trends have improved in some of these actual measures and their projected assumptions, they remain elevated as of the date of this report. In addition, home prices are severely depressed in many areas and nationwide unemployment rates are high, increasing the likelihood and magnitude of potential losses on troubled and/or foreclosed real estate. The widespread impact of these trends has led to the recognition of significant losses by financial institutions, including commercial banks, investment banks, and financial guaranty providers. Actual and expected credit losses on these securities together with uncertainty as to the degree, direction, and duration of these loss trends has led to the reduction in the market values of securities backed by residential mortgages, and has elevated the potential for additional credit losses due to the other-than-temporary impairment of some of these securities.
The following graph demonstrates how average prices have changed with respect to various asset classes in our MBS portfolio during the 12 months ended September 30, 2012:
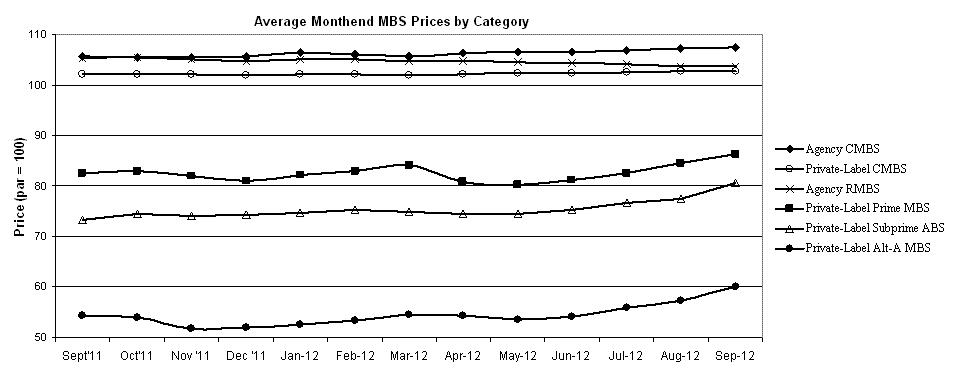
Insured Investments
Certain private-label MBS that we own are insured by monoline insurers, which guarantee the timely payment of principal and interest on such MBS if such payments cannot be satisfied from the cash flows of the underlying mortgage pool. The assessment for other-than-temporary impairment of the MBS protected by such third-party insurance is described in Item 1 — Notes to the Financial Statements — Note 6 — Other-Than-Temporary Impairment.
The following table provides the credit ratings of the third-party insurers.
85
Monoline Insurance and GSE Guarantees of MBS and ABS Backed by Home Equity Loan Investments Credit Ratings and Outlook As of October 31, 2012 | |||||||||||
Moody's | S&P | Fitch | |||||||||
Credit Rating | Outlook / Negative Watch | Credit Rating | Outlook / Negative Watch | Credit Rating | Outlook / Negative Watch | ||||||
Ambac Assurance Corporation (1) | Removed | NA | Removed | NA | Not Rated | Not Rated | |||||
Assured Guaranty Municipal Corp. | Aa3 | Negative Watch | AA- | Stable | Not Rated | Not Rated | |||||
MBIA Insurance Corporation (2) | B3 | Negative Watch | B | Negative | Not Rated | Not Rated | |||||
Syncora Guarantee Inc. (1) | Ca | Positive Watch | Removed | NA | Not Rated | Not Rated | |||||
Financial Guaranty Insurance Company (1) | Not Rated | Not Rated | Not Rated | Not Rated | Not Rated | Not Rated | |||||
Fannie Mae | Aaa | Negative | AA+ | Negative | AAA | Negative | |||||
Freddie Mac | Aaa | Negative | AA+ | Negative | AAA | Negative | |||||
_______________________
(1) | We placed no reliance on these monoline insurers in our models estimating the projected cash flows to determine other-than-temporary impairment. See Item 1 — Notes to the Financial Statements — Note 6 — Other-Than-Temporary Impairment for additional information. |
(2) | MBIA Insurance Corp.'s burnout period ends in December 2012. See Item 1 — Notes to the Financial Statements — Note 6 — Other-Than-Temporary Impairment for additional information. |
The following table shows our private-label MBS and ABS backed by home equity loan investments covered by monoline insurance and related gross unrealized losses.
Par Value of Monoline Insurance Coverage and Related Unrealized Losses of Private-Label MBS and ABS Backed by Home Equity Loan Investments by Year of Securitization At September 30, 2012 (dollars in thousands) | |||||||||||||||||||||||||||||||||||||||
Ambac Assurance Corp (1) | Assured Guaranty Municipal Corp | MBIA Insurance Corp (2) | Syncora Guarantee Inc. (1) | Financial Guaranty Insurance Co. (1) | |||||||||||||||||||||||||||||||||||
Monoline Insurance Coverage | Unrealized Losses | Monoline Insurance Coverage | Unrealized Losses | Monoline Insurance Coverage | Unrealized Losses | Monoline Insurance Coverage | Unrealized Losses | Monoline Insurance Coverage | Unrealized Losses | ||||||||||||||||||||||||||||||
Private-label MBS by Year of Securitization | |||||||||||||||||||||||||||||||||||||||
Alt-A | |||||||||||||||||||||||||||||||||||||||
2007 | $ | 52,739 | $ | (2,083 | ) | $ | — | $ | — | $ | — | $ | — | $ | — | $ | — | $ | — | $ | — | ||||||||||||||||||
2006 | 13,281 | (3,243 | ) | — | — | — | — | — | — | — | — | ||||||||||||||||||||||||||||
2005 | 26,885 | (5,640 | ) | — | — | — | — | — | — | — | — | ||||||||||||||||||||||||||||
2004 and prior | 1,263 | (160 | ) | — | — | — | — | — | — | — | — | ||||||||||||||||||||||||||||
Total Alt-A | 94,168 | (11,126 | ) | — | — | — | — | — | — | — | — | ||||||||||||||||||||||||||||
Subprime | |||||||||||||||||||||||||||||||||||||||
2004 and prior | 1,843 | (32 | ) | 7,022 | (1,536 | ) | 13,891 | (2,222 | ) | 3,408 | (623 | ) | 868 | (180 | ) | ||||||||||||||||||||||||
Total private-label MBS | $ | 96,011 | $ | (11,158 | ) | $ | 7,022 | $ | (1,536 | ) | $ | 13,891 | $ | (2,222 | ) | $ | 3,408 | $ | (623 | ) | $ | 868 | $ | (180 | ) | ||||||||||||||
_______________________
(1) | We placed no reliance on these monoline insurers in our models estimating the projected cash flows to determine other-than-temporary impairment. See Item 1 — Notes to the Financial Statements — Note 6 — Other-Than-Temporary Impairment for additional information. |
(2) | MBIA Insurance Corp.'s burnout period ends in December 2012. See Item 1 — Notes to the Financial Statements — Note |
86
6 — Other-Than-Temporary Impairment for additional information.
Our total investments in HFA securities was $192.0 million as of September 30, 2012. The following table provides the geographic concentrations by state of our HFA investments where such concentrations are five percent or greater of our total HFA investments as of September 30, 2012.
State Concentrations of HFA Securities | |||||||
Carry Value | Percent of Total HFA Investments | ||||||
Massachusetts | $ | 112,655 | 58.7 | % | |||
Rhode Island | 29,910 | 15.6 | |||||
Connecticut | 24,525 | 12.8 | |||||
Maine | 15,000 | 7.8 | |||||
All Other | 9,879 | 5.1 | |||||
$ | 191,969 | 100.0 | % | ||||
Standby Bond-Purchase Agreements. We have entered into standby bond-purchase agreements with one state HFA whereby we, for a fee, agree to purchase and hold the HFA's unremarketed bonds until the designated remarketing agent can find a new investor or the state HFA repurchases the bonds in accordance with a schedule established by the agreement. Each agreement contains termination provisions in the event of a rating downgrade of the subject bond. Standby bond purchase commitments totaled $161.6 million at September 30, 2012, to this HFA. All of the bonds underlying the commitments to this HFA maintain standalone ratings of triple-A from two NRSROs.
Mortgage Loans
As of September 30, 2012, our mortgage loan investment portfolio totaled $3.4 billion, an increase of $322.3 million from the December 31, 2011, balance of $3.1 billion. This increase occurred notwithstanding increasing prepayments on these investments, which could reflect growing interest in MPF as Fannie Mae and Freddie Mac increase their guarantee fees, reducing their competitiveness with MPF.
References to our investments in mortgage loans throughout this report include the 100 percent participation interests in mortgage loans purchased under a participation facility we have with the FHLBank of Chicago. The expiration date of this facility has been extended to December 31, 2013, and may be extended again. As of September 30, 2012, we had $354.7 million in 100 percent participation interests outstanding that had been purchased under this facility. For additional information on this facility, see Item 1 — Business — Mortgage Loan Finance — MPF Loan Participations with the FHLBank of Chicago of the 2011 Annual Report .
Mortgage Loans Credit Risk.
We are subject to credit risk from the mortgage loans in which we invest due to our exposure to the credit risk of the underlying borrowers and the credit risk of the participating financial institutions when the participating financial institutions retain credit-enhancement and/or servicing obligations. For additional information on the credit risks arising from our participation in the MPF program, see Item 7 — Management's Discussion and Analysis of Financial Condition and Results of Operations — Financial Condition — Mortgage Loans — Mortgage Loans Credit Risk in the 2011 Annual Report.
Although our mortgage loan portfolio includes loans throughout the U.S., concentrations of five percent or greater of the outstanding principal balance of our conventional mortgage loan portfolio are shown in the following table:
87
State Concentrations by Outstanding Principal Balance | |||||
Percentage of Total Outstanding Principal Balance of Conventional Mortgage Loans | |||||
September 30, 2012 | December 31, 2011 | ||||
Massachusetts | 38 | % | 35 | % | |
California | 10 | 12 | |||
Maine | 9 | 6 | |||
Connecticut | 8 | 9 | |||
Wisconsin | 7 | 6 | |||
All others | 28 | 32 | |||
Total | 100 | % | 100 | % | |
Although delinquent loans in our portfolio are spread throughout the U.S., delinquent loan concentrations of five percent or greater of the outstanding principal balance of our total conventional mortgage loans delinquent by more than 30 days are shown in the following table:
State Concentrations of Delinquent Conventional Mortgage Loans | |||||
Percentage of Total Outstanding Principal Balance of Delinquent Conventional Mortgage Loans | |||||
September 30, 2012 | December 31, 2011 | ||||
Massachusetts | 27 | % | 24 | % | |
California | 21 | 23 | |||
Connecticut | 8 | 9 | |||
All others | 44 | 44 | |||
Total | 100 | % | 100 | % | |
Allowance for Credit Losses on Mortgage Loans. The allowance for credit losses on mortgage loans was $5.5 million at September 30, 2012, compared with $7.8 million at December 31, 2011. The principal reason for this decline is the continuing improvement in the delinquency rates of our investments in conventional mortgage loans since December 31, 2011. For information on the determination of the allowance at September 30, 2012, see Item 1— Notes to the Financial Statements — Note 9 — Allowance for Credit Losses, and for information on our methodology for estimating the allowance, see Item 7 — Management's Discussion and Analysis of Financial Condition and Results of Operations — Critical Accounting Estimates — Allowance for Loan Losses in the 2011 Annual Report.
We place conventional mortgage loans on nonaccrual when the collection of the contractual principal or interest is 90 days or more past due. Accrued interest on nonaccrual loans is reversed against interest income. We monitor the delinquency levels of the mortgage loan portfolio on a monthly basis. The following table presents our delinquent loans (dollars in thousands).
September 30, 2012 | December 31, 2011 | ||||||
Nonaccrual loans, par value | $ | 50,338 | $ | 54,927 | |||
Total par value past due 90 days or more and still accruing interest (1) | 24,265 | 24,438 | |||||
_______________________
(1) | Represents government mortgage loans. |
Higher-Risk Loans. Our portfolio includes certain higher-risk conventional mortgage loans. These include high loan-to-value ratio mortgage loans and subprime mortgage loans. The higher-risk loans represent a relatively small portion of our conventional mortgage loan portfolio (7.7 percent by outstanding principal balance), but a disproportionately higher portion of the conventional mortgage loan portfolio delinquencies (40.6 percent by outstanding principal balance). Our allowance for loan losses reflects the expected losses associated with these higher-risk loan types. The table below shows the balance of higher-risk conventional mortgage loans and their delinquency rates as of September 30, 2012.
88
Summary of Higher-Risk Conventional Mortgage Loans As of September 30, 2012 (dollars in thousands) | |||||||||||||
High-Risk Loan Type | Total Par Value | Percent Delinquent 30 Days | Percent Delinquent 60 Days | Percent Delinquent 90 Days or More and Nonaccruing | |||||||||
Subprime loans (1) | $ | 181,444 | 8.71 | % | 2.14 | % | 7.35 | % | |||||
High loan-to-value loans (2) | 41,226 | 1.26 | 1.07 | 13.36 | |||||||||
Subprime and high loan-to-value loans (3) | 5,550 | 7.71 | 4.18 | 19.24 | |||||||||
Total high-risk loans | $ | 228,220 | 7.34 | % | 2.00 | % | 8.72 | % | |||||
_______________________
(1) | Subprime loans are loans to borrowers with FICO® credit scores 660 or lower. |
(2) | High loan-to-value loans have an estimated current loan-to-value ratio greater than 100 percent based on movements in property values in the core-based statistical areas where the property securing the loan is located. |
(3) | These loans are subprime and also have a current estimated loan-to-value ratio greater than 100 percent. |
Our portfolio consists solely of fixed-rate conventionally amortizing first-lien mortgage loans. The portfolio does not include adjustable-rate mortgage loans, pay-option adjustable-rate mortgage loans, interest-only mortgage loans, junior lien mortgage loans, or loans with initial teaser rates.
Mortgage Insurance Companies. We are exposed to credit risk from mortgage insurance companies that provide credit enhancement in place of the participating financial institution and for primary mortgage insurance coverage on individual loans. As of September 30, 2012, we were the beneficiary of primary mortgage insurance coverage on $240.6 million of conventional mortgage loans, and we were the beneficiary of supplemental mortgage insurance coverage on mortgage pools with a total unpaid principal balance of $29.0 million. Eight mortgage insurance companies provide all of the coverage under these policies.
As of October 31, 2012, all of these mortgage insurance companies, with the exception of Triad Guaranty Insurance Corporation, which is no longer rated by any of the NRSROs, have a credit rating of triple-B or lower (or equivalent) by at least one NRSRO as presented in the below table. Ordinarily we do not accept primary mortgage insurance from a mortgage insurance company unless that company is rated at least triple B- by S&P at the time of our investment in the loan (although we may accept lower-rated mortgage insurance provided we obtain additional credit enhancement in such form as we deem appropriate and of substance sufficient to mitigate the risks of relying on such lower rated primary mortgage insurance). Given that only two mortgage insurance companies have a credit rating of at least triple B- as of October 31, 2012, we could develop increasing concentrations of exposure to those mortgage insurance companies. We have established and maintain limits on exposure to individual mortgage insurance companies in an effort to mitigate those concentration risks. However, those exposure limits may have, in turn, led to fewer mortgage loan investment opportunities for us.
We have analyzed our potential loss exposure to all of the mortgage insurance companies and do not expect incremental losses based on these exposures at this time. This expectation is based on the credit-enhancement features of our master commitments (exclusive of mortgage insurance), the underwriting characteristics of the loans that back our master commitments, the seasoning of the loans that back these master commitments, and the strong performance of the loans to date. We have monitored the financial condition of these mortgage insurance companies. Further, we required all new supplemental mortgage insurance policies be with companies rated AA- or higher by S&P. However, none of the eight mortgage insurance companies previously approved by us are currently eligible to write new supplemental mortgage insurance policies for loan pools sold to us. We do not currently invest in mortgage loans that rely on supplemental mortgage insurance to be eligible investments.
89
Mortgage Insurance Companies that Provide Mortgage Insurance Coverage (dollars in thousands) | |||||||||||||||||||||||
As of October 31, 2012 | September 30, 2012 | ||||||||||||||||||||||
Mortgage Insurance Company | Mortgage Insurance Company Ratings (S&P/ Moody's/Fitch | Credit Rating Outlook | Balance of Loans with Primary Mortgage Insurance | Primary Mortgage Insurance | Supplemental Mortgage Insurance | Mortgage Insurance Coverage | Percent of Total Mortgage Insurance Coverage | ||||||||||||||||
United Guaranty Residential Insurance Corporation | BBB/Baa1/NR | Stable | $ | 109,003 | $ | 25,655 | $ | — | $ | 25,655 | 46.1 | % | |||||||||||
Genworth Mortgage Insurance Corporation | B/Ba1/NR | Negative | 49,355 | 11,884 | — | 11,884 | 21.3 | ||||||||||||||||
Mortgage Guaranty Insurance Corporation | B-/B2/NR | Negative | 36,692 | 7,982 | — | 7,982 | 14.3 | ||||||||||||||||
PMI Mortgage Insurance Company (1) | R/Caa3/NR | Negative | 14,197 | 2,996 | — | 2,996 | 5.4 | ||||||||||||||||
CMG Mortgage Insurance Company | BBB-/NR/BBB- | Negative | 11,036 | 2,648 | — | 2,648 | 4.8 | ||||||||||||||||
Radian Guaranty Incorporated | B-/Ba3/NR | Negative | 9,122 | 1,730 | — | 1,730 | 3.1 | ||||||||||||||||
Republic Mortgage Insurance Company (2) | R/NR/NR | N/A | 8,559 | 1,683 | 649 | 2,332 | 4.2 | ||||||||||||||||
Triad Guaranty Insurance Corporation | NR/NR/NR | N/A | 2,602 | 459 | — | 459 | 0.8 | ||||||||||||||||
$ | 240,566 | $ | 55,037 | $ | 649 | $ | 55,686 | 100.0 | % | ||||||||||||||
_______________________
(1) | On October 20, 2011, the Arizona Department of Insurance took possession and control of PMI Mortgage Insurance Company and beginning October 24, 2011, PMI Mortgage Insurance Company has been directed to only pay 50 percent of the claim amounts with the remaining claim amounts being deferred until the company is liquidated. |
(2) | On January 19, 2012, the North Carolina Department of Insurance issued an Order of Supervision providing for immediate |
administrative supervision of Republic Mortgage Insurance Co. (RMIC). Under the order, RMIC continues to manage the
business through its employees, and retains its status as a wholly-owned subsidiary of its parent holding company, Old Republic International Corporation. The primary effect is that RMIC may not pay more than 50 percent of any claims allowed under any policy of insurance it has issued. The remaining 50 percent will be deferred and credited to a temporary surplus account on the books of RMIC during an initial period not to exceed one year. Accordingly, all claim payments made on January 19, 2012, and thereafter will be made at the rate of 50 percent.
Deposits
At September 30, 2012, and December 31, 2011, deposits totaled $685.3 million and $654.2 million, respectively.
Term deposits issued in amounts of $100,000 or greater at both September 30, 2012, and December 31, 2011, amounted to $20.0 million, with a maturity date in 2014, and a weighted average rate of 4.71 percent.
Derivative Instruments
All derivative instruments are recorded on the statement of condition at fair value, and are classified as assets or liabilities according to the net fair value of derivatives aggregated by counterparty. Derivative assets' net fair value, net of cash collateral and accrued interest, totaled $529,000 and $16.5 million as of September 30, 2012, and December 31, 2011, respectively. Derivative liabilities' net fair value, net of cash collateral and accrued interest, totaled $949.7 million and $905.3 million as of September 30, 2012, and December 31, 2011, respectively.
The following table presents a summary of the notional amounts and estimated fair values of our outstanding derivative instruments, excluding accrued interest, and related hedged item by product and type of accounting treatment as of September 30, 2012, and December 31, 2011. The notional amount is a factor in determining periodic interest payments or cash flows received and paid. Accordingly, the notional amount does not represent actual amounts exchanged or our overall exposure to credit and market risk. The hedge designation “fair value” represents the hedge classification for transactions that
90
qualify for hedge-accounting treatment and hedge changes in fair value attributable to changes in the designated benchmark interest rate, which is LIBOR. The hedge designation "cash flow" represents the hedge classification for transactions that qualify for hedge-accounting treatment and hedge the exposure to variability in expected future cash flows. The hedge designation “economic” represents hedge strategies that do not qualify for hedge accounting, but are acceptable hedging strategies under our risk-management policy.
Hedged Item and Hedge-Accounting Treatment (dollars in thousands) | ||||||||||||||||||||
September 30, 2012 | December 31, 2011 | |||||||||||||||||||
Hedged Item | Derivative | Designation | Notional Amount | Fair Value | Notional Amount | Fair Value | ||||||||||||||
Advances (1) | Swaps | Fair value | $ | 6,327,340 | $ | (546,001 | ) | $ | 7,850,557 | $ | (603,754 | ) | ||||||||
Swaps | Economic | 140,250 | (1,083 | ) | 10,750 | (282 | ) | |||||||||||||
Total associated with advances | 6,467,590 | (547,084 | ) | 7,861,307 | (604,036 | ) | ||||||||||||||
Available-for-sale securities | Swaps | Fair value | 711,915 | (384,968 | ) | 711,915 | (379,375 | ) | ||||||||||||
Caps and floors | Economic | 300,000 | 42 | 300,000 | 786 | |||||||||||||||
Total associated with available-for-sale securities | 1,011,915 | (384,926 | ) | 1,011,915 | (378,589 | ) | ||||||||||||||
Trading securities | Swaps | Economic | 225,000 | (34,458 | ) | 225,000 | (29,503 | ) | ||||||||||||
COs | Swaps | Fair value | 7,781,145 | 87,366 | 10,743,550 | 196,640 | ||||||||||||||
Swaps | Economic | 800,000 | 372 | — | — | |||||||||||||||
Forward starting swaps | Cash Flow | 1,250,000 | (64,855 | ) | 700,000 | (31,981 | ) | |||||||||||||
Total associated with COs | 9,831,145 | 22,883 | 11,443,550 | 164,659 | ||||||||||||||||
Deposits | Swaps | Fair value | 20,000 | 3,079 | 20,000 | 3,986 | ||||||||||||||
Total | 17,555,650 | (940,506 | ) | 20,561,772 | (843,483 | ) | ||||||||||||||
Mortgage delivery commitments | 41,506 | (43 | ) | 17,734 | 128 | |||||||||||||||
Total derivatives | $ | 17,597,156 | (940,549 | ) | $ | 20,579,506 | (843,355 | ) | ||||||||||||
Accrued interest | (8,327 | ) | (25,187 | ) | ||||||||||||||||
Cash collateral | (330 | ) | (20,241 | ) | ||||||||||||||||
Net derivatives | $ | (949,206 | ) | $ | (888,783 | ) | ||||||||||||||
Derivative asset | $ | 529 | $ | 16,521 | ||||||||||||||||
Derivative liability | (949,735 | ) | (905,304 | ) | ||||||||||||||||
Net derivatives | $ | (949,206 | ) | $ | (888,783 | ) | ||||||||||||||
_______________________
(1) Embedded advance derivatives separated from the the host contract with a notional amount of $118.5 million and a market value of $1.0 million are not included in the table.
The following tables provide a summary of our hedging relationships for fair-value hedges of advances and COs that qualify for hedge accounting by year of contractual maturity. Interest accruals on interest-rate-exchange agreements in qualifying hedge relationships are recorded as interest income on advances and interest expense on COs in the statement of operations. The notional amount of derivatives in qualifying hedge relationships of advances and COs totals $14.1 billion, representing 80.2 percent of all derivatives outstanding as of September 30, 2012. Economic hedges and cash-flow hedges are not included within the two tables below.
91
Fair-Value Hedge Relationships of Advances By Year of Contractual Maturity As of September 30, 2012 (dollars in thousands) | |||||||||||||||||||||||||||
Weighted-Average Yield (3) | |||||||||||||||||||||||||||
Derivatives | Advances(1) | Derivatives | |||||||||||||||||||||||||
Maturity | Notional | Fair Value | Hedged Amount | Fair-Value Adjustment(2) | Advances | Receive Floating Rate | Pay Fixed Rate | Net Receive Result | |||||||||||||||||||
Due in one year or less | $ | 902,610 | $ | (13,606 | ) | $ | 902,610 | $ | 13,562 | 3.61 | % | 0.43 | % | 3.43 | % | 0.61 | % | ||||||||||
Due after one year through two years | 833,500 | (34,348 | ) | 833,500 | 34,330 | 3.22 | 0.42 | 3.01 | 0.63 | ||||||||||||||||||
Due after two years through three years | 785,515 | (45,316 | ) | 785,515 | 45,270 | 3.06 | 0.44 | 2.73 | 0.77 | ||||||||||||||||||
Due after three years through four years | 654,695 | (56,753 | ) | 654,695 | 56,559 | 3.19 | 0.41 | 2.93 | 0.67 | ||||||||||||||||||
Due after four years through five years | 1,871,130 | (253,373 | ) | 1,871,130 | 251,201 | 3.77 | 0.42 | 3.59 | 0.60 | ||||||||||||||||||
Thereafter | 1,279,890 | (142,605 | ) | 1,279,890 | 142,376 | 3.19 | 0.43 | 2.88 | 0.74 | ||||||||||||||||||
Total | $ | 6,327,340 | $ | (546,001 | ) | $ | 6,327,340 | $ | 543,298 | 3.41 | % | 0.42 | % | 3.17 | % | 0.66 | % | ||||||||||
_______________________
(1) | Included in the advances hedged amount are $3.6 billion of putable advances, which would accelerate the termination date of the derivative and the hedged item if the put option is exercised. |
(2) | The fair-value adjustment of hedged advances represents the amounts recorded for changes in the fair value attributable to changes in the designated benchmark interest rate, LIBOR. |
(3) | The yield for floating-rate instruments and the floating-rate leg of interest-rate swaps is the coupon rate in effect as of September 30, 2012. |
Fair-Value Hedge Relationships of Consolidated Obligations By Year of Contractual Maturity As of September 30, 2012 (dollars in thousands) | |||||||||||||||||||||||||||
Weighted-Average Yield (3) | |||||||||||||||||||||||||||
Derivatives | CO Bonds (1) | Derivatives | |||||||||||||||||||||||||
Year of Maturity | Notional | Fair Value | Hedged Amount | Fair-Value Adjustment(2) | CO Bonds | Receive Fixed Rate | Pay Floating Rate | Net Pay Result | |||||||||||||||||||
Due in one year or less | $ | 3,589,950 | $ | 27,999 | $ | 3,589,950 | $ | (27,880 | ) | 1.59 | % | 1.59 | % | 0.32 | % | 0.32 | % | ||||||||||
Due after one year through two years | 2,143,500 | 22,572 | 2,143,500 | (22,572 | ) | 1.03 | 1.11 | 0.32 | 0.24 | ||||||||||||||||||
Due after two years through three years | 647,695 | 8,460 | 647,695 | (8,463 | ) | 0.93 | 0.96 | 0.32 | 0.29 | ||||||||||||||||||
Due after three years through four years | 690,000 | 23,822 | 690,000 | (23,830 | ) | 1.51 | 1.51 | 0.31 | 0.31 | ||||||||||||||||||
Due after four years through five years | 195,000 | 2,008 | 195,000 | (2,078 | ) | 0.93 | 0.93 | 0.26 | 0.26 | ||||||||||||||||||
Thereafter | 515,000 | 2,505 | 515,000 | (2,575 | ) | 1.39 | 1.39 | 0.13 | 0.13 | ||||||||||||||||||
Total | $ | 7,781,145 | $ | 87,366 | $ | 7,781,145 | $ | (87,398 | ) | 1.34 | % | 1.37 | % | 0.30 | % | 0.27 | % | ||||||||||
_______________________
(1) | Included in the CO Bonds hedged amount are $625.0 million of callable CO Bonds, which would accelerate the termination date of the derivative and the hedged item if the call option is exercised. |
(2) | The fair-value adjustment of hedged CO bonds represents the amounts recorded for changes in the fair value attributable to changes in the designated benchmark interest rate, LIBOR. |
(3) | The yield for floating-rate instruments and the floating-rate leg of interest-rate swaps is the coupon rate in effect as of September 30, 2012. |
We engage in derivatives directly with affiliates of certain of our members that act as derivatives dealers to us. These derivatives are entered into for our own risk-management purposes and are not related to requests from our members to enter into such contracts. See Item 1 — Notes to the Financial Statements — Note 19 — Transactions with Related Parties for outstanding derivatives with affiliates of members.
For the period ended September 30, 2012, we continue use the LIBOR yield curve to discount cash flows on both collateralized and non-collateralized interest-rate-exchange agreements, as further detailed in Note 17 — Fair Values — Derivative Assets/Liabilities — Interest Rate-Exchange Agreements. The LIBOR yield curve is also used to discount cash flows on our hedged assets or liabilities designated in fair value hedging relationships where the hedged risk is changes in fair value attributable to
92
changes in the designated benchmark interest rate, LIBOR. We are aware that certain market participants have begun using the overnight index swap (OIS) yield curve to discount cash flows on collateralized interest rate-exchange agreements. Each period we evaluate market data points to determine the appropriate curve with which to discount cash flows on our collateralized and non-collateralized interest-rate-exchange agreements. As noted above, we concluded that the LIBOR yield curve was still the appropriate curve for discounting at September 30, 2012. Should we determine at some point in the future that the OIS curve is a more appropriate curve, we would use OIS to discount cash flows on collateralized interest rate-exchange agreements while continuing to use the LIBOR yield curve to discount cash flows on associated hedged assets or liabilities in fair value hedging relationships. This could result in increased hedge ineffectiveness that in turn could result in the loss of hedge accounting for certain hedge relationships. Loss of hedge accounting for those hedge relationships would lead to increased net income volatility, which could be material. However, we do not yet know how using OIS to discount the cash flows on our collateralized interest rate-exchange agreements would impact our financial condition and/or results of operations.
Derivative Instruments Credit Risk. We are subject to credit risk on derivative instruments. This risk arises from the risk of counterparty default on the derivative. The amount of loss created by default is the replacement cost of the defaulted contract, net of any collateral held by us or pledged by us to counterparties (unsecured derivatives exposure). We currently receive only cash collateral from counterparties with whom we are in a current positive fair-value position (i.e, we are in the money). The resulting net exposure at fair value is reflected in the derivative instruments table below. We presently pledge only securities collateral to counterparties with whom we are in a current negative fair-value position (i.e, we are out of the money). From time to time, due to timing differences or derivatives valuation differences, and the contractual haircuts applied, we pledge to counterparties securities collateral whose fair value exceeds the current negative fair-value positions with them. The table below details our counterparty credit exposure as of September 30, 2012.
Derivatives Counterparty Credit Exposure (dollars in thousands) | ||||||||||||||||||||
Credit Rating (1) | Notional Amount | Net Derivatives Fair Value Before Collateral | Cash Collateral Pledged From Counterparty | Non-cash Collateral Pledged To Counterparty | Net Credit Exposure to Counterparties | |||||||||||||||
Asset positions with credit exposure: | ||||||||||||||||||||
Double-A | $ | 25,000 | $ | 50 | $ | — | $ | — | $ | 50 | ||||||||||
Single-A | 331,500 | 724 | (330 | ) | — | 394 | ||||||||||||||
Liability positions with credit exposure: | ||||||||||||||||||||
Single-A | 6,635,835 | (606,594 | ) | — | 623,084 | 16,490 | ||||||||||||||
Total derivative positions with non-member counterparties to which we had credit exposure | 6,992,335 | (605,820 | ) | (330 | ) | 623,084 | 16,934 | |||||||||||||
Mortgage delivery commitments (2) | 41,506 | 85 | — | — | 85 | |||||||||||||||
Total | $ | 7,033,841 | $ | (605,735 | ) | $ | (330 | ) | $ | 623,084 | $ | 17,019 | ||||||||
Derivative positions without credit exposure: | ||||||||||||||||||||
Double-A | $ | 25,000 | ||||||||||||||||||
Single-A | 7,136,325 | |||||||||||||||||||
Triple-B | 3,401,990 | |||||||||||||||||||
Total derivative positions without credit exposure | $ | 10,563,315 | ||||||||||||||||||
_______________________
93
(1) | Ratings are obtained from Moody's, Fitch, and S&P. If there is a split rating, the lowest rating is used. In the case where the obligations are unconditionally and irrevocably guaranteed, the rating of the guarantor is used. |
(2) | Total fair-value exposures related to commitments to invest in mortgage loans are offset by certain pair-off fees. Commitments to invest in mortgage loans are reflected as derivative instruments. We do not collateralize these commitments. However, should the participating financial institution fail to deliver the mortgage loans as agreed, the participating financial institution is charged a fee to compensate us for the nonperformance. |
We note that our derivatives instruments could require us to deliver additional collateral to certain of our counterparties if our credit rating is downgraded by an NRSRO, which could increase our exposure to loss in the event of a default by a counterparty to which we were the net creditor at the time of any such default, as further detailed in Item 1 — Notes to the Financial Statements — Note 10 — Derivatives and Hedging Activities. For information on how we mitigate the credit risk from unsecured credit exposures under our derivatives instruments, see Item 7 — Management's Discussion and Analysis of Financial Condition and Results of Operations — Financial Condition — Derivative Instruments Credit Risk in the 2011 Annual Report.
We note that during the quarter ended September 30, 2012, we had two Eurozone derivatives counterparties: one domiciled in France and one domiciled in Germany, each of which is rated single-A or higher by all three of the major NRSROs.
We continue to use the same safeguards and approaches to these counterparties to protect against unanticipated exposures arising from possible contagion from the Eurozone financial crisis that are discussed under Item 7 — Management's Discussion and Analysis of Financial Condition and Results of Operations — Financial Market Conditions — European Sovereign Debt Crisis in the 2011 Annual Report. We had $6.0 million in unsecured derivatives exposure to these Eurozone financial institutions on September 30, 2012. Our maximum unsecured derivatives exposure to any Eurozone counterparty was $23.9 million during the quarter ended September 30, 2012.
The following counterparties accounted for more than 10 percent of the total notional amount of interest-rate-exchange agreements outstanding (dollars in thousands):
September 30, 2012 | |||||||||||
Counterparty | Notional Amount Outstanding | Percent of Total Notional Outstanding | Fair Value | ||||||||
Deutsche Bank AG | $ | 2,908,965 | 16.6 | % | $ | (408,733 | ) | ||||
Barclays Bank PLC | 2,203,795 | 12.6 | (70,059 | ) | |||||||
JP Morgan Chase Bank | 1,951,650 | 11.1 | (100,150 | ) | |||||||
Citigroup Financial Products, Inc. | 1,843,840 | 10.5 | (73,133 | ) | |||||||
UBS AG | 1,789,775 | 10.2 | (24,963 | ) | |||||||
Goldman Sachs Capital Markets, LP | 1,775,220 | 10.1 | (97,710 | ) | |||||||
December 31, 2011 | |||||||||||
Counterparty | Notional Amount Outstanding | Percent of Total Notional Outstanding | Fair Value | ||||||||
Barclays Bank PLC | $ | 3,085,095 | 15.0 | % | $ | (66,457 | ) | ||||
Deutsche Bank AG | 2,957,965 | 14.4 | (407,931 | ) | |||||||
Citigroup Financial Products, Inc. | 2,749,040 | 13.4 | (73,395 | ) | |||||||
Morgan Stanley Capital Services, Inc. | 2,414,150 | 11.7 | (115,873 | ) | |||||||
Goldman Sachs Bank USA | 2,286,725 | 11.1 | (78,858 | ) | |||||||
We may deposit funds with these counterparties and their affiliates for short-term money-market investments, including overnight federal funds, term federal funds, and interest-bearing certificates of deposit. We also engage in short-term secured reverse repurchase agreements with affiliates of these counterparties. All of these counterparties affiliates buy, sell, and distribute our COs.
LIQUIDITY AND CAPITAL RESOURCES
Our financial strategies are designed to enable us to expand and contract our assets, liabilities, and capital in response to changes in membership composition and member credit needs. Our primary source of liquidity is our access to the capital
94
markets through CO issuance, which is described in Item 1 — Business — Consolidated Obligations in the 2011 Annual Report.
In September 2012, the Office of Finance revised its methodology for the allocation of the proceeds from the issuance of COs when COs cannot be issued in sufficient amounts to satisfy all FHLBank demand for funding during periods of financial distress and when its existing allocation processes are deemed insufficient. In general, this methodology provides that the proceeds in such circumstances will be allocated among the FHLBanks based on relative FHLBank total regulatory capital with FHLBanks with greater total regulatory capital in absolute terms receiving greater allocations of issuance proceeds. The Office of Finance will use this method in such periods unless it determines that there is an overwhelming reason to adopt a different allocation method. As is the case during any instance of a disruption in our ability to access the capital market, market conditions or this allocation could adversely impact our ability to finance our operations, which could adversely impact our financial condition and results of operations.
Outstanding COs and the condition of the market for COs are discussed below under — External Sources of Liquidity. Our equity capital resources are governed by our capital plan, certain portions of which are described under — Capital below as well as by applicable legal and regulatory requirements.
Liquidity
Internal Sources of Liquidity
We maintain structural liquidity to ensure we meet our day-to-day business needs and our contractual obligations. We define structural liquidity as the difference between projected sources and uses of funds (projected net cash flow) adjusted to include certain assumed contingent, noncontractual obligations or behavioral assumptions (cumulative contingent obligations). Cumulative contingent obligations include the assumption that maturing advances are renewed, member overnight deposits are withdrawn at a rate of 50 percent per day and commitments (MPF and other commitments) are taken down at a conservatively projected pace. We define available liquidity as the sources of funds available to us through our normal access to the capital markets, subject to leverage, credit line capacity, and collateral constraints. Our risk-management policy requires us to maintain structural liquidity each day so that any excess of uses over sources is covered by available liquidity for a four-week forecast period and 50 percent of the excess of uses over sources is covered by available liquidity over eight- and 12-week forecast periods. In addition to these minimum requirements, management measures structural liquidity over a three-month forecast period. If the excess of uses over sources is not fully covered by available liquidity over a two-month or three-month forecast period, a management action trigger is breached and senior management is immediately notified so that a decision can be made as to whether immediate remedial action is necessary.
The following table shows our structural liquidity as of September 30, 2012.
Structural Liquidity As of September 30, 2012 (dollars in thousands) | |||||||||||
1 Month | 2 Month | 3 Months | |||||||||
Projected net cash flow (1) | $ | 2,486,297 | $ | (3,517,183 | ) | $ | (4,144,642 | ) | |||
Less: Cumulative contingent obligations | (4,537,239 | ) | (6,193,958 | ) | (7,414,920 | ) | |||||
Equals: Net structural liquidity need | (2,050,942 | ) | (9,711,141 | ) | (11,559,562 | ) | |||||
Available borrowing capacity (2) | $ | 40,402,058 | $ | 48,006,473 | $ | 49,930,675 | |||||
Ratio of available borrowing capacity to net structural liquidity need | 19.70 | 4.94 | 4.32 | ||||||||
Required ratio | 1.00 | 0.50 | 0.50 | ||||||||
Management action trigger | — | 1.00 | 1.00 | ||||||||
_______________________
(1) | Projected net cash flow equals projected sources of funds less projected uses of funds based on contractual maturities or expected option exercise periods, as applicable. |
(2) | Available borrowing capacity is the CO issuance capacity based on achieving leverage up to our internal minimum capital requirement. For information on this internal minimum capital requirement, see — Internal Capital Practices and Policies — Internal Minimum Capital Requirements. |
95
Finance Agency regulations require us to hold contingency liquidity in an amount sufficient to enable us to cover our liquidity requirements for a minimum of five business days without access to the CO debt markets. We complied with this requirement at all times during the quarter ending September 30, 2012. As of September 30, 2012, and December 31, 2011, we held a surplus of $10.5 billion and $12.8 billion, respectively, of contingency liquidity for the following five days, exclusive of access to the proceeds of CO debt issuance. The following table demonstrates our contingency liquidity as of September 30, 2012.
Contingency Liquidity As of September 30, 2012 (dollars in thousands) | |||
Cumulative Fifth Business Day | |||
Projected net cash flow (1) | $ | (1,748,144 | ) |
Contingency borrowing capacity (exclusive of CO issuances) | 12,252,191 | ||
Net contingency borrowing capacity | $ | 10,504,047 | |
_______________________
(1) | Projected net cash flow equals projected sources of funds less projected uses of funds based on contractual maturities or expected option exercise periods, as applicable. |
In addition, certain Finance Agency guidance requires us to maintain sufficient liquidity, through short-term investments, in an amount at least equal to our anticipated cash outflows under two different scenarios. One scenario assumes that we cannot borrow funds from the capital markets for a period of 15 days and that during that time members do not renew any maturing, prepaid, and put or called advances. The second scenario assumes that we cannot borrow funds from the capital markets for five days and that during that period we will renew maturing and called advances for all members except very large, highly rated members. We were in compliance with these liquidity requirements at all times during the three months ended September 30, 2012.
Further, we are sensitive to maintaining an appropriate funding balance between our assets and liabilities and have an established policy that limits the potential gap between assets inclusive of projected prepayments, funded by liabilities, inclusive of projected calls, maturing in less than one year. The established policy limits this imbalance to a gap of 20 percent of total assets with a management action trigger should this gap exceed 10 percent of total assets. We maintained compliance with this requirement at all times during the three months ended September 30, 2012. During the three months ended September 30, 2012, this gap averaged 5.0 percent (maximum level 6.1 percent and minimum level 4.0 percent). As of September 30, 2012, this gap was 4.8 percent, compared with 9.2 percent at December 31, 2011.
External Sources of Liquidity
FHLBank P&I Funding Contingency Plan Agreement
We have a source of emergency external liquidity through the FHLBank P&I Funding Contingency Plan Agreement. Under the terms of that agreement, in the event we do not fund our principal and interest payments under a CO by deadlines established in the agreement, the other FHLBanks will be obligated to fund any shortfall to the extent that any of the other FHLBanks have a net positive settlement balance (that is, the amount by which end-of-day proceeds received by such FHLBank from the sale of COs on that day exceeds payments by such FHLBank on COs on the same day) in its account with the Office of Finance on the day the shortfall occurs. We would then be required to repay the funding FHLBanks. Neither we nor any of the other FHLBanks have ever drawn upon this agreement.
Debt Financing — Consolidated Obligations
At September 30, 2012, and December 31, 2011, outstanding COs, including both CO bonds and CO discount notes, totaled $40.2 billion and $44.5 billion, respectively.
CO bonds outstanding for which we are primarily liable at September 30, 2012, and December 31, 2011, include issued callable bonds totaling $1.7 billion and $3.0 billion, respectively.
CO discount notes are also a significant funding source for us. CO discount notes are short-term instruments with maturities ranging from overnight to one year. We use CO discount notes primarily to fund short-term advances and investments and
96
longer-term advances and investments with short repricing intervals. CO discount notes comprised 29.8 percent and 32.9 percent of the outstanding COs for which we are primarily liable at September 30, 2012, and December 31, 2011, respectively, but accounted for 92.7 percent and 97.5 percent of the proceeds from the issuance of such COs during the nine months ended September 30, 2012 and 2011, respectively, due, in particular, to our frequent overnight CO discount note issuances.
See Item 1 — Notes to the Financial Statements — Note 12 — Consolidated Obligations for additional information on the COs for which we are primarily liable.
Financial Conditions for Consolidated Obligations
We have experienced relatively favorable CO issuance costs and good market access during the period covered by this report. Financial markets were relatively calmer than during the preceding two quarters as uncertainties about European sovereignties and financial institutions abated due, in part, to actions by the European Central Bank to provide liquidity. The U.S. economy grew modestly during the nine months ended September 30, 2012, and employment growth was generally stronger throughout this period than it had been throughout the second half of 2011.
We continue to operate in a prolonged, historically low-interest rate environment as discussed under — Executive Summary — Low-Interest Rate Environment and U.S. Fiscal Policy. Overall, we have experienced relatively low CO issuance costs during the period covered by this report, reflecting the low-interest rate environment together with a flight to quality due to the sovereign debt crisis in Europe, though easing pressures in Europe caused a slight increase in our relative cost of funding. We have experienced good market demand for all tenors of COs with the strongest demand for short-term COs, and have had no difficulty issuing debt in the amounts and structures required to meet our funding and risk-management needs. Throughout the nine months ended September 30, 2012, COs were issued at yields that were generally at or below equivalent-maturity LIBOR swap yields for debt maturing in less than five years, while longer term issues bore funding costs that were typically higher than equivalent maturity LIBOR swap yields. We continue to experience similar pricing into the fourth quarter of 2012. Among the factors that could further shape demand for COs in the fourth quarter, we note the fiscal cliff and Moody's warning of a potential downgrade of the U.S. federal government, as discussed under — Low-Interest Rate Environment and U.S. Fiscal Policy. We further note that the NRSROs have historically indicated that FHLBank credit ratings, including credit ratings for COs, are constrained by the rating of the U.S. federal government. Accordingly, a Moody's downgrade of the U.S. federal government could result in a downgrade of the FHLBanks and COs. For a discussion of how an NRSRO downgrade could impact us, see the 2011 Annual Report — Item 1A — Risk Factors — Our funding costs and/or access to the capital markets and demand for certain of our products could be adversely impacted by S&P's downgrade of the U.S. government's credit ratings and/or any further downgrade of the U.S. government's credit ratings.
Capital
Our total GAAP capital decreased $22.5 million to $3.5 billion at September 30, 2012. The decrease was attributable to our partial excess capital stock repurchase of $237.4 million in March 2012, offset by a net reduction of $29.7 million in accumulated other comprehensive loss, a $140.1 million increase in retained earnings, and the purchase of $46.1 million of capital stock by members during the nine months ended September 30, 2012.
The FHLBank Act and Finance Agency regulations specify that each FHLBank is required to satisfy certain minimum regulatory capital requirements. We were in compliance with these requirements at September 30, 2012, as discussed in Item 1 — Notes to the Financial Statements — Note 14 — Capital.
Our ability to expand in response to member-credit needs is based primarily on the capital-stock requirements for advances. Members without excess stock are required to increase their capital-stock investment as their outstanding advances increase, as described in Item 1 — Business — Capital Resources in the 2011 Annual Report. As discussed in that Item, we may repurchase excess stock in our sole discretion, although we note our continuing moratorium on repurchases of excess stock other than in limited, former member-related instances of insolvency. Although we conducted a partial repurchase of excess stock on March 9, 2012, there are no plans to conduct another excess stock repurchase in 2012. Further, on April 26, 2012, our board of directors adopted a resolution that it will not conduct excess stock repurchases other than in limited, former member-related instances of insolvency without obtaining the Finance Agency's nonobjection, which we do not expect to pursue again in 2012. We will consider whether and how to conduct other repurchases of excess stock as part of our 2013 business planning process.
At September 30, 2012, and December 31, 2011, excess stock totaled $2.0 billion and $2.1 billion, respectively, as set forth in the following table (dollars in thousands):
97
Membership Stock Investment Requirement | Activity-Based Stock Requirement | Total Stock Investment Requirement (1) | Outstanding Class B Capital Stock (2) | Excess Class B Capital Stock | |||||||||||||||
September 30, 2012 | $ | 639,941 | $ | 1,039,539 | $ | 1,679,503 | $ | 3,648,879 | $ | 1,969,376 | |||||||||
December 31, 2011 | 623,793 | 1,104,877 | 1,728,692 | 3,852,777 | 2,124,085 | ||||||||||||||
_______________________
(1) | Total stock-investment requirement is rounded up to the nearest $100 on an individual member basis. |
(2) | Class B capital stock outstanding includes mandatorily redeemable capital stock. |
We redeem our capital stock in accordance with our capital plan and applicable law. Capital stock can become subject to redemption based on a member's request for the redemption of its excess stock, upon termination of membership or in such other cases as are set forth in our capital plan and subject to the limitations therein. Our only class of capital stock outstanding is Class B stock. Class B stock is subject to a five-year stock redemption period. For additional information on the redemption of our capital stock, see Item 1 — Business — Capital Resources — Redemption of Excess Stock in the 2011 Annual Report and Item 1 — Business — Capital Resources — Mandatorily Redeemable Capital Stock in the 2011 Annual Report.
Capital stock subject to a stock redemption period is reclassified to mandatorily redeemable capital stock in the liability section of the statement of condition. Mandatorily redeemable capital stock totaled $215.9 million and $227.4 million at September 30, 2012, and December 31, 2011, respectively.
The following table sets forth the amount of mandatorily redeemable capital stock by year of expiry of redemption period at September 30, 2012, and December 31, 2011 (dollars in thousands).
Expiry of Redemption Period | September 30, 2012 | December 31, 2011 | ||||||
Due in one year or less | $ | 80,161 | $ | — | ||||
Due after one year through two years | 98 | 86,598 | ||||||
Due after two years through three years | — | 10 | ||||||
Due after three years through four years | 134,590 | — | ||||||
Due after four years through five years | 1,014 | 140,821 | ||||||
Total | $ | 215,863 | $ | 227,429 | ||||
Capital Rule
The Finance Agency's regulation on FHLBank capital classification and critical capital levels (the Capital Rule), among other things, establishes criteria for four capital classifications and corrective action requirements for FHLBanks that are classified in any classification other than adequately capitalized. The Capital Rule requires the Director of the Finance Agency to determine on no less than a quarterly basis the capital classification of each FHLBank. For additional information on the Capital Rule, see Item 7 — Management's Discussion and Analysis of Financial Condition and Results of Operations — Liquidity and Capital Resources — Capital — Capital Rule in the 2011 Annual Report
By letter dated September 26, 2012, the Acting Director of the Finance Agency notified us that, based on June 30, 2012, financial information, we met the definition of adequately capitalized under the Capital Rule. The Acting Director of the Finance Agency has not yet notified us of our capital classification based on September 30, 2012, financial information.
Internal Capital Practices and Policies
We also take steps as we believe prudent beyond legal or regulatory requirements in an effort to protect our capital, reflected in our capital ratio targets, internal minimum capital requirement in excess of regulatory requirements, and retained earnings target.
Targeted Capital Ratio Operating Range
We target an operating range of 4.0 percent to 7.5 percent for our capital ratio, a range adopted in conjunction with our capital preservation measures. Our capital ratio was 9.2 percent at September 30, 2012, a ratio in excess of the targeted operating range. This results principally from our limited repurchases of excess stock accompanied with a significant decline in
98
advances balances since 2008, as discussed under — Executive Summary — Advances Balances.
Internal Minimum Capital Requirement
To provide further protection for our capital base, we maintain an internal minimum capital requirement whereby the amount of paid-in capital stock and retained earnings must exceed the sum of our regulatory capital requirement plus our retained earnings target. As of September 30, 2012, this internal minimum capital requirement equaled $2.7 billion, which was satisfied by our actual regulatory capital of $4.2 billion.
Retained Earnings Target
Our retained earnings target is $875.0 million, a target selected by our board of directors on December 16, 2011. For information on how we select and adjust our retained earnings target, including our response to Finance Agency regulations, orders, or guidance, see Item 7 — Management's Discussion and Analysis of Financial Condition and Results of Operations — Internal Capital Practices and Policies — Retained Earnings Target in the 2011 Annual Report.
At September 30, 2012, we had total retained earnings of $538.2 million, consisting of $484.5 million in unrestricted retained earnings and $53.7 million in restricted retained earnings. For information on our restricted retained earnings contribution requirement, see Item 1 — Notes to the Financial Statements — Note 14 — Capital. Amounts in our restricted retained earnings account are not available to pay dividends.
Dividend Limitations
On April 26, 2012, our board of directors adopted a resolution that it would not declare dividends in excess of 20 percent of quarterly net income for the quarter on which the dividend is based for the remainder of 2012 without the Finance Agency's nonobjection. Additionally, on that same day, the board adopted a revision to our retained earnings policy that now provides that when our retained earnings target exceeds the level of our retained earnings, the quarterly dividend payout cannot exceed 40 percent of our earnings for the quarter. This revised policy replaces the prior policy that had limited the quarterly dividend payout to 50 percent of our earnings for the quarter in such instances. For additional information on dividend limitations, see Item 5 — Market for Registrant's Common Equity, Related Stockholder Matters and Issuer Purchases of Equity Securities in the 2011 Annual Report.
Off-Balance-Sheet Arrangements and Aggregate Contractual Obligations
Our significant off-balance-sheet arrangements consist of the following:
• | commitments that obligate us for additional advances; |
• | standby letters of credit; |
• | commitments for unused lines-of-credit advances; |
• | standby bond-purchase agreements with state housing authorities; and |
• | unsettled COs. |
Off-balance-sheet arrangements are more fully discussed in Item 1 — Notes to the Financial Statements — Note 18 — Commitments and Contingencies.
Through the second quarter of 2011, we were required to pay 20 percent of our net earnings (after the AHP assessment) to REFCorp to support payment of part of the interest on bonds issued by REFCorp. Additionally, the FHLBanks must annually set aside for the AHP the greater of an aggregate of $100 million or 10 percent of the current year's income before charges for AHP and interest expense on mandatorily redeemable capital stock (but after expenses for REFCorp). Based on our net income of $153.6 million for the nine months ended September 30, 2012, our AHP assessment was $17.2 million. See Item 1 — Business — Assessments in the 2011 Annual Report for additional information regarding REFCorp and AHP.
CRITICAL ACCOUNTING ESTIMATES
The preparation of financial statements in accordance with GAAP requires management to make a number of judgments, estimates, and assumptions that affect the reported amounts of assets and liabilities, the disclosure of contingent assets and liabilities (if applicable), and the reported amounts of income and expenses during the reported periods. Although management believes these judgments, estimates, and assumptions to be reasonably accurate, actual results may differ.
99
We have identified five accounting estimates that we believe are critical because they require us to make subjective or complex judgments about matters that are inherently uncertain, and because of the likelihood that materially different amounts would be reported under different conditions or using different assumptions. These estimates include accounting for derivatives, the use of fair-value estimates, accounting for deferred premiums and discounts on prepayable assets, the allowance for loan losses, and other-than-temporary-impairment of investment securities. The Audit Committee of our board of directors has reviewed these estimates. The assumptions involved in applying these policies are discussed in Item 7 — Management's Discussion and Analysis of Financial Condition and Results of Operations — Critical Accounting Estimates in the 2011 Annual Report.
As of September 30, 2012, we have not made any significant changes to the estimates and assumptions used in applying our critical accounting policies and estimates from those used to prepare our audited financial statements. Described below are the results of the sensitivity analysis for private-label MBS.
Other-Than-Temporary Impairment of Investment Securities
See Item 1 — Notes to the Financial Statements — Note 6 — Other-Than-Temporary Impairment for additional information related to management's other-than-temporary impairment analysis for the current period.
In addition to evaluating our residential private-label MBS under a base-case (or best estimate) scenario, a cash-flow analysis was also performed for each of these securities under a more stressful housing price index (HPI) scenario that was determined by the OTTI Governance Committee.
Our base-case housing price forecast as of September 30, 2012, assumed current-to-trough home price declines ranging from 0.0 percent (for those housing markets that are believed to have reached their trough) to 4.0 percent. For those markets for which further home-price declines are anticipated, such declines were projected to occur over the three- to nine-month period beginning July 1, 2012. For the vast majority of markets where further home-price declines are anticipated, the declines were projected to range from 1.0 percent to 2.0 percent over the three-month period beginning July 1, 2012. From the trough, home prices were projected to recover using one of five different recovery paths that vary by housing market. The more stressful scenario was based on a housing-price forecast that was five percentage points lower at the trough than the base-case scenario followed by a flatter recovery path. Under the more stressful scenario, current-to-trough home-price declines were projected to range from 5.0 percent to 9.0 percent over the three- to nine-month period beginning July 1, 2012. For most of the housing markets, the declines were projected to occur over the three-month period beginning July 1, 2012. The following table presents projected home-price recovery ranges by month under the base-case and adverse-case scenario.
Recovery Range of Annualized Rates | |||||||||
Months | Base Case | Adverse Case | |||||||
1 - 6 | 0.0% | to | 2.8% | 0.0% | to | 1.9 | % | ||
7 - 18 | 0.0% | to | 3.0% | 0.0% | to | 2.0 | % | ||
19 - 24 | 1.0% | to | 4.0% | 0.7% | to | 2.7 | % | ||
25 - 30 | 2.0% | to | 4.0% | 1.3% | to | 2.7 | % | ||
31 - 42 | 2.0% | to | 5.0% | 1.3% | to | 3.4 | % | ||
43 - 66 | 2.0% | to | 6.0% | 1.3% | to | 4.0 | % | ||
Thereafter | 2.3% | to | 5.6% | 1.5% | to | 3.8 | % | ||
The following table represents the impact on credit-related other-than-temporary impairment using the more stressful scenario of the HPI, described above, compared with actual credit-related other-than-temporary impairment recorded using our base-case HPI assumptions as of September 30, 2012 (dollars in thousands):
100
Credit Losses as Reported | Sensitivity Analysis - Adverse HPI Scenario | |||||||||||||||||||||
For the quarter ending September 30, 2012 | Number of Securities | Par Value | Other-Than-Temporary Impairment Credit Loss | Number of Securities | Par Value | Other-Than-Temporary Impairment Credit Loss | ||||||||||||||||
Prime | 1 | $ | 1,411 | $ | — | 4 | $ | 30,632 | $ | (426 | ) | |||||||||||
Alt-A | 9 | 199,089 | (1,092 | ) | 57 | 1,130,393 | (31,360 | ) | ||||||||||||||
Subprime | — | — | — | 3 | 2,436 | (60 | ) | |||||||||||||||
Total private-label MBS | 10 | $ | 200,500 | $ | (1,092 | ) | 64 | $ | 1,163,461 | $ | (31,846 | ) | ||||||||||
RECENT ACCOUNTING DEVELOPMENTS
See Item 1 — Notes to the Financial Statements — Note 2 — Recently Issued Accounting Standards and Interpretations for a discussion of recent accounting developments impacting or that could impact us.
LEGISLATIVE AND REGULATORY DEVELOPMENTS
The legislative and regulatory environment in which we operate continues to undergo rapid change driven principally by reforms under the Housing and Economic Reform Act of 2008, as amended (HERA) and the Dodd-Frank Wall Street Reform and Consumer Protection Act of 2010 (the Dodd-Frank Act). We expect HERA and the Dodd-Frank Act as well as plans for housing finance and GSE reform to result in still further changes to this environment. Our business operations, funding costs, rights, obligations, and/or the environment in which we carry out our housing finance mission are likely to continue to be significantly impacted by these changes. Significant regulatory actions and developments for the period covered by this report are summarized below.
Developments under the Dodd-Frank Act Impacting Derivatives Transactions
Definitions of Certain Terms under New Derivatives Requirements. The Dodd-Frank Act will require swap dealers and certain other large users of derivatives to register as “swap dealers” or “major swap participants,” as the case may be, with the U.S. Commodity Futures Trading Commission (the CFTC) and/or the SEC. Based on the definitions in the final rules jointly issued by the CFTC and SEC in April 2012, we will not be required to register as either a major swap participant or as a swap dealer because of the derivative transactions that we enter into for the purposes of hedging and managing our interest-rate risk or any derivative transactions that we may intermediate for our members, although we continue our suspension on member derivatives.
Based on the final rules and accompanying interpretive guidance jointly issued by the CFTC and SEC in July 2012, call and put optionality in certain advances to our members will not be treated as “swaps” as long as the optionality relates solely to the interest rate on the advance and does not result in enhanced or inverse performance or other risks unrelated to the interest rate. Accordingly, our ability to offer these advances to member customers should not be affected by the new derivatives regulations.
Mandatory Clearing of Derivatives Transactions. The Dodd-Frank Act provides for new statutory and regulatory requirements for derivative transactions, including those utilized by us to hedge our interest-rate and other risks. As a result of these requirements, certain derivative transactions will be required to be cleared through a third-party central clearinghouse and traded on regulated exchanges or new swap execution facilities. As further discussed in the 2011 Annual Report under Item 7 — Legislative and Regulatory Developments- Developments under the Dodd-Frank Act Impacting Derivatives Transactions, cleared swaps will be subject to new requirements including mandatory reporting, record-keeping, and documentation requirements established by applicable regulators, and initial and variation margin requirements established by the clearinghouse and its clearing members. The CFTC recently issued guidance regarding the treatment of customer collateral for cleared swaps and proposed additional protections for such collateral.
The implementation timeframe for mandatory clearing of eligible interest-rate swaps is determined according to the effective date of the CFTC's mandatory clearing determinations, which were released in proposed form on July 24, 2012, for interest-rate swaps that are currently clearable. The CFTC is expected to finalize these determinations in November 2012, and we will have to clear eligible interest-rate swaps within 180 days after publication of the final determinations, which we estimate will be during the second quarter 2013.
The CFTC has approved an end-user exception to mandatory clearing that would exempt derivatives transactions that we may intermediate for our members with $10 billion or less in assets as long as the member uses the swaps to hedge or mitigate its commercial risk and the reporting counterparty for such swaps complies with certain additional reporting requirements. As a
101
result, any such intermediated swaps would not be subject to mandatory clearing, although such swaps would be subject to applicable new requirements for derivative transactions that are not subject to mandatory clearing requirements (uncleared trades).
Uncleared Derivatives Transactions. The Dodd-Frank Act will also change the regulatory landscape for uncleared trades. While we expect to continue to enter into uncleared trades on a bilateral basis, such trades will be subject to new requirements, including mandatory reporting, recordkeeping, documentation, and minimum margin and capital requirements established by applicable regulators. These requirements are discussed in the 2011 Annual Report.
The CFTC recently finalized rules regarding certain new documentation requirements for uncleared trades. These rules, the external business conduct rules for swap dealers and major swap participants that the CFTC had previously finalized and certain additional rules that have yet to be finalized, will require amendments to the documentation for swaps we enter into with swap dealers. We have adhered to an ISDA protocol to address the new documentation requirements under the external business conduct rules, and we will consider adhering to future ISDA protocols to address the recently finalized new documentation requirements for uncleared trades. The recently finalized rules require new dispute resolution and valuation provisions, new representations regarding applicable insolvency regimes, and credit support modifications to our existing swap documentation. Our swap documentation with swap dealers must comply with these requirements by April 1, 2013. The recently finalized rules also impose requirements for acknowledgments and confirmations of uncleared trades between us and swap dealers. With respect to interest-rate swaps that we enter into with swap dealers, these requirements will be phased in between November 13, 2012, and March 1, 2014. However, we believe that this scheduled phase-in period may be delayed until December 31, 2012, due to a delay in swap dealer registration. This same delay in registration has also delayed the start of swap dealer compliance with certain of the external business conduct rules discussed above beyond their originally scheduled effective date of October 15, 2012. The compliance date for the remaining external business conduct rules is January 1, 2013.
The Dodd-Frank Act also imposes new margin requirements for uncleared trades, which are discussed in the 2011 Annual Report under Item 7 — Legislative and Regulatory Developments — Developments under the Dodd-Frank Act Impacting Derivatives Transactions. The CFTC, the Finance Agency, and other bank regulators proposed margin requirements in 2011 and the CFTC has re-opened the comment period for such requirements on two occasions. The Finance Agency and other bank regulators recently re-opened the comment period for their proposed margin requirements until November 26, 2012. As a result, we do not expect that such requirements will be finalized until sometime in 2013 and we do not expect that they will apply to the Bank until later in 2013 at the earliest.
Recordkeeping and Reporting. Compliance dates for the new recordkeeping and reporting requirements for all of our cleared and uncleared swaps have now been established, based on the effective date for the final rule further defining the term “swap” issued jointly by the CFTC and SEC, which became effective on October 12, 2012. We currently comply with recordkeeping requirements for our swaps that were (or are) in effect on or after July 21, 2010, and beginning on April 10, 2013; we will have to comply with new recordkeeping requirements for swaps entered into on or after April 10, 2013. For interest-rate swaps that we enter into with swap dealers, the swap dealers must comply with reporting requirements applicable to such swaps, including real-time reporting requirements, as of the date these swap dealers register as such. We will be required to comply with reporting requirements, including real-time reporting requirements, for any swaps that we may intermediate for our members, beginning on April 10, 2013.
We, together with the other FHLBanks, will continue to monitor these rulemakings and the overall regulatory process to implement the derivatives reform under the Dodd-Frank Act. We will also continue to work with the other FHLBanks to implement the processes and documentation necessary to comply with the Dodd-Frank Act's new requirements for derivatives.
Developments under the Finance Agency
Advance Notice of Proposed Rulemaking on Stress-Testing Requirements. On October 5, 2012, the Finance Agency issued a notice of proposed rulemaking with a comment deadline of December 4, 2012, that would implement a provision in the Dodd-Frank Act that requires all financial companies with assets over $10 billion to conduct annual stress tests, which will be used to evaluate an institution's capital adequacy under various economic conditions and financial conditions. The Finance Agency proposes to issue annual guidance to describe the baseline, adverse and severely adverse scenarios and methodologies that the FHLBanks must follow in conducting their stress tests, which, as required by the Dodd-Frank Act, would be generally consistent and comparable to those established by the Federal Reserve. An FHLBank would be required to provide an annual report on the results of the stress tests to the Finance Agency and the Federal Reserve and to then publicly disclose a summary of such report within 90 days.
102
Proposed Guidance on Collateralization of Advances and Other Credit Products Provided to Insurance Company Members. On October 5, 2012, the Finance Agency published a notice requesting comments on a proposed Advisory Bulletin with a comment deadline of December 4, 2012, which would set forth standards to guide the Finance Agency in its supervision of secured lending to insurance company members by the FHLBanks. The Finance Agency's notice provides that lending to insurance company members exposes FHLBanks to risks that are not associated with advances to the insured depository institution members, arising from different states' statutory and regulatory regimes and the statutory accounting principles and reporting practices. The proposed standards include consideration of, among other things:
• | the level of an FHLBank's exposure to insurance companies in relation to its capital structure and retained earnings; |
• | an FHLBank's control of pledged securities collateral and ensuring it has a first-priority perfected security interest; |
• | the use of funding agreements between an FHLBank and an insurance company member to document advances and whether such an FHLBank would be recognized as a secured creditor with a first priority security interest in the collateral; and |
• | the FHLBank's documented framework procedures, methodologies and standards to evaluate an insurance company member's creditworthiness and financial condition, the FHLBanks' valuation of the pledged collateral, and whether the FHLBank has a written plan for the liquidation of insurance company member collateral. |
Proposed Order on Qualified Financial Contracts (QFCs). On August 9, 2012, the Finance Agency circulated a proposed order on QFCs with a comment deadline of October 10, 2012, that would be applicable to the FHLBanks as well as Fannie Mae and Freddie Mac. The Finance Agency has indicated that the proposed order is intended to permit the Finance Agency to comply with certain statutory requirements for the transfer of QFCs in the event of the receivership of a Fannie Mae and Freddie Mac. The proposed order sets forth certain recordkeeping and reporting requirements for Fannie Mae and Freddie Mac QFCs. If the order is issued as proposed, each FHLBank will have to, among other things, establish and maintain infrastructure sufficient to meet the recordkeeping and reporting requirements and engage external personnel to audit its compliance with the order on an annual basis.
Other Significant Developments
National Credit Union Administration Proposed Rule on Access to Emergency Liquidity. On July 30, 2012, the National Credit Union Administration published a proposed rule with a comment deadline of September 28, 2012, requiring, among other things, that federally-insured credit unions of $100 million or larger must maintain access to at least one federal liquidity source for use in times of financial emergency and distressed circumstances. This access must be demonstrated through direct or indirect membership in the Central Liquidity Facility (a U.S. government corporation created to improve the general financial stability of credit unions by serving as a liquidity lender to credit unions) or by establishing access to the Federal Reserve's discount window. The proposed rule does not include FHLBank membership as an emergency liquidity source. If the rule is issued as proposed, it may adversely impact our results of operations if it causes our federally insured credit union members to favor these federal liquidity sources over FHLBank membership or advances.
Housing Finance and GSE Reform. Recently, the U.S. Treasury Department (the Treasury Department) announced a set of modifications to the preferred stock purchase agreements between the Treasury Department and the Finance Agency as conservator of Fannie Mae and Freddie Mac to help expedite their wind-down. The changes require all future earnings from the Enterprises to be turned over to the Treasury Department and require the accelerated wind down of their retained mortgage portfolios. By not allowing Fannie Mae and Freddie Mac to retain any profits, these changes effectively ensure that Fannie Mae and Freddie Mac will never be allowed to recapitalize themselves and return to the market in their previous structure. In addition, the Finance Agency recently solicited comments on their proposal to create a new framework for the secondary mortgage market. The Finance Agency has indicated that the framework is intended to create a more efficient and flexible securitization platform for Fannie Mae and Freddie Mac that also would be available to all market participants and interested parties.
As Fannie Mae and Freddie Mac are being wound down, Congress and the administration have been considering various proposals to reform the U.S. housing finance system and the secondary mortgage market. A number of bills have been introduced in Congress in the past several years, although none have proposed specific changes to the FHLBanks. No further legislative action in this area is expected until the next Congress convenes in 2013. It is impossible to determine at this time whether or when Congress will act in this area. The ultimate effects of housing finance and GSE reform on the FHLBanks is unknown and will depend on the legislation or other changes, if any, that ultimately are implemented.
ITEM 3. QUANTITATIVE AND QUALITATIVE DISCLOSURES ABOUT MARKET RISK
103
Sources and Types of Market and Interest-Rate Risk
Our balance sheet is comprised of different portfolios that require different types of market- and interest-rate-risk management strategies. Sources and types of market and interest-rate risk are described in Item 7A — Quantitative and Qualitative Disclosures About Market Risks — Sources and Types of Market and Interest-Rate Risk in the 2011 Annual Report.
Strategies to Manage Market and Interest-Rate Risk
We use various strategies and techniques to manage our market and interest-rate risk including the following and combinations of the following:
• | the issuance of COs that generally match the interest-rate-risk exposures of our assets; |
• | the use of derivatives and/or COs with embedded options to hedge the interest-rate-risk of our debt (at September 30, 2012, fixed-rate noncallable debt, not hedged by interest-rate swaps, amounted to $14.3 billion, compared with $14.6 billion at December 31, 2011, and fixed-rate callable debt not hedged by interest-rate swaps amounted to $1.1 billion and $843.0 million at September 30, 2012, and December 31, 2011, respectively); |
• | the issuance of COs together with interest-rate swaps that receive a coupon that offsets the bond coupon and that offsets any optionality embedded in the bond, thereby effectively creating a floating-rate liability (total CO bonds used in conjunction with interest-rate-exchange agreements was $7.8 billion, or 27.8 percent of our total outstanding CO bonds at September 30, 2012, compared with $10.7 billion, or 36.3 percent of total outstanding CO bonds, at December 31, 2011); |
• | contractual provisions for advances with original fixed maturities of greater than six months that require borrowers to pay us prepayment fees, which make us financially indifferent if such advances are prepaid prior to maturity and protect against a loss of income under certain interest-rate environments; |
• | the use of the duration extension portfolio (which totaled $2.4 billion at September 30, 2012, as compared with $3.3 billion at December 31, 2011), to hedge our net interest income against the impact of low interest rates, which is discussed in Item 7A — Quantitative and Qualitative Disclosures About Market Risks — Measurement of Market and Interest-Rate Risk — Duration Extension Portfolio in the 2011 Annual Report; and |
• | the use of callable debt for a portion of our investments in mortgage loans to manage the interest-rate and prepayment risks from these investments. |
Each of the foregoing strategies and techniques is more fully discussed in the 2011 Annual Report under Item 7A —Quantitative and Qualitative Disclosures About Market Risks — Strategies to Manage Market and Interest Rate Risk in the 2011 Annual Report.
Measurement of Market and Interest-Rate Risk
Our principal measure of market and interest-rate risk is market value of equity (MVE). MVE is the net economic value of total assets and liabilities, including any off-balance-sheet items. In contrast to the GAAP-based shareholder's equity account, MVE represents the shareholder's equity account in present-value terms. Specifically, MVE equals the difference between the theoretical market value of assets and the theoretical market value of liabilities. MVE, and in particular, the ratio of MVE to the book value of equity (BVE), is therefore a theoretical measure of the current value of shareholder investment based on market rates, spreads, prices, and volatility at the reporting date. BVE is equal to our permanent capital, which consists of the par value of capital stock including mandatorily redeemable capital stock, plus retained earnings. BVE excludes accumulated other comprehensive loss.
We caution that care must be taken to properly interpret the results of the MVE analysis as the theoretical basis for these valuations may not be fully representative of future realized prices. Further, valuations are based on market curves and prices respective of individual assets, liabilities, and derivatives, and therefore are not representative of future net income to be earned by us through the spread between asset market curves and the market curves for funding costs. MVE should not be considered indicative of our market value as a going concern because it does not consider future new business activities, risk-management strategies, or the net profitability of assets after funding costs are subtracted.
We measure our exposure to market and interest-rate risk using several metrics, including:
• | the ratio of MVE to BVE; |
• | the ratio of MVE to the par value of our Class B Stock (Par Stock), which we refer to as the MVE to Par Stock ratio; |
• | the ratio of adjusted MVE to Par Stock, which metric removes the impact of market illiquidity on MVE; |
104
• | the ratio of MVE to the market value of assets, which we refer to as the economic capital ratio; |
• | value at risk (VaR), which measures the change in our MVE to a 99th percent confidence interval, based on a set of stress scenarios using historical interest-rate and volatility movements that have been observed over six-month intervals starting at the most recent month-end and going back monthly to 1978, consistent with Finance Agency regulations; |
• | duration of equity, which measures percentage change to shareholder value for a 100 basis point shift in rates; |
• | the duration gap of our assets and liabilities, which is the difference between the estimated durations (percentage change in market value for a 100 basis point shift in rates) of assets and liabilities (including the effect of related hedges) and reflects the extent to which estimated sensitivities to market changes, including, but not limited to, maturity and repricing cash flows for assets and liabilities are matched; |
• | targeted metrics for the duration extension portfolio and our investments in mortgage loans; and |
• | the use of an income-simulation model that projects net interest income over a range of potential interest-rate scenarios, including parallel interest-rate shocks, nonparallel interest-rate shocks, and nonlinear changes to our funding curve and LIBOR. |
During the quarter ended March 31, 2012, we ceased using alternative measures of VaR and duration of equity, which we had referred to as management VaR and management duration of equity. We had used these metrics to isolate the distortive impact of private-label MBS credit spreads and market illiquidity on VaR and duration of equity. However, these metrics are no longer as important to us due to the ongoing reduction in the size of our investments in private-label MBS and some recovery in the fair values of those investments.
We maintain limits and management action triggers in connection with each of the foregoing metrics. Those limits, management action triggers, and the foregoing market and interest-rate risk metrics are more fully discussed in the 2011 Annual Report under Item 7A — Quantitative and Qualitative Disclosures About Market Risks — Measurement of Market and Interest-Rate Risk in the 2011 Annual Report.
The following table sets forth each of the foregoing metrics together with any targets, associated limits and management actions triggers at September 30, 2012, and December 31, 2011.
105
Interest/Market-Rate Risk Metric | At September 30, 2012 | At December 31, 2011 | Target, Limit or Management Action Trigger at September 30, 2012 | |||
MVE | $3.8 billion | $3.7 billion | None | |||
MVE/BVE | 90% | 86% | None | |||
MVE/Par Stock | 104% | 95% | 100% (target) | |||
Adjusted MVE/Par Stock | 109% | 108% | 102% (management action trigger) and 100% (limit) | |||
Economic Capital Ratio | 8.1% | 7.2% | 4.5% (management action trigger) and 4.0% or lower (limit) | |||
VaR | $71.9 million | $91.3 million | $225.0 million (management action trigger) and $275.0 million (limit) | |||
Duration of Equity | +0.3 years | +1.1 years | +/- 3.5 years (management action trigger) and +/- 4.0 years (limit) lowered from +/- 5.0 years at December 31, 2011 | |||
Duration Gap | +0.3 months | +0.9 months | None | |||
Duration Extension Portfolio VaR Limit (1) | $1.7 million | $5.2 million | $125.0 million (limit) | |||
Duration Extension Portfolio Interest Rate Shock | Market yields on GSE debt would have to rise by 180 basis points for the management action trigger to be breached and by 230 basis points for the limit to be breached | Market yields on GSE debt would have to rise by 68 basis points for the management action trigger to be breached and by 118 basis points for the limit to be breached | 75 basis points (management action trigger) and 25 basis points (limit) | |||
MPF Portfolio VaR Limit | $41.6 million | $38.9 million | $68.8 million (management action trigger) | |||
Income Simulation based on an instantaneous rise in interest rates of 300 basis points | Return on equity falls to 43 basis points above the average yield on three-month LIBOR | Return on equity falls to 24 basis points above the average yield on three-month LIBOR | Projected return on equity falls below three-month LIBOR over the following 12 month horizon (management action trigger) | |||
_______________________
(1) | This metric is calculated net of any unrealized gain or loss. |
The following chart displays our MVE to BVE and MVE to Par Stock ratios at prior period ends.
106
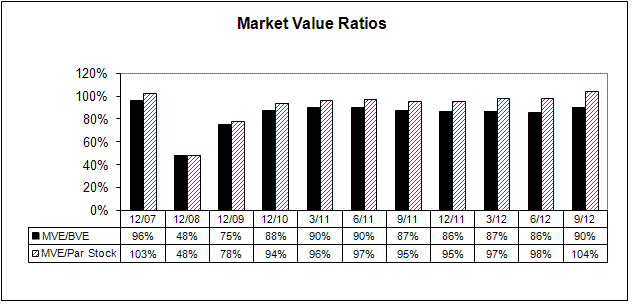
Certain Market and Interest-Rate Risk Metrics under Potential Interest-Rate Scenarios
The sensitivities of market value of equity and the duration of equity to potential interest-rate scenarios are also metrics we monitor. The following table presents certain market and interest-rate risk metrics under different interest-rate scenarios.
September 30, 2012 | ||||||||||||||
Down(1) 300 | Down(1) 200 | Down(1) 100 | Base | Up 100 | Up 200 | Up 300 | ||||||||
MVE/BVE | 94% | 92% | 92% | 90% | 91% | 89% | 86% | |||||||
MVE/Par Stock | 107% | 106% | 106% | 104% | 104% | 102% | 99% | |||||||
Duration of Equity | +1.1 years | +0.9 years | +1.5 years | +0.3 years | +0.6 years | +2.4 years | +3.8 years | |||||||
Return on Equity less LIBOR | 3% | 3% | 3% | 2% | 2% | 1% | —% | |||||||
Net Income percent change from base | (13)% | (13)% | (9)% | —% | 13% | 27% | 35% | |||||||
____________________________
(1) Given the current environment of low interest rates, downward rate shocks are floored as they approach zero, and therefore may not be fully representative of the indicated rate shock.
December 31, 2011 | ||||||||||||||
Down(1) 300 | Down(1) 200 | Down(1) 100 | Base | Up 100 | Up 200 | Up 300 | ||||||||
MVE/BVE | 91% | 89% | 88% | 86% | 86% | 84% | 82% | |||||||
MVE/Par Stock | 100% | 98% | 97% | 95% | 95% | 93% | 90% | |||||||
Duration of Equity | +2.2 years | +1.8 years | +0.9 years | +1.1 years | +1.0 years | +2.6 years | +4.0 years | |||||||
Return on Equity less LIBOR | 2% | 2% | 2% | 1% | 1% | 1% | 1% | |||||||
Net Income percent change from base | (5)% | (5)% | (1)% | —% | 60% | 109% | 151% | |||||||
____________________________
(1) Given the current environment of low interest rates, downward rate shocks are floored as they approach zero, and therefore may not be fully representative of the indicated rate shock.
VaR at Different Confidence Levels
107
The table below presents the historical simulation VaR estimate as of September 30, 2012, and December 31, 2011, which represents the estimates of potential reduction to our MVE from potential future changes in interest rates and other market factors. Estimated potential market value loss exposures are expressed as a percentage of the current MVE and are based on historical behavior of interest rates and other market factors over a 120-business-day time horizon.
Value-at-Risk (Gain) Loss Exposure | ||||||||||||||
September 30, 2012 | December 31, 2011 | |||||||||||||
Confidence Level | % of MVE (1) | $ million | % of MVE (1) | $ million | ||||||||||
50% | (0.15 | )% | $ | (5.7 | ) | (0.15 | )% | $ | (5.5 | ) | ||||
75% | 0.56 | 21.2 | 0.69 | 25.2 | ||||||||||
95% | 1.36 | 51.5 | 1.83 | 67.0 | ||||||||||
99% | 1.90 | 71.9 | 2.49 | 91.3 | ||||||||||
_______________________
(1) Loss exposure is expressed as a percentage of base MVE.
ITEM 4. CONTROLS AND PROCEDURES
Disclosure Controls and Procedures
Our senior management is responsible for establishing and maintaining a system of disclosure controls and procedures designed to ensure that information required to be disclosed by us in the reports filed or submitted under the Securities Exchange Act of 1934 is recorded, processed, summarized, and reported within the time periods specified in the rules and forms of the SEC. Our disclosure controls and procedures include, without limitation, controls and procedures designed to ensure that information required to be disclosed by us in the reports that we file or submit under the Securities Exchange Act of 1934 is accumulated and communicated to our management, including our principal executive officer and principal financial officer, as appropriate to allow timely decisions regarding required disclosure. In designing and evaluating our disclosure controls and procedures, we recognize that any controls and procedures, no matter how well designed and operated, can provide only reasonable assurance of achieving the desired control objectives, and our management necessarily is required to apply its judgment in evaluating the cost-benefit relationship of controls and procedures.
We have evaluated the effectiveness of the design and operation of our disclosure controls and procedures, with the participation of the president and chief executive officer and chief financial officer, as of the end of the period covered by this report. Based on that evaluation, our president and chief executive officer and chief financial officer have concluded that our disclosure controls and procedures were effective at a reasonable assurance level as of the end of the fiscal quarter covered by this report.
Changes in Internal Control over Financial Reporting
During the quarter ended September 30, 2012, there were no changes in our internal control over financial reporting that have materially affected, or are reasonably likely to materially affect, our internal control over financial reporting.
PART II — OTHER INFORMATION
ITEM 1. LEGAL PROCEEDINGS
On April 20, 2011, we filed a complaint (the original complaint) in the Superior Court Department of the Commonwealth of Massachusetts in Suffolk County, against various securities dealers, underwriters, control persons, issuers/depositors, and credit rating agencies based on our investments in certain private-label MBS issued by 115 securitization trusts for which we originally paid approximately $5.8 billion. Since the original complaint was filed, the defendants filed certain notices of removal to remove the case to the United States District Court for the District of Massachusetts. On March 9, 2012, our motion to remand the matter to state court was denied.
On June 29, 2012, we filed an amended complaint (the amended complaint) in the United States District Court for the District of Massachusetts against various securities dealers, underwriters, control persons, issuers/depositors, and credit rating agencies
108
based on our investments in certain private-label MBS issued by 111 securitization trusts for which we originally paid approximately $5.7 billion. The amended complaint asserts, as the original complaint had asserted, claims based on untrue or misleading statements in the sale of securities, signing or circulating securities documents that contained material misrepresentations and omissions, negligent misrepresentation, unfair or deceptive trade practices, fraud by the rating agencies, and controlling person liability. We are seeking various forms of relief including rescission, recovery of damages, recovery of purchase consideration plus interest (less income received to date), and recovery of reasonable attorneys' fees and costs of suit.
The amended complaint names the following defendants and their affiliates and subsidiaries and defendants under their control or controlled by affiliates or subsidiaries thereof: Ally Financial Inc. (formerly GMAC Inc.), Bank of America Corporation; Barclays Capital Inc.; The Bear Stearns Companies LLC; Capital One Financial Corporation; Citigroup, Inc.; Countrywide Financial Corporation; Credit Suisse (USA), Inc.; DB Structured Products, Inc.; DB U.S. Financial Market Holding Corporation; EMC Mortgage Corporation; Fitch; Impac Mortgage Holdings, Inc.; JPMorgan Chase & Co.; The McGraw-Hill Companies, Inc.; Moody's Corporation; Morgan Stanley; Nomura Holding America, Inc.; RBS Holdings USA Inc.; UBS Americas Inc.; WaMu Capital, Corp.; and Wells Fargo & Company.
On October 11, 2012, certain defendants filed motions to dismiss the complaint.
The original complaint also named certain individuals due to their association and control over Lehman Brothers Holdings Inc. and its affiliates and subsidiaries and entities controlled by Lehman Brothers Holdings Inc.'s affiliates and subsidiaries. We have since been able to reach a settlement agreement with those defendants in an amount that is not material to our financial statements.
Bank of America Rhode Island, N.A., which is affiliated with Bank of America Corporation but is not a defendant in the complaint, held approximately 26.8 percent of our capital stock as of September 30, 2012. RBS Citizens N.A., which is affiliated with RBS Holdings USA Inc., but is not a defendant in the complaint, held approximately 13.3 percent of our capital stock as of September 30, 2012.
From time to time, we are subject to various pending legal proceedings arising in the normal course of business. After consultation with legal counsel, we do not anticipate that the ultimate liability, if any, arising out of these matters will have a material adverse effect on our financial condition or results of operations.
ITEM 1A. RISK FACTORS
In addition to the risk factors below and other risks described herein, readers should carefully consider the risk factors set forth in the 2011 Annual Report that could materially impact our business, financial condition, or future results. The risks described below, elsewhere in this report, and in the 2011 Annual Report are not the only risks facing us. Additional risks and uncertainties not currently known to us or that we currently deem immaterial may also materially impact us.
CREDIT RISKS
We are subject to credit-risk exposures related to the loans that back our investments. Increased delinquency rates and credit losses beyond those currently expected could adversely impact the yield on or value of those investments.
We invested in private-label MBS until the fourth quarter of 2007. These investments are backed by prime, subprime, and/or Alt-A hybrid and pay-option adjustable-rate mortgage loans. Although we only invested in senior tranches with the highest long-term debt rating when purchasing private-label MBS, many of these securities are projected to sustain credit losses under current assumptions, and have been downgraded by various NRSROs. See Part I — Item 2 — Management’s Discussion and Analysis of Financial Condition and Results of Operations — Financial Condition — Investments for a description of our portfolio of investments in these securities.
As described under Item 7 — Management's Discussion and Analysis of Financial Condition and Results of Operations — Critical Accounting Estimates in the 2011 Annual Report, other-than-temporary-impairment assessment is a subjective and complex determination by management.
High rates of delinquency and increasing loss-severity trends experienced on some of the loans underlying the MBS in our portfolio, as well as challenging macroeconomic factors, such as continuing high unemployment levels and the number of troubled residential mortgage loans, have caused us to use relatively stressful assumptions for other-than-temporary-impairment assessments of private-label MBS. These assumptions resulted in projected future credit losses, thereby causing other-than-temporary impairment losses from certain of these securities. We incurred credit losses of $1.1 million for private-label MBS
109
that we determined were other-than-temporarily impaired for the three months ended September 30, 2012. If macroeconomic trends or collateral credit performance within our private-label MBS portfolio deteriorate further than currently anticipated, or if foreclosures or similar activity is delayed or impeded, even more stressful assumptions, including, but not limited to, lower house prices, higher loan-default rates, and higher loan-loss severities may be used by us in future other-than-temporary impairment assessments. As a possible outcome, we may recognize additional other-than-temporary impairment charges, which could be substantial. For example, as of September 30, 2012, a cash-flow analysis was also performed for each of these securities under a more stressful housing price scenario. The more stressful scenario was based on a housing price forecast that was five percentage points lower at the trough than the base-case scenario followed by a flatter recovery path. Under this more stressful scenario, we are projected to realize an additional $30.8 million in credit losses.
We have also invested in securities issued by HFAs with an amortized cost of $192.0 million as of September 30, 2012. Generally, these securities' cash flows are based on the performance of the underlying loans, although these securities do include credit enhancements as well. Although our policies require that HFA securities must carry a credit rating of double-A (or equivalent) or higher as of the date of purchase, some have since been downgraded and, when applicable, some of the related bond insurers have been downgraded. Further, the fair values of some of our HFA securities have also fallen. Gross unrealized losses on these securities totaled $28.4 million at September 30, 2012. Although we have determined that none of these securities is other-than-temporarily impaired at September 30, 2012, should the underlying loans underperform our projections, we could realize credit losses from these securities.
ITEM 2. UNREGISTERED SALES OF EQUITY SECURITIES AND USE OF PROCEEDS
Not applicable.
ITEM 3. DEFAULTS UPON SENIOR SECURITIES
None
ITEM 4. MINE SAFETY DISCLOSURES
Not applicable.
ITEM 5. OTHER INFORMATION
None.
110
ITEM 6. EXHIBITS
Number | Exhibit Description | |
31.1 | Certification of the president and chief executive officer pursuant to Section 302 of the Sarbanes-Oxley Act of 2002 | |
31.2 | Certification of the chief financial officer pursuant to Section 302 of the Sarbanes-Oxley Act of 2002 | |
32.1 | Certification of the president and chief executive officer pursuant to 18 U.S.C. Section 1350, as adopted pursuant to Section 906 of the Sarbanes-Oxley Act of 2002 | |
32.2 | Certification of the chief financial officer pursuant to 18 U.S.C. Section 1350, as adopted pursuant to Section 906 of the Sarbanes-Oxley Act of 2002 | |
101.INS | XBRL Instance Document | |
101.SCH | XBRL Taxonomy Extension Schema Document | |
101.CAL | XBRL Taxonomy Extension Calculation Linkbase Document | |
101.LAB | XBRL Taxonomy Extension Label Linkbase Document | |
101.PRE | XBRL Taxonomy Extension Presentation Linkbase Document | |
101.DEF | XBRL Taxonomy Extension Definition Linkbase Document | |
SIGNATURES
Pursuant to the requirements of Section 13 or 15(d) of the Securities Exchange Act of 1934, the registrant has duly caused this report to be signed on its behalf by the undersigned, thereunto duly authorized.
Date | FEDERAL HOME LOAN BANK OF BOSTON (Registrant) | |||||
November 9, 2012 | By: | /s/ | Edward A. Hjerpe III | |||
Edward A. Hjerpe III President and Chief Executive Officer | ||||||
November 9, 2012 | By: | /s/ | Frank Nitkiewicz | |||
Frank Nitkiewicz Executive Vice President and Chief Financial Officer | ||||||
111