PROSPECTUS
7,692,308
Shares
of
Common
Stock
of
Platinum
Energy Resources, Inc.
This
prospectus relates to the distribution of 7,692,308 shares of common stock,
$.0001 par value, of Platinum Energy Resources, Inc. (which we refer to in
this
prospectus as “we,” “us,” “Platinum” or the “Company”) by Tandem Energy
Holdings, Inc., a Nevada corporation (which we refer to in this prospectus
as
“Tandem”) to the shareholders of Tandem as part of Tandem’s dissolution and
winding-up of its affairs and distribution of its assets pursuant to Nevada
law.
On October 26, 2007, Platinum consummated the acquisition of substantially
all
of the assets of Tandem Energy Corporation, a Colorado corporation (which we
refer to in this prospectus as “TEC”), then a wholly-owned subsidiary of Tandem.
As part of the consideration for the assets, Platinum issued these 7,692,308
shares of common stock to TEC in a private transaction pursuant to an exemption
from registration provided by Section 4(2) of the Securities Act of 1933, as
amended. TEC was dissolved by a merger with and into Tandem (TEC’s sole
shareholder) effective March 11, 2008. Tandem was the surviving corporation
in the merger and, as such, received the assets of TEC, which consisted of
the
Platinum shares. Tandem was dissolved on June 24, 2008. Immediately
prior to its dissolution, Tandem’s assets consisted of the Platinum common stock
covered by this prospectus that it received, as the sole shareholder of TEC,
in
the merger. The parties to the acquisition had contemplated that, following
the
consummation of the acquisition, TEC would be dissolved and, thereafter, its
parent, Tandem, would dissolve and distribute the Platinum shares to Tandem’s
shareholders.
Our
common stock is quoted on the Over-the-Counter Bulletin Board (“OTCBB ”) under
the symbol PGRI. On August 7, 2008, the last sale price of our common stock
was $3.80 per share.
Investing
in our common stock involves a high degree of risk. You should carefully read
the discussion of material risks of investing in our common stock under the
heading “Risk Factors” beginning on page 4 of this
prospectus.
Neither
the Securities and Exchange Commission nor any state securities commission
has
approved or disapproved of these securities or determined if this prospectus
is
truthful or complete. Any representation to the contrary is a criminal
offense.
_______________________
The
date
of this prospectus is August 11, 2008.
Table
of Contents
|
|
Page
|
|
|
|
|
|
|
PROSPECTUS
SUMMARY
|
1
|
|
|
|
|
|
|
RISK
FACTORS
|
4
|
|
|
|
|
|
|
SPECIAL
NOTE REGARDING FORWARD-LOOKING STATEMENTS
|
12
|
|
|
|
|
|
|
USE
OF PROCEEDS
|
12
|
|
|
|
|
|
|
DIVIDEND
POLICY
|
12
|
|
|
|
|
|
|
CAPITALIZATION
|
12
|
|
|
|
|
|
|
MARKET
PRICE AND DIVIDEND DATA FOR PLATINUM SECURITIES; SHARE REPURCHASE
PROGRAM
|
13
|
|
|
|
|
|
|
SELECTED
HISTORICAL FINANCIAL DATA
|
14
|
|
|
|
|
|
|
SELECTED
UNAUDITED PRO FORMA CONDENSED COMBINED FINANCIAL INFORMATION OF PLATINUM
AND MAVERICK
|
16 | |
|
|
||
|
MANAGEMENT’S
DISCUSSION AND ANALYSIS OF FINANCIAL CONDITION AND RESULTS OF
OPERATIONS
|
17
|
|
|
|
|
|
|
BUSINESS
|
33
|
|
|
|
|
|
|
DESCRIPTION
OF PROPERTIES
|
39
|
|
|
|
|
|
|
MANAGEMENT
|
43
|
|
|
|
|
|
|
EXECUTIVE
COMPENSATION
|
46
|
|
|
|
|
|
|
SECURITY
OWNERSHIP OF CERTAIN BENEFICIAL OWNERS AND MANAGEMENT
|
55
|
|
|
|
|
|
|
CERTAIN
RELATIONSHIPS AND RELATED PARTY TRANSACTIONS
|
58
|
|
|
|
|
|
|
DESCRIPTION
OF CAPITAL STOCK
|
60
|
|
|
|
|
|
|
SHARES
ELIGIBLE FOR FUTURE SALE
|
62
|
|
|
|
|
|
|
THE
DISTRIBUTION
|
64
|
|
|
|
|
|
|
LEGAL
MATTERS
|
64
|
|
|
|
|
|
|
EXPERTS
|
65
|
|
|
|
|
|
|
WHERE
YOU CAN FIND ADDITIONAL INFORMATION
|
65
|
|
|
|
|
|
|
MANAGEMENT’S
ANNUAL REPORT ON INTERNAL CONTROL OVER FINANCIAL REPORTING
|
65
|
|
|
|
|
|
|
PLATINUM
ENERGY RESOURCES, INC. INDEX TO FINANCIAL STATEMENTS
|
F-1
|
You
should rely only on the information contained in this prospectus. We have not
authorized any other person to provide you with different information. If anyone
provides you with different or inconsistent information, you should not rely
on
it. Tandem is not making an offer to distribute these securities in any
jurisdiction where the offer or sale is not permitted. You should assume that
the information appearing in this prospectus is accurate only as of the date
on
the front cover of this prospectus regardless of the time of delivery of this
prospectus or of any distribution of the shares. Our business, financial
condition, results of operations and prospects may have changed since that
date.
PROSPECTUS
SUMMARY
You
should read the following summary, together with the more detailed information
regarding our company, especially the “Risk Factors” section and our financial
statements and notes to those statements appearing elsewhere in this prospectus,
before deciding to invest in shares of our common stock.
Platinum
Energy Resources, Inc. (which we refer to in this prospectus as “we,” “us,”
“Platinum” or the “Company”) is an independent oil and gas exploration and
production ("E&P") company. We have approximately 37,000 acres under lease
in relatively long-lived fields with well-established production histories,
21,000 of which were acquired as part of the TEC acquisition described below.
Our properties are concentrated primarily in the Gulf Coast region in Texas,
the
Permian Basin in Texas and New Mexico, and the Fort Worth Basin in
Texas.
Our
primary business strategy is to provide long-term growth in stockholder value
by
drilling, developing and exploiting our oil and gas properties. We are currently
engaged in an active drilling and workover program in order to achieve this
goal. Through a number of identifiable synergies, we believe that we are in
a
unique position to exploit our inventory of identified prospects more
effectively and efficiently than many other small independent oil and gas
exploration and production companies (See Business - Business Strategy on page
34.)
We
are
also continually evaluating potential low risk strategic acquisitions that
we
believe will complement our business plan. We believe there exists opportunities
to exploit mature fields that may have substantial remaining reserves. As the
major, large independent oil and gas companies continue to focus on more
costly and risky international and offshore prospects, the smaller independents,
such as Platinum, have an opportunity to take advantage of the
significant reserves left behind. For a discussion of our recent acquisitions,
see Business - Growth Strategy on page 34. We have also recently acquired
Maverick Engineering, Inc. (“Maverick”), a full service engineering company for
$6 million paid at closing, plus $5 million to be paid over the next six years,
pursuant to non-interest bearing cash flow notes, the timing of which related
note payments is related to performance. Following the consummation of this
acquisition, we moved our corporate headquarters to Maverick’s Houston office
and Maverick’s founder and CEO joined us as our Chief Operating Officer. See
Business - Growth Strategy on page 34.
Our
strategy also calls for the use of hedge financing to maximize profit and reduce
risk resulting from volatile energy markets. We believe that there is a gap
in
value between oil and gas reserves and the price of energy commodities and
that
profit can be captured by buying oil and gas companies or reserves, and selling
the underlying oil and gas commodity (See Business - Hedging Strategy on page
36).
TEC
Acquisition
On
October 26, 2007, through our wholly owned subsidiary, then known as PER
Acquisition Corp., a Delaware corporation (which we refer to in this prospectus
as “New TEC” and which has since changed its name to Tandem Energy Corporation)
we consummated the acquisition of substantially all of the assets and assumption
of substantially all of the liabilities of Tandem Energy Corporation, a Colorado
corporation (which we refer to in this prospectus as “TEC”), including
approximately $41.7 million in principal amount of TEC’s debt, in exchange for
the issuance of 7,692,308 shares of Platinum common stock. Prior to the TEC
acquisition, we were a blank check company.
TEC was
dissolved by a merger, effective March 11, 2008, with and into Tandem Energy
Holdings, Inc., a Nevada corporation (TEC’s sole shareholder, which we refer to
in this prospectus as “Tandem”). Tandem was the surviving corporation in the
merger and, as such, received the assets of TEC, which consisted of the
7,692,308 shares of Platinum common stock received in the acquisition. Tandem
was dissolved on June 24, 2008 and, pursuant to this prospectus, Tandem is
distributing the 7,692,308 shares of Platinum common stock (its assets) to
the
Tandem shareholders in accordance with the laws of the State of
Nevada.
1
Corporate
Information
We
were
incorporated in the State of Delaware on April 25, 2005. Our fiscal year ends
on
December 31. Our principal executive offices are located at 11490 Westheimer
Road, Suite 1000, Houston, Texas 77077. Our telephone number is (845) 323-0434.
You can access our web site at www.platenergy.com. Information contained on
our
web site is not a part of this prospectus. In this prospectus, references to
“Platinum,” “we,” “us” and “our” refer to Platinum Energy Resources, Inc., a
Delaware corporation, and our wholly-owned subsidiaries, New TEC, PER Gulf
Coast, Inc., Mixon Drilling, Inc., Red Iron Tool Co., Inc. and
Maverick.
We
formed
New TEC under the laws of the State of Delaware on January 25, 2006, to effect
a
business transaction. TEC was incorporated in Colorado on December 20, 1977.
Since its inception, TEC had been an oil and gas E&P company headquartered
in Midland, Texas. In the TEC acquisition, as described above, New TEC acquired
substantially all of the assets of TEC and we changed the name of New TEC from
“PER Acquisition Corp.” to “Tandem Energy Corporation.” The mailing address and
telephone number of Tandem Energy Corporation is now 200 N. Lorraine, Suite
400,
Midland, Texas and its telephone number is (432) 686-7136.
2
The
Offering
|
Common
stock offered:
|
7,692,308
shares
|
|
|
|
|
|
|
Common
stock outstanding:
|
22,070,762 shares
|
|
|
|
|
|
|
Use
of proceeds:
|
We
will not receive any proceeds from the distribution of the Platinum
shares
by Tandem to its shareholders.
|
|
|
|
|
|
|
OTCBB
symbol:
|
“PGRI”
|
|
|
|
|
|
|
Risk
factors:
|
See
“Risk Factors” and other information included in this prospectus for a
discussion of factors you should consider carefully before investing
in
shares of our common stock.
|
As
of the
date of this prospectus, we have 22,070,762 shares of common stock
outstanding, including the shares covered by this prospectus. This number
excludes the following shares as of the date of this prospectus:
|
|
·
|
14,400,000 shares
of common stock issuable upon exercise of our outstanding warrants
at an
exercise price of $6.00 per share;
|
|
|
·
|
4,000,000
shares of common stock available and reserved for future issuance
under
our 2006 Long-Term Incentive Plan;
|
|
|
·
|
535,714
shares of common stock issuable to Lance Duncan pursuant to a consulting
agreement between Platinum and Mr. Duncan;
and
|
|
|
·
|
1,440,000
shares underlying the purchase option granted to the underwriters
in our
IPO to purchase a total of 720,000 units at $10 per unit, which became
exercisable upon our acquisition of the TEC assets and expires October
24,
2010, consisting of 720,000 shares underlying such units and 720,000
shares issuable upon exercise of the warrants underlying such units
at an
exercise price of $7.50 per share.
|
3
RISK
FACTORS
Any
investment in our common stock involves a high degree of risk. You should
consider the risks described below carefully and all of the information
contained in this prospectus. If any of these risks, as well as other risks
and
uncertainties that are not currently known to us or that we currently believe
are not material, actually occur, our business, financial condition and results
of operations may suffer significantly. As a result, the trading price of our
common stock could decline and you may lose all or part of your investment
in
our common stock.
Since
Tandem, TEC’s parent entity, was a publicly-traded shell corporation, our
acquisition of all of the assets and substantially all liabilities of TEC may
subject us to successor liability for the shell corporation’s known and unknown
liabilities.
On
October 26, 2007, Platinum, through its wholly owned subsidiary, New TEC,
acquired substantially all of the assets and assumed substantially all of the
liabilities of TEC, including approximately $41.7 million of TEC's debt, in
exchange for the issuance of 7,692,308 shares of Platinum common stock. Prior
to
the acquisition, TEC was the wholly owned subsidiary of Tandem.
Tandem
was originally incorporated in Nevada as Las Vegas Major League Sports, Inc.
(“LVMS”) on July 22, 1993 with the plan of engaging in certain business
activities associated with the Canadian Football League. In April 1994, it
completed an initial public offering and began trading under the symbol LVTD.
In
1996, LVMS filed for bankruptcy protection and ceased being a reporting company
and also ceased operations and was considered to be a “shell” corporation. In
1998, LVMS changed its name to Pacific Medical Group, Inc. (“Pacific Medical
Group”) in connection with a share exchange transaction with a privately-held
company whose business plan was to engage in the manufacture and sale of medical
products. To our knowledge, that business was unsuccessful and, again, the
company ceased operations and was considered to be a “shell” corporation. In
February, 2005, Pacific Medical Group changed its name to Tandem Energy
Holdings, Inc. and changed its trading symbol to TDYH.PK. In June, 2005, Tandem
Energy Corporation became a wholly-owned subsidiary of Tandem Energy Holdings,
Inc.
The
risks
and uncertainties that were involved in the TEC acquisition include that we
may
be deemed to be a successor to Tandem, TEC’s parent, and thus subject to the
existing liabilities, including undisclosed liabilities, of the prior shell
corporations arising out of the their prior business operations, financial
activities and equity dealings. These risks and uncertainties
are generally greater when a corporation is used as a shell vehicle
more than once, such as Tandem. There is a risk of litigation by third parties
or governmental investigations or proceedings. Some potential claims against
Tandem that have been identified to date include the following:
|
|
·
|
Tandem
has been informed of a claim of ownership of 2.7 million shares of
Tandem
common stock. Such claim could result in a successor liability claim
against Platinum. These shares are not included in the outstanding
shares
of Tandem.
|
|
|
·
|
Messrs.
Jack and Rex Chambers, former members of Tandem management and significant
shareholders of Tandem, are the subjects of an Order of Permanent
Injunction resulting from proceedings instituted against them in
1984 by
the Securities and Exchange Commission. The Order enjoins Messrs.
Chambers
from, directly or indirectly, engaging in the sale or offer for sale
of
securities in the form of fractional undivided interests in oil or
gas
leases of Chambers Oil and Gas or any other security without a
registration statement being in effect or an exemption from registration
otherwise being available. To the extent a court were to conclude
that the
TEC acquisition constitutes the sale of securities by Messrs. Chambers
in
violation of the Order of Permanent Injunction, Platinum potentially
could
be subject to a successor liability claim to the extent that any
liability
was imposed upon Tandem as a
result.
|
|
|
·
|
Lance
Duncan is a former director and officer of Tandem who entered into
a
consulting agreement with Platinum in October 2006. Mr. Duncan played
a
key role in connection with the acquisition by Tandem of the stock
of TEC
and the assets of Shamrock Energy Corporation, a Texas corporation.
It is
possible that a court could determine that Mr. Duncan acted as an
unlicensed broker-dealer in connection with such transactions. In
that
event, Platinum potentially could be subject to a successor liability
claim to the extent that any liability was imposed upon Tandem as
a
result.
|
4
|
|
·
|
Tandem
has been unsuccessful in its efforts to locate corporate records
and other
material agreements and documents relating to itself and its predecessors
in name for periods prior to mid-March 2005. As a result, no assurance
can
be given that certain actions taken with respect to Tandem were authorized
by the necessary corporate action on the part of Tandem’s board of
directors and its shareholders. Further, no assurance can be given
that
additional shares had not been issued by Tandem’s predecessors in name and
that therefore Tandem’s current capitalization is accurate. If
theoretically all of the 50,000,000 authorized shares of common stock
of
Pacific Medical Group (Tandem’s immediate predecessor in name) were issued
and outstanding, there would be an additional 83,678 shares (post
1:500
stock split) of Tandem common stock currently outstanding and Platinum
could be subject to a successor liability claim for up to approximately
$212,000 to the extent that the holders of the additional shares
do not
receive their full proportion of the Platinum common stock distributed
to
shareholders upon the liquidation and dissolution of Tandem. Platinum
potentially also could be subject to substantially higher successor
liability claims for other actions of the predecessors to Tandem’s current
management that were not properly authorized and implemented, including
any shares that Messrs. Ronald G. Williams or Lyle Mortensen may
claim to
have acquired in connection with the acquisition of Pacific Medical
Group
that were not disclosed to Tandem and thus not presently reflected
in the
shares currently outstanding.
|
|
|
·
|
Prior
to its acquisition of TEC, Mr. Williams claims to have acquired control
of
Pacific Medical Group from Mr. John Karlsson. Tandem has also been
unsuccessful in its efforts to obtain documentation relating to such
acquisition and, as such, has not been able to determine the amount
or
percentage of the outstanding shares of Pacific Medical Group that
Mr.
Williams acquired. Platinum could be subject to potential successor
liability claims to the extent that Mr. Williams did not properly
acquire
control of Pacific Medical Group and did not have proper authority
to
enter into the transactions with
TEC.
|
We
did
not receive a legal opinion relating to Tandem’s capitalization or corporate
actions in connection with the closing of the TEC acquisition. Given the
uncertainty regarding Tandem’ s prior corporate history, the lack of corporate
documentation, claims of share ownership and other related concerns, Tandem’s
legal counsel was unwilling to render such an opinion. Accordingly, we did
not
have a legal opinion to support the representation and warranties of Tandem
contained in the TEC acquisition agreement regarding these matters.
The
volatility of oil and natural gas prices due to factors beyond our control
greatly affects our profitability.
Our
revenues, operating results, profitability, future rate of growth and the
carrying value of our oil and natural gas properties depend primarily upon
the
prevailing prices for oil and natural gas. Historically, oil and natural gas
prices have been volatile and are subject to fluctuations in response to changes
in supply and demand, market uncertainty and a variety of additional factors
that are beyond our control. While prices over the past year have increased
dramatically, any significant decline in the price of oil and natural gas or
any
other unfavorable market conditions could have a material adverse effect on
our
operations, financial condition and level of expenditures for the development
of
our oil and natural gas reserves, and may result in write downs of our
investments as a result of our use of the full cost accounting
method.
Prices
for natural gas and crude oil fluctuate widely. These fluctuations in oil and
natural gas prices may result from relatively minor changes in the supply of
and
demand for oil and natural gas, market uncertainty and other factors that are
beyond our control, including:
|
|
·
|
worldwide
and domestic supplies of oil and natural
gas;
|
|
|
·
|
weather
conditions;
|
|
|
·
|
the
level of consumer demand;
|
|
|
·
|
the
price and availability of alternative
fuels;
|
|
|
·
|
the
availability of drilling rigs and completion
equipment;
|
|
|
·
|
the
proximity to, and capacity of transportation
facilities;
|
|
|
·
|
the
price and level of foreign imports;
|
|
|
·
|
the
nature and extent of domestic and foreign governmental regulation
and
taxation;
|
|
|
·
|
the
ability of the members of the Organization of Petroleum Exporting
Countries to agree to and maintain oil price and production
controls;
|
5
|
|
·
|
worldwide
economic and political conditions;
|
|
|
·
|
the
effect of worldwide energy conservation
measures;
|
|
|
·
|
political
instability or armed conflict in oil-producing regions;
and
|
|
|
·
|
the
overall economic environment.
|
These
factors and the volatility of the energy markets make it extremely difficult
to
predict future oil and natural gas price movements with any certainty. Declines
in oil and natural gas prices would not only reduce revenue, but could reduce
the amount of oil and natural gas that we can produce economically and, as
a
result, could have a material adverse effect on our financial condition, results
of operations and reserves.
Hedging
activities may prevent us from benefiting from price increases and may expose
us
to other risks.
Hedging
is a strategy that can help a company to mitigate the volatility of oil and
gas
prices by limiting its losses if oil and gas prices decline; however, this
strategy may also limit the potential gains that a company could realize if
oil
and gas prices increase. From time to time, we use derivative instruments
(primarily collars and price swaps) to hedge the impact of market fluctuations
on natural gas and crude oil prices and net income and cash flow. To the extent
that we engage in hedging activities, we may be prevented from realizing the
benefits of price increases above the levels of the hedges. Further, as a result
of hedges we entered into at fixed prices below current market prices, our
recent hedging activity has generated substantial losses to us. Hedging
activities are subject to risks associated with differences in prices at
different locations, particularly where transportation constraints restrict
a
producer’s ability to deliver oil and gas volumes to the delivery point to which
the hedging transaction is indexed. Additionally, hedging strategies are
normally more effective with companies with a certain volume of production,
and
our current oil production levels may not be sufficient to be able to employ
a
meaningful hedging strategy. When we acquired the TEC assets, there were some
open commodity derivatives. In its financial statements, Tandem did not
designate any of its currently open commodity derivatives as cash flow hedges;
therefore, all changes in the fair value of these contracts prior to maturity,
plus any realized gains or losses at maturity, are recorded as other income
(expense) in Tandem’s statements of operations. Certain “costless collars”
executed in June 2005 were employed to protect Tandem and its creditors from
exposure to lower oil and gas prices. However, in conjunction with that
protection, Tandem periodically incurred settlement losses associated with
the
ceiling component of such hedges when gas prices spiked in late 2005 and oil
prices spiked in mid 2006. As a result of those positions, we have and may
continue to periodically incur settlement losses associated with the ceiling
component of such hedges as oil prices have increased during 2007. For the
year
ended December 31, 2007, we reported a $1.5 million net loss on derivatives.
For
the three months ended March 31, 2008, we reported a $2.0 million net loss
on
derivatives.
Our
ability to sell crude oil and natural gas production could be materially harmed
by failure to obtain adequate services such as transportation and
processing.
The
sale
of crude oil and natural gas production depends on a number of factors beyond
our control, including the availability, proximity and capacity of pipelines,
natural gas gathering systems and processing facilities. Any significant change
in market factors affecting these infrastructure facilities or our failure
to
obtain these services on acceptable terms could materially harm our business.
We
deliver crude oil and natural gas through gathering systems and pipelines that
we do not own. These facilities may be temporarily unavailable due to market
conditions or mechanical reasons or may become unavailable in the
future.
Our
proved reserves will generally decline as reserves are produced and as such,
success will depend on acquiring or finding additional
reserves.
Our
future success depends upon our ability to find, develop or acquire additional
oil and natural gas reserves that are economically recoverable. According to
reports of proved reserves prepared as of December 31, 2007 by Williamson
Petroleum Consultants, Inc., independent petroleum engineers, and by our own
engineers, our proved reserves will decline at a rate of 18% per year as
reserves are produced and, except to the extent that we conduct successful
exploration or development activities or acquire properties containing proved
reserves, or both, such reserves will continue to decline. To increase reserves
and production, we must commence drilling, workover or acquisition activities.
There can be no assurance, however, that we will have sufficient resources
to
undertake these actions, that our drilling and workover projects or other
replacement activities will result in significant additional reserves or that
we
will have success drilling productive wells at low finding and development
costs. Furthermore, although our revenues may increase if prevailing oil and
natural gas prices increase significantly, our finding costs for additional
reserves may also increase.
6
Approximately
63% of our proved reserves are classified as proved
undeveloped.
Approximately
63% of our reserves are classified as proved undeveloped reserves. The future
development of these undeveloped reserves into proved developed reserves
is
highly dependent upon our ability to fund estimated total capital development
cost of approximately $54.7 million, of which $19.4 million, $24.7 million
and
$10.6 million are expected to be incurred in 2008, 2009 and 2010, respectively.
During the first three months of 2008, we expended $3.4 million. If such
development costs are not incurred or are substantially reduced, our proved
undeveloped and total proved reserves could be substantially reduced. The
reduction in such reserves could have a materially negative impact on our
ability to produce profitable future operations. The successful conversion
of
these proved undeveloped reserves into proved developed reserves is dependent
upon the following:
|
|
·
|
The
funding of the estimated proved undeveloped capital development costs
is
highly dependent upon our ability to generate sufficient working
capital
through operating cash flows, and our ability to borrow funds and/or
raise
equity capital.
|
|
|
·
|
Our
ability to generate sufficient operating cash flows is highly dependent
upon successful and profitable future operations and cash flows which
could be negatively impacted by fluctuating oil and gas prices and
increased operating costs. No assurance can be given that we will
have
successful and profitable future operations and positive future cash
flows.
|
|
|
·
|
Our
ability to borrow funds in the future is dependent upon the terms
of
future loan agreements, borrowing base calculations and other lending
and
operating conditions. No assurance can be given that we will be able
to
secure future borrowings at competitive borrowing rates and conditions,
if
at all.
|
|
|
·
|
Our
ability to secure equity funding is dependent upon a number of factors,
including our profitable operations and cash flows, capital market
conditions and general economic conditions. No assurance can be given
that
we will be able to secure adequate equity
funding.
|
|
|
·
|
Our
ability to secure related oilfield equipment and services on a timely
and
competitive basis. Presently, there is great demand for and often
extensive delays in securing oilfield equipment and services at any
price.
No assurance can be given that the requisite oilfield equipment and
services can be secured in a timely and competitive
manner.
|
|
|
·
|
Projections
for proved undeveloped reserves are largely based on their analogy
to
similar producing properties and to volumetric calculations. Reserves
projections based on analogy are subject to change due to subsequent
changes in the analogous properties. Volumetric calculations are
often
based upon limited log and/or core analysis data and incomplete reservoir
fluid and formation rock data. Since these limited data must frequently
be
extrapolated over an assumed drainage area, subsequent production
performance trends or material balance calculations may cause the
need for
significant revisions to the estimates of
reserves.
|
Estimates
of oil and natural gas depend on many assumptions that may vary substantially
from actual production.
There
are
numerous uncertainties inherent in estimating quantities of proved reserves
and
in projecting future rates of production and timing of expenditures, including
many factors beyond our control. The reserve information relating to proved
reserves set forth in this prospectus represents only estimates based on reports
of proved reserves prepared as of December 31, 2007 by Williamson Petroleum
Consultants, independent petroleum engineers, and by our own engineers.
Williamson Petroleum Consultants was not engaged to evaluate and prepare reports
relating to the probable reserves on our properties and interests as these
are
more uncertain than evaluations of proved reserves. Petroleum engineering is
not
an exact science. Information relating to our proved oil and natural gas
reserves is based upon engineering estimates. Estimating quantities of proved
crude oil and natural gas reserves is a complex process. It requires
interpretations of available technical data and various assumptions, including
assumptions relating to economic factors. Any significant inaccuracies in these
interpretations or assumptions or changes of conditions could cause the
quantities of our reserves to be overstated.
To
prepare estimates of economically recoverable crude oil and natural gas reserves
and future net cash flows, engineers analyze many variable factors, such as
historical production from the area compared with production rates from other
producing areas. It is also necessary to analyze available geological,
geophysical, production and engineering data, and the extent, quality and
reliability of this data can vary. The process also involves economic
assumptions relating to commodity prices, production costs, severance and excise
taxes, capital expenditures and workover and remedial costs. For these reasons,
estimates of the economically recoverable quantities of oil and natural gas
attributable to any particular group of properties, classifications of such
reserves based on risk of recovery and estimates of the future net cash flows
expected therefrom prepared by different engineers or by the same engineers
at
different times may vary substantially. Actual production, revenues and
expenditures with respect to our reserves will likely vary from estimates,
and
such variations may be material.
Our
operations entail inherent casualty risks which may not be covered by adequate
insurance.
We
must
continually acquire, explore and develop new oil and natural gas reserves to
replace those produced and sold. Our hydrocarbon reserves and revenues will
decline if we are not successful in our drilling, acquisition or exploration
activities. We hope to maintain our reserve base primarily through successful
exploration and production operations, but we may not be successful in this
regard. Casualty risks and other operating risks could cause reserves and
revenues to decline.
7
Our
operations are subject to inherent casualty risks such as fires, blowouts,
cratering and explosions. Other risks include pollution, the uncontrollable
flows of oil, natural gas, brine or well fluids. These risks may result in
injury or loss of life, suspension of operations, environmental damage or
property and equipment damage, all of which would cause us to experience
substantial financial loss. Our drilling operations involve risks from high
pressures and from mechanical difficulties such as stuck pipes, collapsed
casings and separated cables.
Although
many of our properties are located across Texas and southeast New Mexico and
are
not confined to one geographic area, our Tomball field, the largest producer
in
our current portfolio, and much of our Maverick business are located in the
Gulf
Coast region of Texas, an area that may be subject to catastrophic weather
and
natural disasters such as floods, earthquakes and hurricanes. If such a disaster
were to occur, it could severely disrupt our operations in that area and results
of operations could be materially and adversely affected. In accordance with
customary industry practice, we maintain insurance against some, but not all,
of
these risks. There can be no assurance that any insurance will be adequate
to
cover any losses or liabilities. We cannot predict the continued availability
of
insurance, or its availability at premium levels that justify its purchase.
In
addition, we may be liable for environmental damages caused by previous owners
of properties that we purchased, which liabilities would not be covered by
our
insurance. We are currently unaware of any material liability we may have for
environmental damages caused by previous owners of properties purchased by
us.
Many
of our wells produce at very low production rates while producing waste water
many times that rate.
Many
of
our wells produce at production rates as low as one barrel of oil equivalent
(“Boe”) per day and produce waste water at many times the rate of production.
Even a modest decrease in oil and gas prices may render these wells uneconomic
to produce, when compared to wells which produce at higher rates. Consequently,
these uneconomic wells could cause a downward revision in our oil and gas
reserves.
Our
operations also entail significant operating risks.
Our
drilling activities involve risks, such as drilling non-productive wells or
dry
holes, which are beyond our control. The cost of drilling and operating wells
and of installing production facilities and pipelines is uncertain. Cost
overruns are common risks that often make a project uneconomical. The decision
to purchase and to exploit a property depends on the evaluations made by reserve
engineers, the results of which are often inconclusive or subject to multiple
interpretations. We may also decide to reduce or cease its drilling operations
due to title problems, weather conditions, noncompliance with governmental
requirements or shortages and delays in the delivery or availability of
equipment or fabrication yards.
Our
future operating results could be negatively impacted by increases in costs
from
third party service providers.
Our
future operating results are dependent upon our ability to secure competitive
and timely third party oilfield services. Generally, the demand for and cost
of
oilfield services is directly related to oil and gas commodity prices and the
number of skilled oilfield laborers in the area. Presently, in our area of
operations, there are a limited number of third party services providers, a
limited amount of oilfield service equipment, and a limited number of skilled
oilfield laborers. In addition, many third party service providers are committed
to providing oilfield services to entities that have much greater financial
resources and oilfield demand than our company. These conditions could
significantly increase our cost of third party services and have a negative
impact on our ability to secure oilfield services on a timely basis. No
assurance can be given that our future operations will not be further negatively
impacted by our inability to secure third party services at competitive
prices.
Our
operations are subject to various governmental regulations that require
compliance that can be burdensome and expensive.
Our
oil
and natural gas operations are subject to extensive federal, state and local
governmental regulations that may be changed from time to time in response
to
economic and political conditions. Matters subject to regulation relate to
the
general population’s health and safety and are associated with compliance and
permitting obligations including regulations related to discharge from drilling
operations, use, storage, handling, emission and disposal, drilling bonds,
reports concerning operations, the spacing of wells, unitization and pooling
of
properties and taxation. From time to time, regulatory agencies have imposed
price controls and limitations on production by restricting the rate of flow
of
oil and natural gas wells below actual production capacity to conserve supplies
of oil and natural gas. In addition, the production, handling, storage,
transportation and disposal of oil and natural gas, by-products thereof and
other substances and materials produced or used in connection with oil and
natural gas operations are subject to regulation under federal, state and local
laws and regulations primarily relating to protection of human health and the
environment. These laws and regulations have continually imposed increasingly
strict requirements for water and air pollution control and solid waste
management, and compliance with these laws may cause delays in the additional
drilling and development of our properties. Significant expenditures may be
required to comply with governmental laws and regulations applicable to us.
We
believe the trend of more expansive and stricter environmental legislation
and
regulations will continue. While, historically, TEC did not experience any
material adverse effect from regulatory delays, there can be no assurance that
such delays will not occur for us in the future.
8
Our method
of accounting for investments in oil and natural gas properties may result
in
impairment of asset value, which could affect our stockholder equity and net
profit or loss.
We
follow
the full cost method of accounting for our crude oil and natural gas properties.
Under this method, all direct costs and certain directly related internal costs
associated with acquisition of properties and successful, as well as
unsuccessful, exploration and development activities are capitalized.
Depreciation, depletion and amortization of capitalized crude oil and natural
gas properties and estimated future development costs, excluding unproved
properties, are based on the unit-of-production method based on proved developed
reserves. Net capitalized costs of crude and natural gas properties, as adjusted
for asset retirement obligations, net of salvage value, are limited, by country,
to the lower of unamortized cost or the cost ceiling, defined as the sum of
the
present value of estimated future net revenues from proved reserves based on
unescalated prices discounted at 10%, plus the cost of properties not being
amortized, if any, plus the lower of cost or estimated fair value of unproved
properties included in the costs being amortized, if any, less related income
taxes. Excess costs are charged to proved property impairment expense. No gain
or loss is recognized upon sale or disposition of crude oil and natural gas
properties, except in unusual circumstances.
Properties
that we acquire may not produce as projected, and we may be unable to identify
liabilities associated with the properties or obtain protection from sellers
against them.
As
part
of our business strategy, we continually seek acquisitions of oil and gas
properties. The successful acquisition of oil and natural gas properties
requires assessment of many factors, which are inherently inexact and may be
inaccurate, including the following:
|
|
·
|
future
oil and natural gas prices;
|
|
|
·
|
the
amount of recoverable reserves;
|
|
|
·
|
future
operating costs;
|
|
|
·
|
future
development costs;
|
|
|
·
|
failure
of titles to properties;
|
|
|
·
|
costs
and timing of plugging and abandoning wells;
and
|
|
|
·
|
potential
environmental and other
liabilities.
|
Our
assessment will not necessarily reveal all existing or potential problems,
nor
will it permit us to become familiar enough with the properties to assess fully
their capabilities and deficiencies. With respect to properties on which there
is current production, we may not inspect every well location, every potential
well location, or pipeline in the course of our due diligence. Inspections
may
not reveal structural and environmental problems such as pipeline corrosion
or
groundwater contamination. We may not be able to obtain or recover on
contractual indemnities from the seller for liabilities that it created. We
may
be required to assume the risk of the physical condition of the properties
in
addition to the risk that the properties may not perform in accordance with
our
expectations.
Changes
in technology may render our products or services
obsolete.
The
oil
and gas E&P industry is substantially affected by rapid and significant
changes in technology. These changes may render certain existing energy sources,
such as oil and gas, and certain services and technologies currently used
obsolete. We cannot assure you that the technologies we use or rely upon will
not be subject to such obsolescence. While we may attempt to adapt and apply
the
services we provide to newer technologies, we cannot assure you that we will
have sufficient resources to fund these changes or that these changes will
ultimately prove successful.
Oil
and gas drilling and producing operations can be hazardous and may expose us
to
environmental liabilities.
Our
oil
and gas operations will subject us to many risks, including well blowouts,
cratering and explosions, pipe failure, fires, formations with abnormal
pressures, uncontrollable flows of oil, natural gas, brine or well fluids,
and
other environmental hazards and risks. If any of these risks occur, we could
sustain substantial losses as a result of:
|
|
·
|
injury
or loss of life;
|
|
|
·
|
severe
damage to or destruction of property, natural resources and
equipment;
|
|
|
·
|
pollution
or other environmental damage;
|
|
|
·
|
clean-up
responsibilities;
|
9
|
|
·
|
regulatory
investigations and penalties; and
|
|
|
·
|
suspension
of operations.
|
Our
liability for environmental hazards could include those created either by the
previous owners of properties that we purchase or lease or by acquired companies
prior to the date we acquire them. We expect to maintain insurance against
some,
but not all, of the risks described above. Our insurance may not be adequate
to
cover casualty losses or liabilities. Also, we may not be able to obtain
insurance at premium levels that justify its purchase.
We
depend on key personnel to execute our business
plans.
The
loss
of any key executives or any other key personnel could have a material adverse
effect on our operations. We depend on the efforts and skill of our key
executives and personnel. Moreover, as we continue to grow our asset base
and
the scope of our operations, future profitability will depend on our ability
to
attract and retain qualified personnel. Mr. Tim Culp, our Chairman of the
Board,
was TEC’s President and Chief Executive Officer prior to the consummation of the
TEC acquisition. Following consummation of our recent acquisition of
Maverick, Maverick’s founder and chief executive officer became our Chief
Operating Officer. On August 11, 2008, we hired Lisa Meier as our Chief
Financial Officer and Treasurer. We cannot predict the effect that any change
in
management might have on our operations.
Terrorist
activities and military and other actions could adversely affect our
business.
Terrorist
attacks and the threat of terrorist attacks, whether domestic or foreign, as
well as the military or other actions taken in response to these acts, cause
instability in the global financial and energy markets. The United States
government has issued public warnings that indicate that energy assets might
be
specific targets of terrorist organizations. These actions could adversely
affect us, in unpredictable ways, including the disruption of fuel supplies
and
markets, increased volatility in crude oil and natural gas prices, or the
possibility that the infrastructure on which we rely could be a direct target
or
an indirect casualty of an act of terror.
Our
officers and directors are now and may in the future become affiliated with
entities engaged in business activities similar to ours and, accordingly, may
have conflicts of interest in determining to which entity a particular business
opportunity should be presented.
Our
Chief
Executive Officer and certain of our directors are engaged in other business
endeavors and certain members of management are, and will likely in the future
become, affiliated with entities engaged in the oil and gas E&P industry or
other business activities similar to those of Platinum. For example, Mr. Jim
Dorman, our executive vice president, owns approximately 30% of KD Resources,
LLC, a privately-owned Delaware limited liability company that purchased certain
oil and gas properties in Texas in May 2007. Mr. Dorman’s son, Mr. James T.
Dorman is the chief executive officer of KD Resources, LLC. In addition, Mr.
Barry Kostiner, our Chief Executive Officer and a director of Platinum, is
a 28%
owner of Braesridge Energy LLC, which invests in energy companies, including
ours. Braesridge also owns approximately 65% of KD Resources. Mr. Kostiner
was
the manager of Braesridge Energy LLC until his resignation from such position
on
February 14, 2008. As of the date of this prospectus, Braesridge owns
approximately 3.5 million shares, or about 15.7%, of our outstanding common
stock, plus presently exercisable warrants to purchase an additional
approximately 5.3 million shares of common stock. Braesridge has entered into
an
agreement to purchase 420,603 shares of Platinum common stock from two Platinum
employees, Todd M. Yocham and Tobin Scott, upon the distribution of Tandem’s
assets pursuant to a registration statement of which this prospectus is a part.
Following this purchase, Braesridge will own a total of 3,875,403 shares,
or about 17.6%, of our outstanding common stock.
In
the
course of their current and/or future activities, our officers and directors
may
become aware of business or investment opportunities which may be appropriate
for presentation to us as well as the other entities with which they are or
may
become affiliated. Accordingly, they may have conflicts of interest in
determining to which entity a particular business opportunity should be
presented. In general, officers and directors of a corporation incorporated
under the laws of the State of Delaware are required to present business
opportunities to a corporation if:
|
|
·
|
the
corporation could financially undertake the
opportunity;
|
|
|
·
|
the
opportunity is within the corporation’s line of business;
and
|
|
|
·
|
it
would not be fair to the corporation and its stockholders for the
opportunity not to be brought to the attention of the
corporation.
|
As
a
result of multiple business affiliations, our Chief Executive Officer and
directors may have similar legal obligations relating to presenting business
opportunities meeting the above-listed criteria to multiple entities. In
addition, conflicts of interest may arise when our board of directors evaluates
a particular business opportunity with respect to the above-listed criteria.
We
cannot assure you that any of the above mentioned conflicts will be resolved
in
our favor. For a description of management’s current affiliations, see “Certain
Relationships and Related Party Transactions.”
10
Maverick
Engineering, our wholly owned subsidiary, is dependent upon a small number
of
customers for a large portion of its net revenues, and a decline in sales to
its
major customers could harm Maverick's results of
operations.
A
small
number of customers are responsible for a significant portion of Maverick's
net
revenues. During 2007, Maverick's 5 largest customers accounted for
approximately $22 million out of its $33.8 million of net revenues. Maverick's
customer concentration could increase or decrease depending on future customer
requirements, which will depend in large part on business conditions in the
market sectors in which Maverick's customers participate. The loss of one or
more major customers or a decline in sales to its major customers could
significantly harm Maverick's business and results of operations. If Maverick
is
not able to expand its customer base, it will continue to depend upon a small
number of customers for a significant percentage of its sales. There can be
no
assurance that its current customers will not reduce the amount of services
for
which Maverick is retained or otherwise terminate their relationship with
Maverick.
11
SPECIAL
NOTE REGARDING FORWARD-LOOKING STATEMENTS
This
prospectus, including the sections entitled “Prospectus Summary,” “Risk
Factors,” “Management’s Discussion and Analysis of Financial Condition and
Results of Operations” and “Business,” contains forward-looking statements
within the meaning of Section 27A of the Securities Act of 1933, as amended,
and
Section 21E of the Securities Exchange Act of 1934, as amended. These statements
relate to future events or our future financial performance and involve known
and unknown risks, uncertainties and other factors that may cause our or our
industry’s actual results, levels of activity, performance or achievements to be
materially different from any future results, levels of activity, performance
or
achievements expressed or implied by the forward-looking statements. These
risks
and other factors include those listed under “Risk Factors” and elsewhere in
this prospectus. In some cases, you can identify forward-looking statements
by
terminology such as “may,” “will,” “should,” “expects,” “intends,” “plans,”
“anticipates,” “believes,” “estimates,” “predicts,” “potential,” “continue” or
the negative of these terms or other comparable terminology. These statements
are only predictions. Actual events or results may differ materially. In
evaluating these statements, you should specifically consider various factors,
including the risks outlined under “Risk Factors.” These factors may cause our
actual results to differ materially from any forward-looking
statement.
Although
we believe that the expectations reflected in the forward-looking statements
are
reasonable, we cannot guarantee future results, levels of activity, performance
or achievements. Moreover, neither we nor any other person assumes
responsibility for the accuracy and completeness of these forward-looking
statements. We are under no duty to update any of the forward-looking statements
after the date of this prospectus to conform our prior statements to actual
results.
USE
OF PROCEEDS
This
prospectus relates to shares of our common stock that Tandem is distributing
to
its shareholders as part of Tandem’s dissolution under Nevada law. Immediately
prior to its dissolution on June 24, 2008, Tandem’s assets consisted of the
Platinum common stock covered by this prospectus. Under Nevada law, as part
of
Tandem’s dissolution, it is required to distribute its assets to its
shareholders. Tandem shareholders will receive these shares as part of the
dissolution by virtue of their ownership of shares of Tandem, and will not
be
paying any consideration to Tandem or Platinum. There will not be any proceeds
from the distribution of the shares covered by this prospectus.
DIVIDEND
POLICY
We
have
not declared or paid any dividends to date. We currently intend to retain future
earnings, if any, to support the development and expansion of our business
and
do not anticipate paying any cash dividends on our common stock in the
foreseeable future. Any future determination to pay dividends will be at the
discretion of our board of directors and will depend on our financial condition,
results of operations, capital requirements and other factors our board deems
relevant.
The
following table summarizes the authorized, issued and outstanding shares and
related additional paid-in-capital of Platinum as of July 16,
2008:
|
STOCKHOLDERS'
EQUITY
|
Shares Issued
and Outstanding |
Amount
|
|||||
|
|
|
|
|||||
|
Preferred
stock, $.0001 par value, 1,000,000 authorized, 0 issued
|
-
|
-
|
|||||
|
Common
stock, $.0001 par value; 75,000,000 shares authorized;
|
24,068,675
|
$
|
2,407
|
||||
|
Additional
paid-in capital
|
155,064,142
|
||||||
|
|
|||||||
|
Treasury
stock - common shares
|
(1,997,913
|
)
|
(15,661,464
|
)
|
|||
|
|
|||||||
|
|
22,070,762
|
$
|
139,405,085
|
||||
The 22,070,762
shares of common stock outstanding as of the date of this prospectus does not
include the following shares:
|
|
·
|
14,400,000
shares of common stock issuable upon exercise of our outstanding
warrants
at an exercise price of $6.00 per
share;
|
|
|
·
|
4,000,000
shares of common stock available and reserved for future issuance
under
our 2006 Long-Term Incentive Plan;
|
12
|
|
·
|
535,714
shares of common stock issuable to Lance Duncan pursuant to a consulting
agreement between Platinum and Mr.
Duncan;
|
|
|
·
|
1,997,913
shares of common stock that have been repurchased by Platinum under
our
share repurchase program and have been designated as treasury shares;
and
|
|
|
·
|
1,440,000
shares underlying the purchase option granted to the underwriters
in our
IPO to purchase a total of 720,000 units at $10 per unit, which purchase
option became exercisable upon our acquisition of the TEC assets
and
expires October 24, 2010, consisting of 720,000 shares underlying
such
units and 720,000 shares issuable upon exercise of the warrants underlying
such units at an exercise price of $7.50 per
share.
|
You
should read this table in conjunction with “Selected Historical Financial Data,”
“Management’s Discussion and Analysis of Financial Condition and Results of
Operations” and the financial statements and the related notes and schedules
thereto included elsewhere in this prospectus.
MARKET
PRICE AND DIVIDEND DATA FOR PLATINUM SECURITIES;
SHARE
REPURCHASE PROGRAM
Platinum
consummated its IPO on October 28, 2005. In the IPO, we sold 14,400,000 units.
Each unit consists of one share of Platinum’s common stock and one redeemable
common stock purchase warrant. Platinum common stock, warrants and units are
quoted on the OTCBB under the symbols “PGRI”, “PGRIW” and “PGRIU”, respectively.
Platinum’s units commenced public trading on October 28, 2005 and its common
stock and warrants commenced separate public trading on December 9, 2005. The
high and low bid prices of our units, common stock and warrants as reported
by
the OTCBB for the quarter indicated are as follows. Such inter-dealer quotations
do not necessarily represent actual transactions and do not reflect retail
mark-ups, mark-downs or commissions:
|
|
Units
|
Common Stock
|
Warrants
|
||||||||||||||||
|
|
High
|
Low
|
High
|
Low
|
High
|
Low
|
|||||||||||||
|
2008:
|
|
|
|
|
|
|
|||||||||||||
|
Third
Quarter (through August 7)
|
$
|
6.39
|
$
|
4.01
|
$
|
4.70
|
$
|
3.72
|
$
|
0.96
|
$
|
0.73
|
|||||||
|
Second
Quarter
|
$
|
6.39
|
$
|
5.50
|
$
|
5.15
|
$
|
4.40
|
$
|
1.10
|
$
|
0.84
|
|||||||
|
First
Quarter
|
$
|
8.40
|
$
|
6.00
|
$
|
6.97
|
$
|
4.60
|
$
|
1.85
|
$
|
1.00
|
|||||||
|
2007:
|
|||||||||||||||||||
|
Fourth
Quarter
|
$
|
10.00
|
$
|
8.19
|
$
|
7.99
|
$
|
6.60
|
$
|
2.21
|
$
|
0.63
|
|||||||
|
Third
Quarter
|
$
|
8.45
|
$
|
7.85
|
$
|
7.65
|
$
|
7.50
|
$
|
0.81
|
$
|
0.35
|
|||||||
|
Second
Quarter
|
$
|
8.25
|
$
|
7.83
|
$
|
7.60
|
$
|
7.40
|
$
|
0.74
|
$
|
0.31
|
|||||||
|
First
Quarter
|
$
|
7.95
|
$
|
7.60
|
$
|
7.41
|
$
|
7.26
|
$
|
0.57
|
$
|
0.43
|
|||||||
|
2006:
|
|||||||||||||||||||
|
Fourth
Quarter
|
$
|
8.10
|
$
|
7.60
|
$
|
7.30
|
$
|
7.08
|
$
|
0.85
|
$
|
0.47
|
|||||||
|
Third
Quarter
|
$
|
8.22
|
$
|
7.70
|
$
|
7.30
|
$
|
7.08
|
$
|
1.00
|
$
|
0.55
|
|||||||
|
Second
Quarter
|
$
|
8.88
|
$
|
7.98
|
$
|
7.40
|
$
|
7.07
|
$
|
1.39
|
$
|
0.78
|
|||||||
|
First
Quarter
|
$
|
8.38
|
$
|
7.78
|
$
|
7.24
|
$
|
6.90
|
$
|
1.12
|
$
|
0.84
|
|||||||
Holders
As
of
August 1, 2008, there was one holder of record of the units, eleven holders
of
record of the common stock and one holder of record of the warrants. Platinum
believes that, as of this date, there were approximately 50 beneficial holders
of the units, 150 beneficial holders of the common stock and 200
beneficial holders of the warrants.
Share
Repurchase Program
In
November 2006, our board approved a share repurchase program to repurchase
Platinum shares of Platinum common stock in open market transactions in an
amount up to $80 million, following the consummation of a business combination.
Effective November 1, 2007, our board of directors instituted the initial stage
of this share repurchase program and established a plan in conformity with
the
provisions of Rules 10b5-1 to purchase up to 2,000,000 shares of Platinum common
stock in open market transactions during the month of November 2007, subject
to
the broker, volume, price and timing restrictions of Rule 10b-18 under the
Securities Exchange Act of 1934. We purchased 1,997,913 shares for an aggregate
of $15,661,464 in November 2007 under this stage of the repurchase program,
which we financed with available cash. Our initial share repurchase plan expired
at the end of November, but we may resume repurchases in the future, pursuant
to
our share repurchase program.
Dividends
Platinum
has not paid any cash dividends on its common stock to date. It is the present
intention of the board of directors to retain all earnings, if any, for use
in
the business operations, and accordingly, the board does not anticipate
declaring any dividends in the foreseeable future. The payment of any dividends
will be within the discretion of the board of directors and will be contingent
upon our financial condition, results of operations, capital requirements and
other factors our board deems relevant.
13
Platinum
Selected Historical Financial Information
The
following table sets forth certain selected consolidated financial information
of Platinum. The selected financial information presented below was derived
from
Platinum’s audited consolidated financial statements for the period from April
25, 2005 (inception) to December 31, 2005, and for the years ended December
31,
2006 and 2007, and Platinum’s unaudited condensed consolidated financial
statements for the three months ended March 31, 2008. All of the data should
be
read together with Platinum’s historical financial statements for the period
from April 25, 2005 (inception) to December 31, 2005, for the years ended
December 31, 2006 and 2007 and for the three months ended March 31, 2007 and
2008 and the related notes thereto and Platinum’s Management’s Discussion and
Analysis of Financial Condition and Results of Operations presented elsewhere
herein. Data for the three months ended March 31, 2007 are not presented since
it preceded the date of acquisition of TEC. The selected data provided are
not
necessarily indicative of Platinum’s future results of operations or financial
performance.
|
Period From
April 25, 2005 (Inception) to December 31, |
Year Ended
December 31, |
Year Ended
December 31, |
For the Three
Months Ended
March 31,
|
||||||||||
|
2005
|
2006
|
2007
|
2008
|
||||||||||
|
Income
Statement Data :
|
|||||||||||||
|
Operating
revenues
|
$
|
—
|
$
|
—
|
$
|
4,308,184
|
$
|
7,134,804
|
|||||
|
Lease
and other operating expenses
|
$
|
—
|
$
|
—
|
$
|
1,776,247
|
$
|
2,456,306
|
|||||
|
Operating
Expenses
|
$
|
167,274
|
$
|
786,300
|
$
|
28,015
|
$ | — | |||||
|
Stock
based compensation
|
$
|
—
|
$
|
—
|
$
|
1,250,000
|
$
|
—
|
|||||
|
Depreciation,
depletion and amortization
|
$
|
—
|
$
|
—
|
$
|
1,253,026
|
$
|
2,063,289
|
|||||
|
Other
Income - Interest, net
|
$
|
471,102
|
$
|
2,565,979
|
$
|
2,716,187
|
$ | 159,693 | |||||
|
Change
in fair value of derivatives - increase (decrease)
|
$
|
—
|
$
|
—
|
$
|
(1,472,522
|
)
|
$
|
(2,035,923
|
)
|
|||
|
Net
income (loss)
|
$
|
275,728
|
$
|
1,659,679
|
$
|
(373,032
|
)
|
$ | (1,000,517 | ) | |||
|
Weighted
average common stock and common stock equivalents outstanding:
|
|||||||||||||
|
Basic
|
6,549,489
|
15,121,440
|
18,876,347
|
22,072,762 | |||||||||
|
Diluted
|
6,980,246
|
17,479,194
|
18,876,347
|
22,072,762 | |||||||||
|
Net
Income (Loss) Per Common Share -
|
|||||||||||||
|
Basic
|
$
|
0.04
|
$
|
0.11
|
$
|
(0.02
|
)
|
$ | (0.05 | ) | |||
|
Diluted
|
$
|
0.04
|
$
|
0.09
|
$
|
(0.02
|
)
|
$ | (0.05 | ) | |||
|
Cash
Dividends Declared Per Share
|
$
|
—
|
$
|
—
|
$
|
—
|
— | ||||||
|
|
December 31,
2005 |
December 31,
2006 |
December 31,
2007 |
March 31,
2008
|
|||||||||
|
Balance
Sheet Data
|
|||||||||||||
|
Working
Capital (Deficiency) (Excluding Cash held in trust)
|
$
|
888,439
|
$
|
(1,683,186
|
)
|
$
|
14,158,775
|
$
|
12,324,460
|
||||
|
Cash
Held in Trust
|
$
|
105,884,102
|
$
|
109,213,492
|
$
|
—
|
—
|
||||||
|
Total
Assets
|
$
|
106,905,311
|
$
|
110,955,650
|
198,389,193
|
$
|
206,225,452
|
||||||
|
Long-term
debt, less current maturities
|
$
|
—
|
$
|
—
|
$
|
5,508,767
|
|||||||
|
Common
Stock Subject to Possible Redemption, 2,878,560 Common Shares
at
Conversion Value
|
$
|
21,071,059
|
$
|
21,831,777
|
$
|
—
|
—
|
||||||
|
Total
liabilities
|
$
|
21,203,829
|
$
|
23,594,489
|
$
|
57,421,733
|
$
|
66,258,509
|
|||||
|
Total
stockholders’ equity
|
$
|
85,701,482
|
$
|
87,361,161
|
$
|
140,967,460
|
$
|
139,966,943
|
|||||
|
|
|||||||||||||
|
Cash
flow provided by (used in)
|
|||||||||||||
|
Operating
activities
|
$
|
289,787
|
$
|
2,111,707
|
$
|
(112,554
|
)
|
$
|
556,419
|
||||
|
Investing
activities
|
$
|
(105,884,102
|
)
|
$
|
(3,849,923
|
)
|
$
|
45,719,620
|
$
|
(7,433,219
|
)
|
||
|
Financing
activities
|
$
|
106,496,813
|
$
|
835,718
|
$
|
(29,177,446
|
)
|
5,508,767
|
|||||
|
Operating
Data:
|
|||||||||||||
|
Product
sales
|
|||||||||||||
|
Oil
(Bbl)
|
—
|
—
|
38,684
|
58,700
|
|||||||||
|
Gas
(Mcf)
|
—
|
—
|
125,849
|
177,200
|
|||||||||
|
Boe
|
—
|
—
|
59,659
|
88,200
|
|||||||||
|
Average
sales prices
|
|||||||||||||
|
Oil
($/Bbl)
|
$
|
—
|
$
|
—
|
$
|
85.24
|
$
|
96.83
|
|||||
|
Gas
($/Mcf)
|
$
|
—
|
$
|
—
|
$
|
8.03
|
$
|
8.10
|
|||||
|
Average
Lifting Cost per Boe of Production:
|
$
|
—
|
$
|
—
|
$
|
29.77
|
$
|
27.53
|
|||||
|
Proved
reserves
|
|||||||||||||
|
Oil
(Bbls)
|
—
|
—
|
6,525,750
|
—
|
|||||||||
|
Gas
(Mcf)
|
—
|
—
|
21,811,856
|
—
|
|||||||||
|
Boe
|
—
|
—
|
10,161,059
|
—
|
|||||||||
14
Tandem
Selected Historical Financial Information
The
following table sets forth certain selected financial and operational data
of
Tandem as the former parent company of TEC. TEC was the sole subsidiary of
Tandem. Tandem’s assets consisted largely of its investment in TEC, and,
accordingly, the consolidated financial statements of Tandem represent the
assets that were acquired and liabilities that were assumed by
Platinum. The selected financial information presented below was derived from
Tandem’s audited consolidated financial statements for the period January 1,
2007 through October 26, 2007 and for the three year period ended December
31,
2006, and from Tandem’s unaudited consolidated financial statements for the year
ended December 31, 2003. The unaudited selected financial information for the
year ended December 31, 2003 is presented for TEC only and does not include
financial information reflecting the acquisition of the properties of Shamrock
Energy Corporation. The operational data for all periods presented is unaudited.
All the data should be read together with Tandem’s historical consolidated
financial statements and accompanying notes and Tandem’s Management’s Discussion
and Analysis of Financial Condition and Results of Operations presented
elsewhere in this prospectus. The selected data provided are not necessarily
indicative of Tandem’s future results of operations or financial performance.
|
For the Years Ended December 31,
|
January 1 to
October 26, |
|||||||||||||||
|
Unaudited
|
Audited
|
Audited
|
||||||||||||||
|
2003
|
2004
|
2005
|
2006
|
2007
|
||||||||||||
|
(in thousands, except per share, production and reserve information)
|
||||||||||||||||
|
Consolidated
Income Statement Data:
|
|
|
|
|
|
|||||||||||
|
Operating
revenues
|
$
|
5,360
|
$
|
8,018
|
$
|
14,249
|
$
|
18,051
|
$
|
13,985
|
||||||
|
Lease
operating expenses (1)
|
3,093
|
2,841
|
4,273
|
6,517
|
5,500
|
|||||||||||
|
Net
income (loss)
|
696
|
3,714
|
(36,309
|
)
|
6,295
|
(2,851
|
)
|
|||||||||
|
Net
income (loss) per common share
|
|
|
|
|
|
|||||||||||
|
Basic
and diluted
|
$
|
0.23
|
$
|
1.24
|
$
|
(1.96
|
)
|
$
|
0.26
|
(0.12
|
)
|
|||||
|
Weighted
average common stock and common stock equivalents
outstanding
|
|
|
|
|
|
|||||||||||
|
Basic
and diluted
|
3,000
|
3,000
|
18,515
|
23,799
|
23,792
|
|||||||||||
|
Consolidated
Balance Sheet Data:
|
|
|
|
|
|
|||||||||||
|
Total
assets
|
$
|
4,374
|
$
|
8,520
|
$
|
34,650
|
$
|
36,903
|
$
|
36,477
|
||||||
|
Total
liabilities
|
1,831
|
3,227
|
51,397
|
47,356
|
49,825
|
|||||||||||
|
Long-term
debt, less current maturities
|
1,300
|
—
|
42,000
|
40,250
|
21,000
|
|||||||||||
|
Total
stockholders’ equity (deficit)
|
2,543
|
5,293
|
(16,747
|
)
|
(10,453
|
)
|
(13,348
|
)
|
||||||||
|
Consolidated
Statement of Cash Flow Data:
|
|
|
|
|
|
|||||||||||
|
Cash
flow provided by (used in)
|
|
|
|
|
|
|||||||||||
|
Operating
activities
|
$
|
689
|
$
|
4,524
|
$
|
6,259
|
$
|
5,995
|
$
|
2,299
|
||||||
|
Investing
activities
|
(475
|
)
|
(998
|
)
|
(6,751
|
)
|
(6,702
|
)
|
(1,177
|
)
|
||||||
|
Financing
activities
|
—
|
(1,771
|
)
|
610
|
(500
|
)
|
(545
|
)
|
||||||||
|
Operating
Data:
|
|
|
|
|
|
|||||||||||
|
Product
sales
|
|
|
|
|
|
|||||||||||
|
Oil
(Bbl)
|
96,459
|
103,788
|
156,503
|
214,845
|
165,282
|
|||||||||||
|
Gas
(Mcf)
|
462,817
|
678,085
|
723,634
|
735,550
|
560,900
|
|||||||||||
|
Boe
|
173,595
|
216,802
|
277,109
|
(2)
|
337,437
|
258,766
|
||||||||||
|
Average
sales prices
|
|
|
|
|
|
|||||||||||
|
Oil
($/Bbl)
|
$
|
29.91
|
$
|
40.48
|
$
|
56.18
|
$
|
62.94
|
$
|
61.68
|
||||||
|
Gas
($/Mcf)
|
$
|
5.40
|
$
|
5.63
|
$
|
7.54
|
$
|
6.16
|
$
|
6.76
|
||||||
|
Average
Lifting Cost per Boe of Production:
|
$
|
17.82
|
$
|
13.10
|
$
|
15.42
|
$
|
19.31
|
$
|
21.25
|
||||||
|
Proved
reserves
|
|
|
|
|
|
|||||||||||
|
Oil
(Bbls)
|
268,150
|
988,597
|
5,814,505
|
5,539,928
|
5,523,587
|
|||||||||||
|
Gas
(Mcf)
|
5,848,673
|
16,603,591
|
21,896,697
|
20,786,645
|
20,892,748
|
|||||||||||
|
Boe
|
1,242,929
|
3,755,862
|
9,463,955
|
(3)
|
9,004,369
|
9,005,712
|
||||||||||
15
The
following unaudited information relates to TEC’s net and gross oil and gas wells
and developed leasehold acres as of October 26, 2007:
|
|
Net
|
Gross
|
|||||
|
Productive
oil wells
|
201.3
|
272.0
|
|||||
|
Productive
gas wells
|
13.8
|
21.0
|
|||||
|
Total
productive wells (4)
|
215.1
|
293.0
|
|||||
|
Developed
leasehold acres
|
16,480
|
21,550
|
|||||
|
(1)
|
Lease
operating expenses include all direct operating expenses, severance
taxes
on oil and gas, and ad valorem taxes associated with oil and gas
properties.
|
|
|
|
|
(2)
|
Production
on a Boe basis for 2005 was 28% higher than 2004. This increase was
due
primarily to the production from the oil and gas properties acquired
from
Shamrock in June, 2005.
|
|
|
|
|
(3)
|
Proved
reserves increased approximately 250% from 2004 to 2005 due primarily
to
the oil and gas properties acquired from Shamrock in June, 2005 and
the
effect of higher pricing on the economic limit of the consolidated
reserves at the end of 2005.
|
|
|
|
|
(4)
|
The
total productive well count includes 40 oil wells and no gas wells
completed in multiple zones.
|
SELECTED
UNAUDITED PRO FORMA CONDENSED COMBINED FINANCIAL INFORMATION
OF
PLATINUM
AND MAVERICK
As
more
fully described under “Management’s Discussion and Analysis Of Financial
Condition and Results of Operations – Liquidity and Capital Resources” on
page 22, we acquired Maverick on April 29, 2008. The following selected
unaudited pro forma condensed combined financial information is intended to
provide you with a picture of what the business of Platinum and TEC, a
predecessor, might have looked like had the Maverick acquisition been completed
on January 1, 2007 with respect to the year ended December 31, 2007 and as
of
January 1, 2008 with respect to the three month period ended March 31, 2008
or
on March 31, 2008, as applicable. You should not rely on the selected unaudited
pro forma condensed combined financial information as being indicative of the
historical results that would have occurred had the Maverick acquisition
occurred at the indicated dates or of the future results that may be achieved
after the acquisition. The following selected unaudited pro forma condensed
combined financial information has been derived from, and should be read in
conjunction with, the unaudited pro forma condensed combined financial
statements and related notes thereto starting on page F-107.
16
|
Year
Ended
December 31, 2007 |
Three Months
Ended
March 31, 2008
|
||||||
|
Consolidated Pro-Forma Income Statement Data:
|
|||||||
|
Total
Revenues
|
$
|
51,512,285
|
$
|
16,817,925
|
|||
|
Cost
of revenues and lease operating expenses
|
$
|
35,526,203
|
$
|
10,888,422
|
|||
|
Net
loss
|
$
|
(7,875,131
|
)
|
$
|
(1,412,392
|
)
|
|
|
Net
loss per common share - basic and diluted
|
$
|
(0.42
|
)
|
$
|
(0.06
|
)
|
|
|
Weighted
average common stock and common stock equivalents outstanding:
|
|||||||
|
Basic
and diluted
|
18,876,347
|
22,070,762
|
|||||
|
|
As
of March
31, 2008 |
|||
|
Consolidated
Pro-Forma Balance Sheet Data:
|
||||
|
Total
assets
|
|
$
|
218,170,252
|
|
|
Working
capital
|
|
$
|
7,501,860
|
|
|
Total
liabilities
|
|
$
|
78,203,309
|
|
|
Long-term
debt, less current maturities
|
|
$
|
14,354,946
|
|
|
Total
stockholders’ equity
|
|
$
|
139,966,943
|
|
|
Book
value per common share
|
|
$
|
6.34
|
|
MANAGEMENT’S
DISCUSSION AND ANALYSIS
OF
FINANCIAL CONDITION AND RESULTS OF OPERATIONS
On
October 26, 2007, we acquired substantially all of the assets and assumed
substantially all of the liabilities of TEC. Prior to that time, we were a
blank
check company with no operations and no net revenues. Set forth below are:
(A)
Results of operations for Platinum and TEC (up to the date of its
acquisition by Platinum) for the following periods (as applicable) (i)
for the year ended December 31, 2006 as compared to the period from April 25,
2005 (Inception) to December 31, 2005 (ii) for the year ended December 31,
2007
as compared to the year ended December 31, 2006 and (iii) for the quarter ended
March 31, 2008 as compared to the quarter ended March 31, 2007. Included within
the results of operations for the year ended December 31, 2007 are the results
of operations of New TEC, our wholly owned subsidiary that purchased
substantially all of the assets of TEC on October 26, 2007, for the period
from
October 26, 2007 through December 31, 2007.
(B) Results
of operations - Oil and Gas provides a comparison of certain summarized
historical information for the quarter ended March 31, 2008 with the period
from
October 27, 2007 to December 31, 2007 in order to provide the reader with
certain meaningful analytical data.
(C)
Pro forma consolidated results of operations for Platinum/TEC for the
years ended December 31, 2007 and 2006. The unaudited pro forma financial
information gives effect to the TEC acquisition as if it happened on the first
day of each year.
For
Platinum/Maverick unaudited pro forma condensed combined financial statements
for the years ended December 31, 2007 and 2006 and as of and for the three
months ended March 31, 2008, please see page F-107.
The
following discussion should be read in conjunction with our financial statements
and related notes thereto included elsewhere in this prospectus.
17
Overview
On
October 26, 2007, we acquired substantially all of the assets and assumed
substantially all of the liabilities of TEC, including approximately $41.7
million of TEC’s debt which was retired at closing, in exchange for 7,692,308
shares of our common stock with a cash value of $7.80 per share. Prior to the
TEC acquisition, we were a blank check company. We were formed on April 25,
2005, to serve as a vehicle to effect a merger, capital stock exchange, asset
acquisition or other similar business combination with an unidentified operating
business in the global oil and gas exploration and production, or E&P,
industry. On October 28, 2005 we consummated an initial public offering of
our
equity securities from which we derived net proceeds of $106,472,000. Of the
net
proceeds of the IPO, $105,408,000 were placed in a trust account until the
closing of the TEC acquisition, at which point the $105,408,000, and the
interest thereon, was released from the trust. Our initial business combination
pursuant to which we became an operating company was the TEC
acquisition.
We
are
now an oil and natural gas exploration, development, acquisition, and production
company. Our basic business model is to find and develop oil and gas reserves
through development activities, and sell the production from those reserves
at a
profit. To be successful, we must, over time, be able to find oil and gas
reserves and then sell the resulting production at a price that is sufficient
to
cover our finding costs, operating expenses, administrative costs and interest
expense, plus offer us a return on our capital investment.
From
time
to time, we may make strategic acquisitions if we believe the acquired assets
offer us the potential for reserve growth through additional developmental
drilling activities. However, the successful acquisition of oil and natural
gas
properties requires assessment of many factors, which are inherently inexact
and
may be inaccurate, including future oil and natural gas prices, the amount
of
recoverable reserves, future operating costs, future development costs, failure
of titles to properties, costs and timing of plugging and abandoning wells
and
potential environmental and other liabilities.
We
believe that the economic climate in the domestic oil and gas industry continues
to be suitable for our business model. Oil prices are currently at near-record
levels, and gas prices are well above historic averages. Although oil and gas
prices are typically volatile and are subject to market fluctuations, we believe
that supply and demand fundamentals in the energy marketplace continue to
provide us with the economic incentives necessary for us to assume the risks
we
face in our search for oil and gas reserves. While profit margins remain
currently favorable, we cannot guarantee that rising finding costs, production
costs, and depletion expense will not affect our future success. Specifically,
our revenue, cash flow from operations and future growth depend substantially
on
many factors, including those beyond our control, such as economic, political
and regulatory developments and competition from other sources of energy.
Because of these factors, we continuously seeks ways to reduce exposure to
the
volatility in oil and natural gas prices. Our strategy is to hedge a portion
of
our expected future oil and natural gas production, using a mixture of calls,
puts, forward contracts and other derivative instruments, to reduce our exposure
to fluctuations in commodity price.
Furthermore,
like all businesses engaged in the exploration and production of oil and natural
gas, we face the challenge of natural production declines. As initial reservoir
pressures are depleted, oil and natural gas production from a given well
decreases. Thus, an oil and natural gas exploration and production company
depletes part of its asset base with each unit of oil or natural gas it
produces. Consequently, key to our success is not only finding reserves through
developmental drilling and strategic acquisitions, but also by exploiting
opportunities related to our existing production. For example, we have two
fields, the Ira Unit located in Scurry County, Texas, and the Ballard Unit
located in Eddy County, New Mexico which we believe contain substantial
opportunities to expand and enhance their existing waterflood capabilities.
These projects will require capital in the form of money and
expertise.
As
described below, on April 29, 2008 we acquired Maverick. Maverick is a provider
of project management, engineering, procurement, and construction management
services to both the public and private sectors, including the oil and gas
industry.
(A)
Results of Operations - Platinum
For
the year ended December 31, 2006 and the period from April 25, 2005 (Inception)
to December 31, 2005
For
the
year ended December 31, 2006 (“2006”) and the period from April 25, 2005
(Inception) to December 31, 2005 (“2005”), we had net income of $1,659,579 and
$275,728, respectively, attributable to net interest income on the proceeds
of
our IPO of $2,568,672 and $476,102, respectively (net of interest income in
the
amount of $760,718 and $0, respectively, attributable to shares of common stock
subject to conversion rights), offset by expenses attributable to organization
and formation expenses, expenses incurred in identifying and qualifying an
acquisition candidate and legal, accounting and administrative costs. As more
fully described below, the interest income was earned on funds held in the
trust
account. This interest income as well as other operating expenses increased
in
2006 as compared to 2005 principally because the funds were invested for a
full
year in 2006 as compared to less than three months in 2005. The funds held
in
trust and related interest income were only available, subject to certain
conditions, for use in making a qualified acquisition and not for our normal
daily operating expenses. Interest income was derived from sources free of
federal income taxes resulting in a lower than normal provision for income
taxes.
18
For
the year ended December 31, 2007 and the year ended December 31,
2006
For
the
years ended December 31, 2007 (“2007”) and December 31, 2006, we had a net loss
of $373,032 as compared to net income of $1,659,579, respectively. In 2007,
our
results of operation included those of the entities acquired on and subsequent
to October 26, 2007. These included the TEC acquisition and the other
transactions more specifically described in “Business - Growth Strategy”
beginning on page 34 and in Note 4 to the consolidated financial statements
beginning on page F-15. Results of operations for 2007 included net interest
income of $2,799,229 (substantially all of which was earned on funds held in
the
trust account and net of interest income in the amount of $616,217 attributable
to shares of common stock subject to conversion rights), after tax net loss
from
oil and gas operations approximating $729,000 (which included a non-cash loss
on
the change in the value of derivatives approximating $1,473,000) and a non-cash
charge for stock based compensation of $1,250,000 resulting from the Lance
Duncan consulting agreement described more fully in “Certain Relationships and
Related Party Transactions” beginning on page 58 and in Note 10 to the
consolidated financial statements beginning on page F-22. Results of operations
for 2006 were generated principally by net interest income on the proceeds
of
our IPO of $2,568,672 (net of interest income in the amount of $760,718,
attributable to shares of common stock subject to conversion rights), offset
by
expenses attributable to organization and formation expenses, expenses incurred
in identifying and qualifying an acquisition candidate and legal, accounting
and
administrative costs.
Consolidated
marketing, general and administrative expense increased to approximately
$1,491,000 in 2007 as compared to $718,000 in 2006, an increase of $773,000.
The
major increase was as a result of $551,000 in marketing, general and
administrative costs of the oil and gas operations acquired as described above,
and an increase of $250,000 in costs of Platinum, excluding those of the
acquired operations. The principal components of these changes were: (i) a
$267,000 increase in professional fees attributable to greater level of
activity, more frequent and complex SEC filings and internal accounting demands
and (ii) officers salaries approximating $55,000 incurred subsequent to October
26, 2007 offset by a reduction of $83,000 in travel and related
costs.
The
funds
held in trust and related interest income became available to us upon
consummation of the TEC acquisition. See “Liquidity and Capital Resources”
below. Interest income was derived from sources free of federal income taxes
resulting in a lower than normal provision for income taxes.
Other
income and expense decreased to $1,244,000 in 2007 as compared to $2,566,000
in
2006, a decrease of $1,322,000. While net interest income increased by $230,000
to $2,799,000 in 2007 as compared to $2,569,000 in 2006, Platinum incurred
$1,473,000 in non-cash loss as a result of mark-to-market losses on the fair
value of its derivatives, resulting entirely from its oil and gas operations.
We
will not continue to earn this level of interest in future years because funds
held in trust were expended for acquisitions, including the TEC acquisition,
share repurchases, and are now being used in operations.
For
the three month period ended March 31, 2008 as compared to the three month
period ended March 31, 2007
We
were a
blank check company for the three months ended March 31, 2007 and consequently
had no operations and no net operating results. For the three months ended
March
31, 2008, our results of operations included those of the oil and gas entities
acquired on and subsequent to October 26, 2007. See “Business - Growth Strategy”
beginning on page 34. For a comparison of results of operations relating to
our oil and gas assets, see “Results of Operations - Oil and Gas” below.
With
respect to our results of operations excluding our oil and gas assets, we had
no
net operating revenues during the three months ended March 31, 2008 or 2007.
Our
general and administrative expenses other than those attributable to our oil
and
gas assets for the three months ended March 31, 2008 was $690,000 (out of the
$1.7 million general and administrative expenses included in the Company’s
condensed consolidated results) as compared to approximately $155,000 in the
three months ended March 31, 2007. The increase of $535,000 in such expenses
for
the three months ended March 31, 2008 as compared to the three months ended
March 31, 2007 is attributable to our status as a parent company of an operating
business in 2008, including associated officer salaries, legal and accounting,
investor relations and other costs. Results of operations for the three months
ended March 31, 2007 included net interest income of $691,000 (substantially
all
of which was earned on funds held in the trust account and net of interest
income in the amount of $ 177,000 attributable to shares of common stock subject
to conversion rights), as compared to net interest income earned of $100,000
in
for three months ended March 31, 2008 on substantially lower cash
balances.
Results
of Operations – TEC Historical
The
following is a summary of financial information for TEC and is provided to
present the history of operating results from the assets purchased by Platinum
on October 26, 2007. The comparative results are for the period from January
1,
2007 through October 26, 2007 as compared to the year ended December 31, 2006
and for the year ended December 31, 2006 as compared to the year ended December
31, 2005. TEC’s parent company, Tandem, held assets consisting largely of its
investment in TEC, and, accordingly, the consolidated financial statements
of
Tandem represent the TEC assets.
19
Comparison
of the period from January 1, 2007 through October 26, 2007, to the Year Ended
December 31, 2006
TEC’s
oil
and gas sales revenues for the period from January 1, 2007 through October
26,
2007, consisting exclusively of oil and gas sales, $14.0 million compared to
$17.8 million during the year ending December 31, 2006. If we include the $4.1
million in oil and gas sales revenues of New TEC after October 26, 2007, TEC
would have recorded a 2% increase in revenues. The increase in revenues was
due
primarily to stronger oil prices during the 2007 period, offset by an overall
6%
decrease in production on a Boe basis.
Oil
and
gas production costs in the form of lease operating expense on a Boe basis
increased 10% from $19.31 per Boe during 2006 to $21.25 per boe during the
period from January 1, 2007 through October 26, 2007. The increase in operating
costs in 2007 was due primarily to a focus, in the Ira Field of Scurry County,
Texas, to bring a number of inactive wells into compliance with regulatory
statutes. This involved testing the integrity of the downhole casing in
approximately 40 wells. In a number of cases, the wells were repaired and either
placed back on production or remain idle awaiting further remedial work. In
some
cases, the wells were actually plugged and abandoned. Only the testing and
repair costs are included in lease operating expense. The cost to plug and
abandon these wells is not included in lease operating expense, but is included
in the capitalized costs of oil and gas properties. This particular testing
program was completed in October, 2007. Some elements of lease operating
expenses are only partially controllable by management. Other factors outside
management control, such as the availability of goods and services, could have
an adverse effect on lease operating costs in the future.
Comparison
of Fiscal Year ended December 31, 2006 to Fiscal Year ended December 31,
2005
The
results of operations between periods will not be comparable in most respects,
primarily due to the significance of the acquisition by TEC of certain Shamrock
Energy Corporation (“Shamrock") oil and gas properties in June
2005.
TEC’s
oil
and gas sales revenues for 2006, consisting exclusively of oil and gas sales,
increased 27% to $18.1 million compared to $14.2 million during 2005. The
increase in revenues was primarily attributable to the acquisition of the
Shamrock oil and gas properties in June 2005.
TEC’s
production for 2006 (on an Mboe basis) increased by 22% to 337.4 Mboe as
compared to 277.1 Mboe during 2005. This increase in production was due
primarily to the acquisition of the Shamrock oil and gas properties in June
2005.
For
2006,
TEC’s average realized gas price of $6.16 per Mcf represented an 18% decrease
from the average price of $7.54 during 2005, and its realized oil price per
barrel increased by 12% from $56.18 during 2005 to $62.94 during 2006. The
overall increases in average product prices were attributable to the
volatility of the markets for oil and gas, over which TEC had no
control.
Oil
and
gas production costs in the form of lease operating expense on a boe basis
increased from $15.42 per boe during 2005 to $19.31 per boe during 2006. The
increase in operating costs in 2006 was due primarily to the increased cost
of
goods and services in the oil and gas production industry. It is likely that
this trend will continue to contribute to higher production costs in future
periods.
Depreciation,
depletion and amortization (“DD&A”) increased 38%, from $1.9 million in 2005
to $2.6 million in 2006. The increase was due primarily to the Shamrock asset
acquisition in June 2005.
General
and administrative expense, excluding non-cash stock-based employee
compensation, was $2.8 million for 2006, 55% higher than this expense for 2005
of $1.8 million. Such increase was due primarily to higher administrative costs
associated with the acquisition of the Shamrock assets and legal and audit
fees
associated with the historical audits and due diligence efforts related to
the
proposed transaction with Platinum.
Gain
on
sales of property and equipment for 2005 of $707,239 consisted primarily of
a
gain associated with the sale of land located in and adjacent to TEC’s Tomball
field. TEC recognized a gain of $368,067 during the first quarter of 2006
related to the sale to a third party of one of TEC’s drilling rigs. Total gains
for the sale of property and equipment during 2006 was $401,470.
Interest
expense was $3.5 million during 2006 as compared to interest expense of $1.7
million during 2005. As of December 31, 2006, TEC’s indebtedness was $42.0
million as a result of funding the acquisitions of TEC and the assets of
Shamrock and the redemption of the shares of one of TEC’s two stockholders, all
of which occurred in June 2005. Outstanding indebtedness under a revolving
line
of credit facility with a bank in the amount of $21.0 million and notes payable
to the principles of TEC and Shamrock in the aggregate totaling $21.0 million
comprise the $42.0 million in indebtedness. The $3.5 million interest incurred
during 2006 consists of approximately $1.8 million associated with the revolving
line of credit and $1.7 million associated with the notes to the former
principles of TEC and Shamrock.
TEC
recorded a $3.5 million gain during 2006 associated with the change in fair
value of its derivatives since the end of 2005. Since TEC had not designated
any
derivative contracts as cash flow hedges, all cash settlements and changes
resulting from mark-to-market valuations were recorded as changes in fair value
of derivatives. Future gains or losses on changes in derivatives will be
impacted by the volatility of commodity and interest rates, as well as the
terms
of any new derivative contracts.
20
(B)
Results of Operations - Oil and Gas
The
following summary of oil and gas revenues and lease and other operating expenses
for the periods indicated is provided for comparative purposes. These
comparative results are for the period from October 26, 2007 through December
31, 2007 as compared to the three months ended March 31, 2008. As indicated
above, since our results for the three months ended March 31, 2007 are not
in
any way comparable to the three months ended March 31, 2008, we believe that
the
comparison of our current operating revenues to the immediately preceding period
would provide relevant information to assist in evaluating our
Company.
Comparison
of the period from October 26, 2007 through December 31, 2007, to the Three
Months Ended March 31, 2008
Any
reference in this comparison to the 2007 period relates to the period from
October 26, 2007 through December 31, 2007, and any reference to the 2008 period
relates to the three months ended March 31, 2008, unless otherwise
indicated.
Our
revenues, consisting entirely of oil and gas sales, for the period from October
26, 2007 through December 31, 2007 were $4.3 million. Oil and gas sales for
the
three months ended March 31, 2008 were $7.1 million. Other than the obvious
difference in the length of the comparative periods, we note that the average
oil price for the 2007 period was $85.24 compared to $96.83 for the 2008 period.
The average gas price increased from $8.03 during the 2007 period compared
to
$8.19 for the 2008 period. Daily production on a Boe basis increased from 890
Boe’s per day during the 2007 period to 970 Boe’s per day during the 2008
period.
Oil
and
gas production costs in the form of lease operating expense on a Boe basis
decreased 7.5% from $29.77 per Boe during the 2007 period to $27.53 per Boe
during the 2008 period. The decrease in lease operating expense on a Boe basis
is a direct result of increased production due to drilling activities, without
a
corresponding increase in our fixed operating expense. Other factors outside
management control, such as rig availability and availability of technical
and
field staff, could have an adverse effect on lease operating costs in the
future.
(C)
Platinum Unaudited Pro Forma Consolidated Financial
Information
The
following tables set forth summary financial information for our pro forma
consolidated results of operations for the years ended December 31, 2007 and
2006. The unaudited pro forma financial information includes the consolidated
statements of operations of TEC for the two years ended December 31, 2007 and
the results of operations of Platinum for these same periods. The pro forma
financial information is adjusted to illustrate the estimated pro forma effects
of the asset acquisition of TEC, the simultaneous transfer of funds from the
trust account associated with the non-converting shareholders,
the reclassification of shares of shareholders electing not to convert as
if these events had occurred at the beginning of each year presented. The
unaudited pro forma financial information should be read in conjunction with
the
consolidated financial statements of the Company and the historical financial
statements of Tandem Energy Holdings, Inc. and other financial information
appearing elsewhere herein.
The
unaudited pro forma adjustments are based upon available information and certain
assumptions that we believe are directly attributable to these transactions
and
are factually supportable.
The
unaudited pro forma financial information is for informational purposes only
and
is not intended to represent or be indicative of the consolidated results of
operations that we would have reported had the TEC asset acquisition been
completed as of the dates presented, and should not be taken as representative
of our future consolidated results of operations.
The
pro
forma effects of the Maverick acquisition consumated on April 29, 2008 are
not
included in this table. Reference is made to Selected Unaudited Pro Forma
Condensed Combined Financial Information of Platinum and Maverick on page 16.
The results of operations of certain
other subsequent acquisitions made by us have not been included in
this presentation, as their results of operations would not be
significant.
|
|
Consolidated Unaudited Pro Forma
Statements of Operations
Information of the Year Ended
December 31,
|
||||||
|
|
2006
|
2007
|
|||||
|
Oil
and Gas Revenues
|
$
|
17,812,000
|
$
|
18,140,000
|
|||
|
|
|||||||
|
Income
(loss) before income taxes
|
545,000
|
(9,204,000
|
)
|
||||
|
|
|||||||
|
Net
income (loss)
|
400,000
|
(5,817,000
|
)
|
||||
|
|
|||||||
|
Earnings
(loss) per share:
|
|||||||
|
|
|||||||
|
Basic
|
$
|
0.02
|
$
|
(0.24
|
)
|
||
|
|
|||||||
|
Diluted
|
0.01
|
(0.24
|
)
|
||||
21
The
following adjustments have been made to the historical results of operations
of
TEC and Platinum in developing this unaudited pro forma data:
·
The elimination of interest expense earned on the trust
account funds held by Platinum;
·
The elimination of interest expense on TEC indebtedness
assumed paid at the inception of each period;
·
Adjustment of depletion expense based upon the
accounting treatment prescribed by FAS 141 with respect to TEC oil and gas
assets;
·
Inclusion of stock based compensation associated with
officers’ stock options and with a consulting agreement;
·
Adjustment of officers’ salary for the assumed
compensation levels that would be in effect upon consummation; and
·
Assumed effective tax rate on net income (loss) of
35%.
·
Pro forma weighted average shares outstanding used to
determine pro forma earnings (loss) per share reflects the shares issued in
the
acquisition of the assets of TEC, the redemption of non-converting shareholders,
the transfer to equity of shareholders electing to retain their shares and
the
issuance of shares for stock based compensation as if these events had occurred
at the beginning of the period. Common stock equivalents associated with the
IPO
warrants were included in determining pro forma EPS in 2006, because their
effect would have been dilutive. The impact of the purchase of treasury shares
in November 2007 was also reflected.
The
pro
forma revenues for 2007 represent TEC historical oil and gas revenues for the
period from January 1, 2007 through October 26, 2007 combined with the
historical New TEC oil and gas revenues for the period from October 27, 2007
though December 31, 2007. This results in a full 12 months of TEC actual
revenues in each period being reflected in this pro forma
presentation.
The
increase in revenues was due primarily to stronger oil prices during the 2007
period, offset by an overall decrease in production on a Boe basis.
The
principal reason for the pro forma loss before income taxes of $9,204,000 in
2007 as compared to pro forma income before income taxes of $545,000 was a
loss
on change in fair value of derivatives of $5.1 million in 2007 versus a gain
of
$3.5 million in 2006. This one item accounts for an $8.6 million reduction
in
pro forma net income in 2007 as compared to 2006.
Liquidity
and Capital Resources
Platinum
Liquidity
On
October 28, 2005, we consummated our IPO of 14,400,000 units with each unit
consisting of one share of our common stock, $0.0001 per share, and one warrant
to purchase one share of common stock at an exercise price of $6.00 per share.
The units were sold at an offering price of $8.00 per unit, generating gross
proceeds of $115,200,000. The total net proceeds to us from the offering were
approximately $106,472,000, of which $105,408,000 was deposited into a trust
fund and the remaining proceeds ($1,064,000) were available to be used to
provide for business, legal and accounting due diligence on prospective business
combinations and continuing general and administrative expenses. The net
proceeds deposited into the trust fund remained on deposit in the trust fund,
earning interest, until the consummation of the TEC acquisition agreement on
October 26, 2007. We received an additional $1,032,000 from our former Chairman
of the Board, Mark Nordlicht, in proceeds of notes issued between January 1,
2007 and October 26, 2007 to fund our working capital needs. The notes bore
interest at 5% per annum. The principal amount of the notes of $1,107,000 and
accrued interest of $18,606 was paid on October 26, 2007, the date of
consummation of the TEC acquisition, with proceeds released from the trust
account. We describe below the complete disposition of the funds held in the
trust account upon consummation of the TEC acquisition.
In
connection with the IPO, we sold to the representatives of the underwriters
a
five year option to purchase up to a total of 720,000 units in the aggregate
at
a per unit price of $10.00. The units issuable upon exercise of this option
are
identical to those offered in the IPO except that the warrants included in
the
option have an exercise price of $7.50 (125% of the exercise price of the
warrants included in the units sold in the IPO). The unit purchase option may
be
exercised for cash or on a “cashless” basis, at the holder’s option, such that
the holder may use the appreciated value of the option (the difference between
the exercise prices of the option and the underlying warrants and the market
price of the units and underlying securities) to exercise the option without
the
payment of any cash. If circumstances warrant and in the event that any holders
of the unit purchase option choose to exercise all or a portion of the unit
purchase option on a cashless basis, we will receive no cash proceeds but would
be required to issue additional units.
22
Upon
the
October 26, 2007 consummation of the TEC acquisition, the cash held in, or
attributable to, the trust approximated $112,300,000 (including approximately
$290,000 of interest earned on the trust account for October 1 through October
26, 2007 but received subsequent to consummation), became available to us and
was applied as follows (i) payment to our stockholders exercising their
conversion rights; (ii) payment of TEC debt assumed pursuant to the acquisition
agreement; (iii) payment of certain fees and expenses relating to the
acquisition; and (iv) the remaining net proceeds became available for operations
and conduct of the business. This resulted in net proceeds to us approximating
$50,650,000 as follows:
|
Distribution
of cash to shareholders exercising their conversion rights
|
$
|
14,057,199
|
||
|
Payment
of TEC indebtedness, including interest
|
41,704,635
|
|||
|
Shareholder
Notes, including interest
|
1,125,606
|
|||
|
Lance
Duncan - finders fee
|
3,000,000
|
|||
|
Transaction
costs paid at closing (legal, accounting), net of interest from escrow
agent
|
1,579,805
|
|||
|
Other
payments
|
182,500
|
|||
|
|
61,649,745
|
|||
|
Available
cash to Platinum upon consummation of the TEC acquisition
|
50,650,255
|
|||
|
Total
|
$
|
112,300,000
|
In
connection with the acquisition, TEC assigned to New TEC its rights and
obligations under TEC’s then existing credit agreement with Guaranty Bank, FSB
pursuant to an Assignment, Waiver and Third Amendment to the Credit Agreement
(the “Third Amendment”) made and entered into effective as of October 26, 2007
among TEC, New TEC and Guaranty Bank. The full balance outstanding as of October
26, 2007 of approximately $20.6 million was repaid in connection with the
consummation of the TEC acquisition and is included in payment of indebtedness
in this table. Pursuant to the Third Amendment, a new borrowing base was set
at
$5,000,000, but no indebtedness was incurred at that time. All other material
terms of the credit agreement were unchanged.
Subsequent
to the October 26, 2007 consummation of the TEC acquisition we have applied
a
substantial portion of the available cash of $50,650,000 as
follows:
a. In
November 2006, the Company’s board approved a share repurchase program to
repurchase shares of Company common stock in an amount up to $80 million
(including shares that may be redeemed in connection with stockholders
conversion rights upon consummation of the TEC acquisition). On October 26,
2007, we redeemed 1,802,205 shares of our common stock for a total purchase
price of $14,057,199 pursuant to such conversion rights. On November 1, 2007,
the Company announced the initial stage of the share repurchase program and
adopted a share repurchase plan for the month of November 2007. In the period
from November 1 through November 30, 2007, we purchased 1,997,913 shares for
an
aggregate of $15,661,464. We financed these purchases with available cash.
The
initial share repurchase plan expired November 30, 2007, but the Company may
resume repurchases in the future, pursuant to our share repurchase
program.
b.
As
part of our overall business strategy, we began our program of strategic
acquisitions and investment opportunities that complement our existing business.
We have made various acquisitions of oil and gas properties and interests and
a
related operating business as follows:
·
In November 2007, we acquired a 12% working interest in
the North Minnie Bock Field, a producing field in Nueces County, Texas for
approximately $1.1 million.
·
In December 2007, we acquired a 50% working interest in
the La Rosa field for approximately $5.3 million. The La Rosa Field is a
non-producing field of approximately 3,800 acres in Refugio County, Texas.
The
field contains previously drilled and abandoned wells. We believe, based on
our
due diligence, that the La Rosa field can yield substantial production through
recompletions and new drilling.
·
In December 2007, we acquired, out of bankruptcy court,
oil and gas properties, including approximately 200 producing wells, located
in
Chavez, Lea and Eddy counties, New Mexico previously owned by Lothian Oil,
Inc.
for $6.9 million. These assets include over one million barrels of oil
equivalent (" Boe") of proved reserves. Approximately 55% of the reserves are
proved developed. On the closing date, the production was approximately
140 Boe per day, and one of the primary fields is adjacent to our Ballard
Field in Eddy County.
·
In December 2007 we acquired an additional 50% working
interest in the Barnett Shale acreage within our Ball Field for approximately
$920,000. This acquisition increased our net acreage position by 2,300 net
acres
and gave us a 100% working interest in the Barnett Shale. We plan to begin
a
horizontal development program in the Barnett Shale during 2008, which may
include a 3-D seismic program.
·
In December 2007, as part of a strategic attempt to
secure readily available well servicing equipment, we purchased, for
approximately $2.2 million, the outstanding stock of Red Iron Tool, Inc. (
Red
Iron). As a result, Red Iron is now a wholly owned subsidiary of Platinum.
Red
Iron owns three pulling units and other service equipment near our Ira field
in
Scurry County, Texas. One of its rigs has been continuously servicing that
field
for the last six months. The other two have been used by other operators.
Additionally, the former president of Red Iron, who is experienced in
operations, drilling and well servicing in that area, will assist us in
providing oversight of the Ira Field. We may continue to contract the rigs
to
third party operators when not in use on our properties.
23
·
In January 2008, we acquired a 70% working interest in
the Pleasanton field for approximately $5 million. The Pleasanton Field is
a
non-producing field of approximately 4,200 acres in Atascosa County, Texas.
The
field contains previously drilled and abandoned wells. We believe, based on
our
due diligence, that the Pleasanton field can yield substantial production
through recompletions and new drilling.
·
In January 2008 in connection with the Pleasanton
acquisition we paid additional cash consideration of $2,950,000 and issued
a
$550,000 note. The note bears interest at 12% per annum, and is subject to
monthly payments beginning June 1, 2008 of an amount equal to ½ of the net
proceeds from production attributable to our interest in the purchased leasehold
or $30,000, whichever is greater, until the note is paid in full.
·
In March 2008 we acquired an additional property
related to our La Rosa field acquisition for cash in the amount of
$461,500.
·
In April 2008, two of our wholly-owned subsidiaries
(the Co-borrowers as defined in c. below) entered into two agreements to acquire
additional oil and gas properties aggregating $1,350,000 for cash.
c.
On
March
14, 2008, two of our operating subsidiaries, New TEC and PER Gulf Coast, Inc.
(collectively the “Co-borrowers”) entered into a new credit facility with the
Bank of Texas, establishing a revolving line of credit with an initial borrowing
base of $35 million. The revolving line of credit is secured by the
Co-borrower’s oil and gas properties and will be used to facilitate the
execution of the two entities’ drilling and acquisition programs. The line bears
interest at either the bank’s base rate or LIBOR, plus a margin which varies
with the ratio of the Co-borrowers’ outstanding borrowings against the defined
borrowing base, ranging from 1.50% to 2.25%. The Co-borrowers can choose
periodically to change the interest rate base which applies to outstanding
borrowings. Under the terms of revolving line of credit agreement, the
Co-borrowers must maintain certain financial ratios, must repay any amounts
due
in excess of the borrowing base, and may not declare any dividends or enter
into
any transactions resulting in a change in control, without the bank’s consent.
As the parent company, we are not a co-borrower or guarantor of the line, and
transfers from the Co-borrowers to us are limited to (i) $1 million per fiscal
year for management fees, and (ii) the repayment of up to $2 million per fiscal
year in subordinate indebtedness owed to us. As of March 31, 2008, there
was $5.5 million outstanding under the revolving line of credit. In conjunction
with the execution of the new line of credit, and as required under the terms
of
the new credit facility, we novated our existing hedge positions from our
existing counterparty over to the Bank of Texas under terms satisfactory to
us.
In connection with establishing the line of credit, the Bank of Texas received
a
commitment fee of $87,500 and a fee for its expenses in connection with the
aforementioned novation of $60,229. In addition, the Co-borrowers are obligated
to the bank for a monthly fee for any unused portion of the line of credit
at
the rate of 0.25% per annum. The unused portion of this revolving line of credit
of $29,500,000 remains available to the Co-borrowers.
d.
On
March
18, 2008, Platinum, a wholly owned subsidiary of Platinum, PERMSub, Inc.,
Maverick, and Robert L. Kovar Services, LLC entered into an Agreement and Plan
of Merger pursuant to which we acquired Maverick. We completed the acquisition
on April 29, 2008. The aggregate consideration paid in the merger was $6 million
in cash and $5 million to be paid over the next 6 years pursuant to non-interest
bearing cash flow note (the “Cash Flow Notes”), subject to certain escrows,
holdbacks and post-closing adjustments. Provisions of the Cash Flow Notes
require quarterly payments commencing in June 2008 to the noteholders pro rata
equal to 50% of the pre-tax net income, as defined, generated by the Maverick
business on a stand alone basis in the prior quarter. Payment of the Cash Flow
Notes can be accelerated by certain events, including a change in control.
The
balance of the Cash Flow Notes remaining unpaid upon maturity, if any, will
be
converted into a 12 month self amortizing note bearing interest at the annual
rate of 2% over the banks prime rate. In addition, we will assume Maverick’s
indebtedness under certain bank and loan arrangements, which aggregate balances
approximated $4.5 million at January 31, 2008. Maverick’s bank has not consented
to continuation of its bank term loan or to its working capital revolving credit
line upon closing. The sellers agreed to the satisfaction of this bank
indebtedness at closing in the aggregate amount of $4.9 million with the
proceeds of the cash to be paid at closing to the Sellers. Subsequent to the
closing, upon securing a replacement revolving line of credit for Maverick,
the
amount of the revolving line of credit repaid at closing ($3.3 million) will
be
drawn down against this line and paid to sellers. The remainder of $1.6 million
will be paid to selling Maverick shareholders by the Company over an approximate
18 month period under the same terms and conditions as the original term loan
with Maverick’s original bank. The Cash Flow Notes will be payable quarterly at
the rate of 50% of pre-tax net income, as defined, generated by the Maverick
business on a stand-alone basis in the preceding quarter. Payment can be
accelerated by certain events, including change in control of the Company.
The
purchase price is also subject to adjustment for any change in working capital
as defined in the agreement, between October 31, 2007 and the closing date,
as
well as other adjustments associated with changes in indebtedness. Any
adjustment will be treated as a modification of the amount of the Cash Flow
Notes and are to be determined within 45 days of closing. The balance of the
Cash Flow Notes remaining unpaid upon maturity, if any, will be converted into
a
12 month self amortizing note bearing interest at the annual rate of 2% over
the
bank’s prime rate at the time.
In
connection with the acquisition of Maverick, the Company entered into an
employment agreement with Mr. Kovar to serve as chief operating officer of
Platinum. The employment agreement provides for an initial term of five years.
Pursuant to the terms of the employment agreement, Mr. Kovar will be paid a
$200,000 base annual salary and will be eligible for annual performance bonuses
in such amount and at such times as determined by the Board or the compensation
committee, in their sole discretion. In addition, pursuant to the employment
agreement, Mr. Kovar was granted 50,000 options to purchase shares of the
Company’s common stock with an exercise price of $5.15 per share, the closing
price on the date of grant, and will be granted an additional 50,000 stock
options on each of the four succeeding anniversaries of the effective date
of
the employment agreement. All options will be issued pursuant to the Company’s
2006 Long Term Incentive Plan and will be subject to a 5 year vesting schedule,
with one-fifth of such options vesting on each anniversary of the date of grant,
beginning April 29, 2009. In the event of a change in control of the Company,
the employment agreement provides that all options granted to Mr. Kovar will
immediately vest.
24
Pursuant
to the employment agreement, if Mr. Kovar’s employment is terminated by the
Company without cause or Mr. Kovar terminates his employment for good reason,
he
will receive an 18 month severance package and his Cash Flow Note will become
immediately due and payable. If, however, Mr. Kovar’s employment is terminated
by the Company for cause or Mr. Kovar terminates his employment without good
reason, he will receive no severance package and his Cash Flow Note will be
cancelled.
TEC
Liquidity
Overview
TEC’s
primary sources of capital were cash flow from operations and funding under
its
revolving line of credit facility. TEC borrowed funds under the revolving line
of credit facility as needed to supplement its operating cash flow as a
financing source for its capital expenditure program.
Cash
Flow
Substantially
all of TEC’s cash flow was derived from the production of its oil and gas
reserves. TEC used this cash flow to fund its on-going developmental activities
in search of new oil and gas reserves and for operating expenses relating to
the
production of existing reserves.
Cash
flow
from operations was $2.3 million for the nine months ended September 30, 2007,
compared to $4.3 million for the nine months ended September 30, 2006. The
decrease was due primarily to a 7% decline in the average product prices on
a
Boe basis during the comparative periods, along with a 4% drop in production
on
a Boe basis, as more fully discussed in the “Results of Operations” section
above. Another contributing factor was the increase in general and
administrative expenses. For the period January 1, 2007 to October 26, 2007
cash
flow from operations was $2.3 million, This data for the comparable period
of
the preceding year was not available, but management believes the relationship
in consistent with the discussion regarding the comparable September 30
th
periods.
Financing
Activities
A
major
bank provided TEC with a revolving line of credit facility, initially in the
principal amount of $23.0 million, on which it relied heavily for both its
short-term liquidity (working capital) and its long-term financing needs. The
funds available to TEC under this revolving line of credit facility were limited
to the amount of the borrowing base established by the bank from time to time
and are secured by TEC’s oil and gas properties. On February 28, 2007 the new
borrowing base was set at $21.1 million with mandatory principle reduction
requirements of $250,000 per month beginning October 1, 2007. The credit
facility was to mature on June 8, 2008. Accordingly, Tandem classified the
entire outstanding balance of $20.5 million as a current liability on its
balance sheet dated October 26, 2007.
In
connection with Platinum’s acquisition of the assets of TEC, TEC assigned to New
TEC its rights and obligations under TEC’s then existing credit agreement with
Guaranty Bank, FSB pursuant to an Assignment, Waiver and Third Amendment to
the
Credit Agreement (the “Third Amendment”) made and entered into effective as of
October 26, 2007 among TEC, New TEC and Guaranty Bank. The full balance
outstanding as of October 26, 2007 of approximately $20.6 million was repaid
in
connection with the consummation of the TEC acquisition and is included in
payment of indebtedness in this table. Pursuant to the Third Amendment, a new
borrowing base was set at $5,000,000, but no indebtedness was incurred at that
time. All other material terms of the credit agreement were
unchanged.
In
conjunction with and simultaneous to the establishment of the new credit
facility among New TEC, PER Gulf Coast, Inc. and Bank of Texas, the previously
existing $5 million credit agreement with Guaranty Bank was terminated. No
outstanding borrowings existed at the time of the termination.
Supplemental
Information
The
following information is intended to supplement the consolidated financial
statements with data that is not readily available from those statements. The
data consists of certain operating results of TEC for the period January 1,
2007
through October 26, 2007, along with the actual results of New TEC reported
by
Platinum for the remainder of 2007 subsequent to the acquisition on October
26,
2007. This presentation provides a comparative analysis of certain of TEC’s
production data for the year ended December 31, 2007 as compared to the year
ended December 31, 2006. These results do not include the operating results
of
PER Gulf Coast, Inc.
25
|
|
Tandem
January 1,
2007 through October 26,
2007
|
New TEC
October 26,
2007 through December 31,
2007
|
Total- Year
Ended
December 31,
2007
|
Tandem - Year
Ended
December 31,
2006
|
|||||||||
|
Oil
and Gas Production Data:
|
|
|
|
|
|||||||||
|
Oil
(MBbls)
|
165.3
|
38.7
|
204.0
|
214.8
|
|||||||||
|
Gas
(MMcf)
|
560.9
|
125.8
|
686.7
|
735.6
|
|||||||||
|
BOE
(MBbls)
|
258.8
|
59.7
|
318.5
|
337.4
|
|||||||||
|
|
|
||||||||||||
|
Average
Sales Prices(1):
|
|||||||||||||
|
Oil
($/Bbl):
|
$
|
61.68
|
$
|
83.52
|
$
|
65.82
|
$
|
62.94
|
|||||
|
Gas($/Mcf):
|
$
|
6.76
|
$
|
7.34
|
$
|
6.87
|
$
|
6.16
|
|||||
|
|
|
||||||||||||
|
Average
Lifting Cost per BOE of Production:
|
$
|
21.25
|
$
|
28.41
|
$
|
22.59
|
$
|
19.31
|
|||||
Supplemental
Oil and Gas Information
The
following information is intended to supplement the consolidated financial
statements included in this prospectus with data that is not readily available
from those statements.
|
Period from January 1, 2008
to March 31, 2008
|
Period from October 26
to December 31, 2007
|
||||||||||||||||||
|
Oil
|
Gas
|
Boe
|
Oil
|
Gas
|
Boe
|
||||||||||||||
|
(Mbls)
|
(MMcf)
|
(Mbls)
|
(Mbls)
|
(MMcf)
|
(Mbls)
|
||||||||||||||
|
Production
|
58.7
|
177.2
|
88.2
|
38.7
|
125.8
|
59.7
|
|||||||||||||
|
Oil
|
Gas
|
Boe
|
Oil
|
Gas
|
Boe
|
||||||||||||||
|
($/Bbl
)
|
($/Mcf
)
|
($/Boe
)
|
($/Bbl
)
|
($/Mcf
)
|
($/Boe
)
|
||||||||||||||
|
Average
Prices
|
$
|
96.83
|
$
|
8.19
|
$
|
80.86
|
$
|
85.24
|
$
|
8.03
|
$
|
72.21
|
|||||||
|
Boe
|
Boe
|
||||||||||||||||||
|
($/Boe)
|
|
($/Boe)
|
|
||||||||||||||||
|
Average
Lifting Cost Per Boe
|
$
|
27.53
|
$
|
29.77
|
|||||||||||||||
Capital
Expenditures
The
reserve report prepared as of December 31, 2007 assumes that we will expend
approximately $19.4 million in expenditures in 2008 to drill a number of
existing proved undeveloped locations, with the intent of converting them into
proved developed producing locations, thereby, generating new cash flows. The
execution of the drilling program is dependent on rig availability, the
availability of technical and field staff, and product pricing. Through March
31, 2008 we have incurred approximately $3.4 million.
Off-Balance
Sheet Arrangements
We
do not
have any off-balance sheet arrangements as defined in Item 303(a) (4) (ii)
of
Regulation S-K promulgated under the Securities Exchange Act of
1934.
Contractual
Obligations
a.
We
have
contractual obligations and commitments that may affect our financial position.
The following table sets forth our significant contractual obligations as of
December 31, 2007:
|
|
2008
|
2009-2011
|
2012-2014
|
Thereafter
|
Total
|
|||||||||||
|
|
(in
thousands)
|
|||||||||||||||
|
Operating
leases
|
$
|
119.3
|
327.6
|
—
|
—
|
$
|
446.9
|
|||||||||
|
Asset
Retirement Obligations
|
$
|
0.0
|
678.4
|
211.2
|
2,673.2
|
$
|
3,562.8
|
|||||||||
|
Derivative
Obligations
|
$
|
3,116.0
|
(73.0
|
)
|
—
|
—
|
$
|
3,043.0
|
||||||||
26
b.
In
connection with the October 26, 2007 TEC acquisition, we entered into an
agreement with Mr. Lance Duncan, for consulting services, including
investigation and evaluation of possible future acquisitions. Under the terms
of
the consulting agreement, Mr. Duncan’s services were valued at $5 million. We
agreed to issue to Mr. Duncan a total of 714,286 shares of our restricted common
stock, 25% to be issued upon commencement of services and the remainder in
semi-annual installments of 25% each over the eighteen month term of the
agreement. The initial installment of 178,572 shares was issued on October
26,
2007 and was recorded as stock compensation expense in our results of operations
in 2007.
Critical
Accounting Policies:
Use
of Estimates
The
preparation of financial statements in conformity with accounting principles
generally accepted in the United States of America requires management to make
estimates and assumptions that affect the reported amounts of assets and
liabilities and disclosure of contingent assets and liabilities at the date
of
the financial statements and the reported amounts of revenues and expenses
during the reporting period. Actual results could differ from those
estimates.
Full
Cost and Impairment of Assets
We
account for our oil and natural gas exploration and development activities
using
the full cost method of accounting. Under this method, all costs incurred in
the
acquisition, exploration and development of oil and natural gas properties
are
capitalized. Costs of non-producing properties, wells in the process of being
drilled and significant development projects are excluded from depletion until
such time as the related project is developed and proved reserves are
established or impairment is determined. At the end of each quarter, the net
capitalized costs of our oil and natural gas properties, as adjusted for asset
retirement obligations, is limited to the lower of unamortized cost or a
ceiling, based on the present value of estimated future net revenues, net of
income tax effects, discounted at 10%, plus the lower of cost or fair market
value of our unproved properties. Revenues are measured at unescalated oil
and
natural gas prices at the end of each quarter, with effect given to cash flow
hedge positions. If the net capitalized costs of oil and natural gas properties
exceed the ceiling, we are subject to a ceiling test write-down to the extent
of
the excess. A ceiling test write-down is a non-cash charge to earnings. It
reduces earnings and impacts stockholders’ equity in the period of occurrence
and results in lower DD&A expense in future periods.
There
is
a risk that we will be required to write down the carrying value of our oil
and
natural gas properties when oil and natural gas prices decline. If commodity
prices deteriorate, it is possible that we could incur impairment in future
periods.
Depletion
Provision
for depletion of oil and natural gas properties under the full cost method
is
calculated using the unit of production method based upon estimates of proved
developed oil and natural gas reserves with oil and natural gas production
being
converted to a common unit of measure based upon their relative energy content.
Investments in unproved properties and major development projects are not
amortized until proved reserves associated with the projects can be determined
or until impairment occurs. The cost of any impaired property is transferred
to
the balance of oil and natural gas properties being depleted.
Significant
Estimates and Assumptions
Oil
and Gas Reserves
(1)
Reserve engineering is a subjective process of estimating underground
accumulations of oil and gas that cannot be measured in an exact manner. The
accuracy of a reserve estimate depends on the quality of available geological
and engineering data, the precision of the interpretation of that data, and
judgment based on experience and training. We have historically engaged an
independent petroleum engineering firm to evaluate our oil and gas reserves.
As
a part of this process, our internal reservoir engineer and the independent
engineers exchange information and attempt to reconcile any material differences
in estimates and assumptions.
(2)
Reserves which can be produced economically through application of improved
recovery techniques (such as fluid injection) are included in the proved
classification when successful testing by a pilot project, or the operation
of
an installed program in the reservoir, provides support for the engineering
analysis on which the project or program was based.
27
(3)
Estimates of proved reserves do not include the following: (A) oil that may
become available from known reservoirs but is classified separately as indicated
additional reserves; (B) crude oil, natural gas, and natural gas liquids, the
recovery of which is subject to reasonable doubt because of uncertainty as
to
geology, reservoir characteristics, or economic factors; (C) crude oil, natural
gas, and natural gas liquids, that may occur in undrilled prospects; and (D)
crude oil, natural gas, and natural gas liquids, that may be recovered from
oil
shales, coal, gilsonite and other such sources.
Valuation
of proved undeveloped properties
Placing
a
fair market value on proved undeveloped properties, commonly referred to as
“PUDs” is very subjective since there is no quoted market for them. The
negotiated price of any PUD between a willing seller and willing buyer depends
on the specific facts regarding the PUD, including:
|
·
|
the
location of the PUD in relation to known fields and reservoirs, available
markets and transportation systems for oil and gas production in
the
vicinity, and other critical
services;
|
|
·
|
the
nature and extent of geological and geophysical data on the
PUD;
|
|
·
|
the
terms of the leases holding the acreage in the area, such as ownership
interests, expiration terms, delay rental obligations, depth limitations,
drilling and marketing restrictions, and similar
terms;
|
|
·
|
the
PUDs risk-adjusted potential for return on investment, giving effect
to
such factors as potential reserves to be discovered, drilling and
completion costs, prevailing commodity prices, and other economic
factors;
and
|
|
·
|
the
results of drilling activity in close proximity to the PUD that could
either enhance or condemn the prospect’s chances of
success.
|
Provision
for DD&A
We
have
computed our provision for DD&A on a unit-of-production method. Each
quarter, we use the following formulas to compute the provision for
DD&A.
|
·
|
DD&A
Rate = Current period production, divided by beginning proved
reserves
|
|
·
|
Provision
for DD&A = DD&A Rate, times the un-depleted full cost pool of oil
and gas properties
|
Reserve
estimates have a significant impact on the DD&A rate. If reserve estimates
for our properties are revised downward in future periods, the DD&A rate
will increase as a result of the revision. Alternatively, if reserve estimates
are revised upward, the DD&A rate will decrease.
Hedging
Activities
From
time
to time, we utilize derivative instruments, consisting of swaps, floors and
collars, to attempt to reduce our exposure to changes in commodity prices and
interest rates. We account for our derivatives in accordance with SFAS No.
133,
Accounting for Derivative Instruments and Hedging Activities, as amended. SFAS
No. 133 requires that all derivative instruments be recognized as assets or
liabilities in the balance sheet, measured at fair value. The accounting for
changes in the fair value of a derivative depends on both the intended purpose
and the formal designation of the derivative. Designation is established at
the
inception of a derivative, but subsequent changes to the designation are
permitted. We have elected not to designate any of our derivative financial
contracts as accounting hedges and, accordingly, account for these derivative
financial contracts using mark-to-market accounting. Changes in fair value
of
derivative instruments which are not designated as cash flow hedges are recorded
in other income (expense) as changes in fair value of derivatives. Hedging
is a
strategy that can help a company to mitigate the volatility of oil and gas
prices by limiting its losses if oil and gas prices decline; however, this
strategy may also limit the potential gains that a company could realize if
oil
and gas prices increase. Historically, certain “costless collars” executed in
June 2005 and swaps executed in mid 2006 by our predecessor in interest were
employed to protect such predecessor and its creditors from exposure to lower
oil and gas prices. However, as a result of those positions, we have and may
continue to periodically incur settlement losses associated with the ceiling
component of such hedges as oil prices have increased during 2007 and in 2008.
For the three months ended March 31, 2008, we reported a $2.0 million net loss
on derivatives.
Asset
Retirement Obligation
We
follow
the provisions of SFAS No. 143, Accounting for Asset Retirement Obligations.
SFAS No. 143 requires us to recognize a liability for the present value of
all
legal obligations associated with the retirement of tangible, long-lived assets
and capitalize an equal amount as a cost of the asset. The cost of the
abandonment obligations, less estimated salvage values, is included in the
computation of depreciation, depletion and amortization.
28
Recent
Accounting Pronouncements
In
September 2006, the Financial Accounting Standards Board (FASB) issued SFAS
No. 157, “Fair Value Measurements.” SFAS No. 157 establishes a single
definition of fair value and a framework for measuring fair value, sets out
a
fair value hierarchy to be used to classify the source of information used
in
fair value measurements, and requires new disclosures of assets and liabilities
measured at fair value based on their level in the hierarchy. This statement
applies under other accounting pronouncements that require or permit fair value
measurements. In February 2008, the FASB issued Staff Positions (FSPs)
No. 157-1 and No. 157-2, which, respectively, remove leasing
transactions from the scope of SFAS No. 157 and defer its effective date
for one year relative to certain nonfinancial assets and liabilities. As a
result, the application of the definition of fair value and related disclosures
of SFAS No. 157 (as impacted by these two FSPs) was effective for the
Company beginning January 1, 2008 on a prospective basis with respect to
fair value measurements of (a) nonfinancial assets and liabilities that are
recognized or disclosed at fair value in the Company’s financial statements on a
recurring basis (at least annually) and (b) all financial assets and
liabilities. This adoption did not have a material impact on the Company’s
consolidated results of operations or financial condition. The remaining aspects
of SFAS No. 157 for which the effective date was deferred under FSP
No. 157-2 are currently being evaluated by the Company. Areas impacted by
the deferral relate to nonfinancial assets and liabilities that are measured
at
fair value, but are recognized or disclosed at fair value on a nonrecurring
basis. This deferral applies to such items as nonfinancial assets and
liabilities initially measured at fair value in a business combination (but
not
measured at fair value in subsequent periods) or nonfinancial long-lived asset
groups measured at fair value for an impairment assessment. The effects of
these
remaining aspects of SFAS No. 157 are to be applied to fair value
measurements prospectively beginning January 1, 2009. The Company does not
expect them to have a material impact on the Company’s consolidated results of
operations or financial condition. Refer to Note 8 for disclosures required
by
this new pronouncement.
In
February 2007, the FASB issued SFAS 159, The
Fair Value Option for Financial Assets and Financial Liabilities, Including
an
Amendment of FASB Statement
No. 115,
which
will become effective on January 1, 2008. FAS 159 permits entities to
measure eligible financial assets, financial liabilities and firm commitments
at
fair value. on an instrument-by-instrument basis, that are otherwise not
permitted to be accounted for at fair value under other generally accepted
accounting principles. The fair value measurement election is irrevocable and
subsequent changes in fair value must be recorded in earnings.
In
April 2007, the FASB issued FASB Staff Position FIN 39-1, Amendment
of FASB Interpretation No. 39
. FSP
FIN 39-1 clarifies that a reporting entity that is party to a master netting
arrangement can offset fair value amounts recognized for the right to reclaim
cash collateral (a receivable) or the obligation to return cash collateral
(a
payable) against fair value amounts recognized for derivative instruments that
have been offset under the same master netting arrangement. FSP FIN 39-1 is
effective for financial statements issued for fiscal years beginning after
November 15, 2007.
In
December 2007, the FASB issued SFAS No. 141 (revised 2007),
Business
Combinations
(“SFAS
141(R)”), which replaces FASB Statement No. 141. SFAS 141(R) establishes
principles and requirements for how an acquirer recognizes and measures in
its
financial statements the identifiable assets acquired, the liabilities assumed,
any non- controlling interest in the acquiree and the goodwill acquired. The
Statement also establishes disclosure requirements that will enable users to
evaluate the nature and financial effects of the business combination. SFAS
141(R) is effective for acquisitions that occur in an entity’s fiscal year that
begins after December 15, 2008.
In
December 2007, the FASB issued SFAS No. 160, Noncontrolling
Interests in Consolidated Financial Statements—an amendment of ARB
No. 51.
SFAS 160
requires that accounting and reporting for minority interests will be
recharacterized as noncontrolling interests and classified as a component of
equity. SFAS 160 also establishes reporting requirements that provide sufficient
disclosures that clearly identify and distinguish between the interests of
the
parent and the interests of the noncontrolling owners. SFAS 160 applies to
all
entities that prepare consolidated financial statements, except not-for-profit
organizations, but will affect only those entities that have an outstanding
noncontrolling interest in one or more subsidiaries or that deconsolidate a
subsidiary. This statement is effective as of the beginning of an entity’s first
fiscal year beginning after December 15, 2008.
In
March
2008, the FASB issued Statement of Financial Accounting Standards No. 161,
“Disclosures about Derivative Instruments and Hedging Activities—an amendment of
FASB Statement No. 133” (“SFAS 161”). SFAS 161 changes the disclosure
requirements for derivative instruments and hedging activities. Entities are
required to provide enhanced disclosures about (a) how and why an entity uses
derivative instruments, (b) how derivative instruments and related hedged items
are accounted for under SFAS No. 133 and its related interpretations, and (c)
how derivative instruments and related hedged items affect an entity’s financial
position, financial performance and cash flows. The guidance in SFAS 161 is
effective for financial statements issued for fiscal years and interim periods
beginning after November 15, 2008, with early application encouraged. This
Statement encourages, but does not require, comparative disclosures for earlier
periods at initial adoption. At this time, management is evaluating the
implications of SFAS 161 and its impact on the financial statements has not
yet
been determined.
29
Quantitative
and Qualitative Disclosures About Market Risk.
The
primary objective of the following information is to provide forward-looking
quantitative and qualitative information about our potential exposure to market
risks. Market risk is the sensitivity of income to changes in interest rates,
foreign exchanges, commodity prices, equity prices, and other market-driven
rates or prices. The disclosures are not meant to be precise indicators of
expected future losses, but rather indicators of reasonably possible losses.
This forward-looking information provides indicators of how we view and manage
our ongoing market risk exposures.
Interest
Rate Risk
Effective
on March 14, 2008, we entered into a four-year $100 million revolving credit
facility with an initial borrowing base limit of $35 million. The
facility bears interest at 1.5% to 2.25% in excess of LIBOR or the Bank’s
prime rate. At March 31, 2008, we had $5.5 million outstanding on this
arrangement, bearing interest at 5.25% per annum. A 10% increase or decrease
in
this interest rate in the period ended March 31, 2008 would have had an
immaterial impact on our financial results. To the extent we have debt
outstanding in the future pursuant to our credit facility, we would be subject
to the risk of interest rate changes that would impact our future results of
operations and cash flows. While we cannot predict future fluctuations in the
amount of debt on the revolving line of credit that would be outstanding, if
we
assume the March 31, 2008 level, and if the annual interest rate should increase
or decrease by 10% from its March 31, 2008 level, we would incur an approximate
$7,200 increase or decrease in related interest expense per
quarter.
Price
Risks
The
Company engages in price risk management activities from time to time. These
activities are intended to manage the Company’s exposure to fluctuations in
commodity prices for natural gas and crude oil. The Company utilizes derivative
financial instruments, primarily price collars, puts and calls, as the means
to
manage this price risk. In addition to these financial transactions, the Company
is a party to various physical commodity contracts for the sale of hydrocarbons
that cover varying periods of time and have varying pricing provisions. Under
SFAS No. 133, Accounting
for Derivative Instruments and Hedging Activities,
as
amended by SFAS Nos. 137, 138, 149 and 157, these various physical commodity
contracts qualify for the normal purchases and normal sales exception and
therefore, are not subject to hedge accounting or mark-to-market accounting.
The
financial impact of these various physical commodity contracts is included
in
revenues at the time of settlement, which in turn affects average realized
hydrocarbon prices. The Company has elected not to designate any of its
derivative financial contracts as accounting hedges and, accordingly, has
accounted for these derivative financial contracts using mark-to-market
accounting.
In
accordance with SFAS No. 157, the Company has categorized its
derivative financial instruments, based on the priority of the inputs to the
valuation technique, into a three-level fair value hierarchy. The fair value
hierarchy gives the highest priority to quoted prices in active markets for
identical assets or liabilities (Level 1); the next highest priority inputs
include quoted prices for similar assets or liabilities in active markets,
quoted prices for identical or similar assets or liabilities in markets that
are
not active, and inputs (other than quoted prices) that are observable for the
asset or liability, either directly or indirectly (Level 2); and the lowest
priority to unobservable inputs (Level 3). The Company uses Level 1
valuation techniques to value its derivatives.
Presented
below is a summary of the Company’s crude oil and natural gas derivative
financial contracts at March 31, 2008 and December 31, 2007, with crude oil
prices expressed in dollars per barrels of crude oil and notional crude oil
volumes in barrels of crude oil per year; and natural gas prices expressed
in
dollars per million British thermal units ($/MMBtu) and notional natural gas
volumes in million British thermal units per year (MMBtuy). As of March 31,
2008, we did not have any financial derivative contracts that extend beyond
December 2011.
The
total
fair value of the crude oil and natural gas financial derivative contracts
at
March 31, 2008, was a liability of approximately $3.0 million as follows:
|
Period
Ended
March 31,
|
Instrument Type
|
Total Volumes
(MMBTU/BBL)
|
Weighted Average
(Floor/Ceiling)
|
Fair Value
Asset/
(Liability)
(stated in
thousands)
|
|||||||||
|
2009
|
Gas
Collar
|
45,230
|
5.00/11.02
|
(96
|
)
|
||||||||
|
|
Gas
Call Option Sold
|
45,230
|
9.10
|
(392
|
)
|
||||||||
|
|
Gas
Call Option Purchased
|
45,230
|
12.00
|
96
|
|||||||||
|
|
Gas
Put Option Sold
|
45,230
|
5.00
|
0
|
|||||||||
|
|
Gas
Put Option Purchased
|
45,230
|
6.00
|
2
|
|||||||||
|
|
Oil
Collar
|
172,749
|
40.00/72.10
|
(2,214
|
)
|
||||||||
|
|
Oil
Call Option Sold
|
87,500
|
67.00
|
(2,864
|
)
|
||||||||
|
|
Oil
Call Option Purchased
|
87,500
|
72.10
|
2,444
|
|||||||||
|
|
Oil
Swaps
|
30,000
|
71.00
|
(781
|
)
|
||||||||
|
|
|||||||||||||
|
2010
|
Oil
Swaps
|
90,000
|
71.00
|
(2,191
|
)
|
||||||||
|
|
Oil
Put Option Purchased
|
120,000
|
75.00
|
613
|
|||||||||
|
|
Oil
Put Option Purchased
|
170,000
|
80.00/85.00
|
1,384
|
|||||||||
|
|
|||||||||||||
|
2011
|
Oil
Put Option Purchased
|
120,000
|
80.00
|
1,002
|
|||||||||
|
|
Total
fair value liability
|
$
|
(2,997
|
)
|
|||||||||
30
The
fair
value of the Company’s financial derivative contracts at March 31, 2008 are
shown in the accompanying financial statements as follows (in
thousands):
|
Fair
value of commodity derivative:
|
||||
|
Current
portion
|
$
|
(3,805
|
)
|
|
|
Long-term
portion
|
808
|
|||
|
Total
fair value liability
|
$
|
(2,997
|
)
|
|
The
total fair value of the crude oil and natural gas financial derivative contracts
at December 31, 2007, was a liability of approximately $3.0 million as
follows:
|
Period
|
Instrument Type
|
Total Volumes
(MMBTU/BBL)
|
Weighted
Average
(Floor/Ceiling)
|
Fair Value
Asset/
(Liability)
(stated in
thousands)
|
|||||||||
|
2008
|
Gas
Collar
|
64,615
|
5.00/11.02
|
(25
|
)
|
||||||||
|
|
Gas
Call Option Sold
|
64,615
|
9.10
|
(128
|
)
|
||||||||
|
|
Gas
Call Option Purchased
|
64,615
|
12.00
|
36
|
|||||||||
|
|
Gas
Put Option Sold
|
64,615
|
5.00
|
(11
|
)
|
||||||||
|
|
Gas
Put Option Purchased
|
64,615
|
6.00
|
46
|
|||||||||
|
|
Oil
Collar
|
113,502
|
40.00/72.10
|
(2,455
|
)
|
||||||||
|
|
Oil
Call Option Sold
|
125,000
|
67.00
|
(3,282
|
)
|
||||||||
|
|
Oil
Call Option Purchased
|
125,000
|
72.10
|
2,703
|
|||||||||
|
|
|||||||||||||
|
2009
|
Oil
Swaps
|
120,000
|
71.00
|
(1,928
|
)
|
||||||||
|
|
|||||||||||||
|
2010
|
Oil
Put Option Purchased
|
120,000
|
75.00
|
1,015
|
|||||||||
|
|
|||||||||||||
|
2011
|
Oil
Put Option Purchased
|
120,000
|
80.00
|
986
|
|||||||||
|
|
Total
fair value liability
|
$
|
(3,043
|
)
|
|||||||||
The
fair
value of the Company’s financial derivative contracts at March 31, 2008 are
shown in the accompanying financial statements as follows (in
thousands):
|
Fair
value of commodity derivative:
|
||||
|
Current
portion
|
$
|
(3,116
|
)
|
|
|
Long-term
portion
|
73
|
|||
|
Total
fair value liability
|
$
|
(3,043
|
)
|
The
natural gas and crude oil prices shown in the above table are based on the
corresponding NYMEX index and have been valued using actively quoted prices
and
quotes obtained from the counterparties to the derivative agreements. The above
prices represent a weighted average of several contracts entered into and are
on
a per MMBtu or per barrel basis for gas and oil derivatives, respectively.
Total
volumes shown for the crude oil collar reflect net volumetric positions with
a
single counterparty under which contracts provide for netting of all settlement
amounts.
31
The
following table summarizes the estimated fair value of financial instruments
and
related transactions at March 31, 2008 and December 31, 2007 (in millions):
(The
carrying amount and the fair value (1) are the same for each period
reported.)
|
|
March 31,
2008
|
December 31,
2007
|
|||||
|
NYMEX-Related
Commodity Derivative
|
|
|
|||||
|
Market
Positions (1)
|
$
|
3.0
|
$
|
3.0
|
|||
|
(1)
|
Estimated
fair values have been determined by using available market data and
valuation methodologies. Judgment is required in interpreting market
data
and the use of different market assumptions or estimation methodologies
may affect the estimated fair value
amounts.
|
Changes
in and Disagreements with Accountants on Accounting and Financial
Disclosure.
None.
32
BUSINESS
We
are an
independent oil and gas exploration and production company. We have
approximately 37,000 acres under lease in relatively long-lived fields with
well-established production histories, 21,000 of which were acquired as part
of
the acquisition described below. Our properties are concentrated primarily
in
the Gulf Coast region in Texas, the Permian Basin in Texas and New Mexico and
the Fort Worth Basin in Texas.
Our
primary business strategy is to provide long-term growth in stockholder value
by
drilling, developing and exploiting our oil and gas properties. We are currently
engaged in active drilling and workover programs in order to achieve this goal.
Through a number of identifiable synergies, we believe that we are in a unique
position to exploit our inventory of identified prospects more effectively
and
efficiently than many other small independent oil and gas exploration and
production companies.
In
addition to our exploitation strategy, we are continually evaluating potential
low risk strategic acquisitions that we believe will complement our business
plan. We believe there exists significant opportunities to exploit mature fields
that may have substantial remaining reserves. As the major and large independent
oil and gas companies continue to focus on more costly and risky international
and offshore prospects, the smaller independents have a tremendous opportunity
to take advantage of the significant reserves left behind. For a discussion
of
recent acquisitions, see “Growth Strategy” on page 34.
Our
strategy also calls for the use of hedge financing to maximize profit and reduce
risk resulting from volatile energy markets. We believe that there is a gap
in
value between oil and gas reserves and the price of energy commodities and
that
profit can be captured by buying oil and gas companies or reserves, and selling
the underlying oil and gas commodity.
History
of Platinum
Platinum
was organized as a corporation under the laws of the State of Delaware on April
25, 2005. At that time, we were a blank check company formed with the purpose
of
effecting a business combination with an unidentified operating business in
the
global oil and gas exploration and production ("E&P") industry. Prior to the
acquisition of all of the assets and assumption of substantially all of the
liabilities of TEC we did not have any operations, other than conducting an
initial public offering and seeking a business combination. From and after
the
consummation of the TEC acquisition on October 26, 2007, our operations have
consisted of the acquired operations of TEC and the identification, acquisition
and operation of other oil and gas properties and related businesses. See
“Growth Strategy” on page 34 for a description of our recent
acquisitions.
On
October 28, 2005, we consummated an IPO of our equity securities, from which
we
received net proceeds of approximately $106,472,000. Of the net proceeds of
the
IPO, $105,408,000 were placed in a trust account. Under the terms of the IPO,
we
were required to complete a business combination in the E&P industry by
October 28, 2007, or we would have been required to liquidate and return to
our
public shareholders a pro rata portion of the trust account into which the
IPO
proceeds were placed. The Platinum common stock, warrants to purchase common
stock and units (each unit consisting of one share of common stock and one
warrant to purchase one share of common stock) sold in the IPO are quoted on
the
OTCBB under the symbols PGRI for the common stock, PGRIW for the warrants and
PGRIU for the units.
On
October 4, 2006, Platinum, its wholly-owned subsidiary, New TEC (formerly PER
Acquisition Corp.), and TEC entered into an acquisition agreement pursuant
to
which New TEC would acquire all of the assets and assume substantially
all of the liabilities of TEC, including approximately $42 million of TEC’s
debt, in exchange for the issuance of approximately 8 million shares of Platinum
common stock. The TEC assets consisted primarily of leases covering
approximately 21,000 acres in relatively long-lived oil fields with
well-established production histories in the Gulf Coast region in Texas, the
Permian Basin in Texas and New Mexico, and the Fort Worth Basin in
Texas.
On
October 26, 2007, Platinum consummated the TEC acquisition pursuant to the
acquisition agreement. At the closing, our wholly-owned subsidiary,
New TEC, acquired all of the assets and assumed substantially all of the
liabilities of TEC, including approximately $41.7 million of TEC’s debt, in
exchange for the issuance of 7,692,308 shares of Platinum common stock. In
addition, at the closing, Mark Nordlicht resigned as Chairman of the Board
and
as director and Tim G. Culp, formerly President and CEO of TEC, became our
Chairman of the Board and a director on our board.
At
the
closing of the TEC acquisition, the net proceeds of the IPO that were placed
in
the trust account, including the interest thereon, were released to us and
we used these funds to (i) retire approximately $41.7 million in indebtedness
of
TEC assumed in connection with the TEC acquisition, (ii) make payments in the
aggregate amount of $14,057,199 to Platinum stockholders owning 1,802,205 shares
of common stock who voted against the acquisition and exercised their rights
to
convert their shares into a pro rata portion of the trust account and (iii)
pay
the finder’s fee of $3.0 million to Mr. Lance Duncan, as well as other
transaction-related expenses. We received approximately $50,650,000 at the
time
of closing. Subsequent to the closing, we repurchased 1,997,913 shares of
Platinum common stock for a total purchase price of $15,661,464 (including
commissions) pursuant to our previously announced share repurchase program
and we have utilized an additional approximately $20,750,000 for
certain acquisitions (See “Growth Strategy” on page 34). Our remaining funds are
being, and will be, used for, among other things, additional acquisitions,
working capital, capital expenditures associated with our assets and further
repurchases of shares of our common stock.
33
TEC was dissolved
by a merger with and into its sole shareholder, Tandem Energy Holdings, Inc.,
a
Nevada corporation, effective March 11, 2008. Tandem was the surviving
corporation in the merger and, as such, received the assets of TEC, consisting
of the 7,692,308 shares of Platinum common stock received in the acquisition.
Tandem was dissolved on June 24, 2008 and will distribute the 7,692,308 shares
of Platinum common stock (its assets) to the Tandem shareholders in accordance
with Nevada laws of corporate dissolution. We filed a registration statement
on
Form S-1 with the SEC on February 14, 2008, as amended on April 18, 2008,
relating to the distribution of such shares by Tandem to its
shareholders.
Business
Strategy
Our
primary business strategy is to provide long-term growth in stockholder value
by
drilling, developing and exploiting our acquired oil and gas properties. We
are
currently engaged in an active drilling and workover program in order to achieve
this goal. Additionally, we have and will continue to identify strategic
acquisitions that fit our current business model, which is directed toward
the
development of long lived reserves.
Through
a
number of identifiable synergies, we believe that we are in a unique position
to
exploit our inventory of identified prospects more effectively and efficiently
than many other small independents.
|
|
·
|
Most
of the value of our oil and gas leases is associated with properties
that
we operate. Having operations is key to our ability to execute a
flexible
business plan.
|
|
|
·
|
We
have approximately 37,000 acres currently under lease. The vast majority
of this acreage is held by production. As a result, these leases
will
remain in effect, by contract, until production
ceases.
|
|
|
·
|
Our
properties should afford us with numerous, as yet untapped, drilling
opportunities such as infill drilling locations on most of our
properties.
|
|
|
·
|
One
of the major concerns in companies of our size is the availability
of
drilling rigs in the continental United States. To mitigate that
concern,
we own two drilling rigs capable of drilling in all of our operating
areas, except for the Tomball Field in southeast Texas. We also own,
as of
December 2007, a well servicing company, Red Iron Tool, Inc., which
operates three well servicing rigs. We can use these rigs to service
our
oil and gas properties, or we can lease the rigs to third party operators
at competitive rates, thereby providing an additional source of cash
flow
for us.
|
|
|
·
|
In
addition to the drilling opportunities, there appears to
be significant upside in upgrading two existing fields currently
under waterflood, by providing additional infrastructure and higher
water
injection capabilities. Waterflood refers to the injection of water
into
an oil reservoir to “push additional oil out of the reservoir rock and
into the wellbores of producing wells. This is commonly referred
to as
secondary recovery process.
|
|
|
·
|
Our
properties are located primarily in Texas and southeast New Mexico
and are
not confined to one geographic area. Therefore, catastrophic weather
conditions in one area, such as the 2005 hurricanes along the Gulf
Coast, are not likely to have a significant impact on our overall
operating or financial condition.
|
|
|
·
|
We
have assembled a talented team of technical and operationally adept
professionals who are capable of executing our business
plan.
|
Growth
Strategy
In
addition to our exploitation strategy, we are continually evaluating potential
low risk strategic acquisitions that we believe will complement our business
plan. We believe there exists significant opportunities to exploit mature fields
that may have substantial remaining reserves. As the major, large
independent oil and gas companies continue to focus on more costly and risky
international and offshore prospects, the smaller independents have an
opportunity to take advantage of the significant reserves left
behind.
34
Recent
Acquisitions
The
following acquisitions made in 2007-2008 will impact our growth strategy during
2008:
·
In November 2007, we acquired a 12% working interest in
the North Minnie Bock Field, a producing field in Nueces County, Texas for
approximately $1.1 million.
·
In December 2007, we acquired a 50% working interest in
the La Rosa field for approximately $5.3 million. The La Rosa Field is a
non-producing field of approximately 3,800 acres in Refugio County, Texas.
The
field contains previously drilled and abandoned wells. We believe, based on
our
due diligence, that the La Rosa field can yield substantial production through
recompletions and new drilling.
·
In December 2007, we acquired, out of bankruptcy court,
oil and gas properties, including approximately 200 producing wells, located
in
Chavez, Lea and Eddy counties, New Mexico previously owned by Lothian Oil,
Inc.
for $6.9 million. These assets include over one million Boe of proved reserves.
Approximately 55% of the reserves are proved developed. On the closing date,
the
production was approximately 140 Boe per day, and one of the primary fields
is adjacent to our Ballard Field in Eddy County.
·
In December 2007 we acquired an additional 50% working
interest in the Barnett Shale acreage within our Ball Field for approximately
$920,000. This acquisition increased our net acreage position by 2,300 net
acres
and gave us a 100% working interest in the Barnett Shale. We plan to begin
a
horizontal development program in the Barnett Shale during 2008, which may
include a 3-D seismic program.
·
In December 2007, as part of a strategic attempt to
secure readily available well servicing equipment, we purchased, for
approximately $2.2 million, the outstanding stock of Red Iron Tool, Inc. (“Red
Iron”). As a result, Red Iron is now a wholly owned subsidiary of Platinum. Red
Iron owns three pulling units and other service equipment near our Ira field
in
Scurry County, Texas. One of its rigs has been continuously servicing that
field
for the last six months. The other two have been used by other operators.
Additionally, the former president of Red Iron, who is experienced in
operations, drilling and well servicing in that area, will assist us in
providing oversight of the Ira Field. We may continue to contract the rigs
to
third party operators when not in use on our properties.
·
In January 2008, we acquired a 70% working interest in
the Pleasanton field for approximately $5 million. The Pleasanton Field is
a
non-producing field of approximately 4,200 acres in Atascosa County, Texas.
The
field contains previously drilled and abandoned wells. We believe, based on
our
due diligence, that the Pleasanton field can yield substantial production
through recompletions and new drilling.
·
In March 2008 we acquired an additional property
related to our La Rosa field acquisition for cash in the amount of
$461,500.
·
On April 29, 2008 we consummated our acquisition of
Maverick, a provider of project management, engineering, procurement, and
construction management services to both the public and private sectors, for
a
gross purchase price of $11 million, subject to a working capital purchase
price
adjustment, with $6 million paid at closing and the remaining $5 million to
be
paid over the next 6 years pursuant to non-interest bearing cash flow notes.
The
merger agreement requires us to repay the cash flow notes quarterly by paying
to
the noteholders pro rata 50% of the pre-tax net income, as defined in the merger
agreement, generated by the Maverick business on a stand alone basis in the
prior quarter. In the event the cash flow notes are not repaid in full after
5
years, or under certain other circumstances prior to such time, the cash flow
notes will convert into one year fixed rate term notes bearing interest at
“prime rate” as published in the Wall Street Journal plus 2% per annum on the
date of such conversion. Established in 1993, Maverick has grown into a
full-service engineering service company with 270 employees including a staff
of
70 engineers, consultants, surveyors, scientists and planners. Maverick is
based
in South Texas with offices in Corpus Christi, Victoria, Harlingen and Houston.
Maverick’s organization is divided into four operational units: Oil & Gas,
Industrial, Infrastructure and Surveying. Maverick’s services include
consulting, project management, engineering, procurement, and construction
management. Following the consummation of the Maverick acquisition, we moved
our
corporate headquarters to Maverick’s Houston office. Following consummation of
the acquisition, Robert Kovar, the founder and CEO of Maverick, became our
Chief
Operating Officer in addition to continuing as President of Maverick. Mr.
Kovar’s responsibilities include oversight of all operations, including
engineering, drilling, and production. Mr. Kovar has considerable
experience in managing drilling and development programs, midstream operations,
compression, gas storage and optimization of mature fields. He has over 20
years
of experience, including field management positions with the former Mobil Oil
Corporation and operating oil field services and engineering
companies. For additional information on the terms of the transaction, see
“Management’s Discussion and Analysis of Financial Condition and Results of
Operations - Liquidity and Capital Resources” beginning on page 22.
·
In April 2008, two of our wholly-owned subsidiaries
entered into two agreements to acquire additional oil and gas leasehold and
wellbore interests in Atascosa County, Texas for an aggregate of $1,350,000
.
35
Hedging
Strategy
We
believe that there is a gap in value between oil and gas reserves and the price
of energy commodities and that profit can be captured by buying oil and gas
companies or reserves, and selling the underlying oil and gas commodity.
Following our consummation of the acquisition of the TEC assets, including
its
oil and gas reserves, our board of directors authorized our Chief Executive
Officer to enter into hedging transactions in an attempt to capitalize on that
gap. We believe that by using this strategy, we may be able to preserve profits
and reduce risk. Specifically, we intend to hedge a significant portion of
our
proved reserves utilizing a mixture of calls, puts, forward contracts and other
derivative instruments, in an attempt to lock in profits based on the existing
gap between spot prices of oil and gas and the prices of various futures
contracts. In December 2007 and January 2008, we purchased put options on the
New York Mercantile Exchange (NYMEX) on a total of 410,000 barrels of crude
oil
in 2010 and 2011 at an average price of $80 per barrel. This is in addition
to a
$71 swap on 120,000 barrels in 2009 and a ceiling price of $67 on 150,000
barrels in 2008 which were previously executed and fixed price swaps on 10,000
barrels permonth that we purchased in April 2008 for the period from January
2010 through December 2012, at an average price of $95.25 per
barrel.
Hedging
is a strategy that can help a company to mitigate the volatility of oil and
gas
prices by limiting its losses if oil and gas prices decline; however, this
strategy may also limit the potential gains that a company could realize if
oil
and gas prices increase. While we believe that engaging in such hedging
transactions can be a successful strategy and is in the best interests of
Platinum, we may be prevented from realizing the benefits of price increases
above the levels of the hedges. Further, as a result of hedges we entered into
at fixed prices below current market prices, our recent hedging activity has
generated substantial losses to us. The larger the volume of production, the
more effective a hedging strategy typically can be. While TEC has had a stable
production history, our current and future production levels may not be
sufficient to be able to employ a meaningful hedging strategy.
This
strategy of hedging to lock in profits is a departure from the hedging methods
used by TEC in the past, prior to our acquisition of the TEC assets. TEC had
engaged in hedging transactions at the request of its lenders. TEC specifically
entered into a number of “costless collars” which were used to attempt to
protect Tandem and its creditors from exposure to lower oil and gas prices.
In
conjunction with those hedging transactions, TEC periodically incurred
settlement losses associated with the ceiling component of such hedges when
gas
prices spiked in late 2005 and oil prices spiked in mid 2006. As a result of
those positions, we have and may continue to periodically incur settlement
losses associated with the ceiling component of such hedges as oil prices have
increased during 2007 and 2008. For the period from October 26, 2007 through
December 31, 2007, we reported a $1.5 million net loss on derivatives. For
the
three months ended March 31, 2008, we reported a $2.0 million net loss on
derivatives.
Drilling,
Exploration and Production Activities
Our
exploration efforts are focused on discovering new reserves by drilling and
completing wells under our existing leases (that is, those we acquired in the
TEC acquisition and thereafter), as well as leases we may acquire in the future.
The investment associated with drilling a well and future development of our
leasehold acreage depends principally upon whether any problems are encountered
in drilling the wells, whether the wells, in the case of gas wells, can be
timely connected to existing infrastructure or will require additional
investment in infrastructure, and, if applicable, the amount of water
encountered in the wells.
Title
to Properties
We
believe that the title to our leasehold properties is good and defensible in
accordance with standards generally acceptable in the oil and gas industry,
subject to exceptions that are not so material as to detract substantially
from
the use of the properties. Our leasehold properties are subject to royalty,
overriding royalty and other outstanding interests customary in the industry.
The properties may be subject to burdens such as liens incident to operating
agreements and taxes, development obligations under oil and gas leases, and
other encumbrances, easements and restrictions. We do not believe any of these
burdens will materially interfere with our use of these properties. For a
description of our oil and gas leasehold properties, see “Description of
Properties - Current oil and Gas Activities”.
As
is
customary in the oil and gas industry, only a preliminary title examination
is
conducted at the time properties believed to be suitable for drilling operations
are acquired. We rely upon oil and gas landmen to conduct the title examination.
We intend to perform necessary curative work with respect to any significant
defects in title prior to proceeding with drilling operations.
Competition
The
oil
and natural gas business is highly competitive. We compete with private and
public companies in all facets of the oil and gas business, including suppliers
of energy and fuel to industrial, commercial and individual customers. Numerous
independent oil and gas companies, oil and gas syndicates and major oil and
gas
companies actively seek out and bid for oil and gas prospects and properties
as
well as for the services of third-party providers, such as drilling companies,
upon which we rely. Many of these companies not only explore for, produce and
market oil and gas, but also carry out refining operations and market the
resultant products on a worldwide basis. A substantial number of our competitors
have longer operating histories and substantially greater financial and
personnel resources than us.
Competitive
conditions may be substantially affected by various forms of energy legislation
and regulation considered from time to time by the government of the United
States and the states in which we have operations, as well as factors that
we
cannot control, including international political conditions, overall levels
of
supply and demand for oil and gas, and the markets for synthetic fuels and
alternative energy sources. Intense competition occurs with respect to
marketing, particularly of natural gas.
Regulatory
Matters
General.
The
availability of a ready market for oil and gas production depends upon numerous
factors beyond our control. These factors include local, state, federal and
international regulation of oil and gas production and transportation, as well
as regulations governing environmental quality and pollution control, state
limits on allowable rates of production by a well or proration unit, the amount
of oil and gas available for sale, the availability of adequate pipeline and
other transportation and processing facilities, and the marketing of competitive
fuels. For example, in the case of gas wells, a productive well may be “shut-in”
because of an over-supply of gas or lack of an available pipeline in the areas
in which we may conduct operations. State and federal regulations are generally
intended to prevent waste of oil and gas, protect rights to produce oil and
gas
between owners in a common reservoir, and control contamination of the
environment. Pipelines and gas plants are also subject to the jurisdiction
of
various federal, state and local agencies that may affect the rates at which
they are able to process or transport gas from our properties.
Applicable
legislation is under constant review for amendment or expansion. These efforts
frequently result in an increase in the regulatory burden on companies in the
oil and gas industry and a consequent increase in the cost of doing business
and
decrease in profitability. Numerous federal and state departments and agencies
issue rules and regulations imposing additional burdens on the oil and gas
industry that are often costly to comply with and carry substantial penalties
for non-compliance. Our production operations may be affected by changing tax
and other laws relating to the petroleum industry, constantly changing
administrative regulations and possible interruptions or termination by
government authorities.
Sales
of Oil and Natural Gas.
Sales
of any oil that we produce will be affected by the availability, terms and
costs
of transportation. The rates, terms and conditions applicable to the interstate
transportation of oil by pipelines are regulated by the Federal Energy
Regulatory Commission (“FERC”) under the Interstate Commerce Act. FERC has
implemented a simplified and generally applicable ratemaking methodology for
interstate oil pipelines to fulfill the requirements of Title VIII of the Energy
Policy Act of 1992 comprised of an indexing system to establish ceilings on
interstate oil pipeline rates. FERC has announced several important
transportation-related policy statements and rule changes, including a statement
of policy and final rule issued February 25, 2000, concerning alternatives
to
its traditional cost-of-serve rate-making methodology to establish the rates
interstate pipelines may charge for their services. The final rule revises
FERC’s pricing policy and current regulatory framework to improve the efficiency
of the market and further enhance competition in natural gas
markets.
Sales
of
any natural gas that we produce will be affected by the availability, terms
and
costs of transportation. The rates, terms and conditions applicable to the
interstate transportation of gas by pipelines are regulated by FERC under the
Natural Gas Acts, as well as under Section 311 of the Natural Gas Policy Act.
Since 1985, the FERC has implemented regulations intended to increase
competition within the gas industry by making gas transportation more accessible
to gas buyers and sellers on an open-access, non-discriminatory
basis.
Pipelines.
Pipelines that we use to gather and transport our oil and gas are subject to
regulation by the Department of Transportation (“DOT”) under the Hazardous
Liquids Pipeline Safety Act of 1979, as amended (“HLPSA”), relating to the
design, installation, testing, construction, operation, replacement and
management of pipeline facilities. The HLPSA requires pipeline operators to
comply with regulations issued pursuant to HLPSA designed to permit access
to
and allowing copying of records and to make certain reports and provide
information as required by the Secretary of Transportation.
State
Restrictions.
State
regulatory authorities have established rules and regulations requiring permits
for drilling operations, drilling bonds and reports concerning operations.
Many
states have statutes and regulations governing various environmental and
conservation matters, including the unitization or pooling of oil and gas
properties and establishment of maximum rates of production from oil and gas
wells, and restricting production to the market demand for oil and gas. Such
statutes and regulations may limit the rate at which oil and gas could otherwise
be produced from our properties.
Most
states impose a production or severance tax with respect to the production
and
sale of crude oil, natural gas and natural gas liquids within their respective
jurisdictions. State production taxes are generally applied as a percentage
of
production or sales. In addition, in the event we conduct operations on federal
or state oil and gas leases, such operations must comply with numerous
regulatory restrictions, including various nondiscrimination statutes, royalty
and related valuation requirements, and certain of such operations must be
conducted pursuant to certain on-site security regulations and other appropriate
permits issued by the Bureau of Land Management or the Minerals Management
Service or other appropriate federal or state agencies.
Other.
Oil and
gas rights may be held by individuals and corporations, and, in certain
circumstances, by governments having jurisdiction over the area in which such
rights are located. As a general rule, parties holding such rights grant
licenses or leases to third parties, such as us, to facilitate the exploration
and development of these rights. The terms of the licenses and leases are
generally established to require timely development. Notwithstanding the
ownership of oil and gas rights, the government of the jurisdiction in which
the
rights are located generally retains authority over the manner of development
of
those rights.
Environmental
Matters
General.
Our
activities are subject to local, state and federal laws and regulations
governing environmental quality and pollution control in the United States.
The
exploration, drilling and production from wells, natural gas facilities,
including the operation and construction of pipelines, plants and other
facilities for transporting, processing, treating or storing natural gas and
other products, are subject to stringent environmental regulation by state
and
federal authorities, including the Environmental Protection Agency (“EPA”). Such
regulation can increase our cost of planning, designing, installing and
operating such facilities.
Significant
fines and penalties may be imposed for the failure to comply with environmental
laws and regulations. Some environmental laws provide for joint and several
strict liability for remediation of releases of hazardous substances, rendering
a person liable for environmental damage without regard to negligence or fault
on the part of such person. In addition, we may be subject to claims alleging
personal injury or property damage as a result of alleged exposure to hazardous
substances, such as oil and gas related products.
Waste
Disposal.
We may
generate wastes, including hazardous wastes, that are subject to the federal
Resource Conservation and Recovery Act (“RCRA”) and comparable state statutes.
The EPA has limited the disposal options for certain wastes that are designated
as hazardous under RCRA (“Hazardous Wastes”). Furthermore, it is possible that
certain wastes generated by our oil and gas operations that are currently exempt
from treatment as Hazardous Wastes may in the future be designated as Hazardous
Wastes, and therefore be subject to more rigorous and costly operating and
disposal requirements.
CERCLA.
The
federal Comprehensive Environmental Response, Compensation and Liability Act
(“CERCLA”), also known as the “Superfund” law, generally imposes joint and
several liability for costs of investigation and remediation and for natural
resource damages, without regard to fault or the legality of the original
conduct, on certain classes of persons with respect to the release into the
environment of substances designated under CERCLA as hazardous substances
(“Hazardous Substances”). These classes of persons or so-called potentially
responsible parties include the current and certain past owners and operators
of
a facility where there is or has been a release or threat of release of a
Hazardous Substance and persons who disposed of or arranged for the disposal
of
the Hazardous Substances found at such a facility. CERCLA also authorizes the
EPA and, in some cases, third parties to take action in response to threats
to
the public health or the environment and to seek to recover from the potentially
responsible parties the costs of such action. Although CERCLA generally exempts
petroleum from the definition of Hazardous Substances, we may have generated
and
may generate wastes that fall within CERCLA’s definition of Hazardous
Substances.
Air
Emissions.
Our
operations may be subject to local, state and federal regulations for the
control of emissions of air pollution. Major sources of air pollutants are
subject to more stringent, federally imposed permitting requirements, including
additional permits. Producing wells may generate volatile organic compounds
and
nitrogen oxides. If ozone problems are not resolved by the deadlines imposed
by
the federal Clean Air Act, or on schedule to meet the standards, even more
restrictive requirements may be imposed, including financial penalties based
upon the quantity of ozone producing emissions. If we fail to comply strictly
with applicable air pollution regulations or permits, we may be subject to
monetary fines and be required to correct any identified deficiencies.
Alternatively, regulatory agencies could require us to forego construction,
modification or operation of certain air emission sources.
We
believe that we are in substantial compliance with current applicable
environmental laws and regulations and that, absent the occurrence of an
extraordinary event, compliance with existing local, state, federal and
international laws, rules and regulations governing the release of materials
in
the environment or otherwise relating to the protection of the environment
will
not have a material effect upon our business, financial condition or results
of
operations.
Employees
and Consultants
We
have
approximately 300 employees, including Barry Kostiner, our Chief Executive
Officer, Robert Kovar, our Chief Operating Officer, Lisa Meier, our Chief
Financial Officer, Tim Culp, our Chairman of the Board, William Glass, our
President, James H. Dorman, our Executive Vice Resident, Jim L. Troxel, our
Executive Vice President and Michael G. Cunningham, Senior Vice President and
Chief Financial Officer of our wholly-owned subsidiary, New TEC. We also utilize
the services of several consultants who provide, among other things, technical
support and accounting services.
Legal
Proceedings
On January
16th, 2008, Exxon Mobil Corporation filed a petition in the 270 th
District
Court of Harris County, Texas, naming us as a defendant along with TEC and
a
third party, Merenco Realty, Inc., demanding environmental remediation of
certain properties in Tomball, Texas. In 1996, pursuant to an assignment
agreement, Exxon Mobil sold certain oil and gas leasehold interests and real
estate interests in Tomball, Texas to TEC’s predecessor in interest, Merit
Energy Corporation. In 1999, TEC assigned its 50% undivided interest in one
of
the tracts in the acquired property to Merenco, an affiliate of TEC, owned
50%
by our Chairman of the Board, Tim Culp. In October 2007, the Texas Railroad
Commission notified Exxon Mobil of an environmental site assessment alleging
soil and groundwater contamination for a site in the area of Tomball, Texas.
Exxon Mobil believes that the site is one which was sold to TEC and claims
that
TEC is obligated to remediate the site under the assignment agreement. Exxon
Mobil has requested that the court declare the defendants obligated to restore
and remediate the properties and has requested any actual damages arising from
breach and attorneys’ fees. We believe that Exxon Mobil’s claim that TEC is
responsible for any remediation of such site is without merit and we intend
to
vigorously defend ourselves against this claim. However, no assurance can be
given that we will prevail in this matter. We acquired substantially all the
assets and liabilities of TEC in the TEC acquisition. Merenco was not acquired
by us in the TEC acquisition and our Chairman, Tim Culp, continues to have
a 50%
ownership interest in Merenco.
On
December 12, 2007, we received a subpoena from the SEC in the Matter of Axium
Technologies, Inc. We have provided the requested documentation to the SEC
and
believe that we have fully complied with the subpoena. We do not recognize
the
name Axium Technologies, Inc. and while we do not believe that we, or any of
our
officers or directors, are the subject or target of the SEC's investigation,
no
assurances can be given to that effect.
DESCRIPTION
OF PROPERTIES
The
properties in which we have an interest consist of: our principal executive
offices; the principal executive office of our wholly-owned subsidiary, New
TEC,
through which our business operations are presently conducted; and our oil
and
gas properties on which we conduct, through New TEC, our exploration,
development and production activities.
Principal
Executive Offices
Following
consummation of our acquisition of Maverick, we moved our corporate headquarters
to Maverick’s Houston office. Platinum’s principal executive offices are now
located at 11490 Westheimer Road, Suite 1000 Houston, Texas 77077. This office,
which is principally used by our subsidiary, Maverick, is rented for $38,376.83
per month. New TEC’s principal executive offices are located at 200 N. Loraine,
Suite 400, Midland, Texas. We rent this office space for approximately $11,000
per month. We believe those offices will be adequate to support our operations
for the foreseeable future.
Current
Oil and Gas Activities
Tomball
Field.
We own
an interest in, and are operator of, oil and natural gas properties in the
Tomball Field, which is located in Harris County, Texas, and is approximately
30
miles northwest of Houston, Texas. The Tomball Field contains multiple
productive formations ranging in depth from 1,000 to 9,000 feet, including
the
Yegua, Cockfield, and Wilcox. Current operations consist of 18 producing wells
and 6 water disposal wells. At December 31, 2007, we held 7,000 acres and had
an
inventory of 3 proved undeveloped locations in the Tomball Field. We own a
100%
working interest and net revenue interests ranging from 84.5% to 87.5%. TEC
began operating the Tomball field in 1996, but it has been producing
continuously since 1930. The daily net production from the field for the first
quarter of 2008 averaged 248 Bbls of oil and 553 Mcf of gas per day. The field
is also producing approximately 19,000 Bbls of water per day.
Ira
Field.
We own
an interest in, and are operator of, an oil production unit in the Ira Field,
which is located in Scurry County, Texas, and is approximately 75 miles
northeast of Midland, Texas. The Ira Field production is from the San Andres
formation at approximately 1,800 feet. Current operations consist of 150
producing wells and 75 water injection wells. At December 31, 2007, we held
3,600 acres and had an inventory of 76 proved undeveloped locations in the
Ira
Field. We own an 88% working interest and 72% net revenue interest. TEC, through
it predecessor in interest, began operating the IRA Field in 2004, but it has
been producing continuously since 1955. The daily net production from the field
for the first quarter of 2008 averaged 128 Bbls of oil per day. The field is
also producing approximately 3,000 Bbls of water per day.
Ball
Field.
We own
an interest in, and are operator of, oil and natural gas properties in the
Ball
Field, which is located in Palo Pinto County, Texas, and is approximately 75
miles west of Fort Worth, Texas. The Ball Field contains multiple productive
formations ranging in depth from 3,000 to 3,800 feet, including the Big Saline,
Duffer, and Barnett Shale. Current operations consist of 17 producing wells
and
1 water disposal well. At December 31, 2007, we held 4,900 acres and had an
inventory of 29 proved undeveloped locations in the Ball Field. We own working
interests ranging from 50% to 100%, and net revenue interests ranging from
40.3%
to 87.5%. TEC began operating the Ball Field in 1993, but it has been producing
continuously since 1930. The daily net production from the field for the first
quarter of 2008 averaged 1 Bbls of oil and 489 Mcf of gas per day. The field
is
also producing approximately 450 Bbls of water per day. On December 28,
2007 we acquired an additional 50% working interest in the Barnett Shale acreage
for approximately $920,000. This acquisition increased our net acreage position
by 2,300 net acres and gave us a 100% working interest in the Barnett. We plan
to begin a horizontal development program in the Barnett Shale during 2008,
which may include a 3-D seismic program.
Ballard
Field.
We own
an interest in, and are operator of, an oil production unit in the Ballard
Field, which is located in Eddy County, New Mexico, and is approximately 150
miles northwest of Midland, Texas. The Ballard Field contains multiple
productive formations ranging in depth from 2,000 to 3,000 feet, including
the
Yates, Grayburg, and San Andres. Current operations consist of 40 producing
wells and 26 water injection wells. At December 31, 2007, we held 3,000 acres
and had an inventory of 36 proved undeveloped locations in the Ballard Field.
We
own an 86% working interest and 78.7% net revenue interest. TEC, through its
predecessor in interest, began operating the Ballard Field in 2004, but it
has
been producing continuously since 1965. The daily net production from the field
for the first quarter of 2008 averaged 47 Bbls of oil per day. The field is
also
producing approximately 1,300 Bbls of water per day.
USM
Field.
We own
an interest in, and are operator of, oil and natural gas properties in the
USM
Field, which is located in Pecos County, Texas, and is approximately 120 miles
southwest of Midland, Texas. The USM Field production is from the Yates and
Queen formations at approximately 3,200 feet. Current operations consist of
50
producing wells and 4 water disposal wells. At December 31, 2007, we held 3,000
acres and had an inventory of 54 proved development locations in the USM Field.
We own working interests ranging from 90% to 100%, and net revenue interests
ranging from 79.3% to 89.6%. TEC, through its predecessor in interest, began
operating the USM Field in 2004, but it has been producing continuously since
1985. The daily net production from the field for the first quarter of 2008
averaged 53 Bbls of oil and 105 Mcf per day. The field is also producing
approximately 150 Bbls of water per day.
Choate
Field.
We own
an interest in, and are operator of, oil and natural gas properties in the
Choate Field, which is located in Hardin County, Texas, and is approximately
35
miles northwest of Beaumont, Texas. The Choate Field production is from sand
lenses flanking a salt dome ranging in depth from 1,000 to 2,500 feet. Current
operations consist of 14 producing wells. At December 31, 2007, we held 50
acres
and had an inventory of 9 proved undeveloped locations in the Choate Field.
We
own a 75% working interest and 57% net revenue interest. TEC, through its
predecessor in interest, began operating the Choate Field in 2004, but it has
been producing continuously since 1960. The daily net production from the field
for the first quarter of 2008 averaged 35 Bbls of oil per day. The field is
also
producing approximately 180 Bbls of water per day.
Lothian
Properties.
In
December 2007 we purchased, for $6.2 million plus customary closing adjustments,
approximately 200 producing wells from Lothian Oil and Gas, Inc. The Lothian
assets acquired consist of oil and gas properties located in Chavez, Lea and
Eddy counties, New Mexico and are adjacent to or near our Ballard Field. On
the
closing date of that acquisition, the net production was approximately 102
boe
per day.
Other.
We own
numerous small mineral, royalty and non-operated working interests in various
oil and natural gas properties located in Texas, New Mexico, Louisiana, Montana,
and North Dakota.
Below
is
a map indicating the locations of our significant properties in Texas and New
Mexico.
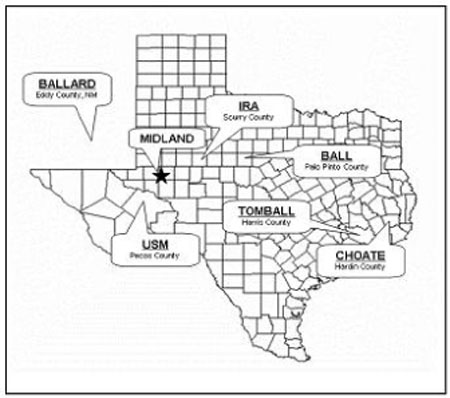
Drilling
Results
New
TEC
drilled or participated in the following numbers of wells during the period
from
the closing of the TEC acquisition on October 26, 2007 through December 31,
2007. No exploratory wells were drilled during the presented
periods.
|
|
Gross
|
Net
|
|||||
|
Development
Wells:
|
|
|
|||||
|
Oil
|
-
|
-
|
|||||
|
Gas
|
1.0
|
0.4
|
|||||
|
Dry
|
-
|
-
|
|||||
|
Total
|
1.0
|
0.4
|
|||||
The
information contained in the foregoing table should not be considered indicative
of our future drilling performance, nor should it be assumed that there is
any
necessary correlation between the number of productive wells drilled and the
amount of oil and gas that may ultimately be recovered by us.
Red Iron Tool,
Inc.
In
December 2007, as part of a strategic attempt to secure readily available well
servicing equipment, we purchased, for approximately $2.2 million, the
outstanding stock of Red Iron Tool, Inc.(Red Iron). As a result, Red Iron is
now
a wholly owned subsidiary of Platinum. Red Iron owns three pulling units and
other service equipment near our Ira field in Scurry County, Texas. One of
its
rigs has been continuously servicing that field for the last six months. The
other two have been used by other operators. Additionally, the former president
of Red Iron, who is experienced in operations, drilling and well servicing
in that area, is assisting us in providing valuable oversight of the Ira Field.
We may continue to contract the rigs to third party operators when not in use
on
our properties.
Reserve
Report Summary
The
engineering evaluation associated with the oil and gas reserves table below
dated December 31, 2007 was prepared by Williamson Petroleum Consultants, Inc.
(“WPC”), independent petroleum engineers, and by New TEC’s reservoir engineer.
The portion of the total reserves evaluated by WPC on a Boe basis was
approximately 94.1%, and on a standardized measure of future net cash flows
basis was approximately 94.4%. The reserves engineered by New TEC’s reservoir
engineer are related to the reserves associated with the Lothian acquisition,
more fully described elsewhere in this prospectus, which was consummated on
December 28, 2007. WPC’s report contains the reserves associated with the proved
developed producing portion of the Lothian acquisition, and New TEC’s report
contains the reserves associated with the proved undeveloped portion of the
Lothian acquisition. Both such estimates were made in accordance with guidelines
established by the Securities and Exchange Commission and the Financial
Accounting Standards Board, which require that reserve reports be prepared
under
economic and operating conditions existing at the registrant’s year end with no
provision for price and cost escalations except by contractual arrangements.
Future cash inflows were computed by applying year-end prices to the year-end
quantities of proved reserves. Future development, abandonment and production
costs were computed by estimating the expenditures to be incurred in developing,
producing, and abandoning proved oil and gas reserves at the end of the year,
based on year-end costs. Certain information utilized in the preparation of
WPC’s report with respect to interests, reversionary status, oil and gas prices,
gas contract terms, operating expenses, investments and current operating
conditions, as applicable were provided by New TEC. All such data provided
to
WPC have been reviewed by WPC for reasonableness and, unless obvious errors
were
detected, have been accepted as correct. WPC did not provide any geological
mapping, seismic interpretations or well log analysis in the course of their
evaluation but relied upon data and analysis provided by previous evaluators.
All of the our reserves are located in the United States.
A
summary
of the combined report is as follows:
|
|
Proved
Developed
Producing
|
Proved
Developed
Nonproducing
|
Proved
Undeveloped
|
Total Proved
|
|||||||||
|
|
|
|
|
|
|||||||||
|
Crude
oil (Bbl)
|
2,569,592
|
68,745
|
3,887,413
|
6,525,750
|
|||||||||
|
Natural
gas (Mcf)
|
5,709,878
|
787,234
|
15,314,743
|
21,811,855
|
|||||||||
|
Bbl
oil equivalent (Boe)
|
3,521,238
|
199,950
|
6,439,870
|
10,161,058
|
|||||||||
|
Undiscounted
future net revenue (before CapEx)
|
$
|
154,381,219
|
9,505,243
|
392,044,598
|
$
|
555,931,060
|
|||||||
|
Estimated
future capital expenditures
|
-
|
255,300
|
54,437,137
|
54,692,437
|
|||||||||
|
Undiscounted
future net revenue (net of CapEx)
|
$
|
154,381,219
|
9,249,943
|
337,607,461
|
$
|
501,238,623
|
|||||||
|
Discounted
future net revenue (net of CapEx)
|
$
|
86,336,766
|
5,906,856
|
171,876,576
|
$
|
264,120,198
|
|||||||
As
of
December 31, 2007, on an equivalent barrel basis, 63% of TEC’s proved reserves,
were classified as proved undeveloped.
A
summary
of the total proved reserves of TEC by major field is as follows:
|
|
Proved Producing
|
Proved Non
Producing
|
Proved Undeveloped
|
Total Proved Reserves
|
|||||||||||||||||||||
|
|
Oil (bbls)
|
Gas (mcf)
|
Oil (bbls)
|
Gas (mcf)
|
Oil (bbls)
|
Gas (mcf)
|
Oil (bbls)
|
Gas (mcf)
|
|||||||||||||||||
|
Tomball
|
967,792
|
931,127
|
28,850
|
—
|
—
|
9,274,074
|
996,642
|
10,205,201
|
|||||||||||||||||
|
Ira
|
396,019
|
—
|
—
|
—
|
1,367,857
|
—
|
1,763,876
|
—
|
|||||||||||||||||
|
Ballard
|
442,093
|
127,598
|
—
|
—
|
632,083
|
—
|
1,074,176
|
127,598
|
|||||||||||||||||
|
USM
|
119,972
|
272,115
|
—
|
—
|
1,148,000
|
2,296,000
|
1,267,972
|
2,568,115
|
|||||||||||||||||
|
Ball
|
409
|
1,392,312
|
—
|
787,234
|
—
|
3,285,129
|
409
|
5,464,674
|
|||||||||||||||||
|
Choate
|
109,265
|
—
|
39,895
|
—
|
153,900
|
—
|
303,060
|
—
|
|||||||||||||||||
|
Lothian
|
405,508
|
538,868
|
—
|
—
|
523,180
|
459,540
|
928,688
|
998,408
|
|||||||||||||||||
|
Other
|
128,534
|
2,447,859
|
—
|
—
|
62,393
|
—
|
190,927
|
2,447,859
|
|||||||||||||||||
|
Total
|
2,569,592
|
5,709,879
|
68,745
|
787,234
|
3,887,413
|
15,314,743
|
6,525,750
|
21,811,855
|
|||||||||||||||||
Areas
of Opportunity
The
following is a discussion of the specific areas of opportunity that were not
identified in the Reserve Report dated as of December 31, 2007
that we
believe are available but not addressed in the proved reserve report
analysis:
| · |
The
Ira Field has produced 20 million boe to date. We believe that there
are
approximately 105 million boe oil in place at such property. Using
area
and industry primary and secondary recovery standards for the Ira
Field
reservoir, we believe that approximately 28% of the property’s oil in
place can be recovered. Only a small fraction of the Ira Field lease
has
been effectively waterflooded. We have already begun a pilot upgrade
to
our waterflood in the Ira Unit in Scurry County, Texas and expect
to
expand the waterflood by year end in an effort to significantly increase
production by the first quarter of 2009.Based on this recovery rate,
if
the total estimated capital cost of the re-instituted waterflood
program
is $12 million to $15 million, the finding and development cost would
be
under $1.75 per boe.
|
| · |
We
believe that the Ball lease has significant Barnett Shale reserves,
as
well as shallow sands (behind pipe reserves) that have never been
completed.
|
| · |
We
have completed a 3D seismic survey in Palo Pinto County, Texas, and
once
the results of the survey are evaluated, we plan to drill several
Barnett
Shale horizontal wells in the fourth quarter. If successful, these
wells
will be the initial phase of an expanded drilling program on this
acreage
in 2009.
|
| · |
We
successfully re-entered an idle well and re-established production
in the
Wilcox interval in our Tomball Field. The well is currently producing
approximately 600 MCFD before stimulation from an interval that had
been
abandoned over 50 years ago. We plan to fracture stimulate the well
to
clean up skin damage that occurred when the well was initially drilled
in
the 1950’s with the obvious goal of increasing productivity. We have plans
to re-complete another well in the Tomball Field to re-establish
production from a similar abandoned Wilcox zone. If successful, we
may
expand development of the Wilcox formation within the
field.
|
Directors,
Executive Officers and Other Key Personnel
The
board
of directors and executive officers of Platinum and New TEC are as
follows:
|
Name
|
|
Age
|
|
Position
|
|
Tim
Culp
|
49
|
Chairman
of the Board and Director
|
||
|
Barry
Kostiner
|
|
37
|
|
Chief
Executive Officer, Secretary and Director
|
|
Robert
Kovar
|
44
|
Chief
Operating Officer
|
||
| Lisa Meier | 35 | Chief Financial Officer and Treasurer | ||
|
William
C. Glass
|
|
37
|
|
President
and Director
|
|
Richard
Geyser
|
|
40
|
|
Vice
President
|
|
James
H. Dorman
|
|
75
|
|
Executive
Vice President
|
|
Jim
L. Troxel
|
|
55
|
|
Executive
Vice President
|
|
Michael
G. Cunningham
|
|
51
|
|
Sr.
Vice President and CFO - New TEC
|
|
Bernard
Lang
|
72
|
Director
|
||
|
Norman
Rosenberg
|
38
|
Director
|
Tim
G. Culp
has been
our Chairman of the Board and a director since October 26, 2007. Prior to this,
Mr. Culp joined Tandem in June 2005 as President and Chief Executive Officer
and, in connection with the acquisition, became Chairman of the Board and a
director of Platinum, as well as President and Chief Executive Officer of New
TEC. Mr. Culp was a co-founder, senior officer and principal stockholder of
TEC
and Shamrock Energy Corporation and its operating affiliate, Arrowhead
Operating, Inc. Prior to forming TEC, Mr. Culp was a Vice President with Adobe
Resources Corporation. During Mr. Culp’s tenure, Adobe, TEC and Shamrock
acquired over $140 million in oil and gas properties. Mr. Culp has over
twenty-five years of oil and gas industry experience with over twenty years
of
experience in property acquisitions and development. Prior to joining Adobe,
Mr.
Culp was a manager for the public accounting firm of KPMG Peat Marwick. Mr.
Culp
received his Bachelor of Business Administration degree in Accounting from
Texas
Tech University in 1981.
Barry
Kostiner
has been
our Chief Executive Officer, secretary and a member of our board of directors
since inception. Mr. Kostiner has been involved in energy trading and
structuring since 1992. Mr. Kostiner has negotiated structured transactions
and
built trading desks in electricity, natural gas options and physical gas. Mr.
Kostiner was formerly a manager and principal of KD Resources, LLC, a
privately-owned Delaware limited liability company engaged in the oil and gas
exploration and production industry, which Mr. Kostiner founded with James
H.
Dorman, our Executive Vice President. Mr. Kostiner was the manager of Braesridge
Energy LLC, which invests in energy companies, including ours, from its
inception on July 19, 2007 through February 14, 2008. From March
2003 through 2005, he was a principal of Ellipse Energy LLC, a
consulting and private equity firm. From March 2001 to January 2003, he was
a
managing director at Allegheny Energy, an energy trading and generation asset
management company. At Allegheny, as a managing director, he was responsible
for
the physical gas trading desk that controlled fuel supply and risk management
for 2,800 MW of natural gas fired generation, with an acquisition value of
over
$2 billion. He also was involved in initiating the coal trading group, the
E&P asset acquisition and European trading businesses. From January 1999
until March 2001, he was a vice president at Merrill Lynch in its energy trading
group which was subsequently sold to Allegheny Energy. From October 1995 until
January 1999, he was an associate at Goldman Sachs in its energy origination
group. Mr. Kostiner was a founding employee involved in business development,
strategy and management for the joint venture between Goldman Sachs and
Constellation Energy. He received a BS in Electrical Engineering and MS in
applied mathematics from MIT. His master’s thesis jointly supervised by
Harvard’s Kennedy School of Government was on mathematics applied to deregulated
electricity markets.
Robert
Kovar
has been
our Chief Operating Officer since our acquisition of Maverick on April 29,
2008.
Mr. Kovar founded Maverick in 1993 and has been its president and chief
executive officer since that time. Maverick has been a provider of project
management, engineering, procurement, and construction management services
to
both the public and private sectors. Mr. Kovar is a registered professional
engineer (P.E.) in Texas, earned a Bachelor of Science in Petroleum Engineering
from Texas A&M in 1986 and a Masters of Business Administration from the
University of Houston-Victoria in 1992.
Lisa
Meier
has been
our Chief Financial Officer and Treasurer since August 11, 2008. Ms. Meier
is a
certified public accountant, and prior to joining the Company served from
April
2004 to July 2008 as chief financial officer of Flotek Industries, Inc.,
a New
York Stock Exchange listed company based in Houston, Texas, specializing
in
innovative production chemicals and down-hole drilling and production equipment.
Previously, Ms. Meier served as Supervisor of SEC Financial Reporting for
Service Corporation International from 2003 to 2004. Prior to that time,
Ms.
Meier held various accounting, finance, and risk management positions at
several
Fortune 500 companies and served in the energy audit practice at
PricewaterhouseCoopers. Ms. Meier earned a Bachelor of Business Administration
(BBA) from the University of Texas at Austin and a Master of Professional
Accountancy (MPA) from the University of Texas at Austin in 1996. Ms. Meier
also
currently serves on the board of directors of Northern Oil and Gas, Inc.,
an
American Stock Exchange listed company. Northern Oil and Gas, Inc. is an
exploration and production company focused in the Bakken formation and
throughout the Rocky Mountain region. She serves as chairman of its audit
committee and compensation committee.
William
C. Glass
has been
President and a member of our board of directors since inception. Mr. Glass
has
worked in the energy industry and energy financial derivatives markets since
1996. Mr. Glass has been an independent energy trader and consultant since
December 2003. From July 2000 to December 2003, Mr. Glass was Vice president
of
Marubeni Energy Incorporated’s North American Natural gas division. He was
responsible for all natural gas transactions, transportation, marketing,
trading, and operations. From February 1997 to July 2000, Mr. Glass was a senior
trader at Southern Company Energy marketing. His responsibilities included
managing the financial gas daily desk as well as trading gulf coast, northeast,
and mid west financial products. From October 1995 to February 1997, Mr. Glass
worked at Enron as part of the risk management team. Mr. Glass holds a
bachelor’s in Finance and Accounting from Texas A&M
University.
Richard
Geyser
has been
our Vice President since inception. Mr. Geyser has over 10 years of alternative
investment-related experience. Since February 2004, Mr. Geyser has been a
Managing Director of Platinum Partners Value Arbitrage Fund, a private
investment partnership. From March 2003 to October 2003, he was a Director
of
Capital Introduction at Paravane Partners, a division of Leeb Brokerage
Services. From February 2002 to February 2003, he co-founded two hedge funds:
Voyager Partners (options volatility and equity statistical arbitrage) and
Entropy Partners (equity statistical arbitrage). From 1996 through 2001, Mr.
Geyser was a Senior VP at BlueStone Capital Corp during which time his clients
financed dozens of publicly traded companies, including several energy-related
companies. Mr. Geyser received an MBA with High Honors from Thunderbird, the
American Graduate School of International Management and an A.B. cum laude
from
Harvard College.
James
H. Dorman
has been
our Executive Vice President since inception. He brings with him 46 years of
global experience in E&P. Since 2001, Mr. Dorman has been involved in
various advisory projects. He has been a member of the board of directors for
Transmeridian Exploration Inc., a public E&P company listed on the American
Stock Exchange, for the past three years. Since May 2007, Mr. Dorman has been
a
manager and principal of KD Resources, LLC, a privately-owned Delaware limited
liability company engaged in the oil and gas exploration and production
industry, which Mr. Dorman founded with Barry Kostiner, our Chief Executive
Officer and a director. From 1996 through 2001, Mr. Dorman formed a public
Canadian exploration company, Doreal Energy, and with his partners developed
successful exploration projects in England, Columbia and Portugal. From 1990
through 1995, Mr. Dorman advised Garnet Resources and American International
Petroleum on the development of South American E&P assets, including the
development of 1.5 mm acres in Columbia. From 1964 through 1989, Mr. Dorman
held
various positions at Tenneco. As Vice President of Exploration for the South
America Division, Mr. Dorman had responsibility for 28 commercial discoveries,
including the giant San Francisco - Balcon and Colombina oil fields, prior
to
Tenneco’s acquisition by Shell. Mr. Dorman began his career with Chevron in
Louisiana in 1955. His diverse experience includes service as an Army Medic
for
the National Guard in Korea in 1951-2. Mr. Dorman has a BS with honors in
Petroleum Geology from Mississippi State University and a MS in Geology from
the
University of Missouri.
Jim
L. Troxel
has been
our Executive Vice President since inception. He has had diverse experience
as a
senior geologist. Mr. Troxel has held his current position of Vice President
of
Exploration at Thorp Petroleum Corporation, an oil and gas E&P company,
since 1997. He has overseen the drilling of 49 wells, with production of 70
Bcf
and 3 mm Boe. Mr. Troxel was at Amerada Hess, a public oil and gas E&P
company listed on the NYSE, from 1987 through 1996, where he held the role
of
senior geologist. He was responsible for discovering Hess’ largest field during
this period, which produced 95 Bcf and 6 mm Boe. While at Texas Oil and Gas,
an
oil and gas E&P company, from 1980 through 1987, Mr. Troxel was an area
geologist that managed a team of geologists and geophysicists that directed
the
drilling of exploration prospects. For four years, he generated prospects for
4
rigs out of a 12 rig drilling program. Mr. Troxel received his BS in Geology
from the University of Oklahoma.
Michael
(Mickey) G. Cunningham
has been
New TEC’s Sr. Vice President and Chief Financial Officer since our acquisition
of TEC. Prior to that, Mr. Cunningham served in the same capacity for Tandem
since joining Tandem in May 2005. Mr. Cunningham has been a Certified Public
Accountant since 1988 but, even prior to becoming a CPA, was involved in the
oil
and gas industry working as an accountant with Gulf Oil Corporation from 1980
in
a wide variety of areas through a special management program developed by Gulf.
From 1985 through 2005, Mr. Cunningham was Controller of Clayton Williams
Energy, Inc. He has been a member of the AICPA and TSCPA since
1988.
Bernard
Lang
has been
a member of our board of directors since his appointment on July 15, 2008.
Mr.
Lang is an Executive Vice President, Project Execution for Synenco Energy Inc.,
an Alberta, Canada-based company focused on developing oil sands resources
in
the Athabasca Oil Sands region northeast of Fort McMurray, Alberta. He has
worked at Synenco since February 2006. Mr. Lang is also currently a director
for
Exall Energy Corporation, a Canadian based oil and gas E&P company. Prior to
joining Synenco, Mr. Lang was a Partner of Techna West Engineering, an Edmonton,
Alberta-based firm that specializes in petroleum-based engineering services,
where he acted as the Vice President, Client Relations from November 2002 to
January 2006. From July 2001 to November 2002, Mr. Lang was President &
Chief Operating Officer (Contract) and the Vice Chairman of the Board of
Directors for Exall Resources Ltd. Slovakia. There, Mr. Lang was responsible
for
the restructuring and reorganization of Novácke Chemické Závody a.s., a
subsidiary of Exall Resources that produces organic and inorganic chemicals,
technical gases, polymers, PVC emulsions and suspensions along with other
products, Prior to that, Mr. Lang held various executive management positions
with Suncor Energy Inc. from June 1982 to July 2001. During this time Mr. Lang
directed an award winning changeover project of an upgrader control room from
manual to computer control and a $210 million flue gas desulphurization plant.
From 1997 to 2001, Mr. Lang served as Vice-President, Millennium Project where
he was accountable for a $3.4 billion oil sands expansion. Suncor is one of
Canada’s largest petroleum recovery and refining operations, mining vast heavy
oil and natural gas reserves in northern Alberta and throughout western Canada.
Norman
Rosenberg
has been
a member of our board of directors since his appointment on July 15, 2008.
Mr.
Rosenberg is chief financial officer for the Americas division of Marsh, Inc.,
a
Marsh & McLennan Company, where he has served since August 2007. Prior to
that, Mr. Rosenberg was the chief financial officer for IDT Telecom, a principal
operating subsidiary of IDT Corporation, where he served from May 1999 to July
2007, managing a global team of approximately 130 finance professionals with
final responsibility for all finance-related functions, including accounting,
budgeting, accounts receivable/payable, credit, pricing, taxation, financings
and mergers & acquisitions. Previously, Mr. Rosenberg held a number of
positions in Standard & Poor’s Equity Group where he worked from June 1995 –
September 1999 and was the head of research for the energy sector. Mr. Rosenberg
received a Bachelor of Arts from Ner Israel College in 1991 and a Master of
Science in Business from Johns Hopkins University in 1995.
Board
Composition
Our
board
of directors is divided into three classes with only one class of directors
being elected in each year and each class serving a three-year term. The term
of
office of the first class of directors (Class A), currently consisting of
Bernard
Lang,
will
expire at our first annual meeting of stockholders. The term of office of the
second class of directors (Class B), consisting of William C. Glass and Norman
Rosenberg, will expire at the second annual meeting. The term of office of
the
third class of directors (Class C), currently consisting of Tim G. Culp and
Barry Kostiner, will expire at the third annual meeting. We currently have
one
vacancy on our board. At the consummation of the TEC acquisition, Mr. Nordlicht
resigned as Chairman and a director and our board appointed Mr. Culp as a Class
C director to fill the vacancy in the class. Pursuant to the terms of the
acquisition agreement, Platinum is required to appoint an individual recommended
by Mr. Culp as a Class A director (which individual shall be “independent”
within the meaning of the NASDAQ corporate governance rules), to fill the
existing vacancy in that class. In addition, pursuant to the TEC acquisition
agreement, Platinum has agreed that, for so long as Mr. Culp owns at least
one
percent (1%) of the outstanding shares of Platinum, to the extent permitted
by
applicable law and corporate governance rules, it shall: (i) cause Mr. Culp
to
be nominated to the board as a Class C director and submitted for election
by
the shareholders of Platinum; and (ii) cause an individual recommended by Mr.
Culp to be nominated to the board as a Class A director (which individual shall
be “independent” within the meaning of the NASDAQ corporate governance rules)
and submitted for election by the shareholders of Platinum.
None
of
our directors who served on our board of directors during the last fiscal year
is independent under the requirements of the Nasdaq corporate governance rules.
Following the consummation of the acquisition, we began seeking candidates
who
would be considered “independent” under the Nasdaq corporate governance
standards. We have since identified and appointed Bernard Lang and Norman
Rosenberg as “independent” directors to fill existing vacancies on the board. We
anticipate that they will eventually serve on the board committees that we
will
create, namely: audit committee, compensation committee and nominating and
corporate governance committee.
Board
Committees
Corporate
Governance - Audit Committee
We
do not
have an audit committee of our board of directors, nor do we have an audit
committee financial expert. Furthermore, our equity securities are not listed
on
an exchange or automated quotation system that requires its listed companies
to
appoint an audit committee. Prior to the TEC acquisition and, thereby, our
commencement of business operations, we did not believe that the nature of
our
business was such that an audit committee or audit committee financial expert
would be useful or necessary. Following the consummation of the acquisition,
we
began seeking candidates who would be considered “independent” under the Nasdaq
corporate governance standards. We anticipate that these individuals, including
those already appointed will comprise our audit committee.
Code
of Ethics
We
have
adopted a Code of Conduct and Ethics that applies to our principal executive
officer or principal financial officer, or persons performing similar functions,
as well as to all our directors, officers and employees. Our Code of Conduct
and
Ethics is posted on our Internet website. Our Internet website is
www.platenergy.com. We intend to post on our website any amendment to, or waiver
from, any provision of our Code of Conduct and Ethics that applies to our
principal executive officer, principal financial officer, principal accounting
other or persons performing similar functions that relates to any element of
our
Code regarding: (1) honest and ethical conduct, including the ethical handling
of actual or apparent conflicts of interest between personal and professional
relationships; (2) full, fair, accurate, timely and understandable disclosure
in
our reports and other filings with the SEC or our public communications; (3)
compliance with applicable governmental laws, rules and regulations; (4) prompt
internal reporting of the violations of our code to an appropriate person
identified in our code; and (5) accountability for adherence to our
code.
Compensation
Committee Interlocks and Insider Participation
We
do not
have a compensation committee. As such, the entire board of directors performs
the function of a compensation committee. The board of directors made the
decision that our executive officers would not be compensated until the
commencement of our operations following consummation of the TEC acquisition.
Going forward, decisions regarding compensation of our officers and directors
will be determined by the board until such time as a compensation committee
is
formed. Tim Culp (our Chairman of the Board), Barry Kostiner (our CEO and
Secretary), William C. Glass (our President), executive officers, and Bernard
Lang and Norman Rosenberg comprise our board of directors.
Compensation of
Directors
During
the last fiscal year, William C. Glass was our only director who was not one
of
our “named executive officers.” Mr. Glass did not receive any compensation or
fees in connection with his role as a member of our board of directors or as
a
member of any board committees in 2006 or 2007. Our newly appointed independent
directors, Bernard Lang and Norman Rosenberg each receive cash compensation
of
$25,000 per year for their services and annual grants of stock options to
purchase up to 5,000 shares of our common stock.
EXECUTIVE
COMPENSATION
Compensation
Discussion and Analysis
The
following discussion and analysis of compensation arrangements of the named
executive officers of our company should be read together with the compensation
tables and related disclosures set forth below.
This
compensation discussion and analysis explains our compensation philosophy,
policies and practices with respect to our executive officers.
General.
Our
board of directors is responsible for establishing and administering policies
governing the compensation of our executive officers. Messrs. Lang and Rosenberg
are independent directors under the requirements of the Nasdaq corporate
governance rules. We have not yet formed a compensation committee but intend
to
soon, at which point our policies with respect to executive compensation will
be
administered by our board in consultation with such compensation committee.
We
intend for our compensation policies to provide for compensation that is
sufficient to attract, motivate and retain executives of outstanding ability
and
potential and to establish an appropriate relationship between executive
compensation and the creation of shareholder value. To meet these goals, our
compensation committee will be charged with recommending executive compensation
packages to our board of directors.
It
is
anticipated that performance-based and equity-based compensation will be an
important foundation in executive compensation packages as we believe it is
important to maintain a strong link between executive incentives and the
creation of shareholder value. We believe that performance and equity-based
compensation can be an important component of the total executive compensation
package for maximizing shareholder value while, at the same time, attracting,
motivating and retaining high-quality executives. The 2006 Long Term Incentive
Plan reflects what we believes is a focus on performance- and equity-based
compensation. Since we do not yet have a compensation committee, we have not
yet
adopted any formal guidelines for allocating total compensation between equity
compensation and cash compensation for executives hired in the
future.
Overall,
we seek to provide total compensation packages that are competitive in terms
of
potential value to our executives, and which are tailored to the unique
characteristics and needs within the oil and gas industry in order to create
an
executive compensation program that will adequately reward our executives for
their roles in creating value for our shareholders. We intend to be competitive
with other similarly situated companies in the oil and gas
industry.
The
compensation decisions regarding our executives will be based on our need to
attract individuals with the skills necessary for us to achieve our business
plan, to reward those individuals fairly over time, and to retain those
individuals who continue to perform at or above our
expectations.
It
is
anticipated that our executives’ compensation will have three primary components
- salary, cash incentive bonus and stock-based awards. We will view the three
components of executive compensation as related but distinct. Although our
compensation committee will review total compensation, we do not believe that
significant compensation derived from one component of compensation should
negate or reduce compensation from other components. We anticipate determining
the appropriate level for each compensation component based in part, but not
exclusively, on our view of internal equity and consistency, individual
performance and other information deemed relevant and timely. Since our
compensation committee has not yet been formed, we have not adopted any formal
or informal policies or guidelines for allocating compensation between long-term
and currently paid out compensation, between cash and non-cash compensation,
or
among different forms of compensation.
In
addition to the guidance provided by our compensation committee, we may utilize
the services of third parties from time to time in connection with the hiring
and compensation awarded to executive employees. This could include
subscriptions to executive compensation surveys and other
databases.
Our
compensation committee will be charged with performing an annual review of
our
executive officers’ cash compensation and equity holdings to determine whether
they provide adequate incentives and motivation to executive officers and
whether they adequately compensate the executive officers relative to comparable
officers in other companies.
Compensation
Components
Base
Salary.
Generally, working with the compensation committee, we anticipate setting
executive base salaries at levels comparable with those of executives in similar
positions and with similar responsibilities at comparable companies. We will
seek to maintain base salary amounts at or near the industry norms while
avoiding paying amounts in excess of what we believe is necessary to motivate
executives to meet corporate goals. It is anticipated that base salaries will
generally be reviewed annually, subject to terms of employment agreements,
and
that the compensation committee and board will seek to adjust base salary
amounts to realign such salaries with industry norms after taking into account
individual responsibilities, performance and experience.
Annual
Bonuses.
We
intend to utilize cash incentive bonuses for executives to focus them on
achieving key operational and financial objectives within a yearly time horizon.
Near the beginning of each year, the board, upon the recommendation of the
compensation committee and subject to any applicable employment agreements,
will
determine performance parameters for appropriate executives. At the end of
each
year, the board and compensation committee will determine the level of
achievement for each corporate goal.
Equity
Awards.
We will
also use stock options and other stock-based awards to reward long-term
performance. We believe that providing a meaningful portion of our executives’
total compensation package in stock options and other stock-based awards will
align the incentives of our executives with the interests of our shareholders
and with our long-term success. The compensation committee and board will
develop their equity award determinations based on their judgments as to whether
the complete compensation packages provided to our executives, including prior
equity awards, are sufficient to retain, motivate and adequately award the
executives. Equity awards will be granted through Platinum’s 2006 Long Term
Incentive Plan described below.
Stock
ownership guidelines have not been implemented by our board of directors for
our
named executive officers. We will continue to periodically review best practices
and re-evaluate our position with respect to stock ownership
guidelines.
Other
Compensation.
We will
establish and maintain various employee benefit plans, including medical,
dental, life insurance and 401(k) plans. These plans will be available to all
salaried employees and will not discriminate in favor of executive officers.
We
may extend other perquisites to our executives that are not available to our
employees generally.
Summary
Compensation Table
The
following table sets forth the aggregate compensation awarded to, earned
by or
paid to our Chairman and our Chief Executive Officer, who are collectively
referred to as our named executive officers, in 2006 and 2007. Prior to our
completion of the TEC acquisition on October 26, 2007, none of our executive
officers received any compensation.
|
Name and
Principal
Position
|
Year
|
Salary
($)
|
Bonus
($)
|
Stock
Awards
($)
|
Option
Awards
($)
|
Non-Equity
Incentive Plan
Compensation
($)
|
Change in
Pension Value
and
Nonqualified
Deferred
Compensation
Earnings
|
All Other
Compensation
($)
|
Total
($)
|
|||||||||||||||||||
|
Tim
Culp,
|
2007
|
$
|
177,700
|
$
|
0
|
$
|
0
|
$
|
0
|
—
|
—
|
$
|
0
|
$
|
177,700
|
|||||||||||||
|
Chairman
of the Board (1)
|
2006
|
$
|
156,000
|
(2)
|
$
|
5,000
|
$
|
0
|
$
|
0
|
—
|
—
|
$
|
0
|
$
|
161,000
|
||||||||||||
|
|
|
|
|
|
|
|||||||||||||||||||||||
|
Barry
Kostiner,
|
2007
|
$
|
30,000
|
$
|
10,000
|
$
|
0
|
$
|
0
|
—
|
—
|
$
|
0
|
$
|
40,000
|
|||||||||||||
|
Chief
Executive Officer
|
2006
|
$
|
0
|
$
|
0
|
$
|
0
|
$
|
0
|
—
|
—
|
$
|
0
|
$
|
0
|
|||||||||||||
|
and
Secretary (3)
|
|
|
|
|
|
|
|
|
|
|||||||||||||||||||
| (1) |
From
January 1, 2006 until the completion of the TEC acquisition on
October 26, 2007, Mr. Culp received compensation from TEC as an
officer of TEC.
|
| (2) |
Of
this total, $136,036 was earned prior to the completion of the TEC
acquisition and $41,664 was earned after
completion.
|
| (3) |
Mr.
Kostiner did not receive any compensation from Platinum until the
completion of the TEC acquisition on October 26,
2007.
|
Equity
Awards
No
options, restricted stock or other awards under our 2006 Long Term Incentive
Plan or otherwise had been made or committed to be made by the Company as of
the
end of the last completed fiscal year.
Pension
Benefits
No
pension benefits have been awarded or provided by us as of the date of this
prospectus.
Non-Qualified
Deferred Compensation
We
do not
have any deferred compensation plans as of the date of this prospectus.
Employment,
Severance and Change of Control Arrangements
Pursuant
to the TEC acquisition agreement, we have agreed to enter into an employment
agreement with Mr. Culp providing for Mr. Culp to serve as Chairman of Platinum
for an initial term of not less than two years. In addition, under the terms
of
the acquisition agreement, we will enter into an employment agreement with
Michael G. Cunningham, current employee of New TEC, providing for a term of
at
least two years and otherwise consistent with the written offers of employment
accepted by such individuals.
In
connection with our acquisition of Maverick on April 29, 2008, we entered into
an employment agreement with Mr. Robert Kovar. The employment agreement provides
that we employ Mr. Kovar as Chief Operating Officer of Platinum and as President
of Maverick, our wholly owned subsidiary, for an initial five year period with
a
base salary at an annual rate of $200,000 and stock options pursuant to our
2006
Long Term Incentive Plan to purchase 250,000 shares of Company common stock
over
that 5 year period. Mr. Kovar received an initial grant of stock options to
purchase 50,000 shares of common stock of Platinum in the form of non-qualified
stock options. On each of the four succeeding anniversaries of the effective
date of the employment agreement, Mr. Kovar will receive an additional 50,000
non-qualified stock options pursuant to the 2006 Long Term Incentive Plan.
All
of such stock options: (i) shall entitle Mr. Kovar to purchase shares of
Platinum common stock at an exercise price equal to the fair market value (as
defined in the 2006 Long Term Incentive Plan) per share of Platinum’s common
stock on the date of grant; and (ii) shall vest with respect to 10,000 of the
shares on each anniversary of the grant until all shares represented by the
stock options are granted. The exercise price for the initial grant on April
29,
2008 was $5.15, the closing price on the date of such grant. Upon a change
in
control of Platinum, the employment agreement provides that all options granted
to Mr. Kovar will immediately vest.
Pursuant
to Mr. Kovar’s employment agreement, if Mr. Kovar’s employment is terminated by
us without cause or Mr. Kovar terminates his employment for good reason, he
will
receive an 18 month severance package and his cash flow note will become
immediately due and payable. If, however, Mr. Kovar’s employment is terminated
by us for cause or Mr. Kovar terminates his employment without good reason,
he
will receive no severance package and his cash flow note will be cancelled.
Mr.
Kovar has also agreed that during the term of his employment with us and for
an
18 month period thereafter, he will not compete with us nor solicit our
employees. If Mr. Kovar breaches any of these obligations, he would forfeit
his
right to any severance payments and benefits to which he otherwise would be
entitled.
On
August
11, 2008, we entered into an employment agreement with Lisa Meier pursuant
to
which Ms. Meier was appointed as our Chief Financial Officer and Treasurer.
Ms.
Meier’s employment agreement provides for an initial term of a five year period.
Pursuant to the terms of her employment agreement, Ms. Meier will be paid
a
$250,000 base annual salary, increasing by 5% annually. Ms. Meier will be
eligible for an annual bonus as determined by the Board or a compensation
committee of the Board which, in the event the Company has positive cash
flow,
will be at least $50,000. In addition, Ms. Meier will be eligible for a
performance bonus based on certain predetermined budgeted goals. The target
bonus for this purpose will be 50% of base salary.
Ms.
Meier
was granted 50,000 incentive stock options to purchase shares of our common
stock with an exercise price equal to the closing price on August 11, 2008,
the
date of grant, and will be granted an additional 50,000 stock options each
year
thereafter during the term of her employment. All options will be issued
pursuant to the Platinum Energy Resources, Inc. 2006 Long Term Incentive
Plan
and will be subject to a four year vesting schedule, with one-quarter of
such
options vesting on each anniversary of the date of grant, beginning August
11,
2009. Upon a change in control of the Company, all options granted to Ms.
Meier
will immediately vest.
Pursuant
to Ms. Meier’s employment agreement, if Ms. Meier’s employment is terminated by
the Company without cause or Ms. Meier terminates her employment for good
reason, she will receive an 18 month severance package. If, however, Ms. Meier’s
employment is terminated by the Company for cause or Ms. Meier terminates her
employment without good reason, she will receive no severance package.
Ms.
Meier
has also agreed that during the term of her employment with the Company and
for
an 18 month period thereafter, she will not compete with the Company nor solicit
any of our employees. If Ms. Meier breaches any of these obligations, she would
forfeit her right to any severance payments and benefits to which she otherwise
would be entitled.
Platinum
Services and Infrastructure (“PSI”) is a proposed new business that Ms.
Meier will help develop in the oilfield services industry. Pursuant to her
employment agreement, Ms. Meier will also be appointed President of PSI. PSI’s
business plan is to develop products, services and solutions to optimize
customer performance in a safe and environmentally sound manner. PSI hopes
to
launch this new business through a series of strategic acquisitions.
PSI expects to support the exploration and production initiatives of the
Company and provide diversified revenue and cash flow potential to balance
the
Company's overall growth.
PSI
has
entered into a Restricted Stock Agreement with Ms Meier pursuant to which Ms.
Meier will be issued 50 restricted shares of PSI’s common stock,
representing 5% of the outstanding shares of PSI common stock. Under the
agreement, the shares will be subject to a vesting schedule, with
one-quarter of such shares to be vested immediately and one-quarter on
each anniversary thereafter until all of the shares are
vested. All shares will be released from restriction upon
a sale of the PSI business.
Long-Term
Incentive Compensation Plan
Background
Platinum’s
2006 Long-Term Incentive Plan has been approved by our board of directors and
our stockholders at the special meeting of stockholders held on October 26,
2007, in connection with the consummation of the TEC acquisition.
The
purposes of our Plan are to create incentives designed to motivate our employees
to significantly contribute toward our growth and profitability, to provide
our
executives, directors and other employees, and persons who, by their position,
ability and diligence, are able to make important contributions to our growth
and profitability, with an incentive to assist us in achieving our long-term
corporate objectives, to attract and retain executives and other employees
of
outstanding competence, and to provide such persons with an opportunity to
acquire an equity interest in us.
We
may
grant incentive and non-qualified stock options, stock appreciation rights,
performance units, restricted stock awards and performance bonuses, or
collectively, awards, to our officers and key employees, and those of our
subsidiaries. In addition, the Plan authorizes the grant of non-qualified
stock
options and restricted stock awards to our directors and to any independent
contractors and consultants who by their position, ability and diligence
are
able to make important contributions to our future growth and profitability.
Generally, all classes of our employees are eligible to participate in our
Plan.
As of the date of this prospectus, we have granted 110,000 options to our
employees and directors, consisting of 50,000 stock options to Mr. Robert
Kovar,
50,000 stock options to Ms. Lisa Meier, and 5,000 stock options to each of
our newly appointed directors, Bernard Lang and Norman
Rosenberg.
The
following is a summary of the material provisions of our Plan and is
qualified in its entirety by reference to the complete text of our Plan,
a copy
of which is filed as Exhibit 10.5 to our Current Report on Form 8-K filed
November 1, 2007. We cannot determine the benefits to be received by our
directors or officers under the Plan, or the benefits that would have been
received by our directors and officers in 2006 had the Plan been in effect
in
2006.
Stock
Subject to the 2006 Plan
We
have
reserved a maximum of 4 million shares of our authorized common stock for
issuance upon the exercise of awards to be granted pursuant to our Plan. Each
share issued under an option or under a restricted stock award will be counted
against this limit. Shares to be delivered at the time a stock option is
exercised or at the time a restricted stock award is made may be available
from
authorized but unissued shares or from stock previously issued but which we
have
reacquired and hold in our treasury.
In
the
event of any change in our outstanding common stock by reason of any
reorganization, recapitalization, stock split, stock dividend, combination
of
shares, asset acquisition, consolidation, issuance of rights or other similar
transactions, the number of shares of our common stock which may be issued
upon
exercise of outstanding options, and the exercise price of options previously
granted under our Plan, will be proportionally adjusted to prevent any
enlargement or dilution of the rights of holders of previously granted options
as may be appropriate to reflect any such transaction or event.
Administration
Our
board
will establish a compensation committee that, among other duties, will
administer the Plan. The compensation committee will be composed of at least
three members of the board, a majority of whom will be “non-employee directors”
within the meaning of Rule 16b-3(b)(3) of the Securities Exchange Act of 1934,
as amended. Members of our compensation committee will serve at the pleasure
of
our board. In connection with the administration of our Plan, the compensation
committee, with respect to awards to be made to any person who is not one of
our
directors, will:
| · |
Determine
which employees and other persons will be granted awards under our
Plan;
|
| · |
grant
the awards to those selected to
participate;
|
| · |
Determine
the exercise price for options; and
|
| · |
prescribe
any limitations, restrictions and conditions upon any
awards.
|
With
respect to stock options or restricted stock awards to be made to any of our
directors, the compensation committee will make recommendations to our board
of
directors as to:
| · |
which
of such persons should be granted stock options, restricted stock
awards,
performance units or stock appreciation
rights;
|
| · |
the
terms of proposed grants of awards to those selected by our board
of
directors to participate;
|
| · |
the
exercise price for options; and
|
| · |
any
limitations, restrictions and conditions upon any
awards.
|
Any
grant
of awards to any of directors under our Plan must be approved by our board
of
directors.
In
addition, the compensation committee will:
| · |
interpret
our Plan; and
|
| · |
make
all other determinations and take all other action that may be necessary
or advisable to implement and administer our
Plan.
|
Types
of Awards
Our
Plan
permits the compensation committee to grant the following types of
awards.
Stock
Options.
Stock
options are contractual rights entitling an optionee who has been granted a
stock option to purchase a stated number of shares of our common stock at an
exercise price per share determined at the date of the grant. Options are
evidenced by stock option agreements with the respective optionees. The exercise
price for each stock option granted under our Plan will be determined by our
board of directors or a committee of the board at the time of the grant, but
will not be less than fair market value on the date of the grant. Our board
of
directors or a committee of the board will also determine the duration of each
option; however, no option may be exercisable more than ten years after the
date
the option is granted. Within the foregoing limitations, the board of directors
or committee of the board may, in its discretion, impose limitations on exercise
of all or some options granted under our Plan, such as specifying minimum
periods of time after grant during which options may not be exercised. Options
granted under our Plan will vest at rates specified in the option agreement
at
the time of grant; however, all options granted under our Plan will vest upon
the occurrence of a change of control, as defined in the Plan. Our Plan also
contains provisions for our board of directors or a committee of the board
to
provide in the participants’ option award agreements for accelerating the right
of an individual employee to exercise his or her stock option or restricted
stock award in the event of retirement or other termination of employment.
No
cash consideration is payable to us in exchange for the grant of
options.
Our
Plan
provides that the stock options may either be Incentive Stock Options within
the
meaning of Section 422 of the Internal Revenue Code of 1986, as amended, or
Non-Qualified Options, which are stock options other than Incentive Stock
Options within the meaning of Sections 422 of the Code. Incentive Stock Options
may be granted only to our employees or employees of our subsidiaries, and
must
be granted at a per share option price not less than the fair market value
of
our common stock on the date the Incentive Stock Option is granted. In the
case
of an Incentive Stock Option granted to a stockholder who owns shares of our
outstanding stock of all classes representing more that 10% of the total
combined voting power of all of our outstanding stock of all classes entitled
to
vote in the election of directors, the per share option price must be not less
than 110% of the fair market value of one share of our common stock on the
date
the Incentive Stock Option is granted and the term of such option may not exceed
five years. As required by the Code, the aggregate fair market value, determined
at the time an Incentive Stock Option is granted, of our common stock with
respect to which Incentive Stock Options may be exercised by an optionee for
the
first time during any calendar year under all of our incentive stock option
plans may not exceed $100,000.
The
exercise price for Non-Qualified Options may not be less than the fair market
value of our common stock on the date the Non-Qualified Option is granted.
Non-Qualified Options are not subject to any of the restrictions described
above
with respect to Incentive Stock Options. The exercise price of stock options
may
be paid in cash, in whole shares of our common stock, in a combination of cash
and our common stock, or in such other form of consideration as our board of
directors or the committee of the board may determine, equal in value to the
exercise price. However, only shares of our common stock which the option holder
has held for at least six months on the date of the exercise may be surrendered
in payment of the exercise price for the options. The maximum number of shares
subject to stock options that may be awarded in any fiscal year to any employee
may not exceed 100,000 and the number of shares subject to stock options that
may be awarded in any fiscal year to any director may not exceed 10,000. In
no
event may a stock option be exercised after the expiration of its stated
term.
Stock
Appreciation Rights.
A stock
appreciation right permits the grantee to receive an amount (in cash, common
stock, or a combination thereof) equal to the number of stock appreciation
rights exercised by the grantee multiplied by the excess of the fair market
value of our common stock on the exercise date over the stock appreciation
rights’ exercise price. Stock appreciation rights may or may not be granted in
connection with the grant of an option. The exercise price of stock appreciation
rights granted under the Plan will be determined by the board of directors
or a
committee of the board; provided, however, that such exercise price cannot
be
less than the fair market value of a share of common stock on a date the stock
appreciation right is granted (subject to adjustments). A stock appreciation
right may be exercised in whole or in such installments and at such times as
determined by the board of directors or a committee of the
board.
Restricted
Stock.
Restricted shares of our common stock may be granted under our Plan subject
to
such terms and conditions, including forfeiture and vesting provisions, and
restrictions against sale, transfer or other disposition as the boa rd of
directors or a committee of the board may determine to be appropriate at the
time of making the award. In addition, the board of directors or a committee
of
the board may direct that share certificates representing restricted stock
be
inscribed with a legend as to the restrictions on sale, transfer or other
disposition, and may direct that the certificates, along with a stock power
signed in blank by the grantee, be delivered to and held by us until such
restrictions lapse. The board of directors or a committee of the board, in
its
discretion, may provide in the award agreement for a modification or
acceleration of shares of restricted stock in the event of permanent disability,
retirement or other termination of employment or business relationship with
the
grantee. The maximum number of restricted shares that may be awarded under
the
Plan to any employee may not exceed 100,000 shares and the number of restricted
shares that may be awarded in any fiscal year to any director may not exceed
10,000 shares.
Performance
Units.
The
Plan permits grants of performance units, which are rights to receive cash
payments equal to the difference (if any) between the fair market value of
our
common stock on the date of grant and its fair market value on the date of
exercise of the award, except to the extent otherwise provided by the board
of
directors or a committee of the board or required by law. Such awards are
subject to the fulfillment of conditions that may be established by the board
of
directors or a committee of the board including, without limitation, the
achievement of performance targets based upon the factors described above
relating to restricted stock awards.
Performance
Bonus.
The
Plan permits grants of performance bonuses, which may be paid in cash, common
stock or combination thereof as determined by the board of directors or a
committee of the board. The maximum value of performance bonus awards granted
under the Plan shall be established by the compensation committee at the time
of
the grant. An employee’s receipt of such amount will be contingent upon
achievement of performance targets during the performance period established
by
the compensation committee. The performance targets will be determined by the
board of directors or a committee of the board based upon the factors described
above relating to restricted stock awards. Following the end of the performance
period, the board of directors or a committee of the board will determine the
achievement of the performance targets for such performance period. Payment
may
be made within 60 days of such determination. Any payment made in shares of
common stock will be based upon the fair market value of the common stock on
the
payment date. The maximum amount of any performance bonus payable to a
participant in any calendar year is $500,000.
Transferability
With
the
exception of Non-Qualified Stock Options, awards are not transferable other
than
by will or by the laws of descent and distribution. Non-Qualified Stock Options
are transferable on a limited basis. Restricted stock awards are not
transferable during the restriction period.
Change
of Control Event
The
Plan
provides for the acceleration of any unvested portion of any outstanding awards
under the Plan upon a change of control event.
Termination
of Employment/Relationship
Awards
granted under our Plan that have not vested will generally terminate immediately
upon the grantee’s termination of employment or business relationship with us or
any of our subsidiaries for any reason other than retirement with our consent,
disability or death. The board of directors or a committee of the board may
determine at the time of the grant that an award agreement should contain
provisions permitting the grantee to exercise the stock options for any stated
period after such termination, or for any period the board of directors or
a
committee of the board determines to be advisable after the grantee’s employment
or business relationship with us terminates by reason of retirement, disability,
death or termination without cause. Incentive Stock Options will, however,
terminate no more than three months after termination of the optionee’s
employment, twelve months after termination of the optionee’s employment due to
disability and three years after termination of the optionee’s employment due to
death. The board of directors or a committee of the board may permit a deceased
optionee’s stock options to be exercised by the optionee’s executor or heirs
during a period acceptable to the board of directors or a committee of the
board
following the date of the optionee’s death but such exercise must occur prior to
the expiration date of the stock option.
Dilution;
Substitution
As
described above, our Plan will provide protection against substantial dilution
or enlargement of the rights granted to holders of awards in the event of stock
splits, recapitalizations, asset acquisitions, consolidations, reorganizations
or similar transactions. New award rights may, but need not, be substituted
for
the awards granted under our Plan, or our obligations with respect to awards
outstanding under our Plan may, but need not, be assumed by another corporation
in connection with any asset acquisition, consolidation, acquisition,
separation, reorganization, sale or distribution of assets, liquidation or
like
occurrence in which we are involved. In the event that our Plan is assumed,
the
stock issuable with respect to awards previously granted under our Plan shall
thereafter include the stock of the corporation granting such new option rights
or assuming our obligations under the Plan.
Amendment
of the Plan
Our
board
may amend our Plan at any time. However, without stockholder approval, our
Plan
may not be amended in a manner that would:
| · |
increase
the number of shares that may be issued under our
Plan;
|
| · |
Materially
modify the requirements for eligibility for participation in our
Plan;
|
| · |
Materially
increase the benefits to participants provided by our Plan;
or
|
| · |
otherwise
disqualify our Plan for coverage under Rule 16b-3 promulgated under
the
Securities Exchange Act of 1934, as
amended.
|
Awards
previously granted under our Plan may not be impaired or affected by any
amendment of our Plan, without the consent of the affected
grantees.
Accounting
Treatment
Under
generally accepted accounting principles with respect to the financial
accounting treatment of stock options used to compensate employees, upon the
grant of stock options under our Plan, the fair value of the options will be
measured on the date of grant and this amount will be recognized as a
compensation expense ratably over the vesting period. Stock appreciation rights
granted under the Plan must be settled in common stock. Therefore, stock
appreciation rights granted under the Plan will receive the same accounting
treatment as options. The cash we receive upon the exercise of stock options
will be reflected as an increase in our capital. No additional compensation
expense will be recognized at the time stock options are exercised, although
the
issuance of shares of common stock upon exercise may reduce basic earnings
per
share, as more shares of our common stock would then be
outstanding.
When
we
make a grant of restricted stock, the fair value of the restricted stock award
at the date of grant will be determined and this amount will be recognized
over
the vesting period of the award. The fair value of a restricted stock award
is
equal to the fair market value of our common stock on the date of
grant.
Due
to
consideration of the accounting treatment of stock options and restricted stock
awards by various regulatory bodies, it is possible that the present accounting
treatment may change.
Tax
Treatment
The
following is a brief description of the federal income tax consequences, under
existing law, with respect to awards that may be granted under our
Plan.
Incentive
Stock Options.
An
optionee will not realize any taxable income upon the grant or the exercise
of
an Incentive Stock Option. However, the amount by which the fair market value
of
the shares covered by the Incentive Stock Option (on the date of exercise)
exceeds the option price paid will be an item of tax preference to which the
alternative minimum tax may apply, depending on each optionee’s individual
circumstances. If the optionee does not dispose of the shares of our common
stock acquired by exercising an Incentive Stock Option within two years from
the
date of the grant of the Incentive Stock Option or within one year after the
shares are transferred to the optionee, when the optionee later sells or
otherwise disposes of the stock, any amount realized by the optionee in excess
of the option price will be taxed as a long-term capital gain and any loss
will
be recognized as a long-term capital loss. We generally will not be entitled
to
an income tax deduction with respect to the grant or exercise of an Incentive
Stock Option.
If
any
shares of our common stock acquired upon exercise of an Incentive Stock Option
are resold or disposed of before the expiration of the prescribed holding
periods, the optionee would realize ordinary income, instead of capital gain.
The amount of the ordinary income realized would be equal to the lesser of
(i)
the excess of the fair market value of the stock on the exercise date over
the
option price; or (ii) in the case of a taxable sale or exchange, the amount
of
the gain realized. Any additional gain would be either long-term or short-term
capital gain, depending on whether the applicable capital gain holding period
has been satisfied. In the event of a premature disposition of shares of stock
acquired by exercising an Incentive Stock Option, we would be entitled to a
deduction equal to the amount of ordinary income realized by the
optionee.
Non-Qualified
Options.
An
optionee will not realize any taxable income upon the grant of a Non-Qualified
Option. At the time the optionee exercises the Non-Qualified Option, the amount
by which the fair market value at the time of exercise of the shares covered
by
the Non-Qualified Option exceeds the option price paid upon exercise will
constitute ordinary income to the optionee in the year of such exercise. We will
be entitled to a corresponding income tax deduction in the year of exercise
equal to the ordinary income recognized by the optionee. If the optionee
thereafter sells such shares, the difference between any amount realized on
the
sale and the fair market value of the shares at the time of exercise will be
taxed to the optionee as capital gain or loss, short- or long-term depending
on
the length of time the stock was held by the optionee before
sale.
Stock
Appreciation Rights.
A
participant realizes no taxable income and we are not entitled to a deduction
when a stock appreciation right is granted. Upon exercising a stock appreciation
right, a participant will realize ordinary income in an amount equal to the
fair
market value of the shares received minus any amount paid for the shares, and
we
will be entitled to a corresponding deduction. A participant’s tax basis in the
shares of common stock received upon exercise of a stock appreciation right
will
be equal to the fair market value of such shares on the exercise date, and
the
participant’s holding period for such shares will begin at that time. Upon sale
of the shares of common stock received upon exercise of a stock appreciation
right, the participant will realize short-term or long-term capital gain or
loss, depending upon whether the shares have been held for more than one year.
The amount of such gain or loss will be equal to the difference between the
amount realized in connection with the sale of the shares, and the participant’s
tax basis in such shares.
Restricted
Stock Award.
A
recipient of restricted stock generally will not recognize any taxable income
until the shares of restricted stock become freely transferable or are no longer
subject to a substantial risk of forfeiture. At that time, the excess of the
fair market value of the restricted stock over the amount, if any, paid for
the
restricted stock is taxable to the recipient as ordinary income. If a recipient
of restricted stock subsequently sells the shares, he or she generally will
realize capital gain or loss in the year of such sale in an amount equal to
the
difference between the net proceeds from the sale and the price paid for the
stock, if any, plus the amount previously included in income as ordinary income
with respect to such restricted shares.
A
recipient has the opportunity, within certain limits, to fix the amount and
timing of the taxable income attributable to a grant of restricted stock.
Section 83(b) of the Code permits a recipient of restricted stock, which is
not
yet required to be included in taxable income, to elect, within 30 days of
the
award of restricted stock, to include in income immediately the difference
between the fair market value of the shares of restricted stock at the date
of
the award and the amount paid for the restricted stock, if any. The election
permits the recipient of restricted stock to fix the amount of income that
must
be recognized by virtue of the restricted stock grant. We will be entitled
to a
deduction in the year the recipient is required (or elects) to recognize income
by virtue of receipt of restricted stock, equal to the amount of taxable income
recognized by the recipient.
Performance
Units and Performance Bonuses.
A
participant realizes no taxable income and we are not entitled to a deduction
when performance units or performance bonuses are awarded. When the performance
units or performance bonuses vest and become payable upon the achievement of
the
performance objectives, the participant will realize ordinary income equal
to
the amount of cash received or the fair market value of the shares received
minus any amount paid for the shares, and we will be entitled to a corresponding
deduction. A participant’s tax basis in shares of common stock received upon
payment will be equal to the fair market value of such shares when the
participant receives them. Upon sale of the shares, the participant will realize
short-term or long-term capital gain or loss, depending upon whether the shares
have been held for more than one year at the time of sale. Such gain or loss
will be equal to the difference between the amount realized upon the sale of
the
shares and the tax basis of the shares in the participant’s hands.
Section
162(m) of the Code.
Section
162(m) of the Code precludes a public corporation from taking a deduction for
annual compensation in excess of $1.0 million paid to its chief executive
officer or any of its four other highest-paid officers. However, compensation
that qualifies under Section 162(m) of the Code as “performance-based” is
specifically exempt from the deduction limit. Based on Section 162(m) of the
Code and the regulations thereunder, our ability to deduct compensation income
generated in connection with the exercise of stock options or stock appreciation
rights granted under the Plan should not be limited by Section 162(m) of the
Code. Further, we believe that compensation income generated in connection
with
performance awards granted under the Plan should not be limited by Section
162(m) of the Code. The Plan has been designed to provide flexibility with
respect to whether restricted stock awards or performance bonuses will qualify
as performance-based compensation under Section 162(m) of the Code and,
therefore, be exempt from the deduction limit. If the vesting restrictions
relating to any such award are based solely upon the satisfaction of one of
the
performance goals set forth in the Plan, then we believe that the compensation
expense relating to such an award will be deductible by us if the awards become
vested. However, compensation expense deductions relating to such awards will
be
subject to the Section 162(m) deduction limitation if such awards become vested
based upon any other criteria set forth in such award (such as the occurrence
of
a change in control or vesting based upon continued employment with
us).
Certain
Awards Deferring or Accelerating the Receipt of Compensation.
Section
409A of the Internal Revenue Code, enacted as part of the American Jobs Creation
Act of 2004, imposes certain new requirements applicable to “nonqualified
deferred compensation plans.” If a nonqualified deferred compensation plan
subject to Section 409A fails to meet, or is not operated in accordance with,
these new requirements, then all compensation deferred under the plan may become
immediately taxable. Stock appreciation rights and deferred stock awards which
may be granted under the plan may constitute deferred compensation subject
to
the Section 409A requirements. It is our intention that any award agreement
governing awards subject to Section 409A will comply with these new
rules.
Limitations
on Liability and Indemnification Matters
We
have
adopted provisions in our certificate of incorporation that will limit the
liability of our directors and executive officers for monetary damages for
breach of their fiduciary duties to the maximum extent permitted by Delaware
law. Under Delaware laws a certificate of incorporation may provide that
directors of a corporation will not be personally liable for monetary damages
for breach of their fiduciary duties as directors, except liability
for:
| · |
any
breach of their duty of loyalty to our company or our
stockholders;
|
| · |
acts
or omissions not in good faith or which involve intentional misconduct
or
a knowing violation of law;
|
| · |
unlawful
payments of dividends or unlawful stock repurchases or redemptions
as
provided in Section 174 of the Delaware General Corporation Law;
or
|
| · |
any
transaction from which the director derived an improper personal
benefit.
|
The
limits on a director’s or officer’s liability in our certificate of
incorporation will not apply to liabilities arising under the federal securities
laws and will not affect the availability of equitable remedies such as
injunctive relief or rescission.
Our
certificate of incorporation together with our bylaws provide that we must
indemnify our directors and executive officers and may indemnify our other
officers and employees and other agents to the fullest extent permitted by
law.
We believe that indemnification under our bylaws covers at least negligence
and
gross negligence on the part of indemnified parties. Our bylaws also permit
us
to secure insurance on behalf of any officer, director, employee or other agent
for any liability arising out of his or her actions in that capacity, regardless
of whether our bylaws would otherwise permit indemnification. We believe that
the indemnification provisions of our certificate of incorporation and bylaws
are necessary to attract and retain qualified persons as directors and officers.
We also maintain directors’ and officers’ liability insurance.
We
have
entered and expect to continue to enter into agreements to indemnify our
directors, executive officers and other employees as determined by the board
of
directors. These agreements provide for indemnification for related expenses
including attorneys’ fees, judgments, fines and settlement amounts incurred by
any of these individuals in any action or proceeding. We believe that these
provisions and agreements are necessary to attract and retain qualified persons
as our directors and executive officers.
At
present we are not aware of any pending litigation or proceeding involving
any
director, officer, employee or agent of our company in such person’s capacity
with our company where indemnification will be required or permitted. We are
also not aware of any threatened litigation or proceedings that might result
in
a claim for indemnification.
Director
Compensation
Our
current directors except for our newly appointed directors all serve as officers
or employees and did not receive additional compensation for their board service
in 2007. Our newly appointed independent directors, Bernard Lang and Norman
Rosenberg each receive cash compensation of $25,000 per year for their services
and annual grants of stock options to purchase up to 5,000 shares of our common
stock.
54
SECURITY
OWNERSHIP OF CERTAIN
BENEFICIAL
OWNERS AND MANAGEMENT
The
following table sets forth information regarding the beneficial ownership
of our
common stock as of August 7, 2008:
| · |
each
person known by us to be the beneficial owner of more than 5% of
our
outstanding shares of common stock;
|
| · |
each
of our officers and directors; and
|
| · |
all
our officers and directors as a group.
|
|
Name and Address of Beneficial Owner(1)
|
Amount and
Nature of
Beneficial
Ownership
|
Approximate
Percentage of
Outstanding
Common Stock
|
|||||
|
Azimuth
Opportunity, Ltd. (2)
|
1,542,000
|
7.0
|
%
|
||||
|
J.D.
Capital Management LLC (3)
J.
David Rogers
|
5,611,600
|
25.4
|
%
|
||||
|
Millennium
Management LLC (4)
|
1,209,800
|
5.5
|
%
|
||||
|
D.B.
Zwirn Special Opportunities Fund, L.P. (5)
D.B.
Zwirn Special Opportunities Fund, Ltd.
HCM/2
Special Opportunities LLC
|
1,625,000
|
7.4
|
%
|
||||
|
QVT
Financial LP (6)
|
1,574,483
|
6.9
|
%
|
||||
|
Braesridge
Energy LLC (7)
|
8,776,600
|
32.0
|
%
|
||||
|
Jackie
Chambers (8)
|
1,410,650
|
6.4
|
%
|
||||
|
Mark
Nordlicht (9)
|
2,151,000
|
9.7
|
%
|
||||
|
Barry
Kostiner (10)
|
968,130
|
4.0
|
%
|
||||
|
William
C. Glass (11)
|
270,000
|
1.2
|
%
|
||||
|
Richard
Geyser (12)
|
90,000
|
*
|
%
|
||||
|
James
H. Dorman (13)
|
60,000
|
*
|
%
|
||||
|
Jim
L. Troxel (14)
|
60,000
|
*
|
%
|
||||
|
Tim
G. Culp (8)
|
2,115,976
|
9.6
|
%
|
||||
|
Robert
Kovar (15)
|
—
|
—
|
%
|
||||
|
Lisa
Meier (16)
|
— |
—
|
%
|
||||
|
Bernard
Lang (17)
|
—
|
—
|
%
|
||||
|
Norman
Rosenberg (18)
|
—
|
—
|
%
|
||||
|
All
directors and executive officers as a group (11
individuals)
|
3,564,106
|
16.1
|
%
|
||||
*
Denotes
percentages of less than 1%.
55
|
|
(1)
|
Unless
otherwise indicated, the business address of each of the individuals
is
11490 Westheimer Road, Suite 1000 Houston, Texas
77077.
|
|
|
(2)
|
Based
upon a Statement on Schedule 13G (Amendment No. 1) dated December
13, 2006
filed by Azimuth Opportunity, Ltd. The address of Azimuth Opportunity,
Ltd. is c/o WSmiths Finance, Nemours Chambers, P.O. Box 3170, Road
Town,
Tortola, British Virgin Islands.
|
|
|
(3)
|
Based
upon a Statement on Schedule 13D/A dated July 22, 2008 filed by J.D.
Capital Management LLC (“JD Capital”) and J. David Rogers, we understand
that JD Capital is the investment manager of Tempo Master Fund LP
and
Tempo Fund LLC and, by virtue of such status, may be deemed to be the
beneficial owner of the shares of common stock beneficially
owned by Tempo. Mr. Rogers is the managing member of J.D. Capital
and has
voting and investment power with respect to the shares. The address
of
J.D. Capital and Mr. Rogers is Two Greenwich Plaza, Greenwich, Connecticut
06830.
|
|
|
(4)
|
Based
upon a Statement on Schedule 13D dated December 26, 2007 filed by
Millenco
LLC, Millennium Partners, L.P., Millennium Management LLC and Israel
A.
Englander. Millenco LLC is the beneficial owner of 1,101,400 shares
of
common stock and presently exercisable warrants to purchase 8,400
shares
at an exercise price of $6.00 per share. Millennium Partners, L.P.
is the
beneficial owner of 100,000 shares of common stock. Millennium Management
LLC is the manager of Millenco LLC and the managing partner of Millennium
Partners, L.P. Mr. Englander is the managing member of Millennium
Management LLC. Therefore, both Millennium Management LLC and Mr.
Englander may be deemed to beneficially own an aggregate of 1,209,800
shares. The address of each of the parties is c/o Millennium Management
LLC, 666 Fifth Avenue, New York, New York
10103.
|
|
|
(5)
|
Based
upon a Statement on Schedule 13G dated September 5, 2006 filed by
D.B.
Zwirn & Co., L.P., DBZ GP, LLC, Zwirn Holdings, LLC, Daniel B. Zwirn,
D.B. Zwirn Special Opportunities Fund, L.P. (“Fund L.P.”), D.B. Zwirn
Special Opportunities Fund, Ltd. (“Fund Ltd.”) and HCM/Z Special
Opportunities LLC (“Opportunities LLC”), D.B. Zwirn & Co., L.P., DBZ
GP, LLC, Zwirn Holdings, LLC, and Daniel B. Zwirn may each be deemed
the
beneficial owner of (i) 573,750 shares of common stock owned by Fund,
L.P., (ii) 932,500 shares of common stock owned by Fund, Ltd. and
(iii)
118,750 shares of common stock owned by Opportunities LLC. D.B. Zwirn
& Co., L.P. is the manager of each of Fund L.P., Fund Ltd. and
Opportunities LLC, and, consequently, has voting control and investment
discretion over the shares of common stock held by each of the Funds.
Furthermore, Daniel B. Zwirn is the managing member of, and thereby
controls, Zwirn Holdings, LLC, which in turn is the managing member
of
and, thereby, controls DBZ GP, LLC, which in turn is the general
partner
of and thereby controls D.B. Zwirn & Co., L.P. The address of each of
the parties is 745 Fifth Avenue, 18th Floor, New York, NY 10151,
except
for Fund Ltd. which has an address at P.O. Box 896, George Town,
Harbour
Centre, 2nd Floor, Grand Cayman, Cayman Islands, British West Indies
and
Opportunities LLC which has an address at Seven Mile Beach, Grand
Cayman,
Cayman Islands, British West
Indies.
|
56
|
|
(6)
|
Based
upon a Statement on Schedule 13G (Amendment No. 4) dated April 23,
2008
filed by QVT Financial LP, QVT Financial GP LLC, QVT Fund LP, and
QVT
Associates GP LLC. QVT Financial LP is the investment manager for
QVT Fund
LP, which beneficially owns 719,101 shares of common stock and presently
exercisable warrants to purchase 490,766 shares at an exercise price
of
$6.00 per share. QVT Financial LP is also the investment manager
for
Quintessence Fund L.P. which beneficially owns 79,785 shares of common
stock and presently exercisable warrants to purchase 55,355 shares.
QVT
Financial LP is also the investment manager for a separate discretionary
account, which holds 122,087 shares of common stock and presently
exercisable warrants to purchase 107,279 shares. QVT Financial LP
has the
power to direct the vote and disposition of the common stock held
by each
of the QVT Fund LP, Quintessence Fund L.P. and the separate discretionary
account. Accordingly, QVT Financial LP may be deemed to be the beneficial
owner of an aggregate amount of 1,574,483 shares of common stock.
QVT
Financial LP is the general partner of QVT Financial LP and QVT Associates
GP LLC is the general partner of the QVT Fund LP. The address of
each of
the parties is 1177 Avenue of the Americas, 9th Floor New York, New
York
10036, except QVT Fund LP whose address is Walkers SPV, Walkers House,
P.O. Box 908GT, Mary Street, George Town, Grand Cayman, Cayman
Islands.
|
|
|
(7)
|
Based
on a Statement on Schedule 13D (Amendment No. 11) dated June 27,
2008,
filed by Braesridge Energy LLC and Syd Ghermezian and a Form 4 filed
by
Braesridge Energy LLC and Syd Ghermezian, dated July 29, 2008,
the 8,746,600
shares listed
includes (i) 3,454,800 shares of common stock and (ii) presently
exercisable warrants to purchase 5,321,800 shares at an exercise
price of $6.00 per share. Braesridge has entered into an agreement
to
purchase 420,603 shares of Platinum common stock from two Platinum
employees, Todd M. Yocham and Tobin Scott, upon the distribution
of
Tandem’s assets pursuant to the registration statement of which this
prospectus is a part. For a description of Braesridge and activities
with
respect thereto by our Chief Executive Officer, Barry Kostiner, see
“Certain Relationships and Related Party Transactions” beginning on
page 58 of this prospectus. Braesridge and Mr. Syd Ghermezian’s
business address is 9440 West Sahara, Suite 240, Las Vegas, NV
89117.
|
|
|
(8)
|
On
June 24, 2008, Tandem dissolved under the laws of the State of Nevada.
As
part of Tandem’s dissolution, the 7,692,308 shares of Platinum’s common
stock held by Tandem as a result of its merger with TEC, its wholly-owned
subsidiary, will be distributed to its shareholders in a liquidating
distribution, which includes 2,115,976 shares of Platinum’s common stock
that will be distributed to Mr. Tim Culp and 1,410,650 shares that
will be
distributed to Mr. Jackie Chambers. On February 14, 2008, we filed
a
registration statement on Form S-1 relating to the distribution of
the
shares to the Tandem shareholders, as amended on April 18, 2008 and
on
July 18, 2008. On or about the effective date of that registration
statement, these shares will be distributed to the shareholders of
Tandem
as part of Tandem’s dissolution and distribution of its assets. Mr. Culp’s
business address is 200 N. Loraine, Suite 400, Midland, Texas 79701.
Mr.
Chamber’s address is 5713 Hillcrest Place, Midland, Texas
79707.
|
|
|
(
9)
|
Includes
21,000 shares owned directly by Mr. Nordlicht and 2,130,000 shares
held by
Platinum Management (NY) LLC, a limited liability company controlled
by
Mr. Nordlicht. The address of Mr. Nordlicht and Platinum Management
(NY)
LLC is 152 West 57th Street, New York, New York
10019.
|
|
|
(10)
|
Does
not include an aggregate of 480,000 shares of common stock he may
receive
in the event Messrs. Glass, Geyser, Dorman or Troxel’s shares do not vest
as described below in footnotes 11, 12, 13, and 14, respectively.
Prior to
the IPO, Mr. James E. Bashaw (a former director of Platinum) entered
into
a Subscription Agreement to subscribe for 45,000 shares of Platinum
common
stock. Pursuant to the Agreement, Mr. Bashaw agreed that in the event
he
ceases to remain a director of Platinum until the expiration of the
escrow
period, Mr. Kostiner would have the right to elect within 3 months
following such termination of services to purchase Mr. Bashaw’s shares at
$0.0001 per share. On August 15, 2007, Mr. Kostiner entered into
an
agreement with Mr. Bashaw pursuant to which Mr. Kostiner agreed to
purchase Mr. Bashaw’s 45,000 shares of Platinum common stock at the
expiration of the three year escrow period, conditioned upon consummation
of the asset acquisition. These shares will remain in escrow until
the
expiration of the three year escrow
period.
|
|
|
(11)
|
These
shares vest in full upon the expiration of the three-year escrow
period,
October 24, 2008, provided Mr. Glass is still affiliated with us
at such
time, or if his affiliation has been terminated without cause or
as a
result of death or disability. In the event Mr. Glass is not affiliated
with us, for reasons other than as described in the previous sentence,
at
the time of the expiration of the three-year escrow period, these
shares
revert back to Mr. Kostiner upon his election, within three months
of Mr.
Glass’ termination, to purchase the shares at $.0001 per
share.
|
|
|
(12)
|
These
shares vest in full upon the expiration of the three-year escrow
period,
October 24, 2008, provided Mr. Geyser is still affiliated with us
at such
time, or if his affiliation has been terminated without cause or
as a
result of death or disability. In the event Mr. Geyser is not affiliated
with us, for reasons other than as described in the previous sentence,
at
the time of the expiration of the three-year escrow period, these
shares
revert back to Mr. Kostiner upon his election, within three months
of Mr.
Geyser’s termination, to purchase the shares at $.0001 per
share.
|
57
|
|
(13)
|
These
shares vest in full upon the expiration of the three-year escrow
period,
October 24, 2008, provided Mr. Dorman is still affiliated with us
at such
time, or if his affiliation has been terminated without cause or
as a
result of death or disability. In the event Mr. Dorman is not affiliated
with us, for reasons other than as described in the previous sentence,
at
the time of the expiration of the three-year escrow period, these
shares
revert back to Mr. Kostiner upon his election, within three months
of Mr.
Dorman’s termination, to purchase the shares at $.0001 per
share.
|
|
|
(14)
|
These
shares vest in full upon the expiration of the three-year escrow
period,
October 24, 2008, provided Mr. Troxel is still affiliated with us
at such
time, or if his affiliation has been terminated without cause or
as a
result of death or disability. In the event Mr. Troxel is not affiliated
with us, for reasons other than as described in the previous sentence,
at
the time of the expiration of the three-year escrow period, these
shares
revert back to Mr. Kostiner upon his election, within three months
of Mr.
Troxel’s termination, to purchase the shares at $.0001 per share. Mr.
Troxel’s business address is 1001 McKinney, Suite 2200, Houston, Texas
77002.
|
|
|
(15)
|
In
connection with our acquisition of Maverick on April 29, 2008, Mr.
Kovar
received an initial grant of stock options to purchase 50,000 shares
of
common stock of Platinum in the form of non-qualified stock options.
On
each of the four succeeding anniversaries of the effective date of
the
employment agreement, Mr. Kovar will receive an additional 50,000
non-qualified stock options pursuant to the 2006 Long Term Incentive
Plan.
The stock options shall vest with respect to 10,000 of the shares
on each
anniversary of the grant.
|
|
|
(16)
|
In
connection with our appointment of Ms. Meier as our Chief Financial
Officer and Treasurer, Ms. Meier received an initial grant of
stock
options to purchase 50,000 shares of common stock of Platinum
in the form
of incentive stock options and will receive an additional
grant of 50,000 stock options each year in which Ms. Meier
continues to be employed by the Company. The stock options shall
vest with
respect to 12,500 of the shares on each anniversary of the
grant.
|
|
|
(17)
|
In
connection with our appointment of Mr. Lang to our Board of Directors,
Mr.
Lang received an initial grant of stock options to purchase 5,000
shares
of common stock of Platinum in the form of incentive stock options
and will receive an additional grant each year in which Mr. Lang
continues
to serve on our Board of Directors. The stock options shall vest
with
respect to 1,000 of the shares on each anniversary of the
grant.
|
|
|
(18)
|
In
connection with our appointment of Mr. Rosenberg to our Board of
Directors, Mr. Rosenberg received an initial grant of stock options
to
purchase 5,000 shares of common stock of Platinum in the form
of incentive stock options and will receive an additional grant each
year in which Mr. Rosenberg continues to serve on our Board of Directors.
The stock options shall vest with respect to 1,000 of the shares
on each
anniversary of the grant.
|
CERTAIN
RELATIONSHIPS
AND
RELATED
PARTY TRANSACTIONS
Review, Approval or
Ratification of Related Party Transactions
We
do not
maintain a formal written procedure for the review and approval of transactions
with related persons. It is our policy for the disinterested members of our
board to review all related party transactions on a case by case basis. To
receive approval, a related-party transaction must have a business purpose
for
Platinum and be on terms that are fair and reasonable to Platinum and as
favorable to Platinum as would be available from non-related entities in
comparable transactions.
Platinum
Related Party Transactions
Prior
to
our IPO, we issued an aggregate of 3,250,000 shares of our common stock to
the
individuals set forth below for $25,000 in cash, at an average purchase price
of
approximately $0.0077 per share as follows:
|
Name
|
|
Number
of Shares
|
|
Relationship
to Us
|
|
Platinum
Management (NY) LLC
|
|
1,922,918
|
|
Stockholder
(beneficially owned by our former Chairman, Mark
Nordlicht)
|
|
Barry
Kostiner
|
|
812,500
|
|
Chief
Executive Officer, Secretary and Director
|
|
William
C. Glass
|
|
243,750
|
|
President
and Director
|
|
Richard
Geyser
|
|
81,250
|
|
Vice
President
|
|
James
H. Dorman
|
|
54,166
|
|
Executive
Vice President
|
|
Jim
L. Troxel
|
|
54,166
|
|
Executive
Vice President
|
|
Albert
Helmig
|
|
40,625
|
|
Former
Director
|
|
James
E. Bashaw
|
|
40,625
|
|
Former
Director
|
On
September 23, 2005, our board of directors authorized a stock dividend of
.3846153 of a share of common stock for each outstanding share of common stock,
effectively lowering the purchase price to $.0056 per share. The sole purpose
of
such stock dividend authorized by the board of directors was to maintain the
existing stockholders’ collective ownership at 20% of our issued and outstanding
shares of common stock immediately after our IPO.
58
On
October 21, 2005, we effected a four-for-five reverse stock split, effectively
raising the purchase price to $0.0069 per share. The sole purpose for such
reverse stock split authorized by the board and approved by our stockholders
was
to maintain the existing stockholders’ collective ownership at 20% of our issued
and outstanding shares of common stock immediately after our IPO. Following
the
reverse stock split, there were 3,600,000 shares of common stock outstanding
as
reflected in the section entitled “Security Ownership Of Certain Beneficial
Owners And Management” beginning on page 55.
The
holders of the majority of these shares will be entitled to make up to two
demands that we register these shares pursuant to a registration rights
agreement. The holders of the majority of these shares may elect to exercise
these registration rights at any time after the date on which these shares
of
common stock are released from escrow, which, except in limited circumstances,
is not before three years from the date of the IPO. In addition, these
stockholders have certain “piggy-back” registration rights on registration
statements filed subsequent to the date on which these shares of common stock
are released from escrow. We will bear the expenses incurred in connection
with
the filing of any such registration statements.
Platinum
Partners Value Arbitrage, L.P., an affiliate of Mark Nordlicht, made available
to us certain office and secretarial services, as we required from time to
time
through the consummation of the TEC acquisition. We agreed to pay Platinum
Partners Value Arbitrage, L.P. $7,500 per month for these services. Platinum
Management NY LLC is the general partner of Platinum Partners Value Arbitrage,
L.P. and Mark Nordlicht, our former Chairman of the Board, is the managing
member and 100% owner of Platinum Management (NY) LLC. As a result, he benefited
from the transaction to the extent of his interest in Platinum Partners Value
Arbitrage, L.P. However, this arrangement was solely for our benefit and was
not
intended to provide Mr. Nordlicht compensation in lieu of a salary. We believe,
based on fees for similar services in the New York City metropolitan area,
that
the fee charged by Platinum Partners Value Arbitrage, L.P. was at least as
favorable as we could have obtained from an unaffiliated person. However, as
our
directors may not be deemed “independent,” we did not have the benefit of
disinterested directors approving this transaction.
During
2005, Mark Nordlicht, our former Chairman of the Board, advanced a total of
approximately $180,000 to us to cover expenses related to the IPO. This loan
was
repaid together with interest at a rate of 4% per annum upon consummation of
the
IPO. During 2006, Mr. Nordlicht advanced to us an aggregate of $75,000 pursuant
to two promissory notes. During 2007, Mr. Nordlicht advanced to us an aggregate
of $1,032,000 pursuant to twelve promissory notes. The notes accrued interest
at
a rate of 5% per annum and matured upon the consummation of the TEC acquisition.
We paid the amounts owing under the notes at the closing of the TEC acquisition
and the notes were cancelled.
We
have
reimbursed and will continue to reimburse our officers and directors for any
reasonable out-of-pocket business expenses incurred by them in connection with
certain activities on our behalf such as identifying and investigating possible
acquisitions. There is no limit on the amount of accountable out-of-pocket
expenses reimbursable by us, which will be reviewed only by our board or a
court
of competent jurisdiction if such reimbursement is challenged.
Pursuant
to an escrow agreement, all of the shares of our common stock outstanding prior
to our IPO were placed in escrow with American Stock Transfer & Trust
Company, as escrow agent, until the earliest of (i) October 24, 2008; (ii)
our
liquidation; or (iii) the consummation of a liquidation, merger, stock exchange
or other similar transaction which results in all of our stockholders having
the
right to exchange their shares of common stock for cash, securities or other
property subsequent to our consummating the TEC acquisition.
During
the escrow period, the holders of these shares are not able to sell or transfer
their securities except to their spouses and children or trusts established
for
their benefit, but have retained all other rights as our stockholders,
including, without limitation, the right to vote their shares of common stock
and the right to receive cash dividends, if declared. If dividends are declared
and payable in shares of common stock, such dividends will also be placed in
escrow.
Mr.
Lance
Duncan, a director and officer of Tandem for a short time from March 2005
through June 1, 2005, introduced Platinum’s management to Tandem, which resulted
in the acquisition agreement. As a consequence of his efforts in this regard,
we
paid to Mr. Duncan a finder’s fee of $3.0 million at the consummation of the TEC
acquisition for introduction of the parties. We also entered into a consulting
agreement with Mr. Duncan, the term of which commenced upon the consummation
of
the TEC acquisition, for future consulting services including investigation
and
evaluation of possible future acquisitions for us. Under the terms of the
consulting agreement, we agreed to issue to Mr. Duncan a total of 714,286 shares
of our restricted common stock, 25% to be issued upon commencement of services
and the remainder in semi-annual installments of 25% each over the eighteen
month term of the agreement. On October 26, 2007, the first installment of
178,
572 shares were issued to Mr. Duncan.
Simultaneous
with the purchase of TEC by Tandem in June 2005, TEC acquired the Shamrock
Assets, comprised largely of oil and gas properties, for $44.2 million. At
the
date of the Shamrock acquisition, TEC’s then sole stockholder, Mr. Tim Culp,
also owned or controlled two-thirds of the outstanding stock of Shamrock. The
remaining one-third of Shamrock was owned or controlled by Mr. Jack Chambers
who
received approximately $19.2 million, including cash of $2.6 million, the
issuance of a $3.0 million note payable, repayment of certain Shamrock debt
totaling $1.6 million and 4.0 million shares of Tandem common stock valued
at
$3.00 per share, or $12.0 million, for his one-third interest. The note payable
to Mr. Chambers was repaid in connection with the consummation of the TEC
acquisition on October 26, 2007.
59
In
connection with the acquisition of the two-thirds interest in Shamrock, TEC
paid
to Messrs. Tim and Dyke Culp, $25.0 million, including payment of cash totaling
$5.3 million, notes payable of $6.0 million, and the repayment of certain
Shamrock debt totaling approximately $3.2 million, and issued to Messrs. Culp
an
aggregate 3.5 million shares of Tandem common stock valued at $3.00 per share
or
$10.5 million. The notes payable to Messrs. Tim and Dyke Culp were repaid in
connection with the consummation of the TEC acquisition on October 26, 2007.
During 2007 Tim Culp received interest income from the notes, totaling
$1,179,658.
Braesridge
Energy, LLC
Our
Chief
Executive Officer, Barry Kostiner, is 28% owner of Braesridge Energy, LLC and
was the manager of Braesridge from its inception on July 19, 2007
until February 14, 2008. Braesridge is a privately owned entity formed by
Mr. Kostiner and an entity controlled by the Ghermezian family, to invest in
energy opportunities. Mr. Kostiner transferred to Braesridge his interest in
KD
Resources, LLC, an oil and gas company purchased in May 2007 by Mr. Kostiner
and
Mr. Dorman, the executive vice president of Platinum, in exchange for his
interest in Braesridge. Braesridge has entered into several plans in conformity
with Rule 10b5-1 under the Securities Exchange Act of 1934 under which
Braesridge has purchased an aggregate of 3,454,800 shares of our common stock
and 5,291,800 warrants to purchase our shares at $6.00 per share. Braesridge
has
entered into an agreement to purchase 420,603 shares of Platinum common stock
from two Platinum employees, Todd M. Yocham and Tobin Scott, upon the
distribution of Tandem’s assets pursuant to the registration statement of which
this prospectus is a part. As of the date of this prospectus, to our knowledge,
Braesridge has made no other investment and holds no other interests other
than
KD Resources and Platinum securities. Braesridge is currently the beneficial
owner of 32.0% of the shares of our company. See “Securities Ownership of
Certain Beneficial Owners and Management.” As manager of Braesridge, Mr.
Kostiner’s duties included review of, and due diligence relating to, investment
opportunities in the oil and gas industry, subject to his fiduciary and other
duties owed to Platinum as described below.
As
our
director and Chief Executive Officer, Mr. Kostiner is subject to fiduciary
duties to us, which includes, under Delaware law, the requirement to present
business opportunities to a corporation if (i) the corporation could financially
undertake the opportunity; (ii) the opportunity is within the corporation’s line
of business; and (iii) it would not be fair to the corporation and its
stockholders for the opportunity not to be brought to the attention of the
corporation. Thus, to the extent a business opportunity arises that satisfies
the above criteria, Mr. Kostiner would be required to first present the
opportunity to our board. Further, Mr. Kostiner is subject to our Code of Ethics
pursuant to which our employees, officers and directors must refrain from
engaging in any activity or having a personal interest that presents a “conflict
of interest.” To the extent any potential business opportunity could constitute
a conflict of interest transaction, Mr. Kostiner would be required to seek
a
waiver from compliance with the Code of Ethics from the disinterested directors
of our board. If our disinterested directors chose not to pursue the business
opportunity and Mr. Kostiner was granted a waiver of the Code of Ethics, then,
as disclosed under “Directors and Executive Officers of the Registrant and
Corporate Governance - Code of Ethics,” such waiver would be posted on the
Company’s web site. Mr. Kostiner was granted a waiver from the Code of Ethics in
connection with the purchase of certain oil and gas properties by KD Resources,
LLC. Under the terms of his agreement with the Ghermezian family, Mr. Kostiner
must first present any oil and gas business opportunity satisfying the criteria
referenced above to Platinum and must receive a waiver of his obligations under
our Code of Ethics before the business opportunity would be available to
Braesridge. For further discussion on conflicts of interests, see “Risk Factors
- Our officers and directors are now and may in the future become affiliated
with entities engaged in business activities similar to ours and, accordingly,
may have conflicts of interest in determining to which entity a particular
business opportunity should be presented.”
DESCRIPTION
OF CAPITAL STOCK
General
We
are
authorized to issue 75,000,000 shares of common stock, par value $.0001, and
1,000,000 shares of preferred stock, par value $.0001. As of the date of this
prospectus, 22,070,762 shares of common stock are outstanding, held by
eleven recordholders, and are traded on the OTCBB. No shares of preferred stock
are currently outstanding.
Units
Platinum
consummated its IPO on October 28, 2005. In the IPO, we sold 14,400,000 units.
Each unit consists of one share of common stock and one warrant. Each warrant
(described below) entitles the holder to purchase one share of common stock.
As
of the date of this prospectus, 908,456 Units are outstanding, held by one
recordholder, and are traded on the OTCBB.
Common
stock
Our
stockholders are entitled to one vote for each share held of record on all
matters to be voted on by stockholders.
60
Our
board
of directors is divided into three classes, each of which will generally serve
for a term of three years with only one class of directors being elected in
each
year. There is no cumulative voting with respect to the election of directors,
with the result that the holders of more than 50% of the shares voted for the
election of directors can elect all of the directors.
Our
stockholders have no conversion, preemptive or other subscription rights and
there are no sinking fund or redemption provisions applicable to the common
stock.
Preferred
stock
Our
certificate of incorporation authorizes the issuance of 1,000,000 shares of
blank check preferred stock with such designation, rights and preferences as
may
be determined from time to time by our board of directors. No shares of
preferred stock are being issued or registered in this offering. Accordingly,
our board of directors is empowered, without stockholder approval, to issue
preferred stock with dividend, liquidation, conversion, voting or other rights
which could adversely affect the voting power or other rights of the holders
of
common stock. The preferred stock could be utilized as a method of discouraging,
delaying or preventing a change in control of us. Although we do not currently
intend to issue any shares of preferred stock, we cannot assure you that we
will
not do so in the future.
Warrants
14,400,000
warrants are currently outstanding. Each warrant entitles the registered holder
to purchase one share of our common stock at a price of $6.00 per share, subject
to adjustment as discussed below, at any time.
The
warrants are held by one recordholder, and are traded on the OTCBB.
The
warrants will expire on October 23, 2009 at 5:00 p.m., New York City
time.
We
may
call the warrants for redemption:
|
|
·
|
in
whole and not in part,
|
|
|
·
|
at
a price of $.01 per warrant at any time after the warrants become
exercisable,
|
|
|
·
|
upon
not less than 30 days' prior written notice of redemption to each
warrant
holder, and
|
|
|
·
|
if,
and only if, the reported last sale price of the common stock equals
or
exceeds $11.50 per share, for any 20 trading days within a 30 trading day
period ending on the third business day prior to the notice of redemption
to warrant holders.
|
We
have
established this criteria to provide warrant holders with a significant premium
to the initial warrant exercise price as well as a sufficient degree to
liquidity to cushion the market reaction, if any, to our redemption call. If
the
foregoing conditions are satisfied and we call the warrants for redemption,
each
warrant holder shall then be entitled to exercise his or her warrant prior
to
the date scheduled for redemption, however, there can be no assurance that
the
price of the common stock will exceed the call trigger price or the warrant
exercise price after the redemption call is made.
The
exercise price and number of shares of common stock issuable on exercise of
the
warrants may be adjusted in certain circumstances including in the event of
a
stock dividend, or our recapitalization, reorganization, merger or
consolidation. However, the warrants will not be adjusted for issuances of
common stock at a price below their respective exercise prices.
61
The
warrants may be exercised upon surrender of the warrant certificate on or prior
to the expiration date at the offices of the warrant agent, with the exercise
form on the reverse side of the warrant certificate completed and executed
as
indicated, accompanied by full payment of the exercise price, by certified
check
payable to us, for the number of warrants being exercised. The warrant holders
do not have the rights or privileges of holders of common stock and any voting
rights until they exercise their warrants and receive shares of common stock.
After the issuance of shares of common stock upon exercise of the warrants,
each
holder will be entitled to one vote for each share held of record on all matters
to be voted on by stockholders.
No
warrants will be exercisable unless at the time of exercise a prospectus
relating to common stock issuable upon exercise of the warrants is current
and
the common stock has been registered or qualified or deemed to be exempt under
the securities laws of the state of residence of the holder of the warrants.
Under the terms of the warrant agreement, we have agreed to meet these
conditions and use our best efforts to maintain a current prospectus relating
to
common stock issuable upon exercise of the warrants until the expiration of
the
warrants. However, we cannot assure you that we will be able to do so. The
warrants may be deprived of any value and the market for the warrants may be
limited if the prospectus relating to the common stock issuable upon the
exercise of the warrants is not current or if the common stock is not qualified
or exempt from qualification in the jurisdictions in which the holders of the
warrants reside.
No
fractional shares will be issued upon exercise of the warrants. If, upon
exercise of the warrants, a holder would be entitled to receive a fractional
interest in a share, we will, upon exercise, round up to the nearest whole
number the number of shares of common stock to be issued to the warrant
holder.
Transfer
Agent and Registrar
Our
transfer agent, warrant agent and Registrar is American Stock Transfer &
Trust Company, 6201 15th Avenue, 2nd
Fl.,
Brooklyn, New York 11219. The telephone number is 718-921-8247.
General
There
are 22,070,762 shares of our common stock outstanding, including the shares
covered by this prospectus. Of these shares:
|
|
·
|
all
7,692,308 shares of common stock distributed in this offering will be
freely tradeable, except for an aggregate of 2,821,301 shares
distributed to Tandem shareholders who are, or may be deemed to be,
our
affiliates, the resales of which 2,821,301 shares are subject to
Rule 144, described below;
|
|
|
·
|
8,825,631 shares
are held by our affiliates, the resales of which are subject to Rule
144,
as described below (additionally, one of our affiliates, Braesridge
Energy
LLC, has entered into an agreement to purchase 420,603 shares of
Platinum
common stock from two Platinum employees, Todd M. Yocham and Tobin
Scott,
upon the distribution of Tandem’s assets pursuant to the registration
statement of which this prospectus is a
part);
|
|
|
·
|
178,572
shares are “restricted securities” held by non-affiliates and are subject
to Rule 144; and
|
|
|
·
|
6,134,952 shares
were issued in our IPO and are freely
tradeable.
|
The
restricted securities and control securities held by our affiliates described
above are eligible for sale in the public market, subject to volume limitations,
manner of sale provisions and other requirements of Rule 144, from time to
time.
Rule
144
On
November 15, 2007, the SEC adopted amendments to Rule 144. These amendments
became effective on February 15, 2008. Rule 144, as amended, is described
below.
In
general, under Rule 144, a person (or persons whose shares are aggregated)
who
is not deemed to have been an affiliate of ours at any time during the three
months preceding a sale, and who has beneficially owned restricted securities
within the meaning of Rule 144 for at least six months (including any period
of
consecutive ownership of preceding non-affiliated holders) would be entitled
to
sell those shares, subject only to the availability of current public
information about us. A non-affiliated person who has beneficially owned
restricted securities within the meaning of Rule 144 for at least one year
would
be entitled to sell those shares without regard to the availability of current
information.
62
A
person
(or persons whose shares are aggregated) who is deemed to be an affiliate of
ours and who has beneficially owned restricted securities within the meaning
of
Rule 144 for at least six months would be entitled to sell within any
three-month period a number of shares that does not exceed the greater of one
percent of the then outstanding shares of our common stock, which equals 220,708
shares, or the average weekly trading volume of our common stock during the
four
calendar weeks preceding such sale. Such sales are also subject to certain
manner of sale provisions, notice requirements and the availability of current
public information about us.
Rule
144
is not available for the resale of securities initially issued by either a
shell
company (other than a business combination related shell company) or an issuer
that has been at any time previously a shell company, unless the issuer is
a
former shell company that meets all of the following conditions of Rule
144(i):
|
|
·
|
The
issuer of the securities that was formerly a reporting or non-reporting
shell company has ceased to be a shell
company;
|
|
|
·
|
The
issuer of the securities is subject to the reporting requirements
of
Section 13 or 15(d) of the Exchange
Act;
|
|
|
·
|
The
issuer of the securities has filed all reports and material required
to be
filed under Section 13 or 15(d) of the Exchange Act, as applicable,
during
the preceding 12 months, other than Form 8-K reports;
and
|
|
|
·
|
At
least one year has elapsed from the time that the issuer filed current
Form 10 type information with the Commission reflecting its status
as an
entity that is not a shell company.
|
We
were
considered a “shell company” prior to our acquisition of the TEC assets on
October 26, 2007. Since that acquisition, we are no longer a shell company.
Additionally, we are subject to the reporting requirements of the Exchange
Act
and have filed all reports and material required to be filed during the
preceding 12 months. We filed the required Form 10 type information reflecting
our new status as an entity that is no longer a shell company in our Report
on
Form 8-K filed with the commission on November 1, 2007. Accordingly, Rule 144
will be available for resales of our securities commencing November 2,
2008.
Lock-up
Agreements and Escrow Agreement
| · |
October
24, 2008;
|
| · |
our
liquidation; or
|
| · |
the
consummation of a liquidation, merger, stock exchange or other
similar
transaction which results in all of our stockholders having the
right to
exchange their shares of common stock for cash, securities or other
property subsequent to our consummating the TEC
acquisition.
|
During
the escrow period, the holders of these shares are not permitted to sell or
transfer their securities, except under limited exceptions such as to their
spouses and children or trusts established for their benefit, but retain all
other rights as our stockholders, including, without limitation, the right
to
vote their shares of common stock and the right to receive cash dividends,
if
declared. If dividends are declared and payable in shares of common stock,
such
dividends will also be placed in escrow.
Registration
Rights
The
holders of the 3,600,000 shares of common stock issued prior to our initial
public offering are entitled to registration rights pursuant to a registration
rights agreement with us. Under this registration rights agreement, the holders
of the majority of these shares are entitled to make up to two demands that
we
register these shares. The holders of the majority of these shares can elect
to
exercise these registration rights at any time after the date on which these
shares of common stock are released from escrow. In addition, these stockholders
have certain “piggy-back” registration rights on registration statements filed
subsequent to the date on which these shares of common stock are released from
escrow. We will bear the expenses incurred in connection with the filing of
any
such registration statements.
We
sold
to the representatives of the underwriters, in connection with our initial
public offering, for $100, as additional compensation, an option to purchase
up
to a total of 720,000 units in the aggregate at a per-unit offering price of
$10.00. The units issuable upon exercise of this option are identical to those
offered by the prospectus for our initial public offering, except that the
warrants included in the option have an exercise price of $7.50. The purchase
option and its underlying securities have been registered under the registration
statement in connection with our initial public offering.
63
In
addition, the representatives’ option grants to the holders demand and “piggy
back” rights for periods of five and seven years, respectively, from the date of
the IPO prospectus, with respect to the registration under the Securities Act
of
the securities directly and indirectly issuable upon exercise of the option.
We
will bear all fees and expenses attendant to registering the securities, other
than underwriting commissions which will be paid for by the holders themselves.
The purchase option also contains a cashless exercise provision that allows
the
holder of the purchase option to receive units on a net exercise basis. The
exercise price and number of units issuable upon exercise of the option may
be
adjusted in certain circumstances including in the event of a stock dividend,
or
our recapitalization, reorganization, merger or consolidation. However, the
option will not be adjusted for issuances of common stock at a price below
its
exercise price.
THE
DISTRIBUTION
On
October 26, 2007, Platinum consummated the acquisition of substantially all
of
the assets of TEC, then a wholly-owned subsidiary of Tandem. As part of the
consideration for the assets, Platinum issued 7,692,308 shares of common stock
to TEC in a private transaction. TEC dissolved through a merger with Tandem,
effective March 11, 2008, as a result of which Tandem became the owner of
the 7,692,308 shares of Platinum common stock that TEC had received in the
asset
acquisition.
The
parties to the TEC asset acquisition had contemplated that, following the
consummation of the acquisition and the dissolution of TEC, Tandem would be
dissolved and its assets - consisting of the Platinum shares - would be
distributed to its shareholders. This prospectus relates to the distribution
by
Tandem of the 7,692,308 Platinum shares to its shareholders in connection with
its dissolution under the laws of the state of Nevada, Tandem’s state of
incorporation.
The
dissolution of Tandem and the distribution of the Platinum shares to the
shareholders of Tandem has been approved by the necessary written consent of
Tandem’s board of directors and shareholders of Tandem holding in excess of a
majority of the shares of Tandem’s common stock, as required by Nevada law.
Tandem was dissolved on June 24, 2008 and the assets of Tandem, which
consist of the 7,692,308 shares of our common stock that Tandem
received in the merger with TEC, are being distributed to Tandem’s shareholders,
along with the delivery of this prospectus, by the distribution agent, American
Stock Transfer & Trust Company. The distribution agent will mail, on or
about the date of this prospectus, certificates representing such shares to
the
Tandem stockholders who were record holders of Tandem’s common stock on the date
of Tandem’s dissolution. The Tandem stockholders will not be required to pay for
the shares of Platinum common stock received in the distribution.
In
the
distribution, except for a small group of Tandem insiders who have each agreed
to accept .2717 of a Platinum share for each share of Tandem common stock,
each
shareholder of Tandem who owns validly issued and fully paid shares of Tandem’s
common stock on the date of dissolution will receive .5769 of a Platinum share
of common stock for each share of Tandem common stock. Fractional shares of
Platinum common stock will be rounded downward to the nearest whole number
and
no certificates or scrip resenting fractional shares of our common stock will
be
distributed to Tandem’s shareholders as a result of the
distribution.
Mr.
Tim
Culp, our Chairman of the Board, is expected to receive approximately 2,115,976
of the Platinum shares in the distribution. In addition, Mr. Michael G.
Cunningham, who is an officer of our wholly-owned subsidiary, New TEC, will
receive 705,325 shares, of our common stock in the distribution. Since Mr.
Culp
is an “affiliate” of Platinum, as defined in Rule 144(a)(1) under the Securities
Act, and to the extent that Mr. Cunningham is an affiliate of the Company,
the
resales of such shares will be subject to the limitations and restrictions
of
Rule 144. The remaining 4,871,007 shares distributed to Tandem shareholders
pursuant to this prospectus will be freely tradable. See “Shares Eligible for
Future Sale.”
Other
than our affiliates, shareholders of Tandem receiving shares of our common
stock
in the distribution may sell those shares at any time. It is expected that
those
shares will be sold through the selling efforts of brokers or dealers. There
is
no agreement with any specific brokers or dealers relating to the shares, nor
has any plan of distribution or sale of the shares been developed, other than
the distribution to Tandem shareholders described in this section. Tandem may
be
deemed to be an underwriter in the distribution.
Pursuant
to the acquisition agreement that we entered into in connection with the
acquisition of the assets of TEC, we will pay the fees and expenses in
connection with this registration statement and delivery of this prospectus,
including the fees and expenses of Tandem’s counsel. We will not receive any
proceeds from the distribution to, or subsequent sale by, the shareholders
of
Tandem of our shares of common stock. The distribution by Tandem will not affect
the number of our outstanding shares of common stock or any rights of our
security holders.
LEGAL
MATTERS
The
validity of the common stock offered hereby will be passed upon for us by Sills
Cummis & Gross P.C.
64
EXPERTS
Marcum
& Kliegman LLP, an independent registered public accounting firm, has
audited our financial statements as of December 31, 2007, for the years ended
December 31, 2007 and December 31, 2006 and for the period from inception (April
25, 2005) to December 31, 2005, as set forth in their report. We have included
our financial statements in the registration statement in reliance on Marcum
& Kliegman LLP’s report, given on their authority as experts in accounting
and auditing.
Johnson,
Miller & Co. CPA’s, P.C., an independent certified public accounting firm,
has audited Tandem Energy Holdings, Inc.’s financial statements at October 26,
2007, the date of the TEC acquisition and at December 31, 2006 and 2005 and
the
related statements of operations, stockholders’ equity (deficit), and cash flows
for each of the three audited periods ended October 26, 2007. Prior to the
TEC
acquisition, Tandem Energy Holdings, Inc.’s assets consisted largely of its
investment in TEC. We have included Tandem Energy Holdings, Inc.’s financial
statements in the registration statement in reliance on Johnson, Miller &
Co. CPA’s, P.C.’s report appearing herein, given on their authority as experts
in accounting and auditing.
Melton
& Melton, LLP, an independent certified public accounting firm, has audited
Maverick Engineering, Inc.’s financial statements as of December 31, 2007 and
2006 and for the years then ended, as set forth in their report. We have
included Maverick Engineering, Inc.’s financial statements in the registration
statement in reliance on Melton & Melton, LLP’s report appearing herein,
given on their authority as experts in accounting and auditing.
Certain
estimates of oil and natural gas reserves included in this prospectus were
based
upon engineering studies prepared by Williamson Petroleum Consultants, Inc.,
independent petroleum engineers, and all such information has been so included
in reliance on the authority of such firm as experts regarding the matters
contained in their reports.
WHERE
YOU CAN FIND ADDITIONAL INFORMATION
We
have
filed with the Securities and Exchange Commission, or SEC, a registration
statement on Form S-1 under the Securities Act with respect to the common stock
offered hereby. This prospectus does not contain all of the information set
forth in the registration statement and the exhibits and schedules filed as
part
of the registration statement. For further information with respect to us and
our common stock, we refer you to the registration statement and the exhibits
and schedules filed as a part of the registration statement. Statements
contained in this prospectus concerning the contents of any contract or any
other document are not necessarily complete. If a contract or document has
been
filed as an exhibit to the registration statement, we refer you to the copy
of
the contract or document that has been filed. Each statement in this prospectus
relating to a contract or document filed as an exhibit is qualified in all
respects by the filed exhibit. The reports and other information we file with
the SEC can be found on the SEC’s website provided below, or read and copied at
the SEC’s Public Reference Room at 450 Fifth Street, N.W., Washington D.C.
20549. Copies of these materials can b e obtained at prescribed rates from
the
Public Reference Section of the SEC at the principal offices of the SEC, 450
Fifth Street, N.W., Washington D.C. 20549. You may obtain information regarding
the operation of the public reference room by calling 1(800) SEC-0330. The
SEC
also maintains a web site (http://www.sec.gov) that contains reports, proxy
and
information statements, and other information regarding issuers that file
electronically with the SEC.
We
are
subject to the information and periodic reporting requirements of the Securities
Exchange Act and, in accordance therewith, file periodic reports, proxy
statements and other information with the SEC. These periodic reports, proxy
statements and other information are available for inspection and copying at
the
SEC’s public reference rooms and the web site of the SEC referred to above. Our
Internet address is http://www.platenergy.com.
We
intend
to provide our stockholders with annual reports containing, among other
information, financial statements audited by an independent public accounting
firm and we intend to make available to our stockholders quarterly reports
containing unaudited financial data for the first three quarters of each fiscal
year. We also intend to furnish other reports as we may determine or as required
by law.
MANAGEMENT’S
ANNUAL REPORT ON INTERNAL CONTROL OVER FINANCIAL REPORTING
Our
management is responsible for establishing and maintaining adequate internal
control over financial reporting. As defined in Exchange Act Rule 13a-15(f),
internal control over financial reporting is a process designed by, or under
the
supervision of, our principal executive officer and principal financial officer
and effected by our board of directors, management and other personnel, to
provide reasonable assurance regarding the reliability of financial reporting
and the preparation of financial statements for external purposes in accordance
with generally accepted accounting principles.
Under
the
supervision and with the participation of our management, including our
principal executive officer and principal financial officer, we carried out
an
evaluation of the effectiveness of our internal control over financial
reporting, excluding the recent TEC and other subsequent acquisitions, as of
December 31, 2007 based on the criteria in “Internal Control - Integrated
Framework” issued by the Committee of Sponsoring Organizations of the Treadway
Commission (“COSO”). Based upon this evaluation, our management concluded that
our internal control over financial reporting was effective as of December
31,
2007.
65
Prior
to
the consummation of the TEC acquisition on October 26, 2007, we were a blank
check company. Our wholly-owned subsidiary, New TEC, acquired substantially
all
of the assets and assumed all of the liabilities of TEC. Management has excluded
New TEC and the other acquisitions referred to herein in Item 1, Business -
Growth Strategy and Note 4b - Other Business Combinations from its evaluation
of
the effectiveness of our internal control over financial reporting as of
December 31, 2007, due to the limited time from the dates of such acquisitions
through December 31, 2007, in which to perform such evaluations. The net
revenues attributable to New TEC and the other acquisitions accounted for all
of
our consolidated revenues for the year ended December 31, 2007, and their
aggregate total assets represented approximately 91% of our consolidated total
assets as of December 31, 2007. Management plans to assess the internal controls
over financial reporting for all of our 2007 acquisitions in 2008.
Marcum
& Kliegman LLP, the independent registered public accounting firm that
audited our consolidated financial statements included in this Registration
Statement of which this prospectus is a part, has also audited the effectiveness
of the Company’s internal control over financial reporting as of December 31,
2007 as stated in their report included herein, as presented on page F-2. Their
audit of the effectiveness of the Company’s internal control over financial
reporting as of December 31, 2007 excluded our recent TEC and other subsequent
acquisitions.
66
PLATINUM
ENERGY RESOURCES, INC.
INDEX
TO FINANCIAL STATEMENTS
|
Platinum
Energy Resources, Inc.
|
|
|
|
|
|
Audited
Consolidated Financial Statements
|
||||
|
Report
of Independent Registered Public Accounting Firm
|
|
|
F-2
|
|
|
Consolidated
Balance Sheets — December 31, 2007 and 2006
|
|
|
F-3
|
|
|
Consolidated
Statements of Operations — For the years ended December 31, 2007 and 2006
and the period from April 25, 2005 (inception) to December 31,
2005
|
|
|
F-4
|
|
|
Consolidated
Statements of Changes in Stockholders’ Equity — For the years ended
December 31, 2007 and 2006 and the period from April 25, 2005 (inception)
to December 31, 2005
|
|
|
F-5
|
|
|
Consolidated
Statements of Cash Flows — For the years ended December 31, 2007 and 2006
and the period from April 25, 2005 (inception) to December 31,
2005
|
|
|
F-6
|
|
|
Notes
to Consolidated Financial Statements
|
|
|
F-7
|
|
|
Unaudited
Condensed Consolidated Financial Statements
|
||||
|
Condensed
Consolidated Balance Sheets — March 31, 2008 (unaudited) and December 31,
2007
|
F-31 | |||
|
Condensed
Consolidated Statements of Operations — Three months ended March 31, 2008
and three months ended March 31, 2007
|
F-32 | |||
|
Condensed
Consolidated Statements of Changes in Stockholders’ Equity for the three
months ended March 31, 2008
|
F-33 | |||
|
Condensed
Consolidated Statements of Cash Flows — Three months ended March 31, 2008
and three months ended March 31, 2007
|
F-34 | |||
|
Notes
to Condensed Consolidated Financial Statements (unaudited)
|
F-35 | |||
|
Tandem
Energy Holdings, Inc.
|
|
|
|
|
|
Report
of Independent Certified Public Accountants
|
|
|
F-52 |
|
|
Consolidated
Balance Sheets — October 26, 2007 and December 31, 2006
|
|
|
F-53 |
|
|
Consolidated
Statements of Operations — For the period from January 1, 2007 through
October 26, 2007 and the years ended December 31, 2006 and
2005
|
|
|
F-54 |
|
|
Consolidated
Statements of Stockholders’ Equity (Deficit) — For the period from January
1, 2007 through October 26, 2007 and the years ended December 31,
2006 and
2005
|
|
|
F-55 |
|
|
Consolidated
Statements of Cash Flows — For the period from January 1, 2007 through
October 26, 2007 and the years ended December 31, 2006 and
2005
|
|
|
F-56 |
|
|
Notes
to Consolidated Financial Statements
|
|
|
F-58 |
|
|
Maverick
Engineering, Inc.
|
||||
|
Audited
Financial Statements
|
||||
|
Report
of Independent Certified Public Accounting Firm
|
F-79 | |||
|
Balance
Sheets — December 31, 2007 and December 31, 2006
|
F-80 | |||
|
Consolidated
Statements of Operations — For the years ended December 31, 2007 and
2006
|
F-82 | |||
|
Consolidated
Statements of Changes in Stockholders’ Equity — For the years ended
December 31, 2007 and 2006
|
F-83 | |||
|
Consolidated
Statements of Cash Flows — For the years ended December 31, 2007 and
2006
|
F-84 | |||
|
Notes
to Financial Statements
|
F-85 | |||
|
Unaudited
Financial Statements
|
F-95 | |||
|
Balance
Sheet — March 31, 2008
|
F-96 | |||
|
Statements
of Operations — For the three months ended March 31, 2008 and
2007
|
F-97 | |||
|
Statements
of Cash Flows — For the three months ended March 31, 2008 and
2007
|
F-98 | |||
|
Notes
to Financial Statements
|
F-99 | |||
|
Unaudited
Pro-Forma Information
|
||||
|
Unaudited
pro-forma condensed combined financial statements for the year ended
December 31, 2007 and as of and for the three months ended March
31,
2008
|
F-107 | |||
F-1
To
the
Board of Directors and Stockholders of
Platinum
Energy Resources, Inc. and Subsidiaries
We
have
audited the accompanying consolidated balance sheets of Platinum Energy
Resources, Inc. and Subsidiaries (the “Company”) as of December 31, 2007 and
2006, and the related consolidated statements of operations, stockholders’
equity and cash flows for the years then ended and for the period from April
25,
2005 (Inception) to December 31, 2005. We have also audited the Company’s
internal control over financial reporting as of December 31, 2007, based on
the
criteria established in Internal Control — Integrated Framework issued by the
Committee of Sponsoring Organizations of the Treadway Commission. The Company’s
management is responsible for these consolidated financial statements, for
maintaining effective internal control over financial reporting, and for its
assessment of the effectiveness of internal control over financial reporting
included in the accompanying Management’s Report on Internal Control over
Financial Reporting. Our responsibility is to express an opinion on these
consolidated financial statements and an opinion on the Company’s internal
control over financial reporting based on our audits.
Our
audit
of the Company’s internal control over financial reporting as of December 31,
2007 did not include the Company’s internal control over financial reporting
applicable to the TEC acquisition, which acquisition was consummated on October
26, 2007, and other subsequent acquisitions as discussed in Note 4 to the
consolidated financial statements. TEC and the other acquisitions accounted
for
100% of the Company’s net revenues for the year ended December 31, 2007, and
approximately 91% of the Company’s consolidated total assets as of December 31,
2007.
Except
as
discussed in the preceding paragraph, we conducted our audits in accordance
with
the standards of the Public Company Accounting Oversight Board (United States).
Those standards require that we plan and perform the audits to obtain reasonable
assurance about whether the consolidated financial statements are free of
material misstatement and whether effective internal control over financial
reporting was maintained in all material respects. Our audits of the
consolidated financial statements included examining, on a test basis, evidence
supporting the amounts and disclosures in the consolidated financial statements,
assessing the accounting principles used and significant estimates made by
management, and evaluating the overall consolidated financial statement
presentation. Our audit of internal control over financial reporting included
obtaining an understanding of internal control over financial reporting,
assessing the risk that a material weakness exists, and testing and evaluating
the design and operating effectiveness of internal control based on the assessed
risk. Our audits also included performing such other procedures as we considered
necessary in the circumstances. We believe that our audits provide a reasonable
basis for our opinions.
A
company’s internal control over financial reporting is a process designed to
provide reasonable assurance regarding the reliability of financial reporting
and the preparation of financial statements for external purposes in accordance
with generally accepted accounting principles. A company’s internal control over
financial reporting includes those policies and procedures that (1) pertain
to
the maintenance of records that, in reasonable detail, accurately and fairly
reflect the transactions and dispositions of the assets of the company; (2)
provide reasonable assurance that transactions are recorded as necessary to
permit preparation of financial statements in accordance with generally accepted
accounting principles, and that receipts and expenditures of the company are
being made only in accordance with authorizations of management and directors
of
the company; and (3) provide reasonable assurance regarding prevention or timely
detection of unauthorized acquisition, use, or disposition of the company’s
assets that could have a material effect on the financial
statements.
Because
of its inherent limitations, internal control over financial reporting may
not
prevent or detect misstatements. Also, projections of any evaluation of
effectiveness to future periods are subject to the risk that controls may become
inadequate because of changes in conditions, or that the degree of compliance
with the policies or procedures may deteriorate.
In
our
opinion, the consolidated financial statements referred to above present fairly,
in all material respects, the consolidated financial position of Platinum Energy
Resources, Inc. and Subsidiaries as of December 31, 2007 and 2006, and the
consolidated results of its operations and its cash flows for the years then
ended and for the period from April 25, 2005 (Inception) to December 31, 2005
in
conformity with accounting principles generally accepted in the United States
of
America. Also, in our opinion, except for the effect of any deficiencies that
might have been determined to have existed had we audited the internal control
over financial reporting applicable to the TEC and other acquisitions discussed
in the second paragraph above, the Company maintained, in all material respects,
effective internal control over financial reporting as of December 31, 2007,
based on the criteria established in Internal Control — Integrated Framework
issued by the Committee of Sponsoring Organizations of the Treadway
Commission.
/s/
Marcum & Kliegman LLP
New
York,
New York
March
31,
2008
F-2
PLATINUM
ENERGY RESOURCES, INC. AND SUBSIDIARIES
CONSOLIDATED
BALANCE SHEETS
|
|
December
31,
|
||||||
|
|
2007
|
2006
|
|||||
|
|
|
|
|||||
|
ASSETS
|
|
|
|||||
|
CURRENT
ASSETS
|
|
|
|||||
|
Cash
|
$
|
16,429,619
|
$
|
-
|
|||
|
Cash
and cash equivalents held in trust
|
—
|
109,213,492
|
|||||
|
Accounts
receivable, net
|
|||||||
|
Oil
and gas sales
|
2,619,363
|
—
|
|||||
|
Affiliates
and other
|
668,216
|
—
|
|||||
|
Inventory
|
88,556
|
—
|
|||||
|
Prepaid
expenses and other current assets
|
299,445
|
79,526
|
|||||
|
|
|||||||
|
Total
Current Assets
|
20,105,199
|
109,293,018
|
|||||
|
|
|||||||
|
Property
and equipment, at cost
|
|||||||
|
Oil
and gas properties, full cost method
|
170,571,663
|
—
|
|||||
|
Other
|
3,293,108
|
—
|
|||||
|
Less
accumulated depreciation, depletion and amortization
|
(1,253,026
|
)
|
—
|
||||
|
Property
and equipment, net
|
172,611,745
|
—
|
|||||
|
|
|||||||
|
Other
assets
|
|||||||
|
Deferred
acquisition and financing costs
|
—
|
1,662,632
|
|||||
|
Fair
value of commodity derivatives
|
73,446
|
—
|
|||||
|
Advance
payment and costs, Pleasanton transaction
|
2,522,639
|
—
|
|||||
|
Covenant
not to compete
|
376,164
|
—
|
|||||
|
Real
estate held for development
|
2,700,000
|
—
|
|||||
|
|
|||||||
|
Total
Assets
|
$
|
198,389,193
|
$
|
110,955,650
|
|||
|
|
|||||||
|
|
|||||||
|
CURRENT
LIABILITIES
|
|||||||
|
Accounts
payable
|
|||||||
|
Trade
|
$
|
1,132,725
|
$
|
1,471,167
|
|||
|
Oil
and gas sales
|
1,074,222
|
—
|
|||||
|
Due
to related party
|
—
|
85,585
|
|||||
|
Notes
payable - stockholder
|
—
|
75,000
|
|||||
|
Fair
value of commodity derivatives
|
3,116,542
|
—
|
|||||
|
Asset
retirement obligation - current
|
186,545
|
—
|
|||||
|
Accrued
liabilities and other
|
181,430
|
—
|
|||||
|
Income
taxes payable
|
254,960
|
130,960
|
|||||
|
Total
Current Liabilities
|
5,946,424
|
1,762,712
|
|||||
|
|
|||||||
|
Asset
retirement obligation
|
3,390,094
|
—
|
|||||
|
Deferred
income taxes
|
48,085,215
|
—
|
|||||
|
Common
stock subject to possible redemption, 2,878,560 shares at conversion
value
|
—
|
21,831,777
|
|||||
|
|
51,475,309
|
21,831,777
|
|||||
|
|
|||||||
|
STOCKHOLDERS'
EQUITY
|
|||||||
|
Preferred
stock, $.0001 par value, 1,000,000 authorized, 0 issued
|
—
|
—
|
|||||
|
Common
stock, $.0001 par value; 75,000,000 shares authorized; 24,068,675
and
18,000,000 shares (which includes 2,878,560 subject to possible conversion
in 2006) issued and outstanding, respectively
|
2,407
|
1,512
|
|||||
|
Additional
paid-in capital
|
155,064,142
|
85,424,242
|
|||||
|
Retained
earnings
|
1,562,375
|
1,935,407
|
|||||
|
Treasury
stock - 1,997,913 shares
|
(15,661,464
|
)
|
—
|
||||
|
|
|||||||
|
Total
Stockholders' Equity
|
140,967,460
|
87,361,161
|
|||||
|
|
|||||||
|
Total
Liabilities and Stockholders' Equity
|
$
|
198,389,193
|
$
|
110,955,650
|
|||
See
notes to consolidated financial statements
F-3
PLATINUM
ENERGY RESOURCES, INC. AND SUBSIDIARIES
CONSOLIDATED
STATEMENTS OF OPERATIONS
|
|
Year
Ended December 31, 2007
|
Year
Ended December 31, 2006
|
Period
from April 25, 2005 (Inception) to December 31, 2005
|
|||||||
|
|
|
|
|
|||||||
|
Revenues
|
|
|
|
|||||||
|
Oil
and Gas Sales
|
$
|
4,308,184
|
$
|
-
|
$
|
-
|
||||
|
|
||||||||||
|
Costs
and expenses
|
||||||||||
|
Lease
and other operating expense
|
1,776,247
|
—
|
—
|
|||||||
|
Marketing,
general and administrative expense
|
2,741,235
|
717,590
|
150,399
|
|||||||
|
Administrative
cost allowance - related party
|
28,015
|
68,710
|
16,875
|
|||||||
|
Depreciation,
depletion and amortization expense
|
1,253,026
|
—
|
—
|
|||||||
|
Accretion
of abandonment obligations
|
38,358
|
—
|
—
|
|||||||
|
|
||||||||||
|
Total
costs and expenses
|
5,836,881
|
786,300
|
167,274
|
|||||||
|
|
||||||||||
|
Operating
loss
|
(1,528,697
|
)
|
(786,300
|
)
|
(167,274
|
)
|
||||
|
|
||||||||||
|
Other
Income (Expenses)
|
||||||||||
|
Interest
income, net of interest allocated to common stock subject to
possible
|
||||||||||
|
redemption
of $616,217, $760,718 and $0
|
2,799,229
|
2,568,672
|
476,102
|
|||||||
|
Interest
(expense)
|
(59,580
|
)
|
(2,693
|
)
|
(5,000
|
)
|
||||
|
Change
in fair value of commodity derivatives
|
(1,472,522
|
)
|
—
|
—
|
||||||
|
Other
|
(23,462
|
)
|
—
|
—
|
||||||
|
Total
other income, net
|
1,243,665
|
2,565,979
|
471,102
|
|||||||
|
|
||||||||||
|
(Loss)
Income Before Income Taxes
|
(285,032
|
)
|
1,779,679
|
303,828
|
||||||
|
Provision
For Income Taxes - Current
|
88,000
|
120,000
|
28,100
|
|||||||
|
|
||||||||||
|
Net
(Loss) Income
|
$
|
(373,032
|
)
|
$
|
1,659,679
|
$
|
275,728
|
|||
|
|
||||||||||
|
WEIGHTED
AVERAGE NUMBER OF COMMON SHARES:
|
||||||||||
|
Basic
|
18,876,347
|
15,121,440
|
6,549,489
|
|||||||
|
Diluted
|
18,876,347
|
17,479,194
|
6,980,246
|
|||||||
|
|
||||||||||
|
NET
(LOSS) INCOME PER COMMON SHARE:
|
||||||||||
|
Basic
|
$
|
(0.02
|
)
|
$
|
0.11
|
$
|
0.04
|
|||
|
Diluted
|
$
|
(0.02
|
)
|
$
|
0.09
|
$
|
0.04
|
|||
See
notes to consolidated financial statements
F-4
PLATINUM
ENERGY RESOURCES, INC. AND SUBSIDIARIES
CONSOLIDATED
STATEMENTS OF STOCKHOLDERS’ EQUITY
|
|
Common
stock
|
Additional
paid-in
|
Retained
|
Treasury
|
Total
stockholders'
|
||||||||||||||
|
|
Shares
|
Amount
|
capital
|
earnings
|
Stock
|
equity
|
|||||||||||||
|
Common
shares issued to founders for cash, May 6, 2005 at $.0077 per
share
|
3,250,000
|
$
|
325
|
$
|
24,675
|
$
|
—
|
$
|
—
|
$
|
25,000
|
||||||||
|
Retroactive
effect of common stock dividend, declared September 23,
2005
|
1,250,000
|
125
|
(125
|
)
|
—
|
—
|
—
|
||||||||||||
|
Retroactive
effect of four-for-five reverse split effected October 21,
2005
|
(900,000
|
)
|
(90
|
)
|
90
|
—
|
—
|
—
|
|||||||||||
|
Sale
of 14,400,000 units, net of underwriters’ discount and offering expenses
(includes 2,878,560
|
|||||||||||||||||||
|
shares
subject to possible conversion), October 28, 2005 at $8.00 per
Unit
|
14,400,000
|
1,440
|
106,470,273
|
—
|
—
|
106,471,713
|
|||||||||||||
|
Proceeds
subject to possible conversion of 2,878,560 shares, October 28, 2005
at
$7.32 per Unit
|
(2,878,560
|
)
|
(288
|
)
|
(21,070,771
|
)
|
—
|
—
|
(21,071,059
|
)
|
|||||||||
|
Proceeds
from issuance of option, October 28, 2005
|
—
|
—
|
100
|
—
|
—
|
100
|
|||||||||||||
|
Net
income, for the period from April 25, 2005 (Inception) to December
31,
2005
|
—
|
—
|
—
|
275,728
|
—
|
275,728
|
|||||||||||||
|
Balance
at December 31, 2005
|
15,121,440
|
1,512
|
85,424,242
|
275,728
|
—
|
85,701,482
|
|||||||||||||
|
Net
income, for the year ended December 31, 2006
|
—
|
—
|
—
|
1,659,679
|
—
|
1,659,679
|
|||||||||||||
|
Balance
at December 31, 2006
|
15,121,440
|
1,512
|
85,424,242
|
1,935,407
|
—
|
87,361,161
|
|||||||||||||
|
Shares
not redeemed by shareholders upon TEC
|
1,076,355
|
108
|
8,390,687
|
—
|
—
|
8,390,795
|
|||||||||||||
|
Issaunce
of shares in connection with acquisition of TEC
|
7,692,308
|
769
|
59,999,231
|
—
|
—
|
60,000,000
|
|||||||||||||
|
Shares
issued to consultant for services
|
178,572
|
18
|
1,249,982
|
—
|
—
|
1,250,000
|
|||||||||||||
|
Treasury
shares purchased
|
(1,997,913
|
)
|
—
|
—
|
—
|
(15,661,464
|
)
|
(15,661,464
|
)
|
||||||||||
|
Net
(loss), for the year ended December 31, 2007
|
—
|
—
|
—
|
(373,032
|
)
|
—
|
(373,032
|
)
|
|||||||||||
|
|
|||||||||||||||||||
|
Balance
at December 31, 2007
|
22,070,762
|
$
|
2,407
|
$
|
155,064,142
|
$
|
1,562,375
|
$
|
(15,661,464
|
)
|
$
|
140,967,460
|
|||||||
See
notes to consolidated financial statements
F-5
PLATINUM
ENERGY RESOURCES, INC. AND SUBSIDIARIES
CONSOLIDATED
STATEMENTS OF CASH FLOWS
|
|
Year
Ended December 31, 2007
|
Year
Ended December 31, 2006
|
Period
from April 25, 2005 (Inception) to December 31, 2005
|
|||||||
|
Cash
Flows From Operating Activities
|
|
|
|
|||||||
|
Net
(loss) income
|
$
|
(373,032
|
)
|
$
|
1,659,679
|
$
|
275,728
|
|||
|
Adjustments
to reconcile net (loss) income to net cash provided by
|
||||||||||
|
(used
in) operating activities:
|
||||||||||
|
Depreciation,
depletion and amortization
|
1,253,026
|
—
|
—
|
|||||||
|
Accretion
of asset retirement obligation
|
38,358
|
—
|
—
|
|||||||
|
Amortization/writeoff
of bank loan fees
|
25,000
|
—
|
—
|
|||||||
|
Stock
based compensation
|
1,250,000
|
—
|
—
|
|||||||
|
Change
in fair value of derivatives
|
1,472,522
|
—
|
—
|
|||||||
|
Changes
in operating assets and liabilities:
|
||||||||||
|
Accounts
receivable
|
(1,114,095
|
)
|
—
|
—
|
||||||
|
Inventory
|
(2,974
|
)
|
—
|
—
|
||||||
|
Prepaid
expenses and other current assets
|
10,905
|
39,185
|
(118,711
|
)
|
||||||
|
Accounts
payable
|
119,215
|
241,273
|
87,795
|
|||||||
|
Accrued
liabilities and other
|
(177,695
|
)
|
—
|
—
|
||||||
|
Due
to related party
|
(85,585
|
)
|
68,710
|
16,875
|
||||||
|
Income
taxes payable
|
108,655
|
102,860
|
28,100
|
|||||||
|
Commodity
derivatives
|
(2,636,855
|
)
|
—
|
—
|
||||||
|
Net
cash (used in) provided by operating activities
|
(112,555
|
)
|
2,111,707
|
289,787
|
||||||
|
|
||||||||||
|
Cash
Flows From Investing Activities
|
||||||||||
|
Deposits
to Trust Fund
|
(3,082,629
|
)
|
(3,329,390
|
)
|
(105,884,102
|
)
|
||||
|
Release
of Cash held in trust fund
|
112,296,121
|
—
|
—
|
|||||||
|
Additions
to property and equipment
|
(1,713,819
|
)
|
—
|
—
|
||||||
|
Performance
deposit
|
—
|
(500,000
|
)
|
—
|
||||||
|
Recovery
of perfomance deposit upon restructuring
|
—
|
500,000
|
—
|
|||||||
|
Acquisition
of business of TEC, net of cash acquired of $2,959,773
|
(41,744,861
|
)
|
—
|
—
|
||||||
|
Acquistion
of other business
|
(15,518,501
|
)
|
—
|
—
|
||||||
|
Advance
payment and costs, Pleasanton transaction
|
(2,522,639
|
)
|
—
|
—
|
||||||
|
Deferred
acquistion costs
|
(1,994,052
|
)
|
(520,533
|
)
|
—
|
|||||
|
Net
cash provided by (used in) investing activities
|
45,719,620
|
(3,849,923
|
)
|
(105,884,102
|
)
|
|||||
|
|
||||||||||
|
Cash
Flows From Financing Activities
|
||||||||||
|
Interest
on cash held in trust allocated to common
|
||||||||||
|
stock
subject to possible redemption
|
616,217
|
760,718
|
—
|
|||||||
|
Proceeds
from the sale of common stock
|
—
|
—
|
25,000
|
|||||||
|
Proceeds
from notes payable-stockholder
|
1,032,000
|
75,000
|
180,000
|
|||||||
|
Repayment
of note payable-stockholder
|
(1,107,000
|
)
|
—
|
(180,000
|
)
|
|||||
|
Payments
to redeeming shareholders
|
(14,057,199
|
)
|
—
|
—
|
||||||
|
Gross
proceeds of public offering
|
—
|
—
|
115,200,000
|
|||||||
|
Payments
of costs of public offering
|
—
|
—
|
(8,728,287
|
)
|
||||||
|
Purchase of
treasury stock
|
(15,661,464
|
)
|
—
|
—
|
||||||
|
Proceeds
from issuance of underwriter’s stock option
|
—
|
—
|
100
|
|||||||
|
Net
cash (used in) provided by financing activities
|
(29,177,446
|
)
|
835,718
|
106,496,813
|
||||||
|
|
||||||||||
|
Net
Increase (Decrease) in Cash
|
16,429,619
|
(902,498
|
)
|
902,498
|
||||||
|
|
||||||||||
|
Cash
- Beginning of the Period
|
—
|
902,498
|
—
|
|||||||
|
|
||||||||||
|
Cash
- End of Period
|
$
|
16,429,619
|
$
|
—
|
$
|
902,498
|
||||
|
|
||||||||||
|
Cash
paid during the period for:
|
||||||||||
|
Interest
|
$
|
(59,580
|
)
|
$
|
2,693
|
$
|
5,000
|
|||
|
Income
taxes - state
|
$
|
—
|
$
|
17,140
|
$
|
—
|
||||
|
Non-Cash
Investing and Financing Activities:
|
||||||||||
|
Non-Converting
common shares subject to
possible
redemption converted to equity
|
$
|
8,390,795
|
$
|
—
|
$
|
—
|
||||
|
Deferrred
acquisition costs accrued and deferred
|
$
|
100,000
|
$
|
1,142,099
|
$
|
—
|
||||
|
|
||||||||||
|
Acquisition
of TEC:
|
||||||||||
|
Assets
acquired and liabilities assumed:
|
||||||||||
|
Cash
|
$
|
2,959,773
|
||||||||
|
Accounts
Receivable
|
1,923,957
|
|||||||||
|
Inventory
|
85,582
|
|||||||||
|
Property
and equipment
|
||||||||||
|
Oil
and gas properties, full cost method
|
154,881,344
|
|||||||||
|
Other
|
1,381,398
|
|||||||||
|
Other
current assets
|
246,169
|
|||||||||
|
Real
estate held for development
|
2,700,000
|
|||||||||
|
Accounts
payable
|
(1,983,134
|
)
|
||||||||
|
Fair
value of commodity derivatives - noncurrent
|
(4,207,430
|
)
|
||||||||
|
Asset
retirement obligation
|
(2,542,881
|
)
|
||||||||
|
Deferred
income taxes
|
(48,100,560
|
)
|
||||||||
|
Total
purchase price
|
107,344,218
|
|||||||||
|
Less:
Cash consideration paid to sellers
|
(41,704,634
|
)
|
||||||||
|
Less:
Cash paid to finder
|
(3,000,000
|
)
|
||||||||
|
Less:
Other closing costs including legal and accounting
|
(2,639,584
|
)
|
||||||||
|
Non-cash
consideration - common stock issued to seller
|
$
|
60,000,000
|
||||||||
|
|
||||||||||
|
All
other acquisition:
|
||||||||||
|
Assets
acquired and liabilities assumed:
|
||||||||||
|
Accounts
Receivable
|
$
|
883,655
|
||||||||
|
Due
from TEC on date of acquisition
|
64,976
|
|||||||||
|
Property
and equipment
|
||||||||||
|
Oil
and gas properties, full cost method
|
13,553,206
|
|||||||||
|
Other
|
1,635,900
|
|||||||||
|
Covenant
not to compete, gross
|
376,164
|
|||||||||
|
Asset
retirement obligation
|
(995,400
|
)
|
||||||||
|
|
15,518,501
|
|||||||||
|
Less:
Cash consideration paid to sellers
|
(15,465,365
|
)
|
||||||||
|
Less:
Legal fees
|
(53,136
|
)
|
||||||||
|
Non-cash
consideration
|
$
|
—
|
||||||||
See
notes
to consolidated financial statements
F-6
PLATINUM
ENERGY RESOURCES, INC. AND SUBSIDIARIES
NOTES
TO CONSOLIDATED FINANCIAL STATEMENTS
For
the Years Ended December 31, 2007 and 2006
And
the Period From April 25, 2005 (Inception) to December 31,
2005
Note
1 – Organization, Business and Operations
Platinum
Energy Resources, Inc. and subsidiaries (the “Company” or “Platinum”) was
incorporated in Delaware on April 25, 2005 as a blank check company for the
purpose of effecting a business combination with an unidentified operating
business in the global oil and gas Exploration & Production (“E&P”)
industry. In October 2007, the Company acquired substantially all of the
assets and assumed all of the liabilities of Tandem Energy Corporation
(which is sometimes referred to herein as “TEC”) described in Note 4 below, a
Colorado Corporation. The Company had no operations other than conducting an
initial public offering and seeking a business combination.
Currently
the Company is an independent oil and gas exploration and production company.
It
has approximately 37,000 acres under lease in relatively long-lived fields
with
well-established production histories, 21,000 of which were acquired as part
of
the TEC acquisition. The Company’s properties are concentrated primarily in the
Gulf Coast region in Texas, the Permian Basin in Texas and New Mexico and the
Fort Worth Basin in Texas.
The
registration statement of the Company’s initial public offering (the “Offering”)
was declared effective on October 24, 2005. The Company consummated the Offering
on October 28, 2005 and received net proceeds of approximately $106,472,000.
See
Note 3 - “Initial Public Offering,” for a complete discussion. On October 26,
2007 the Company successfully consummated a Business Combination, as more fully
described in Note 4 herein. See Note 4 -“Business Combination” for a discussion
of the definitive Asset Acquisition Agreement and Plan of Reorganization entered
into on October 26, 2006, as amended, which replaced an Agreement and Plan
or
Merger entered into on January 26, 2006 with the same parties.
Note
2 –
Summary of Significant Accounting Policies
Principles
of Consolidation
The
consolidated financial statements include the accounts of the Company and its
wholly owned subsidiaries. All material intercompany balances and transactions
have been eliminated.
Estimates
and Assumptions
The
preparation of financial statements in conformity with accounting principles
generally accepted in the United States of America requires management to make
estimates and assumptions that affect the reported amounts of assets and
liabilities and the disclosure of contingent assets and liabilities as of the
date of the financial statements and the reported amounts of revenues and
expenses during the reporting period. Actual results could differ from those
estimates. The accounting policy most affected by management’s estimates and
assumptions is the reliance on estimates of proved reserves to compute the
provision for depreciation, depletion and amortization (“DD&A”), and the
determination of any impairment of long-lived assets.
Oil
and Gas Properties
The
Company uses the full cost method of accounting for exploration and development
activities as defined by the Securities and Exchange Commission (“SEC”). Under
this method of accounting, the costs of unsuccessful, as well as successful,
exploration and development activities are capitalized as properties and
equipment. This includes any internal costs that are directly related to
exploration and development activities but does not include any costs related
to
production, general corporate overhead or similar activities. Gain or loss
on
the sale or other disposition of oil and gas properties is not recognized,
unless the gain or loss would significantly alter the relationship between
capitalized costs and proved reserves of oil and natural gas attributable to
a
country. The Company has defined a cost center by country. Currently, all of
the
Company’s oil and gas properties are located within the continental United
States.
F-7
PLATINUM
ENERGY RESOURCES, INC. AND SUBSIDIARIES
NOTES
TO CONSOLIDATED FINANCIAL STATEMENTS
For
the Years Ended December 31, 2007 and 2006
And
the Period From April 25, 2005 (Inception) to December 31,
2005
Note
2 – Summary of Significant Accounting Policies - continued
Properties
and equipment may include costs that are excluded from costs being depreciated
or amortized. Oil and gas costs excluded represent investments in unproved
properties and major development projects in which New TEC owns a direct
interest. These unproved property costs include nonproducing leasehold,
geological and geophysical costs associated with leasehold or drilling interests
and exploration drilling costs. All costs excluded are reviewed at least
quarterly to determine if impairment has occurred. The amount of any impairment
is transferred to the capitalized costs being amortized in the DD&A
pool.
Depreciation,
Depletion and Amortization
The
depreciable base for oil and gas properties includes the sum of capitalized
costs net of accumulated DD&A, estimated future development costs and asset
retirement costs not accrued in oil and gas properties, less costs excluded
from
amortization and salvage. The depreciable base of oil and gas properties and
mineral investments are amortized using the unit-of-production method based
on
total proved oil and gas reserves. Properties and equipment carrying values
do
not purport to represent replacement or market values.
Proved
Oil and Gas Reserves
In
accordance with Rule 4-10(a) of SEC Regulation S-X, proved oil and gas reserves
are the estimated quantities of crude oil, natural gas, and natural gas liquids
which geological and engineering data demonstrate with reasonable certainty
to
be recoverable in future years from known reservoirs under existing economic
and
operating conditions, i.e., prices and costs as of the date the estimate is
made. Prices include consideration of changes in existing prices provided only
by contractual arrangements, but not on escalation based upon future
conditions.
|
(i)
|
Reservoirs
are considered proved if economic producibility is supported by either
actual production or conclusive formation tests. The area of a reservoir
considered proved includes (A) that portion delineated by drilling
and
defined by gas-oil and/or oil-water contacts, if any; and (B) the
immediately adjoining portions not yet drilled, but which can be
reasonably judged as economically productive on the basis of available
geological and engineering data. In the absence of information on
fluid
contacts, the lowest known structural occurrence of hydrocarbons
controls
the lower proved limit of the
reservoir.
|
|
(ii)
|
Reserves
which can be produced economically through application of improved
recovery techniques (such as fluid injection) are included in the
“proved”
classification when successful testing by a pilot project, or the
operation of an installed program in the reservoir, provides support
for
the engineering analysis on which the project or program was
based.
|
|
(iii)
|
Estimates
of proved reserves do not include the
following:
|
|
(A)
|
oil
that may become available from known reservoirs but is classified
separately as “indicated additional
reserves”;
|
|
(B)
|
crude
oil, natural gas, and natural gas liquids, the recovery of which
is
subject to reasonable doubt because of uncertainty as to geology,
reservoir characteristics, or economic
factors;
|
|
(C)
|
crude
oil, natural gas, and natural gas liquids, that may occur in undrilled
prospects; and
|
|
(D)
|
crude
oil, natural gas, and natural gas liquids, that may be recovered
from oil
shales, coal, gilsonite and other such
sources.
|
F-8
PLATINUM
ENERGY RESOURCES, INC. AND SUBSIDIARIES
NOTES
TO CONSOLIDATED FINANCIAL STATEMENTS
For
the Years Ended December 31, 2007 and 2006
And
the Period From April 25, 2005 (Inception) to December 31,
2005
Note
2 – Summary of Significant Accounting Policies - continued
Ceiling
Test
Under
the
full cost method of accounting, a ceiling test is performed each quarter. The
full cost ceiling test is an impairment test prescribed by SEC Regulation S-X
Rule 4-10. The ceiling test determines a limit, on a country-by-country basis,
on the book value of oil and gas properties. Currently, all of the Company’s
operations are located in the United States. The capitalized costs of proved
oil
and gas properties, net of accumulated DD&A and the related deferred income
taxes, may not exceed the estimated future net cash flows from proved oil and
gas reserves, excluding future cash outflows associated with settling asset
retirement obligations that have been accrued on the balance sheet, generally
using prices in effect at the end of the period held flat for the life of
production and including the effect of derivative instruments that qualify
as
cash flow hedges, discounted at 10%, net of related tax effects, plus the cost
of unevaluated properties and major development projects excluded from the
costs
being amortized. If capitalized costs exceed this limit, the excess is charged
to expense and reflected as additional accumulated DD&A.
Asset
Retirement Obligation
The
Company follows the provisions of Statement of Financial Accounting Standards
(“SFAS”) No. 143, Accounting
for Asset Retirement Obligations.
SFAS
No. 143 requires the Company to recognize a liability for the present value
of all legal obligations associated with the retirement of tangible, long-lived
assets and capitalize an equal amount as a cost of the asset. The cost of the
abandonment obligations, less estimated salvage values, is included in the
computation of depreciation, depletion and amortization.
Income
Taxes
The
Company follows the asset and liability method prescribed by SFAS No. 109,
Accounting
for Income Taxes (“SFAS 109”).
Under
this method of accounting for income taxes, deferred tax assets and liabilities
are recognized for the future tax consequences attributable to differences
between the financial statement carrying amounts of existing assets and
liabilities and their respective tax bases. Deferred tax assets and liabilities
are measured using enacted tax rates expected to apply to taxable income in
the
years in which those temporary differences are expected to be recovered or
settled. Under SFAS No. 109, the effect on deferred tax assets and liabilities
of a change in enacted tax rates is recognized in income in the period that
includes the enactment date.
Effective
January 1, 2007, the Company adopted the provisions of Financial Accounting
Standards Board Interpretation No. 48, “Accounting for Uncertainty in Income
Taxes, an interpretation of FASB Statement No. 109” (“FIN 48”). FIN 48 clarifies
the accounting for uncertainty in income taxes recognized in the Company’s
financial statements in accordance with SFAS 109, and prescribes a recognition
threshold and measurement process for financial statement recognition and
measurement of a tax position taken or expected to be taken in a tax return.
FIN
48 also provides guidance on derecognition, classification, interest and
penalties, accounting in interim periods, disclosure and
transition.
Management
has evaluated and concluded that there are no significant uncertain tax
positions requiring recognition in the Company’s financial statements as of
January 1, 2007. The evaluation was performed for the tax period April 25
(inception) to December 31, 2005 and the for the year ended December 31, 2006,
the tax years which remain subject to examination for Federal and New Jersey
State purposes as of September 30, 2007.
The
Company’s policy is to classify assessments, if any, for tax related interest as
interest expenses and penalties as marketing, general and administrative
expenses.
Stock-Based
Compensation
The
Company has adopted SFAS No. 123(R) “Share Based Payment”
(“SFAS 123(R)”). This statement is a revision of SFAS Statement
No. 123, and supersedes APB Opinion No. 25, and its related
implementation guidance.
F-9
PLATINUM
ENERGY RESOURCES, INC. AND SUBSIDIARIES
NOTES
TO CONSOLIDATED FINANCIAL STATEMENTS
For
the Years Ended December 31, 2007 and 2006
And
the Period From April 25, 2005 (Inception) to December 31,
2005
Note
2 – Summary of Significant Accounting Policies - continued
SFAS 123(R)
addresses all forms of share based payment (“SBP”) awards including shares
issued under employee stock purchase plans, stock options, restricted stock
and
stock appreciation rights.Under SFAS 123(R), SBP awards are measured
at fair value on the awards’ grant date, based on the estimated number of awards
that are expected to vest and results in a charge to operations. No such
instruments were issued in 2005, 2006 and 2007.
Non-Employee
Stock Based Compensation
The
Company accounts for equity instruments issued to non-employees in accordance
with the provisions of SFAS No. 123(R) and Emerging Issues Task Force
(“EITF”) Issue No. 96-18, “Accounting for Equity Instruments That are
Issued to Other Than Employees for Acquiring, or in Conjunction with Selling,
Goods or Services,” (“EITF 96-18”) which requires that such equity instruments
be recorded at their fair value on the measurement date. The measurement of
stock-based compensation is subject to periodic adjustment as the underlying
equity instrument vests. No such instruments were issued in 2005, 2006 and
2007.
The Company issued 178,572 shares of its common stock in connection with a
consulting agreement as described in Note 6 (f).
Income
Per Share
The
Company follows the provisions of SFAS No. 128, “Earnings Per Share” (“SFAS No.
128”). In accordance with SFAS No. 128, earnings per common share amounts
(“Basic EPS”) were computed by dividing earnings by the weighted average number
of common shares outstanding for the period. Earnings per common share amounts,
assuming dilution (“Diluted EPS”), were computed by reflecting the potential
dilution from the exercise of dilutive common stock purchase warrants. SFAS
No.
128 requires the presentation of both Basic EPS and Diluted EPS on the face
of
the consolidated statements of operations.
Reconciliations
between the numerators and denominators of the Basic and Diluted EPS
computations for earnings for each period are as follows.
|
|
Year
Ended December 31, 2007
|
|||||||||
|
Net
Income (Loss)
(Numerator)
|
Shares
(Denominator)
|
Per
Share Amounts
|
||||||||
|
Basic
EPS
|
|
|
|
|||||||
|
Net
Income
|
$
|
(373,032
|
)
|
18,876,347
|
$
|
(0.02
|
)
|
|||
|
Effect
of Dilutive Securities
|
—
|
—
|
—
|
|||||||
|
Warrants
|
|
—
|
—
|
|||||||
|
Net
income attributable to common stock and assumed exercise of
warrants
|
$
|
(373,032
|
)
|
18,876,347
|
$
|
(0.02
|
)
|
|||
F-10
PLATINUM
ENERGY RESOURCES, INC. AND SUBSIDIARIES
NOTES
TO CONSOLIDATED FINANCIAL STATEMENTS
For
the Years Ended December 31, 2007 and 2006
And
the Period From April 25, 2005 (Inception) to December 31,
2005
Note
2 – Summary of Significant Accounting Policies - continued
|
|
Year
Ended December 31, 2006
|
|||||||||
|
|
Net
Income
(Numerator)
|
Shares
(Denominator)
|
Per
Share
Amounts
|
|||||||
|
Basic
EPS
|
|
|
|
|||||||
|
Net
Income
|
$
|
1,659,679
|
15,121,440
|
$
|
0.11
|
|||||
|
Effect
of Dilutive Securities
|
||||||||||
|
Warrants
|
|
—
|
2,357,754
|
|
(0.02
|
)
|
||||
|
Net
income attributable to common stock and assumed exercise of
warrants
|
$
|
1,659,679
|
17,479,194
|
$
|
0.09
|
|||||
|
|
Period
From April 25, 2005 through
December
31, 2005
|
|||||||||
|
|
Net
Income
(Numerator)
|
Shares
(Denominator)
|
Per
Share
Amounts
|
|||||||
|
Basic
EPS
|
|
|
|
|||||||
|
Net
Income
|
$
|
275,728
|
6,549,489
|
$
|
0.04
|
|||||
|
Effect
of Dilutive Securities
|
||||||||||
|
Warrants
|
|
—
|
430,757
|
|
0.00
|
|||||
|
Net
income attributable to common stock and assumed exercise of
warrants
|
$
|
275,728
|
6,980,246
|
$
|
0.04
|
|||||
In
2005
and 2006, common shares subject to possible conversion of 2,878,560 were
excluded from the calculation of Basic EPS in 2006 and 2007 since such shares
if
redeemed, only participate in their Pro-Rata share of the trust earnings.
Subsequent to the date of the Acquisition transaction, October 26, 2007, an
additional 1,076,355, which were not redeemed, were included in the
determination of weighted average number of common shares outstanding. The
Company has determined that the Warrants contained in the Units sold in the
IPO
(see Note 3) are dilutive for all the 2005 and 2006 periods, and accordingly
included the effects of the Warrants in Diluted EPS using the Treasury Stock
Method in those periods, and has determined that their inclusion in 2007 would
be antidilutive and thus excluded the affects of the Warrants in 2007. An option
to purchase 720,000 Units was excluded in the computation of Diluted
EPS because the option exercise price exceeded the average market price for
the Units in all periods.
F-11
PLATINUM
ENERGY RESOURCES, INC. AND SUBSIDIARIES
NOTES
TO CONSOLIDATED FINANCIAL STATEMENTS
For
the Years Ended December 31, 2007 and 2006
And
the Period From April 25, 2005 (Inception) to December 31,
2005
Note
2 – Summary of Significant Accounting Policies - continued
Environmental
Expenditures
The
Company is subject to extensive federal, state and local environmental laws
and
regulations. These laws regulate the discharge of materials into the environment
and may require the Company to remove or mitigate the environmental effects
of
the disposal or release of petroleum or chemical substances at various sites.
Environmental expenditures are expensed or capitalized depending on their future
economic benefit. Expenditures that relate to an existing condition caused
by
past operations and that have no future economic benefits are
expensed.
Liabilities
for expenditures of a non-capital nature are recorded when environmental
assessment and/or remediation is probable, and the costs can be reasonably
estimated. Such liabilities are generally undiscounted unless the timing of
cash
payments for the liability or component is fixed or reliably
determinable.
Hedging
Activities
From
time
to time, the Company may utilize derivative instruments, consisting of swaps,
floors and collars, to attempt to reduce its exposure to changes in commodity
prices and interest rates. The Company accounts for its derivatives in
accordance with SFAS No. 133, Accounting
for Derivative Instruments and Hedging Activities,
as
amended. SFAS No. 133 requires that all derivative instruments be
recognized as assets or liabilities in the balance sheet, measured at fair
value. The accounting for changes in the fair value of a derivative depends
on
both the intended purpose and the formal designation of the derivative.
Designation is established at the inception of a derivative, but subsequent
changes to the designation are permitted. The Company has elected not to
designate any of its derivative financial contracts as accounting hedges and,
accordingly, has accounted for these derivative financial contracts using
mark-to-market accounting. Changes in fair value of derivative instruments
which
are not designated as cash flow hedges are recorded in other income (expense)
as
changes in fair value of derivatives.
Cash
and Cash Equivalents
The
Company considers all cash and highly liquid investments with original
maturities of three months or less to be cash equivalents.
Concentration
of Credit Risk - Cash
The
Company maintains its cash balances at two major financial institutions. Certain
balances may at times exceed the federally insured limits established by the
Federal Deposit Insurance Corporation. The Company has not experienced any
losses in such accounts and believes it is not exposed to any significant credit
risk.
Concentration
Risk - Other
The
Company sells its oil and natural gas production to various customers, serves
as
operator in the drilling, completion and operation of oil and gas wells, and
from time to time enters into derivatives transactions with various
counterparties. When management deems appropriate, the Company may obtain
letters of credit to secure amounts due from its significant oil and gas
purchasers and follow other procedures to monitor credit risk from joint owners
and derivatives counterparties.
Inventory
Inventory
consists primarily of tubular goods and other well equipment which the Company
plans to utilize in its ongoing exploration and development activities and
is
carried at the lower of cost or market value.
Real
Estate Held for Development
The
Company’s real estate held for development was recorded at fair market value
when the Company completed its purchase of the assets of Tandem Energy
Corporation on October 26, 2007 as described more fully in Note 4, and relates
to approximately 41 acres of undeveloped land located near Tomball,
Texas.
F-12
PLATINUM
ENERGY RESOURCES, INC. AND SUBSIDIARIES
NOTES
TO CONSOLIDATED FINANCIAL STATEMENTS
For
the Years Ended December 31, 2007 and 2006
And
the Period From April 25, 2005 (Inception) to December 31,
2005
Note
2 – Summary of Significant Accounting Policies - continued
Revenue
Recognition and Gas Balancing
The
Company utilizes the sales method of accounting for oil, natural gas and natural
gas liquids revenues whereby revenues, net of royalties, are recognized as
the
production is sold to purchasers. The amount of gas sold may differ from the
amount to which the Company is entitled based on its revenue interests in the
properties. The Company did not have any significant gas imbalance positions
at
December 31, 2007 and 2006.
Comprehensive
Income
SFAS
No.
130, Reporting
Comprehensive Income,
established standards for reporting and displaying comprehensive income and
its
components (revenue, expenses, gains and losses) in a full set of
general-purpose financial statements. There were no differences between net
income and comprehensive income in 2007, 2006 or 2005.
Accounts
Receivable and Allowance for Doubtful Accounts
The
Company’s trade receivables consist primarily of receivables from non-operators
who own an interest in properties which the Company operates, and trade
receivables associated with the operations of the Company’s wholly owned
subsidiary, Red Iron Tool, Inc. Insofar as the receivables relate to oil and
gas
trade receivables, the Company has the ability and the right to withhold oil
and
gas revenues from any owner who is delinquent in their payments. The accounts
receivables of Red Iron Tool, Inc. are generally with established customers
with
no history of non-payment. With respect to these accounts receivable acquired
in
the Lothian acquisition described in Note 4, the Company established an
allowance for doubtful accounts approximating $100,000 upon acquisition.
.
Recent
Accounting Pronouncements
In
September 2006, the Financial Accounting Standards Board (“FASB”) issued
Statement of Financial Accounting Standards (“SFAS”) No. 157, Fair
Value Measurements
. SFAS
157 defines fair value as used in numerous accounting pronouncements,
establishes a framework for measuring fair value in accordance with generally
accepted accounting principles and expands disclosure requirements related
to
the use of fair value measures in financial statements. SFAS 157 will be
effective for the Company’s financial statements for the fiscal year beginning
January 1, 2008.
In
February 2007, the FASB issued SFAS 159, The
Fair Value Option for Financial Assets and Financial Liabilities, Including
an
Amendment of FASB Statement No. 115,
which
will become effective on January 1, 2008. FAS 159 permits entities to
measure eligible financial assets, financial liabilities and firm commitments
at
fair value, on an instrument-by-instrument basis, that are otherwise not
permitted to be accounted for at fair value under other generally accepted
accounting principles. The fair value measurement election is irrevocable and
subsequent changes in fair value must be recorded in earnings.
In
April 2007, the FASB issued FASB Staff Position FIN 39-1, Amendment
of FASB Interpretation No. 39
. FSP
FIN 39-1 clarifies that a reporting entity that is party to a master netting
arrangement can offset fair value amounts recognized for the right to reclaim
cash collateral (a receivable) or the obligation to return cash collateral
(a
payable) against fair value amounts recognized for derivative instruments that
have been offset under the same master netting arrangement. FSP FIN 39-1 is
effective for financial statements issued for fiscal years beginning after
November 15, 2007.
F-13
PLATINUM
ENERGY RESOURCES, INC. AND SUBSIDIARIES
NOTES
TO CONSOLIDATED FINANCIAL STATEMENTS
For
the Years Ended December 31, 2007 and 2006
And
the Period From April 25, 2005 (Inception) to December 31,
2005
Note
2 – Summary of Significant Accounting Policies - continued
In
December 2007, the FASB issued SFAS No. 141 (revised 2007),
Business
Combinations
(“SFAS
141(R)”), which replaces FASB Statement No. 141. SFAS 141(R) establishes
principles and requirements for how an acquirer recognizes and measures in
its
financial statements the identifiable assets acquired, the liabilities assumed,
any non- controlling interest in the acquiree and the goodwill acquired. The
Statement also establishes disclosure requirements that will enable users to
evaluate the nature and financial effects of the business combination. SFAS
141(R) is effective for acquisitions that occur in an entity’s fiscal year that
begins after December 15, 2008.
In
December 2007, the FASB issued SFAS No. 160, Noncontrolling
Interests in Consolidated Financial Statements—an amendment of ARB
No. 51
. SFAS
160 requires that accounting and reporting for minority interests will be
recharacterized as noncontrolling interests and classified as a component of
equity. SFAS 160 also establishes reporting requirements that provide sufficient
disclosures that clearly identify and distinguish between the interests of
the
parent and the interests of the noncontrolling owners. SFAS 160 applies to
all
entities that prepare consolidated financial statements, except not-for-profit
organizations, but will affect only those entities that have an outstanding
noncontrolling interest in one or more subsidiaries or that deconsolidate a
subsidiary. This statement is effective as of the beginning of an entity’s first
fiscal year beginning after December 15, 2008.
Note
3 – Initial Public Offering
On
October 28, 2005, the Company sold to the public 14,400,000 units (“Units”) at
an offering price of $8.00 per Unit. Each Unit consists of one share of the
Company’s common stock, $0.0001 par value, and one Redeemable Common Stock
Purchase Warrant (“Warrants”). Each Warrant entitles the holder to purchase from
the Company one share of common stock at an exercise price of $6.00 commencing
on the later of the completion of a Business Combination with a target business
or one year from the effective date of the Offering and expiring four years
from
the effective date of the Offering. The Warrants will be redeemable, in whole
or
in part, upon written consent of the representative of the underwriters, at
a
price of $0.01 per Warrant upon thirty (30) days notice after the Warrants
become exercisable, only in the event that the last sale price of the common
stock is at least $11.50 per share for any twenty (20) trading days within
a
thirty (30) trading day period ending on the third day prior to the date on
which notice of redemption is given. Separate trading of the common stock and
Warrants comprising the Units commenced on or about December 9,
2005.
In
connection with the Offering, the Company issued an option (the “Units Purchase
Option” or “UPO”), for $100.00, to the representative of the underwriters to
purchase up to 720,000 Units at an exercise price of $10.00 per Unit. The Units
issuable upon exercise of this option are identical to those described in the
preceding paragraph, except that the warrants underlying the Units will be
exercisable at $7.50 per share. This option is exercisable at $10.00 per Unit
commencing on the later of the consummation of a Business Combination or one
year from the date of the prospectus relating to the Offering (October 24,
2005)
and expiring five years from such date. The option may be exercised for cash
or
on a “cashless” basis, at the holder’s option, such that the holder may use the
appreciated value of the option (the difference between the exercise prices
of
the option and the underlying Warrants and the market price of the Units and
underlying securities) to exercise the option without the payment of any cash.
The option and the 720,000 units, the 720,000 shares of common stock and the
720,000 warrants underlying such units, and the 720,000 shares of common stock
underlying such warrants, were deemed compensation by the National Association
of Securities Dealers (“NASD”) and are therefore subject to a 180-day lock-up.
Additionally, the option may not be sold, transferred, assigned, pledged or
hypothecated for a one-year period (including the foregoing 180-day period)
following the date of the Offering prospectus. The option grants to holders
demand and “piggy back” rights for periods of five and seven years,
respectively, from the date of the Offering with respect to the registration
under the Securities Act of the securities directly and indirectly issuable
upon
exercise of the option. The Company would be obligated to bear all fees and
expenses attendant to registering the securities.
F-14
PLATINUM
ENERGY RESOURCES, INC. AND SUBSIDIARIES
NOTES
TO CONSOLIDATED FINANCIAL STATEMENTS
For
the Years Ended December 31, 2007 and 2006
And
the Period From April 25, 2005 (Inception) to December 31,
2005
Note
3 – Initial Public Offering - continued
The
exercise price and number of units issuable upon exercise of the option may
be
adjusted in certain circumstances including in the event of a stock dividend,
or
a recapitalization, reorganization, merger or consolidation. However, the option
will not be adjusted for issuances of common stock at a price below its exercise
price.
Should
the Company be unable to deliver shares of its common stock underlying the
exercise of the Warrants included in the Units and shares of its common stock
underlying the exercise of the Company’s Unit Purchase Option as a result of the
absence of an effective registration statement with respect to these securities,
then the Warrants and the UPO would not be exercisable and the Company will
have
no obligation to pay holders of the Warrants and UPO any cash or otherwise
“net
cash settle” the Warrant or the UPO. In this event, the Warrants and UPO may
expire worthless.
The
Company has accounted for the fair value of the option, inclusive of the receipt
of the $100.00 cash payment, as an expense of the Offering resulting in a charge
directly to stockholders’ equity. The Company estimated that the fair value of
this option was approximately $2,412,000 ($0.168 per Unit) using a Black-Scholes
option-pricing model. The fair value of the option granted to the representative
of the underwriters was estimated as of the date of grant using the following
assumptions: (i) expected volatility of 49.65%, (ii) risk-free interest rate
of
4.34%, (iii) expected life of 5 years and (iv) a dividend rate of
zero.
Because
the Company did not have a trading history, the Company estimated the potential
volatility of its common stock price based upon volatility of a representative
sample of comparable companies .
Note
4 – Business Combinations
a.
Tandem Energy Acquisition
On
October 4, 2006, Platinum, through its wholly-owned subsidiary, PER Acquisition
Corporation (which changed its name to Tandem Energy Corporation (“New TEC”), a
Delaware corporation, upon consummation of the Acquisition), entered into an
Acquisition Agreement pursuant to which Platinum would acquire all of the assets
and assume substantially all of the liabilities of the predecessor entity,
Tandem Energy Corporation (TEC), a Colorado corporation, including the
assumption of approximately $42 million of TEC’s debt, in exchange for the
issuance of approximately 8 million shares of Platinum common
stock.
On
October 26, 2007, Platinum consummated the TEC acquisition pursuant to the
Acquisition Agreement. At the closing, New TEC acquired all of the assets
and assumed substantially all of the liabilities of TEC for $107,344,219,
including approximately $41.7 million of TEC’s debt (including accrued
interest), in exchange for the issuance of 7,692,308 shares of Platinum common
stock with a per share cash value of $7.80 per share. Included in the purchase
price were customary closing costs and commissions associated with the
transaction.
F-15
PLATINUM
ENERGY RESOURCES, INC. AND SUBSIDIARIES
NOTES
TO CONSOLIDATED FINANCIAL STATEMENTS
For
the Years Ended December 31, 2007 and 2006
And
the Period From April 25, 2005 (Inception) to December 31,
2005
Note
4 – Business Combinations - continued
At
the
closing of the Acquisition, the net proceeds of the IPO that were placed in
the
trust account, including the interest thereon (approximating $112 million in
the
aggregate), were released to the Company and were used to (i) retire the $41.7
million in indebtedness of TEC assumed in connection with the TEC acquisition,
(ii) make payments in the aggregate amount of $14,057,199 to Platinum
stockholders owning 1,802,205 shares of common stock who voted against the
acquisition and exercised their rights to convert their shares into a pro rata
portion of the trust account and (iii) pay a finder’s fee of $3.0 million to Mr.
Lance Duncan, as well as other transaction-related expenses. The remainder
of
the funds became available to the Company for corporate purposes.
In
November 2007, Platinum repurchased 1,997,913 shares of Platinum common stock
for a total purchase price of $15,661,464 (including commissions) pursuant
to
its previously announced share repurchase program. The remainder of the funds
will be applied towards, among other things, future acquisitions (see Note
4,
Business
Combinations
),
working capital, capital expenditures and further repurchases of shares of
Platinum common stock.
In
addition, in accordance with the Asset Acquisition agreement, the Company filed
a registration statement with the Securities and Exchange Commission with
respect to the approximately 7.7 million Platinum common shares issued in
connection with the Acquisition. This registration statement has not yet become
effective.
In
connection with the Asset Acquisition Agreement:
|
·
|
The
Company retained C.K. Cooper & Company, Inc., an investment banking
firm, to provide a fairness opinion as to whether the consideration
to be
paid by the Company in the Asset Acquisition was fair, from a financial
point of view, to the Company’s stockholders and that the fair value of
TEC was at least equal to 80% of the Company’s net assets. C.K. Cooper was
originally retained to provide a fairness opinion in connection with
the
previously proposed merger with Tandem and was paid $50,000 at that
time.
In October 2006, the Company, entered into a letter agreement with
C.K.
Cooper to provide a fairness opinion in connection with respect to
the
Asset Acquisition Agreement, with $25,000 paid upon execution of
the
arrangement and an additional $25,000 due upon closing of the Asset
Acquisition.
|
|
·
|
The
Company entered into a Finders Agreement and a Consulting Agreement
with
Mr. Lance Duncan, an individual with prior affiliations with Tandem,
who
had been given limited authority by Tandem management to act on its
behalf. These agreements are more fully described in Note
6f.
|
b.
Other Business Combinations
The
following acquisitions (the “Other Acquisitions”) made in late 2007 are
reflected in Platinum’s consolidated results of operations for the period from
their respective dates of acquisition and the balance sheet as of December
31,
2007 in accordance with the provisions of SFAS #141, “Business
Combinations”.
|
·
|
In
December 2007, Platinum, through its wholly owned subsidiary, PER
Gulf
Coast, Inc., acquired a 50% working interest in the La Rosa field
for
approximately $5.3 million. Although the La Rosa field is a producing
field of approximately 3,800 acres in Refugio County, Texas, actual
production was minimal. The primary focus of the acquisition is related
to
its recompletion and re-entry potential. The entire purchase price
was
allocated to oil and gas
properties.
|
|
·
|
In
December 2007, Platinum, through its wholly owned subsidiary, Tandem
Energy Corporation, acquired, out of bankruptcy court, oil and gas
properties, including approximately 200 producing wells, located
in
Chavez, Lea and Eddy counties, New Mexico previously owned by Lothian
Oil,
Inc. for $6.9 million. Approximately 55% of the reserves are proved
developed. On the closing date, production was approximately 140
gross
barrels of oil equivalents ( “ boe ” ) per day, and one of the primary
fields is adjacent to the Ballard Field in Eddy County. Approximately
$700,000 of the purchase price was allocated to accounts receivable.
The
balance of the purchase price, $6.2 million, was allocated to oil
and gas
properties.
|
F-16
PLATINUM
ENERGY RESOURCES, INC. AND SUBSIDIARIES
NOTES
TO CONSOLIDATED FINANCIAL STATEMENTS
For
the Years Ended December 31, 2007 and 2006
And
the Period From April 25, 2005 (Inception) to December 31,
2005
Note
4 – Business Combinations - continued
|
·
|
In
December 2007, Platinum, through its wholly owned subsidiary, Tandem
Energy Corporation, acquired an additional 50% working interest in
the
Barnett Shale acreage within the Ball Field for approximately $920,000.
This acquisition increased the net acreage position by 2,300 net
acres and
gave us a 100% working interest in the Barnett Shale. The entire
purchase
price was allocated to oil and gas properties. There is currently
no
production on this lease from the Barnett
Shale.
|
|
|
·
|
In
December 2007, Platinum purchased, for approximately $2.2 million
(including transaction costs), the outstanding stock of Red Iron
Tool,
Inc.( Red Iron). As a result, Red Iron is now a wholly owned subsidiary
of
Platinum. Red Iron owns three pulling units and other service equipment
near TEC’s Ira field in Scurry County, Texas. One of its rigs has been
continuously servicing that field since June, 2007. The other two
have
been under contract by other operators. Additionally, the former
president
of Red Iron, will assist TEC in providing oversight of the Ira
Field. Red Iron may continue to contract the rigs to third party
operators
when not in use on the Company’s properties. Of the acquisition cost,
approximately $1.6 million was allocated to the equipment acquired,
approximately $185,000 in accounts receivable, and approximately
$376,000
was allocated to the former owners 2 year employment agreement, and
non-compete contract. The cost allocated to the contract will be
amortized
over the life of the non-compete of five
years.
|
|
|
·
|
In
December 2007, Platinum purchased through its wholly owned subsidiary,
TEC, a 100% working interest in various producing leases in Scurry
county,
Texas for approximately $300,000. TEC is the operator of these leases
which are located near TEC’s Ira
Unit.
|
The
assets and liabilities of TEC and the other acquisitions were recorded in the
Company’s consolidated balance sheet at their fair values at the date of
acquisition in accordance with the provisions for SFAS # 141, “Business
Combinations”.
F-17
PLATINUM
ENERGY RESOURCES, INC. AND SUBSIDIARIES
NOTES
TO CONSOLIDATED FINANCIAL STATEMENTS
For
the Years Ended December 31, 2007 and 2006
And
the Period From April 25, 2005 (Inception) to December 31,
2005
Note
4 – Business Combinations - continued
The
following details the allocation of the purchase price of the TEC and Other
Acquisitions:
|
|
|
|
|
|||||||
|
Consideration
-
|
TEC
|
Other
Acquisitions
|
Total
|
|||||||
|
Cash
|
$
|
47,344,219
|
$
|
15,518,501
|
$
|
62,862,720
|
||||
|
Equity
instruments (7,692,308 Platinum common shares )
|
60,000,000
|
-
|
60,000,000
|
|||||||
|
|
$
|
107,344,219
|
$
|
15,518,501
|
$
|
122,862,720
|
||||
|
|
||||||||||
|
Recognized
amount of identifiable assets acquired and
|
||||||||||
|
liabilities
assumed -
|
||||||||||
|
Assets
acquired
|
||||||||||
|
Cash
|
$
|
2,959,773
|
$
|
883,655
|
$
|
3,843,428
|
||||
|
Accounts
receivable, net
|
1,923,957
|
-
|
1,923,957
|
|||||||
|
Inventory
|
85,582
|
-
|
85,582
|
|||||||
|
Property
and equipment:
|
||||||||||
|
Oil
and Gas Properties
|
154,881,344
|
13,553,206
|
168,434,550
|
|||||||
|
Other
|
1,381,398
|
1,635,900
|
3,017,298
|
|||||||
|
Covenant
not to compete and other
|
246,169
|
441,140
|
687,309
|
|||||||
|
Real
estate held for development
|
2,700,000
|
-
|
2,700,000
|
|||||||
|
Liabilities
assumed
|
||||||||||
|
Accounts
payable and other
|
(1,983,133
|
)
|
-
|
(1,983,133
|
)
|
|||||
|
Asset
retirement obligations
|
(2,542,881
|
)
|
(995,400
|
)
|
(3,538,281
|
)
|
||||
|
Fair
value of commodity derivatives
|
(4,207,430
|
)
|
-
|
(4,207,430
|
)
|
|||||
|
Deferred
income taxes
|
(48,100,560
|
)
|
-
|
(48,100,560
|
)
|
|||||
|
|
||||||||||
|
Total
identifiable net assets
|
$
|
107,344,219
|
$
|
15,518,501
|
$
|
122,862,720
|
||||
Unaudited
Pro-Forma Financial Information
The
following unaudited pro forma consolidated results of operations assume that
the
acquisitions of the acquired entities as disclosed herein were completed as
of
January 1 for each of the years shown below:
|
Year
Ended December 31,
|
Revenue
|
Income
(Loss) Before Income Taxes
|
Net
Income (Loss)
|
Earnings
(Loss)
Per
Share
|
|||||||||
|
Pro
forma 2007
|
$
|
22,547,000
|
$
|
(7,089,000
|
)
|
$
|
(4,608,000
|
)
|
$
|
(0.19
|
)
|
||
|
|
|||||||||||||
|
Pro
forma 2006
|
$
|
22,298,000
|
$
|
4,791,000
|
$
|
3,114,000
|
$
|
0.13
|
|||||
The
pro
forma combined results are not necessarily indicative of the results that
actually would have occurred if the TEC acquisition and the other acquisitions
had been completed as of the beginning of 2007 or 2006, nor are they necessarily
indicative of future consolidated results. For certain acquisition transactions
for which adequate data was not available, estimates of certain expenses were
used.
F-18
PLATINUM
ENERGY RESOURCES, INC. AND SUBSIDIARIES
NOTES
TO CONSOLIDATED FINANCIAL STATEMENTS
For
the Years Ended December 31, 2007 and 2006
And
the Period From April 25, 2005 (Inception) to December 31,
2005
Note
4 – Business Combinations - continued
Other
Non-Controlling Acquisitions by Platinum
In
November 2007, Platinum, through its wholly owned subsidiary, PER Gulf Coast,
Inc., acquired a non-controlling 12% working interest in the North Minnie Bock
field, a producing field in Nueces County, Texas for approximately $1.1
million. Although the North Minnie Bock field is a producing field of
approximately 3,800 acres, actual production was minimal. The primary focus
of
the acquisition is related to its recompletion and re-entry potential. The
entire purchase price was allocated at fair value to oil and gas
properties.
Note
5 – Note Payable – Stockholder
In
the
year ended December 31, 2006 and 2007, the Company received an aggregate of
$75,000 and $1,032,000, respectively from the proceeds of a note payable to
an
officer and stockholder of the Company. The notes, which bore interest at 5%
per
annum, were repaid upon the consummation of the Asset Acquisition Agreement
on
October 26, 2007.
Note
6 – Commitments
a.
The
Company has engaged Casimir Capital LP (“CCLP”), the representative of the
underwriters, on a non-exclusive basis, as its agent for the solicitation of
the
exercise of the Warrants. To the extent not inconsistent with the guidelines
of
the NASD and the rules and regulations of the SEC, the Company has agreed to
pay
CCLP for bona fide services rendered, a commission equal to 5% of the exercise
price for each warrant exercised more than one year after the date of an
effective prospectus if the exercise was solicited by the underwriters. In
addition to soliciting, either orally or in writing, the exercise of the
warrants, the representative’s services may also include disseminating
information, either orally or in writing, to warrant holders about the Company
or the market for its securities, and assisting in the processing of the
exercise of the warrants. No compensation will be paid to the representative
upon the exercise of the warrants if:
|
|
·
|
the
market price of the underlying shares of common stock is lower than
the
exercise price;
|
|
|
·
|
the
holder of the warrants has not confirmed in writing that the underwriters
solicited the exercise;
|
|
|
·
|
the
warrants are held in a discretionary
account;
|
|
|
·
|
the
warrants are exercised in an unsolicited transaction;
or
|
|
|
·
|
the
arrangement to pay the commission is not disclosed in the prospectus
provided to warrant holders at the time of
exercise.
|
F-19
PLATINUM
ENERGY RESOURCES, INC. AND SUBSIDIARIES
NOTES
TO CONSOLIDATED FINANCIAL STATEMENTS
For
the Years Ended December 31, 2007 and 2006
And
the Period From April 25, 2005 (Inception) to December 31,
2005
Note
6 - Commitments-
continued
b.
On
March 20, 2006, the Board of Directors of the Company approved its 2006
Long-Term Incentive Plan (the “Plan”), which became effective with the
consummation of the Asset Acquisition of TEC and the approval of the
Company’s stockholders. Pursuant to Plan, the Company may grant incentive and
non-qualified stock options, stock appreciation rights, performance units,
restricted stock awards and performance bonuses, or collectively, awards, to
officers and key employees. In addition, the Plan authorizes the grant of
non-qualified stock options and restricted stock awards to directors and to
any
independent contractors and consultants. Generally, all classes of employees
are
eligible to participate in the Plan.
The
Company has reserved a maximum of 4 million shares of its authorized common
stock for issuance upon the exercise of awards to be granted pursuant to the
Plan.
Other
than stock options issuable in connection with the Maverick acquisition
described in Note 15 below, no options, restricted stock or other awards under
the Plan have been made or committed to be made as of the date
hereof.
d.
Leases
The
Company leases office space from third parties under non-cancelable operating
leases that expire October, 2010. The Company also has operating leases for
office equipment. Rental expense pursuant to these facility and equipment leases
amounted to $12,424 for the period from October 27, 2007 through December 31,
2007. In January 2008, the Company expanded its space and extended its lease
maturity. Future minimum annual lease payments, which reflect this modification,
under the non-cancelable lease for the years ending December 31 are as follows:
|
2008
|
$
|
119,269
|
||
|
2009
|
125,410
|
|||
|
2010
|
121,320
|
|||
|
2011
|
80,880
|
|||
|
Thereafter
|
—
|
|||
|
|
$
|
446,879
|
e.
Stock Repurchase Program
In
November 2006, the Company’s board approved a share repurchase program to
repurchase shares of Company common stock in open market transactions in an
amount up to $80 million, following the consummation of a the Asset Acquisition.
On November 1, 2007, the board of directors instituted the initial stage of
this
share repurchase program and established a plan in conformity with the
provisions of Rule 10b5-1 to purchase up to 2,000,000 shares of Platinum common
stock in open market transactions during the month of November 2007, subject
to
the broker, volume, price and timing restrictions of Rule 10b-18 under the
Securities Exchange Act of 1934. Pursuant to the plan, the Company purchased
1,997,913 shares for an aggregate of $15,661,464 in November 2007 under this
stage of the repurchase program. The initial share repurchase plan expired
November 30, 2007, but the Company may resume repurchases in the future,
pursuant to our share repurchase program.
f.
Consulting
Agreement
Mr.
Lance
Duncan, a director and officer of Tandem for a short time from March 2005
through June 1, 2005, introduced Platinum’s management to Tandem, which resulted
in the Asset Acquisition Agreement. As a consequence of his efforts in this
regard, Mr. Duncan was paid a finder’s fee of $3.0 million at the consummation
of the TEC acquisition for introduction of the parties. The Company also entered
into a consulting agreement with Mr. Duncan, the term of which commenced upon
the consummation of the TEC acquisition, for consulting services, including
investigation and evaluation of possible future acquisitions for the Company.
Under the terms of the consulting agreement, the Company valued such services
at
$5 million and agreed to issue to Mr. Duncan a total of 714,286 shares of the
Company’s restricted common stock in consideration over the period of service.
These shares are to be issued in semi-annual installments over the eighteen
month term of the agreement beginning with the closing of the TEC acquisition.
On October 26, 2007, the first installment of 178, 572 irrevocable shares were
issued to Mr. Duncan. The accompanying financial statements for the period
from
October 26, 2007 to December 31, 2007 include stock based compensation expense
in the amount of $1,250,000 associated with these shares.
F-20
PLATINUM
ENERGY RESOURCES, INC. AND SUBSIDIARIES
NOTES
TO CONSOLIDATED FINANCIAL STATEMENTS
For
the Years Ended December 31, 2007 and 2006
And
the Period From April 25, 2005 (Inception) to December 31,
2005
Note
7 – Income Taxes
The
Company utilizes an asset liability approach to determine the extent of any
deferred income taxes, as described in SFAS No. 109, “Accounting for Income
Taxes.” This method gives consideration to the future tax consequences
associated with differences between financial statement and tax bases of assets
and liabilities.
The
provision for income taxes for the year ended December 31, 2007 and 2006 is
comprised of current New Jersey state income taxes.
A
reconciliation of the federal statutory income tax rate to the Company’s
effective tax rate as reported is as follows:
|
|
2007
|
2006
|
|||||
|
Taxes
at federal statutory rate
|
(35.0
|
)%
|
34.0
|
%
|
|||
|
State
income tax net of federal benefit
|
20.0
|
%
|
4.5
|
%
|
|||
|
Non
taxable income - interest
|
(302.0
|
)%
|
(49.1
|
)%
|
|||
|
Non
deductible expenses
|
0.0
|
%
|
1.0
|
%
|
|||
|
Increase
in valuation allowance
|
348.0
|
%
|
16.3
|
%
|
|||
|
Effective
income tax rate
|
31.0
|
%
|
6.7
|
%
|
|||
Significant
components of deferred tax assets and liabilities at December 31, 2007 and
2006
are as follows:
|
|
2007
|
2006
|
|||||
|
Deferred
expenses - start-up costs
|
$
|
384,000
|
$
|
356,000
|
|||
|
Other
|
4,000
|
—
|
|||||
|
Commodity
derivatives
|
1,775,000
|
—
|
|||||
|
Net
operating loss carryforward
|
609,000
|
—
|
|||||
|
Less:
valuation allowance
|
(1,366,000
|
)
|
(356,000
|
)
|
|||
|
|
1,406,000
|
—
|
|||||
|
Difference
between fair value of assets acquired and tax basis
|
(49,491,000
|
)
|
—
|
||||
|
|
|||||||
|
Net
deferred tax assets (liabilities)
|
$
|
(48,085,000
|
)
|
$
|
—
|
||
At
December 31, 2007. the Company did not record an income tax credit for its
net
operating losses and other temporary differences because it is more likely
than
not that these will not be realizable based upon the results of operations
for
2008. The Company has recorded a full valuation allowance against its net
deferred tax assets at December 31, 2006 since management believes that based
upon available objective evidence it is more likely than not that the deferred
tax assets at December 31, 2006 will not be realized.
The
valuation allowance for deferred tax assets increased by approximately
$1,010,000 for the year ended December 31, 2007 and by approximately $292,000
for the period ended December 31, 2006.
F-21
PLATINUM
ENERGY RESOURCES, INC. AND SUBSIDIARIES
NOTES
TO CONSOLIDATED FINANCIAL STATEMENTS
For
the Years Ended December 31, 2007 and 2006
And
the Period From April 25, 2005 (Inception) to December 31,
2005
Note
9 – Long-Term Debt
In
connection with the TEC asset acquisition on October 26, 2007, TEC assigned
its
rights and obligations under the Credit Agreement to Platinum’s wholly-owned
subsidiary, New TEC. An Assignment, Waiver and Third Amendment to Credit
Agreement (the “Third Amendment”) was made and entered into effective as of
October 26, 2007 among TEC, New TEC and the lender. Pursuant to the Third
Amendment, a new borrowing base was set at $5 million. All other material terms
of the Credit Agreement remained unchanged. All outstanding borrowings under
the
Credit Agreement in the principal amount of $20,500,000 were paid off at the
closing of the Acquisition. Accordingly there are no outstanding borrowings
under the Credit Agreement at December 31, 2007, nor were there any outstanding
balances in the period October 26, 2007 through December 31, 2007.
As
more
fully described in Note 14, on March 14, 2008, two operating subsidiaries of
the
Company, Tandem Energy Corporation and PER Gulf Coast, Inc. entered into a
new
credit facility with an initial borrowing base of $35 million.
Note
10 – Marketing Arrangements, Segment Information and Major
Customers
The
Company considers itself to be in one line of business, as an independent oil
and gas exploration and production company.
The
Company sells substantially all of its crude oil production under short-term
contracts based on prices quoted on the New York Mercantile Exchange (“NYMEX”)
for spot West Texas Intermediate contracts, less agreed-upon deductions which
vary by grade of crude oil.
The
majority of the Company’s natural gas production is sold under short-term
contracts based on pricing formulas which are generally market responsive.
From
time to time, The Company may also sell a portion of the gas production under
short-term contracts at fixed prices. The Company believes that the loss of
any
of its oil and gas purchasers would not have a material adverse effect on its
results of operations due to the availability of other purchasers.
For
the
period from October 27, 2007 to December 31, 2007, two customers accounted
for
approximately 48% and 16% of New TEC’s crude oil and natural gas revenues. The
Company believes that the loss of any of its significant customers would not
create a financial risk as the Company's oil and gas production can be sold
to
others at similar prices.
Note
11 – Price, Interest Rate and Credit Risk Management
Activities
Price
and Interest Rate Risks
The
Company engages in price risk management activities from time to time. These
activities are intended to manage the Company’s exposure to fluctuations in
commodity prices for natural gas and crude oil. The Company utilizes derivative
financial instruments, primarily price collars, puts and calls, as the means
to
manage this price risk. In addition to these financial transactions, the Company
is a party to various physical commodity contracts for the sale of hydrocarbons
that cover varying periods of time and have varying pricing provisions. Under
SFAS No. 133, Accounting
for Derivative Instruments and Hedging Activities,
as
amended by SFAS Nos. 137, 138 and 149, these various physical commodity
contracts qualify for the normal purchases and normal sales exception and
therefore, are not subject to hedge accounting or mark-to-market accounting.
The
financial impact of these various physical commodity contracts is included
in
revenues at the time of settlement, which in turn affects average realized
hydrocarbon prices. The Company has elected not to designate any of its
derivative financial contracts as accounting hedges and, accordingly, has
accounted for these derivative financial contracts using mark-to-market
accounting. For the period from October 26, 2007 to December 31, 2007, the
Company recognized losses on its hedging activities of $1.5
million.
F-22
PLATINUM
ENERGY RESOURCES, INC. AND SUBSIDIARIES
NOTES
TO CONSOLIDATED FINANCIAL STATEMENTS
For
the Years Ended December 31, 2007 and 2006
And
the Period From April 25, 2005 (Inception) to December 31,
2005
Note
11 – Price, Interest Rate and Credit Risk Management Activities -
continued
Presented
below is a summary of the Company’s crude oil and natural gas derivative
financial contracts at December 31, 2007, with crude oil prices expressed in
dollars per barrels of crude oil and notional crude oil volumes in barrels
of
crude oil per year; and natural gas prices expressed in dollars per million
British thermal units ($/MMBtu) and notional natural gas volumes in million
British thermal units per year (MMBtuy). As indicated, The Company does not
have
any financial derivative contracts that extend beyond December
2011.
The
Company accounts for its financial derivative contracts using mark-to-market
accounting. The total fair value of the crude oil and natural gas financial
derivative contracts at December 31, 2007, was a liability of approximately
$3.0 million. The purchase of TEC’s assets, as more fully described in Note
3, includes the derivative contracts and the associated liabilities described
herein.
|
Period
|
|
Instrument
Type
|
|
Total
Volumes (MMBTU/BBL)
|
|
Weighted
Average (Floor/Ceiling)
|
|
Fair
Value Asset/ (Liability) (stated in thousands)
|
||
|
2008
|
|
Gas
Collar
|
|
64,615
|
|
$ 5.00/11.02
|
|
|
$
(25)
|
|
|
|
|
Gas
Call Option Sold
|
|
64,615
|
|
9.10
|
|
|
(128)
|
|
|
|
|
Gas
Call Option Purchased
|
|
64,615
|
|
12.00
|
|
|
36
|
|
|
|
|
Gas
Put Option Sold
|
|
64,615
|
|
5.00
|
|
|
(11)
|
|
|
|
|
Gas
Put Option Purchased
|
|
64,615
|
|
6.00
|
|
|
46
|
|
|
|
|
Oil
Collar
|
|
113,502
|
|
40.00/72.10
|
|
|
(2,455)
|
|
|
|
|
Oil
Call Option Sold
|
|
125,000
|
|
67.00
|
|
|
(3,282)
|
|
|
|
|
Oil
Call Option Purchased
|
|
125,000
|
|
72.10
|
|
|
2,703
|
|
|
|
|
|
|
|
|
|
|
|
||
|
2009
|
|
Oil
Swaps
|
|
120,000
|
|
71.00
|
|
|
(1,928)
|
|
|
|
|
|
|
|
|
|
|
|
|
|
|
2010
|
|
Oil
Put Option Purchased
|
|
120,000
|
|
75.00
|
|
|
1,015
|
|
|
|
|
|
|
|
|
|
|
|
|
|
|
2011
|
|
Oil
Put Option Purchased
|
|
120,000
|
|
80.00
|
|
|
986
|
|
|
|
Total
fair value liability
|
|
|
|
|
$
(3,043)
|
||||
The
fair
value of the Company’s financial derivative contracts at December 31, 2007 are
shown in the accompanying financial statements as follows (in thousands):
|
Fair
value of commodity derivative:
|
|
|
|
|
|
|
$
|
(3,116
|
)
|
|
|
Long-term
portion
|
|
|
73
|
|
|
Total
fair value liability
|
|
$
|
(3,043
|
)
|
The
natural gas and crude oil prices shown in the above table are based on the
corresponding NYMEX index and have been valued using actively quoted prices
and
quotes obtained from the counterparties to the derivative agreements. The above
prices represent a weighted average of several contracts entered into and are
on
a per MMBtu or per barrel basis for gas and oil derivatives, respectively.
Total
volumes shown for the crude oil collar reflect net volumetric positions with
a
single counterparty under which contracts provide for netting of all settlement
amounts.
F-23
PLATINUM
ENERGY RESOURCES, INC. AND SUBSIDIARIES
NOTES
TO CONSOLIDATED FINANCIAL STATEMENTS
For
the Years Ended December 31, 2007 and 2006
And
the Period From April 25, 2005 (Inception) to December 31,
2005
Note
11 – Price, Interest Rate and Credit Risk Management Activities -
continued
The
following table summarizes the estimated fair value of financial instruments
and
related transactions at December 31, 2007 (in millions):
|
|
Carrying
Amount
|
Estimated
Fair
Value (1)
|
|||||
|
NYMEX-Related
Commodity Derivative
|
|
|
|||||
|
Market
Positions (1)
|
$
|
3.0
|
$
|
3.0
|
|||
|
(1)
|
Estimated
fair values have been determined by using available market data and
valuation methodologies. Judgment is required in interpreting market
data
and the use of different market assumptions or estimation methodologies
may affect the estimated fair value
amounts.
|
Note
12 – Oil and Gas Properties
As
described in Note 4,
all of
the Company’s oil and gas properties were purchased during the year ended
December 31, 2007.
The
following table sets forth the Company’s costs incurred in oil and gas property
acquisition, exploration and development activities for the period from October
26, 2007 through December 31, 2007:
|
Acquisition
of properties
|
|
|||
|
Proved
|
$
|
169,214,135
|
||
|
Unproved
|
-
|
|||
|
|
||||
|
Exploration
Costs
|
-
|
|||
|
|
||||
|
Development
Costs
|
1,380,167
|
|||
|
|
||||
|
|
$
|
170,594,302
|
||
PLATINUM
ENERGY RESOURCES, INC. AND SUBSIDIARIES
NOTES
TO CONSOLIDATED FINANCIAL STATEMENTS
For
the Years Ended December 31, 2007 and 2006
And
the Period From April 25, 2005 (Inception) to December 31,
2005
Note
12 – Oil and Gas Properties - continued
The
following table sets forth the Company’s capitalized costs relating to oil and
gas producing activities at December 31, 2007:
|
Proved
oil and gas properties
|
$
|
170,594,302
|
||
|
|
||||
|
Unproved
oil and gas properties
|
-
|
|||
|
|
170,594,302
|
|||
|
|
||||
|
Accumulated
depletion
|
(1,227,000
|
)
|
||
|
|
||||
|
Net
capitalized costs
|
$
|
169,367,302
|
Note
13 – Oil and Gas Reserve Information (Unaudited)
The
estimates of proved oil and gas reserves utilized in the preparation of the
consolidated financial statements were prepared by Williamson Petroleum
Consultants (Williamson), independent petroleum engineers, and by the Company’s
reservoir engineer. The portion of the total reserves evaluated by Williamson
on
a Boe basis was approximately 94.1%, and on a standardized measure of future
net
cash flows basis was approximately 94.4%. The reserves engineered by the
Company’s reservoir engineer are related to the proved undeveloped reserves
associated with the Lothian acquisition, more fully discussed in Note 4, which
was consummated on December 28, 2007. Williamson’s report contains the reserves
associated with the proved developed producing portion of the Lothian
acquisition, but because the purchase took place so late in the year, Williamson
did not have time to evaluate the validity of the proved undeveloped reserves.
There was no disagreement as to the existence of the reserves; merely that
Williamson did not have the time to evaluate the estimate. The Company,
therefore, felt it important to include the proved undeveloped reserves, since
a
significant portion of the basis for the purchase was associated with the proved
undeveloped reserves. Both such estimates were made in accordance with
guidelines established by the Securities and Exchange Commission and the
Financial Accounting Standards Board, which require that reserve reports be
prepared under economic and operating conditions existing at the registrant’s
year end with no provision for price and cost escalations except by contractual
arrangements. Future cash inflows were computed by applying year-end prices
to
the year-end quantities of proved reserves. Future development, abandonment
and
production costs were computed by estimating the expenditures to be incurred
in
developing, producing, and abandoning proved oil and gas reserves at the end
of
the year, based on year-end costs. Future income taxes were computed by applying
statutory tax rates to the estimated net pre-tax cash flows after consideration
of tax basis and tax credits and carryforwards. All of the Company’s reserves
are located in the United States. For information about the Company’s results of
operations from oil and gas producing activities, see the accompanying
consolidated statements of operations.
In
accordance with Rule 4-10(a) of SEC Regulation S-X, proved oil and gas reserves
are the estimated quantities of crude oil, natural gas, and natural gas liquids
which geological and engineering data demonstrate with reasonable certainty
to
be recoverable in future years from known reservoirs under existing economic
and
operating conditions, i.e., prices and costs as of the date the estimate is
made. Prices include consideration of changes in existing prices provided only
by contractual arrangements, but not on escalations based upon future
conditions.
F-25
PLATINUM
ENERGY RESOURCES, INC. AND SUBSIDIARIES
NOTES
TO CONSOLIDATED FINANCIAL STATEMENTS
For
the Years Ended December 31, 2007 and 2006
And
the Period From April 25, 2005 (Inception) to December 31,
2005
Note
13 – Oil and Gas Reserve Information (Unaudited) -
continued
(1)
Reservoirs are considered proved if economic producibility is supported by
either actual production or conclusive formation test. The area of a reservoir
considered proved includes (A) that portion delineated by drilling and defined
by gas-oil and/or oil-water contacts, if any, and (B) the immediately adjoining
portions not yet drilled, but which can be reasonably judged as economically
productive on the basis of available geological and engineering data. In the
absence of information on fluid contacts, the lowest known structural occurrence
of hydrocarbons controls the lower proved limit of the reservoir.
(2)
Reserves which can be produced economically through application of improved
recovery techniques (such as fluid injection) are included in the proved
classification when successful testing by a pilot project, or the operation
of
an installed program in the reservoir, provides support for the engineering
analysis on which the project or program was based.
(3)
Estimates of proved reserves do not include the following: (A) oil that may
become available from known reservoirs but is classified separately as indicated
additional reserves; (B) crude oil, natural gas, and natural gas liquids, the
recovery of which is subject to reasonable doubt because of uncertainty as
to
geology, reservoir characteristics, or economic factors; (C) crude oil, natural
gas, and natural gas liquids, that may occur in undrilled prospects; and
(D) crude oil, natural gas, and natural gas liquids, that may be recovered
from
oil shales, coal, gilsonite and other such sources.
The
Company emphasizes that reserve estimates are inherently imprecise. Accordingly,
the estimates are expected to change as more current information becomes
available. In addition, a portion of the Company’s proved reserves are
classified as proved developed non-producing and proved undeveloped, which
increases the imprecision inherent in estimating reserves which may ultimately
be produced.
The
following table sets forth proved oil and gas reserves together with the changes
therein and proved developed reserves (oil in Bbls, gas in Mcf, gas converted
to
Boe’s at six Mcf per Bbl) for the year ended December 31, 2007. (in thousands):
F-26
PLATINUM
ENERGY RESOURCES, INC. AND SUBSIDIARIES
NOTES
TO CONSOLIDATED FINANCIAL STATEMENTS
For
the Years Ended December 31, 2007 and 2006
And
the Period From April 25, 2005 (Inception) to December 31,
2005
Note
13 – Oil and Gas Reserve Information (Unaudited) -
continued
The
following table sets forth standardized measure of discounted future net cash
flows (stated in thousands) relating to proved reserves for the year ended
December 31, 2007:
|
|
2007
|
|||
|
|
(in
thousands)
|
|||
|
Future
cash inflows
|
$
|
755,292
|
||
|
Future
costs:
|
||||
|
Production
|
(188,072
|
)
|
||
|
Abandonment
|
(13,735
|
)
|
||
|
Development
|
(54,692
|
)
|
||
|
Income
taxes
|
(177,440
|
)
|
||
|
Future
net cash inflows
|
321,353
|
|||
|
10%
discount factor
|
(150,331
|
)
|
||
|
Standardized
measure of discounted net cash flows
|
$
|
171,022
|
||
Impact
of Pricing
The
estimates of cash flows and reserve quantities shown above are based on year-end
oil and gas prices, except in those cases where future natural gas or oil sales
are covered by physical contracts at specified prices. Forward price volatility
is largely attributable to supply and demand perceptions for natural gas and
crude oil.
Under
full-cost accounting rules, the Company reviews the carrying value of its proved
oil and gas properties each quarter. Under these rules, capitalized costs of
proved oil and gas properties, net of accumulated DD&A and deferred income
taxes, may not exceed the present value of estimated future net cash flows
from
proved oil and gas reserves, discounted at 10%, plus the lower of cost or fair
value of unproved properties included in the costs being amortized, net of
related tax effects (the “ceiling”). These rules generally require pricing
future oil and gas production at the unescalated oil and gas prices at the
end
of each fiscal quarter and require a write-down if the “ceiling” is exceeded.
Given the volatility of oil and gas prices, it is reasonably possible that
the
Company’s estimate of discounted future net cash flows from proved oil and gas
reserves could change in the near term. If oil and gas prices decline
significantly, even if only for a short period of time, it is possible that
write-downs of oil and gas properties could occur in the future.
The
estimated present value of future cash flows relating to proved reserves is
extremely sensitive to prices used at any measurement period. The average prices
used for each commodity for the year ended December 31, 2007 were as
follows:
|
|
Average
Prices
|
||||||
|
As
of December 31,
|
Oil
|
Gas
|
|||||
|
2007
|
$
|
92.44
|
$
|
7.02
|
|||
F-27
PLATINUM
ENERGY RESOURCES, INC. AND SUBSIDIARIES
NOTES
TO CONSOLIDATED FINANCIAL STATEMENTS
For
the Years Ended December 31, 2007 and 2006
And
the Period From April 25, 2005 (Inception) to December 31,
2005
Note
14 – Litigation
On January
16, 2008, Exxon Mobil Corporation filed a petition in the 270 th
District
Court of Harris County, Texas, naming TEC and a third party, Merenco Realty,
Inc., demanding environmental remediation of certain properties in
Tomball, Texas. In 1996, pursuant to an assignment agreement, Exxon Mobil sold
certain oil and gas leasehold interests and real estate interests in Tomball,
Texas to TEC’s predecessor in interest, Merit Energy Corporation. In 1999, TEC
assigned its 50% undivided interest in one of the tracts in the acquired
property to Merenco, an affiliate of TEC, owned 50% by our chairman of the
board, Tim Culp. In October 2007, the Texas Railroad Commission notified Exxon
Mobil of an environmental site assessment alleging soil and groundwater
contamination for a site in the area of Tomball, Texas. Exxon Mobil believes
that the site is one which was sold to TEC and claims that TEC is obligated
to
remediate the site under the assignment agreement. Exxon Mobil has requested
that the court declare the defendants obligated to restore and remediate the
properties and has requested any actual damages arising from breach and
attorneys’ fees. The Company believes that Exxon Mobil’s claim that TEC is
responsible for any remediation of such site is without merit and we intend
to
vigorously defend ourselves against this claim. However, no assurance can be
given that we will prevail in this matter. Platinum acquired substantially
all
the assets and liabilities of TEC in the TEC acquisition. Merenco was not
acquired by Platinum in the TEC acquisition and Platinum’s chairman, Tim Culp,
continues to have a 50% ownership interest in Merenco.
Note
15 – Subsequent Events
a.
In
January 2008, the Company acquired a 70% working interest in the Pleasanton
field for approximately $5.5 million. $2.5 million of the $5 million purchase
price is recorded as a Deposit on the December 31, 2007 balance sheet. The
remainder of the purchase price was paid in January 2008. The Pleasanton Field
is a non-producing field of approximately 4,200 acres in Atascosa County, Texas.
The field contains previously drilled and abandoned wells. The final purchase
price is subject to normal closing adjustments and to adjustments arising from
indemnification provisions of the agreement.
b.
On
March 18, 2008, the Company, Maverick Engineering, Inc. (“Maverick”) and Robert
L. Kovar Services, LLC entered into an Agreement and Plan of Merger (the “Merger
Agreement”) for a gross purchase price of $11 million, subject to a working
capital purchase price adjustment, with $6 million paid at closing and the
remaining $5 million to be paid over the next 6 years pursuant to a non-interest
bearing note (the “Cashflow Notes”). In addition, the Company will assume
Maverick’s indebtedness under certain bank and loan arrangements, which
aggregate balances approximated $4.5 million at January 31, 2008. Maverick’s
bank has not consented to continue of its bank term loan or to its working
capital revolving credit line upon closing. Rober L. Kovar has agreed to
personally assume the indebtedness under the bank term loan, which approximated
$ 1.67 million as of January 31, 2008. Maverick shareholders, as represented
by
Robert L. Kovar Services, LLC, have agreed to the reduction of the $6 million
intended to be paid at closing by the outstanding balance on the line of credit
on the closing date, which approximated $1.97 million on January 31, 2008 in
the
event that a replacement line of credit is not in place on the closing date.
These proceeds would be used to payoff its bank obligation under the revolving
line of credit. Upon obtaining a replacement line of credit, such withheld
amounts would be paid to Robert L. Kovar Services, LLC for distribution to
the
selling Maverick shareholders. The Cashflow Notes will be payable quarterly
at
the rate of 50% of pre-tax net income, as it is defined in the Merger Agreement,
generated by the Maverick business on a standalone basis in the preceding
quarter. Payment can be accelerated by certain events, including change in
control. The purchase price also subject to adjustment for any change in working
capital as defined in the agreement, between October 31, 2007 and the closing
date, as well as other adjustments associated with changes in indebtedness.
Any
adjustment will be treated as a modification of the amount of the Cashflow
Notes. The balance of the Cashflow Notes remaining unpaid upon maturity, if
any,
will be converted into a 12 month self amortizing note bearing interest at
the
annual rate of 2% over the banks prime rate. Established in 1993, Maverick
is a
full-service engineering service company with 270 employees including a staff
of
70 engineers, consultants, surveyors, scientists and planners. Maverick is
a provider of project management, engineering, procurement, and
construction management services to both the public and private sectors.
Maverick is based in South Texas with offices in Corpus Christi, Victoria,
Harlingen and Houston. In connection with the transaction, the Company will
enter into an five year employment agreement with Robert Kovar, the founder
and
CEO of Maverick, pursuant to which he will join Platinum as its Chief Operating
Officer in addition to continuing as CEO and President of Maverick. In
connection with his employment agreement Mr. Kovar will receive base annual
compensation of $200,000 and stock options to purchase 250,000 shares of Company
common stock over that 5 year period. Mr. Kovar’s responsibilities will include
oversight of all operations, including engineering, drilling, and
production.
F-28
PLATINUM
ENERGY RESOURCES, INC. AND SUBSIDIARIES
NOTES
TO CONSOLIDATED FINANCIAL STATEMENTS
For
the Years Ended December 31, 2007 and 2006
And
the Period From April 25, 2005 (Inception) to December 31,
2005
Note
15 – Subsequent Events - continued
c.
On
March 14, 2008, two operating subsidiaries of the Company, New TEC and PER
Gulf
Coast, Inc. (collectively the “Co-borrowers”) entered into a new credit facility
with the Bank of Texas (the “Bank”) establishing a revolving line of credit with
an initial borrowing base of $35 million. The revolving line of credit is
secured by the Co-borrower’s oil and gas properties and will be used to
facilitate the execution of the two entities’ drilling and acquisition programs.
The line bears interest at either the Bank’s base rate or LIBOR, plus a margin
which varies with the ratio of the Co-borrower’s outstanding borrowings against
the defined borrowing base, ranging from 1.5% to 2.25 % The Co-borrower’s can
choose periodically to change the interest rate base which applies to
outstanding borrowings. Under the terms of revolving line of credit agreement,
the Co-borrowers must maintain certain financial ratios, must repay any amounts
due in excess of the borrowing base, and may not declare any dividends or enter
into any transactions resulting in a change in control, without the Bank’s
consent. The Company, as the parent company, is not a co-borrower or guarantor
of the line, and transfers from the co-borrowers to the parent company are
limited to (i) $1 million per fiscal year to the parent for management fees,
and
(ii) the repayment of up to $2 million per fiscal year in subordinate
indebtedness owed to the parent. As of March 18, there was $5.5 million
outstanding under the revolving line of credit. In conjunction with the
execution of the new line of credit and as required under the terms of the
new
credit facility, the Company novated its existing hedge positions from its
existing counterparty’s over to the Bank under terms satisfactory to the
Company. In connection with establishing the line of credit, the Bank received
a
commitment fee of $87,500 and a fee of $60,229 for its expenses in connection
with the aforementioned novation. In addition, the Co-borrowers are obligated
to
the bank for a monthly fee of any unused portion of the line of credit at the
rate of 0.25% per annum.
In
conjunction with and simultaneous to the establishment of the new Bank credit
facility, the previously existing $5 million line of credit with another bank
was terminated. No outstanding borrowings existed at the time of the termination
of this previous arrangement.
Note
16 – Quarterly Financial Data (Unaudited)
The
following table sets forth certain unaudited quarterly results of operations
for
each of the quarters in the years ended December 31, 2007 and 2006. The
operating results for any quarter are not necessarily indicative of the results
for any future period.
|
Year
ended December 31, 2007
|
1st
Quarter
|
2nd
Quarter
|
3rd
Quarter
|
4th
Quarter
|
|||||||||
|
Total
revenue
|
$
|
—
|
$
|
—
|
$
|
—
|
$
|
4,308,184
|
|||||
|
Lease
and other operating expenses (a)
|
—
|
—
|
—
|
3,067,631
|
|||||||||
|
Gross
profit
|
—
|
—
|
—
|
1,240,553
|
|||||||||
|
|
|||||||||||||
|
Net
income (loss)
|
$
|
497,865
|
$
|
578,843
|
615,974
|
(2,065,714
|
)
|
||||||
|
|
|||||||||||||
|
Per
share amounts:
|
|||||||||||||
|
Net
earnings (loss) - Basic:
|
$
|
.03
|
$
|
.04
|
$
|
.04
|
$
|
(.10
|
)
|
||||
|
Net
earnings (loss) - Diluted:
|
$
|
.03
|
$
|
.03
|
$
|
.03
|
$
|
(.10
|
)
|
||||
F-29
PLATINUM
ENERGY RESOURCES, INC. AND SUBSIDIARIES
NOTES
TO CONSOLIDATED FINANCIAL STATEMENTS
For
the Years Ended December 31, 2007 and 2006
And
the Period From April 25, 2005 (Inception) to December 31,
2005
|
Year
ended December 31, 2006
|
1st
Quarter
|
2nd
Quarter
|
3rd
Quarter
|
4th
Quarter
|
|||||||||
|
(a)
|
|
|
|
||||||||||
|
|
|
|
|
|
|||||||||
|
Total
revenue
|
$
|
—
|
$
|
—
|
$
|
—
|
$
|
—
|
|||||
|
Gross
profit
|
—
|
—
|
—
|
—
|
|||||||||
|
Net
income
|
$
|
231,228
|
$
|
456,336
|
$
|
502,675
|
$
|
469,440
|
|||||
|
|
|||||||||||||
|
Per
share amounts:
|
|||||||||||||
|
Net
earnings - Basic:
|
$
|
.02
|
$
|
.03
|
$
|
.03
|
$
|
.03
|
|||||
|
Net
earnings - Diluted:
|
$
|
.01
|
$
|
.03
|
$
|
.03
|
$
|
.03
|
|||||
|
(a)
|
Includes
depletion, depreciation and amortization expense of
$1,291,384.
|
|
|
|
|
(b)
|
Income
(loss) per share for the each year may not equal the sum of quarterly
income (loss) per share due to changes in average share
calculations.
|
F-30
|
PLATINUM
ENERGY RESOURCES, INC. AND SUBSIDIARIES
|
|||||||
|
CONDENSED
CONSOLIDATED BALANCE SHEETS
|
|||||||
|
|
|||||||
|
March
31,
|
December
31,
|
||||||
|
2008
|
2007
|
||||||
|
(Unaudited)
|
*
|
||||||
|
ASSETS
|
|||||||
|
CURRENT
ASSETS
|
|||||||
|
Cash
and cash equivalents
|
$
|
15,061,586
|
$
|
16,429,619
|
|||
|
Accounts
receivable, net
|
|||||||
|
Oil
and gas sales
|
4,382,657
|
2,619,363
|
|||||
|
Affililiates
and other
|
586,034
|
668,216
|
|||||
|
Inventory
|
152,932
|
88,556
|
|||||
|
Prepaid
expenses and other current assets
|
835,617
|
299,445
|
|||||
|
|
|||||||
|
Total
Current Assets
|
21,018,826
|
20,105,199
|
|||||
|
Property
and equipment, at cost
|
|||||||
|
Oil
and gas properties, full cost method
|
180,713,481
|
170,571,663
|
|||||
|
Other
|
3,706,676
|
3,293,108
|
|||||
|
Less
accumulated depreciation, depletion and amortization
|
(3,297,507
|
)
|
(1,253,026
|
)
|
|||
|
Property
and equipment, net
|
181,122,650
|
172,611,745
|
|||||
|
Other
assets
|
|||||||
|
Fair
value of commodity derivatives
|
807,750
|
73,446
|
|||||
|
Advance
payment and costs, acquisition transactions
|
218,870
|
2,522,639
|
|||||
|
Covenant
not to compete, net
|
357,356
|
376,164
|
|||||
|
Real
estate held for development
|
2,700,000
|
2,700,000
|
|||||
|
|
|||||||
|
Total
Assets
|
$
|
206,225,452
|
$
|
198,389,193
|
|||
|
LIABILITIES
AND STOCKHOLDERS' EQUITY
|
|||||||
|
CURRENT
LIABILITIES
|
|||||||
|
Accounts
payable
|
|||||||
|
Trade
|
$
|
2,425,547
|
$
|
1,132,725
|
|||
|
Oil
and gas sales
|
1,462,200
|
1,074,222
|
|||||
|
Fair
value of commodity derivatives
|
3,804,669
|
3,116,542
|
|||||
|
Asset
retirement obligation - current
|
186,545
|
186,545
|
|||||
|
Accrued
liabilities and other
|
413,445
|
181,430
|
|||||
|
Income
taxes payable
|
101,960
|
254,960
|
|||||
|
Acquisition
note payable - current portion
|
300,000
|
--
|
|||||
|
Total
Current Liabilities
|
8,694,366
|
5,946,424
|
|||||
|
Revolving
bank line of credit
|
5,508,767
|
--
|
|||||
|
Acquisition
note payable
|
250,000
|
--
|
|||||
|
Asset
retirement obligation
|
3,720,161
|
3,390,094
|
|||||
|
Deferred
income taxes
|
48,085,215
|
48,085,215
|
|||||
|
57,564,143
|
51,475,309
|
||||||
|
COMMITMENTS
AND CONTINGENCIES
|
|||||||
|
STOCKHOLDERS'
EQUITY
|
|||||||
|
Preferred
stock, $.0001 par value, 1,000,000 authorized, 0 issued
|
--
|
--
|
|||||
|
Common
stock, $.0001 par value; 75,000,000 shares authorized; 24,068,675
issued;
22,070,762 outstanding
|
2,407
|
2,407
|
|||||
|
Additional
paid-in capital
|
155,064,142
|
155,064,142
|
|||||
|
Retained
earnings
|
561,858
|
1,562,375
|
|||||
|
Treasury
stock - 1,997,913 shares
|
(15,661,464
|
)
|
(15,661,464
|
)
|
|||
|
Total
Stockholders' Equity
|
139,966,943
|
140,967,460
|
|||||
|
Total
Liabilities and Stockholders' Equity
|
$
|
206,225,452
|
$
|
198,389,193
|
|||
*
Condensed from audited consolidated financial statements
See
notes
to condensed consolidated fianncial statements
F-31
|
PLATINUM
ENERGY RESOURCES, INC. AND SUBSIDIARIES
|
|||||||
|
CONDENSED
CONSOLIDATED STATEMENTS OF OPERATIONS
|
|||||||
|
Three
Months Ended March 31,
|
|||||||
|
2008
|
2007
|
||||||
|
(Unaudited)
|
|||||||
|
Revenues
|
|||||||
|
Oil
and Gas Sales
|
$
|
7,134,804
|
$
|
--
|
|||
|
Costs
and expenses
|
|||||||
|
Lease
and other operating expense
|
2,456,306
|
--
|
|||||
|
Marketing,
general and administrative expense
|
1,731,827
|
154,991
|
|||||
|
Depreciation,
depletion and amortization expense
|
2,063,289
|
--
|
|||||
|
Accretion
of asset retirement obligations
|
61,669
|
--
|
|||||
|
Total
costs and expenses
|
6,313,091
|
154,991
|
|||||
|
Operating
income (loss)
|
821,713
|
(154,991
|
)
|
||||
|
OTHER
INCOME (EXPENSES)
|
|||||||
|
Interest
income, net of interest allocated to common stock subject to
possible
redemption of $0 and $177,120, respectively
|
104,387
|
708,925
|
|||||
|
Interest
expense
|
(13,805
|
)
|
(18,069
|
)
|
|||
|
Loss
on commodity derivatives, including realized loss of
1,073,535
|
(2,035,923
|
)
|
--
|
||||
|
Other
|
69,111
|
--
|
|||||
|
Total
other income (expense)
|
(1,876,230
|
)
|
690,856
|
||||
|
Income
(Loss) Before Income Taxes
|
(1,054,517
|
)
|
535,865
|
||||
|
Provision
(Benefit) For Income Taxes
|
(54,000
|
)
|
38,000
|
||||
|
Net
Income (Loss)
|
$
|
(1,000,517
|
)
|
$
|
497,865
|
||
|
WEIGHTED
AVERAGE NUMBER OF COMMON SHARES:
|
|||||||
|
Basic
|
22,070,762
|
15,121,440
|
|||||
|
Diluted
|
22,070,762
|
17,731,897
|
|||||
|
NET
INCOME (LOSS) PER COMMON SHARE:
|
|||||||
|
Basic
|
$
|
(0.05
|
)
|
$
|
0.03
|
||
|
Diluted
|
$
|
(0.05
|
)
|
$
|
0.03
|
||
See
notes to condensed consolidated financial statements
F-32
|
PLATINUM
ENERGY RESOURCES, INC. AND SUBSIDIARIES
|
|
|||||||||||||||||||||
|
CONDENSED
CONSOLIDATED STATEMENT OF STOCKHOLDERS’ EQUITY
|
|
|||||||||||||||||||||
|
Three
Months Ended March 31, 2008
|
|
|||||||||||||||||||||
|
(Unaudited)
|
|
|||||||||||||||||||||
|
|
|
|
|
|
|
|
|
|
|
|
|
|
|
|
|
|||||||
|
|
|
Common
Stock
|
|
Additional
Paid-in
|
|
Retained
|
|
Treaury
Stock
|
|
Total
Stockholders'
|
|
|||||||||||
|
|
|
Shares
|
|
Amount
|
|
Capital
|
|
Earnings
|
|
Shares
|
|
Amount
|
|
Equity
|
||||||||
|
Balance
at January 1, 2008
|
24,068,675
|
$
|
2,407
|
$
|
155,064,142
|
$
|
1,562,375
|
(1,997,913
|
)
|
$
|
(15,661,464
|
)
|
$
|
140,967,460
|
||||||||
|
Net
loss for the three months ended March 31, 2008
|
--
|
--
|
--
|
(1,000,517
|
)
|
--
|
--
|
(1,000,517
|
)
|
|||||||||||||
|
Balance
at March 31, 2008
|
24,068,675
|
$
|
2,407
|
$
|
155,064,142
|
$
|
561,858
|
(1,997,913
|
)
|
$
|
(15,661,464
|
)
|
$
|
139,966,943
|
||||||||
See
notes to condensed consolidated financial statements
F-33
|
PLATINUM
ENERGY RESOURCES, INC. AND SUBSIDIARIES
|
|||||||
|
CONDENSED
CONSOLIDATED STATEMENTS OF CASH FLOWS
|
|||||||
|
(Unaudited)
|
|||||||
|
Three
Months Ended March 31,
|
|
||||||
|
|
|
2008
|
|
2007
|
|||
|
Cash
Flows From Operating Activities
|
|||||||
|
Net
income (loss)
|
$
|
(1,000,517
|
)
|
$
|
497,865
|
||
|
Adjustments
to reconcile net income (loss) to net cash provided by operating
activities:
|
|||||||
|
Depreciation,
depletion and amortization
|
2,044,481
|
--
|
|||||
|
Accretion
of asset retirement obligation
|
61,669
|
--
|
|||||
|
Amortization/writeoff
of bank loan fees
|
18,808
|
--
|
|||||
|
Change
in fair value of derivatives
|
2,035,923
|
--
|
|||||
|
Changes
in operating assets and liabilities:
|
|||||||
|
Accounts
receivable
|
(1,681,112
|
)
|
--
|
||||
|
Inventory
|
(64,376
|
)
|
--
|
||||
|
Prepaid
expenses and other current assets
|
(536,172
|
)
|
24,186
|
||||
|
Accounts
payable
|
1,680,801
|
(78,865
|
)
|
||||
|
Accrued
liabilities and other
|
232,014
|
--
|
|||||
|
Due
to related party
|
--
|
22,500
|
|||||
|
Income
taxes payable - State
|
(153,000
|
)
|
38,000
|
||||
|
Commodity
derivatives
|
(2,082,100
|
)
|
--
|
||||
|
Net
cash provided by operating activities
|
556,419
|
503,686
|
|||||
|
Cash
Flows From Investing Activities
|
|||||||
|
Additions
to property and equipment
|
(3,747,849
|
)
|
--
|
||||
|
Acquistion
of businesses - oil and gas properties
|
(5,989,139
|
)
|
--
|
||||
|
Advance
payment and costs, Pleasanton transaction
|
2,303,769
|
--
|
|||||
|
Deposits
to cash and cash equivalents held in trust fund
|
--
|
(886,045
|
)
|
||||
|
Deferred
acquistion costs
|
--
|
(54,569
|
)
|
||||
|
Net
cash used in investing activities
|
(7,433,219
|
)
|
(940,614
|
)
|
|||
|
Cash
Flows From Financing Activities
|
|||||||
|
Proceeds
of revolving credit facility
|
5,508,767
|
--
|
|||||
|
Interest
on cash held in trust allocated to common stock subject to possible
redemption
|
--
|
177,120
|
|||||
|
Proceeds
from notes payable-stockholder
|
--
|
260,000
|
|||||
|
Net
cash provided by financing activities
|
5,508,767
|
437,120
|
|||||
|
Net
Increase (Decrease) in Cash
|
(1,368,033
|
)
|
192
|
||||
|
Cash
- Beginning of the Period
|
16,429,619
|
--
|
|||||
|
Cash
- End of Period
|
$
|
15,061,586
|
$
|
192
|
|||
|
SUPPLEMENTAL
DISCLOSURE OF CASH FLOW INFORMATION
|
|||||||
|
Cash
paid during the period for:
|
|||||||
|
Interest
|
$
|
13,805
|
$
|
2,693
|
|||
|
Income
taxes - State
|
$
|
99,000
|
$
|
17,140
|
|||
|
Non-Cash
Investing and Financing Activities:
|
|||||||
|
Acquisition
of oil and gas property - Pleasanton
|
$
|
550,000
|
$
|
--
|
|||
|
Issuance
of notes payable - Pleasanton acquisition
|
$
|
550,000
|
$
|
--
|
|||
See
notes to condensed consolidated financial
statements
F-34
PLATINUM
ENERGY RESOURCES, INC. AND SUBSIDIARIES
NOTES
TO CONDENSED CONSOLIDATED FINANCIAL STATEMENTS
Note
1 - Organization, Business and Operations and Basis of
Presentation
Platinum
Energy Resources, Inc. and subsidiaries (the “Company” or “Platinum”) was
incorporated in Delaware on April 25, 2005 as a blank check company for the
purpose of effecting a business combination with an unidentified operating
business in the global oil and gas Exploration & Production (“E&P”)
industry. In October 2007, the Company acquired substantially all of the
assets and assumed all of the liabilities of Tandem Energy Corporation
(which is sometimes referred to herein as “TEC”) described in Note 4 below.
Prior to the TEC transactions, the Company had no operations other than
conducting an initial public offering and seeking a business
combination.
Currently
the Company is an independent oil and gas exploration and production company.
It
has approximately 37,000 acres under lease in relatively long-lived fields
with
well-established production histories, 21,000 of which were acquired as part
of
the TEC acquisition. The Company’s properties are concentrated primarily in the
Gulf Coast region in Texas, the Permian Basin in Texas and New Mexico and
the
Fort Worth Basin in Texas.
The
accompanying unaudited condensed consolidated financial statements have been
prepared in accordance with accounting principles generally accepted in the
United States of America (“GAAP”) for interim financial statements and the
instructions to Form 10-Q. Accordingly, the financial statements do not include
all of the information and footnotes required by GAAP for complete financial
statements. In the opinion of management, all adjustments considered necessary
for a fair presentation have been included and such adjustments are of a
normal
recurring nature. These condensed consolidated financial statements should
be
read in conjunction with the consolidated financial statements for the year
ended December 31, 2007 and notes thereto of Platinum Energy Resources, Inc
(the “Company” or “Platinum”) included in the Annual Report on Form 10-K for the
fiscal year ended December 31, 2007. The results of operations for the
three months ended March 31, 2008 are not necessarily indicative of the results
for the full fiscal year ending December 31, 2008.
Note
2 — Summary of Significant Accounting Policies
Principles
of Consolidation
The
consolidated financial statements include the accounts of the Company and
its
wholly owned subsidiaries. All material intercompany balances and transactions
have been eliminated.
Estimates
and Assumptions
The
preparation of financial statements in conformity with accounting principles
generally accepted in the United States of America requires management to
make
estimates and assumptions that affect the reported amounts of assets and
liabilities and the disclosure of contingent assets and liabilities as of
the
date of the financial statements and the reported amounts of revenues and
expenses during the reporting period. Actual results could differ from those
estimates. The accounting policy most affected by management’s estimates and
assumptions is the reliance on estimates of proved reserves to compute the
provision for depreciation, depletion and amortization (“DD&A”), and the
determination of any impairment of long-lived assets.
Oil
and Gas Properties
The
Company uses the full cost method of accounting for exploration and development
activities as defined by the Securities and Exchange Commission (“SEC”). Under
this method of accounting, the costs of unsuccessful, as well as successful,
exploration and development activities are capitalized as properties and
equipment. This includes any internal costs that are directly related to
exploration and development activities but does not include any costs related
to
production, general corporate overhead or similar activities. Gain or loss
on
the sale or other disposition of oil and gas properties is not recognized,
unless the gain or loss would significantly alter the relationship between
capitalized costs and proved reserves of oil and natural gas attributable
to a
country. The Company has defined a cost center by country. Currently, all
of the
Company’s oil and gas properties are located within the continental United
States.
F-35
PLATINUM
ENERGY RESOURCES, INC. AND SUBSIDIARIES
NOTES
TO CONDENSED CONSOLIDATED FINANCIAL
STATEMENTS
Oil
and Gas Properties - continued
Properties
and equipment may include costs that are excluded from costs being depreciated
or amortized. Oil and gas costs excluded represent investments in unproved
properties and major development projects in which the Company owns a direct
interest. These unproved property costs include nonproducing leasehold,
geological and geophysical costs associated with leasehold or drilling interests
and exploration drilling costs. All costs excluded are reviewed at least
quarterly to determine if impairment has occurred. The amount of any impairment
is transferred to the capitalized costs being amortized in the DD&A
pool.
Depreciation,
Depletion and Amortization
The
depreciable base for oil and gas properties includes the sum of capitalized
costs net of accumulated DD&A, estimated future development costs and asset
retirement costs not accrued in oil and gas properties, less costs excluded
from
amortization and salvage. The depreciable base of oil and gas properties
and
mineral investments are amortized using the unit-of-production method based
on
total proved oil and gas reserves. Properties and equipment carrying values
do
not purport to represent replacement or market values.
Proved
Oil and Gas Reserves
In
accordance with Rule 4-10(a) of SEC Regulation S-X, proved oil and gas reserves
are the estimated quantities of crude oil, natural gas, and natural gas liquids
which geological and engineering data demonstrate with reasonable certainty
to
be recoverable in future years from known reservoirs under existing economic
and
operating conditions, i.e., prices and costs as of the date the estimate
is
made. Prices include consideration of changes in existing prices provided
only
by contractual arrangements, but not on escalation based upon future
conditions.
|
|
(i)
|
Reservoirs
are considered proved if economic producibility is supported by
either
actual production or conclusive formation tests. The area of a
reservoir
considered proved includes (A) that portion delineated by drilling
and
defined by gas-oil and/or oil-water contacts, if any; and (B) the
immediately adjoining portions not yet drilled, but which can be
reasonably judged as economically productive on the basis of available
geological and engineering data. In the absence of information
on fluid
contacts, the lowest known structural occurrence of hydrocarbons
controls
the lower proved limit of the
reservoir.
|
|
|
(ii)
|
Reserves
which can be produced economically through application of improved
recovery techniques (such as fluid injection) are included in the
“proved”
classification when successful testing by a pilot project, or the
operation of an installed program in the reservoir, provides support
for
the engineering analysis on which the project or program was
based.
|
|
|
(iii)
|
Estimates
of proved reserves do not include the
following:
|
|
|
(A)
|
oil
that may become available from known reservoirs but is classified
separately as “indicated additional
reserves”;
|
|
|
(B)
|
crude
oil, natural gas, and natural gas liquids, the recovery of which
is
subject to reasonable doubt because of uncertainty as to geology,
reservoir characteristics, or economic
factors;
|
|
|
(C)
|
crude
oil, natural gas, and natural gas liquids, that may occur in undrilled
prospects; and
|
|
|
(D)
|
crude
oil, natural gas, and natural gas liquids, that may be recovered
from oil
shales, coal, gilsonite and other such
sources.
|
F-36
PLATINUM
ENERGY RESOURCES, INC. AND SUBSIDIARIES
NOTES
TO CONDENSED CONSOLIDATED FINANCIAL STATEMENTS
Note
2 — Summary of Significant Accounting Policies - continued
Ceiling
Test
Under
the
full cost method of accounting, a ceiling test is performed each quarter.
The
full cost ceiling test is an impairment test prescribed by SEC Regulation
S-X
Rule 4-10. The ceiling test determines a limit, on a country-by-country basis,
on the book value of oil and gas properties. Currently, all of the Company’s
operations are located in the United States. The capitalized costs of proved
oil
and gas properties, net of accumulated DD&A and the related deferred income
taxes, may not exceed the estimated future net cash flows from proved oil
and
gas reserves, excluding future cash outflows associated with settling asset
retirement obligations that have been accrued on the balance sheet, generally
using prices in effect at the end of the period held flat for the life of
production and including the effect of derivative instruments that qualify
as
cash flow hedges, discounted at 10%, net of related tax effects, plus the
cost
of unevaluated properties and major development projects excluded from the
costs
being amortized. If capitalized costs exceed this limit, the excess is charged
to expense and reflected as additional accumulated DD&A.
Asset
Retirement Obligation
The
Company follows the provisions of Statement of Financial Accounting Standards
(“SFAS”) No. 143, Accounting
for Asset Retirement Obligations.
SFAS
No. 143 requires the Company to recognize a liability for the present value
of all legal obligations associated with the retirement of tangible, long-lived
assets and capitalize an equal amount as a cost of the asset. The cost of
the
abandonment obligations, less estimated salvage values, is included in the
computation of depreciation, depletion and amortization.
Income
Taxes
The
Company follows the asset and liability method prescribed by SFAS No. 109,
Accounting
for Income Taxes (“SFAS 109”).
Under
this method of accounting for income taxes, deferred tax assets and liabilities
are recognized for the future tax consequences attributable to differences
between the financial statement carrying amounts of existing assets and
liabilities and their respective tax bases. Deferred tax assets and liabilities
are measured using enacted tax rates expected to apply to taxable income
in the
years in which those temporary differences are expected to be recovered or
settled. Under SFAS No. 109, the effect on deferred tax assets and liabilities
of a change in enacted tax rates is recognized in income in the period that
includes the enactment date.
Effective
January 1, 2007, the Company adopted the provisions of Financial Accounting
Standards Board Interpretation No. 48, “Accounting for Uncertainty in Income
Taxes, an interpretation of FASB Statement No. 109” (“FIN 48”). FIN 48 clarifies
the accounting for uncertainty in income taxes recognized in the Company’s
financial statements in accordance with SFAS 109, and prescribes a recognition
threshold and measurement process for financial statement recognition and
measurement of a tax position taken or expected to be taken in a tax return.
FIN
48 also provides guidance on derecognition, classification, interest and
penalties, accounting in interim periods, disclosure and
transition.
Management
has evaluated and concluded that there are no significant uncertain tax
positions requiring recognition in the Company’s financial statements as of
January 1, 2008. The evaluation was performed for the tax period April 25
(inception) to December 31, 2005 and for the years ended December 31, 2006
and
2007, the tax years which remain subject to examination for Federal and New
Jersey State purposes as of March 31 2008.
The
Company’s policy is to classify assessments, if any, for tax related interest as
interest expenses and penalties as marketing, general and administrative
expenses.
F-37
PLATINUM
ENERGY RESOURCES, INC. AND SUBSIDIARIES
NOTES
TO CONDENSED CONSOLIDATED FINANCIAL STATEMENTS
Note
2 — Summary of Significant Accounting Policies - continued
Non-Employee
Stock Based Compensation
The
Company accounts for equity instruments issued to non-employees in accordance
with the provisions of SFAS No. 123(R) and Emerging Issues Task Force
(“EITF”) Issue No. 96-18, “Accounting for Equity Instruments That are
Issued to Other Than Employees for Acquiring, or in Conjunction with Selling,
Goods or Services,” (“EITF 96-18”) which requires that such equity instruments
be recorded at their fair value on the measurement date. The measurement
of
stock-based compensation is subject to periodic adjustment as the underlying
equity instrument vests. No such instruments were issued in 2007 and 2008.
In
October 2007, the Company issued 178,572 shares of its common stock in
connection with a consulting agreement as described in Note 5(d).
Income
(Loss) Per Share
The
Company follows the provisions of SFAS No. 128, “Earnings Per Share” (“SFAS No.
128”). In accordance with SFAS No. 128, earnings (loss) per common share amounts
(“Basic EPS”) were computed by dividing earnings (loss) by the weighted
average number of common shares outstanding for the period. Earnings per
common
share amounts, assuming dilution (“Diluted EPS”), were computed by reflecting
the potential dilution from the exercise of dilutive common stock purchase
warrants. SFAS No. 128 requires the presentation of both Basic EPS and Diluted
EPS on the face of the consolidated statements of operations.
Reconciliations
between the numerators and denominators of the Basic and Diluted EPS
computations for earnings (loss) for each period are as follows.
|
|
Three
Months Ended March 31, 2008
|
|||||||||
|
|
Net
Income
(Loss)
(Numerator)
|
|
Shares
(Denominator)
|
|
Per
Share
Amounts
|
|||||
|
Basic
EPS
|
|
|
|
|||||||
|
Net
Loss
|
$
|
(1,000,517
|
)
|
22,070,762
|
$
|
(0.05
|
)
|
|||
|
Effect
of Dilutive Securities
|
||||||||||
|
Warrants
|
—
|
—
|
—
|
|||||||
|
Net
loss attributable to common stock
|
$
|
(1,000,517
|
)
|
22,070,762
|
$
|
(0.05
|
)
|
|||
|
|
Three
Months Ended March 31, 2007
|
|||||||||
|
|
Net
Income
(Numerator)
|
|
Shares
(Denominator)
|
|
Per
Share
Amounts
|
|||||
|
Basic
EPS
|
|
|
|
|||||||
|
Net
Income
|
$
|
497,865
|
15,121,440
|
$
|
0.03
|
|||||
|
Effect
of Dilutive Securities
|
||||||||||
|
Warrants
|
$
|
—
|
2,610,451
|
$
|
—
|
|||||
|
Net
income attributable to common stock and assumed exercise of
warrants
|
$
|
497,865
|
17,731,891
|
$
|
0.03
|
|||||
F-38
PLATINUM
ENERGY RESOURCES, INC. AND SUBSIDIARIES
NOTES
TO CONDENSED CONSOLIDATED FINANCIAL
STATEMENTS
Note
2 — Summary of Significant Accounting Policies - continued
Income
(Loss) Per Share, continued
In
2007,
for the period prior to the October 26, 2007 TEC acquisition, common shares
subject to possible conversion of 2,878,560 were excluded from the calculation
of Basic EPS since such shares if redeemed, would only participate in their
Pro-Rata share of the trust asset earnings. In this acquisition, 1,802,205
were
actually converted and redeemed. Subsequent to the date of the TEC acquistion
transaction, the remainder of 1,076,355 common shares subject to conversion
but
which were not redeemed (and thus remain outstanding), were included in the
determination of weighted average number of common shares outstanding for
the
three months ended March 31, 2008. The Company has determined that the Warrants
contained in the Units sold in its IPO are dilutive for the 2007 period,
and
accordingly included the effects of the Warrants in Diluted EPS using the
Treasury Stock Method in this period. The Company has determined that their
inclusion in 2008 would be antidilutive and thus excluded the effects of
the
Warrants in this period. An option to purchase 720,000 Units was excluded
in the
computation of Diluted EPS because the option exercise price exceeded the
average market price for the Units in all periods.
Environmental
Expenditures
The
Company is subject to extensive federal, state and local environmental laws
and
regulations. These laws regulate the discharge of materials into the environment
and may require the Company to remove or mitigate the environmental effects
of
the disposal or release of petroleum or chemical substances at various sites.
Environmental expenditures are expensed or capitalized depending on their
future
economic benefit. Expenditures that relate to an existing condition caused
by
past operations and that have no future economic benefits are
expensed.
Liabilities
for expenditures of a non-capital nature are recorded when environmental
assessment and/or remediation is probable, and the costs can be reasonably
estimated. Such liabilities are generally undiscounted unless the timing
of cash
payments for the liability or component is fixed or reliably
determinable.
Hedging
Activities
From
time
to time, the Company may utilize derivative instruments, consisting of swaps,
floors and collars, to attempt to reduce its exposure to changes in commodity
prices and interest rates. The Company accounts for its derivatives in
accordance with SFAS No. 133, Accounting
for Derivative Instruments and Hedging Activities,
as
amended. SFAS No. 133 requires that all derivative instruments be
recognized as assets or liabilities in the balance sheet, measured at fair
value. The accounting for changes in the fair value of a derivative depends
on
both the intended purpose and the formal designation of the derivative.
Designation is established at the inception of a derivative, but subsequent
changes to the designation are permitted. The Company has elected not to
designate any of its derivative financial contracts as accounting hedges
and,
accordingly, has accounted for these derivative financial contracts using
mark-to-market accounting. Changes in fair value of derivative instruments
which
are not designated as cash flow hedges are recorded in other income (expense)
as
changes in fair value of derivatives.
Real
Estate Held for Development
The
Company’s real estate held for development was recorded at fair market value
when the Company completed its purchase of the assets of Tandem Energy
Corporation on October 26, 2007 and relates to approximately 41 acres of
undeveloped land located near Tomball, Texas.
F-39
PLATINUM
ENERGY RESOURCES, INC. AND SUBSIDIARIES
NOTES
TO CONDENSED CONSOLIDATED FINANCIAL
STATEMENTS
Note
2 — Summary of Significant Accounting Policies - continued
Revenue
Recognition and Gas Balancing
The
Company utilizes the sales method of accounting for oil, natural gas and
natural
gas liquids revenues whereby revenues, net of royalties, are recognized as
the
production is sold to purchasers. The amount of gas sold may differ from
the
amount to which the Company is entitled based on its revenue interests in
the
properties. The Company did not have any significant gas imbalance positions
at
March 31, 2008 and December 31, 2007.
Comprehensive
Income
SFAS
No.
130, Reporting
Comprehensive Income,
established standards for reporting and displaying comprehensive income and
its
components (revenue, expenses, gains and losses) in a full set of
general-purpose financial statements. There were no differences between net
income and comprehensive income.
Accounts
Receivable and Allowance for Doubtful Accounts
The
Company’s trade receivables consist primarily of receivables from non-operators
who own an interest in properties which the Company operates, and trade
receivables associated with the operations of the Company’s wholly owned
subsidiary, Red Iron Tool, Inc. Insofar as the receivables relate to oil
and gas
trade receivables, the Company has the ability and the right to withhold
oil and
gas revenues from any owner who is delinquent in their payments.
Recent
Accounting Pronouncements
In
September 2006, the Financial Accounting Standards Board (FASB) issued SFAS
No. 157, “Fair Value Measurements.” SFAS No. 157 establishes a single
definition of fair value and a framework for measuring fair value, sets out
a
fair value hierarchy to be used to classify the source of information used
in
fair value measurements, and requires new disclosures of assets and liabilities
measured at fair value based on their level in the hierarchy. This statement
applies under other accounting pronouncements that require or permit fair
value
measurements. In February 2008, the FASB issued Staff Positions (FSPs)
No. 157-1 and No. 157-2, which, respectively, remove leasing
transactions from the scope of SFAS No. 157 and defer its effective date
for one year relative to certain nonfinancial assets and liabilities. As
a
result, the application of the definition of fair value and related disclosures
of SFAS No. 157 (as impacted by these two FSPs) was effective for the
Company beginning January 1, 2008 on a prospective basis with respect to
fair value measurements of (a) nonfinancial assets and liabilities that are
recognized or disclosed at fair value in the Company’s financial statements on a
recurring basis (at least annually) and (b) all financial assets and
liabilities. This adoption did not have a material impact on the Company’s
consolidated results of operations or financial condition. The remaining
aspects
of SFAS No. 157 for which the effective date was deferred under FSP
No. 157-2 are currently being evaluated by the Company. Areas impacted by
the deferral relate to nonfinancial assets and liabilities that are measured
at
fair value, but are recognized or disclosed at fair value on a nonrecurring
basis. This deferral applies to such items as nonfinancial assets and
liabilities initially measured at fair value in a business combination (but
not
measured at fair value in subsequent periods) or nonfinancial long-lived
asset
groups measured at fair value for an impairment assessment. The effects of
these
remaining aspects of SFAS No. 157 are to be applied to fair value
measurements prospectively beginning January 1, 2009. The Company does not
expect them to have a material impact on the Company’s consolidated results of
operations or financial condition. Refer to Note 8 for disclosures required
by
this new pronouncement.
In
February 2007, the FASB issued SFAS 159, The
Fair Value Option for Financial Assets and Financial Liabilities, Including
an
Amendment of FASB Statement No. 115,
which
will become effective on January 1, 2008. FAS 159 permits entities to
measure eligible financial assets, financial liabilities and firm commitments
at
fair value. on an instrument-by-instrument basis, that are otherwise not
permitted to be accounted for at fair value under other generally accepted
accounting principles. The fair value measurement election is irrevocable
and
subsequent changes in fair value must be recorded in earnings.
F-40
PLATINUM
ENERGY RESOURCES, INC. AND SUBSIDIARIES
NOTES
TO CONDENSED CONSOLIDATED FINANCIAL
STATEMENTS
Note
2 — Summary of Significant Accounting Policies - continued
Recent
Accounting Pronouncements -continued
In
April 2007, the FASB issued FASB Staff Position FIN 39-1, Amendment
of FASB Interpretation No. 39
. FSP
FIN 39-1 clarifies that a reporting entity that is party to a master netting
arrangement can offset fair value amounts recognized for the right to reclaim
cash collateral (a receivable) or the obligation to return cash collateral
(a
payable) against fair value amounts recognized for derivative instruments
that
have been offset under the same master netting arrangement. FSP FIN 39-1
is
effective for financial statements issued for fiscal years beginning after
November 15, 2007.
In
December 2007, the FASB issued SFAS No. 141 (revised 2007),
Business
Combinations
(“SFAS
141(R)”), which replaces FASB Statement No. 141. SFAS 141(R) establishes
principles and requirements for how an acquirer recognizes and measures in
its
financial statements the identifiable assets acquired, the liabilities assumed,
any non- controlling interest in the acquiree and the goodwill acquired.
The
Statement also establishes disclosure requirements that will enable users
to
evaluate the nature and financial effects of the business combination. SFAS
141(R) is effective for acquisitions that occur in an entity’s fiscal year that
begins after December 15, 2008.
In
December 2007, the FASB issued SFAS No. 160, Noncontrolling
Interests in Consolidated Financial Statements—an amendment of ARB
No. 51.
SFAS 160
requires that accounting and reporting for minority interests will be
recharacterized as noncontrolling interests and classified as a component
of
equity. SFAS 160 also establishes reporting requirements that provide sufficient
disclosures that clearly identify and distinguish between the interests of
the
parent and the interests of the noncontrolling owners. SFAS 160 applies to
all
entities that prepare consolidated financial statements, except not-for-profit
organizations, but will affect only those entities that have
an
outstanding noncontrolling interest in one or more subsidiaries or that
deconsolidate a subsidiary. This statement is effective as of the beginning
of
an entity’s first fiscal year beginning after December 15,
2008.
In
March
2008, the FASB issued Statement of Financial Accounting Standards No. 161,
“Disclosures about Derivative Instruments and Hedging Activities—an amendment of
FASB Statement No. 133” (“SFAS 161”). SFAS 161 changes the disclosure
requirements for derivative instruments and hedging activities. Entities
are
required to provide enhanced disclosures about (a) how and why an entity
uses
derivative instruments, (b) how derivative instruments and related hedged
items
are accounted for under SFAS No. 133 and its related interpretations, and
(c)
how derivative instruments and related hedged items affect an entity’s financial
position, financial performance and cash flows. The guidance in SFAS 161
is
effective for financial statements issued for fiscal years and interim periods
beginning after November 15, 2008, with early application encouraged. This
Statement encourages, but does not require, comparative disclosures for earlier
periods at initial adoption. At this time, management is evaluating the
implications of SFAS 161 and its impact on the financial statements has not
yet
been determined.
Note
3 — Initial Public Offering
On
October 28, 2005, the Company sold to the public 14,400,000 units (“Units”) at
an offering price of $8.00 per Unit. Each Unit consists of one share of the
Company’s common stock, $0.0001 par value, and one Redeemable Common Stock
Purchase Warrant (“Warrants”). Each Warrant entitles the holder to purchase from
the Company one share of common stock at an exercise price of $6.00 commencing
on the later of the completion of a Business Combination with a target business
or one year from the effective date of the Offering and expiring four years
from
the effective date of the Offering. The Warrants will be redeemable, in whole
or
in part, upon written consent of the representative of the underwriters,
at a
price of $0.01 per Warrant upon thirty (30) days notice after the Warrants
become exercisable, only in the event that the last sale price of the common
stock is at least $11.50 per share for any twenty (20) trading days within
a
thirty (30) trading day period ending on the third day prior to the date
on
which notice of redemption is given. Separate trading of the common stock
and
Warrants comprising the Units commenced on or about December 9,
2005.
F-41
PLATINUM
ENERGY RESOURCES, INC. AND SUBSIDIARIES
NOTES
TO CONDENSED CONSOLIDATED FINANCIAL STATEMENTS
Note
3 — Initial Public Offering - continued
In
connection with the Offering, the Company issued an option (the “Units Purchase
Option” or “UPO”), for $100.00, to the representative of the underwriters to
purchase up to 720,000 Units at an exercise price of $10.00 per Unit. The
Units
issuable upon exercise of this option are identical to those described
in the
preceding paragraph, except that the warrants underlying the Units will
be
exercisable at $7.50 per share. This option is exercisable at $10.00 per
Unit
commencing on the later of the consummation of a Business Combination or
one
year from the date of the prospectus relating to the Offering (October
24, 2005)
and expiring five years from such date. The option may be exercised for
cash or
on a “cashless” basis, at the holder’s option, such that the holder may use the
appreciated value of the option (the difference between the exercise prices
of
the option and the underlying Warrants and the market price of the Units
and
underlying securities) to exercise the option without the payment of any
cash.
The option and the 720,000 units, the 720,000 shares of common stock and
the
720,000 warrants underlying such units, and the 720,000 shares of common
stock
underlying such warrants, were deemed compensation by the National Association
of Securities Dealers (“NASD”) and are therefore subject to a 180-day lock-up.
Additionally, the option may not be sold, transferred, assigned, pledged
or
hypothecated for a one-year period (including the foregoing 180-day period)
following the date of the Offering prospectus. The option grants to holders
demand and “piggy back” rights for periods of five and seven years,
respectively, from the date of the Offering with respect to the registration
under the Securities Act of the securities directly and indirectly issuable
upon
exercise of the option. The Company would be obligated to bear all fees
and
expenses attendant to registering the securities.
The
exercise price and number of units issuable upon exercise of the option may
be
adjusted in certain circumstances including in the event of a stock dividend,
or
a recapitalization, reorganization, merger or consolidation. However, the
option
will not be adjusted for issuances of common stock at a price below its exercise
price.
Should
the Company be unable to deliver shares of its common stock underlying the
exercise of the Warrants included in the Units and shares of its common stock
underlying the exercise of the Company’s Unit Purchase Option as a result of the
absence of an effective registration statement with respect to these securities,
then the Warrants and the UPO would not be exercisable and the Company will
have
no obligation to pay holders of the Warrants and UPO any cash or otherwise
“net
cash settle” the Warrant or the UPO. In this event, the Warrants and UPO may
expire worthless.
Note
4 — Business Combinations
On
October 26, 2007, Platinum consummated the TEC acquisition pursuant to the
Acquisition Agreement. Among other terms and conditions, the Company filed
a
registration statement with the Securities and Exchange Commission with respect
to the approximately 7.7 million Platinum common shares issued in connection
with the Acquisition. The Company is presently taking steps necessary for
this
registration statement to become effective. In connection with the Asset
Acquisition Agreement, the Company entered into a Finders Agreement and a
Consulting Agreement
with Mr. Lance Duncan, an individual with prior affiliations with Tandem,
who
had been given limited authority by Tandem management to act on its behalf.
These agreements are more fully described in Note 6f.
F-42
PLATINUM
ENERGY RESOURCES, INC. AND SUBSIDIARIES
NOTES
TO CONDENSED CONSOLIDATED FINANCIAL
STATEMENTS
Note
4 — Business Combinations - continued
In
December 2007, Platinum, through its wholly owned subsidiary, PER Gulf Coast,
Inc., acquired a 50% working interest in the La Rosa field for approximately
$5.3 million. Although the La Rosa field is a producing field of approximately
3,800 acres in Refugio County, Texas, actual production was minimal. The
primary
focus of the acquisition is related to its recompletion and re-entry potential.
The entire purchase price was allocated to oil and gas properties. In March
2008
an additional related working interest was acquired for $461,500.
In
January 2008, the Company acquired a 70% working interest in the Pleasanton
field for approximately $6.1 million. $2.5 million of the purchase price
was
paid in December 2007 and recorded as a Deposit on the December 31, 2007
balance
sheet. The remainder of the purchase price was paid in January 2008, including
direct transaction costs. See Note 6 for a further description of
consideration paid. The Pleasanton Field is a non-producing field of
approximately 4,200 acres in Atascosa County, Texas. The field contains
previously drilled and abandoned wells. The entire purchase price was allocated
to the fair value of oil and gas properties.
On
March
18, 2008, the Company, Maverick Engineering, Inc. (“Maverick”) and Robert L.
Kovar Services, LLC (the “Sellers”) (as the representative of the selling equity
stake holders in Maverick) entered into an Agreement and Plan of Merger (the
“Merger Agreement”) for a gross purchase price of $11 million, subject to a
working capital purchase price adjustment, with $6 million paid at closing
and
the remaining $5 million to be paid over the next 6 years pursuant to a
non-interest bearing note (the “Cashflow Notes”). Established in 1993, Maverick
is a full-service engineering service company with 270 employees including
a
staff of 70 engineers, consultants, surveyors, scientists and planners. Maverick
is a provider of project management, engineering, procurement, and
construction management services to both the public and private sectors.
Maverick is based in South Texas with offices in Corpus Christi, Victoria,
Harlingen and Houston. In connection with the transaction, the Company will
enter into an five year employment agreement with Robert Kovar, the founder
and
CEO of Maverick, pursuant to which he will join Platinum as its Chief Operating
Officer in addition to continuing as CEO and President of Maverick. See Note
11,
Subsequent Events.
The
assets and liabilities related to the foregoing acquisitions were recorded
in
the Company’s consolidated balance sheet at their fair values at the date of
acquisition in accordance with the provisions for SFAS # 141, “Business
Combinations”.
a.
The
Company has engaged Casimir Capital LP (“CCLP”), the representative of the
underwriters, on a non-exclusive basis, as its agent for the solicitation
of the
exercise of the Warrants. To the extent not inconsistent with the guidelines
of
the NASD and the rules and regulations of the SEC, the Company has agreed
to pay
CCLP for bona fide services rendered, a commission equal to 5% of the exercise
price for each warrant exercised more than one year after the date of an
effective prospectus if the exercise was solicited by the underwriters. In
addition to soliciting, either orally or in writing, the exercise of the
warrants, the representative’s services may also include disseminating
information, either orally or in writing, to warrant holders about the Company
or the market for its securities,
and assisting in the processing of the exercise of the warrants. No compensation
will be paid to the representative upon the exercise of the warrants
if:
|
|
·
|
the
market price of the underlying shares of common stock is lower
than the
exercise price;
|
|
|
·
|
the
holder of the warrants has not confirmed in writing that the underwriters
solicited the exercise;
|
|
|
·
|
the
warrants are held in a discretionary
account;
|
F-43
PLATINUM
ENERGY RESOURCES, INC. AND SUBSIDIARIES
NOTES
TO CONDENSED CONSOLIDATED FINANCIAL
STATEMENTS
Note
5 - Commitments - continued
|
|
·
|
the
warrants are exercised in an unsolicited transaction;
or
|
|
|
·
|
the
arrangement to pay the commission is not disclosed in the prospectus
provided to warrant holders
at
the time of exercise.
|
b.
On
March 20, 2006, the Board of Directors of the Company approved its 2006
Long-Term Incentive Plan (the “Plan”) Pursuant to Plan, the Company may grant
incentive and non-qualified stock options, stock appreciation rights,
performance units, restricted stock awards and performance bonuses, or
collectively, awards, to officers and key employees. In addition, the Plan
authorizes the grant of non-qualified stock options and restricted stock
awards
to directors and to any independent contractors and consultants. Generally,
all
classes of employees are eligible to participate in the Plan.
The
Company has reserved a maximum of 4 million shares of its authorized common
stock for issuance upon the exercise of awards to be granted pursuant to
the
Plan.
Other
than stock options issuable in connection with the Maverick acquisition
described in Note 11, no options, restricted stock or other awards under
the
Plan have been made or committed to be made as of the date hereof.
c.
Stock Repurchase Program
In
November 2006, the Company’s board approved a share repurchase program to
repurchase shares of Company common stock in open market transactions in
an
amount up to $80 million, following the consummation of a the Asset Acquisition.
On November 1, 2007, the board of directors instituted the initial stage
of this
share repurchase program and established a plan in conformity with the
provisions of Rule 10b5-1 to purchase up to 2,000,000 shares of Platinum
common
stock in open market transactions during the month of November 2007, subject
to
the broker, volume, price and timing restrictions of Rule 10b-18 under the
Securities Exchange Act of 1934., On October 26, 2007, the Company redeemed
1,802,205 shares of common stock for a total purchase price of $14,057,199
and,
pursuant to the plan in November 2007 purchased 1,997,913 shares for an
aggregate of $15,661,464 under the repurchase program. The initial share
repurchase plan expired November 30, 2007, but the Company may resume
repurchases in the future, pursuant to the share repurchase
program.
d. Consulting
Agreement
Mr.
Lance
Duncan, a director and officer of Tandem for a short time from March 2005
through June 1, 2005, introduced Platinum’s management to Tandem, which resulted
in the Asset Acquisition Agreement. As a consequence of his efforts in this
regard, Mr. Duncan was paid a finder’s fee of $3.0 million at the consummation
of the TEC acquisition for introduction of the parties. The Company also
entered
into a consulting agreement with Mr. Duncan, the term of which commenced
upon
the consummation of the TEC acquisition, for consulting services, including
investigation and evaluation of possible future acquisitions for the Company.
Under the terms of the consulting agreement, the Company valued such services
at
$5 million and agreed to issue to Mr. Duncan a total of 714,286 shares of
the
Company’s restricted common stock in consideration over the period of service.
These shares are to be issued in semi-annual installments over the eighteen
month term of the agreement beginning with the closing of the TEC acquisition.
On October 26, 2007, the first installment of 178,572 irrevocable shares
were
issued to Mr. Duncan.
F-44
PLATINUM
ENERGY RESOURCES, INC. AND SUBSIDIARIES
NOTES
TO CONDENSED CONSOLIDATED FINANCIAL
STATEMENTS
Note
6 - Long-Term Debt
On
March 14, 2008, two operating subsidiaries of the Company entered into a
new
credit facility with a bank, establishing a revolving line of credit with
an
initial borrowing base of $35 million. The revolving line of credit is secured
by the Co-borrower’s oil and gas properties and will be used to facilitate the
execution of the two entities’ drilling and acquisition programs. The line bears
interest at either the Bank’s base rate or LIBOR, plus a margin which varies
with the ratio of the Co-borrower’s outstanding borrowings against the defined
borrowing base, ranging from 1.5% to 2.25 %. The Co-borrower’s can choose
periodically to change the interest rate base which applies to outstanding
borrowings. Under the terms of revolving line of credit agreement, the
Co-borrowers must maintain certain financial ratios, must repay any amounts
due
in excess of the borrowing base, and may not declare any dividends or enter
into
any transactions resulting in a change in control, without the Bank’s consent.
The Company, as the parent company, is not a co-borrower or guarantor of
the
line, and transfers from the co-borrowers to the parent company are limited
to
(i) $1 million per fiscal year to the parent for management fees, and (ii)
the
repayment of up to $2 million per fiscal year in subordinate indebtedness
owed
to the parent. As of March 31, 2008 there was approximately $5.5 million
outstanding under the revolving line of credit, bearing interest at the Bank’s
base rate, which was 5.25%. The entire $5.5 million outstanding balance is
classified as long term debt in the accompanying financial statements. The
facility expires in March, 2012. In conjunction with the execution of the
new
line of credit and as required under the terms of the new credit facility,
the
Company novated its existing hedge positions from its existing counterparty’s
over to the Bank under terms satisfactory to the Company. In connection with
establishing the line of credit, the Bank received a commitment fee of $87,500
and a fee of $60,229 for its expenses in connection with the aforementioned
novation. In addition, the Co-borrowers are obligated to the bank for a monthly
fee of any unused portion of the line of credit at the rate of 0.25% per
annum.
In
conjunction with and simultaneous to the establishment of the new Bank credit
facility, the previously existing $5 million line of credit with another
bank
was terminated. No outstanding borrowings existed at the time of the termination
of this previous arrangement.
In
connection with the Pleasanton acquisition as more fully described in Note
4,
the Company, entered into a Settlement Agreement for $1,000,000 in order
to
secure clear title to the properties acquired, of which $450,000 was paid
in
cash and issued its note for the balance in the amount of $550,000. The cash
payment was treated as a reduction of the payment of the purchase price paid
to
the seller pursuant to indemnification provisions of the acquisition agreement.
The note bears interest at 12% per annum, and is subject to monthly payments
beginning June 1, 2008 of an amount equal to ½ of the net proceeds from
production attributable to the Company’s interest in the purchased leasehold or
$30,000, whichever is greater, until the note is paid in full. The long term
portion of the note is established at March 31, 2008 as being
$250,000.
The
following table sets out the Company’s long term debt position as of March 31,
2008:
|
Borrowings
under the credit facility
|
$
|
5,508,767
|
||
|
Notes
payable – Pleasanton
|
550,000
|
|||
|
Less:
|
||||
|
Current
portion
|
(300,000
|
)
|
||
|
Long
term debt
|
$
|
5,758,767
|
F-45
PLATINUM
ENERGY RESOURCES, INC. AND SUBSIDIARIES
NOTES
TO CONDENSED CONSOLIDATED FINANCIAL STATEMENTS
Note
7 - Marketing Arrangements and Segment Information
The
Company considers itself to be in one line of business, as an independent
oil
and gas exploration and production company.
The
Company sells substantially all of its crude oil production under short-term
contracts based on prices quoted on the New York Mercantile Exchange (“NYMEX”)
for spot West Texas Intermediate contracts, less agreed-upon deductions which
vary by grade of crude oil.
The
majority of the Company’s natural gas production is sold under short-term
contracts based on pricing formulas which are generally market responsive.
From
time to time, The Company may also sell a portion of the gas production under
short-term contracts at fixed prices. The Company believes that the loss
of any
of its oil and gas purchasers would not have a material adverse effect on
its
results of operations due to the availability of other purchasers.
Note
8 - Price, Interest Rate and Credit Risk Management
Activities
The
Company engages in price risk management activities from time to time. These
activities are intended to manage the Company’s exposure to fluctuations in
commodity prices for natural gas and crude oil. The Company utilizes derivative
financial instruments, primarily price collars, puts and calls, as the means
to
manage this price risk. In addition to these financial transactions, the
Company
is a party to various physical commodity contracts for the sale of hydrocarbons
that cover varying periods of time and have varying pricing provisions. Under
SFAS No. 133, Accounting
for Derivative Instruments and Hedging Activities,
as
amended by SFAS Nos. 137, 138, 149 and 157, these various physical commodity
contracts qualify for the normal purchases and normal sales exception and
therefore, are not subject to hedge accounting or mark-to-market accounting.
The
financial impact of these various physical commodity contracts is included
in
revenues at the time of settlement, which in turn affects average realized
hydrocarbon prices. The Company has elected not to designate any of its
derivative financial contracts as accounting hedges and, accordingly, has
accounted for these derivative financial contracts using mark-to-market
accounting.
In
accordance with SFAS No. 157, the Company has categorized its
derivative financial instruments, based on the priority of the inputs to
the
valuation technique, into a three-level fair value hierarchy. The fair value
hierarchy gives the highest priority to quoted prices in active markets for
identical assets or liabilities (Level 1); the next highest priority inputs
include quoted prices for similar assets or liabilities in active markets,
quoted prices for identical or similar assets or liabilities in markets that
are
not active, and inputs (other than quoted prices) that are observable for
the
asset or liability, either directly or indirectly (Level 2); and the lowest
priority to unobservable inputs (Level 3). The Company uses Level 1
valuation techniques to value its derivatives.
Presented
below is a summary of the Company’s crude oil and natural gas derivative
financial contracts at March 31, 2008 and December 31, 2007, with crude oil
prices expressed in dollars per barrels of crude oil and notional crude oil
volumes in barrels of crude oil per year; and natural gas prices expressed
in
dollars per million British thermal units ($/MMBtu) and notional natural
gas
volumes in million British thermal units per year (MMBtuy). As indicated,
The
Company does not have any financial derivative contracts that extend beyond
December 2011.
F-46
PLATINUM
ENERGY RESOURCES, INC. AND SUBSIDIARIES
NOTES
TO CONDENSED CONSOLIDATED FINANCIAL
STATEMENTS
Note
8 - Price, Interest Rate and Credit Risk Management Activities -
continued
The
total
fair value of the crude oil and natural gas financial derivative contracts
at
March 31, 2008, was a liability of approximately $3.0 million as follows:
|
Period
Ended
March
31,
|
Instrument
Type
|
Total
Volumes
(MMBTU/BBL)
|
Weighted
Average
(Floor/Ceiling)
|
Fair
Value
Asset/
(Liability)
(stated
in
thousands)
|
|||||
|
2009
|
Gas
Collar
|
45,230
|
5.00/11.02
|
(96)
|
|||||
|
|
Gas
Call Option Sold
|
45,230
|
9.10
|
(392)
|
|||||
|
|
Gas
Call Option Purchased
|
45,230
|
12.00
|
96
|
|||||
|
|
Gas
Put Option Sold
|
45,230
|
5.00
|
0
|
|||||
|
|
Gas
Put Option Purchased
|
45,230
|
|
6.00
|
2
|
||||
|
|
Oil
Collar
|
172,749
|
40.00/72.10
|
(2,214)
|
|||||
|
|
Oil
Call Option Sold
|
87,500
|
67.00
|
(2,864)
|
|||||
|
|
Oil
Call Option Purchased
|
87,500
|
72.10
|
2,444
|
|||||
|
|
Oil
Swaps
|
30,000
|
71.00
|
(781)
|
|||||
|
|
|
|
|
||||||
|
2010
|
Oil
Swaps
|
90,000
|
71.00
|
(2,191)
|
|||||
|
Oil
Put Option Purchased
|
120,000
|
75.00
|
613
|
||||||
|
Oil
Put Option Purchased
|
170,000
|
80.00/85.00
|
1,384
|
||||||
|
|
|
|
|
|
|||||
|
2011
|
Oil
Put Option Purchased
|
120,000
|
80.00
|
1,002
|
|||||
|
|
Total
fair value liability
|
|
|
$ |
(2,997)
|
The
fair
value of the Company’s financial derivative contracts at March 31, 2008 are
shown in the accompanying financial statements as follows (in
thousands):
|
Fair
value of commodity derivative:
|
|
|||
|
Current
portion
|
$
|
(3,805
|
)
|
|
|
Long-term
portion
|
808
|
|||
|
Total
fair value liability
|
$
|
(2,997
|
)
|
|
F-47
PLATINUM
ENERGY RESOURCES, INC. AND SUBSIDIARIES
NOTES
TO CONDENSED CONSOLIDATED FINANCIAL
STATEMENTS
Note
8 - Price, Interest Rate and Credit Risk Management Activities -
continued
The
total fair value of the crude oil and natural gas financial derivative contracts
at December 31, 2007, was a liability of approximately $3.0 million as
follows:
|
Period
|
|
Instrument
Type
|
|
Total
Volumes
(MMBTU/BBL)
|
|
Weighted
Average
(Floor/Ceiling)
|
|
|
Fair
Value
Asset/
(Liability)
(stated
in
thousands)
|
|
|
2008
|
Gas
Collar
|
64,615
|
5.00/11.02
|
(25)
|
||||||
|
|
Gas
Call Option Sold
|
64,615
|
9.10
|
(128)
|
||||||
|
|
Gas
Call Option Purchased
|
64,615
|
|
12.00
|
36
|
|||||
|
|
Gas
Put Option Sold
|
64,615
|
5.00
|
(11)
|
||||||
|
|
Gas
Put Option Purchased
|
64,615
|
6.00
|
46
|
||||||
|
|
Oil
Collar
|
113,502
|
40.00/72.10
|
(2,455)
|
||||||
|
|
Oil
Call Option Sold
|
125,000
|
|
67.00
|
(3,282)
|
|||||
|
|
Oil
Call Option Purchased
|
125,000
|
72.10
|
2,703
|
||||||
|
|
|
|
|
|
||||||
|
2009
|
Oil
Swaps
|
120,000
|
71.00
|
(1,928)
|
||||||
|
|
|
|
|
|
||||||
|
2010
|
Oil
Put Option Purchased
|
120,000
|
75.00
|
1,015
|
||||||
|
|
|
|
|
|
||||||
|
2011
|
Oil
Put Option Purchased
|
120,000
|
80.00
|
986
|
||||||
|
|
Total
fair value liability
|
|
|
$ |
(3,043)
|
|||||
The
fair
value of the Company’s financial derivative contracts at March 31, 2008 are
shown in the accompanying financial statements as follows (in
thousands):
|
Fair
value of commodity derivative:
|
|
|||
|
Current
portion
|
$
|
(3,116
|
)
|
|
|
Long-term
portion
|
73
|
|||
|
Total
fair value liability
|
$
|
(3,043
|
)
|
|
The
natural gas and crude oil prices shown in the above table are based on the
corresponding NYMEX index and have been valued using actively quoted prices
and
quotes obtained from the counterparties to the derivative agreements. The
above
prices represent a weighted average of several contracts entered into and
are on
a per MMBtu or per barrel basis for gas and oil derivatives, respectively.
Total
volumes shown for the crude oil collar reflect net volumetric positions with
a
single counterparty under which contracts provide for netting of all settlement
amounts.
F-48
PLATINUM
ENERGY RESOURCES, INC. AND SUBSIDIARIES
NOTES
TO CONDENSED CONSOLIDATED FINANCIAL
STATEMENTS
Note
8 - Price, Interest Rate and Credit Risk Management Activities –
continued
The
following table summarizes the estimated fair value of financial instruments
and
related transactions at March 31, 2008 and December 31, 2007 (in millions):
(The
carrying amount and the fair value (1) are the same for each period
reported.
|
|
March
31,
2008
|
December
31,
2007
|
|||||
|
NYMEX-Related
Commodity Derivative
|
|
|
|||||
|
Market
Positions (1)
|
$
|
3.0
|
$
|
3.0
|
|||
| (1) |
Estimated
fair values have been determined by using available market data
and
valuation methodologies. Judgment is required in interpreting market
data
and the use of different market assumptions or estimation methodologies
may affect the estimated fair value
amounts.
|
Note
9 - Oil and Gas Properties
The
following table sets forth the Company’s costs incurred in oil and gas property
acquisition, exploration and development activities for the period from
January1, 2008 through March 31, 2008:
|
Balance
at January 1, 2008:
|
$
|
170,571,663
|
||
|
Acquisition
of properties
|
||||
|
Proved
|
6,539,139
|
|||
|
Unproved
|
-
|
|||
|
|
||||
|
Exploration
Costs
|
-
|
|||
|
|
||||
|
Development
Costs
|
3,602,679
|
|||
|
|
||||
|
Balance
at March 31, 2008:
|
$
|
180,713,481
|
The
following table sets forth the Company’s capitalized costs relating to oil and
gas producing activities at March 31, 2008:
|
Proved
oil and gas properties
|
$
|
180,713,481
|
||
|
Unproved
oil and gas properties
|
-
|
|||
|
|
180,713,481
|
|||
|
|
||||
|
Accumulated
depletion
|
(3,184,093
|
)
|
||
|
|
||||
|
Net
capitalized costs
|
$
|
177,529,388
|
F-49
PLATINUM
ENERGY RESOURCES, INC. AND SUBSIDIARIES
NOTES
TO CONDENSED CONSOLIDATED FINANCIAL STATEMENTS
Note
10 — Litigation
On January
16, 2008, Exxon Mobil Corporation filed a petition in the 270th
District
Court of Harris County, Texas, naming TEC and a third party, Merenco Realty,
Inc., demanding environmental remediation of certain properties in
Tomball, Texas. In 1996, pursuant to an assignment agreement, Exxon Mobil
sold
certain oil and gas leasehold interests and real estate interests in Tomball,
Texas to the Company’s predecessor in interest, Merit Energy Corporation. In
1999, the Company assigned its 50% undivided interest in one of the tracts
in
the acquired property to Merenco, an affiliate of the Company, owned 50%
by the
chairman of the board of the Company, Tim Culp. In October 2007, the Texas
Railroad Commission notified Exxon Mobil of an environmental site assessment
alleging soil and groundwater contamination for a site in the area of Tomball,
Texas. Exxon Mobil believes that the site is one which was sold to the Company
and claims that the Company is obligated to remediate the site under the
assignment agreement. Exxon Mobil has requested that the court declare the
defendants obligated to restore and remediate the properties and has requested
any actual damages arising from breach and attorneys’ fees. The Company believes
that Exxon Mobil’s claim that the Company is responsible for any remediation of
such site is without merit and the Company intends to vigorously defend itself
against this claim. However, no assurance can be given that the Company will
prevail in this matter. The Company acquired substantially all the assets
and
liabilities of TEC in the TEC acquisition. Merenco was not acquired by the
Company in the TEC acquisition and the Company’s chairman, Tim Culp, continues
to have a 50% ownership interest in Merenco.
Note
11 — Subsequent Events
On
April
29, 2008, the Company completed the acquisition of Maverick pursuant to the
Agreement and Plan of Merger (the “Merger Agreement”) entered into on March 18,
2008 among the Company, a wholly-owned subsidiary , Maverick, and Robert
L.
Kovar Services, LLC, as Stockholder Representative. The aggregate consideration
paid in the merger was $6 million in cash and $5 million to be paid over
the
next 6 years pursuant to non-interest bearing cash flow note (the “Cash Flow
Notes”), subject to certain escrows, holdbacks and post-closing adjustments.
Provisions of the Cash Flow Notes require quarterly payments commencing in
June
2008 to the noteholders pro rata equal to 50% of the pre-tax net income,
as
defined in the Merger Agreement, generated by the Maverick business on a
stand
alone basis in the prior quarter. Payment of the Cash Flow Notes can be
accelerated by certain events, including a change in control. The balance
of the
Cash Flow Notes remaining unpaid upon maturity, if any, will be converted
into a
12 month self amortizing note bearing interest at the annual rate of 2% over
the
banks prime rate. In addition, the Company will assume Maverick’s indebtedness
under certain bank and loan arrangements, which aggregate balances, approximated
$4.5 million at January 31, 2008. Maverick’s bank has not consented to continue
of its bank term loan or to its working capital revolving credit line upon
closing. The Sellers agreed to the satisfaction of this bank indebtedness
at
closing in the aggregate amount of $4.9 million with the proceeds of the
cash to
be paid at closing to the Sellers. Subsequent to the closing, upon securing
a
replacement revolving line of credit for Maverick, the amount of the revolving
line of credit repaid at closing ($3.3 million) will be drawn down against
this
line and paid to Robert L. Kovar Services, LLC for distribution to the Sellers.
The remainder of $1.6 million will be paid to selling Maverick shareholders
by
the Company over an approximate 18 month period under the same terms and
conditions as the original term loan with Mavericks original bank. The Cash
Flow
Notes will be payable quarterly at the rate of 50% of pre-tax net income,
as it
is defined in the Merger Agreement, generated by the Maverick business on
a
standalone basis in the preceding quarter. Payment can be accelerated by
certain
events, including change in control of the Company. The purchase price is
also
subject to adjustment for any change in working capital as defined in the
agreement, between October 31, 2007 and the closing date, as well as other
adjustments associated with changes in indebtedness. Any adjustment will
be
treated as a modification of the amount of the Cash Flow Notes and are to
be
determined within 45 days of closing. The balance of the Cash Flow Notes
remaining unpaid upon maturity, if any, will be converted into a 12 month
self
amortizing note bearing interest at the annual rate of 2% over the banks
prime
rate at the time.
F-50
PLATINUM
ENERGY RESOURCES, INC. AND SUBSIDIARIES
NOTES
TO CONDENSED CONSOLIDATED FINANCIAL STATEMENTS
Note
11 — Subsequent Events - continued
Pursuant
to that agreement Mr. Kovar has been appointed as Chief Operating Officer
(“COO”) of the Company and President of Maverick, the Company’s wholly-owned
subsidiary.
The
Employment Agreement provides for an initial term of five years. Pursuant
to the
terms of the Employment Agreement, Mr. Kovar will be paid a $200,000 base
annual
salary and will be eligible for annual performance bonuses in such amount
and at
such times as determined by the Board or the compensation committee, in their
sole discretion. In addition, pursuant to the Employment Agreement, Mr. Kovar
was granted 50,000 options to purchase shares of the Company’s common stock with
an exercise price of $5.15 per share, the closing price on the date of grant,
and will be granted an additional 50,000 stock options on each of the four
succeeding anniversaries of the effective date of the Employment Agreement.
All
options will be issued pursuant to the Company’s 2006 Long Term Incentive Plan
and will be subject to a 5 year vesting schedule, with one-fifth of such
options
vesting on each anniversary of the date of grant, beginning April 29, 2009.
In
the event of a change in control of the Company, the Employment Agreement
provides that all options granted to Mr. Kovar will immediately vest.
Pursuant
to the Employment Agreement, if Mr. Kovar’s employment is terminated by the
Company without cause or Mr. Kovar terminates his employment for good reason,
he
will receive an 18 month severance package and his Cash Flow Note will become
immediately due and payable. If, however, Mr. Kovar’s employment is terminated
by the Company for cause or Mr. Kovar terminates his employment without good
reason, he will receive no severance package and his Cash Flow Note will
be
cancelled.
Mr.
Kovar
has also agreed that during the term of his employment with the Company and
for
an 18 month period thereafter, he will not compete with the Company nor solicit
its employees. If Mr. Kovar breaches any of these obligations, he would forfeit
his right to any severance payments and benefits to which he otherwise would
be
entitled.
F-51
REPORT
OF INDEPENDENT CERTIFIED PUBLIC ACCOUNTANTS
To
the
Stockholders of
Tandem
Energy Holdings, Inc.
We
have
audited the consolidated balance sheets of Tandem Energy Holdings, Inc.,
a
Nevada corporation, (“Tandem”) successor to Tandem Energy Corporation as of
October 26, 2007 and December 31, 2006, and the related consolidated statements
of operations, stockholders’ equity (deficit), and cash flows for the period
from January 1, 2007 through October 26, 2007 and the years ended December
31,
2006 and 2005. These financial statements are the responsibility of Tandem’s
management. Our responsibility is to express an opinion on these financial
statements based on our audits.
We
conducted our audits in accordance with auditing standards generally accepted
in
the United States of America. Those standards require that we plan and perform
the audit to obtain reasonable assurance about whether the financial statements
are free of material misstatement. An audit includes consideration of internal
control over financial reporting as a basis for designing audit procedures
that
are appropriate in the circumstances, but not for the purpose of expressing
an
opinion on the effectiveness of Tandem’s internal control over financial
reporting. Accordingly, we express no such opinion. An audit also includes
examining, on a test basis, evidence supporting the amounts and disclosures
in
the financial statements, assessing the accounting principles used and
significant estimates made by management, as well as evaluating the overall
financial statement presentation. We believe that our audits provide a
reasonable basis for our opinion.
As
discussed in Note 15, on October 26, 2007, Tandem consummated an agreement
whereby a publicly-owned entity acquired all of the assets and assumed all
of
the liabilities of Tandem’s wholly-owned subsidiary, Tandem Energy Corporation.
The accompanying financial statements are presented on a basis immediately
prior
to the sale.
In
our
opinion, the consolidated financial statements, referred to above, present
fairly, in all material respects, Tandem’s financial position at October 26,
2007 and December 31, 2006, and the results of its operations and its cash
flows
for the period from January 1, 2007 through October 26, 2007 and the years
ended
December 31, 2006 and 2005, in conformity with accounting principles generally
accepted in the United States of America.
/s/
Johnson Miller & Co. CPA’s, PC
Midland,
Texas
March
6,
2008
F-52
TANDEM
ENERGY HOLDINGS, INC.
(Successor
to Tandem Energy Corporation)
CONSOLIDATED
BALANCE SHEETS
October
26, 2007 and December 31, 2006
|
|
2007
|
2006
|
|||||
|
ASSETS
|
|
|
|||||
|
Current
assets
|
|
|
|||||
|
Cash
and cash equivalents
|
$
|
3,059,774
|
$
|
2,482,608
|
|||
|
Accounts
receivable:
|
|||||||
|
Oil
and gas sales
|
1,657,495
|
1,551,494
|
|||||
|
Affiliates
and other, net
|
266,462
|
493,120
|
|||||
|
Inventory
|
85,582
|
73,781
|
|||||
|
Federal
income tax receivable
|
15,345
|
—
|
|||||
|
Other
current assets
|
386,377
|
301,578
|
|||||
|
Total
current assets
|
5,471,035
|
4,902,581
|
|||||
|
Property
and equipment, at cost
|
|||||||
|
Oil
and gas properties, full cost method
|
36,753,241
|
35,639,538
|
|||||
|
Other
|
1,426,089
|
1,271,035
|
|||||
|
Less
accumulated depreciation, depletion and amortization
|
(7,785,307
|
)
|
(5,635,280
|
)
|
|||
|
Property
and equipment, net
|
30,394,023
|
31,275,293
|
|||||
|
Other
assets
|
|||||||
|
Investment
in partnership
|
30,001
|
30,001
|
|||||
|
Deferred
fees, net of amortization
|
—
|
111,109
|
|||||
|
Real
estate held for development
|
584,045
|
584,167
|
|||||
|
Total
other assets
|
612,046
|
725,277
|
|||||
|
Total
assets
|
$
|
36,477,104
|
$
|
36,903,151
|
|||
|
LIABILITIES
AND STOCKHOLDERS’ EQUITY (DEFICIT)
|
|||||||
|
Current
liabilities
|
|||||||
|
Accounts
payable
|
|||||||
|
Trade
|
$
|
1,343,773
|
$
|
970,894
|
|||
|
Oil
and gas sales
|
280,236
|
395,528
|
|||||
|
Current
portion of long-term debt
|
20,500,000
|
1,750,000
|
|||||
|
Fair
value of commodity derivatives
|
3,245,676
|
633,073
|
|||||
|
Current
income taxes payable
|
—
|
123,053
|
|||||
|
Asset
retirement obligation - current
|
186,545
|
177,411
|
|||||
|
Accrued
liabilities and other
|
563,760
|
936,712
|
|||||
|
Total
current liabilities
|
26,119,990
|
4,986,671
|
|||||
|
Long-term
debt, net of current portion
|
21,000,000
|
40,250,000
|
|||||
|
Fair
Fair value of commodity derivatives - non-current
|
961,754
|
440,873
|
|||||
|
Asset
retirement obligation - non-current
|
1,743,149
|
1,678,296
|
|||||
|
Total
liabilities
|
49,824,893
|
47,355,840
|
|||||
|
Stockholders’
equity (deficit)
|
|||||||
|
Common
stock, $.001 par value, authorized 100,000,000 shares; Shares issued
and
outstanding: 23,777,322 and 23,799,322 respectively
|
23,777
|
23,799
|
|||||
|
Additional
paid-in capital
|
64,231,323
|
64,275,801
|
|||||
|
Retained
earnings (deficit)
|
(77,602,889
|
)
|
(74,752,289
|
)
|
|||
|
Total
stockholders’ equity (deficit)
|
(13,347,789
|
)
|
(10,452,689
|
)
|
|||
|
Total
liabilities and stockholders’ equity (deficit)
|
$
|
36,477,104
|
$
|
36,903,151
|
|||
The
accompanying summary of accounting policies and footnotes are an integral
part
of these financial statements.
F-53
TANDEM
ENERGY HOLDINGS, INC.
(Successor
to Tandem Energy Corporation)
CONSOLIDATED
STATEMENTS OF OPERATIONS
For
the Period January 1, 2007 through October 26, 2007 and Years Ended December
31,
2006 and 2005
|
|
2007
|
2006
|
2005
|
|||||||
|
Revenues
|
|
|
|
|||||||
|
Oil
and gas sales
|
$
|
13,985,263
|
$
|
18,051,060
|
$
|
14,249,449
|
||||
|
Costs
and expenses
|
||||||||||
|
Lease
operating expense
|
5,499,538
|
6,516,711
|
4,273,420
|
|||||||
|
General
and administrative
|
2,912,083
|
2,836,837
|
1,824,676
|
|||||||
|
Stock-based
compensation
|
—
|
—
|
37,605,730
|
|||||||
|
Depreciation,
depletion and amortization
|
2,150,027
|
2,641,315
|
1,915,613
|
|||||||
|
Accretion
of asset retirement obligation
|
116,258
|
137,222
|
120,209
|
|||||||
|
Total
costs and expenses
|
10,677,906
|
12,132,085
|
45,739,648
|
|||||||
|
Operating
income (loss)
|
3,307,357
|
5,918,975
|
(31,490,199
|
)
|
||||||
|
Other
income (expense)
|
||||||||||
|
Interest
expense
|
(2,944,902
|
)
|
(3,503,812
|
)
|
(1,726,583
|
)
|
||||
|
Partnership
income
|
4,600
|
49,877
|
8,399
|
|||||||
|
Change
in fair value of derivatives
|
(3,636,450
|
)
|
3,308,703
|
(5,194,155
|
)
|
|||||
|
Gain
on sale of property and equipment
|
127,021
|
401,470
|
707,239
|
|||||||
|
Other
|
291,774
|
229,054
|
69,794
|
|||||||
|
Total
other income (expense), net
|
(6,157,957
|
)
|
485,292
|
(6,135,306
|
)
|
|||||
|
Income
(loss) before income taxes
|
(2,850,600
|
)
|
6,404,267
|
(37,625,505
|
)
|
|||||
|
Income
tax benefit (expense)
|
||||||||||
|
Current
|
—
|
(109,747
|
)
|
658,264
|
||||||
|
Deferred
|
—
|
—
|
657,850
|
|||||||
|
Total
income tax benefit (expense)
|
—
|
(109,747
|
)
|
1,316,114
|
||||||
|
NET
INCOME (LOSS)
|
$
|
(2,850,600
|
)
|
$
|
6,294,520
|
$
|
(36,309,391
|
)
|
||
|
Earnings
(loss) per share
|
$
|
(.12
|
)
|
.26
|
(1.96
|
)
|
||||
|
Weighted
average shares outstanding
|
23,792,495
|
23,799,322
|
18,514,688
|
|||||||
The
accompanying summary of accounting policies and footnotes are an integral
part
of these financial statements.
F-54
TANDEM
ENERGY HOLDINGS, INC.
(Successor
to Tandem Energy Corporation)
CONSOLIDATED
STATEMENTS OF STOCKHOLDERS’ EQUITY (DEFICIT)
For
the Years Ended December 31, 2005 and 2006 and For the Period January 1,
2007
through October 26, 2007
|
|
Common
Stock
|
|||||||||||||||
|
|
Shares
|
Par
Value
|
Additional
Paid-In Capital
|
Retained
Earnings (Deficit)
|
Total
|
|||||||||||
|
Balance,
January 1, 2005
|
1,000
|
$
|
10
|
$
|
2,710,115
|
$
|
2,582,457
|
$
|
5,292,582
|
|||||||
|
Acquisition
and retirement of treasury stock
|
(500
|
)
|
(5
|
)
|
—
|
(13,015,000
|
)
|
(13,015,005
|
)
|
|||||||
|
Shares
issued in conjunction with:
|
||||||||||||||||
|
Conversion
of TEC shares
|
2,999,500
|
2,995
|
(2,995
|
)
|
—
|
—
|
||||||||||
|
Conversion
of Tandem shares
|
16,322
|
16
|
(16
|
)
|
—
|
—
|
||||||||||
|
Acquisition
of Shamrock assets
|
7,500,000
|
7,500
|
11,992,500
|
—
|
12,000,000
|
|||||||||||
|
Compensation
for management
|
9,243,000
|
9,243
|
33,845,567
|
—
|
33,854,810
|
|||||||||||
|
Compensation
for consultants
|
2,507,000
|
2,507
|
3,748,413
|
—
|
3,750,920
|
|||||||||||
|
Private
placement offerings
|
1,533,000
|
1,533
|
1,482,217
|
—
|
1,483,750
|
|||||||||||
|
Distributions
to shareholders
|
||||||||||||||||
|
Acquisition
of TEC -shares
|
—
|
—
|
10,500,000
|
(10,500,000
|
)
|
—
|
||||||||||
|
Acquisition
of Shamrock assets
|
—
|
—
|
—
|
(11,699,375
|
)
|
(11,699,375
|
)
|
|||||||||
|
Acquisition
of TEC -notes payable
|
—
|
—
|
—
|
(12,000,000
|
)
|
(12,000,000
|
)
|
|||||||||
|
Other
|
—
|
—
|
—
|
(105,500
|
)
|
(105,500
|
)
|
|||||||||
|
Net
loss
|
—
|
—
|
—
|
(36,309,391
|
)
|
(36,309,391
|
)
|
|||||||||
|
Balance,
December 31, 2005
|
23,799,322
|
23,799
|
64,275,801
|
(81,046,809
|
)
|
(16,747,209
|
)
|
|||||||||
|
Net
income
|
—
|
—
|
—
|
6,294,520
|
6,294,520
|
|||||||||||
|
Balance,
December 31, 2006
|
23,799,322
|
23,799
|
64,275,801
|
(74,752,289
|
)
|
(10,452,689
|
)
|
|||||||||
|
Acquisition
and retirement of common stock, at cost
|
(22,000
|
)
|
(22
|
)
|
(44,478
|
)
|
—
|
(44,500
|
)
|
|||||||
|
Net
loss
|
—
|
—
|
—
|
(2,850,600
|
)
|
(2,850,600
|
)
|
|||||||||
|
Balance,
October 26, 2007
|
23,777,322
|
$
|
23,777
|
$
|
64,231,323
|
$
|
(77,602,889
|
)
|
$
|
(13,347,789
|
)
|
|||||
The
accompanying summary of accounting policies and footnotes are an integral
part
of these financial statements.
F-55
TANDEM
ENERGY HOLDINGS, INC.
(Successor
to Tandem Energy Corporation)
CONSOLIDATED
STATEMENTS OF CASH FLOWS
For
the Period January 1, 2007 through October 26, 2007 and Years Ended December
31,
2006 and 2005
|
|
2007
|
2006
|
2005
|
|||||||
|
Cash
flows from operating activities:
|
|
|
|
|||||||
|
Net
income (loss)
|
$
|
(2,850,600
|
)
|
$
|
6,294,520
|
$
|
(36,309,391
|
)
|
||
|
Adjustments
to reconcile net income (loss) to net cash provided by operating
activities:
|
||||||||||
|
Depreciation,
depletion and amortization
|
2,150,027
|
2,641,315
|
1,915,613
|
|||||||
|
Accretion
of asset retirement obligation
|
116,258
|
137,222
|
120,209
|
|||||||
|
Amortization
of deferred loan fees
|
222,223
|
266,669
|
155,555
|
|||||||
|
Partnership
income
|
(4,600
|
)
|
(49,877
|
)
|
(8,399
|
)
|
||||
|
Gain
on sale of real estate held for development
|
(127,021
|
)
|
(401,470
|
)
|
(707,239
|
)
|
||||
|
Change
in fair value of derivatives
|
3,636,450
|
(3,308,703
|
)
|
5,194,155
|
||||||
|
Stock-based
compensation
|
—
|
—
|
37,605,730
|
|||||||
|
Current
income tax benefit
|
—
|
—
|
(630,497
|
)
|
||||||
|
Deferred
income tax benefit
|
—
|
—
|
(657,850
|
)
|
||||||
|
Changes
in operating assets and liabilities:
|
||||||||||
|
Decrease
(increase) in accounts receivable
|
120,657
|
266,633
|
(796,317
|
)
|
||||||
|
Increase
in inventory
|
(11,801
|
)
|
(35,057
|
)
|
(38,724
|
)
|
||||
|
Decrease
(increase) in other current assets
|
(195,913
|
)
|
—
|
700
|
||||||
|
Increase
(decrease) in accounts payable
|
257,587
|
(211,499
|
)
|
618,147
|
||||||
|
Increase
(decrease) in income taxes payable
|
(138,398
|
)
|
753,550
|
(436,387
|
)
|
|||||
|
Increase
(decrease) in accrued liabilities and other
|
(590,245
|
)
|
(119,461
|
)
|
725,852
|
|||||
|
Decrease
in commodity derivatives
|
(285,673
|
)
|
(239,045
|
)
|
(491,736
|
)
|
||||
|
Net
cash provided by operating activities
|
2,298,951
|
5,994,797
|
6,259,421
|
|||||||
|
Cash
flows from investing activities:
|
||||||||||
|
Property
and equipment additions
|
(1,311,028
|
)
|
(7,342,671
|
)
|
(7,518,057
|
)
|
||||
|
Partnership
distributions
|
4,600
|
55,200
|
11,000
|
|||||||
|
Proceeds
from sale of property and equipment
|
—
|
585,099
|
929,469
|
|||||||
|
Decrease
in advance relocation fees
|
—
|
—
|
(173,588
|
)
|
||||||
|
Proceeds
from sale of real estate held for development
|
129,143
|
—
|
—
|
|||||||
|
Net
cash used in investing activities
|
(1,177,285
|
)
|
(6,702,372
|
)
|
(6,751,176
|
)
|
||||
|
Cash
flows from financing activities:
|
||||||||||
|
Long-term
borrowings
|
—
|
—
|
23,000,000
|
|||||||
|
Payment
of bank loan fees
|
—
|
—
|
(825,000
|
)
|
||||||
|
Payments
of bank borrowings
|
(500,000
|
)
|
(500,000
|
)
|
(1,500,000
|
)
|
||||
|
Payments
of notes to former shareholders
|
—
|
—
|
(147,280
|
)
|
||||||
|
Cash
distributions to shareholders
|
—
|
—
|
(8,401,453
|
)
|
||||||
|
Proceeds
from issuance of stock
|
—
|
—
|
1,483,750
|
|||||||
|
Purchase
and retirement of common stock
|
(44,500
|
)
|
—
|
—
|
||||||
|
Acquisition
and retirement of treasury stock
|
—
|
—
|
(13,000,000
|
)
|
||||||
|
Net
cash (used in) provided by financing activities
|
(544,500
|
)
|
(500,000
|
)
|
610,017
|
|||||
|
Net
increase (decrease) in cash and cash equivalents
|
577,166
|
(1,207,575
|
)
|
118,262
|
||||||
|
Cash
and cash equivalents, beginning of year
|
2,482,608
|
3,690,183
|
3,571,921
|
|||||||
|
Cash
and cash equivalents, end of year
|
$
|
3,059,774
|
$
|
2,482,608
|
$
|
3,690,183
|
||||
The
accompanying summary of accounting policies and footnotes are an integral
part
of these financial statements.
F-56
TANDEM
ENERGY HOLDINGS, INC.
(Successor
to Tandem Energy Corporation)
CONSOLIDATED
STATEMENTS OF CASH FLOWS - (continued)
For
the Period January 1, 2007 through October 26, 2007 and Years Ended December
31,
2006 and 2005
|
|
2007
|
2006
|
2005
|
|||||||
|
Non-cash
financing and investing activities:
|
|
|
|
|||||||
|
Asset
retirement cost and obligation
|
$
|
(42,271
|
)
|
$
|
77,545
|
$
|
126,550
|
|||
|
Stock
issued in connection with:
|
||||||||||
|
Shamrock
asset acquisition
|
$
|
—
|
$
|
—
|
$
|
12,000,000
|
||||
|
Distribution
to shareholders
|
$
|
—
|
$
|
—
|
$
|
10,500,000
|
||||
|
Stockholder
distributions financed by note payable
|
$
|
—
|
$
|
—
|
$
|
12,000,000
|
||||
|
Cash
paid during the year for:
|
||||||||||
|
Taxes
|
$
|
40,250
|
$
|
75,327
|
$
|
408,274
|
||||
|
Interest
|
$
|
2,771,510
|
$
|
3,063,202
|
$
|
1,343,398
|
||||
The
accompanying summary of accounting policies and footnotes are an integral
part
of these financial statements.
F-57
TANDEM
ENERGY HOLDINGS, INC.
(Successor
to Tandem Energy Corporation)
NOTES
TO CONSOLIDATED FINANCIAL STATEMENTS
For
the Period January 1, 2007 through October 26, 2007 and Years Ended December
31,
2006 and 2005
Note
1 – Organization, Basis of Presentation and Nature of
Operations
Organization
Tandem
Energy Holdings, Inc. (“Tandem”) is a publicly traded, non-reporting company. It
was originally incorporated in Nevada as Las Vegas Major League Sports, Inc.
(“Las Vegas”) on July 22, 1993, to engage in certain business activities
associated with the Canadian Football League. In April 1994, it completed
an
initial public offering and began trading under the symbol LVTD. In 1996,
Las
Vegas filed for bankruptcy protection and ceased being a reporting company
and
ceased operations. In 1998, Las Vegas changed its name to Pacific Medical
Group,
Inc. (“Pacific”) in connection with a share exchange transaction with a
privately-held company whose business plan was to engage in the manufacture
and
sale of medical products. That business was unsuccessful and Pacific ceased
operations for some years. In February, 2005, Pacific changed its name to
Tandem
Energy Holdings, Inc. and changed its trading symbol to TDYH.PK. In June,
2005,
Tandem Energy Corporation, a privately held Colorado corporation (“TEC”), which
had acquired certain oil and gas assets of Shamrock Energy Corporation, a
privately held Texas corporation (“Shamrock”), became a wholly owned subsidiary
of Tandem. TEC and Shamrock, independent oil and gas E & P
companies headquartered in Midland, Texas, have been engaged in the oil and
gas
industry since 1977 and 2004, respectively.
Basis
of Presentation
The
acquisition by Tandem in June 2005, of all of the outstanding stock of TEC
is
accounted for as a combination of entities under common control, sometimes
referred to hereinafter as the “share exchange.” Consequently, the assets,
liabilities and results of operations presented herein are the historical
results of operations of Tandem and TEC. The financial statements presented
herein are the historical financial statements of the combined entities.
See
Note 3 for a detailed discussion of this transaction.
Nature
of Operations
Tandem
based in Midland, Texas, is engaged in the exploration, development and
production of oil and gas properties located primarily in Texas and New
Mexico.
Substantially
all of Tandem’s oil and gas production is sold under short-term contracts which
are market-sensitive. Accordingly, Tandem’s financial condition, results of
operations and capital resources are highly dependent upon prevailing market
prices of, and demand for, crude oil and natural gas. These commodity prices
are
subject to wide fluctuations and market uncertainties due to a variety of
factors that are beyond the control of Tandem. These factors include the
level
of global demand for petroleum products, foreign supply of oil and gas, the
establishment of and compliance with production quotas by oil-exporting
countries, weather conditions, the price and availability of alternative
fuels,
and overall economic conditions, both foreign and domestic.
Note
2 – Summary of Significant Accounting Policies
Principles
of Consolidation
The
consolidated financial statements include the accounts of Tandem and its
wholly
owned subsidiaries, Tandem Energy Corporation and Mixon Drilling, Inc. All
intercompany balances and transactions have been eliminated.
Estimates
and Assumptions
The
preparation of financial statements in conformity with accounting principles
generally accepted in the United States of America requires management to
make
estimates and assumptions that affect the reported amounts of assets and
liabilities and the disclosure of contingent assets and liabilities as of
the
date of the financial statements and the reported amounts of revenues and
expenses during the reporting period. Actual results could differ from those
estimates. The accounting policy most affected by management’s estimates and
assumptions is the reliance on estimates of proved reserves to compute the
provision for depreciation, depletion and amortization (“DD&A”), and the
determination of any impairment of long-lived assets.
F-58
TANDEM
ENERGY HOLDINGS, INC.
(Successor
to Tandem Energy Corporation)
NOTES
TO CONSOLIDATED FINANCIAL STATEMENTS
Note
2 – Summary of Significant Accounting Policies
- (continued)
Oil
and Gas Properties
TEC
uses
the full cost method of accounting for exploration and development activities
as
defined by the Securities and Exchange Commission (SEC). Under this method
of
accounting, the costs of unsuccessful, as well as successful, exploration
and
development activities are capitalized as properties and equipment. This
includes any internal costs that are directly related to exploration and
development activities but does not include any costs related to production,
general corporate overhead or similar activities. Gain or loss on the sale
or
other disposition of oil and gas properties is not recognized, unless the
gain
or loss would significantly alter the relationship between capitalized costs
and
proved reserves of oil and natural gas attributable to a country. Tandem
has
defined a cost center by country. Currently, all of Tandem’s oil and gas
properties are located within the continental United States.
Properties
and equipment include costs that are excluded from costs being depreciated
or
amortized. Oil and gas costs excluded represent investments in unproved
properties and major development projects in which Tandem owns a direct
interest. These unproved property costs include nonproducing leasehold,
geological and geophysical costs associated with leasehold or drilling interests
and exploration drilling costs. All costs excluded are reviewed at least
quarterly to determine if impairment has occurred. The amount of any impairment
is transferred to the capitalized costs being amortized in the DD&A
pool.
Depreciation,
Depletion and Amortization
The
depreciable base for oil and gas properties includes the sum of capitalized
costs net of accumulated DD&A, estimated future development costs and asset
retirement costs not accrued in oil and gas properties, less costs excluded
from
amortization and salvage. The depreciable base of oil and gas properties
and
mineral investments are amortized using the unit-of-production method based
on
total proved oil and gas reserves. Properties and equipment carrying values
do
not purport to represent replacement or market values.
Proved
Oil and Gas Reserves
In
accordance with Rule 4-10(a) of SEC Regulation S-X, proved oil and gas reserves
are the estimated quantities of crude oil, natural gas, and natural gas liquids
which geological and engineering data demonstrate with reasonable certainty
to
be recoverable in future years from known reservoirs under existing economic
and
operating conditions, i.e., prices and costs as of the date the estimate
is
made. Prices include consideration of changes in existing prices provided
only
by contractual arrangements, but not on escalation based upon future
conditions.
|
|
(i)
|
Reservoirs
are considered proved if economic producibility is supported by
either
actual production or conclusive formation tests. The area of a
reservoir
considered proved includes (A) that portion delineated by drilling
and
defined by gas-oil and/or oil-water contacts, if any; and (B) the
immediately adjoining portions not yet drilled, but which can be
reasonably judged as economically productive on the basis of available
geological and engineering data. In the absence of information
on fluid
contracts, the lowest known structural occurrence of hydrocarbons
controls
the lower proved limit of the
reservoir.
|
|
|
(ii)
|
Reserves
which can be produced economically through application of improved
recovery techniques (such as fluid injection) are included in the
“proved”
classification when successful testing by a pilot project, or the
operation of an installed program in the reservoir, provides support
for
the engineering analysis on which the project or program was
based.
|
|
(iii)
|
Estimates
of proved reserves do not include the
following:
|
|
|
(A)
|
oil
that may become available from known reservoirs but is classified
separately as “indicated additional
reserves”;
|
F-59
TANDEM
ENERGY HOLDINGS, INC.
(Successor
to Tandem Energy Corporation)
NOTES
TO CONSOLIDATED FINANCIAL STATEMENTS
Note
2 – Summary of Significant Accounting Policies
- (continued)
|
|
(B)
|
crude
oil, natural gas, and natural gas liquids, the recovery of which
is
subject to reasonable doubt because of uncertainty as to geology,
reservoir characteristics, or economic
factors;
|
|
|
(C)
|
crude
oil, natural gas, and natural gas liquids, that may occur in
undrilled
prospects; and
|
|
|
(D)
|
crude
oil, natural gas, and natural gas liquids, that may be recovered
from oil
shales, coal, gilsonite and other such
sources.
|
Ceiling
Test
Under
the
full cost method of accounting, a ceiling test is performed each quarter.
The
full cost ceiling test is an impairment test prescribed by SEC Regulation
S-X
Rule 4-10. The ceiling test determines a limit, on a country-by-country basis,
on the book value of oil and gas properties. Currently, all of Tandem’s
operations are located in the United States. The capitalized costs of proved
oil
and gas properties, net of accumulated DD&A and the related deferred income
taxes, may not exceed the estimated future net cash flows from proved oil
and
gas reserves, excluding future cash outflows associated with settling asset
retirement obligations that have been accrued on the balance sheet, generally
using prices in effect at the end of the period held flat for the life of
production and including the effect of derivative instruments that qualify
as
cash flow hedges, discounted at 10%, net of related tax effects, plus the
cost
of unevaluated properties and major development projects excluded from the
costs
being amortized. If capitalized costs exceed this limit, the excess is charged
to expense and reflected as additional accumulated DD&A.
Asset
Retirement Obligation
Tandem
follows the provisions of Statement of Financial Accounting Standards (“SFAS”)
No. 143, Accounting
for Asset Retirement Obligations.
SFAS
No. 143 requires Tandem to recognize a liability for the present value of
all
legal obligations associated with the retirement of tangible, long-lived
assets
and capitalize an equal amount as a cost of the asset. The cost of the
abandonment obligations, less estimated salvage values, is included in the
computation of depreciation, depletion and amortization.
Income
Taxes
Tandem
follows the asset and liability method prescribed by SFAS No. 109, Accounting
for Income Taxes
. Under
this method of accounting for income taxes, deferred tax assets and liabilities
are recognized for the future tax consequences attributable to differences
between the financial statement carrying amounts of existing assets and
liabilities and their respective tax bases. Deferred tax assets and liabilities
are measured using enacted tax rates expected to apply to taxable income
in the
years in which those temporary differences are expected to be recovered or
settled. Under SFAS No. 109, the effect on deferred tax assets and liabilities
of a change in enacted tax rates is recognized in income in the period that
includes the enactment date.
Environmental
Expenditures
Tandem
is
subject to extensive federal, state and local environmental laws and
regulations. These laws regulate the discharge of materials into the environment
and may require Tandem to remove or mitigate the environmental effects of
the
disposal or release of petroleum or chemical substances at various sites.
Environmental expenditures are expensed or capitalized depending on their
future
economic benefit. Expenditures that relate to an existing condition caused
by
past operations and that have no future economic benefits are
expensed.
Liabilities
for expenditures of a non-capital nature are recorded when environmental
assessment and/or remediation is probable, and the costs can be reasonably
estimated. Such liabilities are generally undiscounted unless the timing
of cash
payments for the liability or component is fixed or reliably
determinable.
Hedging
Activities
From
time
to time, Tandem may utilize derivative instruments, consisting of swaps,
floors
and collars, to attempt to reduce its exposure to changes in commodity prices
and interest rates. Tandem accounts for its derivatives
in accordance with SFAS No. 133, Accounting
for Derivative Instruments and Hedging Activities
, as
amended. SFAS No. 133 requires that all derivative instruments be recognized
as
assets or liabilities in the balance sheet, measured at fair value. The
accounting for changes in the fair value of a derivative depends on both
the
intended purpose and the formal designation of the derivative. Designation
is
established at the inception of a derivative, but subsequent changes to the
designation are permitted. Tandem has elected not to designate any of its
derivative financial contracts as accounting hedges and, accordingly, has
accounted for these derivative financial contracts using mark-to-market
accounting. Changes in fair value of derivative instruments which are not
designated as cash flow hedges are recorded in other income (expense) as
changes
in fair value of derivatives.
F-60
TANDEM
ENERGY HOLDINGS, INC.
(Successor
to Tandem Energy Corporation)
NOTES
TO CONSOLIDATED FINANCIAL STATEMENTS
Note
2 – Summary of Significant Accounting Policies
- (continued)
Cash
and Cash Equivalents
Tandem
considers all cash and highly liquid investments with original maturities
of
three months or less to be cash equivalents.
Concentration
of Credit Risk — Cash
Tandem
maintains its cash balances at a single major financial institution. Certain
balances may at times exceed the federally insured limits established by
the
Federal Deposit Insurance Corporation. Tandem has not experienced any losses
in
such accounts and believes it is not exposed to any significant credit
risk.
Inventory
Inventory
consists primarily of tubular goods and other well equipment which Tandem
plans
to utilize in its ongoing exploration and development activities and is carried
at the lower of cost or market value.
Investment
in Partnership
Tandem
uses the equity method to account for its non-operating 33-1/3% interest
in a
real estate partnership.
Real
Estate Held for Development
Tandem’s
real estate held for development is at cost and relates to undeveloped land
located near Tomball, Texas.
Debt
Financing Costs
As
discussed in Note 4, certain financing costs related to Tandem’s revolving line
of credit have been capitalized. The deferred debt financing costs are being
amortized over the term of the financing.
Stock-Based
Compensation
Tandem
has not issued any stock-based compensation to employees for the for the
period
from January 1, 2007 through October 26, 2007 or for the two years ended
December 31, 2006 and 2005, except for the issuance of common stock as
compensation discussed in Notes 3 and 11. Such issuances were recorded at
the
fair value of the stock at the time of issuance. As of October 26, 2007,
Tandem
does not have any other stock-based compensation plans or
obligations.
F-61
TANDEM
ENERGY HOLDINGS, INC.
(Successor
to Tandem Energy Corporation)
NOTES
TO CONSOLIDATED FINANCIAL STATEMENTS
Note
2 – Summary of Significant Accounting Policies
- (continued)
Revenue
Recognition and Gas Balancing
Tandem
utilizes the sales method of accounting for oil, natural gas and natural
gas
liquids revenues whereby revenues, net of royalties, are recognized as the
production is sold to purchasers. The amount of gas sold may differ from
the
amount to which Tandem is entitled based on its revenue interests in the
properties. Tandem did not have any significant gas imbalance positions at
October 26, 2007 or at December 31, 2006 or 2005.
Comprehensive
Income
SFAS
No.
130, Reporting
Comprehensive Income
,
established standards for reporting and displaying comprehensive income and
its
components (revenue, expenses, gains and losses) in a full set of
general-purpose financial statements. There were no differences between net
income and comprehensive income in 2007, 2006 or 2005.
Concentration
Risks
Tandem
sells its oil and natural gas production to various customers, serves as
operator in the drilling, completion and operation of oil and gas wells,
and
from time to time enters into derivatives with various counterparties. When
management deems appropriate, Tandem may obtain letters of credit to secure
amounts due from its significant oil and gas purchasers and follow other
procedures to monitor credit risk from joint owners and derivatives
counterparties.
Accounts
Receivable and Allowance for Doubtful Accounts
Tandem’s
trade receivables consist of receivables from non-operators who own an interest
in properties which Tandem operates. Tandem has the ability and the right
to
withhold oil and gas revenues from any owner who is delinquent in their
payments. At October 26, 2007and December 31, 2006, all trade receivables
were
collectable; therefore, the allowance for doubtful accounts was
zero.
Recent
Accounting Pronouncements
In
September 2006, the Financial Accounting Standards Board (“FASB”) issued
Statement of Financial Accounting Standards (“SFAS”) No. 157, Fair
Value Measurements.
SFAS
157 defines fair value as used in numerous accounting pronouncements,
establishes a framework for measuring fair value in accordance with generally
accepted accounting principles and expands disclosure requirements related
to
the use of fair value measures in financial statements. SFAS 157 will be
effective for the Company’s financial statements for the fiscal year beginning
January 1, 2008; however, earlier application is encouraged.
In
February 2007, the FASB issued SFAS 159, The
Fair Value Option for Financial Assets and Financial Liabilities, Including
an
Amendment of FASB Statement No. 115,
which
will become effective on January 1, 2008. FAS 159 permits entities to
measure eligible financial assets, financial liabilities and firm commitments
at
fair value, on an instrument-by-instrument basis, that are otherwise not
permitted to be accounted for at fair value under other generally accepted
accounting principles. The fair value measurement election is irrevocable
and
subsequent changes in fair value must be recorded in earnings.
F-62
TANDEM
ENERGY HOLDINGS, INC.
(Successor
to Tandem Energy Corporation)
NOTES
TO CONSOLIDATED FINANCIAL STATEMENTS (CONTINUED)
For
the Period January 1, 2007 through October 26, 2007 and the Year Ended December
31, 2006
Note
2 – Summary of Significant Accounting Policies -
(continued)
Recent
Accounting Pronouncements (continued)
In
April 2007, the FASB issued FASB Staff Position FIN 39-1, Amendment
of FASB Interpretation No. 39.
FSP FIN
39-1 clarifies that a reporting entity that is party to a master netting
arrangement can offset fair value amounts recognized for the right to reclaim
cash collateral (a receivable) or the obligation to return cash collateral
(a
payable) against fair value amounts recognized for derivative instruments
that
have been offset under the same master netting arrangement. FSP FIN 39-1
is
effective for financial statements issued for fiscal years beginning after
November 15, 2007.
In
December 2007, the FASB issued SFAS No. 141 (revised 2007),
Business
Combinations (“SFAS
141(R)”), which replaces FASB Statement No. 141. SFAS 141(R) establishes
principles and requirements for how an acquirer recognizes and measures in
its
financial statements the identifiable assets acquired, the liabilities assumed,
any non- controlling interest in the acquiree and the goodwill acquired.
The
Statement also establishes disclosure requirements that will enable users
to
evaluate the nature and financial effects of the business combination. SFAS
141(R) is effective for acquisitions that occur in an entity’s fiscal year that
begins after December 15, 2008.
In
December 2007, the FASB issued SFAS No. 160, Noncontrolling
Interests in Consolidated Financial Statements—an amendment of ARB
No. 51.
SFAS
160 requires that accounting and reporting for minority interests will be
recharacterized as noncontrolling interests and classified as a component
of
equity. SFAS 160 also establishes reporting requirements that provide sufficient
disclosures that clearly identify and distinguish between the interests of
the
parent and the interests of the noncontrolling owners. SFAS 160 applies to
all
entities that prepare consolidated financial statements, except not-for-profit
organizations, but will affect only those entities that have an outstanding
noncontrolling interest in one or more subsidiaries or that deconsolidate
a
subsidiary. This statement is effective as of the beginning of an entity’s first
fiscal year beginning after December 15, 2008.
As
a
result of the sale of TEC’s assets on October 26, 2007, as more fully described
in Note 15, these recent accounting pronouncements will have no future impact
on
the Company.
Note
3 – Common Stock and Significant Transactions
The
following is a description of Tandem’s common stock transactions and other
significant events:
|
Date
|
|
Description
of Transaction
|
|
Issuance
(Cancellation) of Shares of Common Stock
|
|
|
February
2005(1)
|
|
Acquisition
of control of Pacific
|
|
16,322
|
|
|
March
1, 2005(2)
|
|
Proposed
acquisitions of TEC and Shamrock by Tandem Energy Holdings, Inc.
(Texas)
|
|
—
|
|
|
March
7, 2005(1)
|
|
Shares
issued to sole officer and director (Mortensen)
|
|
20,000,000
|
|
|
March
8, 2005(3)
|
|
Shares
issued to third parties
|
|
2,000,000
|
|
|
March
16, 2005(3)
|
|
Shares
issued to third parties
|
|
250,000
|
|
|
March
17, 2005(4)
|
|
Cancellation
of shares issued to Mortensen
|
|
(20,000,000)
|
|
|
March
17, 2005(4)
|
|
Issuance
of shares to TEC/Shamrock control group and former director
Mortensen
|
|
20,000,000
|
|
|
May
31, 2005(5)
|
|
Original
TEC and Shamrock purchase agreements terminated
|
|
—
|
|
|
June
1, 2005(5)
|
|
Cancellation
of shares issued to TEC/Shamrock control group and former director
Mortensen
|
|
(20,000,000)
|
|
|
June
1, 2005(6)
|
|
Restated
acquisition agreements of TEC and Shamrock
|
|
—
|
F-63
TANDEM
ENERGY HOLDINGS, INC.
(Successor
to Tandem Energy Corporation)
NOTES
TO CONSOLIDATED FINANCIAL STATEMENTS
Note
3 – Common Stock and Significant
Transactions - (continued)
|
Date
|
|
Description
of Transaction
|
|
Issuance
(Cancellation) of
Shares
of Common Stock
|
||
|
June
1, 2005(7)
|
|
Issuance
of shares to Tandem management as compensation
|
|
9,143,000
|
||
|
June
8, 2005(8)
|
|
Acquisition
and retirement of Tandem treasury stock
|
|
—
|
||
|
June
8, 2005(9)
|
|
Shares
issued for acquisition of Shamrock assets
|
|
7,500,000
|
||
|
June
8, 2005(10)
|
|
Shares
issued for acquisition of TEC stock
|
|
3,000,000
|
||
|
June
14, 2005(7)
|
|
Shares
issued to related party
|
|
100,000
|
||
|
June-July
2005(7)
|
|
Shares
issued for compensation
|
|
257,000
|
||
|
|
|
Total
shares issued
|
|
20,000,000
|
||
|
June
14, 2005(11)
|
|
Shares
issued in connection with private
placement offering
|
|
1,533,000
|
||
|
|
|
Total
shares outstanding
|
|
23,799,322
|
||
1.
Acquisition of Control of Pacific
In
mid-March 2005, a group of promoters, including Mr. Lyle Mortensen
(“Mortensen”), claimed to have acquired control of Pacific Medical Group, which
in February 2005 had changed its name to Tandem and declared a 1 for 500
reverse
stock split resulting in 16,322 shares of common stock outstanding. Mr.
Mortensen was named sole officer and director, and on March 7, 2005, he issued
himself 20,000,000 shares of common stock.
2.
Proposed Acquisitions of TEC and Shamrock
In
February 2005, Mr. Mortensen had incorporated a new privately held Texas
corporation (Tandem, Texas) to facilitate the acquisition of TEC and the
Shamrock Assets. It was intended that Tandem, Texas would then be rolled
up into
Tandem.
On
March
1, 2005, Tandem (Texas) entered into agreements to purchase the common stock
of
TEC and certain oil and gas properties owned by Shamrock to be completed
no
later than May 31, 2005. See the discussion below under the captions “
9 — Acquisition
of Shamrock Assets by Tandem”
and
“
10 — Acquisition
of TEC
.”
3.
Shares Issued to Third Parties
In
conjunction with its formation, on March 8, 2005 and March 16, 2005, Tandem
issued 2,000,000 and 250,000 shares, respectively, to third parties and recorded
compensation expense of $2,680,000 and $335,000, respectively, ($1.34 per
share)
based on Tandem’s average closing trading price on the OTC Pink Sheet system two
days before and two days after the transaction (the “average trading
price”).
4.
March 17, 2005 Cancellation and Issuance of Common Stock
On
March
17, 2005, in anticipation of the fulfillment of the March 1, 2005 proposed
TEC
and Shamrock acquisitions, Mortensen cancelled the 20,000,000 shares issued
to
himself on March 7, 2005, and on March 17, 2005, Mortensen, as sole officer
and
director, issued 20 million restricted shares of common stock to a group
comprised of Mortensen, principals of Tandem and Shamrock (Tim Culp, Dyke
Culp
and Jack Chambers) and others.
On
March
30, 2005, Mortensen appointed certain TEC and Shamrock owners and management
members as officers and directors of Tandem and immediately resigned as officer
and director.
5.
Termination of Original TEC/Shamrock Acquisition Agreements and Cancellation
of
Stock
On
May
31, 2005, the original TEC/Shamrock acquisition agreements terminated due
to the
inability to secure the necessary financing. As a result of the terminations,
on
June 1, 2005, Tandem’s new board of directors
cancelled all 20 million shares of common stock issued on March 17, 2005,
for
lack of consideration, and that they were issued in connection with the
fulfillment of the acquisition of Tandem, Texas by Tandem, which never
occurred.
F-64
TANDEM
ENERGY HOLDINGS, INC.
(Successor
to Tandem Energy Corporation)
NOTES
TO CONSOLIDATED FINANCIAL STATEMENTS
Note
3 – Common Stock and Significant Transactions
- (continued)
All
of
the cancelled 20 million shares were subsequently returned to Tandem, except
for
2.878 million shares controlled by Mortensen. Management of TEC believes
that
all of the shares controlled by Mortensen are null and void. See the additional
discussion below under the captions “7 — Compensation
Shares”
with
respect to any resolution of Mortensen’s 2.878 million shares.
6.
Revised TEC/Shamrock Purchase Agreements
On
June
1, 2005, after the May 31, 2005 termination of the original TEC/Shamrock
purchase agreements, management of TEC revised and restated the TEC/Shamrock
purchase agreements.
7.
Compensation Shares
On
June
1, 2005, Tandem issued to Tandem’s management team and other related parties
9,143,000 compensation shares valued at $33,554,810 ($3.67 per share) and,
on
June 14, 2005, 100,000 compensation shares to others valued at $300,000 ($3.00
per share), based on the average trading price at date of issuance. All
management shares were restricted and subject to a voting
agreement.
Mortensen
is contesting Tandem’s cancellation of his 2.878 million shares of common stock.
Although management believes Mortensen’s claim is without merit, if Mortensen is
partially or completely successful, certain members of Tandem’s management team
have agreed to reduce their compensation shares for any Mortensen shares
and to
reimburse Tandem for any related expense. Accordingly, any resolution of
the
Mortensen’s shares will have no effect on Tandem’s total shares outstanding or
its results of operations.
In
addition, during June-July 2005, TEC issued 257,000 compensation shares valued
at $735,920 (ranging from $1.96-$3.67 per share), based on the average trading
price at date of issuance.
The
following is a summary of TEC’s compensation share expense for the year ended
December 31, 2005:
|
|
Date
Issued
|
Shares
|
Expense
|
|||||||
|
Third
parties(3)
|
March
8, 2005
|
2,250,000
|
$
|
3,015,000
|
||||||
|
Management
|
June
1, 2005
|
9,143,000
|
33,554,810
|
|||||||
|
Related
party
|
June
14, 2005
|
100,000
|
300,000
|
|||||||
|
Others
|
June-July
2005
|
257,000
|
735,920
|
|||||||
|
Total
|
11,750,000
|
$
|
37,605,730
|
|||||||
8.
Acquisition and Retirement of TEC Treasury Stock
Historically,
TEC was owned equally by Joe C. Bullard and Tim G. Culp, who served as its
president and vice president, respectively. Prior to 2002, the spouses of
Culp
and Bullard also owned shares. Under a stock redemption agreement executed
in
2002, the spouses redeemed their shares for notes which required annual payments
until the notes were satisfied. These notes were paid in full during the
second
quarter of 2005.
On
June
8, 2005, in conjunction with the revised and restated TEC/Shamrock purchase
agreements and pursuant to a share redemption agreement, TEC repurchased
and
retired as treasury stock one-half of its outstanding common shares owned
by
Bullard for $13.0 million and cancelled a $15,000 note receivable, funded
by
proceeds of the revolving line of credit discussed in Note 6 to the Consolidated
Financial Statements. As a result, Tim Culp became the sole shareholder of
TEC.
F-65
TANDEM
ENERGY HOLDINGS, INC.
(Successor
to Tandem Energy Corporation)
NOTES
TO CONSOLIDATED FINANCIAL STATEMENTS
Note
3 – Common Stock and Significant Transactions
- (continued)
9.
Acquisition of Shamrock Assets by Tandem
Historically,
Shamrock was owned equally by Tim Culp, his brother Dyke Culp, and Jack
Chambers. At date of acquisition, TEC’s then sole stockholder owned or
controlled a two-thirds interest in Shamrock, the other one-third interest
was
owned or controlled by an unrelated third party. Accordingly, the acquisition
of
the two-thirds Shamrock interest has been accounted for as a combination
of
entities under common control using carryover historical costs, and the
acquisition of the remaining one-third Shamrock interest has been accounted
for
as a purchase in accordance with SFAS No. 141, Business
Combinations
.
The
following is a summary of the combination of entities under common control
related to the two-thirds Shamrock interest:
|
Consideration
paid to predecessor shareholder:
|
|
|||
|
Cash
paid
|
$
|
5.3
million
|
||
|
Issuance
of note payable
|
6.0
million
|
|||
|
Repayment
of certain debt
|
3.2
million
|
|||
|
Issuance
of 3.5 million shares valued at average trading price of $3.00
per
share
|
10.5
million
|
|||
|
Total
consideration paid
|
25.0
million
|
|||
|
Less
historic cost basis of net assets acquired
|
2.8
million
|
|||
|
Distribution
to predecessor shareholder
|
$
|
22.2
million
|
||
The
following is a summary of the purchase of the one-third Shamrock
interest:
|
Cash
paid
|
$
|
2.6
million
|
||
|
Issuance
of note payable
|
3.0
million
|
|||
|
Repayment
of certain debt
|
1.6
million
|
|||
|
Issuance
of 4.0 million shares valued at average trading price of $3.00
per
share
|
12.0
million
|
|||
|
Total
purchase price
|
$
|
19.2
million
|
The
following is a summary of the Shamrock acquisition transactions:
|
Cost
basis of assets acquired:
|
|
|||
|
$
|
2.8
million
|
|||
|
One-third
interest
|
19.2
million
|
|||
|
Total
assets acquired
|
22.0
million
|
|||
|
Distribution
to predecessor shareholder
|
22.2
million
|
|||
|
Total
consideration paid
|
$
|
44.2
million
|
||
The
results of operations of Shamrock’s oil and gas properties have been recorded in
TEC’s consolidated financial statements since the June 1, 2005 acquisition date.
Reference is made to Note 14 of the Consolidated Financial Statements for
further discussion of the Shamrock acquisition.
10.
Acquisition of TEC
On
June
8, 2005, pursuant to a restated purchase agreement, Tandem acquired the
remaining 500 shares of capital stock outstanding in TEC from Tim Culp in
exchange for 3.0 million shares of Tandem common stock and a note payable
of
$12.0 million. The 3.0 million shares of Tandem common stock were valued
at the
historic cost basis of the 500 shares of TEC common stock and the $12.0 million
note payable is reflected as a distribution to the Tandem
shareholder.
F-66
TANDEM
ENERGY HOLDINGS, INC.
(Successor
to Tandem Energy Corporation)
NOTES
TO CONSOLIDATED FINANCIAL STATEMENTS
Note
3 – Common Stock and Significant Transactions
- (continued)
Since
TEC
was owned 100% by Tim Culp, and since Culp controlled more than 50% of Tandem,
the acquisition of TEC by Tandem has been accounted for as a combination
of
entities under common control using Tandem’s and TEC’s carryover historical cost
basis.
Since
the
business combination is accounted for as a combination of entities under
common
control, no purchase value adjustment for Tandem or TEC is appropriate or
necessary. Consequently, the consolidated financial statements presented
herein
are the historical results of operations of both TEC and Tandem.
11.
Private Placement Offering
On
March
30, 2005, in contemplation of original March 1, 2005 proposed TEC and Shamrock
acquisitions, Tandem began a 2,000,000 private placement offering at $1.00
per
share. On June 14, 2005, Tandem closed the private placement offering and
issued
1,533,000 shares of common stock and received net proceeds of approximately
$1.5
million. The net proceeds are being used for general operating
purposes.
12.
Purchase and Retirement of Stock
On
September 7, 2007 and September 11, 2007, Tandem purchased 10,000 and 12,000
shares of Common Stock, respectively, from third parties in private transactions
for $44,500. These shares have been retired and are no longer carried as
outstanding at October 26, 2007.
Note
4 – Other Current Assets
Financing
costs totaling $800,000 relating to Tandem’s revolving line of credit, as
discussed in Note 6, were capitalized during 2005. Tandem is amortizing these
costs to expense over the term of the financing; the portion included in
other
current assets at October 26, 2007 and December 31, 2007 was $155,553 and
$222,223, respectively.
Note
5 – Asset Retirement Obligation
The
following table summarizes the changes in the Tandem’s asset retirement
obligation for the years ended December 31, 2005 and 2006 and for the period
from January 1, 2007 through October 26, 2007 as follows:
|
Balance,
January 1, 2005
|
$
|
602,938
|
||
|
Additions
related to new properties
|
126,550
|
|||
|
Additions
related to acquisition of Shamrock properties
|
791,243
|
|||
|
Accretion
expense
|
120,209
|
|||
|
Balance,
December 31, 2005
|
1,640,940
|
|||
|
Additions
related to new properties
|
77,545
|
|||
|
Accretion
expense
|
137,222
|
|||
|
Balance,
December 31, 2006
|
1,855,707
|
|||
|
Revisions
of previous estimates
|
(42,271
|
)
|
||
|
Accretion
expense
|
116,258
|
|||
|
Balance,
October 26, 2007
|
$
|
1,929,694
|
Note
6 – Long-Term Debt
TEC’s
long-term debt at October 26, 2007 and December 31, 2006 consisted of the
following:
|
|
October
26, 2007
|
December
31, 2006
|
|||||
|
Revolving
line of credit
|
$
|
20,500,000
|
21,000,000
|
||||
|
Notes
to former TEC and Shamrock owners
|
21,000,000
|
21,000,000
|
|||||
|
Total
long-term debt
|
41,500,000
|
42,000,000
|
|||||
|
Less
current portion of long-term debt
|
(20,500,000
|
)
|
(1,750,000
|
)
|
|||
|
Long-term
debt, net of current portion
|
$
|
21,000,000
|
40,250,000
|
||||
F-67
TANDEM
ENERGY HOLDINGS, INC.
(Successor
to Tandem Energy Corporation)
NOTES
TO CONSOLIDATED FINANCIAL STATEMENTS
Revolving
Line of Credit
On
June
8, 2005, TEC entered into a revolving line of credit agreement with a bank
to
provide an initial borrowing base of up to $23.0 million. The borrowing base
is
reduced by payments of $250,000 each month beginning July 1, 2005, and the
lender may redetermine the borrowing base at its discretion. The revolving
line
of credit expires June 8, 2008. Under the terms of the third amendment to
the
credit agreement, dated September 21, 2006, and in anticipation of the impending
asset sale referred to in Note 15, the borrowing base was set at $21.35 million
and the mandatory principal reduction requirement was waived until December
1,
2006. The December 1, 2006 principle reduction requirement was waived. On
June
1, 2007, under the terms of the fourth amendment to the credit agreement,
the
new borrowing base was set at $21.1 million with mandatory principle reduction
requirements of $250,000 per month beginning October 1, 2007. Since the
revolving line of credit is due on June 8, 2008, TEC has reclassed the entire
$20,500,000 as current as of October 26, 2007. As discussed more fully in
Note
15, the sale of the assets of TEC to Platinum Energy Resources, Inc., (Platinum)
was consummated on October 26, 2007. TEC assigned all rights and obligations
under the credit facility to Platinum. Pursuant to the amended credit facility,
a new borrowing base was set at $5,000,000. All outstanding borrowings under
the
Credit Agreement were paid off at the closing of the acquisition by
Platinum. The
revolving line of credit, which is secured by Tandem’s oil and gas properties,
bears interest at either the bank’s base rate or LIBOR, plus a margin which
varies with the ratio of Tandem’s outstanding borrowings to a defined borrowing
base. Tandem can choose periodically to change the interest rate base which
applies to outstanding borrowings. As of October 26, 2007, $20.25 million
due
under the revolving line of credit bears interest payable at LIBOR plus 2.25%
(7.09%), and $250,000 due under a floating rate loan bears interest at prime
(7.75%).
Under
the
terms of revolving line of credit agreement, Tandem must maintain certain
financial ratios, must repay any amounts due in excess of the borrowing base,
and may not declare any dividends or enter into any transactions resulting
in a
change in control, without the lender’s consent. In connection with the
revolving line of credit, Tandem entered into crude oil and natural gas
derivative swaps, puts and calls discussed in Note 9.
Notes
to Former TEC and Shamrock Owners
Tandem
issued a note payable to the sole stockholder of TEC as part of the overall
consideration for the share exchange in 2005 when Tandem acquired TEC. Such
note, in the principle amount of $12.0 million, bears interest at a national
bank’s prime rate (7.75% at October 26, 2007) payable monthly. Interest only is
due through May 31, 2009, at which point the note and any unpaid interest
is due
in full.
TEC
issued notes payable to three individuals as part of the overall consideration
for the acquisition of the Shamrock properties in 2005. Such notes, in the
aggregate totaling $9.0 million, bear interest at a national bank’s prime rate
(7.75% at October 26, 2007) payable monthly. Interest is due through May
31,
2009, at which point the note and any unpaid interest is due in full.
Scheduled
Maturities
Annual
maturities of TEC’s long-term debt for the periods ended October 26 are as
follows:
|
2008
|
$
|
20,500,000
|
||
|
2009
(1)
|
21,000,000
|
|
(1)
|
As
discussed more fully in Note 15, the sale of the assets of TEC
to Platinum
Energy Resources, Inc., was consummated on October 26, 2007. All
outstanding notes and the bank loan balance ($41,500,000, plus
accrued
interest) were paid off at the closing of the
Acquisition.
|
TANDEM
ENERGY HOLDINGS, INC.
(Successor
to Tandem Energy Corporation)
NOTES
TO CONSOLIDATED FINANCIAL STATEMENTS
Note
7 – Income Taxes
Deferred
tax assets and liabilities are the result of temporary differences between
the
financial statement carrying values and the tax basis of assets and liabilities.
For the period ended October 26, 2007 and the years ended December 31,
2006 and
2005, Tandem’s income tax benefit (expense) is summarized as
follows:
|
Current
|
Deferred
|
Total
|
||||||||
|
Period
ended October 26, 2007:
|
||||||||||
|
State
income tax benefit (expense)
|
$
|
—
|
—
|
—
|
||||||
|
Federal
income tax benefit ( expense)
|
—
|
—
|
—
|
|||||||
|
$
|
—
|
—
|
—
|
|
|
Current
|
Deferred
|
Total
|
|||||||
|
Year
ended December 31, 2006:
|
|
|
|
|||||||
|
State
income tax benefit (expense)
|
$
|
—
|
—
|
—
|
||||||
|
Federal
income tax benefit (expense)
|
(109,747
|
)
|
—
|
(109,747
|
)
|
|||||
|
|
$
|
(109,747
|
)
|
—
|
(109,747
|
)
|
||||
|
|
Current
|
Deferred
|
Total
|
|||||||
|
Year
ended December 31, 2005:
|
|
|
|
|||||||
|
State
income tax benefit (expense)
|
$
|
—
|
—
|
—
|
||||||
|
Federal
income tax benefit (expense)
|
658,264
|
657,850
|
1,316,114
|
|||||||
|
|
$
|
658,264
|
657,850
|
1,316,114
|
||||||
Income
tax benefit (expense) for the period ended October 26, 2007 and the years
ended
December 31, 2006 and 2005, differs from the expected amount based on Tandem’s
income (loss) before income taxes computed at the federal statutory income
tax
rate as follows:
|
October
26,
|
||||||||||
|
|
2007
|
2006
|
2005
|
|||||||
|
Income
tax benefit (expense) computed at statutory rate
|
$
|
969,204
|
(2,177,451
|
)
|
12,792,672
|
|||||
|
Statutory
depletion
|
—
|
—
|
483,123
|
|||||||
|
Nondeductible
expenses and other
|
(461
|
)
|
(1,111
|
)
|
(4,195
|
)
|
||||
|
Alternative
minimum tax
|
—
|
(34,421
|
)
|
—
|
||||||
|
Utilization
(carryover) of net operating losses
|
(968,743
|
)
|
2,103,236
|
(11,955,486
|
)
|
|||||
|
Total
income tax benefit (expense)
|
$
|
—
|
(109,747
|
)
|
1,316,114
|
|||||
At
October 26, 2007, Tandem’s future financial and tax net operating loss
carryforward benefits were approximately $8.5 million and $3.8 million,
respectively, and are available to reduce future income taxes. If not utilized,
the carryforwards will expire in 2027.
Note
8 – Marketing Arrangements and Major Customers
Tandem
sells substantially all of its crude oil production under short-term contracts
based on prices quoted on the New York Mercantile Exchange (“NYMEX”) for spot
West Texas Intermediate contracts, less agreed-upon deductions which vary
by
grade of crude oil.
F-69
TANDEM
ENERGY HOLDINGS, INC.
(Successor
to Tandem Energy Corporation)
NOTES
TO CONSOLIDATED FINANCIAL STATEMENTS
The
majority of Tandem’s natural gas production is sold under short-term contracts
based on pricing formulas which are generally market responsive. From time
to
time, Tandem may also sell a portion of the gas production under short-term
contracts at fixed prices. Tandem believes that the loss of any of its oil
and
gas purchasers would not have a material adverse effect on its results of
operations due to the availability of other purchasers.
During
the period ended October 26, 2007, three customers accounted for approximately
68% and for the years ended December 31, 2006 and 2005, two customers accounted
for approximately 80% and 77%, respectively, of Tandem’s crude oil and natural
gas revenues. Tandem believes that the loss of any of Tandem’s significant
customers would not create a financial risk as Tandem’s oil and gas production
can be sold to others at similar prices.
Note
9 – Price, Interest Rate and Credit Risk Management
Activities
Price
and Interest Rate Risks
Tandem
engages in price risk management activities from time to time. These activities
are intended to manage Tandem’s exposure to fluctuations in commodity prices for
natural gas and crude oil. Tandem utilizes derivative financial instruments,
primarily price collars, puts and calls, as the means to manage this price
risk.
In addition to these financial transactions, Tandem is a party to various
physical commodity contracts for the sale of hydrocarbons that cover varying
periods of time and have varying pricing provisions. Under SFAS No. 133,
Accounting
for Derivative Instruments and Hedging Activities,
as
amended by SFAS Nos. 137, 138 and 149, these various physical commodity
contracts qualify for the normal purchases and normal sales exception and
therefore, are not subject to hedge accounting or mark-to-market accounting.
The
financial impact of these various physical commodity contracts is included
in
revenues at the time of settlement, which in turn affects average realized
hydrocarbon prices.
During
2006 and 2005, as discussed in Note 6, Tandem’s revolving line of credit
required Tandem to execute various crude oil and natural gas swaps, collars,
puts and calls (derivative financial instruments). Tandem has elected not
to
designate any of its derivative financial contracts as accounting hedges
and,
accordingly, has accounted for these derivative financial contracts using
mark-to-market accounting. For the period ended October 26, 2007, Tandem
recognized losses on its hedging activities of $4.2 million, including a
mark-to-market loss of $3.7 million at October 26, 2007. For the year ended
December 31, 2006, Tandem recognized gains on its hedging activities of
$3.3 million, including a mark-to-market gain of $3.5 million at
December 31, 2006. For the year ended December 31, 2005, Tandem recognized
losses on its hedging activities of $5.2 million, including a mark-to-market
loss of $4.7 million at December 31, 2005, and a $0.5 million cash charge
for
settled contracts.
Presented
below is a summary of Tandem’s crude oil and natural gas derivative financial
contracts at October 26, 2007, with crude oil prices expressed in dollars
per
barrels of crude oil and notional crude oil volumes in barrels of crude oil
per
year; and natural gas prices expressed in dollars per million British thermal
units ($/MMBtu) and notional natural gas volumes in million British thermal
units per year (MMBtuy). As indicated, Tandem does not have any financial
derivative contracts that extend beyond October 2009.
Tandem
accounts for its financial derivative contracts using mark-to-market accounting.
The total fair value of the crude oil and natural gas financial derivative
contracts at October 26, 2007, was a liability of approximately
$4.2 million. The sale of TEC’s assets, as more fully described in Note 15,
includes the derivative contracts and the associated liabilities described
herein.
|
Period
|
|
Instrument
Type
|
|
Total
Volumes
(MMBTU/BBL)
|
|
Weighted
Average (Floor/Ceiling)
|
|
Fair
Value Asset/ (Liability) (stated in thousands)
|
|
2008
|
|
Gas
Collar
|
462,000
|
5.00/11.02
|
(15)
|
|||
|
|
|
Gas
Call Option Sold
|
462,000
|
|
9.10
|
(309)
|
||
|
|
|
Gas
Call Option Purchased
|
462,000
|
|
12.00
|
101
|
||
|
|
|
Gas
Put Option Sold
|
462,000
|
5.00
|
(86)
|
|||
|
|
|
Gas
Put Option Purchased
|
462,000
|
6.00
|
57
|
|||
|
|
|
Oil
Collar
|
136,336
|
40.00/72.10
|
(2,358)
|
|||
|
|
|
Oil
Call Option Sold
|
150,000
|
67.00
|
(3,233)
|
|||
|
|
|
Oil
Call Option Purchased
|
150,000
|
72.10
|
2,597
|
|||
|
|
|
|
|
|
|
|||
|
2009
|
|
Oil
Swaps
|
120,000
|
71.00
|
(961)
|
|||
|
|
|
Total
fair value liability
|
|
|
$ (4,207)
|
F-70
TANDEM
ENERGY HOLDINGS, INC.
(Successor
to Tandem Energy Corporation)
NOTES
TO CONSOLIDATED FINANCIAL STATEMENTS
Note
9 – Price, Interest Rate and Credit Risk Management Activities
- (continued)
The
fair
value of Tandem’s financial derivative contracts at October 26, 2007 are shown
in the accompanying financial statements as follows (in thousands):
|
Fair
value of commodity derivative:
|
|
|||
|
$
|
(3,246
|
)
|
||
|
Long-term
portion
|
(961
|
)
|
||
|
Total
fair value liability
|
$
|
(4,207
|
)
|
|
The
natural gas and crude oil prices shown in the above table are based on the
corresponding NYMEX index and have been valued using actively quoted prices
and
quotes obtained from the counterparties to the derivative agreements. The
above
prices represent a weighted average of several contracts entered into and
are on
a per MMBtu or per barrel basis for gas and oil derivatives, respectively.
Total
volumes shown for the crude oil collar reflect net volumetric positions with
a
single counterparty under which contracts provide for netting of all settlement
amounts.
The
following table summarizes the estimated fair value of financial instruments
and
related transactions at October 26, 2007 (in millions):
|
|
Carrying
Amount
|
Estimated
Fair
Value(1)
|
|||||
|
Long-Term
Debt
|
$
|
21.0
|
21.0
|
||||
|
NYMEX-Related
Commodity Derivative
|
|||||||
|
Market
Positions(1)
|
$
|
4.2
|
4.2
|
||||
|
(1)
|
Estimated
fair values have been determined by using available market data
and
valuation methodologies. Judgment is required in interpreting market
data
and the use of different market assumptions or estimation methodologies
may affect the estimated fair value
amounts.
|
F-71
TANDEM
ENERGY HOLDINGS, INC.
(Successor
to Tandem Energy Corporation)
NOTES
TO CONSOLIDATED FINANCIAL STATEMENTS
Note
10 – Commitments and Contingencies
Leases
Tandem
leases office space from third parties under non-cancelable operating leases
that expires May 31, 2010. Beginning in 2006, Tandem also leased office
equipment and a compressor in the Tomball field. Rental expense
pursuant to these leases amounted to $188,097, $135,128 and $34,146 for
the
period from January 1, 2007 through October 26, 2007 and the years ended
December 31, 2006 and 2005, respectively. Future minimum annual lease payments
under the non-cancelable lease for the years ending October 26 are as
follows:
|
2008
|
$
|
136,257
|
||
|
2009
|
125,820
|
|||
|
2010
|
121,320
|
|||
|
2011
|
80,880
|
|||
|
Thereafter
|
—
|
|||
|
|
$
|
464,277
|
Legal
Proceedings
Except
as
discussed in Note 16, Tandem is not currently a defendant in any lawsuit
arising
in the ordinary course of business.
Note
11 – Related Party Transactions
As
discussed in Note 3, in 2005, TEC purchased as treasury stock the common
shares
held by one of its two shareholders for $13.0 million. The purchase was funded
from a portion of the proceeds of Tandem’s revolving line of credit discussed in
Note 6.
As
discussed in Note 3, Tandem issued a note payable to its primary shareholder,
Mr. Culp, for $12.0 million in connection with the share exchange with TEC.
Mr.
Culp also received 1.8 million shares of restricted common stock in connection
with the distribution of restricted shares issued to officers, directors
and
other related parties for services discussed in Note 3, such shares were
valued
for accounting purposes at $3.67 per share and the resulting approximately
$6.6
million was charged to compensation expense in 2005.
As
discussed in Note 3, in connection with the purchase of TEC, 7.4 million
shares
of restricted common stock were distributed to officers, directors and other
related parties of Tandem, other than Mr. Culp, for services. The overall
value
of such shares (approximately $27.3 million) was charged to compensation
expense
in 2005, as discussed in Note 3.
During
the period ended October 26, 2007, Mixon Drilling Company, a wholly owned
subsidiary of TEC, received approximately $49 thousand from a major shareholder
to drill a well in southeast Texas. The shareholder is neither an employee
nor a
director of TEC, and the contract drilling rate was commensurate with third
party rates.
Note
12 – Costs of Oil and Gas Properties
The
following table sets forth certain information with respect to costs incurred
in
connection with Tandem’s oil and gas producing activities during the period
ended October 26, 2007 and the year ended December 31, 2006.
|
October
26,
|
|||||||
|
|
2007
|
2006
|
|||||
|
|
(In
Thousands)
|
||||||
|
Property
acquisitions:
|
|
|
|||||
|
Proved
|
$
|
(308.5
|
)
|
$
|
6.3
|
||
|
Unproved
|
—
|
—
|
|||||
|
Developmental
costs
|
|||||||
|
Intangible
|
585.7
|
4,229.0
|
|||||
|
Tangible
|
836.5
|
2,328.2
|
|||||
|
Exploratory
costs
|
—
|
—
|
|||||
|
Total
|
$
|
1,113.7
|
$
|
6,563.5
|
|||
F-72
TANDEM
ENERGY HOLDINGS, INC.
(Successor
to Tandem Energy Corporation)
NOTES
TO CONSOLIDATED FINANCIAL STATEMENTS
Note
12 – Costs of Oil and Gas
Properties - (continued)
The
following table sets forth the capitalized costs for oil and gas properties
as
of October 26, 2007 and December 31, 2006.
|
October
26,
|
|||||||
|
|
2007
|
2006
|
|||||
|
|
(In
Thousands)
|
||||||
|
Proved
properties
|
$
|
36,753.2
|
$
|
35,639.5
|
|||
|
Unproved
properties
|
—
|
—
|
|||||
|
Total
capitalized costs
|
36,753.2
|
35,639.5
|
|||||
|
Accumulated
depreciation, depletion and amortization
|
(7,488.2
|
)
|
(5,469.2
|
)
|
|||
|
Net
capitalized costs
|
$
|
29,265.0
|
$
|
30,170.3
|
|||
Note
13 – Oil and Gas Reserve Information (Unaudited)
The
estimates of proved oil and gas reserves utilized in the preparation of the
consolidated financial statements were prepared by Williamson Petroleum
Consultants, independent petroleum engineers. Such estimates are in accordance
with guidelines established by the Securities and Exchange Commission and
the
Financial Accounting Standards Board, which require that reserve reports
be
prepared under economic and operating conditions existing at the registrant’s
year end with no provision for price and cost escalations except by contractual
arrangements. Future cash inflows were computed by applying year-end prices
to
the year-end quantities of proved reserves. Future development, abandonment
and
production costs were computed by estimating the expenditures to be incurred
in
developing, producing, and abandoning proved oil and gas reserves at the
end of
the year, based on year-end costs. Future income taxes were computed by applying
statutory tax rates to the estimated net pre-tax cash flows after consideration
of tax basis and tax credits and carryforwards. All of Tandem’s reserves are
located in the United States. For information about Tandem’s results of
operations from oil and gas producing activities, see the accompanying
consolidated statements of operations.
In
accordance with Rule 4-10(a) of SEC Regulation S-X, proved oil and gas reserves
are the estimated quantities of crude oil, natural gas, and natural gas liquids
which geological and engineering data demonstrate with reasonable certainty
to
be recoverable in future years from known reservoirs under existing economic
and
operating conditions, i.e., prices and costs as of the date the estimate
is
made. Prices include consideration of changes in existing prices provided
only
by contractual arrangements, but not on escalations based upon future
conditions.
(1)
Reservoirs are considered proved if economic producibility is supported by
either actual production or conclusive formation test. The area of a reservoir
considered proved includes (A) that portion delineated by drilling and defined
by gas-oil and/or oil-water contacts, if any, and (B) the immediately adjoining
portions not yet drilled, but which can be reasonably judged as economically
productive on the basis of available geological and engineering data. In
the
absence of information on fluid contacts, the lowest known structural occurrence
of hydrocarbons controls the lower proved limit of the reservoir.
(2)
Reserves which can be produced economically through application of improved
recovery techniques (such as fluid injection) are included in the proved
classification when successful testing by a pilot project, or the operation
of
an installed program in the reservoir, provides support for the engineering
analysis on which the project or program was based.
(3)
Estimates of proved reserves do not include the following: (A) oil that may
become available from known reservoirs but is classified separately as indicated
additional reserves; (B) crude oil, natural gas, and natural gas liquids,
the
recovery of which is subject to reasonable doubt because of uncertainty as
to
geology, reservoir characteristics, or economic factors; (C) crude oil, natural
gas, and natural gas liquids, that may occur
in
undrilled prospects; and (D) crude oil, natural gas, and natural gas liquids,
that may be recovered from oil shales, coal, gilsonite and other such
sources.
F-73
TANDEM
ENERGY HOLDINGS, INC.
(Successor
to Tandem Energy Corporation)
NOTES
TO CONSOLIDATED FINANCIAL STATEMENTS
Note
13 – Oil and Gas Reserve Information (Unaudited)
- (continued)
Tandem
emphasizes that reserve estimates are inherently imprecise. Accordingly,
the
estimates are expected to change as more current information becomes available.
In addition, a portion of Tandem’s proved reserves are classified as proved
developed nonproducing and proved undeveloped, which increases the imprecision
inherent in estimating reserves which may ultimately be produced.
The
following table sets forth proved oil and gas reserves together with the
changes
therein and proved developed reserves (oil in Bbls, gas in Mcf, gas converted
to
Boe’s at six Mcf per Bbl) for the years ended December 31, 2006 and 2005 (in
thousands):
|
|
2006
|
2005
|
|||||||||||||||||
|
|
Oil
|
Gas
|
Boe
|
Oil
|
Gas
|
Boe
|
|||||||||||||
|
Proved
reserves:
|
|
|
|
|
|
|
|||||||||||||
|
Beginning
of period
|
5,814
|
21,897
|
9,464
|
989
|
16,604
|
3,756
|
|||||||||||||
|
Revisions
|
(117
|
)
|
(1,034
|
)
|
(289
|
)
|
460
|
(32
|
)
|
455
|
|||||||||
|
Extensions
and discoveries
|
57
|
660
|
167
|
56
|
3,482
|
636
|
|||||||||||||
|
Sales
of minerals-in-place
|
—
|
—
|
—
|
—
|
—
|
—
|
|||||||||||||
|
Purchases
of minerals-in-place
|
—
|
—
|
—
|
4,466
|
2,567
|
4,894
|
|||||||||||||
|
Production
|
(215
|
)
|
(736
|
)
|
(338
|
)
|
(157
|
)
|
(724
|
)
|
(277
|
)
|
|||||||
|
End
of period
|
5,539
|
20,787
|
9,004
|
5,814
|
21,897
|
9,464
|
|||||||||||||
|
Proved
developed reserves:
|
|||||||||||||||||||
|
Beginning
of period
|
2,295
|
6,077
|
3,308
|
989
|
5,708
|
1,940
|
|||||||||||||
|
End
of period
|
2,170
|
5,691
|
3,119
|
2,295
|
6,077
|
3,308
|
|||||||||||||
The
following table sets forth standardized measure of discounted future net
cash
flows (stated in thousands) relating to proved reserves for the year ended
December 31, 2006 and 2005:
|
|
2006
|
2005
|
|||||
|
Future
cash inflows
|
$
|
430,558
|
551,286
|
||||
|
Future
costs:
|
|||||||
|
Production
|
(121,129
|
)
|
(141,530
|
)
|
|||
|
Abandonment
|
(4,872
|
)
|
(4,665
|
)
|
|||
|
Development
|
(41,153
|
)
|
(41,810
|
)
|
|||
|
Income
taxes
|
(28,881
|
)
|
(61,738
|
)
|
|||
|
Future
net cash inflows
|
234,523
|
301,543
|
|||||
|
10%
discount factor
|
(111,945
|
)
|
(114,098
|
)
|
|||
|
Standardized
measure of discounted net cash flows
|
$
|
122,578
|
187,445
|
||||
F-74
TANDEM
ENERGY HOLDINGS, INC.
(Successor
to Tandem Energy Corporation)
NOTES
TO CONSOLIDATED FINANCIAL STATEMENTS
Note
13 – Oil and Gas Reserve Information
(Unaudited) - (continued)
The
following table sets forth the changes in the standardized measure of discounted
future net cash flows relating to proved reserves for the years ended December
31, 2006 and 2005: (in thousands)
|
2006
|
2005
|
||||||
|
Standardized
measure, beginning of year
|
$
|
187,445
|
43,655
|
||||
|
Net
changes in sales prices, net of production costs
|
(45,744
|
)
|
52,323
|
||||
|
Revisions
of quantity estimates
|
(5,461
|
)
|
50,642
|
||||
|
Accretion
of discount
|
20,159
|
4,818
|
|||||
|
Changes
in future development costs, including development costs incurred
that
reduced future development costs
|
955
|
(1,874
|
)
|
||||
|
Changes
in timing and other
|
(3,583
|
)
|
(2,121
|
)
|
|||
|
Net
change in income taxes
|
(20,981
|
)
|
(44,852
|
)
|
|||
|
Future
abandonment costs
|
(1,856
|
)
|
918
|
||||
|
Extensions
and discoveries
|
3,178
|
16,584
|
|||||
|
Sales,
net of production costs:
|
|||||||
|
Continuing
operations
|
(11,534
|
)
|
(10,321
|
)
|
|||
|
Sales
of minerals-in-place
|
—
|
—
|
|||||
|
Purchases
of minerals-in-place
|
—
|
77,673
|
|||||
|
Net
increase (decrease) in standardized measure
|
(64,867
|
)
|
143,790
|
||||
|
Standardized
measure, end of period
|
$
|
122,578
|
187,445
|
Impact
of Pricing
The
estimates of cash flows and reserve quantities shown above are based on year-end
oil and gas prices, except in those cases where future natural gas or oil
sales
are covered by physical contracts at specified prices. Forward price volatility
is largely attributable to supply and demand perceptions for natural gas
and
crude oil.
Under
full-cost accounting rules, TEC reviews the carrying value of its proved
oil and
gas properties each quarter. Under these rules, capitalized costs of proved
oil
and gas properties, net of accumulated DD&A and deferred income taxes, may
not exceed the present value of estimated future net cash flows from proved
oil
and gas reserves, discounted at 10%, plus the lower of cost or fair value
of
unproved properties included in the costs being amortized, net of related
tax
effects (the “ceiling”). These rules generally require pricing future oil and
gas production at the unescalated oil and gas prices at the end of each fiscal
quarter and require a write-down if the “ceiling” is exceeded. Given the
volatility of oil and gas prices, it is reasonably possible that Tandem’s
estimate of discounted future net cash flows from proved oil and gas reserves
could change in the near term. If oil and gas prices decline significantly,
even
if only for a short period of time, it is possible that write-downs of oil
and
gas properties could occur in the future.
The
estimated present value of future cash flows relating to proved reserves
is
extremely sensitive to prices used at any measurement period. The average
prices
used for each commodity for the years ended December 31, 2006 and 2005were
as
follows:
|
|
Average
Prices
|
||||||
|
As
of December 31,
|
Oil
|
Gas
|
|||||
|
2006
|
$
|
57.65
|
5.35
|
||||
|
2005
|
$
|
57.38
|
9.94
|
||||
F-75
TANDEM
ENERGY HOLDINGS, INC.
(Successor
to Tandem Energy Corporation)
NOTES
TO CONSOLIDATED FINANCIAL STATEMENTS
Note
14 – Shamrock Acquisition
On
June
8, 2005, Tandem, through its wholly-owned subsidiary TEC, acquired certain
oil
and gas properties located in the Permian Basin of West Texas, Southeastern
New
Mexico, and Hardin County in East Texas, from Shamrock. The total purchase
price
was approximately $44.2 million including the issuance of 7.5 million shares
of
Tandem common stock. Since the purchase of TEC by Tandem and the Shamrock
asset
acquisition by TEC occurred concurrently, the 7.5 million shares were issued
directly by Tandem. See Note 3 for a complete discussion of the
acquisition.
The
Shamrock properties included estimated total proved reserves of 4.9 million
equivalent barrels of oil.
Acquisition
Pro Forma
The
following pro forma information shows the effect on Tandem’s consolidated
results of operations as if the Shamrock acquisition occurred on January
1,
2005. The pro forma information (stated in thousands) includes numerous
assumptions, and is not necessarily indicative of future results of
operations.
|
|
2005
|
2004
|
|||||||||||
|
|
As
Reported
|
Pro
Forma
|
As
Reported
|
Pro
Forma
|
|||||||||
|
Year
ended December 31:
|
|
|
|
|
|||||||||
|
Oil
and gas sales
|
$
|
13,758
|
16,203
|
$
|
8,018
|
12,105
|
|||||||
|
Operating
expenses
|
4,273
|
5,233
|
2,841
|
4,508
|
|||||||||
|
Operating
profit
|
$
|
9,485
|
10,970
|
$
|
5,177
|
7,597
|
|||||||
Note
15 – Subsequent Event - Sale of Tandem Assets
On
January 19, 2006, Tandem announced that it had executed a definitive merger
agreement (“Merger Agreement”) with Platinum, a publicly-owned entity, for the
acquisition of 100% of the outstanding stock of Tandem for total cash
consideration of approximately $102 million.
On
October 5, 2006, Platinum and Tandem announced that the proposed merger had
been
terminated, and announced a restructured transaction from a merger transaction
to an acquisition of the assets of Tandem’s operating subsidiary TEC, pursuant
to a plan of reorganization under Section 368(a)(1)(C) of the Internal Revenue
Code. As a part of the new Asset Acquisition Agreement and Plan of
Reorganization, dated October 4, 2006, Platinum Energy will acquire all of
the
assets and assume substantially all of the liabilities of TEC, including
approximately $42 million of TEC’s debt, in exchange for the issuance of
approximately 8 million Platinum shares to TEC shareholders.
On
October 26, 2007, the sale of TEC’s assets to Platinum was consummated and
closed. Consideration for the transaction consisted of the assumption and
satisfaction of $41.5 million of TEC indebtedness (Note 6), plus accrued
interest, and $60 million payable in shares of common stock of Platinum.
In
accordance with the acquisition agreement, the total number of shares received
by TEC was 7,692,308, based on $60 million divided by the per share cash
value
of the Platinum IPO trust account at the time of closing. The per share cash
value was $7.80 as of the closing date. Under the terms of the agreement,
TEC
will liquidate, then dividend these Platinum shares to Tandem. Pursuant to
the
acquisition agreement, Platinum is obligated to register the 7.7 million
shares
issued to TEC on the appropriate Securities and Exchange Commission form.
Once
the registration of the shares is complete, Tandem will distribute the Platinum
shares to Tandem’s shareholders and liquidate.
F-76
Note
16 – Litigation
As
discussed in Note 3, in early March, 2005, Tandem, whose board was comprised
solely of one of its promoters, Lyle Mortensen, issued 20 million restricted
shares of its common stock to Mr. Mortensen. Some of these shares were
subsequently transferred by Mr. Mortensen to others including principals
of TEC
and Shamrock, Tim Culp, Dyke Culp and Jack Chambers, in late March, 2005.
Concurrently, Mr. Mortensen resigned as a director and officer of Tandem.
Tandem’s board cancelled all of the 20 million shares on the grounds that the
stock was issued without consideration from Mr. Mortensen, in that the shares
were originally issued in fulfillment of a planned acquisition of TEC/Shamrock
by a Texas corporation formed by Mr. Mortensen to facilitate a contemplated
merger of the new Texas corporation and Tandem. This contemplated merger
never
occurred. All of the cancelled shares were returned to Tandem, except for
2.878
million shares controlled by Mr. Mortensen. Management of Tandem believes
that
all of the shares controlled by Mr. Mortensen are null and void and has
instructed its common stock transfer agent to place a hold on the Mr. Mortensen
common stock certificates. On May 17, 2006, Tandem received notification
from a
third party claiming to be a “holder in due course” of a certificate
representing 2.7 million shares of Tandem common stock controlled by Mr.
Mortensen and a demand that certificate be reissued without a restrictive
legend
as 2.7 million free-trading shares. Management of Tandem has and will continue
to vigorously contest the third party claim.
On
May
23, 2006, Tandem filed a lawsuit in Nevada District Court against Tandem’s
transfer agent, the third party and three other defendants. The third party,
as
well as the three other defendants, successfully challenged the jurisdiction
of
the Nevada court over them and were therefore able to be excluded from the
lawsuit, which proceeded without them and resulted in the court rendering
a
judgment that the certificates evidencing the shares are invalid and void
and
directing Tandem’s transfer agent to void the certificates if presented for
transfer, as well as enjoining the transfer agent from transferring the
certificates if so presented.
The
third
party filed a competing lawsuit against Tandem and Platinum in the Florida
Circuit court on or about June 14, 2006, seeking a declaration by the court
that
Tandem’s cancellation of the shares was improper and that the third party is the
rightful owner of the shares, and an injunction prohibiting Tandem and Platinum
from taking any action in detriment to his alleged rights in and to the shares.
Tandem challenged the jurisdiction of the Florida court over it since it
has had
no contact with the state of Florida, and was successful in getting the judge
in
that lawsuit to enter an order dismissing the entire complaint filed by the
third party on the grounds that the court did not have jurisdiction over
the
matter. The third party then sought approval of the court to file an amended
complaint, but prior to any ruling by the court, the third party dismissed
his
lawsuit. On June 12, 2007, the third party filed a lawsuit in the United
States
District Court for the Western District of Texas, Midland-Odessa Division,
against Tandem, TEC, and Messrs. Yocham, Culp, Chambers and Cunningham, and
Tandem's transfer agent alleging conversion and conspiracy to convert with
respect to the certificate representing the 2.7 million shares. Tandem, TEC
and
the other defendants in this lawsuit are vigorously contesting these
allegations. Accordingly, based on SFAS No. 5, Accounting for Contingencies,
no
liability has been recorded in the accompanying consolidated financial
statements.
On
September 25, 2006, Tandem filed a lawsuit against Mr. Mortensen and Mr.
Mortensen’s corporate affiliate in the Judicial District Court in Tarrant
County, Texas, the domicile of Mr. Mortensen and his affiliate, seeking a
declaration by the court that the certificates issued to Mr. Mortensen and
subsequently transferred to his affiliate are void, that the certificates
were
properly cancelled by Tandem and that the transfer agent is authorized to
cancel
and destroy the certificates. In addition, Tandem is seeking a temporary
and
permanent injunction against Mr. Mortensen, his affiliate and any other person
in possession of the certificates prohibiting any transfer or other disposition
of the certificates and ordering that they be cancelled. An answer in this
lawsuit was filed by Mr. Mortensen and his affiliate, and Tandem is now
proceeding with a vigorous prosecution of this case.
On January
16th, 2008, Exxon Mobil Corporation filed a petition in the 270 th
District
Court of Harris County, Texas, naming TEC and a third party, Merenco Realty,
Inc., demanding environmental remediation of certain properties in Tomball,
Texas. In 1996, pursuant to an assignment agreement, Exxon Mobil sold certain
oil and gas leasehold interests and real estate interests in Tomball, Texas
to
TEC’s predecessor in interest, Merit Energy Corporation. In 1999, TEC assigned
its 50% undivided interest in one of the tracts in the acquired property
to
Merenco, an affiliate of TEC, owned 50% by our chairman of the board, Tim
Culp.
In October 2007, the Texas Railroad Commission notified Exxon Mobil of an
environmental site assessment alleging soil and groundwater contamination
for a
site in the area of Tomball, Texas. Exxon Mobil believes that the site is
one
which was sold to TEC and claims that TEC is obligated to remediate the site
under the assignment agreement. Exxon Mobil has requested that the court
declare
the defendants obligated to restore and remediate the properties and has
requested any actual damages arising from breach and attorneys’ fees. We believe
that Exxon Mobil’s claim that TEC is responsible for any remediation of such
site is without merit and we intend to vigorously defend ourselves against
this
claim. However, no assurance can be given that we will prevail in this matter.
Platinum acquired substantially all the assets and liabilities of TEC in
the TEC
acquisition. Merenco was not acquired by Platinum in the TEC acquisition
and
Platinum’s chairman, Tim Culp, continues to have a 50% ownership interest in
Merenco.
F-77
MAVERICK
ENGINEERING, INC.
|
Page
|
|
|
Audited
Financial Statements
|
|
|
Report
of Independent Certified Public Accounting Firm
|
F-79
|
|
|
|
|
Balance
Sheets —
December 31,
2007 and December 31, 2006
|
F-80
|
|
|
|
|
Consolidated
Statements of Operations — For the years ended December 31, 2007 and
2006
|
F-82
|
|
|
|
|
Consolidated
Statements of Changes in Stockholders’ Equity — For the years ended
December 31, 2007 and 2006
|
F-83
|
|
|
|
|
Consolidated
Statements of Cash Flows — For the years ended December 31, 2007 and
2006
|
F-84
|
|
|
|
|
Notes
to Financial Statements
|
F-85
|
F-78
REPORT
OF INDEPENDENT CERTIFIED PUBLIC ACCOUNTANTS
April
11,
2008
To
the
Stockholders of
Maverick
Engineering, Inc.
We
have
audited the accompanying balance sheet of Maverick Engineering, Inc. (the
“Company”) as of December 31, 2007 and 2006, and the related statements of
operations, changes in stockholders’ equity, and cash flows for the years then
ended. These financial statements are the responsibility of the Company’s
management. Our responsibility is to express an opinion on these financial
statements based on our audits.
We
conducted our audits in accordance with auditing standards generally accepted
in
the United States of America. Those standards require that we plan and perform
the audit to obtain reasonable assurance about whether the financial statements
are free of material misstatement. An audit includes examining, on a test basis,
evidence supporting the amounts and disclosures in the financial statements.
An
audit also includes assessing the accounting principles used and significant
estimates made by management, as well as evaluating the overall financial
statement presentation. We believe that our audits provide a reasonable basis
for our opinion.
In
our
opinion, the financial statements referred to above present fairly, in all
material respects, the financial position of Maverick Engineering, Inc. as
of
December 31, 2007 and 2006, and the results of its operations and its cash
flows
for the years then ended in conformity with accounting principles generally
accepted in the United States of America.
/s/
Melton & Melton, L.L.P.
F-79
|
MAVERICK
ENGINEERING, INC.
|
|||||||
|
BALANCE
SHEET
|
|||||||
|
December
31, 2007 and 2006
|
|||||||
|
2007
|
2006
|
||||||
|
ASSETS
|
|||||||
|
Current
Assets:
|
|||||||
|
Cash
|
$
|
30,185
|
$
|
31,014
|
|||
|
Accounts
receivable:
|
|||||||
|
Trade,
net of $146,837 and $142,727 allowance for
|
|||||||
|
doubtful
accounts for 2007 and 2006, respectively
|
6,290,867
|
5,285,715
|
|||||
|
Unbilled
receivables
|
159,139
|
-
|
|||||
|
Assets
of discontinued component - current
|
138,769 |
289,460
|
|||||
|
Other
|
-
|
14,119
|
|||||
|
Prepaid
expenses
|
230,222
|
274,828
|
|||||
|
Total
current assets
|
6,849,182
|
5,895,136
|
|||||
|
|
|||||||
|
Property,
net
|
1,704,161
|
1,406,452
|
|||||
|
|
|||||||
|
Other
Assets:
|
|||||||
|
Goodwill
|
3,878,873
|
3,878,873
|
|||||
|
Deferred
financing costs, net
|
14,119
|
48,007
|
|||||
|
Assets
of discontinued component - non current
|
- |
50,000
|
|||||
|
|
3,892,992
|
3,976,880
|
|||||
|
Total
Assets
|
$
|
12,446,335
|
$
|
11,278,468
|
|||
(See
Notes to Financial Statements)
F-80
|
MAVERICK
ENGINEERING, INC.
|
|||||||
|
BALANCE
SHEET (CONTINUED)
|
|||||||
|
December
31, 2007 and 2006
|
|||||||
|
2007
|
2006
|
||||||
|
LIABILITIES
AND STOCKHOLDERS’ EQUITY
|
|||||||
|
Current
Liabilities:
|
|||||||
|
Note
payable and current maturities of long-term debt
|
$
|
3,732,095
|
$
|
716,969
|
|||
|
Current
maturities of capital lease obligations
|
276,937
|
257,138
|
|||||
|
Accounts
payable
|
1,787,096
|
426,196
|
|||||
|
Accrued
salaries
|
892,038
|
755,143
|
|||||
|
Accrued
benefits
|
670,563
|
833,610
|
|||||
|
Deferred
rent
|
206,619
|
-
|
|||||
|
Accrued
settlement
|
350,000
|
-
|
|||||
|
Other
accrued liabilities
|
527,491
|
337,302
|
|||||
|
State
income tax payable
|
108,000 | - | |||||
|
Liabilities
of discontinued component - current
|
84,629 | 70,596 | |||||
|
Total
current liabilities
|
8,635,468
|
3,396,954
|
|||||
|
|
|||||||
|
Long-Term
Liabilities:
|
|||||||
|
Long-term
debt, net of current maturities
|
1,486,740
|
5,450,235
|
|||||
|
Capital
lease obligations, net of current maturities
|
347,614
|
279,984
|
|||||
|
Liabilities
of discontinued compenent - non-current
|
- | 13,140 | |||||
|
|
1,834,354
|
5,743,359
|
|||||
|
Commitments
and Contingencies
|
|||||||
|
Stockholders’
Equity:
|
|||||||
|
Common
stock - $1 par value, 1,000,000 shares
|
|||||||
|
authorized,
120,878 and 106,690 shares issued
|
|||||||
|
and
outstanding in 2007 and 2006, respectively
|
120,878
|
106,690
|
|||||
|
Additional
paid-in capital
|
4,822,405
|
3,749,988
|
|||||
|
Accumulated
deficit
|
(2,966,770
|
)
|
(1,718,523
|
)
|
|||
|
Total
stockholders’ equity
|
1,976,513
|
2,138,155
|
|||||
|
Total
liabilities and stockholders’ equity
|
$
|
12,446,335
|
$
|
11,278,468
|
|||
(See
Notes to Financial Statements)
F-81
|
MAVERICK
ENGINEERING, INC.
|
|||||||
|
STATEMENT
OF OPERATIONS
|
|||||||
|
For
the Years Ended December 31, 2007 and 2006
|
|||||||
|
2007
|
2006
|
||||||
|
Revenues
|
$
|
33,372,449
|
$
|
28,289,795
|
|||
|
Cost
of Revenues
|
28,331,742
|
22,294,225
|
|||||
|
Gross
profit
|
5,040,707
|
5,995,570
|
|||||
|
General
and Administrative Expenses
|
5,128,457
|
4,060,579
|
|||||
|
(87,750
|
)
|
1,934,991
|
|||||
|
Other
Income (Expense):
|
|||||||
|
Other
income (expense)
|
3,251
|
(3,619
|
)
|
||||
|
Nonrecurring
settlement expense
|
(350,000
|
)
|
-
|
||||
|
Interest
expense
|
(478,352
|
)
|
(528,127
|
)
|
|||
|
(825,101
|
)
|
(531,746
|
)
|
||||
|
Income
(loss) from continuing operations
|
|||||||
|
before
state income taxes
|
(912,851
|
)
|
1,403,245
|
||||
|
|
|||||||
|
State
Income Taxes
|
108,000
|
-
|
|||||
|
|
|||||||
|
Income
(loss) from continuing operations
|
(1,020,851
|
)
|
1,403,245
|
||||
|
|
|||||||
|
Loss
from Operations of Discontinued Component
|
(227,396
|
)
|
(68,462
|
)
|
|||
|
|
|||||||
|
Net
income (loss)
|
$
|
(1,248,247
|
)
|
$
|
1,334,783
|
||
(See
Notes to Financial Statements)
F-82
|
MAVERICK
ENGINEERING, INC.
|
|||||||||||||
|
STATEMENT
OF CHANGES IN STOCKHOLDERS’ EQUITY
|
|||||||||||||
|
For
the Years Ended December 31, 2007 and 2006
|
|||||||||||||
|
Additional
|
|||||||||||||
|
Common
|
Paid-in
|
Retained
|
|||||||||||
|
Stock
|
Capital
|
Deficit
|
Total
|
||||||||||
|
Balance,
December 31, 2005
|
$
|
104,853
|
$
|
3,742,640
|
$
|
(3,053,306
|
)
|
$
|
794,187
|
||||
|
1,837
shares of common stock issued
|
|||||||||||||
|
pursuant
to incentive compensation
|
|||||||||||||
|
agreements
|
1,837
|
7,348
|
9,185
|
||||||||||
|
Net
income
|
-
|
-
|
1,334,783
|
1,334,783
|
|||||||||
|
Balance,
December 31, 2006
|
106,690
|
3,749,988
|
(1,718,523
|
)
|
2,138,155
|
||||||||
|
|
|||||||||||||
|
11,200
shares issued pursuant to
|
|||||||||||||
|
extinguishment
of debt
|
11,200
|
996,800
|
1,008,000
|
||||||||||
|
Sale
of 749 shares of common stock
|
749
|
66,661
|
67,410
|
||||||||||
|
|
|||||||||||||
|
2,239
shares of common stock issued
|
|||||||||||||
|
pursuant
to incentive compensation
|
|||||||||||||
|
agreements
|
2,239
|
8,956
|
11,195
|
||||||||||
|
|
|||||||||||||
|
Net
loss
|
-
|
-
|
(1,248,247
|
)
|
(1,248,247
|
)
|
|||||||
|
|
|||||||||||||
|
Balance,
December 31, 2007
|
$
|
120,878
|
$
|
4,822,405
|
$
|
(2,966,770
|
)
|
$
|
1,976,513
|
||||
(See
Notes to Financial Statements)
F-83
|
MAVERICK
ENGINEERING, INC.
|
|||||||
|
STATEMENT
OF CASH FLOWS
|
|||||||
|
For
the Years Ended December 31, 2007 and 2006
|
|||||||
|
2007
|
2006
|
||||||
|
Cash
Flows from Operating Activities:
|
|||||||
|
Income
(loss) from continuing operations
|
$
|
(1,020,851
|
)
|
$
|
1,403,245
|
||
|
Adjustments
to reconcile net income (loss) to net
|
|||||||
|
cash
provided by (used in) operating activities:
|
|||||||
|
Loss
from operations of discontinued component
|
(227,396
|
)
|
(68,462
|
)
|
|||
|
Depreciation
and amortization
|
593,768
|
504,861
|
|||||
|
Writedown
of goodwill
|
50,000
|
-
|
|||||
|
Loss
on sale of assets
|
-
|
3,316
|
|||||
|
Stock
compensation
|
11,195
|
9,185
|
|||||
|
Changes
in operating assets and liabilities:
|
|||||||
|
Accounts
receivable - net
|
(1,025,063
|
)
|
(2,123,571
|
)
|
|||
|
Prepaid
expenses
|
36,611
|
(118,491
|
)
|
||||
|
Accounts
payable
|
1,360,900
|
72,003
|
|||||
|
Accrued
liabilities
|
826,442 |
175,112
|
|||||
|
Total
adjustments
|
1,626,457
|
(1,546,047
|
)
|
||||
|
Net
cash provided by (used in) operating
|
|||||||
|
activities
|
605,606
|
(142,802
|
)
|
||||
|
|
|||||||
|
Cash
Flows from Investing Activities:
|
|||||||
|
Acquisition
of business
|
-
|
(84,331
|
)
|
||||
|
Proceeds
from sale of property
|
-
|
3,500
|
|||||
|
Purchase
of property
|
(369,192
|
)
|
(362,769
|
)
|
|||
|
Net
cash used in investing activities
|
(369,192
|
)
|
(443,600
|
)
|
|||
|
|
|||||||
|
Cash
Flows from Financing Activities:
|
|||||||
|
Proceeds
from notes payable and long-term debt
|
448,673
|
5,817,766
|
|||||
|
Principal
payments on notes payable and long-term debt
|
(451,642
|
)
|
(5,310,045
|
)
|
|||
|
Payments
on capital lease obligations
|
(301,684
|
)
|
(302,709
|
)
|
|||
|
Proceeds
from issuance of common stock
|
67,410
|
-
|
|||||
|
Net
cash provided by (used in) financing
|
|||||||
|
activities
|
(237,243
|
)
|
205,012
|
||||
|
|
|||||||
|
Net
decrease in cash
|
(829
|
)
|
(381,390
|
)
|
|||
|
|
|||||||
|
Cash,
beginning of year
|
31,014
|
412,404
|
|||||
|
|
|||||||
|
Cash,
end of year
|
$
|
30,185
|
$
|
31,014
|
|||
(See
Notes to Financial Statements)
F-84
MAVERICK
ENGINEERING, INC.
NOTES
TO FINANCIAL STATEMENTS
December
31, 2007
NOTE
1 - SUMMARY OF SIGNIFICANT ACCOUNTING POLICIES
Business
Purpose
Maverick
Engineering, Inc. (the “Company”) was incorporated in December 1993 in the State
of Texas. The Company is engaged in providing engineering and construction
services primarily for three types of clients: (1) UPSTREAM OIL & GAS,
domestic oil and gas producers and pipeline companies; (2) INDUSTRIAL,
petrochemical and refining plants; and (3) INFRASTRUCTURE, private
and public
sectors, including state municipalities, cities, and port authorities.
The
Company is headquartered in Victoria, Texas and operates primarily
in
Texas.
Business
Acquisition
Effective
January 1, 2006, the Company acquired the net assets of MGM Engineering
Group,
L.L.C. (“MGM”), a Texas limited liability company in Harlingen, Texas. The
purchase price of $221,657 was allocated to the fair value of the assets
of MGM
with the excess being allocated to goodwill as follows:
|
Property
|
$
|
171,657
|
||
|
Goodwill
|
50,000
|
|||
|
|
$
|
221,657
|
Revenues
and Accounts Receivable
Revenues
are billed and accounts receivable recorded as services are performed.
Most of
the Company’s work is performed under time and material projects.
Management
periodically reviews all accounts receivable to determine if any are
considered
delinquent based upon the age of the receivable and the credit worthiness
of the
parties involved. An allowance for doubtful accounts is recorded for
the amount
management estimates as uncollectible. An allowance of $146,837 and
$142,727 was
considered necessary by management at December 31, 2007 and 2006,
respectively.
Unbilled
receivables represent costs and estimated fees on work for which billings
have
not been presented to customers. When billed, these amounts are included
in
accounts receivable - trade. Unbilled accounts receivable include management’s
best estimates of the amounts expected to be realized on the work that
has been
performed to date.
Property
Property
is recorded at cost. Improvements or betterments of a permanent nature
are
capitalized. Expenditures for maintenance and repairs are charged to
expense as
incurred. The cost of assets retired or otherwise disposed of and the
related
accumulated depreciation are eliminated from the accounts in the year
of
disposal. Gains or losses resulting from property disposals are credited
or
charged to operations currently.
F-85
MAVERICK
ENGINEERING, INC.
NOTES
TO FINANCIAL STATEMENTS (CONTINUED)
December
31, 2007
NOTE
1 - SUMMARY OF SIGNIFICANT ACCOUNTING POLICIES (CONTINUED)
The
Company computes depreciation using the straight-line method over the
estimated
useful lives as follows:
|
Office
equipment and furniture
|
3
-
15 years
|
|
Vehicles
|
5
years
|
|
Leasehold
improvements
|
5
years
|
|
Machinery
and equipment
|
5
-
7 years
|
Depreciation
expense amounted to approximately $560,000 and $471,000 for the years
ended
December 31, 2007 and 2006, respectively.
Income
Taxes
The
Company elected to be taxed as an S corporation under provisions of
the Internal
Revenue Code. Under those provisions the stockholders are liable for
individual
federal income taxes on their respective share of the Company’s taxable income.
Therefore, no provision or liability for federal income taxes has been
included
in the financial statements. During 2006, the Company was subject to
franchise
taxes in the State of Texas. During 2007, the State of Texas adopted
a gross
margin tax which is included in state income tax expense. State income
tax
expense totaled $108,000 for the year ended December 31, 2007. There
was no
state franchise tax expense for the year ended December 31, 2006.
Presentation
of Sales Taxes
The
State
of Texas imposes a sales tax on all of the Company’s sales to nonexempt
customers. The Company collects that sales tax from customers and remits
the
entire amount to the State. The Company’s accounting policy is to exclude the
tax collected and remitted to the State from revenues and cost of
revenues.
Goodwill
Goodwill
represents the excess of cost over fair value of net assets acquired
through
acquisitions. Goodwill recorded on acquisitions prior to June 30, 2001
was
amortized through December 31, 2001. The Company adopted Statement of
Financial Accounting Standards (“SFAS”) No. 142, Goodwill
and Other Intangible Assets,
issued
in June 2001, and amortization of this goodwill ceased as of December
31, 2001.
The Company will evaluate the goodwill on an annual basis for potential
impairment. Goodwill recorded by the Company after June 30, 2001 has
not been
amortized and will be evaluated on an annual basis, or sooner if deemed
necessary, in connection with other long-lived assets, for potential
impairment.
During 2007, the Company discontinued operations at its Harlingen office.
As a
result, the Company determined that goodwill was impaired by $50,000.
This has
been included in the accompanying statement of operations in loss from
operations of discontinued component. Revenues from the Harlingen office
amounted to approximately $530,000 and $660,000 for 2007 and 2006,
respectively.
Management performed an impairment assessment on the remaining goodwill
as of
December 31, 2007 and 2006, which resulted in no impairment of goodwill.
An
annual assessment of goodwill will be assessed in the fourth quarter
of each
year.
F-86
MAVERICK
ENGINEERING, INC.
NOTES
TO FINANCIAL STATEMENTS (CONTINUED)
December
31, 2007
NOTE
1 - SUMMARY OF SIGNIFICANT ACCOUNTING POLICIES (CONTINUED)
Deferred
Financing Costs
In
April
2005, the Company incurred financing costs associated with the assumption
of
debt. These costs are being deferred and amortized over the three-year
life of
the debt.
Amortization
expense amounted to approximately $34,000 for each of the years ended
December
31, 2007 and 2006.
Estimates
The
preparation of financial statements in conformity with accounting principles
generally accepted in the United States of America requires management
to make
estimates and assumptions that affect the reported amounts of assets
and
liabilities and disclosure of contingent assets and liabilities at
the date of
the financial statements and the reported amounts of revenues and expenses
during the reporting period. Actual results could differ from those
estimates.
Management believes that these estimates and assumptions provide a
reasonable
basis for the fair presentation of the financial statements.
NOTE
2 - RELATED PARTY TRANSACTIONS
The
Company leases office facilities from employees of the Company. The
future
payments of these leases are included in the operating lease note disclosure
(see Note 7).
NOTE
3 - NOTES PAYABLE AND LONG-TERM DEBT
Notes
payable and long-term debt at December 31, 2007 and 2006 consist of
the
following:
|
2007
|
2006
|
||||||
|
*$3,250,000
revolving line of credit, payable to a financial
|
|||||||
|
institution
in monthly interest payments at prime plus .25%,
|
|||||||
|
principal
and unpaid interest due at maturity in April 2008
|
$
|
2,749,891
|
$
|
2,310,002
|
|||
|
*$500,000
term note, payable to a financial institution in
monthly
principal and interest payments of $10,280 with interest at prime plus .75%, unpaid principal and interest due at maturity in May 2009 |
369,135
|
455,065
|
|||||
F-87
MAVERICK
ENGINEERING, INC.
NOTES
TO FINANCIAL STATEMENTS (CONTINUED)
December
31, 2007
NOTE
3 - NOTES PAYABLE AND LONG-TERM DEBT (CONTINUED)
|
2007
|
2006
|
||||||
| *$1,950,000 second term note, payable to a financial institution in monthly installments beginning in July 2007. If balance is greater than or equal to $1,000,000, then payment is equal to principal balance amortized over 48 months. If balance is less than $1,000,000, then principal payment is equal to principal balance amortized over 18 months. Interest payable in monthly installments of prime plus .50%. Principal and unpaid interest due at maturity in April 2011. If any part of Corpus Christi, Texas operations is sold, net proceeds from the sale must be used as prepayment against the note. If unpaid principal at the end of any calendar year, beginning December 31, 2007, is greater than $500,000 and adjusted net income of the Company is positive, 25% of the Company’s net income must be used as prepayment to the financial institution within 120 days after year-end. | $ | 1,706,250 | $ | 1,950,000 | |||
| **$1,502,000 note, payable to a related party through common ownership in monthly principal installments of $24,000 plus interest at prime plus 1.5%, maturing in April 2008, collateralized by substantially all assets, excluding assets noted below (see “*”) and guaranteed by the majority stockholder | - | 1,047,783 | |||||
| $610,000 note, payable to a related party through common ownership in monthly interest payments at 12%, principal due at maturity in April 2008, collateralized by guaranty of majority stockholder and substantially all assets excluding assets noted below (see “*”) | 305,000 | 305,000 | |||||
| Other | 88,559 | 99,354 | |||||
| 5,218,835 | 6,167,204 | ||||||
| Less: Current maturities | 3,732,095 | 716,969 | |||||
| $ | 1,486,740 | $ | 5,450,235 | ||||
F-88
MAVERICK
ENGINEERING, INC.
NOTES
TO FINANCIAL STATEMENTS (CONTINUED)
December
31, 2007
NOTE
3 - NOTES PAYABLE AND LONG-TERM DEBT (CONTINUED)
*These
notes are collateralized by accounts receivable, a $4,000,000 life
insurance
policy on the majority stockholder, general and limited partnership
interests
owned by the majority stockholder, and common stock owned by the majority
stockholder.
**Effective
January 8, 2007, the holder of the $1,502,000 note, which had a balance
of
$1,047,783 at December 31, 2006, agreed to exchange $1,008,000 of debt
for
11,200 shares of common stock of the Company. The total debt at the
time of the
exchange was $1,056,567 of principle and accrued interest. The difference
between the exchange value and total debt was $48,567 at the time of
the
exchange. This difference was paid to the note holder in cash.
Annual
maturities of notes payable and long-term debt are as follows:
|
For
the Year Ending December 31:
|
||||
|
2008
|
$
|
3,732,095
|
||
|
2009
|
755,490
|
|||
|
2010
|
487,500
|
|||
|
2011
|
243,750
|
|||
|
|
$
|
5,218,835
|
||
NOTE
4 - OTHER ASSETS
The
following is a summary of goodwill and deferred financing costs at
December 31,
2007 and 2006:
|
2007
|
2006
|
||||||
|
Goodwill:
|
|||||||
|
Cost
|
$
|
3,905,727
|
$
|
3,905,727
|
|||
|
Accumulated
amortization
|
26,854
|
26,854
|
|||||
|
$
|
3,878,873
|
$
|
3,878,873
|
||||
|
Deferred
financing costs:
|
|||||||
|
Cost
|
$
|
101,663
|
$
|
101,663
|
|||
|
Accumulated
amortization
|
87,544
|
53,656
|
|||||
|
$
|
14,119
|
$
|
48,007
|
||||
The
estimated amortization expenses for deferred financing costs are as
follows:
|
For
the Year Ending December 31:
|
||||
|
2008
|
$ | 14,119 | ||
F-89
MAVERICK
ENGINEERING, INC.
NOTES
TO FINANCIAL STATEMENTS (CONTINUED)
December
31, 2007
NOTE
5 - SUPPLEMENTAL INFORMATION - STATEMENT OF CASH FLOWS
|
2007
|
2006
|
||||||
|
Interest
paid
|
$
|
478,352
|
$
|
799,811
|
|||
A
schedule of noncash investing and financing activities and other operating
activities is as follows:
|
2007
|
2006
|
||||||
|
Capital
lease obligation issued to acquire property
|
$
|
389,113
|
$
|
356,611
|
|||
|
Property
additions included in accrued liabilities
|
$
|
99,284
|
|||||
|
Stock
issued pursuant to extinguishment of debt
|
$
|
1,008,000
|
|||||
|
Acquisition
of MGM:
|
|||||||
|
Property
|
|
|
$
|
171,657 | |||
|
Goodwill
|
|
50,000 | |||||
|
Debt
assumed
|
|
|
(137,326 |
)
|
|||
|
Cash
paid
|
|
|
$
|
84,331 | |||
NOTE
6 - CONCENTRATION RISKS
Financial
instruments which potentially subject the Company to concentrations
of credit
risk principally consist of cash and trade receivables. The Company
places its
cash in financial institutions. At times, such investments may be in
excess of
FDIC insurance limits.
The
Company had approximately 57% in 2007 and 2006, of total revenues concentrated
in four and three customers, respectively. At December 31, 2006, the
Company had
69% of accounts receivable - trade concentrated in five customers.
F-90
MAVERICK
ENGINEERING, INC.
NOTES
TO FINANCIAL STATEMENTS (CONTINUED)
December
31, 2007
NOTE
7 - OPERATING LEASES
The
Company leases its general office space and equipment under noncancellable
operating leases. The obligations of the operating leases are summarized
as
follows:
|
For
the Year Ending December 31:
|
||||
|
2008
|
$
|
$898,522
|
||
|
2009
|
903,511
|
|||
|
2010
|
918,591
|
|||
|
2011
|
922,934
|
|||
|
2012
|
245,077
|
|||
|
Thereafter
|
315,094
|
|||
|
|
$
|
4,203,729
|
||
Rent
expense amounted to approximately $1,002,000 and $742,000 for 2007
and 2006,
respectively, which includes approximately $301,000 paid to related
parties in
2007 and 2006.
NOTE
8 - BENEFIT PLAN
The
Company has adopted a defined contribution plan under Section 401(k)
of the
Internal Revenue Code for the benefit of all employees who have met
certain
length-of-service requirements. Under this plan, employees may elect
to make
contributions pursuant to a salary reduction agreement. Each year,
the Company
may make a matching contribution to the plan on behalf of the participating
employees. Employer contributions to the plan are at the discretion
of the
Company. For the years ended December 31, 2007 and 2006, employer contributions
charged to operations totaled approximately $697,000 and $517,000,
respectively.
NOTE
9 - CAPITAL
LEASE OBLIGATIONS
The
Company leases office equipment and vehicles under capital lease agreements.
Depreciation expense for capital leases is included with depreciation
on
property.
The
cost
and accumulated depreciation of capital leases at December 31, 2007
and 2006 are
as follows:
|
2007
|
2006
|
||||||
|
Office
equipment and furniture
|
$
|
808,625
|
$
|
734,994
|
|||
|
Vehicles
|
371,598
|
234,860
|
|||||
|
1,180,223
|
969,854
|
||||||
|
Less:
Accumulated depreciation
|
524,472
|
399,168
|
|||||
|
$
|
655,751
|
$
|
570,686
|
||||
F-91
MAVERICK
ENGINEERING, INC.
NOTES
TO FINANCIAL STATEMENTS (CONTINUED)
December
31, 2007
NOTE
9 - CAPITAL
LEASE OBLIGATIONS (CONTINUED)
The
following is a schedule of future minimum lease payments under capitalized
leases together with the present value of the net minimum lease payments
at
December 31, 2006:
|
For
the Year Ending December 31:
|
||||
|
2008
|
$
|
329,293
|
||
|
2009
|
199,556
|
|||
|
2010
|
127,010
|
|||
|
2011
|
86,522
|
|||
|
2012
|
39,772
|
|||
|
Total
minimum lease payments
|
782,153
|
|||
|
Less:
Amount representing interest
|
157,602
|
|||
|
Present
value of minimum lease payments
|
624,551
|
|||
|
Less:
Current maturities
|
276,937
|
|||
|
|
$ | 347,614 | ||
The effective interest rate on capitalized leases ranges from 5% - 27%.
NOTE
10 - PROPERTY
Property
at December 31, 2007 and 2006 consists of the following:
|
2007
|
2006
|
||||||
|
Office
equipment and furniture
|
$
|
632,242
|
$
|
363,403
|
|||
|
Vehicles
|
589,822
|
485,613
|
|||||
|
Leasehold
improvements
|
182,344
|
14,254
|
|||||
|
Machinery
and equipment
|
2,491,921
|
2,176,470
|
|||||
|
3,896,329
|
3,039,740
|
||||||
|
Less:
Accumulated depreciation
|
2,192,168
|
1,633,288
|
|||||
|
$
|
1,704,161
|
$
|
1,406,452
|
||||
NOTE
11 - INCENTIVE COMPENSATION AGREEMENTS
Pursuant
to executive employee incentive compensation agreements and subject
to
achievement of performance targets and other conditions as specified
in the
agreement, the Company will issue annually the lesser of .5% of the
issued and
outstanding common stock of the Company or the number of shares which
would
elevate the executive to 3% of the issued and outstanding common stock
of the
Company. The executives are 100% vested in the stock issued. There
were four
employees with incentive compensation agreements in 2007 and two employees
with
incentive compensation agreements in 2006. The Company shall have the
right and
option to repurchase the stock upon certain events.
In
2007
and 2006, the Company issued 2,239 and 1,837 shares, respectively,
in accordance
with the agreements.
F-92
MAVERICK
ENGINEERING, INC.
NOTES
TO FINANCIAL STATEMENTS (CONTINUED)
December
31, 2007
NOTE
12 - COMMITMENTS & CONTINGENCIES
During
the year ended December 31, 2007, Maverick entered into a settlement
agreement
regarding a claim of excess billings to a customer for services rendered
by
Maverick. The settlement resulted in Maverick incurring a liability
of $350,000.
The liability is to be paid in monthly installments of $29,167 beginning
on
January 1, 2008. Maverick has recorded a nonrecurring settlement expense
of
$350,000 for the year ended December 31, 2007.
Financial
instruments which potentially subject Maverick to concentrations of
credit risk
principally consist of cash. Maverick maintains cash with various financial
institutions. At times, such amounts may be in excess of FDIC insurance
limits.
NOTE
13 - DISCONTINUED OPERATIONS
In
October 2007, Maverick Engineering management decided to discontinue
the
operations of its Harlingen office. Management notified customers of
its
intention to cease operations by the end of the fourth quarter of 2007.
The
amounts reported as assets and liabilities of discontinued operations
at
December 31, 2007 and 2006 are as follows:
|
2007
|
2006
|
||||||
|
Accounts
receivable
|
$
|
138,769
|
$
|
289,460
|
|||
|
Goodwill
|
-
|
50,000
|
|||||
|
Assets
of discontinued operations
|
$
|
138,769
|
$
|
339,460
|
|||
|
Accrued
expenses
|
$
|
71,489
|
|
||||
|
Notes
payable and current maturities of long-term debt
|
13,140
|
$
|
70,596
|
||||
|
Long-term
debt, net of current maturities
|
|
13,140
|
|||||
|
Liabilities
of discontinued operations
|
$
|
84,629
|
$
|
83,736
|
|||
NOTE
14 - OTHER ITEMS
During
2007, several occurrences transpired which had a negative effect on
the
Company’s net income for the year. Included in these items was the temporary
absence of a key member of management which made it necessary for the
Company to
employ a replacement on an interim basis at a cost of $110,685. Management
also
incurred substantial legal fees during the year in an effort to enforce
a senior
manager’s noncompete agreement that totaled $78,235. Management believes that
these occurrences are nonrecurring in nature.
F-93
MAVERICK
ENGINEERING, INC.
NOTES
TO FINANCIAL STATEMENTS (CONTINUED)
December
31, 2007
NOTE
15 - SUBSEQUENT EVENT
On
March
18, 2008, the Company was sold to Platinum Energy Resources, Inc.,
a Delaware
corporation. Platinum Energy Resources, Inc., based in Montvale, New
Jersey, is
a publicly traded company and trades under the ticker symbol
PGRI.OB.
F-94
MAVERICK
ENGINEERING, INC.
|
Page
|
|
|
|
|
|
Unaudited
Financial Statements
|
|
|
Balance
Sheet —
March
31, 2008
|
F-96
|
|
|
|
|
Statements
of Operations — For the three months ended March 31, 2008 and
2007
|
F-97
|
|
|
|
|
Statements
of Cash Flows — For the three months ended March 31, 2008 and
2007
|
F-98
|
|
|
|
|
Notes
to Financial Statements
|
F-99
|
F-95
|
MAVERICK
ENGINEERING, INC.
|
||||
|
BALANCE
SHEET
|
||||
|
March
31, 2008
|
||||
|
(Unaudited)
|
||||
|
ASSETS
|
||||
|
Current
Assets:
|
||||
|
Cash
|
$
|
71,131
|
||
|
Accounts
receivable:
|
||||
|
Trade,
net of $94,942 allowance for doubtful accounts
|
3,935,841
|
|||
|
Unbilled
receivable on completed contract
|
537,258
|
|||
|
Prepaid
expenses
|
181,791
|
|||
|
Assets
of discontinued component
|
116,046
|
|||
|
Total
current assets
|
4,842,067
|
|||
|
Property,
net
|
1,558,601
|
|||
|
Other
Assets:
|
||||
|
Goodwill
|
3,878,873
|
|||
|
Deferred
financing costs, net
|
5,647
|
|||
|
3,884,520
|
||||
|
Total
Assets
|
$
|
10,285,188
|
||
|
LIABILITIES
AND STOCKHOLDERS’ EQUITY
|
||||
|
Current
Liabilities:
|
||||
|
Notes
payable and current maturities of long-term debt
|
$
|
609,453
|
||
|
Current
maturities of capital lease obligations
|
256,215
|
|||
|
Accounts
payable
|
420,738
|
|||
|
Salaries
payable
|
518,148
|
|||
|
Accrued
vacation
|
488,808
|
|||
|
Accrued
rent expense
|
188,076
|
|||
|
Other
accrued liabilities
|
604,683
|
|||
|
Accrued
nonrecurring settlement
|
262,500
|
|||
|
Total
current liabilities
|
3,348,621
|
|||
|
Long-Term
Liabilities:
|
||||
|
Long-term
debt, net of current maturities
|
4,818,103
|
|||
|
Capital
lease obligations, net of current maturities
|
295,076
|
|||
|
5,113,179
|
||||
| Commitments and Contingencies | ||||
|
Stockholders’
Equity:
|
||||
|
Common
stock - $1 par value, 1,000,000 shares
|
||||
|
authorized,
120,878 shares issued and outstanding
|
120,878
|
|||
|
Additional
paid-in capital
|
4,822,405
|
|||
|
Accumulated
deficit
|
(3,119,895
|
)
|
||
|
Total
Stockholders' Equity
|
1,823,388
|
|||
|
Total
Liabilities and Stockholders' Equity
|
$
|
10,285,188
|
||
F-96
|
MAVERICK
ENGINEERING, INC.
|
|||||||
|
STATEMENTS
OF OPERATIONS
|
|||||||
|
(Unaudited)
|
|||||||
|
For
the Three Months Ended
|
|||||||
|
2008
|
2007
|
||||||
|
Revenues
|
$
|
9,683,121
|
$
|
8,238,303
|
|||
|
Cost
of Revenues
|
8,575,771
|
6,658,178
|
|||||
|
Gross
profit
|
1,107,350
|
1,580,125
|
|||||
|
General
and Administrative Expenses
|
1,126,429
|
1,130,954
|
|||||
|
(19,079
|
)
|
449,171
|
|||||
|
Other
Income (Expense):
|
|||||||
|
Other
income
|
674
|
138
|
|||||
|
Interest
expense
|
(105,671
|
)
|
(131,074
|
)
|
|||
|
(104,997
|
)
|
(130,936
|
)
|
||||
|
Income
(loss) from continuing operations
|
|||||||
|
before
income taxes
|
(124,076
|
)
|
318,235
|
||||
|
Income
taxes - state
|
29,049
|
24,715
|
|||||
|
Income
(loss) from continuing operations
|
(153,125
|
)
|
293,520
|
||||
|
Loss
From Operations of Discontinued Component
|
-
|
(12,656
|
)
|
||||
|
Net
income (loss)
|
$
|
(153,125
|
)
|
$
|
280,864
|
||
F-97
|
STATEMENT
OF CASH FLOWS
|
|||||||
|
For
the Three Months Ended
|
|||||||
|
2008
|
2007
|
||||||
|
Cash
Flows from Operating Activities:
|
|||||||
|
Income
(loss) from continuing operations
|
$
|
(153,125
|
)
|
$
|
293,520
|
||
|
Adjustments
to reconcile net income (loss) to net
|
|||||||
|
cash
provided by (used in) operating activities:
|
|||||||
|
Loss
from operations of discontinued component
|
-
|
(12,656
|
)
|
||||
|
Depreciation
and amortization
|
143,655
|
140,868
|
|||||
|
Loss
on sale of assets
|
20,202
|
-
|
|||||
|
Changes
in operating assets and liabilities:
|
|||||||
|
Accounts
receivable, net
|
1,976,907
|
201,602
|
|||||
|
Prepaid
expenses
|
(4,468
|
)
|
34,911
|
||||
|
Accounts
payable
|
(1,716,358
|
)
|
204,164
|
||||
|
Accounts
payable and accrued liabilities
|
(342,497
|
)
|
(222,141
|
)
|
|||
|
Assets
of discontinued component
|
22,723
|
67,576
|
|||||
|
Liabilities
of discontinued component
|
(71,489 | ) | - | ||||
|
Total
adjustments
|
28,675
|
414,324
|
|||||
|
Net
cash provided by (used in) operating
|
|||||||
|
activities
|
(124,450
|
)
|
707,844
|
||||
|
Cash
Flows from Investing Activities:
|
|||||||
|
Proceeds
from sale of property
|
|||||||
|
Purchase
of property
|
(7,494
|
)
|
(91,379
|
)
|
|||
|
Net
cash used in investing activities
|
(7,494
|
)
|
(91,379
|
)
|
|||
|
Cash
Flows from Financing Activities:
|
|||||||
|
Proceeds
from notes payable and long-term debt
|
1,545,950
|
1,129,851
|
|||||
|
Principal
payments on notes payable and long-term debt
|
(1,297,469
|
)
|
(1,680,784
|
)
|
|||
|
Payments
on capital lease obligations
|
(75,591
|
)
|
(81,677
|
)
|
|||
|
Proceeds
from sale of 749 shares of common stock
|
-
|
67,410
|
|||||
|
Net
cash provided by (used in) financing
|
|||||||
|
activities
|
172,890
|
(565,200
|
)
|
||||
|
Net
increase in cash
|
40,946
|
51,265
|
|||||
|
Cash,
beginning of period
|
30,185
|
31,014
|
|||||
|
Cash,
end of period
|
$
|
71,131
|
$
|
82,279
|
|||
F-98
MAVERICK
ENGINEERING, INC.
NOTES
TO FINANCIAL STATEMENTS
(Unaudited)
NOTE
1 - SUMMARY OF SIGNIFICANT ACCOUNTING POLICIES
The
accompanying unaudited financial statements have been prepared in accordance
with accounting principles generally accepted in the United States
of America
(“GAAP”) for interim financial statements. Accordingly, these financial
statements do not necessarily include all of the information and footnotes
required by GAAP for annual financial statements. In the opinion of
management,
all adjustments considered necessary for a fair presentation have been
included
and such adjustments are of a normal recurring nature. These interim
financial
statements should be read in conjunction with the annual financial
statements as
of and for the years ended December 31, 2007 and 2006 and the related
notes
thereto included elsewhere herein. The results of operations for the
three
months ended March 31, 2008 are not necessarily indicative of the results
for
the full fiscal year ending December 31, 2008 or for any other
period.
Business
Purpose
Maverick
Engineering, Inc. (the “Company”) was incorporated in December 1993 in the State
of Texas. The Company is engaged in providing engineering and construction
services primarily for three types of clients: (1) upstream oil & gas,
domestic oil and gas producers and pipeline companies; (2) Industrial,
petrochemical and refining plants; and (3) Infrastructure, private and
public
sectors, including state municipalities, cities, and port authorities.
The
Company is headquartered in Victoria, Texas and operates primarily in
Texas.
Business
Acquisition
Effective
January 1, 2006, the Company acquired the net assets of MGM Engineering
Group,
L.L.C. (“MGM”), a Texas limited liability company, which it operated as its
Harlingen office. The purchase price of $221,657 was allocated to the
fair value
of the assets of MGM with the excess being allocated to goodwill as
follows:
|
Property
|
$
|
171,657
|
||
|
Goodwill
|
50,000
|
|||
|
$
|
221,657
|
Revenues
and Accounts Receivable
Revenues
are billed and accounts receivable recorded as services are performed.
Most of
the Company’s work is performed under time and material projects.
Management
periodically reviews all accounts receivable to determine if any are
considered
delinquent based upon the age of the receivable and the credit worthiness
of the
parties involved. An allowance for doubtful accounts is recorded for
the amount
management estimates as uncollectible. An allowance of $94,942 was considered
necessary by management at March 31, 2008.
Unbilled
receivables represent costs and estimated fees on work for which billings
have
not been presented to customers. When billed, these amounts are included
in
accounts receivable - trade. Unbilled accounts receivable include management’s
best estimates of the amounts expected to be realized on the work that
has been
performed to date.
Property
Property
is recorded at cost. Improvements or betterments of a permanent nature
are
capitalized.
Expenditures for maintenance and repairs are charged to expense as incurred.
The
cost of assets retired or otherwise disposed of and the related accumulated
depreciation are eliminated from the accounts in the year of disposal.
Gains or
losses resulting from property disposals are credited or charged to operations
currently.
F-99
MAVERICK
ENGINEERING, INC.
NOTES
TO FINANCIAL STATEMENTS
(Unaudited)
NOTE
1 - SUMMARY OF SIGNIFICANT ACCOUNTING POLICIES
-(Continued)
The
Company computes depreciation using the straight-line method over the
estimated
useful lives as follows:
|
Office
equipment and furniture
|
3
-
15 years
|
|
Vehicles
|
5
years
|
|
Leasehold
improvements
|
5
years
|
|
Machinery
and equipment
|
5
-
7 years
|
Depreciation
expense amounted to approximately $135,000 and $132,000 for the three
months
ended March 31, 2008 and 2007, respectively.
Income
Taxes
The
Company elected to be taxed as an S corporation under provisions of the
Internal
Revenue Code. Under those provisions the stockholders are liable for
individual
federal income taxes on their respective share of the Company’s taxable income.
Therefore, no provision or liability for federal income taxes has been
included
in the financial statements. The Company is subject to franchise taxes
in the
State of Texas.
Presentation
of Sales Taxes
The
State
of Texas imposes a sales tax on all of the Company’s sales to nonexempt
customers. The Company collects that sales tax from customers and remits
the
entire amount to the State. The Company’s accounting policy is to exclude the
tax collected and remitted to the State from revenues and cost of
revenues.
Goodwill
Goodwill
represents the excess of cost over fair value of net assets acquired
through
acquisitions. Goodwill recorded on acquisitions prior to June 30, 2001
was
amortized through December 31, 2001. The Company adopted Statement of
Financial Accounting Standards (“SFAS”) No. 142, Goodwill
and Other Intangible Assets,
issued
in June 2001, and amortization of this goodwill ceased as of December
31, 2001.
The Company evaluates the goodwill on an annual basis for potential impairment.
Goodwill recorded by the Company after June 30, 2001 has not been amortized
and
is evaluated on an annual basis, or sooner if deemed necessary, in connection
with other long-lived assets, for potential impairment. In December 2007,
the
Company discontinued operations at its Harlingen office (see Business
Acquisition above). As a result, the Company determined that goodwill
was
impaired by $50,000. This has been included in the accompanying statement
of
operations in loss from operations of discontinued component. Revenues
from the
Harlingen office amounted to approximately $190,000 for the three months
ended
March 31, 2007. Management performed an impairment assessment on the
remaining
goodwill as of March 31, 2008 and 2007, which resulted in no impairment of
goodwill. An annual assessment of goodwill is conducted in the fourth
quarter of
each year.
F-100
MAVERICK
ENGINEERING, INC.
NOTES
TO FINANCIAL STATEMENTS
(Unaudited)
NOTE
1 - SUMMARY OF SIGNIFICANT ACCOUNTING POLICIES -
(Continued)
Deferred
Financing Costs
In
April
2005, the Company incurred financing costs associated with the assumption
of
debt. These costs are being deferred and amortized over the three-year
life of
the debt.
Amortization
expense amounted to approximately $8,500 for the three months ended March
31,
2008 and 2007.
Estimates
The
preparation of financial statements in conformity with accounting principles
generally accepted in the United States of America requires management
to make
estimates and assumptions that affect the reported amounts of assets
and
liabilities and disclosure of contingent assets and liabilities at the
date of
the financial statements and the reported amounts of revenues and expenses
during the reporting period. Actual results could differ from those estimates.
Management believes that these estimates and assumptions provide a reasonable
basis for the fair presentation of the financial statements.
NOTE
2 - RELATED PARTY TRANSACTIONS
The
Company leased certain office facilities from related parties. These
leases expired in 2007 (see Note 7).
NOTE
3 - NOTES PAYABLE AND LONG-TERM DEBT
Notes
payable and long-term debt at March 31, 2008 consist of the
following:
|
*$3,250,000
revolving line of credit, payable to a financial institution
in monthly interest payments at prime plus .25%, principal
and unpaid interest due at maturity in April
2011
|
$
|
3,156,761
|
||
|
|
||||
|
*$500,000
term note, payable to a financial institution in monthly
principal
and interest payments of $10,280 with interest at prime plus
.75%, unpaid principal and interest due at maturity in May
2009
|
345,761
|
F-101
MAVERICK
ENGINEERING, INC.
NOTES
TO FINANCIAL STATEMENTS
(Unaudited)
NOTE
3 - NOTES PAYABLE AND LONG-TERM DEBT - (Continued)
|
*$1,950,000
second term note, payable to a financial institution in monthly
installments beginning in July 2007. If balance is greater
than or equal
to $1,000,000, then payment is equal to principal balance
amortized over
48 months. If balance is less than $1,000,000, then principal
payment is
equal to principal balance amortized over 18 months. Interest
payable in
monthly installments of prime plus .50%. Principal and unpaid
interest due
at maturity in April 2011. If any part of Corpus Christi,
Texas operations
is sold, net proceeds from the sale must be used as prepayment
against the
note. If unpaid principal at the end of any calendar year,
beginning
December 31, 2007, is greater than $500,000 and adjusted
net income of the
Company is positive, 25% of the Company’s net income must be used as
prepayment to the financial institution within 120 days after
year-end.
|
$
|
1,584,375
|
||
|
$610,000
note, payable to a related party through common ownership
in monthly
interest payments at 12%, principal due at maturity in April
2008,
collateralized by guaranty of majority stockholder and substantially
all
assets excluding assets noted below (see “*”)
|
305,000
|
|||
|
Other
|
35,659
|
|||
|
5,427,556
|
||||
|
Less:
Current maturities
|
609,453
|
|||
|
$
|
4,818,103
|
*These
notes are collateralized by accounts receivable, a $4,000,000 life insurance
policy on the majority stockholder, general and limited partnership interests
owned by the majority stockholder, and common stock owned by the majority
stockholder.
F-102
MAVERICK
ENGINEERING, INC.
NOTES
TO FINANCIAL STATEMENTS
(Unaudited)
NOTE
3 - NOTES PAYABLE AND LONG-TERM DEBT - (Continued)
Annual
maturities of notes payable and long-term debt at March 31, 2008 are
as
follows:
|
For
the Year Ending March 31:
|
||||
|
2009
|
$
|
609,453
|
||
|
2010
|
746,967
|
|||
|
2011
|
3,949,261
|
|||
|
2012
|
121,875
|
|||
|
$
|
5,427,556
|
|||
NOTE
4 - OTHER ASSETS
The
following is a summary of goodwill and deferred financing costs at March
31,
2008:
|
Goodwill:
|
||||
|
Cost
|
$
|
3,905,727
|
||
|
Accumulated
amortization
|
(26,854
|
)
|
||
|
|
$3,878,873
|
|||
|
Deferred
financing costs:
|
||||
|
Cost
|
$
|
101,663
|
||
|
Accumulated
amortization
|
(96,016
|
) | ||
|
|
$5,647
|
|||
The
estimated amortization expenses for deferred financing costs are as
follows:
|
For
the Year Ending March 31:
|
||||
|
2009
|
$
|
5,647
|
||
NOTE
5 - SUPPLEMENTAL INFORMATION - STATEMENT OF CASH FLOWS
|
2008
|
2007
|
||||||
|
Interest
paid
|
$
|
128,965
|
$
|
156,243
|
|||
A
schedule of noncash investing and financing activities and other operating
activities is as follows:
|
2008
|
2007
|
||||||
|
Capital
lease obligation issued to acquire property
|
$
|
128,965
|
$
|
156,243
|
|||
| Stock issued for debt* | $ | 1,008,000 | |||||
*Effective
January 8, 2007, the holder of the $1,502,000
note, which had a balance of $1,047,783 at December 31, 2006, agreed
to exchange
$1,008,000 of debt for 11,200 shares of common stock of the Company.
The total
debt at the time of the exchange was $1,056,567 of principle and
accrued
interest. The difference between the exchange value and total debt
was $48,567
at the time of the exchange. This difference was paid to the note
holder in
cash.
F-103
MAVERICK
ENGINEERING, INC.
NOTES
TO FINANCIAL STATEMENTS
(Unaudited)
NOTE
6 - CONCENTRATION RISKS
Financial
instruments which potentially subject the Company to concentrations of
credit
risk principally consist of cash and trade receivables. The Company places
its
cash in financial institutions. At times, such investments may be in
excess of
FDIC insurance limits.
The
Company had approximately 57% and 74% in 2008 and 2007, respectively,
of total
revenues concentrated in three and four customers, respectively. At March
31,
2008, the Company had 58% of accounts receivable - trade concentrated
in three
customers.
NOTE
7 - OPERATING LEASES
The
Company leases its general office space and equipment under non- cancellable
operating leases. The obligations of the operating leases are summarized
as
follows:
|
For
the Twelve Months Periods Ending March 31:
|
||||
|
2009
|
$
|
899,773
|
||
|
2010
|
864,718
|
|||
|
2011
|
920,194
|
|||
|
2012
|
773,330
|
|||
|
2013
|
163,385
|
|||
|
Thereafter
|
315,094
|
|||
|
$
|
3,936,494
|
|||
Rent
expense amounted to approximately $225,000 and $194,000 for 2008 and
2007,
respectively, which includes approximately $75,250 paid to related parties
in
the three month period ended March 31, 2007. For the period subsequent
to March
31, 2008, there are no related party rental commitments.
NOTE
8 - BENEFIT PLAN
The
Company has adopted a defined contribution plan under Section 401(k)
of the
Internal Revenue Code for the benefit of all employees who have met certain
length-of-service requirements. Under this plan, employees may elect
to make
contributions pursuant to a salary reduction agreement. Each year, the
Company
may make a matching contribution to the plan on behalf of the participating
employees. Employer contributions to the plan are at the discretion of
the
Company. For the three months ended March 31, 2008 and 2007, employer
contributions charged to operations totaled approximately $216,000 and
$178,000,
respectively.
F-104
MAVERICK
ENGINEERING, INC.
NOTES
TO FINANCIAL STATEMENTS
(Unaudited)
NOTE
9 - CAPITAL
LEASE OBLIGATIONS
The
Company leases office equipment and vehicles under capital lease agreements.
Depreciation expense for capital leases is included with depreciation
on
property.
The
cost
and accumulated depreciation of capital leases at March 31, 2008 are
as
follows:
|
Office
equipment and furniture
|
$
|
810,955
|
||
|
Vehicles
|
371,598
|
|||
|
1,182,553
|
||||
|
Less:
Accumulated depreciation
|
601,861
|
|||
|
$
|
580,692
|
The
following is a schedule of future minimum lease payments under capitalized
leases together with the present value of the net minimum lease payments
at
March 31, 2008:
|
For
the Year Ending March 31:
|
||||
|
2009
|
$
|
293,570
|
||
|
2010
|
177,076
|
|||
|
2011
|
120,660
|
|||
|
2012
|
74,003
|
|||
|
2013
|
24,858
|
|||
|
Total
minimum lease payments
|
690,167
|
|||
|
Less:
Amount representing interest
|
138,876
|
|||
|
Present
value of minimum lease payments
|
551,291
|
|||
|
Less:
Current maturities
|
256,215
|
|||
|
|
$295,076
|
|||
The
effective interest rate on capitalized leases ranges from 5% - 27%.
NOTE
10 - PROPERTY
Property
at March 31, 2008 consists of the following:
|
Office
equipment and furniture
|
$
|
2,671,851
|
||
|
Vehicles
|
560,718
|
|||
|
Leasehold
improvements
|
182,344
|
|||
|
Machinery
and equipment
|
469,910
|
|||
|
3,884,823
|
||||
|
Less:
Accumulated depreciation
|
2,326,222
|
|||
|
|
$1,558,601
|
F-105
MAVERICK
ENGINEERING, INC.
NOTES
TO FINANCIAL STATEMENTS
(Unaudited)
NOTE
11 - INCENTIVE COMPENSATION AGREEMENTS
Pursuant
to two executive employee incentive compensation agreements and subject
to
achievement of performance targets and other conditions as specified
in the
agreement, the Company will issue annually the lesser of .5% of the issued
and
outstanding common stock of the Company or the number of shares which
would
elevate the executive to 3% of the issued and outstanding common stock
of the
Company. The executives are 100% vested in the stock issued. The Company
shall
have the right and option to repurchase the stock upon certain
events.
There
were no shares issued in the three month periods ended March 31, 2008
and
2007.
NOTE
12 - DISCONTINUED OPERATIONS
In
October 2007, Maverick Engineering management decided to discontinue
the
operations of its Harlingen office. Management notified customers of
its
intention to cease operations by the end of the fourth quarter of 2007.
The
amounts reported as assets and liabilities of discontinued operations
at March
31, 2008 and 2007 are as follows:
|
|
|
2008
|
2007
|
||||
|
Accounts
receivable
|
$
|
116,046
|
$
|
357,036
|
|||
|
Goodwill
|
-
|
50,000
|
|||||
|
Assets
of discontinued operations
|
$
|
116,046
|
$
|
407,036
|
|||
|
Notes
payable and current maturities
|
|||||||
|
of
long-term debt
|
$
|
63,713
|
|||||
|
Long-term
debt, net of current maturities
|
|
3,090
|
|||||
|
Liabilities
of discontinued operations
|
$
|
66,803
|
|||||
Revenues
from the Harlingen office amounted to approximately $0 and $190,000 for
the
three months ended March 31, 2008 and 2007 respectively.
NOTE
13 - COMMITMENTS AND CONTINGENCIES
During
the year ended December 31, 2007, Maverick entered into a settlement
agreement
regarding a claim of excess billings to a customer for services rendered
by
Maverick. The settlement resulted in Maverick incurring a liability
of $350,000.
The liability is to be paid in monthly installments of $29,167 beginning
on
January 1, 2008. Maverick has recorded a nonrecurring settlement expense
of
$350,000 for the year ended December 31, 2007.
Financial
instruments which potentially subject Maverick to concentrations of
credit risk
principally consist of cash. Maverick maintains cash with various financial
institutions. At times, such amounts may be in excess of FDIC insurance
limits.
NOTE
14 - SALE OF COMPANY
On
April
29, 2008, the Company was sold to Platinum Energy Resources, Inc., a
Delaware
corporation. Platinum Energy Resources, Inc., based in Houston, Texas,
is a
publicly traded company and trades under the ticker symbol PGRI.OB.
F-106
PLATINUM
ENERGY RESOURCES, INC./MAVERICK ENGINEERING, INC.
FOR
THE YEAR ENDED DECEMBER 31, 2007 AND AS OF AND FOR THE THREE MONTHS
ENDED MARCH
31, 2008
On
March
18, 2008,
Platinum
Energy Resources, Inc. and predecessor (“Platinum”),
Maverick
Engineering Resources, Inc. (“Maverick”) and
Robert L. Kovar Services, LLC (the “Sellers”) (as the representative of the
selling equity stake holders in Maverick) entered into an Agreement
and Plan of
Merger (“Merger Agreement”) pursuant to which Platinum acquired Maverick (the
“Merger”) for a gross purchase price of $11 million, subject to a working
capital purchase price adjustment, with $6 million paid at closing
and the
remaining $5 million to be paid over the next 6 years pursuant to
a non-interest
bearing note (the “Cashflow Notes”). Established in 1993, Maverick is a
full-service engineering service company with 270 employees including
a staff of
70 engineers, consultants, surveyors, scientists and planners. Maverick
is a
provider of project management, engineering, procurement, and construction
management services to both the public and private sectors. Maverick
is based in
South Texas with offices in Corpus Christi, Victoria and Houston.
In connection
with the Merger, Platinum entered into a five year employment agreement
with
Robert Kovar, the founder and CEO of Maverick, pursuant to which
he joined
Platinum as its Chief Operating Officer in addition to continuing
as President
of Maverick.
The
following unaudited pro forma condensed combined financial statements
of
Platinum and Maverick are
provided to assist you in your analysis of the financial aspects
of
the
Merger.
The
unaudited pro forma condensed combined statement of operations for
the year
ended December 31, 2007 combines the proforma consolidated results
of operations
of Platinum and its predecessor company and the historical statements of
operations Maverick giving effect to the Merger
as if it
had occurred on January 1, 2007.
The
unaudited pro forma condensed combined balance sheet combines the
historical
balance sheets of Platinum and Maverick as of March 31, 2008 giving
effect to
the Merger
as
if it
had
occurred March 31, 2008.
The
unaudited pro forma condensed combined statement of operations for
the three
months ended March 31, 2008 combines the historical statements of
operations of
Platinum and Maverick giving effect to the Merger
as if it
had occurred on January 1, 2008.
The
pro
forma adjustments give effect to events that are directly attributable
to the
transactions discussed below and are based on available data and
certain
assumptions that management believes are factually supportable. In
addition, the
adjustments made to the pro forma statements of operations are limited
to those
that have a continuing impact on the combined company.
The
unaudited pro forma condensed combined financial statements described
above
should be read in conjunction with the historical consolidated financial
statements of Platinum for the period April 25, 2005 (inception)
to December 31,
2005 and the years ended December 31, 2006 and 2007 and the related
notes
thereto and the historical financial statements of Maverick for the
years ended
December 31, 2006 and 2007 and the related notes thereto, the unaudited
pro
forma statement of operations of Platinum and its predecessor company
for the
year ended December 31, 2007 and in conjunction with the unaudited
historical
financial statements of Platinum for the three months ended March
31, 2008 and
2007 and the related notes thereto and the unaudited historical financial
statements of Maverick for the three months ended March 31, 2008
and 2007 and
the related notes thereto. The financial statements of Platinum are
included in
its Form 10-K/A (Amendment No. 2) for the year ended December 31,
2007 and its
Form 10-Q for the quarter ended March 31, 2008 filed with the Securities
and
Exchange Commission. The Maverick statements are
included
elsewhere herein. The pro
forma
adjustments are preliminary and the unaudited pro forma information
is not
necessarily indicative of the financial position or results of operations
that
may have actually occurred had the Merger
Agreement taken place on the dates noted, or the future financial
position or
operating results of Platinum.
F-107
The
aggregate purchase price as of March 31, 2008 for Maverick
determined based upon the pro forma assumptions contained herein
is as follows:
|
Cash
|
|
$
|
6,000,000
|
|
|
Cashflow
Notes (net of $1,517,000 discount to present value)
|
|
|
3,483,000
|
|
|
Estimated
closing costs, principally legal
|
|
|
200,000
|
|
|
Total
purchase price
|
|
$
|
9,683,000
|
|
The
Unaudited Pro Forma Condensed Combined Financial Statements reflect
that the
Merger
is
accounted for under the purchase method of accounting in accordance
with the
Statement of Financial Accounting Standard (“SFAS”) No. 141, Business
Combinations.
Based
upon a preliminary determination, utilizing currently available
information,
the
excess of purchase price of assets acquired over their carrying value
as of
March 31, 2008 has been allocated
to
customer contracts and relationships, executive employment and covenant
not to
compete and goodwill. All other assets and liabilities acquired are
preliminarily estimated to be stated at their fair values, which
approximates
their recorded historical cost. It is contemplated that the transaction
will
qualify as a tax-free reorganization under Section 368(a)(1)(C) of
the IRS Code.
Accordingly, for income tax purposes, Platinum will assume the carryover
basis
of Maverick and will have no income tax deduction for the amortization
of
intangible assets for the difference between the amount allocated
to these
intangible assets and their carryover basis from Maverick or possible
goodwill
write-down(s) that may occur. We intend
to
engage
a firm
to prepare a final valuation of the acquired assets and liabilities.
At such
time as the valuation is complete, we will adjust the allocation
of the purchase
price among the acquired assets and assumed liabilities to reflect
the final
valuation as prescribed by SFAS No. 141.
Accordingly, historical cost approximates fair value for these assets.
The
preliminary allocation of the purchase price to the acquired assets
and assumed
liabilities is as follows:
|
Assets:
|
||||
|
Current
assets
|
$
|
4,842,000
|
||
|
Property
|
1,559,000
|
|||
|
Intangible
assets - employment agreement
|
206,000
|
|||
|
Intangible
assets - customer contracts and relationships
|
4,430,000
|
|||
|
Intangible
assets - covenant not to compete
|
886,000
|
|||
|
Goodwill
|
6,220,000
|
|||
|
|
$
|
18,143,000
|
||
|
Liabilities:
|
||||
|
Current
liabilities
|
$
|
3,347,000
|
||
|
Long-term
debt
|
1,661,000
|
|||
|
Revolving
line of credit
|
3,157,000
|
|||
|
Capitalized
lease obligations
|
295,000
|
|||
|
|
8,460,000
|
|||
|
Net
purchase price
|
$
|
9,683,000
|
F-108
UNAUDITED
PRO FORMA CONDENSED COMBINED STATEMENT OF OPERATIONS
Year
Ended December 31, 2007
|
Platinum
Energy Resources, Inc.
|
Maverick
Engineering, Inc.
|
Pro
Forma Adjustments
|
Notes
|
Pro
Forma Combined
|
|||||||||||||||
|
*
|
Dr
|
Cr
|
|||||||||||||||||
|
|
|||||||||||||||||||
|
Revenues
|
$
|
18,139,836
|
$
|
33,372,449
|
$
|
-
|
$
|
-
|
$
|
51,512,285
|
|||||||||
|
Costs
and expenses:
|
|||||||||||||||||||
|
Lease
operating expense
|
7,194,461
|
-
|
-
|
-
|
7,194,461
|
||||||||||||||
|
Cost
of revenues
|
-
|
28,331,742
|
-
|
-
|
28,331,742
|
||||||||||||||
|
Marketing,
general and administrative
|
8,318,904
|
4,534,689
|
9,200
|
-
|
B
|
12,862,793
|
|||||||||||||
|
Depreciation,
depletion and amortization
|
6,946,671
|
593,768
|
851,000
|
-
|
A
|
8,391,439
|
|||||||||||||
|
Accretion
of asset retirement obligations
|
154,616
|
-
|
-
|
-
|
154,616
|
||||||||||||||
|
Total
costs and expenses
|
22,614,652
|
33,460,199
|
860,200
|
-
|
56,935,051
|
||||||||||||||
|
Operating
loss
|
(4,474,816
|
)
|
(87,750
|
)
|
(860,200
|
)
|
-
|
(5,422,766
|
)
|
||||||||||
|
Other
income (expense):
|
|||||||||||||||||||
|
Interest
income
|
15,893
|
-
|
-
|
-
|
15,893
|
||||||||||||||
|
Interest
(expense)
|
(59,580
|
)
|
(478,352
|
)
|
305,000
|
-
|
C
|
(842,932
|
)
|
||||||||||
|
Change
in fair value of derivatives
|
(5,108,972
|
)
|
-
|
-
|
-
|
(5,108,972
|
)
|
||||||||||||
|
Non
recurring settlement expense
|
-
|
(350,000
|
)
|
-
|
-
|
(350,000
|
)
|
||||||||||||
|
Other
|
423,395
|
3,251
|
-
|
-
|
426,646
|
||||||||||||||
|
Total
other income (expense), net
|
(4,729,264
|
)
|
(825,101
|
)
|
305,000
|
-
|
(5,859,365
|
)
|
|||||||||||
|
Loss
before income taxes
|
(9,204,080
|
)
|
(912,851
|
)
|
(1,165,200
|
)
|
-
|
(11,282,131
|
)
|
||||||||||
|
Benefit
(provision) for income taxes
|
|||||||||||||||||||
|
Current
|
3,351,000
|
(108,000
|
)
|
128,000
|
D
|
3,371,000
|
|||||||||||||
|
Deferred
|
36,000
|
-
|
-
|
-
|
36,000
|
||||||||||||||
|
Total
income tax benefit (expense)
|
3,387,000
|
(108,000
|
)
|
-
|
128,000
|
3,407,000
|
|||||||||||||
|
Loss
from continuing operations
|
$
|
(5,817,080
|
)
|
(1,020,851
|
)
|
|
(1,165,200
|
)
|
|
128,000
|
$
|
(7,875,131
|
)
|
||||||
|
Pro
forma weighted average common shares outstanding:
|
|||||||||||||||||||
|
Basic
and diluted
|
18,876,347
|
|
18,876,347
|
||||||||||||||||
|
Pro
forma loss per common share:
|
|||||||||||||||||||
|
Basic
and diluted
|
$
|
(0.42
|
)
|
||||||||||||||||
*
Represents results of operations of Platinum for the year ended December
31,
2007 and TEC from October 26, 2007 (date of acquisition) to December
31, 2007,
and the results of operations and the effects of the asset acquisition
of TEC as
if it had occurred on January 1, 2007.
F-109
PLATINUM
ENERGY RESOURCES, INC./MAVERICK ENGINEERING, INC.
NOTES
TO UNAUDITED PRO FORMA CONDENSED
COMBINED
STATEMENT OF OPERATIONS
December
31, 2007
Income
Statement pro forma notes:
|
Note
A
|
|
To
record amortization expense associated with allocation
of purchase price
of Maverick to intangible assets
|
|
|||
|
|
|
|
|
|
|
|
|
|
|
Expense
|
Amortization
expense
|
$
|
851,000
|
|
|
|
|
|
|
|
|
|
|
Note
B
|
|
To
provide for contractually obligated anticipated stock
compensation
expense
|
|
|||
|
|
|
|
|
|
|
|
|
|
|
Expense
|
Marketing,
general and administrative - stock based compensation
|
$
|
9,200
|
|
|
|
|
|
|
|||
|
Note
C
|
|
To
provide for amortization of debt discount associated
with non interest
bearing Cash flow notes issued in the Maverick acquisition
|
|
|||
|
|
|
|
|
|
|
|
|
|
|
Expense
|
Interest
expense
|
$
|
305,000
|
|
|
|
|
|
|
|||
|
Note
D
|
|
To
reflect the reduction in income tax expense associated
with the effect on
pro forma income of Notes A, C and D
|
|
|||
|
|
|
|
|
|
|
|
|
|
|
Income
|
Income
Tax Expense
|
$
|
(128,000
|
)
|
F-110
PLATINUM
ENERGY RESOURCES, INC./MAVERICK ENGINEERING, INC.
UNAUDITED
PRO FORMA CONDENSED COMBINED BALANCE SHEET
March
31, 2008
|
Platinum
Energy Resources, Inc.
|
Maverick
Engineering, Inc.
|
Pro
Forma Adjustments
|
Notes
|
Pro
Forma Combined
|
|||||||||||||||
|
Assets
|
Dr
|
Cr
|
|||||||||||||||||
|
Current
assets:
|
|||||||||||||||||||
|
Cash
and cash equivalents
|
$
|
15,061,586
|
$
|
71,131
|
$
|
-
|
$
|
6,200,000
|
1
|
$
|
8,932,717
|
||||||||
|
Accounts
receivable:
|
|||||||||||||||||||
|
Oil
and gas sales
|
4,382,657
|
-
|
-
|
-
|
4,382,657
|
||||||||||||||
|
Joint
interest and other
|
586,034
|
3,982,942
|
-
|
-
|
4,568,976
|
||||||||||||||
|
Unbilled
accounts receivable on completed contracts
|
-
|
606,203
|
606,203
|
||||||||||||||||
|
Inventory
|
152,932
|
-
|
-
|
-
|
152,932
|
||||||||||||||
|
Prepaid
expenses and other current assets
|
835,617
|
181,791
|
-
|
-
|
1,017,408
|
||||||||||||||
|
Total
current assets
|
21,018,826
|
4,842,067
|
-
|
6,200,000
|
19,660,893
|
||||||||||||||
|
Property
and equipment:
|
|||||||||||||||||||
|
Oil
and gas properties, full cost method
|
180,713,481
|
-
|
-
|
180,713,481
|
|||||||||||||||
|
Other
fixed assets rigs, equipment, office
|
3,706,676
|
3,884,823
|
-
|
-
|
7,591,499
|
||||||||||||||
|
Less
accumulated deprectiaion, depletion and amortization
|
(3,297,507
|
)
|
(2,326,222
|
)
|
-
|
-
|
(5,623,729
|
)
|
|||||||||||
|
Total
property and equipment - net
|
181,122,650
|
1,558,601
|
-
|
-
|
182,681,251
|
||||||||||||||
|
Other
assets:
|
|||||||||||||||||||
|
Fair
value of commodity
|
807,750
|
-
|
-
|
-
|
807,750
|
||||||||||||||
|
Goodwill,net
|
-
|
3,878,873
|
2,340,960
|
-
|
1
|
6,219,833
|
|||||||||||||
|
Intangible
assets
|
5,522,250
|
-
|
1
|
5,522,250
|
|||||||||||||||
|
Advance
payment and costs, acquisition transactions
|
218,870
|
-
|
-
|
-
|
218,870
|
||||||||||||||
|
Covenant
not to compete, net
|
357,356
|
-
|
-
|
357,356
|
|||||||||||||||
|
Deferred
loan costs
|
-
|
5,647
|
-
|
5,647
|
1
|
-
|
|||||||||||||
|
Real
estate held for development
|
2,700,000
|
-
|
-
|
-
|
2,700,000
|
||||||||||||||
|
Total
assets
|
$
|
206,225,452
|
$
|
10,285,188
|
$
|
7,863,210
|
$
|
6,205,647
|
$
|
218,168,203
|
|||||||||
F-111
PLATINUM
ENERGY RESOURCES, INC./MAVERICK ENGINEERING, INC.
UNAUDITED
PRO FORMA CONDENSED COMBINED BALANCE SHEET
March
31, 2008
|
Platinum
Energy Resources, Inc.
|
Maverick
Engineering, Inc.
|
Pro
Forma Adjustments
|
Notes
|
Pro
Forma Combined
|
|||||||||||||||
|
Liabilities
and Stockholders' Equity
|
Dr
|
Cr
|
|||||||||||||||||
|
Current
liabilities:
|
|||||||||||||||||||
|
Accounts
payable:
|
|||||||||||||||||||
|
Trade
|
$
|
2,425,547
|
$
|
420,738
|
$
|
-
|
$
|
-
|
$
|
2,846,285
|
|||||||||
|
Oil
and gas sales
|
1,462,200
|
-
|
-
|
-
|
1,462,200
|
||||||||||||||
|
Current
portion of long-term debt
|
-
|
609,453
|
609,453
|
-
|
2
|
-
|
|||||||||||||
|
Current
portion of long-term debt - Sellers
|
-
|
-
|
609,453
|
2
|
609,453
|
||||||||||||||
|
Current
portion of capitalized lease obligation
|
-
|
256,215
|
256,215
|
||||||||||||||||
|
Fair
value of commodity derivatives
|
3,804,669
|
-
|
-
|
-
|
3,804,669
|
||||||||||||||
|
Acquisition
note payable - current portion
|
300,000
|
-
|
-
|
300,000
|
|||||||||||||||
|
Accrued
liabilities and other
|
413,445
|
2,060,166
|
-
|
2,473,611
|
|||||||||||||||
|
Asset
retirement obligation - current
|
186,545
|
-
|
186,545
|
||||||||||||||||
|
Income
taxes payable
|
101,960
|
-
|
-
|
-
|
101,960
|
||||||||||||||
|
Total
current liabilities
|
8,694,366
|
3,346,572
|
609,453
|
609,453
|
12,040,938
|
||||||||||||||
|
Revolving
bank line of credit
|
5,508,767
|
3,156,751
|
3,156,751
|
-
|
2
|
5,508,767
|
|||||||||||||
|
Revolving
line of credit - Sellers
|
-
|
-
|
3,156,751
|
2
|
3,156,751
|
||||||||||||||
|
Long-term
debt
|
-
|
1,661,352
|
1,661,352
|
2
|
-
|
||||||||||||||
|
Long-term
debt - Sellers
|
1,661,352
|
2
|
1,661,352
|
||||||||||||||||
|
Capitalized
lease obligations, net of current maturities
|
-
|
295,076
|
295,076
|
||||||||||||||||
|
Deferred
tax liability
|
48,085,215
|
-
|
48,085,215
|
||||||||||||||||
|
Cashflow
notes payable - Maverick acquisition
|
-
|
-
|
1,517,000
|
5,000,000
|
1
|
3,483,000
|
|||||||||||||
|
Acquistion
note payable
|
250,000
|
-
|
-
|
-
|
250,000
|
||||||||||||||
|
Asset
retirement obligation - non-current
|
3,720,161
|
-
|
-
|
-
|
3,720,161
|
||||||||||||||
|
Total
liabilities
|
66,258,509
|
8,459,751
|
6,944,556
|
10,427,556
|
78,201,260
|
||||||||||||||
|
Stockholders’
equity:
|
|||||||||||||||||||
|
Preferred
stock
|
-
|
-
|
-
|
-
|
-
|
||||||||||||||
|
Common
stock
|
2,407
|
-
|
-
|
-
|
2,407
|
||||||||||||||
|
Net
equity - Maverick
|
-
|
1,825,437
|
1,825,437
|
-
|
1
|
-
|
|||||||||||||
|
Additional
paid-in capital
|
155,064,142
|
-
|
-
|
-
|
155,064,142
|
||||||||||||||
|
Retained
earnings
|
561,858
|
-
|
-
|
-
|
561,858
|
||||||||||||||
|
Treasury
stock
|
(15,661,464
|
)
|
-
|
-
|
-
|
(15,661,464
|
)
|
||||||||||||
|
Total
stockholders’ equity
|
139,966,943
|
1,825,437
|
1,825,437
|
-
|
139,966,943
|
||||||||||||||
|
Total
liabilities and stockholders’equity
|
$
|
206,225,452
|
$
|
10,285,188
|
$
|
8,769,993
|
$
|
10,427,556
|
$
|
218,168,203
|
|||||||||
|
Pro
forma book value per common share
|
$
|
6.34 | |||||||||||||||||
F-112
PLATINUM
ENERGY RESOURCES, INC./MAVERICK ENGINEERING, INC.
UNAUDITED
PRO FORMA CONDENSED COMBINED STATEMENT OF OPERATIONS
Three
Months Ended March 31, 2008
|
Platinum
Energy Resources, Inc.
|
Maverick
Engineering, Inc.
|
Pro
Forma Adjustments
|
Notes
|
Pro
Forma Combined
|
|||||||||||||||
|
Dr
|
Cr
|
||||||||||||||||||
|
Revenues
|
$
|
7,134,804
|
$
|
9,683,121
|
$
|
-
|
$
|
-
|
$
|
16,817,925
|
|||||||||
|
Costs
and expenses:
|
|||||||||||||||||||
|
Lease
operating expense
|
2,456,306
|
-
|
-
|
-
|
2,456,306
|
||||||||||||||
|
Cost
of revenues
|
-
|
8,432,116
|
-
|
-
|
8,432,116
|
||||||||||||||
|
Marketing,
general and administrative
|
1,731,827
|
1,126,429
|
4,750
|
-
|
A
|
2,863,006
|
|||||||||||||
|
Depreciation,
depletion and amortization
|
2,063,289
|
143,655
|
212,000
|
-
|
B
|
2,418,944
|
|||||||||||||
|
Accretion
of asset retirement obligation
|
61,669
|
-
|
-
|
-
|
61,669
|
||||||||||||||
|
Total
costs and expenses
|
6,313,091
|
9,702,200
|
216,750
|
-
|
16,232,041
|
||||||||||||||
|
Operating
income (loss)
|
821,713
|
(19,079
|
)
|
(216,750
|
)
|
-
|
585,884
|
||||||||||||
|
Other
income (expense):
|
|||||||||||||||||||
|
Interest
income
|
104,387
|
-
|
-
|
-
|
104,387
|
||||||||||||||
|
Interest
(expense)
|
(13,805
|
)
|
(104,997
|
)
|
74,000
|
-
|
C
|
(192,802
|
)
|
||||||||||
|
Change
in fair value of derivatives
|
(2,035,923
|
)
|
-
|
-
|
-
|
(2,035,923
|
)
|
||||||||||||
|
Other
|
69,111
|
-
|
-
|
-
|
69,111
|
||||||||||||||
|
Total
other income (expense), net
|
(1,876,230
|
)
|
(104,997
|
)
|
74,000
|
-
|
(2,055,227
|
)
|
|||||||||||
|
Loss
before income taxes
|
(1,054,517
|
)
|
(124,076
|
)
|
(290,750
|
)
|
-
|
(1,469,343
|
)
|
||||||||||
|
Pro
forma benefit (provision)
|
|
|
|
||||||||||||||||
|
Current
|
54,000
|
(29,049
|
)
|
-
|
32,000
|
D
|
56,951
|
||||||||||||
|
Deferred
|
-
|
-
|
-
|
-
|
-
|
||||||||||||||
|
Total
income tax benefit (expense)
|
54,000
|
(29,049
|
)
|
-
|
32,000
|
56,951
|
|||||||||||||
|
NET
LOSS
|
$
|
(1,000,517
|
)
|
$
|
(153,125
|
)
|
$
|
(290,750
|
)
|
$
|
32,000
|
$
|
(1,412,392
|
)
|
|||||
|
Pro
forma weighted average common shares outstanding:
|
|||||||||||||||||||
|
Basic
and diluted
|
22,070,762
|
|
22,070,762
|
||||||||||||||||
|
Pro
forma income per common share:
|
|||||||||||||||||||
|
Basic
and diluted
|
$
|
(0.06
|
)
|
||||||||||||||||
F-113
PLATINUM
ENERGY RESOURCES, INC./MAVERICK ENGINEERING, INC.
NOTES
TO UNAUDITED PRO FORMA CONDENSED COMBINED FINANCIAL STATEMENTS March
31, 2008
Balance
Sheet pro forma notes
|
Note
1
|
|
Represents
the application of the adjusted purchase price to the excess
of fair value
over the cost of the assets acquired, payment of cash consideration
and
transaction costs, issuance of non-interest bearing cash
flow notes and
elimination of deferred costs associated with the long-term
indebtedness
|
|
|||
|
|
|
|
|
|
|
|
|
|
|
Increase
|
Intangible
assets - employment agreement
|
$
|
206,250
|
|
|
|
|
|
|
|
||
|
|
|
Increase
|
Intangible
assets - customer relationships
|
|
4,430,000
|
|
|
|
|
|
|
|
||
|
|
|
Increase
|
Intangible
assets - covenant not to compete
|
|
886,000
|
|
|
|
|
|
|
|
||
|
Increase
|
Goodwill
|
|
2,340,960
|
|||
|
|
|
Decrease
|
Equity
accounts - Maverick
|
|
1,825,437
|
|
|
|
|
|
|
|
||
|
|
|
Decrease
|
Deferred
fees - financing costs
|
|
(5,647
|
)
|
|
|
|
|
|
|
||
|
|
|
Increase
|
Cash
flow notes payable
|
|
(5,000,000
|
)
|
|
|
|
|
|
|
||
|
Increase
|
Cash
flow notes payable - discount to present value
|
1,517,000
|
||||
|
|
|
Decrease
|
Cash
|
|
(6,200,000
|
)
|
|
Note
2
|
|
Represents
reclassification of Maverick bank indebtedness assumed
by selling
shareholders
|
|
|||
|
|
|
|
|
|
|
|
|
|
|
Decrease
|
Current
portion of long-term debt
|
$
|
609,453
|
|
|
|
|
|
|
|
|
|
|
|
|
Decrease
|
Revolving
bank line of credit
|
|
3,156,751
|
|
|
|
|
|
|
|
|
|
|
|
|
Decrease
|
Long-term
debt
|
|
1,661,352
|
|
|
|
|
|
|
|
|
|
|
|
|
Increase
|
Current
portion of long-term debt - sellers
|
|
(609,453
|
)
|
|
|
|
|
|
|
|
|
|
|
|
Decrease
|
Revolving
bank line of credit - sellers
|
|
(3,156,751
|
)
|
|
|
|
|
|
|
|
|
|
|
|
Decrease
|
Long-term
debt - sellers
|
|
(1,661,352
|
)
|
F-114
Income
Statement pro forma notes:
|
Note
A
|
|
To
provide for contractually obligated anticipated stock
compensation
expense
|
|
|||
|
|
|
|
|
|
|
|
|
|
|
Expense
|
Marketing,
general and administrative - stock based compensation
|
$
|
4,750
|
|
|
|
|
|
|
|||
|
Note
B
|
|
To
record amortization expense associated with allocation
of purchase price
of Maverick to intangible assets
|
|
|||
|
|
|
|
|
|
|
|
|
|
|
Expense
|
Stock
based compensation
|
$
|
212,000
|
|
|
|
|
|
|
|||
|
Note
C
|
|
To
provide for amortization of debt discount associated
with non interest
bearing Cash flow notes issued in the Maverick acquisition
|
|
|||
|
|
|
|
|
|
|
|
|
|
|
Expense
|
Interest
expense
|
$
|
74,000
|
|
|
|
|
|
|
|||
|
Note
D
|
|
To
reflect the reduction in income tax expense associated
with the effect on
pro forma income of Notes A and C
|
|
|||
|
|
|
|
|
|
|
|
|
|
|
Income
|
Income
tax expense
|
$
|
(32,000
|
)
|
F-115
Common
Stock
Prospectus
AUGUST
11, 2008