UNITED STATES
SECURITIES AND EXCHANGE COMMISSION
Washington, D.C. 20549
FORM N-CSR
CERTIFIED SHAREHOLDER REPORT OF REGISTERED MANAGEMENT INVESTMENT COMPANIES
Investment Company Act file number 811-21774
First Trust Exchange-Traded Fund
(Exact name of registrant as specified in charter)
120 East Liberty Drive, Suite 400
Wheaton, IL 60187
(Address of principal executive offices) (Zip code)
W. Scott Jardine, Esq.
First Trust Portfolios L.P.
120 East Liberty Drive, Suite 400
Wheaton, IL 60187
(Name and address of agent for service)
Registrant's telephone number, including area code: (630) 765-8000
Date of fiscal year end: December 31
Date of reporting period: June 30, 2023
Form N-CSR is to be used by management investment companies to file reports with the Commission not later than 10 days after the transmission to stockholders of any report that is required to be transmitted to stockholders under Rule 30e-1 under the Investment Company Act of 1940 (17 CFR 270.30e-1). The Commission may use the information provided on Form N-CSR in its regulatory, disclosure review, inspection, and policymaking roles.
A registrant is required to disclose the information specified by Form N-CSR, and the Commission will make this information public. A registrant is not required to respond to the collection of information contained in Form N-CSR unless the Form displays a currently valid Office of Management and Budget ("OMB") control number. Please direct comments concerning the accuracy of the information collection burden estimate and any suggestions for reducing the burden to Secretary, Securities and Exchange Commission, 100 F Street, NE, Washington, DC 20549. The OMB has reviewed this collection of information under the clearance requirements of 44 U.S.C. § 3507.
Item 1. Report to Stockholders.
| (a) | The registrant's semi-annual report transmitted to shareholders pursuant to Rule 30e-1 under the Investment Company Act of 1940 is as follows: |
June 30, 2023

|
First Trust Dow Jones Select MicroCap Index Fund (FDM)
|
|
First Trust Morningstar Dividend Leaders Index Fund (FDL)
|
|
First Trust US Equity Opportunities ETF (FPX)
|
|
First Trust NYSE® Arca® Biotechnology Index Fund (FBT)
|
|
First Trust Dow Jones Internet Index Fund (FDN)
|
|
First Trust Capital Strength ETF (FTCS)
|
|
First Trust Value Line® Dividend Index Fund (FVD)
|
Semi-Annual Report
June 30, 2023
|
2
|
|
|
3
|
|
|
4
|
|
|
6
|
|
|
8
|
|
|
10
|
|
|
12
|
|
|
14
|
|
|
16
|
|
|
18
|
|
|
19
|
|
|
21
|
|
|
25
|
|
|
27
|
|
|
31
|
|
|
33
|
|
|
35
|
|
|
37
|
|
|
42
|
|
|
44
|
|
|
46
|
|
|
49
|
|
|
56
|
|
|
65
|
Semi-Annual Letter from the Chairman and CEO
June 30, 2023
non-profit business membership and research group organization, reported that its Leading Economic Index, which is composed of 10 economic indicators whose changes tend to precede changes in the overall economy, fell by 0.7% to a reading of 106.1 in June 2023, according to Reuters. The result represents the fifteenth consecutive monthly decline in the index, the longest streak of
month-over-month decreases since just before the financial crisis in 2007. From our perspective, even if the Fed can pull off a soft landing, it is likely to be a very bumpy ride.

Chairman of the Board of Trustees
Chief Executive Officer of First Trust Advisors L.P.
Semi-Annual Report
June 30, 2023
Senior Vice President and Chief Market Strategist
First Trust Advisors L.P.

|
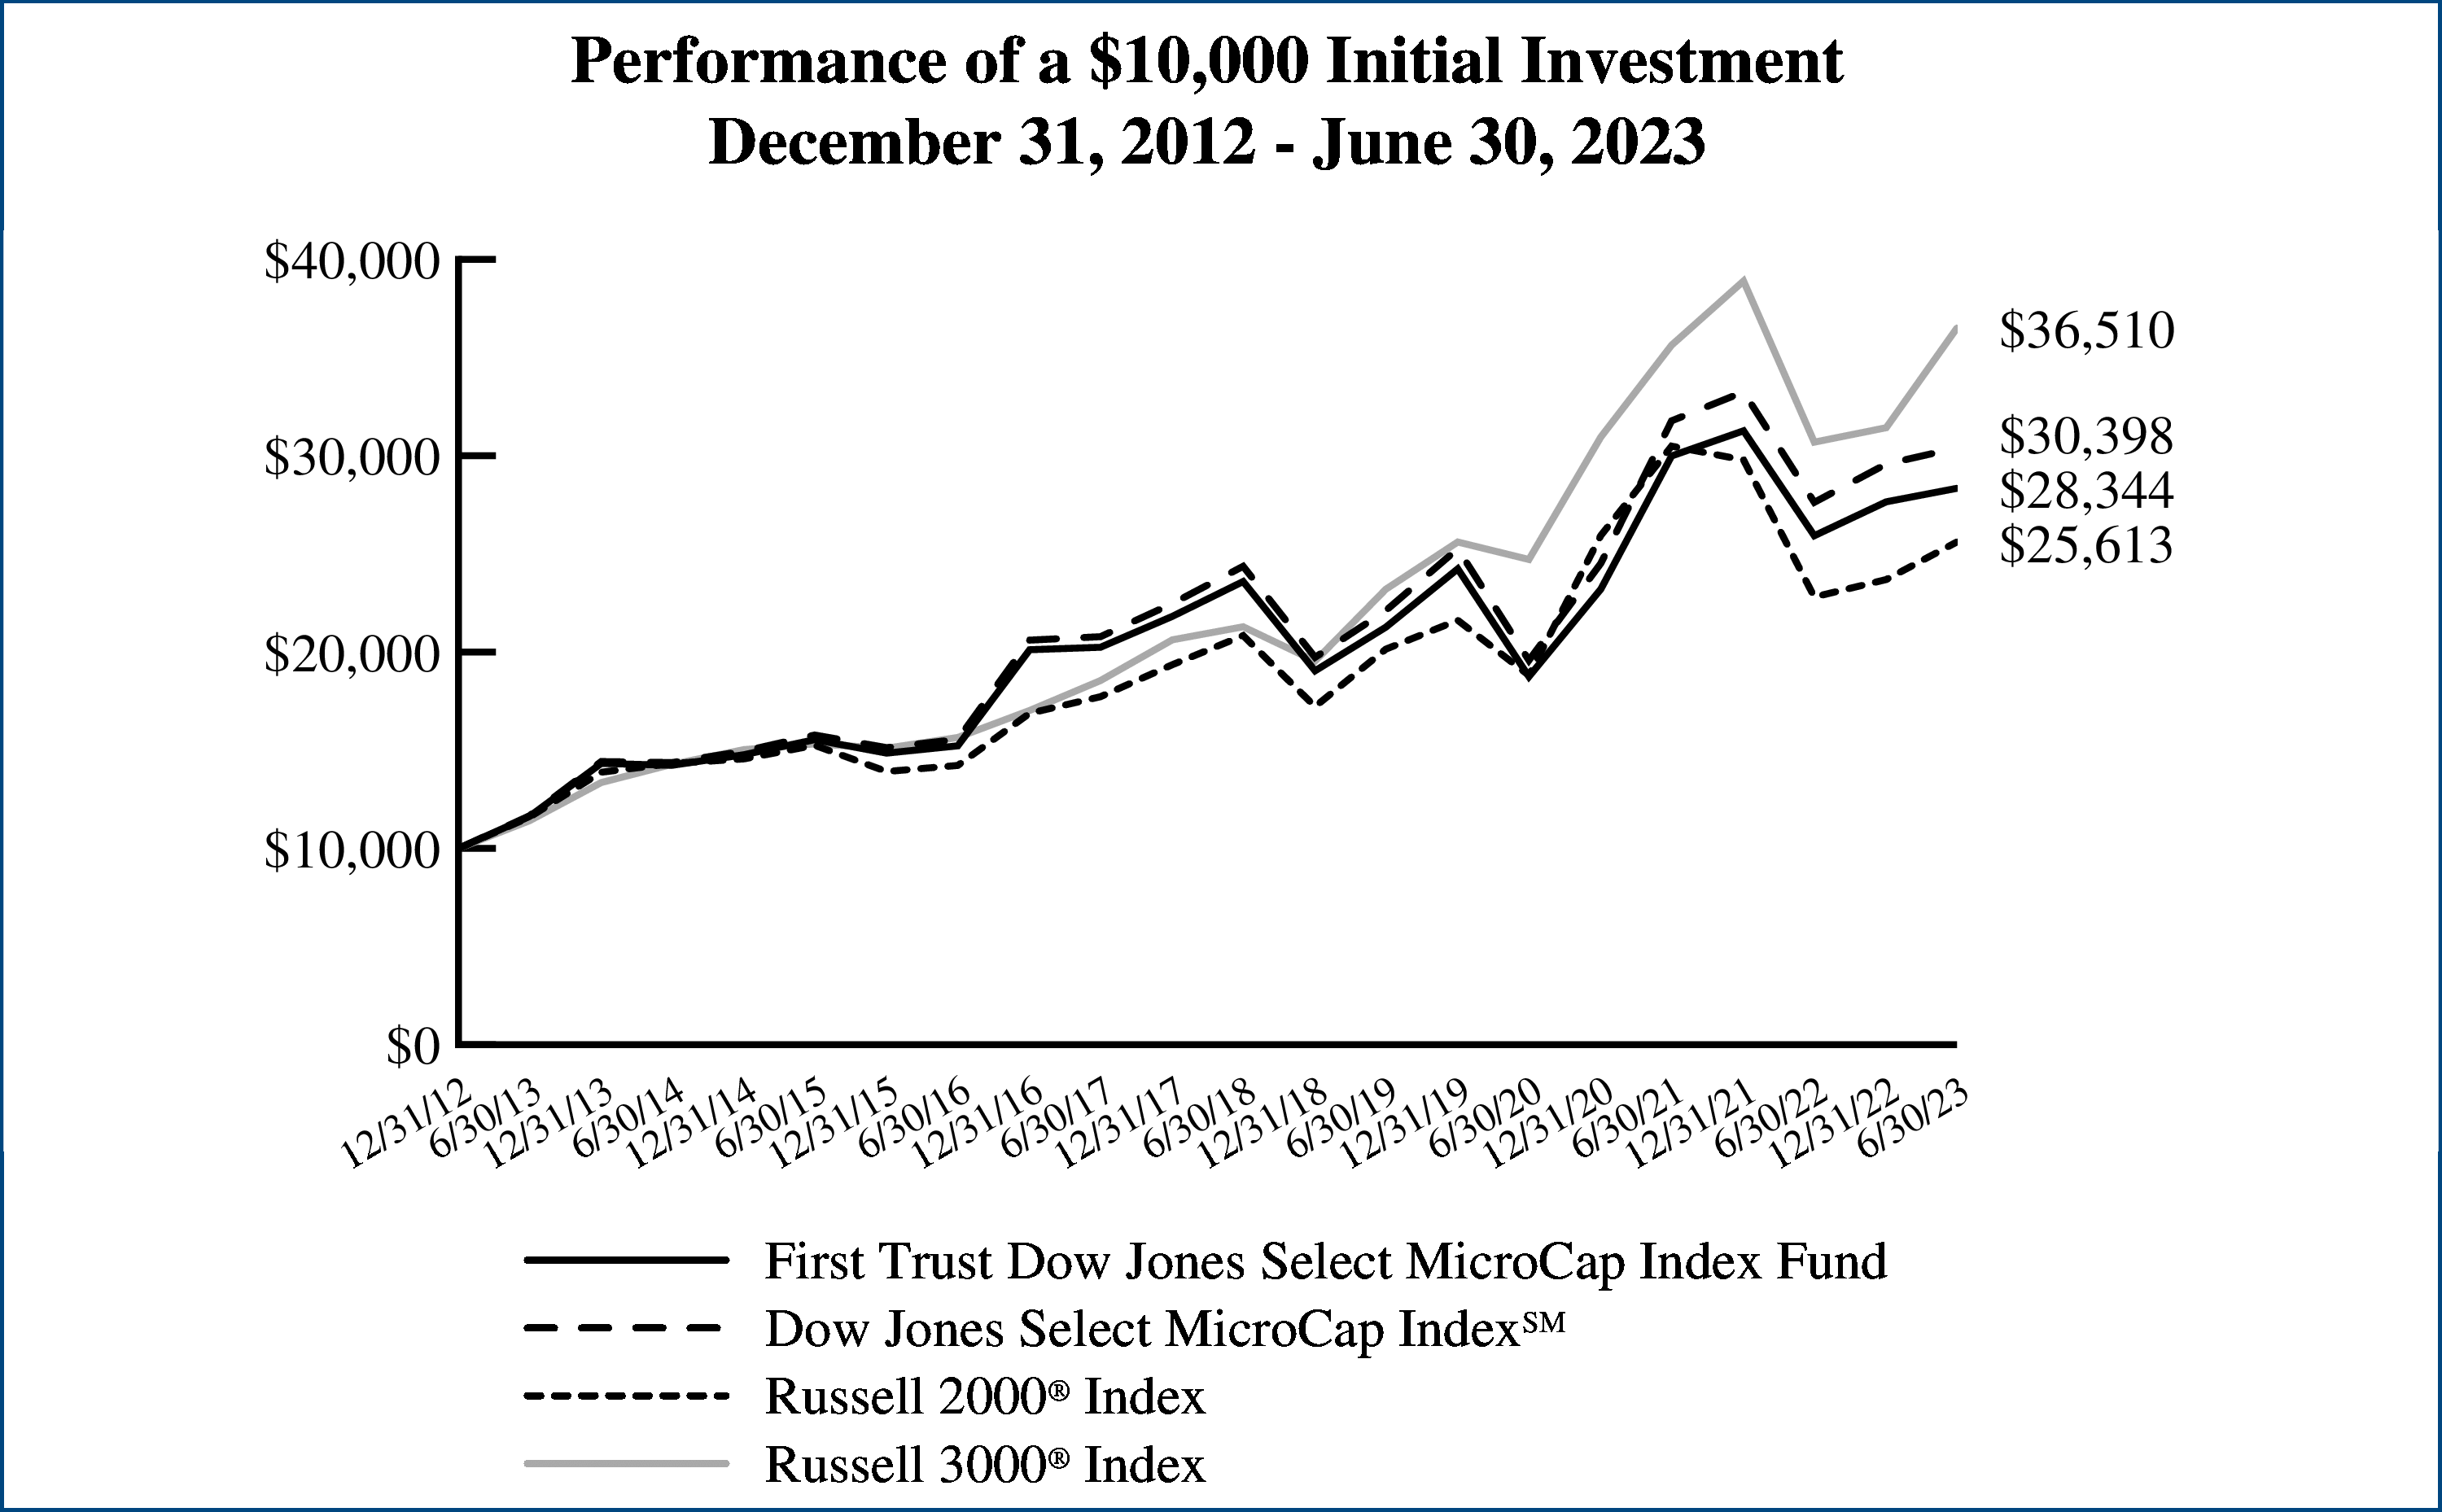
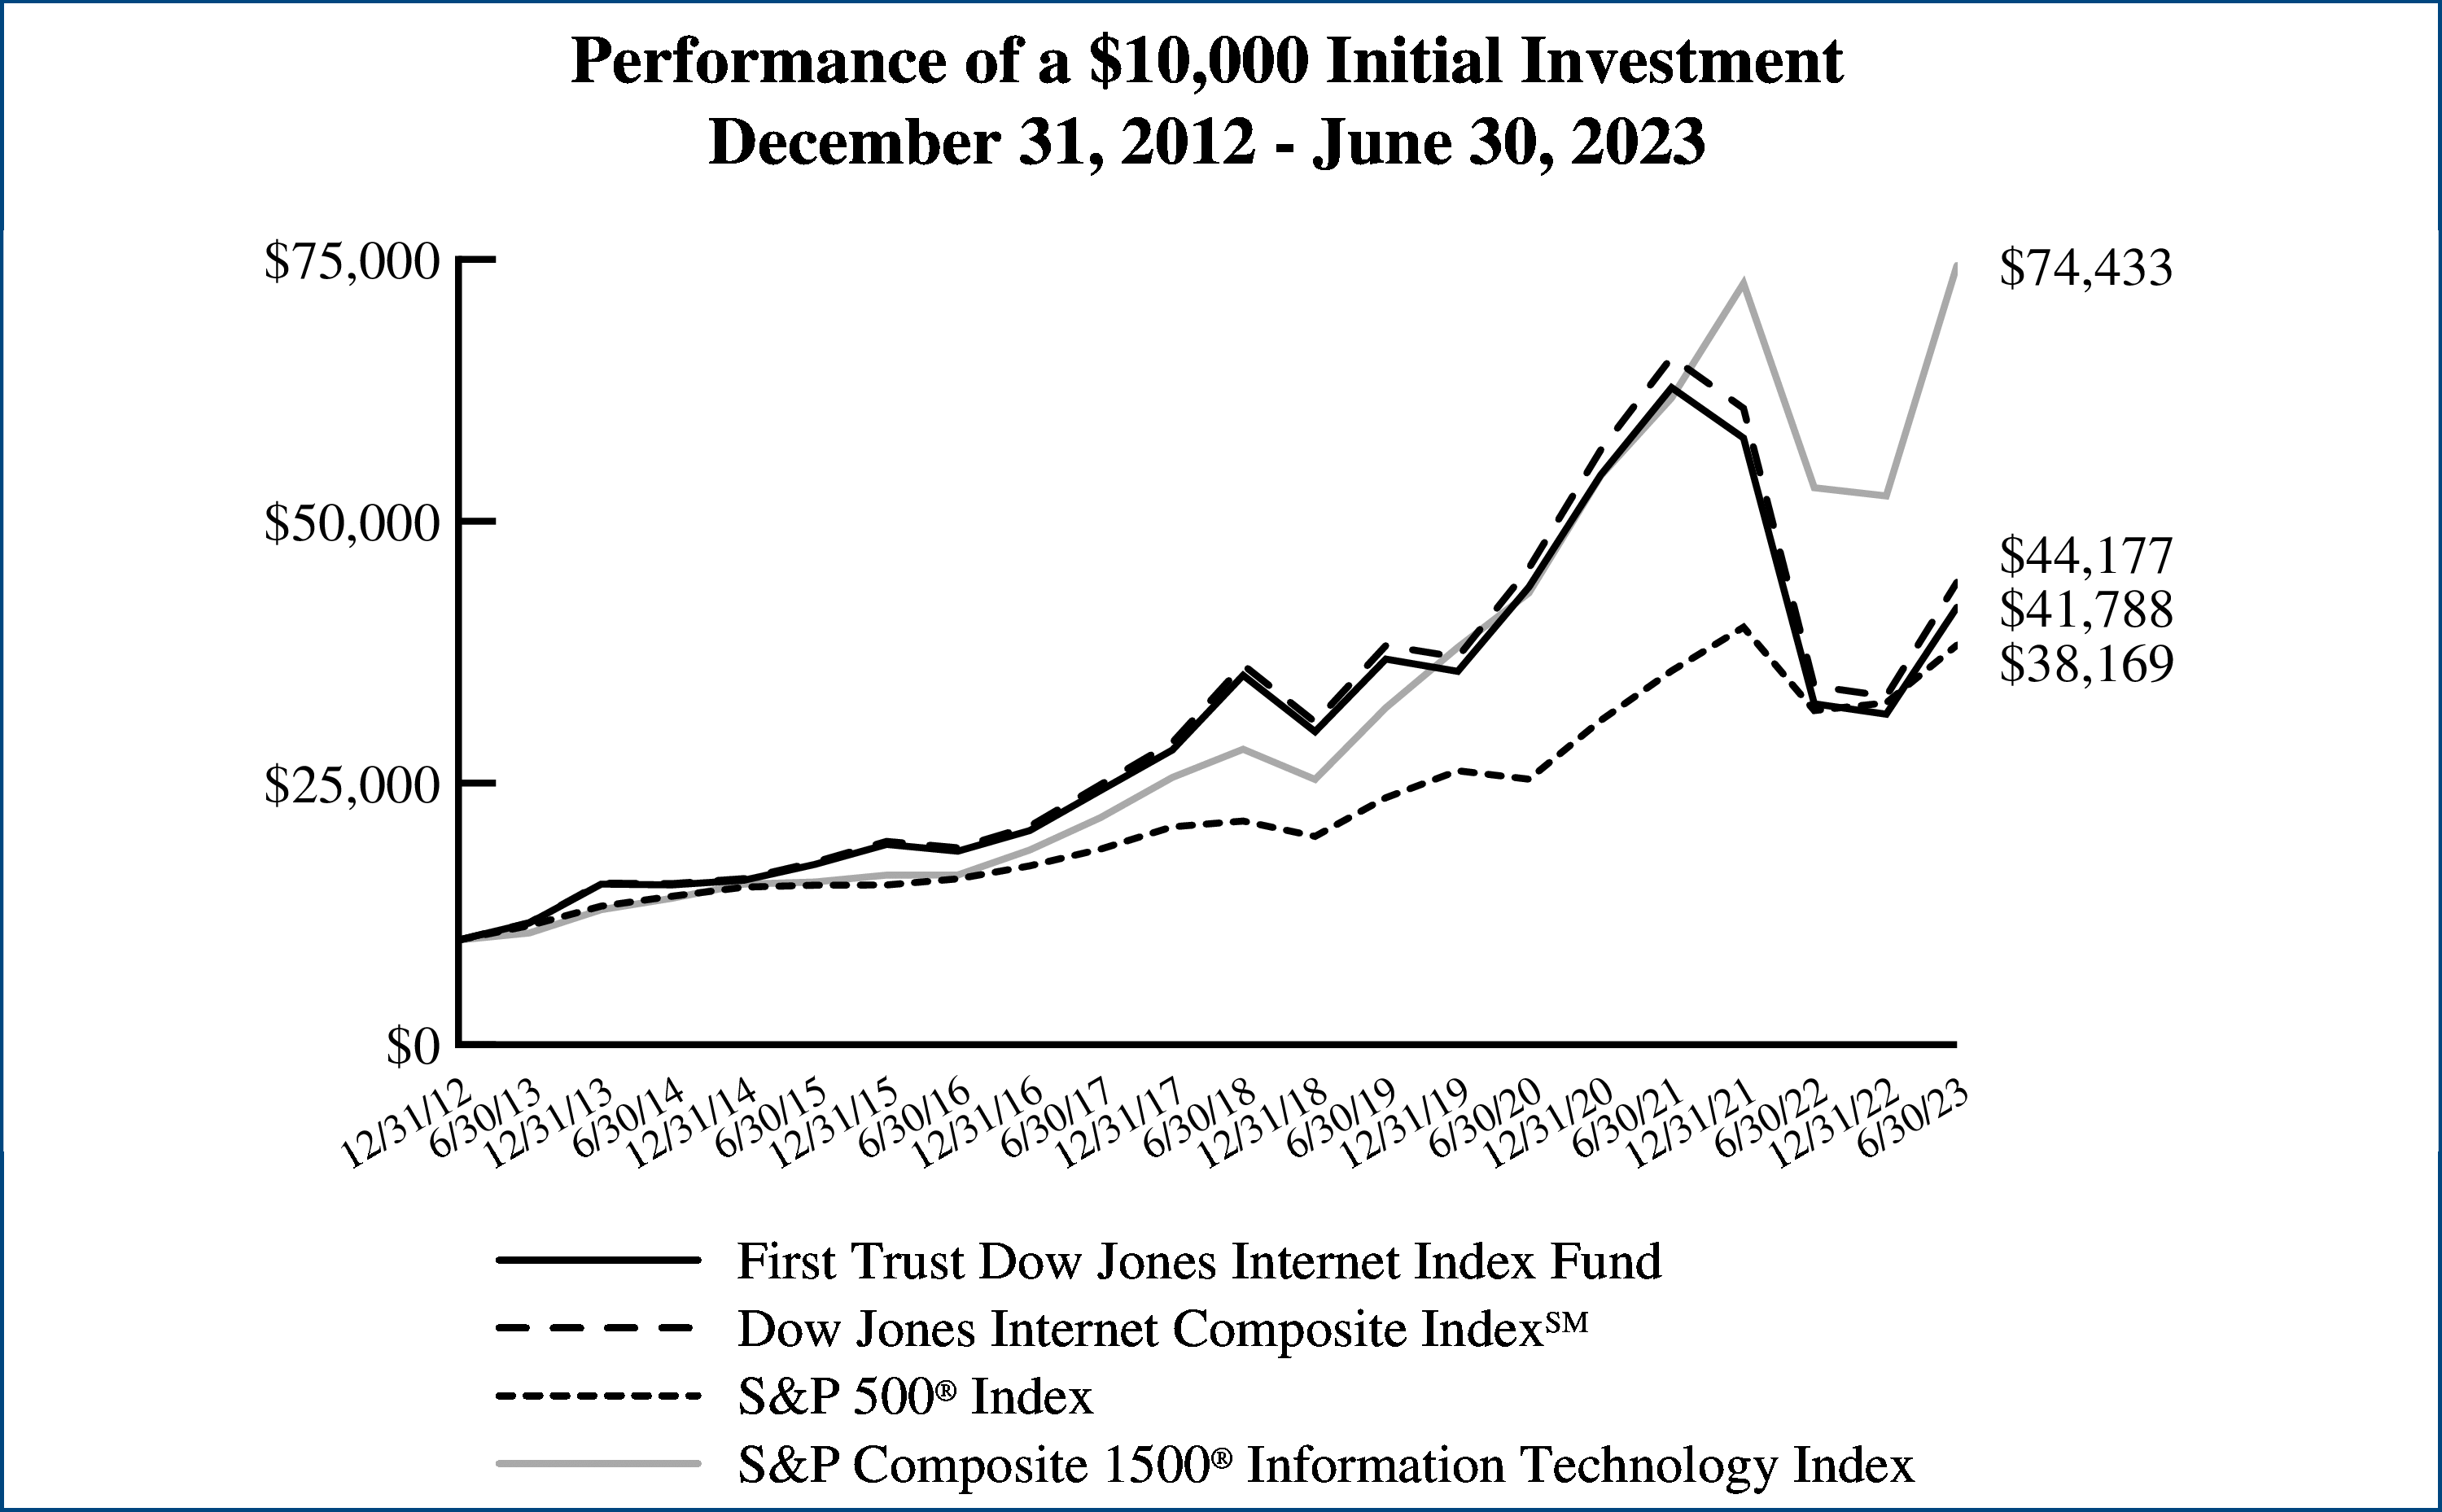
Performance
|
||||||||
|
|
|
|
Average Annual Total Returns
|
Cumulative Total Returns
|
||||
|
|
6 Months
Ended
6/30/23
|
1 Year
Ended
6/30/23
|
5 Years
Ended
6/30/23
|
10 Years
Ended
6/30/23
|
Inception
(9/27/05)
to 6/30/23
|
5 Years
Ended
6/30/23
|
10 Years
Ended
6/30/23
|
Inception
(9/27/05)
to 6/30/23
|
|
Fund Performance
|
|
|
|
|
|
|
|
|
|
NAV
|
2.49%
|
9.33%
|
3.74%
|
9.32%
|
7.18%
|
20.13%
|
143.84%
|
242.71%
|
|
Market Price
|
2.51%
|
9.36%
|
3.70%
|
9.35%
|
7.18%
|
19.93%
|
144.46%
|
242.44%
|
|
Index Performance
|
|
|
|
|
|
|
|
|
|
Dow Jones Select MicroCap
IndexSM
|
2.77%
|
10.04%
|
4.52%
|
10.06%
|
7.92%
|
24.73%
|
160.73%
|
286.92%
|
|
Russell 2000® Index
|
8.09%
|
12.31%
|
4.21%
|
8.26%
|
7.55%
|
22.89%
|
121.06%
|
264.33%
|
|
Russell 3000® Index
|
16.17%
|
18.95%
|
11.39%
|
12.34%
|
9.58%
|
71.49%
|
220.10%
|
407.72%
|
|
Sector Allocation
|
% of Total
Long-Term
Investments
|
|
Financials
|
28.2%
|
|
Consumer Discretionary
|
19.8
|
|
Industrials
|
19.0
|
|
Energy
|
8.3
|
|
Information Technology
|
6.4
|
|
Materials
|
5.0
|
|
Real Estate
|
3.6
|
|
Health Care
|
3.5
|
|
Communication Services
|
3.1
|
|
Consumer Staples
|
2.5
|
|
Utilities
|
0.6
|
|
Total
|
100.0%
|
|
Top Ten Holdings
|
% of Total
Long-Term
Investments
|
|
Sitio Royalties Corp., Class A
|
3.7%
|
|
Modine Manufacturing Co.
|
3.0
|
|
John B Sanfilippo & Son, Inc.
|
1.8
|
|
National Western Life Group, Inc., Class A
|
1.7
|
|
Thermon Group Holdings, Inc.
|
1.5
|
|
Beazer Homes USA, Inc.
|
1.4
|
|
Dorian LPG Ltd.
|
1.4
|
|
PubMatic, Inc., Class A
|
1.4
|
|
Collegium Pharmaceutical, Inc.
|
1.3
|
|
Chuy’s Holdings, Inc.
|
1.3
|
|
Total
|
18.5%
|
Dow Jones Select MicroCap IndexSM (“Index”) is a product of S&P Dow Jones Indices LLC or its affiliates (“SPDJI”) and has been licensed for use by First Trust. S&P® is a registered trademark of Standard & Poor’s Financial Services LLC (“S&P”); Dow Jones® is a registered trademark of Dow Jones Trademark Holdings LLC (“Dow Jones”); and these trademarks have been licensed for use by SPDJI and sublicensed for certain purposes by First Trust. The Fund is not sponsored, endorsed, sold or promoted by SPDJI, Dow Jones, S&P, or their respective affiliates and none of such parties make any representation regarding the advisability of investing in such product nor do they have any liability for any errors, omissions, or interruptions of the Index.
 |
Performance figures assume reinvestment of
all distributions and do not reflect the
deduction of taxes that a shareholder would
pay on Fund distributions or the redemption
or sale of Fund shares. An index is a statistical
composite that tracks a specified financial
market or sector. Unlike the Fund, the indices
do not actually hold a portfolio of securities
and therefore do not incur the expenses
incurred by the Fund. These expenses
negatively impact the performance of the
Fund. The Fund’s past performance does not
predict future performance.
|
|
Performance
|
||||||||
|
|
|
|
Average Annual Total Returns
|
Cumulative Total Returns
|
||||
|
|
6 Months
Ended
6/30/23
|
1 Year
Ended
6/30/23
|
5 Years
Ended
6/30/23
|
10 Years
Ended
6/30/23
|
Inception
(3/9/06)
to 6/30/23
|
5 Years
Ended
6/30/23
|
10 Years
Ended
6/30/23
|
Inception
(3/9/06)
to 6/30/23
|
|
Fund Performance
|
|
|
|
|
|
|
|
|
|
NAV
|
-4.80%
|
1.19%
|
7.96%
|
9.12%
|
7.20%
|
46.68%
|
139.46%
|
233.03%
|
|
Market Price
|
-4.82%
|
1.07%
|
7.89%
|
9.13%
|
7.19%
|
46.18%
|
139.61%
|
232.82%
|
|
Index Performance
|
|
|
|
|
|
|
|
|
|
Morningstar® Dividend
Leaders IndexSM
|
-4.56%
|
1.61%
|
8.52%
|
9.68%
|
7.74%
|
50.51%
|
151.92%
|
263.22%
|
|
S&P 500® Index
|
16.89%
|
19.59%
|
12.31%
|
12.86%
|
9.68%
|
78.66%
|
235.35%
|
394.88%
|
|
Russell 1000® Value Index
|
5.12%
|
11.54%
|
8.11%
|
9.22%
|
7.31%
|
47.66%
|
141.55%
|
239.20%
|
|
Sector Allocation
|
% of Total
Long-Term
Investments
|
|
Financials
|
22.0%
|
|
Energy
|
17.6
|
|
Health Care
|
15.0
|
|
Consumer Staples
|
12.9
|
|
Utilities
|
9.3
|
|
Communication Services
|
9.1
|
|
Information Technology
|
4.8
|
|
Consumer Discretionary
|
4.1
|
|
Industrials
|
2.8
|
|
Materials
|
2.4
|
|
Total
|
100.0%
|
|
Top Ten Holdings
|
% of Total
Long-Term
Investments
|
|
Verizon Communications, Inc.
|
9.1%
|
|
Chevron Corp.
|
8.3
|
|
AbbVie, Inc.
|
8.2
|
|
Pfizer, Inc.
|
6.9
|
|
Philip Morris International, Inc.
|
6.6
|
|
Altria Group, Inc.
|
5.3
|
|
International Business Machines Corp.
|
4.7
|
|
Citigroup, Inc.
|
3.0
|
|
3M Co.
|
2.6
|
|
Pioneer Natural Resources Co.
|
2.5
|
|
Total
|
57.2%
|
Morningstar® and Morningstar® Dividend Leaders IndexSM are registered trademarks and service marks of Morningstar, Inc. (“Morningstar”) and have been licensed for use by First Trust on behalf of the Fund. The Fund is not sponsored, endorsed, issued, sold or promoted by Morningstar and Morningstar makes no representation regarding the advisability of investing in the Fund.
 |
Performance figures assume reinvestment of
all distributions and do not reflect the
deduction of taxes that a shareholder would
pay on Fund distributions or the redemption
or sale of Fund shares. An index is a statistical
composite that tracks a specified financial
market or sector. Unlike the Fund, the indices
do not actually hold a portfolio of securities
and therefore do not incur the expenses
incurred by the Fund. These expenses
negatively impact the performance of the
Fund. The Fund’s past performance does not
predict future performance.
|
|
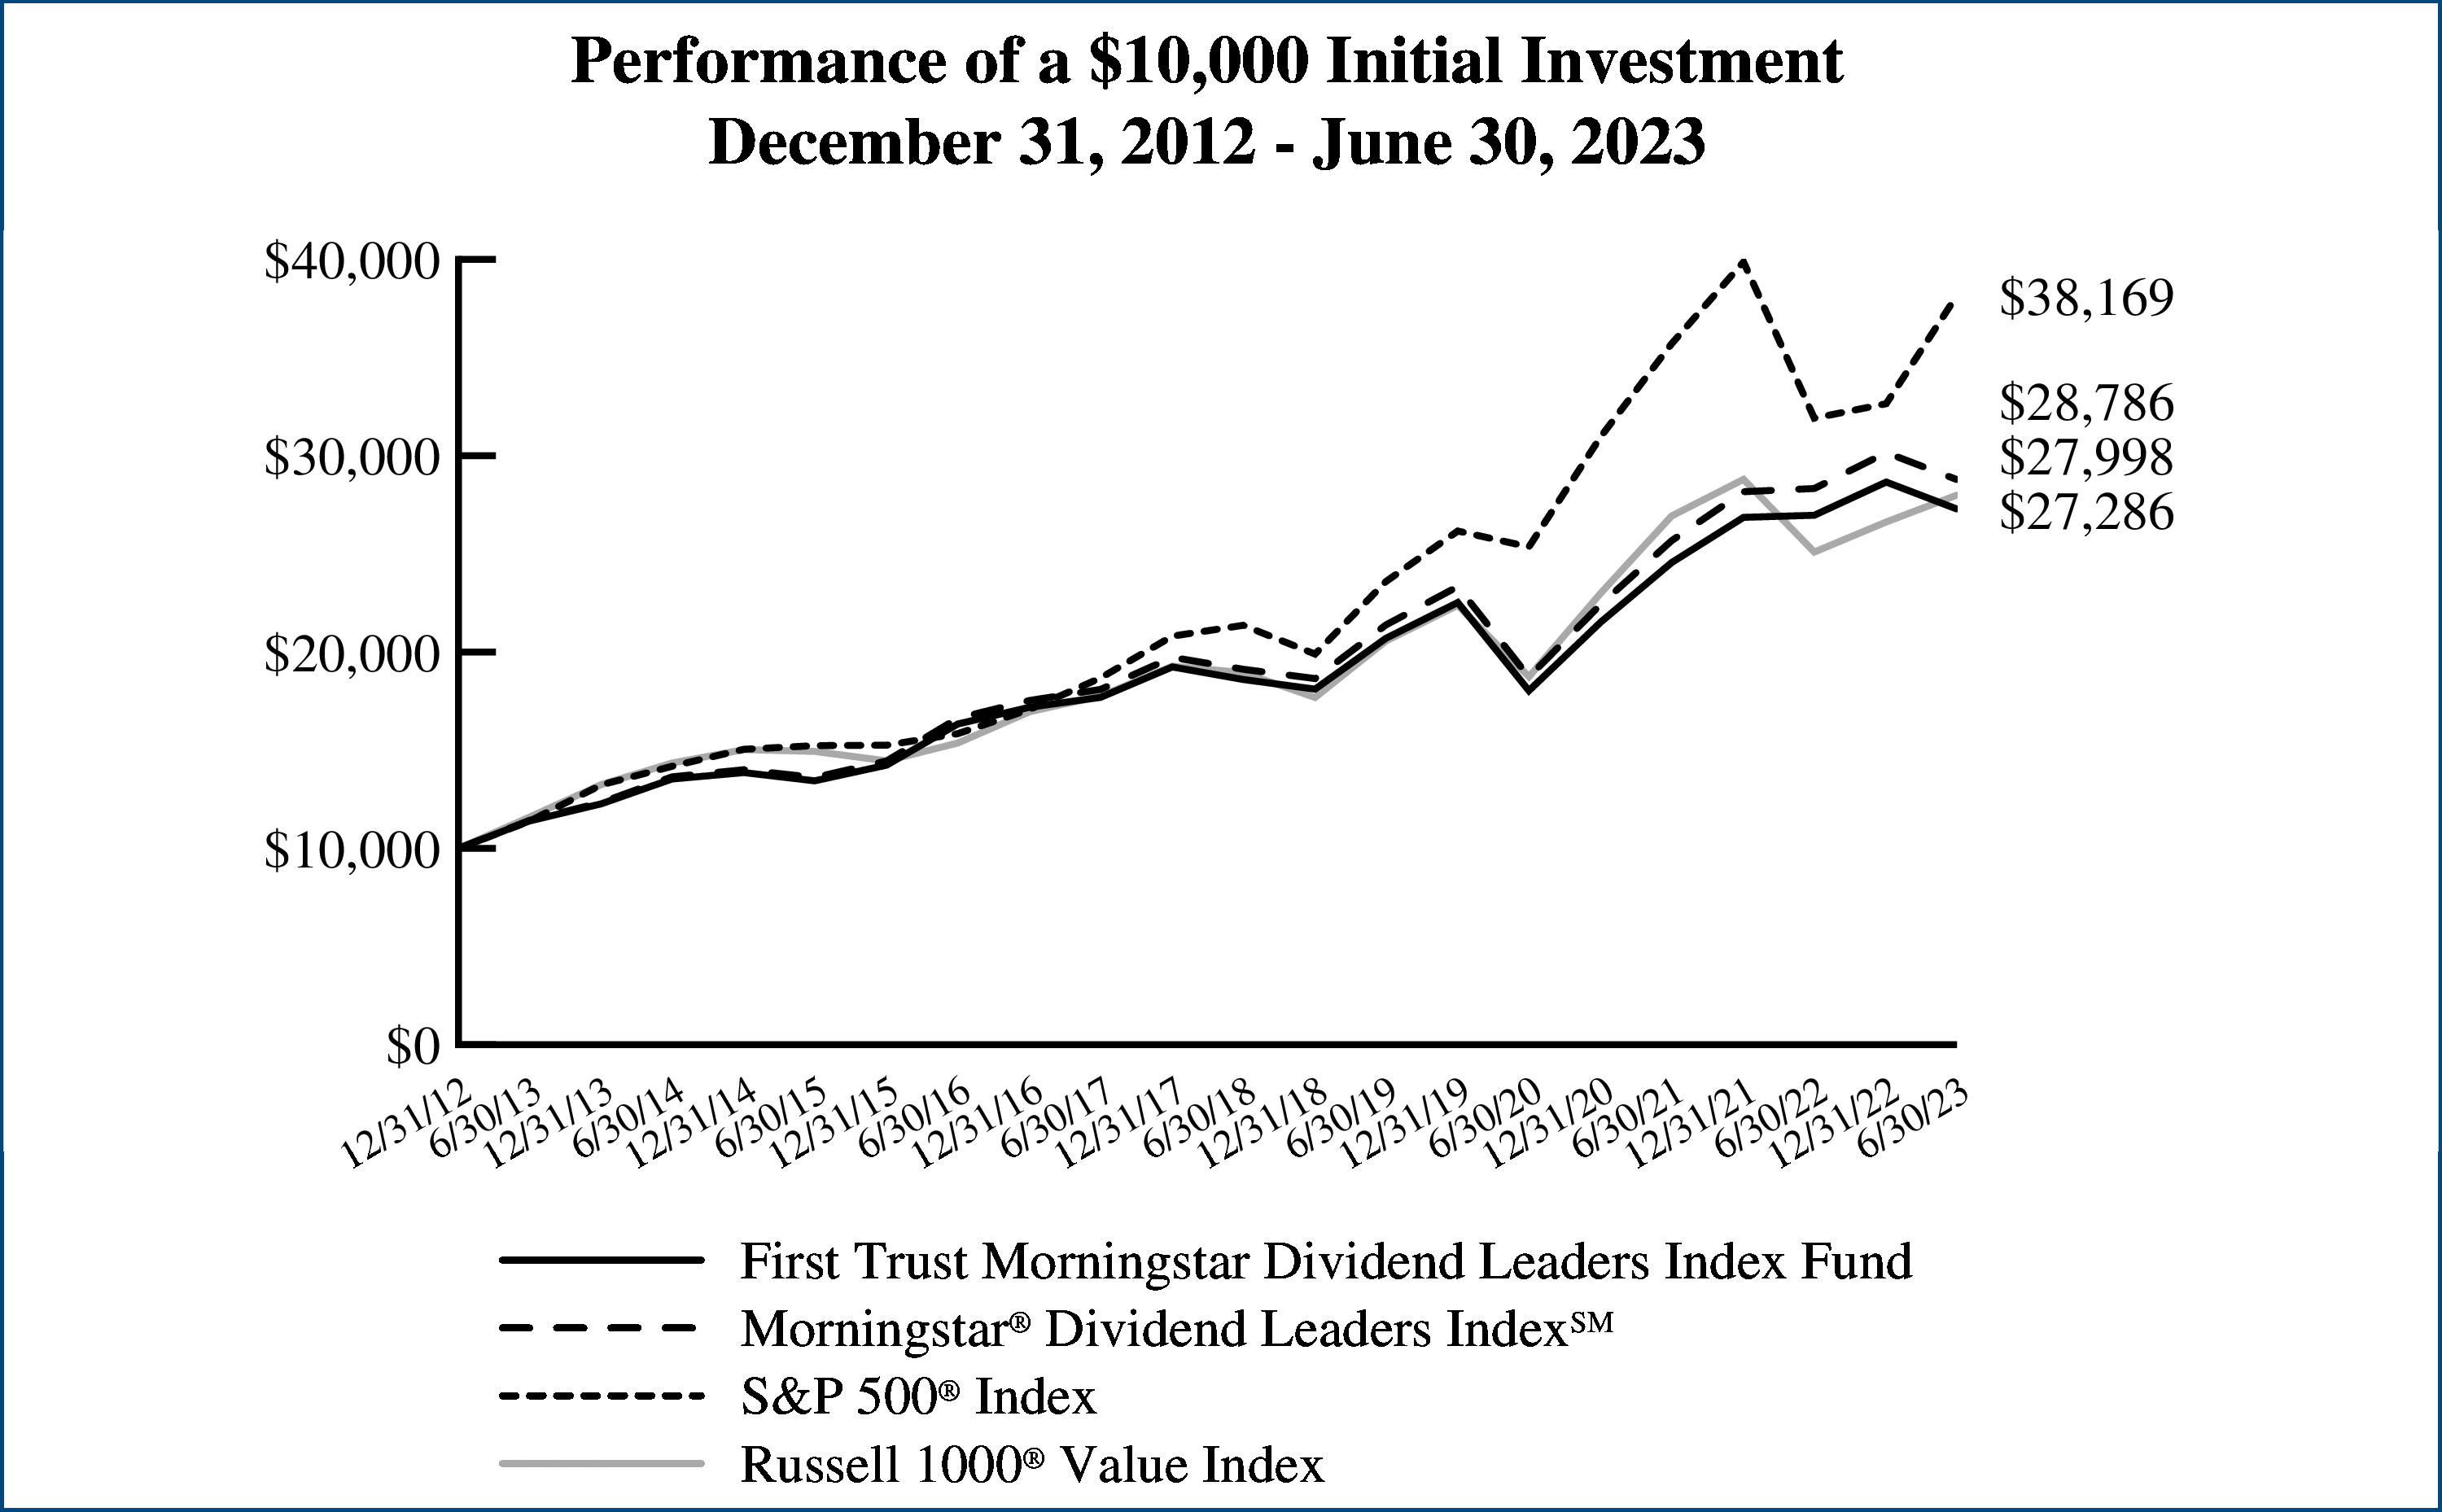
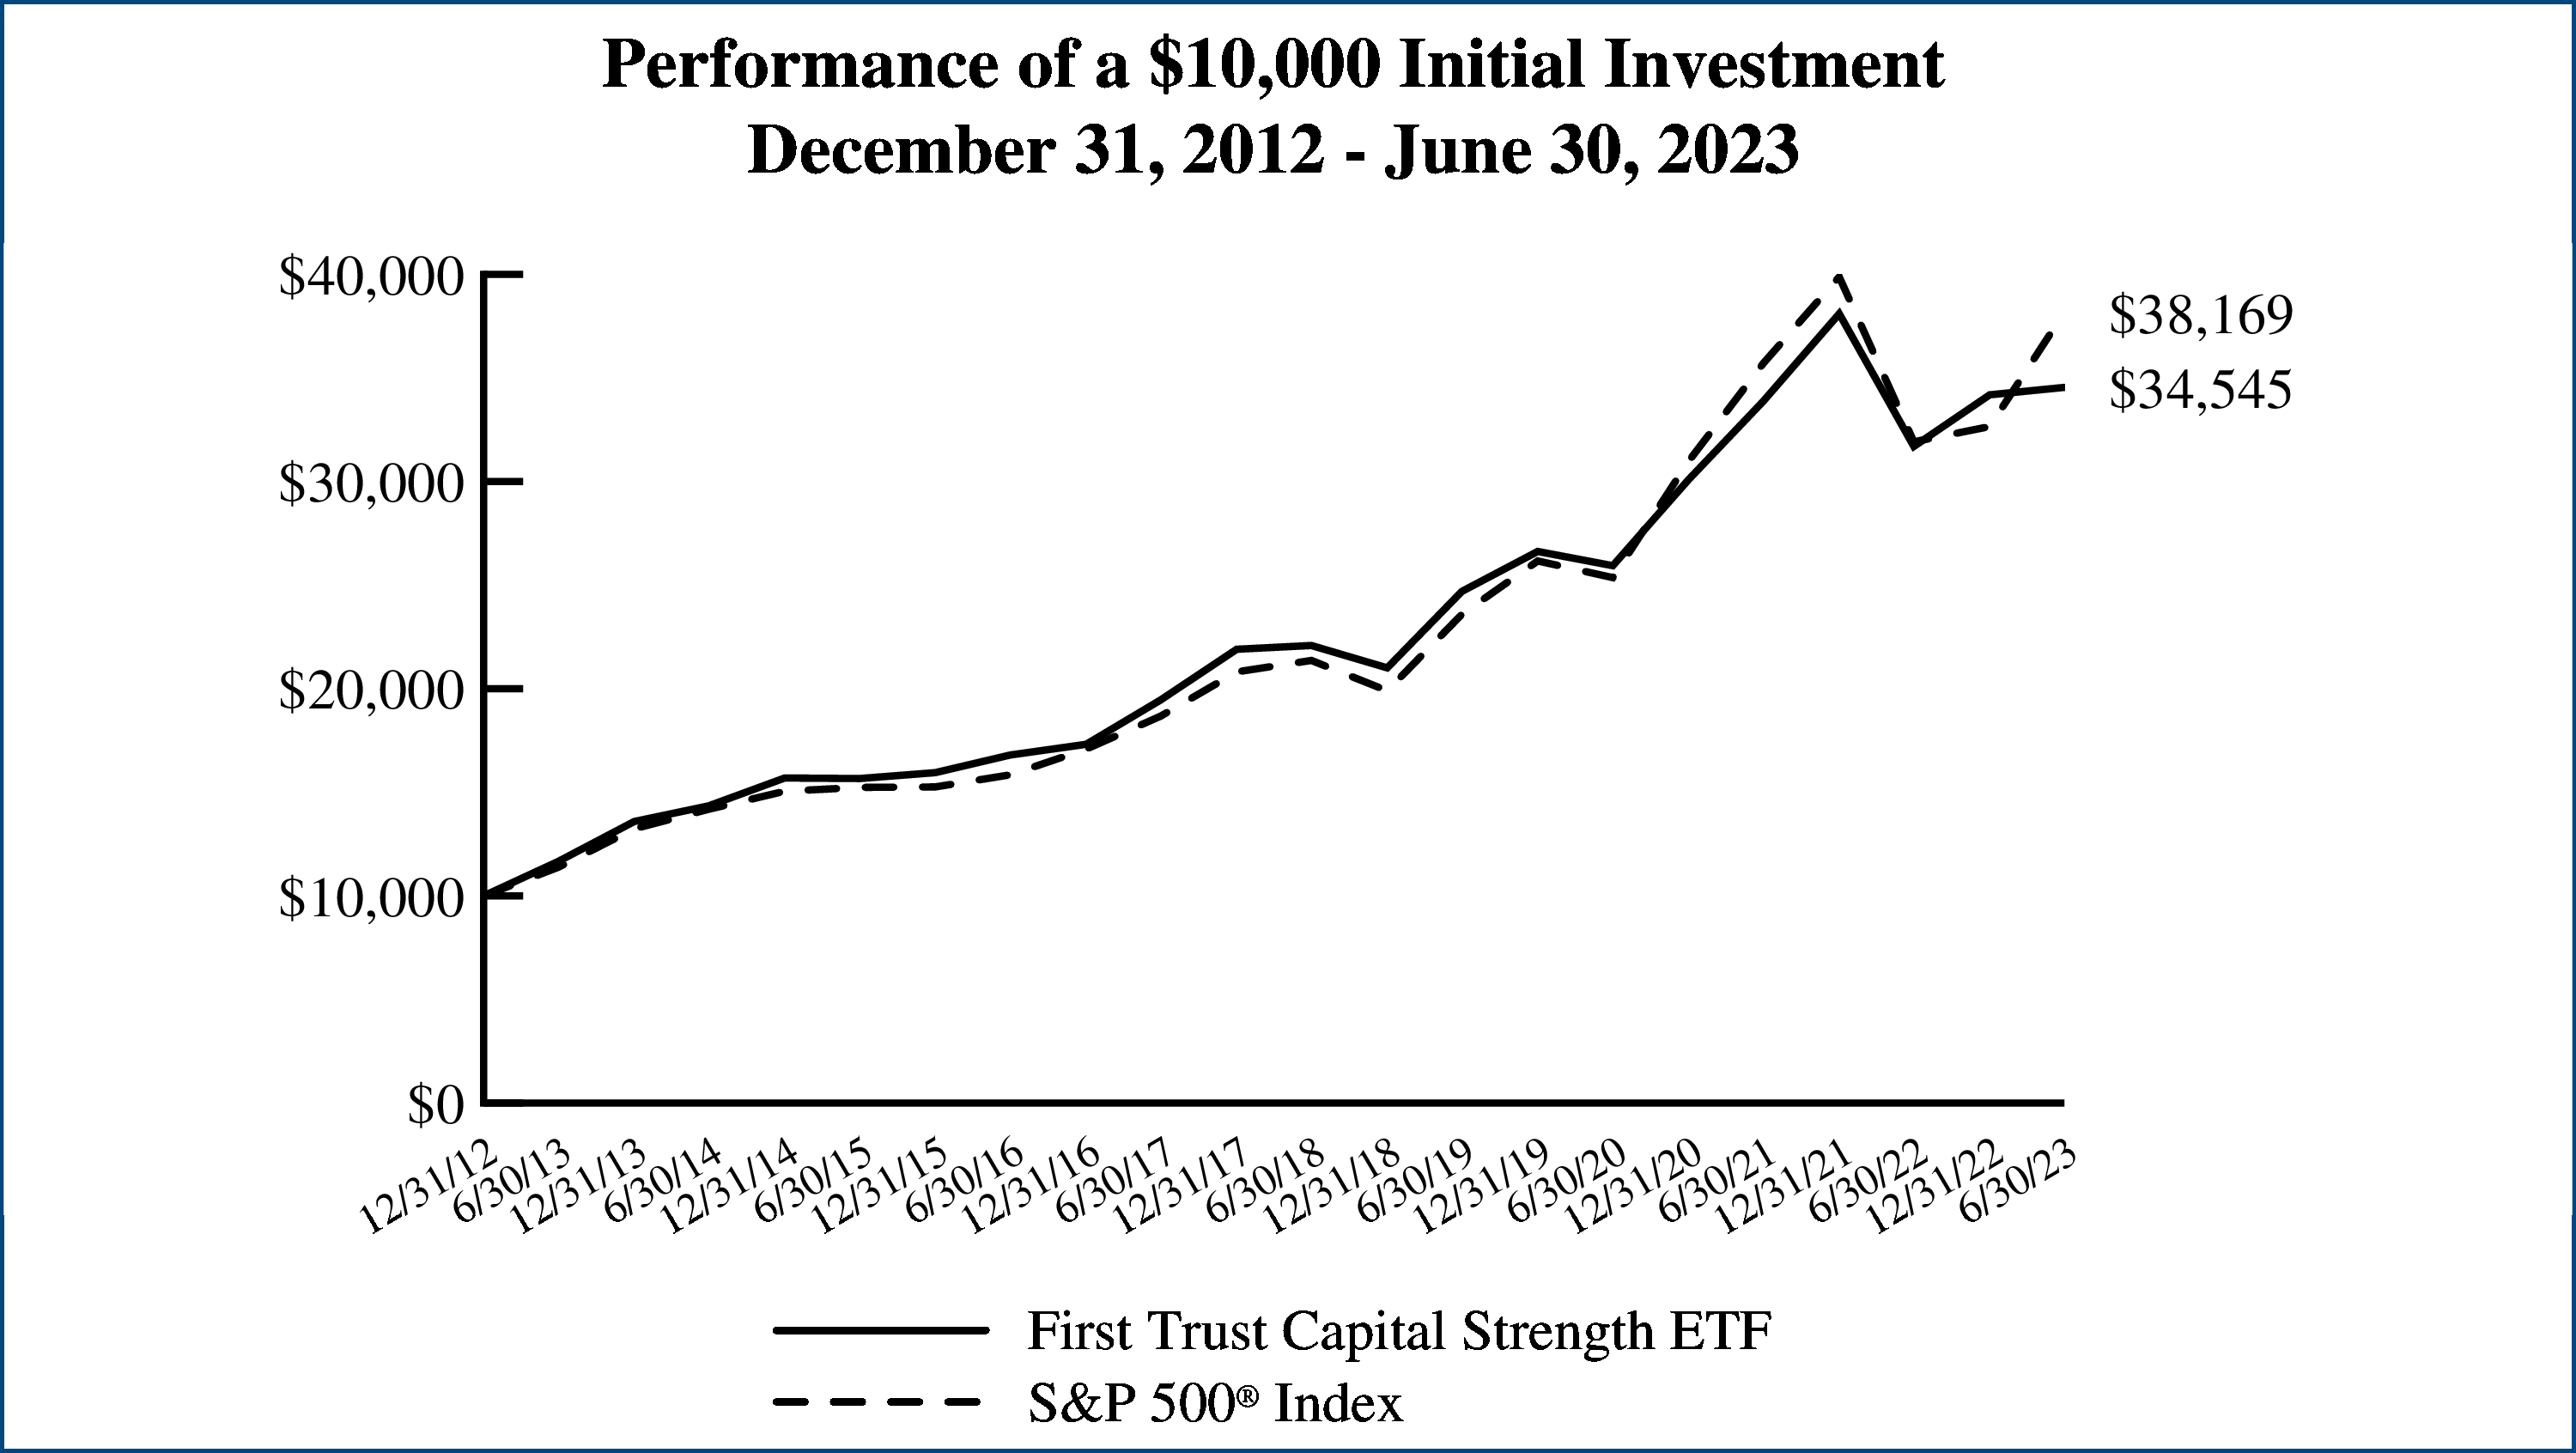
Performance
|
||||||||
|
|
|
|
Average Annual Total Returns
|
Cumulative Total Returns
|
||||
|
|
6 Months
Ended
6/30/23
|
1 Year
Ended
6/30/23
|
5 Years
Ended
6/30/23
|
10 Years
Ended
6/30/23
|
Inception
(4/12/06)
to 6/30/23
|
5 Years
Ended
6/30/23
|
10 Years
Ended
6/30/23
|
Inception
(4/12/06)
to 6/30/23
|
|
Fund Performance
|
|
|
|
|
|
|
|
|
|
NAV
|
12.18%
|
8.42%
|
4.89%
|
10.12%
|
9.83%
|
26.99%
|
162.32%
|
402.22%
|
|
Market Price
|
12.30%
|
8.35%
|
4.87%
|
10.12%
|
9.82%
|
26.82%
|
162.20%
|
402.01%
|
|
Index Performance
|
|
|
|
|
|
|
|
|
|
IPOX®-100 U.S. Index
|
12.52%
|
8.98%
|
5.39%
|
10.69%
|
10.44%
|
30.02%
|
176.16%
|
452.58%
|
|
S&P 500® Index
|
16.89%
|
19.59%
|
12.31%
|
12.86%
|
9.65%
|
78.66%
|
235.35%
|
388.11%
|
|
Russell 3000® Index
|
16.17%
|
18.95%
|
11.39%
|
12.34%
|
9.40%
|
71.49%
|
220.10%
|
369.95%
|
|
Sector Allocation
|
% of Total
Long-Term
Investments
|
|
Industrials
|
30.7%
|
|
Information Technology
|
25.4
|
|
Consumer Discretionary
|
14.3
|
|
Health Care
|
11.6
|
|
Communication Services
|
5.9
|
|
Financials
|
4.5
|
|
Utilities
|
3.2
|
|
Energy
|
1.9
|
|
Consumer Staples
|
1.7
|
|
Real Estate
|
0.7
|
|
Materials
|
0.1
|
|
Total
|
100.0%
|
|
Top Ten Holdings
|
% of Total
Long-Term
Investments
|
|
Uber Technologies, Inc.
|
9.2%
|
|
ON Semiconductor Corp.
|
7.7
|
|
Carrier Global Corp.
|
6.3
|
|
Otis Worldwide Corp.
|
5.6
|
|
Airbnb, Inc., Class A
|
5.6
|
|
GE HealthCare Technologies, Inc.
|
3.9
|
|
Samsara, Inc., Class A
|
3.7
|
|
Symbotic, Inc.
|
3.5
|
|
Warner Bros Discovery, Inc.
|
3.2
|
|
Bentley Systems, Inc., Class B
|
2.6
|
|
Total
|
51.3%
|
IPOX® and IPOX®-100 U.S. Index are registered international trademarks and service marks of IPOX® Schuster LLC (“IPOX”) and have been licensed for use by First Trust. The Fund is not sponsored, endorsed, sold or promoted by IPOX, and IPOX makes no representation regarding the advisability of trading in such Fund.
 |
Performance figures assume reinvestment of
all distributions and do not reflect the
deduction of taxes that a shareholder would
pay on Fund distributions or the redemption
or sale of Fund shares. An index is a statistical
composite that tracks a specified financial
market or sector. Unlike the Fund, the indices
do not actually hold a portfolio of securities
and therefore do not incur the expenses
incurred by the Fund. These expenses
negatively impact the performance of the
Fund. The Fund’s past performance does not
predict future performance.
|
|
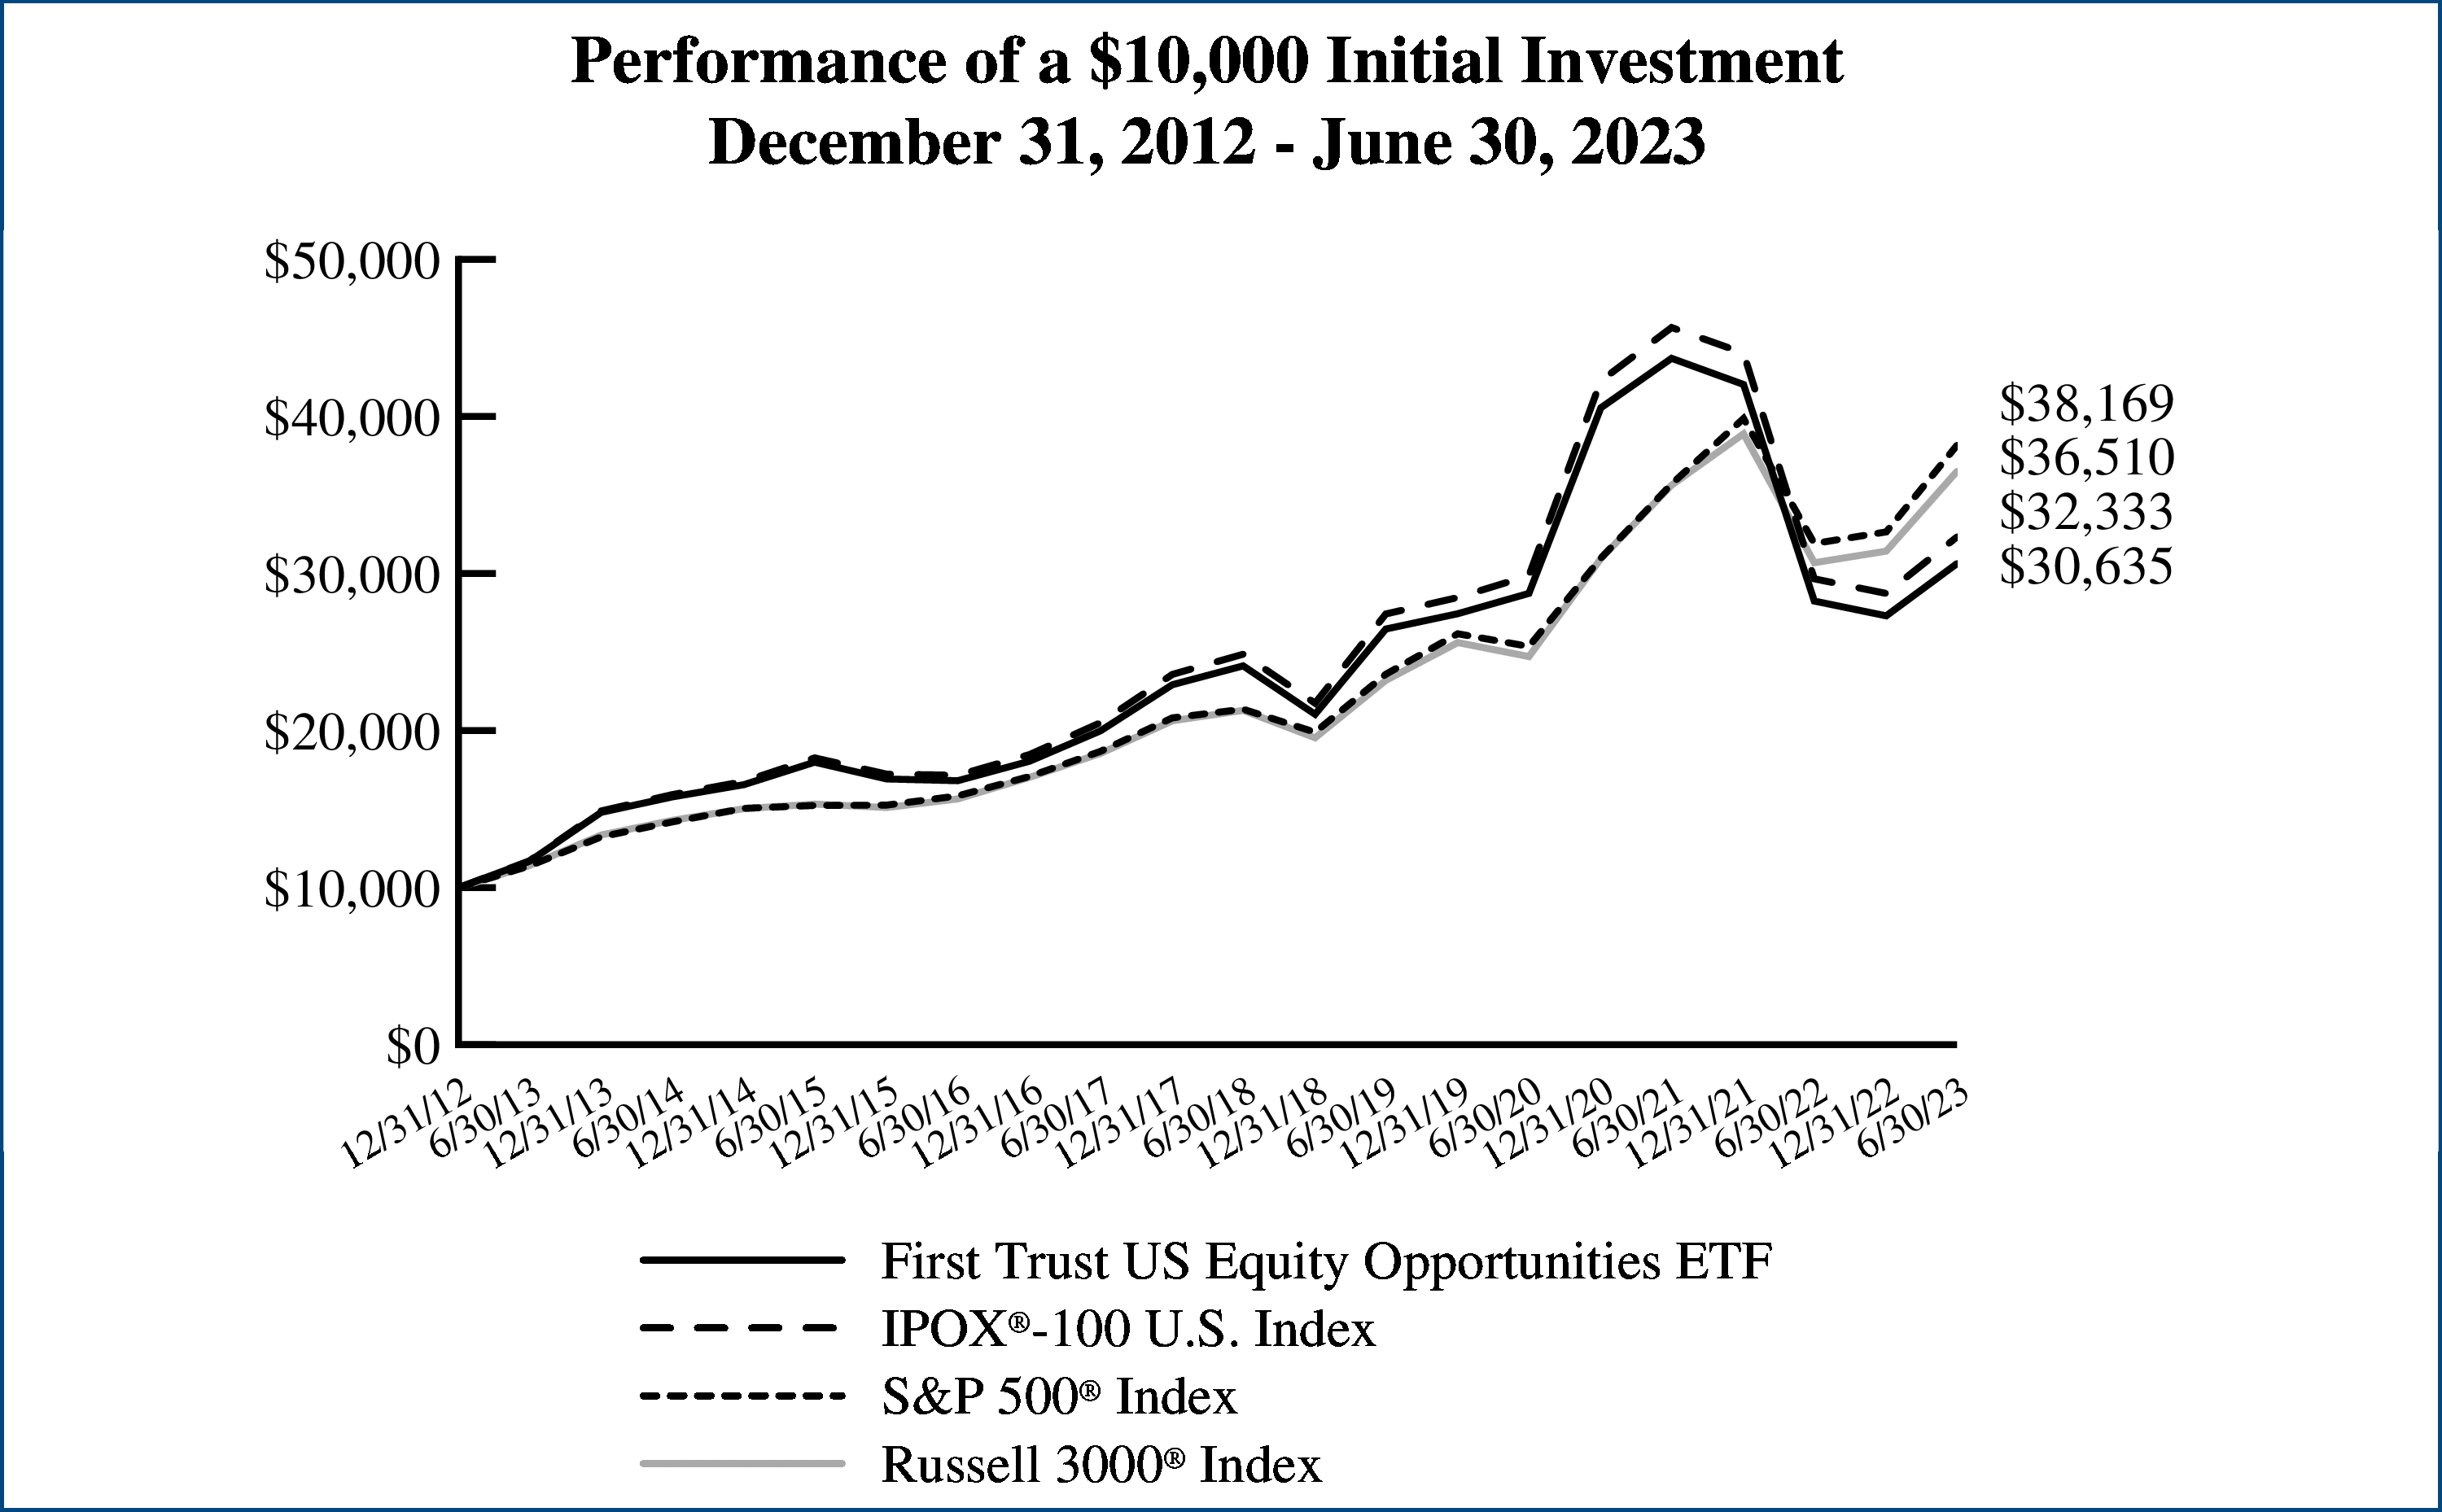
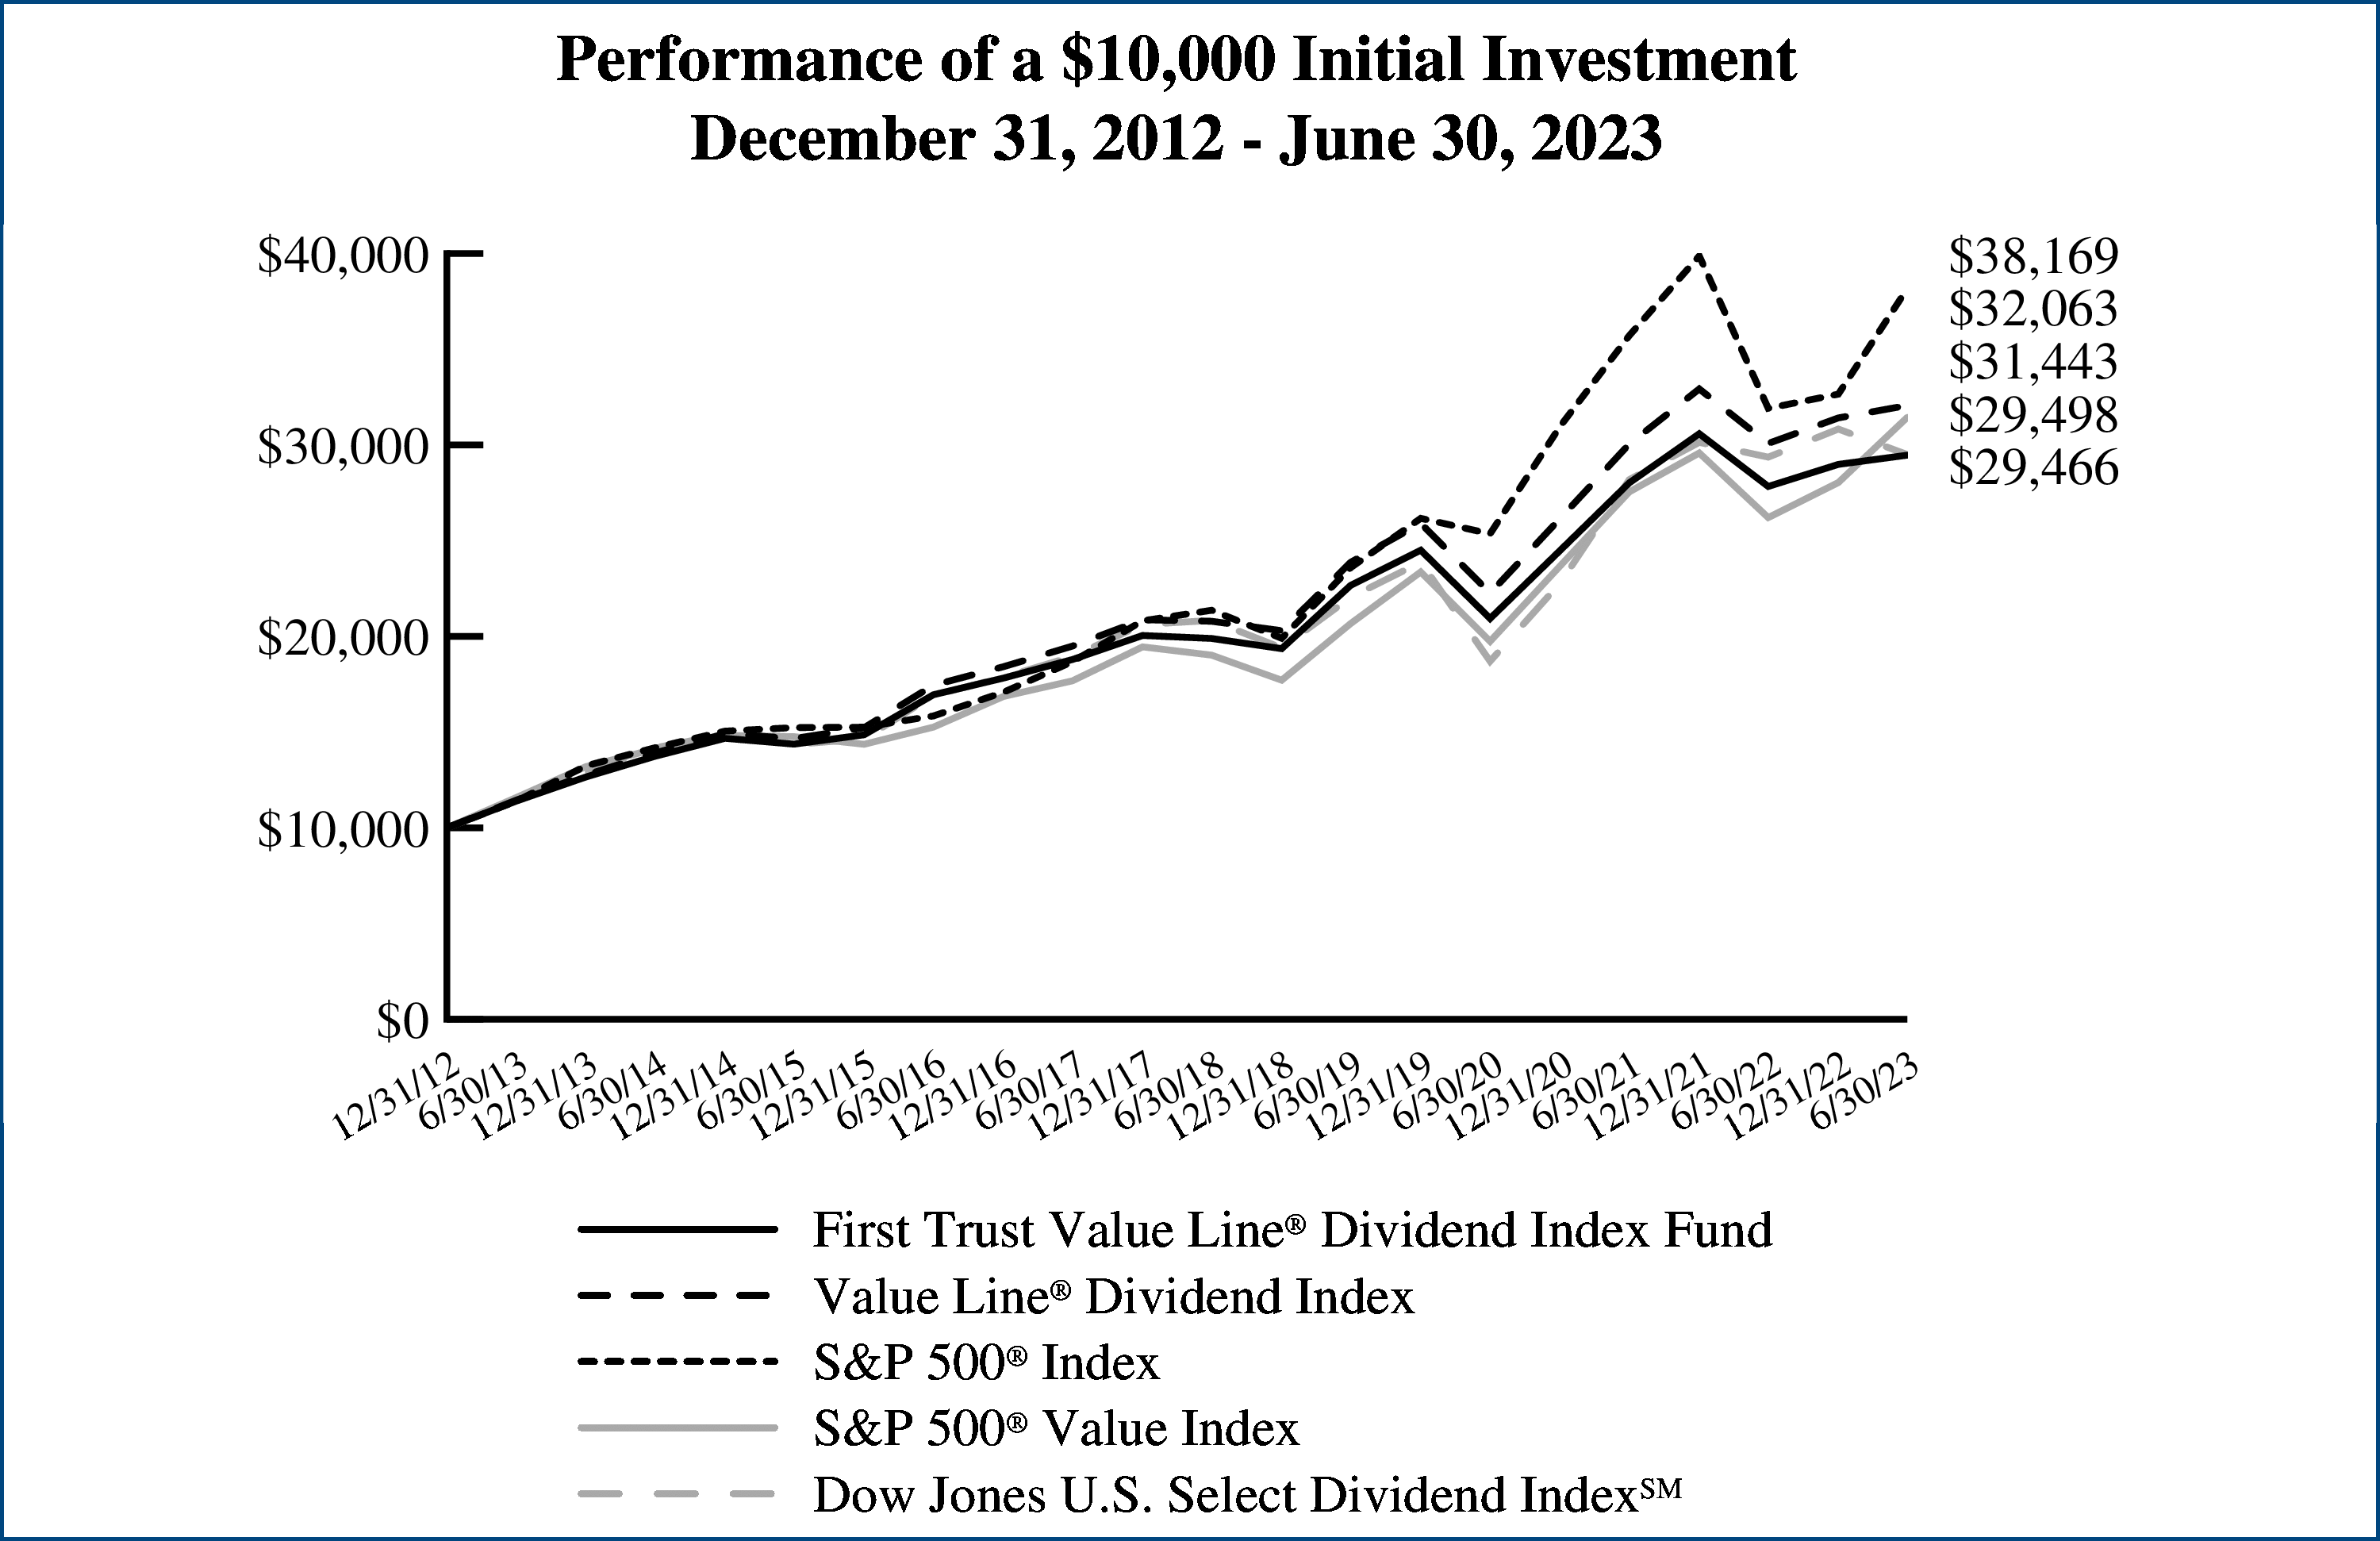
Performance
|
||||||||
|
|
|
|
Average Annual Total Returns
|
Cumulative Total Returns
|
||||
|
|
6 Months
Ended
6/30/23
|
1 Year
Ended
6/30/23
|
5 Years
Ended
6/30/23
|
10 Years
Ended
6/30/23
|
Inception
(6/19/06)
to 6/30/23
|
5 Years
Ended
6/30/23
|
10 Years
Ended
6/30/23
|
Inception
(6/19/06)
to 6/30/23
|
|
Fund Performance
|
|
|
|
|
|
|
|
|
|
NAV
|
-1.24%
|
12.53%
|
1.73%
|
10.15%
|
12.76%
|
8.96%
|
162.94%
|
673.39%
|
|
Market Price
|
-1.07%
|
12.66%
|
1.76%
|
10.16%
|
12.77%
|
9.10%
|
163.14%
|
674.35%
|
|
Index Performance
|
|
|
|
|
|
|
|
|
|
NYSE® Arca® Biotechnology
Index
|
-0.94%
|
13.21%
|
2.22%
|
10.65%
|
13.35%
|
11.60%
|
175.01%
|
744.40%
|
|
S&P Composite 1500® Health
Care Index
|
-1.18%
|
5.20%
|
11.28%
|
12.82%
|
11.36%
|
70.63%
|
234.05%
|
524.78%
|
|
Nasdaq® Biotechnology Index
|
-2.81%
|
9.61%
|
4.08%
|
9.00%
|
11.15%
|
22.11%
|
136.76%
|
504.67%
|
|
S&P 500® Index
|
16.89%
|
19.59%
|
12.31%
|
12.86%
|
9.98%
|
78.66%
|
235.35%
|
405.24%
|
Source ICE Data Indices, LLC, is used with permission. “NYSE®” is a service/trade mark of ICE Data Indices, LLC or its affiliates. This trademark has been licensed, along with the NYSE® Arca® Biotechnology Index (the “Index”) for use by First Trust Portfolios L.P. in connection with the First Trust NYSE® Arca® Biotechnology Index Fund (the “Product”). Neither First Trust Portfolios L.P., First Trust Exchange-Traded Fund (the “Trust”) nor the Product, as applicable, is sponsored, endorsed, sold or promoted by ICE Data Indices, LLC, its affiliates or its Third Party Suppliers (“ICE Data and its Suppliers”). ICE Data and its Suppliers make no representations or warranties regarding the advisability of investing in securities generally, in the Product particularly, the Trust or the ability of the Index to track general market performance. Past performance of an Index is not an indicator of or a guarantee of future results.
|
Industry Allocation
|
% of Total
Long-Term
Investments
|
|
Biotechnology
|
80.0%
|
|
Life Sciences Tools & Services
|
20.0
|
|
Total
|
100.0%
|
|
Top Ten Holdings
|
% of Total
Long-Term
Investments
|
|
Exact Sciences Corp.
|
4.8%
|
|
Agios Pharmaceuticals, Inc.
|
4.3
|
|
Grifols S.A.
|
4.2
|
|
ACADIA Pharmaceuticals, Inc.
|
4.1
|
|
IQVIA Holdings, Inc.
|
3.8
|
|
Ionis Pharmaceuticals, Inc.
|
3.8
|
|
Ultragenyx Pharmaceutical, Inc.
|
3.7
|
|
Alkermes PLC
|
3.7
|
|
Vertex Pharmaceuticals, Inc.
|
3.6
|
|
Charles River Laboratories International, Inc.
|
3.6
|
|
Total
|
39.6%
|
 |
Performance figures assume reinvestment of
all distributions and do not reflect the
deduction of taxes that a shareholder would
pay on Fund distributions or the redemption
or sale of Fund shares. An index is a statistical
composite that tracks a specified financial
market or sector. Unlike the Fund, the indices
do not actually hold a portfolio of securities
and therefore do not incur the expenses
incurred by the Fund. These expenses
negatively impact the performance of the
Fund. The Fund’s past performance does not
predict future performance.
|
|
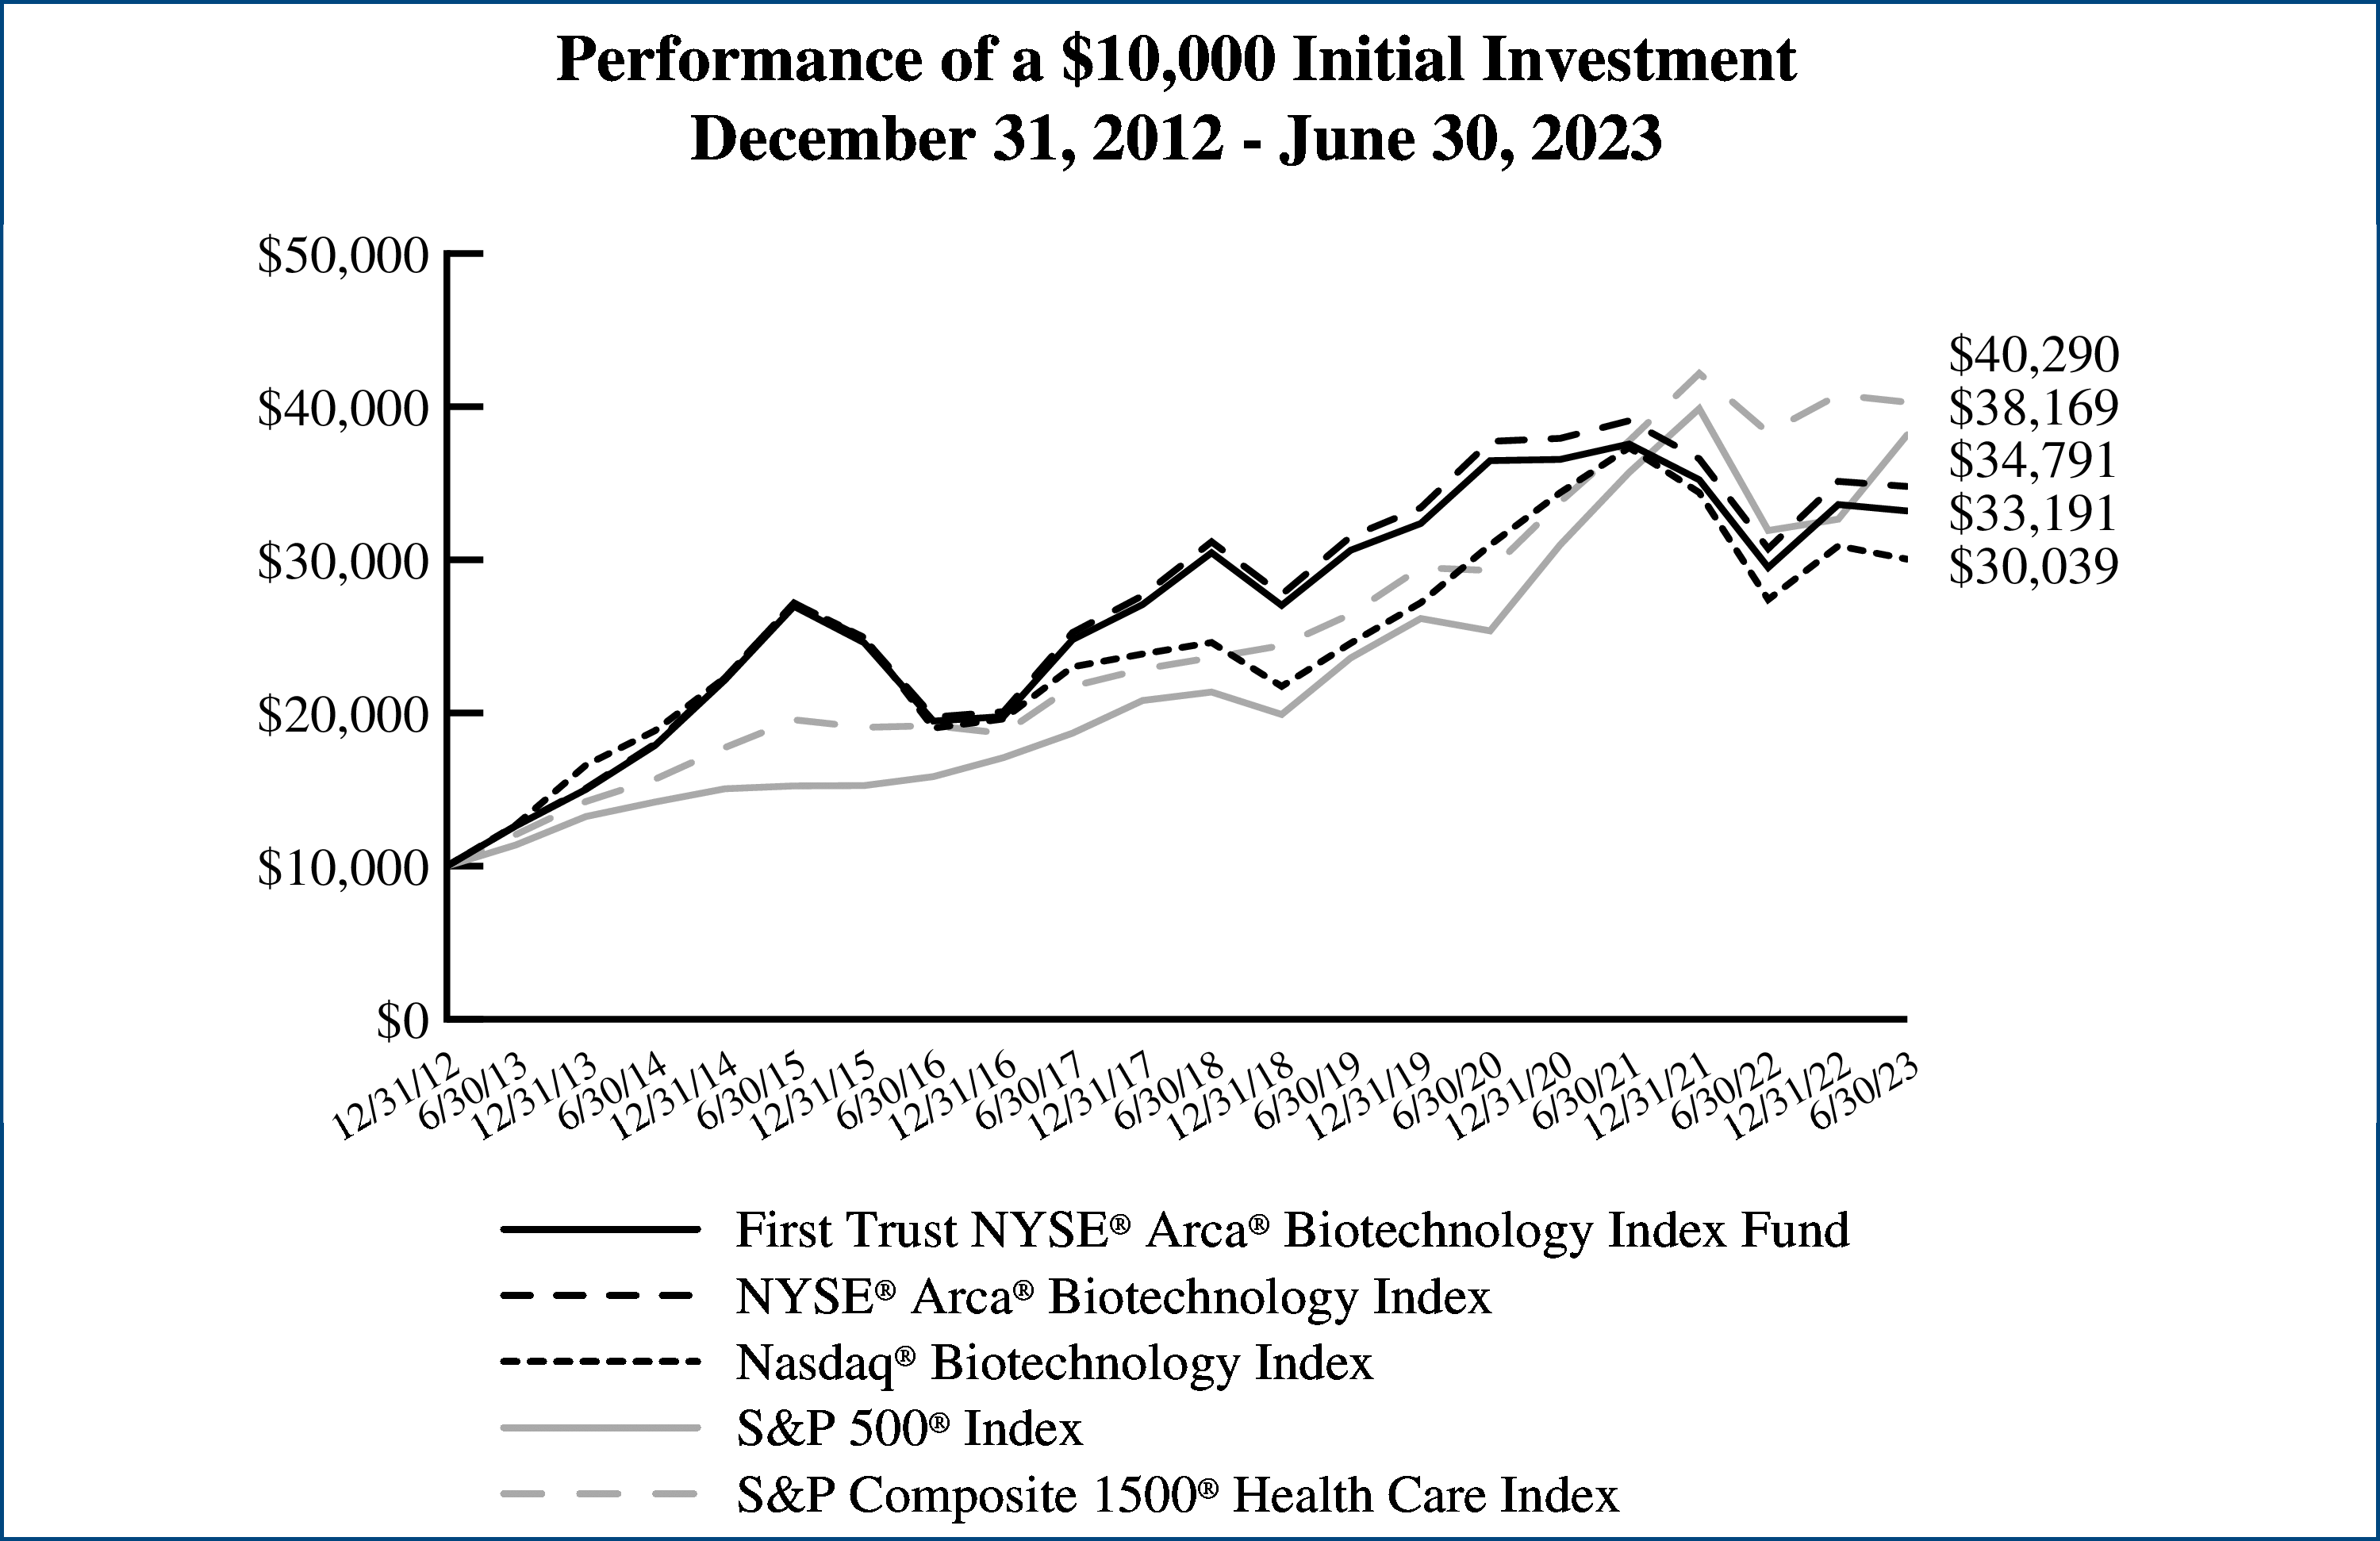
Performance
|
||||||||
|
|
|
|
Average Annual Total Returns
|
Cumulative Total Returns
|
||||
|
|
6 Months
Ended
6/30/23
|
1 Year
Ended
6/30/23
|
5 Years
Ended
6/30/23
|
10 Years
Ended
6/30/23
|
Inception
(6/19/06)
to 6/30/23
|
5 Years
Ended
6/30/23
|
10 Years
Ended
6/30/23
|
Inception
(6/19/06)
to 6/30/23
|
|
Fund Performance
|
|
|
|
|
|
|
|
|
|
NAV
|
32.37%
|
28.32%
|
3.44%
|
13.65%
|
13.14%
|
18.42%
|
259.37%
|
718.57%
|
|
Market Price
|
32.38%
|
28.27%
|
3.41%
|
13.64%
|
13.14%
|
18.25%
|
259.09%
|
718.47%
|
|
Index Performance
|
|
|
|
|
|
|
|
|
|
Dow Jones Internet Composite
IndexSM
|
32.72%
|
28.96%
|
4.02%
|
14.25%
|
13.75%
|
21.77%
|
278.87%
|
797.53%
|
|
S&P Composite 1500®
Information Technology
Index
|
42.01%
|
39.93%
|
21.40%
|
21.44%
|
15.65%
|
163.70%
|
597.39%
|
1,089.81%
|
|
S&P 500® Index
|
16.89%
|
19.59%
|
12.31%
|
12.86%
|
9.98%
|
78.66%
|
235.35%
|
405.24%
|
|
Sector Allocation
|
% of Total
Long-Term
Investments
|
|
Information Technology
|
42.5%
|
|
Communication Services
|
28.3
|
|
Consumer Discretionary
|
19.8
|
|
Financials
|
3.5
|
|
Health Care
|
3.3
|
|
Real Estate
|
2.6
|
|
Total
|
100.0%
|
|
Top Ten Holdings
|
% of Total
Long-Term
Investments
|
|
Amazon.com, Inc.
|
9.3%
|
|
Meta Platforms, Inc., Class A
|
7.5
|
|
Cisco Systems, Inc.
|
5.0
|
|
Netflix, Inc.
|
5.0
|
|
Alphabet, Inc., Class A
|
5.0
|
|
Salesforce, Inc.
|
5.0
|
|
Alphabet, Inc., Class C
|
4.4
|
|
PayPal Holdings, Inc.
|
3.5
|
|
Airbnb, Inc., Class A
|
3.1
|
|
Snowflake, Inc., Class A
|
3.0
|
|
Total
|
50.8%
|
Dow Jones Internet Composite IndexSM (“Index”) is a product of S&P Dow Jones Indices LLC or its affiliates (“SPDJI”) and has been licensed for use by First Trust. S&P® is a registered trademark of Standard & Poor’s Financial Services LLC (“S&P”); Dow Jones® is a registered trademark of Dow Jones Trademark Holdings LLC (“Dow Jones”); and these trademarks have been licensed for use by SPDJI and sublicensed for certain purposes by First Trust. The Fund is not sponsored, endorsed, sold or promoted by SPDJI, Dow Jones, S&P, or their respective affiliates and none of such parties make any representation regarding the advisability of investing in such product nor do they have any liability for any errors, omissions, or interruptions of the Index.
 |
Performance figures assume reinvestment of
all distributions and do not reflect the
deduction of taxes that a shareholder would
pay on Fund distributions or the redemption
or sale of Fund shares. An index is a statistical
composite that tracks a specified financial
market or sector. Unlike the Fund, the indices
do not actually hold a portfolio of securities
and therefore do not incur the expenses
incurred by the Fund. These expenses
negatively impact the performance of the
Fund. The Fund’s past performance does not
predict future performance.
|
|
Performance
|
||||||||
|
|
|
|
Average Annual Total Returns
|
Cumulative Total Returns
|
||||
|
|
6 Months
Ended
6/30/23
|
1 Year
Ended
6/30/23
|
5 Years
Ended
6/30/23
|
10 Years
Ended
6/30/23
|
Inception
(7/6/06)
to 6/30/23
|
5 Years
Ended
6/30/23
|
10 Years
Ended
6/30/23
|
Inception
(7/6/06)
to 6/30/23
|
|
Fund Performance
|
|
|
|
|
|
|
|
|
|
NAV
|
1.05%
|
8.99%
|
9.36%
|
11.47%
|
9.68%
|
56.43%
|
196.16%
|
379.96%
|
|
Market Price
|
1.03%
|
8.91%
|
9.35%
|
11.47%
|
9.67%
|
56.35%
|
196.31%
|
379.89%
|
|
Index Performance
|
|
|
|
|
|
|
|
|
|
The Capital StrengthTM
Index(1)
|
1.37%
|
9.63%
|
10.03%
|
12.18%
|
N/A
|
61.30%
|
215.69%
|
N/A
|
|
S&P 500® Index
|
16.89%
|
19.59%
|
12.31%
|
12.86%
|
9.83%
|
78.66%
|
235.35%
|
391.27%
|
|
(1)
|
On June 4, 2013, the Fund’s underlying index changed from the Credit Suisse U.S. Value Index, Powered by HOLTTM to The Capital Strength
IndexSM. On June 18, 2010, the Fund’s underlying index changed from the Deutsche Bank CROCI® US+ IndexTM to the Credit Suisse
U.S. Value Index, Powered by HOLTTM. Since the Fund’s new underlying index had an inception date of March 20, 2013, it was not in existence
for some of the periods disclosed.
|
|
Sector Allocation
|
% of Total
Long-Term
Investments
|
|
Health Care
|
28.9%
|
|
Industrials
|
22.2
|
|
Financials
|
16.1
|
|
Consumer Staples
|
13.8
|
|
Information Technology
|
8.7
|
|
Consumer Discretionary
|
6.3
|
|
Materials
|
2.0
|
|
Communication Services
|
2.0
|
|
Total
|
100.0%
|
|
Top Ten Holdings
|
% of Total
Long-Term
Investments
|
|
Eli Lilly & Co.
|
2.4%
|
|
NetApp, Inc.
|
2.4
|
|
Copart, Inc.
|
2.3
|
|
AmerisourceBergen Corp.
|
2.3
|
|
PACCAR, Inc.
|
2.2
|
|
Brown & Brown, Inc.
|
2.2
|
|
Amphenol Corp., Class A
|
2.2
|
|
Cisco Systems, Inc.
|
2.2
|
|
Molina Healthcare, Inc.
|
2.1
|
|
Monster Beverage Corp.
|
2.1
|
|
Total
|
22.4%
|
Nasdaq® and The Capital StrengthTM Index are registered trademarks and service marks of Nasdaq, Inc. (together with its affiliates hereinafter referred to as the “Corporations”) and are licensed for use by First Trust. The Fund has not been passed on by the Corporations as to its legality or suitability. The Fund is not issued, endorsed, sold or promoted by the Corporations. THE CORPORATIONS MAKE NO WARRANTIES AND BEAR NO LIABILITY WITH RESPECT TO THE FUND.
 |
Performance figures assume reinvestment of
all distributions and do not reflect the
deduction of taxes that a shareholder would
pay on Fund distributions or the redemption
or sale of Fund shares. An index is a statistical
composite that tracks a specified financial
market or sector. Unlike the Fund, the index
does not actually hold a portfolio of securities
and therefore does not incur the expenses
incurred by the Fund. These expenses
negatively impact the performance of the
Fund. The Fund’s past performance does not
predict future performance.
|
|
Performance
|
||||||||
|
|
|
|
Average Annual Total Returns
|
Cumulative Total Returns
|
||||
|
|
6 Months
Ended
6/30/23
|
1 Year
Ended
6/30/23
|
5 Years
Ended
6/30/23
|
10 Years
Ended
6/30/23
|
Inception
(8/19/03)
to 6/30/23
|
5 Years
Ended
6/30/23
|
10 Years
Ended
6/30/23
|
Inception
(8/19/03)
to 6/30/23
|
|
Fund Performance
|
|
|
|
|
|
|
|
|
|
NAV
|
1.66%
|
5.86%
|
8.18%
|
9.97%
|
9.31%
|
48.14%
|
158.73%
|
485.97%
|
|
Market Price
|
1.64%
|
5.75%
|
8.16%
|
9.97%
|
9.31%
|
48.01%
|
158.66%
|
485.82%
|
|
Index Performance
|
|
|
|
|
|
|
|
|
|
Value Line® Dividend Index(1)
|
2.07%
|
6.59%
|
9.05%
|
10.86%
|
N/A
|
54.24%
|
180.30%
|
N/A
|
|
S&P 500® Index
|
16.89%
|
19.59%
|
12.31%
|
12.86%
|
9.95%
|
78.66%
|
235.35%
|
557.72%
|
|
S&P 500® Value Index
|
12.15%
|
19.99%
|
10.58%
|
10.51%
|
8.77%
|
65.31%
|
171.71%
|
431.30%
|
|
Dow Jones U.S. Select
Dividend IndexSM(1)
|
-4.32%
|
0.47%
|
7.21%
|
9.99%
|
N/A
|
41.61%
|
159.10%
|
N/A
|
|
|
On December 15, 2006, the Fund acquired the assets and adopted the financial and performance history of First Trust Value
Line® Dividend
Fund (the “Predecessor FVD Fund,” a closed-end fund), which had an inception date of August 19, 2003. The inception date total returns at net
asset value (“NAV”) include the sales load of $0.675 per share on the initial offering. The investment goals, strategies and policies of the Fund
are substantially similar to those of the Predecessor FVD Fund. The inception date of the Index was July 3, 2006. Returns
for the Index are only
disclosed for those periods in which the Index was in existence for the entire period. The cumulative total returns for the
period from the
reorganization date (December 15, 2006) through period end (June 30, 2023) were 262.27% and 263.91% at NAV and Market Price,
respectively. That compares to an Index return of 312.92% for the same period. The average annual total returns for the period
from the
reorganization date (December 15, 2006) through period end (June 30, 2023) were 8.09% and 8.12% at NAV and Market Price, respectively.
That compares to an Index return of 8.95% for the same period.
NAV and Market Price returns assume that all distributions have been reinvested in the Fund at NAV and Market Price, respectively.
Prior to
December 15, 2006, NAV and Market Price returns assumed that all distributions were reinvested at prices obtained by the Dividend
Reinvestment Plan of the Predecessor FVD Fund and the price used to calculate Market Price return was the AMEX (now known
as the NYSE
American) closing market price of the Predecessor FVD Fund.
|
|
(1)
|
Performance data is not available for all the periods shown in the table for the index because performance data does not exist
for some of the
entire periods.
|
Value Line® and Value Line® Dividend Index are trademarks or registered trademarks of Value Line, Inc. (“Value Line”) and have been licensed for use for certain purposes by First Trust. The Fund is not sponsored, endorsed, recommended, sold or promoted by Value Line and Value Line makes no representation regarding the advisability of investing in products utilizing such strategy.
|
Sector Allocation
|
% of Total
Long-Term
Investments
|
|
Utilities
|
22.5%
|
|
Industrials
|
17.2
|
|
Consumer Staples
|
15.6
|
|
Financials
|
10.6
|
|
Health Care
|
9.8
|
|
Information Technology
|
7.2
|
|
Consumer Discretionary
|
5.9
|
|
Materials
|
5.9
|
|
Communication Services
|
2.9
|
|
Real Estate
|
1.8
|
|
Energy
|
0.6
|
|
Total
|
100.0%
|
|
Top Ten Holdings
|
% of Total
Long-Term
Investments
|
|
Avnet, Inc.
|
0.6%
|
|
Texas Instruments, Inc.
|
0.6
|
|
Otter Tail Corp.
|
0.6
|
|
Domino’s Pizza, Inc.
|
0.6
|
|
Gentex Corp.
|
0.6
|
|
PPG Industries, Inc.
|
0.6
|
|
Watsco, Inc.
|
0.6
|
|
T. Rowe Price Group, Inc.
|
0.6
|
|
Cummins, Inc.
|
0.6
|
|
Robert Half International, Inc.
|
0.6
|
|
Total
|
6.0%
|
 |
Performance figures assume reinvestment of
all distributions and do not reflect the
deduction of taxes that a shareholder would
pay on Fund distributions or the redemption
or sale of Fund shares. An index is a statistical
composite that tracks a specified financial
market or sector. Unlike the Fund, the indices
do not actually hold a portfolio of securities
and therefore do not incur the expenses
incurred by the Fund. These expenses
negatively impact the performance of the
Fund. The Fund’s past performance does not
predict future performance.
|
Understanding Your Fund Expenses
June 30, 2023 (Unaudited)
|
|
Beginning
Account Value
January 1, 2023
|
Ending
Account Value
June 30, 2023
|
Annualized
Expense Ratio
Based on the
Six-Month
Period (a)
|
Expenses Paid
During the
Six-Month
Period (b)
|
|
First Trust Dow Jones Select MicroCap Index Fund (FDM)
|
||||
|
Actual
|
$1,000.00
|
$1,024.90
|
0.60%
|
$3.01
|
|
Hypothetical (5% return before expenses)
|
$1,000.00
|
$1,021.82
|
0.60%
|
$3.01
|
|
First Trust Morningstar Dividend Leaders Index Fund (FDL)
|
||||
|
Actual
|
$1,000.00
|
$952.00
|
0.44%
|
$2.13
|
|
Hypothetical (5% return before expenses)
|
$1,000.00
|
$1,022.61
|
0.44%
|
$2.21
|
|
First Trust US Equity Opportunities ETF (FPX)
|
||||
|
Actual
|
$1,000.00
|
$1,121.80
|
0.58%
|
$3.05
|
|
Hypothetical (5% return before expenses)
|
$1,000.00
|
$1,021.92
|
0.58%
|
$2.91
|
|
First Trust NYSE® Arca® Biotechnology Index Fund (FBT)
|
||||
|
Actual
|
$1,000.00
|
$987.60
|
0.55%
|
$2.71
|
|
Hypothetical (5% return before expenses)
|
$1,000.00
|
$1,022.07
|
0.55%
|
$2.76
|
|
First Trust Dow Jones Internet Index Fund (FDN)
|
||||
|
Actual
|
$1,000.00
|
$1,323.70
|
0.52%
|
$3.00
|
|
Hypothetical (5% return before expenses)
|
$1,000.00
|
$1,022.22
|
0.52%
|
$2.61
|
|
First Trust Capital Strength ETF (FTCS)
|
||||
|
Actual
|
$1,000.00
|
$1,010.50
|
0.53%
|
$2.64
|
|
Hypothetical (5% return before expenses)
|
$1,000.00
|
$1,022.17
|
0.53%
|
$2.66
|
Understanding Your Fund Expenses (Continued)
June 30, 2023 (Unaudited)
|
|
Beginning
Account Value
January 1, 2023
|
Ending
Account Value
June 30, 2023
|
Annualized
Expense Ratio
Based on the
Six-Month
Period (a)
|
Expenses Paid
During the
Six-Month
Period (b)
|
|
First Trust Value Line® Dividend Index Fund (FVD)
|
||||
|
Actual
|
$1,000.00
|
$1,016.60
|
0.64%
|
$3.20
|
|
Hypothetical (5% return before expenses)
|
$1,000.00
|
$1,021.62
|
0.64%
|
$3.21
|
|
(a)
|
These expense ratios reflect expense caps for certain Funds. See Note 3 in the Notes to Financial Statements.
|
|
(b)
|
Expenses are equal to the annualized expense ratio as indicated in the table multiplied by the average account value over
the period
(January 1, 2023 through June 30, 2023), multiplied by 181/365 (to reflect the six-month period).
|
Portfolio of Investments
June 30, 2023 (Unaudited)
|
Shares
|
Description
|
Value
|
|||
|
COMMON STOCKS — 100.0%
|
|||||
|
|
Aerospace & Defense — 0.6%
|
|
|||
|
13,667
|
National Presto Industries, Inc.
|
$1,000,424
|
|||
|
|
Air Freight & Logistics —
0.4%
|
|
|||
|
98,269
|
Radiant Logistics, Inc. (a)
|
660,368
|
|||
|
|
Automobile Components —
3.0%
|
|
|||
|
139,800
|
Modine Manufacturing Co. (a)
|
4,616,196
|
|||
|
|
Banks — 17.7%
|
|
|||
|
22,861
|
ACNB Corp.
|
758,299
|
|||
|
47,631
|
Amalgamated Financial Corp.
|
766,383
|
|||
|
38,470
|
Bank of Marin Bancorp
|
679,765
|
|||
|
17,671
|
Bankwell Financial Group, Inc.
|
430,819
|
|||
|
39,759
|
BCB Bancorp, Inc.
|
466,771
|
|||
|
64,222
|
Carter Bankshares, Inc. (a)
|
949,843
|
|||
|
29,215
|
Coastal Financial Corp. (a)
|
1,099,945
|
|||
|
113,414
|
CrossFirst Bankshares, Inc. (a)
|
1,134,140
|
|||
|
18,453
|
Esquire Financial Holdings, Inc.
|
844,040
|
|||
|
33,635
|
Farmers & Merchants Bancorp,
Inc.
|
757,124
|
|||
|
12,460
|
Fidelity D&D Bancorp, Inc. (b)
|
605,431
|
|||
|
74,961
|
First Bancshares (The), Inc.
|
1,936,992
|
|||
|
19,352
|
First Business Financial
Services, Inc.
|
570,690
|
|||
|
29,452
|
First Financial Corp.
|
956,306
|
|||
|
14,660
|
First Guaranty Bancshares, Inc.
|
164,925
|
|||
|
57,474
|
First of Long Island (The) Corp.
|
690,837
|
|||
|
75,143
|
Flushing Financial Corp.
|
923,507
|
|||
|
39,889
|
FVCBankcorp, Inc. (a)
|
429,605
|
|||
|
163,538
|
Heritage Commerce Corp.
|
1,354,095
|
|||
|
41,464
|
HomeTrust Bancshares, Inc.
|
866,183
|
|||
|
56,706
|
Independent Bank Corp.
|
961,734
|
|||
|
31,067
|
John Marshall Bancorp, Inc. (b)
|
624,136
|
|||
|
48,559
|
Metrocity Bankshares, Inc.
|
868,721
|
|||
|
59,077
|
Midland States Bancorp, Inc.
|
1,176,223
|
|||
|
105,427
|
Old Second Bancorp, Inc.
|
1,376,877
|
|||
|
28,588
|
Orrstown Financial Services, Inc.
|
547,460
|
|||
|
43,011
|
Peapack-Gladstone Financial
Corp.
|
1,164,738
|
|||
|
38,208
|
RBB Bancorp
|
456,204
|
|||
|
123,342
|
Republic First Bancorp, Inc. (a)
|
111,008
|
|||
|
79,901
|
Shore Bancshares, Inc.
|
923,656
|
|||
|
25,226
|
Southern Missouri Bancorp, Inc.
|
969,940
|
|||
|
51,028
|
TrustCo Bank Corp.
|
1,459,911
|
|||
|
15,394
|
Unity Bancorp, Inc.
|
363,144
|
|||
|
|
|
27,389,452
|
|||
|
|
Biotechnology — 0.6%
|
|
|||
|
28,091
|
Eagle Pharmaceuticals, Inc. (a)
|
546,089
|
|||
|
308,650
|
Selecta Biosciences, Inc. (a)
|
345,688
|
|||
|
|
|
891,777
|
|||
|
Shares
|
Description
|
Value
|
|||
|
|
|||||
|
|
Building Products — 1.0%
|
|
|||
|
52,146
|
Insteel Industries, Inc.
|
$1,622,784
|
|||
|
|
Capital Markets — 1.4%
|
|
|||
|
80,908
|
Bridge Investment Group
Holdings, Inc., Class A
|
918,306
|
|||
|
112,457
|
GCM Grosvenor, Inc., Class A
|
847,926
|
|||
|
23,125
|
Silvercrest Asset Management
Group, Inc., Class A
|
468,281
|
|||
|
|
|
2,234,513
|
|||
|
|
Chemicals — 1.1%
|
|
|||
|
183,723
|
Alto Ingredients, Inc. (a) (b)
|
530,960
|
|||
|
69,257
|
FutureFuel Corp.
|
612,924
|
|||
|
25,413
|
Intrepid Potash, Inc. (a)
|
576,621
|
|||
|
|
|
1,720,505
|
|||
|
|
Commercial Services &
Supplies — 3.4%
|
|
|||
|
254,593
|
ACCO Brands Corp.
|
1,326,430
|
|||
|
69,345
|
Ennis, Inc.
|
1,413,251
|
|||
|
62,540
|
Liquidity Services, Inc. (a)
|
1,031,910
|
|||
|
28,342
|
VSE Corp.
|
1,550,024
|
|||
|
|
|
5,321,615
|
|||
|
|
Communications Equipment
— 0.9%
|
|
|||
|
29,154
|
Aviat Networks, Inc. (a)
|
972,869
|
|||
|
30,873
|
Cambium Networks Corp. (a)
|
469,887
|
|||
|
|
|
1,442,756
|
|||
|
|
Construction & Engineering
— 1.1%
|
|
|||
|
26,820
|
Northwest Pipe Co. (a)
|
811,037
|
|||
|
113,591
|
Tutor Perini Corp. (a)
|
812,175
|
|||
|
|
|
1,623,212
|
|||
|
|
Consumer Finance — 1.0%
|
|
|||
|
25,637
|
Consumer Portfolio Services,
Inc. (a) (b)
|
299,184
|
|||
|
140,680
|
EZCORP, Inc., Class A (a) (b)
|
1,178,898
|
|||
|
|
|
1,478,082
|
|||
|
|
Consumer Staples Distribution
& Retail — 0.2%
|
|
|||
|
21,952
|
Natural Grocers by Vitamin
Cottage, Inc.
|
269,132
|
|||
|
|
Distributors — 0.3%
|
|
|||
|
17,854
|
Weyco Group, Inc.
|
476,523
|
|||
|
|
Diversified Consumer Services
— 1.3%
|
|
|||
|
47,527
|
American Public Education,
Inc. (a)
|
225,278
|
|||
|
35,651
|
Carriage Services, Inc.
|
1,157,588
|
|||
|
91,374
|
Universal Technical Institute,
Inc. (a)
|
631,394
|
|||
|
|
|
2,014,260
|
|||
Portfolio of Investments (Continued)
June 30, 2023 (Unaudited)
|
Shares
|
Description
|
Value
|
|||
|
COMMON STOCKS (Continued)
|
|||||
|
|
Diversified REITs — 0.6%
|
|
|||
|
53,583
|
CTO Realty Growth, Inc.
|
$918,413
|
|||
|
|
Electrical Equipment — 3.1%
|
|
|||
|
197,588
|
Babcock & Wilcox Enterprises,
Inc. (a)
|
1,165,769
|
|||
|
7,963
|
Preformed Line Products Co.
|
1,243,025
|
|||
|
89,867
|
Thermon Group Holdings,
Inc. (a)
|
2,390,462
|
|||
|
|
|
4,799,256
|
|||
|
|
Electronic Equipment,
Instruments & Components
— 3.4%
|
|
|||
|
28,518
|
Bel Fuse, Inc., Class B
|
1,637,218
|
|||
|
66,317
|
Kimball Electronics, Inc. (a)
|
1,832,339
|
|||
|
29,825
|
Richardson Electronics Ltd.
|
492,112
|
|||
|
33,732
|
Vishay Precision Group, Inc. (a)
|
1,253,144
|
|||
|
|
|
5,214,813
|
|||
|
|
Entertainment — 1.1%
|
|
|||
|
91,530
|
Reservoir Media, Inc. (a) (b)
|
551,010
|
|||
|
58,838
|
Sciplay Corp., Class A (a)
|
1,157,932
|
|||
|
|
|
1,708,942
|
|||
|
|
Financial Services — 3.6%
|
|
|||
|
157,053
|
Acacia Research Corp. (a)
|
653,341
|
|||
|
48,042
|
A-Mark Precious Metals, Inc.
|
1,798,452
|
|||
|
32,743
|
Cass Information Systems, Inc.
|
1,269,774
|
|||
|
17,624
|
Ocwen Financial Corp. (a) (b)
|
528,191
|
|||
|
249,725
|
UWM Holdings Corp. (b)
|
1,398,460
|
|||
|
|
|
5,648,218
|
|||
|
|
Food Products — 2.4%
|
|
|||
|
24,028
|
John B Sanfilippo & Son, Inc.
|
2,817,764
|
|||
|
14,216
|
Seneca Foods Corp., Class A (a)
|
464,579
|
|||
|
92,919
|
Whole Earth Brands, Inc. (a)
|
373,534
|
|||
|
|
|
3,655,877
|
|||
|
|
Ground Transportation —
0.6%
|
|
|||
|
21,258
|
Covenant Logistics Group, Inc.
|
931,738
|
|||
|
|
Health Care Equipment &
Supplies — 0.5%
|
|
|||
|
81,176
|
Co-Diagnostics, Inc. (a)
|
90,105
|
|||
|
34,745
|
Sensus Healthcare, Inc. (a)
|
109,447
|
|||
|
57,025
|
Zynex, Inc. (a) (b)
|
546,870
|
|||
|
|
|
746,422
|
|||
|
|
Hotels, Restaurants & Leisure
— 4.3%
|
|
|||
|
48,605
|
Chuy’s Holdings, Inc. (a)
|
1,984,056
|
|||
|
150,325
|
Denny’s Corp. (a)
|
1,852,004
|
|||
|
51,213
|
El Pollo Loco Holdings, Inc.
|
449,138
|
|||
|
7,551
|
Nathan’s Famous, Inc. (b)
|
593,056
|
|||
|
23,270
|
RCI Hospitality Holdings, Inc.
|
1,768,287
|
|||
|
|
|
6,646,541
|
|||
|
Shares
|
Description
|
Value
|
|||
|
|
|||||
|
|
Household Durables — 3.7%
|
|
|||
|
22,036
|
Bassett Furniture Industries, Inc.
|
$331,421
|
|||
|
79,036
|
Beazer Homes USA, Inc. (a)
|
2,235,929
|
|||
|
57,369
|
Dream Finders Homes, Inc.,
Class A (a) (b)
|
1,410,704
|
|||
|
61,211
|
Ethan Allen Interiors, Inc.
|
1,731,047
|
|||
|
|
|
5,709,101
|
|||
|
|
Insurance — 1.9%
|
|
|||
|
121,694
|
Citizens, Inc. (a) (b)
|
293,282
|
|||
|
6,451
|
National Western Life Group,
Inc., Class A
|
2,680,778
|
|||
|
|
|
2,974,060
|
|||
|
|
IT Services — 1.2%
|
|
|||
|
62,718
|
Hackett Group (The), Inc.
|
1,401,747
|
|||
|
92,141
|
Information Services Group, Inc.
|
493,876
|
|||
|
|
|
1,895,623
|
|||
|
|
Leisure Products — 2.1%
|
|
|||
|
237,067
|
AMMO, Inc. (a) (b)
|
504,953
|
|||
|
19,328
|
JAKKS Pacific, Inc. (a)
|
385,980
|
|||
|
14,892
|
Johnson Outdoors, Inc., Class A
|
915,113
|
|||
|
46,926
|
MasterCraft Boat Holdings,
Inc. (a)
|
1,438,282
|
|||
|
|
|
3,244,328
|
|||
|
|
Machinery — 1.7%
|
|
|||
|
79,908
|
Commercial Vehicle Group,
Inc. (a) (b)
|
886,979
|
|||
|
94,263
|
Manitowoc (The) Co., Inc. (a)
|
1,774,972
|
|||
|
|
|
2,661,951
|
|||
|
|
Marine Transportation —
0.4%
|
|
|||
|
97,217
|
Pangaea Logistics Solutions
Ltd. (b)
|
658,159
|
|||
|
|
Media — 2.0%
|
|
|||
|
210,172
|
Entravision Communications
Corp., Class A
|
922,655
|
|||
|
115,783
|
PubMatic, Inc., Class A (a)
|
2,116,513
|
|||
|
|
|
3,039,168
|
|||
|
|
Metals & Mining — 3.9%
|
|
|||
|
237,298
|
Gold Resource Corp.
|
149,498
|
|||
|
34,148
|
Haynes International, Inc.
|
1,735,401
|
|||
|
25,681
|
Olympic Steel, Inc.
|
1,258,369
|
|||
|
65,522
|
Ramaco Resources, Inc.,
Class A (b)
|
553,006
|
|||
|
13,104
|
Ramaco Resources, Inc.,
Class B (a)
|
139,033
|
|||
|
224,560
|
SunCoke Energy, Inc.
|
1,767,287
|
|||
|
67,458
|
Tredegar Corp.
|
449,945
|
|||
|
|
|
6,052,539
|
|||
|
|
Mortgage Real Estate
Investment Trusts — 2.5%
|
|
|||
|
43,348
|
AFC Gamma, Inc.
|
539,683
|
|||
Portfolio of Investments (Continued)
June 30, 2023 (Unaudited)
|
Shares
|
Description
|
Value
|
|||
|
COMMON STOCKS (Continued)
|
|||||
|
|
Mortgage Real Estate
Investment Trusts
(Continued)
|
|
|||
|
145,149
|
Dynex Capital, Inc.
|
$1,827,426
|
|||
|
138,207
|
Granite Point Mortgage Trust,
Inc.
|
732,497
|
|||
|
63,047
|
Great Ajax Corp.
|
386,478
|
|||
|
106,805
|
Sachem Capital Corp.
|
372,749
|
|||
|
|
|
3,858,833
|
|||
|
|
Office REITs — 0.4%
|
|
|||
|
107,125
|
City Office REIT, Inc.
|
596,686
|
|||
|
|
Oil, Gas & Consumable Fuels
— 8.2%
|
|
|||
|
34,052
|
Centrus Energy Corp.,
Class A (a)
|
1,108,733
|
|||
|
85,504
|
Dorian LPG Ltd.
|
2,193,178
|
|||
|
46,120
|
Epsilon Energy Ltd.
|
246,281
|
|||
|
81,205
|
Evolution Petroleum Corp.
|
655,324
|
|||
|
308,822
|
Ring Energy, Inc. (a) (b)
|
528,086
|
|||
|
85,124
|
SandRidge Energy, Inc.
|
1,298,141
|
|||
|
216,312
|
Sitio Royalties Corp.,
Class A (b)
|
5,682,516
|
|||
|
277,803
|
VAALCO Energy, Inc.
|
1,044,539
|
|||
|
|
|
12,756,798
|
|||
|
|
Pharmaceuticals — 2.4%
|
|
|||
|
203,566
|
Atea Pharmaceuticals, Inc. (a)
|
761,337
|
|||
|
92,793
|
Collegium Pharmaceutical,
Inc. (a)
|
1,994,121
|
|||
|
54,552
|
Phibro Animal Health Corp.,
Class A
|
747,362
|
|||
|
37,333
|
ProPhase Labs, Inc. (a) (b)
|
271,038
|
|||
|
|
|
3,773,858
|
|||
|
|
Professional Services — 3.1%
|
|
|||
|
18,256
|
Barrett Business Services, Inc.
|
1,591,923
|
|||
|
53,721
|
Heidrick & Struggles
International, Inc.
|
1,421,995
|
|||
|
15,304
|
RCM Technologies, Inc. (a)
|
281,594
|
|||
|
83,212
|
TrueBlue, Inc. (a)
|
1,473,684
|
|||
|
|
|
4,769,196
|
|||
|
|
Real Estate Management &
Development — 1.6%
|
|
|||
|
197,331
|
Douglas Elliman, Inc.
|
438,075
|
|||
|
48,182
|
Forestar Group, Inc. (a)
|
1,086,504
|
|||
|
38,545
|
RMR Group (The), Inc., Class A
|
893,088
|
|||
|
|
|
2,417,667
|
|||
|
|
Retail REITs — 1.1%
|
|
|||
|
77,705
|
Urstadt Biddle Properties, Inc.,
Class A
|
1,652,008
|
|||
|
Shares
|
Description
|
Value
|
|||
|
|
|||||
|
|
Semiconductors &
Semiconductor Equipment
— 0.2%
|
|
|||
|
108,728
|
AXT, Inc. (a)
|
$374,024
|
|||
|
|
Software — 0.3%
|
|
|||
|
16,421
|
CoreCard Corp. (a) (b)
|
416,437
|
|||
|
|
Specialty Retail — 4.3%
|
|
|||
|
56,782
|
Arhaus, Inc. (a) (b)
|
592,236
|
|||
|
34,454
|
Build-A-Bear Workshop, Inc.
|
738,005
|
|||
|
331,095
|
Chico’s FAS, Inc. (a)
|
1,771,358
|
|||
|
147,808
|
Destination XL Group, Inc. (a)
|
724,259
|
|||
|
35,763
|
Haverty Furniture Cos., Inc.
|
1,080,758
|
|||
|
34,827
|
Lands’ End, Inc. (a)
|
270,258
|
|||
|
30,447
|
Lazydays Holdings, Inc. (a)
|
351,967
|
|||
|
29,611
|
OneWater Marine, Inc.,
Class A (a)
|
1,073,103
|
|||
|
|
|
6,601,944
|
|||
|
|
Technology Hardware, Storage
& Peripherals — 0.4%
|
|
|||
|
87,533
|
Immersion Corp.
|
619,734
|
|||
|
|
Textiles, Apparel & Luxury
Goods — 0.9%
|
|
|||
|
41,886
|
Movado Group, Inc.
|
1,123,802
|
|||
|
33,902
|
Unifi, Inc. (a)
|
273,589
|
|||
|
|
|
1,397,391
|
|||
|
|
Trading Companies &
Distributors — 3.5%
|
|
|||
|
39,116
|
DXP Enterprises, Inc. (a)
|
1,424,214
|
|||
|
104,563
|
Hudson Technologies, Inc. (a)
|
1,005,896
|
|||
|
20,138
|
Rush Enterprises, Inc.,
Class B (b)
|
1,370,592
|
|||
|
54,104
|
Titan Machinery, Inc. (a)
|
1,596,068
|
|||
|
|
|
5,396,770
|
|||
|
|
Water Utilities — 0.6%
|
|
|||
|
20,597
|
Artesian Resources Corp.,
Class A
|
972,590
|
|||
|
|
Total Common Stocks
|
154,870,684
|
|||
|
|
(Cost $163,672,461)
|
|
|||
|
MONEY MARKET FUNDS — 2.2%
|
|||||
|
3,444,001
|
Goldman Sachs Financial Square
Treasury Obligations Fund -
Institutional Class -
4.99% (c) (d)
|
3,444,001
|
|||
|
|
(Cost $3,444,001)
|
|
|||
Portfolio of Investments (Continued)
June 30, 2023 (Unaudited)
|
Principal
Value
|
Description
|
Value
|
|||
|
REPURCHASE AGREEMENTS — 7.5%
|
|||||
|
$11,608,804
|
BNP Paribas S.A., 5.01% (c),
dated 06/30/23, due 07/03/23,
with a maturity value of
$11,613,651. Collateralized by
U.S. Treasury Securities,
interest rates of 1.25% to
1.50%, due 08/15/26 to
11/30/26. The value of the
collateral including accrued
interest is $11,854,364. (d)
|
$11,608,804
|
|||
|
|
(Cost $11,608,804)
|
|
|||
|
|
|||||
|
|
|||||
|
|
Total Investments — 109.7%
|
169,923,489
|
|||
|
|
(Cost $178,725,266)
|
|
|||
|
|
Net Other Assets and
Liabilities — (9.7)%
|
(15,015,222
)
|
|||
|
|
Net Assets — 100.0%
|
$154,908,267
|
|||
|
(a)
|
Non-income producing security.
|
|
(b)
|
All or a portion of this security is on loan (see Note 2D -
Securities Lending in the Notes to Financial Statements). The
remaining contractual maturity of all of the securities lending
transactions is overnight and continuous. The aggregate
value of such securities, including those sold and pending
settlement, is $14,660,003 and the total value of the collateral
held by the Fund is $15,052,805.
|
|
(c)
|
Rate shown reflects yield as of June 30, 2023.
|
|
(d)
|
This security serves as collateral for securities on loan.
|
Valuation Inputs
|
|
Total
Value at
6/30/2023
|
Level 1
Quoted
Prices
|
Level 2
Significant
Observable
Inputs
|
Level 3
Significant
Unobservable
Inputs
|
|
Common Stocks*
|
$154,870,684
|
$154,870,684
|
$—
|
$—
|
|
Money Market
Funds
|
3,444,001
|
3,444,001
|
—
|
—
|
|
Repurchase
Agreements
|
11,608,804
|
—
|
11,608,804
|
—
|
|
Total Investments
|
$169,923,489
|
$158,314,685
|
$11,608,804
|
$—
|
|
*
|
See Portfolio of Investments for industry breakout.
|
Offsetting Assets and Liabilities
|
Securities Lending Agency Agreement
|
|
|
Total gross amount presented on the Statements
of Assets and Liabilities(1)
|
$14,660,003
|
|
Non-cash Collateral(2)
|
(14,660,003
)
|
|
Net Amount
|
$—
|
|
(1)
|
The amount presented on the Statements of Assets and
Liabilities, which is included in “Investments, at value,” is not
offset and is shown on a gross basis.
|
|
(2)
|
At June 30, 2023, the value of the collateral received from
each borrower exceeded the value of the related securities
loaned. This amount is disclosed on the Portfolio of
Investments.
|
|
Repurchase Agreements
|
|
|
Total gross amount presented on the Statements
of Assets and Liabilities(3)
|
$11,608,804
|
|
Non-cash Collateral(4)
|
(11,608,804
)
|
|
Net Amount
|
$—
|
|
(3)
|
The amount is included in “Investments, at value” on the
Statements of Assets and Liabilities.
|
|
(4)
|
At June 30, 2023, the value of the collateral received from
each seller exceeded the value of the repurchase agreements.
|
Portfolio of Investments
June 30, 2023 (Unaudited)
|
Shares
|
Description
|
Value
|
|||
|
COMMON STOCKS — 99.8%
|
|||||
|
|
Automobiles — 2.1%
|
|
|||
|
6,031,767
|
Ford Motor Co.
|
$91,260,635
|
|||
|
|
Banks — 16.0%
|
|
|||
|
259,385
|
Associated Banc-Corp.
|
4,209,818
|
|||
|
106,331
|
Atlantic Union Bankshares Corp.
|
2,759,289
|
|||
|
129,276
|
Bank OZK
|
5,191,724
|
|||
|
281,998
|
Cadence Bank
|
5,538,441
|
|||
|
99,978
|
Cathay General Bancorp
|
3,218,292
|
|||
|
2,871,706
|
Citigroup, Inc.
|
132,213,344
|
|||
|
995,185
|
Citizens Financial Group, Inc.
|
25,954,425
|
|||
|
440,728
|
Columbia Banking System, Inc.
|
8,937,964
|
|||
|
296,035
|
Comerica, Inc.
|
12,540,043
|
|||
|
245,411
|
CVB Financial Corp.
|
3,259,058
|
|||
|
173,112
|
East West Bancorp, Inc.
|
9,138,582
|
|||
|
497,318
|
F.N.B. Corp.
|
5,689,318
|
|||
|
1,160,622
|
Fifth Third Bancorp
|
30,419,903
|
|||
|
237,265
|
First Hawaiian, Inc.
|
4,273,143
|
|||
|
964,338
|
First Horizon Corp.
|
10,868,089
|
|||
|
229,187
|
First Interstate BancSystem, Inc.,
Class A
|
5,463,818
|
|||
|
144,988
|
Glacier Bancorp, Inc.
|
4,519,276
|
|||
|
2,733,741
|
Huntington Bancshares, Inc.
|
29,469,728
|
|||
|
65,666
|
Independent Bank Corp.
|
2,922,794
|
|||
|
2,423,315
|
KeyCorp
|
22,391,431
|
|||
|
236,327
|
M&T Bank Corp.
|
29,247,829
|
|||
|
1,545,187
|
New York Community Bancorp,
Inc.
|
17,367,902
|
|||
|
410,290
|
Old National Bancorp
|
5,719,443
|
|||
|
658,143
|
PNC Financial Services Group
(The), Inc.
|
82,893,111
|
|||
|
1,395,734
|
Regions Financial Corp.
|
24,871,980
|
|||
|
187,846
|
Simmons First National Corp.,
Class A
|
3,240,343
|
|||
|
240,390
|
Synovus Financial Corp.
|
7,271,797
|
|||
|
2,876,319
|
Truist Financial Corp.
|
87,296,282
|
|||
|
2,806,339
|
U.S. Bancorp
|
92,721,440
|
|||
|
198,371
|
United Bankshares, Inc.
|
5,885,668
|
|||
|
136,906
|
United Community Banks, Inc.
|
3,421,281
|
|||
|
745,124
|
Valley National Bancorp
|
5,774,711
|
|||
|
238,744
|
Webster Financial Corp.
|
9,012,586
|
|||
|
271,901
|
Zions Bancorp N.A.
|
7,303,261
|
|||
|
|
|
711,006,114
|
|||
|
|
Biotechnology — 8.1%
|
|
|||
|
2,676,297
|
AbbVie, Inc.
|
360,577,495
|
|||
|
|
Capital Markets — 2.1%
|
|
|||
|
361,384
|
Carlyle Group (The), Inc.
|
11,546,219
|
|||
|
32,694
|
Cohen & Steers, Inc.
|
1,895,925
|
|||
|
454,756
|
Franklin Resources, Inc.
|
12,146,533
|
|||
|
255,725
|
Janus Henderson Group PLC
|
6,968,506
|
|||
|
Shares
|
Description
|
Value
|
|||
|
|
|||||
|
|
Capital Markets (Continued)
|
|
|||
|
287,907
|
Northern Trust Corp.
|
$21,345,425
|
|||
|
337,813
|
T. Rowe Price Group, Inc.
|
37,841,812
|
|||
|
|
|
91,744,420
|
|||
|
|
Chemicals — 2.0%
|
|
|||
|
156,410
|
Eastman Chemical Co.
|
13,094,645
|
|||
|
354,989
|
International Flavors &
Fragrances, Inc.
|
28,253,575
|
|||
|
480,411
|
LyondellBasell Industries N.V.,
Class A
|
44,116,142
|
|||
|
57,993
|
Scotts Miracle-Gro (The) Co.
|
3,635,581
|
|||
|
|
|
89,099,943
|
|||
|
|
Construction & Engineering
— 0.1%
|
|
|||
|
300,151
|
MDU Resources Group, Inc.
|
6,285,162
|
|||
|
|
Consumer Finance — 0.3%
|
|
|||
|
439,297
|
Ally Financial, Inc.
|
11,865,412
|
|||
|
128,375
|
Navient Corp.
|
2,385,207
|
|||
|
|
|
14,250,619
|
|||
|
|
Consumer Staples Distribution
& Retail — 1.0%
|
|
|||
|
1,502,046
|
Walgreens Boots Alliance, Inc.
|
42,793,291
|
|||
|
|
Containers & Packaging —
0.4%
|
|
|||
|
7,682
|
Greif, Inc., Class B
|
593,435
|
|||
|
121,515
|
Packaging Corp. of America
|
16,059,422
|
|||
|
|
|
16,652,857
|
|||
|
|
Diversified Telecommunication
Services — 9.1%
|
|
|||
|
10,847,741
|
Verizon Communications, Inc.
|
403,427,488
|
|||
|
|
Electric Utilities — 8.5%
|
|
|||
|
86,391
|
ALLETE, Inc.
|
5,008,086
|
|||
|
109,927
|
Avangrid, Inc.
|
4,142,049
|
|||
|
1,179,522
|
Duke Energy Corp.
|
105,850,304
|
|||
|
572,170
|
Edison International
|
39,737,207
|
|||
|
299,964
|
Entergy Corp.
|
29,207,495
|
|||
|
328,749
|
Evergy, Inc.
|
19,205,517
|
|||
|
767,958
|
FirstEnergy Corp.
|
29,858,207
|
|||
|
356,283
|
NRG Energy, Inc.
|
13,321,421
|
|||
|
317,365
|
OGE Energy Corp.
|
11,396,577
|
|||
|
169,686
|
Pinnacle West Capital Corp.
|
13,822,622
|
|||
|
1,516,689
|
Southern (The) Co.
|
106,547,402
|
|||
|
|
|
378,096,887
|
|||
|
|
Financial Services — 0.3%
|
|
|||
|
1,006,642
|
Western Union (The) Co.
|
11,807,911
|
|||
|
|
Gas Utilities — 0.5%
|
|
|||
|
89,708
|
Southwest Gas Holdings, Inc.
|
5,709,914
|
|||
|
77,639
|
Spire, Inc.
|
4,925,418
|
|||
|
355,133
|
UGI Corp.
|
9,577,937
|
|||
|
|
|
20,213,269
|
|||
Portfolio of Investments (Continued)
June 30, 2023 (Unaudited)
|
Shares
|
Description
|
Value
|
|||
|
COMMON STOCKS (Continued)
|
|||||
|
|
Hotels, Restaurants & Leisure
— 0.2%
|
|
|||
|
111,991
|
Bloomin’ Brands, Inc.
|
$3,011,438
|
|||
|
42,408
|
Cracker Barrel Old Country
Store, Inc.
|
3,951,577
|
|||
|
|
|
6,963,015
|
|||
|
|
Household Durables — 0.4%
|
|
|||
|
91,168
|
M.D.C. Holdings, Inc.
|
4,263,927
|
|||
|
91,193
|
Whirlpool Corp.
|
13,568,607
|
|||
|
|
|
17,832,534
|
|||
|
|
Industrial Conglomerates —
2.6%
|
|
|||
|
1,141,120
|
3M Co.
|
114,214,701
|
|||
|
|
Insurance — 3.2%
|
|
|||
|
477,036
|
Fidelity National Financial, Inc.
|
17,173,296
|
|||
|
403,823
|
Lincoln National Corp.
|
10,402,480
|
|||
|
872,086
|
MetLife, Inc.
|
49,299,022
|
|||
|
748,654
|
Prudential Financial, Inc.
|
66,046,256
|
|||
|
|
|
142,921,054
|
|||
|
|
IT Services — 4.7%
|
|
|||
|
1,558,864
|
International Business Machines
Corp.
|
208,591,592
|
|||
|
|
Leisure Products — 0.3%
|
|
|||
|
207,457
|
Hasbro, Inc.
|
13,436,990
|
|||
|
|
Multi-Utilities — 0.3%
|
|
|||
|
111,792
|
Avista Corp.
|
4,390,072
|
|||
|
88,495
|
Black Hills Corp.
|
5,332,709
|
|||
|
87,545
|
NorthWestern Corp.
|
4,969,054
|
|||
|
|
|
14,691,835
|
|||
|
|
Oil, Gas & Consumable Fuels
— 17.6%
|
|
|||
|
53,594
|
Arch Resources, Inc.
|
6,043,259
|
|||
|
2,345,780
|
Chevron Corp.
|
369,108,483
|
|||
|
73,561
|
CVR Energy, Inc.
|
2,203,888
|
|||
|
1,622,435
|
Devon Energy Corp.
|
78,428,508
|
|||
|
183,480
|
HF Sinclair Corp.
|
8,185,043
|
|||
|
985,873
|
ONEOK, Inc.
|
60,848,081
|
|||
|
675,846
|
Phillips 66
|
64,462,191
|
|||
|
535,571
|
Pioneer Natural Resources Co.
|
110,959,600
|
|||
|
2,422,784
|
Williams (The) Cos., Inc.
|
79,055,442
|
|||
|
|
|
779,294,495
|
|||
|
|
Pharmaceuticals — 6.8%
|
|
|||
|
8,259,787
|
Pfizer, Inc.
|
302,968,987
|
|||
|
|
Professional Services — 0.1%
|
|
|||
|
67,196
|
ManpowerGroup, Inc.
|
5,335,362
|
|||
|
|
Specialty Retail — 1.0%
|
|
|||
|
189,274
|
Advance Auto Parts, Inc.
|
13,305,962
|
|||
|
Shares
|
Description
|
Value
|
|||
|
|
|||||
|
|
Specialty Retail (Continued)
|
|
|||
|
334,132
|
Best Buy Co., Inc.
|
$27,382,117
|
|||
|
165,981
|
Foot Locker, Inc.
|
4,499,745
|
|||
|
|
|
45,187,824
|
|||
|
|
Technology Hardware, Storage
& Peripherals — 0.1%
|
|
|||
|
254,463
|
Xerox Holdings Corp.
|
3,788,954
|
|||
|
|
Textiles, Apparel & Luxury
Goods — 0.1%
|
|
|||
|
59,248
|
Carter’s, Inc.
|
4,301,405
|
|||
|
|
Tobacco — 11.9%
|
|
|||
|
5,194,253
|
Altria Group, Inc.
|
235,299,661
|
|||
|
2,978,787
|
Philip Morris International, Inc.
|
290,789,187
|
|||
|
|
|
526,088,848
|
|||
|
|
|||||
|
|
|||||
|
|
Total Investments — 99.8%
|
4,422,833,687
|
|||
|
|
(Cost $4,627,156,018)
|
|
|||
|
|
Net Other Assets and
Liabilities — 0.2%
|
9,959,198
|
|||
|
|
Net Assets — 100.0%
|
$4,432,792,885
|
|||
Valuation Inputs
|
|
Total
Value at
6/30/2023
|
Level 1
Quoted
Prices
|
Level 2
Significant
Observable
Inputs
|
Level 3
Significant
Unobservable
Inputs
|
|
Common
Stocks*
|
$4,422,833,687
|
$4,422,833,687
|
$—
|
$—
|
|
*
|
See Portfolio of Investments for industry breakout.
|
Portfolio of Investments
June 30, 2023 (Unaudited)
|
Shares
|
Description
|
Value
|
|||
|
COMMON STOCKS — 100.0%
|
|||||
|
|
Aerospace & Defense — 0.9%
|
|
|||
|
303,663
|
Leonardo DRS, Inc. (a)
|
$5,265,516
|
|||
|
39,213
|
Parsons Corp. (a)
|
1,887,714
|
|||
|
|
|
7,153,230
|
|||
|
|
Air Freight & Logistics —
0.1%
|
|
|||
|
19,767
|
GXO Logistics, Inc. (a)
|
1,241,763
|
|||
|
|
Automobile Components —
2.6%
|
|
|||
|
87,648
|
BorgWarner, Inc.
|
4,286,864
|
|||
|
416,917
|
Mobileye Global, Inc.,
Class A (a)
|
16,017,951
|
|||
|
|
|
20,304,815
|
|||
|
|
Automobiles — 0.3%
|
|
|||
|
156,125
|
Rivian Automotive, Inc.,
Class A (a)
|
2,601,043
|
|||
|
|
Beverages — 0.0%
|
|
|||
|
9,349
|
Vita Coco (The) Co., Inc. (a)
|
251,208
|
|||
|
|
Biotechnology — 4.5%
|
|
|||
|
58,068
|
Apellis Pharmaceuticals, Inc. (a)
|
5,289,995
|
|||
|
39,885
|
Arcellx, Inc. (a)
|
1,261,164
|
|||
|
6,223
|
Karuna Therapeutics, Inc. (a)
|
1,349,457
|
|||
|
48,186
|
Legend Biotech Corp., ADR (a)
|
3,326,280
|
|||
|
7,617
|
Morphic Holding, Inc. (a)
|
436,683
|
|||
|
28,264
|
Regeneron Pharmaceuticals,
Inc. (a)
|
20,308,814
|
|||
|
7,788
|
United Therapeutics Corp. (a)
|
1,719,201
|
|||
|
31,150
|
Vaxcyte, Inc. (a)
|
1,555,631
|
|||
|
|
|
35,247,225
|
|||
|
|
Building Products — 6.4%
|
|
|||
|
1,005,989
|
Carrier Global Corp.
|
50,007,713
|
|||
|
21,359
|
Masterbrand, Inc. (a)
|
248,405
|
|||
|
|
|
50,256,118
|
|||
|
|
Capital Markets — 0.4%
|
|
|||
|
18,430
|
AssetMark Financial Holdings,
Inc. (a)
|
546,634
|
|||
|
64,788
|
Owl Rock Capital Corp. (b)
|
869,455
|
|||
|
51,386
|
TPG, Inc.
|
1,503,554
|
|||
|
|
|
2,919,643
|
|||
|
|
Commercial Services &
Supplies — 0.0%
|
|
|||
|
26,549
|
ACV Auctions, Inc., Class A (a)
|
458,501
|
|||
|
|
Communications Equipment
— 0.1%
|
|
|||
|
21,440
|
Extreme Networks, Inc. (a)
|
558,512
|
|||
|
Shares
|
Description
|
Value
|
|||
|
|
|||||
|
|
Construction & Engineering
— 1.9%
|
|
|||
|
104,856
|
MasTec, Inc. (a)
|
$12,369,862
|
|||
|
50,440
|
WillScot Mobile Mini Holdings
Corp. (a)
|
2,410,528
|
|||
|
|
|
14,780,390
|
|||
|
|
Construction Materials —
0.0%
|
|
|||
|
9,402
|
Knife River Corp. (a)
|
408,987
|
|||
|
|
Diversified Consumer Services
— 0.6%
|
|
|||
|
34,117
|
Duolingo, Inc. (a)
|
4,876,684
|
|||
|
|
Electric Utilities — 3.2%
|
|
|||
|
217,177
|
Constellation Energy Corp.
|
19,882,554
|
|||
|
95,397
|
Evergy, Inc.
|
5,573,093
|
|||
|
|
|
25,455,647
|
|||
|
|
Electrical Equipment — 1.0%
|
|
|||
|
125,365
|
Array Technologies, Inc. (a)
|
2,833,249
|
|||
|
6,409
|
Atkore, Inc. (a)
|
999,420
|
|||
|
29,172
|
Fluence Energy, Inc. (a)
|
777,142
|
|||
|
71,847
|
NEXTracker, Inc., Class A (a)
|
2,860,229
|
|||
|
28,568
|
Shoals Technologies Group, Inc.,
Class A (a)
|
730,198
|
|||
|
|
|
8,200,238
|
|||
|
|
Electronic Equipment,
Instruments & Components
— 0.6%
|
|
|||
|
5,528
|
Insight Enterprises, Inc. (a)
|
808,968
|
|||
|
129,326
|
Vontier Corp.
|
4,165,590
|
|||
|
|
|
4,974,558
|
|||
|
|
Energy Equipment & Services
— 1.9%
|
|
|||
|
479,550
|
Baker Hughes Co.
|
15,158,576
|
|||
|
|
Entertainment — 5.9%
|
|
|||
|
116,863
|
Endeavor Group Holdings, Inc.,
Class A (a)
|
2,795,363
|
|||
|
154,826
|
Liberty Media Corp.-Liberty
Formula One, Class C (a)
|
11,655,301
|
|||
|
8,604
|
Madison Square Garden
Entertainment Corp. (a)
|
289,267
|
|||
|
101,500
|
ROBLOX Corp., Class A (a)
|
4,090,450
|
|||
|
103,705
|
Sciplay Corp., Class A (a)
|
2,040,914
|
|||
|
2,024,507
|
Warner Bros Discovery, Inc. (a)
|
25,387,318
|
|||
|
|
|
46,258,613
|
|||
|
|
Financial Services — 3.8%
|
|
|||
|
150,808
|
Block, Inc. (a)
|
10,039,289
|
|||
|
107,727
|
Corebridge Financial, Inc.
|
1,902,459
|
|||
|
26,856
|
Enact Holdings, Inc.
|
674,891
|
|||
|
18,409
|
Flywire Corp. (a)
|
571,415
|
|||
|
328,408
|
Rocket Cos., Inc., Class A (a) (b)
|
2,942,536
|
|||
Portfolio of Investments (Continued)
June 30, 2023 (Unaudited)
|
Shares
|
Description
|
Value
|
|||
|
COMMON STOCKS (Continued)
|
|||||
|
|
Financial Services (Continued)
|
|
|||
|
34,569
|
Shift4 Payments, Inc.,
Class A (a)
|
$2,347,581
|
|||
|
529,025
|
Toast, Inc., Class A (a)
|
11,940,094
|
|||
|
|
|
30,418,265
|
|||
|
|
Food Products — 0.1%
|
|
|||
|
22,081
|
Hostess Brands, Inc. (a)
|
559,091
|
|||
|
|
Ground Transportation —
9.3%
|
|
|||
|
19,434
|
RXO, Inc. (a)
|
440,569
|
|||
|
1,681,885
|
Uber Technologies, Inc. (a)
|
72,606,975
|
|||
|
|
|
73,047,544
|
|||
|
|
Health Care Equipment &
Supplies — 6.6%
|
|
|||
|
291,079
|
Bausch + Lomb Corp. (a) (b)
|
5,841,956
|
|||
|
377,856
|
GE HealthCare Technologies,
Inc.
|
30,697,021
|
|||
|
42,613
|
Shockwave Medical, Inc. (a)
|
12,162,176
|
|||
|
37,875
|
TransMedics Group, Inc. (a)
|
3,180,743
|
|||
|
|
|
51,881,896
|
|||
|
|
Health Care Providers &
Services — 0.6%
|
|
|||
|
71,030
|
HealthEquity, Inc. (a)
|
4,484,834
|
|||
|
|
Hotels, Restaurants & Leisure
— 9.7%
|
|
|||
|
345,419
|
Airbnb, Inc., Class A (a)
|
44,268,899
|
|||
|
209,894
|
DoorDash, Inc., Class A (a)
|
16,040,099
|
|||
|
426,265
|
DraftKings, Inc., Class A (a)
|
11,325,861
|
|||
|
27,956
|
Krispy Kreme, Inc.
|
411,792
|
|||
|
226,919
|
Life Time Group Holdings,
Inc. (a)
|
4,463,497
|
|||
|
|
|
76,510,148
|
|||
|
|
Insurance — 0.3%
|
|
|||
|
21,005
|
F&G Annuities & Life, Inc.
|
520,504
|
|||
|
43,178
|
Ryan Specialty Holdings, Inc. (a)
|
1,938,260
|
|||
|
|
|
2,458,764
|
|||
|
|
IT Services — 2.5%
|
|
|||
|
27,583
|
Cloudflare, Inc., Class A (a)
|
1,803,101
|
|||
|
97,501
|
Snowflake, Inc., Class A (a)
|
17,158,226
|
|||
|
22,462
|
Squarespace, Inc., Class A (a)
|
708,451
|
|||
|
|
|
19,669,778
|
|||
|
|
Machinery — 9.8%
|
|
|||
|
9,429
|
Crane Co.
|
840,312
|
|||
|
70,066
|
Esab Corp.
|
4,662,192
|
|||
|
498,020
|
Otis Worldwide Corp.
|
44,328,760
|
|||
|
646,254
|
Symbotic, Inc. (a) (b)
|
27,666,134
|
|||
|
|
|
77,497,398
|
|||
|
Shares
|
Description
|
Value
|
|||
|
|
|||||
|
|
Media — 0.1%
|
|
|||
|
25,750
|
Integral Ad Science Holding
Corp. (a)
|
$462,985
|
|||
|
|
Personal Care Products —
1.6%
|
|
|||
|
110,365
|
BellRing Brands, Inc. (a)
|
4,039,359
|
|||
|
318,271
|
Kenvue, Inc. (a)
|
8,408,720
|
|||
|
|
|
12,448,079
|
|||
|
|
Professional Services — 0.4%
|
|
|||
|
174,974
|
Verra Mobility Corp. (a)
|
3,450,487
|
|||
|
|
Retail REITs — 0.7%
|
|
|||
|
153,391
|
Phillips Edison & Co., Inc.
|
5,227,565
|
|||
|
|
Semiconductors &
Semiconductor Equipment
— 9.9%
|
|
|||
|
31,872
|
Allegro MicroSystems, Inc. (a)
|
1,438,702
|
|||
|
24,597
|
Credo Technology Group
Holding Ltd. (a)
|
426,512
|
|||
|
229,276
|
GLOBALFOUNDRIES, Inc. (a)
|
14,806,644
|
|||
|
646,028
|
ON Semiconductor Corp. (a)
|
61,101,328
|
|||
|
|
|
77,773,186
|
|||
|
|
Software — 12.3%
|
|
|||
|
36,041
|
Asana, Inc., Class A (a)
|
794,344
|
|||
|
376,318
|
Bentley Systems, Inc., Class B
|
20,407,725
|
|||
|
16,220
|
Braze, Inc., Class A (a)
|
710,274
|
|||
|
18,938
|
C3.ai, Inc., Class A (a) (b)
|
689,911
|
|||
|
49,220
|
Confluent, Inc., Class A (a)
|
1,737,958
|
|||
|
19,705
|
Crowdstrike Holdings, Inc.,
Class A (a)
|
2,894,073
|
|||
|
40,124
|
Datadog, Inc., Class A (a)
|
3,947,399
|
|||
|
27,639
|
DoubleVerify Holdings, Inc. (a)
|
1,075,710
|
|||
|
48,363
|
Dynatrace, Inc. (a)
|
2,489,244
|
|||
|
126,983
|
Gitlab, Inc., Class A (a)
|
6,490,101
|
|||
|
47,695
|
Instructure Holdings, Inc. (a)
|
1,200,006
|
|||
|
78,209
|
Intapp, Inc. (a)
|
3,277,739
|
|||
|
352,103
|
Palantir Technologies, Inc.,
Class A (a)
|
5,397,739
|
|||
|
186,815
|
Procore Technologies, Inc. (a)
|
12,156,052
|
|||
|
1,054,156
|
Samsara, Inc., Class A (a)
|
29,210,663
|
|||
|
44,483
|
Sprinklr, Inc., Class A (a)
|
615,200
|
|||
|
39,709
|
Unity Software, Inc. (a)
|
1,724,165
|
|||
|
125,968
|
Vertex, Inc., Class A (a)
|
2,456,376
|
|||
|
|
|
97,274,679
|
|||
|
|
Specialty Retail — 1.1%
|
|
|||
|
213,126
|
Chewy, Inc., Class A (a)
|
8,412,083
|
|||
|
|
Trading Companies &
Distributors — 0.8%
|
|
|||
|
192,060
|
Core & Main, Inc., Class A (a)
|
6,019,161
|
|||
|
|
Total Common Stocks
|
788,701,694
|
|||
|
|
(Cost $706,009,298)
|
|
|||
Portfolio of Investments (Continued)
June 30, 2023 (Unaudited)
|
Principal
Value
|
Description
|
Value
|
|||
|
REPURCHASE AGREEMENTS — 4.0%
|
|||||
|
$15,314,263
|
Bank of America Corp., 5.05%
(c), dated 06/30/23, due
07/03/23, with a maturity
value of $15,320,708.
Collateralized by
U.S. Treasury Securities,
interest rates of 2.88% to
4.38%, due 02/15/38 to
02/15/49. The value of the
collateral including accrued
interest is $15,620,552. (d)
|
$15,314,263
|
|||
|
15,943,889
|
JPMorgan Chase & Co., 5.05%
(c), dated 06/30/23, due
07/03/23, with a maturity
value of $15,950,599.
Collateralized by
U.S. Treasury Securities,
interest rates of 0.00% to
2.75%, due 07/05/23 to
09/30/26. The value of the
collateral including accrued
interest is $16,262,768. (d)
|
15,943,889
|
|||
|
|
Total Repurchase Agreements
|
31,258,152
|
|||
|
|
(Cost $31,258,152)
|
|
|||
|
|
|||||
|
|
|||||
|
|
Total Investments — 104.0%
|
819,959,846
|
|||
|
|
(Cost $737,267,450)
|
|
|||
|
|
Net Other Assets and
Liabilities — (4.0)%
|
(31,203,989
)
|
|||
|
|
Net Assets — 100.0%
|
$788,755,857
|
|||
|
(a)
|
Non-income producing security.
|
|
(b)
|
All or a portion of this security is on loan (see Note 2D -
Securities Lending in the Notes to Financial Statements). The
remaining contractual maturity of all of the securities lending
transactions is overnight and continuous. The aggregate
value of such securities, including those sold and pending
settlement, is $31,344,815 and the total value of the collateral
held by the Fund is $31,258,152.
|
|
(c)
|
Rate shown reflects yield as of June 30, 2023.
|
|
(d)
|
This security serves as collateral for securities on loan.
|
|
Abbreviations throughout the Portfolio of Investments:
|
|
|
ADR
|
– American Depositary Receipt
|
Valuation Inputs
|
|
Total
Value at
6/30/2023
|
Level 1
Quoted
Prices
|
Level 2
Significant
Observable
Inputs
|
Level 3
Significant
Unobservable
Inputs
|
|
Common Stocks*
|
$788,701,694
|
$788,701,694
|
$—
|
$—
|
|
Repurchase
Agreements
|
31,258,152
|
—
|
31,258,152
|
—
|
|
Total Investments
|
$819,959,846
|
$788,701,694
|
$31,258,152
|
$—
|
|
*
|
See Portfolio of Investments for industry breakout.
|
Offsetting Assets and Liabilities
|
Securities Lending Agency Agreement
|
|
|
Total gross amount presented on the Statements
of Assets and Liabilities(1)
|
$31,344,815
|
|
Non-cash Collateral(2)
|
(31,258,152
)
|
|
Net Amount
|
$86,663
|
|
(1)
|
The amount presented on the Statements of Assets and
Liabilities, which is included in “Investments, at value,” is not
offset and is shown on a gross basis.
|
|
(2)
|
The collateral requirements are determined at the beginning
of each business day based on the market value of the loaned
securities from the end of the prior day. On June 30, 2023, the
last business day of the period, there was sufficient collateral
based on the end of day market value from the prior business
day; however, as a result of market movement from June 29
to June 30, the value of the related securities loaned was
above the collateral value received. See Note 2D - Securities
Lending in the Notes to Financial Statements.
|
Portfolio of Investments (Continued)
June 30, 2023 (Unaudited)
|
Repurchase Agreements
|
|
|
Total gross amount presented on the Statements
of Assets and Liabilities(3)
|
$31,258,152
|
|
Non-cash Collateral(4)
|
(31,258,152
)
|
|
Net Amount
|
$—
|
|
(3)
|
The amount is included in “Investments, at value” on the
Statements of Assets and Liabilities.
|
|
(4)
|
At June 30, 2023, the value of the collateral received from
each seller exceeded the value of the repurchase agreements.
|
Portfolio of Investments
June 30, 2023 (Unaudited)
|
Shares
|
Description
|
Value
|
|||
|
COMMON STOCKS — 100.0%
|
|||||
|
|
Biotechnology — 80.0%
|
|
|||
|
2,427,956
|
ACADIA Pharmaceuticals,
Inc. (a)
|
$58,149,546
|
|||
|
2,136,729
|
Agios Pharmaceuticals, Inc. (a)
|
60,512,165
|
|||
|
1,653,025
|
Alkermes PLC (a)
|
51,739,683
|
|||
|
232,733
|
Alnylam Pharmaceuticals,
Inc. (a)
|
44,205,306
|
|||
|
200,114
|
Amgen, Inc.
|
44,429,310
|
|||
|
165,799
|
Biogen, Inc. (a)
|
47,227,845
|
|||
|
501,723
|
BioMarin Pharmaceutical,
Inc. (a)
|
43,489,350
|
|||
|
406,079
|
BioNTech SE, ADR (a)
|
43,828,106
|
|||
|
722,991
|
Exact Sciences Corp. (a)
|
67,888,855
|
|||
|
2,560,251
|
Exelixis, Inc. (a)
|
48,926,397
|
|||
|
2,406,450
|
FibroGen, Inc. (a)
|
6,497,415
|
|||
|
1,186,435
|
Genmab A/S, ADR (a) (b)
|
45,096,394
|
|||
|
563,130
|
Gilead Sciences, Inc.
|
43,400,429
|
|||
|
6,420,061
|
Grifols S.A., ADR (a)
|
58,807,759
|
|||
|
650,812
|
Incyte Corp. (a)
|
40,513,047
|
|||
|
1,313,312
|
Ionis Pharmaceuticals, Inc. (a)
|
53,885,191
|
|||
|
343,011
|
Moderna, Inc. (a)
|
41,675,837
|
|||
|
465,375
|
Neurocrine Biosciences, Inc. (a)
|
43,884,863
|
|||
|
60,758
|
Regeneron Pharmaceuticals,
Inc. (a)
|
43,657,053
|
|||
|
383,549
|
Sarepta Therapeutics, Inc. (a)
|
43,924,032
|
|||
|
238,522
|
Seagen, Inc. (a)
|
45,905,944
|
|||
|
1,144,821
|
Ultragenyx Pharmaceutical,
Inc. (a)
|
52,810,593
|
|||
|
212,171
|
United Therapeutics Corp. (a)
|
46,836,748
|
|||
|
146,066
|
Vertex Pharmaceuticals, Inc. (a)
|
51,402,086
|
|||
|
|
|
1,128,693,954
|
|||
|
|
Life Sciences Tools & Services
— 20.0%
|
|
|||
|
584,310
|
Bio-Techne Corp.
|
47,697,225
|
|||
|
242,335
|
Charles River Laboratories
International, Inc. (a)
|
50,950,934
|
|||
|
213,553
|
Illumina, Inc. (a)
|
40,039,052
|
|||
|
240,453
|
IQVIA Holdings, Inc. (a)
|
54,046,621
|
|||
|
31,309
|
Mettler-Toledo International,
Inc. (a)
|
41,066,137
|
|||
|
1,080,950
|
QIAGEN N.V. (a)
|
48,675,178
|
|||
|
|
|
282,475,147
|
|||
|
|
Total Common Stocks
|
1,411,169,101
|
|||
|
|
(Cost $1,320,250,481)
|
|
|||
|
MONEY MARKET FUNDS — 0.1%
|
|||||
|
1,075,889
|
Goldman Sachs Financial Square
Treasury Obligations Fund -
Institutional Class -
4.99% (c) (d)
|
1,075,889
|
|||
|
|
(Cost $1,075,889)
|
|
|||
|
Principal
Value
|
Description
|
Value
|
|||
|
REPURCHASE AGREEMENTS — 0.2%
|
|||||
|
$3,626,531
|
BNP Paribas S.A., 5.01% (c),
dated 06/30/23, due 07/03/23,
with a maturity value of
$3,628,046. Collateralized by
U.S. Treasury Securities,
interest rates of 1.25% to
1.50%, due 08/15/26 to
11/30/26. The value of the
collateral including accrued
interest is $3,703,243. (d)
|
$3,626,531
|
|||
|
|
(Cost $3,626,531)
|
|
|||
|
|
|||||
|
|
|||||
|
|
Total Investments — 100.3%
|
1,415,871,521
|
|||
|
|
(Cost $1,324,952,901)
|
|
|||
|
|
Net Other Assets and
Liabilities — (0.3)%
|
(4,241,757
)
|
|||
|
|
Net Assets — 100.0%
|
$1,411,629,764
|
|||
|
(a)
|
Non-income producing security.
|
|
(b)
|
All or a portion of this security is on loan (see Note 2D -
Securities Lending in the Notes to Financial Statements). The
remaining contractual maturity of all of the securities lending
transactions is overnight and continuous. The aggregate
value of such securities, including those sold and pending
settlement, is $4,679,031 and the total value of the collateral
held by the Fund is $4,702,420.
|
|
(c)
|
Rate shown reflects yield as of June 30, 2023.
|
|
(d)
|
This security serves as collateral for securities on loan.
|
|
Abbreviations throughout the Portfolio of Investments:
|
|
|
ADR
|
– American Depositary Receipt
|
Valuation Inputs
|
|
Total
Value at
6/30/2023
|
Level 1
Quoted
Prices
|
Level 2
Significant
Observable
Inputs
|
Level 3
Significant
Unobservable
Inputs
|
|
Common
Stocks*
|
$1,411,169,101
|
$1,411,169,101
|
$—
|
$—
|
|
Money Market
Funds
|
1,075,889
|
1,075,889
|
—
|
—
|
|
Repurchase
Agreements
|
3,626,531
|
—
|
3,626,531
|
—
|
|
Total
Investments
|
$1,415,871,521
|
$1,412,244,990
|
$3,626,531
|
$—
|
|
*
|
See Portfolio of Investments for industry breakout.
|
Portfolio of Investments (Continued)
June 30, 2023 (Unaudited)
Offsetting Assets and Liabilities
|
Securities Lending Agency Agreement
|
|
|
Total gross amount presented on the Statements
of Assets and Liabilities(1)
|
$4,679,031
|
|
Non-cash Collateral(2)
|
(4,679,031
)
|
|
Net Amount
|
$—
|
|
(1)
|
The amount presented on the Statements of Assets and
Liabilities, which is included in “Investments, at value,” is not
offset and is shown on a gross basis.
|
|
(2)
|
At June 30, 2023, the value of the collateral received from
each borrower exceeded the value of the related securities
loaned. This amount is disclosed on the Portfolio of
Investments.
|
|
Repurchase Agreements
|
|
|
Total gross amount presented on the Statements
of Assets and Liabilities(3)
|
$3,626,531
|
|
Non-cash Collateral(4)
|
(3,626,531
)
|
|
Net Amount
|
$—
|
|
(3)
|
The amount is included in “Investments, at value” on the
Statements of Assets and Liabilities.
|
|
(4)
|
At June 30, 2023, the value of the collateral received from
each seller exceeded the value of the repurchase agreements.
|
Portfolio of Investments
June 30, 2023 (Unaudited)
|
Shares
|
Description
|
Value
|
|||
|
COMMON STOCKS — 100.0%
|
|||||
|
|
Broadline Retail — 12.9%
|
|
|||
|
3,847,360
|
Amazon.com, Inc. (a)
|
$501,541,849
|
|||
|
2,517,227
|
eBay, Inc.
|
112,494,875
|
|||
|
915,431
|
Etsy, Inc. (a)
|
77,454,617
|
|||
|
|
|
691,491,341
|
|||
|
|
Communications Equipment
— 11.1%
|
|
|||
|
890,904
|
Arista Networks, Inc. (a)
|
144,379,902
|
|||
|
1,485,133
|
Ciena Corp. (a)
|
63,103,301
|
|||
|
5,232,557
|
Cisco Systems, Inc.
|
270,732,499
|
|||
|
6,627,129
|
CommScope Holding Co.,
Inc. (a)
|
37,310,737
|
|||
|
2,538,387
|
Juniper Networks, Inc.
|
79,527,665
|
|||
|
|
|
595,054,104
|
|||
|
|
Entertainment — 5.0%
|
|
|||
|
613,485
|
Netflix, Inc. (a)
|
270,234,008
|
|||
|
|
Financial Services — 3.5%
|
|
|||
|
2,793,507
|
PayPal Holdings, Inc. (a)
|
186,410,722
|
|||
|
|
Health Care Technology —
3.4%
|
|
|||
|
2,136,289
|
Teladoc Health, Inc. (a)
|
54,090,837
|
|||
|
637,011
|
Veeva Systems, Inc., Class A (a)
|
125,956,185
|
|||
|
|
|
180,047,022
|
|||
|
|
Hotels, Restaurants & Leisure
— 6.9%
|
|
|||
|
1,305,566
|
Airbnb, Inc., Class A (a)
|
167,321,339
|
|||
|
1,444,591
|
DoorDash, Inc., Class A (a)
|
110,395,644
|
|||
|
861,845
|
Expedia Group, Inc. (a)
|
94,277,224
|
|||
|
|
|
371,994,207
|
|||
|
|
Interactive Media & Services
— 23.2%
|
|
|||
|
2,248,960
|
Alphabet, Inc., Class A (a)
|
269,200,512
|
|||
|
1,934,531
|
Alphabet, Inc., Class C (a)
|
234,020,215
|
|||
|
2,051,243
|
Match Group, Inc. (a)
|
85,844,520
|
|||
|
1,400,195
|
Meta Platforms, Inc., Class A (a)
|
401,827,961
|
|||
|
3,738,580
|
Pinterest, Inc., Class A (a)
|
102,212,777
|
|||
|
7,656,031
|
Snap, Inc., Class A (a)
|
90,647,407
|
|||
|
2,525,172
|
ZoomInfo Technologies, Inc. (a)
|
64,114,117
|
|||
|
|
|
1,247,867,509
|
|||
|
|
IT Services — 10.3%
|
|
|||
|
969,856
|
Akamai Technologies, Inc. (a)
|
87,160,959
|
|||
|
1,602,068
|
Cloudflare, Inc., Class A (a)
|
104,727,185
|
|||
|
2,458,996
|
Fastly, Inc., Class A (a)
|
38,778,367
|
|||
|
1,121,854
|
GoDaddy, Inc., Class A (a)
|
84,284,891
|
|||
|
1,129,747
|
Okta, Inc. (a)
|
78,347,955
|
|||
|
907,032
|
Snowflake, Inc., Class A (a)
|
159,619,491
|
|||
|
|
|
552,918,848
|
|||
|
|
Real Estate Management &
Development — 2.6%
|
|
|||
|
14,531,055
|
Opendoor Technologies, Inc. (a)
|
58,414,841
|
|||
|
Shares
|
Description
|
Value
|
|||
|
|
|||||
|
|
Real Estate Management &
Development (Continued)
|
|
|||
|
440,912
|
Zillow Group, Inc., Class A (a)
|
$21,692,871
|
|||
|
1,236,686
|
Zillow Group, Inc., Class C (a)
|
62,155,838
|
|||
|
|
|
142,263,550
|
|||
|
|
Software — 21.1%
|
|
|||
|
684,960
|
Atlassian Corp., Class A (a)
|
114,943,138
|
|||
|
1,873,140
|
Box, Inc., Class A (a)
|
55,032,853
|
|||
|
1,868,154
|
Confluent, Inc., Class A (a)
|
65,964,518
|
|||
|
1,199,963
|
Datadog, Inc., Class A (a)
|
118,052,360
|
|||
|
1,445,280
|
DocuSign, Inc. (a)
|
73,839,355
|
|||
|
2,729,194
|
Dropbox, Inc., Class A (a)
|
72,787,604
|
|||
|
2,250,174
|
Nutanix, Inc., Class A (a)
|
63,117,381
|
|||
|
1,259,155
|
Salesforce, Inc. (a)
|
266,009,085
|
|||
|
1,316,919
|
Smartsheet, Inc., Class A (a)
|
50,385,321
|
|||
|
704,278
|
Workday, Inc., Class A (a)
|
159,089,357
|
|||
|
1,377,505
|
Zoom Video Communications,
Inc., Class A (a)
|
93,505,039
|
|||
|
|
|
1,132,726,011
|
|||
|
|
Total Common Stocks
|
5,371,007,322
|
|||
|
|
(Cost $6,325,753,989)
|
|
|||
|
MONEY MARKET FUNDS — 0.1%
|
|||||
|
3,718,869
|
Morgan Stanley Institutional
Liquidity Funds - Treasury
Portfolio - Institutional Class -
4.94% (b)
|
3,718,869
|
|||
|
|
(Cost $3,718,869)
|
|
|||
|
|
|||||
|
|
|||||
|
|
Total Investments — 100.1%
|
5,374,726,191
|
|||
|
|
(Cost $6,329,472,858)
|
|
|||
|
|
Net Other Assets and
Liabilities — (0.1)%
|
(3,333,267
)
|
|||
|
|
Net Assets — 100.0%
|
$5,371,392,924
|
|||
|
(a)
|
Non-income producing security.
|
|
(b)
|
Rate shown reflects yield as of June 30, 2023.
|
Portfolio of Investments (Continued)
June 30, 2023 (Unaudited)
Valuation Inputs
|
|
Total
Value at
6/30/2023
|
Level 1
Quoted
Prices
|
Level 2
Significant
Observable
Inputs
|
Level 3
Significant
Unobservable
Inputs
|
|
Common
Stocks*
|
$5,371,007,322
|
$5,371,007,322
|
$—
|
$—
|
|
Money Market
Funds
|
3,718,869
|
3,718,869
|
—
|
—
|
|
Total
Investments
|
$5,374,726,191
|
$5,374,726,191
|
$—
|
$—
|
|
*
|
See Portfolio of Investments for industry breakout.
|
Portfolio of Investments
June 30, 2023 (Unaudited)
|
Shares
|
Description
|
Value
|
|||
|
COMMON STOCKS — 100.0%
|
|||||
|
|
Aerospace & Defense — 5.6%
|
|
|||
|
764,966
|
General Dynamics Corp.
|
$164,582,435
|
|||
|
356,715
|
Lockheed Martin Corp.
|
164,224,452
|
|||
|
364,695
|
Northrop Grumman Corp.
|
166,227,981
|
|||
|
|
|
495,034,868
|
|||
|
|
Air Freight & Logistics —
1.8%
|
|
|||
|
881,781
|
United Parcel Service, Inc.,
Class B
|
158,059,244
|
|||
|
|
Beverages — 5.9%
|
|
|||
|
2,687,473
|
Coca-Cola (The) Co.
|
161,839,624
|
|||
|
3,243,501
|
Monster Beverage Corp. (a)
|
186,306,698
|
|||
|
928,388
|
PepsiCo, Inc.
|
171,956,025
|
|||
|
|
|
520,102,347
|
|||
|
|
Biotechnology — 5.1%
|
|
|||
|
1,059,865
|
AbbVie, Inc.
|
142,795,611
|
|||
|
705,864
|
Amgen, Inc.
|
156,715,925
|
|||
|
1,988,366
|
Gilead Sciences, Inc.
|
153,243,368
|
|||
|
|
|
452,754,904
|
|||
|
|
Capital Markets — 1.7%
|
|
|||
|
3,021,461
|
Nasdaq, Inc.
|
150,619,831
|
|||
|
|
Chemicals — 2.0%
|
|
|||
|
592,397
|
Air Products and Chemicals, Inc.
|
177,440,673
|
|||
|
|
Commercial Services &
Supplies — 2.3%
|
|
|||
|
2,195,850
|
Copart, Inc. (a)
|
200,283,479
|
|||
|
|
Communications Equipment
— 2.2%
|
|
|||
|
3,660,061
|
Cisco Systems, Inc.
|
189,371,556
|
|||
|
|
Consumer Staples Distribution
& Retail — 4.1%
|
|
|||
|
339,949
|
Costco Wholesale Corp.
|
183,021,742
|
|||
|
1,134,465
|
Walmart, Inc.
|
178,315,209
|
|||
|
|
|
361,336,951
|
|||
|
|
Electronic Equipment,
Instruments & Components
— 2.2%
|
|
|||
|
2,240,144
|
Amphenol Corp., Class A
|
190,300,233
|
|||
|
|
Financial Services — 4.0%
|
|
|||
|
458,727
|
Mastercard, Inc., Class A
|
180,417,329
|
|||
|
735,452
|
Visa, Inc., Class A
|
174,655,141
|
|||
|
|
|
355,072,470
|
|||
|
|
Food Products — 1.8%
|
|
|||
|
2,138,295
|
Archer-Daniels-Midland Co.
|
161,569,570
|
|||
|
|
Ground Transportation —
2.1%
|
|
|||
|
5,409,573
|
CSX Corp.
|
184,466,439
|
|||
|
Shares
|
Description
|
Value
|
|||
|
|
|||||
|
|
Health Care Equipment &
Supplies — 3.8%
|
|
|||
|
1,541,577
|
Abbott Laboratories
|
$168,062,725
|
|||
|
2,047,734
|
Hologic, Inc. (a)
|
165,805,022
|
|||
|
|
|
333,867,747
|
|||
|
|
Health Care Providers &
Services — 10.1%
|
|
|||
|
1,032,403
|
AmerisourceBergen Corp.
|
198,665,309
|
|||
|
381,889
|
Elevance Health, Inc.
|
169,669,464
|
|||
|
350,425
|
Humana, Inc.
|
156,685,530
|
|||
|
624,710
|
Molina Healthcare, Inc. (a)
|
188,187,641
|
|||
|
355,778
|
UnitedHealth Group, Inc.
|
171,001,138
|
|||
|
|
|
884,209,082
|
|||
|
|
Household Durables — 4.2%
|
|
|||
|
1,761,309
|
Garmin Ltd.
|
183,686,916
|
|||
|
29,058
|
NVR, Inc. (a)
|
184,536,316
|
|||
|
|
|
368,223,232
|
|||
|
|
Household Products — 1.9%
|
|
|||
|
1,102,919
|
Procter & Gamble (The) Co.
|
167,356,929
|
|||
|
|
Industrial Conglomerates —
2.1%
|
|
|||
|
877,870
|
Honeywell International, Inc.
|
182,158,025
|
|||
|
|
Insurance — 10.4%
|
|
|||
|
2,608,862
|
Aflac, Inc.
|
182,098,568
|
|||
|
515,986
|
Aon PLC, Class A
|
178,118,367
|
|||
|
2,803,461
|
Brown & Brown, Inc.
|
192,990,255
|
|||
|
956,450
|
Marsh & McLennan Cos., Inc.
|
179,889,116
|
|||
|
2,992,572
|
W.R. Berkley Corp.
|
178,237,588
|
|||
|
|
|
911,333,894
|
|||
|
|
Machinery — 4.3%
|
|
|||
|
739,147
|
Cummins, Inc.
|
181,209,278
|
|||
|
2,353,147
|
PACCAR, Inc.
|
196,840,747
|
|||
|
|
|
378,050,025
|
|||
|
|
Media — 2.0%
|
|
|||
|
4,590,204
|
Interpublic Group of (The) Cos.,
Inc.
|
177,090,070
|
|||
|
|
Pharmaceuticals — 9.9%
|
|
|||
|
2,441,945
|
Bristol-Myers Squibb Co.
|
156,162,383
|
|||
|
446,818
|
Eli Lilly & Co.
|
209,548,706
|
|||
|
1,058,041
|
Johnson & Johnson
|
175,126,946
|
|||
|
1,492,006
|
Merck & Co., Inc.
|
172,162,572
|
|||
|
4,280,841
|
Pfizer, Inc.
|
157,021,248
|
|||
|
|
|
870,021,855
|
|||
|
|
Professional Services — 4.0%
|
|
|||
|
799,834
|
Automatic Data Processing, Inc.
|
175,795,515
|
|||
|
1,571,701
|
Paychex, Inc.
|
175,826,191
|
|||
|
|
|
351,621,706
|
|||
Portfolio of Investments (Continued)
June 30, 2023 (Unaudited)
|
Shares
|
Description
|
Value
|
|||
|
COMMON STOCKS (Continued)
|
|||||
|
|
Semiconductors &
Semiconductor Equipment
— 2.0%
|
|
|||
|
972,392
|
Texas Instruments, Inc.
|
$175,050,008
|
|||
|
|
Specialty Retail — 2.1%
|
|
|||
|
2,194,727
|
TJX (The) Cos., Inc.
|
186,090,902
|
|||
|
|
Technology Hardware, Storage
& Peripherals — 2.4%
|
|
|||
|
2,723,187
|
NetApp, Inc.
|
208,051,487
|
|||
|
|
|||||
|
|
|||||
|
|
Total Investments — 100.0%
|
8,789,537,527
|
|||
|
|
(Cost $8,284,433,776)
|
|
|||
|
|
Net Other Assets and
Liabilities — 0.0%
|
4,079,211
|
|||
|
|
Net Assets — 100.0%
|
$8,793,616,738
|
|||
|
(a)
|
Non-income producing security.
|
Valuation Inputs
|
|
Total
Value at
6/30/2023
|
Level 1
Quoted
Prices
|
Level 2
Significant
Observable
Inputs
|
Level 3
Significant
Unobservable
Inputs
|
|
Common
Stocks*
|
$8,789,537,527
|
$8,789,537,527
|
$—
|
$—
|
|
*
|
See Portfolio of Investments for industry breakout.
|
Portfolio of Investments
June 30, 2023 (Unaudited)
|
Shares
|
Description
|
Value
|
|||
|
COMMON STOCKS — 99.9%
|
|||||
|
|
Aerospace & Defense — 2.9%
|
|
|||
|
327,745
|
General Dynamics Corp.
|
$70,514,337
|
|||
|
362,562
|
L3Harris Technologies, Inc.
|
70,978,763
|
|||
|
153,515
|
Lockheed Martin Corp.
|
70,675,235
|
|||
|
155,151
|
Northrop Grumman Corp.
|
70,717,826
|
|||
|
719,948
|
RTX Corp.
|
70,526,106
|
|||
|
|
|
353,412,267
|
|||
|
|
Air Freight & Logistics —
1.2%
|
|
|||
|
750,982
|
C.H. Robinson Worldwide, Inc.
|
70,855,152
|
|||
|
402,377
|
United Parcel Service, Inc.,
Class B
|
72,126,077
|
|||
|
|
|
142,981,229
|
|||
|
|
Automobile Components —
0.6%
|
|
|||
|
2,498,592
|
Gentex Corp.
|
73,108,802
|
|||
|
|
Automobiles — 0.6%
|
|
|||
|
449,763
|
Toyota Motor Corp., ADR
|
72,299,402
|
|||
|
|
Banks — 2.9%
|
|
|||
|
779,009
|
Bank of Montreal
|
70,352,303
|
|||
|
1,623,326
|
Canadian Imperial Bank of
Commerce
|
69,283,554
|
|||
|
499,398
|
JPMorgan Chase & Co.
|
72,632,445
|
|||
|
739,554
|
Royal Bank of Canada
|
70,634,803
|
|||
|
1,152,940
|
Toronto-Dominion (The) Bank
|
71,493,809
|
|||
|
|
|
354,396,914
|
|||
|
|
Beverages — 2.3%
|
|
|||
|
1,135,427
|
Coca-Cola (The) Co.
|
68,375,414
|
|||
|
411,164
|
Diageo PLC, ADR
|
71,328,731
|
|||
|
2,233,642
|
Keurig Dr Pepper, Inc.
|
69,845,985
|
|||
|
375,959
|
PepsiCo, Inc.
|
69,635,126
|
|||
|
|
|
279,185,256
|
|||
|
|
Biotechnology — 1.7%
|
|
|||
|
515,087
|
AbbVie, Inc.
|
69,397,671
|
|||
|
309,306
|
Amgen, Inc.
|
68,672,118
|
|||
|
907,925
|
Gilead Sciences, Inc.
|
69,973,780
|
|||
|
|
|
208,043,569
|
|||
|
|
Building Products — 1.2%
|
|
|||
|
979,716
|
A.O. Smith Corp.
|
71,303,730
|
|||
|
1,053,197
|
Johnson Controls
International PLC
|
71,764,844
|
|||
|
|
|
143,068,574
|
|||
|
|
Capital Markets — 2.4%
|
|
|||
|
388,566
|
CME Group, Inc.
|
71,997,394
|
|||
|
222,536
|
Goldman Sachs Group (The),
Inc.
|
71,776,762
|
|||
|
1,401,146
|
Nasdaq, Inc.
|
69,847,128
|
|||
|
649,512
|
T. Rowe Price Group, Inc.
|
72,758,334
|
|||
|
|
|
286,379,618
|
|||
|
Shares
|
Description
|
Value
|
|||
|
|
|||||
|
|
Chemicals — 3.6%
|
|
|||
|
242,712
|
Air Products and Chemicals, Inc.
|
$72,699,526
|
|||
|
904,734
|
International Flavors &
Fragrances, Inc.
|
72,007,779
|
|||
|
174,693
|
NewMarket Corp.
|
70,247,549
|
|||
|
492,704
|
PPG Industries, Inc.
|
73,068,003
|
|||
|
984,715
|
Sensient Technologies Corp.
|
70,042,778
|
|||
|
749,847
|
Stepan Co.
|
71,655,379
|
|||
|
|
|
429,721,014
|
|||
|
|
Commercial Services &
Supplies — 0.6%
|
|
|||
|
416,883
|
Waste Management, Inc.
|
72,295,850
|
|||
|
|
Communications Equipment
— 1.2%
|
|
|||
|
1,384,402
|
Cisco Systems, Inc.
|
71,628,959
|
|||
|
2,318,578
|
Juniper Networks, Inc.
|
72,641,049
|
|||
|
|
|
144,270,008
|
|||
|
|
Consumer Staples Distribution
& Retail — 0.6%
|
|
|||
|
1,490,052
|
Kroger (The) Co.
|
70,032,444
|
|||
|
|
Containers & Packaging —
2.3%
|
|
|||
|
410,846
|
Avery Dennison Corp.
|
70,583,343
|
|||
|
530,943
|
Packaging Corp. of America
|
70,169,427
|
|||
|
1,493,894
|
Silgan Holdings, Inc.
|
70,048,690
|
|||
|
1,204,070
|
Sonoco Products Co.
|
71,064,211
|
|||
|
|
|
281,865,671
|
|||
|
|
Diversified Telecommunication
Services — 1.8%
|
|
|||
|
1,552,277
|
BCE, Inc.
|
70,768,308
|
|||
|
3,624,134
|
TELUS Corp.
|
70,525,648
|
|||
|
1,924,976
|
Verizon Communications, Inc.
|
71,589,857
|
|||
|
|
|
212,883,813
|
|||
|
|
Electric Utilities — 12.1%
|
|
|||
|
1,175,758
|
ALLETE, Inc.
|
68,158,691
|
|||
|
1,312,271
|
Alliant Energy Corp.
|
68,867,982
|
|||
|
829,682
|
American Electric Power Co.,
Inc.
|
69,859,224
|
|||
|
1,843,301
|
Avangrid, Inc.
|
69,455,582
|
|||
|
765,203
|
Duke Energy Corp.
|
68,669,317
|
|||
|
702,483
|
Entergy Corp.
|
68,400,770
|
|||
|
1,187,004
|
Evergy, Inc.
|
69,344,774
|
|||
|
981,513
|
Eversource Energy
|
69,608,902
|
|||
|
1,713,357
|
Exelon Corp.
|
69,802,164
|
|||
|
1,629,417
|
Fortis, Inc.
|
70,211,579
|
|||
|
1,904,928
|
Hawaiian Electric Industries, Inc.
|
68,958,394
|
|||
|
668,500
|
IDACORP, Inc.
|
68,588,100
|
|||
|
902,033
|
MGE Energy, Inc.
|
71,359,831
|
|||
|
935,672
|
NextEra Energy, Inc.
|
69,426,862
|
|||
|
1,927,645
|
OGE Energy Corp.
|
69,221,732
|
|||
|
933,907
|
Otter Tail Corp.
|
73,741,297
|
|||
Portfolio of Investments (Continued)
June 30, 2023 (Unaudited)
|
Shares
|
Description
|
Value
|
|||
|
COMMON STOCKS (Continued)
|
|||||
|
|
Electric Utilities (Continued)
|
|
|||
|
848,213
|
Pinnacle West Capital Corp.
|
$69,095,431
|
|||
|
1,547,435
|
PNM Resources, Inc.
|
69,789,318
|
|||
|
1,478,328
|
Portland General Electric Co.
|
69,230,100
|
|||
|
969,063
|
Southern (The) Co.
|
68,076,676
|
|||
|
1,105,807
|
Xcel Energy, Inc.
|
68,748,021
|
|||
|
|
|
1,458,614,747
|
|||
|
|
Electrical Equipment — 0.6%
|
|
|||
|
787,123
|
Emerson Electric Co.
|
71,148,048
|
|||
|
|
Electronic Equipment,
Instruments & Components
— 1.2%
|
|
|||
|
1,474,874
|
Avnet, Inc.
|
74,407,393
|
|||
|
518,972
|
TE Connectivity Ltd.
|
72,739,116
|
|||
|
|
|
147,146,509
|
|||
|
|
Food Products — 8.0%
|
|
|||
|
943,931
|
Archer-Daniels-Midland Co.
|
71,323,426
|
|||
|
1,516,712
|
Campbell Soup Co.
|
69,328,906
|
|||
|
2,027,737
|
Conagra Brands, Inc.
|
68,375,292
|
|||
|
2,842,978
|
Flowers Foods, Inc.
|
70,733,293
|
|||
|
849,143
|
General Mills, Inc.
|
65,129,268
|
|||
|
267,834
|
Hershey (The) Co.
|
66,878,150
|
|||
|
1,704,533
|
Hormel Foods Corp.
|
68,556,317
|
|||
|
670,372
|
Ingredion, Inc.
|
71,025,913
|
|||
|
445,297
|
J & J Snack Foods Corp.
|
70,517,233
|
|||
|
458,092
|
J.M. Smucker (The) Co.
|
67,646,446
|
|||
|
1,059,616
|
Kellogg Co.
|
71,418,118
|
|||
|
352,635
|
Lancaster Colony Corp.
|
70,911,372
|
|||
|
745,107
|
McCormick & Co., Inc.
|
64,995,684
|
|||
|
949,214
|
Mondelez International, Inc.,
Class A
|
69,235,669
|
|||
|
|
|
966,075,087
|
|||
|
|
Gas Utilities — 2.9%
|
|
|||
|
597,430
|
Atmos Energy Corp.
|
69,505,006
|
|||
|
571,356
|
Chesapeake Utilities Corp.
|
67,991,364
|
|||
|
1,504,241
|
New Jersey Resources Corp.
|
71,000,175
|
|||
|
903,206
|
ONE Gas, Inc.
|
69,375,253
|
|||
|
1,103,698
|
Spire, Inc.
|
70,018,601
|
|||
|
|
|
347,890,399
|
|||
|
|
Ground Transportation —
1.8%
|
|
|||
|
585,157
|
Canadian National Railway Co.
|
70,844,958
|
|||
|
313,325
|
Norfolk Southern Corp.
|
71,049,577
|
|||
|
345,258
|
Union Pacific Corp.
|
70,646,692
|
|||
|
|
|
212,541,227
|
|||
|
|
Health Care Equipment &
Supplies — 1.7%
|
|
|||
|
640,597
|
Abbott Laboratories
|
69,837,885
|
|||
|
Shares
|
Description
|
Value
|
|||
|
|
|||||
|
|
Health Care Equipment &
Supplies (Continued)
|
|
|||
|
1,554,704
|
Baxter International, Inc.
|
$70,832,314
|
|||
|
798,976
|
Medtronic PLC
|
70,389,786
|
|||
|
|
|
211,059,985
|
|||
|
|
Health Care Providers &
Services — 2.3%
|
|
|||
|
995,147
|
CVS Health Corp.
|
68,794,512
|
|||
|
2,556,485
|
Premier, Inc., Class A
|
70,712,375
|
|||
|
491,623
|
Quest Diagnostics, Inc.
|
69,102,529
|
|||
|
145,100
|
UnitedHealth Group, Inc.
|
69,740,864
|
|||
|
|
|
278,350,280
|
|||
|
|
Hotels, Restaurants & Leisure
— 2.4%
|
|
|||
|
217,736
|
Domino’s Pizza, Inc.
|
73,374,855
|
|||
|
240,447
|
McDonald’s Corp.
|
71,751,789
|
|||
|
707,632
|
Starbucks Corp.
|
70,098,026
|
|||
|
517,847
|
Yum! Brands, Inc.
|
71,747,702
|
|||
|
|
|
286,972,372
|
|||
|
|
Household Durables — 0.6%
|
|
|||
|
678,287
|
Garmin Ltd.
|
70,738,551
|
|||
|
|
Household Products — 3.5%
|
|
|||
|
443,280
|
Clorox (The) Co.
|
70,499,251
|
|||
|
906,978
|
Colgate-Palmolive Co.
|
69,873,585
|
|||
|
509,647
|
Kimberly-Clark Corp.
|
70,361,865
|
|||
|
467,739
|
Procter & Gamble (The) Co.
|
70,974,716
|
|||
|
2,473,696
|
Reynolds Consumer Products,
Inc.
|
69,881,912
|
|||
|
375,631
|
WD-40 Co.
|
70,862,788
|
|||
|
|
|
422,454,117
|
|||
|
|
Industrial Conglomerates —
1.2%
|
|
|||
|
692,271
|
3M Co.
|
69,289,404
|
|||
|
343,128
|
Honeywell International, Inc.
|
71,199,060
|
|||
|
|
|
140,488,464
|
|||
|
|
Insurance — 5.2%
|
|
|||
|
1,028,571
|
Aflac, Inc.
|
71,794,256
|
|||
|
637,950
|
Allstate (The) Corp.
|
69,562,068
|
|||
|
550,103
|
Assurant, Inc.
|
69,158,949
|
|||
|
364,354
|
Chubb Ltd.
|
70,160,006
|
|||
|
330,737
|
Erie Indemnity Co., Class A
|
69,458,077
|
|||
|
204,463
|
Everest Re Group Ltd.
|
69,897,721
|
|||
|
624,536
|
Hanover Insurance Group (The),
Inc.
|
70,591,304
|
|||
|
1,357,370
|
Sun Life Financial, Inc.
|
70,746,125
|
|||
|
403,217
|
Travelers (The) Cos., Inc.
|
70,022,664
|
|||
|
|
|
631,391,170
|
|||
|
|
IT Services — 1.8%
|
|
|||
|
727,787
|
Amdocs Ltd.
|
71,941,745
|
|||
Portfolio of Investments (Continued)
June 30, 2023 (Unaudited)
|
Shares
|
Description
|
Value
|
|||
|
COMMON STOCKS (Continued)
|
|||||
|
|
IT Services (Continued)
|
|
|||
|
1,112,888
|
Cognizant Technology Solutions
Corp., Class A
|
$72,649,329
|
|||
|
4,484,571
|
Infosys Ltd., ADR
|
72,067,056
|
|||
|
|
|
216,658,130
|
|||
|
|
Machinery — 3.0%
|
|
|||
|
293,359
|
Caterpillar, Inc.
|
72,180,982
|
|||
|
296,764
|
Cummins, Inc.
|
72,754,662
|
|||
|
1,130,627
|
Donaldson Co., Inc.
|
70,675,494
|
|||
|
283,405
|
Illinois Tool Works, Inc.
|
70,896,595
|
|||
|
250,229
|
Snap-on, Inc.
|
72,113,495
|
|||
|
|
|
358,621,228
|
|||
|
|
Media — 0.6%
|
|
|||
|
1,713,777
|
Comcast Corp., Class A
|
71,207,434
|
|||
|
|
Multi-Utilities — 6.3%
|
|
|||
|
847,900
|
Ameren Corp.
|
69,247,993
|
|||
|
1,788,754
|
Avista Corp.
|
70,244,370
|
|||
|
1,154,855
|
Black Hills Corp.
|
69,591,562
|
|||
|
1,166,488
|
CMS Energy Corp.
|
68,531,170
|
|||
|
758,192
|
Consolidated Edison, Inc.
|
68,540,557
|
|||
|
1,316,742
|
Dominion Energy, Inc.
|
68,194,068
|
|||
|
629,056
|
DTE Energy Co.
|
69,208,741
|
|||
|
1,219,276
|
NorthWestern Corp.
|
69,206,106
|
|||
|
1,118,435
|
Public Service Enterprise Group,
Inc.
|
70,025,215
|
|||
|
475,939
|
Sempra
|
69,291,959
|
|||
|
781,726
|
WEC Energy Group, Inc.
|
68,979,502
|
|||
|
|
|
761,061,243
|
|||
|
|
Oil, Gas & Consumable Fuels
— 0.6%
|
|
|||
|
1,886,317
|
Enbridge, Inc.
|
70,076,677
|
|||
|
|
Personal Care Products —
0.6%
|
|
|||
|
1,345,808
|
Unilever PLC, ADR
|
70,156,971
|
|||
|
|
Pharmaceuticals — 4.0%
|
|
|||
|
969,063
|
AstraZeneca PLC, ADR
|
69,355,839
|
|||
|
1,072,863
|
Bristol-Myers Squibb Co.
|
68,609,589
|
|||
|
424,803
|
Johnson & Johnson
|
70,313,393
|
|||
|
614,706
|
Merck & Co., Inc.
|
70,930,925
|
|||
|
698,534
|
Novartis AG, ADR
|
70,489,066
|
|||
|
1,884,273
|
Pfizer, Inc.
|
69,115,134
|
|||
|
1,299,756
|
Sanofi, ADR
|
70,056,848
|
|||
|
|
|
488,870,794
|
|||
|
|
Professional Services — 3.5%
|
|
|||
|
322,499
|
Automatic Data Processing, Inc.
|
70,882,055
|
|||
|
638,886
|
Booz Allen Hamilton Holding
Corp.
|
71,299,678
|
|||
|
434,687
|
Broadridge Financial Solutions,
Inc.
|
71,997,208
|
|||
|
1,352,878
|
CSG Systems International, Inc.
|
71,350,786
|
|||
|
Shares
|
Description
|
Value
|
|||
|
|
|||||
|
|
Professional Services
(Continued)
|
|
|||
|
628,206
|
Paychex, Inc.
|
$70,277,405
|
|||
|
967,174
|
Robert Half International, Inc.
|
72,750,828
|
|||
|
|
|
428,557,960
|
|||
|
|
Semiconductors &
Semiconductor Equipment
— 1.8%
|
|
|||
|
373,032
|
Analog Devices, Inc.
|
72,670,364
|
|||
|
694,348
|
Taiwan Semiconductor
Manufacturing Co., Ltd., ADR
|
70,073,600
|
|||
|
411,928
|
Texas Instruments, Inc.
|
74,155,279
|
|||
|
|
|
216,899,243
|
|||
|
|
Software — 1.2%
|
|
|||
|
1,732,576
|
Open Text Corp.
|
71,988,533
|
|||
|
524,890
|
SAP SE, ADR
|
71,810,201
|
|||
|
|
|
143,798,734
|
|||
|
|
Specialized REITs — 1.8%
|
|
|||
|
369,481
|
American Tower Corp.
|
71,657,145
|
|||
|
627,409
|
Crown Castle, Inc.
|
71,486,982
|
|||
|
240,657
|
Public Storage
|
70,242,965
|
|||
|
|
|
213,387,092
|
|||
|
|
Specialty Retail — 1.7%
|
|
|||
|
225,764
|
Home Depot (The), Inc.
|
70,131,329
|
|||
|
318,916
|
Lowe’s Cos., Inc.
|
71,979,341
|
|||
|
317,312
|
Tractor Supply Co.
|
70,157,683
|
|||
|
|
|
212,268,353
|
|||
|
|
Tobacco — 0.6%
|
|
|||
|
1,570,512
|
Altria Group, Inc.
|
71,144,194
|
|||
|
|
Trading Companies &
Distributors — 1.2%
|
|
|||
|
1,207,417
|
Fastenal Co.
|
71,225,529
|
|||
|
191,463
|
Watsco, Inc.
|
73,037,390
|
|||
|
|
|
144,262,919
|
|||
|
|
Water Utilities — 1.2%
|
|
|||
|
819,126
|
American States Water Co.
|
71,263,962
|
|||
|
876,557
|
Middlesex Water Co.
|
70,703,088
|
|||
|
|
|
141,967,050
|
|||
|
|
Wireless Telecommunication
Services — 0.6%
|
|
|||
|
1,552,277
|
Rogers Communications, Inc.,
Class B
|
70,845,922
|
|||
|
|
|||||
|
|
|||||
|
|
Total Investments — 99.9%
|
12,048,599,331
|
|||
|
|
(Cost $11,059,125,202)
|
|
|||
|
|
Net Other Assets and
Liabilities — 0.1%
|
16,052,376
|
|||
|
|
Net Assets — 100.0%
|
$12,064,651,707
|
|||
|
Abbreviations throughout the Portfolio of Investments:
|
|
|
ADR
|
– American Depositary Receipt
|
Portfolio of Investments (Continued)
June 30, 2023 (Unaudited)
Valuation Inputs
|
|
Total
Value at
6/30/2023
|
Level 1
Quoted
Prices
|
Level 2
Significant
Observable
Inputs
|
Level 3
Significant
Unobservable
Inputs
|
|
Common
Stocks*
|
$12,048,599,331
|
$12,048,599,331
|
$—
|
$—
|
|
*
|
See Portfolio of Investments for industry breakout.
|
Statements of Assets and Liabilities
June 30, 2023 (Unaudited)
|
|
First Trust Dow
Jones Select
MicroCap Index
Fund
(FDM)
|
First Trust
Morningstar
Dividend
Leaders Index
Fund
(FDL)
|
First Trust US
Equity
Opportunities
ETF
(FPX)
|
First Trust
NYSE® Arca®
Biotechnology
Index Fund
(FBT)
|
|
ASSETS:
|
|
|
|
|
|
Investments, at value
|
$169,923,489
|
$4,422,833,687
|
$819,959,846
|
$1,415,871,521
|
|
Cash
|
47,397
|
435,195
|
2,600,427
|
1,494,525
|
|
Receivables:
|
|
|
|
|
|
Investment securities sold
|
352,587
|
20,373,341
|
—
|
7,580,186
|
|
Dividends
|
167,796
|
12,468,895
|
232,627
|
—
|
|
Securities lending income
|
15,247
|
—
|
175,635
|
599
|
|
Reclaims
|
268
|
—
|
10,993
|
69,294
|
|
Capital shares sold
|
—
|
—
|
—
|
—
|
|
Prepaid expenses
|
3,345
|
25,080
|
3,808
|
4,693
|
|
Total Assets
|
170,510,129
|
4,456,136,198
|
822,983,336
|
1,425,020,818
|
|
|
||||
|
LIABILITIES:
|
|
|
|
|
|
Payables:
|
|
|
|
|
|
Collateral for securities on loan
|
15,052,805
|
—
|
31,258,152
|
4,702,420
|
|
Investment securities purchased
|
380,185
|
—
|
2,302,236
|
—
|
|
Licensing fees
|
60,464
|
1,057,918
|
178,984
|
293,377
|
|
Investment advisory fees
|
54,991
|
1,137,842
|
255,990
|
484,363
|
|
Audit and tax fees
|
13,602
|
14,885
|
14,915
|
15,238
|
|
Shareholder reporting fees
|
10,888
|
77,790
|
67,032
|
66,103
|
|
Capital shares redeemed
|
—
|
20,419,268
|
—
|
7,583,318
|
|
Other liabilities
|
28,927
|
635,610
|
150,170
|
246,235
|
|
Total Liabilities
|
15,601,862
|
23,343,313
|
34,227,479
|
13,391,054
|
|
NET ASSETS
|
$154,908,267
|
$4,432,792,885
|
$788,755,857
|
$1,411,629,764
|
|
|
||||
|
NET ASSETS consist of:
|
|
|
|
|
|
Paid-in capital
|
$216,573,594
|
$5,000,403,703
|
$1,354,019,785
|
$1,972,338,011
|
|
Par value
|
27,550
|
1,302,500
|
89,500
|
92,500
|
|
Accumulated distributable earnings (loss)
|
(61,692,877
)
|
(568,913,318
)
|
(565,353,428
)
|
(560,800,747
)
|
|
NET ASSETS
|
$154,908,267
|
$4,432,792,885
|
$788,755,857
|
$1,411,629,764
|
|
NET ASSET VALUE, per share
|
$56.23
|
$34.03
|
$88.13
|
$152.61
|
|
Number of shares outstanding (unlimited number of
shares authorized, par value $0.01 per share)
|
2,755,000
|
130,250,002
|
8,950,002
|
9,250,002
|
|
Investments, at cost
|
$178,725,266
|
$4,627,156,018
|
$737,267,450
|
$1,324,952,901
|
|
Securities on loan, at value
|
$14,660,003
|
$—
|
$31,344,815
|
$4,679,031
|
|
First Trust Dow
Jones Internet
Index Fund
(FDN)
|
First Trust
Capital Strength
ETF
(FTCS)
|
First Trust
Value Line®
Dividend Index
Fund
(FVD)
|
|
|
|
|
|
$5,374,726,191
|
$8,789,537,527
|
$12,048,599,331
|
|
—
|
3,573,890
|
11,100,093
|
|
|
|
|
|
48,382,825
|
11,134,996
|
3,969,432
|
|
9,024
|
5,163,245
|
20,374,056
|
|
76
|
—
|
—
|
|
—
|
—
|
3,329,924
|
|
32,343,482
|
—
|
3,973,229
|
|
3,554
|
120,851
|
44,701
|
|
5,455,465,152
|
8,809,530,509
|
12,091,390,766
|
|
|
||
|
|
|
|
|
|
|
|
|
—
|
—
|
—
|
|
32,341,894
|
—
|
9,222,647
|
|
677,911
|
—
|
7,021,791
|
|
1,608,745
|
3,435,748
|
4,696,396
|
|
22,188
|
21,008
|
23,602
|
|
386,078
|
237,317
|
343,638
|
|
48,385,760
|
11,146,004
|
3,973,229
|
|
649,652
|
1,073,694
|
1,457,756
|
|
84,072,228
|
15,913,771
|
26,739,059
|
|
$5,371,392,924
|
$8,793,616,738
|
$12,064,651,707
|
|
|
||
|
|
|
|
|
$7,296,035,451
|
$9,069,155,108
|
$11,647,761,293
|
|
329,500
|
1,170,500
|
3,009,909
|
|
(1,924,972,027
)
|
(276,708,870
)
|
413,880,505
|
|
$5,371,392,924
|
$8,793,616,738
|
$12,064,651,707
|
|
$163.02
|
$75.13
|
$40.08
|
|
32,950,002
|
117,050,002
|
300,990,884
|
|
$6,329,472,858
|
$8,284,433,776
|
$11,059,125,202
|
|
$—
|
$—
|
$—
|
Statements of Operations
For the Six Months Ended June 30, 2023 (Unaudited)
|
|
First Trust Dow
Jones Select
MicroCap Index
Fund
(FDM)
|
First Trust
Morningstar
Dividend
Leaders Index
Fund
(FDL)
|
First Trust US
Equity
Opportunities
ETF
(FPX)
|
|
INVESTMENT INCOME:
|
|
|
|
|
Dividends
|
$2,203,366
|
$121,961,208
|
$2,851,222
|
|
Securities lending income (net of fees)
|
78,624
|
—
|
699,162
|
|
Foreign withholding tax
|
(828
)
|
—
|
—
|
|
Total investment income
|
2,281,162
|
121,961,208
|
3,550,384
|
|
|
|||
|
EXPENSES:
|
|
|
|
|
Investment advisory fees
|
366,900
|
7,338,148
|
1,571,551
|
|
Licensing fees
|
44,028
|
2,241,503
|
392,888
|
|
Accounting and administration fees
|
38,637
|
913,511
|
197,321
|
|
Shareholder reporting fees
|
14,636
|
188,776
|
57,998
|
|
Audit and tax fees
|
14,248
|
14,633
|
14,706
|
|
Listing fees
|
3,874
|
4,834
|
3,874
|
|
Transfer agent fees
|
3,669
|
74,359
|
19,644
|
|
Trustees’ fees and expenses
|
3,659
|
5,638
|
3,843
|
|
Custodian fees
|
3,238
|
36,249
|
7,488
|
|
Legal fees
|
1,507
|
35,246
|
10,419
|
|
Other expenses
|
1,685
|
26,018
|
8,456
|
|
Total expenses
|
496,081
|
10,878,915
|
2,288,188
|
|
Less fees waived and expenses reimbursed by the investment advisor
|
(55,782
)
|
—
|
—
|
|
Net expenses
|
440,299
|
10,878,915
|
2,288,188
|
|
NET INVESTMENT INCOME (LOSS)
|
1,840,863
|
111,082,293
|
1,262,196
|
|
|
|||
|
NET REALIZED AND UNREALIZED GAIN (LOSS):
|
|
|
|
|
Net realized gain (loss) on:
|
|
|
|
|
Investments
|
(82,408
)
|
(179,264,595
)
|
(47,554,369
)
|
|
In-kind redemptions
|
2,025,416
|
229,074,979
|
14,516,292
|
|
Foreign currency transactions
|
—
|
—
|
—
|
|
Net realized gain (loss)
|
1,943,008
|
49,810,384
|
(33,038,077
)
|
|
Net change in unrealized appreciation (depreciation) on:
|
|
|
|
|
Investments
|
1,351,560
|
(429,176,981
)
|
122,254,649
|
|
Foreign currency translation
|
—
|
—
|
—
|
|
Net change in unrealized appreciation (depreciation)
|
1,351,560
|
(429,176,981
)
|
122,254,649
|
|
NET REALIZED AND UNREALIZED GAIN (LOSS)
|
3,294,568
|
(379,366,597
)
|
89,216,572
|
|
NET INCREASE (DECREASE) IN NET ASSETS RESULTING
FROM OPERATIONS
|
$5,135,431
|
$(268,284,304
)
|
$90,478,768
|
|
First Trust
NYSE® Arca®
Biotechnology
Index Fund
(FBT)
|
First Trust Dow
Jones Internet
Index Fund
(FDN)
|
First Trust
Capital Strength
ETF
(FTCS)
|
First Trust
Value Line®
Dividend Index
Fund
(FVD)
|
|
|
|
|
|
|
$1,846,463
|
$4,970,812
|
$88,438,181
|
$191,146,144
|
|
1,977
|
1,215
|
—
|
—
|
|
—
|
—
|
—
|
(4,848,392
)
|
|
1,848,440
|
4,972,027
|
88,438,181
|
186,297,752
|
|
|
|||
|
|
|
|
|
|
2,950,184
|
8,031,702
|
20,769,964
|
28,875,506
|
|
590,037
|
1,124,324
|
3,719
|
7,627,484
|
|
345,267
|
781,417
|
1,325,360
|
1,726,858
|
|
73,230
|
288,530
|
293,485
|
412,707
|
|
14,674
|
16,966
|
16,667
|
17,762
|
|
3,874
|
5,188
|
2,251
|
19,451
|
|
30,836
|
63,098
|
119,643
|
164,208
|
|
4,173
|
4,894
|
6,505
|
7,936
|
|
43,473
|
162,937
|
107,732
|
50,083
|
|
13,897
|
44,041
|
84,161
|
122,818
|
|
9,845
|
35,018
|
63,332
|
93,778
|
|
4,079,490
|
10,558,115
|
22,792,819
|
39,118,591
|
|
—
|
—
|
—
|
—
|
|
4,079,490
|
10,558,115
|
22,792,819
|
39,118,591
|
|
(2,231,050
)
|
(5,586,088
)
|
65,645,362
|
147,179,161
|
|
|
|||
|
|
|
|
|
|
|
|
|
|
|
(30,019,279
)
|
(348,912,369
)
|
(134,663,890
)
|
(1,995,864
)
|
|
23,947,358
|
176,060,172
|
210,751,111
|
234,465,127
|
|
—
|
—
|
—
|
(11,955
)
|
|
(6,071,921
)
|
(172,852,197
)
|
76,087,221
|
232,457,308
|
|
|
|
|
|
|
(8,953,364
)
|
1,307,950,463
|
(34,576,105
)
|
(174,574,184
)
|
|
—
|
—
|
—
|
333
|
|
(8,953,364
)
|
1,307,950,463
|
(34,576,105
)
|
(174,573,851
)
|
|
(15,025,285
)
|
1,135,098,266
|
41,511,116
|
57,883,457
|
|
$(17,256,335
)
|
$1,129,512,178
|
$107,156,478
|
$205,062,618
|
Statements of Changes in Net Assets
|
|
First Trust Dow Jones Select
MicroCap Index Fund (FDM)
|
First Trust Morningstar Dividend
Leaders Index Fund (FDL)
|
||
|
|
Six Months
Ended
6/30/2023
(Unaudited)
|
Year
Ended
12/31/2022
|
Six Months
Ended
6/30/2023
(Unaudited)
|
Year
Ended
12/31/2022
|
|
OPERATIONS:
|
|
|
|
|
|
Net investment income (loss)
|
$1,840,863
|
$2,691,970
|
$111,082,293
|
$122,503,215
|
|
Net realized gain (loss)
|
1,943,008
|
8,379,423
|
49,810,384
|
35,160,034
|
|
Net change in unrealized appreciation (depreciation)
|
1,351,560
|
(34,793,960
)
|
(429,176,981
)
|
(5,208,289
)
|
|
Net increase (decrease) in net assets resulting from
operations
|
5,135,431
|
(23,722,567
)
|
(268,284,304
)
|
152,454,960
|
|
|
||||
|
DISTRIBUTIONS TO SHAREHOLDERS FROM:
|
|
|
|
|
|
Investment operations
|
(1,587,186
)
|
(2,696,103
)
|
(104,482,507
)
|
(122,518,973
)
|
|
|
||||
|
SHAREHOLDER TRANSACTIONS:
|
|
|
|
|
|
Proceeds from shares sold
|
18,511,285
|
113,413,517
|
1,709,231,253
|
3,837,574,234
|
|
Cost of shares redeemed
|
(11,592,813
)
|
(131,289,899
)
|
(1,705,488,963
)
|
(828,602,429
)
|
|
Net increase (decrease) in net assets resulting from
shareholder transactions
|
6,918,472
|
(17,876,382
)
|
3,742,290
|
3,008,971,805
|
|
Total increase (decrease) in net assets
|
10,466,717
|
(44,295,052
)
|
(369,024,521
)
|
3,038,907,792
|
|
|
||||
|
NET ASSETS:
|
|
|
|
|
|
Beginning of period
|
144,441,550
|
188,736,602
|
4,801,817,406
|
1,762,909,614
|
|
End of period
|
$154,908,267
|
$144,441,550
|
$4,432,792,885
|
$4,801,817,406
|
|
|
||||
|
CHANGES IN SHARES OUTSTANDING:
|
|
|
|
|
|
Shares outstanding, beginning of period
|
2,605,000
|
2,955,000
|
131,400,002
|
49,600,002
|
|
Shares sold
|
350,000
|
1,900,000
|
48,050,000
|
105,600,000
|
|
Shares redeemed
|
(200,000
)
|
(2,250,000
)
|
(49,200,000
)
|
(23,800,000
)
|
|
Shares outstanding, end of period
|
2,755,000
|
2,605,000
|
130,250,002
|
131,400,002
|
|
First Trust US Equity Opportunities
ETF (FPX)
|
First Trust NYSE® Arca®
Biotechnology Index Fund (FBT)
|
First Trust Dow Jones Internet Index
Fund (FDN)
|
|||
|
Six Months
Ended
6/30/2023
(Unaudited)
|
Year
Ended
12/31/2022
|
Six Months
Ended
6/30/2023
(Unaudited)
|
Year
Ended
12/31/2022
|
Six Months
Ended
6/30/2023
(Unaudited)
|
Year
Ended
12/31/2022
|
|
|
|
|
|
|
|
|
$1,262,196
|
$9,971,724
|
$(2,231,050
)
|
$(3,533,844
)
|
$(5,586,088
)
|
$(13,722,408
)
|
|
(33,038,077
)
|
(201,088,840
)
|
(6,071,921
)
|
(231,261,606
)
|
(172,852,197
)
|
400,961,949
|
|
122,254,649
|
(386,182,483
)
|
(8,953,364
)
|
140,025,277
|
1,307,950,463
|
(4,159,637,254
)
|
|
90,478,768
|
(577,299,599
)
|
(17,256,335
)
|
(94,770,173
)
|
1,129,512,178
|
(3,772,397,713
)
|
|
|
|||||
|
|
|
|
|
|
|
|
(1,740,325
)
|
(9,427,777
)
|
—
|
—
|
—
|
—
|
|
|
|||||
|
|
|
|
|
|
|
|
—
|
49,560,039
|
31,166,011
|
126,254,644
|
1,989,355,579
|
2,488,710,947
|
|
(103,076,336
)
|
(515,443,931
)
|
(85,634,989
)
|
(256,885,942
)
|
(1,300,314,693
)
|
(5,131,046,629
)
|
|
(103,076,336
)
|
(465,883,892
)
|
(54,468,978
)
|
(130,631,298
)
|
689,040,886
|
(2,642,335,682
)
|
|
(14,337,893
)
|
(1,052,611,268
)
|
(71,725,313
)
|
(225,401,471
)
|
1,818,553,064
|
(6,414,733,395
)
|
|
|
|||||
|
|
|
|
|
|
|
|
803,093,750
|
1,855,705,018
|
1,483,355,077
|
1,708,756,548
|
3,552,839,860
|
9,967,573,255
|
|
$788,755,857
|
$803,093,750
|
$1,411,629,764
|
$1,483,355,077
|
$5,371,392,924
|
$3,552,839,860
|
|
|
|||||
|
|
|
|
|
|
|
|
10,200,002
|
15,150,002
|
9,600,002
|
10,550,002
|
28,850,002
|
44,100,002
|
|
—
|
500,000
|
200,000
|
850,000
|
12,900,000
|
17,850,000
|
|
(1,250,000
)
|
(5,450,000
)
|
(550,000
)
|
(1,800,000
)
|
(8,800,000
)
|
(33,100,000
)
|
|
8,950,002
|
10,200,002
|
9,250,002
|
9,600,002
|
32,950,002
|
28,850,002
|
Statements of Changes in Net Assets (Continued)
|
|
First Trust Capital Strength ETF
(FTCS)
|
First Trust Value Line® Dividend
Index Fund (FVD)
|
||
|
|
Six Months
Ended
6/30/2023
(Unaudited)
|
Year
Ended
12/31/2022
|
Six Months
Ended
6/30/2023
(Unaudited)
|
Year
Ended
12/31/2022
|
|
OPERATIONS:
|
|
|
|
|
|
Net investment income (loss)
|
$65,645,362
|
$101,795,857
|
$147,179,161
|
$251,184,769
|
|
Net realized gain (loss)
|
76,087,221
|
(117,550,809
)
|
232,457,308
|
494,800,079
|
|
Net change in unrealized appreciation (depreciation)
|
(34,576,105
)
|
(1,009,131,344
)
|
(174,573,851
)
|
(1,448,623,545
)
|
|
Net increase (decrease) in net assets resulting from
operations
|
107,156,478
|
(1,024,886,296
)
|
205,062,618
|
(702,638,697
)
|
|
|
||||
|
DISTRIBUTIONS TO SHAREHOLDERS FROM:
|
|
|
|
|
|
Investment operations
|
(61,957,871
)
|
(104,442,497
)
|
(143,239,597
)
|
(255,493,903
)
|
|
|
||||
|
SHAREHOLDER TRANSACTIONS:
|
|
|
|
|
|
Proceeds from shares sold
|
1,887,952,465
|
3,134,829,083
|
641,387,540
|
2,857,719,852
|
|
Cost of shares redeemed
|
(1,831,681,935
)
|
(2,805,284,887
)
|
(1,081,229,649
)
|
(2,411,103,178
)
|
|
Net increase (decrease) in net assets resulting from
shareholder transactions
|
56,270,530
|
329,544,196
|
(439,842,109
)
|
446,616,674
|
|
Total increase (decrease) in net assets
|
101,469,137
|
(799,784,597
)
|
(378,019,088
)
|
(511,515,926
)
|
|
|
||||
|
NET ASSETS:
|
|
|
|
|
|
Beginning of period
|
8,692,147,601
|
9,491,932,198
|
12,442,670,795
|
12,954,186,721
|
|
End of period
|
$8,793,616,738
|
$8,692,147,601
|
$12,064,651,707
|
$12,442,670,795
|
|
|
||||
|
CHANGES IN SHARES OUTSTANDING:
|
|
|
|
|
|
Shares outstanding, beginning of period
|
116,100,002
|
112,300,002
|
311,940,884
|
301,240,884
|
|
Shares sold
|
25,450,000
|
40,300,000
|
16,000,000
|
70,050,000
|
|
Shares redeemed
|
(24,500,000
)
|
(36,500,000
)
|
(26,950,000
)
|
(59,350,000
)
|
|
Shares outstanding, end of period
|
117,050,002
|
116,100,002
|
300,990,884
|
311,940,884
|
Financial Highlights
For a share outstanding throughout each period
|
|
Six Months
Ended
6/30/2023
(Unaudited)
|
Year Ended December 31,
|
||||
|
|
2022
|
2021
|
2020
|
2019
|
2018
|
|
|
Net asset value, beginning of period
|
$55.45
|
$63.87
|
$47.94
|
$51.09
|
$40.76
|
$47.21
|
|
Income from investment operations:
|
|
|
|
|
|
|
|
Net investment income (loss)
|
0.68
(a)
|
1.00
|
0.64
|
0.80
|
0.66
|
0.56
|
|
Net realized and unrealized gain (loss)
|
0.69
|
(8.42
)
|
15.98
|
(3.15
)
|
10.37
|
(6.50
)
|
|
Total from investment operations
|
1.37
|
(7.42
)
|
16.62
|
(2.35
)
|
11.03
|
(5.94
)
|
|
Distributions paid to shareholders from:
|
|
|
|
|
|
|
|
Net investment income
|
(0.59
)
|
(1.00
)
|
(0.69
)
|
(0.80
)
|
(0.70
)
|
(0.51
)
|
|
Net asset value, end of period
|
$56.23
|
$55.45
|
$63.87
|
$47.94
|
$51.09
|
$40.76
|
|
Total return (b)
|
2.49
%
|
(11.56
)%
|
34.71
%
|
(4.25
)%
|
27.25
%
|
(12.68
)%
|
|
|
||||||
|
Ratios to average net assets/supplemental
data:
|
|
|
|
|
|
|
|
Net assets, end of period (in 000’s)
|
$154,908
|
$144,442
|
$188,737
|
$122,482
|
$156,067
|
$138,777
|
|
Ratio of total expenses to average net assets
|
0.68
% (c)
|
0.69
%
|
0.69
%
|
0.71
%
|
0.70
%
|
0.73
%
|
|
Ratio of net expenses to average net assets
|
0.60
% (c)
|
0.60
%
|
0.60
%
|
0.60
%
|
0.60
%
|
0.60
%
|
|
Ratio of net investment income (loss) to
average net assets
|
2.51
% (c)
|
1.72
%
|
1.10
%
|
1.88
%
|
1.42
%
|
1.29
%
|
|
Portfolio turnover rate (d)
|
7
%
|
84
%
|
95
%
|
95
%
|
64
%
|
75
%
|
|
(a)
|
Based on average shares outstanding.
|
|
(b)
|
Total return is calculated assuming an initial investment made at the net asset value at the beginning of the period, reinvestment
of all
distributions at net asset value during the period, and redemption at net asset value on the last day of the period. The returns
presented do not
reflect the deduction of taxes that a shareholder would pay on Fund distributions or the redemption or sale of Fund shares.
Total return is
calculated for the time period presented and is not annualized for periods of less than a year. The total returns would have
been lower if certain
fees had not been waived and expenses reimbursed by the investment advisor.
|
|
(c)
|
Annualized.
|
|
(d)
|
Portfolio turnover is calculated for the time period presented and is not annualized for periods of less than a year and does
not include securities
received or delivered from processing creations or redemptions and in-kind transactions.
|
Financial Highlights (Continued)
For a share outstanding throughout each period
|
|
Six Months
Ended
6/30/2023
(Unaudited)
|
Year Ended December 31,
|
||||
|
|
2022
|
2021
|
2020
|
2019
|
2018
|
|
|
Net asset value, beginning of
period
|
$36.54
|
$35.54
|
$29.59
|
$32.58
|
$27.24
|
$30.06
|
|
Income from investment
operations:
|
|
|
|
|
|
|
|
Net investment income (loss)
|
0.80
(a)
|
1.30
|
1.29
|
1.32
|
1.22
|
1.09
|
|
Net realized and unrealized gain
(loss)
|
(2.54
)
|
1.01
|
5.95
|
(2.98
)
|
5.34
|
(2.83
)
|
|
Total from investment operations
|
(1.74
)
|
2.31
|
7.24
|
(1.66
)
|
6.56
|
(1.74
)
|
|
Distributions paid to
shareholders from:
|
|
|
|
|
|
|
|
Net investment income
|
(0.77
)
|
(1.31
)
|
(1.29
)
|
(1.33
)
|
(1.22
)
|
(1.08
)
|
|
Net asset value, end of period
|
$34.03
|
$36.54
|
$35.54
|
$29.59
|
$32.58
|
$27.24
|
|
Total return (b)
|
(4.80
)%
|
6.71
%
|
24.76
%
|
(4.42
)%
|
24.36
%
|
(5.87
)%
|
|
|
||||||
|
Ratios to average net
assets/supplemental data:
|
|
|
|
|
|
|
|
Net assets, end of period (in 000’s)
|
$4,432,793
|
$4,801,817
|
$1,762,910
|
$1,399,483
|
$1,841,000
|
$1,386,483
|
|
Ratio of total expenses to average
net assets
|
0.44
% (c)
|
0.45
%
|
0.46
%
|
0.46
%
|
0.46
%
|
0.47
%
|
|
Ratio of net expenses to average
net assets
|
0.44
% (c)
|
0.45
%
|
0.45
%
|
0.45
%
|
0.45
%
|
0.45
%
|
|
Ratio of net investment income
(loss) to average net assets
|
4.48
% (c)
|
4.15
%
|
3.90
%
|
4.73
%
|
4.06
%
|
3.70
%
|
|
Portfolio turnover rate (d)
|
33
%
|
60
%
|
59
%
|
63
%
|
39
%
|
39
%
|
|
(a)
|
Based on average shares outstanding.
|
|
(b)
|
Total return is calculated assuming an initial investment made at the net asset value at the beginning of the period, reinvestment
of all
distributions at net asset value during the period, and redemption at net asset value on the last day of the period. The returns
presented do not
reflect the deduction of taxes that a shareholder would pay on Fund distributions or the redemption or sale of Fund shares.
Total return is
calculated for the time period presented and is not annualized for periods of less than a year. The total returns would have
been lower if certain
fees had not been waived and expenses reimbursed by the investment advisor.
|
|
(c)
|
Annualized.
|
|
(d)
|
Portfolio turnover is calculated for the time period presented and is not annualized for periods of less than a year and does
not include securities
received or delivered from processing creations or redemptions and in-kind transactions.
|
Financial Highlights (Continued)
For a share outstanding throughout each period
|
|
Six Months
Ended
6/30/2023
(Unaudited)
|
Year Ended December 31,
|
||||
|
|
2022
|
2021
|
2020
|
2019
|
2018
|
|
|
Net asset value, beginning of period
|
$78.73
|
$122.49
|
$118.32
|
$80.41
|
$62.07
|
$68.18
|
|
Income from investment operations:
|
|
|
|
|
|
|
|
Net investment income (loss)
|
0.13
(a)
|
0.90
|
0.08
|
0.24
|
0.58
|
0.52
|
|
Net realized and unrealized gain (loss)
|
9.45
|
(43.81
)
|
4.26
|
38.01
|
18.30
|
(6.08
)
|
|
Total from investment operations
|
9.58
|
(42.91
)
|
4.34
|
38.25
|
18.88
|
(5.56
)
|
|
Distributions paid to shareholders
from:
|
|
|
|
|
|
|
|
Net investment income
|
(0.18
)
|
(0.85
)
|
(0.17
)
|
(0.34
)
|
(0.54
)
|
(0.55
)
|
|
Net asset value, end of period
|
$88.13
|
$78.73
|
$122.49
|
$118.32
|
$80.41
|
$62.07
|
|
Total return (b)
|
12.18
%
|
(35.05
)%
|
3.67
%
|
47.76
%
|
30.45
%
|
(8.22
)%
|
|
|
||||||
|
Ratios to average net
assets/supplemental data:
|
|
|
|
|
|
|
|
Net assets, end of period (in 000’s)
|
$788,756
|
$803,094
|
$1,855,705
|
$1,946,373
|
$1,330,835
|
$912,479
|
|
Ratio of total expenses to average net
assets
|
0.58
% (c)
|
0.58
%
|
0.57
%
|
0.57
%
|
0.58
%
|
0.59
%
|
|
Ratio of net investment income (loss) to
average net assets
|
0.32
% (c)
|
0.86
%
|
0.07
%
|
0.26
%
|
0.79
%
|
0.74
%
|
|
Portfolio turnover rate (d)
|
78
%
|
115
%
|
85
%
|
75
%
|
81
%
|
57
%
|
|
(a)
|
Based on average shares outstanding.
|
|
(b)
|
Total return is calculated assuming an initial investment made at the net asset value at the beginning of the period, reinvestment
of all
distributions at net asset value during the period, and redemption at net asset value on the last day of the period. The returns
presented do not
reflect the deduction of taxes that a shareholder would pay on Fund distributions or the redemption or sale of Fund shares.
Total return is
calculated for the time period presented and is not annualized for periods of less than a year.
|
|
(c)
|
Annualized.
|
|
(d)
|
Portfolio turnover is calculated for the time period presented and is not annualized for periods of less than a year and does
not include securities
received or delivered from processing creations or redemptions and in-kind transactions.
|
Financial Highlights (Continued)
For a share outstanding throughout each period
|
|
Six Months
Ended
6/30/2023
(Unaudited)
|
Year Ended December 31,
|
||||
|
|
2022
|
2021
|
2020
|
2019
|
2018
|
|
|
Net asset value, beginning of
period
|
$154.52
|
$161.97
|
$168.08
|
$148.84
|
$124.26
|
$124.52
|
|
Income from investment
operations:
|
|
|
|
|
|
|
|
Net investment income (loss)
|
(0.24
) (a)
|
(0.37
)
|
(0.42
)
|
(0.45
)
|
(0.51
)
|
(0.22
)
|
|
Net realized and unrealized gain
(loss)
|
(1.67
)
|
(7.08
)
|
(5.69
)
|
19.69
|
25.09
|
(0.04
)
|
|
Total from investment operations
|
(1.91
)
|
(7.45
)
|
(6.11
)
|
19.24
|
24.58
|
(0.26
)
|
|
Net asset value, end of period
|
$152.61
|
$154.52
|
$161.97
|
$168.08
|
$148.84
|
$124.26
|
|
Total return (b)
|
(1.24
)%
|
(4.60
)%
|
(3.64
)%
|
12.93
%
|
19.78
%
|
(0.21
)%
|
|
|
||||||
|
Ratios to average net
assets/supplemental data:
|
|
|
|
|
|
|
|
Net assets, end of period (in 000’s)
|
$1,411,630
|
$1,483,355
|
$1,708,757
|
$2,042,173
|
$1,800,927
|
$2,342,213
|
|
Ratio of total expenses to average
net assets
|
0.55
% (c)
|
0.56
%
|
0.55
%
|
0.55
%
|
0.55
%
|
0.57
%
|
|
Ratio of net investment income
(loss) to average net assets
|
(0.30
)% (c)
|
(0.25
)%
|
(0.23
)%
|
(0.28
)%
|
(0.25
)%
|
(0.21
)%
|
|
Portfolio turnover rate (d)
|
12
%
|
39
%
|
39
%
|
26
%
|
31
%
|
37
%
|
|
(a)
|
Based on average shares outstanding.
|
|
(b)
|
Total return is calculated assuming an initial investment made at the net asset value at the beginning of the period, reinvestment
of all
distributions at net asset value during the period, and redemption at net asset value on the last day of the period. The returns
presented do not
reflect the deduction of taxes that a shareholder would pay on Fund distributions or the redemption or sale of Fund shares.
Total return is
calculated for the time period presented and is not annualized for periods of less than a year.
|
|
(c)
|
Annualized.
|
|
(d)
|
Portfolio turnover is calculated for the time period presented and is not annualized for periods of less than a year and does
not include securities
received or delivered from processing creations or redemptions and in-kind transactions.
|
Financial Highlights (Continued)
For a share outstanding throughout each period
|
|
Six Months
Ended
6/30/2023
(Unaudited)
|
Year Ended December 31,
|
||||
|
|
2022
|
2021
|
2020
|
2019
|
2018
|
|
|
Net asset value, beginning of
period
|
$123.15
|
$226.02
|
$212.37
|
$139.12
|
$116.66
|
$109.82
|
|
Income from investment
operations:
|
|
|
|
|
|
|
|
Net investment income (loss)
|
(0.19
) (a)
|
(0.48
)
|
(0.73
)
|
(0.34
)
|
(0.14
)
|
(0.35
)
|
|
Net realized and unrealized gain
(loss)
|
40.06
|
(102.39
)
|
14.38
|
73.59
|
22.60
|
7.19
|
|
Total from investment operations
|
39.87
|
(102.87
)
|
13.65
|
73.25
|
22.46
|
6.84
|
|
Net asset value, end of period
|
$163.02
|
$123.15
|
$226.02
|
$212.37
|
$139.12
|
$116.66
|
|
Total return (b)
|
32.37
%
|
(45.51
)%
|
6.43
%
|
52.65
%
|
19.26
%
|
6.23
%
|
|
|
||||||
|
Ratios to average net
assets/supplemental data:
|
|
|
|
|
|
|
|
Net assets, end of period (in
000’s)
|
$5,371,393
|
$3,552,840
|
$9,967,573
|
$11,075,029
|
$7,853,367
|
$7,016,807
|
|
Ratio of total expenses to average
net assets
|
0.52
% (c)
|
0.52
%
|
0.51
%
|
0.51
%
|
0.52
%
|
0.52
%
|
|
Ratio of net investment income
(loss) to average net assets
|
(0.28
)% (c)
|
(0.26
)%
|
(0.30
)%
|
(0.20
)%
|
(0.10
)%
|
(0.27
)%
|
|
Portfolio turnover rate (d)
|
14
%
|
24
%
|
19
%
|
39
%
|
28
%
|
21
%
|
|
(a)
|
Based on average shares outstanding.
|
|
(b)
|
Total return is calculated assuming an initial investment made at the net asset value at the beginning of the period, reinvestment
of all
distributions at net asset value during the period, and redemption at net asset value on the last day of the period. The returns
presented do not
reflect the deduction of taxes that a shareholder would pay on Fund distributions or the redemption or sale of Fund shares.
Total return is
calculated for the time period presented and is not annualized for periods of less than a year.
|
|
(c)
|
Annualized.
|
|
(d)
|
Portfolio turnover is calculated for the time period presented and is not annualized for periods of less than a year and does
not include securities
received or delivered from processing creations or redemptions and in-kind transactions.
|
Financial Highlights (Continued)
For a share outstanding throughout each period
|
|
Six Months
Ended
6/30/2023
(Unaudited)
|
Year Ended December 31,
|
||||
|
|
2022
|
2021
|
2020
|
2019
|
2018
|
|
|
Net asset value, beginning of
period
|
$74.87
|
$84.52
|
$67.55
|
$60.37
|
$48.29
|
$50.95
|
|
Income from investment
operations:
|
|
|
|
|
|
|
|
Net investment income (loss)
|
0.56
(a)
|
0.90
|
0.91
|
0.63
|
0.76
|
0.60
|
|
Net realized and unrealized gain
(loss)
|
0.23
|
(9.63
)
|
16.95
|
7.18
|
12.08
|
(2.65
)
|
|
Total from investment operations
|
0.79
|
(8.73
)
|
17.86
|
7.81
|
12.84
|
(2.05
)
|
|
Distributions paid to
shareholders from:
|
|
|
|
|
|
|
|
Net investment income
|
(0.53
)
|
(0.92
)
|
(0.89
)
|
(0.63
)
|
(0.76
)
|
(0.61
)
|
|
Net asset value, end of period
|
$75.13
|
$74.87
|
$84.52
|
$67.55
|
$60.37
|
$48.29
|
|
Total return (b)
|
1.05
%
|
(10.28
)%
|
26.61
%
|
13.07
%
|
26.72
%
|
(4.09
)%
|
|
|
||||||
|
Ratios to average net
assets/supplemental data:
|
|
|
|
|
|
|
|
Net assets, end of period (in 000’s)
|
$8,793,617
|
$8,692,148
|
$9,491,932
|
$7,021,909
|
$3,392,623
|
$1,376,131
|
|
Ratio of total expenses to average
net assets
|
0.53
% (c)
|
0.55
%
|
0.55
%
|
0.56
%
|
0.58
%
|
0.60
%
|
|
Ratio of net investment income
(loss) to average net assets
|
1.53
% (c)
|
1.21
%
|
1.23
%
|
1.10
%
|
1.46
%
|
1.30
%
|
|
Portfolio turnover rate (d)
|
53
%
|
135
%
|
117
%
|
133
%
|
125
%
|
117
%
|
|
(a)
|
Based on average shares outstanding.
|
|
(b)
|
Total return is calculated assuming an initial investment made at the net asset value at the beginning of the period, reinvestment
of all
distributions at net asset value during the period, and redemption at net asset value on the last day of the period. The returns
presented do not
reflect the deduction of taxes that a shareholder would pay on Fund distributions or the redemption or sale of Fund shares.
Total return is
calculated for the time period presented and is not annualized for periods of less than a year.
|
|
(c)
|
Annualized.
|
|
(d)
|
Portfolio turnover is calculated for the time period presented and is not annualized for periods of less than a year and does
not include securities
received or delivered from processing creations or redemptions and in-kind transactions.
|
Financial Highlights (Continued)
For a share outstanding throughout each period
|
|
Six Months
Ended
6/30/2023
(Unaudited)
|
Year Ended December 31,
|
||||
|
|
2022
|
2021
|
2020
|
2019
|
2018
|
|
|
Net asset value, beginning of
period
|
$39.89
|
$43.00
|
$35.10
|
$36.03
|
$29.07
|
$30.84
|
|
Income from investment
operations:
|
|
|
|
|
|
|
|
Net investment income (loss)
|
0.48
(a)
|
0.82
|
0.74
|
0.79
|
0.73
|
0.73
|
|
Net realized and unrealized
gain (loss)
|
0.18
|
(3.10
)
|
7.91
|
(0.91
)
|
6.96
|
(1.77
)
|
|
Total from investment
operations
|
0.66
|
(2.28
)
|
8.65
|
(0.12
)
|
7.69
|
(1.04
)
|
|
Distributions paid to
shareholders from:
|
|
|
|
|
|
|
|
Net investment income
|
(0.47
)
|
(0.83
)
|
(0.75
)
|
(0.81
)
|
(0.73
)
|
(0.73
)
|
|
Net asset value, end of period
|
$40.08
|
$39.89
|
$43.00
|
$35.10
|
$36.03
|
$29.07
|
|
Total return (b)
|
1.66
%
|
(5.24
)%
|
24.86
%
|
(0.04
)%
|
26.60
%
|
(3.44
)%
|
|
|
||||||
|
Ratios to average net
assets/supplemental data:
|
|
|
|
|
|
|
|
Net assets, end of period (in
000’s)
|
$12,064,652
|
$12,442,671
|
$12,954,187
|
$10,149,204
|
$9,665,219
|
$4,374,483
|
|
Ratio of total expenses to
average net assets
|
0.64
% (c)
|
0.65
%
|
0.67
%
|
0.70
%
|
0.71
%
|
0.72
%
|
|
Ratio of net expenses to
average net assets
|
0.64
% (c)
|
0.65
%
|
0.67
%
|
0.70
%
|
0.70
%
|
0.70
%
|
|
Ratio of net investment
income (loss) to average net
assets
|
2.42
% (c)
|
2.04
%
|
1.91
%
|
2.47
%
|
2.36
%
|
2.40
%
|
|
Portfolio turnover rate (d)
|
26
%
|
53
%
|
47
%
|
86
%
|
53
%
|
58
%
|
|
(a)
|
Based on average shares outstanding.
|
|
(b)
|
Total return is calculated assuming an initial investment made at the net asset value at the beginning of the period, reinvestment
of all
distributions at net asset value during the period, and redemption at net asset value on the last day of the period. The returns
presented do not
reflect the deduction of taxes that a shareholder would pay on Fund distributions or the redemption or sale of Fund shares.
Total return is
calculated for the time period presented and is not annualized for periods of less than a year. The total returns would have
been lower if certain
fees had not been waived and expenses reimbursed by the investment advisor.
|
|
(c)
|
Annualized.
|
|
(d)
|
Portfolio turnover is calculated for the time period presented and is not annualized for periods of less than a year and does
not include securities
received or delivered from processing creations or redemptions and in-kind transactions.
|
June 30, 2023 (Unaudited)
|
First Trust Dow Jones Select MicroCap Index Fund – (NYSE Arca, Inc. (“NYSE Arca”) ticker “FDM”)
|
|
First Trust Morningstar Dividend Leaders Index Fund – (NYSE Arca ticker “FDL”)
|
|
First Trust US Equity Opportunities ETF – (NYSE Arca ticker “FPX”)
|
|
First Trust NYSE® Arca® Biotechnology Index Fund – (NYSE Arca ticker “FBT”)
|
|
First Trust Dow Jones Internet Index Fund – (NYSE Arca ticker “FDN”)
|
|
First Trust Capital Strength ETF – (The Nasdaq Stock Market LLC (“Nasdaq”) ticker “FTCS”)
|
|
First Trust Value Line® Dividend Index Fund – (NYSE Arca ticker “FVD”)
|
|
Fund
|
Index
|
|
First Trust Dow Jones Select MicroCap Index Fund
|
Dow Jones Select MicroCap IndexSM
|
|
First Trust Morningstar Dividend Leaders Index Fund
|
Morningstar® Dividend Leaders IndexSM
|
|
First Trust US Equity Opportunities ETF
|
IPOX®-100 U.S. Index
|
|
First Trust NYSE® Arca® Biotechnology Index Fund
|
NYSE® Arca® Biotechnology Index
|
|
First Trust Dow Jones Internet Index Fund
|
Dow Jones Internet Composite IndexSM
|
|
First Trust Capital Strength ETF
|
The Capital StrengthTM Index
|
|
First Trust Value Line® Dividend Index Fund
|
Value Line® Dividend Index
|
June 30, 2023 (Unaudited)
June 30, 2023 (Unaudited)
June 30, 2023 (Unaudited)
|
|
Distributions
paid from
Ordinary
Income
|
Distributions
paid from
Capital
Gains
|
Distributions
paid from
Return of
Capital
|
|
First Trust Dow Jones Select MicroCap Index Fund
|
$2,696,103
|
$—
|
$—
|
|
First Trust Morningstar Dividend Leaders Index Fund
|
122,518,973
|
—
|
—
|
|
First Trust US Equity Opportunities ETF
|
9,427,777
|
—
|
—
|
|
First Trust NYSE® Arca® Biotechnology Index Fund
|
—
|
—
|
—
|
|
First Trust Dow Jones Internet Index Fund
|
—
|
—
|
—
|
June 30, 2023 (Unaudited)
|
|
Distributions
paid from
Ordinary
Income
|
Distributions
paid from
Capital
Gains
|
Distributions
paid from
Return of
Capital
|
|
First Trust Capital Strength ETF
|
$104,442,497
|
$—
|
$—
|
|
First Trust Value Line® Dividend Index Fund
|
255,493,903
|
—
|
—
|
|
|
Undistributed
Ordinary
Income
|
Accumulated
Capital and
Other
Gain (Loss)
|
Net
Unrealized
Appreciation
(Depreciation)
|
|
First Trust Dow Jones Select MicroCap Index Fund
|
$—
|
$(53,504,160
)
|
$(11,736,962
)
|
|
First Trust Morningstar Dividend Leaders Index Fund
|
428,089
|
(339,388,648
)
|
142,814,052
|
|
First Trust US Equity Opportunities ETF
|
564,575
|
(614,449,867
)
|
(40,206,579
)
|
|
First Trust NYSE® Arca® Biotechnology Index Fund
|
—
|
(608,689,298
)
|
65,144,886
|
|
First Trust Dow Jones Internet Index Fund
|
—
|
(570,251,563
)
|
(2,484,232,642
)
|
|
First Trust Capital Strength ETF
|
165,743
|
(835,844,643
)
|
513,771,423
|
|
First Trust Value Line® Dividend Index Fund
|
—
|
(482,206,022
)
|
834,263,506
|
|
|
Non-Expiring
Capital Loss
Carryforward
|
|
First Trust Dow Jones Select MicroCap Index Fund
|
$53,504,160
|
|
First Trust Morningstar Dividend Leaders Index Fund
|
339,388,648
|
|
First Trust US Equity Opportunities ETF
|
614,449,867
|
|
First Trust NYSE® Arca® Biotechnology Index Fund
|
608,689,298
|
|
First Trust Dow Jones Internet Index Fund
|
570,251,563
|
|
First Trust Capital Strength ETF
|
835,844,643
|
|
First Trust Value Line® Dividend Index Fund*
|
482,206,022
|
|
*
|
$11,007,161 of First Trust Value Line® Dividend Index Fund’s non-expiring net capital losses is subject to loss limitation resulting
from reorganization activity. This limitation generally reduces the utilization of these losses to a maximum of $364,518 per
year.
|
June 30, 2023 (Unaudited)
|
|
Tax Cost
|
Gross
Unrealized
Appreciation
|
Gross
Unrealized
(Depreciation)
|
Net Unrealized
Appreciation
(Depreciation)
|
|
First Trust Dow Jones Select MicroCap Index Fund
|
$178,725,266
|
$17,090,194
|
$(25,891,971
)
|
$(8,801,777
)
|
|
First Trust Morningstar Dividend Leaders Index Fund
|
4,627,156,018
|
62,937,411
|
(267,259,742
)
|
(204,322,331
)
|
|
First Trust US Equity Opportunities ETF
|
737,267,450
|
92,640,101
|
(9,947,705
)
|
82,692,396
|
|
First Trust NYSE® Arca® Biotechnology Index Fund
|
1,324,952,901
|
224,709,449
|
(133,790,829
)
|
90,918,620
|
|
First Trust Dow Jones Internet Index Fund
|
6,329,472,858
|
305,639,527
|
(1,260,386,194
)
|
(954,746,667
)
|
|
First Trust Capital Strength ETF
|
8,284,433,776
|
736,503,424
|
(231,399,673
)
|
505,103,751
|
|
First Trust Value Line® Dividend Index Fund
|
11,059,125,202
|
1,288,553,641
|
(299,079,512
)
|
989,474,129
|
|
Fund
|
Licensor
|
|
First Trust Dow Jones Select MicroCap Index Fund
|
S&P Dow Jones Indices LLC
|
|
First Trust Morningstar Dividend Leaders Index Fund
|
Morningstar, Inc.
|
|
First Trust US Equity Opportunities ETF
|
IPOX® Schuster LLC
|
|
First Trust NYSE® Arca® Biotechnology Index Fund
|
ICE Data Indices, LLC
|
|
First Trust Dow Jones Internet Index Fund
|
S&P Dow Jones Indices LLC
|
|
First Trust Capital Strength ETF
|
Nasdaq, Inc.
|
|
First Trust Value Line® Dividend Index Fund
|
Value Line Publishing LLC
|
June 30, 2023 (Unaudited)
|
Breakpoints
|
FDM
|
FDL
|
FPX
|
FBT
|
FDN
|
FTCS
|
FVD
|
|
Fund net assets up to and including $2.5 billion
|
0.5000
%
|
0.3000
%
|
0.40
%
|
0.40
%
|
0.40
%
|
0.5000
%
|
0.5000
%
|
|
Fund net assets greater than $2.5 billion up to and including
$5 billion
|
0.4875
%
|
0.2925
%
|
0.39
%
|
0.39
%
|
0.39
%
|
0.4875
%
|
0.4875
%
|
|
Fund net assets greater than $5 billion up to and including
$7.5 billion
|
0.4750
%
|
0.2850
%
|
0.38
%
|
0.38
%
|
0.38
%
|
0.4750
%
|
0.4750
%
|
|
Fund net assets greater than $7.5 billion up to and including
$10 billion
|
0.4625
%
|
0.2775
%
|
0.37
%
|
0.37
%
|
0.37
%
|
0.4625
%
|
0.4625
%
|
|
Fund net assets greater than $10 billion up to and including
$15 billion
|
0.4500
%
|
0.2700
%
|
0.36
%
|
0.36
%
|
0.36
%
|
0.4500
%
|
0.4500
%
|
|
Fund net assets greater than $15 billion
|
0.4250
%
|
0.2550
%
|
0.34
%
|
0.34
%
|
0.34
%
|
0.4250
%
|
0.4250
%
|
|
|
Expense Cap
|
|
First Trust Dow Jones Select MicroCap Index Fund
|
0.60
%
|
|
First Trust Morningstar Dividend Leaders Index Fund
|
0.45
%
|
|
First Trust US Equity Opportunities ETF
|
0.60
%
|
|
First Trust NYSE® Arca® Biotechnology Index Fund
|
0.60
%
|
|
First Trust Dow Jones Internet Index Fund
|
0.60
%
|
|
First Trust Capital Strength ETF
|
0.65
%
|
|
First Trust Value Line® Dividend Index Fund
|
0.70
%
|
|
|
Purchases
|
Sales
|
|
First Trust Dow Jones Select MicroCap Index Fund
|
$10,346,347
|
$10,024,560
|
|
First Trust Morningstar Dividend Leaders Index Fund
|
1,620,609,600
|
1,610,035,809
|
|
First Trust US Equity Opportunities ETF
|
624,169,165
|
622,052,035
|
|
First Trust NYSE® Arca® Biotechnology Index Fund
|
170,775,233
|
173,501,649
|
|
First Trust Dow Jones Internet Index Fund
|
575,096,116
|
581,896,992
|
|
First Trust Capital Strength ETF
|
4,561,723,749
|
4,544,854,544
|
June 30, 2023 (Unaudited)
|
|
Purchases
|
Sales
|
|
First Trust Value Line® Dividend Index Fund
|
$3,218,016,470
|
$3,206,520,606
|
|
|
Purchases
|
Sales
|
|
First Trust Dow Jones Select MicroCap Index Fund
|
$18,481,886
|
$11,575,866
|
|
First Trust Morningstar Dividend Leaders Index Fund
|
1,700,976,785
|
1,699,115,049
|
|
First Trust US Equity Opportunities ETF
|
—
|
102,880,680
|
|
First Trust NYSE® Arca® Biotechnology Index Fund
|
31,168,130
|
85,616,202
|
|
First Trust Dow Jones Internet Index Fund
|
1,989,319,920
|
1,299,226,057
|
|
First Trust Capital Strength ETF
|
1,885,381,281
|
1,843,238,541
|
|
First Trust Value Line® Dividend Index Fund
|
639,572,846
|
1,081,141,080
|
June 30, 2023 (Unaudited)
June 30, 2023 (Unaudited)
June 30, 2023 (Unaudited)
June 30, 2023 (Unaudited)
June 30, 2023 (Unaudited)
|
First Trust Dow Jones Select MicroCap Index Fund (FDM)
|
|
First Trust Morningstar Dividend Leaders Index Fund (FDL)
|
|
First Trust US Equity Opportunities ETF (FPX)
|
|
First Trust NYSE® Arca® Biotechnology Index Fund (FBT)
|
|
First Trust Dow Jones Internet Index Fund (FDN)
|
|
First Trust Capital Strength ETF (FTCS)
|
|
First Trust Value Line® Dividend Index Fund (FVD)
|
June 30, 2023 (Unaudited)
June 30, 2023 (Unaudited)

120 East Liberty Drive, Suite 400
Wheaton, IL 60187
FUND ACCOUNTANT &
TRANSFER AGENT
240 Greenwich Street
New York, NY 10286
PUBLIC ACCOUNTING FIRM
111 South Wacker Drive
Chicago, IL 60606
320 South Canal Street
Chicago, IL 60606
June 30, 2023

|
First Trust NASDAQ-100 Equal Weighted Index Fund
(QQEW)
|
|
First Trust NASDAQ-100-Technology Sector Index Fund
(QTEC)
|
|
First Trust NASDAQ-100 Ex-Technology Sector Index Fund
(QQXT)
|
|
First Trust NASDAQ® Clean Edge® Green Energy Index Fund
(QCLN)
|
|
First Trust S&P REIT Index Fund (FRI)
|
|
First Trust Water ETF (FIW)
|
|
First Trust Natural Gas ETF (FCG)
|
|
First Trust NASDAQ® ABA Community Bank Index Fund
(QABA)
|
Semi-Annual Report
June 30, 2023
|
2
|
|
|
3
|
|
|
4
|
|
|
6
|
|
|
8
|
|
|
10
|
|
|
12
|
|
|
14
|
|
|
16
|
|
|
18
|
|
|
20
|
|
|
21
|
|
|
23
|
|
|
26
|
|
|
28
|
|
|
31
|
|
|
34
|
|
|
37
|
|
|
39
|
|
|
41
|
|
|
44
|
|
|
46
|
|
|
48
|
|
|
51
|
|
|
59
|
|
|
69
|
Semi-Annual Letter from the Chairman and CEO
June 30, 2023
non-profit business membership and research group organization, reported that its Leading Economic Index, which is composed of 10 economic indicators whose changes tend to precede changes in the overall economy, fell by 0.7% to a reading of 106.1 in June 2023, according to Reuters. The result represents the fifteenth consecutive monthly decline in the index, the longest streak of
month-over-month decreases since just before the financial crisis in 2007. From our perspective, even if the Fed can pull off a soft landing, it is likely to be a very bumpy ride.

Chairman of the Board of Trustees
Chief Executive Officer of First Trust Advisors L.P.
Semi-Annual Report
June 30, 2023
Senior Vice President and Chief Market Strategist
First Trust Advisors L.P.

|
Performance
|
||||||||
|
|
|
|
Average Annual Total Returns
|
Cumulative Total Returns
|
||||
|
|
6 Months
Ended
6/30/23
|
1 Year
Ended
6/30/23
|
5 Years
Ended
6/30/23
|
10 Years
Ended
6/30/23
|
Inception
(4/19/06)
to 6/30/23
|
5 Years
Ended
6/30/23
|
10 Years
Ended
6/30/23
|
Inception
(4/19/06)
to 6/30/23
|
|
Fund Performance
|
|
|
|
|
|
|
|
|
|
NAV
|
20.94%
|
23.14%
|
12.62%
|
14.20%
|
10.79%
|
81.19%
|
277.20%
|
482.80%
|
|
Market Price
|
20.90%
|
23.06%
|
12.58%
|
14.21%
|
10.79%
|
80.83%
|
277.51%
|
482.69%
|
|
Index Performance
|
|
|
|
|
|
|
|
|
|
Nasdaq-100 Equal
WeightedTM Index
|
21.20%
|
23.62%
|
13.26%
|
14.87%
|
11.46%
|
86.38%
|
299.90%
|
546.62%
|
|
S&P 500® Index
|
16.89%
|
19.59%
|
12.31%
|
12.86%
|
9.55%
|
78.66%
|
235.35%
|
379.94%
|
|
Nasdaq-100 Index®
|
39.35%
|
33.13%
|
17.66%
|
19.22%
|
14.53%
|
125.51%
|
480.20%
|
931.11%
|
|
Sector Allocation
|
% of Total
Long-Term
Investments
|
|
Information Technology
|
35.8%
|
|
Consumer Discretionary
|
13.9
|
|
Health Care
|
13.8
|
|
Industrials
|
10.3
|
|
Communication Services
|
10.3
|
|
Consumer Staples
|
7.8
|
|
Utilities
|
3.9
|
|
Energy
|
2.1
|
|
Real Estate
|
1.1
|
|
Financials
|
1.0
|
|
Total
|
100.0%
|
|
Top Ten Holdings
|
% of Total
Long-Term
Investments
|
|
Sirius XM Holdings, Inc.
|
1.1%
|
|
Old Dominion Freight Line, Inc.
|
1.1
|
|
Charter Communications, Inc., Class A
|
1.1
|
|
Align Technology, Inc.
|
1.1
|
|
PACCAR, Inc.
|
1.1
|
|
Lucid Group, Inc.
|
1.1
|
|
T-Mobile US, Inc.
|
1.1
|
|
CoStar Group, Inc.
|
1.1
|
|
Dollar Tree, Inc.
|
1.1
|
|
Lam Research Corp.
|
1.0
|
|
Total
|
10.9%
|
Nasdaq®, Nasdaq-100®, Nasdaq-100 Index®, and Nasdaq-100 Equal WeightedTM Index are registered trademarks and service marks of Nasdaq, Inc. (together with its affiliates hereinafter referred to as the “Corporations”) and are licensed for use by First Trust. The Fund has not been passed on by the Corporations as to its legality or suitability. The Fund is not issued, endorsed, sold or promoted by the Corporations. THE CORPORATIONS MAKE NO WARRANTIES AND BEAR NO LIABILITY WITH RESPECT TO THE FUND.
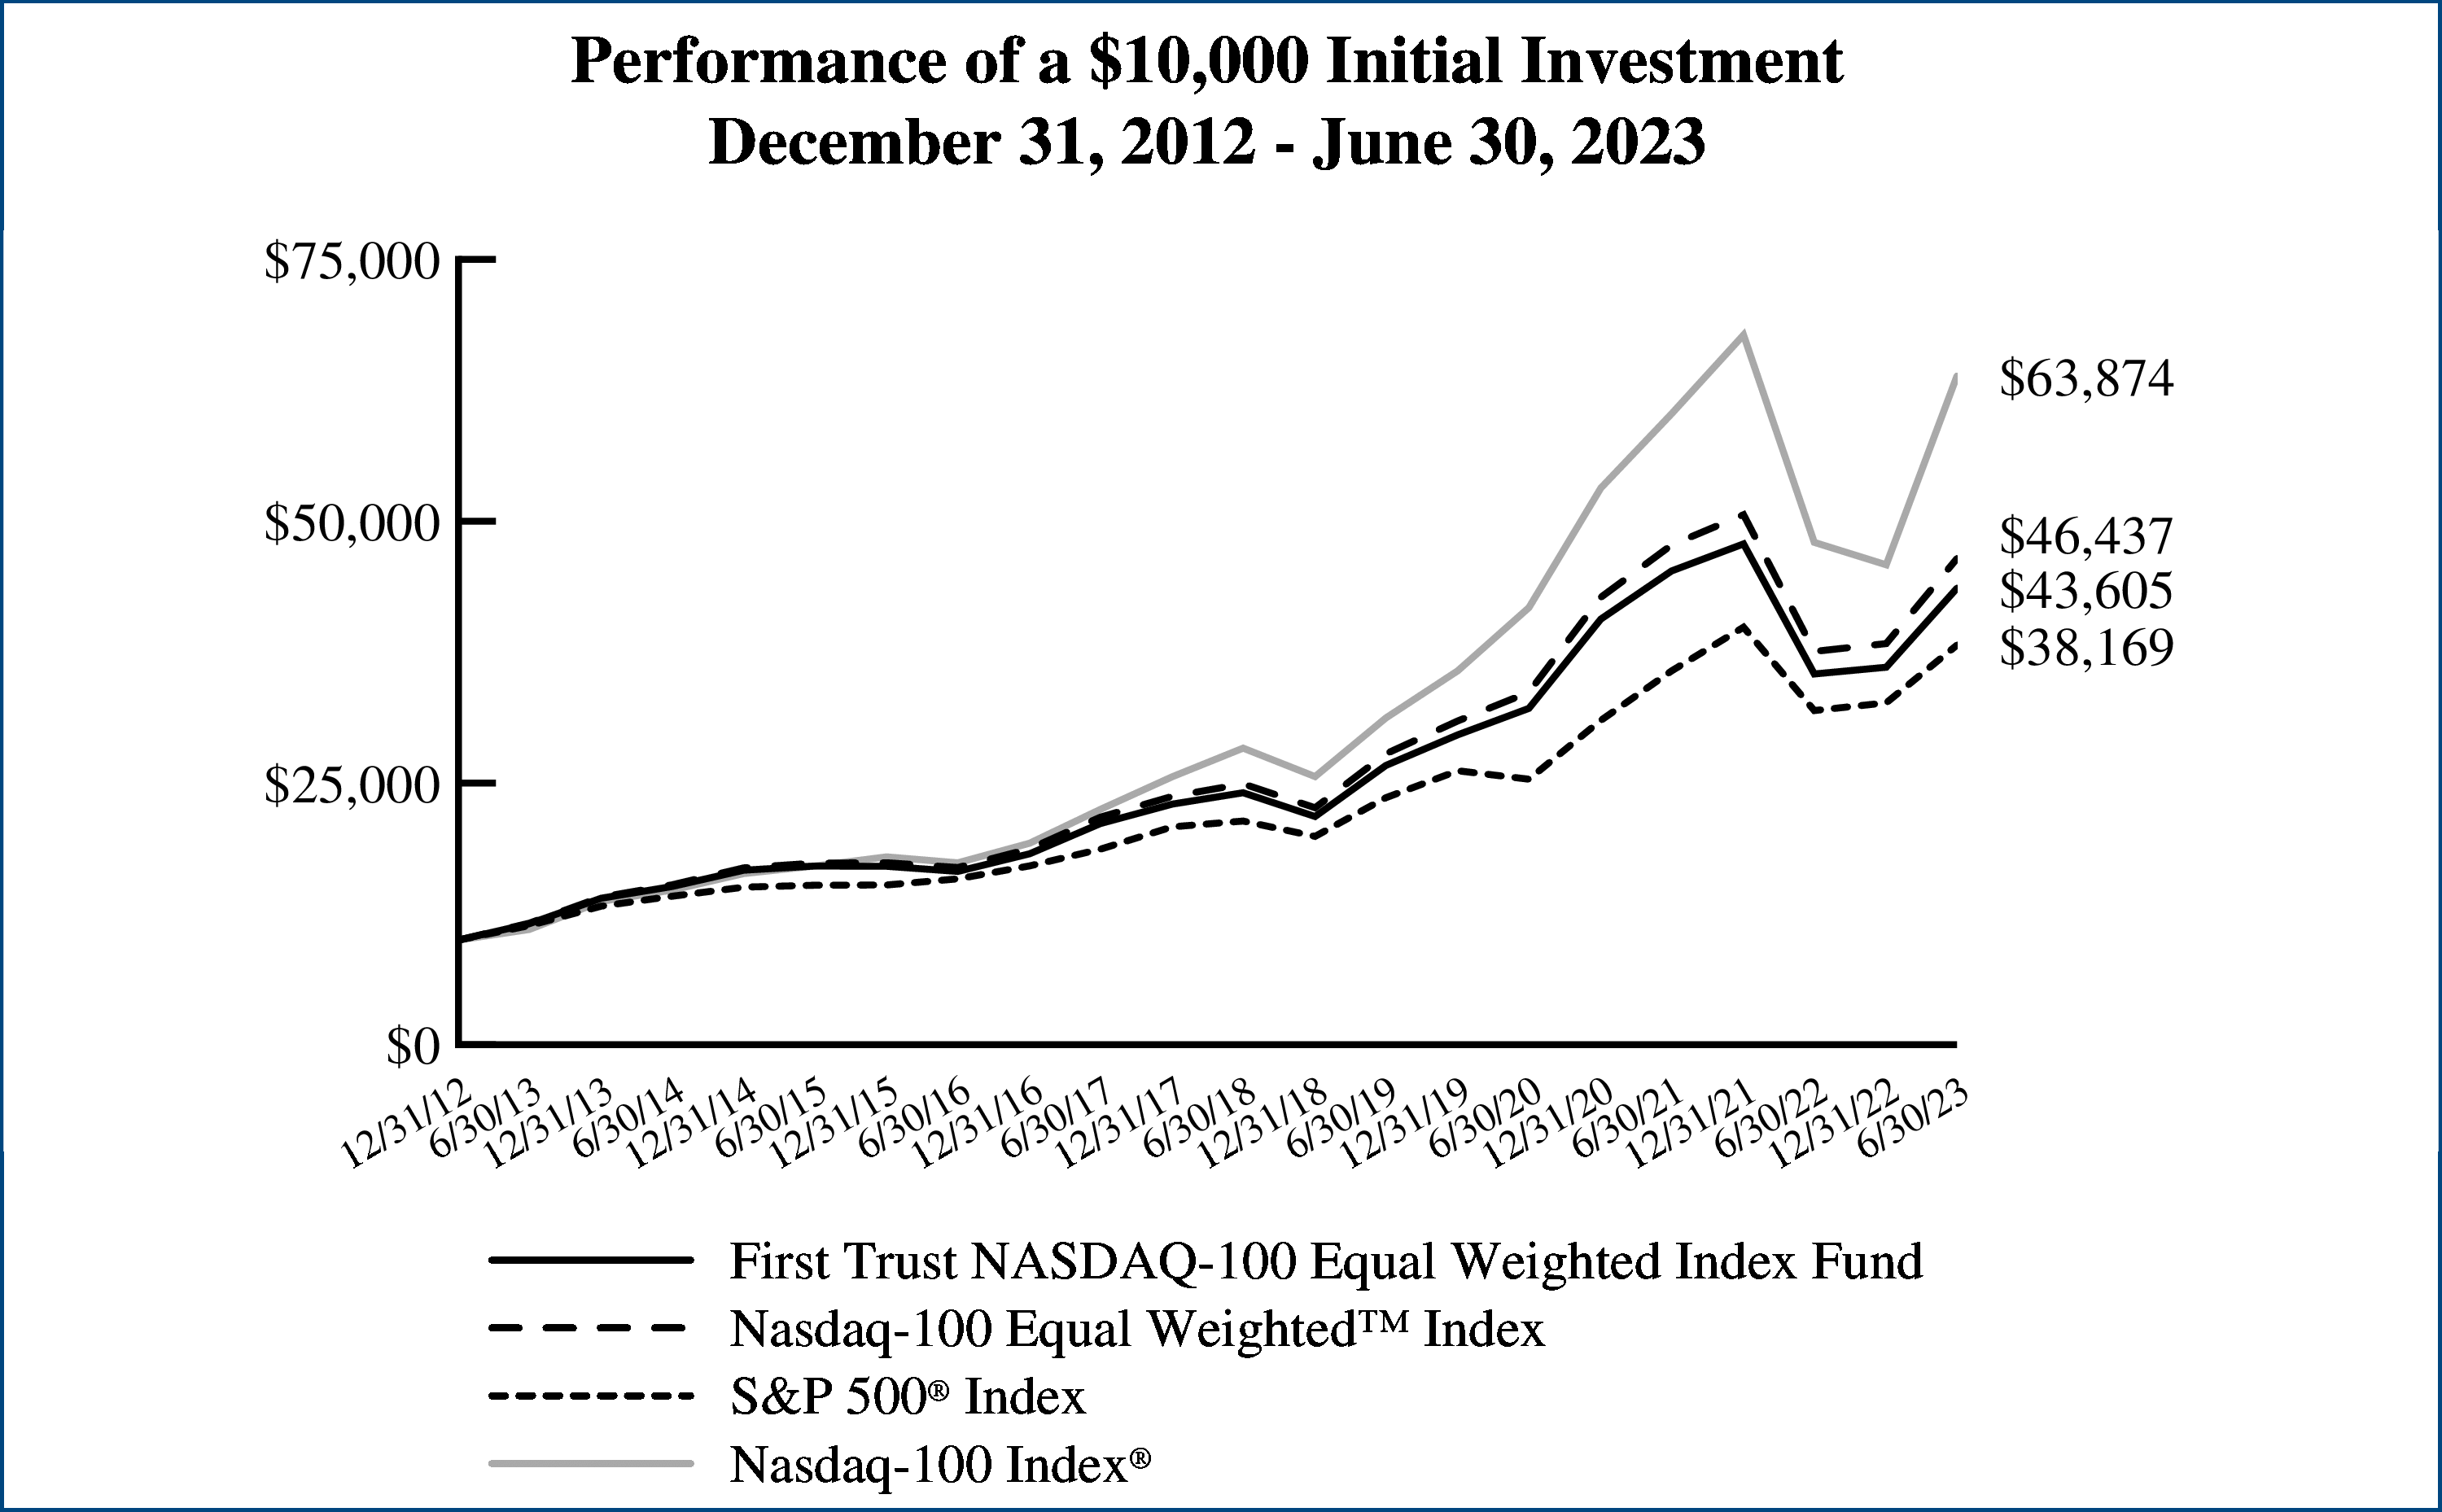 |
Performance figures assume reinvestment of
all distributions and do not reflect the
deduction of taxes that a shareholder would
pay on Fund distributions or the redemption
or sale of Fund shares. An index is a statistical
composite that tracks a specified financial
market or sector. Unlike the Fund, the indices
do not actually hold a portfolio of securities
and therefore do not incur the expenses
incurred by the Fund. These expenses
negatively impact the performance of the
Fund. The Fund’s past performance does not
predict future performance.
|
|
Performance
|
||||||||
|
|
|
|
Average Annual Total Returns
|
Cumulative Total Returns
|
||||
|
|
6 Months
Ended
6/30/23
|
1 Year
Ended
6/30/23
|
5 Years
Ended
6/30/23
|
10 Years
Ended
6/30/23
|
Inception
(4/19/06)
to 6/30/23
|
5 Years
Ended
6/30/23
|
10 Years
Ended
6/30/23
|
Inception
(4/19/06)
to 6/30/23
|
|
Fund Performance
|
|
|
|
|
|
|
|
|
|
NAV
|
40.03%
|
29.08%
|
14.36%
|
18.63%
|
12.94%
|
95.62%
|
451.96%
|
710.33%
|
|
Market Price
|
40.02%
|
29.00%
|
14.32%
|
18.59%
|
12.94%
|
95.27%
|
450.13%
|
710.14%
|
|
Index Performance
|
|
|
|
|
|
|
|
|
|
Nasdaq-100 Technology
SectorTM Index
|
40.45%
|
29.82%
|
15.06%
|
19.37%
|
13.64%
|
101.62%
|
487.18%
|
801.88%
|
|
S&P 500® Index
|
16.89%
|
19.59%
|
12.31%
|
12.86%
|
9.55%
|
78.66%
|
235.35%
|
379.94%
|
|
S&P 500® Information
Technology Index
|
42.77%
|
40.26%
|
21.82%
|
21.86%
|
14.94%
|
168.25%
|
622.23%
|
995.91%
|
|
Sector Allocation(1)
|
% of Total
Long-Term
Investments
|
|
Information Technology
|
92.2%
|
|
Communication Services
|
5.4
|
|
Consumer Discretionary
|
2.4
|
|
Total
|
100.0%
|
|
(1)
|
The above sector classification is based on Standard & Poor’s
Global Industry Classification Standard (“GICS”) and is different
than the industry sector classification system used by the Index to
select securities, which is the Industry Classification Benchmark
(“ICB”) system, the joint classification system of Dow Jones
Indexes and FTSE Group.
|
|
Top Ten Holdings
|
% of Total
Long-Term
Investments
|
|
Lam Research Corp.
|
2.8%
|
|
ON Semiconductor Corp.
|
2.8
|
|
Apple, Inc.
|
2.8
|
|
Microchip Technology, Inc.
|
2.8
|
|
KLA Corp.
|
2.8
|
|
Applied Materials, Inc.
|
2.8
|
|
Fortinet, Inc.
|
2.8
|
|
Palo Alto Networks, Inc.
|
2.8
|
|
NXP Semiconductors N.V.
|
2.8
|
|
Analog Devices, Inc.
|
2.8
|
|
Total
|
28.0%
|
Nasdaq®, Nasdaq-100®, Nasdaq-100 Index®, and Nasdaq-100 Technology SectorTM Index are registered trademarks and service marks of Nasdaq, Inc. (together with its affiliates hereinafter referred to as the “Corporations”) and are licensed for use by First Trust. The Fund has not been passed on by the Corporations as to its legality or suitability. The Fund is not issued, endorsed, sold or promoted by the Corporations. THE CORPORATIONS MAKE NO WARRANTIES AND BEAR NO LIABILITY WITH RESPECT TO THE FUND.
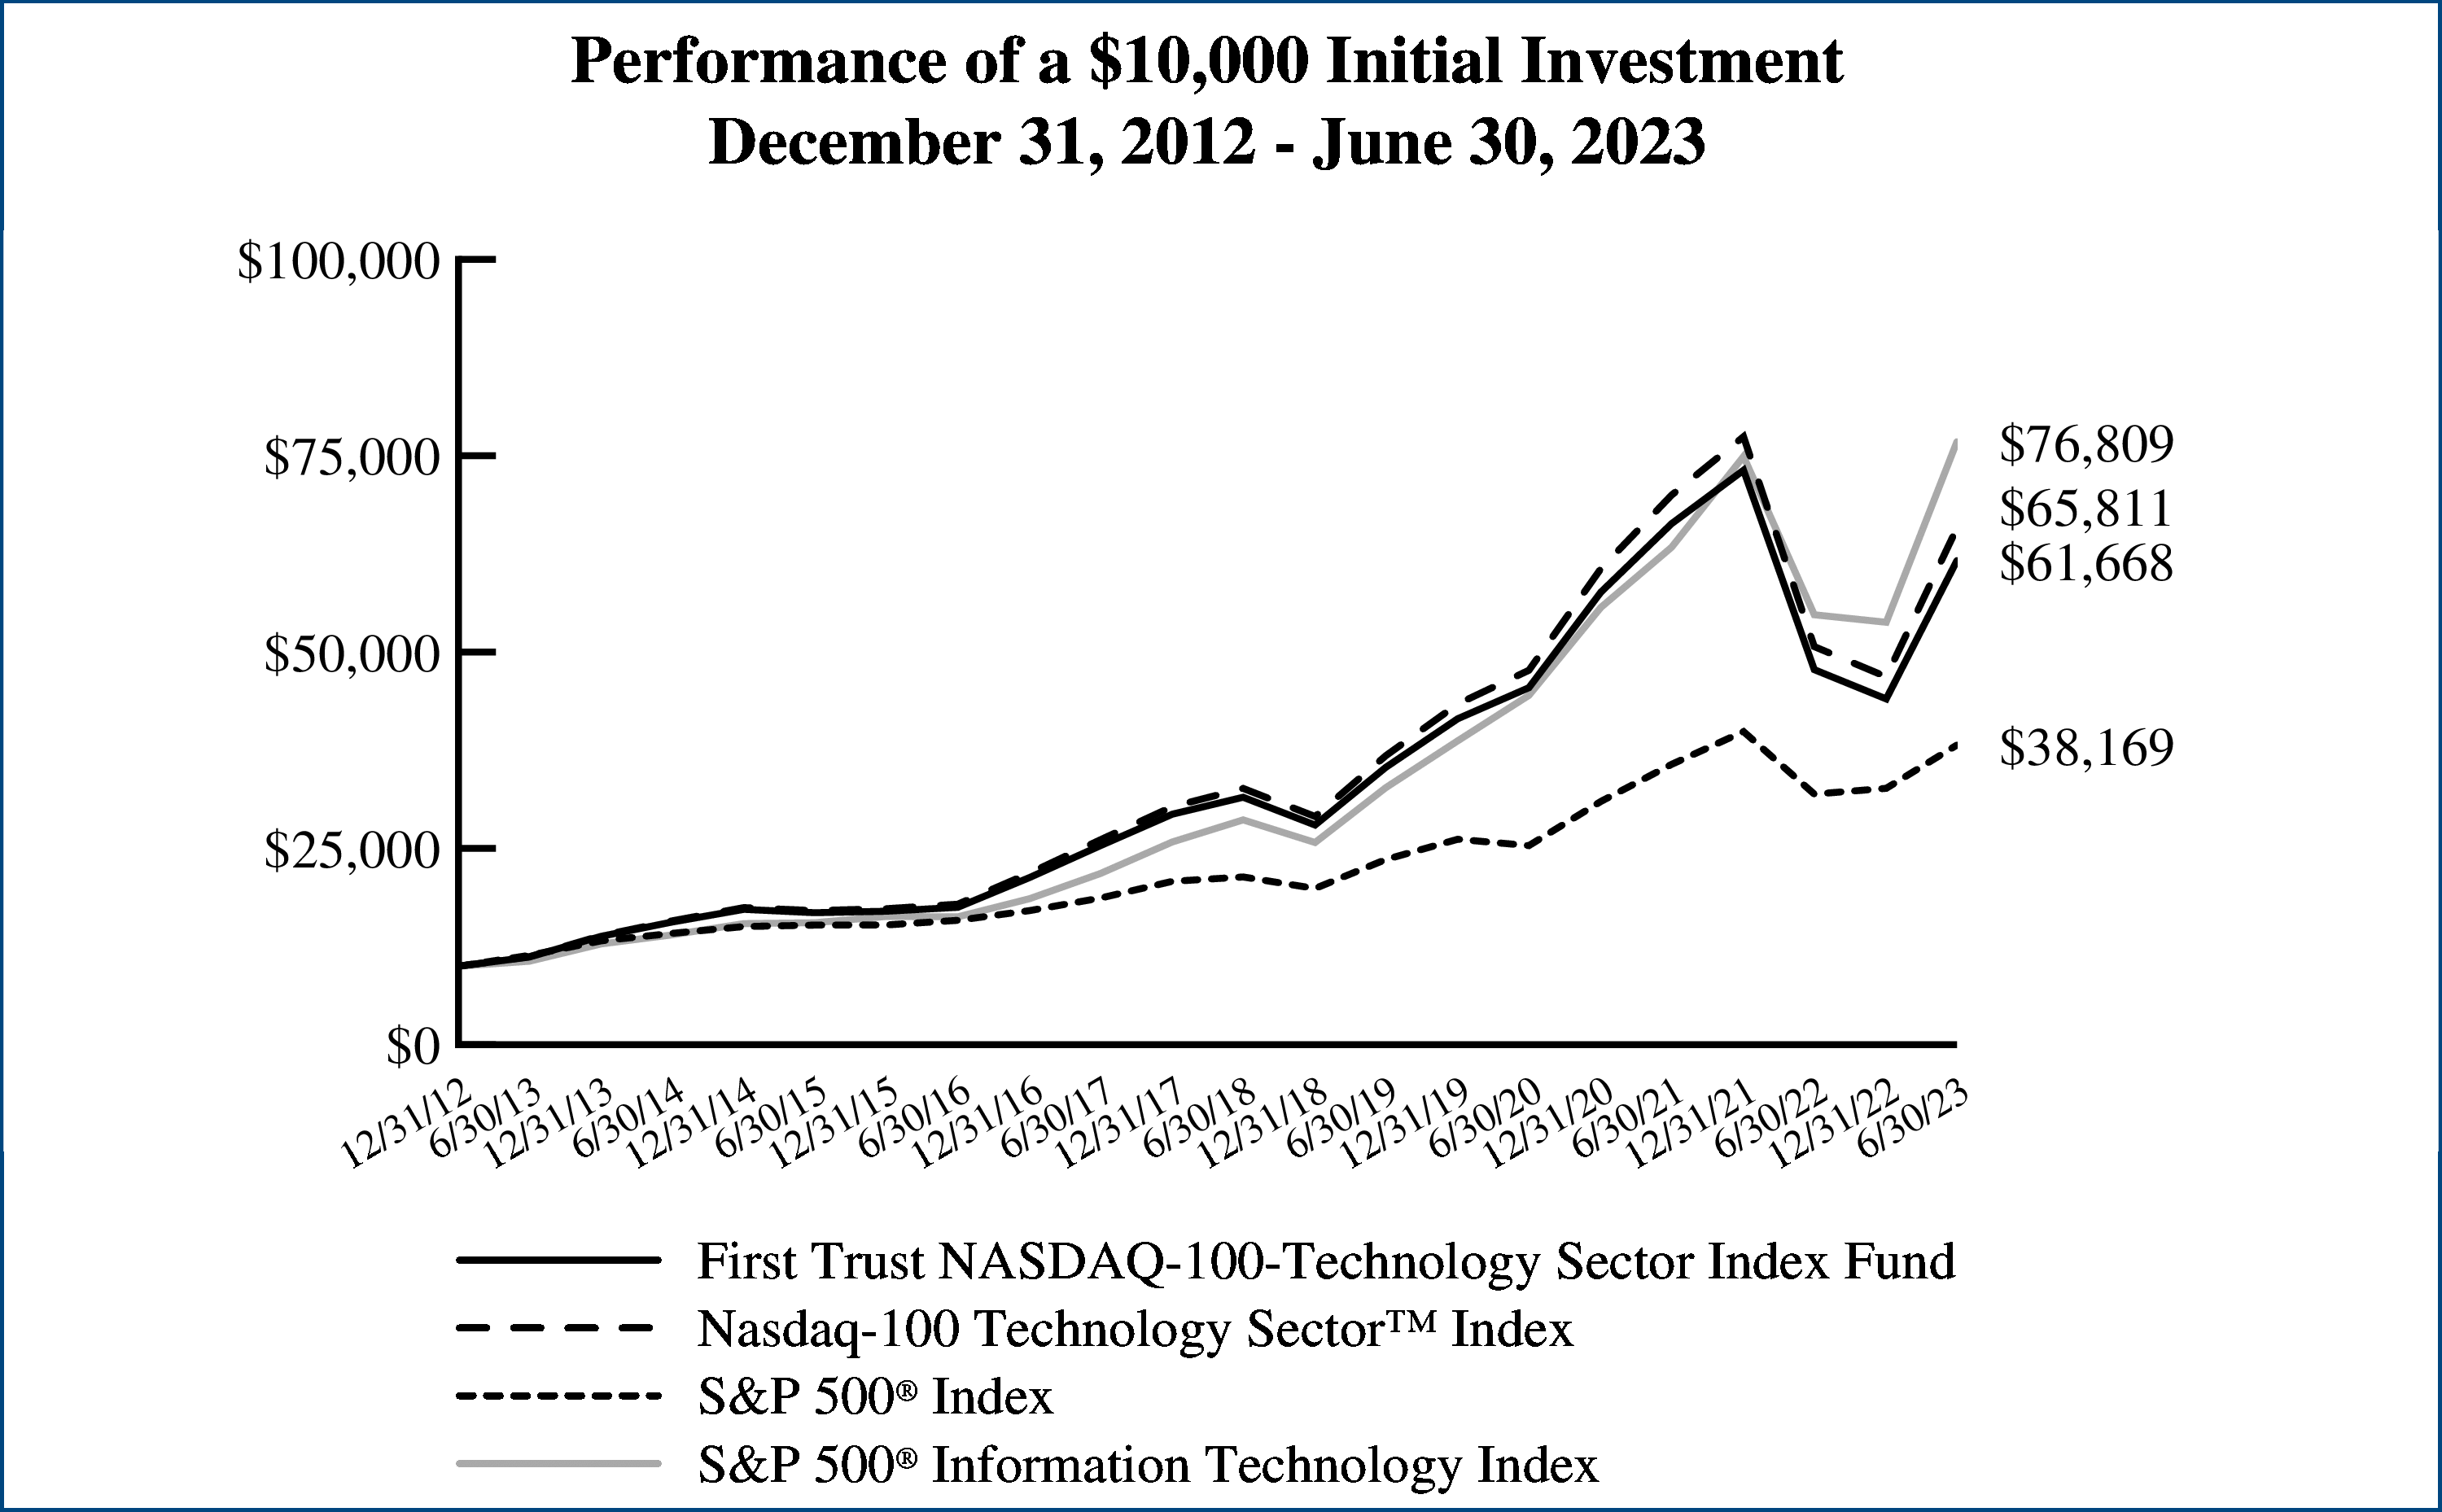 |
Performance figures assume reinvestment of
all distributions and do not reflect the
deduction of taxes that a shareholder would
pay on Fund distributions or the redemption
or sale of Fund shares. An index is a statistical
composite that tracks a specified financial
market or sector. Unlike the Fund, the indices
do not actually hold a portfolio of securities
and therefore do not incur the expenses
incurred by the Fund. These expenses
negatively impact the performance of the
Fund. The Fund’s past performance does not
predict future performance.
|
|
Performance
|
||||||||
|
|
|
|
Average Annual Total Returns
|
Cumulative Total Returns
|
||||
|
|
6 Months
Ended
6/30/23
|
1 Year
Ended
6/30/23
|
5 Years
Ended
6/30/23
|
10 Years
Ended
6/30/23
|
Inception
(2/8/07)
to 6/30/23
|
5 Years
Ended
6/30/23
|
10 Years
Ended
6/30/23
|
Inception
(2/8/07)
to 6/30/23
|
|
Fund Performance
|
|
|
|
|
|
|
|
|
|
NAV
|
10.89%
|
20.27%
|
11.62%
|
11.71%
|
9.71%
|
73.26%
|
202.57%
|
356.55%
|
|
Market Price
|
10.72%
|
20.19%
|
11.60%
|
11.68%
|
9.70%
|
73.09%
|
201.87%
|
356.13%
|
|
Index Performance
|
|
|
|
|
|
|
|
|
|
Nasdaq-100 Ex-Tech SectorTM
Index
|
11.10%
|
20.71%
|
12.24%
|
12.34%
|
10.37%
|
78.09%
|
220.14%
|
403.52%
|
|
Russell 1000® Index
|
16.68%
|
19.36%
|
11.92%
|
12.64%
|
9.21%
|
75.62%
|
228.91%
|
323.58%
|
|
Russell 3000® Index
|
16.17%
|
18.95%
|
11.39%
|
12.34%
|
9.03%
|
74.49%
|
220.10%
|
312.60%
|
|
Sector Allocation
|
% of Total
Long-Term
Investments
|
|
Health Care
|
21.8%
|
|
Consumer Discretionary
|
20.6
|
|
Industrials
|
16.3
|
|
Communication Services
|
13.2
|
|
Consumer Staples
|
12.4
|
|
Utilities
|
6.2
|
|
Energy
|
3.2
|
|
Information Technology
|
3.0
|
|
Real Estate
|
1.7
|
|
Financials
|
1.6
|
|
Total
|
100.0%
|
|
Top Ten Holdings
|
% of Total
Long-Term
Investments
|
|
Sirius XM Holdings, Inc.
|
1.8%
|
|
Old Dominion Freight Line, Inc.
|
1.8
|
|
Charter Communications, Inc., Class A
|
1.7
|
|
Align Technology, Inc.
|
1.7
|
|
PACCAR, Inc.
|
1.7
|
|
Lucid Group, Inc.
|
1.7
|
|
T-Mobile US, Inc.
|
1.7
|
|
CoStar Group, Inc.
|
1.7
|
|
Dollar Tree, Inc.
|
1.7
|
|
Copart, Inc.
|
1.7
|
|
Total
|
17.2%
|
Nasdaq®, Nasdaq-100®, Nasdaq-100 Index®, and Nasdaq-100 Ex-Tech SectorTM Index are registered trademarks and service marks of Nasdaq, Inc. (together with its affiliates hereinafter referred to as the “Corporations”) and are licensed for use by First Trust. The Fund has not been passed on by the Corporations as to its legality or suitability. The Fund is not issued, endorsed, sold or promoted by the Corporations. THE CORPORATIONS MAKE NO WARRANTIES AND BEAR NO LIABILITY WITH RESPECT TO THE FUND.
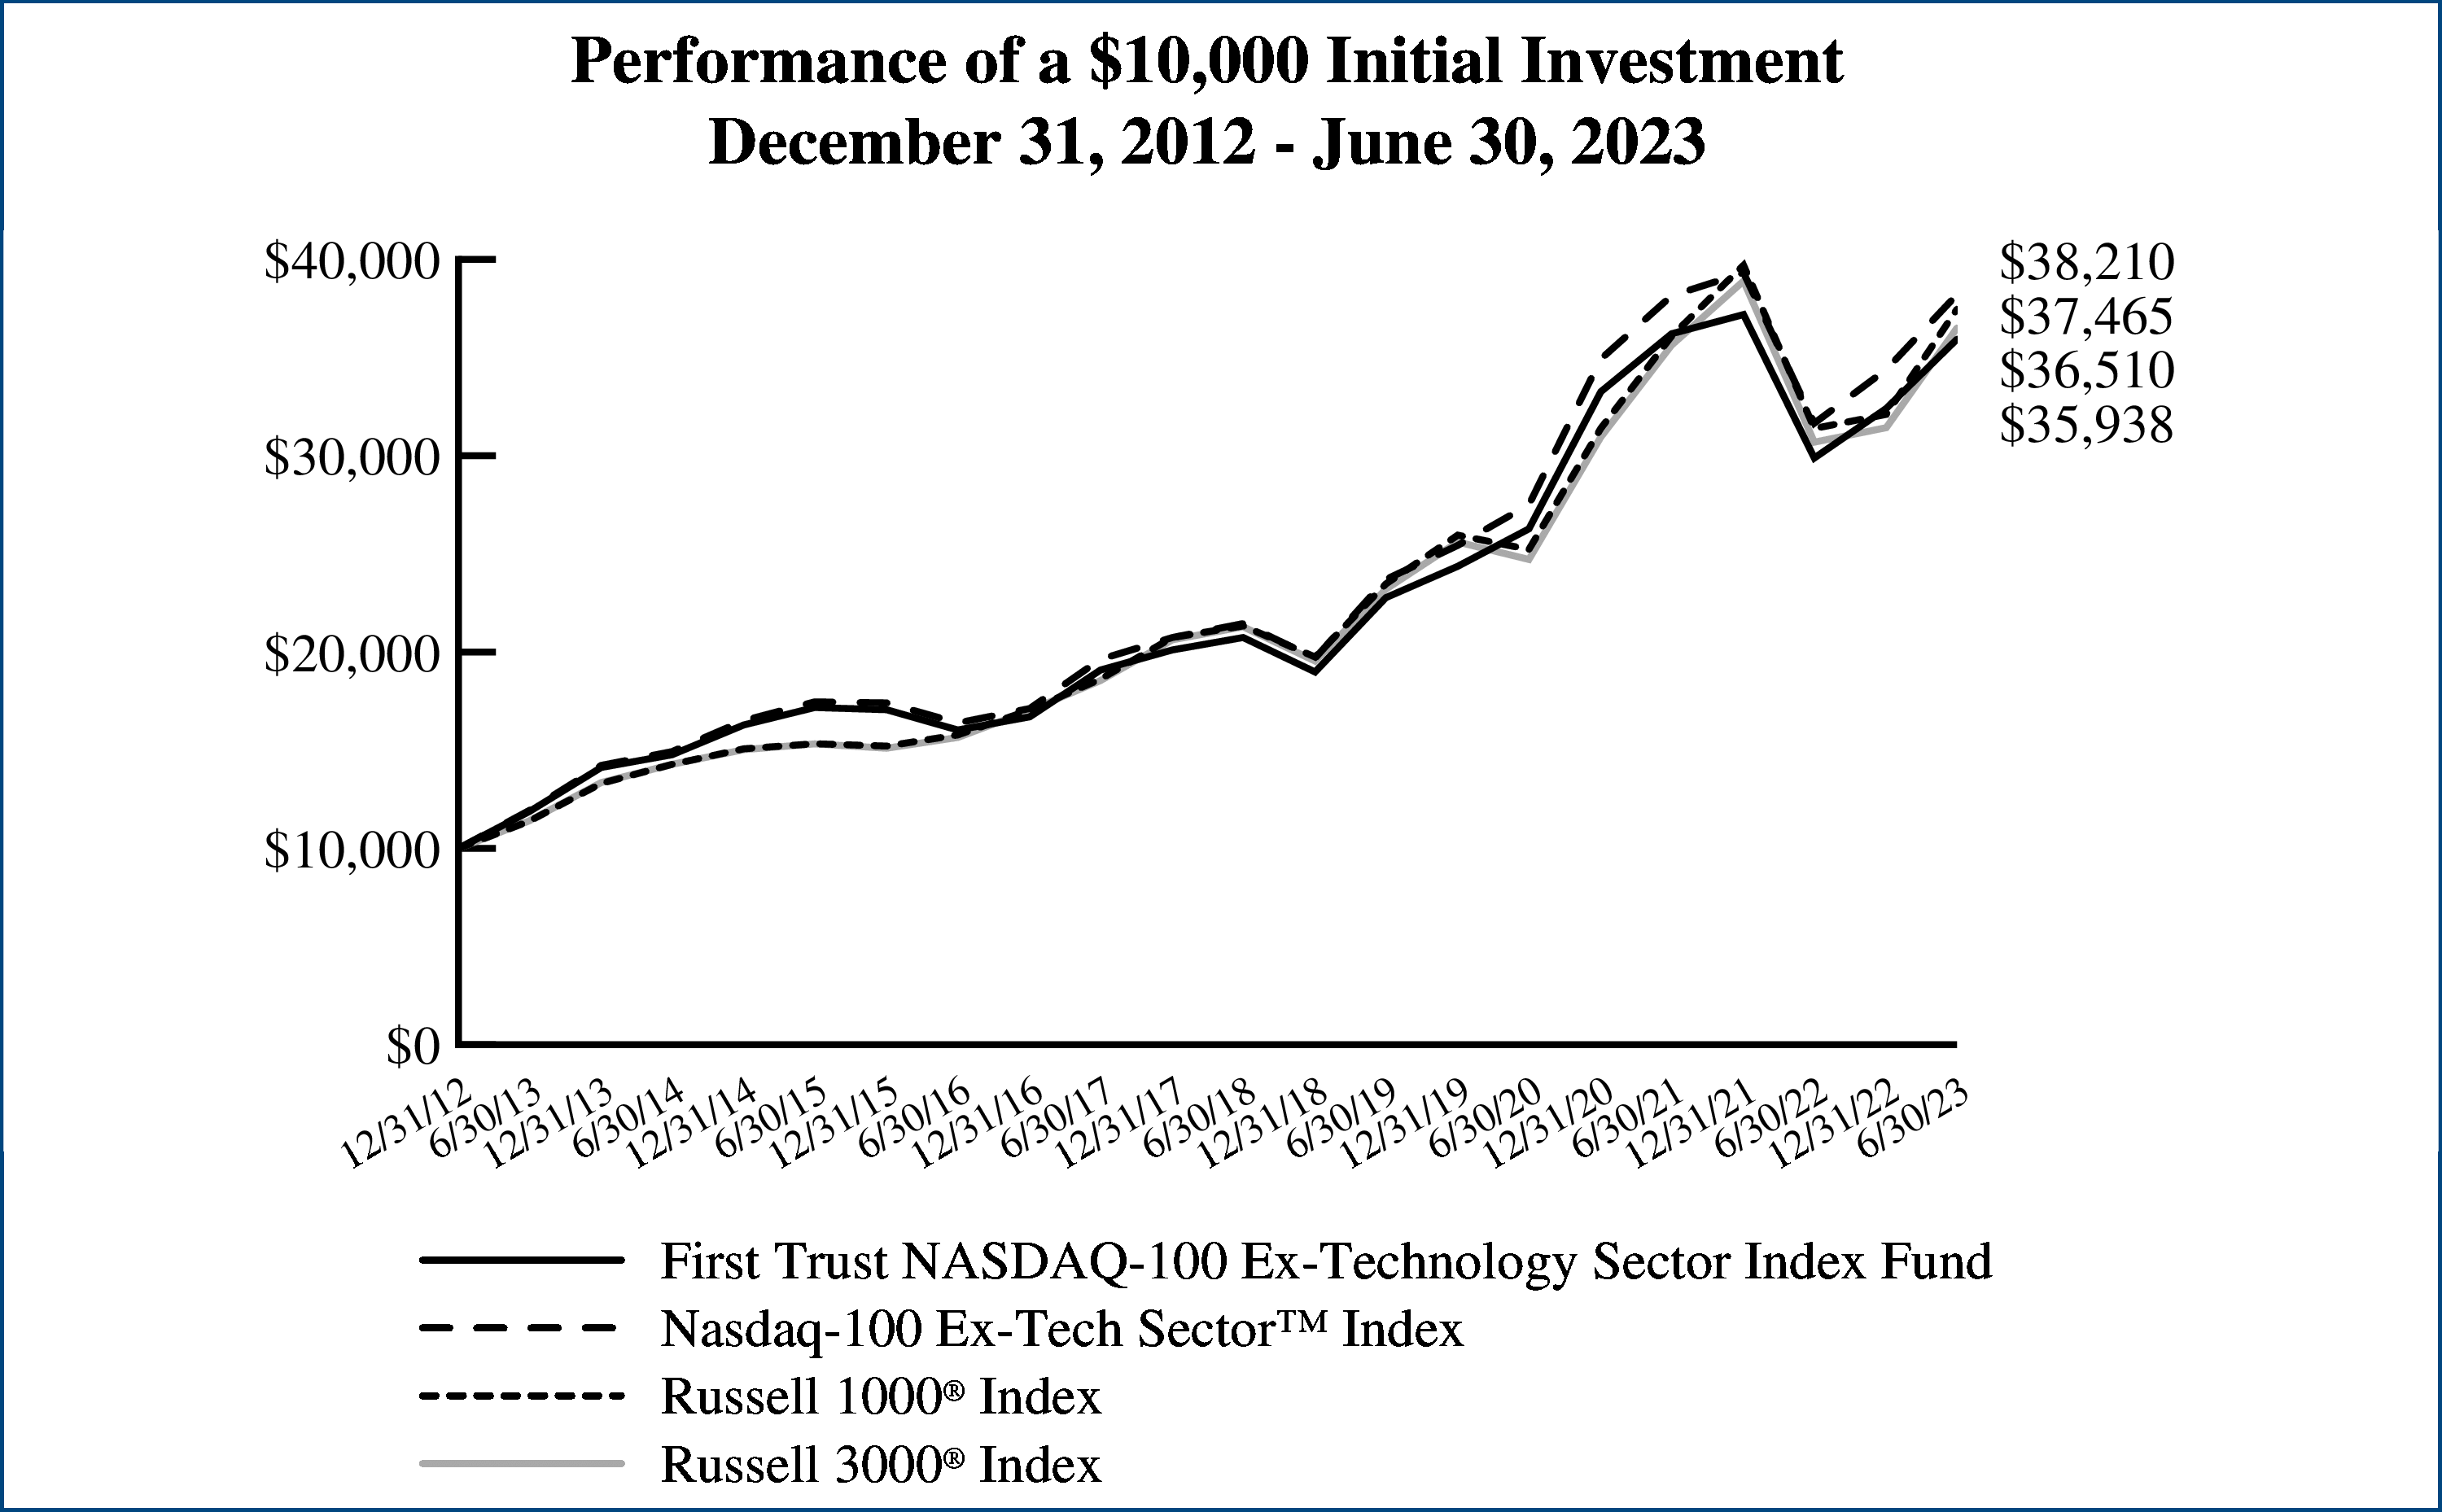 |
Performance figures assume reinvestment of
all distributions and do not reflect the
deduction of taxes that a shareholder would
pay on Fund distributions or the redemption
or sale of Fund shares. An index is a statistical
composite that tracks a specified financial
market or sector. Unlike the Fund, the indices
do not actually hold a portfolio of securities
and therefore do not incur the expenses
incurred by the Fund. These expenses
negatively impact the performance of the
Fund. The Fund’s past performance does not
predict future performance.
|
|
Performance
|
||||||||
|
|
|
|
Average Annual Total Returns
|
Cumulative Total Returns
|
||||
|
|
6 Months
Ended
6/30/23
|
1 Year
Ended
6/30/23
|
5 Years
Ended
6/30/23
|
10 Years
Ended
6/30/23
|
Inception
(2/8/07)
to 6/30/23
|
5 Years
Ended
6/30/23
|
10 Years
Ended
6/30/23
|
Inception
(2/8/07)
to 6/30/23
|
|
Fund Performance
|
|
|
|
|
|
|
|
|
|
NAV
|
9.03%
|
-1.29%
|
22.09%
|
14.51%
|
6.45%
|
171.24%
|
287.80%
|
178.33%
|
|
Market Price
|
9.03%
|
-1.35%
|
22.01%
|
14.62%
|
6.44%
|
170.44%
|
291.25%
|
178.25%
|
|
Index Performance
|
|
|
|
|
|
|
|
|
|
Nasdaq® Clean Edge® Green
EnergyTM Index
|
9.01%
|
-1.13%
|
22.40%
|
14.64%
|
6.67%
|
174.74%
|
291.98%
|
187.93%
|
|
Russell 2000® Index
|
8.09%
|
12.31%
|
4.21%
|
8.26%
|
6.70%
|
22.89%
|
121.06%
|
189.42%
|
|
Russell 3000® Index
|
16.17%
|
18.95%
|
11.39%
|
12.34%
|
9.03%
|
71.49%
|
220.10%
|
312.60%
|
|
Sector Allocation
|
% of Total
Long-Term
Investments
|
|
Information Technology
|
39.6%
|
|
Industrials
|
17.9
|
|
Consumer Discretionary
|
17.8
|
|
Materials
|
13.4
|
|
Utilities
|
10.3
|
|
Financials
|
0.9
|
|
Energy
|
0.1
|
|
Total
|
100.0%
|
|
Top Ten Holdings
|
% of Total
Long-Term
Investments
|
|
Tesla, Inc.
|
9.6%
|
|
Albemarle Corp.
|
8.6
|
|
ON Semiconductor Corp.
|
8.5
|
|
Enphase Energy, Inc.
|
7.2
|
|
First Solar, Inc.
|
6.7
|
|
Rivian Automotive, Inc., Class A
|
4.2
|
|
SolarEdge Technologies, Inc.
|
3.5
|
|
Lucid Group, Inc.
|
3.3
|
|
Allegro MicroSystems, Inc.
|
3.1
|
|
Brookfield Renewable Partners, L.P.
|
2.9
|
|
Total
|
57.6%
|
Nasdaq®, Clean Edge®, and Nasdaq® Clean Edge® Green EnergyTM Index are registered trademarks and service marks of Nasdaq, Inc. and Clean Edge, Inc., respectively (together with its affiliates hereinafter referred to as the “Corporations”) and are licensed for use by First Trust. The Fund has not been passed on by the Corporations as to its legality or suitability. The Fund is not issued, endorsed, sold or promoted by the Corporations. THE CORPORATIONS MAKE NO WARRANTIES AND BEAR NO LIABILITY WITH RESPECT TO THE FUND.
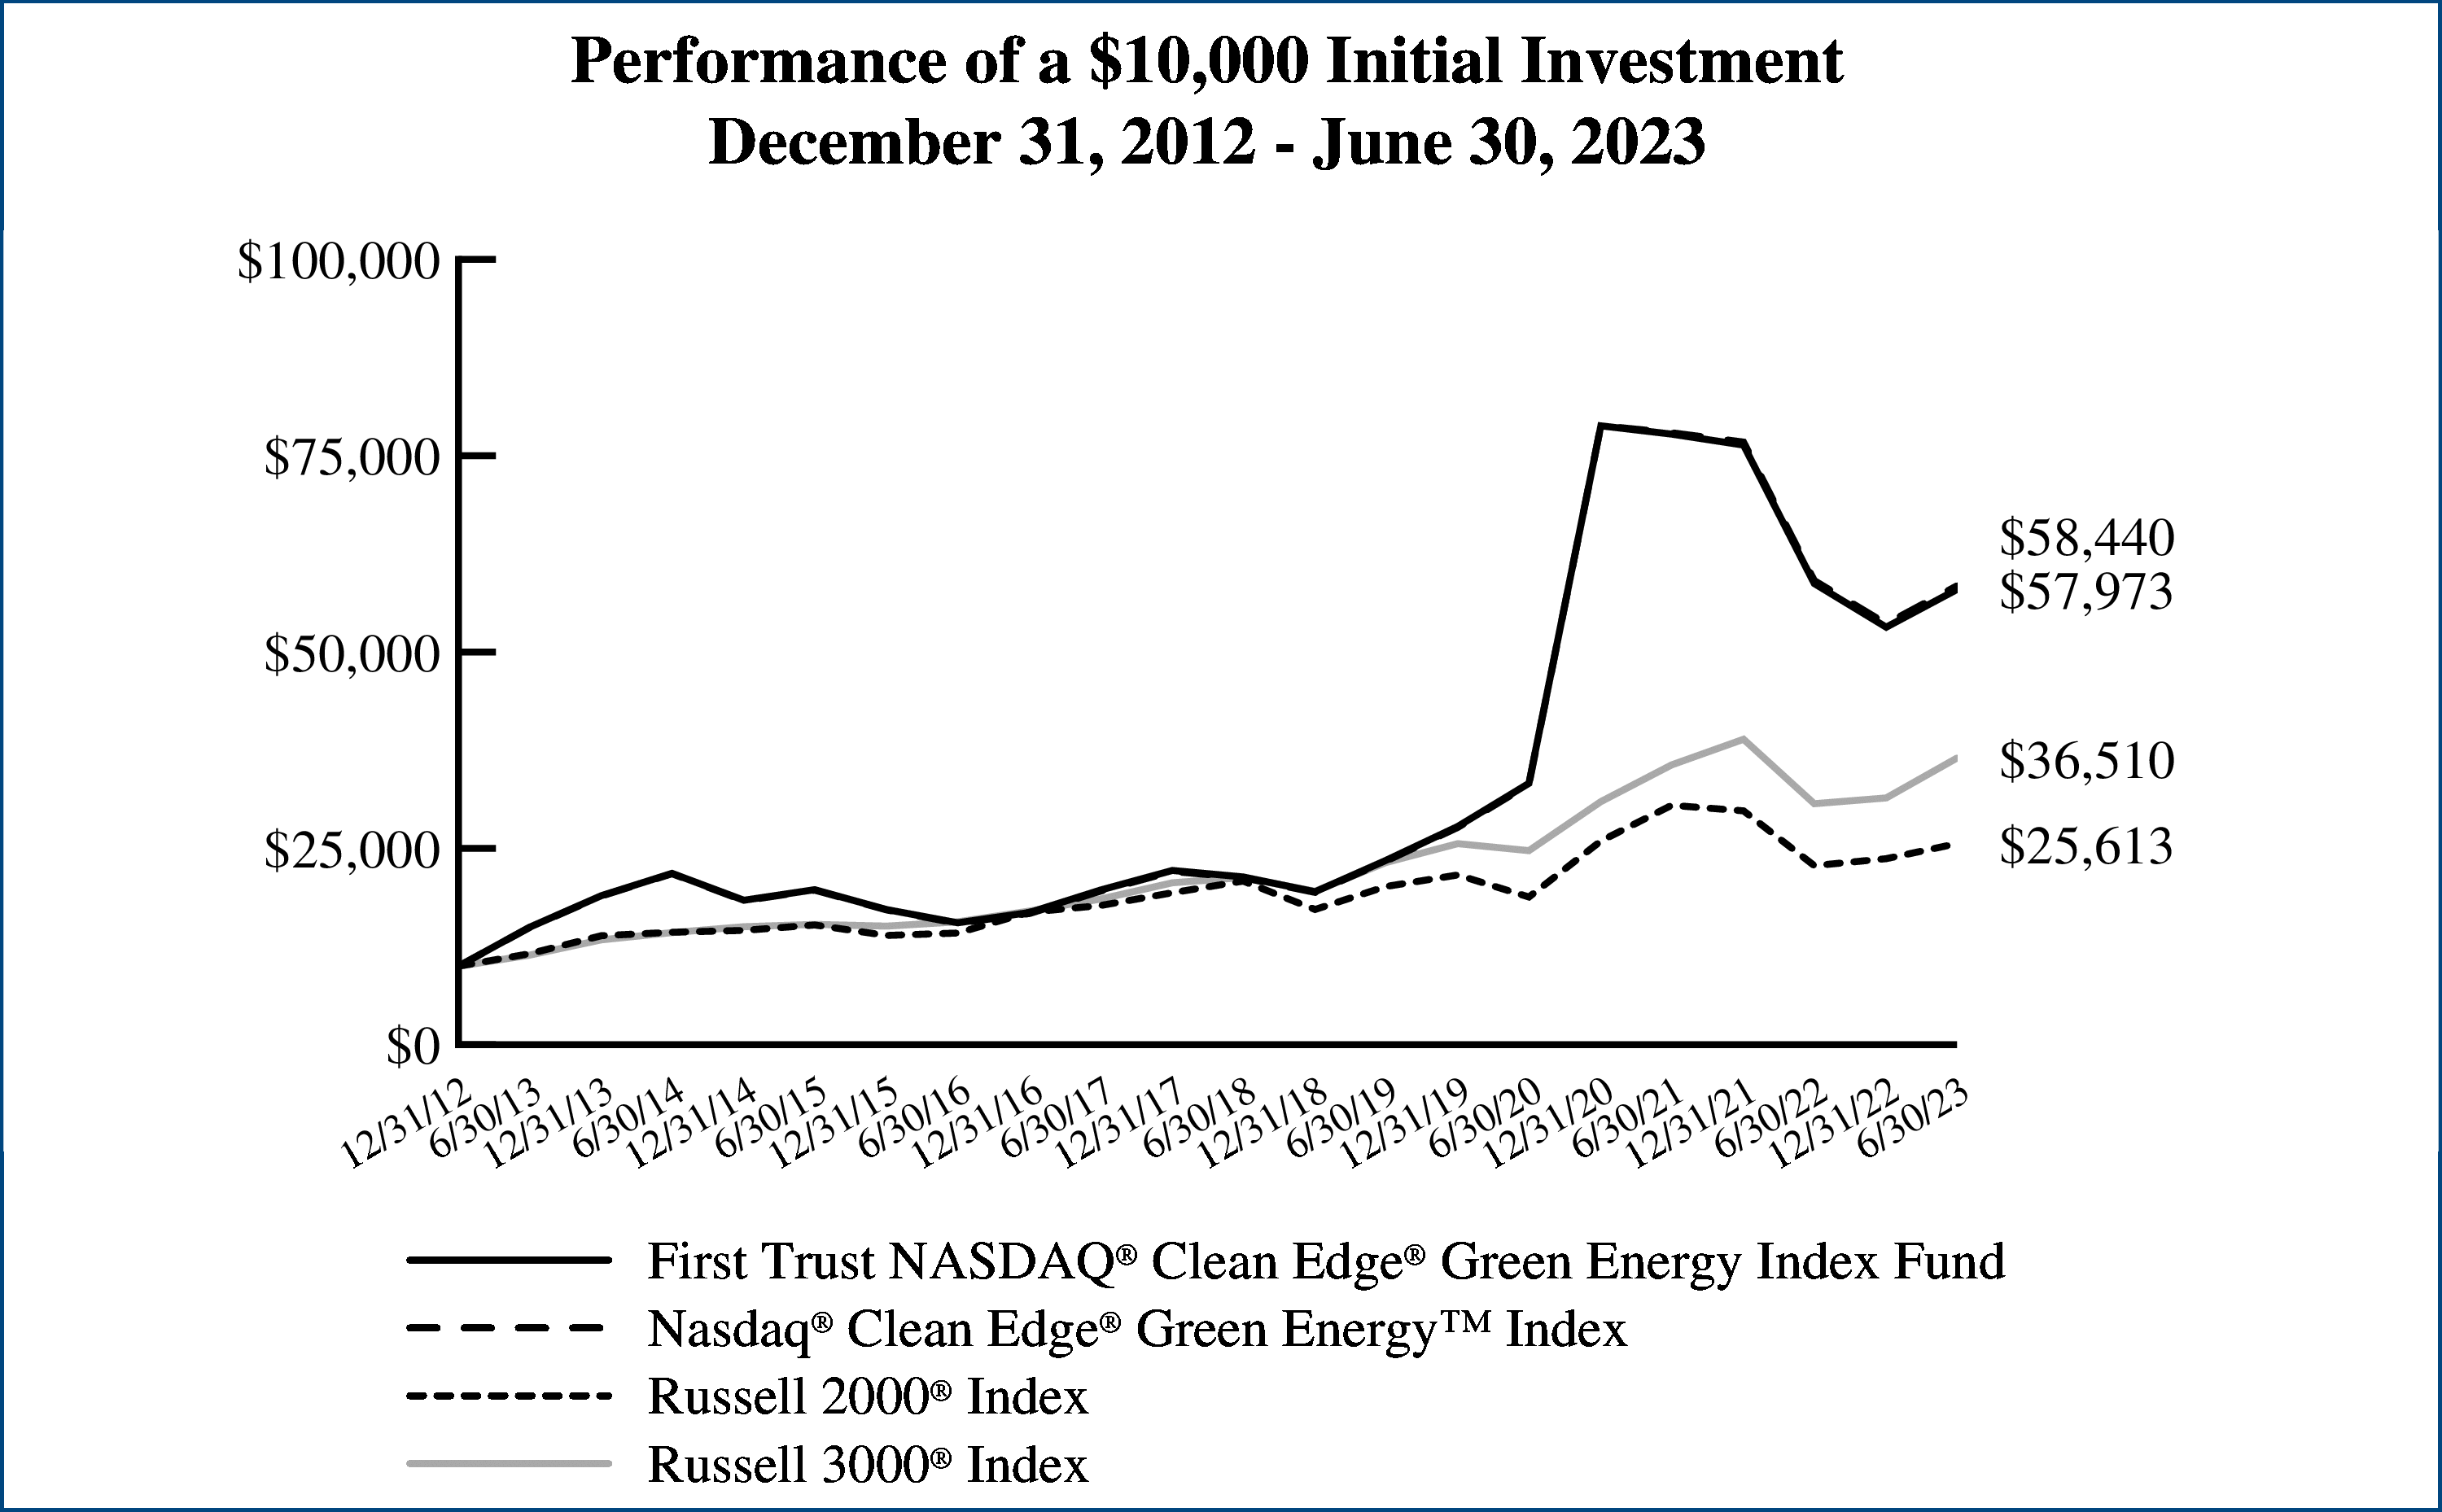 |
Performance figures assume reinvestment of
all distributions and do not reflect the
deduction of taxes that a shareholder would
pay on Fund distributions or the redemption
or sale of Fund shares. An index is a statistical
composite that tracks a specified financial
market or sector. Unlike the Fund, the indices
do not actually hold a portfolio of securities
and therefore do not incur the expenses
incurred by the Fund. These expenses
negatively impact the performance of the
Fund. The Fund’s past performance does not
predict future performance.
|
|
Performance
|
||||||||
|
|
|
|
Average Annual Total Returns
|
Cumulative Total Returns
|
||||
|
|
6 Months
Ended
6/30/23
|
1 Year
Ended
6/30/23
|
5 Years
Ended
6/30/23
|
10 Years
Ended
6/30/23
|
Inception
(5/8/07)
to 6/30/23
|
5 Years
Ended
6/30/23
|
10 Years
Ended
6/30/23
|
Inception
(5/8/07)
to 6/30/23
|
|
Fund Performance
|
|
|
|
|
|
|
|
|
|
NAV
|
5.07%
|
-0.56%
|
3.98%
|
5.73%
|
4.05%
|
21.55%
|
74.62%
|
89.78%
|
|
Market Price
|
5.08%
|
-0.60%
|
3.97%
|
5.73%
|
4.05%
|
21.51%
|
74.55%
|
89.72%
|
|
Index Performance
|
|
|
|
|
|
|
|
|
|
S&P United States REIT
Index(1)
|
5.45%
|
-0.06%
|
4.50%
|
6.27%
|
N/A
|
24.62%
|
83.75%
|
N/A
|
|
FTSE EPRA/NAREIT North
America Index
|
5.24%
|
-0.51%
|
3.69%
|
5.69%
|
4.15%
|
19.89%
|
73.90%
|
92.86%
|
|
Russell 3000® Index
|
16.17%
|
18.95%
|
11.39%
|
12.34%
|
8.90%
|
71.49%
|
220.10%
|
296.08%
|
|
(1)
|
On November 6, 2008, the Fund’s underlying index changed from the S&P REIT Composite Index to the S&P United States REIT Index.
Effective December 31, 2008, the S&P REIT Composite Index was discontinued. Therefore, the Fund’s performance and historical returns shown
for the periods prior to November 6, 2008 are not necessarily indicative of the performance that the Fund, based on its current
Index, would have
generated. The inception date of the Index was June 30, 2008. Returns for the Index are only disclosed for those periods in
which the Index was
in existence for the whole period.
|
|
REIT Allocation
|
% of Total
Long-Term
Investments
|
|
Industrial REITs
|
16.5%
|
|
Retail REITs
|
16.3
|
|
Multi-Family Residential REITs
|
12.3
|
|
Data Center REITs
|
10.7
|
|
Health Care REITs
|
10.5
|
|
Self-Storage REITs
|
9.1
|
|
Other Specialized REITs
|
6.9
|
|
Single-Family Residential REITs
|
6.0
|
|
Office REITs
|
5.4
|
|
Hotel & Resort REITs
|
3.5
|
|
Diversified REITs
|
2.8
|
|
Total
|
100.0%
|
|
Top Ten Holdings
|
% of Total
Long-Term
Investments
|
|
Prologis, Inc.
|
11.4%
|
|
Equinix, Inc.
|
7.4
|
|
Public Storage
|
4.6
|
|
Realty Income Corp.
|
4.0
|
|
Welltower, Inc.
|
4.0
|
|
Simon Property Group, Inc.
|
3.8
|
|
Digital Realty Trust, Inc.
|
3.3
|
|
VICI Properties, Inc.
|
3.2
|
|
AvalonBay Communities, Inc.
|
2.7
|
|
Equity Residential
|
2.3
|
|
Total
|
46.7%
|
S&P United States REIT Index (“Index”) is a product of S&P Dow Jones Indices LLC or its affiliates (“SPDJI”) and has been licensed for use by First Trust. S&P® is a registered trademark of Standard & Poor’s Financial Services LLC (“S&P”); Dow Jones® is a registered trademark of Dow Jones Trademark Holdings LLC (“Dow Jones”); and these trademarks have been licensed for use by SPDJI and sublicensed for certain purposes by First Trust. The Fund is not sponsored, endorsed, sold or promoted by SPDJI, Dow Jones, S&P, or their respective affiliates and none of such parties make any representation regarding the advisability of investing in such product nor do they have any liability for any errors, omissions, or interruptions of the Index.
 |
Performance figures assume reinvestment of
all distributions and do not reflect the
deduction of taxes that a shareholder would
pay on Fund distributions or the redemption
or sale of Fund shares. An index is a statistical
composite that tracks a specified financial
market or sector. Unlike the Fund, the indices
do not actually hold a portfolio of securities
and therefore do not incur the expenses
incurred by the Fund. These expenses
negatively impact the performance of the
Fund. The Fund’s past performance does not
predict future performance.
|
|
Performance
|
||||||||
|
|
|
|
Average Annual Total Returns
|
Cumulative Total Returns
|
||||
|
|
6 Months
Ended
6/30/23
|
1 Year
Ended
6/30/23
|
5 Years
Ended
6/30/23
|
10 Years
Ended
6/30/23
|
Inception
(5/8/07)
to 6/30/23
|
5 Years
Ended
6/30/23
|
10 Years
Ended
6/30/23
|
Inception
(5/8/07)
to 6/30/23
|
|
Fund Performance
|
|
|
|
|
|
|
|
|
|
NAV
|
11.93%
|
23.75%
|
13.70%
|
13.11%
|
10.48%
|
90.05%
|
242.68%
|
399.79%
|
|
Market Price
|
12.00%
|
23.81%
|
13.69%
|
13.12%
|
10.48%
|
89.98%
|
243.01%
|
399.88%
|
|
Index Performance
|
|
|
|
|
|
|
|
|
|
ISE Clean Edge WaterTM
Index
|
12.27%
|
24.49%
|
14.52%
|
13.81%
|
11.19%
|
96.96%
|
264.44%
|
454.61%
|
|
Russell 3000® Index
|
16.17%
|
18.95%
|
11.39%
|
12.34%
|
8.90%
|
71.49%
|
220.10%
|
296.08%
|
|
Sector Allocation
|
% of Total
Long-Term
Investments
|
|
Industrials
|
52.3%
|
|
Utilities
|
20.7
|
|
Health Care
|
10.8
|
|
Information Technology
|
8.9
|
|
Materials
|
5.8
|
|
Consumer Staples
|
1.5
|
|
Total
|
100.0%
|
|
Top Ten Holdings
|
% of Total
Long-Term
Investments
|
|
Ecolab, Inc.
|
4.4%
|
|
Advanced Drainage Systems, Inc.
|
4.2
|
|
Roper Technologies, Inc.
|
4.2
|
|
Xylem, Inc.
|
4.1
|
|
IDEXX Laboratories, Inc.
|
4.0
|
|
Tetra Tech, Inc.
|
3.9
|
|
Cia de Saneamento Basico do Estado de Sao
Paulo
|
3.9
|
|
American Water Works Co., Inc.
|
3.8
|
|
Pentair PLC
|
3.8
|
|
AECOM
|
3.7
|
|
Total
|
40.0%
|
Nasdaq®, Clean Edge®, and ISE Clean Edge WaterTM Index are registered trademarks and service marks of Nasdaq, Inc. and Clean Edge, Inc., respectively (together with its affiliates hereinafter referred to as the “Corporations”) and are licensed for use by First Trust. The Fund has not been passed on by the Corporations as to its legality or suitability. The Fund is not issued, endorsed, sold or promoted by the Corporations. THE CORPORATIONS MAKE NO WARRANTIES AND BEAR NO LIABILITY WITH RESPECT TO THE FUND.
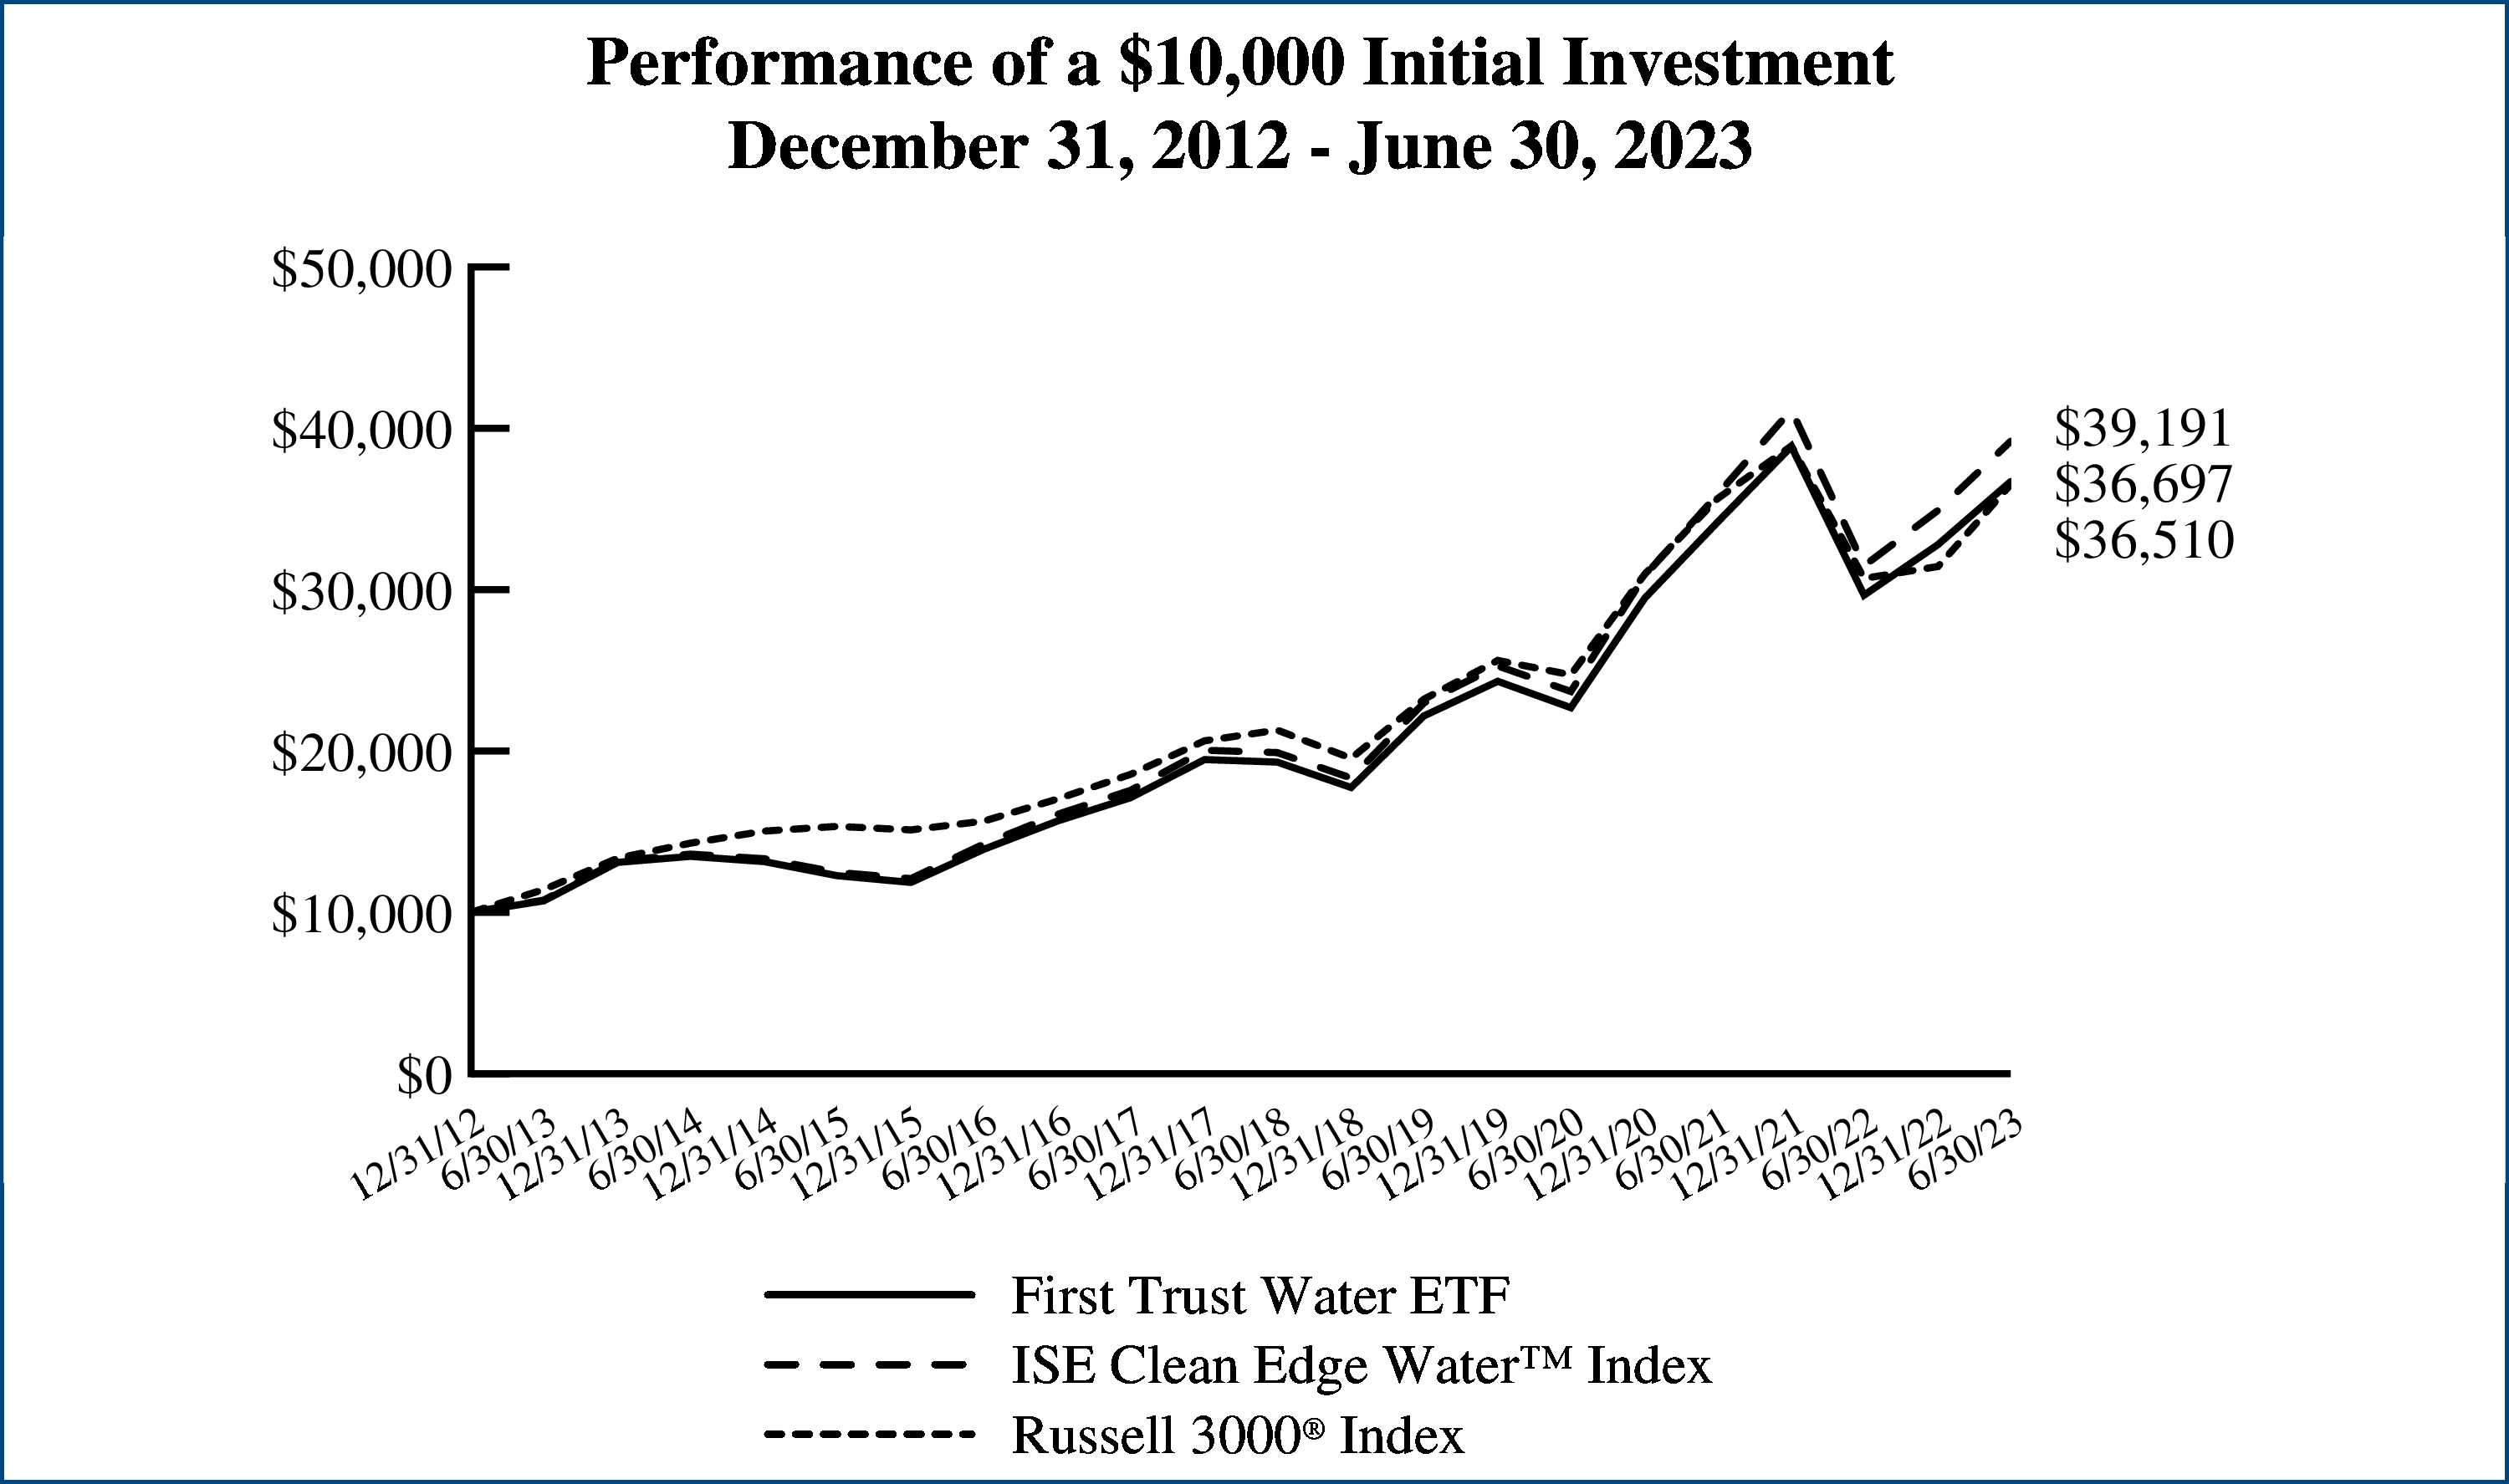 |
Performance figures assume reinvestment of
all distributions and do not reflect the
deduction of taxes that a shareholder would
pay on Fund distributions or the redemption
or sale of Fund shares. An index is a statistical
composite that tracks a specified financial
market or sector. Unlike the Fund, the indices
do not actually hold a portfolio of securities
and therefore do not incur the expenses
incurred by the Fund. These expenses
negatively impact the performance of the
Fund. The Fund’s past performance does not
predict future performance.
|
|
Performance
|
||||||||
|
|
|
|
Average Annual Total Returns
|
Cumulative Total Returns
|
||||
|
|
6 Months
Ended
6/30/23
|
1 Year
Ended
6/30/23
|
5 Years
Ended
6/30/23
|
10 Years
Ended
6/30/23
|
Inception
(5/8/07)
to 6/30/23
|
5 Years
Ended
6/30/23
|
10 Years
Ended
6/30/23
|
Inception
(5/8/07)
to 6/30/23
|
|
Fund Performance
|
|
|
|
|
|
|
|
|
|
NAV
|
-3.23%
|
10.35%
|
2.95%
|
-9.62%
|
-7.16%
|
15.63%
|
-63.64%
|
-69.87%
|
|
Market Price
|
-3.27%
|
10.30%
|
2.92%
|
-9.62%
|
-7.16%
|
15.49%
|
-63.63%
|
-69.87%
|
|
Index Performance
|
|
|
|
|
|
|
|
|
|
ISE-Revere Natural GasTM
Index
|
-2.86%
|
11.03%
|
2.55%
|
-9.78%
|
-7.02%
|
13.42%
|
-64.29%
|
-69.15%
|
|
S&P Composite 1500® Energy
Index
|
-5.33%
|
18.40%
|
5.65%
|
3.62%
|
3.96%
|
31.62%
|
42.65%
|
87.28%
|
|
Russell 3000® Index
|
16.17%
|
18.95%
|
11.39%
|
12.34%
|
8.90%
|
71.49%
|
220.10%
|
296.08%
|
|
Sub-Industry Allocation
|
% of Total
Long-Term
Investments
|
|
Oil & Gas Exploration & Production
|
86.2%
|
|
Oil & Gas Storage & Transportation
|
8.9
|
|
Integrated Oil & Gas
|
3.3
|
|
Gas Utilities
|
1.6
|
|
Total
|
100.0%
|
|
Top Ten Holdings
|
% of Total
Long-Term
Investments
|
|
Hess Midstream, L.P., Class A
|
4.5%
|
|
Western Midstream Partners, L.P.
|
4.3
|
|
ConocoPhillips
|
3.5
|
|
Pioneer Natural Resources Co.
|
3.4
|
|
EOG Resources, Inc.
|
3.3
|
|
Occidental Petroleum Corp.
|
3.3
|
|
Hess Corp.
|
3.2
|
|
Devon Energy Corp.
|
3.2
|
|
EQT Corp.
|
3.1
|
|
Coterra Energy, Inc.
|
3.0
|
|
Total
|
34.8%
|
Nasdaq® and ISE-Revere Natural GasTM Index are registered trademarks and service marks of Nasdaq, Inc. (together with its affiliates hereinafter referred to as the “Corporations”) and are licensed for use by First Trust. The Fund has not been passed on by the Corporations as to its legality or suitability. The Fund is not issued, endorsed, sold or promoted by the Corporations. THE CORPORATIONS MAKE NO WARRANTIES AND BEAR NO LIABILITY WITH RESPECT TO THE FUND.
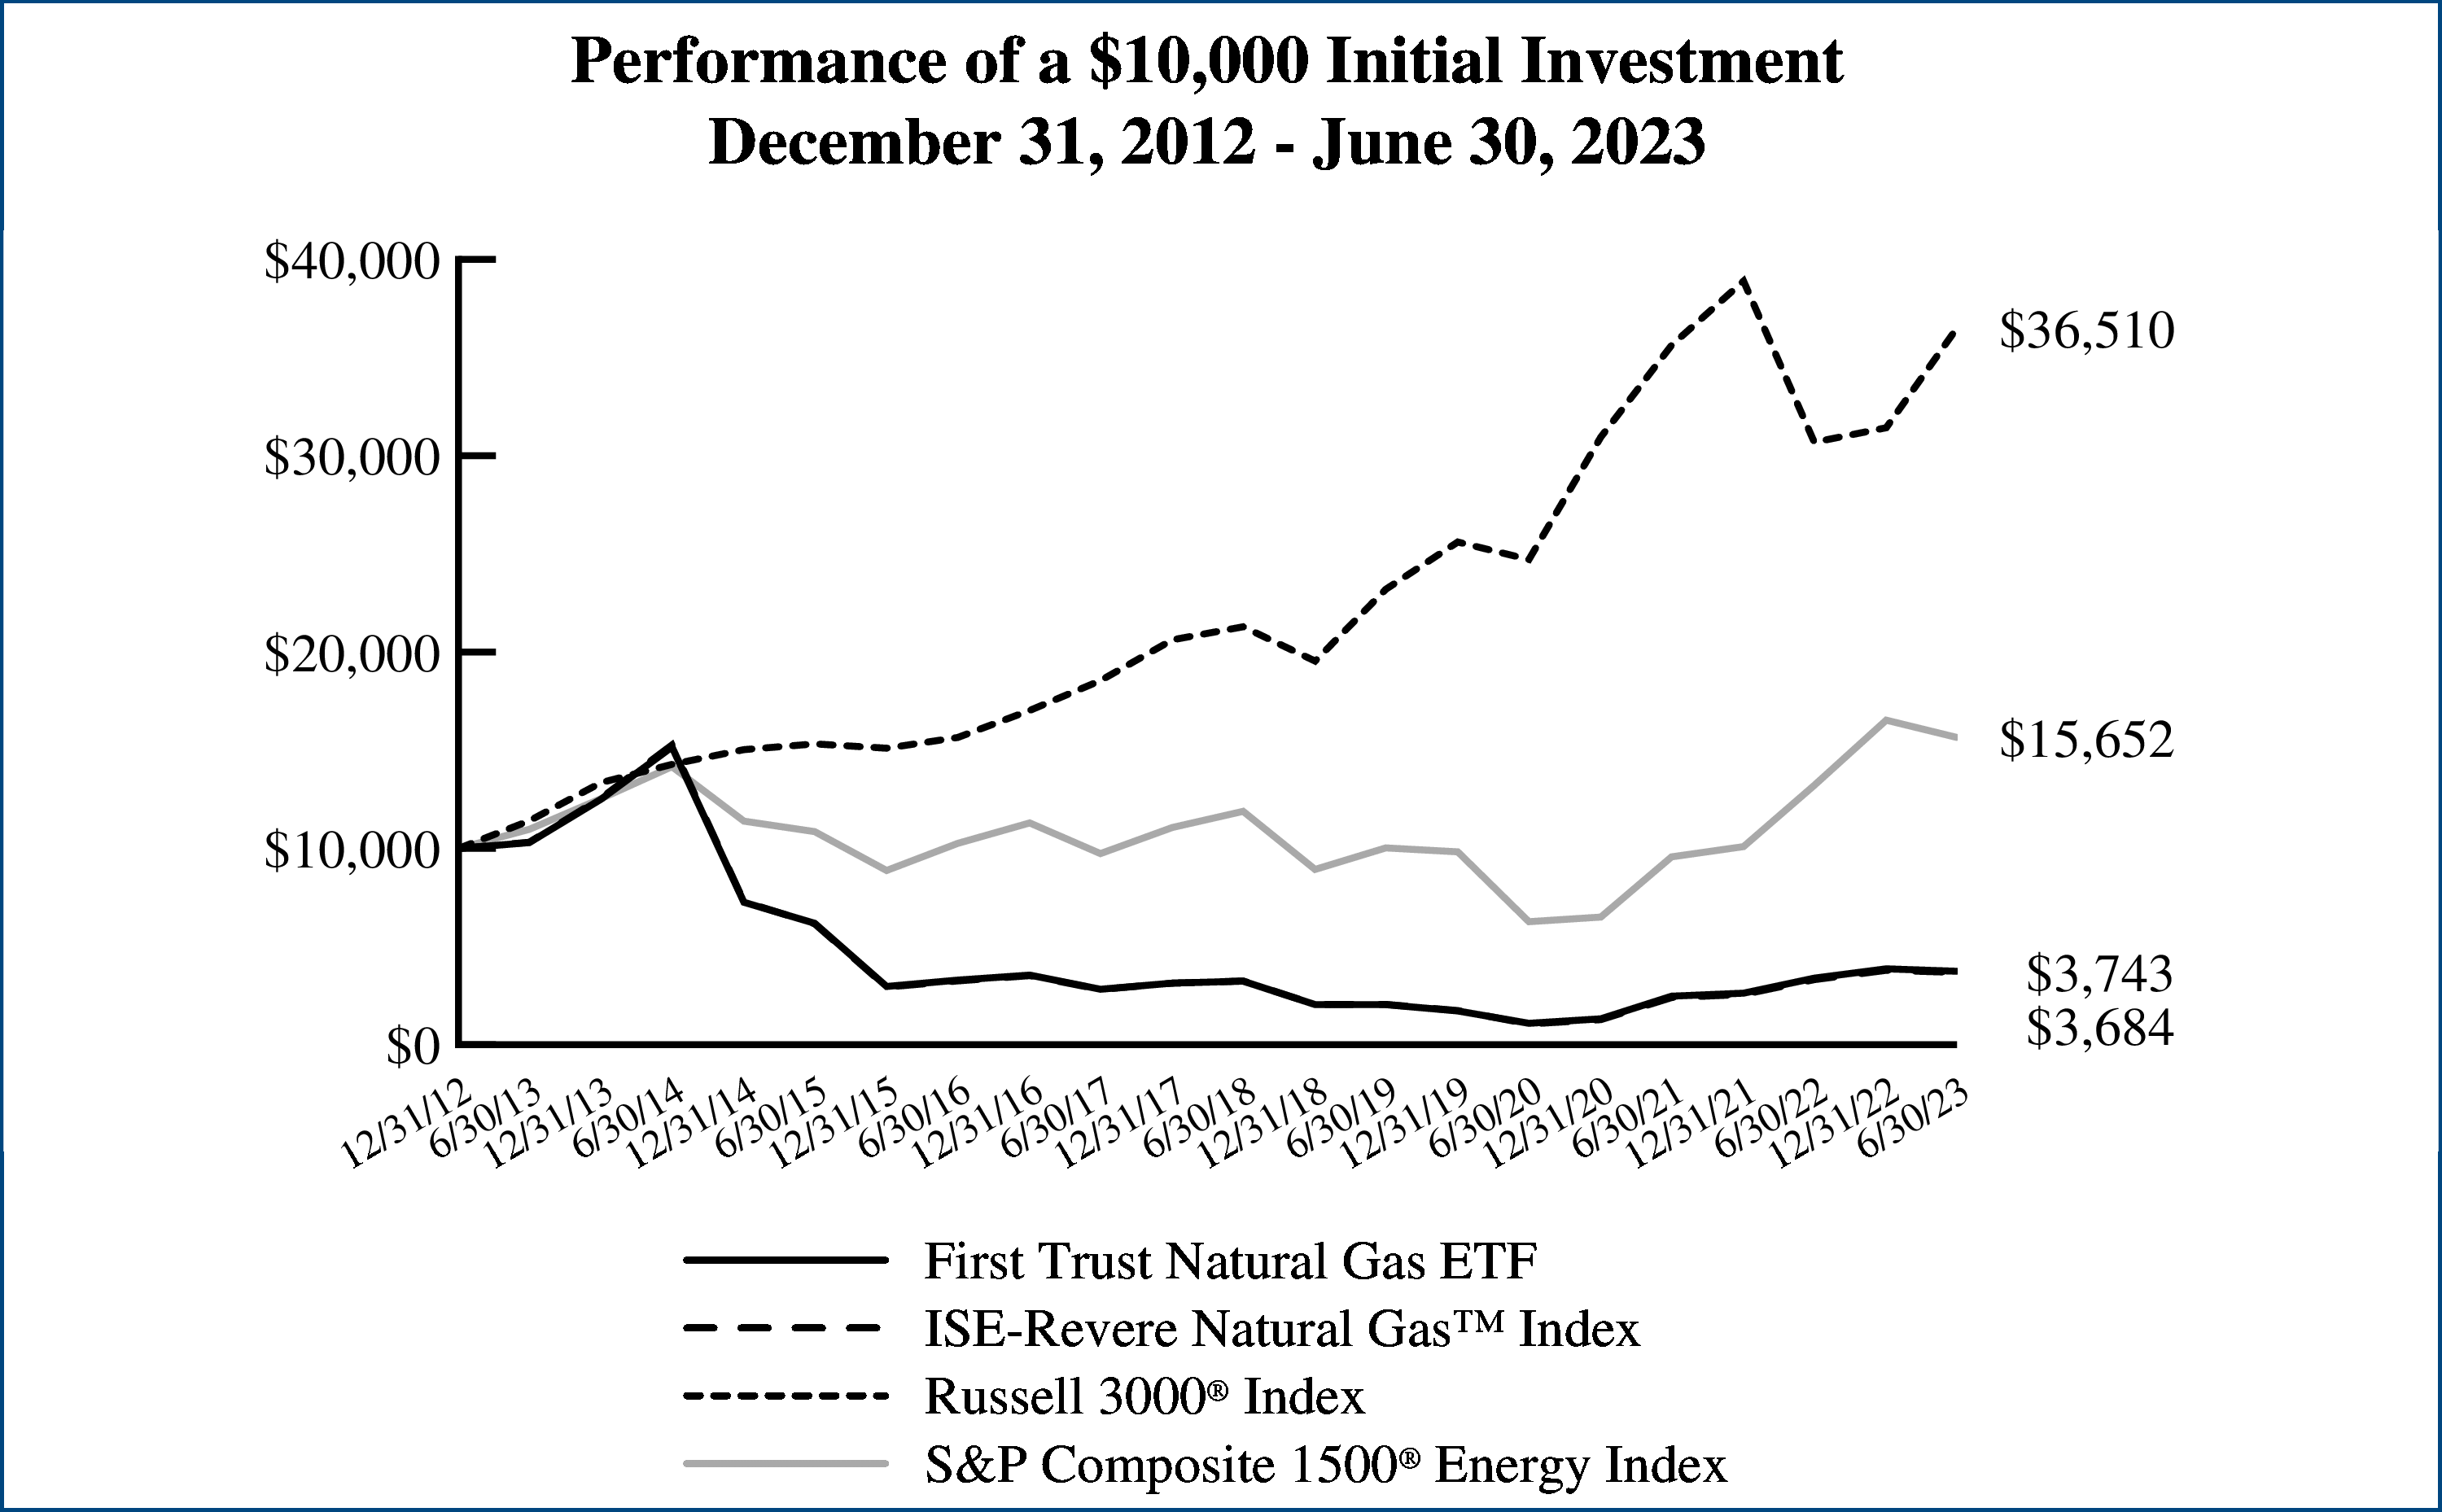 |
Performance figures assume reinvestment of
all distributions and do not reflect the
deduction of taxes that a shareholder would
pay on Fund distributions or the redemption
or sale of Fund shares. An index is a statistical
composite that tracks a specified financial
market or sector. Unlike the Fund, the indices
do not actually hold a portfolio of securities
and therefore do not incur the expenses
incurred by the Fund. These expenses
negatively impact the performance of the
Fund. The Fund’s past performance does not
predict future performance.
|
|
Performance
|
||||||||
|
|
|
|
Average Annual Total Returns
|
Cumulative Total Returns
|
||||
|
|
6 Months
Ended
6/30/23
|
1 Year
Ended
6/30/23
|
5 Years
Ended
6/30/23
|
10 Years
Ended
6/30/23
|
Inception
(6/29/09)
to 6/30/23
|
5 Years
Ended
6/30/23
|
10 Years
Ended
6/30/23
|
Inception
(6/29/09)
to 6/30/23
|
|
Fund Performance
|
|
|
|
|
|
|
|
|
|
NAV
|
-23.91%
|
-18.59%
|
-4.08%
|
4.67%
|
6.84%
|
-18.78%
|
57.80%
|
152.53%
|
|
Market Price
|
-23.91%
|
-18.52%
|
-4.08%
|
4.64%
|
6.84%
|
-18.79%
|
57.43%
|
152.62%
|
|
Index Performance
|
|
|
|
|
|
|
|
|
|
Nasdaq OMX® ABA
Community BankTM Index
|
-23.72%
|
-18.14%
|
-3.48%
|
5.32%
|
7.52%
|
-16.23%
|
67.92%
|
175.88%
|
|
S&P Composite 1500®
Financials Index
|
-1.43%
|
8.31%
|
6.66%
|
9.96%
|
11.42%
|
38.07%
|
158.46%
|
354.48%
|
|
Russell 3000® Index
|
16.17%
|
18.95%
|
11.39%
|
12.34%
|
13.83%
|
71.49%
|
220.10%
|
513.76%
|
|
Industry Allocation
|
% of Total
Long-Term
Investments
|
|
Banks
|
96.5%
|
|
Financial Services
|
3.5
|
|
Total
|
100.0%
|
|
Top Ten Holdings
|
% of Total
Long-Term
Investments
|
|
Commerce Bancshares, Inc.
|
3.6%
|
|
BOK Financial Corp.
|
3.2
|
|
SouthState Corp.
|
3.0
|
|
Bank OZK
|
2.7
|
|
Wintrust Financial Corp.
|
2.6
|
|
Pinnacle Financial Partners, Inc.
|
2.6
|
|
Columbia Banking System, Inc.
|
2.5
|
|
First Financial Bankshares, Inc.
|
2.4
|
|
United Bankshares, Inc.
|
2.4
|
|
TFS Financial Corp.
|
2.1
|
|
Total
|
27.1%
|
Nasdaq®, Nasdaq OMX®, OMX®, American Bankers Association®, ABA® and Nasdaq OMX® ABA Community BankTM Index are registered trademarks and service marks of Nasdaq, Inc. and American Bankers Associations, respectively (together with its affiliates hereinafter referred to as the “Corporations”) and are licensed for use by First Trust. The Fund has not been passed on by the Corporations as to its legality or suitability. The Fund is not issued, endorsed, sold or promoted by the Corporations. THE CORPORATIONS MAKE NO WARRANTIES AND BEAR NO LIABILITY WITH RESPECT TO THE FUND.
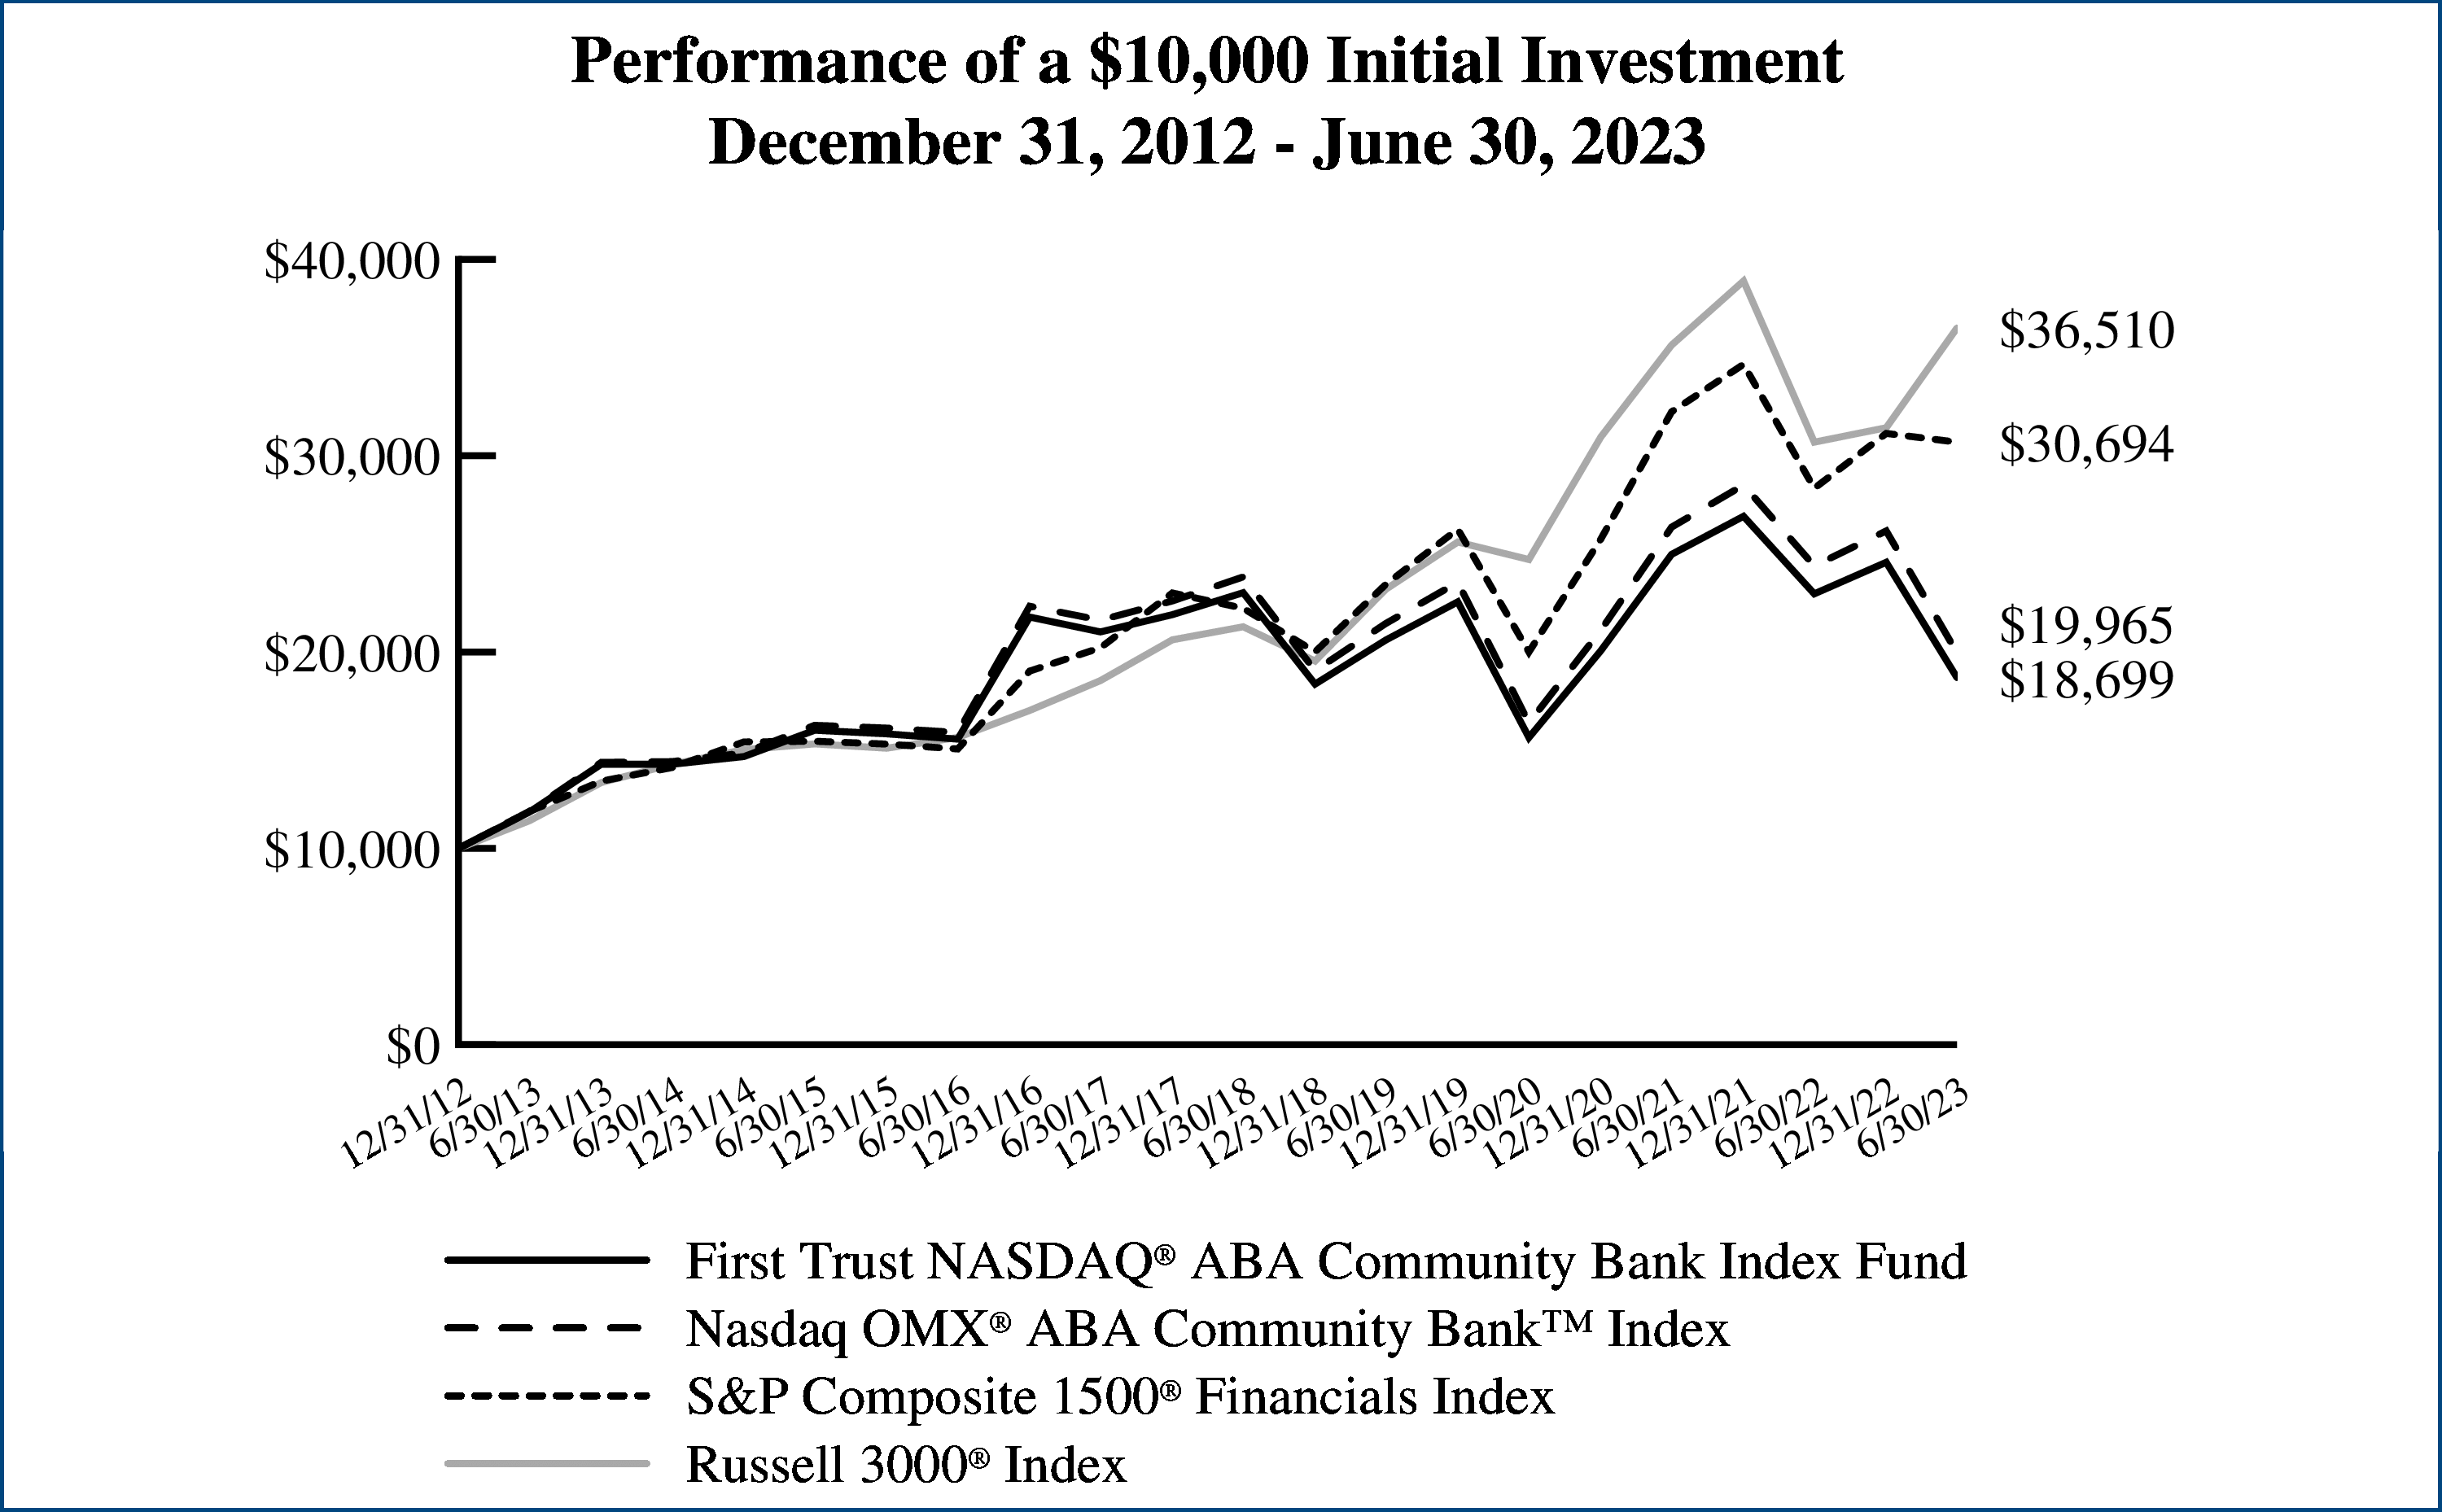 |
Performance figures assume reinvestment of
all distributions and do not reflect the
deduction of taxes that a shareholder would
pay on Fund distributions or the redemption
or sale of Fund shares. An index is a statistical
composite that tracks a specified financial
market or sector. Unlike the Fund, the indices
do not actually hold a portfolio of securities
and therefore do not incur the expenses
incurred by the Fund. These expenses
negatively impact the performance of the
Fund. The Fund’s past performance does not
predict future performance.
|
Understanding Your Fund Expenses
June 30, 2023 (Unaudited)
|
|
Beginning
Account Value
January 1, 2023
|
Ending
Account Value
June 30, 2023
|
Annualized
Expense Ratio
Based on the
Six-Month
Period (a)
|
Expenses Paid
During the
Six-Month
Period (b)
|
|
First Trust NASDAQ-100 Equal Weighted Index Fund (QQEW)
|
||||
|
Actual
|
$1,000.00
|
$1,209.40
|
0.57%
|
$3.12
|
|
Hypothetical (5% return before expenses)
|
$1,000.00
|
$1,021.97
|
0.57%
|
$2.86
|
|
First Trust NASDAQ-100-Technology Sector Index Fund (QTEC)
|
||||
|
Actual
|
$1,000.00
|
$1,400.30
|
0.57%
|
$3.39
|
|
Hypothetical (5% return before expenses)
|
$1,000.00
|
$1,021.97
|
0.57%
|
$2.86
|
|
First Trust NASDAQ-100 Ex-Technology Sector Index Fund (QQXT)
|
||||
|
Actual
|
$1,000.00
|
$1,108.90
|
0.60%
|
$3.14
|
|
Hypothetical (5% return before expenses)
|
$1,000.00
|
$1,021.82
|
0.60%
|
$3.01
|
|
First Trust NASDAQ® Clean Edge® Green Energy Index Fund (QCLN)
|
||||
|
Actual
|
$1,000.00
|
$1,090.30
|
0.58%
|
$3.01
|
|
Hypothetical (5% return before expenses)
|
$1,000.00
|
$1,021.92
|
0.58%
|
$2.91
|
|
First Trust S&P REIT Index Fund (FRI)
|
||||
|
Actual
|
$1,000.00
|
$1,050.70
|
0.50%
|
$2.54
|
|
Hypothetical (5% return before expenses)
|
$1,000.00
|
$1,022.32
|
0.50%
|
$2.51
|
|
First Trust Water ETF (FIW)
|
||||
|
Actual
|
$1,000.00
|
$1,119.30
|
0.53%
|
$2.78
|
|
Hypothetical (5% return before expenses)
|
$1,000.00
|
$1,022.17
|
0.53%
|
$2.66
|
Understanding Your Fund Expenses (Continued)
June 30, 2023 (Unaudited)
|
|
Beginning
Account Value
January 1, 2023
|
Ending
Account Value
June 30, 2023
|
Annualized
Expense Ratio
Based on the
Six-Month
Period (a)
|
Expenses Paid
During the
Six-Month
Period (b)
|
|
First Trust Natural Gas ETF (FCG)
|
||||
|
Actual
|
$1,000.00
|
$967.70
|
0.59%
|
$2.88
|
|
Hypothetical (5% return before expenses)
|
$1,000.00
|
$1,021.87
|
0.59%
|
$2.96
|
|
First Trust NASDAQ® ABA Community Bank Index Fund (QABA)
|
||||
|
Actual
|
$1,000.00
|
$760.90
|
0.60%
|
$2.62
|
|
Hypothetical (5% return before expenses)
|
$1,000.00
|
$1,021.82
|
0.60%
|
$3.01
|
|
(a)
|
These expense ratios reflect expense caps for certain Funds. See Note 3 in the Notes to Financial Statements.
|
|
(b)
|
Expenses are equal to the annualized expense ratio as indicated in the table multiplied by the average account value over
the period
(January 1, 2023 through June 30, 2023), multiplied by 181/365 (to reflect the six-month period).
|
Portfolio of Investments
June 30, 2023 (Unaudited)
|
Shares
|
Description
|
Value
|
|||
|
COMMON STOCKS — 100.0%
|
|||||
|
|
Automobiles — 2.1%
|
|
|||
|
2,882,335
|
Lucid Group, Inc. (a) (b)
|
$19,859,288
|
|||
|
71,690
|
Tesla, Inc. (a)
|
18,766,291
|
|||
|
|
|
38,625,579
|
|||
|
|
Beverages — 2.9%
|
|
|||
|
580,590
|
Keurig Dr Pepper, Inc.
|
18,155,049
|
|||
|
319,540
|
Monster Beverage Corp. (a)
|
18,354,378
|
|||
|
100,394
|
PepsiCo, Inc.
|
18,594,977
|
|||
|
|
|
55,104,404
|
|||
|
|
Biotechnology — 6.7%
|
|
|||
|
81,327
|
Amgen, Inc.
|
18,056,221
|
|||
|
62,784
|
Biogen, Inc. (a)
|
17,884,022
|
|||
|
236,846
|
Gilead Sciences, Inc.
|
18,253,721
|
|||
|
145,095
|
Moderna, Inc. (a)
|
17,629,043
|
|||
|
23,851
|
Regeneron Pharmaceuticals,
Inc. (a)
|
17,137,898
|
|||
|
94,179
|
Seagen, Inc. (a)
|
18,125,690
|
|||
|
53,686
|
Vertex Pharmaceuticals, Inc. (a)
|
18,892,640
|
|||
|
|
|
125,979,235
|
|||
|
|
Broadline Retail — 4.7%
|
|
|||
|
148,832
|
Amazon.com, Inc. (a)
|
19,401,740
|
|||
|
414,496
|
eBay, Inc.
|
18,523,826
|
|||
|
468,693
|
JD.com, Inc., ADR
|
15,996,492
|
|||
|
15,634
|
MercadoLibre, Inc. (a)
|
18,520,036
|
|||
|
233,851
|
PDD Holdings, Inc., ADR (a)
|
16,168,458
|
|||
|
|
|
88,610,552
|
|||
|
|
Commercial Services &
Supplies — 2.1%
|
|
|||
|
38,013
|
Cintas Corp.
|
18,895,502
|
|||
|
213,991
|
Copart, Inc. (a)
|
19,518,119
|
|||
|
|
|
38,413,621
|
|||
|
|
Communications Equipment
— 1.0%
|
|
|||
|
358,700
|
Cisco Systems, Inc.
|
18,559,138
|
|||
|
|
Consumer Staples Distribution
& Retail — 3.0%
|
|
|||
|
35,667
|
Costco Wholesale Corp.
|
19,202,399
|
|||
|
137,110
|
Dollar Tree, Inc. (a)
|
19,675,285
|
|||
|
571,734
|
Walgreens Boots Alliance, Inc.
|
16,288,702
|
|||
|
|
|
55,166,386
|
|||
|
|
Electric Utilities — 3.9%
|
|
|||
|
219,912
|
American Electric Power Co.,
Inc.
|
18,516,590
|
|||
|
201,067
|
Constellation Energy Corp.
|
18,407,684
|
|||
|
453,228
|
Exelon Corp.
|
18,464,509
|
|||
|
292,194
|
Xcel Energy, Inc.
|
18,165,701
|
|||
|
|
|
73,554,484
|
|||
|
|
Energy Equipment & Services
— 1.0%
|
|
|||
|
610,984
|
Baker Hughes Co.
|
19,313,204
|
|||
|
Shares
|
Description
|
Value
|
|||
|
|
|||||
|
|
Entertainment — 4.0%
|
|
|||
|
227,861
|
Activision Blizzard, Inc.
|
$19,208,682
|
|||
|
145,168
|
Electronic Arts, Inc.
|
18,828,290
|
|||
|
43,238
|
Netflix, Inc. (a)
|
19,045,907
|
|||
|
1,459,184
|
Warner Bros Discovery, Inc. (a)
|
18,298,167
|
|||
|
|
|
75,381,046
|
|||
|
|
Financial Services — 1.0%
|
|
|||
|
281,173
|
PayPal Holdings, Inc. (a)
|
18,762,674
|
|||
|
|
Food Products — 1.9%
|
|
|||
|
504,931
|
Kraft Heinz (The) Co.
|
17,925,051
|
|||
|
253,866
|
Mondelez International, Inc.,
Class A
|
18,516,986
|
|||
|
|
|
36,442,037
|
|||
|
|
Ground Transportation —
2.2%
|
|
|||
|
562,401
|
CSX Corp.
|
19,177,874
|
|||
|
57,386
|
Old Dominion Freight Line, Inc.
|
21,218,474
|
|||
|
|
|
40,396,348
|
|||
|
|
Health Care Equipment &
Supplies — 5.2%
|
|
|||
|
56,552
|
Align Technology, Inc. (a)
|
19,999,049
|
|||
|
143,561
|
Dexcom, Inc. (a)
|
18,449,024
|
|||
|
237,467
|
GE HealthCare Technologies,
Inc.
|
19,291,819
|
|||
|
38,667
|
IDEXX Laboratories, Inc. (a)
|
19,419,727
|
|||
|
56,709
|
Intuitive Surgical, Inc. (a)
|
19,391,076
|
|||
|
|
|
96,550,695
|
|||
|
|
Hotels, Restaurants & Leisure
— 4.0%
|
|
|||
|
145,153
|
Airbnb, Inc., Class A (a)
|
18,602,809
|
|||
|
7,071
|
Booking Holdings, Inc. (a)
|
19,094,033
|
|||
|
105,906
|
Marriott International, Inc.,
Class A
|
19,453,873
|
|||
|
183,346
|
Starbucks Corp.
|
18,162,255
|
|||
|
|
|
75,312,970
|
|||
|
|
Industrial Conglomerates —
1.0%
|
|
|||
|
92,020
|
Honeywell International, Inc.
|
19,094,150
|
|||
|
|
Interactive Media & Services
— 2.0%
|
|
|||
|
75,597
|
Alphabet, Inc., Class A (a)
|
9,048,961
|
|||
|
75,274
|
Alphabet, Inc., Class C (a)
|
9,105,896
|
|||
|
66,466
|
Meta Platforms, Inc., Class A (a)
|
19,074,412
|
|||
|
|
|
37,229,269
|
|||
|
|
IT Services — 1.0%
|
|
|||
|
286,995
|
Cognizant Technology Solutions
Corp., Class A
|
18,735,034
|
|||
|
|
Life Sciences Tools & Services
— 0.9%
|
|
|||
|
90,724
|
Illumina, Inc. (a)
|
17,009,843
|
|||
Portfolio of Investments (Continued)
June 30, 2023 (Unaudited)
|
Shares
|
Description
|
Value
|
|||
|
COMMON STOCKS (Continued)
|
|||||
|
|
Machinery — 1.1%
|
|
|||
|
237,534
|
PACCAR, Inc.
|
$19,869,719
|
|||
|
|
Media — 3.2%
|
|
|||
|
54,732
|
Charter Communications, Inc.,
Class A (a)
|
20,106,895
|
|||
|
453,333
|
Comcast Corp., Class A
|
18,835,986
|
|||
|
4,740,919
|
Sirius XM Holdings, Inc. (b)
|
21,476,363
|
|||
|
|
|
60,419,244
|
|||
|
|
Oil, Gas & Consumable Fuels
— 1.0%
|
|
|||
|
145,088
|
Diamondback Energy, Inc.
|
19,058,760
|
|||
|
|
Pharmaceuticals — 1.0%
|
|
|||
|
248,302
|
AstraZeneca PLC, ADR
|
17,770,974
|
|||
|
|
Professional Services — 3.0%
|
|
|||
|
84,391
|
Automatic Data Processing, Inc.
|
18,548,298
|
|||
|
164,429
|
Paychex, Inc.
|
18,394,672
|
|||
|
83,189
|
Verisk Analytics, Inc.
|
18,803,210
|
|||
|
|
|
55,746,180
|
|||
|
|
Real Estate Management &
Development — 1.1%
|
|
|||
|
221,984
|
CoStar Group, Inc. (a)
|
19,756,576
|
|||
|
|
Semiconductors &
Semiconductor Equipment
— 18.0%
|
|
|||
|
155,536
|
Advanced Micro Devices,
Inc. (a)
|
17,717,106
|
|||
|
99,156
|
Analog Devices, Inc.
|
19,316,580
|
|||
|
134,438
|
Applied Materials, Inc.
|
19,431,669
|
|||
|
25,873
|
ASML Holding N.V.
|
18,751,457
|
|||
|
21,513
|
Broadcom, Inc.
|
18,661,022
|
|||
|
102,740
|
Enphase Energy, Inc. (a)
|
17,206,895
|
|||
|
299,037
|
GLOBALFOUNDRIES,
Inc. (a) (b)
|
19,311,809
|
|||
|
513,542
|
Intel Corp.
|
17,172,844
|
|||
|
40,176
|
KLA Corp.
|
19,486,163
|
|||
|
30,486
|
Lam Research Corp.
|
19,598,230
|
|||
|
305,578
|
Marvell Technology, Inc.
|
18,267,453
|
|||
|
218,478
|
Microchip Technology, Inc.
|
19,573,444
|
|||
|
276,051
|
Micron Technology, Inc.
|
17,421,579
|
|||
|
43,748
|
NVIDIA Corp.
|
18,506,279
|
|||
|
94,406
|
NXP Semiconductors N.V.
|
19,323,020
|
|||
|
207,182
|
ON Semiconductor Corp. (a)
|
19,595,274
|
|||
|
152,246
|
QUALCOMM, Inc.
|
18,123,364
|
|||
|
105,664
|
Texas Instruments, Inc.
|
19,021,633
|
|||
|
|
|
336,485,821
|
|||
|
|
Software — 14.8%
|
|
|||
|
37,717
|
Adobe, Inc. (a)
|
18,443,236
|
|||
|
55,860
|
ANSYS, Inc. (a)
|
18,448,882
|
|||
|
105,046
|
Atlassian Corp., Class A (a)
|
17,627,769
|
|||
|
87,479
|
Autodesk, Inc. (a)
|
17,899,078
|
|||
|
Shares
|
Description
|
Value
|
|||
|
|
|||||
|
|
Software (Continued)
|
|
|||
|
79,194
|
Cadence Design Systems,
Inc. (a)
|
$18,572,577
|
|||
|
120,389
|
Crowdstrike Holdings, Inc.,
Class A (a)
|
17,681,533
|
|||
|
195,060
|
Datadog, Inc., Class A (a)
|
19,190,003
|
|||
|
256,630
|
Fortinet, Inc. (a)
|
19,398,662
|
|||
|
41,046
|
Intuit, Inc.
|
18,806,867
|
|||
|
54,559
|
Microsoft Corp.
|
18,579,522
|
|||
|
75,761
|
Palo Alto Networks, Inc. (a)
|
19,357,693
|
|||
|
42,334
|
Synopsys, Inc. (a)
|
18,432,647
|
|||
|
83,982
|
Workday, Inc., Class A (a)
|
18,970,694
|
|||
|
266,605
|
Zoom Video Communications,
Inc., Class A (a)
|
18,097,147
|
|||
|
121,268
|
Zscaler, Inc. (a)
|
17,741,508
|
|||
|
|
|
277,247,818
|
|||
|
|
Specialty Retail — 2.1%
|
|
|||
|
20,323
|
O’Reilly Automotive, Inc. (a)
|
19,414,562
|
|||
|
173,197
|
Ross Stores, Inc.
|
19,420,579
|
|||
|
|
|
38,835,141
|
|||
|
|
Technology Hardware, Storage
& Peripherals — 1.0%
|
|
|||
|
101,003
|
Apple, Inc.
|
19,591,552
|
|||
|
|
Textiles, Apparel & Luxury
Goods — 1.0%
|
|
|||
|
48,763
|
Lululemon Athletica, Inc. (a)
|
18,456,795
|
|||
|
|
Trading Companies &
Distributors — 1.0%
|
|
|||
|
330,101
|
Fastenal Co.
|
19,472,658
|
|||
|
|
Wireless Telecommunication
Services — 1.1%
|
|
|||
|
142,652
|
T-Mobile US, Inc. (a)
|
19,814,363
|
|||
|
|
Total Common Stocks
|
1,870,766,270
|
|||
|
|
(Cost $1,634,076,463)
|
|
|||
|
MONEY MARKET FUNDS — 0.7%
|
|||||
|
13,039,163
|
Goldman Sachs Financial Square
Treasury Obligations Fund -
Institutional Class -
4.99% (c) (d)
|
13,039,163
|
|||
|
|
(Cost $13,039,163)
|
|
|||
Portfolio of Investments (Continued)
June 30, 2023 (Unaudited)
|
Principal
Value
|
Description
|
Value
|
|||
|
REPURCHASE AGREEMENTS — 2.3%
|
|||||
|
$43,951,521
|
BNP Paribas S.A., 5.01% (c),
dated 06/30/23, due 07/03/23,
with a maturity value of
$43,969,871. Collateralized by
U.S. Treasury Securities,
interest rates of 1.25% to
1.50%, due 08/15/26 to
11/30/26. The value of the
collateral including accrued
interest is $44,881,225. (d)
|
$43,951,521
|
|||
|
|
(Cost $43,951,521)
|
|
|||
|
|
|||||
|
|
|||||
|
|
Total Investments — 103.0%
|
1,927,756,954
|
|||
|
|
(Cost $1,691,067,147)
|
|
|||
|
|
Net Other Assets and
Liabilities — (3.0)%
|
(56,790,511
)
|
|||
|
|
Net Assets — 100.0%
|
$1,870,966,443
|
|||
|
(a)
|
Non-income producing security.
|
|
(b)
|
All or a portion of this security is on loan (see Note 2D -
Securities Lending in the Notes to Financial Statements). The
remaining contractual maturity of all of the securities lending
transactions is overnight and continuous. The aggregate
value of such securities, including those sold and pending
settlement, is $56,751,350 and the total value of the collateral
held by the Fund is $56,990,684.
|
|
(c)
|
Rate shown reflects yield as of June 30, 2023.
|
|
(d)
|
This security serves as collateral for securities on loan.
|
|
Abbreviations throughout the Portfolio of Investments:
|
|
|
ADR
|
– American Depositary Receipt
|
Valuation Inputs
|
|
Total
Value at
6/30/2023
|
Level 1
Quoted
Prices
|
Level 2
Significant
Observable
Inputs
|
Level 3
Significant
Unobservable
Inputs
|
|
Common
Stocks*
|
$1,870,766,270
|
$1,870,766,270
|
$—
|
$—
|
|
Money
Market
Funds
|
13,039,163
|
13,039,163
|
—
|
—
|
|
Repurchase
Agreements
|
43,951,521
|
—
|
43,951,521
|
—
|
|
Total
Investments
|
$1,927,756,954
|
$1,883,805,433
|
$43,951,521
|
$—
|
|
*
|
See Portfolio of Investments for industry breakout.
|
Offsetting Assets and Liabilities
|
Securities Lending Agency Agreement
|
|
|
Total gross amount presented on the Statements
of Assets and Liabilities(1)
|
$56,751,350
|
|
Non-cash Collateral(2)
|
(56,751,350
)
|
|
Net Amount
|
$—
|
|
(1)
|
The amount presented on the Statements of Assets and
Liabilities, which is included in “Investments, at value,” is not
offset and is shown on a gross basis.
|
|
(2)
|
At June 30, 2023, the value of the collateral received from
each borrower exceeded the value of the related securities
loaned. This amount is disclosed on the Portfolio of
Investments.
|
|
Repurchase Agreements
|
|
|
Total gross amount presented on the Statements
of Assets and Liabilities(3)
|
$43,951,521
|
|
Non-cash Collateral(4)
|
(43,951,521
)
|
|
Net Amount
|
$—
|
|
(3)
|
The amount is included in “Investments, at value” on the
Statements of Assets and Liabilities.
|
|
(4)
|
At June 30, 2023, the value of the collateral received from
each seller exceeded the value of the repurchase agreements.
|
Portfolio of Investments
June 30, 2023 (Unaudited)
|
Shares
|
Description
|
Value
|
|||
|
COMMON STOCKS — 100.0%
|
|||||
|
|
Broadline Retail — 2.4%
|
|
|||
|
658,294
|
PDD Holdings, Inc., ADR (a)
|
$45,514,447
|
|||
|
|
Interactive Media & Services
— 5.4%
|
|
|||
|
212,814
|
Alphabet, Inc., Class A (a)
|
25,473,836
|
|||
|
211,905
|
Alphabet, Inc., Class C (a)
|
25,634,148
|
|||
|
187,110
|
Meta Platforms, Inc., Class A (a)
|
53,696,827
|
|||
|
|
|
104,804,811
|
|||
|
|
IT Services — 2.7%
|
|
|||
|
807,896
|
Cognizant Technology Solutions
Corp., Class A
|
52,739,451
|
|||
|
|
Semiconductors &
Semiconductor Equipment
— 46.4%
|
|
|||
|
437,857
|
Advanced Micro Devices,
Inc. (a)
|
49,876,291
|
|||
|
279,135
|
Analog Devices, Inc.
|
54,378,289
|
|||
|
378,449
|
Applied Materials, Inc.
|
54,701,019
|
|||
|
72,835
|
ASML Holding N.V.
|
52,787,166
|
|||
|
60,566
|
Broadcom, Inc.
|
52,536,766
|
|||
|
841,785
|
GLOBALFOUNDRIES,
Inc. (a) (b)
|
54,362,475
|
|||
|
1,445,639
|
Intel Corp.
|
48,342,168
|
|||
|
113,098
|
KLA Corp.
|
54,854,792
|
|||
|
85,820
|
Lam Research Corp.
|
55,170,245
|
|||
|
860,241
|
Marvell Technology, Inc.
|
51,425,207
|
|||
|
615,018
|
Microchip Technology, Inc.
|
55,099,463
|
|||
|
777,090
|
Micron Technology, Inc.
|
49,042,150
|
|||
|
123,156
|
NVIDIA Corp.
|
52,097,451
|
|||
|
265,746
|
NXP Semiconductors N.V.
|
54,392,891
|
|||
|
583,227
|
ON Semiconductor Corp. (a)
|
55,161,610
|
|||
|
428,578
|
QUALCOMM, Inc.
|
51,017,925
|
|||
|
297,454
|
Texas Instruments, Inc.
|
53,547,669
|
|||
|
|
|
898,793,577
|
|||
|
|
Software — 40.3%
|
|
|||
|
106,179
|
Adobe, Inc. (a)
|
51,920,469
|
|||
|
157,245
|
ANSYS, Inc. (a)
|
51,933,306
|
|||
|
295,714
|
Atlassian Corp., Class A (a)
|
49,623,766
|
|||
|
246,266
|
Autodesk, Inc. (a)
|
50,388,486
|
|||
|
222,939
|
Cadence Design Systems,
Inc. (a)
|
52,283,654
|
|||
|
338,906
|
Crowdstrike Holdings, Inc.,
Class A (a)
|
49,775,124
|
|||
|
549,116
|
Datadog, Inc., Class A (a)
|
54,022,032
|
|||
|
722,422
|
Fortinet, Inc. (a)
|
54,607,879
|
|||
|
115,548
|
Intuit, Inc.
|
52,942,938
|
|||
|
153,588
|
Microsoft Corp.
|
52,302,858
|
|||
|
213,272
|
Palo Alto Networks, Inc. (a)
|
54,493,129
|
|||
|
119,173
|
Synopsys, Inc. (a)
|
51,889,116
|
|||
|
236,411
|
Workday, Inc., Class A (a)
|
53,402,881
|
|||
|
Shares
|
Description
|
Value
|
|||
|
|
|||||
|
|
Software (Continued)
|
|
|||
|
750,469
|
Zoom Video Communications,
Inc., Class A (a)
|
$50,941,836
|
|||
|
341,392
|
Zscaler, Inc. (a)
|
49,945,650
|
|||
|
|
|
780,473,124
|
|||
|
|
Technology Hardware, Storage
& Peripherals — 2.8%
|
|
|||
|
284,328
|
Apple, Inc.
|
55,151,102
|
|||
|
|
Total Common Stocks
|
1,937,476,512
|
|||
|
|
(Cost $1,743,931,683)
|
|
|||
|
MONEY MARKET FUNDS — 0.6%
|
|||||
|
11,781,496
|
Goldman Sachs Financial Square
Treasury Obligations Fund -
Institutional Class -
4.99% (c) (d)
|
11,781,496
|
|||
|
|
(Cost $11,781,496)
|
|
|||
|
Principal
Value
|
Description
|
Value
|
|||
|
REPURCHASE AGREEMENTS — 2.1%
|
|||||
|
$39,712,263
|
BNP Paribas S.A., 5.01% (c),
dated 06/30/23, due 07/03/23,
with a maturity value of
$39,728,842. Collateralized by
U.S. Treasury Securities,
interest rates of 1.25% to
1.50%, due 08/15/26 to
11/30/26. The value of the
collateral including accrued
interest is $40,552,294. (d)
|
39,712,263
|
|||
|
|
(Cost $39,712,263)
|
|
|||
|
|
|||||
|
|
|||||
|
|
Total Investments — 102.7%
|
1,988,970,271
|
|||
|
|
(Cost $1,795,425,442)
|
|
|||
|
|
Net Other Assets and
Liabilities — (2.7)%
|
(51,412,405
)
|
|||
|
|
Net Assets — 100.0%
|
$1,937,557,866
|
|||
|
(a)
|
Non-income producing security.
|
|
(b)
|
All or a portion of this security is on loan (see Note 2D -
Securities Lending in the Notes to Financial Statements). The
remaining contractual maturity of all of the securities lending
transactions is overnight and continuous. The aggregate
value of such securities, including those sold and pending
settlement, is $51,641,526 and the total value of the collateral
held by the Fund is $51,493,759.
|
|
(c)
|
Rate shown reflects yield as of June 30, 2023.
|
|
(d)
|
This security serves as collateral for securities on loan.
|
|
Abbreviations throughout the Portfolio of Investments:
|
|
|
ADR
|
– American Depositary Receipt
|
Portfolio of Investments (Continued)
June 30, 2023 (Unaudited)
Valuation Inputs
|
|
Total
Value at
6/30/2023
|
Level 1
Quoted
Prices
|
Level 2
Significant
Observable
Inputs
|
Level 3
Significant
Unobservable
Inputs
|
|
Common
Stocks*
|
$1,937,476,512
|
$1,937,476,512
|
$—
|
$—
|
|
Money
Market
Funds
|
11,781,496
|
11,781,496
|
—
|
—
|
|
Repurchase
Agreements
|
39,712,263
|
—
|
39,712,263
|
—
|
|
Total
Investments
|
$1,988,970,271
|
$1,949,258,008
|
$39,712,263
|
$—
|
|
*
|
See Portfolio of Investments for industry breakout.
|
Offsetting Assets and Liabilities
|
Securities Lending Agency Agreement
|
|
|
Total gross amount presented on the Statements
of Assets and Liabilities(1)
|
$51,641,526
|
|
Non-cash Collateral(2)
|
(51,493,759
)
|
|
Net Amount
|
$147,767
|
|
(1)
|
The amount presented on the Statements of Assets and
Liabilities, which is included in “Investments, at value,” is not
offset and is shown on a gross basis.
|
|
(2)
|
The collateral requirements are determined at the beginning
of each business day based on the market value of the loaned
securities from the end of the prior day. On June 30, 2023, the
last business day of the period, there was sufficient collateral
based on the end of day market value from the prior business
day; however, as a result of market movement from June 29
to June 30, the value of the related securities loaned was
above the collateral value received. See Note 2D - Securities
Lending in the Notes to Financial Statements.
|
|
Repurchase Agreements
|
|
|
Total gross amount presented on the Statements
of Assets and Liabilities(3)
|
$39,712,263
|
|
Non-cash Collateral(4)
|
(39,712,263
)
|
|
Net Amount
|
$—
|
|
(3)
|
The amount is included in “Investments, at value” on the
Statements of Assets and Liabilities.
|
|
(4)
|
At June 30, 2023, the value of the collateral received from
each seller exceeded the value of the repurchase agreements.
|
Portfolio of Investments
June 30, 2023 (Unaudited)
|
Shares
|
Description
|
Value
|
|||
|
COMMON STOCKS (a) — 100.0%
|
|||||
|
|
Automobiles — 3.3%
|
|
|||
|
472,689
|
Lucid Group, Inc. (b) (c)
|
$3,256,827
|
|||
|
11,756
|
Tesla, Inc. (b)
|
3,077,368
|
|||
|
|
|
6,334,195
|
|||
|
|
Beverages — 4.7%
|
|
|||
|
95,214
|
Keurig Dr Pepper, Inc.
|
2,977,342
|
|||
|
52,404
|
Monster Beverage Corp. (b)
|
3,010,086
|
|||
|
16,464
|
PepsiCo, Inc.
|
3,049,462
|
|||
|
|
|
9,036,890
|
|||
|
|
Biotechnology — 10.6%
|
|
|||
|
13,337
|
Amgen, Inc.
|
2,961,081
|
|||
|
10,297
|
Biogen, Inc. (b)
|
2,933,100
|
|||
|
38,841
|
Gilead Sciences, Inc.
|
2,993,476
|
|||
|
23,794
|
Moderna, Inc. (b)
|
2,890,971
|
|||
|
3,912
|
Regeneron Pharmaceuticals,
Inc. (b)
|
2,810,928
|
|||
|
15,445
|
Seagen, Inc. (b)
|
2,972,545
|
|||
|
8,805
|
Vertex Pharmaceuticals, Inc. (b)
|
3,098,568
|
|||
|
|
|
20,660,669
|
|||
|
|
Broadline Retail — 6.1%
|
|
|||
|
24,409
|
Amazon.com, Inc. (b)
|
3,181,957
|
|||
|
67,977
|
eBay, Inc.
|
3,037,892
|
|||
|
76,864
|
JD.com, Inc., ADR
|
2,623,368
|
|||
|
2,564
|
MercadoLibre, Inc. (b)
|
3,037,315
|
|||
|
|
|
11,880,532
|
|||
|
|
Commercial Services &
Supplies — 3.2%
|
|
|||
|
6,234
|
Cintas Corp.
|
3,098,796
|
|||
|
35,094
|
Copart, Inc. (b)
|
3,200,924
|
|||
|
|
|
6,299,720
|
|||
|
|
Communications Equipment
— 1.6%
|
|
|||
|
58,825
|
Cisco Systems, Inc.
|
3,043,606
|
|||
|
|
Consumer Staples Distribution
& Retail — 4.7%
|
|
|||
|
5,849
|
Costco Wholesale Corp.
|
3,148,985
|
|||
|
22,486
|
Dollar Tree, Inc. (b)
|
3,226,741
|
|||
|
93,757
|
Walgreens Boots Alliance, Inc.
|
2,671,137
|
|||
|
|
|
9,046,863
|
|||
|
|
Electric Utilities — 6.2%
|
|
|||
|
36,065
|
American Electric Power Co.,
Inc.
|
3,036,673
|
|||
|
32,975
|
Constellation Energy Corp.
|
3,018,861
|
|||
|
74,327
|
Exelon Corp.
|
3,028,082
|
|||
|
47,920
|
Xcel Energy, Inc.
|
2,979,187
|
|||
|
|
|
12,062,803
|
|||
|
|
Energy Equipment & Services
— 1.6%
|
|
|||
|
100,197
|
Baker Hughes Co.
|
3,167,227
|
|||
|
Shares
|
Description
|
Value
|
|||
|
|
|||||
|
|
Entertainment — 6.4%
|
|
|||
|
37,368
|
Activision Blizzard, Inc.
|
$3,150,122
|
|||
|
23,807
|
Electronic Arts, Inc.
|
3,087,768
|
|||
|
7,091
|
Netflix, Inc. (b)
|
3,123,515
|
|||
|
239,299
|
Warner Bros Discovery, Inc. (b)
|
3,000,809
|
|||
|
|
|
12,362,214
|
|||
|
|
Financial Services — 1.6%
|
|
|||
|
46,109
|
PayPal Holdings, Inc. (b)
|
3,076,854
|
|||
|
|
Food Products — 3.1%
|
|
|||
|
82,807
|
Kraft Heinz (The) Co.
|
2,939,648
|
|||
|
41,634
|
Mondelez International, Inc.,
Class A
|
3,036,784
|
|||
|
|
|
5,976,432
|
|||
|
|
Ground Transportation —
3.4%
|
|
|||
|
92,232
|
CSX Corp.
|
3,145,111
|
|||
|
9,411
|
Old Dominion Freight Line, Inc.
|
3,479,717
|
|||
|
|
|
6,624,828
|
|||
|
|
Health Care Equipment &
Supplies — 8.2%
|
|
|||
|
9,274
|
Align Technology, Inc. (b)
|
3,279,657
|
|||
|
23,544
|
Dexcom, Inc. (b)
|
3,025,640
|
|||
|
38,945
|
GE HealthCare Technologies,
Inc.
|
3,163,892
|
|||
|
6,341
|
IDEXX Laboratories, Inc. (b)
|
3,184,640
|
|||
|
9,300
|
Intuitive Surgical, Inc. (b)
|
3,180,042
|
|||
|
|
|
15,833,871
|
|||
|
|
Hotels, Restaurants & Leisure
— 6.4%
|
|
|||
|
23,803
|
Airbnb, Inc., Class A (b)
|
3,050,592
|
|||
|
1,160
|
Booking Holdings, Inc. (b)
|
3,132,383
|
|||
|
17,368
|
Marriott International, Inc.,
Class A
|
3,190,328
|
|||
|
30,068
|
Starbucks Corp.
|
2,978,536
|
|||
|
|
|
12,351,839
|
|||
|
|
Industrial Conglomerates —
1.6%
|
|
|||
|
15,091
|
Honeywell International, Inc.
|
3,131,382
|
|||
|
|
Life Sciences Tools & Services
— 1.4%
|
|
|||
|
14,878
|
Illumina, Inc. (b)
|
2,789,476
|
|||
|
|
Machinery — 1.7%
|
|
|||
|
38,955
|
PACCAR, Inc.
|
3,258,586
|
|||
|
|
Media — 5.1%
|
|
|||
|
8,976
|
Charter Communications, Inc.,
Class A (b)
|
3,297,513
|
|||
|
74,345
|
Comcast Corp., Class A
|
3,089,035
|
|||
|
777,418
|
Sirius XM Holdings, Inc. (c)
|
3,521,703
|
|||
|
|
|
9,908,251
|
|||
Portfolio of Investments (Continued)
June 30, 2023 (Unaudited)
|
Shares
|
Description
|
Value
|
|||
|
COMMON STOCKS (a) (Continued)
|
|||||
|
|
Oil, Gas & Consumable Fuels
— 1.6%
|
|
|||
|
23,792
|
Diamondback Energy, Inc.
|
$3,125,317
|
|||
|
|
Pharmaceuticals — 1.5%
|
|
|||
|
40,721
|
AstraZeneca PLC, ADR
|
2,914,402
|
|||
|
|
Professional Services — 4.7%
|
|
|||
|
13,840
|
Automatic Data Processing, Inc.
|
3,041,894
|
|||
|
26,966
|
Paychex, Inc.
|
3,016,686
|
|||
|
13,643
|
Verisk Analytics, Inc.
|
3,083,727
|
|||
|
|
|
9,142,307
|
|||
|
|
Real Estate Management &
Development — 1.7%
|
|
|||
|
36,404
|
CoStar Group, Inc. (b)
|
3,239,956
|
|||
|
|
Semiconductors &
Semiconductor Equipment
— 1.4%
|
|
|||
|
16,847
|
Enphase Energy, Inc. (b)
|
2,821,536
|
|||
|
|
Specialty Retail — 3.3%
|
|
|||
|
3,333
|
O’Reilly Automotive, Inc. (b)
|
3,184,015
|
|||
|
28,403
|
Ross Stores, Inc.
|
3,184,828
|
|||
|
|
|
6,368,843
|
|||
|
|
Textiles, Apparel & Luxury
Goods — 1.6%
|
|
|||
|
7,997
|
Lululemon Athletica, Inc. (b)
|
3,026,865
|
|||
|
|
Trading Companies &
Distributors — 1.6%
|
|
|||
|
54,136
|
Fastenal Co.
|
3,193,483
|
|||
|
|
Wireless Telecommunication
Services — 1.7%
|
|
|||
|
23,394
|
T-Mobile US, Inc. (b)
|
3,249,427
|
|||
|
|
Total Common Stocks
|
193,928,374
|
|||
|
|
(Cost $173,678,610)
|
|
|||
|
MONEY MARKET FUNDS — 0.8%
|
|||||
|
1,450,217
|
Goldman Sachs Financial Square
Treasury Obligations Fund -
Institutional Class -
4.99% (d) (e)
|
1,450,217
|
|||
|
86,610
|
Morgan Stanley Institutional
Liquidity Funds - Treasury
Portfolio - Institutional Class -
4.94% (d)
|
86,610
|
|||
|
|
Total Money Market Funds
|
1,536,827
|
|||
|
|
(Cost $1,536,827)
|
|
|||
|
Principal
Value
|
Description
|
Value
|
|||
|
REPURCHASE AGREEMENTS — 2.5%
|
|||||
|
$4,888,294
|
BNP Paribas S.A., 5.01% (d),
dated 06/30/23, due 07/03/23,
with a maturity value of
$4,890,335. Collateralized by
U.S. Treasury Securities,
interest rates of 1.25% to
1.50%, due 08/15/26 to
11/30/26. The value of the
collateral including accrued
interest is $4,991,696. (e)
|
$4,888,294
|
|||
|
|
(Cost $4,888,294)
|
|
|||
|
|
|||||
|
|
|||||
|
|
Total Investments — 103.3%
|
200,353,495
|
|||
|
|
(Cost $180,103,731)
|
|
|||
|
|
Net Other Assets and
Liabilities — (3.3)%
|
(6,385,599
)
|
|||
|
|
Net Assets — 100.0%
|
$193,967,896
|
|||
|
(a)
|
The industry allocation is based on Standard & Poor’s Global
Industry Classification Standard (GICS), and is different than
the industry sector classification system used by the Index to
select securities, which is the Industry Classification
Benchmark (ICB) system, which is maintained by FTSE
International Limited.
|
|
(b)
|
Non-income producing security.
|
|
(c)
|
All or a portion of this security is on loan (see Note 2D -
Securities Lending in the Notes to Financial Statements). The
remaining contractual maturity of all of the securities lending
transactions is overnight and continuous. The aggregate
value of such securities, including those sold and pending
settlement, is $6,272,159 and the total value of the collateral
held by the Fund is $6,338,511.
|
|
(d)
|
Rate shown reflects yield as of June 30, 2023.
|
|
(e)
|
This security serves as collateral for securities on loan.
|
|
Abbreviations throughout the Portfolio of Investments:
|
|
|
ADR
|
– American Depositary Receipt
|
Portfolio of Investments (Continued)
June 30, 2023 (Unaudited)
Valuation Inputs
|
|
Total
Value at
6/30/2023
|
Level 1
Quoted
Prices
|
Level 2
Significant
Observable
Inputs
|
Level 3
Significant
Unobservable
Inputs
|
|
Common Stocks*
|
$193,928,374
|
$193,928,374
|
$—
|
$—
|
|
Money Market
Funds
|
1,536,827
|
1,536,827
|
—
|
—
|
|
Repurchase
Agreements
|
4,888,294
|
—
|
4,888,294
|
—
|
|
Total Investments
|
$200,353,495
|
$195,465,201
|
$4,888,294
|
$—
|
|
*
|
See Portfolio of Investments for industry breakout.
|
Offsetting Assets and Liabilities
|
Securities Lending Agency Agreement
|
|
|
Total gross amount presented on the Statements
of Assets and Liabilities(1)
|
$6,272,159
|
|
Non-cash Collateral(2)
|
(6,272,159
)
|
|
Net Amount
|
$—
|
|
(1)
|
The amount presented on the Statements of Assets and
Liabilities, which is included in “Investments, at value,” is not
offset and is shown on a gross basis.
|
|
(2)
|
At June 30, 2023, the value of the collateral received from
each borrower exceeded the value of the related securities
loaned. This amount is disclosed on the Portfolio of
Investments.
|
|
Repurchase Agreements
|
|
|
Total gross amount presented on the Statements
of Assets and Liabilities(3)
|
$4,888,294
|
|
Non-cash Collateral(4)
|
(4,888,294
)
|
|
Net Amount
|
$—
|
|
(3)
|
The amount is included in “Investments, at value” on the
Statements of Assets and Liabilities.
|
|
(4)
|
At June 30, 2023, the value of the collateral received from
each seller exceeded the value of the repurchase agreements.
|
Portfolio of Investments
June 30, 2023 (Unaudited)
|
Shares
|
Description
|
Value
|
|||
|
COMMON STOCKS — 100.0%
|
|||||
|
|
Automobiles — 17.6%
|
|
|||
|
1,353,857
|
Gogoro, Inc. (a) (b)
|
$4,670,807
|
|||
|
7,529,197
|
Lucid Group, Inc. (a) (b)
|
51,876,167
|
|||
|
566,483
|
Polestar Automotive Holding
UK PLC, Class A,
ADR (a) (b)
|
2,163,965
|
|||
|
3,966,503
|
Rivian Automotive, Inc.,
Class A (a)
|
66,081,940
|
|||
|
573,007
|
Tesla, Inc. (a)
|
149,996,042
|
|||
|
1,034,043
|
Workhorse Group, Inc. (a) (b)
|
901,272
|
|||
|
|
|
275,690,193
|
|||
|
|
Chemicals — 12.0%
|
|
|||
|
603,524
|
Albemarle Corp.
|
134,640,169
|
|||
|
995,788
|
Livent Corp. (a)
|
27,314,465
|
|||
|
347,017
|
Sociedad Quimica y Minera de
Chile S.A., ADR
|
25,200,375
|
|||
|
|
|
187,155,009
|
|||
|
|
Commercial Services &
Supplies — 0.4%
|
|
|||
|
977,180
|
Li-Cycle Holdings Corp. (a) (b)
|
5,423,349
|
|||
|
|
Construction & Engineering
— 0.6%
|
|
|||
|
189,174
|
Ameresco, Inc., Class A (a)
|
9,199,532
|
|||
|
|
Electrical Equipment — 16.6%
|
|
|||
|
176,295
|
Acuity Brands, Inc.
|
28,750,189
|
|||
|
164,082
|
American Superconductor
Corp. (a)
|
1,027,153
|
|||
|
836,353
|
Array Technologies, Inc. (a)
|
18,901,578
|
|||
|
1,655,957
|
Ballard Power Systems,
Inc. (a) (b)
|
7,219,972
|
|||
|
59,656
|
Beam Global (a) (b)
|
617,440
|
|||
|
339,137
|
Blink Charging Co. (a) (b)
|
2,031,431
|
|||
|
1,069,272
|
Bloom Energy Corp., Class A (a)
|
17,482,597
|
|||
|
1,958,593
|
ChargePoint Holdings,
Inc. (a) (b)
|
17,216,032
|
|||
|
226,808
|
EnerSys
|
24,613,204
|
|||
|
662,308
|
Eos Energy Enterprises,
Inc. (a) (b)
|
2,874,417
|
|||
|
855,833
|
ESS Tech, Inc. (a) (b)
|
1,258,074
|
|||
|
648,279
|
Fluence Energy, Inc. (a) (b)
|
17,270,153
|
|||
|
619,253
|
FTC Solar, Inc. (a) (b)
|
1,993,995
|
|||
|
2,249,439
|
FuelCell Energy, Inc. (a) (b)
|
4,858,788
|
|||
|
157,274
|
LSI Industries, Inc.
|
1,975,361
|
|||
|
3,329,468
|
Plug Power, Inc. (a) (b)
|
34,593,172
|
|||
|
941,512
|
Shoals Technologies Group, Inc.,
Class A (a)
|
24,065,047
|
|||
|
862,272
|
Stem, Inc. (a) (b)
|
4,932,196
|
|||
|
970,019
|
SunPower Corp. (a) (b)
|
9,506,186
|
|||
|
1,195,384
|
Sunrun, Inc. (a)
|
21,349,558
|
|||
|
235,515
|
TPI Composites, Inc. (a)
|
2,442,291
|
|||
|
866,611
|
Tritium DCFC Ltd. (a) (b)
|
944,606
|
|||
|
Shares
|
Description
|
Value
|
|||
|
|
|||||
|
|
Electrical Equipment
(Continued)
|
|
|||
|
180,025
|
Vicor Corp. (a)
|
$9,721,350
|
|||
|
826,935
|
Wallbox N.V. (a) (b)
|
2,927,350
|
|||
|
|
|
258,572,140
|
|||
|
|
Electronic Equipment,
Instruments & Components
— 2.6%
|
|
|||
|
208,093
|
Advanced Energy Industries,
Inc.
|
23,191,965
|
|||
|
251,831
|
Itron, Inc. (a)
|
18,157,015
|
|||
|
|
|
41,348,980
|
|||
|
|
Independent Power and
Renewable Electricity
Producers — 10.3%
|
|
|||
|
881,465
|
Altus Power, Inc. (a) (b)
|
4,759,911
|
|||
|
643,971
|
Atlantica Sustainable
Infrastructure PLC
|
15,094,680
|
|||
|
336,734
|
Azure Power Global Ltd. (a) (b)
|
596,019
|
|||
|
1,527,042
|
Brookfield Renewable Partners,
L.P. (c)
|
45,032,469
|
|||
|
456,759
|
Clearway Energy, Inc., Class C
|
13,045,037
|
|||
|
796,482
|
Montauk Renewables, Inc. (a)
|
5,925,826
|
|||
|
492,888
|
NextEra Energy Partners,
L.P. (c) (d)
|
28,902,953
|
|||
|
331,018
|
Ormat Technologies, Inc.
|
26,633,708
|
|||
|
1,566,053
|
ReNew Energy Global PLC,
Class A (a) (b)
|
8,581,971
|
|||
|
644,730
|
Sunnova Energy International,
Inc. (a) (b)
|
11,805,006
|
|||
|
|
|
160,377,580
|
|||
|
|
Machinery — 0.4%
|
|
|||
|
1,239,243
|
Lion Electric (The) Co. (a) (b)
|
2,292,600
|
|||
|
1,715,514
|
Microvast Holdings, Inc. (a) (b)
|
2,744,822
|
|||
|
1,261,172
|
Proterra, Inc. (a)
|
1,513,406
|
|||
|
|
|
6,550,828
|
|||
|
|
Metals & Mining — 1.4%
|
|
|||
|
984,758
|
MP Materials Corp. (a)
|
22,531,263
|
|||
|
|
Mortgage Real Estate
Investment Trusts — 1.0%
|
|
|||
|
592,735
|
Hannon Armstrong Sustainable
Infrastructure Capital, Inc.
|
14,818,375
|
|||
|
|
Oil, Gas & Consumable Fuels
— 0.1%
|
|
|||
|
153,541
|
OPAL Fuels, Inc., Class A (a)
|
1,145,416
|
|||
|
|
Semiconductors &
Semiconductor Equipment
— 36.9%
|
|
|||
|
1,063,129
|
Allegro MicroSystems, Inc. (a)
|
47,989,643
|
|||
|
672,032
|
Enphase Energy, Inc. (a)
|
112,551,919
|
|||
|
549,459
|
First Solar, Inc. (a)
|
104,446,661
|
|||
Portfolio of Investments (Continued)
June 30, 2023 (Unaudited)
|
Shares
|
Description
|
Value
|
|||
|
COMMON STOCKS (Continued)
|
|||||
|
|
Semiconductors &
Semiconductor Equipment
(Continued)
|
|
|||
|
290,994
|
Maxeon Solar Technologies
Ltd. (a) (b)
|
$8,194,391
|
|||
|
947,734
|
Navitas Semiconductor
Corp. (a) (b)
|
9,989,116
|
|||
|
1,397,766
|
ON Semiconductor Corp. (a)
|
132,200,708
|
|||
|
317,965
|
Power Integrations, Inc.
|
30,101,747
|
|||
|
205,129
|
SolarEdge Technologies, Inc. (a)
|
55,189,958
|
|||
|
262,428
|
Universal Display Corp.
|
37,823,748
|
|||
|
690,105
|
Wolfspeed, Inc. (a)
|
38,362,937
|
|||
|
|
|
576,850,828
|
|||
|
|
Specialty Retail — 0.1%
|
|
|||
|
565,776
|
EVgo, Inc. (a) (b)
|
2,263,104
|
|||
|
|
Total Common Stocks
|
1,561,926,597
|
|||
|
|
(Cost $1,902,031,434)
|
|
|||
|
MONEY MARKET FUNDS — 2.5%
|
|||||
|
38,977,408
|
Goldman Sachs Financial Square
Treasury Obligations Fund -
Institutional Class -
4.99% (e) (f)
|
38,977,408
|
|||
|
|
(Cost $38,977,408)
|
|
|||
|
Principal
Value
|
Description
|
Value
|
|||
|
REPURCHASE AGREEMENTS — 8.4%
|
|||||
|
$131,382,386
|
BNP Paribas S.A., 5.01% (e),
dated 06/30/23, due 07/03/23,
with a maturity value of
$131,437,238. Collateralized
by U.S. Treasury Securities,
interest rates of 1.25% to
1.50%, due 08/15/26 to
11/30/26. The value of the
collateral including accrued
interest is $134,161,510. (f)
|
131,382,386
|
|||
|
|
(Cost $131,382,386)
|
|
|||
|
|
|||||
|
|
|||||
|
|
Total Investments — 110.9%
|
1,732,286,391
|
|||
|
|
(Cost $2,072,391,228)
|
|
|||
|
|
Net Other Assets and
Liabilities — (10.9)%
|
(169,834,335
)
|
|||
|
|
Net Assets — 100.0%
|
$1,562,452,056
|
|||
|
(a)
|
Non-income producing security.
|
|
(b)
|
All or a portion of this security is on loan (see Note 2D -
Securities Lending in the Notes to Financial Statements). The
remaining contractual maturity of all of the securities lending
transactions is overnight and continuous. The aggregate
value of such securities, including those sold and pending
settlement, is $167,526,853 and the total value of the
collateral held by the Fund is $170,359,794.
|
|
(c)
|
Security is a Master Limited Partnership (“MLP”).
|
|
(d)
|
This security is taxed as a “C” corporation for federal income
tax purposes.
|
|
(e)
|
Rate shown reflects yield as of June 30, 2023.
|
|
(f)
|
This security serves as collateral for securities on loan.
|
|
Abbreviations throughout the Portfolio of Investments:
|
|
|
ADR
|
– American Depositary Receipt
|
Valuation Inputs
|
|
Total
Value at
6/30/2023
|
Level 1
Quoted
Prices
|
Level 2
Significant
Observable
Inputs
|
Level 3
Significant
Unobservable
Inputs
|
|
Common
Stocks*
|
$1,561,926,597
|
$1,561,926,597
|
$—
|
$—
|
|
Money
Market
Funds
|
38,977,408
|
38,977,408
|
—
|
—
|
|
Repurchase
Agreements
|
131,382,386
|
—
|
131,382,386
|
—
|
|
Total
Investments
|
$1,732,286,391
|
$1,600,904,005
|
$131,382,386
|
$—
|
|
*
|
See Portfolio of Investments for industry breakout.
|
Portfolio of Investments (Continued)
June 30, 2023 (Unaudited)
Offsetting Assets and Liabilities
|
Securities Lending Agency Agreement
|
|
|
Total gross amount presented on the Statements
of Assets and Liabilities(1)
|
$167,526,853
|
|
Non-cash Collateral(2)
|
(167,526,853
)
|
|
Net Amount
|
$—
|
|
(1)
|
The amount presented on the Statements of Assets and
Liabilities, which is included in “Investments, at value,” is not
offset and is shown on a gross basis.
|
|
(2)
|
At June 30, 2023, the value of the collateral received from
each borrower exceeded the value of the related securities
loaned. This amount is disclosed on the Portfolio of
Investments.
|
|
Repurchase Agreements
|
|
|
Total gross amount presented on the Statements
of Assets and Liabilities(3)
|
$131,382,386
|
|
Non-cash Collateral(4)
|
(131,382,386
)
|
|
Net Amount
|
$—
|
|
(3)
|
The amount is included in “Investments, at value” on the
Statements of Assets and Liabilities.
|
|
(4)
|
At June 30, 2023, the value of the collateral received from
each seller exceeded the value of the repurchase agreements.
|
Portfolio of Investments
June 30, 2023 (Unaudited)
|
Shares
|
Description
|
Value
|
|||
|
COMMON STOCKS — 99.5%
|
|||||
|
|
Data Center REITs — 10.6%
|
|
|||
|
34,409
|
Digital Realty Trust, Inc.
|
$3,918,153
|
|||
|
11,045
|
Equinix, Inc.
|
8,658,617
|
|||
|
|
|
12,576,770
|
|||
|
|
Diversified REITs — 2.8%
|
|
|||
|
8,574
|
Alexander & Baldwin, Inc.
|
159,305
|
|||
|
1,529
|
Alpine, Inc.ome Property Trust,
Inc.
|
24,846
|
|||
|
6,167
|
American Assets Trust, Inc.
|
118,406
|
|||
|
8,024
|
Armada Hoffler Properties, Inc.
|
93,720
|
|||
|
22,109
|
Broadstone Net Lease, Inc.
|
341,363
|
|||
|
2,359
|
CTO Realty Growth, Inc.
|
40,433
|
|||
|
15,437
|
Empire State Realty Trust, Inc.,
Class A
|
115,623
|
|||
|
17,578
|
Essential Properties Realty Trust,
Inc.
|
413,786
|
|||
|
4,724
|
Gladstone Commercial Corp.
|
58,436
|
|||
|
12,265
|
Global Net Lease, Inc.
|
126,084
|
|||
|
3,863
|
NexPoint Diversified Real Estate
Trust
|
48,365
|
|||
|
1,939
|
One Liberty Properties, Inc.
|
39,401
|
|||
|
1,573
|
Star Holdings (a)
|
23,076
|
|||
|
25,262
|
WP Carey, Inc.
|
1,706,701
|
|||
|
|
|
3,309,545
|
|||
|
|
Health Care REITs — 10.4%
|
|
|||
|
11,748
|
CareTrust REIT, Inc.
|
233,315
|
|||
|
2,889
|
Community Healthcare Trust,
Inc.
|
95,395
|
|||
|
28,307
|
Diversified Healthcare Trust
|
63,691
|
|||
|
7,275
|
Global Medical REIT, Inc.
|
66,421
|
|||
|
44,975
|
Healthcare Realty Trust, Inc.
|
848,228
|
|||
|
64,602
|
Healthpeak Properties, Inc.
|
1,298,500
|
|||
|
4,889
|
LTC Properties, Inc.
|
161,435
|
|||
|
70,661
|
Medical Properties Trust, Inc.
|
654,321
|
|||
|
5,124
|
National Health Investors, Inc.
|
268,600
|
|||
|
27,678
|
Omega Healthcare Investors, Inc.
|
849,438
|
|||
|
28,156
|
Physicians Realty Trust
|
393,902
|
|||
|
27,305
|
Sabra Health Care REIT, Inc.
|
321,380
|
|||
|
1,500
|
Universal Health Realty Income
Trust
|
71,370
|
|||
|
47,247
|
Ventas, Inc.
|
2,233,366
|
|||
|
58,701
|
Welltower, Inc.
|
4,748,324
|
|||
|
|
|
12,307,686
|
|||
|
|
Hotel & Resort REITs — 3.5%
|
|
|||
|
25,154
|
Apple Hospitality REIT, Inc.
|
380,077
|
|||
|
4,072
|
Ashford Hospitality Trust,
Inc. (a)
|
15,188
|
|||
|
6,309
|
Braemar Hotels & Resorts, Inc.
|
25,362
|
|||
|
5,770
|
Chatham Lodging Trust
|
54,007
|
|||
|
24,777
|
DiamondRock Hospitality Co.
|
198,464
|
|||
|
Shares
|
Description
|
Value
|
|||
|
|
|||||
|
|
Hotel & Resort REITs
(Continued)
|
|
|||
|
3,909
|
Hersha Hospitality Trust,
Class A
|
$23,806
|
|||
|
83,999
|
Host Hotels & Resorts, Inc.
|
1,413,703
|
|||
|
25,466
|
Park Hotels & Resorts, Inc.
|
326,474
|
|||
|
14,540
|
Pebblebrook Hotel Trust
|
202,687
|
|||
|
18,796
|
RLJ Lodging Trust
|
193,035
|
|||
|
6,590
|
Ryman Hospitality Properties,
Inc.
|
612,343
|
|||
|
19,540
|
Service Properties Trust
|
169,803
|
|||
|
12,692
|
Summit Hotel Properties, Inc.
|
82,625
|
|||
|
24,459
|
Sunstone Hotel Investors, Inc.
|
247,525
|
|||
|
12,931
|
Xenia Hotels & Resorts, Inc.
|
159,181
|
|||
|
|
|
4,104,280
|
|||
|
|
Industrial REITs — 16.4%
|
|
|||
|
31,907
|
Americold Realty Trust, Inc.
|
1,030,596
|
|||
|
5,245
|
EastGroup Properties, Inc.
|
910,532
|
|||
|
15,618
|
First Industrial Realty Trust, Inc.
|
822,132
|
|||
|
7,744
|
Industrial Logistics Properties
Trust
|
25,555
|
|||
|
3,311
|
Innovative Industrial Properties,
Inc.
|
241,736
|
|||
|
34,555
|
LXP Industrial Trust
|
336,911
|
|||
|
4,625
|
Plymouth Industrial REIT, Inc.
|
106,468
|
|||
|
109,064
|
Prologis, Inc.
|
13,374,518
|
|||
|
23,733
|
Rexford Industrial Realty, Inc.
|
1,239,337
|
|||
|
21,185
|
STAG Industrial, Inc.
|
760,118
|
|||
|
8,751
|
Terreno Realty Corp.
|
525,935
|
|||
|
|
|
19,373,838
|
|||
|
|
Multi-Family Residential
REITs — 12.3%
|
|
|||
|
17,621
|
Apartment Income REIT Corp.
|
635,942
|
|||
|
17,552
|
Apartment Investment and
Management Co., Class A
|
149,543
|
|||
|
16,770
|
AvalonBay Communities, Inc.
|
3,174,058
|
|||
|
1,427
|
BRT Apartments Corp.
|
28,255
|
|||
|
12,609
|
Camden Property Trust
|
1,372,742
|
|||
|
1,767
|
Centerspace
|
108,423
|
|||
|
1,556
|
Clipper Realty, Inc.
|
8,822
|
|||
|
10,360
|
Elme Communities
|
170,318
|
|||
|
40,275
|
Equity Residential
|
2,656,942
|
|||
|
7,580
|
Essex Property Trust, Inc.
|
1,775,994
|
|||
|
26,492
|
Independence Realty Trust, Inc.
|
482,684
|
|||
|
13,778
|
Mid-America Apartment
Communities, Inc.
|
2,092,327
|
|||
|
2,697
|
NexPoint Residential Trust, Inc.
|
122,660
|
|||
|
36,544
|
UDR, Inc.
|
1,569,930
|
|||
|
9,420
|
Veris Residential, Inc. (a)
|
151,191
|
|||
|
|
|
14,499,831
|
|||
Portfolio of Investments (Continued)
June 30, 2023 (Unaudited)
|
Shares
|
Description
|
Value
|
|||
|
COMMON STOCKS (Continued)
|
|||||
|
|
Office REITs — 5.4%
|
|
|||
|
18,594
|
Alexandria Real Estate Equities,
Inc.
|
$2,110,233
|
|||
|
16,856
|
Boston Properties, Inc.
|
970,737
|
|||
|
20,304
|
Brandywine Realty Trust
|
94,414
|
|||
|
4,717
|
City Office REIT, Inc.
|
26,274
|
|||
|
13,288
|
Corporate Office Properties
Trust
|
315,590
|
|||
|
17,915
|
Cousins Properties, Inc.
|
408,462
|
|||
|
20,055
|
Douglas Emmett, Inc.
|
252,091
|
|||
|
11,030
|
Easterly Government Properties,
Inc.
|
159,935
|
|||
|
12,956
|
Equity Commonwealth
|
262,489
|
|||
|
10,851
|
Franklin Street Properties Corp.
|
15,734
|
|||
|
12,455
|
Highwoods Properties, Inc.
|
297,799
|
|||
|
15,143
|
Hudson Pacific Properties, Inc.
|
63,904
|
|||
|
11,451
|
JBG SMITH Properties
|
172,223
|
|||
|
12,449
|
Kilroy Realty Corp.
|
374,590
|
|||
|
5,736
|
Office Properties Income Trust
|
44,167
|
|||
|
6,692
|
Orion Office REIT, Inc.
|
44,234
|
|||
|
19,240
|
Paramount Group, Inc.
|
85,233
|
|||
|
14,603
|
Piedmont Office Realty Trust,
Inc., Class A
|
106,164
|
|||
|
2,187
|
Postal Realty Trust, Inc., Class A
|
32,171
|
|||
|
7,603
|
SL Green Realty Corp.
|
228,470
|
|||
|
19,036
|
Vornado Realty Trust
|
345,313
|
|||
|
|
|
6,410,227
|
|||
|
|
Other Specialized REITs —
6.9%
|
|
|||
|
8,891
|
EPR Properties
|
416,099
|
|||
|
5,579
|
Farmland Partners, Inc.
|
68,120
|
|||
|
10,278
|
Four Corners Property Trust, Inc.
|
261,061
|
|||
|
31,020
|
Gaming and Leisure Properties,
Inc.
|
1,503,229
|
|||
|
3,923
|
Gladstone Land Corp.
|
63,827
|
|||
|
34,441
|
Iron Mountain, Inc.
|
1,956,938
|
|||
|
4,758
|
Safehold, Inc.
|
112,907
|
|||
|
118,603
|
VICI Properties, Inc.
|
3,727,692
|
|||
|
|
|
8,109,873
|
|||
|
|
Retail REITs — 16.2%
|
|
|||
|
11,245
|
Acadia Realty Trust
|
161,816
|
|||
|
11,007
|
Agree Realty Corp.
|
719,748
|
|||
|
256
|
Alexander’s, Inc.
|
47,068
|
|||
|
35,495
|
Brixmor Property Group, Inc.
|
780,890
|
|||
|
2,916
|
CBL & Associates Properties,
Inc.
|
64,269
|
|||
|
8,664
|
Federal Realty Investment Trust
|
838,415
|
|||
|
5,319
|
Getty Realty Corp.
|
179,889
|
|||
|
7,973
|
InvenTrust Properties Corp.
|
184,495
|
|||
|
73,211
|
Kimco Realty Corp.
|
1,443,721
|
|||
|
25,903
|
Kite Realty Group Trust
|
578,673
|
|||
|
Shares
|
Description
|
Value
|
|||
|
|
|||||
|
|
Retail REITs (Continued)
|
|
|||
|
25,403
|
Macerich (The) Co.
|
$286,292
|
|||
|
15,848
|
Necessity Retail REIT (The),
Inc.
|
107,132
|
|||
|
7,188
|
NETSTREIT Corp.
|
128,450
|
|||
|
21,505
|
NNN REIT, Inc.
|
920,199
|
|||
|
13,853
|
Phillips Edison & Co., Inc.
|
472,110
|
|||
|
79,509
|
Realty Income Corp.
|
4,753,843
|
|||
|
18,174
|
Regency Centers Corp.
|
1,122,608
|
|||
|
14,884
|
Retail Opportunity Investments
Corp.
|
201,083
|
|||
|
10,238
|
RPT Realty
|
106,987
|
|||
|
1,526
|
Saul Centers, Inc.
|
56,203
|
|||
|
38,618
|
Simon Property Group, Inc.
|
4,459,607
|
|||
|
21,501
|
SITE Centers Corp.
|
284,243
|
|||
|
16,688
|
Spirit Realty Capital, Inc.
|
657,173
|
|||
|
12,422
|
Tanger Factory Outlet Centers,
Inc.
|
274,153
|
|||
|
13,885
|
Urban Edge Properties
|
214,246
|
|||
|
3,421
|
Urstadt Biddle Properties, Inc.,
Class A
|
72,730
|
|||
|
5,487
|
Whitestone REIT
|
53,224
|
|||
|
|
|
19,169,267
|
|||
|
|
Self-Storage REITs — 9.0%
|
|
|||
|
26,535
|
CubeSmart
|
1,185,053
|
|||
|
15,950
|
Extra Space Storage, Inc.
|
2,374,158
|
|||
|
10,049
|
Life Storage, Inc.
|
1,336,115
|
|||
|
9,699
|
National Storage Affiliates Trust
|
337,816
|
|||
|
18,687
|
Public Storage
|
5,454,362
|
|||
|
|
|
10,687,504
|
|||
|
|
Single-Family Residential
REITs — 6.0%
|
|
|||
|
37,107
|
American Homes 4 Rent,
Class A
|
1,315,443
|
|||
|
457
|
Bluerock Homes Trust, Inc. (a)
|
7,376
|
|||
|
20,672
|
Equity LifeStyle Properties, Inc.
|
1,382,750
|
|||
|
68,656
|
Invitation Homes, Inc.
|
2,361,766
|
|||
|
14,693
|
Sun Communities, Inc.
|
1,916,849
|
|||
|
6,669
|
UMH Properties, Inc.
|
106,571
|
|||
|
|
|
7,090,755
|
|||
|
|
Total Common Stocks
|
117,639,576
|
|||
|
|
(Cost $152,542,298)
|
|
|||
Portfolio of Investments (Continued)
June 30, 2023 (Unaudited)
|
Shares
|
Description
|
Value
|
|||
|
MONEY MARKET FUNDS — 0.1%
|
|||||
|
79,545
|
Morgan Stanley Institutional
Liquidity Funds - Treasury
Portfolio - Institutional Class -
4.94% (b)
|
$79,545
|
|||
|
|
(Cost $79,545)
|
|
|||
|
|
|||||
|
|
|||||
|
|
Total Investments — 99.6%
|
117,719,121
|
|||
|
|
(Cost $152,621,843)
|
|
|||
|
|
Net Other Assets and
Liabilities — 0.4%
|
454,308
|
|||
|
|
Net Assets — 100.0%
|
$118,173,429
|
|||
|
(a)
|
Non-income producing security.
|
|
(b)
|
Rate shown reflects yield as of June 30, 2023.
|
Valuation Inputs
|
|
Total
Value at
6/30/2023
|
Level 1
Quoted
Prices
|
Level 2
Significant
Observable
Inputs
|
Level 3
Significant
Unobservable
Inputs
|
|
Common Stocks*
|
$117,639,576
|
$117,639,576
|
$—
|
$—
|
|
Money Market
Funds
|
79,545
|
79,545
|
—
|
—
|
|
Total Investments
|
$117,719,121
|
$117,719,121
|
$—
|
$—
|
|
*
|
See Portfolio of Investments for sub-industry breakout.
|
Portfolio of Investments
June 30, 2023 (Unaudited)
|
Shares
|
Description
|
Value
|
|||
|
COMMON STOCKS — 99.8%
|
|||||
|
|
Beverages — 1.5%
|
|
|||
|
1,706,162
|
Primo Water Corp.
|
$21,395,271
|
|||
|
|
Building Products — 10.0%
|
|
|||
|
704,251
|
A.O. Smith Corp.
|
51,255,388
|
|||
|
520,906
|
Advanced Drainage Systems,
Inc.
|
59,268,685
|
|||
|
1,148,322
|
Zurn Elkay Water Solutions
Corp.
|
30,878,378
|
|||
|
|
|
141,402,451
|
|||
|
|
Chemicals — 5.8%
|
|
|||
|
331,447
|
Ecolab, Inc.
|
61,877,840
|
|||
|
405,879
|
Hawkins, Inc.
|
19,356,370
|
|||
|
|
|
81,234,210
|
|||
|
|
Commercial Services &
Supplies — 4.9%
|
|
|||
|
339,025
|
Montrose Environmental Group,
Inc. (a)
|
14,279,733
|
|||
|
337,642
|
Tetra Tech, Inc.
|
55,285,501
|
|||
|
|
|
69,565,234
|
|||
|
|
Construction & Engineering
— 9.4%
|
|
|||
|
611,657
|
AECOM
|
51,801,231
|
|||
|
682,817
|
Stantec, Inc.
|
44,533,325
|
|||
|
124,844
|
Valmont Industries, Inc.
|
36,335,846
|
|||
|
|
|
132,670,402
|
|||
|
|
Electronic Equipment,
Instruments & Components
— 4.7%
|
|
|||
|
217,164
|
Badger Meter, Inc.
|
32,044,720
|
|||
|
473,578
|
Itron, Inc. (a)
|
34,144,974
|
|||
|
|
|
66,189,694
|
|||
|
|
Health Care Equipment &
Supplies — 4.0%
|
|
|||
|
111,620
|
IDEXX Laboratories, Inc. (a)
|
56,058,913
|
|||
|
|
Life Sciences Tools & Services
— 6.8%
|
|
|||
|
372,069
|
Agilent Technologies, Inc.
|
44,741,297
|
|||
|
213,400
|
Danaher Corp.
|
51,216,000
|
|||
|
|
|
95,957,297
|
|||
|
|
Machinery — 25.4%
|
|
|||
|
747,945
|
Energy Recovery, Inc. (a)
|
20,905,063
|
|||
|
1,142,032
|
Flowserve Corp.
|
42,426,489
|
|||
|
276,356
|
Franklin Electric Co., Inc.
|
28,437,032
|
|||
|
234,789
|
IDEX Corp.
|
50,540,680
|
|||
|
109,689
|
Lindsay Corp.
|
13,090,285
|
|||
|
357,055
|
Mueller Industries, Inc.
|
31,163,760
|
|||
|
1,190,132
|
Mueller Water Products, Inc.,
Class A
|
19,315,842
|
|||
|
826,241
|
Pentair PLC
|
53,375,169
|
|||
|
Shares
|
Description
|
Value
|
|||
|
|
|||||
|
|
Machinery (Continued)
|
|
|||
|
226,087
|
Watts Water Technologies, Inc.,
Class A
|
$41,538,965
|
|||
|
514,591
|
Xylem, Inc.
|
57,953,239
|
|||
|
|
|
358,746,524
|
|||
|
|
Multi-Utilities — 3.0%
|
|
|||
|
5,192,281
|
Algonquin Power & Utilities
Corp. (b)
|
42,888,241
|
|||
|
|
Software — 4.2%
|
|
|||
|
122,787
|
Roper Technologies, Inc.
|
59,035,989
|
|||
|
|
Trading Companies &
Distributors — 2.5%
|
|
|||
|
1,133,050
|
Core & Main, Inc., Class A (a)
|
35,509,787
|
|||
|
|
Water Utilities — 17.6%
|
|
|||
|
295,760
|
American States Water Co.
|
25,731,120
|
|||
|
376,285
|
American Water Works Co., Inc.
|
53,714,684
|
|||
|
461,414
|
California Water Service Group
|
23,822,805
|
|||
|
4,645,221
|
Cia de Saneamento Basico do
Estado de Sao Paulo, ADR
|
54,999,417
|
|||
|
1,234,755
|
Essential Utilities, Inc.
|
49,279,072
|
|||
|
215,778
|
Middlesex Water Co.
|
17,404,653
|
|||
|
345,518
|
SJW Group
|
24,224,267
|
|||
|
|
|
249,176,018
|
|||
|
|
Total Common Stocks
|
1,409,830,031
|
|||
|
|
(Cost $1,222,671,776)
|
|
|||
|
MONEY MARKET FUNDS — 0.7%
|
|||||
|
9,512,625
|
Goldman Sachs Financial Square
Treasury Obligations Fund -
Institutional Class -
4.99% (c) (d)
|
9,512,625
|
|||
|
512,403
|
Morgan Stanley Institutional
Liquidity Funds - Treasury
Portfolio - Institutional Class -
4.94% (c)
|
512,403
|
|||
|
|
Total Money Market Funds
|
10,025,028
|
|||
|
|
(Cost $10,025,028)
|
|
|||
Portfolio of Investments (Continued)
June 30, 2023 (Unaudited)
|
Principal
Value
|
Description
|
Value
|
|||
|
REPURCHASE AGREEMENTS — 2.3%
|
|||||
|
$32,064,505
|
BNP Paribas S.A., 5.01% (c),
dated 06/30/23, due 07/03/23,
with a maturity value of
$32,077,892. Collateralized by
U.S. Treasury Securities,
interest rates of 1.25% to
1.50%, due 08/15/26 to
11/30/26. The value of the
collateral including accrued
interest is $32,742,764. (d)
|
$32,064,505
|
|||
|
|
(Cost $32,064,505)
|
|
|||
|
|
|||||
|
|
|||||
|
|
Total Investments — 102.8%
|
1,451,919,564
|
|||
|
|
(Cost $1,264,761,309)
|
|
|||
|
|
Net Other Assets and
Liabilities — (2.8)%
|
(40,082,678
)
|
|||
|
|
Net Assets — 100.0%
|
$1,411,836,886
|
|||
|
(a)
|
Non-income producing security.
|
|
(b)
|
All or a portion of this security is on loan (see Note 2D -
Securities Lending in the Notes to Financial Statements). The
remaining contractual maturity of all of the securities lending
transactions is overnight and continuous. The aggregate
value of such securities, including those sold and pending
settlement, is $40,419,484 and the total value of the collateral
held by the Fund is $41,577,130.
|
|
(c)
|
Rate shown reflects yield as of June 30, 2023.
|
|
(d)
|
This security serves as collateral for securities on loan.
|
|
Abbreviations throughout the Portfolio of Investments:
|
|
|
ADR
|
– American Depositary Receipt
|
Valuation Inputs
|
|
Total
Value at
6/30/2023
|
Level 1
Quoted
Prices
|
Level 2
Significant
Observable
Inputs
|
Level 3
Significant
Unobservable
Inputs
|
|
Common
Stocks*
|
$1,409,830,031
|
$1,409,830,031
|
$—
|
$—
|
|
Money
Market
Funds
|
10,025,028
|
10,025,028
|
—
|
—
|
|
Repurchase
Agreements
|
32,064,505
|
—
|
32,064,505
|
—
|
|
Total
Investments
|
$1,451,919,564
|
$1,419,855,059
|
$32,064,505
|
$—
|
|
*
|
See Portfolio of Investments for industry breakout.
|
Offsetting Assets and Liabilities
|
Securities Lending Agency Agreement
|
|
|
Total gross amount presented on the Statements
of Assets and Liabilities(1)
|
$40,419,484
|
|
Non-cash Collateral(2)
|
(40,419,484
)
|
|
Net Amount
|
$—
|
|
(1)
|
The amount presented on the Statements of Assets and
Liabilities, which is included in “Investments, at value,” is not
offset and is shown on a gross basis.
|
|
(2)
|
At June 30, 2023, the value of the collateral received from
each borrower exceeded the value of the related securities
loaned. This amount is disclosed on the Portfolio of
Investments.
|
|
Repurchase Agreements
|
|
|
Total gross amount presented on the Statements
of Assets and Liabilities(3)
|
$32,064,505
|
|
Non-cash Collateral(4)
|
(32,064,505
)
|
|
Net Amount
|
$—
|
|
(3)
|
The amount is included in “Investments, at value” on the
Statements of Assets and Liabilities.
|
|
(4)
|
At June 30, 2023, the value of the collateral received from
each seller exceeded the value of the repurchase agreements.
|
Portfolio of Investments
June 30, 2023 (Unaudited)
|
Shares
|
Description
|
Value
|
|||
|
COMMON STOCKS — 100.0%
|
|||||
|
|
Gas Utilities — 1.7%
|
|
|||
|
162,781
|
National Fuel Gas Co.
|
$8,360,432
|
|||
|
|
Oil, Gas & Consumable Fuels
— 98.3%
|
|
|||
|
152,339
|
Amplify Energy Corp. (a)
|
1,031,335
|
|||
|
609,047
|
Antero Resources Corp. (a)
|
14,026,352
|
|||
|
434,607
|
APA Corp.
|
14,850,521
|
|||
|
1,311,248
|
Baytex Energy Corp. (a)
|
4,274,669
|
|||
|
248,008
|
Callon Petroleum Co. (a)
|
8,697,641
|
|||
|
169,782
|
Chesapeake Energy Corp.
|
14,207,358
|
|||
|
77,248
|
Chord Energy Corp.
|
11,880,742
|
|||
|
139,566
|
Civitas Resources, Inc.
|
9,681,693
|
|||
|
446,986
|
CNX Resources Corp. (a)
|
7,920,592
|
|||
|
666,879
|
Comstock Resources, Inc.
|
7,735,796
|
|||
|
170,387
|
ConocoPhillips
|
17,653,797
|
|||
|
608,907
|
Coterra Energy, Inc.
|
15,405,347
|
|||
|
146,777
|
Crescent Energy, Inc.,
Class A (b)
|
1,529,416
|
|||
|
1,368,050
|
Crescent Point Energy Corp.
|
9,206,977
|
|||
|
337,057
|
Devon Energy Corp.
|
16,293,335
|
|||
|
116,773
|
Diamondback Energy, Inc.
|
15,339,301
|
|||
|
373,761
|
Earthstone Energy, Inc.,
Class A (a)
|
5,341,045
|
|||
|
424,750
|
Enerplus Corp.
|
6,146,133
|
|||
|
148,042
|
EOG Resources, Inc.
|
16,941,927
|
|||
|
387,305
|
EQT Corp.
|
15,929,855
|
|||
|
39,148
|
Gulfport Energy Corp. (a)
|
4,113,280
|
|||
|
119,942
|
Hess Corp.
|
16,306,115
|
|||
|
749,982
|
Hess Midstream, L.P.,
Class A (c) (d)
|
23,009,448
|
|||
|
1,216,645
|
Kosmos Energy Ltd. (a)
|
7,287,704
|
|||
|
410,856
|
Magnolia Oil & Gas Corp.,
Class A
|
8,586,890
|
|||
|
654,442
|
Marathon Oil Corp.
|
15,065,255
|
|||
|
267,004
|
Matador Resources Co.
|
13,969,649
|
|||
|
307,589
|
Murphy Oil Corp.
|
11,780,659
|
|||
|
219,346
|
Northern Oil and Gas, Inc.
|
7,527,955
|
|||
|
313,905
|
Obsidian Energy Ltd. (a)
|
1,830,066
|
|||
|
281,457
|
Occidental Petroleum Corp.
|
16,549,672
|
|||
|
396,772
|
Ovintiv, Inc.
|
15,105,110
|
|||
|
145,927
|
PDC Energy, Inc.
|
10,381,247
|
|||
|
1,036,257
|
Permian Resources Corp.
|
11,357,377
|
|||
|
83,102
|
Pioneer Natural Resources Co.
|
17,217,072
|
|||
|
441,554
|
Range Resources Corp.
|
12,981,688
|
|||
|
10,315
|
Riley Exploration Permian, Inc.
|
368,452
|
|||
|
406,229
|
Ring Energy, Inc. (a) (b)
|
694,652
|
|||
|
205,077
|
SandRidge Energy, Inc.
|
3,127,424
|
|||
|
86,758
|
SilverBow Resources, Inc. (a)
|
2,526,393
|
|||
|
341,488
|
SM Energy Co.
|
10,801,265
|
|||
|
2,388,841
|
Southwestern Energy Co. (a)
|
14,356,934
|
|||
|
420,751
|
Talos Energy, Inc. (a)
|
5,835,816
|
|||
|
Shares
|
Description
|
Value
|
|||
|
|
|||||
|
|
Oil, Gas & Consumable Fuels
(Continued)
|
|
|||
|
2,853,683
|
Tellurian, Inc. (a) (b)
|
$4,023,693
|
|||
|
508,254
|
Vermilion Energy, Inc.
|
6,327,762
|
|||
|
116,515
|
Vital Energy, Inc. (a)
|
5,260,652
|
|||
|
104,681
|
Vitesse Energy, Inc.
|
2,344,854
|
|||
|
803,013
|
W&T Offshore, Inc. (a)
|
3,107,660
|
|||
|
828,722
|
Western Midstream Partners,
L.P. (d)
|
21,977,708
|
|||
|
469,153
|
Woodside Energy Group Ltd.,
ADR (b)
|
10,879,658
|
|||
|
|
|
498,795,942
|
|||
|
|
Total Common Stocks
|
507,156,374
|
|||
|
|
(Cost $550,978,698)
|
|
|||
|
MONEY MARKET FUNDS — 0.4%
|
|||||
|
1,694,240
|
Goldman Sachs Financial Square
Treasury Obligations Fund -
Institutional Class -
4.99% (e) (f)
|
1,694,240
|
|||
|
189,882
|
Morgan Stanley Institutional
Liquidity Funds - Treasury
Portfolio - Institutional Class -
4.94% (e)
|
189,882
|
|||
|
|
Total Money Market Funds
|
1,884,122
|
|||
|
|
(Cost $1,884,122)
|
|
|||
|
Principal
Value
|
Description
|
Value
|
|||
|
REPURCHASE AGREEMENTS — 1.1%
|
|||||
|
$5,710,830
|
BNP Paribas S.A., 5.01% (e),
dated 06/30/23, due 07/03/23,
with a maturity value of
$5,713,214. Collateralized by
U.S. Treasury Securities,
interest rates of 1.25% to
1.50%, due 08/15/26 to
11/30/26. The value of the
collateral including accrued
interest is $5,831,630. (f)
|
5,710,830
|
|||
|
|
(Cost $5,710,830)
|
|
|||
|
|
|||||
|
|
|||||
|
|
Total Investments — 101.5%
|
514,751,326
|
|||
|
|
(Cost $558,573,650)
|
|
|||
|
|
Net Other Assets and
Liabilities — (1.5)%
|
(7,376,246
)
|
|||
|
|
Net Assets — 100.0%
|
$507,375,080
|
|||
Portfolio of Investments (Continued)
June 30, 2023 (Unaudited)
|
(a)
|
Non-income producing security.
|
|
(b)
|
All or a portion of this security is on loan (see Note 2D -
Securities Lending in the Notes to Financial Statements). The
remaining contractual maturity of all of the securities lending
transactions is overnight and continuous. The aggregate
value of such securities, including those sold and pending
settlement, is $7,110,520 and the total value of the collateral
held by the Fund is $7,405,070.
|
|
(c)
|
This security is taxed as a “C” corporation for federal income
tax purposes.
|
|
(d)
|
Security is a Master Limited Partnership (“MLP”).
|
|
(e)
|
Rate shown reflects yield as of June 30, 2023.
|
|
(f)
|
This security serves as collateral for securities on loan.
|
|
Abbreviations throughout the Portfolio of Investments:
|
|
|
ADR
|
– American Depositary Receipt
|
Valuation Inputs
|
|
Total
Value at
6/30/2023
|
Level 1
Quoted
Prices
|
Level 2
Significant
Observable
Inputs
|
Level 3
Significant
Unobservable
Inputs
|
|
Common Stocks*
|
$507,156,374
|
$507,156,374
|
$—
|
$—
|
|
Money Market
Funds
|
1,884,122
|
1,884,122
|
—
|
—
|
|
Repurchase
Agreements
|
5,710,830
|
—
|
5,710,830
|
—
|
|
Total Investments
|
$514,751,326
|
$509,040,496
|
$5,710,830
|
$—
|
|
*
|
See Portfolio of Investments for industry breakout.
|
Offsetting Assets and Liabilities
|
Securities Lending Agency Agreement
|
|
|
Total gross amount presented on the Statements
of Assets and Liabilities(1)
|
$7,110,520
|
|
Non-cash Collateral(2)
|
(7,110,520
)
|
|
Net Amount
|
$—
|
|
(1)
|
The amount presented on the Statements of Assets and
Liabilities, which is included in “Investments, at value,” is not
offset and is shown on a gross basis.
|
|
(2)
|
At June 30, 2023, the value of the collateral received from
each borrower exceeded the value of the related securities
loaned. This amount is disclosed on the Portfolio of
Investments.
|
|
Repurchase Agreements
|
|
|
Total gross amount presented on the Statements
of Assets and Liabilities(3)
|
$5,710,830
|
|
Non-cash Collateral(4)
|
(5,710,830
)
|
|
Net Amount
|
$—
|
|
(3)
|
The amount is included in “Investments, at value” on the
Statements of Assets and Liabilities.
|
|
(4)
|
At June 30, 2023, the value of the collateral received from
each seller exceeded the value of the repurchase agreements.
|
Portfolio of Investments
June 30, 2023 (Unaudited)
|
Shares
|
Description
|
Value
|
|||
|
COMMON STOCKS — 99.9%
|
|||||
|
|
Banks — 96.4%
|
|
|||
|
9,860
|
1st Source Corp.
|
$413,430
|
|||
|
12,223
|
Amalgamated Financial Corp.
|
196,668
|
|||
|
13,501
|
Amerant Bancorp, Inc.
|
232,082
|
|||
|
4,242
|
American National Bankshares,
Inc.
|
122,933
|
|||
|
27,698
|
Ameris Bancorp
|
947,549
|
|||
|
6,600
|
Arrow Financial Corp.
|
132,924
|
|||
|
13,137
|
BancFirst Corp.
|
1,208,604
|
|||
|
21,837
|
Bancorp (The), Inc. (a)
|
712,978
|
|||
|
4,148
|
Bank First Corp. (b)
|
345,114
|
|||
|
6,435
|
Bank of Marin Bancorp
|
113,706
|
|||
|
45,785
|
Bank OZK
|
1,838,726
|
|||
|
13,709
|
Banner Corp.
|
598,672
|
|||
|
10,557
|
Blue Foundry Bancorp (a)
|
106,731
|
|||
|
26,592
|
BOK Financial Corp.
|
2,148,102
|
|||
|
11,154
|
Bridgewater Bancshares, Inc. (a)
|
109,867
|
|||
|
35,402
|
Brookline Bancorp, Inc.
|
309,413
|
|||
|
10,110
|
Business First Bancshares, Inc.
|
152,358
|
|||
|
3,128
|
Cambridge Bancorp
|
169,882
|
|||
|
5,827
|
Camden National Corp.
|
180,462
|
|||
|
6,796
|
Capital City Bank Group, Inc.
|
208,229
|
|||
|
54,364
|
Capitol Federal Financial, Inc.
|
335,426
|
|||
|
8,402
|
Capstar Financial Holdings, Inc.
|
103,093
|
|||
|
9,560
|
Carter Bankshares, Inc. (a)
|
141,392
|
|||
|
28,961
|
Cathay General Bancorp
|
932,255
|
|||
|
6,134
|
Citizens & Northern Corp.
|
118,386
|
|||
|
1,602
|
Citizens Financial Services,
Inc. (b)
|
119,301
|
|||
|
6,017
|
City Holding Co.
|
541,470
|
|||
|
6,296
|
Civista Bancshares, Inc.
|
109,550
|
|||
|
8,410
|
CNB Financial Corp.
|
148,437
|
|||
|
5,304
|
Coastal Financial Corp. (a)
|
199,696
|
|||
|
83,231
|
Columbia Banking System, Inc.
|
1,687,925
|
|||
|
42,246
|
Columbia Financial, Inc. (a)
|
730,433
|
|||
|
49,795
|
Commerce Bancshares, Inc.
|
2,425,017
|
|||
|
7,181
|
Community Trust Bancorp, Inc.
|
255,428
|
|||
|
15,643
|
ConnectOne Bancorp, Inc.
|
259,517
|
|||
|
19,404
|
CrossFirst Bankshares, Inc. (a)
|
194,040
|
|||
|
55,614
|
CVB Financial Corp.
|
738,554
|
|||
|
15,495
|
Dime Community Bancshares,
Inc.
|
273,177
|
|||
|
12,264
|
Eagle Bancorp, Inc.
|
259,506
|
|||
|
4,879
|
Enterprise Bancorp, Inc.
|
141,198
|
|||
|
14,898
|
Enterprise Financial Services
Corp.
|
582,512
|
|||
|
3,271
|
Esquire Financial Holdings, Inc.
|
149,616
|
|||
|
14,957
|
Farmers National Banc Corp.
|
185,018
|
|||
|
6,138
|
Financial Institutions, Inc.
|
96,612
|
|||
|
16,367
|
First Bancorp
|
486,918
|
|||
|
12,397
|
First Bancshares (The), Inc.
|
320,338
|
|||
|
Shares
|
Description
|
Value
|
|||
|
|
|||||
|
|
Banks (Continued)
|
|
|||
|
22,081
|
First Busey Corp.
|
$443,828
|
|||
|
3,312
|
First Business Financial
Services, Inc.
|
97,671
|
|||
|
7,680
|
First Community Bankshares,
Inc.
|
228,326
|
|||
|
37,993
|
First Financial Bancorp
|
776,577
|
|||
|
56,989
|
First Financial Bankshares, Inc.
|
1,623,617
|
|||
|
4,817
|
First Financial Corp.
|
156,408
|
|||
|
22,528
|
First Foundation, Inc.
|
89,436
|
|||
|
50,947
|
First Hawaiian, Inc.
|
917,555
|
|||
|
41,674
|
First Interstate BancSystem, Inc.,
Class A
|
993,508
|
|||
|
23,829
|
First Merchants Corp.
|
672,693
|
|||
|
8,197
|
First Mid Bancshares, Inc.
|
197,876
|
|||
|
9,005
|
First of Long Island (The) Corp.
|
108,240
|
|||
|
6,890
|
Five Star Bancorp
|
154,129
|
|||
|
11,775
|
Flushing Financial Corp.
|
144,715
|
|||
|
3,092
|
FS Bancorp, Inc.
|
92,976
|
|||
|
66,076
|
Fulton Financial Corp.
|
787,626
|
|||
|
11,808
|
German American Bancorp, Inc.
|
320,941
|
|||
|
4,810
|
Great Southern Bancorp, Inc.
|
244,011
|
|||
|
34,368
|
Hancock Whitney Corp.
|
1,319,044
|
|||
|
12,196
|
Hanmi Financial Corp.
|
182,086
|
|||
|
18,603
|
HarborOne Bancorp, Inc.
|
161,474
|
|||
|
12,793
|
HBT Financial, Inc.
|
235,903
|
|||
|
16,992
|
Heartland Financial USA, Inc.
|
473,567
|
|||
|
24,344
|
Heritage Commerce Corp.
|
201,568
|
|||
|
13,999
|
Heritage Financial Corp.
|
226,364
|
|||
|
859
|
Hingham Institution for Savings
|
183,122
|
|||
|
6,935
|
HomeTrust Bancshares, Inc.
|
144,872
|
|||
|
47,883
|
Hope Bancorp, Inc.
|
403,175
|
|||
|
17,614
|
Horizon Bancorp, Inc.
|
183,362
|
|||
|
17,618
|
Independent Bank Corp.
|
784,177
|
|||
|
8,441
|
Independent Bank Corp.
|
143,159
|
|||
|
16,482
|
Independent Bank Group, Inc.
|
569,123
|
|||
|
24,801
|
International Bancshares Corp.
|
1,096,204
|
|||
|
26,385
|
Kearny Financial Corp.
|
186,014
|
|||
|
10,153
|
Lakeland Financial Corp.
|
492,624
|
|||
|
13,691
|
Macatawa Bank Corp.
|
127,052
|
|||
|
6,388
|
Mercantile Bank Corp.
|
176,437
|
|||
|
10,040
|
Metrocity Bankshares, Inc.
|
179,616
|
|||
|
6,351
|
Mid Penn Bancorp, Inc.
|
140,230
|
|||
|
8,793
|
Midland States Bancorp, Inc.
|
175,069
|
|||
|
6,259
|
MidWestOne Financial Group,
Inc.
|
133,755
|
|||
|
5,070
|
MVB Financial Corp.
|
106,876
|
|||
|
17,130
|
NBT Bancorp, Inc.
|
545,591
|
|||
|
3,062
|
Northeast Bank
|
127,594
|
|||
|
6,026
|
Northeast Community Bancorp,
Inc.
|
89,667
|
|||
|
18,579
|
Northfield Bancorp, Inc.
|
203,997
|
|||
|
2,257
|
Northrim BanCorp, Inc.
|
88,768
|
|||
Portfolio of Investments (Continued)
June 30, 2023 (Unaudited)
|
Shares
|
Description
|
Value
|
|||
|
COMMON STOCKS (Continued)
|
|||||
|
|
Banks (Continued)
|
|
|||
|
50,733
|
Northwest Bancshares, Inc.
|
$537,770
|
|||
|
23,750
|
OceanFirst Financial Corp.
|
370,975
|
|||
|
17,833
|
Old Second Bancorp, Inc.
|
232,899
|
|||
|
38,250
|
Pacific Premier Bancorp, Inc.
|
791,010
|
|||
|
47,129
|
PacWest Bancorp (b)
|
384,101
|
|||
|
10,746
|
Pathward Financial, Inc.
|
498,185
|
|||
|
5,717
|
PCB Bancorp
|
84,097
|
|||
|
7,193
|
Peapack-Gladstone Financial
Corp.
|
194,786
|
|||
|
14,100
|
Peoples Bancorp, Inc.
|
374,355
|
|||
|
30,642
|
Pinnacle Financial Partners, Inc.
|
1,735,869
|
|||
|
5,763
|
Preferred Bank
|
316,907
|
|||
|
14,264
|
Premier Financial Corp.
|
228,509
|
|||
|
6,676
|
QCR Holdings, Inc.
|
273,916
|
|||
|
22,396
|
Renasant Corp.
|
585,207
|
|||
|
7,022
|
Republic Bancorp, Inc., Class A
|
298,435
|
|||
|
15,558
|
S&T Bancorp, Inc.
|
423,022
|
|||
|
17,901
|
Sandy Spring Bancorp, Inc.
|
405,995
|
|||
|
33,781
|
Seacoast Banking Corp. of
Florida
|
746,560
|
|||
|
7,944
|
Shore Bancshares, Inc.
|
91,833
|
|||
|
6,007
|
Sierra Bancorp
|
101,939
|
|||
|
50,838
|
Simmons First National Corp.,
Class A
|
876,956
|
|||
|
6,789
|
SmartFinancial, Inc.
|
146,031
|
|||
|
6,814
|
South Plains Financial, Inc.
|
153,383
|
|||
|
4,524
|
Southern Missouri Bancorp, Inc.
|
173,948
|
|||
|
12,348
|
Southside Bancshares, Inc.
|
323,024
|
|||
|
30,313
|
SouthState Corp.
|
1,994,595
|
|||
|
11,708
|
Stock Yards Bancorp, Inc.
|
531,192
|
|||
|
19,113
|
Texas Capital Bancshares,
Inc. (a)
|
984,320
|
|||
|
5,423
|
Third Coast Bancshares, Inc. (a)
|
86,063
|
|||
|
29,868
|
TowneBank
|
694,132
|
|||
|
13,258
|
TriCo Bancshares
|
440,166
|
|||
|
9,332
|
Triumph Financial, Inc. (a)
|
566,639
|
|||
|
7,597
|
TrustCo Bank Corp.
|
217,350
|
|||
|
24,383
|
Trustmark Corp.
|
514,969
|
|||
|
19,367
|
UMB Financial Corp.
|
1,179,450
|
|||
|
53,874
|
United Bankshares, Inc.
|
1,598,442
|
|||
|
45,978
|
United Community Banks, Inc.
|
1,148,990
|
|||
|
4,021
|
Unity Bancorp, Inc.
|
94,855
|
|||
|
11,749
|
Univest Financial Corp.
|
212,422
|
|||
|
21,660
|
Veritex Holdings, Inc.
|
388,364
|
|||
|
26,268
|
Washington Federal, Inc.
|
696,627
|
|||
|
6,795
|
Washington Trust Bancorp, Inc.
|
182,174
|
|||
|
23,655
|
WesBanco, Inc.
|
605,805
|
|||
|
6,673
|
West BanCorp, Inc.
|
122,850
|
|||
|
10,640
|
Westamerica BanCorp
|
407,512
|
|||
|
Shares
|
Description
|
Value
|
|||
|
|
|||||
|
|
Banks (Continued)
|
|
|||
|
24,432
|
Wintrust Financial Corp.
|
$1,774,252
|
|||
|
24,534
|
WSFS Financial Corp.
|
925,422
|
|||
|
|
|
64,630,171
|
|||
|
|
Financial Services — 3.5%
|
|
|||
|
5,477
|
Cass Information Systems, Inc.
|
212,398
|
|||
|
17,261
|
Merchants Bancorp
|
441,536
|
|||
|
9,825
|
NewtekOne, Inc. (b)
|
156,218
|
|||
|
111,927
|
TFS Financial Corp.
|
1,406,922
|
|||
|
8,648
|
Waterstone Financial, Inc.
|
125,310
|
|||
|
|
|
2,342,384
|
|||
|
|
Total Common Stocks
|
66,972,555
|
|||
|
|
(Cost $101,267,894)
|
|
|||
|
MONEY MARKET FUNDS — 0.3%
|
|||||
|
220,177
|
Goldman Sachs Financial Square
Treasury Obligations Fund -
Institutional Class -
4.99% (c) (d)
|
220,177
|
|||
|
|
(Cost $220,177)
|
|
|||
|
Principal
Value
|
Description
|
Value
|
|||
|
REPURCHASE AGREEMENTS — 1.1%
|
|||||
|
$742,159
|
BNP Paribas S.A., 5.01% (c),
dated 06/30/23, due 07/03/23,
with a maturity value of
$742,469. Collateralized by
U.S. Treasury Securities,
interest rates of 1.25% to
1.50%, due 08/15/26 to
11/30/26. The value of the
collateral including accrued
interest is $757,858. (d)
|
742,159
|
|||
|
|
(Cost $742,159)
|
|
|||
|
|
|||||
|
|
|||||
|
|
Total Investments — 101.3%
|
67,934,891
|
|||
|
|
(Cost $102,230,230)
|
|
|||
|
|
Net Other Assets and
Liabilities — (1.3)%
|
(864,808
)
|
|||
|
|
Net Assets — 100.0%
|
$67,070,083
|
|||
|
(a)
|
Non-income producing security.
|
|
(b)
|
All or a portion of this security is on loan (see Note 2D -
Securities Lending in the Notes to Financial Statements). The
remaining contractual maturity of all of the securities lending
transactions is overnight and continuous. The aggregate
value of such securities, including those sold and pending
settlement, is $923,384 and the total value of the collateral
held by the Fund is $962,336.
|
|
(c)
|
Rate shown reflects yield as of June 30, 2023.
|
|
(d)
|
This security serves as collateral for securities on loan.
|
Portfolio of Investments (Continued)
June 30, 2023 (Unaudited)
Valuation Inputs
|
|
Total
Value at
6/30/2023
|
Level 1
Quoted
Prices
|
Level 2
Significant
Observable
Inputs
|
Level 3
Significant
Unobservable
Inputs
|
|
Common Stocks*
|
$66,972,555
|
$66,972,555
|
$—
|
$—
|
|
Money Market Funds
|
220,177
|
220,177
|
—
|
—
|
|
Repurchase
Agreements
|
742,159
|
—
|
742,159
|
—
|
|
Total Investments
|
$67,934,891
|
$67,192,732
|
$742,159
|
$—
|
|
*
|
See Portfolio of Investments for industry breakout.
|
Offsetting Assets and Liabilities
|
Securities Lending Agency Agreement
|
|
|
Total gross amount presented on the Statements
of Assets and Liabilities(1)
|
$923,384
|
|
Non-cash Collateral(2)
|
(923,384
)
|
|
Net Amount
|
$—
|
|
(1)
|
The amount presented on the Statements of Assets and
Liabilities, which is included in “Investments, at value,” is not
offset and is shown on a gross basis.
|
|
(2)
|
At June 30, 2023, the value of the collateral received from
each borrower exceeded the value of the related securities
loaned. This amount is disclosed on the Portfolio of
Investments.
|
|
Repurchase Agreements
|
|
|
Total gross amount presented on the Statements
of Assets and Liabilities(3)
|
$742,159
|
|
Non-cash Collateral(4)
|
(742,159
)
|
|
Net Amount
|
$—
|
|
(3)
|
The amount is included in “Investments, at value” on the
Statements of Assets and Liabilities.
|
|
(4)
|
At June 30, 2023, the value of the collateral received from
each seller exceeded the value of the repurchase agreements.
|
Statements of Assets and Liabilities
June 30, 2023 (Unaudited)
|
|
First Trust
NASDAQ-100
Equal Weighted
Index Fund
(QQEW)
|
First Trust
NASDAQ-100-
Technology
Sector Index
Fund
(QTEC)
|
First Trust
NASDAQ-100
Ex-Technology
Sector Index
Fund
(QQXT)
|
|
ASSETS:
|
|
|
|
|
Investments, at value
|
$1,927,756,954
|
$1,988,970,271
|
$200,353,495
|
|
Cash
|
658,118
|
1,085,357
|
—
|
|
Receivables:
|
|
|
|
|
Capital shares sold
|
10,556,439
|
—
|
—
|
|
Dividends
|
569,413
|
366,804
|
73,045
|
|
Securities lending income
|
273,679
|
58,413
|
39,016
|
|
Investment securities sold
|
—
|
—
|
—
|
|
Reclaims
|
—
|
—
|
—
|
|
Prepaid expenses
|
5,147
|
6,036
|
2,339
|
|
Total Assets
|
1,939,819,750
|
1,990,486,881
|
200,467,895
|
|
|
|||
|
LIABILITIES:
|
|
|
|
|
Payables:
|
|
|
|
|
Collateral for securities on loan
|
56,990,684
|
51,493,759
|
6,338,511
|
|
Investment securities purchased
|
10,554,050
|
—
|
—
|
|
Investment advisory fees
|
590,842
|
618,834
|
60,697
|
|
Licensing fees
|
398,214
|
415,322
|
43,565
|
|
Shareholder reporting fees
|
48,546
|
97,150
|
12,210
|
|
Audit and tax fees
|
14,501
|
16,798
|
13,537
|
|
Capital shares redeemed
|
—
|
—
|
—
|
|
Other liabilities
|
256,470
|
287,152
|
31,479
|
|
Total Liabilities
|
68,853,307
|
52,929,015
|
6,499,999
|
|
NET ASSETS
|
$1,870,966,443
|
$1,937,557,866
|
$193,967,896
|
|
|
|||
|
NET ASSETS consist of:
|
|
|
|
|
Paid-in capital
|
$1,779,303,989
|
$2,157,402,390
|
$186,074,923
|
|
Par value
|
175,000
|
131,500
|
23,000
|
|
Accumulated distributable earnings (loss)
|
91,487,454
|
(219,976,024
)
|
7,869,973
|
|
NET ASSETS
|
$1,870,966,443
|
$1,937,557,866
|
$193,967,896
|
|
NET ASSET VALUE, per share
|
$106.91
|
$147.34
|
$84.33
|
|
Number of shares outstanding (unlimited number of shares authorized,
par value $0.01 per share)
|
17,500,002
|
13,150,002
|
2,300,002
|
|
Investments, at cost
|
$1,691,067,147
|
$1,795,425,442
|
$180,103,731
|
|
Securities on loan, at value
|
$56,751,350
|
$51,641,526
|
$6,272,159
|
|
First Trust NASDAQ®
Clean Edge® Green
Energy Index Fund
(QCLN)
|
First Trust S&P REIT
Index Fund
(FRI)
|
First Trust Water
ETF
(FIW)
|
First Trust Natural
Gas ETF
(FCG)
|
First Trust NASDAQ®
ABA Community
Bank Index Fund
(QABA)
|
|
|
|
|
|
|
|
$1,732,286,391
|
$117,719,121
|
$1,451,919,564
|
$514,751,326
|
$67,934,891
|
|
579,172
|
40,334
|
—
|
—
|
24,001
|
|
|
|
|
|
|
|
—
|
—
|
4,425,695
|
—
|
—
|
|
206,475
|
502,985
|
2,218,290
|
460,557
|
141,369
|
|
534,587
|
—
|
16,679
|
5,271
|
3,013
|
|
7,580,187
|
—
|
—
|
—
|
1,969,716
|
|
526,856
|
—
|
169,819
|
905
|
—
|
|
10,891
|
4,444
|
7,633
|
9,301
|
2,317
|
|
1,741,724,559
|
118,266,884
|
1,458,757,680
|
515,227,360
|
70,075,307
|
|
|
||||
|
|
|
|
|
|
|
|
|
|
|
|
|
170,359,794
|
—
|
41,577,130
|
7,405,070
|
962,336
|
|
—
|
—
|
4,419,421
|
—
|
—
|
|
507,204
|
25,871
|
448,418
|
164,037
|
21,077
|
|
372,220
|
—
|
163,073
|
130,116
|
17,359
|
|
167,055
|
20,987
|
71,482
|
31,422
|
1,845
|
|
15,730
|
16,870
|
14,678
|
14,782
|
13,539
|
|
7,582,592
|
—
|
—
|
—
|
1,972,573
|
|
267,908
|
29,727
|
226,592
|
106,853
|
16,495
|
|
179,272,503
|
93,455
|
46,920,794
|
7,852,280
|
3,005,224
|
|
$1,562,452,056
|
$118,173,429
|
$1,411,836,886
|
$507,375,080
|
$67,070,083
|
|
|
||||
|
|
|
|
|
|
|
$2,332,853,734
|
$160,093,509
|
$1,247,792,088
|
$1,058,756,360
|
$127,587,123
|
|
305,000
|
48,000
|
159,500
|
217,984
|
17,000
|
|
(770,706,678
)
|
(41,968,080
)
|
163,885,298
|
(551,599,264
)
|
(60,534,040
)
|
|
$1,562,452,056
|
$118,173,429
|
$1,411,836,886
|
$507,375,080
|
$67,070,083
|
|
$51.23
|
$24.62
|
$88.52
|
$23.28
|
$39.45
|
|
30,500,002
|
4,800,002
|
15,950,002
|
21,798,365
|
1,700,002
|
|
$2,072,391,228
|
$152,621,843
|
$1,264,761,309
|
$558,573,650
|
$102,230,230
|
|
$167,526,853
|
$—
|
$40,419,484
|
$7,110,520
|
$923,384
|
Statements of Operations
For the Six Months Ended June 30, 2023 (Unaudited)
|
|
First Trust
NASDAQ-100
Equal Weighted
Index Fund
(QQEW)
|
First Trust
NASDAQ-100-
Technology
Sector Index
Fund
(QTEC)
|
First Trust
NASDAQ-100
Ex-Technology
Sector Index
Fund
(QQXT)
|
|
INVESTMENT INCOME:
|
|
|
|
|
Dividends
|
$7,719,844
|
$5,892,112
|
$1,021,168
|
|
Securities lending income (net of fees)
|
1,544,977
|
540,626
|
237,381
|
|
Foreign withholding tax
|
(36,297
)
|
(107,507
)
|
—
|
|
Total investment income
|
9,228,524
|
6,325,231
|
1,258,549
|
|
|
|||
|
EXPENSES:
|
|
|
|
|
Investment advisory fees
|
2,863,295
|
3,173,853
|
321,238
|
|
Licensing fees
|
715,824
|
793,463
|
80,309
|
|
Accounting and administration fees
|
336,614
|
367,588
|
40,803
|
|
Shareholder reporting fees
|
63,318
|
95,793
|
13,752
|
|
Transfer agent fees
|
30,293
|
32,234
|
4,015
|
|
Custodian fees
|
25,190
|
24,269
|
6,229
|
|
Audit and tax fees
|
14,561
|
15,273
|
14,203
|
|
Legal fees
|
11,362
|
16,493
|
1,292
|
|
Listing fees
|
4,996
|
4,996
|
4,996
|
|
Trustees’ fees and expenses
|
4,170
|
4,126
|
3,673
|
|
Other expenses
|
9,434
|
10,318
|
1,532
|
|
Total expenses
|
4,079,057
|
4,538,406
|
492,042
|
|
Less fees waived and expenses reimbursed by the investment advisor
|
—
|
—
|
(10,203
)
|
|
Net expenses
|
4,079,057
|
4,538,406
|
481,839
|
|
NET INVESTMENT INCOME (LOSS)
|
5,149,467
|
1,786,825
|
776,710
|
|
|
|||
|
NET REALIZED AND UNREALIZED GAIN (LOSS):
|
|
|
|
|
Net realized gain (loss) on:
|
|
|
|
|
Investments
|
(17,001,286
)
|
(17,569,257
)
|
(1,253,047
)
|
|
In-kind redemptions
|
22,259,930
|
33,253,135
|
7,183,595
|
|
Foreign currency transactions
|
—
|
—
|
—
|
|
Net realized gain (loss)
|
5,258,644
|
15,683,878
|
5,930,548
|
|
Net change in unrealized appreciation (depreciation) on:
|
|
|
|
|
Investments
|
262,392,082
|
518,128,096
|
9,522,539
|
|
Foreign currency translation
|
—
|
—
|
—
|
|
Net change in unrealized appreciation (depreciation)
|
262,392,082
|
518,128,096
|
9,522,539
|
|
NET REALIZED AND UNREALIZED GAIN (LOSS)
|
267,650,726
|
533,811,974
|
15,453,087
|
|
NET INCREASE (DECREASE) IN NET ASSETS RESULTING
FROM OPERATIONS
|
$272,800,193
|
$535,598,799
|
$16,229,797
|
|
First Trust NASDAQ®
Clean Edge® Green
Energy Index Fund
(QCLN)
|
First Trust S&P REIT
Index Fund
(FRI)
|
First Trust Water
ETF
(FIW)
|
First Trust Natural
Gas ETF
(FCG)
|
First Trust NASDAQ®
ABA Community
Bank Index Fund
(QABA)
|
|
|
|
|
|
|
|
$5,324,517
|
$2,684,329
|
$8,946,501
|
$10,627,263
|
$1,778,764
|
|
5,783,805
|
—
|
95,946
|
125,497
|
8,637
|
|
(371,020
)
|
—
|
(160,906
)
|
(164,755
)
|
—
|
|
10,737,302
|
2,684,329
|
8,881,541
|
10,588,005
|
1,787,401
|
|
|
||||
|
|
|
|
|
|
|
3,181,178
|
187,740
|
2,585,921
|
1,220,966
|
233,315
|
|
795,294
|
50,064
|
323,240
|
305,241
|
52,496
|
|
368,562
|
32,428
|
308,866
|
153,385
|
30,762
|
|
164,876
|
21,949
|
87,555
|
53,820
|
13,884
|
|
32,280
|
3,129
|
28,559
|
15,262
|
2,917
|
|
41,655
|
8,423
|
40,018
|
25,124
|
2,933
|
|
15,030
|
17,000
|
14,575
|
15,264
|
14,165
|
|
20,631
|
1,712
|
12,773
|
9,392
|
696
|
|
4,996
|
4,866
|
6,125
|
6,125
|
4,989
|
|
4,236
|
3,640
|
4,090
|
3,802
|
3,657
|
|
17,560
|
1,795
|
10,360
|
7,670
|
1,215
|
|
4,646,298
|
332,746
|
3,422,082
|
1,816,051
|
361,029
|
|
—
|
(19,898
)
|
—
|
—
|
(10,963
)
|
|
4,646,298
|
312,848
|
3,422,082
|
1,816,051
|
350,066
|
|
6,091,004
|
2,371,481
|
5,459,459
|
8,771,954
|
1,437,335
|
|
|
||||
|
|
|
|
|
|
|
|
|
|
|
|
|
(51,674,523
)
|
(2,082,083
)
|
(23,768,636
)
|
(9,164,964
)
|
(3,584,275
)
|
|
21,149,694
|
(2,463,057
)
|
29,099,266
|
47,878,179
|
(7,548,580
)
|
|
—
|
—
|
—
|
1,854
|
—
|
|
(30,524,829
)
|
(4,545,140
)
|
5,330,630
|
38,715,069
|
(11,132,855
)
|
|
|
|
|
|
|
|
164,206,122
|
8,745,306
|
137,485,220
|
(80,847,722
)
|
(21,436,282
)
|
|
—
|
—
|
—
|
522
|
—
|
|
164,206,122
|
8,745,306
|
137,485,220
|
(80,847,200
)
|
(21,436,282
)
|
|
133,681,293
|
4,200,166
|
142,815,850
|
(42,132,131
)
|
(32,569,137
)
|
|
$139,772,297
|
$6,571,647
|
$148,275,309
|
$(33,360,177
)
|
$(31,131,802
)
|
Statements of Changes in Net Assets
|
|
First Trust NASDAQ-100 Equal
Weighted Index Fund (QQEW)
|
First Trust NASDAQ-100-
Technology Sector Index Fund
(QTEC)
|
||
|
|
Six Months
Ended
6/30/2023
(Unaudited)
|
Year
Ended
12/31/2022
|
Six Months
Ended
6/30/2023
(Unaudited)
|
Year
Ended
12/31/2022
|
|
OPERATIONS:
|
|
|
|
|
|
Net investment income (loss)
|
$5,149,467
|
$6,934,732
|
$1,786,825
|
$2,528,502
|
|
Net realized gain (loss)
|
5,258,644
|
(31,834,305
)
|
15,683,878
|
30,459,402
|
|
Net change in unrealized appreciation (depreciation)
|
262,392,082
|
(315,062,565
)
|
518,128,096
|
(1,355,869,794
)
|
|
Net increase (decrease) in net assets resulting from
operations
|
272,800,193
|
(339,962,138
)
|
535,598,799
|
(1,322,881,890
)
|
|
|
||||
|
DISTRIBUTIONS TO SHAREHOLDERS FROM:
|
|
|
|
|
|
Investment operations
|
(5,199,875
)
|
(6,866,581
)
|
(2,244,730
)
|
(2,234,346
)
|
|
|
||||
|
SHAREHOLDER TRANSACTIONS:
|
|
|
|
|
|
Proceeds from shares sold
|
591,284,110
|
303,095,848
|
176,651,588
|
358,662,021
|
|
Cost of shares redeemed
|
(74,411,047
)
|
(261,188,326
)
|
(131,585,274
)
|
(1,724,215,364
)
|
|
Net increase (decrease) in net assets resulting from
shareholder transactions
|
516,873,063
|
41,907,522
|
45,066,314
|
(1,365,553,343
)
|
|
Total increase (decrease) in net assets
|
784,473,381
|
(304,921,197
)
|
578,420,383
|
(2,690,669,579
)
|
|
|
||||
|
NET ASSETS:
|
|
|
|
|
|
Beginning of period
|
1,086,493,062
|
1,391,414,259
|
1,359,137,483
|
4,049,807,062
|
|
End of period
|
$1,870,966,443
|
$1,086,493,062
|
$1,937,557,866
|
$1,359,137,483
|
|
|
||||
|
CHANGES IN SHARES OUTSTANDING:
|
|
|
|
|
|
Shares outstanding, beginning of period
|
12,250,002
|
11,750,002
|
12,900,002
|
23,100,002
|
|
Shares sold
|
6,000,000
|
3,250,000
|
1,300,000
|
2,600,000
|
|
Shares redeemed
|
(750,000
)
|
(2,750,000
)
|
(1,050,000
)
|
(12,800,000
)
|
|
Shares outstanding, end of period
|
17,500,002
|
12,250,002
|
13,150,002
|
12,900,002
|
|
First Trust NASDAQ-100 Ex-
Technology Sector Index
Fund (QQXT)
|
First Trust NASDAQ® Clean
Edge® Green Energy Index
Fund (QCLN)
|
First Trust S&P REIT Index
Fund (FRI)
|
First Trust Water ETF (FIW)
|
||||
|
Six Months
Ended
6/30/2023
(Unaudited)
|
Year
Ended
12/31/2022
|
Six Months
Ended
6/30/2023
(Unaudited)
|
Year
Ended
12/31/2022
|
Six Months
Ended
6/30/2023
(Unaudited)
|
Year
Ended
12/31/2022
|
Six Months
Ended
6/30/2023
(Unaudited)
|
Year
Ended
12/31/2022
|
|
|
|
|
|
|
|
|
|
|
$776,710
|
$1,073,743
|
$6,091,004
|
$2,172,391
|
$2,371,481
|
$3,638,070
|
$5,459,459
|
$8,414,234
|
|
5,930,548
|
57,843
|
(30,524,829
)
|
(111,416,162
)
|
(4,545,140
)
|
(1,238,871
)
|
5,330,630
|
65,651,825
|
|
9,522,539
|
(20,127,544
)
|
164,206,122
|
(703,458,148
)
|
8,745,306
|
(67,166,910
)
|
137,485,220
|
(333,862,573
)
|
|
16,229,797
|
(18,995,958
)
|
139,772,297
|
(812,701,919
)
|
6,571,647
|
(64,767,711
)
|
148,275,309
|
(259,796,514
)
|
|
|
|||||||
|
|
|
|
|
|
|
|
|
|
(778,040
)
|
(1,136,087
)
|
(6,556,010
)
|
(5,415,781
)
|
(2,820,176
)
|
(4,101,541
)
|
(4,720,591
)
|
(8,373,346
)
|
|
|
|||||||
|
|
|
|
|
|
|
|
|
|
68,695,999
|
31,623,232
|
32,889,541
|
285,231,186
|
3,618,872
|
79,391,146
|
114,993,013
|
125,554,676
|
|
(23,862,210
)
|
(14,943,882
)
|
(177,157,668
)
|
(717,271,062
)
|
(22,295,270
)
|
(113,732,649
)
|
(96,491,919
)
|
(213,394,672
)
|
|
44,833,789
|
16,679,350
|
(144,268,127
)
|
(432,039,876
)
|
(18,676,398
)
|
(34,341,503
)
|
18,501,094
|
(87,839,996
)
|
|
60,285,546
|
(3,452,695
)
|
(11,051,840
)
|
(1,250,157,576
)
|
(14,924,927
)
|
(103,210,755
)
|
162,055,812
|
(356,009,856
)
|
|
|
|||||||
|
|
|
|
|
|
|
|
|
|
133,682,350
|
137,135,045
|
1,573,503,896
|
2,823,661,472
|
133,098,356
|
236,309,111
|
1,249,781,074
|
1,605,790,930
|
|
$193,967,896
|
$133,682,350
|
$1,562,452,056
|
$1,573,503,896
|
$118,173,429
|
$133,098,356
|
$1,411,836,886
|
$1,249,781,074
|
|
|
|||||||
|
|
|
|
|
|
|
|
|
|
1,750,002
|
1,550,002
|
33,350,002
|
41,550,002
|
5,550,002
|
7,250,002
|
15,750,002
|
16,950,002
|
|
850,000
|
400,000
|
650,000
|
4,650,000
|
150,000
|
2,700,000
|
1,400,000
|
1,550,000
|
|
(300,000
)
|
(200,000
)
|
(3,500,000
)
|
(12,850,000
)
|
(900,000
)
|
(4,400,000
)
|
(1,200,000
)
|
(2,750,000
)
|
|
2,300,002
|
1,750,002
|
30,500,002
|
33,350,002
|
4,800,002
|
5,550,002
|
15,950,002
|
15,750,002
|
Statements of Changes in Net Assets (Continued)
|
|
First Trust Natural Gas ETF
(FCG)
|
First Trust NASDAQ® ABA
Community Bank Index Fund
(QABA)
|
||
|
|
Six Months
Ended
6/30/2023
(Unaudited)
|
Year
Ended
12/31/2022
|
Six Months
Ended
6/30/2023
(Unaudited)
|
Year
Ended
12/31/2022
|
|
OPERATIONS:
|
|
|
|
|
|
Net investment income (loss)
|
$8,771,954
|
$22,056,076
|
$1,437,335
|
$2,504,493
|
|
Net realized gain (loss)
|
38,715,069
|
141,222,022
|
(11,132,855
)
|
(402,926
)
|
|
Net change in unrealized appreciation (depreciation)
|
(80,847,200
)
|
(5,986,689
)
|
(21,436,282
)
|
(18,078,803
)
|
|
Net increase (decrease) in net assets resulting from
operations
|
(33,360,177
)
|
157,291,409
|
(31,131,802
)
|
(15,977,236
)
|
|
|
||||
|
DISTRIBUTIONS TO SHAREHOLDERS FROM:
|
|
|
|
|
|
Investment operations
|
(9,835,642
)
|
(25,396,449
)
|
(1,419,507
)
|
(2,513,482
)
|
|
|
||||
|
SHAREHOLDER TRANSACTIONS:
|
|
|
|
|
|
Proceeds from shares sold
|
16,860,582
|
843,634,059
|
—
|
136,483,565
|
|
Cost of shares redeemed
|
(354,433,381
)
|
(510,610,575
)
|
(87,518,349
)
|
(48,799,730
)
|
|
Net increase (decrease) in net assets resulting from
shareholder transactions
|
(337,572,799
)
|
333,023,484
|
(87,518,349
)
|
87,683,835
|
|
Total increase (decrease) in net assets
|
(380,768,618
)
|
464,918,444
|
(120,069,658
)
|
69,193,117
|
|
|
||||
|
NET ASSETS:
|
|
|
|
|
|
Beginning of period
|
888,143,698
|
423,225,254
|
187,139,741
|
117,946,624
|
|
End of period
|
$507,375,080
|
$888,143,698
|
$67,070,083
|
$187,139,741
|
|
|
||||
|
CHANGES IN SHARES OUTSTANDING:
|
|
|
|
|
|
Shares outstanding, beginning of period
|
36,248,365
|
24,648,365
|
3,550,002
|
2,000,002
|
|
Shares sold
|
750,000
|
33,450,000
|
—
|
2,450,000
|
|
Shares redeemed
|
(15,200,000
)
|
(21,850,000
)
|
(1,850,000
)
|
(900,000
)
|
|
Shares outstanding, end of period
|
21,798,365
|
36,248,365
|
1,700,002
|
3,550,002
|
Financial Highlights
For a share outstanding throughout each period
|
|
Six Months
Ended
6/30/2023
(Unaudited)
|
Year Ended December 31,
|
||||
|
|
2022
|
2021
|
2020
|
2019
|
2018
|
|
|
Net asset value, beginning of period
|
$88.69
|
$118.42
|
$100.88
|
$73.78
|
$54.61
|
$57.88
|
|
Income from investment operations:
|
|
|
|
|
|
|
|
Net investment income (loss)
|
0.35
(a)
|
0.60
|
0.28
|
0.34
|
0.36
|
0.32
|
|
Net realized and unrealized gain (loss)
|
18.21
|
(29.74
)
|
17.54
|
27.11
|
19.16
|
(3.29
) (b)
|
|
Total from investment operations
|
18.56
|
(29.14
)
|
17.82
|
27.45
|
19.52
|
(2.97
)
|
|
Distributions paid to shareholders
from:
|
|
|
|
|
|
|
|
Net investment income
|
(0.34
)
|
(0.59
)
|
(0.28
)
|
(0.35
)
|
(0.35
)
|
(0.30
)
|
|
Net asset value, end of period
|
$106.91
|
$88.69
|
$118.42
|
$100.88
|
$73.78
|
$54.61
|
|
Total return (c)
|
20.94
%
|
(24.62
)%
|
17.67
%
|
37.35
%
|
35.78
%
|
(5.16
)% (b)
|
|
|
||||||
|
Ratios to average net
assets/supplemental data:
|
|
|
|
|
|
|
|
Net assets, end of period (in 000’s)
|
$1,870,966
|
$1,086,493
|
$1,391,414
|
$1,175,270
|
$907,438
|
$461,464
|
|
Ratio of total expenses to average net
assets
|
0.57
% (d)
|
0.58
%
|
0.57
%
|
0.58
%
|
0.59
%
|
0.60
%
|
|
Ratio of net investment income (loss)
to average net assets
|
0.72
% (d)
|
0.61
%
|
0.25
%
|
0.41
%
|
0.56
%
|
0.52
%
|
|
Portfolio turnover rate (e)
|
15
%
|
33
%
|
23
%
|
28
%
|
29
%
|
27
%
|
|
(a)
|
Based on average shares outstanding.
|
|
(b)
|
The Fund received a reimbursement from the Advisor in the amount of $22,098 in connection with a trade error, which represents
less than $0.01
per share. Since the Advisor reimbursed the Fund, there was no effect on the Fund’s total return.
|
|
(c)
|
Total return is calculated assuming an initial investment made at the net asset value at the beginning of the period, reinvestment
of all
distributions at net asset value during the period, and redemption at net asset value on the last day of the period. The returns
presented do not
reflect the deduction of taxes that a shareholder would pay on Fund distributions or the redemption or sale of Fund shares.
Total return is
calculated for the time period presented and is not annualized for periods of less than a year.
|
|
(d)
|
Annualized.
|
|
(e)
|
Portfolio turnover is calculated for the time period presented and is not annualized for periods of less than a year and does
not include securities
received or delivered from processing creations or redemptions and in-kind transactions.
|
Financial Highlights (Continued)
For a share outstanding throughout each period
|
|
Six Months
Ended
6/30/2023
(Unaudited)
|
Year Ended December 31,
|
||||
|
|
2022
|
2021
|
2020
|
2019
|
2018
|
|
|
Net asset value, beginning of
period
|
$105.36
|
$175.32
|
$138.14
|
$100.08
|
$67.97
|
$71.92
|
|
Income from investment
operations:
|
|
|
|
|
|
|
|
Net investment income (loss)
|
0.14
(a)
|
0.18
|
0.02
|
0.58
|
0.70
|
0.65
|
|
Net realized and unrealized gain
(loss)
|
42.02
|
(69.98
)
|
37.19
|
38.09
|
32.09
|
(3.98
)
|
|
Total from investment operations
|
42.16
|
(69.80
)
|
37.21
|
38.67
|
32.79
|
(3.33
)
|
|
Distributions paid to
shareholders from:
|
|
|
|
|
|
|
|
Net investment income
|
(0.18
)
|
(0.16
)
|
(0.03
)
|
(0.61
)
|
(0.68
)
|
(0.62
)
|
|
Net asset value, end of period
|
$147.34
|
$105.36
|
$175.32
|
$138.14
|
$100.08
|
$67.97
|
|
Total return (b)
|
40.03
%
|
(39.81
)%
|
26.94
%
|
38.82
%
|
48.36
%
|
(4.70
)%
|
|
|
||||||
|
Ratios to average net
assets/supplemental data:
|
|
|
|
|
|
|
|
Net assets, end of period (in 000’s)
|
$1,937,558
|
$1,359,137
|
$4,049,807
|
$3,349,911
|
$2,912,388
|
$1,950,669
|
|
Ratio of total expenses to average
net assets
|
0.57
% (c)
|
0.57
%
|
0.56
%
|
0.57
%
|
0.57
%
|
0.57
%
|
|
Ratio of net investment income
(loss) to average net assets
|
0.23
% (c)
|
0.12
%
|
0.01
%
|
0.50
%
|
0.82
%
|
0.84
%
|
|
Portfolio turnover rate (d)
|
13
%
|
28
%
|
25
%
|
31
%
|
23
%
|
21
%
|
|
(a)
|
Based on average shares outstanding.
|
|
(b)
|
Total return is calculated assuming an initial investment made at the net asset value at the beginning of the period, reinvestment
of all
distributions at net asset value during the period, and redemption at net asset value on the last day of the period. The returns
presented do not
reflect the deduction of taxes that a shareholder would pay on Fund distributions or the redemption or sale of Fund shares.
Total return is
calculated for the time period presented and is not annualized for periods of less than a year.
|
|
(c)
|
Annualized.
|
|
(d)
|
Portfolio turnover is calculated for the time period presented and is not annualized for periods of less than a year and does
not include securities
received or delivered from processing creations or redemptions and in-kind transactions.
|
Financial Highlights (Continued)
For a share outstanding throughout each period
|
|
Six Months
Ended
6/30/2023
(Unaudited)
|
Year Ended December 31,
|
||||
|
|
2022
|
2021
|
2020
|
2019
|
2018
|
|
|
Net asset value, beginning of period
|
$76.39
|
$88.47
|
$79.43
|
$58.39
|
$45.66
|
$48.53
|
|
Income from investment operations:
|
|
|
|
|
|
|
|
Net investment income (loss)
|
0.39
(a)
|
0.66
|
0.35
|
0.22
|
0.20
|
0.18
|
|
Net realized and unrealized gain (loss)
|
7.93
|
(12.04
)
|
9.00
|
21.04
|
12.73
|
(2.88
)
|
|
Total from investment operations
|
8.32
|
(11.38
)
|
9.35
|
21.26
|
12.93
|
(2.70
)
|
|
Distributions paid to shareholders from:
|
|
|
|
|
|
|
|
Net investment income
|
(0.38
)
|
(0.70
)
|
(0.31
)
|
(0.22
)
|
(0.20
)
|
(0.17
)
|
|
Net asset value, end of period
|
$84.33
|
$76.39
|
$88.47
|
$79.43
|
$58.39
|
$45.66
|
|
Total return (b)
|
10.89
%
|
(12.85
)%
|
11.80
%
|
36.48
%
|
28.35
%
|
(5.58
)%
|
|
|
||||||
|
Ratios to average net assets/supplemental
data:
|
|
|
|
|
|
|
|
Net assets, end of period (in 000’s)
|
$193,968
|
$133,682
|
$137,135
|
$146,938
|
$102,183
|
$77,618
|
|
Ratio of total expenses to average net assets
|
0.61
% (c)
|
0.63
%
|
0.62
%
|
0.62
%
|
0.64
%
|
0.64
%
|
|
Ratio of net expenses to average net assets
|
0.60
% (c)
|
0.60
%
|
0.60
%
|
0.60
%
|
0.60
%
|
0.60
%
|
|
Ratio of net investment income (loss) to
average net assets
|
0.97
% (c)
|
0.86
%
|
0.40
%
|
0.34
%
|
0.38
%
|
0.34
%
|
|
Portfolio turnover rate (d)
|
14
%
|
35
%
|
25
%
|
35
%
|
31
%
|
26
%
|
|
(a)
|
Based on average shares outstanding.
|
|
(b)
|
Total return is calculated assuming an initial investment made at the net asset value at the beginning of the period, reinvestment
of all
distributions at net asset value during the period, and redemption at net asset value on the last day of the period. The returns
presented do not
reflect the deduction of taxes that a shareholder would pay on Fund distributions or the redemption or sale of Fund shares.
Total return is
calculated for the time period presented and is not annualized for periods of less than a year. The total returns would have
been lower if certain
fees had not been waived and expenses reimbursed by the investment advisor.
|
|
(c)
|
Annualized.
|
|
(d)
|
Portfolio turnover is calculated for the time period presented and is not annualized for periods of less than a year and does
not include securities
received or delivered from processing creations or redemptions and in-kind transactions.
|
Financial Highlights (Continued)
For a share outstanding throughout each period
|
|
Six Months
Ended
6/30/2023
(Unaudited)
|
Year Ended December 31,
|
||||
|
|
2022
|
2021
|
2020
|
2019
|
2018
|
|
|
Net asset value, beginning of period
|
$47.18
|
$67.96
|
$70.17
|
$24.91
|
$17.63
|
$20.28
|
|
Income from investment operations:
|
|
|
|
|
|
|
|
Net investment income (loss)
|
0.19
(a)
|
0.07
|
(0.13
)
|
0.11
|
0.13
|
0.12
|
|
Net realized and unrealized gain (loss)
|
4.07
|
(20.70
)
|
(2.07
)
|
45.36
|
7.36
|
(2.59
)
|
|
Total from investment operations
|
4.26
|
(20.63
)
|
(2.20
)
|
45.47
|
7.49
|
(2.47
)
|
|
Distributions paid to shareholders
from:
|
|
|
|
|
|
|
|
Net investment income
|
(0.21
)
|
(0.15
)
|
(0.01
)
|
(0.21
)
|
(0.21
)
|
(0.11
)
|
|
Return of capital
|
—
|
—
|
—
|
—
|
—
|
(0.07
)
|
|
Total distributions
|
(0.21
)
|
(0.15
)
|
(0.01
)
|
(0.21
)
|
(0.21
)
|
(0.18
)
|
|
Net asset value, end of period
|
$51.23
|
$47.18
|
$67.96
|
$70.17
|
$24.91
|
$17.63
|
|
Total return (b)
|
9.03
%
|
(30.37
)%
|
(3.14
)%
|
183.52
%
|
42.69
%
|
(12.22
)%
|
|
|
||||||
|
Ratios to average net
assets/supplemental data:
|
|
|
|
|
|
|
|
Net assets, end of period (in 000’s)
|
$1,562,452
|
$1,573,504
|
$2,823,661
|
$1,999,803
|
$144,467
|
$83,731
|
|
Ratio of total expenses to average net
assets
|
0.58
% (c)
|
0.58
%
|
0.58
%
|
0.60
%
|
0.63
%
|
0.65
%
|
|
Ratio of net expenses to average net
assets
|
0.58
% (c)
|
0.58
%
|
0.58
%
|
0.60
%
|
0.60
%
|
0.60
%
|
|
Ratio of net investment income (loss) to
average net assets
|
0.77
% (c)
|
0.10
%
|
(0.24
)%
|
0.04
%
|
0.58
%
|
0.59
%
|
|
Portfolio turnover rate (d)
|
8
%
|
36
%
|
28
%
|
43
%
|
26
%
|
45
%
|
|
(a)
|
Based on average shares outstanding.
|
|
(b)
|
Total return is calculated assuming an initial investment made at the net asset value at the beginning of the period, reinvestment
of all
distributions at net asset value during the period, and redemption at net asset value on the last day of the period. The returns
presented do not
reflect the deduction of taxes that a shareholder would pay on Fund distributions or the redemption or sale of Fund shares.
Total return is
calculated for the time period presented and is not annualized for periods of less than a year. The total returns would have
been lower if certain
fees had not been waived and expenses reimbursed by the investment advisor.
|
|
(c)
|
Annualized.
|
|
(d)
|
Portfolio turnover is calculated for the time period presented and is not annualized for periods of less than a year and does
not include securities
received or delivered from processing creations or redemptions and in-kind transactions.
|
Financial Highlights (Continued)
For a share outstanding throughout each period
|
|
Six Months
Ended
6/30/2023
(Unaudited)
|
Year Ended December 31,
|
||||
|
|
2022
|
2021
|
2020
|
2019
|
2018
|
|
|
Net asset value, beginning of period
|
$23.98
|
$32.59
|
$23.23
|
$26.14
|
$21.63
|
$23.28
|
|
Income from investment operations:
|
|
|
|
|
|
|
|
Net investment income (loss)
|
0.46
(a)
|
0.53
|
0.50
|
0.52
|
0.56
|
0.69
|
|
Net realized and unrealized gain (loss)
|
0.75
|
(8.54
)
|
9.33
|
(2.72
)
|
4.55
|
(1.65
)
|
|
Total from investment operations
|
1.21
|
(8.01
)
|
9.83
|
(2.20
)
|
5.11
|
(0.96
)
|
|
Distributions paid to shareholders from:
|
|
|
|
|
|
|
|
Net investment income
|
(0.57
)
|
(0.60
)
|
(0.47
)
|
(0.71
)
|
(0.60
)
|
(0.69
)
|
|
Net asset value, end of period
|
$24.62
|
$23.98
|
$32.59
|
$23.23
|
$26.14
|
$21.63
|
|
Total return (b)
|
5.07
%
|
(24.63
)%
|
42.52
%
|
(8.10
)%
|
23.67
%
|
(4.19
)%
|
|
|
||||||
|
Ratios to average net assets/supplemental
data:
|
|
|
|
|
|
|
|
Net assets, end of period (in 000’s)
|
$118,173
|
$133,098
|
$236,309
|
$74,344
|
$198,642
|
$115,696
|
|
Ratio of total expenses to average net assets
|
0.53
% (c)
|
0.50
%
|
0.51
%
|
0.52
%
|
0.51
%
|
0.52
%
|
|
Ratio of net expenses to average net assets
|
0.50
% (c)
|
0.50
%
|
0.50
%
|
0.50
%
|
0.50
%
|
0.50
%
|
|
Ratio of net investment income (loss) to
average net assets
|
3.79
% (c)
|
1.84
%
|
2.04
%
|
2.04
%
|
2.40
%
|
3.05
%
|
|
Portfolio turnover rate (d)
|
3
%
|
8
%
|
6
%
|
6
%
|
10
%
|
10
%
|
|
(a)
|
Based on average shares outstanding.
|
|
(b)
|
Total return is calculated assuming an initial investment made at the net asset value at the beginning of the period, reinvestment
of all
distributions at net asset value during the period, and redemption at net asset value on the last day of the period. The returns
presented do not
reflect the deduction of taxes that a shareholder would pay on Fund distributions or the redemption or sale of Fund shares.
Total return is
calculated for the time period presented and is not annualized for periods of less than a year. The total returns would have
been lower if certain
fees had not been waived and expenses reimbursed by the investment advisor.
|
|
(c)
|
Annualized.
|
|
(d)
|
Portfolio turnover is calculated for the time period presented and is not annualized for periods of less than a year and does
not include securities
received or delivered from processing creations or redemptions and in-kind transactions.
|
Financial Highlights (Continued)
For a share outstanding throughout each period
|
|
Six Months
Ended
6/30/2023
(Unaudited)
|
Year Ended December 31,
|
||||
|
|
2022
|
2021
|
2020
|
2019
|
2018
|
|
|
Net asset value, beginning of period
|
$79.35
|
$94.74
|
$72.13
|
$59.91
|
$43.96
|
$48.58
|
|
Income from investment operations:
|
|
|
|
|
|
|
|
Net investment income (loss)
|
0.35
(a)
|
0.53
|
0.36
|
0.38
|
0.32
|
0.35
|
|
Net realized and unrealized gain (loss)
|
9.12
|
(15.39
)
|
22.60
|
12.24
|
15.96
|
(4.65
)
|
|
Total from investment operations
|
9.47
|
(14.86
)
|
22.96
|
12.62
|
16.28
|
(4.30
)
|
|
Distributions paid to shareholders
from:
|
|
|
|
|
|
|
|
Net investment income
|
(0.30
)
|
(0.53
)
|
(0.35
)
|
(0.40
)
|
(0.33
)
|
(0.32
)
|
|
Net asset value, end of period
|
$88.52
|
$79.35
|
$94.74
|
$72.13
|
$59.91
|
$43.96
|
|
Total return (b)
|
11.93
%
|
(15.65
)%
|
31.89
%
|
21.20
%
|
37.11
%
|
(8.89
)%
|
|
|
||||||
|
Ratios to average net
assets/supplemental data:
|
|
|
|
|
|
|
|
Net assets, end of period (in 000’s)
|
$1,411,837
|
$1,249,781
|
$1,605,791
|
$688,794
|
$536,168
|
$290,107
|
|
Ratio of total expenses to average net
assets
|
0.53
% (c)
|
0.53
%
|
0.53
%
|
0.54
%
|
0.55
%
|
0.55
%
|
|
Ratio of net investment income (loss) to
average net assets
|
0.84
% (c)
|
0.66
%
|
0.47
%
|
0.66
%
|
0.61
%
|
0.72
%
|
|
Portfolio turnover rate (d)
|
7
%
|
13
%
|
15
%
|
15
%
|
12
%
|
11
%
|
|
(a)
|
Based on average shares outstanding.
|
|
(b)
|
Total return is calculated assuming an initial investment made at the net asset value at the beginning of the period, reinvestment
of all
distributions at net asset value during the period, and redemption at net asset value on the last day of the period. The returns
presented do not
reflect the deduction of taxes that a shareholder would pay on Fund distributions or the redemption or sale of Fund shares.
Total return is
calculated for the time period presented and is not annualized for periods of less than a year.
|
|
(c)
|
Annualized.
|
|
(d)
|
Portfolio turnover is calculated for the time period presented and is not annualized for periods of less than a year and does
not include securities
received or delivered from processing creations or redemptions and in-kind transactions.
|
Financial Highlights (Continued)
For a share outstanding throughout each period
|
|
Six Months
Ended
6/30/2023
(Unaudited)
|
Year Ended December 31,
|
||||
|
|
2022
|
2021
|
2020
|
2019
|
2018
|
|
|
Net asset value, beginning of period
|
$24.50
|
$17.17
|
$8.80
|
$12.05
|
$14.69
|
$22.75
|
|
Income from investment operations:
|
|
|
|
|
|
|
|
Net investment income (loss)
|
0.32
(a)
|
0.69
|
0.20
|
0.10
|
0.10
|
0.02
|
|
Net realized and unrealized gain (loss)
|
(1.12
)
|
7.38
|
8.47
|
(3.01
)
|
(2.39
)
|
(7.86
)
|
|
Total from investment operations
|
(0.80
)
|
8.07
|
8.67
|
(2.91
)
|
(2.29
)
|
(7.84
)
|
|
Distributions paid to shareholders from:
|
|
|
|
|
|
|
|
Net investment income
|
(0.42
)
|
(0.74
)
|
(0.30
)
|
—
|
(0.11
)
|
—
|
|
Return of capital
|
—
|
—
|
—
|
(0.34
)
|
(0.24
)
|
(0.22
)
|
|
Total distributions
|
(0.42
)
|
(0.74
)
|
(0.30
)
|
(0.34
)
|
(0.35
)
|
(0.22
)
|
|
Net asset value, end of period
|
$23.28
|
$24.50
|
$17.17
|
$8.80
|
$12.05
|
$14.69
|
|
Total return (b)
|
(3.23
)%
|
47.27
%
|
98.69
%
|
(23.22
)%
|
(15.87
)%
|
(34.77
)%
|
|
|
||||||
|
Ratios to average net assets/supplemental
data:
|
|
|
|
|
|
|
|
Net assets, end of period (in 000’s)
|
$507,375
|
$888,144
|
$423,225
|
$103,429
|
$95,209
|
$88,874
|
|
Ratio of total expenses to average net assets
|
0.59
% (c)
|
0.60
%
|
0.62
% (d)
|
0.67
%
|
0.65
%
|
0.63
%
|
|
Ratio of net expenses to average net assets
|
0.59
% (c)
|
0.60
%
|
0.61
% (d)
|
0.60
%
|
0.60
%
|
0.60
%
|
|
Ratio of net investment income (loss) to average
net assets
|
2.87
% (c)
|
2.82
%
|
1.41
%
|
1.48
%
|
0.65
%
|
0.07
%
|
|
Portfolio turnover rate (e)
|
13
%
|
39
%
|
42
%
|
103
%
|
61
%
|
47
%
|
|
(a)
|
Based on average shares outstanding.
|
|
(b)
|
Total return is calculated assuming an initial investment made at the net asset value at the beginning of the period, reinvestment
of all
distributions at net asset value during the period, and redemption at net asset value on the last day of the period. The returns
presented do not
reflect the deduction of taxes that a shareholder would pay on Fund distributions or the redemption or sale of Fund shares.
Total return is
calculated for the time period presented and is not annualized for periods of less than a year. The total returns would have
been lower if certain
fees had not been waived and expenses reimbursed by the investment advisor.
|
|
(c)
|
Annualized.
|
|
(d)
|
For the year ended December 31, 2021, ratio reflects excise tax of 0.01%, which is not included in the expense cap.
|
|
(e)
|
Portfolio turnover is calculated for the time period presented and is not annualized for periods of less than a year and does
not include securities
received or delivered from processing creations or redemptions and in-kind transactions.
|
Financial Highlights (Continued)
For a share outstanding throughout each period
|
|
Six Months
Ended
6/30/2023
(Unaudited)
|
Year Ended December 31,
|
||||
|
|
2022
|
2021
|
2020
|
2019
|
2018
|
|
|
Net asset value, beginning of period
|
$52.72
|
$58.97
|
$44.75
|
$51.91
|
$43.16
|
$52.34
|
|
Income from investment operations:
|
|
|
|
|
|
|
|
Net investment income (loss)
|
0.57
(a)
|
1.10
|
1.01
|
1.11
|
1.04
|
0.81
|
|
Net realized and unrealized gain (loss)
|
(13.16
)
|
(6.24
)
|
14.20
|
(7.13
)
|
8.72
|
(9.17
)
|
|
Total from investment operations
|
(12.59
)
|
(5.14
)
|
15.21
|
(6.02
)
|
9.76
|
(8.36
)
|
|
Distributions paid to shareholders from:
|
|
|
|
|
|
|
|
Net investment income
|
(0.68
)
|
(1.11
)
|
(0.99
)
|
(1.14
)
|
(1.01
)
|
(0.82
)
|
|
Net asset value, end of period
|
$39.45
|
$52.72
|
$58.97
|
$44.75
|
$51.91
|
$43.16
|
|
Total return (b)
|
(23.91
)%
|
(8.70
)%
|
34.08
%
|
(11.00
)%
|
22.80
%
|
(16.14
)%
|
|
|
||||||
|
Ratios to average net assets/supplemental
data:
|
|
|
|
|
|
|
|
Net assets, end of period (in 000’s)
|
$67,070
|
$187,140
|
$117,947
|
$85,020
|
$142,752
|
$228,762
|
|
Ratio of total expenses to average net assets
|
0.62
% (c)
|
0.62
%
|
0.63
%
|
0.64
%
|
0.60
%
|
0.60
%
|
|
Ratio of net expenses to average net assets
|
0.60
% (c)
|
0.60
%
|
0.60
%
|
0.60
%
|
0.60
%
|
0.60
%
|
|
Ratio of net investment income (loss) to
average net assets
|
2.46
% (c)
|
2.11
%
|
1.82
%
|
2.75
%
|
1.98
%
|
1.50
%
|
|
Portfolio turnover rate (d)
|
8
%
|
18
%
|
23
%
|
14
%
|
15
%
|
11
%
|
|
(a)
|
Based on average shares outstanding.
|
|
(b)
|
Total return is calculated assuming an initial investment made at the net asset value at the beginning of the period, reinvestment
of all
distributions at net asset value during the period, and redemption at net asset value on the last day of the period. The returns
presented do not
reflect the deduction of taxes that a shareholder would pay on Fund distributions or the redemption or sale of Fund shares.
Total return is
calculated for the time period presented and is not annualized for periods of less than a year. The total returns would have
been lower if certain
fees had not been waived and expenses reimbursed by the investment advisor.
|
|
(c)
|
Annualized.
|
|
(d)
|
Portfolio turnover is calculated for the time period presented and is not annualized for periods of less than a year and does
not include securities
received or delivered from processing creations or redemptions and in-kind transactions.
|
June 30, 2023 (Unaudited)
|
First Trust NASDAQ-100 Equal Weighted Index Fund – (The Nasdaq Stock Market LLC (“Nasdaq”) ticker “QQEW”)
|
|
First Trust NASDAQ-100-Technology Sector Index Fund – (Nasdaq ticker “QTEC”)
|
|
First Trust NASDAQ-100 Ex-Technology Sector Index Fund – (Nasdaq ticker “QQXT”)
|
|
First Trust NASDAQ® Clean Edge® Green Energy Index Fund – (Nasdaq ticker “QCLN”)
|
|
First Trust S&P REIT Index Fund – (NYSE Arca, Inc. (“NYSE Arca”) ticker “FRI”)
|
|
First Trust Water ETF – (NYSE Arca ticker “FIW”)
|
|
First Trust Natural Gas ETF – (NYSE Arca ticker “FCG”)
|
|
First Trust NASDAQ® ABA Community Bank Index Fund – (Nasdaq ticker “QABA”)
|
|
Fund
|
Index
|
|
First Trust NASDAQ-100 Equal Weighted Index Fund
|
Nasdaq-100 Equal WeightedTM Index
|
|
First Trust NASDAQ-100-Technology Sector Index Fund
|
Nasdaq-100 Technology SectorTM Index
|
|
First Trust NASDAQ-100 Ex-Technology Sector Index Fund
|
Nasdaq-100 Ex-Tech SectorTM Index
|
|
First Trust NASDAQ® Clean Edge® Green Energy Index Fund
|
Nasdaq® Clean Edge® Green EnergyTM Index
|
|
First Trust S&P REIT Index Fund
|
S&P United States REIT Index
|
|
First Trust Water ETF
|
ISE Clean Edge WaterTM Index
|
|
First Trust Natural Gas ETF
|
ISE-Revere Natural GasTM Index
|
|
First Trust NASDAQ® ABA Community Bank Index Fund
|
Nasdaq OMX® ABA Community BankTM Index
|
June 30, 2023 (Unaudited)
June 30, 2023 (Unaudited)
June 30, 2023 (Unaudited)
June 30, 2023 (Unaudited)
|
|
Distributions
paid from
Ordinary
Income
|
Distributions
paid from
Capital
Gains
|
Distributions
paid from
Return of
Capital
|
|
First Trust NASDAQ-100 Equal Weighted Index Fund
|
$6,866,581
|
$—
|
$—
|
|
First Trust NASDAQ-100-Technology Sector Index Fund
|
2,234,346
|
—
|
—
|
|
First Trust NASDAQ-100 Ex-Technology Sector Index Fund
|
1,136,087
|
—
|
—
|
|
First Trust NASDAQ® Clean Edge® Green Energy Index Fund
|
5,415,781
|
—
|
—
|
|
First Trust S&P REIT Index Fund
|
4,101,541
|
—
|
—
|
|
First Trust Water ETF
|
8,373,346
|
—
|
—
|
|
First Trust Natural Gas ETF
|
25,396,449
|
—
|
—
|
|
First Trust NASDAQ® ABA Community Bank Index Fund
|
2,513,482
|
—
|
—
|
|
|
Undistributed
Ordinary
Income
|
Accumulated
Capital and
Other
Gain (Loss)
|
Net
Unrealized
Appreciation
(Depreciation)
|
|
First Trust NASDAQ-100 Equal Weighted Index Fund
|
$68,151
|
$(129,411,693
)
|
$(46,769,322
)
|
|
First Trust NASDAQ-100-Technology Sector Index Fund
|
294,156
|
(411,078,895
)
|
(342,545,354
)
|
|
First Trust NASDAQ-100 Ex-Technology Sector Index Fund
|
9,867
|
(15,846,180
)
|
8,254,529
|
|
First Trust NASDAQ® Clean Edge® Green Energy Index Fund
|
—
|
(341,292,950
)
|
(562,630,015
)
|
|
First Trust S&P REIT Index Fund
|
23,162
|
(225,432
)
|
(45,517,281
)
|
|
First Trust Water ETF
|
194,810
|
(14,566,866
)
|
34,702,636
|
|
First Trust Natural Gas ETF
|
—
|
(523,424,510
)
|
15,021,065
|
|
First Trust NASDAQ® ABA Community Bank Index Fund
|
290,430
|
(13,902,549
)
|
(14,109,612
)
|
June 30, 2023 (Unaudited)
|
|
Non-Expiring
Capital Loss
Carryforward
|
|
First Trust NASDAQ-100 Equal Weighted Index Fund
|
$129,411,693
|
|
First Trust NASDAQ-100-Technology Sector Index Fund
|
411,078,895
|
|
First Trust NASDAQ-100 Ex-Technology Sector Index Fund
|
15,846,180
|
|
First Trust NASDAQ® Clean Edge® Green Energy Index Fund
|
341,292,950
|
|
First Trust S&P REIT Index Fund
|
225,432
|
|
First Trust Water ETF
|
14,566,866
|
|
First Trust Natural Gas ETF
|
523,424,510
|
|
First Trust NASDAQ® ABA Community Bank Index Fund
|
13,902,549
|
|
|
Capital Loss Utilized
|
|
First Trust S&P REIT Index Fund
|
$460,089
|
June 30, 2023 (Unaudited)
|
|
Tax Cost
|
Gross
Unrealized
Appreciation
|
Gross
Unrealized
(Depreciation)
|
Net Unrealized
Appreciation
(Depreciation)
|
|
First Trust NASDAQ-100 Equal Weighted Index Fund
|
$1,691,067,147
|
$306,714,739
|
$(70,024,932
)
|
$236,689,807
|
|
First Trust NASDAQ-100-Technology Sector Index Fund
|
1,795,425,442
|
355,856,048
|
(162,311,219
)
|
193,544,829
|
|
First Trust NASDAQ-100 Ex-Technology Sector Index
Fund
|
180,103,731
|
28,632,949
|
(8,383,185
)
|
20,249,764
|
|
First Trust NASDAQ® Clean Edge® Green Energy Index
Fund
|
2,072,391,228
|
245,089,936
|
(585,194,773
)
|
(340,104,837
)
|
|
First Trust S&P REIT Index Fund
|
152,621,843
|
1,457,138
|
(36,359,860
)
|
(34,902,722
)
|
|
First Trust Water ETF
|
1,264,761,309
|
226,954,212
|
(39,795,957
)
|
187,158,255
|
|
First Trust Natural Gas ETF
|
558,573,650
|
15,071,456
|
(58,893,780
)
|
(43,822,324
)
|
|
First Trust NASDAQ® ABA Community Bank Index
Fund
|
102,230,230
|
84,782
|
(34,380,121
)
|
(34,295,339
)
|
|
Fund
|
Licensor
|
|
First Trust NASDAQ-100 Equal Weighted Index Fund
|
Nasdaq, Inc.
|
|
First Trust NASDAQ-100-Technology Sector Index Fund
|
Nasdaq, Inc.
|
|
First Trust NASDAQ-100 Ex-Technology Sector Index Fund
|
Nasdaq, Inc.
|
|
First Trust NASDAQ® Clean Edge® Green Energy Index Fund
|
Nasdaq, Inc. and Clean Edge®
|
|
First Trust S&P REIT Index Fund
|
S&P Dow Jones Indices LLC
|
|
First Trust Water ETF
|
International Securities Exchange, LLC
|
|
First Trust Natural Gas ETF
|
International Securities Exchange, LLC
|
|
First Trust NASDAQ® ABA Community Bank Index Fund
|
Nasdaq, Inc. and American Bankers Association
|
June 30, 2023 (Unaudited)
|
Breakpoints
|
QQEW
|
QTEC
|
QQXT
|
QCLN
|
FRI
|
FIW
|
FCG
|
QABA
|
|
Fund net assets up to and including $2.5 billion
|
0.40
%
|
0.40
%
|
0.40
%
|
0.40
%
|
0.3000
%
|
0.40
%
|
0.40
%
|
0.40
%
|
|
Fund net assets greater than $2.5 billion up to and
including $5 billion
|
0.39
%
|
0.39
%
|
0.39
%
|
0.39
%
|
0.2925
%
|
0.39
%
|
0.39
%
|
0.39
%
|
|
Fund net assets greater than $5 billion up to and
including $7.5 billion
|
0.38
%
|
0.38
%
|
0.38
%
|
0.38
%
|
0.2850
%
|
0.38
%
|
0.38
%
|
0.38
%
|
|
Fund net assets greater than $7.5 billion up to and
including $10 billion
|
0.37
%
|
0.37
%
|
0.37
%
|
0.37
%
|
0.2775
%
|
0.37
%
|
0.37
%
|
0.37
%
|
|
Fund net assets greater than $10 billion up to and
including $15 billion
|
0.36
%
|
0.36
%
|
0.36
%
|
0.36
%
|
0.2770
%
|
0.36
%
|
0.36
%
|
0.36
%
|
|
Fund net assets greater than $15 billion
|
0.34
%
|
0.34
%
|
0.34
%
|
0.34
%
|
0.2550
%
|
0.34
%
|
0.34
%
|
0.34
%
|
|
|
Expense Cap
|
|
First Trust NASDAQ-100 Equal Weighted Index Fund
|
0.60
%
|
|
First Trust NASDAQ-100-Technology Sector Index Fund
|
0.60
%
|
|
First Trust NASDAQ-100 Ex-Technology Sector Index Fund
|
0.60
%
|
|
First Trust NASDAQ® Clean Edge® Green Energy Index Fund
|
0.60
%
|
|
First Trust S&P REIT Index Fund
|
0.50
%
|
|
First Trust Water ETF
|
0.60
%
|
|
First Trust Natural Gas ETF
|
0.60
%
|
|
First Trust NASDAQ® ABA Community Bank Index Fund
|
0.60
%
|
|
|
Purchases
|
Sales
|
|
First Trust NASDAQ-100 Equal Weighted Index Fund
|
$222,224,069
|
$221,557,434
|
|
First Trust NASDAQ-100-Technology Sector Index Fund
|
207,088,689
|
206,354,431
|
|
First Trust NASDAQ-100 Ex-Technology Sector Index Fund
|
22,786,602
|
22,755,427
|
|
First Trust NASDAQ® Clean Edge® Green Energy Index Fund
|
135,360,181
|
136,403,052
|
|
First Trust S&P REIT Index Fund
|
4,083,343
|
4,346,328
|
June 30, 2023 (Unaudited)
|
|
Purchases
|
Sales
|
|
First Trust Water ETF
|
$88,510,436
|
$89,052,453
|
|
First Trust Natural Gas ETF
|
85,199,104
|
83,944,953
|
|
First Trust NASDAQ® ABA Community Bank Index Fund
|
9,584,185
|
9,607,901
|
|
|
Purchases
|
Sales
|
|
First Trust NASDAQ-100 Equal Weighted Index Fund
|
$590,802,063
|
$74,352,583
|
|
First Trust NASDAQ-100-Technology Sector Index Fund
|
176,560,794
|
131,508,854
|
|
First Trust NASDAQ-100 Ex-Technology Sector Index Fund
|
68,614,413
|
23,813,003
|
|
First Trust NASDAQ® Clean Edge® Green Energy Index Fund
|
32,863,115
|
177,054,629
|
|
First Trust S&P REIT Index Fund
|
3,613,004
|
22,245,288
|
|
First Trust Water ETF
|
114,801,092
|
96,226,807
|
|
First Trust Natural Gas ETF
|
16,809,487
|
353,546,921
|
|
First Trust NASDAQ® ABA Community Bank Index Fund
|
—
|
87,362,238
|
June 30, 2023 (Unaudited)
June 30, 2023 (Unaudited)
June 30, 2023 (Unaudited)
June 30, 2023 (Unaudited)
June 30, 2023 (Unaudited)
|
First Trust NASDAQ-100 Equal Weighted Index Fund (QQEW)
|
|
First Trust NASDAQ-100-Technology Sector Index Fund (QTEC)
|
|
First Trust NASDAQ-100 Ex-Technology Sector Index Fund (QQXT)
|
|
First Trust NASDAQ® Clean Edge® Green Energy Index Fund (QCLN)
|
|
First Trust S&P REIT Index Fund (FRI)
|
|
First Trust Water ETF (FIW)
|
|
First Trust Natural Gas ETF (FCG)
|
|
First Trust NASDAQ® ABA Community Bank Index Fund (QABA)
|
June 30, 2023 (Unaudited)
June 30, 2023 (Unaudited)

120 East Liberty Drive, Suite 400
Wheaton, IL 60187
FUND ACCOUNTANT &
TRANSFER AGENT
240 Greenwich Street
New York, NY 10286
PUBLIC ACCOUNTING FIRM
111 South Wacker Drive
Chicago, IL 60606
320 South Canal Street
Chicago, IL 60606
June 30, 2023

|
First Trust Dividend Strength ETF (FTDS)
|
|
First Trust Dow 30 Equal Weight ETF (EDOW)
|
|
First Trust Lunt U.S. Factor Rotation ETF (FCTR)
|
|
First Trust Growth Strength ETF (FTGS)
|
|
First Trust Indxx Aerospace & Defense ETF (MISL)
|
|
First Trust Bloomberg Inflation Sensitive Equity ETF (FTIF)
|
Semi-Annual Report
June 30, 2023
|
2
|
|
|
3
|
|
|
4
|
|
|
6
|
|
|
8
|
|
|
10
|
|
|
12
|
|
|
14
|
|
|
16
|
|
|
17
|
|
|
19
|
|
|
21
|
|
|
22
|
|
|
25
|
|
|
27
|
|
|
28
|
|
|
30
|
|
|
32
|
|
|
34
|
|
|
36
|
|
|
42
|
|
|
51
|
Semi-Annual Letter from the Chairman and CEO
June 30, 2023
semi-annual report prior to that Fund’s inception date does not apply to this Fund.
non-profit business membership and research group organization, reported that its Leading Economic Index, which is composed of 10 economic indicators whose changes tend to precede changes in the overall economy, fell by 0.7% to a reading of 106.1 in June 2023, according to Reuters. The result represents the fifteenth consecutive monthly decline in the index, the longest streak of
month-over-month decreases since just before the financial crisis in 2007. From our perspective, even if the Fed can pull off a soft landing, it is likely to be a very bumpy ride.

Chairman of the Board of Trustees
Chief Executive Officer of First Trust Advisors L.P.
Semi-Annual Report
June 30, 2023
Senior Vice President and Chief Market Strategist
First Trust Advisors L.P.

|
Performance
|
||||||||
|
|
|
|
Average Annual Total Returns
|
Cumulative Total Returns
|
||||
|
|
6 Months
Ended
6/30/23
|
1 Year
Ended
6/30/23
|
5 Years
Ended
6/30/23
|
10 Years
Ended
6/30/23
|
Inception
(12/5/06)
to 6/30/23
|
5 Years
Ended
6/30/23
|
10 Years
Ended
6/30/23
|
Inception
(12/5/06)
to 6/30/23
|
|
Fund Performance
|
|
|
|
|
|
|
|
|
|
NAV
|
0.32%
|
6.02%
|
5.83%
|
8.03%
|
5.98%
|
32.74%
|
116.49%
|
161.69%
|
|
Market Price
|
0.15%
|
5.74%
|
5.83%
|
8.03%
|
5.98%
|
32.74%
|
116.43%
|
161.66%
|
|
Index Performance
|
|
|
|
|
|
|
|
|
|
The Dividend StrengthTM
Index(1) (2)
|
0.62%
|
6.72%
|
N/A
|
N/A
|
N/A
|
N/A
|
N/A
|
N/A
|
|
S&P 500® Index(3)
|
16.89%
|
19.59%
|
12.31%
|
12.86%
|
9.34%
|
78.66%
|
235.35%
|
338.97%
|
|
Russell 3000® Index
|
16.17%
|
18.95%
|
11.39%
|
12.34%
|
9.13%
|
71.49%
|
220.10%
|
325.09%
|
|
Dow Jones U.S. Select
Dividend Index
|
-4.32%
|
0.47%
|
7.21%
|
9.99%
|
7.26%
|
41.61%
|
159.10%
|
219.17%
|
|
Russell 1000® Index
|
5.12%
|
11.54%
|
8.11%
|
9.22%
|
6.67%
|
47.66%
|
141.55%
|
191.58%
|
|
(1)
|
On April 29, 2022, the Fund’s underlying index changed from the Nasdaq AlphaDEX® Total US Market Index to The Dividend StrengthTM
Index. Therefore, the Fund’s performance and total returns shown are not necessarily indicative of the performance the Fund, based on its current
index, would have generated.
|
|
(2)
|
Because the Fund’s underlying Index has an inception date of March 7, 2022, performance data for the Index is not available for all periods
shown in the table.
|
|
(3)
|
The S&P 500® Index will serve as the Fund’s new primary benchmark index. The Fund’s portfolio managers believe that the S&P 500® Index
provides a more appropriate comparison to Fund returns.
|
Nasdaq® and The Dividend StrengthTM Index are registered trademarks and service marks of Nasdaq, Inc. (together with its affiliates hereinafter referred to as the “Corporations”) and are licensed for use by First Trust. The Fund has not been passed on by the Corporations as to its legality or suitability. The Fund is not issued, endorsed, sold or promoted by the Corporations. THE CORPORATIONS MAKE NO WARRANTIES AND BEAR NO LIABILITY WITH RESPECT TO THE FUND.
|
Sector Allocation
|
% of Total
Long-Term
Investments
|
|
Industrials
|
27.5%
|
|
Financials
|
21.5
|
|
Energy
|
9.7
|
|
Materials
|
9.1
|
|
Information Technology
|
8.6
|
|
Health Care
|
8.0
|
|
Consumer Discretionary
|
7.8
|
|
Consumer Staples
|
3.8
|
|
Communication Services
|
2.0
|
|
Real Estate
|
2.0
|
|
Total
|
100.0%
|
|
Top Ten Holdings
|
% of Total
Long-Term
Investments
|
|
Owens Corning
|
2.6%
|
|
NetApp, Inc.
|
2.4
|
|
PACCAR, Inc.
|
2.3
|
|
Caterpillar, Inc.
|
2.2
|
|
Cigna Group (The)
|
2.2
|
|
AGCO Corp.
|
2.2
|
|
Cognizant Technology Solutions Corp., Class A
|
2.2
|
|
Snap-on, Inc.
|
2.2
|
|
RPM International, Inc.
|
2.2
|
|
Huntington Ingalls Industries, Inc.
|
2.2
|
|
Total
|
22.7%
|
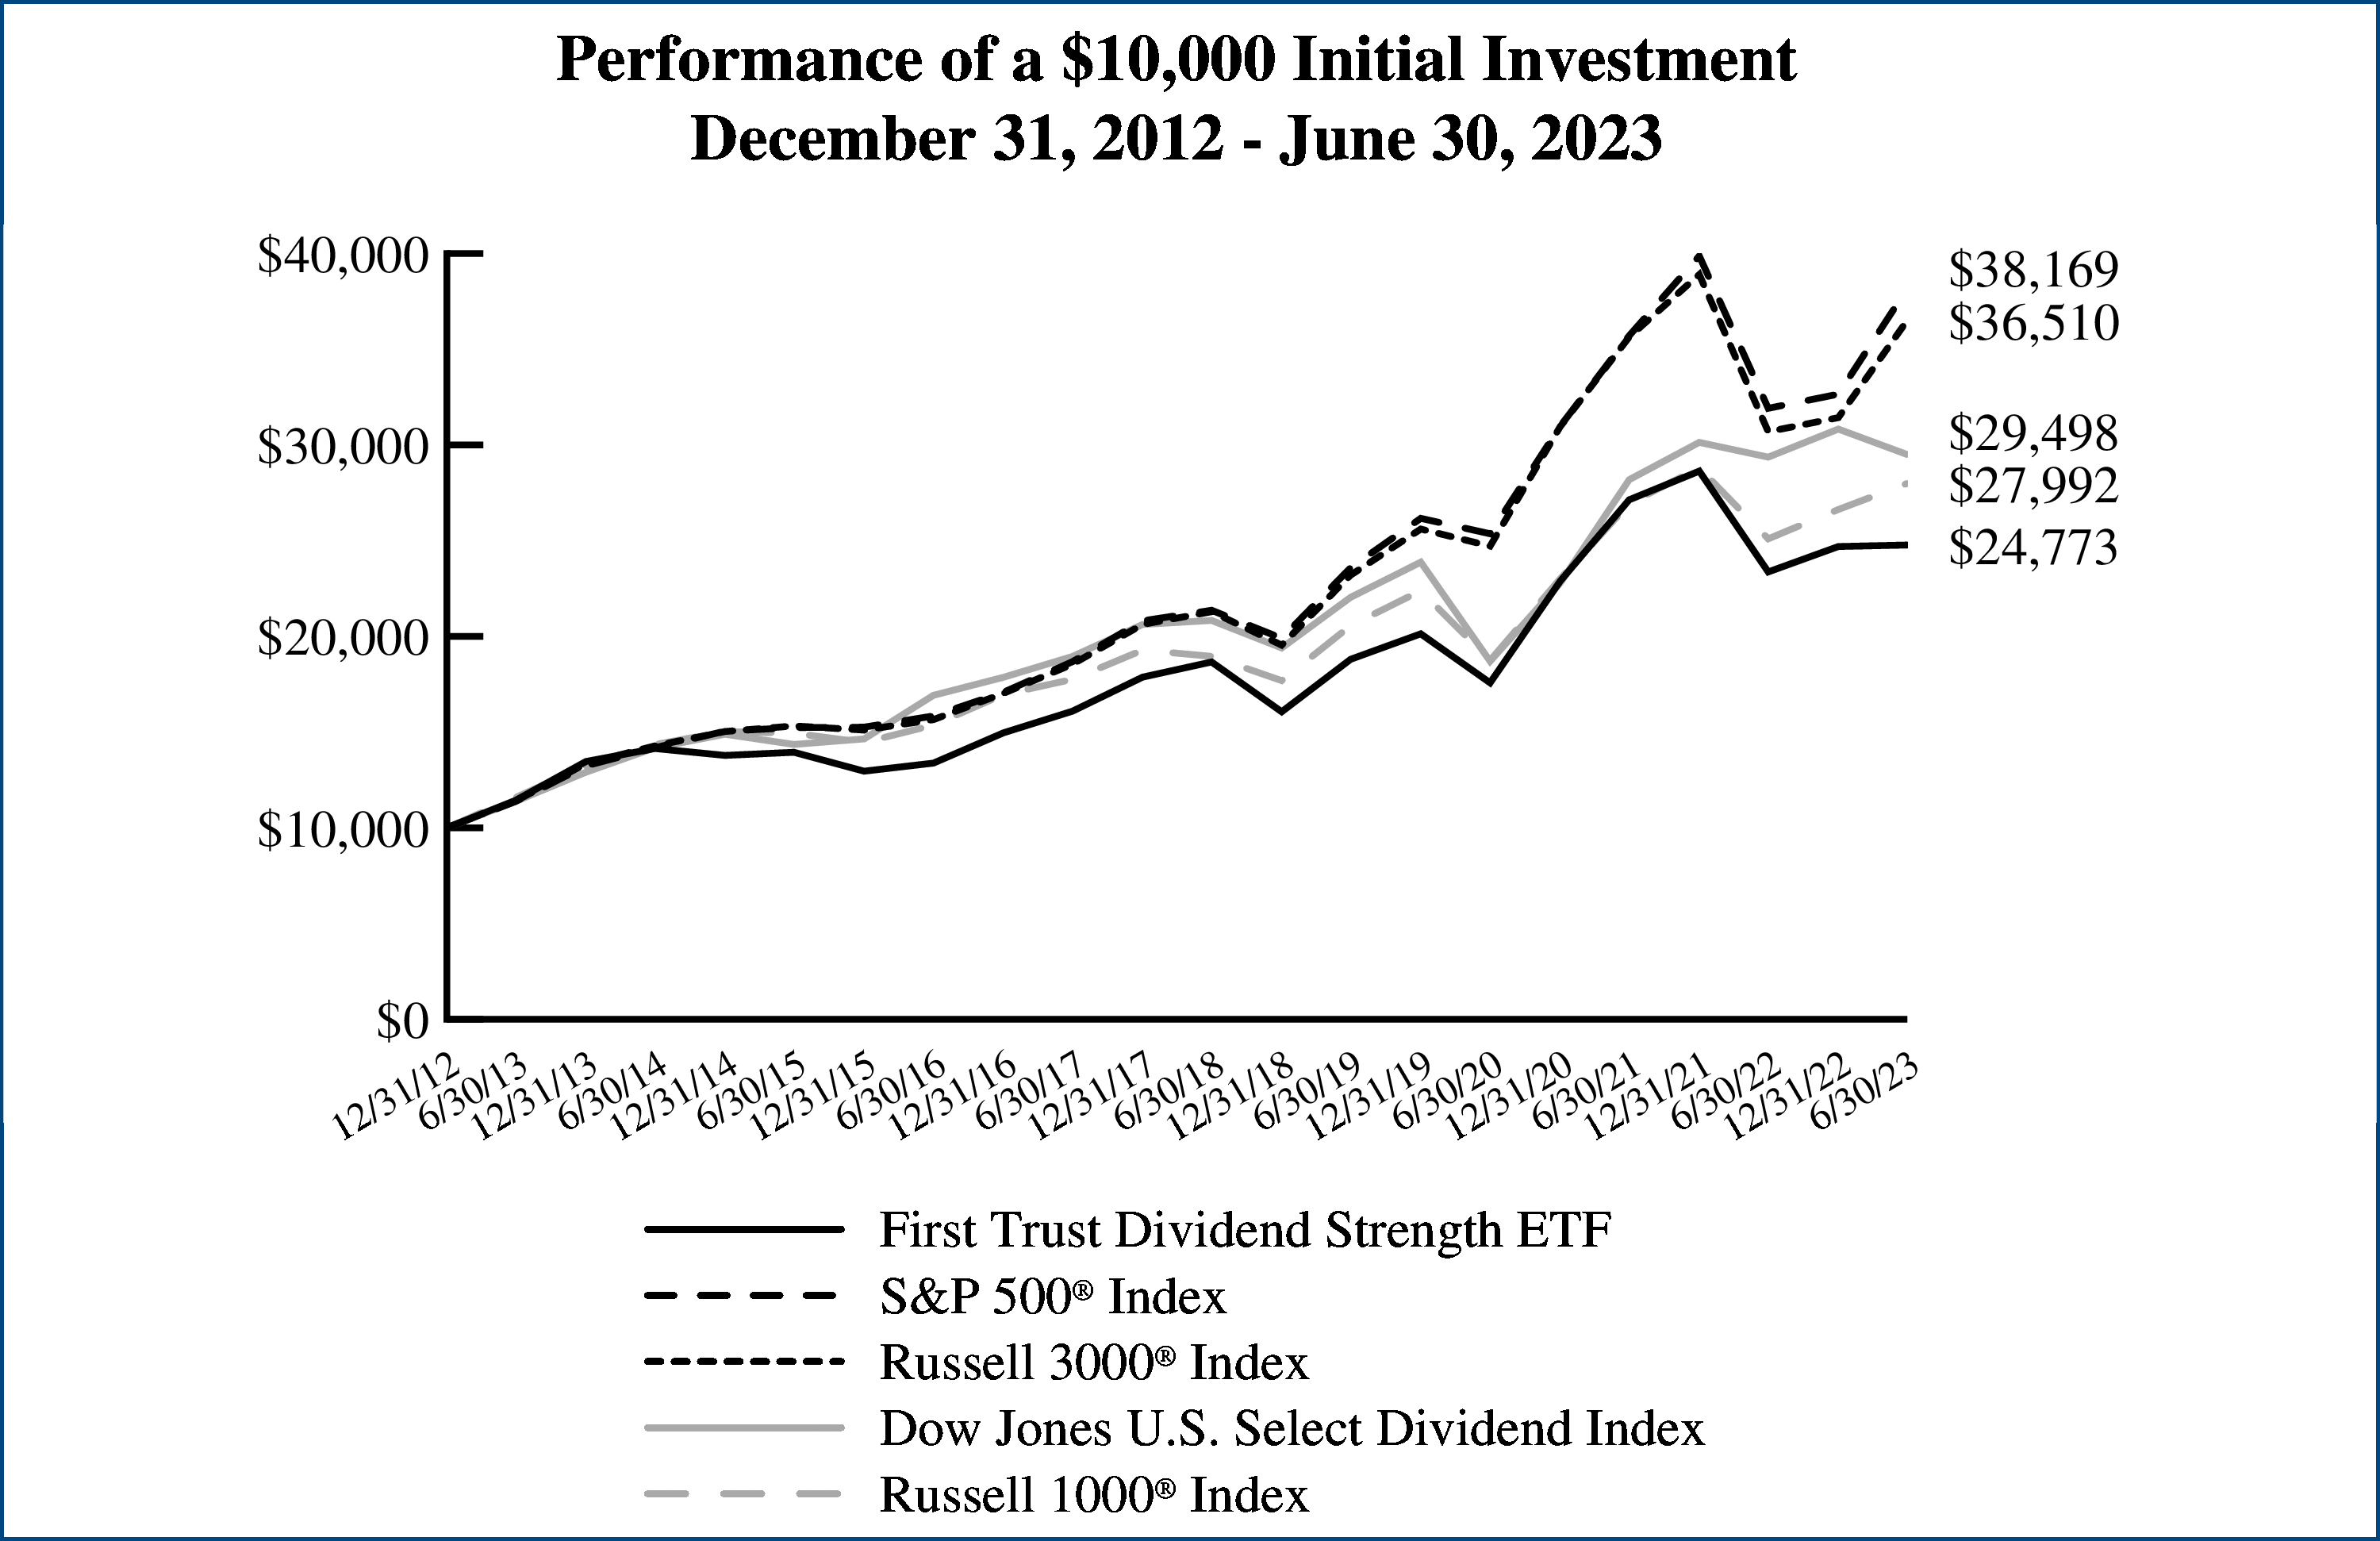 |
Performance figures assume reinvestment of
all distributions and do not reflect the
deduction of taxes that a shareholder would
pay on Fund distributions or the redemption
or sale of Fund shares. An index is a statistical
composite that tracks a specified financial
market or sector. Unlike the Fund, the indices
do not actually hold a portfolio of securities
and therefore do not incur the expenses
incurred by the Fund. These expenses
negatively impact the performance of the
Fund. The Fund’s past performance does not
predict future performance.
|
|
Performance
|
||||||
|
|
|
|
Average Annual Total
Returns
|
Cumulative Total Returns
|
||
|
|
6 Months
Ended
6/30/23
|
1 Year
Ended
6/30/23
|
5 Years
Ended
6/30/23
|
Inception
(8/8/17)
to 6/30/23
|
5 Years
Ended
6/30/23
|
Inception
(8/8/17)
to 6/30/23
|
|
Fund Performance
|
|
|
|
|
|
|
|
NAV
|
5.63%
|
13.08%
|
8.87%
|
9.27%
|
52.97%
|
68.64%
|
|
Market Price
|
5.70%
|
12.95%
|
8.87%
|
9.28%
|
52.95%
|
68.69%
|
|
Index Performance
|
|
|
|
|
|
|
|
Dow Jones Industrial Average® Equal
Weight Index
|
5.93%
|
13.61%
|
9.55%
|
9.92%
|
57.76%
|
74.64%
|
|
Dow Jones Industrial AverageTM
|
4.94%
|
14.23%
|
9.59%
|
10.21%
|
58.06%
|
77.35%
|
|
S&P 500® Index
|
16.89%
|
19.59%
|
12.31%
|
12.46%
|
78.66%
|
99.74%
|
|
Sector Allocation
|
% of Total
Long-Term
Investments
|
|
Information Technology
|
20.3%
|
|
Financials
|
16.6
|
|
Industrials
|
13.3
|
|
Health Care
|
13.3
|
|
Consumer Staples
|
13.0
|
|
Consumer Discretionary
|
10.3
|
|
Communication Services
|
6.6
|
|
Materials
|
3.4
|
|
Energy
|
3.2
|
|
Total
|
100.0%
|
|
Top Ten Holdings
|
% of Total
Long-Term
Investments
|
|
Apple, Inc.
|
3.5%
|
|
Intel Corp.
|
3.5
|
|
Visa, Inc., Class A
|
3.5
|
|
Verizon Communications, Inc.
|
3.4
|
|
Honeywell International, Inc.
|
3.4
|
|
Caterpillar, Inc.
|
3.4
|
|
Home Depot (The), Inc.
|
3.4
|
|
NIKE, Inc., Class B
|
3.4
|
|
Merck & Co., Inc.
|
3.4
|
|
Microsoft Corp.
|
3.4
|
|
Total
|
34.3%
|
Dow Jones Industrial Average® Equal Weight Index (“Index”) is a product of S&P Dow Jones Indices LLC or its affiliates (“SPDJI”) and has been licensed for use by First Trust. S&P® is a registered trademark of Standard & Poor’s Financial Services LLC (“S&P”); Dow Jones® is a registered trademark of Dow Jones Trademark Holdings LLC (“Dow Jones”); and these trademarks have been licensed for use by SPDJI and sublicensed for certain purposes by First Trust. The Fund is not sponsored, endorsed, sold or promoted by SPDJI, Dow Jones, S&P, or their respective affiliates and none of such parties make any representation regarding the advisability of investing in such product nor do they have any liability for any errors, omissions, or interruptions of the Index.
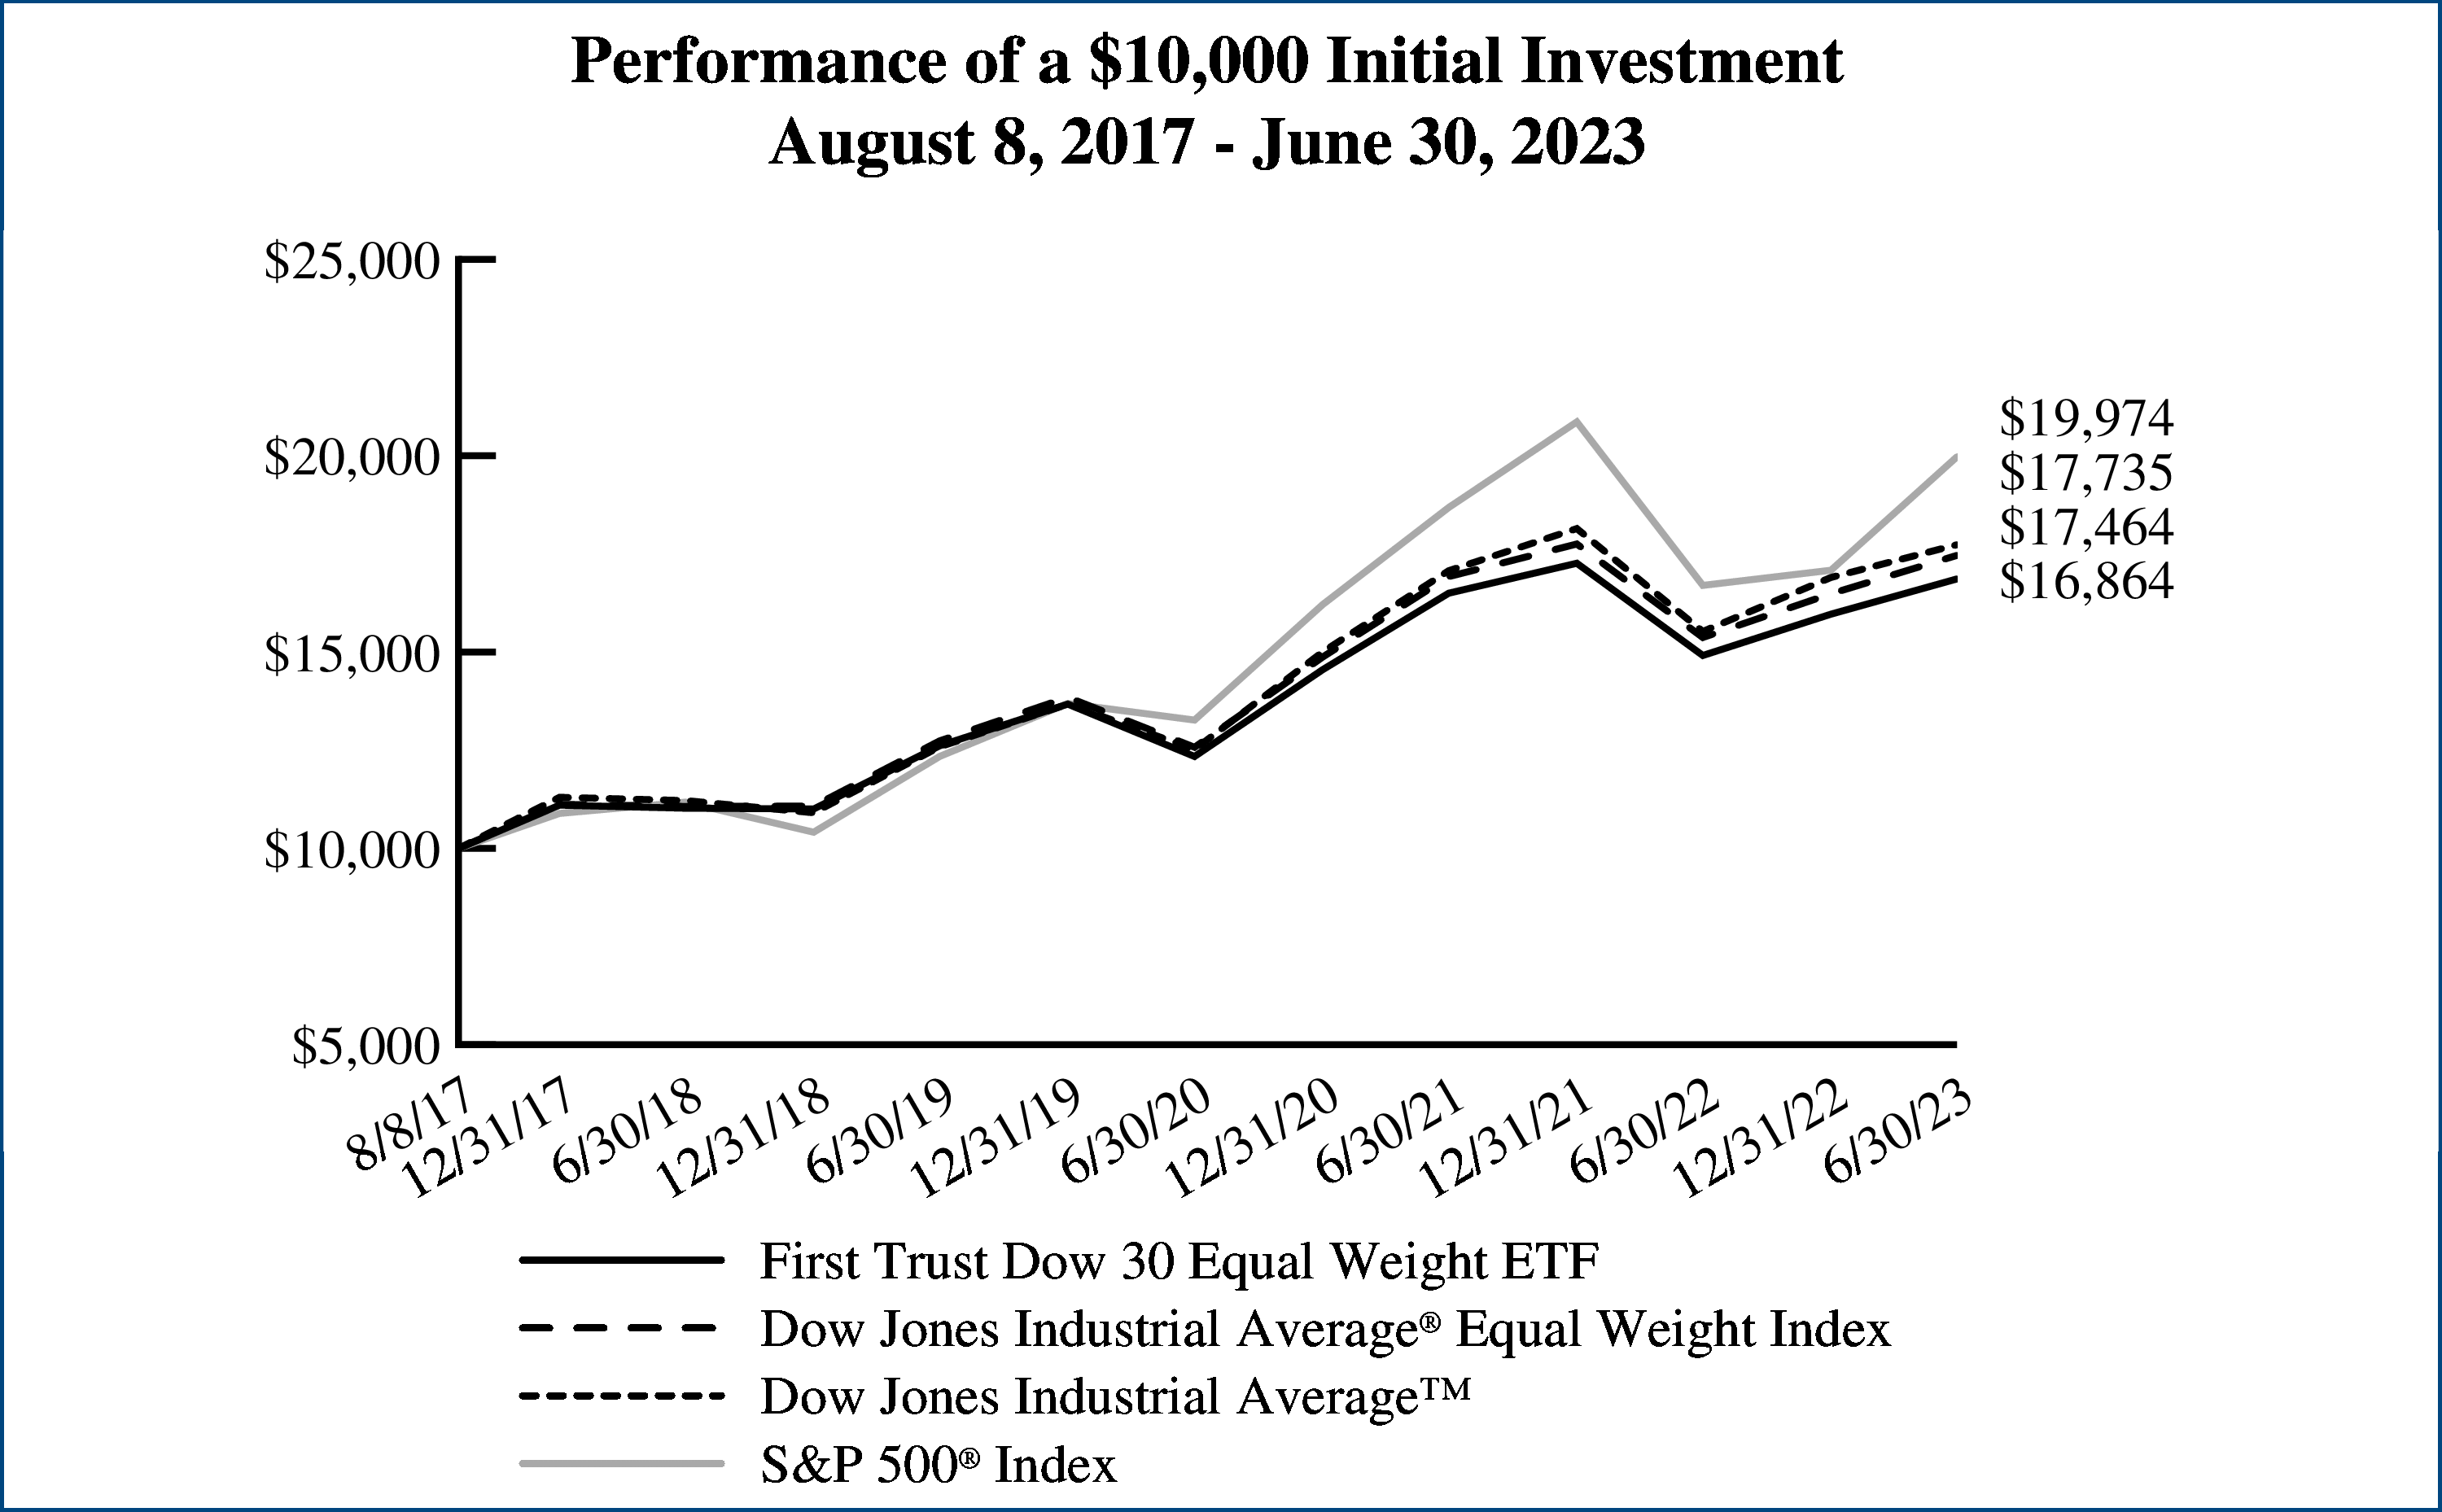 |
Performance figures assume reinvestment of
all distributions and do not reflect the
deduction of taxes that a shareholder would
pay on Fund distributions or the redemption
or sale of Fund shares. An index is a statistical
composite that tracks a specified financial
market or sector. Unlike the Fund, the indices
do not actually hold a portfolio of securities
and therefore do not incur the expenses
incurred by the Fund. These expenses
negatively impact the performance of the
Fund. The Fund’s past performance does not
predict future performance.
|
|
Performance
|
||||
|
|
|
|
Average Annual
Total Returns
|
Cumulative
Total Returns
|
|
|
6 Months
Ended
6/30/23
|
1 Year
Ended
6/30/23
|
Inception
(7/25/18)
to 6/30/23
|
Inception
(7/25/18)
to 6/30/23
|
|
Fund Performance
|
|
|
|
|
|
NAV
|
-5.14%
|
-1.82%
|
6.50%
|
36.43%
|
|
Market Price
|
-5.24%
|
-1.97%
|
6.48%
|
36.32%
|
|
Index Performance
|
|
|
|
|
|
Lunt Capital Large Cap Factor Rotation Index
|
-4.86%
|
-1.21%
|
7.28%
|
41.41%
|
|
Nasdaq US 500 Large CapTM Index
|
17.32%
|
19.82%
|
11.36%
|
69.97%
|
|
S&P 500® Index
|
16.89%
|
19.59%
|
11.42%
|
70.47%
|
|
Sector Allocation
|
% of Total
Long-Term
Investments
|
|
Information Technology
|
25.2%
|
|
Financials
|
23.8
|
|
Consumer Discretionary
|
12.5
|
|
Health Care
|
9.1
|
|
Energy
|
7.0
|
|
Industrials
|
6.5
|
|
Communication Services
|
6.1
|
|
Real Estate
|
5.1
|
|
Materials
|
3.6
|
|
Consumer Staples
|
0.7
|
|
Utilities
|
0.4
|
|
Total
|
100.0%
|
|
Top Ten Holdings
|
% of Total
Long-Term
Investments
|
|
Rivian Automotive, Inc., Class A
|
4.0%
|
|
BILL Holdings, Inc.
|
2.8
|
|
Apollo Global Management, Inc.
|
2.7
|
|
Datadog, Inc., Class A
|
2.0
|
|
Fidelity National Information Services, Inc.
|
1.8
|
|
Royal Caribbean Cruises Ltd.
|
1.5
|
|
KKR & Co., Inc.
|
1.5
|
|
Las Vegas Sands Corp.
|
1.4
|
|
Ovintiv, Inc.
|
1.4
|
|
Illumina, Inc.
|
1.3
|
|
Total
|
20.4%
|
Lunt Capital Management, Inc. (“Lunt”) and Lunt Capital Large Cap Factor Rotation Index (“Lunt Index”) are trademarks of Lunt and have been licensed for use for certain purposes by First Trust. The First Trust Lunt U.S. Factor Rotation ETF is based on the Lunt Index and is not sponsored, endorsed, sold or promoted by Lunt, and Lunt makes no representation regarding the advisability of trading in such fund. Lunt has contracted with Nasdaq, Inc. to calculate and maintain the Lunt Index. The Fund is not sponsored, endorsed, sold or promoted by Nasdaq, Inc. or its affiliates (Nasdaq, with its affiliates, hereinafter referred to as the “Corporations”). The Corporations have not passed on the legality or suitability of, or the accuracy or adequacy of descriptions and disclosures relating to, the Fund. The Corporations make no representation or warranty, express or implied to the owners of the Fund or any member of the public regarding the advisability of investing in securities generally or in the Fund particularly, or the ability of the Lunt Index to track general stock performance.
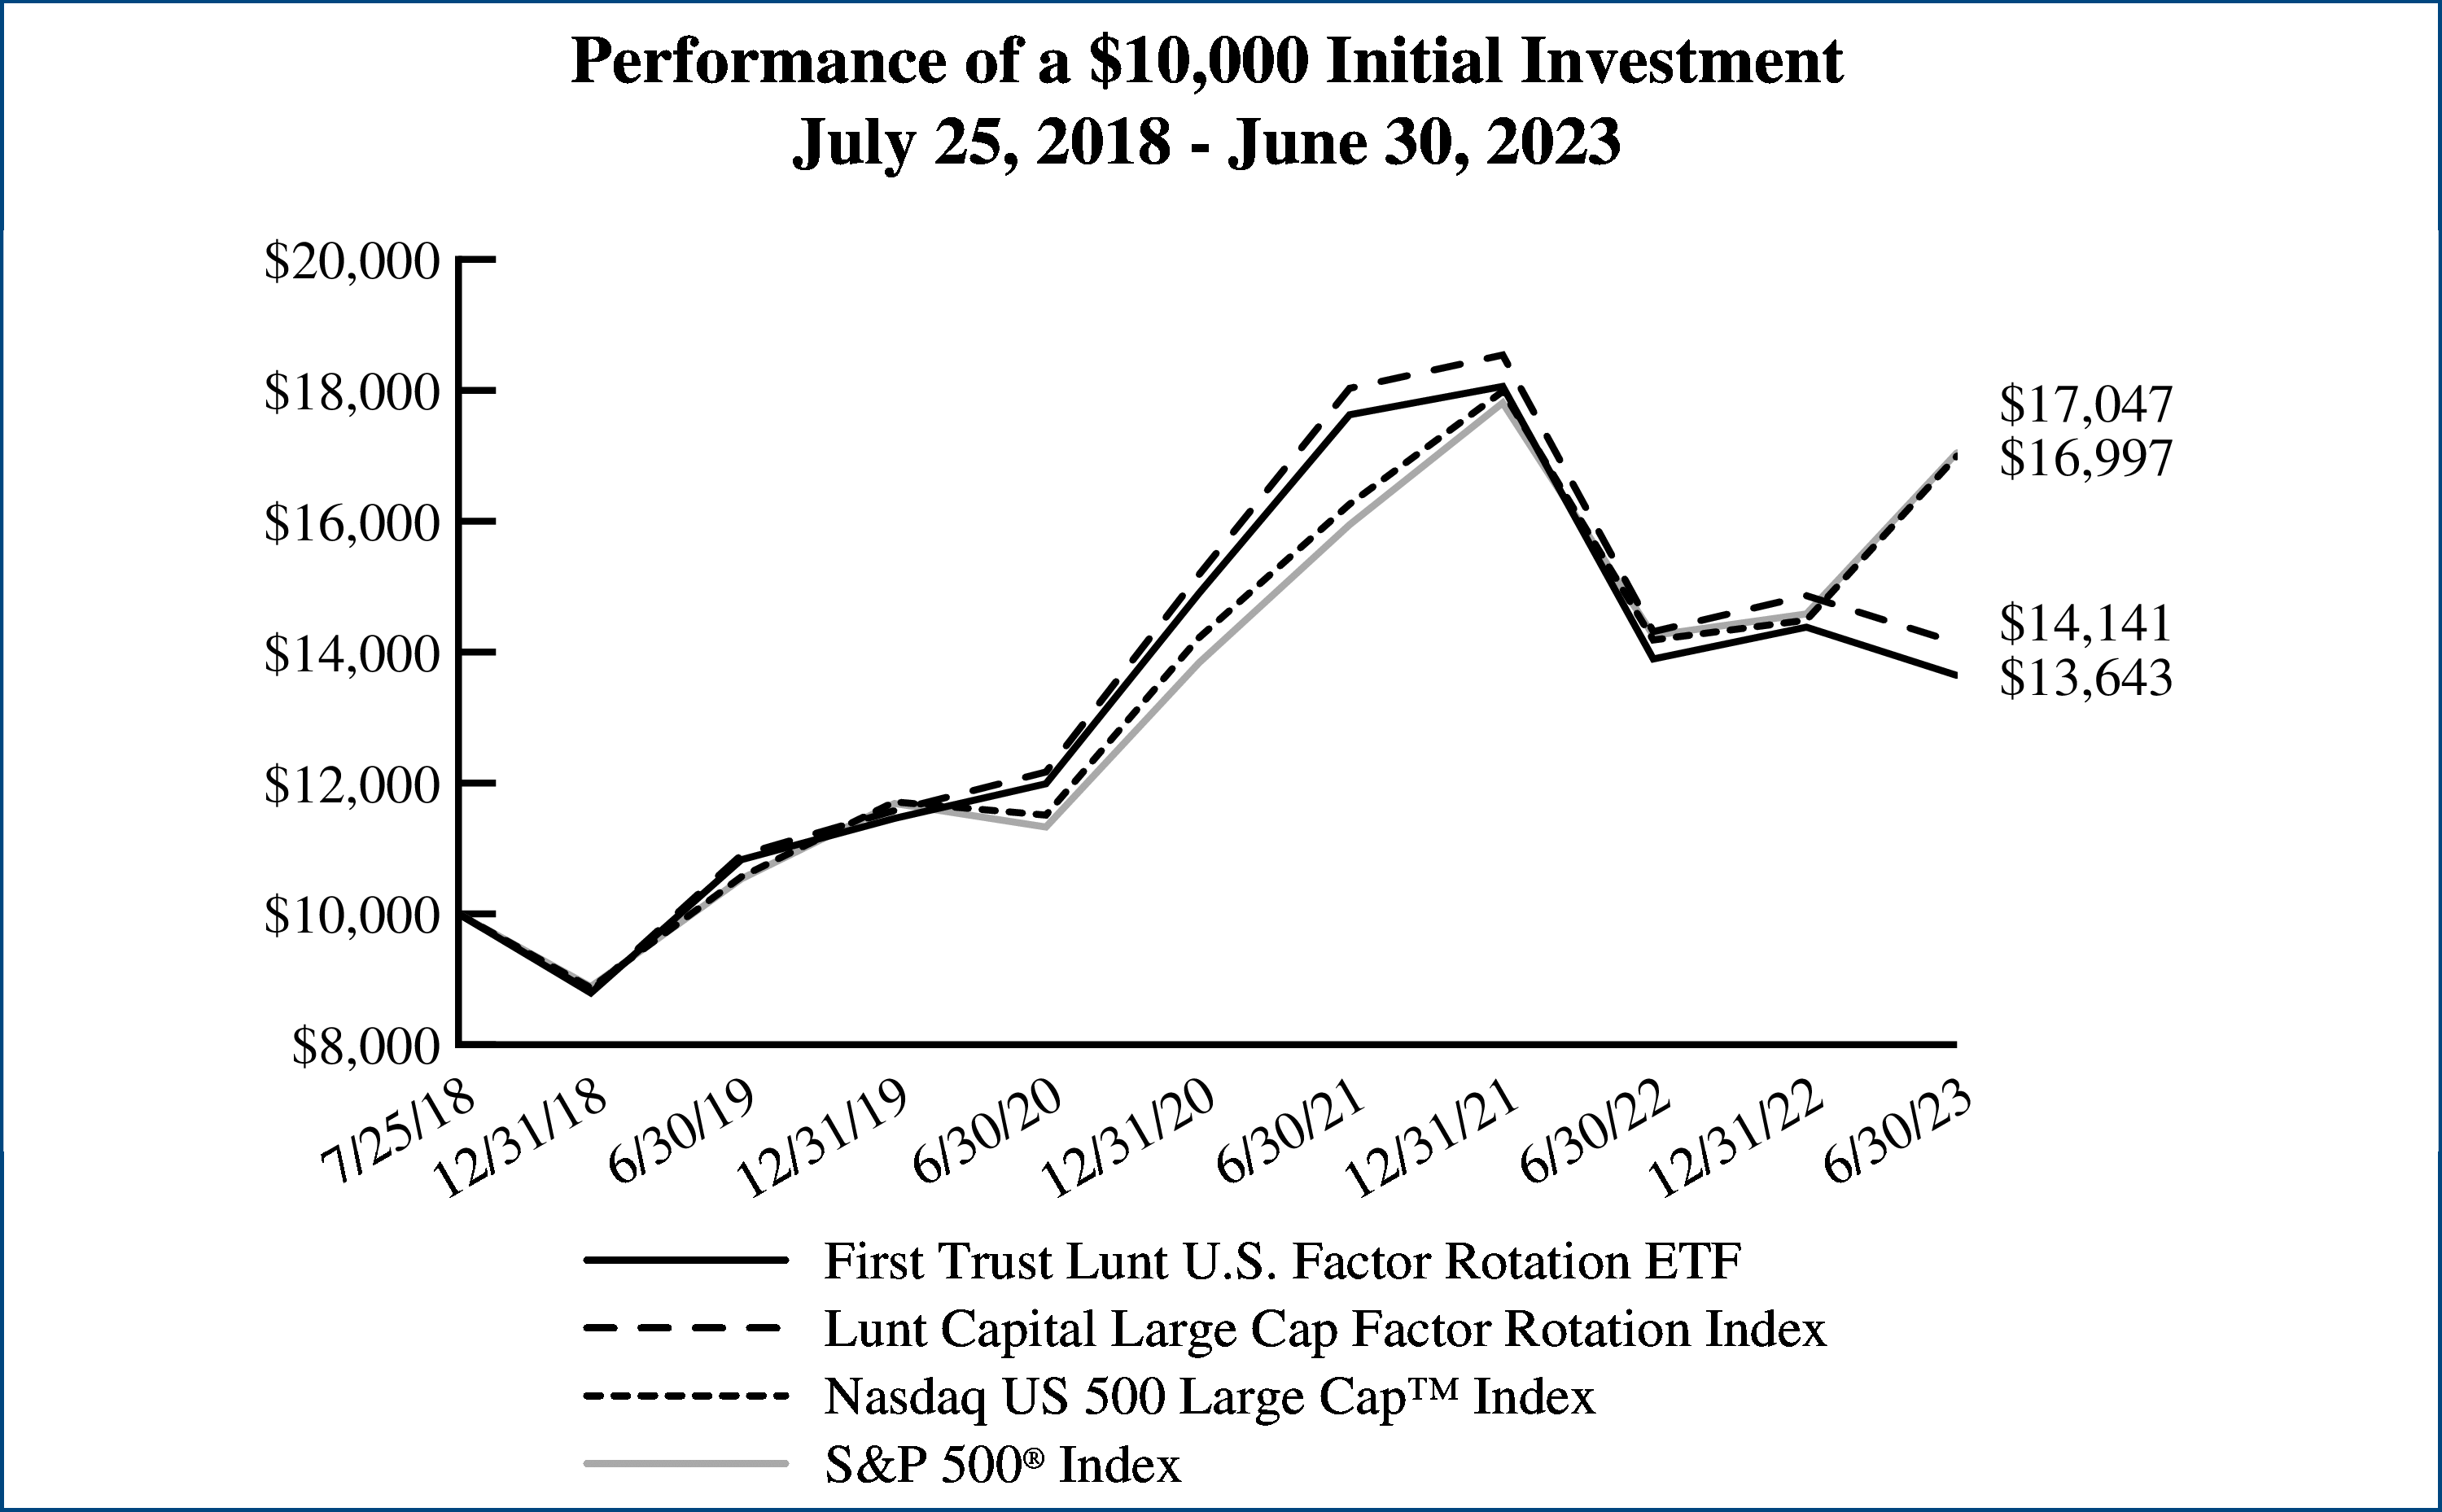 |
Performance figures assume reinvestment of
all distributions and do not reflect the
deduction of taxes that a shareholder would
pay on Fund distributions or the redemption
or sale of Fund shares. An index is a statistical
composite that tracks a specified financial
market or sector. Unlike the Fund, the indices
do not actually hold a portfolio of securities
and therefore do not incur the expenses
incurred by the Fund. These expenses
negatively impact the performance of the
Fund. The Fund’s past performance does not
predict future performance.
|
|
Performance
|
||
|
|
|
Cumulative
Total Returns
|
|
|
6 Months
Ended
6/30/23
|
Inception
(10/25/22)
to 6/30/23
|
|
Fund Performance
|
|
|
|
NAV
|
14.89%
|
16.26%
|
|
Market Price
|
14.76%
|
16.36%
|
|
Index Performance
|
|
|
|
The Growth StrengthTM Index
|
15.30%
|
16.61%
|
|
S&P 500® Index
|
16.89%
|
16.72%
|
|
Sector Allocation
|
% of Total
Long-Term
Investments
|
|
Information Technology
|
32.9%
|
|
Health Care
|
21.4
|
|
Consumer Discretionary
|
11.4
|
|
Energy
|
10.8
|
|
Industrials
|
7.9
|
|
Materials
|
7.7
|
|
Communication Services
|
2.1
|
|
Real Estate
|
2.0
|
|
Financials
|
1.9
|
|
Consumer Staples
|
1.9
|
|
Total
|
100.0%
|
|
Top Ten Holdings
|
% of Total
Long-Term
Investments
|
|
Tesla, Inc.
|
3.0%
|
|
NVIDIA Corp.
|
2.9
|
|
Broadcom, Inc.
|
2.6
|
|
KLA Corp.
|
2.4
|
|
Adobe, Inc.
|
2.4
|
|
ON Semiconductor Corp.
|
2.4
|
|
Applied Materials, Inc.
|
2.4
|
|
Lam Research Corp.
|
2.3
|
|
NXP Semiconductors N.V.
|
2.3
|
|
Apple, Inc.
|
2.2
|
|
Total
|
24.9%
|
Nasdaq® and The Growth StrengthTM Index are registered trademarks and service marks of Nasdaq, Inc. (together with its affiliates hereinafter referred to as the “Corporations”) and are licensed for use by First Trust. The Fund has not been passed on by the Corporations as to its legality or suitability. The Fund is not issued, endorsed, sold or promoted by the Corporations. THE CORPORATIONS MAKE NO WARRANTIES AND BEAR NO LIABILITY WITH RESPECT TO THE FUND.
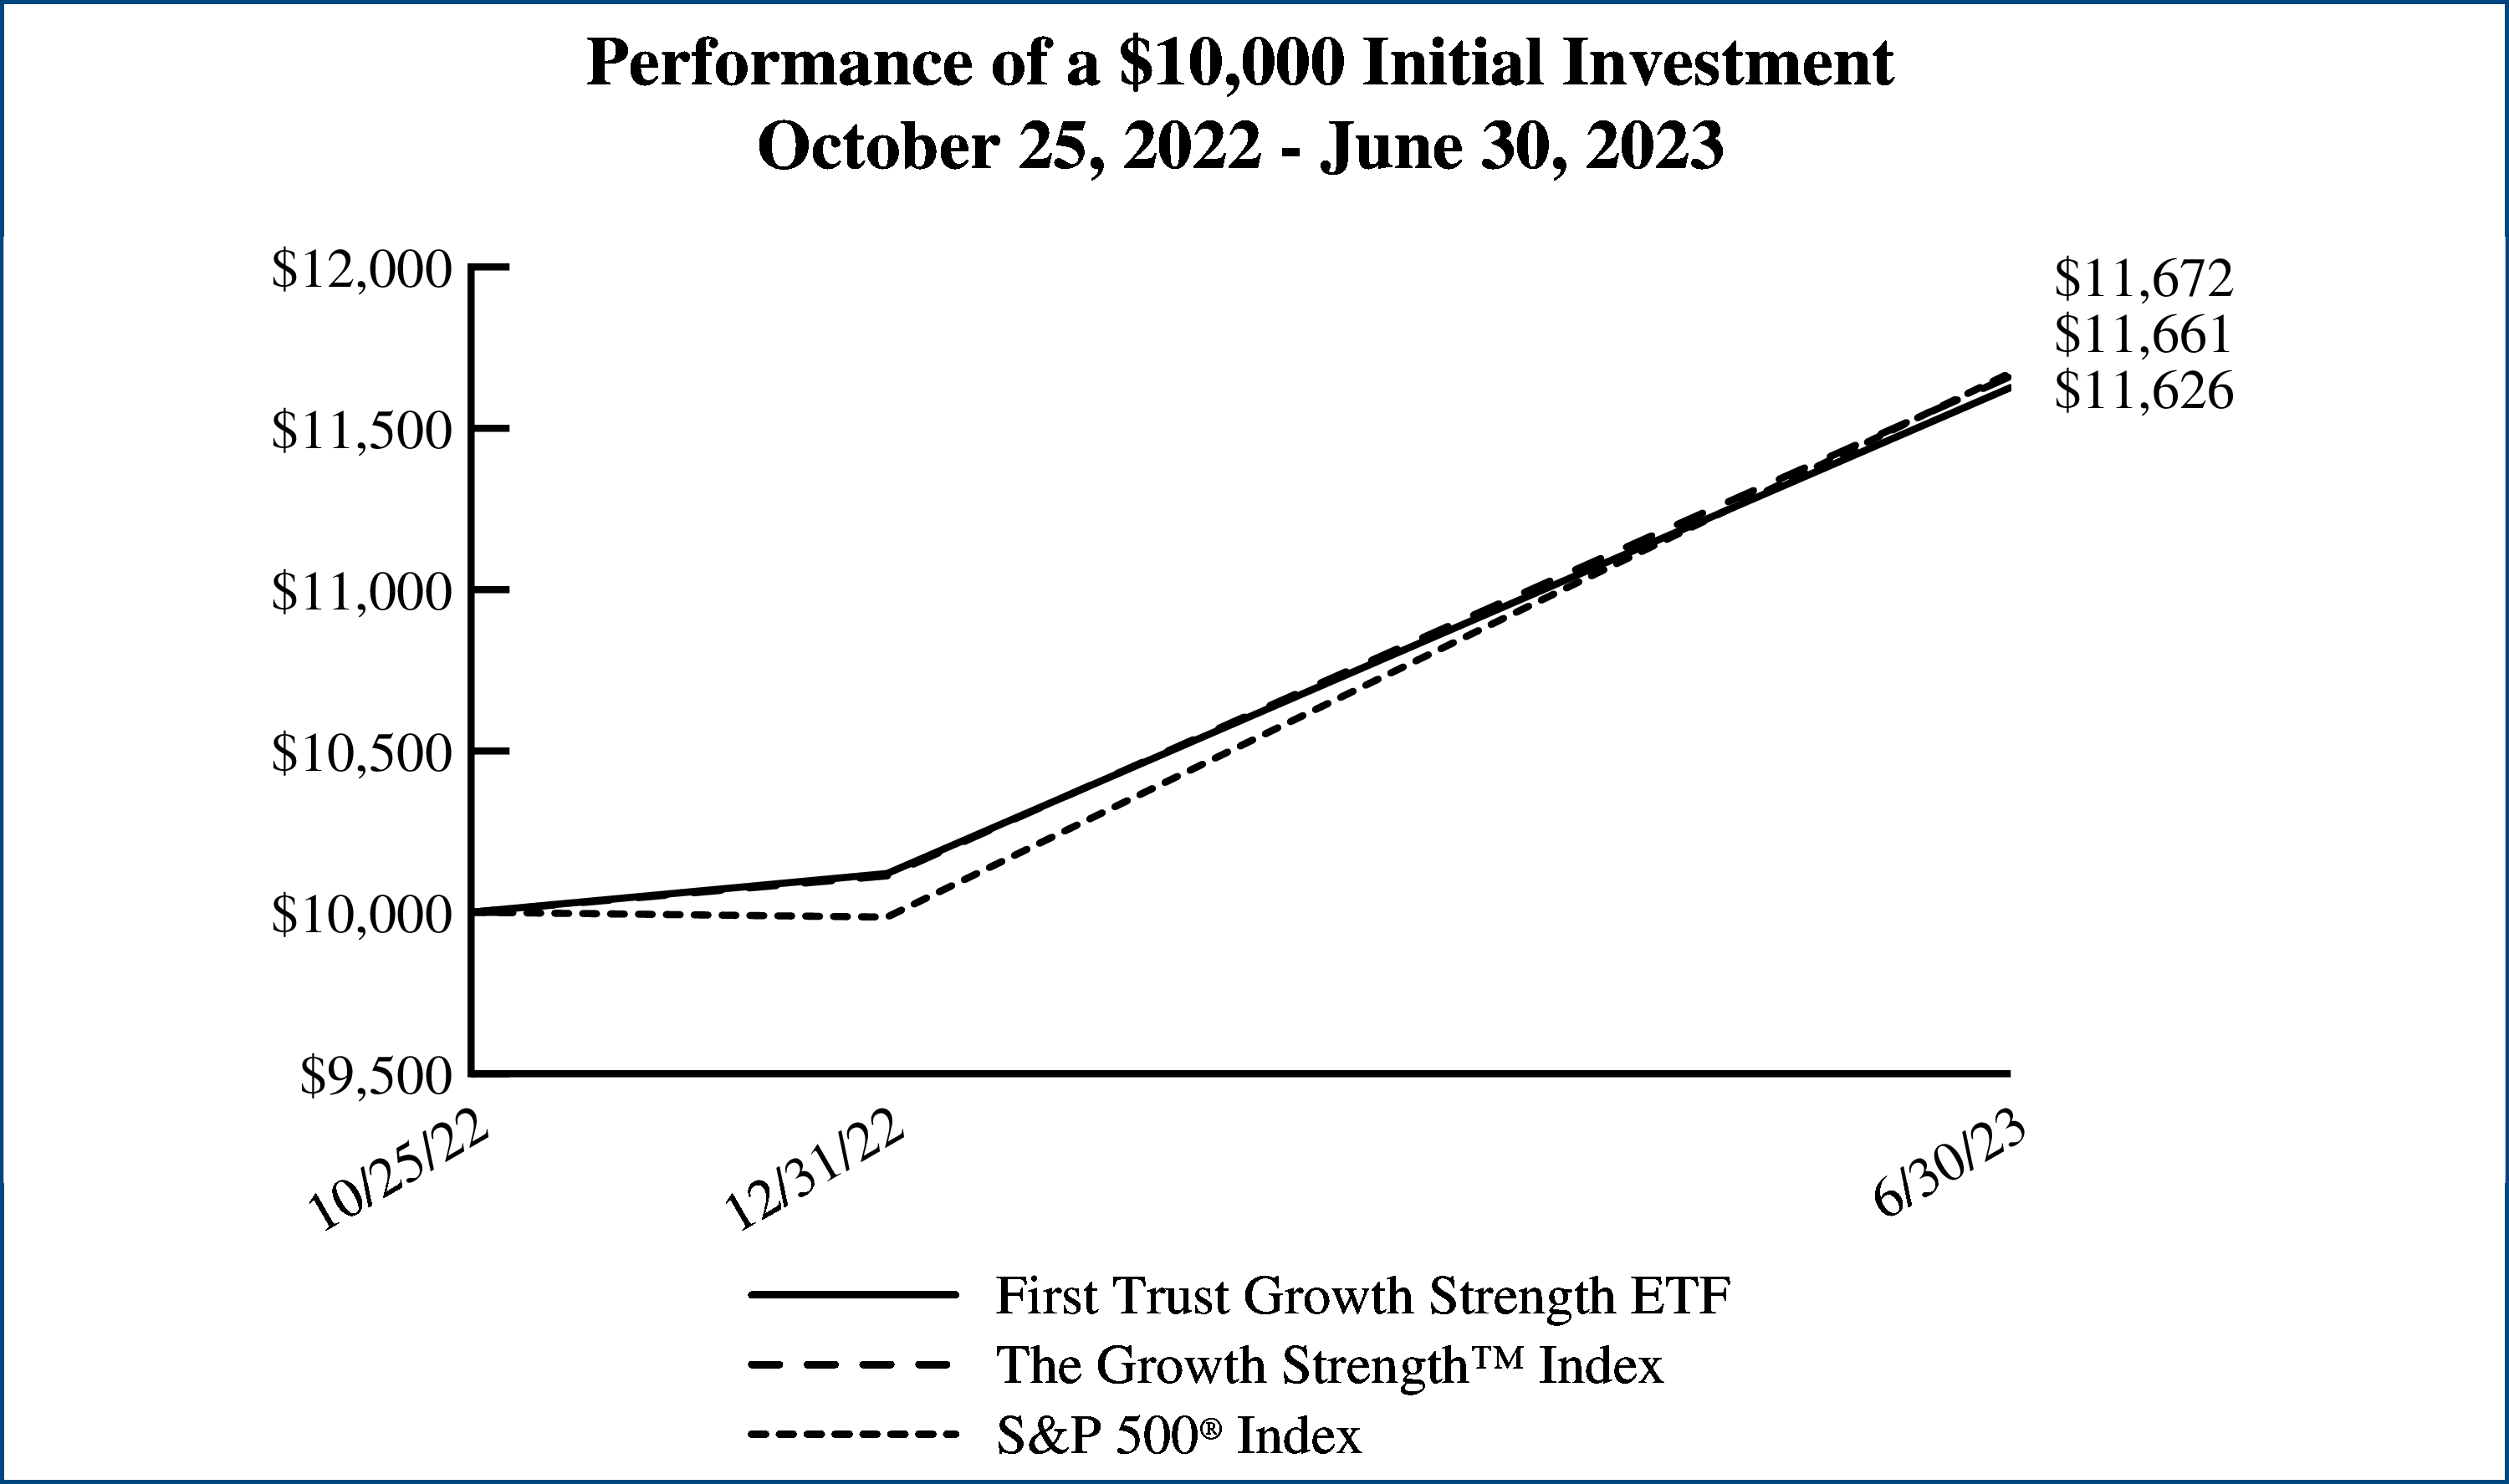 |
Performance figures assume reinvestment of
all distributions and do not reflect the
deduction of taxes that a shareholder would
pay on Fund distributions or the redemption
or sale of Fund shares. An index is a statistical
composite that tracks a specified financial
market or sector. Unlike the Fund, the indices
do not actually hold a portfolio of securities
and therefore do not incur the expenses
incurred by the Fund. These expenses
negatively impact the performance of the
Fund. The Fund’s past performance does not
predict future performance.
|
|
Performance
|
||
|
|
|
Cumulative
Total Returns
|
|
|
6 Months
Ended
6/30/23
|
Inception
(10/25/22)
to 6/30/23
|
|
Fund Performance
|
|
|
|
NAV
|
4.49%
|
12.16%
|
|
Market Price
|
4.39%
|
12.16%
|
|
Index Performance
|
|
|
|
Indxx US Aerospace & Defense Index
|
4.83%
|
12.59%
|
|
S&P 500® Index
|
16.89%
|
16.72%
|
|
S&P Composite 1500® Aerospace & Defense Index
|
1.01%
|
10.33%
|
Indxx and Indxx US Aerospace & Defense Index (“Index”) are trademarks of Indxx, Inc. (“Indxx”) and have been licensed for use for certain purposes by First Trust. The Fund is not sponsored, endorsed, sold or promoted by Indxx and Indxx makes no representation regarding the advisability of trading in such product. The Index is determined, composed and calculated by Indxx without regard to First Trust or the Fund.
|
Sector Allocation
|
% of Total
Long-Term
Investments
|
|
Industrials
|
99.6%
|
|
Communication Services
|
0.4
|
|
Total
|
100.0%
|
|
Top Ten Holdings
|
% of Total
Long-Term
Investments
|
|
Boeing (The) Co.
|
8.2%
|
|
Northrop Grumman Corp.
|
7.6
|
|
RTX Corp.
|
7.6
|
|
General Dynamics Corp.
|
7.4
|
|
Lockheed Martin Corp.
|
7.4
|
|
TransDigm Group, Inc.
|
4.7
|
|
Howmet Aerospace, Inc.
|
4.6
|
|
HEICO Corp.
|
4.1
|
|
Textron, Inc.
|
3.9
|
|
L3Harris Technologies, Inc.
|
3.8
|
|
Total
|
59.3%
|
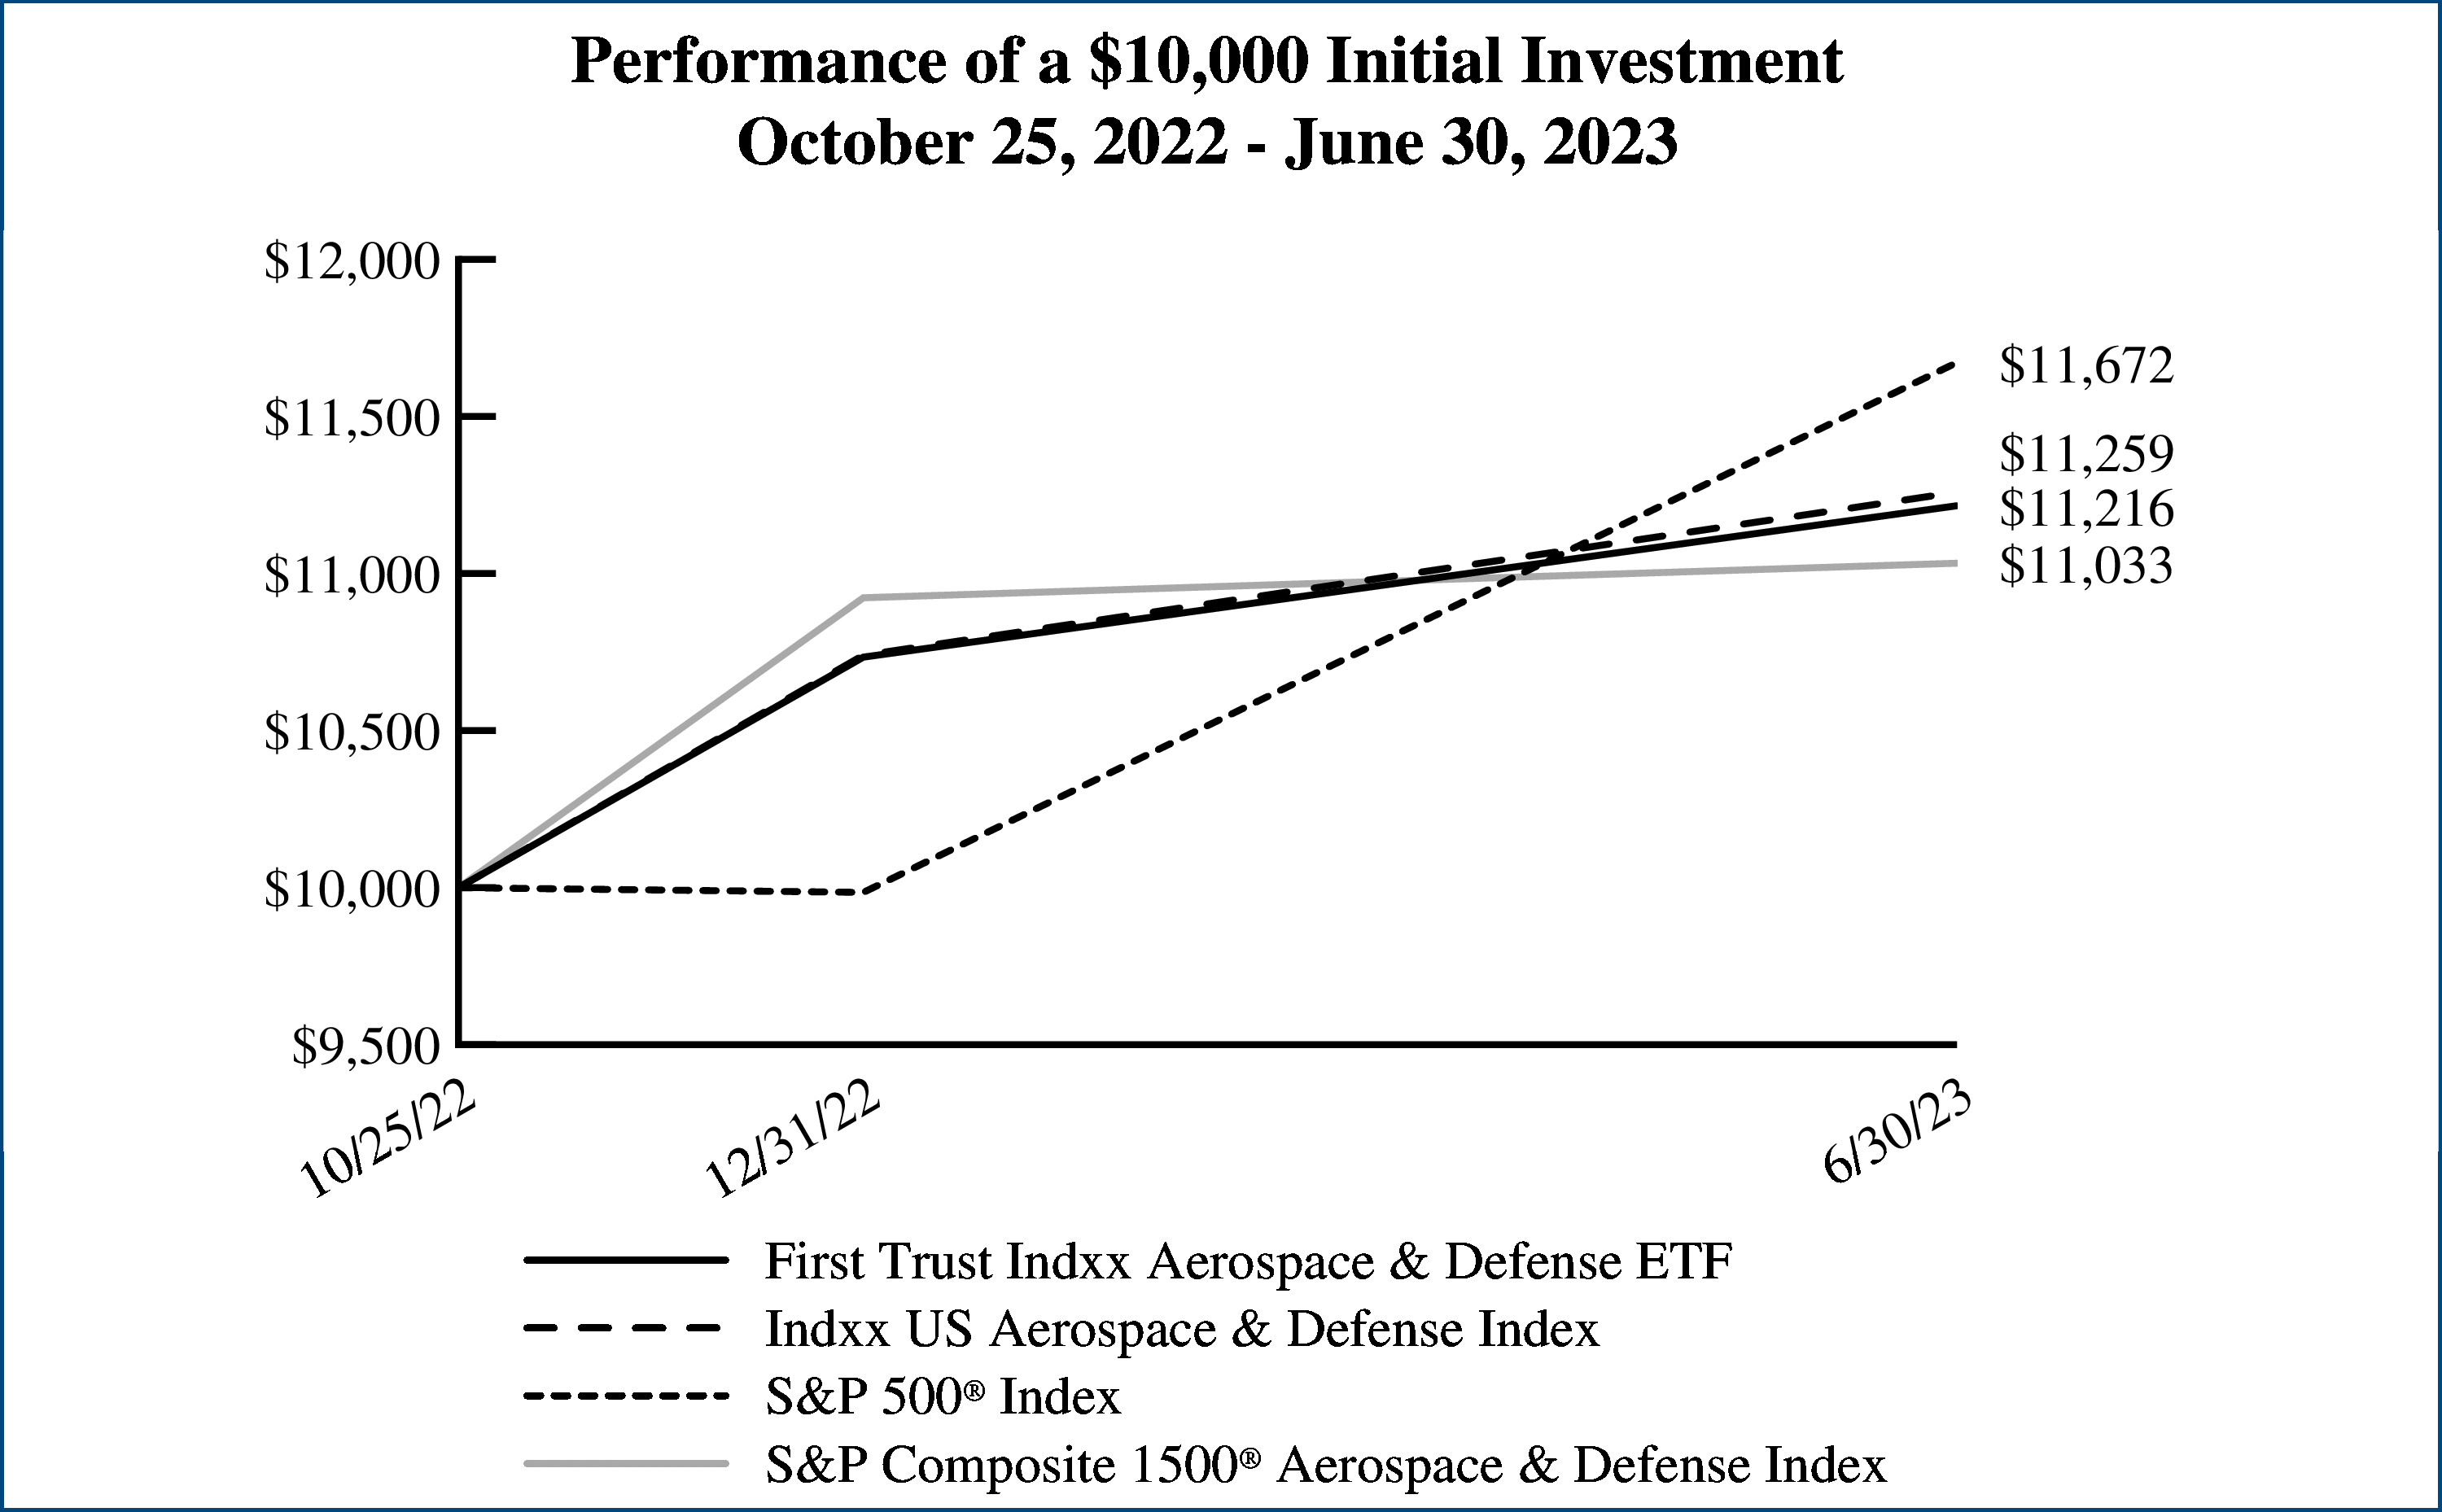 |
Performance figures assume reinvestment of
all distributions and do not reflect the
deduction of taxes that a shareholder would
pay on Fund distributions or the redemption
or sale of Fund shares. An index is a statistical
composite that tracks a specified financial
market or sector. Unlike the Fund, the indices
do not actually hold a portfolio of securities
and therefore do not incur the expenses
incurred by the Fund. These expenses
negatively impact the performance of the
Fund. The Fund’s past performance does not
predict future performance.
|
|
Performance
|
|
|
|
Cumulative
Total Returns
|
|
|
Inception
(3/13/23)
to 6/30/23
|
|
Fund Performance
|
|
|
NAV
|
4.53%
|
|
Market Price
|
4.53%
|
|
Index Performance
|
|
|
Bloomberg Inflation Sensitive Equity Index
|
4.74%
|
|
S&P 500® Index
|
16.00%
|
|
Sector Allocation
|
% of Total
Long-Term
Investments
|
|
Energy
|
31.8%
|
|
Materials
|
30.6
|
|
Industrials
|
21.4
|
|
Real Estate
|
16.2
|
|
Total
|
100.0%
|
|
Top Ten Holdings
|
% of Total
Long-Term
Investments
|
|
Owens Corning
|
3.1%
|
|
Reliance Steel & Aluminum Co.
|
2.7
|
|
Parker-Hannifin Corp.
|
2.7
|
|
Nucor Corp.
|
2.5
|
|
EQT Corp.
|
2.4
|
|
Range Resources Corp.
|
2.3
|
|
Chord Energy Corp.
|
2.2
|
|
PDC Energy, Inc.
|
2.2
|
|
Steel Dynamics, Inc.
|
2.2
|
|
LyondellBasell Industries N.V., Class A
|
2.2
|
|
Total
|
24.5%
|
“Bloomberg®” and Bloomberg Inflation Sensitive Equity Index licensed herein (the “Indices”) are service marks of Bloomberg Finance L.P. and its affiliates, including Bloomberg Index Services Limited (“BISL”), the administrator of the Indices (collectively, “Bloomberg”) and have been licensed for use for certain purposes by First Trust Advisors L.P. (the “Licensee”). Bloomberg is not affiliated with the Licensee, and Bloomberg does not approve, endorse, review, or recommend the financial products referenced herein (the “Financial Products”). Bloomberg does not guarantee the timeliness, accurateness, or completeness of any data or information relating to the Indices or the Financial Products.
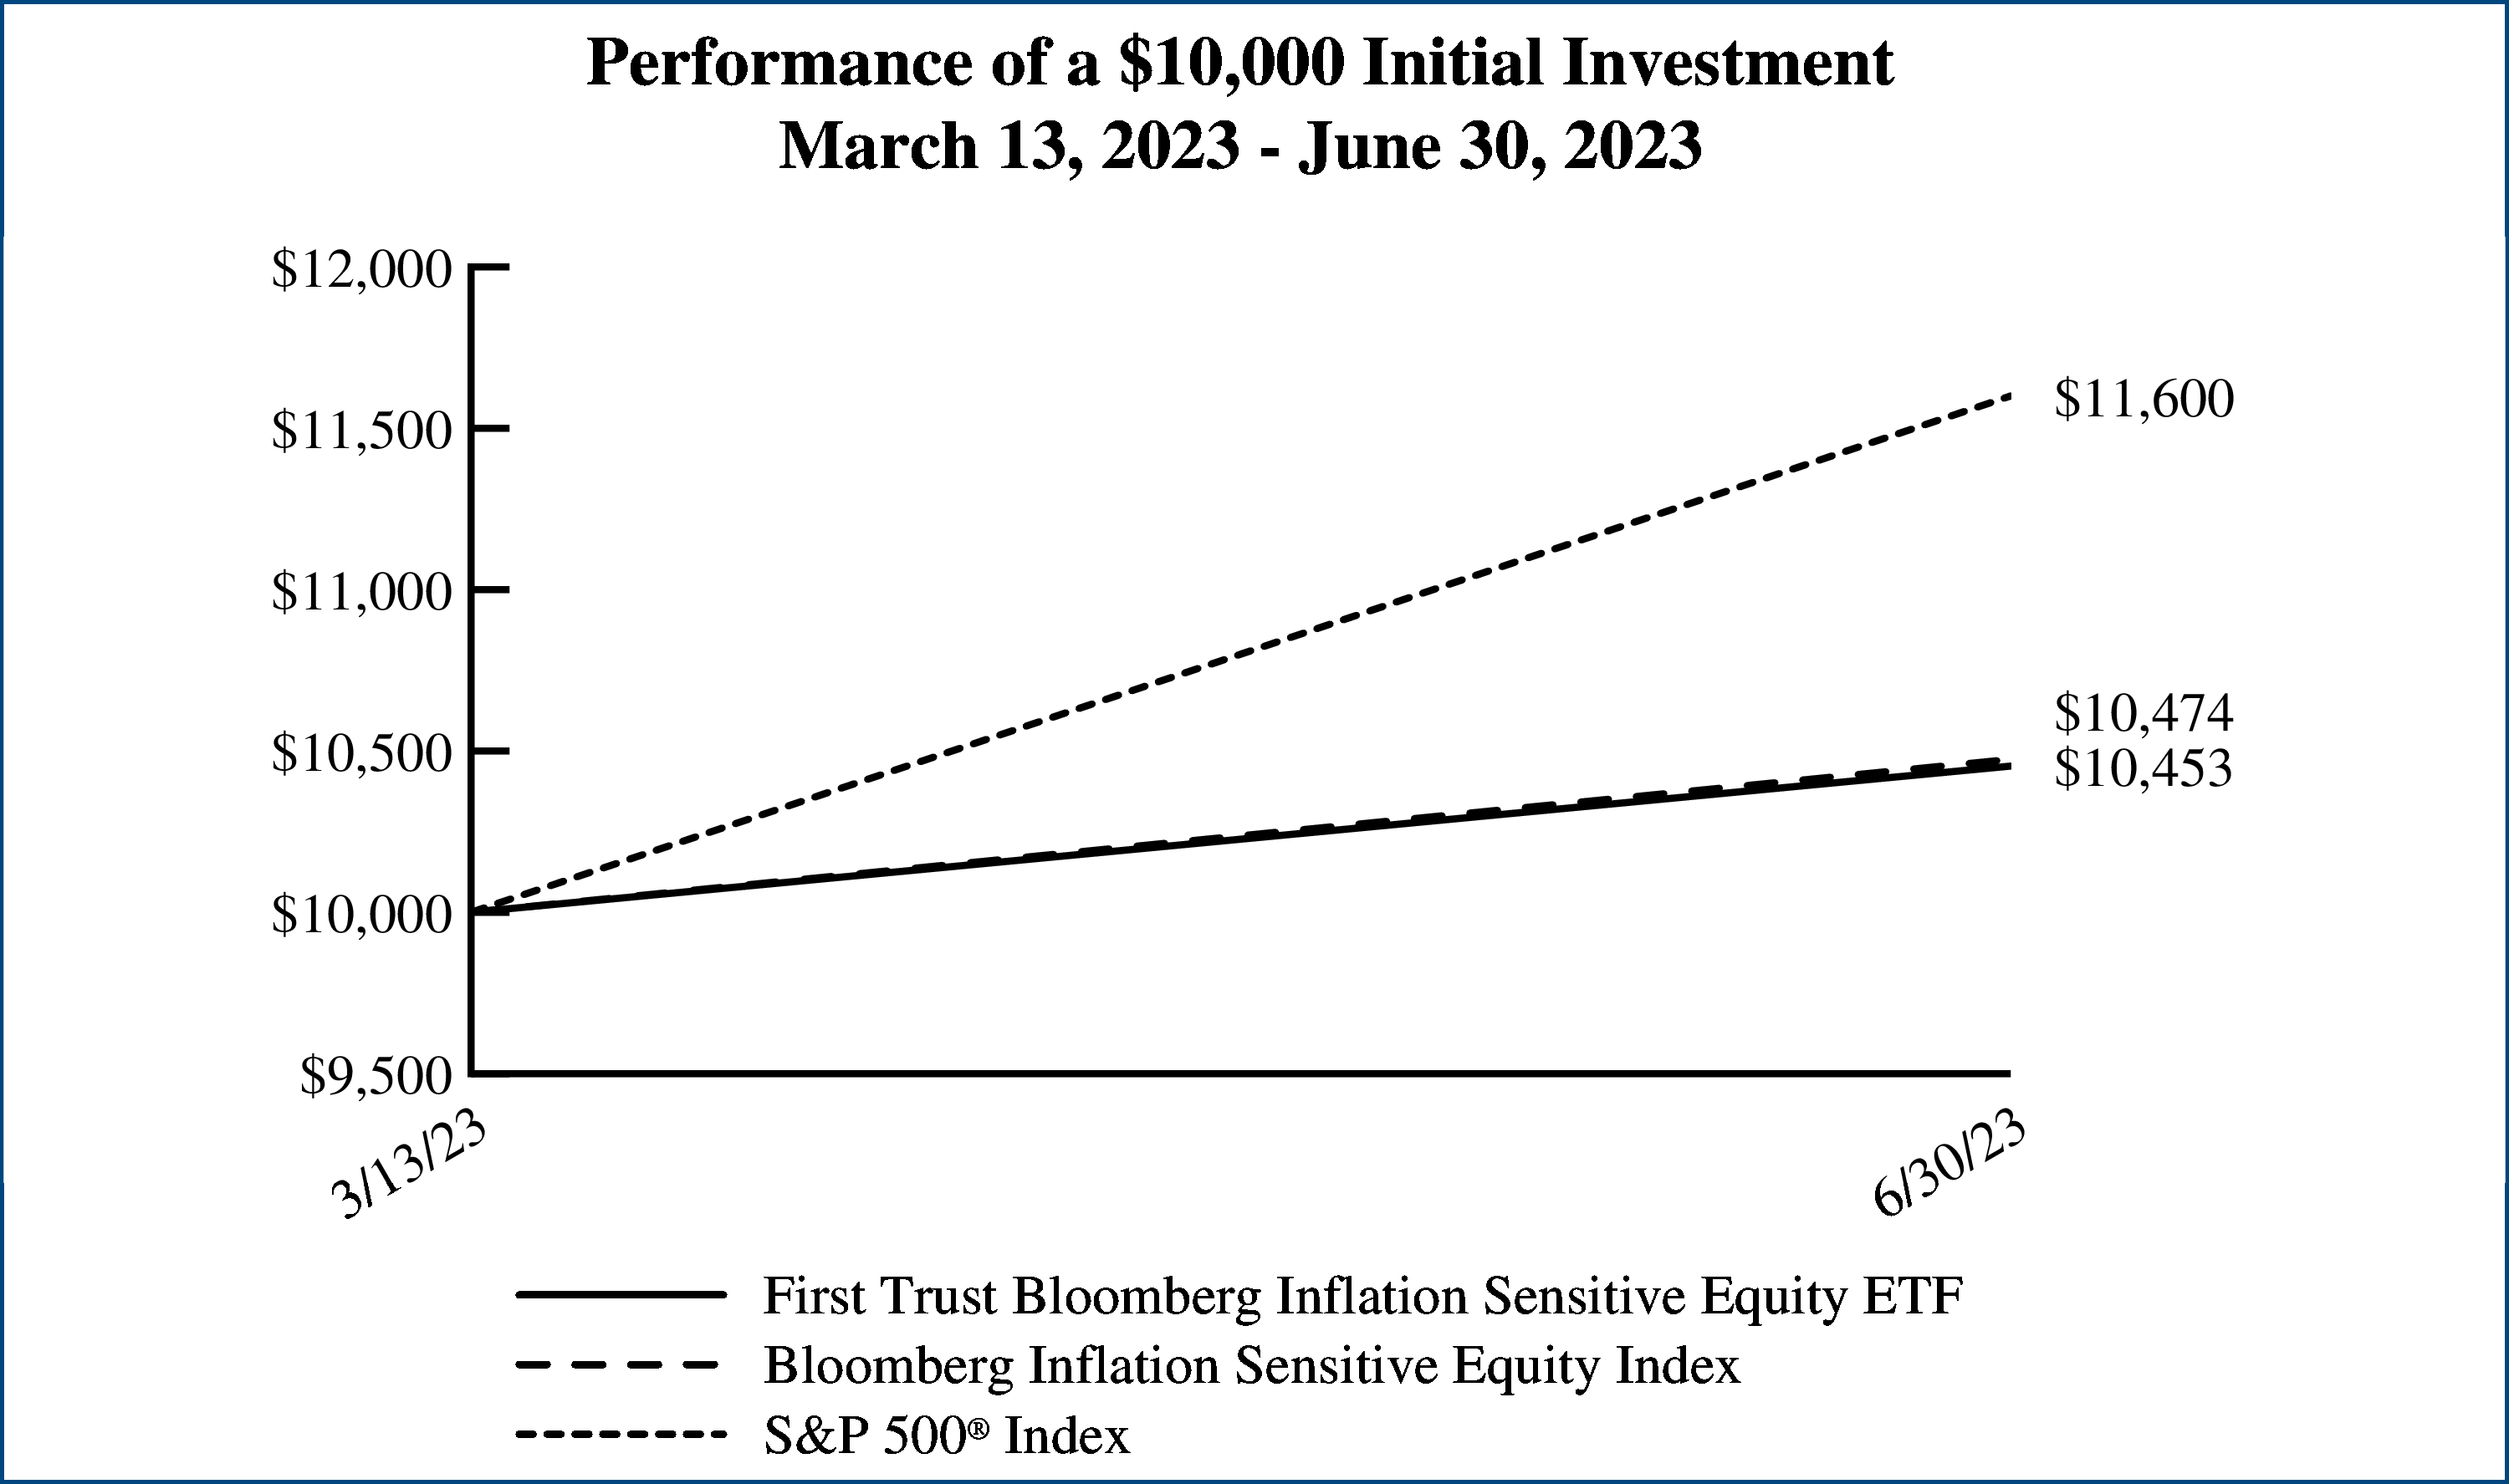 |
Performance figures assume reinvestment of
all distributions and do not reflect the
deduction of taxes that a shareholder would
pay on Fund distributions or the redemption
or sale of Fund shares. An index is a statistical
composite that tracks a specified financial
market or sector. Unlike the Fund, the indices
do not actually hold a portfolio of securities
and therefore do not incur the expenses
incurred by the Fund. These expenses
negatively impact the performance of the
Fund. The Fund’s past performance does not
predict future performance.
|
Understanding Your Fund Expenses
June 30, 2023 (Unaudited)
|
|
Beginning
Account Value
January 1, 2023
|
Ending
Account Value
June 30, 2023
|
Annualized
Expense Ratio
Based on the
Six-Month
Period
|
Expenses Paid
During the
Six-Month
Period (a)
|
|
First Trust Dividend Strength ETF (FTDS)
|
||||
|
Actual
|
$1,000.00
|
$1,003.20
|
0.70%
(b)
|
$3.48
|
|
Hypothetical (5% return before expenses)
|
$1,000.00
|
$1,021.32
|
0.70%
(b)
|
$3.51
|
|
First Trust Dow 30 Equal Weight ETF (EDOW)
|
||||
|
Actual
|
$1,000.00
|
$1,056.30
|
0.50%
|
$2.55
|
|
Hypothetical (5% return before expenses)
|
$1,000.00
|
$1,022.32
|
0.50%
|
$2.51
|
|
First Trust Lunt U.S. Factor Rotation ETF (FCTR)
|
||||
|
Actual
|
$1,000.00
|
$948.60
|
0.65%
|
$3.14
|
|
Hypothetical (5% return before expenses)
|
$1,000.00
|
$1,021.57
|
0.65%
|
$3.26
|
|
First Trust Growth Strength ETF (FTGS)
|
||||
|
Actual
|
$1,000.00
|
$1,148.90
|
0.61%
|
$3.25
|
|
Hypothetical (5% return before expenses)
|
$1,000.00
|
$1,021.77
|
0.61%
|
$3.06
|
|
First Trust Indxx Aerospace & Defense ETF (MISL)
|
||||
|
Actual
|
$1,000.00
|
$1,044.90
|
0.60%
|
$3.04
|
|
Hypothetical (5% return before expenses)
|
$1,000.00
|
$1,021.82
|
0.60%
|
$3.01
|
Understanding Your Fund Expenses (Continued)
June 30, 2023 (Unaudited)
|
|
Beginning
Account Value
March 13, 2023 (c)
|
Ending
Account Value
June 30, 2023
|
Annualized
Expense Ratio
Based on the
Number of Days
in the Period
|
Expenses Paid
During the Period
March 13, 2023 (c)
to
June 30, 2023 (d)
|
|
First Trust Bloomberg Inflation Sensitive Equity ETF (FTIF)
|
||||
|
Actual
|
$1,000.00
|
$1,045.30
|
0.60%
|
$1.85
|
|
Hypothetical (5% return before expenses)
|
$1,000.00
|
$1,021.82
|
0.60%
|
$3.01
|
|
(a)
|
Expenses are equal to the annualized expense ratio as indicated in the table multiplied by the average account value over
the period
(January 1, 2023 through June 30, 2023), multiplied by 181/365 (to reflect the six-month period).
|
|
(b)
|
These expense ratios reflect an expense cap. See Note3 in the Notes to Financial Statements.
|
|
(c)
|
Inception date.
|
|
(d)
|
Actual expenses are equal to the annualized expense ratio as indicated in the table multiplied by the average account value
over the period
(March 13, 2023 through June 30, 2023), multiplied by 110/365. Hypothetical expenses are assumed for the most recent six-month
period.
|
Portfolio of Investments
June 30, 2023 (Unaudited)
|
Shares
|
Description
|
Value
|
|||
|
COMMON STOCKS — 100.0%
|
|||||
|
|
Aerospace & Defense — 4.1%
|
|
|||
|
1,668
|
General Dynamics Corp.
|
$358,870
|
|||
|
1,799
|
Huntington Ingalls Industries,
Inc.
|
409,453
|
|||
|
|
|
768,323
|
|||
|
|
Air Freight & Logistics —
3.7%
|
|
|||
|
3,855
|
C.H. Robinson Worldwide, Inc.
|
363,719
|
|||
|
1,923
|
United Parcel Service, Inc.,
Class B
|
344,698
|
|||
|
|
|
708,417
|
|||
|
|
Banks — 7.6%
|
|
|||
|
6,880
|
Commerce Bancshares, Inc.
|
335,056
|
|||
|
3,622
|
Cullen/Frost Bankers, Inc.
|
389,474
|
|||
|
6,850
|
East West Bancorp, Inc.
|
361,611
|
|||
|
20,448
|
Regions Financial Corp.
|
364,383
|
|||
|
|
|
1,450,524
|
|||
|
|
Building Products — 2.6%
|
|
|||
|
3,707
|
Owens Corning
|
483,763
|
|||
|
|
Capital Markets — 5.7%
|
|
|||
|
6,978
|
Charles Schwab (The) Corp.
|
395,513
|
|||
|
4,401
|
Northern Trust Corp.
|
326,290
|
|||
|
6,105
|
Stifel Financial Corp.
|
364,285
|
|||
|
|
|
1,086,088
|
|||
|
|
Chemicals — 7.3%
|
|
|||
|
5,043
|
CF Industries Holdings, Inc.
|
350,085
|
|||
|
3,047
|
FMC Corp.
|
317,924
|
|||
|
8,523
|
Mosaic (The) Co.
|
298,305
|
|||
|
4,572
|
RPM International, Inc.
|
410,246
|
|||
|
|
|
1,376,560
|
|||
|
|
Containers & Packaging —
1.8%
|
|
|||
|
2,621
|
Packaging Corp. of America
|
346,391
|
|||
|
|
Distributors — 2.0%
|
|
|||
|
2,255
|
Genuine Parts Co.
|
381,614
|
|||
|
|
Food Products — 3.8%
|
|
|||
|
4,664
|
Archer-Daniels-Midland Co.
|
352,412
|
|||
|
3,948
|
Bunge Ltd.
|
372,494
|
|||
|
|
|
724,906
|
|||
|
|
Ground Transportation —
4.2%
|
|
|||
|
1,774
|
Norfolk Southern Corp.
|
402,272
|
|||
|
1,888
|
Union Pacific Corp.
|
386,323
|
|||
|
|
|
788,595
|
|||
|
|
Health Care Equipment &
Supplies — 1.9%
|
|
|||
|
3,362
|
Abbott Laboratories
|
366,525
|
|||
|
Shares
|
Description
|
Value
|
|||
|
|
|||||
|
|
Health Care Providers &
Services — 4.1%
|
|
|||
|
1,489
|
Cigna Group (The)
|
$417,813
|
|||
|
2,586
|
Quest Diagnostics, Inc.
|
363,488
|
|||
|
|
|
781,301
|
|||
|
|
Hotels, Restaurants & Leisure
— 2.0%
|
|
|||
|
3,414
|
Texas Roadhouse, Inc.
|
383,324
|
|||
|
|
Industrial REITs — 2.0%
|
|
|||
|
7,125
|
First Industrial Realty Trust, Inc.
|
375,060
|
|||
|
|
Insurance — 8.1%
|
|
|||
|
5,690
|
Aflac, Inc.
|
397,162
|
|||
|
10,579
|
Fidelity National Financial, Inc.
|
380,844
|
|||
|
5,399
|
Hartford Financial Services
Group (The), Inc.
|
388,836
|
|||
|
2,092
|
Travelers (The) Cos., Inc.
|
363,297
|
|||
|
|
|
1,530,139
|
|||
|
|
IT Services — 2.2%
|
|
|||
|
6,311
|
Cognizant Technology Solutions
Corp., Class A
|
411,982
|
|||
|
|
Machinery — 10.9%
|
|
|||
|
3,147
|
AGCO Corp.
|
413,579
|
|||
|
1,704
|
Caterpillar, Inc.
|
419,269
|
|||
|
1,612
|
Cummins, Inc.
|
395,198
|
|||
|
5,132
|
PACCAR, Inc.
|
429,292
|
|||
|
1,427
|
Snap-on, Inc.
|
411,247
|
|||
|
|
|
2,068,585
|
|||
|
|
Media — 2.0%
|
|
|||
|
10,012
|
Interpublic Group of (The) Cos.,
Inc.
|
386,263
|
|||
|
|
Oil, Gas & Consumable Fuels
— 9.7%
|
|
|||
|
2,220
|
Chevron Corp.
|
349,317
|
|||
|
3,671
|
ConocoPhillips
|
380,352
|
|||
|
14,746
|
Coterra Energy, Inc.
|
373,074
|
|||
|
8,469
|
HF Sinclair Corp.
|
377,802
|
|||
|
3,749
|
Phillips 66
|
357,580
|
|||
|
|
|
1,838,125
|
|||
|
|
Pharmaceuticals — 2.0%
|
|
|||
|
3,254
|
Merck & Co., Inc.
|
375,479
|
|||
|
|
Professional Services — 2.0%
|
|
|||
|
5,122
|
Robert Half International, Inc.
|
385,277
|
|||
|
|
Semiconductors &
Semiconductor Equipment
— 4.1%
|
|
|||
|
3,188
|
QUALCOMM, Inc.
|
379,500
|
|||
|
3,518
|
Skyworks Solutions, Inc.
|
389,407
|
|||
|
|
|
768,907
|
|||
Portfolio of Investments (Continued)
June 30, 2023 (Unaudited)
|
Shares
|
Description
|
Value
|
|||
|
COMMON STOCKS (Continued)
|
|||||
|
|
Specialty Retail — 3.8%
|
|
|||
|
1,510
|
Tractor Supply Co.
|
$333,861
|
|||
|
3,096
|
Williams-Sonoma, Inc.
|
387,433
|
|||
|
|
|
721,294
|
|||
|
|
Technology Hardware, Storage
& Peripherals — 2.4%
|
|
|||
|
5,939
|
NetApp, Inc.
|
453,740
|
|||
|
|
Total Common Stocks
|
18,961,182
|
|||
|
|
(Cost $19,211,429)
|
|
|||
|
MONEY MARKET FUNDS — 0.0%
|
|||||
|
13,518
|
Morgan Stanley Institutional
Liquidity Funds - Treasury
Portfolio - Institutional Class -
4.94% (a)
|
13,518
|
|||
|
|
(Cost $13,518)
|
|
|||
|
|
|||||
|
|
|||||
|
|
Total Investments — 100.0%
|
18,974,700
|
|||
|
|
(Cost $19,224,947)
|
|
|||
|
|
Net Other Assets and
Liabilities — (0.0)%
|
(8,794
)
|
|||
|
|
Net Assets — 100.0%
|
$18,965,906
|
|||
|
(a)
|
Rate shown reflects yield as of June 30, 2023.
|
Valuation Inputs
|
|
Total
Value at
6/30/2023
|
Level 1
Quoted
Prices
|
Level 2
Significant
Observable
Inputs
|
Level 3
Significant
Unobservable
Inputs
|
|
Common Stocks*
|
$18,961,182
|
$18,961,182
|
$—
|
$—
|
|
Money Market Funds
|
13,518
|
13,518
|
—
|
—
|
|
Total Investments
|
$18,974,700
|
$18,974,700
|
$—
|
$—
|
|
*
|
See Portfolio of Investments for industry breakout.
|
Portfolio of Investments
June 30, 2023 (Unaudited)
|
Shares
|
Description
|
Value
|
|||
|
COMMON STOCKS — 99.9%
|
|||||
|
|
Aerospace & Defense — 3.2%
|
|
|||
|
31,315
|
Boeing (The) Co. (a)
|
$6,612,475
|
|||
|
|
Banks — 3.4%
|
|
|||
|
48,261
|
JPMorgan Chase & Co.
|
7,019,080
|
|||
|
|
Beverages — 3.3%
|
|
|||
|
112,538
|
Coca-Cola (The) Co.
|
6,777,038
|
|||
|
|
Biotechnology — 3.3%
|
|
|||
|
31,101
|
Amgen, Inc.
|
6,905,044
|
|||
|
|
Capital Markets — 3.2%
|
|
|||
|
20,254
|
Goldman Sachs Group (The),
Inc.
|
6,532,725
|
|||
|
|
Chemicals — 3.4%
|
|
|||
|
131,518
|
Dow, Inc.
|
7,004,649
|
|||
|
|
Communications Equipment
— 3.4%
|
|
|||
|
137,028
|
Cisco Systems, Inc.
|
7,089,829
|
|||
|
|
Consumer Finance — 3.3%
|
|
|||
|
39,625
|
American Express Co.
|
6,902,675
|
|||
|
|
Consumer Staples Distribution
& Retail — 6.3%
|
|
|||
|
216,582
|
Walgreens Boots Alliance, Inc.
|
6,170,421
|
|||
|
44,448
|
Walmart, Inc.
|
6,986,337
|
|||
|
|
|
13,156,758
|
|||
|
|
Diversified Telecommunication
Services — 3.4%
|
|
|||
|
191,856
|
Verizon Communications, Inc.
|
7,135,125
|
|||
|
|
Entertainment — 3.2%
|
|
|||
|
74,029
|
Walt Disney (The) Co. (a)
|
6,609,309
|
|||
|
|
Financial Services — 3.5%
|
|
|||
|
30,443
|
Visa, Inc., Class A
|
7,229,603
|
|||
|
|
Health Care Providers &
Services — 3.2%
|
|
|||
|
13,787
|
UnitedHealth Group, Inc.
|
6,626,584
|
|||
|
|
Hotels, Restaurants & Leisure
— 3.4%
|
|
|||
|
23,728
|
McDonald’s Corp.
|
7,080,672
|
|||
|
|
Household Products — 3.4%
|
|
|||
|
46,437
|
Procter & Gamble (The) Co.
|
7,046,350
|
|||
|
|
Industrial Conglomerates —
6.7%
|
|
|||
|
68,121
|
3M Co.
|
6,818,231
|
|||
|
34,385
|
Honeywell International, Inc.
|
7,134,887
|
|||
|
|
|
13,953,118
|
|||
|
|
Insurance — 3.2%
|
|
|||
|
38,754
|
Travelers (The) Cos., Inc.
|
6,730,020
|
|||
|
|
IT Services — 3.2%
|
|
|||
|
50,301
|
International Business Machines
Corp.
|
6,730,777
|
|||
|
Shares
|
Description
|
Value
|
|||
|
|
|||||
|
|
Machinery — 3.4%
|
|
|||
|
28,955
|
Caterpillar, Inc.
|
$7,124,378
|
|||
|
|
Oil, Gas & Consumable Fuels
— 3.3%
|
|
|||
|
42,842
|
Chevron Corp.
|
6,741,189
|
|||
|
|
Pharmaceuticals — 6.8%
|
|
|||
|
42,525
|
Johnson & Johnson
|
7,038,738
|
|||
|
61,472
|
Merck & Co., Inc.
|
7,093,254
|
|||
|
|
|
14,131,992
|
|||
|
|
Semiconductors &
Semiconductor Equipment
— 3.5%
|
|
|||
|
217,135
|
Intel Corp.
|
7,260,994
|
|||
|
|
Software — 6.6%
|
|
|||
|
20,824
|
Microsoft Corp.
|
7,091,405
|
|||
|
31,604
|
Salesforce, Inc. (a)
|
6,676,661
|
|||
|
|
|
13,768,066
|
|||
|
|
Specialty Retail — 3.4%
|
|
|||
|
22,887
|
Home Depot (The), Inc.
|
7,109,618
|
|||
|
|
Technology Hardware, Storage
& Peripherals — 3.5%
|
|
|||
|
37,610
|
Apple, Inc.
|
7,295,212
|
|||
|
|
Textiles, Apparel & Luxury
Goods — 3.4%
|
|
|||
|
64,283
|
NIKE, Inc., Class B
|
7,094,915
|
|||
|
|
|||||
|
|
|||||
|
|
Total Investments — 99.9%
|
207,668,195
|
|||
|
|
(Cost $202,236,065)
|
|
|||
|
|
Net Other Assets and
Liabilities — 0.1%
|
118,861
|
|||
|
|
Net Assets — 100.0%
|
$207,787,056
|
|||
|
(a)
|
Non-income producing security.
|
Valuation Inputs
|
|
Total
Value at
6/30/2023
|
Level 1
Quoted
Prices
|
Level 2
Significant
Observable
Inputs
|
Level 3
Significant
Unobservable
Inputs
|
|
Common Stocks*
|
$207,668,195
|
$207,668,195
|
$—
|
$—
|
|
*
|
See Portfolio of Investments for industry breakout.
|
Portfolio of Investments
June 30, 2023 (Unaudited)
|
Shares
|
Description
|
Value
|
|||
|
COMMON STOCKS — 99.9%
|
|||||
|
|
Aerospace & Defense — 2.6%
|
|
|||
|
5,289
|
Axon Enterprise, Inc. (a)
|
$1,031,990
|
|||
|
9,234
|
Boeing (The) Co. (a)
|
1,949,851
|
|||
|
951
|
TransDigm Group, Inc.
|
850,356
|
|||
|
|
|
3,832,197
|
|||
|
|
Automobiles — 5.7%
|
|
|||
|
66,582
|
Ford Motor Co.
|
1,007,386
|
|||
|
216,642
|
Lucid Group, Inc. (a)
|
1,492,663
|
|||
|
351,051
|
Rivian Automotive, Inc.,
Class A (a)
|
5,848,510
|
|||
|
|
|
8,348,559
|
|||
|
|
Banks — 8.0%
|
|
|||
|
18,951
|
Bank of America Corp.
|
543,704
|
|||
|
37,579
|
Citizens Financial Group, Inc.
|
980,060
|
|||
|
61,719
|
Fifth Third Bancorp
|
1,617,655
|
|||
|
120,528
|
Huntington Bancshares, Inc.
|
1,299,292
|
|||
|
187,385
|
KeyCorp
|
1,731,437
|
|||
|
8,037
|
M&T Bank Corp.
|
994,659
|
|||
|
5,347
|
PNC Financial Services Group
(The), Inc.
|
673,455
|
|||
|
32,030
|
Regions Financial Corp.
|
570,775
|
|||
|
53,139
|
Truist Financial Corp.
|
1,612,769
|
|||
|
39,772
|
U.S. Bancorp
|
1,314,067
|
|||
|
9,636
|
Wells Fargo & Co.
|
411,264
|
|||
|
|
|
11,749,137
|
|||
|
|
Biotechnology — 1.2%
|
|
|||
|
9,214
|
Alnylam Pharmaceuticals,
Inc. (a)
|
1,750,107
|
|||
|
|
Broadline Retail — 0.8%
|
|
|||
|
3,347
|
Amazon.com, Inc. (a)
|
436,315
|
|||
|
9,259
|
Etsy, Inc. (a)
|
783,404
|
|||
|
|
|
1,219,719
|
|||
|
|
Building Products — 0.3%
|
|
|||
|
1,693
|
Carlisle Cos., Inc.
|
434,305
|
|||
|
|
Capital Markets — 5.5%
|
|
|||
|
6,957
|
Ares Management Corp.,
Class A
|
670,307
|
|||
|
8,270
|
Blackstone, Inc.
|
768,862
|
|||
|
20,029
|
Carlyle Group (The), Inc.
|
639,926
|
|||
|
33,337
|
Charles Schwab (The) Corp.
|
1,889,541
|
|||
|
38,224
|
KKR & Co., Inc.
|
2,140,544
|
|||
|
3,495
|
LPL Financial Holdings, Inc.
|
759,918
|
|||
|
1,414
|
MSCI, Inc.
|
663,576
|
|||
|
8,044
|
State Street Corp.
|
588,660
|
|||
|
|
|
8,121,334
|
|||
|
|
Chemicals — 1.9%
|
|
|||
|
5,907
|
Celanese Corp.
|
684,030
|
|||
|
10,247
|
CF Industries Holdings, Inc.
|
711,347
|
|||
|
Shares
|
Description
|
Value
|
|||
|
|
|||||
|
|
Chemicals (Continued)
|
|
|||
|
6,688
|
International Flavors &
Fragrances, Inc.
|
$532,298
|
|||
|
25,280
|
Mosaic (The) Co.
|
884,800
|
|||
|
|
|
2,812,475
|
|||
|
|
Consumer Finance — 0.5%
|
|
|||
|
23,301
|
Synchrony Financial
|
790,370
|
|||
|
|
Energy Equipment & Services
— 2.1%
|
|
|||
|
49,410
|
Baker Hughes Co.
|
1,561,850
|
|||
|
23,731
|
Halliburton Co.
|
782,886
|
|||
|
14,535
|
Schlumberger N.V.
|
713,959
|
|||
|
|
|
3,058,695
|
|||
|
|
Entertainment — 3.7%
|
|
|||
|
15,863
|
Live Nation Entertainment,
Inc. (a)
|
1,445,278
|
|||
|
44,991
|
ROBLOX Corp., Class A (a)
|
1,813,137
|
|||
|
6,488
|
Take-Two Interactive Software,
Inc. (a)
|
954,774
|
|||
|
93,838
|
Warner Bros Discovery, Inc. (a)
|
1,176,729
|
|||
|
|
|
5,389,918
|
|||
|
|
Financial Services — 7.1%
|
|
|||
|
50,805
|
Apollo Global Management, Inc.
|
3,902,332
|
|||
|
29,576
|
Block, Inc. (a)
|
1,968,874
|
|||
|
48,231
|
Fidelity National Information
Services, Inc.
|
2,638,236
|
|||
|
3,185
|
Jack Henry & Associates, Inc.
|
532,946
|
|||
|
1,905
|
Mastercard, Inc., Class A
|
749,237
|
|||
|
2,700
|
Visa, Inc., Class A
|
641,196
|
|||
|
|
|
10,432,821
|
|||
|
|
Food Products — 0.7%
|
|
|||
|
6,803
|
Bunge Ltd.
|
641,863
|
|||
|
8,679
|
Tyson Foods, Inc., Class A
|
442,976
|
|||
|
|
|
1,084,839
|
|||
|
|
Ground Transportation —
0.3%
|
|
|||
|
10,682
|
Uber Technologies, Inc. (a)
|
461,142
|
|||
|
|
Health Care Equipment &
Supplies — 4.1%
|
|
|||
|
23,789
|
Baxter International, Inc.
|
1,083,827
|
|||
|
12,385
|
Dexcom, Inc. (a)
|
1,591,596
|
|||
|
1,257
|
IDEXX Laboratories, Inc. (a)
|
631,303
|
|||
|
6,844
|
Insulet Corp. (a)
|
1,973,399
|
|||
|
2,275
|
Intuitive Surgical, Inc. (a)
|
777,914
|
|||
|
|
|
6,058,039
|
|||
|
|
Health Care Providers &
Services — 0.7%
|
|
|||
|
7,968
|
Centene Corp. (a)
|
537,441
|
|||
|
8,013
|
CVS Health Corp.
|
553,939
|
|||
|
|
|
1,091,380
|
|||
Portfolio of Investments (Continued)
June 30, 2023 (Unaudited)
|
Shares
|
Description
|
Value
|
|||
|
COMMON STOCKS (Continued)
|
|||||
|
|
Health Care REITs — 0.9%
|
|
|||
|
25,837
|
Healthpeak Properties, Inc.
|
$519,323
|
|||
|
18,088
|
Ventas, Inc.
|
855,020
|
|||
|
|
|
1,374,343
|
|||
|
|
Health Care Technology —
0.4%
|
|
|||
|
2,971
|
Veeva Systems, Inc., Class A (a)
|
587,456
|
|||
|
|
Hotels, Restaurants & Leisure
— 5.9%
|
|
|||
|
2,394
|
Domino’s Pizza, Inc.
|
806,754
|
|||
|
21,655
|
DoorDash, Inc., Class A (a)
|
1,654,875
|
|||
|
35,948
|
Las Vegas Sands Corp. (a)
|
2,084,984
|
|||
|
2,270
|
McDonald’s Corp.
|
677,391
|
|||
|
7,990
|
MGM Resorts International
|
350,921
|
|||
|
21,333
|
Royal Caribbean Cruises Ltd. (a)
|
2,213,085
|
|||
|
5,958
|
Yum! Brands, Inc.
|
825,481
|
|||
|
|
|
8,613,491
|
|||
|
|
Industrial Conglomerates —
0.9%
|
|
|||
|
4,125
|
3M Co.
|
412,871
|
|||
|
8,387
|
General Electric Co.
|
921,312
|
|||
|
|
|
1,334,183
|
|||
|
|
Insurance — 2.7%
|
|
|||
|
8,071
|
Allstate (The) Corp.
|
880,062
|
|||
|
7,583
|
American International Group,
Inc.
|
436,326
|
|||
|
7,190
|
Cincinnati Financial Corp.
|
699,731
|
|||
|
271
|
Markel Group, Inc. (a)
|
374,841
|
|||
|
9,225
|
MetLife, Inc.
|
521,489
|
|||
|
12,204
|
Prudential Financial, Inc.
|
1,076,637
|
|||
|
|
|
3,989,086
|
|||
|
|
Interactive Media & Services
— 1.9%
|
|
|||
|
28,508
|
Match Group, Inc. (a)
|
1,193,060
|
|||
|
11,955
|
Pinterest, Inc., Class A (a)
|
326,849
|
|||
|
113,644
|
Snap, Inc., Class A (a)
|
1,345,545
|
|||
|
|
|
2,865,454
|
|||
|
|
IT Services — 3.7%
|
|
|||
|
18,728
|
Cloudflare, Inc., Class A (a)
|
1,224,249
|
|||
|
4,629
|
MongoDB, Inc. (a)
|
1,902,473
|
|||
|
8,078
|
Snowflake, Inc., Class A (a)
|
1,421,566
|
|||
|
3,781
|
VeriSign, Inc. (a)
|
854,393
|
|||
|
|
|
5,402,681
|
|||
|
|
Life Sciences Tools & Services
— 1.7%
|
|
|||
|
10,527
|
Illumina, Inc. (a)
|
1,973,707
|
|||
|
386
|
Mettler-Toledo International,
Inc. (a)
|
506,293
|
|||
|
|
|
2,480,000
|
|||
|
Shares
|
Description
|
Value
|
|||
|
|
|||||
|
|
Machinery — 0.4%
|
|
|||
|
6,688
|
Stanley Black & Decker, Inc.
|
$626,733
|
|||
|
|
Media — 0.5%
|
|
|||
|
16,235
|
Paramount Global, Class B
|
258,299
|
|||
|
5,432
|
Trade Desk (The), Inc.,
Class A (a)
|
419,459
|
|||
|
|
|
677,758
|
|||
|
|
Metals & Mining — 1.6%
|
|
|||
|
17,917
|
Freeport-McMoRan, Inc.
|
716,680
|
|||
|
6,766
|
Newmont Corp.
|
288,638
|
|||
|
4,187
|
Nucor Corp.
|
686,584
|
|||
|
6,640
|
Steel Dynamics, Inc.
|
723,295
|
|||
|
|
|
2,415,197
|
|||
|
|
Multi-Utilities — 0.4%
|
|
|||
|
11,577
|
Dominion Energy, Inc.
|
599,573
|
|||
|
|
Office REITs — 0.6%
|
|
|||
|
7,933
|
Alexandria Real Estate Equities,
Inc.
|
900,316
|
|||
|
|
Oil, Gas & Consumable Fuels
— 4.9%
|
|
|||
|
22,106
|
APA Corp.
|
755,362
|
|||
|
25,873
|
Coterra Energy, Inc.
|
654,587
|
|||
|
11,951
|
Devon Energy Corp.
|
577,711
|
|||
|
5,719
|
EOG Resources, Inc.
|
654,482
|
|||
|
5,097
|
Hess Corp.
|
692,937
|
|||
|
31,145
|
Marathon Oil Corp.
|
716,958
|
|||
|
52,954
|
Ovintiv, Inc.
|
2,015,959
|
|||
|
2,968
|
Pioneer Natural Resources Co.
|
614,910
|
|||
|
459
|
Texas Pacific Land Corp.
|
604,274
|
|||
|
|
|
7,287,180
|
|||
|
|
Passenger Airlines — 0.6%
|
|
|||
|
24,309
|
Southwest Airlines Co.
|
880,229
|
|||
|
|
Pharmaceuticals — 1.0%
|
|
|||
|
1,829
|
Eli Lilly & Co.
|
857,764
|
|||
|
3,145
|
Zoetis, Inc.
|
541,601
|
|||
|
|
|
1,399,365
|
|||
|
|
Professional Services — 0.8%
|
|
|||
|
2,149
|
Paycom Software, Inc.
|
690,345
|
|||
|
6,119
|
TransUnion
|
479,301
|
|||
|
|
|
1,169,646
|
|||
|
|
Residential REITs — 2.0%
|
|
|||
|
2,342
|
AvalonBay Communities, Inc.
|
443,270
|
|||
|
6,151
|
Camden Property Trust
|
669,659
|
|||
|
8,129
|
Equity LifeStyle Properties, Inc.
|
543,749
|
|||
|
8,577
|
Equity Residential
|
565,825
|
|||
|
2,825
|
Essex Property Trust, Inc.
|
661,898
|
|||
|
|
|
2,884,401
|
|||
Portfolio of Investments (Continued)
June 30, 2023 (Unaudited)
|
Shares
|
Description
|
Value
|
|||
|
COMMON STOCKS (Continued)
|
|||||
|
|
Semiconductors &
Semiconductor Equipment
— 5.4%
|
|
|||
|
3,353
|
Advanced Micro Devices,
Inc. (a)
|
$381,940
|
|||
|
7,940
|
Enphase Energy, Inc. (a)
|
1,329,791
|
|||
|
9,996
|
First Solar, Inc. (a)
|
1,900,140
|
|||
|
45,428
|
Intel Corp.
|
1,519,112
|
|||
|
20,548
|
Marvell Technology, Inc.
|
1,228,360
|
|||
|
1,071
|
Monolithic Power Systems, Inc.
|
578,586
|
|||
|
2,401
|
NVIDIA Corp.
|
1,015,671
|
|||
|
|
|
7,953,600
|
|||
|
|
Software — 15.5%
|
|
|||
|
1,567
|
Adobe, Inc. (a)
|
766,247
|
|||
|
1,643
|
Aspen Technology, Inc. (a)
|
275,383
|
|||
|
6,196
|
Autodesk, Inc. (a)
|
1,267,764
|
|||
|
34,693
|
BILL Holdings, Inc. (a)
|
4,053,877
|
|||
|
2,997
|
Cadence Design Systems,
Inc. (a)
|
702,856
|
|||
|
4,871
|
Crowdstrike Holdings, Inc.,
Class A (a)
|
715,404
|
|||
|
30,082
|
Datadog, Inc., Class A (a)
|
2,959,467
|
|||
|
20,197
|
DocuSign, Inc. (a)
|
1,031,865
|
|||
|
998
|
Fair Isaac Corp. (a)
|
807,592
|
|||
|
9,179
|
Fortinet, Inc. (a)
|
693,841
|
|||
|
45,421
|
Gen Digital, Inc.
|
842,559
|
|||
|
2,201
|
HubSpot, Inc. (a)
|
1,171,130
|
|||
|
3,092
|
Palo Alto Networks, Inc. (a)
|
790,037
|
|||
|
3,333
|
Salesforce, Inc. (a)
|
704,130
|
|||
|
1,386
|
ServiceNow, Inc. (a)
|
778,890
|
|||
|
6,607
|
Splunk, Inc. (a)
|
700,937
|
|||
|
1,355
|
Synopsys, Inc. (a)
|
589,980
|
|||
|
22,491
|
Unity Software, Inc. (a)
|
976,559
|
|||
|
1,726
|
Workday, Inc., Class A (a)
|
389,886
|
|||
|
10,677
|
Zoom Video Communications,
Inc., Class A (a)
|
724,755
|
|||
|
12,936
|
Zscaler, Inc. (a)
|
1,892,537
|
|||
|
|
|
22,835,696
|
|||
|
|
Specialized REITs — 1.6%
|
|
|||
|
3,164
|
American Tower Corp.
|
613,626
|
|||
|
4,016
|
Crown Castle, Inc.
|
457,583
|
|||
|
4,108
|
Digital Realty Trust, Inc.
|
467,778
|
|||
|
3,617
|
SBA Communications Corp.
|
838,276
|
|||
|
|
|
2,377,263
|
|||
|
|
Specialty Retail — 0.2%
|
|
|||
|
1,635
|
Burlington Stores, Inc. (a)
|
257,333
|
|||
|
|
Technology Hardware, Storage
& Peripherals — 0.6%
|
|
|||
|
21,734
|
Western Digital Corp. (a)
|
824,371
|
|||
|
Shares
|
Description
|
Value
|
|||
|
|
|||||
|
|
Trading Companies &
Distributors — 0.5%
|
|
|||
|
1,677
|
United Rentals, Inc.
|
$746,886
|
|||
|
|
Total Common Stocks
|
147,117,278
|
|||
|
|
(Cost $140,603,993)
|
|
|||
|
MONEY MARKET FUNDS — 0.1%
|
|||||
|
72,727
|
Morgan Stanley Institutional
Liquidity Funds - Treasury
Portfolio - Institutional Class -
4.94% (b)
|
72,727
|
|||
|
|
(Cost $72,727)
|
|
|||
|
|
|||||
|
|
|||||
|
|
Total Investments — 100.0%
|
147,190,005
|
|||
|
|
(Cost $140,676,720)
|
|
|||
|
|
Net Other Assets and
Liabilities — 0.0%
|
69,416
|
|||
|
|
Net Assets — 100.0%
|
$147,259,421
|
|||
|
(a)
|
Non-income producing security.
|
|
(b)
|
Rate shown reflects yield as of June 30, 2023.
|
Valuation Inputs
|
|
Total
Value at
6/30/2023
|
Level 1
Quoted
Prices
|
Level 2
Significant
Observable
Inputs
|
Level 3
Significant
Unobservable
Inputs
|
|
Common Stocks*
|
$147,117,278
|
$147,117,278
|
$—
|
$—
|
|
Money Market
Funds
|
72,727
|
72,727
|
—
|
—
|
|
Total Investments
|
$147,190,005
|
$147,190,005
|
$—
|
$—
|
|
*
|
See Portfolio of Investments for industry breakout.
|
Portfolio of Investments
June 30, 2023 (Unaudited)
|
Shares
|
Description
|
Value
|
|||
|
COMMON STOCKS — 100.0%
|
|||||
|
|
Air Freight & Logistics —
3.8%
|
|
|||
|
1,583
|
Expeditors International of
Washington, Inc.
|
$191,749
|
|||
|
903
|
United Parcel Service, Inc.,
Class B
|
161,863
|
|||
|
|
|
353,612
|
|||
|
|
Automobiles — 3.0%
|
|
|||
|
1,064
|
Tesla, Inc. (a)
|
278,523
|
|||
|
|
Biotechnology — 5.2%
|
|
|||
|
1,082
|
AbbVie, Inc.
|
145,778
|
|||
|
218
|
Regeneron Pharmaceuticals,
Inc. (a)
|
156,642
|
|||
|
528
|
Vertex Pharmaceuticals, Inc. (a)
|
185,808
|
|||
|
|
|
488,228
|
|||
|
|
Chemicals — 1.8%
|
|
|||
|
2,377
|
CF Industries Holdings, Inc.
|
165,011
|
|||
|
|
Commercial Services &
Supplies — 2.2%
|
|
|||
|
2,250
|
Copart, Inc. (a)
|
205,222
|
|||
|
|
Electronic Equipment,
Instruments & Components
— 2.1%
|
|
|||
|
2,290
|
Amphenol Corp., Class A
|
194,536
|
|||
|
|
Food Products — 1.9%
|
|
|||
|
1,856
|
Bunge Ltd.
|
175,114
|
|||
|
|
Health Care Equipment &
Supplies — 5.6%
|
|
|||
|
1,575
|
Abbott Laboratories
|
171,707
|
|||
|
1,408
|
Dexcom, Inc. (a)
|
180,942
|
|||
|
2,090
|
Hologic, Inc. (a)
|
169,227
|
|||
|
|
|
521,876
|
|||
|
|
Health Care Providers &
Services — 2.1%
|
|
|||
|
640
|
Molina Healthcare, Inc. (a)
|
192,794
|
|||
|
|
Household Durables — 6.3%
|
|
|||
|
1,641
|
D.R. Horton, Inc.
|
199,693
|
|||
|
1,583
|
Lennar Corp., Class A
|
198,366
|
|||
|
31
|
NVR, Inc. (a)
|
196,869
|
|||
|
|
|
594,928
|
|||
|
|
Insurance — 1.9%
|
|
|||
|
3,039
|
W.R. Berkley Corp.
|
181,003
|
|||
|
|
Interactive Media & Services
— 2.1%
|
|
|||
|
1,672
|
Alphabet, Inc., Class A (a)
|
200,138
|
|||
|
|
IT Services — 1.5%
|
|
|||
|
623
|
EPAM Systems, Inc. (a)
|
140,019
|
|||
|
Shares
|
Description
|
Value
|
|||
|
|
|||||
|
|
Life Sciences Tools & Services
— 5.1%
|
|
|||
|
1,279
|
Agilent Technologies, Inc.
|
$153,800
|
|||
|
698
|
Danaher Corp.
|
167,520
|
|||
|
306
|
Thermo Fisher Scientific, Inc.
|
159,655
|
|||
|
|
|
480,975
|
|||
|
|
Machinery — 2.0%
|
|
|||
|
456
|
Deere & Co.
|
184,767
|
|||
|
|
Metals & Mining — 5.9%
|
|
|||
|
1,151
|
Nucor Corp.
|
188,741
|
|||
|
705
|
Reliance Steel & Aluminum Co.
|
191,471
|
|||
|
1,616
|
Steel Dynamics, Inc.
|
176,031
|
|||
|
|
|
556,243
|
|||
|
|
Oil, Gas & Consumable Fuels
— 10.8%
|
|
|||
|
1,039
|
Chevron Corp.
|
163,487
|
|||
|
1,720
|
ConocoPhillips
|
178,209
|
|||
|
3,290
|
Devon Energy Corp.
|
159,039
|
|||
|
1,503
|
EOG Resources, Inc.
|
172,003
|
|||
|
1,513
|
Exxon Mobil Corp.
|
162,269
|
|||
|
1,472
|
Valero Energy Corp.
|
172,666
|
|||
|
|
|
1,007,673
|
|||
|
|
Pharmaceuticals — 3.4%
|
|
|||
|
2,505
|
Bristol-Myers Squibb Co.
|
160,195
|
|||
|
4,370
|
Pfizer, Inc.
|
160,291
|
|||
|
|
|
320,486
|
|||
|
|
Semiconductors &
Semiconductor Equipment
— 20.6%
|
|
|||
|
1,545
|
Applied Materials, Inc.
|
223,314
|
|||
|
279
|
Broadcom, Inc.
|
242,013
|
|||
|
777
|
Enphase Energy, Inc. (a)
|
130,132
|
|||
|
472
|
KLA Corp.
|
228,930
|
|||
|
336
|
Lam Research Corp.
|
216,001
|
|||
|
649
|
NVIDIA Corp.
|
274,540
|
|||
|
1,040
|
NXP Semiconductors N.V.
|
212,867
|
|||
|
2,378
|
ON Semiconductor Corp. (a)
|
224,911
|
|||
|
1,496
|
QUALCOMM, Inc.
|
178,084
|
|||
|
|
|
1,930,792
|
|||
|
|
Software — 6.5%
|
|
|||
|
465
|
Adobe, Inc. (a)
|
227,380
|
|||
|
903
|
Autodesk, Inc. (a)
|
184,763
|
|||
|
463
|
Synopsys, Inc. (a)
|
201,595
|
|||
|
|
|
613,738
|
|||
|
|
Specialized REITs — 2.0%
|
|
|||
|
5,657
|
Weyerhaeuser Co.
|
189,566
|
|||
|
|
Technology Hardware, Storage
& Peripherals — 2.2%
|
|
|||
|
1,065
|
Apple, Inc.
|
206,578
|
|||
Portfolio of Investments (Continued)
June 30, 2023 (Unaudited)
|
Shares
|
Description
|
Value
|
|||
|
COMMON STOCKS (Continued)
|
|||||
|
|
Textiles, Apparel & Luxury
Goods — 2.0%
|
|
|||
|
361
|
Deckers Outdoor Corp. (a)
|
$190,485
|
|||
|
|
|||||
|
|
|||||
|
|
Total Investments — 100.0%
|
9,372,307
|
|||
|
|
(Cost $8,780,580)
|
|
|||
|
|
Net Other Assets and
Liabilities — 0.0%
|
4,291
|
|||
|
|
Net Assets — 100.0%
|
$9,376,598
|
|||
|
(a)
|
Non-income producing security.
|
Valuation Inputs
|
|
Total
Value at
6/30/2023
|
Level 1
Quoted
Prices
|
Level 2
Significant
Observable
Inputs
|
Level 3
Significant
Unobservable
Inputs
|
|
Common Stocks*
|
$9,372,307
|
$9,372,307
|
$—
|
$—
|
|
*
|
See Portfolio of Investments for industry breakout.
|
Portfolio of Investments
June 30, 2023 (Unaudited)
|
Shares
|
Description
|
Value
|
|||
|
COMMON STOCKS — 99.9%
|
|||||
|
|
Aerospace & Defense — 86.1%
|
|
|||
|
3,697
|
AAR Corp. (a)
|
$213,539
|
|||
|
8,594
|
Aerojet Rocketdyne Holdings,
Inc. (a)
|
471,553
|
|||
|
2,691
|
AeroVironment, Inc. (a)
|
275,235
|
|||
|
9,967
|
Boeing (The) Co. (a)
|
2,104,632
|
|||
|
4,077
|
Curtiss-Wright Corp.
|
748,782
|
|||
|
1,294
|
Ducommun, Inc. (a)
|
56,380
|
|||
|
8,830
|
General Dynamics Corp.
|
1,899,774
|
|||
|
5,970
|
HEICO Corp.
|
1,056,332
|
|||
|
8,978
|
Hexcel Corp.
|
682,508
|
|||
|
23,631
|
Howmet Aerospace, Inc.
|
1,171,152
|
|||
|
4,245
|
Huntington Ingalls Industries,
Inc.
|
966,162
|
|||
|
2,986
|
Kaman Corp.
|
72,649
|
|||
|
13,492
|
Kratos Defense & Security
Solutions, Inc. (a)
|
193,475
|
|||
|
5,014
|
L3Harris Technologies, Inc.
|
981,591
|
|||
|
27,754
|
Leonardo DRS, Inc. (a)
|
481,254
|
|||
|
4,120
|
Lockheed Martin Corp.
|
1,896,766
|
|||
|
6,189
|
Mercury Systems, Inc. (a)
|
214,078
|
|||
|
3,395
|
Moog, Inc., Class A
|
368,120
|
|||
|
4,254
|
Northrop Grumman Corp.
|
1,938,973
|
|||
|
11,154
|
Parsons Corp. (a)
|
536,954
|
|||
|
50,879
|
Rocket Lab USA, Inc. (a)
|
305,274
|
|||
|
19,773
|
RTX Corp.
|
1,936,963
|
|||
|
11,212
|
Spirit AeroSystems Holdings,
Inc., Class A
|
327,278
|
|||
|
14,656
|
Textron, Inc.
|
991,185
|
|||
|
1,337
|
TransDigm Group, Inc.
|
1,195,505
|
|||
|
6,925
|
Triumph Group, Inc. (a)
|
85,662
|
|||
|
29,853
|
Virgin Galactic Holdings,
Inc. (a)
|
115,830
|
|||
|
6,362
|
Woodward, Inc.
|
756,505
|
|||
|
|
|
22,044,111
|
|||
|
|
Diversified Telecommunication
Services — 0.4%
|
|
|||
|
21,313
|
AST SpaceMobile, Inc. (a)
|
100,171
|
|||
|
|
Professional Services — 13.4%
|
|
|||
|
2,504
|
CACI International, Inc.,
Class A (a)
|
853,463
|
|||
|
14,547
|
KBR, Inc.
|
946,428
|
|||
|
Shares
|
Description
|
Value
|
|||
|
|
|||||
|
|
Professional Services
(Continued)
|
|
|||
|
10,937
|
Leidos Holdings, Inc.
|
$967,706
|
|||
|
5,773
|
Science Applications
International Corp.
|
649,347
|
|||
|
|
|
3,416,944
|
|||
|
|
|||||
|
|
|||||
|
|
Total Investments — 99.9%
|
25,561,226
|
|||
|
|
(Cost $24,616,680)
|
|
|||
|
|
Net Other Assets and
Liabilities — 0.1%
|
28,405
|
|||
|
|
Net Assets — 100.0%
|
$25,589,631
|
|||
|
(a)
|
Non-income producing security.
|
Valuation Inputs
|
|
Total
Value at
6/30/2023
|
Level 1
Quoted
Prices
|
Level 2
Significant
Observable
Inputs
|
Level 3
Significant
Unobservable
Inputs
|
|
Common Stocks*
|
$25,561,226
|
$25,561,226
|
$—
|
$—
|
|
*
|
See Portfolio of Investments for industry breakout.
|
Portfolio of Investments
June 30, 2023 (Unaudited)
|
Shares
|
Description
|
Value
|
|||
|
COMMON STOCKS — 99.9%
|
|||||
|
|
Aerospace & Defense — 7.4%
|
|
|||
|
82
|
General Dynamics Corp.
|
$17,642
|
|||
|
98
|
L3Harris Technologies, Inc.
|
19,186
|
|||
|
42
|
Lockheed Martin Corp.
|
19,336
|
|||
|
288
|
Textron, Inc.
|
19,477
|
|||
|
|
|
75,641
|
|||
|
|
Building Products — 3.0%
|
|
|||
|
239
|
Owens Corning
|
31,190
|
|||
|
|
Chemicals — 9.5%
|
|
|||
|
239
|
CF Industries Holdings, Inc.
|
16,591
|
|||
|
406
|
Dow, Inc.
|
21,624
|
|||
|
246
|
LyondellBasell Industries N.V.,
Class A
|
22,590
|
|||
|
465
|
Mosaic (The) Co.
|
16,275
|
|||
|
387
|
Olin Corp.
|
19,888
|
|||
|
|
|
96,968
|
|||
|
|
Containers & Packaging —
2.1%
|
|
|||
|
160
|
Packaging Corp. of America
|
21,146
|
|||
|
|
Ground Transportation —
6.0%
|
|
|||
|
659
|
CSX Corp.
|
22,472
|
|||
|
83
|
Norfolk Southern Corp.
|
18,821
|
|||
|
99
|
Union Pacific Corp.
|
20,257
|
|||
|
|
|
61,550
|
|||
|
|
Health Care REITs — 2.0%
|
|
|||
|
1,059
|
Healthcare Realty Trust, Inc.
|
19,973
|
|||
|
|
Hotel & Resort REITs — 2.1%
|
|
|||
|
1,276
|
Host Hotels & Resorts, Inc.
|
21,475
|
|||
|
|
Machinery — 4.9%
|
|
|||
|
70
|
Parker-Hannifin Corp.
|
27,303
|
|||
|
205
|
Westinghouse Air Brake
Technologies Corp.
|
22,482
|
|||
|
|
|
49,785
|
|||
|
|
Metals & Mining — 19.0%
|
|
|||
|
448
|
Alcoa Corp.
|
15,201
|
|||
|
1,271
|
Cleveland-Cliffs, Inc. (a)
|
21,302
|
|||
|
422
|
Commercial Metals Co.
|
22,222
|
|||
|
537
|
Freeport-McMoRan, Inc.
|
21,480
|
|||
|
432
|
Newmont Corp.
|
18,429
|
|||
|
155
|
Nucor Corp.
|
25,417
|
|||
|
101
|
Reliance Steel & Aluminum Co.
|
27,431
|
|||
|
209
|
Steel Dynamics, Inc.
|
22,766
|
|||
|
815
|
United States Steel Corp.
|
20,383
|
|||
|
|
|
194,631
|
|||
|
|
Oil, Gas & Consumable Fuels
— 31.8%
|
|
|||
|
657
|
Antero Resources Corp. (a)
|
15,131
|
|||
|
437
|
APA Corp.
|
14,932
|
|||
|
Shares
|
Description
|
Value
|
|||
|
|
|||||
|
|
Oil, Gas & Consumable Fuels
(Continued)
|
|
|||
|
149
|
Chord Energy Corp.
|
$22,916
|
|||
|
173
|
ConocoPhillips
|
17,925
|
|||
|
831
|
Coterra Energy, Inc.
|
21,024
|
|||
|
331
|
Devon Energy Corp.
|
16,001
|
|||
|
602
|
EQT Corp.
|
24,760
|
|||
|
869
|
Magnolia Oil & Gas Corp.,
Class A
|
18,162
|
|||
|
754
|
Marathon Oil Corp.
|
17,357
|
|||
|
356
|
Matador Resources Co.
|
18,626
|
|||
|
474
|
Murphy Oil Corp.
|
18,154
|
|||
|
325
|
Occidental Petroleum Corp.
|
19,110
|
|||
|
402
|
Ovintiv, Inc.
|
15,304
|
|||
|
502
|
PBF Energy, Inc., Class A
|
20,552
|
|||
|
322
|
PDC Energy, Inc.
|
22,907
|
|||
|
816
|
Range Resources Corp.
|
23,990
|
|||
|
585
|
SM Energy Co.
|
18,504
|
|||
|
|
|
325,355
|
|||
|
|
Residential REITs — 2.2%
|
|
|||
|
96
|
Essex Property Trust, Inc.
|
22,493
|
|||
|
|
Retail REITs — 3.8%
|
|
|||
|
962
|
Kimco Realty Corp.
|
18,971
|
|||
|
174
|
Simon Property Group, Inc.
|
20,093
|
|||
|
|
|
39,064
|
|||
|
|
Specialized REITs — 6.1%
|
|
|||
|
393
|
Gaming and Leisure Properties,
Inc.
|
19,045
|
|||
|
216
|
Lamar Advertising Co., Class A
|
21,438
|
|||
|
661
|
Weyerhaeuser Co.
|
22,150
|
|||
|
|
|
62,633
|
|||
|
|
|||||
|
|
|||||
|
|
Total Investments — 99.9%
|
1,021,904
|
|||
|
|
(Cost $984,552)
|
|
|||
|
|
Net Other Assets and
Liabilities — 0.1%
|
1,150
|
|||
|
|
Net Assets — 100.0%
|
$1,023,054
|
|||
|
(a)
|
Non-income producing security.
|
Valuation Inputs
|
|
Total
Value at
6/30/2023
|
Level 1
Quoted
Prices
|
Level 2
Significant
Observable
Inputs
|
Level 3
Significant
Unobservable
Inputs
|
|
Common Stocks*
|
$1,021,904
|
$1,021,904
|
$—
|
$—
|
|
*
|
See Portfolio of Investments for industry breakout.
|
Statements of Assets and Liabilities
June 30, 2023 (Unaudited)
|
|
First Trust
Dividend
Strength ETF
(FTDS)
|
First Trust Dow
30 Equal Weight
ETF
(EDOW)
|
First Trust Lunt
U.S. Factor
Rotation ETF
(FCTR)
|
|
ASSETS:
|
|
|
|
|
Investments, at value
|
$18,974,700
|
$207,668,195
|
$147,190,005
|
|
Cash
|
—
|
87,205
|
—
|
|
Receivables:
|
|
|
|
|
Dividends
|
26,371
|
102,380
|
162,062
|
|
Investment securities sold
|
—
|
—
|
3,906,250
|
|
Capital shares sold
|
—
|
16,487,002
|
—
|
|
Prepaid expenses
|
2,061
|
—
|
—
|
|
Total Assets
|
19,003,132
|
224,344,782
|
151,258,317
|
|
|
|||
|
LIABILITIES:
|
|
|
|
|
Payables:
|
|
|
|
|
Audit and tax fees
|
12,940
|
—
|
—
|
|
Shareholder reporting fees
|
4,891
|
—
|
—
|
|
Licensing fees
|
4,014
|
—
|
—
|
|
Investment advisory fees
|
3,346
|
76,290
|
82,544
|
|
Investment securities purchased
|
—
|
16,481,436
|
—
|
|
Capital shares redeemed
|
—
|
—
|
3,916,352
|
|
Other liabilities
|
12,035
|
—
|
—
|
|
Total Liabilities
|
37,226
|
16,557,726
|
3,998,896
|
|
NET ASSETS
|
$18,965,906
|
$207,787,056
|
$147,259,421
|
|
|
|||
|
NET ASSETS consist of:
|
|
|
|
|
Paid-in capital
|
$23,316,923
|
$211,800,833
|
$312,072,192
|
|
Par value
|
4,500
|
68,978
|
56,000
|
|
Accumulated distributable earnings (loss)
|
(4,355,517
)
|
(4,082,755
)
|
(164,868,771
)
|
|
NET ASSETS
|
$18,965,906
|
$207,787,056
|
$147,259,421
|
|
NET ASSET VALUE, per share
|
$42.15
|
$30.12
|
$26.30
|
|
Number of shares outstanding (unlimited number of shares authorized,
par value $0.01 per share)
|
450,002
|
6,897,756
|
5,600,002
|
|
Investments, at cost
|
$19,224,947
|
$202,236,065
|
$140,676,720
|
|
First Trust
Growth
Strength ETF
(FTGS)
|
First Trust
Indxx Aerospace
& Defense ETF
(MISL)
|
First Trust
Bloomberg
Inflation
Sensitive Equity
ETF
(FTIF)
|
|
|
|
|
|
$9,372,307
|
$25,561,226
|
$1,021,904
|
|
3,260
|
36,399
|
620
|
|
|
|
|
|
5,029
|
4,267
|
1,017
|
|
—
|
—
|
—
|
|
—
|
—
|
—
|
|
—
|
—
|
—
|
|
9,380,596
|
25,601,892
|
1,023,541
|
|
|
||
|
|
|
|
|
|
|
|
|
—
|
—
|
—
|
|
—
|
—
|
—
|
|
—
|
—
|
—
|
|
3,998
|
12,261
|
487
|
|
—
|
—
|
—
|
|
—
|
—
|
—
|
|
—
|
—
|
—
|
|
3,998
|
12,261
|
487
|
|
$9,376,598
|
$25,589,631
|
$1,023,054
|
|
|
||
|
|
|
|
|
$8,705,490
|
$24,499,319
|
$984,097
|
|
4,000
|
11,000
|
500
|
|
667,108
|
1,079,312
|
38,457
|
|
$9,376,598
|
$25,589,631
|
$1,023,054
|
|
$23.44
|
$23.26
|
$20.46
|
|
400,002
|
1,100,002
|
50,002
|
|
$8,780,580
|
$24,616,680
|
$984,552
|
Statements of Operations
For the Period Ended June 30, 2023 (Unaudited)
|
|
First Trust
Dividend
Strength ETF
(FTDS)
|
First Trust Dow
30 Equal Weight
ETF
(EDOW)
|
First Trust Lunt
U.S. Factor
Rotation ETF
(FCTR)
|
|
INVESTMENT INCOME:
|
|
|
|
|
Dividends
|
$297,168
|
$2,150,989
|
$1,793,403
|
|
Foreign withholding tax
|
—
|
—
|
—
|
|
Total investment income
|
297,168
|
2,150,989
|
1,793,403
|
|
|
|||
|
EXPENSES:
|
|
|
|
|
Investment advisory fees
|
52,370
|
422,453
(b)
|
695,994
(b)
|
|
Audit and tax fees
|
14,399
|
—
|
—
|
|
Shareholder reporting fees
|
8,360
|
—
|
—
|
|
Accounting and administration fees
|
6,193
|
—
|
—
|
|
Licensing fees
|
4,762
|
—
|
—
|
|
Trustees’ fees and expenses
|
3,615
|
—
|
—
|
|
Listing fees
|
3,241
|
—
|
—
|
|
Custodian fees
|
2,035
|
—
|
—
|
|
Transfer agent fees
|
524
|
—
|
—
|
|
Legal fees
|
169
|
—
|
—
|
|
Excise tax
|
—
|
—
|
—
|
|
Other expenses
|
452
|
—
|
—
|
|
Total expenses
|
96,120
|
422,453
|
695,994
|
|
Less fees waived and expenses reimbursed by the investment advisor
|
(22,776
)
|
—
|
—
|
|
Net expenses
|
73,344
|
422,453
|
695,994
|
|
NET INVESTMENT INCOME (LOSS)
|
223,824
|
1,728,536
|
1,097,409
|
|
|
|||
|
NET REALIZED AND UNREALIZED GAIN (LOSS):
|
|
|
|
|
Net realized gain (loss) on:
|
|
|
|
|
Investments
|
(291,071
)
|
(2,052,474
)
|
(23,667,114
)
|
|
In-kind redemptions
|
154,457
|
621,736
|
2,468,536
|
|
Net realized gain (loss)
|
(136,614
)
|
(1,430,738
)
|
(21,198,578
)
|
|
Net change in unrealized appreciation (depreciation) on investments
|
(212,128
)
|
9,203,351
|
5,949,568
|
|
NET REALIZED AND UNREALIZED GAIN (LOSS)
|
(348,742
)
|
7,772,613
|
(15,249,010
)
|
|
NET INCREASE (DECREASE) IN NET ASSETS RESULTING
FROM OPERATIONS
|
$(124,918
)
|
$9,501,149
|
$(14,151,601
)
|
|
(a)
|
Inception date is March 13, 2023, which is consistent with the commencement of investment operations and is the date the initial
creation units were established.
|
|
(b)
|
Fund is subject to a unitary fee (see Note 3 in the Notes to Financial Statements).
|
|
First Trust
Growth
Strength ETF
(FTGS)
|
First Trust
Indxx Aerospace
& Defense ETF
(MISL)
|
First Trust
Bloomberg
Inflation
Sensitive Equity
ETF
(FTIF) (a)
|
|
|
|
|
|
$30,040
|
$77,905
|
$8,934
|
|
(139
)
|
—
|
—
|
|
29,901
|
77,905
|
8,934
|
|
|
||
|
|
|
|
|
11,535
(b)
|
42,181
(b)
|
1,754
(b)
|
|
—
|
—
|
—
|
|
—
|
—
|
—
|
|
—
|
—
|
—
|
|
—
|
—
|
—
|
|
—
|
—
|
—
|
|
—
|
—
|
—
|
|
—
|
—
|
—
|
|
—
|
—
|
—
|
|
—
|
—
|
—
|
|
150
|
—
|
—
|
|
—
|
—
|
—
|
|
11,685
|
42,181
|
1,754
|
|
—
|
—
|
—
|
|
11,685
|
42,181
|
1,754
|
|
18,216
|
35,724
|
7,180
|
|
|
||
|
|
|
|
|
|
|
|
|
(17,255
)
|
(80,935
)
|
(5
)
|
|
91,299
|
220,427
|
—
|
|
74,044
|
139,492
|
(5
)
|
|
584,273
|
854,189
|
37,352
|
|
658,317
|
993,681
|
37,347
|
|
$676,533
|
$1,029,405
|
$44,527
|
Statements of Changes in Net Assets
|
|
First Trust Dividend Strength
ETF (FTDS)
|
First Trust Dow 30 Equal Weight
ETF (EDOW)
|
||
|
|
Six Months
Ended
6/30/2023
(Unaudited)
|
Year
Ended
12/31/2022
|
Six Months
Ended
6/30/2023
(Unaudited)
|
Year
Ended
12/31/2022
|
|
OPERATIONS:
|
|
|
|
|
|
Net investment income (loss)
|
$223,824
|
$383,157
|
$1,728,536
|
$2,623,645
|
|
Net realized gain (loss)
|
(136,614
)
|
65,172
|
(1,430,738
)
|
2,627,895
|
|
Net change in unrealized appreciation (depreciation)
|
(212,128
)
|
(3,516,779
)
|
9,203,351
|
(16,343,947
)
|
|
Net increase (decrease) in net assets resulting from
operations
|
(124,918
)
|
(3,068,450
)
|
9,501,149
|
(11,092,407
)
|
|
|
||||
|
DISTRIBUTIONS TO SHAREHOLDERS FROM:
|
|
|
|
|
|
Investment operations
|
(239,726
)
|
(419,147
)
|
(1,700,078
)
|
(2,633,200
)
|
|
|
||||
|
SHAREHOLDER TRANSACTIONS:
|
|
|
|
|
|
Proceeds from shares sold
|
4,423,244
|
2,147,136
|
44,706,756
|
72,258,682
|
|
Cost of shares redeemed
|
(4,219,995
)
|
(4,755,506
)
|
(2,994,809
)
|
(38,301,275
)
|
|
Net increase (decrease) in net assets resulting from
shareholder transactions
|
203,249
|
(2,608,370
)
|
41,711,947
|
33,957,407
|
|
Total increase (decrease) in net assets
|
(161,395
)
|
(6,095,967
)
|
49,513,018
|
20,231,800
|
|
|
||||
|
NET ASSETS:
|
|
|
|
|
|
Beginning of period
|
19,127,301
|
25,223,268
|
158,274,038
|
138,042,238
|
|
End of period
|
$18,965,906
|
$19,127,301
|
$207,787,056
|
$158,274,038
|
|
|
||||
|
CHANGES IN SHARES OUTSTANDING:
|
|
|
|
|
|
Shares outstanding, beginning of period
|
450,002
|
500,002
|
5,497,756
|
4,347,756
|
|
Shares sold
|
100,000
|
50,000
|
1,500,000
|
2,450,000
|
|
Shares redeemed
|
(100,000
)
|
(100,000
)
|
(100,000
)
|
(1,300,000
)
|
|
Shares outstanding, end of period
|
450,002
|
450,002
|
6,897,756
|
5,497,756
|
|
(a)
|
Inception date is October 25, 2022, which is consistent with the commencement of investment operations and is the date the
initial
creation units were established.
|
|
(b)
|
Inception date is March 13, 2023, which is consistent with the commencement of investment operations and is the date the initial
creation units were established.
|
|
First Trust Lunt U.S. Factor
Rotation ETF (FCTR)
|
First Trust Growth Strength ETF
(FTGS)
|
First Trust Indxx Aerospace &
Defense ETF (MISL)
|
First Trust
Bloomberg
Inflation
Sensitive Equity
ETF (FTIF)
|
|||
|
Six Months
Ended
6/30/2023
(Unaudited)
|
Year
Ended
12/31/2022
|
Six Months
Ended
6/30/2023
(Unaudited)
|
Period
Ended
12/31/2022 (a)
|
Six Months
Ended
6/30/2023
(Unaudited)
|
Period
Ended
12/31/2022 (a)
|
Period
Ended
6/30/2023 (b)
(Unaudited)
|
|
|
|
|
|
|
|
|
|
$1,097,409
|
$4,647,184
|
$18,216
|
$2,146
|
$35,724
|
$1,699
|
$7,180
|
|
(21,198,578
)
|
(116,272,618
)
|
74,044
|
2,655
|
139,492
|
101
|
(5
)
|
|
5,949,568
|
(18,358,590
)
|
584,273
|
7,454
|
854,189
|
90,357
|
37,352
|
|
(14,151,601
)
|
(129,984,024
)
|
676,533
|
12,255
|
1,029,405
|
92,157
|
44,527
|
|
|
||||||
|
|
|
|
|
|
|
|
|
(1,280,450
)
|
(4,905,611
)
|
(19,540
)
|
(2,140
)
|
(40,560
)
|
(1,690
)
|
(6,070
)
|
|
|
||||||
|
|
|
|
|
|
|
|
|
—
|
197,817,866
|
8,766,970
|
1,014,356
|
24,582,311
|
2,139,654
|
984,597
|
|
(105,333,028
)
|
(457,908,923
)
|
(1,071,836
)
|
—
|
(2,211,646
)
|
—
|
—
|
|
(105,333,028
)
|
(260,091,057
)
|
7,695,134
|
1,014,356
|
22,370,665
|
2,139,654
|
984,597
|
|
(120,765,079
)
|
(394,980,692
)
|
8,352,127
|
1,024,471
|
23,359,510
|
2,230,121
|
1,023,054
|
|
|
||||||
|
|
|
|
|
|
|
|
|
268,024,500
|
663,005,192
|
1,024,471
|
—
|
2,230,121
|
—
|
—
|
|
$147,259,421
|
$268,024,500
|
$9,376,598
|
$1,024,471
|
$25,589,631
|
$2,230,121
|
$1,023,054
|
|
|
||||||
|
|
|
|
|
|
|
|
|
9,600,002
|
18,650,002
|
50,002
|
—
|
100,002
|
—
|
—
|
|
—
|
6,050,000
|
400,000
|
50,002
|
1,100,000
|
100,002
|
50,002
|
|
(4,000,000
)
|
(15,100,000
)
|
(50,000
)
|
—
|
(100,000
)
|
—
|
—
|
|
5,600,002
|
9,600,002
|
400,002
|
50,002
|
1,100,002
|
100,002
|
50,002
|
Financial Highlights
For a share outstanding throughout each period
|
|
Six Months
Ended
6/30/2023
(Unaudited)
|
Year Ended December 31,
|
||||
|
|
2022
|
2021
|
2020
|
2019
|
2018
|
|
|
Net asset value, beginning of period
|
$42.50
|
$50.45
|
$40.62
|
$36.20
|
$29.22
|
$32.85
|
|
Income from investment operations:
|
|
|
|
|
|
|
|
Net investment income (loss)
|
0.45
(a)
|
0.90
|
0.39
|
0.35
|
0.40
|
0.34
|
|
Net realized and unrealized gain (loss)
|
(0.32
)
|
(7.87
)
|
9.80
|
4.47
|
6.99
|
(3.64
)
|
|
Total from investment operations
|
0.13
|
(6.97
)
|
10.19
|
4.82
|
7.39
|
(3.30
)
|
|
Distributions paid to shareholders from:
|
|
|
|
|
|
|
|
Net investment income
|
(0.48
)
|
(0.98
)
|
(0.36
)
|
(0.40
)
|
(0.41
)
|
(0.33
)
|
|
Net asset value, end of period
|
$42.15
|
$42.50
|
$50.45
|
$40.62
|
$36.20
|
$29.22
|
|
Total return (b)
|
0.32
%
|
(13.75
)%
|
25.12
%
|
13.65
%
|
25.36
%
|
(10.13
)%
|
|
|
||||||
|
Ratios to average net assets/supplemental data:
|
|
|
|
|
|
|
|
Net assets, end of period (in 000’s)
|
$18,966
|
$19,127
|
$25,223
|
$16,249
|
$18,100
|
$13,151
|
|
Ratio of total expenses to average net assets
|
0.92
% (c)
|
1.04
%
|
1.08
%
|
1.16
%
|
1.02
%
|
1.57
%
|
|
Ratio of net expenses to average net assets
|
0.70
% (c)
|
0.70
%
|
0.70
%
|
0.70
%
|
0.70
%
|
0.70
%
|
|
Ratio of net investment income (loss) to average net
assets
|
2.14
% (c)
|
2.00
%
|
0.84
%
|
1.04
%
|
1.20
%
|
1.03
%
|
|
Portfolio turnover rate (d)
|
52
%
|
225
% (e)
|
98
%
|
125
%
|
119
%
|
110
%
|
|
(a)
|
Based on average shares outstanding.
|
|
(b)
|
Total return is calculated assuming an initial investment made at the net asset value at the beginning of the period, reinvestment
of all
distributions at net asset value during the period, and redemption at net asset value on the last day of the period. The returns
presented do not
reflect the deduction of taxes that a shareholder would pay on Fund distributions or the redemption or sale of Fund shares.
Total return is
calculated for the time period presented and is not annualized for periods of less than a year. The total returns would have
been lower if certain
fees had not been waived and expenses reimbursed by the investment advisor.
|
|
(c)
|
Annualized.
|
|
(d)
|
Portfolio turnover is calculated for the time period presented and is not annualized for periods of less than a year and does
not include securities
received or delivered from processing creations or redemptions and in-kind transactions.
|
|
(e)
|
The variation in the portfolio turnover rate is due to the change in the Fund’s underlying index effective April 29, 2022, which resulted in a
complete rebalance of the Fund’s portfolio.
|
Financial Highlights (Continued)
For a share outstanding throughout each period
|
|
Six Months
Ended
6/30/2023
(Unaudited)
|
Year Ended December 31,
|
||||
|
|
2022
|
2021
|
2020
|
2019
|
2018
|
|
|
Net asset value, beginning of period
|
$28.79
|
$31.75
|
$27.19
|
$26.11
|
$21.43
|
$22.00
|
|
Income from investment operations:
|
|
|
|
|
|
|
|
Net investment income (loss)
|
0.29
(a)
|
0.55
|
0.48
|
0.50
|
0.47
|
0.40
|
|
Net realized and unrealized gain (loss)
|
1.33
|
(2.96
)
|
4.56
|
1.08
|
4.70
|
(0.58
)
|
|
Total from investment operations
|
1.62
|
(2.41
)
|
5.04
|
1.58
|
5.17
|
(0.18
)
|
|
Distributions paid to shareholders from:
|
|
|
|
|
|
|
|
Net investment income
|
(0.29
)
|
(0.55
)
|
(0.48
)
|
(0.50
)
|
(0.49
)
|
(0.39
)
|
|
Net asset value, end of period
|
$30.12
|
$28.79
|
$31.75
|
$27.19
|
$26.11
|
$21.43
|
|
Total return (b)
|
5.63
%
|
(7.52
)%
|
18.63
%
|
6.41
%
|
24.27
%
|
(0.88
)%
|
|
|
||||||
|
Ratios to average net assets/supplemental
data:
|
|
|
|
|
|
|
|
Net assets, end of period (in 000’s)
|
$207,787
|
$158,274
|
$138,042
|
$71,994
|
$43,077
|
$12,859
|
|
Ratio of total expenses to average net assets
|
0.50
% (c)
|
0.50
%
|
0.50
%
|
0.50
%
|
0.50
%
|
0.50
%
|
|
Ratio of net investment income (loss) to average
net assets
|
2.05
% (c)
|
1.95
%
|
1.70
%
|
2.11
%
|
1.99
%
|
2.33
%
|
|
Portfolio turnover rate (d)
|
7
%
|
17
%
|
14
%
|
31
%
|
13
%
|
16
%
|
|
(a)
|
Based on average shares outstanding.
|
|
(b)
|
Total return is calculated assuming an initial investment made at the net asset value at the beginning of the period, reinvestment
of all
distributions at net asset value during the period, and redemption at net asset value on the last day of the period. The returns
presented do not
reflect the deduction of taxes that a shareholder would pay on Fund distributions or the redemption or sale of Fund shares.
Total return is
calculated for the time period presented and is not annualized for periods of less than a year.
|
|
(c)
|
Annualized.
|
|
(d)
|
Portfolio turnover is calculated for the time period presented and is not annualized for periods of less than a year and does
not include securities
received or delivered from processing creations or redemptions and in-kind transactions.
|
Financial Highlights (Continued)
For a share outstanding throughout each period
|
|
Six Months
Ended
6/30/2023
(Unaudited)
|
Year Ended December 31,
|
Period
Ended
12/31/2018 (a)
|
|||
|
|
2022
|
2021
|
2020
|
2019
|
||
|
Net asset value, beginning of period
|
$27.92
|
$35.55
|
$29.47
|
$22.80
|
$17.67
|
$20.23
|
|
Income from investment operations:
|
|
|
|
|
|
|
|
Net investment income (loss)
|
0.14
(b)
|
0.38
|
0.17
|
0.12
|
0.23
|
0.12
|
|
Net realized and unrealized gain (loss)
|
(1.57
)
|
(7.62
)
|
6.07
|
6.68
|
5.12
|
(2.56
)
|
|
Total from investment operations
|
(1.43
)
|
(7.24
)
|
6.24
|
6.80
|
5.35
|
(2.44
)
|
|
Distributions paid to shareholders from:
|
|
|
|
|
|
|
|
Net investment income
|
(0.19
)
|
(0.39
)
|
(0.16
)
|
(0.13
)
|
(0.22
)
|
(0.12
)
|
|
Net asset value, end of period
|
$26.30
|
$27.92
|
$35.55
|
$29.47
|
$22.80
|
$17.67
|
|
Total return (c)
|
(5.14
)%
|
(20.37
)%
|
21.22
%
|
30.02
%
|
30.35
%
|
(12.09
)%
|
|
|
||||||
|
Ratios to average net assets/supplemental
data:
|
|
|
|
|
|
|
|
Net assets, end of period (in 000’s)
|
$147,259
|
$268,025
|
$663,005
|
$131,157
|
$62,696
|
$28,269
|
|
Ratio of total expenses to average net assets
|
0.65
% (d)
|
0.65
%
|
0.65
%
|
0.65
%
|
0.65
%
|
0.65
% (d)
|
|
Ratio of net investment income (loss) to
average net assets
|
1.02
% (d)
|
1.13
%
|
0.52
%
|
0.42
%
|
1.17
%
|
1.48
% (d)
|
|
Portfolio turnover rate (e)
|
228
%
|
379
%
|
307
%
|
460
%
|
246
%
|
183
%
|
|
(a)
|
Inception date is July 25, 2018, which is consistent with the commencement of investment operations and is the date the initial
creation units
were established.
|
|
(b)
|
Based on average shares outstanding.
|
|
(c)
|
Total return is calculated assuming an initial investment made at the net asset value at the beginning of the period, reinvestment
of all
distributions at net asset value during the period, and redemption at net asset value on the last day of the period. The returns
presented do not
reflect the deduction of taxes that a shareholder would pay on Fund distributions or the redemption or sale of Fund shares.
Total return is
calculated for the time period presented and is not annualized for periods of less than a year.
|
|
(d)
|
Annualized.
|
|
(e)
|
Portfolio turnover is calculated for the time period presented and is not annualized for periods of less than a year and does
not include securities
received or delivered from processing creations or redemptions and in-kind transactions.
|
Financial Highlights (Continued)
For a share outstanding throughout each period
|
|
Six Months
Ended
6/30/2023
(Unaudited)
|
Period
Ended
12/31/2022 (a)
|
|
|
||
|
Net asset value, beginning of period
|
$20.49
|
$20.29
|
|
Income from investment operations:
|
|
|
|
Net investment income (loss)
|
0.10
(b)
|
0.04
|
|
Net realized and unrealized gain
|
2.95
|
0.20
|
|
Total from investment operations
|
3.05
|
0.24
|
|
Distributions paid to shareholders from:
|
|
|
|
Net investment income
|
(0.10
)
|
(0.04
)
|
|
Net asset value, end of period
|
$23.44
|
$20.49
|
|
Total return (c)
|
14.89
%
|
1.20
%
|
|
|
||
|
Ratios to average net assets/supplemental data:
|
|
|
|
Net assets, end of period (in 000’s)
|
$9,377
|
$1,024
|
|
Ratio of total expenses to average net assets
|
0.61
% (d) (e)
|
0.60
% (d)
|
|
Ratio of net investment income (loss) to average net assets
|
0.95
% (d)
|
1.11
% (d)
|
|
Portfolio turnover rate (f)
|
46
%
|
25
%
|
|
(a)
|
Inception date is October 25, 2022, which is consistent with the commencement of investment operations and is the date the
initial creation units
were established.
|
|
(b)
|
Based on average shares outstanding.
|
|
(c)
|
Total return is calculated assuming an initial investment made at the net asset value at the beginning of the period, reinvestment
of all
distributions at net asset value during the period, and redemption at net asset value on the last day of the period. The returns
presented do not
reflect the deduction of taxes that a shareholder would pay on Fund distributions or the redemption or sale of Fund shares.
Total return is
calculated for the time period presented and is not annualized for periods of less than a year.
|
|
(d)
|
Annualized.
|
|
(e)
|
Includes excise tax. If this excise tax expense was not included, the expense ratio would have been 0.60%.
|
|
(f)
|
Portfolio turnover is calculated for the time period presented and is not annualized for periods of less than a year and does
not include securities
received or delivered from processing creations or redemptions and in-kind transactions.
|
Financial Highlights (Continued)
For a share outstanding throughout each period
|
|
Six Months
Ended
6/30/2023
(Unaudited)
|
Period
Ended
12/31/2022 (a)
|
|
|
||
|
Net asset value, beginning of period
|
$22.30
|
$20.79
|
|
Income from investment operations:
|
|
|
|
Net investment income (loss)
|
0.06
(b)
|
0.02
|
|
Net realized and unrealized gain
|
0.94
|
1.51
|
|
Total from investment operations
|
1.00
|
1.53
|
|
Distributions paid to shareholders from:
|
|
|
|
Net investment income
|
(0.04
)
|
(0.02
)
|
|
Net asset value, end of period
|
$23.26
|
$22.30
|
|
Total return (c)
|
4.49
%
|
7.34
%
|
|
|
||
|
Ratios to average net assets/supplemental data:
|
|
|
|
Net assets, end of period (in 000’s)
|
$25,590
|
$2,230
|
|
Ratio of total expenses to average net assets
|
0.60
% (d)
|
0.60
% (d)
|
|
Ratio of net investment income (loss) to average net assets
|
0.51
% (d)
|
0.53
% (d)
|
|
Portfolio turnover rate (e)
|
9
%
|
2
%
|
|
(a)
|
Inception date is October 25, 2022, which is consistent with the commencement of investment operations and is the date the
initial creation units
were established.
|
|
(b)
|
Based on average shares outstanding.
|
|
(c)
|
Total return is calculated assuming an initial investment made at the net asset value at the beginning of the period, reinvestment
of all
distributions at net asset value during the period, and redemption at net asset value on the last day of the period. The returns
presented do not
reflect the deduction of taxes that a shareholder would pay on Fund distributions or the redemption or sale of Fund shares.
Total return is
calculated for the time period presented and is not annualized for periods of less than a year.
|
|
(d)
|
Annualized.
|
|
(e)
|
Portfolio turnover is calculated for the time period presented and is not annualized for periods of less than a year and does
not include securities
received or delivered from processing creations or redemptions and in-kind transactions.
|
Financial Highlights (Continued)
For a share outstanding throughout the period
|
|
Period
Ended
6/30/2023 (a)
(Unaudited)
|
|
|
|
|
Net asset value, beginning of period
|
$19.69
|
|
Income from investment operations:
|
|
|
Net investment income (loss)
|
0.14
(b)
|
|
Net realized and unrealized gain
|
0.75
|
|
Total from investment operations
|
0.89
|
|
Distributions paid to shareholders from:
|
|
|
Net investment income
|
(0.12
)
|
|
Net asset value, end of period
|
$20.46
|
|
Total return (c)
|
4.53
%
|
|
|
|
|
Ratios to average net assets/supplemental data:
|
|
|
Net assets, end of period (in 000’s)
|
$1,023
|
|
Ratio of total expenses to average net assets
|
0.60
% (d)
|
|
Ratio of net investment income (loss) to average net assets
|
2.46
% (d)
|
|
Portfolio turnover rate (e)
|
0
%
|
|
(a)
|
Inception date is March 13, 2023, which is consistent with the commencement of investment operations and is the date the initial
creation units
were established.
|
|
(b)
|
Based on average shares outstanding.
|
|
(c)
|
Total return is calculated assuming an initial investment made at the net asset value at the beginning of the period, reinvestment
of all
distributions at net asset value during the period, and redemption at net asset value on the last day of the period. The return
presented does not
reflect the deduction of taxes that a shareholder would pay on Fund distributions or the redemption or sale of Fund shares.
Total return is
calculated for the time period presented and is not annualized for periods of less than a year.
|
|
(d)
|
Annualized.
|
|
(e)
|
Portfolio turnover is calculated for the time period presented and is not annualized for periods of less than a year and does
not include securities
received or delivered from processing creations or redemptions and in-kind transactions.
|
June 30, 2023 (Unaudited)
|
First Trust Dividend Strength ETF – (The Nasdaq Stock Market LLC (“Nasdaq”) ticker “FTDS”)
|
|
First Trust Dow 30 Equal Weight ETF – (NYSE Arca, Inc. (“NYSE Arca”) ticker “EDOW”)
|
|
First Trust Lunt U.S. Factor Rotation ETF – (Cboe BZX Exchange, Inc. ticker “FCTR”)
|
|
First Trust Growth Strength ETF – (Nasdaq ticker “FTGS”)
|
|
First Trust Indxx Aerospace & Defense ETF – (NYSE Arca ticker “MISL”)
|
|
First Trust Bloomberg Inflation Sensitive Equity ETF – (NYSE Arca ticker “FTIF”)(1)
|
|
(1)
|
Commenced investment operations on March 13, 2023.
|
|
Fund
|
Index
|
|
First Trust Dividend Strength ETF
|
The Dividend StrengthTM Index
|
|
First Trust Dow 30 Equal Weight ETF
|
Dow Jones Industrial Average® Equal Weight Index
|
|
First Trust Lunt U.S. Factor Rotation ETF
|
Lunt Capital Large Cap Factor Rotation Index
|
|
First Trust Growth Strength ETF
|
The Growth StrengthTM Index
|
|
First Trust Indxx Aerospace & Defense ETF
|
Indxx US Aerospace & Defense Index
|
|
First Trust Bloomberg Inflation Sensitive Equity ETF
|
Bloomberg Inflation Sensitive Equity Index
|
June 30, 2023 (Unaudited)
June 30, 2023 (Unaudited)
June 30, 2023 (Unaudited)
|
|
Distributions
paid from
Ordinary
Income
|
Distributions
paid from
Capital
Gains
|
Distributions
paid from
Return of
Capital
|
|
First Trust Dividend Strength ETF
|
$419,147
|
$—
|
$—
|
|
First Trust Dow 30 Equal Weight ETF
|
2,633,200
|
—
|
—
|
|
First Trust Lunt U.S. Factor Rotation ETF
|
4,905,611
|
—
|
—
|
|
First Trust Growth Strength ETF
|
2,140
|
—
|
—
|
|
First Trust Indxx Aerospace & Defense ETF
|
1,690
|
—
|
—
|
June 30, 2023 (Unaudited)
|
|
Undistributed
Ordinary
Income
|
Accumulated
Capital and
Other
Gain (Loss)
|
Net
Unrealized
Appreciation
(Depreciation)
|
|
First Trust Dividend Strength ETF
|
$—
|
$(3,921,145
)
|
$(69,728
)
|
|
First Trust Dow 30 Equal Weight ETF
|
—
|
(5,157,811
)
|
(6,726,015
)
|
|
First Trust Lunt U.S. Factor Rotation ETF
|
9,593
|
(144,354,832
)
|
(5,091,481
)
|
|
First Trust Growth Strength ETF
|
2,542
|
119
|
7,454
|
|
First Trust Indxx Aerospace & Defense ETF
|
212
|
—
|
90,255
|
|
|
Non-Expiring
Capital Loss
Carryforward
|
|
First Trust Dividend Strength ETF
|
$3,921,145
|
|
First Trust Dow 30 Equal Weight ETF*
|
5,157,811
|
|
First Trust Lunt U.S. Factor Rotation ETF
|
144,354,832
|
|
First Trust Growth Strength ETF
|
—
|
|
First Trust Indxx Aerospace & Defense ETF
|
—
|
|
*
|
$3,196,504 of First Trust Dow 30 Equal Weight ETF’s non-expiring net capital losses is subject to loss limitation resulting from
reorganization activity. This limitation generally reduces the utilization of these losses to a maximum of $212,620 per year.
|
June 30, 2023 (Unaudited)
|
|
Tax Cost
|
Gross
Unrealized
Appreciation
|
Gross
Unrealized
(Depreciation)
|
Net Unrealized
Appreciation
(Depreciation)
|
|
First Trust Dividend Strength ETF
|
$19,224,947
|
$832,352
|
$(1,082,599
)
|
$(250,247
)
|
|
First Trust Dow 30 Equal Weight ETF
|
202,236,065
|
16,100,375
|
(10,668,245
)
|
5,432,130
|
|
First Trust Lunt U.S. Factor Rotation ETF
|
140,676,720
|
10,985,507
|
(4,472,222
)
|
6,513,285
|
|
First Trust Growth Strength ETF
|
8,780,580
|
769,756
|
(178,029
)
|
591,727
|
|
First Trust Indxx Aerospace & Defense ETF
|
24,616,680
|
1,387,051
|
(442,505
)
|
944,546
|
|
First Trust Bloomberg Inflation Sensitive Equity ETF
|
984,552
|
59,885
|
(22,533
)
|
37,352
|
|
Fund
|
Licensor
|
|
First Trust Dividend Strength ETF
|
Nasdaq, Inc.
|
|
First Trust Dow 30 Equal Weight ETF
|
S&P Dow Jones Indices LLC
|
|
First Trust Lunt U.S. Factor Rotation ETF
|
Lunt Capital Management, Inc.
|
|
First Trust Growth Strength ETF
|
Nasdaq, Inc.
|
|
First Trust Indxx Aerospace & Defense ETF
|
Indxx, Inc.
|
|
First Trust Bloomberg Inflation Sensitive Equity ETF
|
Bloomberg Index Services Limited
|
|
Breakpoints
|
|
|
Fund net assets up to and including $2.5 billion
|
0.5000
%
|
|
Fund net assets greater than $2.5 billion up to and including $5 billion
|
0.4875
%
|
|
Fund net assets greater than $5 billion up to and including $7.5 billion
|
0.4750
%
|
|
Fund net assets greater than $7.5 billion up to and including $10 billion
|
0.4625
%
|
|
Fund net assets greater than $10 billion up to and including $15 billion
|
0.4500
%
|
|
Fund net assets greater than $15 billion
|
0.4250
%
|
June 30, 2023 (Unaudited)
|
Breakpoints
|
EDOW
|
FCTR
|
FTGS
|
MISL
|
FTIF
|
|
Fund net assets up to and including $2.5 billion
|
0.5000
%
|
0.65000
%
|
0.600
%
|
0.600
%
|
0.600
%
|
|
Fund net assets greater than $2.5 billion up to and including $5 billion
|
0.4875
%
|
0.63375
%
|
0.585
%
|
0.585
%
|
0.585
%
|
|
Fund net assets greater than $5 billion up to and including $7.5 billion
|
0.4750
%
|
0.61750
%
|
0.570
%
|
0.570
%
|
0.570
%
|
|
Fund net assets greater than $7.5 billion up to and including $10 billion
|
0.4625
%
|
0.60125
%
|
0.555
%
|
0.555
%
|
0.555
%
|
|
Fund net assets greater than $10 billion up to and including $15 billion
|
0.4500
%
|
0.58500
%
|
0.540
%
|
0.540
%
|
0.540
%
|
|
Fund net assets greater than $15 billion
|
0.4250
%
|
0.55250
%
|
0.510
%
|
0.510
%
|
0.510
%
|
|
|
Purchases
|
Sales
|
|
First Trust Dividend Strength ETF
|
$10,933,510
|
$10,939,076
|
|
First Trust Dow 30 Equal Weight ETF
|
12,637,915
|
12,583,952
|
|
First Trust Lunt U.S. Factor Rotation ETF
|
491,244,927
|
491,569,708
|
|
First Trust Growth Strength ETF
|
1,824,349
|
1,876,637
|
|
First Trust Indxx Aerospace & Defense ETF
|
1,297,954
|
1,279,918
|
|
First Trust Bloomberg Inflation Sensitive Equity ETF
|
3,693
|
1,726
|
June 30, 2023 (Unaudited)
|
|
Purchases
|
Sales
|
|
First Trust Dividend Strength ETF
|
$4,419,728
|
$4,215,998
|
|
First Trust Dow 30 Equal Weight ETF
|
44,585,067
|
2,991,679
|
|
First Trust Lunt U.S. Factor Rotation ETF
|
—
|
105,052,710
|
|
First Trust Growth Strength ETF
|
8,753,128
|
1,010,097
|
|
First Trust Indxx Aerospace & Defense ETF
|
24,532,922
|
2,212,711
|
|
First Trust Bloomberg Inflation Sensitive Equity ETF
|
982,590
|
—
|
June 30, 2023 (Unaudited)
June 30, 2023 (Unaudited)
June 30, 2023 (Unaudited)
June 30, 2023 (Unaudited)
June 30, 2023 (Unaudited)
|
First Trust Dividend Strength ETF (FTDS)
|
|
First Trust Dow 30 Equal Weight ETF (EDOW)
|
|
First Trust Lunt U.S. Factor Rotation ETF (FCTR)
|
June 30, 2023 (Unaudited)
June 30, 2023 (Unaudited)
June 30, 2023 (Unaudited)
June 30, 2023 (Unaudited)

120 East Liberty Drive, Suite 400
Wheaton, IL 60187
FUND ACCOUNTANT &
TRANSFER AGENT
240 Greenwich Street
New York, NY 10286
PUBLIC ACCOUNTING FIRM
111 South Wacker Drive
Chicago, IL 60606
320 South Canal Street
Chicago, IL 60606
June 30, 2023

|
FT Cboe Vest Gold Strategy Quarterly Buffer ETF (BGLD)
|
Semi-Annual Report
June 30, 2023
|
1
|
|
|
2
|
|
|
4
|
|
|
5
|
|
|
6
|
|
|
8
|
|
|
9
|
|
|
10
|
|
|
11
|
|
|
12
|
|
|
18
|
Semi-Annual Letter from the Chairman and CEO
June 30, 2023
non-profit business membership and research group organization, reported that its Leading Economic Index, which is composed of 10 economic indicators whose changes tend to precede changes in the overall economy, fell by 0.7% to a reading of 106.1 in June 2023, according to Reuters. The result represents the fifteenth consecutive monthly decline in the index, the longest streak of
month-over-month decreases since just before the financial crisis in 2007. From our perspective, even if the Fed can pull off a soft landing, it is likely to be a very bumpy ride.

Chairman of the Board of Trustees
Chief Executive Officer of First Trust Advisors L.P.
|
Performance
|
||||
|
|
|
|
Average Annual
Total Returns
|
Cumulative
Total Returns
|
|
|
6 Months
Ended
6/30/23
|
1 Year
Ended
6/30/23
|
Inception
(1/20/21)
to 6/30/23
|
Inception
(1/20/21)
to 6/30/23
|
|
Fund Performance
|
|
|
|
|
|
NAV
|
6.47%
|
7.24%
|
-0.66%
|
-1.61%
|
|
Market Price
|
6.64%
|
7.02%
|
-0.64%
|
-1.55%
|
|
Index Performance
|
|
|
|
|
|
LBMA Gold Price
|
5.43%
|
5.24%
|
1.22%
|
3.00%
|
|
S&P 500® Index - Price Return
|
15.91%
|
17.57%
|
6.10%
|
15.54%
|
|
Fund Allocation
|
% of
Net Assets
|
|
U.S. Treasury Bills
|
95.3%
|
|
Money Market Funds
|
0.2
|
|
Purchased Options
|
4.2
|
|
Written Options
|
(0.1)
|
|
Net Other Assets and Liabilities
|
0.4
|
|
Total
|
100.0%
|
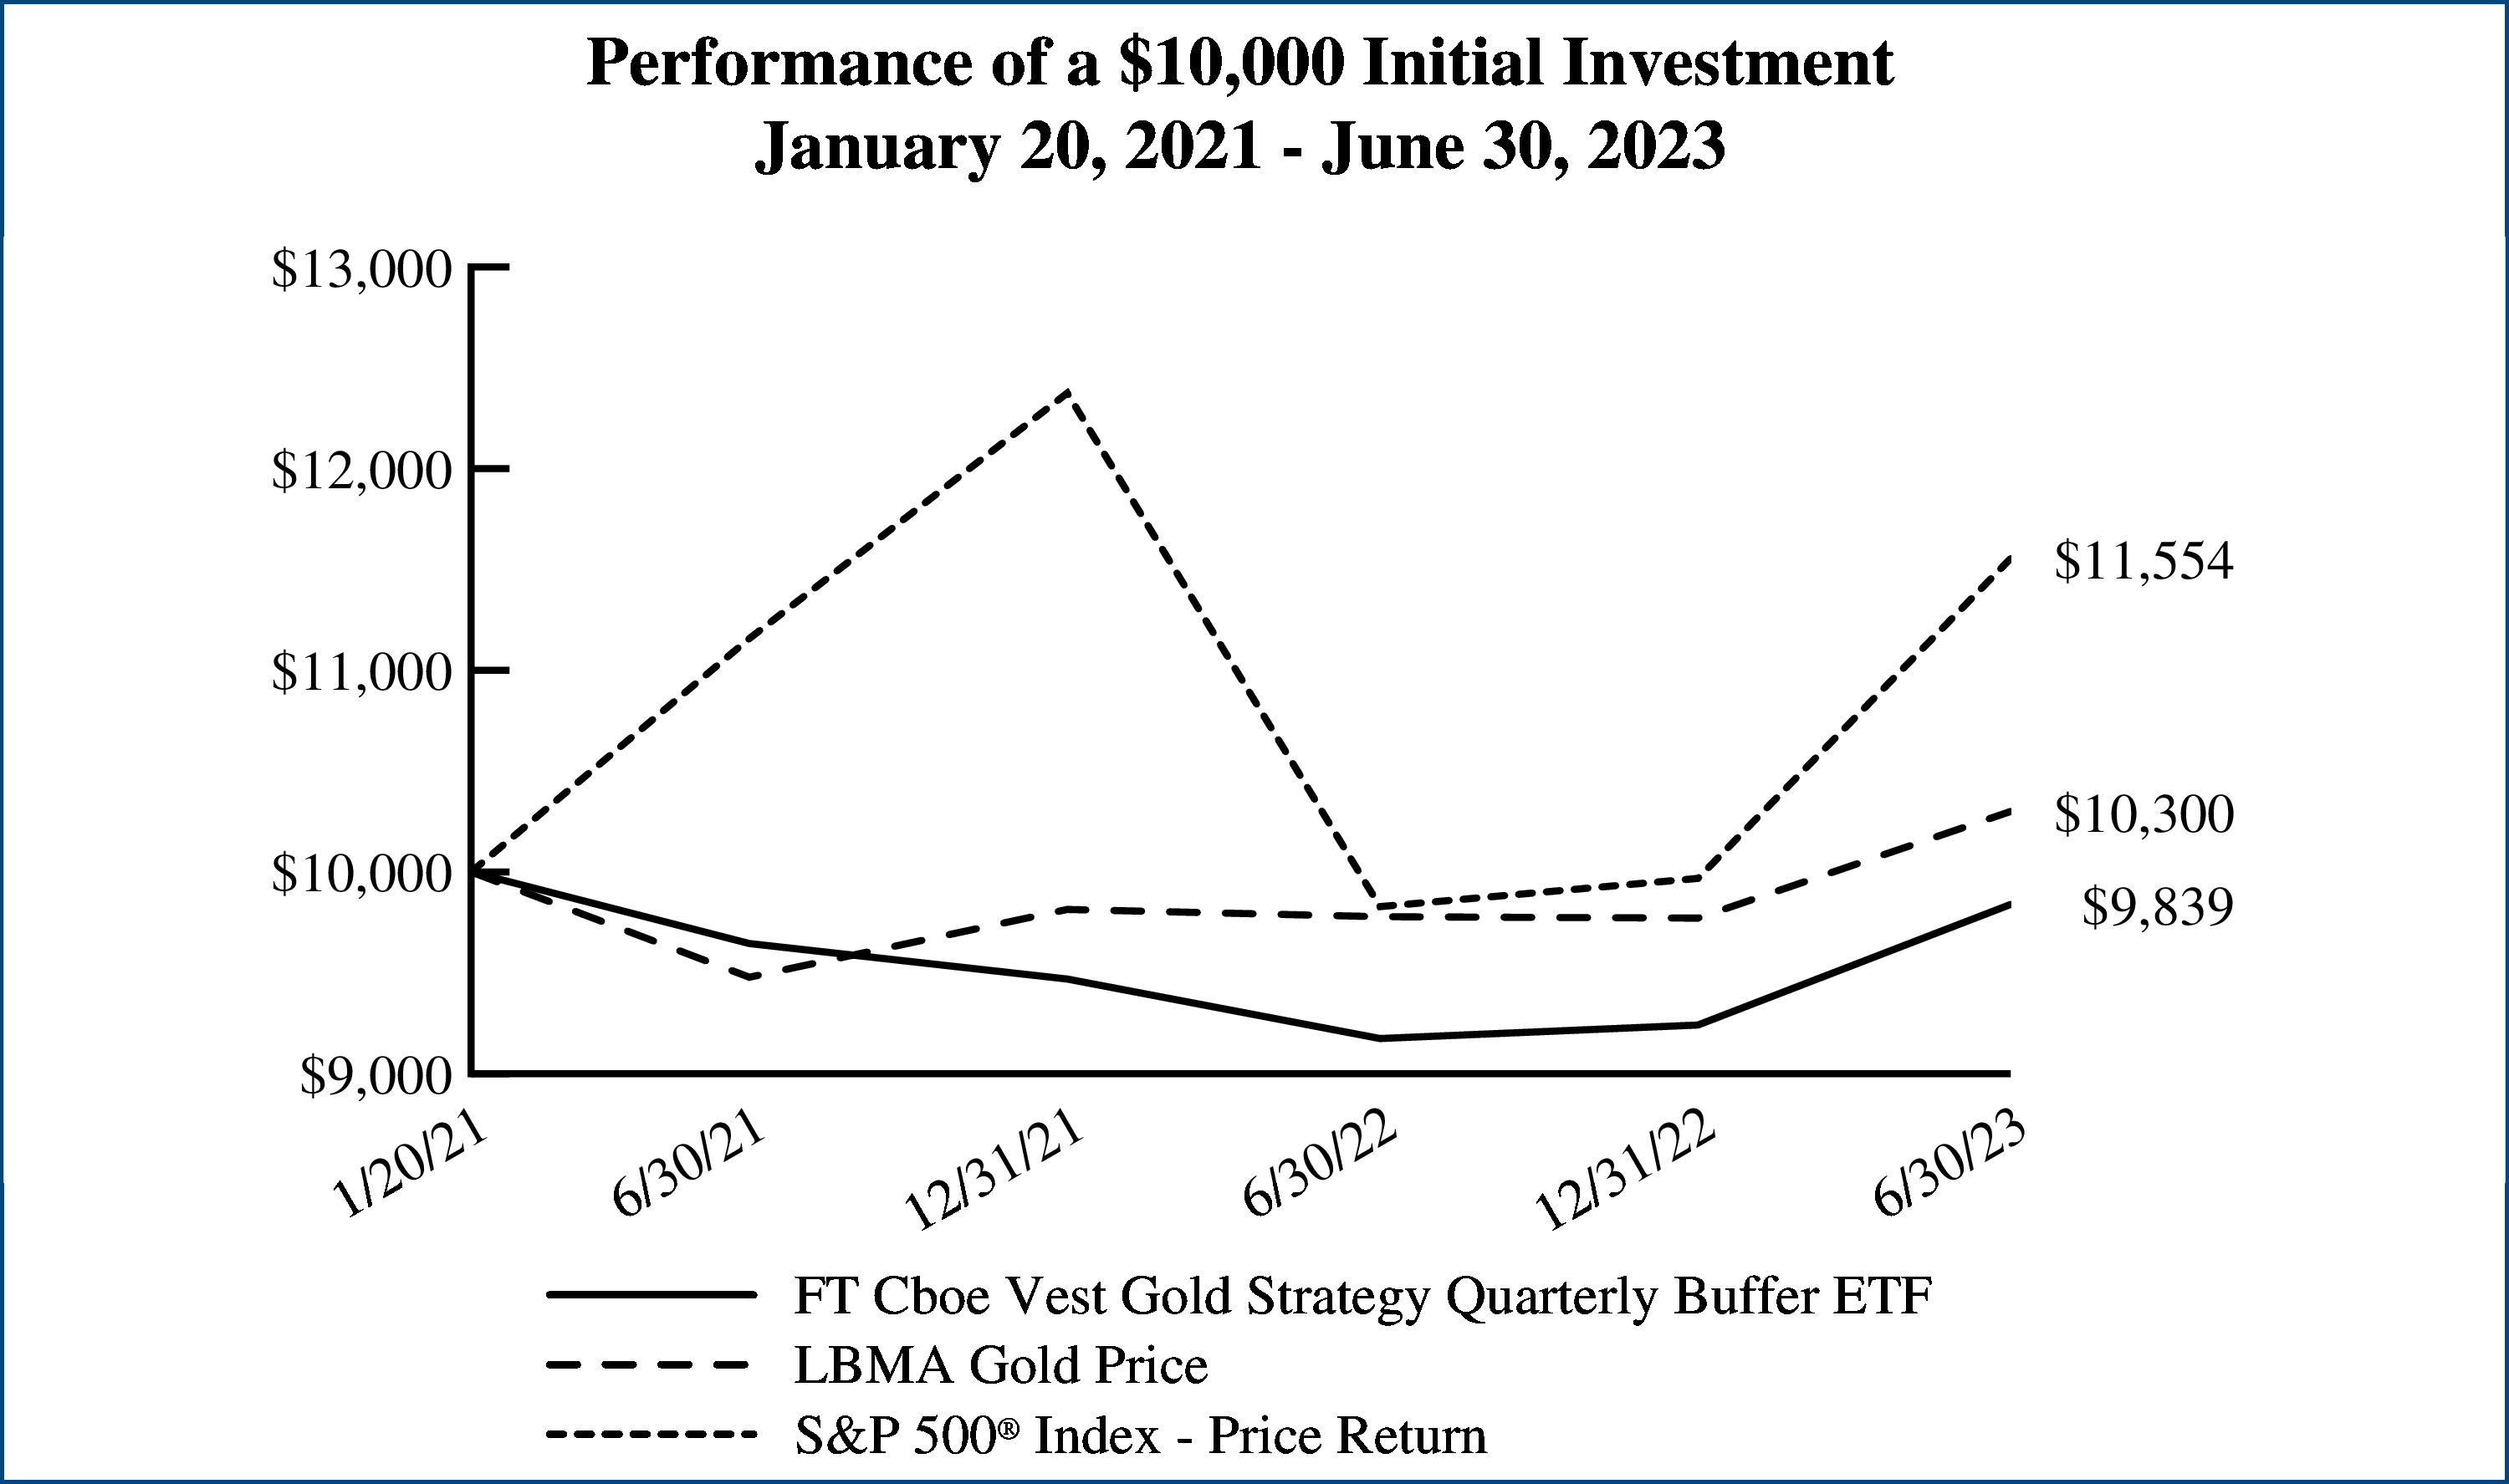 |
Performance figures assume reinvestment of
all distributions and do not reflect the
deduction of taxes that a shareholder would
pay on Fund distributions or the redemption
or sale of Fund shares. An index is a statistical
composite that tracks a specified financial
market or sector. Unlike the Fund, the indices
do not actually hold a portfolio of securities
and therefore do not incur the expenses
incurred by the Fund. These expenses
negatively impact the performance of the
Fund. The Fund’s past performance does not
predict future performance.
|
Semi-Annual Report
June 30, 2023 (Unaudited)
Howard Rubin, Managing Director of Cboe Vest
Understanding Your Fund Expenses
June 30, 2023 (Unaudited)
|
|
Beginning
Account Value
January 1, 2023
|
Ending
Account Value
June 30, 2023
|
Annualized
Expense Ratio
Based on the
Six-Month
Period
|
Expenses Paid
During the
Six-Month
Period (a)
|
|
FT Cboe Vest Gold Strategy Quarterly Buffer ETF (BGLD)
|
||||
|
Actual
|
$1,000.00
|
$1,064.70
|
0.90%
|
$4.61
|
|
Hypothetical (5% return before expenses)
|
$1,000.00
|
$1,020.33
|
0.90%
|
$4.51
|
|
(a)
|
Expenses are equal to the annualized expense ratio as indicated in the table multiplied by the average account value over
the period
(January 1, 2023 through June 30, 2023), multiplied by 181/365 (to reflect the six-month period).
|
Consolidated Portfolio of Investments
June 30, 2023 (Unaudited)
|
Principal
Value
|
Description
|
Stated
Coupon
|
Stated
Maturity
|
Value
|
|
|
U.S. TREASURY BILLS — 95.3%
|
|||||
|
$15,997,000
|
U.S. Treasury Bill (a)
|
(b)
|
08/29/23
|
$15,867,064
|
|
|
|
(Cost $15,860,995)
|
|
|
|
|
|
Shares
|
Description
|
Value
|
|||
|
MONEY MARKET FUNDS — 0.2%
|
|||||
|
43,883
|
Dreyfus Government Cash Management Fund, Institutional Shares - 5.00% (c)
|
43,883
|
|||
|
|
(Cost $43,883)
|
|
|||
|
|
Total Investments — 95.5%
|
15,910,947
|
|||
|
|
(Cost $15,904,878)
|
|
|||
|
Number of
Contracts
|
Description
|
Notional
Amount
|
Exercise
Price
|
Expiration
Date
|
Value
|
|
PURCHASED OPTIONS — 4.2%
|
|||||
|
|
Call Options Purchased — 4.2%
|
|
|||
|
929
|
SPDR® Gold Shares
|
$16,561,283
|
$173.20
|
08/31/23
|
702,341
|
|
|
(Cost $1,152,085)
|
|
|
|
|
|
WRITTEN OPTIONS — (0.1)%
|
|||||
|
|
Call Options Written — (0.1)%
|
|
|||
|
(929
)
|
SPDR® Gold Shares
|
(16,561,283
)
|
199.18
|
08/31/23
|
(18,985
)
|
|
|
(Premiums received $18,614)
|
|
|
|
|
|
|
Put Options Written — (0.0)%
|
|
|||
|
(929
)
|
SPDR® Gold Shares
|
(16,561,283
)
|
154.97
|
08/31/23
|
(4,641
)
|
|
|
(Premiums received $110,801)
|
|
|
|
|
|
|
Total Written Options
|
(23,626
)
|
|||
|
|
(Premiums received $129,415)
|
|
|||
|
|
Net Other Assets and Liabilities — 0.4%
|
62,441
|
|||
|
|
Net Assets — 100.0%
|
$16,652,103
|
|||
|
(a)
|
All or a portion of this security is segregated as collateral for the options written. At June 30, 2023, the segregated value
of this
security amounts to $2,826,778.
|
|
(b)
|
Zero coupon security.
|
|
(c)
|
Rate shown reflects yield as of June 30, 2023.
|
Consolidated Portfolio of Investments (Continued)
June 30, 2023 (Unaudited)
Valuation Inputs
|
ASSETS TABLE
|
||||
|
|
Total
Value at
6/30/2023
|
Level 1
Quoted
Prices
|
Level 2
Significant
Observable
Inputs
|
Level 3
Significant
Unobservable
Inputs
|
|
U.S. Treasury Bills
|
$15,867,064
|
$—
|
$15,867,064
|
$—
|
|
Money Market Funds
|
43,883
|
43,883
|
—
|
—
|
|
Total Investments
|
15,910,947
|
43,883
|
15,867,064
|
—
|
|
Purchased Options
|
702,341
|
—
|
702,341
|
—
|
|
Total
|
$16,613,288
|
$43,883
|
$16,569,405
|
$—
|
|
LIABILITIES TABLE
|
||||
|
|
Total
Value at
6/30/2023
|
Level 1
Quoted
Prices
|
Level 2
Significant
Observable
Inputs
|
Level 3
Significant
Unobservable
Inputs
|
|
Written Options
|
$(23,626
)
|
$—
|
$(23,626
)
|
$—
|
Consolidated Statement of Assets and Liabilities
June 30, 2023 (Unaudited)
|
ASSETS:
|
|
|
Investments, at value
|
$15,910,947
|
|
Options contracts purchased, at value
|
702,341
|
|
Cash
|
74,385
|
|
Dividends receivable
|
174
|
|
Total Assets
|
16,687,847
|
|
|
|
|
LIABILITIES:
|
|
|
Options contracts written, at value
|
23,626
|
|
Investment advisory fees payable
|
12,118
|
|
Total Liabilities
|
35,744
|
|
NET ASSETS
|
$16,652,103
|
|
|
|
|
NET ASSETS consist of:
|
|
|
Paid-in capital
|
$15,720,364
|
|
Par value
|
8,500
|
|
Accumulated distributable earnings (loss)
|
923,239
|
|
NET ASSETS
|
$16,652,103
|
|
NET ASSET VALUE, per share
|
$19.59
|
|
Number of shares outstanding (unlimited number of shares authorized, par value $0.01 per share)
|
850,002
|
|
Investments, at cost
|
$15,904,878
|
|
Premiums paid on options contracts purchased
|
$1,152,085
|
|
Premiums received on options contracts written
|
$129,415
|
Consolidated Statement of Operations
For the Six Months Ended June 30, 2023 (Unaudited)
|
INVESTMENT INCOME:
|
|
|
Interest
|
$272,929
|
|
Dividends
|
12,638
|
|
Total investment income
|
285,567
|
|
|
|
|
EXPENSES:
|
|
|
Investment advisory fees
|
60,291
|
|
Total expenses
|
60,291
|
|
NET INVESTMENT INCOME (LOSS)
|
225,276
|
|
|
|
|
NET REALIZED AND UNREALIZED GAIN (LOSS):
|
|
|
Net realized gain (loss) on:
|
|
|
Investments
|
(483
)
|
|
Purchased options contracts
|
617,737
|
|
Written options contracts
|
410,130
|
|
Net realized gain (loss)
|
1,027,384
|
|
Net change in unrealized appreciation (depreciation) on:
|
|
|
Investments
|
5,402
|
|
Purchased options contracts
|
(680,522
)
|
|
Written options contracts
|
144,729
|
|
Net change in unrealized appreciation (depreciation)
|
(530,391
)
|
|
NET REALIZED AND UNREALIZED GAIN (LOSS)
|
496,993
|
|
NET INCREASE (DECREASE) IN NET ASSETS RESULTING FROM OPERATIONS
|
$722,269
|
Consolidated Statements of Changes in Net Assets
|
|
Six Months
Ended
6/30/2023
(Unaudited)
|
Year
Ended
12/31/2022
|
|
OPERATIONS:
|
|
|
|
Net investment income (loss)
|
$225,276
|
$54,643
|
|
Net realized gain (loss)
|
1,027,384
|
(414,350
)
|
|
Net change in unrealized appreciation (depreciation)
|
(530,391
)
|
(105,812
)
|
|
Net increase (decrease) in net assets resulting from operations
|
722,269
|
(465,519
)
|
|
|
||
|
DISTRIBUTIONS TO SHAREHOLDERS FROM:
|
|
|
|
Investment operations
|
—
|
(31,758
)
|
|
Return of capital
|
—
|
(16,277
)
|
|
Total distributions to shareholders
|
—
|
(48,035
)
|
|
|
||
|
SHAREHOLDER TRANSACTIONS:
|
|
|
|
Proceeds from shares sold
|
6,811,961
|
14,891,168
|
|
Cost of shares redeemed
|
(3,760,730
)
|
(19,479,127
)
|
|
Net increase (decrease) in net assets resulting from shareholder transactions
|
3,051,231
|
(4,587,959
)
|
|
Total increase (decrease) in net assets
|
3,773,500
|
(5,101,513
)
|
|
|
||
|
NET ASSETS:
|
|
|
|
Beginning of period
|
12,878,603
|
17,980,116
|
|
End of period
|
$16,652,103
|
$12,878,603
|
|
|
||
|
CHANGES IN SHARES OUTSTANDING:
|
|
|
|
Shares outstanding, beginning of period
|
700,002
|
950,002
|
|
Shares sold
|
350,000
|
800,000
|
|
Shares redeemed
|
(200,000
)
|
(1,050,000
)
|
|
Shares outstanding, end of period
|
850,002
|
700,002
|
Consolidated Financial Highlights
For a share outstanding throughout each period
|
|
Six Months
Ended
6/30/2023
(Unaudited)
|
Year
Ended
12/31/2022
|
Period
Ended
12/31/2021 (a)
|
|
|
|||
|
Net asset value, beginning of period
|
$18.40
|
$18.93
|
$19.99
|
|
Income from investment operations:
|
|
|
|
|
Net investment income (loss)
|
0.32
(b)
|
0.08
|
(0.08
)
|
|
Net realized and unrealized gain (loss)
|
0.87
|
(0.54
)
|
(0.98
)
|
|
Total from investment operations
|
1.19
|
(0.46
)
|
(1.06
)
|
|
Distributions paid to shareholders from:
|
|
|
|
|
Net investment income
|
—
|
(0.05
)
|
—
|
|
Return of capital
|
—
|
(0.02
)
|
—
|
|
Total distributions
|
—
|
(0.07
)
|
—
|
|
Net asset value, end of period
|
$19.59
|
$18.40
|
$18.93
|
|
Total return (c)
|
6.47
%
|
(2.41
)%
|
(5.30
)%
|
|
|
|||
|
Ratios to average net assets/supplemental data:
|
|
|
|
|
Net assets, end of period (in 000’s)
|
$16,652
|
$12,879
|
$17,980
|
|
Ratio of total expenses to average net assets
|
0.90
% (d)
|
0.90
%
|
0.90
% (d)
|
|
Ratio of net investment income (loss) to average net assets
|
3.36
% (d)
|
0.37
%
|
(0.87
)% (d)
|
|
Portfolio turnover rate (e)
|
0
%
|
0
%
|
0
%
|
|
(a)
|
Inception date is January 20, 2021, which is consistent with the commencement of investment operations and is the date the
initial creation units
were established.
|
|
(b)
|
Based on average shares outstanding.
|
|
(c)
|
Total return is calculated assuming an initial investment made at the net asset value at the beginning of the period, reinvestment
of all
distributions at net asset value during the period, and redemption at net asset value on the last day of the period. The returns
presented do not
reflect the deduction of taxes that a shareholder would pay on Fund distributions or the redemption or sale of Fund shares.
Total return is
calculated for the time period presented and is not annualized for periods of less than a year.
|
|
(d)
|
Annualized.
|
|
(e)
|
Portfolio turnover is calculated for the time period presented and is not annualized for periods of less than a year and does
not include securities
received or delivered from processing creations or redemptions, derivatives and in-kind transactions.
|
June 30, 2023 (Unaudited)
June 30, 2023 (Unaudited)
June 30, 2023 (Unaudited)
|
Ordinary income
|
$31,758
|
|
Capital gains
|
—
|
|
Return of capital
|
16,277
|
|
Undistributed ordinary income
|
$—
|
|
Accumulated capital and other gain (loss)
|
(2,991
)
|
|
Net unrealized appreciation (depreciation)
|
195,286
|
June 30, 2023 (Unaudited)
|
Tax Cost
|
Gross Unrealized
Appreciation
|
Gross Unrealized
(Depreciation)
|
Net Unrealized
Appreciation
(Depreciation)
|
|
$16,927,548
|
$112,229
|
$(450,115
)
|
$(337,886
)
|
|
Breakpoints
|
|
|
Fund net assets up to and including $2.5 billion
|
0.9000
%
|
|
Fund net assets greater than $2.5 billion up to and including $5 billion
|
0.8775
%
|
|
Fund net assets greater than $5 billion up to and including $7.5 billion
|
0.8550
%
|
|
Fund net assets greater than $7.5 billion up to and including $10 billion
|
0.8325
%
|
|
Fund net assets greater than $10 billion
|
0.8100
%
|
June 30, 2023 (Unaudited)
|
|
|
Asset Derivatives
|
Liability Derivatives
|
||
|
Derivative
Instrument
|
Risk
Exposure
|
Consolidated
Statement of Assets and
Liabilities Location
|
Value
|
Consolidated
Statement of Assets and
Liabilities Location
|
Value
|
|
Options Contracts
|
Commodity Risk
|
Options contracts
purchased, at value
|
$702,341
|
Options contracts written,
at value
|
$23,626
|
|
|
|
|
Consolidated Statement of Operations Location
|
|
|
Commodity Risk Exposure
|
|
|
Net realized gain (loss) on:
|
|
|
Purchased options contracts
|
$617,737
|
|
Written options contracts
|
410,130
|
|
Net change in unrealized appreciation (depreciation) on:
|
|
|
Purchased options contracts
|
(680,522
)
|
|
Written options contracts
|
144,729
|
June 30, 2023 (Unaudited)
June 30, 2023 (Unaudited)
June 30, 2023 (Unaudited)
June 30, 2023 (Unaudited)
June 30, 2023 (Unaudited)
June 30, 2023 (Unaudited)
June 30, 2023 (Unaudited)
June 30, 2023 (Unaudited)

120 East Liberty Drive, Suite 400
Wheaton, IL 60187
8350 Broad Street, Suite 240
McLean, VA 22102
FUND ACCOUNTANT &
TRANSFER AGENT
240 Greenwich Street
New York, NY 10286
PUBLIC ACCOUNTING FIRM
111 South Wacker Drive
Chicago, IL 60606
320 South Canal Street
Chicago, IL 60606
June 30, 2023

|
FT Cboe Vest Gold Strategy Target Income ETF® (IGLD)
|
Semi-Annual Report
June 30, 2023
|
1
|
|
|
2
|
|
|
4
|
|
|
5
|
|
|
6
|
|
|
8
|
|
|
9
|
|
|
10
|
|
|
11
|
|
|
12
|
|
|
18
|
Semi-Annual Letter from the Chairman and CEO
June 30, 2023
non-profit business membership and research group organization, reported that its Leading Economic Index, which is composed of 10 economic indicators whose changes tend to precede changes in the overall economy, fell by 0.7% to a reading of 106.1 in June 2023, according to Reuters. The result represents the fifteenth consecutive monthly decline in the index, the longest streak of
month-over-month decreases since just before the financial crisis in 2007. From our perspective, even if the Fed can pull off a soft landing, it is likely to be a very bumpy ride.

Chairman of the Board of Trustees
Chief Executive Officer of First Trust Advisors L.P.
short-term U.S. Treasury securities, cash and cash equivalents, and the shares of a wholly-owned subsidiary (“Subsidiary”) that holds FLexible EXchange® Options (“FLEX Options”) that reference the price performance of the Underlying ETF. In seeking to achieve its objective, the Fund, through the Subsidiary, will generally purchase or sell FLEX Options. FLEX Options are customized equity or index option contracts that trade on an exchange but provide investors with the ability to customize key contract terms like exercise prices, styles and expiration dates. In combination, the purchased call and sold put options generally provide exposure to price returns of the Underlying ETF both on the upside and downside. The Fund’s investment sub-advisor is Cboe Vest Financial LLC. Additionally, as a means to generate income, the Fund will employ a “partial covered call strategy” that seeks to sell call options having a strike price roughly equal to the value of the Underlying ETF at the inception of the Fund or each subsequent roll of the strategy (such options are said to be “at-the-money”) on only a portion of the notional value of the call options purchased by the Fund. To execute this strategy, the Fund will sell call options with an expiration date less than or equal to approximately one month in the future (the “Target Income Period”). The amount of call options sold by the Fund is based on a calculation designed to result in the Fund generating income over the Target Income Period on the average assets of the Fund from premiums from writing call options that is approximately 3.85% higher annually than the annual yield from one-month U.S. Treasury securities, before Fund fees and expenses. The Fund is classified as “non-diversified” under the Investment Company Act of 1940, as amended. Shares of the Fund are listed on the Cboe BZX Exchange, Inc. under the ticker symbol “IGLD.”
|
Performance
|
||||
|
|
|
|
Average Annual
Total Returns
|
Cumulative
Total Returns
|
|
|
6 Months
Ended
6/30/23
|
1 Year
Ended
6/30/23
|
Inception
(3/2/21)
to 6/30/23
|
Inception
(3/2/21)
to 6/30/23
|
|
Fund Performance
|
|
|
|
|
|
NAV
|
5.21%
|
2.63%
|
2.11%
|
4.99%
|
|
Market Price
|
3.99%
|
2.57%
|
2.11%
|
4.99%
|
|
Index Performance
|
|
|
|
|
|
LBMA Gold Price
|
5.43%
|
5.24%
|
4.55%
|
10.93%
|
|
S&P 500® Index - Price Return
|
15.91%
|
17.57%
|
6.18%
|
14.99%
|
|
Fund Allocation
|
% of
Net Assets
|
|
U.S. Treasury Bills
|
130.9%
|
|
Money Market Funds
|
2.1
|
|
Purchased Options
|
0.1
|
|
Written Options
|
(34.8)
|
|
Net Other Assets and Liabilities
|
1.7
|
|
Total
|
100.0%
|
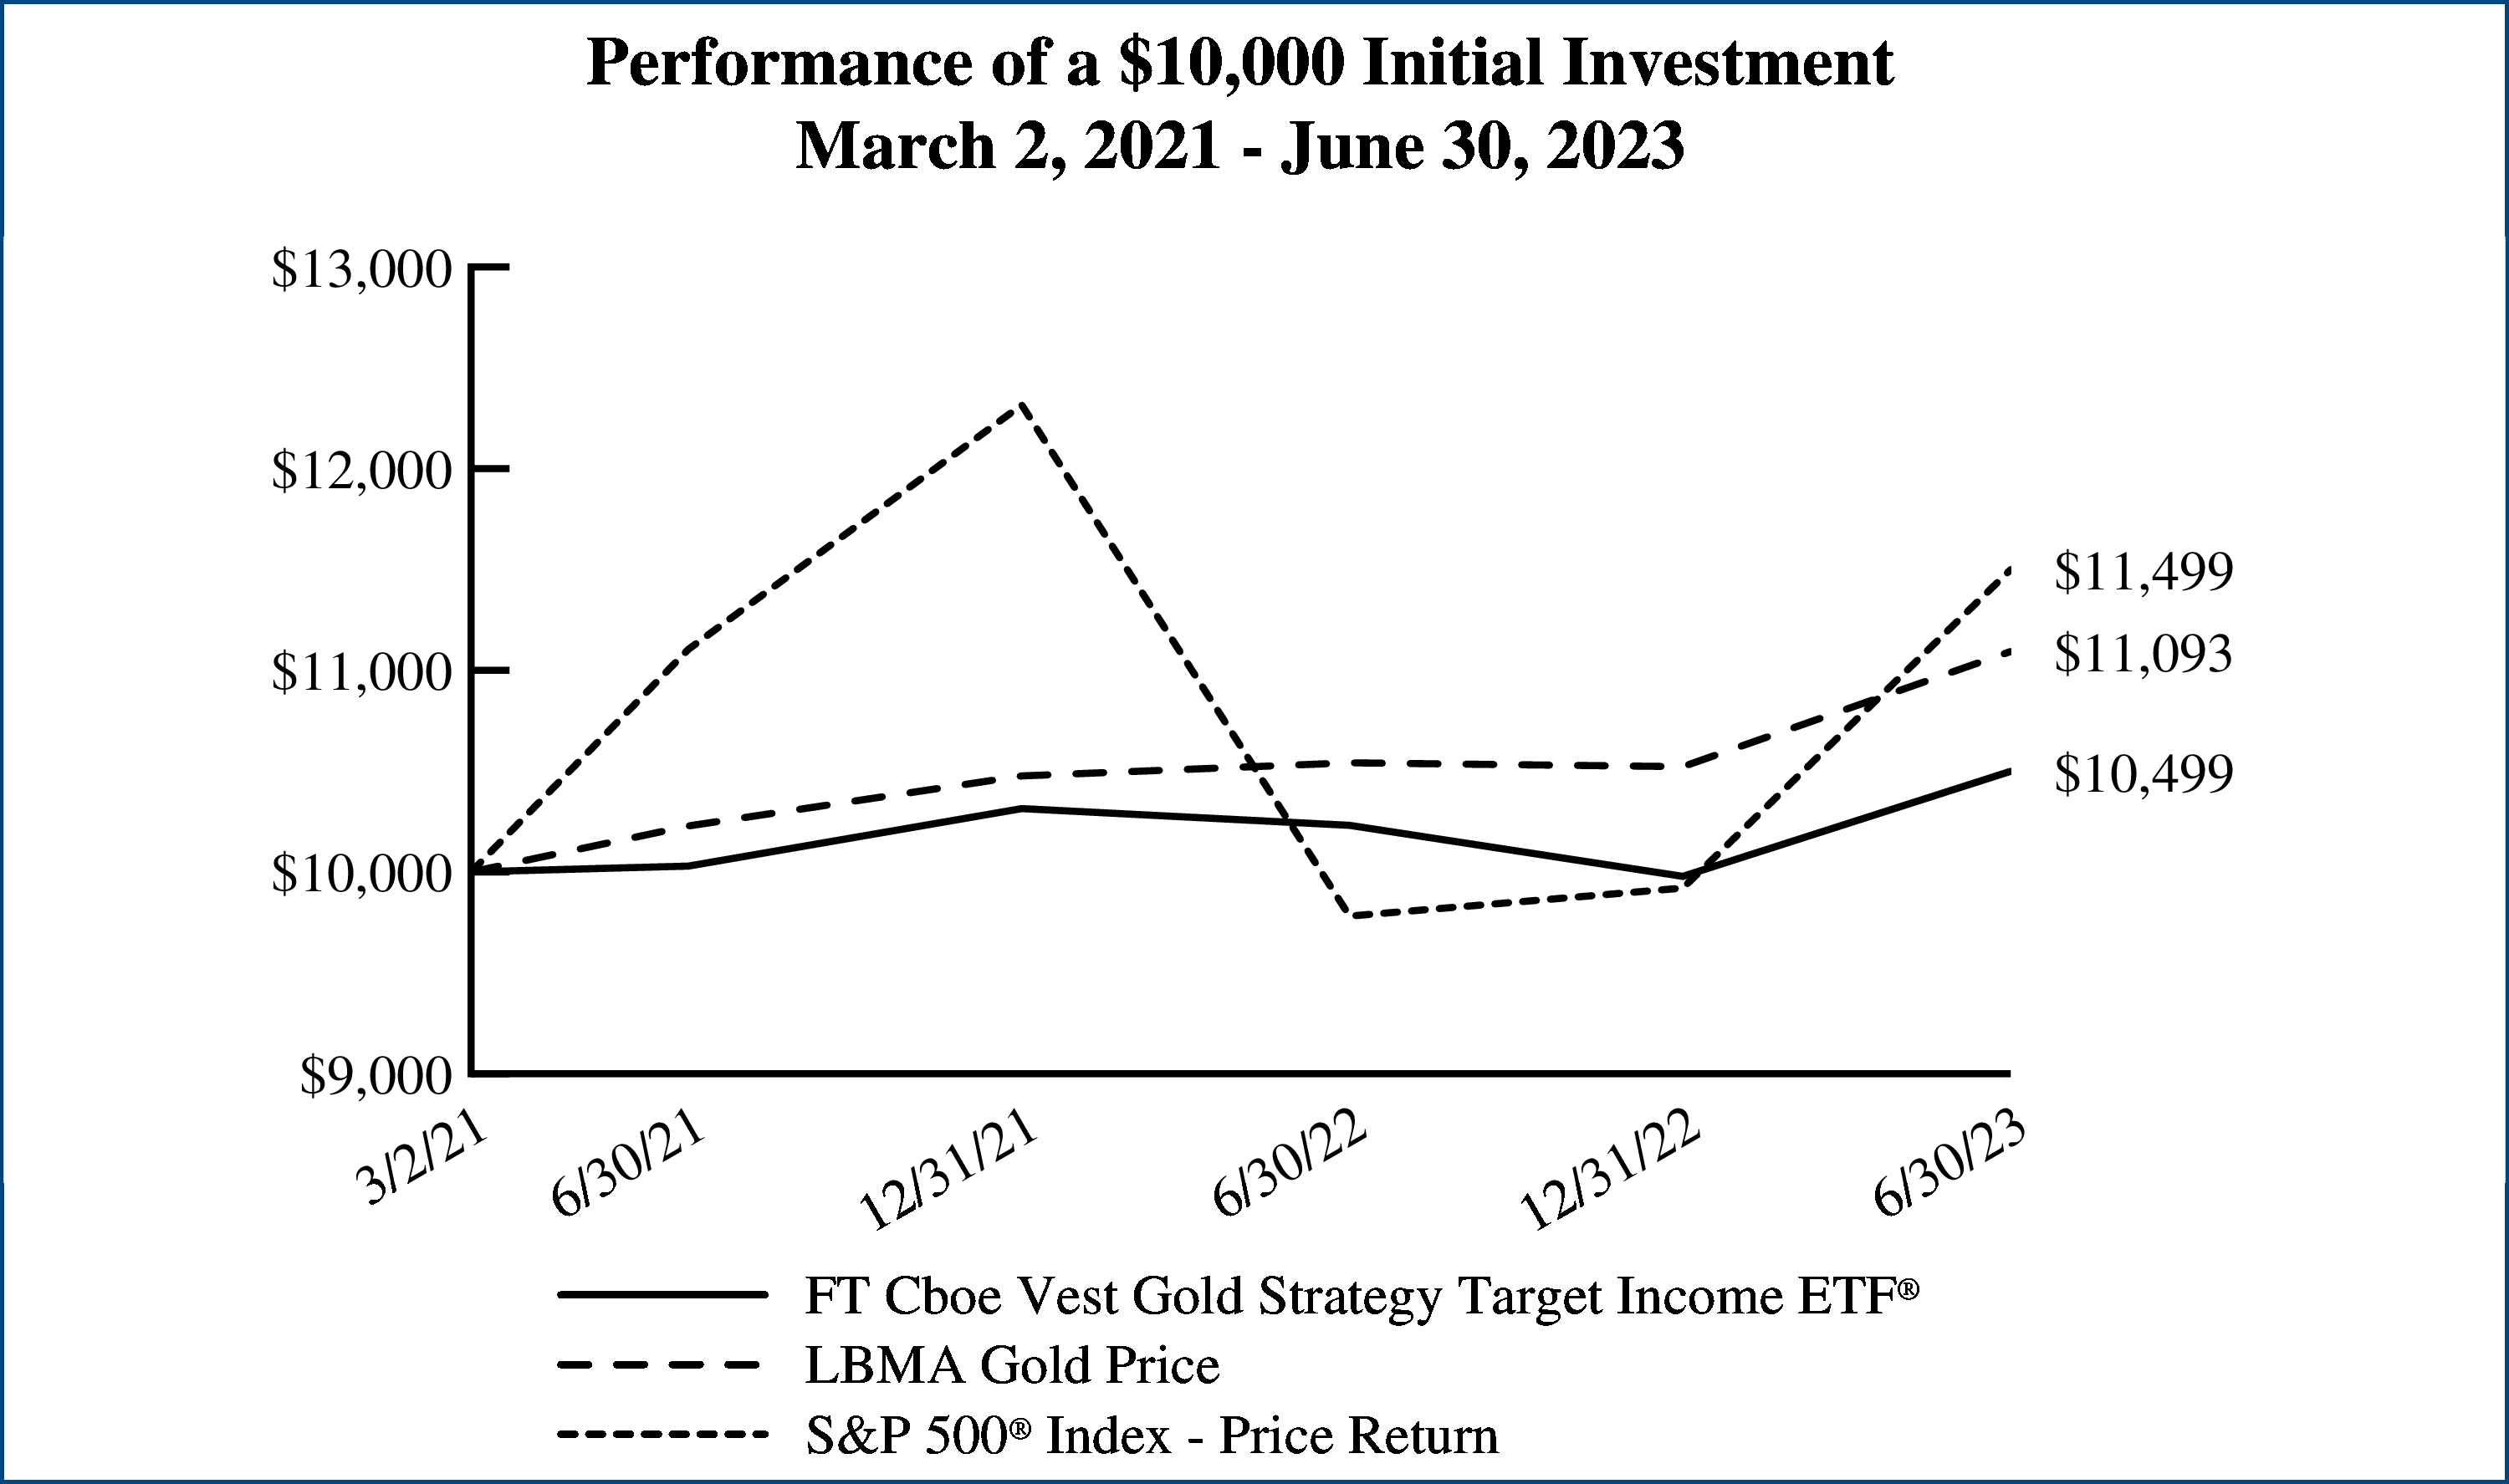 |
Performance figures assume reinvestment of
all distributions and do not reflect the
deduction of taxes that a shareholder would
pay on Fund distributions or the redemption
or sale of Fund shares. An index is a statistical
composite that tracks a specified financial
market or sector. Unlike the Fund, the indices
do not actually hold a portfolio of securities
and therefore do not incur the expenses
incurred by the Fund. These expenses
negatively impact the performance of the
Fund. The Fund’s past performance does not
predict future performance.
|
Semi-Annual Report
June 30, 2023 (Unaudited)
Howard Rubin, Managing Director of Cboe Vest
Understanding Your Fund Expenses
June 30, 2023 (Unaudited)
|
|
Beginning
Account Value
January 1, 2023
|
Ending
Account Value
June 30, 2023
|
Annualized
Expense Ratio
Based on the
Six-Month
Period
|
Expenses Paid
During the
Six-Month
Period (a)
|
|
FT Cboe Vest Gold Strategy Target Income ETF® (IGLD)
|
||||
|
Actual
|
$1,000.00
|
$1,052.10
|
0.85%
|
$4.32
|
|
Hypothetical (5% return before expenses)
|
$1,000.00
|
$1,020.58
|
0.85%
|
$4.26
|
|
(a)
|
Expenses are equal to the annualized expense ratio as indicated in the table multiplied by the average account value over
the period
(January 1, 2023 through June 30, 2023), multiplied by 181/365 (to reflect the six-month period).
|
Consolidated Portfolio of Investments
June 30, 2023 (Unaudited)
|
Principal
Value
|
Description
|
Stated
Coupon
|
Stated
Maturity
|
Value
|
|
|
U.S. TREASURY BILLS — 130.9%
|
|||||
|
$96,941,700
|
U.S. Treasury Bill (a)
|
(b)
|
11/30/23
|
$94,843,854
|
|
|
|
(Cost $95,074,334)
|
|
|
|
|
|
Shares
|
Description
|
Value
|
|||
|
MONEY MARKET FUNDS — 2.1%
|
|||||
|
1,560,066
|
Dreyfus Government Cash Management Fund, Institutional Shares - 5.00% (c)
|
1,560,066
|
|||
|
|
(Cost $1,560,066)
|
|
|||
|
|
Total Investments — 133.0%
|
96,403,920
|
|||
|
|
(Cost $96,634,400)
|
|
|||
|
Number of
Contracts
|
Description
|
Notional
Amount
|
Exercise
Price
|
Expiration
Date
|
Value
|
|
PURCHASED OPTIONS — 0.1%
|
|||||
|
|
Call Options Purchased — 0.1%
|
|
|||
|
4,038
|
SPDR® Gold Shares
|
$71,985,426
|
$244.50
|
11/30/23
|
56,758
|
|
|
(Cost $596,446)
|
|
|
|
|
|
WRITTEN OPTIONS — (34.8)%
|
|||||
|
|
Call Options Written — (0.7)%
|
|
|||
|
(2,150
)
|
SPDR® Gold Shares
|
(38,328,050
)
|
178.27
|
07/31/23
|
(548,250
)
|
|
|
(Premiums received $545,452)
|
|
|
|
|
|
|
Put Options Written — (34.1)%
|
|
|||
|
(4,038
)
|
SPDR® Gold Shares
|
(71,985,426
)
|
244.50
|
11/30/23
|
(24,693,389
)
|
|
|
(Premiums received $25,482,275)
|
|
|
|
|
|
|
Total Written Options
|
(25,241,639
)
|
|||
|
|
(Premiums received $26,027,727)
|
|
|||
|
|
Net Other Assets and Liabilities — 1.7%
|
1,241,920
|
|||
|
|
Net Assets — 100.0%
|
$72,460,959
|
|||
|
(a)
|
All or a portion of this security is segregated as collateral for the options written. At June 30, 2023, the segregated value
of this
security amounts to $37,981,287.
|
|
(b)
|
Zero coupon security.
|
|
(c)
|
Rate shown reflects yield as of June 30, 2023.
|
Consolidated Portfolio of Investments (Continued)
June 30, 2023 (Unaudited)
Valuation Inputs
|
ASSETS TABLE
|
||||
|
|
Total
Value at
6/30/2023
|
Level 1
Quoted
Prices
|
Level 2
Significant
Observable
Inputs
|
Level 3
Significant
Unobservable
Inputs
|
|
U.S. Treasury Bills
|
$94,843,854
|
$—
|
$94,843,854
|
$—
|
|
Money Market Funds
|
1,560,066
|
1,560,066
|
—
|
—
|
|
Total Investments
|
96,403,920
|
1,560,066
|
94,843,854
|
—
|
|
Purchased Options
|
56,758
|
—
|
56,758
|
—
|
|
Total
|
$96,460,678
|
$1,560,066
|
$94,900,612
|
$—
|
|
LIABILITIES TABLE
|
||||
|
|
Total
Value at
6/30/2023
|
Level 1
Quoted
Prices
|
Level 2
Significant
Observable
Inputs
|
Level 3
Significant
Unobservable
Inputs
|
|
Written Options
|
$(25,241,639
)
|
$—
|
$(25,241,639
)
|
$—
|
Consolidated Statement of Assets and Liabilities
June 30, 2023 (Unaudited)
|
ASSETS:
|
|
|
Investments, at value
|
$96,403,920
|
|
Options contracts purchased, at value
|
56,758
|
|
Cash
|
739,730
|
|
Receivables:
|
|
|
Investment securities sold
|
545,453
|
|
Dividends
|
6,573
|
|
Total Assets
|
97,752,434
|
|
|
|
|
LIABILITIES:
|
|
|
Options contracts written, at value
|
25,241,639
|
|
Investment advisory fees payable
|
49,836
|
|
Total Liabilities
|
25,291,475
|
|
NET ASSETS
|
$72,460,959
|
|
|
|
|
NET ASSETS consist of:
|
|
|
Paid-in capital
|
$73,050,200
|
|
Par value
|
38,000
|
|
Accumulated distributable earnings (loss)
|
(627,241
)
|
|
NET ASSETS
|
$72,460,959
|
|
NET ASSET VALUE, per share
|
$19.07
|
|
Number of shares outstanding (unlimited number of shares authorized, par value $0.01 per share)
|
3,800,002
|
|
Investments, at cost
|
$96,634,400
|
|
Premiums paid on options contracts purchased
|
$596,446
|
|
Premiums received on options contracts written
|
$26,027,727
|
Consolidated Statement of Operations
For the Six Months Ended June 30, 2023 (Unaudited)
|
INVESTMENT INCOME:
|
|
|
Interest
|
$1,553,353
|
|
Dividends
|
21,004
|
|
Total investment income
|
1,574,357
|
|
|
|
|
EXPENSES:
|
|
|
Investment advisory fees
|
221,986
|
|
Total expenses
|
221,986
|
|
NET INVESTMENT INCOME (LOSS)
|
1,352,371
|
|
|
|
|
NET REALIZED AND UNREALIZED GAIN (LOSS):
|
|
|
Net realized gain (loss) on:
|
|
|
Investments
|
(4,292
)
|
|
Purchased options contracts
|
(20,837
)
|
|
Written options contracts
|
4,784
|
|
Net realized gain (loss)
|
(20,345
)
|
|
Net change in unrealized appreciation (depreciation) on:
|
|
|
Investments
|
(244,081
)
|
|
Purchased options contracts
|
(541,439
)
|
|
Written options contracts
|
702,988
|
|
Net change in unrealized appreciation (depreciation)
|
(82,532
)
|
|
NET REALIZED AND UNREALIZED GAIN (LOSS)
|
(102,877
)
|
|
NET INCREASE (DECREASE) IN NET ASSETS RESULTING FROM OPERATIONS
|
$1,249,494
|
Consolidated Statements of Changes in Net Assets
|
|
Six Months
Ended
6/30/2023
(Unaudited)
|
Year
Ended
12/31/2022
|
|
OPERATIONS:
|
|
|
|
Net investment income (loss)
|
$1,352,371
|
$270,325
|
|
Net realized gain (loss)
|
(20,345
)
|
(1,431,362
)
|
|
Net change in unrealized appreciation (depreciation)
|
(82,532
)
|
(720,292
)
|
|
Net increase (decrease) in net assets resulting from operations
|
1,249,494
|
(1,881,239
)
|
|
|
||
|
DISTRIBUTIONS TO SHAREHOLDERS FROM:
|
|
|
|
Investment operations
|
(1,879,642
)
|
—
|
|
Return of capital
|
—
|
(1,725,727
)
|
|
Total distributions to shareholders
|
(1,879,642
)
|
(1,725,727
)
|
|
|
||
|
SHAREHOLDER TRANSACTIONS:
|
|
|
|
Proceeds from shares sold
|
36,455,120
|
21,210,170
|
|
Cost of shares redeemed
|
(1,933,777
)
|
(10,509,533
)
|
|
Net increase (decrease) in net assets resulting from shareholder transactions
|
34,521,343
|
10,700,637
|
|
Total increase (decrease) in net assets
|
33,891,195
|
7,093,581
|
|
|
||
|
NET ASSETS:
|
|
|
|
Beginning of period
|
38,569,764
|
31,476,183
|
|
End of period
|
$72,460,959
|
$38,569,764
|
|
|
||
|
CHANGES IN SHARES OUTSTANDING:
|
|
|
|
Shares outstanding, beginning of period
|
2,050,002
|
1,550,002
|
|
Shares sold
|
1,850,000
|
1,050,000
|
|
Shares redeemed
|
(100,000
)
|
(550,000
)
|
|
Shares outstanding, end of period
|
3,800,002
|
2,050,002
|
Consolidated Financial Highlights
For a share outstanding throughout each period
|
|
Six Months
Ended
6/30/2023
(Unaudited)
|
Year
Ended
12/31/2022
|
Period
Ended
12/31/2021 (a)
|
|
|
|||
|
Net asset value, beginning of period
|
$18.81
|
$20.31
|
$20.14
|
|
Income from investment operations:
|
|
|
|
|
Net investment income (loss)
|
0.49
(b)
|
0.14
|
(0.08
)
|
|
Net realized and unrealized gain (loss)
|
0.49
(c)
|
(0.79
)
|
0.71
|
|
Total from investment operations
|
0.98
|
(0.65
)
|
0.63
|
|
Distributions paid to shareholders from:
|
|
|
|
|
Net investment income
|
(0.72
)
|
—
|
—
|
|
Return of capital
|
—
|
(0.85
)
|
(0.46
)
|
|
Total distributions
|
(0.72
)
|
(0.85
)
|
(0.46
)
|
|
Net asset value, end of period
|
$19.07
|
$18.81
|
$20.31
|
|
Total return (d)
|
5.21
%
|
(3.26
)%
|
3.14
%
|
|
|
|||
|
Ratios to average net assets/supplemental data:
|
|
|
|
|
Net assets, end of period (in 000’s)
|
$72,461
|
$38,570
|
$31,476
|
|
Ratio of total expenses to average net assets
|
0.85
% (e)
|
0.85
%
|
0.85
% (e)
|
|
Ratio of net investment income (loss) to average net assets
|
5.18
% (e)
|
0.69
%
|
(0.76
)% (e)
|
|
Portfolio turnover rate (f)
|
0
%
|
0
%
|
0
%
|
|
(a)
|
Inception date is March 02, 2021, which is consistent with the commencement of investment operations and is the date the initial
creation units
were established.
|
|
(b)
|
Based on average shares outstanding.
|
|
(c)
|
The per share amount does not correlate with the aggregate realized and unrealized gain (loss) due to the timing of the Fund
share sales and
repurchases in relation to market value fluctuation of the underlying investments.
|
|
(d)
|
Total return is calculated assuming an initial investment made at the net asset value at the beginning of the period, reinvestment
of all
distributions at net asset value during the period, and redemption at net asset value on the last day of the period. The returns
presented do not
reflect the deduction of taxes that a shareholder would pay on Fund distributions or the redemption or sale of Fund shares.
Total return is
calculated for the time period presented and is not annualized for periods of less than a year.
|
|
(e)
|
Annualized.
|
|
(f)
|
Portfolio turnover is calculated for the time period presented and is not annualized for periods of less than a year and does
not include securities
received or delivered from processing creations or redemptions, derivatives and in-kind transactions.
|
June 30, 2023 (Unaudited)
June 30, 2023 (Unaudited)
June 30, 2023 (Unaudited)
|
Ordinary income
|
$—
|
|
Capital gains
|
—
|
|
Return of capital
|
1,725,727
|
|
Undistributed ordinary income
|
$—
|
|
Accumulated capital and other gain (loss)
|
(42,405
)
|
|
Net unrealized appreciation (depreciation)
|
114,456
|
June 30, 2023 (Unaudited)
|
Tax Cost
|
Gross Unrealized
Appreciation
|
Gross Unrealized
(Depreciation)
|
Net Unrealized
Appreciation
(Depreciation)
|
|
$71,203,119
|
$788,886
|
$(772,966
)
|
$15,920
|
|
Breakpoints
|
|
|
Fund net assets up to and including $2.5 billion
|
0.85000
%
|
|
Fund net assets greater than $2.5 billion up to and including $5 billion
|
0.82875
%
|
|
Fund net assets greater than $5 billion up to and including $7.5 billion
|
0.80750
%
|
|
Fund net assets greater than $7.5 billion up to and including $10 billion
|
0.78625
%
|
|
Fund net assets greater than $10 billion
|
0.76500
%
|
June 30, 2023 (Unaudited)
|
|
|
Asset Derivatives
|
Liability Derivatives
|
||
|
Derivative
Instrument
|
Risk
Exposure
|
Consolidated
Statement of Assets and
Liabilities Location
|
Value
|
Consolidated
Statement of Assets and
Liabilities Location
|
Value
|
|
Options Contracts
|
Commodity Risk
|
Options contracts
purchased, at value
|
$56,758
|
Options contracts written,
at value
|
$25,241,639
|
|
|
|
|
Consolidated Statement of Operations Location
|
|
|
Commodity Risk Exposure
|
|
|
Net realized gain (loss) on:
|
|
|
Purchased options contracts
|
$(20,837
)
|
|
Written options contracts
|
4,784
|
|
Net change in unrealized appreciation (depreciation) on:
|
|
|
Purchased options contracts
|
(541,439
)
|
|
Written options contracts
|
702,988
|
June 30, 2023 (Unaudited)
June 30, 2023 (Unaudited)
June 30, 2023 (Unaudited)
June 30, 2023 (Unaudited)
June 30, 2023 (Unaudited)
June 30, 2023 (Unaudited)
June 30, 2023 (Unaudited)
June 30, 2023 (Unaudited)

120 East Liberty Drive, Suite 400
Wheaton, IL 60187
8350 Broad Street, Suite 240
McLean, VA 22102
FUND ACCOUNTANT &
TRANSFER AGENT
240 Greenwich Street
New York, NY 10286
PUBLIC ACCOUNTING FIRM
111 South Wacker Drive
Chicago, IL 60606
320 South Canal Street
Chicago, IL 60606
| (b) | Not applicable. |
Item 2. Code of Ethics.
Not applicable.
Item 3. Audit Committee Financial Expert.
Not applicable.
Item 4. Principal Accountant Fees and Services.
Not applicable.
Item 5. Audit Committee of Listed Registrants.
Not applicable.
Item 6. Investments.
| (a) | Schedules of Investments in securities of unaffiliated issuers as of the close of the reporting period are included as part of the report to shareholders filed under Item 1 of this form. |
| (b) | Not applicable. |
Item 7. Disclosure of Proxy Voting Policies and Procedures for Closed-End Management Investment Companies.
Not applicable.
Item 8. Portfolio Managers of Closed-End Management Investment Companies.
Not applicable.
Item 9. Purchases of Equity Securities by Closed-End Management Investment Company and Affiliated Purchasers.
Not applicable.
Item 10. Submission of Matters to a Vote of Security Holders.
There have been no material changes to the procedures by which the shareholders may recommend nominees to the registrant's board of directors, where those changes were implemented after the registrant last provided disclosure in response to the requirements of Item 407(c)(2)(iv) of Regulation S-K (17 CFR 229.407) (as required by Item 22(b)(15) of Schedule 14A (17 CFR 240.14a-101)), or this Item.
Item 11. Controls and Procedures.
| (a) | The registrant's principal executive and principal financial officers, or persons performing similar functions, have concluded that the registrant's disclosure controls and procedures (as defined in Rule 30a-3(c) under the Investment Company Act of 1940, as amended (the "1940 Act") (17 CFR 270.30a-3 (c))) are effective, as of a date within 90 days of the filing date of the report that includes the disclosure required by this paragraph, based on their evaluation of these controls and procedures required by Rule 30a-3(b) under the 1940 Act (17 CFR 270.30a-3(b)) and Rules 13a-15(b) or 15d-15(b) under the Securities Exchange Act of 1934, as amended (17 CFR 240.13a-15(b) or 240.15d-15 (b)). |
| (b) | There were no changes in the registrant's internal control over financial reporting (as defined in Rule 30a-3(d) under the 1940 Act (17 CFR 270.30a-3(d)) that occurred during the period covered by this report that have materially affected, or are reasonably likely to materially affect, the registrant's internal control over financial reporting. |
Item 12. Disclosure of Securities Lending Activities for Closed-End Management Investment Companies.
Not applicable.
Item 13. Exhibits.
| (a)(1) | Not applicable. |
| (a)(2) | Certifications pursuant to Rule 30a-2(a) under the 1940 Act and Section 302 of the Sarbanes-Oxley Act of 2002 are attached hereto. |
| (a)(3) | Not applicable. |
| (a)(4) | Not applicable. |
| (b) | Certifications pursuant to Rule 30a-2(b) under the 1940 Act and Section 906 of the Sarbanes-Oxley Act of 2002 are attached hereto. |
SIGNATURES
Pursuant to the requirements of the Securities Exchange Act of 1934 and the Investment Company Act of 1940, the registrant has duly caused this report to be signed on its behalf by the undersigned, thereunto duly authorized.
| (registrant) | First Trust Exchange-Traded Fund |
| By (Signature and Title)* | /s/ James M. Dykas | |
| James M. Dykas, President and Chief Executive Officer (principal executive officer) |
| Date: | September 8, 2023 |
Pursuant to the requirements of the Securities Exchange Act of 1934 and the Investment Company Act of 1940, this report has been signed below by the following persons on behalf of the registrant and in the capacities and on the dates indicated.
| By (Signature and Title)* | /s/ James M. Dykas | |
| James M. Dykas, President and Chief Executive Officer (principal executive officer) |
| Date: | September 8, 2023 |
| By (Signature and Title)* | /s/ Derek D. Maltbie | |
| Derek D. Maltbie, Treasurer, Chief Financial Officer and Chief Accounting Officer (principal financial officer) |
| Date: | September 8, 2023 |
* Print the name and title of each signing officer under his or her signature.