Exhibit 99.1

Expedia, Inc. Reports Third Quarter 2014 Results
BELLEVUE, WA – October 30, 2014 – Expedia, Inc. (NASDAQ: EXPE) today announced financial results for the third quarter ended September 30, 2014.
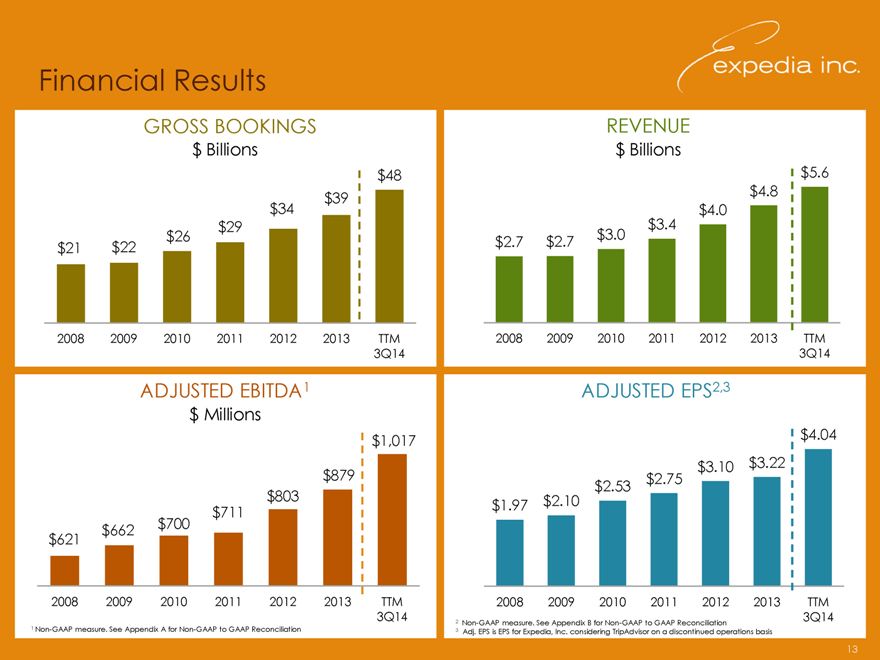
| • | Gross bookings growth of 29% and revenue growth of 22% were primarily driven by strong hotel room night and air ticket growth. Revenue growth was also driven by strength in advertising and media revenue which grew 29% to $141 million for the quarter. |
| • | Room nights grew 24% year-over-year, driven by continued strong performance at Brand Expedia® and Hotels.com®, with both domestic and international room nights increasing 24% year-over-year. |
| • | The combination of healthy top-line growth and leverage on fixed costs led to Adjusted EBITDA* improving 20% and Adjusted EPS* improving 35% compared to the third quarter of 2013. |
| • | Year to date, Expedia, Inc. repurchased 6.5 million shares of its common stock for approximately $492 million excluding transaction costs. |
Financial Summary & Operating Metrics (financial figures in $MMs except per share amounts)
| Metric |
Quarter Ended 9.30.14 |
Quarter Ended 9.30.13 |
Y / Y Growth |
|||||||||
| Room night growth |
24 | % | 20 | % | 357 | bps | ||||||
| Gross bookings |
13,469.6 | 10,436.7 | 29 | % | ||||||||
| Revenue |
1,712.5 | 1,401.9 | 22 | % | ||||||||
| Adjusted EBITDA* |
409.1 | 339.9 | 20 | % | ||||||||
| Operating income |
296.8 | 238.7 | 24 | % | ||||||||
| Adjusted net income* |
256.0 | 200.9 | 27 | % | ||||||||
| Net income attributable to Expedia, Inc. |
257.1 | 170.9 | 50 | % | ||||||||
| Adjusted EPS* |
$ | 1.93 | $ | 1.43 | 35 | % | ||||||
| Diluted EPS |
$ | 1.94 | $ | 1.22 | 59 | % | ||||||
| Free cash flow * |
19.4 | (301.8 | ) | NM | ||||||||
| * | “Adjusted EBITDA” (Adjusted Earnings Before Interest, Taxes, Depreciation and Amortization), “Adjusted net income,” “Adjusted EPS” and “Free cash flow” are non-GAAP measures as defined by the Securities and Exchange Commission (the “SEC”). Please see “Definitions of Non-GAAP Measures” and “Tabular Reconciliations for Non-GAAP Measures” on pages 10-13 herein for an explanation of non-GAAP measures used throughout this release. The definition for adjusted net income was revised in the fourth quarters of 2010, 2011 and 2012 and the definition for Adjusted EBITDA was revised in the fourth quarter of 2012. |
Please refer to the Glossary in the Quarterly Results section on Expedia’s investor relations website for definitions of the business and financial terms discussed within this release.
Page 1 of 15
Discussion of Results
The results include Expedia.com®, Hotels.com, Hotwire.com®, Expedia® Affiliate Network, Classic Vacations®, Expedia Local Expert®, Expedia® CruiseShipCenters®, Egencia®, eLong, Venere® Net SpA, trivago GmbH, and CarRentals.com™, in addition to the related international points of sale.
Expedia and AirAsia™ formed a joint venture on July 1, 2011, which is 50% owned by Expedia; therefore, results do not include the Brand Expedia websites contributed to the joint venture.
The results include trivago GmbH (“trivago”) following acquisition of a controlling interest during March 2013 as well as results from the strategic marketing agreement with Travelocity launched during the fourth quarter of 2013. Unless otherwise noted, all comparisons below are versus the third quarter of 2013.
Gross Bookings, Revenue & Revenue Margins
For the third quarter of 2014, gross bookings increased 29% (29% excluding foreign exchange) primarily driven by room night and air ticket growth. Room night growth was driven by Brand Expedia including the Travelocity-branded websites and Hotels.com. Air ticket growth was driven by Brand Expedia including the Travelocity-branded websites.
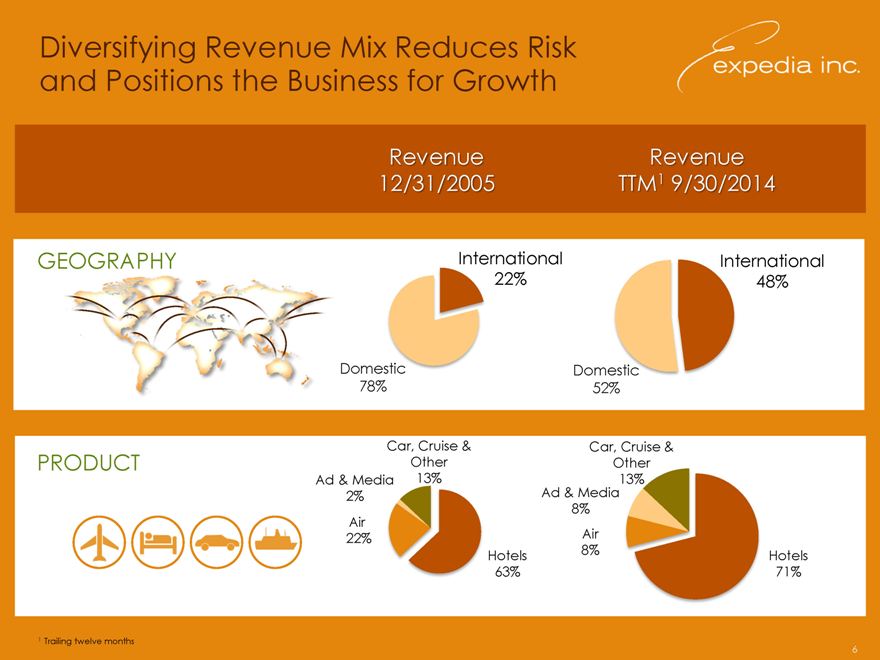
For the third quarter of 2014, domestic gross bookings increased 35% and international gross bookings increased 22% (22% excluding foreign exchange). International bookings totaled $5.6 billion, accounting for 42% of worldwide bookings versus 44% in the third quarter of 2013. The decrease in international gross bookings mix was primarily due to the inclusion of the Travelocity-branded websites, which bolstered domestic gross bookings.
For the third quarter of 2014, revenue increased 22% (21% excluding foreign exchange) primarily driven by growth in hotel and advertising and media revenue. Domestic revenue increased 20% and international revenue increased 25% (24% excluding foreign exchange). International revenue equaled $824 million, representing 48% of worldwide revenue versus 47% in the third quarter of 2013.
Revenue as a percentage of gross bookings (“revenue margin”) was 12.7% for the third quarter of 2014, a decrease of 72 basis points compared to the third quarter of 2013. The decrease primarily relates to lower revenue per room night and the inclusion of the Travelocity-branded websites.
Product & Services Detail
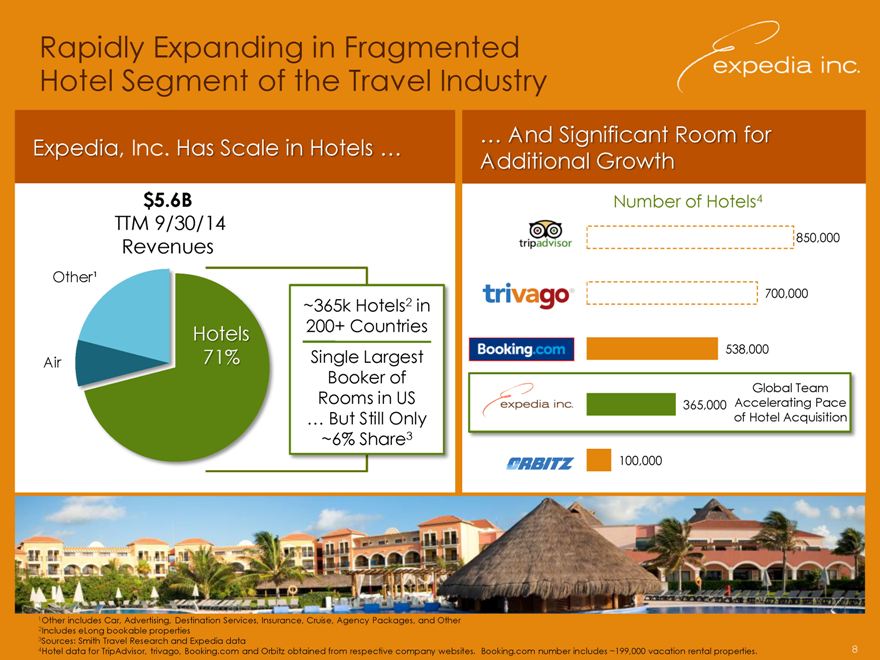
As a percentage of total worldwide revenue in the third quarter of 2014, hotel accounted for 73%, advertising and media accounted for 8%, air accounted for 7% and all other revenues accounted for the remaining 12%.
Hotel revenue increased 21% in the third quarter of 2014 on a 24% increase in room nights stayed driven by Brand Expedia including the Travelocity-branded websites and Hotels.com, partially offset by a 2% decrease in revenue per room night. Revenue per room night decreased primarily due to promotional activities such as growing loyalty programs and couponing as well as efforts to expand the size and availability of the global hotel supply portfolio, including contracts signed as part of the Expedia® Traveler Preference™ (ETP) program. This decline was partially offset by a 5% increase in average daily rates.
Air revenue increased 21% in the third quarter of 2014 due to a 30% increase in air tickets sold, partially offset by a 7% decrease in revenue per ticket. Advertising and media revenue increased 29% in the third quarter of 2014 due to continued strong growth in trivago® and Expedia® Media Solutions. All other revenue increased 24% in the third quarter of 2014 primarily on growth in our car rental and travel insurance products.
Page 2 of 15
Adjusted Expenses
| Costs and Expenses | As a % of Revenue | |||||||||||||||||||||||
| Three months ended September 30, | Three months ended September 30, | |||||||||||||||||||||||
| 2014 | 2013 | Growth | 2014 | 2013 | D in bps | |||||||||||||||||||
| Adjusted cost of revenue * |
$ | 289 | $ | 267 | 8 | % | 16.9 | % | 19.0 | % | (214 | ) | ||||||||||||
| Adjusted selling and marketing * |
810 | 620 | 31 | % | 47.3 | % | 44.2 | % | 310 | |||||||||||||||
| Adjusted technology and content * |
111 | 98 | 14 | % | 6.5 | % | 7.0 | % | (46 | ) | ||||||||||||||
| Adjusted general and administrative * |
93 | 83 | 12 | % | 5.4 | % | 5.9 | % | (48 | ) | ||||||||||||||
|
|
|
|
|
|
|
|
|
|
|
|
|
|||||||||||||
| Total adjusted costs and expenses |
$ | 1,303 | $ | 1,067 | 22 | % | 76.1 | % | 76.1 | % | 2 | |||||||||||||
|
|
|
|
|
|
|
|
|
|
|
|
|
|||||||||||||
| Total depreciation |
67 | 53 | 27 | % | 3.9 | % | 3.8 | % | 16 | |||||||||||||||
| Total stock based compensation |
22 | 18 | 24 | % | 1.3 | % | 1.3 | % | 2 | |||||||||||||||
|
|
|
|
|
|
|
|
|
|
|
|
|
|||||||||||||
| Total costs and expenses - GAAP |
$ | 1,393 | $ | 1,138 | 22 | % | 81.4 | % | 81.2 | % | 20 | |||||||||||||
|
|
|
|
|
|
|
|
|
|
|
|
|
|||||||||||||
| * | Non-GAAP measures as defined by the SEC. Please see “Definitions of Non-GAAP Measures” and “Tabular Reconciliations for Non-GAAP Measures” on pages 10-13 herein for an explanation of the use of these non-GAAP measures. |
Adjusted Cost of Revenue
| • | For the third quarter of 2014, adjusted cost of revenue increased 8% primarily due to a $14 million increase in customer operations expenses primarily due to an increase in transaction costs and volumes period over period as well as a $6 million increase in net credit card processing costs, including fraud and chargebacks. |
Adjusted Selling and Marketing
| • | For the third quarter of 2014, adjusted selling and marketing expense increased 31% due to a $172 million increase in direct costs, including online and offline marketing expenses. Brand Expedia including commissions related to the Travelocity agreement, trivago and Hotels.com accounted for a majority of the total increase in direct selling and marketing expenses. |
| • | Indirect costs increased $19 million for the third quarter of 2014 primarily driven by additional personnel, including accelerated pace of hiring in our lodging supply organization as well as higher incentive compensation accrual. As a percentage of total selling and marketing, indirect costs represented 17% in the third quarter of 2014 compared to 19% in the third quarter of 2013. |
Adjusted Technology and Content
| • | For the third quarter of 2014, adjusted technology and content expense increased 14% primarily due to a $13 million increase in personnel and overhead costs, net of capitalized salary costs, for additional personnel to support key technology projects for our corporate technology function, supply organization and Brand Expedia as well as higher incentive compensation accrual. |
Adjusted General and Administrative
| • | For the third quarter of 2014, adjusted general and administrative expense increased 12% primarily due to higher personnel costs totaling $7 million including higher incentive compensation accrual as well as higher professional and legal fees. |
Depreciation Expense
For the third quarter of 2014, depreciation expense increased 27% primarily due to increased expenses related to previously capitalized software development costs for completed technology which has been placed into service. We expect depreciation expense to continue to increase as additional projects are completed.
Interest and Other
For the third quarter of 2014, interest income increased 22% primarily due to higher cash and short-term investment balances. Interest expense increased 16% primarily due to higher long-term debt balances.
For the third quarter of 2014, other, net was a gain of $10 million compared to a loss of $11 million in the third quarter of 2013. The gain for the third quarter of 2014 and loss for the third quarter of 2013 were primarily related to foreign exchange. Foreign currency rate fluctuations positively impacted third quarter 2014 revenue growth rates reflecting
Page 3 of 15
appreciation in certain foreign currencies compared to the third quarter of 2013. Our revenue hedging program is designed to offset the book-to-stay impact on merchant hotel revenue. We include any realized gains or losses from our revenue hedging program in our calculation of Adjusted EBITDA.
Income Taxes
The effective tax rate on GAAP pre-tax income was 13.4% for the third quarter of 2014, compared with 21.4% in the prior year period. The effective tax rate on pre-tax adjusted net income (“ANI”) was 20.4% for the third quarter of 2014 compared with 25.4% in the prior year period. The year-over-year changes in the GAAP and ANI effective tax rates were primarily due to expiration of the statute of limitations for the 2001 – 2005 federal tax years and the associated release of liabilities related to uncertain tax positions.
Balance Sheet, Cash Flows and Capitalization
Cash, cash equivalents, restricted cash and short-term investments totaled $2.7 billion at September 30, 2014. For the nine months ended September 30, 2014, net cash provided by operating activities was $1.6 billion and free cash flow totaled $1.3 billion. Both measures include $898 million from net changes in operating assets and liabilities, primarily driven by an increase in deferred merchant bookings, which includes amounts related to the Travelocity agreement. Free cash flow increased $587 million for the nine months ended September 30, 2014, compared to the prior year period primarily due to lower pay-to-play tax assessment payments in the current period, higher operating income after adjusting for the impacts of depreciation and amortization as well as increased benefits from working capital changes.
In August 2014, we registered $500 million of senior unsecured notes that are due in August 2024 and bear interest at 4.5% (the “4.5% Notes”). The 4.5% Notes were issued at 99.444% of par resulting in a discount, which is being amortized over their life. Interest is payable semi-annually in February and August of each year, beginning February 15, 2015.
Long-term debt totaled $1.75 billion at September 30, 2014 consisting of $497 million, net of discount, in 4.5% senior notes due 2024, $749 million, net of discount, in 5.95% senior notes due 2020 and $500 million in 7.456% senior notes due 2018. In addition, we have a $1 billion unsecured revolving credit facility which was essentially untapped as of September 30, 2014.
At September 30, 2014, we had stock-based awards outstanding representing approximately 16.0 million shares of our common stock, consisting of options to purchase approximately 15.7 million common shares with a $47.45 weighted average exercise price and weighted average remaining life of 4.5 years, and approximately 0.3 million restricted stock units (RSUs).
During the third quarter of 2014, we repurchased 1.5 million shares of common stock for an aggregate purchase price of $130 million excluding transaction costs (an average of $84.63 per share). As of September 30, 2014, we had approximately 2.5 million shares remaining under our April 2012 repurchase authorization.
Pursuant to the Amended and Restated Governance Agreement with Liberty Interactive Corporation (“Liberty”), we issued 264,608 shares of common stock to Liberty at a price of $77.11 per share for an aggregate value of approximately $20 million. The shares were issued from treasury stock during the fourth quarter of 2014.
On September 17, 2014, we paid a quarterly dividend of $23 million ($0.18 per common share). In addition, on October 27, 2014, the Executive Committee of Expedia’s Board of Directors declared a cash dividend of $0.18 per share of outstanding common stock to be paid to stockholders of record as of the close of business on November 20, 2014, with a payment date of December 11, 2014. Based on our current shares outstanding, we estimate the total payment for this quarterly dividend will be approximately $23 million. Future declaration of dividends and the establishment of future record and payment dates are subject to the final determination of Expedia’s Board of Directors.
Page 4 of 15
Recent Highlights
Global Presence and Supply Portfolio
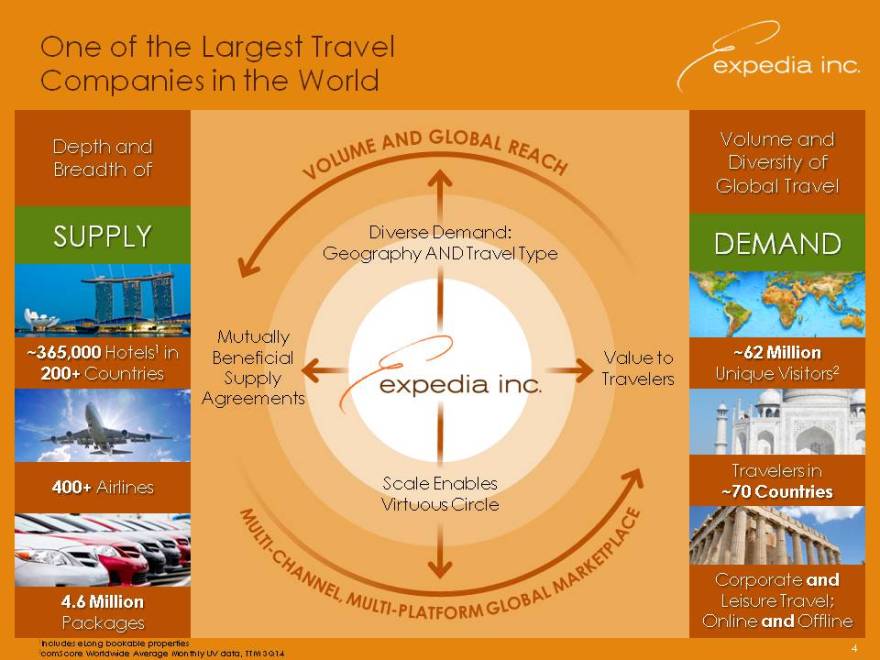
| • | At quarter-end, Expedia, Inc. global websites featured over 365,000 properties, including approximately 155,000 in China through eLong. |
| • | HomeAway and Expedia.com broadened their existing vacation rental listing partnership. Expedia.com customers in the U.S. will now have the opportunity to browse more than 115,000 vacation rental listings, providing more choice and variety in their trip planning. |
| • | Expedia Inc. renewed distribution agreements with American Airlines, who merged with US Airways last year to become the world’s largest airline, and Seattle-based Alaska Airlines, which flies to over 100 destinations in the contiguous United States, Alaska, Hawaii and Mexico. |
| • | Expedia Lodging Partner Services enabled new provisions that allow for distribution under the Expedia Traveler Preference (ETP) program with a number of noteworthy hotel brands, including a leading global hospitality company Choice Hotels International. |
| • | Expedia® Affiliate Network (EAN) signed agreements to power online hotel bookings for several international companies, including The Travel Network Group (formerly known as TTA / Worldchoice), one of the largest independent travel networks in Europe. |
| • | Egencia signed nearly 300 new customers, including ActionTarget, a US-based leading global manufacturer of shooting ranges, equipment, and services, and SNCF, the French national rail company. |
| • | As part of the joint venture between Brand Expedia and AirAsia, AirAsiaGo launched their new site in China, enabling Alipay payments for standalone hotels. |
Technology Innovation
| • | Continued advancements in mobile apps and on the mobile web including: |
| • | Brand Expedia launched a new tablet app for iOS and Android, featuring federated search, making it the first app to allow a search for a flight and a hotel at the same time. |
| • | AirAsiaGo launched a mobile Hotels and Flights app on iOS and Android. |
| • | Hotwire’s mobile apps won several awards including a W3 Award for excellence in mobile travel for iPhone and a Travel Weekly Magellan Award for excellence in mobile travel for the iPad app. |
| • | Corporate travel mobile transactions increased by 200% since the launch of the mobile app Egencia® TripNavigator, now available on iPhone and Android operating systems. |
| • | Brand Expedia, Hotels.com and Hotwire entered the wearable device space: |
| • | Brand Expedia app is now available for the Samsung Gear 2 around the globe. |
| • | Hotels.com Android app for wearables (e.g. watches) launched during the quarter. It sends helpful reminders to travelers before checking into their hotel, which means not having to pull out travel wallets, phones or itineraries. |
| • | Hotwire launched an add-on to its Android app, making it one of the first travel apps on Android to sync automatically with the Google Watch for a fully integrated approach to trip planning. |
| • | Brand Expedia successfully completed the global platform migration of the car rental business. Similar investments at Hotwire mean its car offering is now available across all native app platforms. |
| • | Hotels.com launched hotel gift cards in North America, redeemable on over 100,000 hotels worldwide (including chain hotels, bed & breakfast, resort, vacation rentals and boutique properties). |
Distribution Channels
| • | Brand Expedia launched two new travel cobranded credit cards via a partnership with Citi: the Expedia+ Credit Card and the Expedia+ Voyager Credit Card allow travelers to earn Expedia+ rewards bonus points faster and redeem for travel rewards from Expedia.com. |
| • | Brand Expedia brand campaign received accolades this quarter. #ThrowMeBack contest won the 2014 Skifties Award for Best Integrated Campaign and social media program was recognized on Skift.com as one of the “5 Travel Brands Winning on Social Media for the Week Ending September 19, 2014.” |
Page 5 of 15
EXPEDIA, INC.
CONSOLIDATED STATEMENTS OF OPERATIONS
(In thousands, except for per share data)
(Unaudited)
| Three months ended September 30, |
Nine months ended September 30, |
|||||||||||||||
| 2014 | 2013 | 2014 | 2013 | |||||||||||||
| Revenue |
$ | 1,712,504 | $ | 1,401,860 | $ | 4,407,507 | $ | 3,619,244 | ||||||||
| Costs and expenses: |
||||||||||||||||
| Cost of revenue (1)(2) |
299,708 | 276,318 | 894,828 | 789,506 | ||||||||||||
| Selling and marketing (1)(2) |
815,800 | 625,296 | 2,184,115 | 1,711,919 | ||||||||||||
| Technology and content (1)(2) |
172,754 | 143,816 | 504,804 | 422,781 | ||||||||||||
| General and administrative (1)(2) |
104,999 | 92,351 | 306,584 | 276,618 | ||||||||||||
| Amortization of intangible assets |
18,519 | 18,514 | 55,275 | 49,921 | ||||||||||||
| Legal reserves, occupancy tax and other |
3,888 | 6,874 | 38,843 | 74,678 | ||||||||||||
| Acquisition-related and other (1) |
— | — | — | 66,472 | ||||||||||||
|
|
|
|
|
|
|
|
|
|||||||||
| Operating income |
296,836 | 238,691 | 423,058 | 227,349 | ||||||||||||
| Other income (expense): |
||||||||||||||||
| Interest income |
8,075 | 6,642 | 20,756 | 19,837 | ||||||||||||
| Interest expense |
(25,558 | ) | (21,966 | ) | (69,683 | ) | (65,343 | ) | ||||||||
| Other, net |
10,172 | (11,287 | ) | 2,514 | (1,611 | ) | ||||||||||
|
|
|
|
|
|
|
|
|
|||||||||
| Total other expense, net |
(7,311 | ) | (26,611 | ) | (46,413 | ) | (47,117 | ) | ||||||||
|
|
|
|
|
|
|
|
|
|||||||||
| Income before income taxes |
289,525 | 212,080 | 376,645 | 180,232 | ||||||||||||
| Provision for income taxes |
(38,904 | ) | (45,356 | ) | (59,974 | ) | (57,861 | ) | ||||||||
|
|
|
|
|
|
|
|
|
|||||||||
| Net income |
250,621 | 166,724 | 316,671 | 122,371 | ||||||||||||
| Net loss attributable to noncontrolling interests |
6,438 | 4,135 | 15,457 | 15,762 | ||||||||||||
|
|
|
|
|
|
|
|
|
|||||||||
| Net income attributable to Expedia, Inc. |
$ | 257,059 | $ | 170,859 | $ | 332,128 | $ | 138,133 | ||||||||
|
|
|
|
|
|
|
|
|
|||||||||
| Earnings per share attributable to Expedia, Inc. available to common stockholders: |
||||||||||||||||
| Basic |
$ | 2.01 | $ | 1.25 | $ | 2.57 | $ | 1.01 | ||||||||
| Diluted |
1.94 | 1.22 | 2.48 | 0.98 | ||||||||||||
| Shares used in computing earnings per share: |
||||||||||||||||
| Basic |
127,911 | 136,380 | 129,326 | 136,381 | ||||||||||||
| Diluted |
132,274 | 140,451 | 133,683 | 141,202 | ||||||||||||
| Dividends declared per common share |
$ | 0.18 | $ | 0.15 | $ | 0.48 | $ | 0.41 | ||||||||
|
|
||||||||||||||||
| (1) Includes stock-based compensation as follows: |
||||||||||||||||
| Cost of revenue |
$ | 1,045 | $ | 887 | $ | 3,190 | $ | 2,712 | ||||||||
| Selling and marketing |
3,643 | 3,943 | 13,798 | 11,857 | ||||||||||||
| Technology and content |
7,374 | 5,372 | 17,892 | 15,459 | ||||||||||||
| General and administrative |
10,242 | 7,837 | 33,259 | 22,532 | ||||||||||||
| Acquisition-related and other |
— | — | — | 56,643 | ||||||||||||
| (2) Includes depreciation as follows: |
||||||||||||||||
| Cost of revenue |
$ | 9,217 | $ | 8,519 | $ | 25,554 | $ | 25,629 | ||||||||
| Selling and marketing |
2,086 | 1,676 | 5,757 | 4,665 | ||||||||||||
| Technology and content |
54,129 | 40,942 | 157,890 | 117,312 | ||||||||||||
| General and administrative |
2,037 | 1,828 | 5,960 | 5,364 | ||||||||||||
Page 6 of 15
EXPEDIA, INC.
CONSOLIDATED BALANCE SHEETS
(In thousands, except per share data)
| September 30, 2014 |
December 31, 2013 |
|||||||
| (Unaudited) | ||||||||
| ASSETS | ||||||||
| Current assets: |
||||||||
| Cash and cash equivalents |
$ | 2,252,748 | $ | 1,021,033 | ||||
| Restricted cash and cash equivalents |
31,794 | 26,042 | ||||||
| Short-term investments |
396,041 | 325,510 | ||||||
| Accounts receivable, net of allowance of $13,430 and $11,555 |
887,436 | 614,735 | ||||||
| Deferred income taxes |
97,541 | 66,130 | ||||||
| Income taxes receivable |
19,545 | 64,296 | ||||||
| Prepaid expenses and other current assets |
151,713 | 101,541 | ||||||
|
|
|
|
|
|||||
| Total current assets |
3,836,818 | 2,219,287 | ||||||
| Property and equipment, net |
525,053 | 480,702 | ||||||
| Long-term investments and other assets |
298,396 | 250,626 | ||||||
| Deferred income taxes |
18,196 | 14,151 | ||||||
| Intangible assets, net |
1,076,780 | 1,111,041 | ||||||
| Goodwill |
3,669,745 | 3,663,674 | ||||||
|
|
|
|
|
|||||
| TOTAL ASSETS |
$ | 9,424,988 | $ | 7,739,481 | ||||
|
|
|
|
|
|||||
| LIABILITIES AND STOCKHOLDERS’ EQUITY | ||||||||
| Current liabilities: |
||||||||
| Accounts payable, merchant |
$ | 1,272,709 | $ | 1,044,259 | ||||
| Accounts payable, other |
425,310 | 261,288 | ||||||
| Deferred merchant bookings |
2,086,886 | 1,350,319 | ||||||
| Deferred revenue |
56,234 | 39,746 | ||||||
| Income taxes payable |
31,037 | 61,874 | ||||||
| Accrued expenses and other current liabilities |
669,531 | 536,895 | ||||||
|
|
|
|
|
|||||
| Total current liabilities |
4,541,707 | 3,294,381 | ||||||
| Long-term debt |
1,746,712 | 1,249,412 | ||||||
| Deferred income taxes |
446,922 | 433,532 | ||||||
| Other long-term liabilities |
167,325 | 138,300 | ||||||
| Commitments and contingencies |
||||||||
| Redeemable noncontrolling interests |
520,443 | 364,871 | ||||||
| Stockholders’ equity: |
||||||||
| Common stock $.0001 par value |
20 | 19 | ||||||
| Authorized shares: 1,600,000 |
||||||||
| Shares issued: 195,674 and 192,562 |
||||||||
| Shares outstanding: 113,729 and 116,886 |
||||||||
| Class B common stock $.0001 par value |
1 | 1 | ||||||
| Authorized shares: 400,000 |
||||||||
| Shares issued and outstanding: 12,800 and 12,800 |
||||||||
| Additional paid-in capital |
5,818,942 | 5,802,140 | ||||||
| Treasury stock - Common stock, at cost |
(3,934,942 | ) | (3,465,675 | ) | ||||
| Shares: 81,945 and 75,676 |
||||||||
| Retained earnings (deficit) |
31,802 | (209,218 | ) | |||||
| Accumulated other comprehensive income (loss) |
(31,035 | ) | 18,197 | |||||
|
|
|
|
|
|||||
| Total Expedia, Inc. stockholders’ equity |
1,884,788 | 2,145,464 | ||||||
| Non-redeemable noncontrolling interest |
117,091 | 113,521 | ||||||
|
|
|
|
|
|||||
| Total stockholders’ equity |
2,001,879 | 2,258,985 | ||||||
|
|
|
|
|
|||||
| TOTAL LIABILITIES AND STOCKHOLDERS’ EQUITY |
$ | 9,424,988 | $ | 7,739,481 | ||||
|
|
|
|
|
|||||
Page 7 of 15
EXPEDIA, INC.
CONSOLIDATED STATEMENTS OF CASH FLOWS
(In thousands)
(Unaudited)
| Nine months ended September 30, |
||||||||
| 2014 | 2013 | |||||||
| Operating activities: |
||||||||
| Net income |
$ | 316,671 | $ | 122,371 | ||||
| Adjustments to reconcile net income to net cash provided by operating activities: |
||||||||
| Depreciation of property and equipment, including internal-use software and website development |
195,161 | 152,970 | ||||||
| Amortization of stock-based compensation |
68,139 | 109,203 | ||||||
| Amortization of intangible assets |
55,275 | 49,921 | ||||||
| Deferred income taxes |
(27,371 | ) | 2,863 | |||||
| Foreign exchange (gain) loss on cash, cash equivalents and short-term investments, net |
44,484 | 53,199 | ||||||
| Realized (gain) loss on foreign currency forwards |
11,267 | (40,228 | ) | |||||
| Other |
4,919 | 8,772 | ||||||
| Changes in operating assets and liabilities, net of effects from acquisitions: |
||||||||
| Accounts receivable |
(277,056 | ) | (210,118 | ) | ||||
| Prepaid expenses and other current assets |
(55,810 | ) | (14,226 | ) | ||||
| Accounts payable, merchant |
226,362 | 257,016 | ||||||
| Accounts payable, other, accrued expenses and other current liabilities |
289,525 | (49,299 | ) | |||||
| Taxes payable/receivable, net |
3,704 | (31,745 | ) | |||||
| Deferred merchant bookings |
694,830 | 547,988 | ||||||
| Deferred revenue |
16,702 | 16,728 | ||||||
|
|
|
|
|
|||||
| Net cash provided by operating activities from continuing operations |
1,566,802 | 975,415 | ||||||
|
|
|
|
|
|||||
| Investing activities: |
||||||||
| Capital expenditures, including internal-use software and website development |
(239,678 | ) | (235,416 | ) | ||||
| Purchases of investments |
(1,044,665 | ) | (1,139,157 | ) | ||||
| Sales and maturities of investments |
957,347 | 1,338,062 | ||||||
| Acquisitions, net of cash acquired |
(25,177 | ) | (540,489 | ) | ||||
| Net settlement of foreign currency forwards |
(11,267 | ) | 40,228 | |||||
| Other, net |
2,188 | (177 | ) | |||||
|
|
|
|
|
|||||
| Net cash used in investing activities from continuing operations |
(361,252 | ) | (536,949 | ) | ||||
|
|
|
|
|
|||||
| Financing activities: |
||||||||
| Proceeds from issuance of long-term debt, net of issuance costs |
493,630 | — | ||||||
| Purchases of treasury stock |
(469,267 | ) | (355,689 | ) | ||||
| Proceeds from issuance of treasury stock |
— | 25,273 | ||||||
| Payment of dividends to stockholders |
(61,777 | ) | (56,080 | ) | ||||
| Proceeds from exercise of equity awards and employee stock purchase plan |
79,490 | 42,693 | ||||||
| Excess tax benefit on equity awards |
38,352 | 33,368 | ||||||
| Other, net |
(1,591 | ) | (9,920 | ) | ||||
|
|
|
|
|
|||||
| Net cash provided by (used in) financing activities from continuing operations |
78,837 | (320,355 | ) | |||||
|
|
|
|
|
|||||
| Net cash provided by continuing operations |
1,284,387 | 118,111 | ||||||
| Net cash provided by discontinued operations |
— | 13,637 | ||||||
| Effect of exchange rate changes on cash and cash equivalents |
(52,672 | ) | (30,411 | ) | ||||
|
|
|
|
|
|||||
| Net increase in cash and cash equivalents |
1,231,715 | 101,337 | ||||||
| Cash and cash equivalents at beginning of period |
1,021,033 | 1,293,161 | ||||||
|
|
|
|
|
|||||
| Cash and cash equivalents at end of period |
$ | 2,252,748 | $ | 1,394,498 | ||||
|
|
|
|
|
|||||
| Supplemental cash flow information |
||||||||
| Cash paid for interest from continuing operations |
$ | 86,349 | $ | 83,659 | ||||
| Income tax payments, net from continuing operations |
42,428 | 52,550 | ||||||
Page 8 of 15
Expedia, Inc.
Trended Metrics
(All figures in millions)
| • | The following metrics are intended as a supplement to the financial statements found in this release and in our filings with the SEC. In the event of discrepancies between amounts in these tables and our historical financial statements, readers should rely on our filings with the SEC and financial statements in our most recent earnings release. |
| • | We intend to periodically review and refine the definition, methodology and appropriateness of each of our supplemental metrics. As a result, metrics are subject to removal and/or change, and such changes could be material. |
| • | These metrics do not include adjustments for one-time items, acquisitions, foreign exchange or other adjustments. |
| • | Some numbers may not add due to rounding. |
| 2012 | 2013 | 2014 | Y / Y | |||||||||||||||||||||||||||||||||||||
| Q3 | Q4 | Q1 | Q2 | Q3 | Q4 | Q1 | Q2 | Q3 | Growth | |||||||||||||||||||||||||||||||
| Gross Bookings by Segment |
||||||||||||||||||||||||||||||||||||||||
| Leisure |
$ | 8,120 | $ | 6,571 | $ | 8,664 | $ | 8,933 | $ | 9,312 | $ | 8,000 | $ | 11,315 | $ | 11,718 | $ | 12,185 | 31 | % | ||||||||||||||||||||
| Egencia |
936 | 955 | 1,117 | 1,188 | 1,125 | 1,104 | 1,310 | 1,328 | 1,285 | 14 | % | |||||||||||||||||||||||||||||
|
|
|
|
|
|
|
|
|
|
|
|
|
|
|
|
|
|
|
|
|
|||||||||||||||||||||
| Total |
$ | 9,056 | $ | 7,526 | $ | 9,781 | $ | 10,121 | $ | 10,437 | $ | 9,104 | $ | 12,624 | $ | 13,046 | $ | 13,470 | 29 | % | ||||||||||||||||||||
| Gross Bookings by Geography |
||||||||||||||||||||||||||||||||||||||||
| Domestic |
$ | 5,155 | $ | 4,201 | $ | 5,484 | $ | 5,848 | $ | 5,828 | $ | 4,982 | $ | 7,427 | $ | 7,889 | $ | 7,861 | 35 | % | ||||||||||||||||||||
| International |
3,902 | 3,324 | 4,297 | 4,273 | 4,609 | 4,122 | 5,197 | 5,157 | 5,609 | 22 | % | |||||||||||||||||||||||||||||
|
|
|
|
|
|
|
|
|
|
|
|
|
|
|
|
|
|
|
|
|
|||||||||||||||||||||
| Total |
$ | 9,056 | $ | 7,526 | $ | 9,781 | $ | 10,121 | $ | 10,437 | $ | 9,104 | $ | 12,624 | $ | 13,046 | $ | 13,470 | 29 | % | ||||||||||||||||||||
| Gross Bookings by Agency/Merchant |
||||||||||||||||||||||||||||||||||||||||
| Agency |
$ | 4,706 | $ | 4,165 | $ | 5,270 | $ | 5,466 | $ | 5,701 | $ | 5,248 | $ | 7,326 | $ | 7,525 | $ | 7,596 | 33 | % | ||||||||||||||||||||
| Merchant |
4,350 | 3,361 | 4,511 | 4,655 | 4,736 | 3,856 | 5,299 | 5,520 | 5,874 | 24 | % | |||||||||||||||||||||||||||||
|
|
|
|
|
|
|
|
|
|
|
|
|
|
|
|
|
|
|
|
|
|||||||||||||||||||||
| Total |
$ | 9,056 | $ | 7,526 | $ | 9,781 | $ | 10,121 | $ | 10,437 | $ | 9,104 | $ | 12,624 | $ | 13,046 | $ | 13,470 | 29 | % | ||||||||||||||||||||
| Revenue |
||||||||||||||||||||||||||||||||||||||||
| Leisure |
$ | 1,121 | $ | 890 | $ | 924 | $ | 1,110 | $ | 1,316 | $ | 1,056 | $ | 1,100 | $ | 1,392 | $ | 1,616 | 23 | % | ||||||||||||||||||||
| Egencia |
78 | 85 | 89 | 95 | 85 | 96 | 100 | 103 | 97 | 13 | % | |||||||||||||||||||||||||||||
|
|
|
|
|
|
|
|
|
|
|
|
|
|
|
|
|
|
|
|
|
|||||||||||||||||||||
| Total |
$ | 1,199 | $ | 975 | $ | 1,012 | $ | 1,205 | $ | 1,402 | $ | 1,152 | $ | 1,200 | $ | 1,495 | $ | 1,713 | 22 | % | ||||||||||||||||||||
| Revenue by Geography |
||||||||||||||||||||||||||||||||||||||||
| Domestic |
$ | 642 | $ | 511 | $ | 558 | $ | 664 | $ | 742 | $ | 583 | $ | 642 | $ | 789 | $ | 888 | 20 | % | ||||||||||||||||||||
| International |
557 | 464 | 454 | 541 | 660 | 569 | 559 | 706 | 824 | 25 | % | |||||||||||||||||||||||||||||
|
|
|
|
|
|
|
|
|
|
|
|
|
|
|
|
|
|
|
|
|
|||||||||||||||||||||
| Total |
$ | 1,199 | $ | 975 | $ | 1,012 | $ | 1,205 | $ | 1,402 | $ | 1,152 | $ | 1,200 | $ | 1,495 | $ | 1,713 | 22 | % | ||||||||||||||||||||
| Revenue by Agency/ Merchant/Advertising |
||||||||||||||||||||||||||||||||||||||||
| Agency |
$ | 235 | $ | 212 | $ | 234 | $ | 270 | $ | 330 | $ | 293 | $ | 329 | $ | 397 | $ | 477 | 45 | % | ||||||||||||||||||||
| Merchant |
930 | 730 | 733 | 855 | 963 | 774 | 772 | 975 | 1,095 | 14 | % | |||||||||||||||||||||||||||||
| Advertising & Media |
35 | 33 | 46 | 80 | 109 | 84 | 99 | 123 | 141 | 29 | % | |||||||||||||||||||||||||||||
|
|
|
|
|
|
|
|
|
|
|
|
|
|
|
|
|
|
|
|
|
|||||||||||||||||||||
| Total |
$ | 1,199 | $ | 975 | $ | 1,012 | $ | 1,205 | $ | 1,402 | $ | 1,152 | $ | 1,200 | $ | 1,495 | $ | 1,713 | 22 | % | ||||||||||||||||||||
| Adjusted EBITDA |
||||||||||||||||||||||||||||||||||||||||
| Leisure |
$ | 357 | $ | 262 | $ | 178 | $ | 265 | $ | 419 | $ | 315 | $ | 181 | $ | 342 | $ | 495 | 18 | % | ||||||||||||||||||||
| Unallocated Overhead Costs |
(76 | ) | (90 | ) | (85 | ) | (91 | ) | (91 | ) | (91 | ) | (91 | ) | (100 | ) | (101 | ) | 12 | % | ||||||||||||||||||||
|
|
|
|
|
|
|
|
|
|
|
|
|
|
|
|
|
|
|
|
|
|||||||||||||||||||||
| Subtotal |
$ | 281 | $ | 172 | $ | 93 | $ | 174 | $ | 328 | $ | 224 | $ | 90 | $ | 242 | $ | 393 | 20 | % | ||||||||||||||||||||
| Egencia |
12 | 13 | 12 | 18 | 11 | 18 | 16 | 17 | 16 | 37 | % | |||||||||||||||||||||||||||||
|
|
|
|
|
|
|
|
|
|
|
|
|
|
|
|
|
|
|
|
|
|||||||||||||||||||||
| Total |
$ | 294 | $ | 185 | $ | 105 | $ | 192 | $ | 340 | $ | 242 | $ | 107 | $ | 259 | $ | 409 | 20 | % | ||||||||||||||||||||
| Worldwide Hotel (Merchant & Agency) |
||||||||||||||||||||||||||||||||||||||||
| Room Nights |
36.7 | 29.7 | 29.0 | 35.9 | 44.1 | 37.1 | 35.9 | 45.9 | 54.5 | |||||||||||||||||||||||||||||||
| Room Night Growth |
27 | % | 33 | % | 28 | % | 19 | % | 20 | % | 25 | % | 24 | % | 28 | % | 24 | % | ||||||||||||||||||||||
| Domestic Room Night Growth |
18 | % | 19 | % | 15 | % | 11 | % | 12 | % | 18 | % | 20 | % | 24 | % | 24 | % | ||||||||||||||||||||||
| International Room Night Growth |
37 | % | 49 | % | 43 | % | 29 | % | 28 | % | 31 | % | 27 | % | 31 | % | 24 | % | ||||||||||||||||||||||
| ADR Growth |
-3 | % | -3 | % | 0 | % | 0 | % | 0 | % | 0 | % | 1 | % | 2 | % | 5 | % | ||||||||||||||||||||||
| Revenue per Night Growth |
-6 | % | -6 | % | -3 | % | -6 | % | -7 | % | -9 | % | -10 | % | -4 | % | -2 | % | ||||||||||||||||||||||
| Revenue Growth |
20 | % | 25 | % | 24 | % | 12 | % | 11 | % | 13 | % | 12 | % | 23 | % | 21 | % | ||||||||||||||||||||||
| Worldwide Air (Merchant & Agency) |
||||||||||||||||||||||||||||||||||||||||
| Tickets Sold Growth |
11 | % | 12 | % | 9 | % | 7 | % | 7 | % | 13 | % | 30 | % | 28 | % | 30 | % | ||||||||||||||||||||||
| Airfare Growth |
1 | % | 2 | % | 0 | % | 0 | % | 3 | % | 1 | % | 1 | % | 3 | % | 0 | % | ||||||||||||||||||||||
| Revenue per Ticket Growth |
-19 | % | -2 | % | 5 | % | 1 | % | 9 | % | 3 | % | -2 | % | -5 | % | -7 | % | ||||||||||||||||||||||
| Revenue Growth |
-10 | % | 10 | % | 14 | % | 8 | % | 16 | % | 17 | % | 28 | % | 22 | % | 21 | % | ||||||||||||||||||||||
Notes:
The metrics above exclude results from the joint venture between Brand Expedia and AirAsia.
The metrics above include VIA Travel following our acquisition on April 27, 2012 and trivago GmbH following our acquisition of a controlling interest on March 8, 2013. VIA Travel and trivago GmbH are recorded within the Egencia and Leisure segments, respectively.
Advertising & Media Revenue includes revenue from trivago GmbH. All trivago GmbH revenue is classified as international.
Beginning in Q1 2014, Expedia moved to a new Enterprise Accounting System of Record, which caused immaterial changes to some of the metrics above due to remapping.
Page 9 of 15
Notes & Definitions:
Gross Bookings – Total retail value of transactions booked for both agency and merchant transactions, recorded at the time of booking. Bookings include the total price due for travel, including taxes, fees and other charges, and are generally reduced for cancellations and refunds.
Leisure – Reflects results for travel products and services provided to customers of our leisure travel sites including Expedia branded sites, Hotels.com branded sites, Hotwire.com, the Expedia Affiliate Network, trivago, eLong and other leisure brands.
Egencia – Reflects worldwide results for our managed corporate travel business.
Corporate – Includes unallocated corporate expenses.
Worldwide Hotel metrics – Reported on a stayed basis, and include both merchant and agency model hotel stays.
Worldwide Air metrics – Reported on a booked basis and includes both merchant and agency air bookings.
Definitions of Non-GAAP Measures
Expedia, Inc. reports Adjusted EBITDA, Adjusted Net Income, Adjusted EPS, Free Cash Flow and Adjusted Expenses (non-GAAP cost of revenue, non-GAAP selling and marketing, non-GAAP technology and content and non-GAAP general and administrative), all of which are supplemental measures to GAAP and are defined by the SEC as non-GAAP financial measures. These measures are among the primary metrics by which management evaluates the performance of the business and on which internal budgets are based. Management believes that investors should have access to the same set of tools that management uses to analyze our results. These non-GAAP measures should be considered in addition to results prepared in accordance with GAAP, but should not be considered a substitute for or superior to GAAP. Adjusted EBITDA, Adjusted Net Income, Adjusted EPS have certain limitations in that they do not take into account the impact of certain expenses to our consolidated statements of operations. We endeavor to compensate for the limitation of the non-GAAP measures presented by also providing the most directly comparable GAAP measures and descriptions of the reconciling items and adjustments to derive the non-GAAP measures. Adjusted EBITDA, Adjusted Net Income and Adjusted EPS also exclude certain items related to transactional tax matters, which may ultimately be settled in cash, and we urge investors to review the detailed disclosure regarding these matters in the Management Discussion and Analysis, Legal Proceedings sections, as well as the notes to the financial statements, included in the Company’s annual and quarterly reports filed with the Securities and Exchange Commission. The non-GAAP financial measures used by the Company may be calculated differently from, and therefore may not be comparable to, similarly titled measures used by other companies. The definition of Adjusted Net Income was revised in the fourth quarters of 2010, 2011 and 2012 and the definition for Adjusted Earnings Before Interest, Taxes, Depreciation and Amortization was revised in the fourth quarter of 2012. The definition of Adjusted Expenses was revised in the first quarter of 2014.
Adjusted EBITDA is defined as operating income / (loss) plus: (1) stock-based compensation expense, including compensation expense related to certain subsidiary equity plans; (2) acquisition-related impacts, including (i) amortization of intangible assets and goodwill and intangible asset impairment, (ii) gains (losses) recognized on changes in the value of contingent consideration arrangements; and (iii) upfront consideration paid to settle employee compensation plans of the acquiree; (3) certain infrequently occurring items, including restructuring; (4) items included in Legal reserves, occupancy tax and other, which includes reserves for potential settlement of issues related to transactional taxes (e.g. hotel and excise taxes), related to court decisions and final settlements, and charges incurred, if any, for monies that may be required to be paid in advance of litigation in certain transactional tax proceedings; (5) gains (losses) realized on revenue hedging activities that are included in other, net; and (6) depreciation.
The above items are excluded from our Adjusted EBITDA measure because these items are noncash in nature, or because the amount and timing of these items is unpredictable, not driven by core operating results and renders comparisons with prior periods and competitors less meaningful. We believe Adjusted EBITDA is a useful measure for analysts and investors to evaluate our future on-going performance as this measure allows a more meaningful comparison of our performance and projected cash earnings with our historical results from prior periods and to the results of our competitors. Moreover, our management uses this measure internally to evaluate the performance of our business as a whole and our individual business segments. In addition, we believe that by excluding certain items, such as stock-based compensation and acquisition-related impacts, Adjusted EBITDA corresponds more closely to the cash operating income generated from our business and allows investors to gain an understanding of the factors and trends affecting the ongoing cash earnings capabilities of our business, from which capital investments are made and debt is serviced.
Page 10 of 15
Adjusted Net Income generally captures all items on the statements of operations that occur in normal course operations and have been, or ultimately will be, settled in cash and is defined as net income/(loss) attributable to Expedia, Inc. plus net of tax: (1) stock-based compensation expense, including compensation expense related to equity plans of certain subsidiaries and equity-method investments; (2) acquisition-related impacts, including (i) amortization of intangible assets, including as part of equity-method investments, and goodwill and intangible asset impairment, (ii) gains (losses) recognized on changes in the value of contingent consideration arrangements, and (iii) upfront consideration paid to settle employee compensation plans of the acquiree and (iv) gains (losses) recognized on noncontrolling investment basis adjustments when we acquire controlling interests; (3) currency gains or losses on U.S. dollar denominated cash or investments held by eLong; (4) certain other infrequently occurring items, including restructuring charges; (5) items included in Legal reserves, occupancy tax and other, which includes reserves for potential settlement of issues related to transactional taxes (e.g., hotel occupancy and excise taxes), related court decisions and final settlements, and charges incurred, if any, for monies that may be required to be paid in advance of litigation in certain transactional tax proceedings; (6) discontinued operations; (7) the noncontrolling interest impact of the aforementioned adjustment items and (8) unrealized gains (losses) on revenue hedging activities that are included in other, net. We believe Adjusted Net Income is useful to investors because it represents Expedia, Inc.’s combined results, taking into account depreciation, which management believes is an ongoing cost of doing business, but excluding the impact of certain expenses, infrequently occurring items and items not directly tied to the core operations of our businesses.
Adjusted EPS is defined as Adjusted Net Income divided by adjusted weighted average shares outstanding, which include dilution from options per the treasury stock method and include all shares relating to RSUs in shares outstanding for Adjusted EPS. This differs from the GAAP method for including RSUs, which treats them on a treasury method basis. Shares outstanding for Adjusted EPS purposes are therefore higher than shares outstanding for GAAP EPS purposes. We believe Adjusted EPS is useful to investors because it represents, on a per share basis, Expedia’s consolidated results, taking into account depreciation, which we believe is an ongoing cost of doing business, as well as other items which are not allocated to the operating businesses such as interest expense, taxes, foreign exchange gains or losses, and minority interest, but excluding the effects of certain expenses not directly tied to the core operations of our businesses. Adjusted Net Income and Adjusted EPS have similar limitations as Adjusted EBITDA. In addition, Adjusted Net Income does not include all items that affect our net income / (loss) and net income / (loss) per share for the period. Therefore, we think it is important to evaluate these measures along with our consolidated statements of operations.
Free Cash Flow is defined as net cash flow provided by operating activities less capital expenditures. Management believes Free Cash Flow is useful to investors because it represents the operating cash flow that our operating businesses generate, less capital expenditures but before taking into account other cash movements that are not directly tied to the core operations of our businesses, such as financing activities, foreign exchange or certain investing activities. Free Cash Flow has certain limitations in that it does not represent the total increase or decrease in the cash balance for the period, nor does it represent the residual cash flow for discretionary expenditures. Therefore, it is important to evaluate Free Cash Flow along with the consolidated statements of cash flows.
Adjusted Expenses (cost of revenue, selling and marketing, technology and content and general and administrative expenses) exclude stock-based compensation related to expenses for stock options, restricted stock units and other equity compensation under applicable stock-based compensation accounting standards as well as depreciation expense. Expedia, Inc. excludes stock-based compensation and depreciation expenses from these measures primarily because they are non-cash expenses that we do not believe are necessarily reflective of our ongoing cash operating expenses and cash operating income. Moreover, because of varying available valuation methodologies, subjective assumptions and the variety of award types that companies can use when adopting applicable stock-based compensation accounting standards, management believes that providing non-GAAP financial measures that exclude stock-based compensation allows investors to make meaningful comparisons between our recurring core business operating results and those of other companies, as well as providing management with an important tool for financial operational decision making and for evaluating our own recurring core business operating results over different periods of time. Exclusion of depreciation expense also allows the year-over-year comparison of expenses on a basis that is consistent with the year-over-year comparison of Adjusted EBITDA. There are certain limitations in using financial measures that do not take into account stock-based compensation and depreciation expense, including the fact that stock-based compensation is a recurring expense and a valued part of employees’ compensation and depreciation expense is also a recurring expense and is a direct result of previous capital investment decisions made by management. Therefore it is important to evaluate both our GAAP and non-GAAP measures. See the Notes to the Consolidated Statements of Operations for stock-based compensation and depreciation expense by line item.
Page 11 of 15
Tabular Reconciliations for Non-GAAP Measures
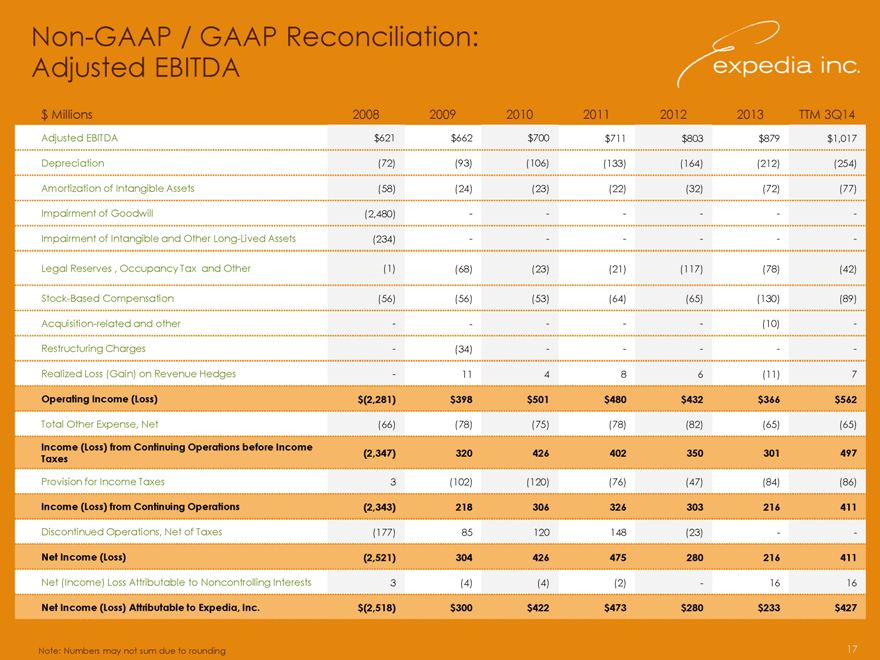
Adjusted EBITDA (Adjusted Earnings Before Interest, Taxes, Depreciation & Amortization)
| Three months ended September 30, |
Nine months ended September 30, |
|||||||||||||||
| 2014 | 2013 | 2014 | 2013 | |||||||||||||
| (In thousands) | ||||||||||||||||
| Adjusted EBITDA |
$ | 409,070 | $ | 339,897 | $ | 775,097 | $ | 636,727 | ||||||||
| Depreciation |
(67,469 | ) | (52,965 | ) | (195,161 | ) | (152,970 | ) | ||||||||
| Amortization of intangible assets |
(18,519 | ) | (18,514 | ) | (55,275 | ) | (49,921 | ) | ||||||||
| Stock-based compensation |
(22,304 | ) | (18,039 | ) | (68,139 | ) | (109,203 | ) | ||||||||
| Legal reserves, occupancy tax and other |
(3,888 | ) | (6,874 | ) | (38,843 | ) | (74,678 | ) | ||||||||
| Acquisition-related and other |
— | — | — | (9,829 | ) | |||||||||||
| Realized (gain) loss on revenue hedges |
(54 | ) | (4,814 | ) | 5,379 | (12,777 | ) | |||||||||
|
|
|
|
|
|
|
|
|
|||||||||
| Operating income |
296,836 | 238,691 | 423,058 | 227,349 | ||||||||||||
| Interest expense, net |
(17,483 | ) | (15,324 | ) | (48,927 | ) | (45,506 | ) | ||||||||
| Other, net |
10,172 | (11,287 | ) | 2,514 | (1,611 | ) | ||||||||||
|
|
|
|
|
|
|
|
|
|||||||||
| Income before income taxes |
289,525 | 212,080 | 376,645 | 180,232 | ||||||||||||
| Provision for income taxes |
(38,904 | ) | (45,356 | ) | (59,974 | ) | (57,861 | ) | ||||||||
|
|
|
|
|
|
|
|
|
|||||||||
| Net income |
250,621 | 166,724 | 316,671 | 122,371 | ||||||||||||
| Net loss attributable to noncontrolling interests |
6,438 | 4,135 | 15,457 | 15,762 | ||||||||||||
|
|
|
|
|
|
|
|
|
|||||||||
| Net income attributable to Expedia, Inc. |
$ | 257,059 | $ | 170,859 | $ | 332,128 | $ | 138,133 | ||||||||
|
|
|
|
|
|
|
|
|
|||||||||
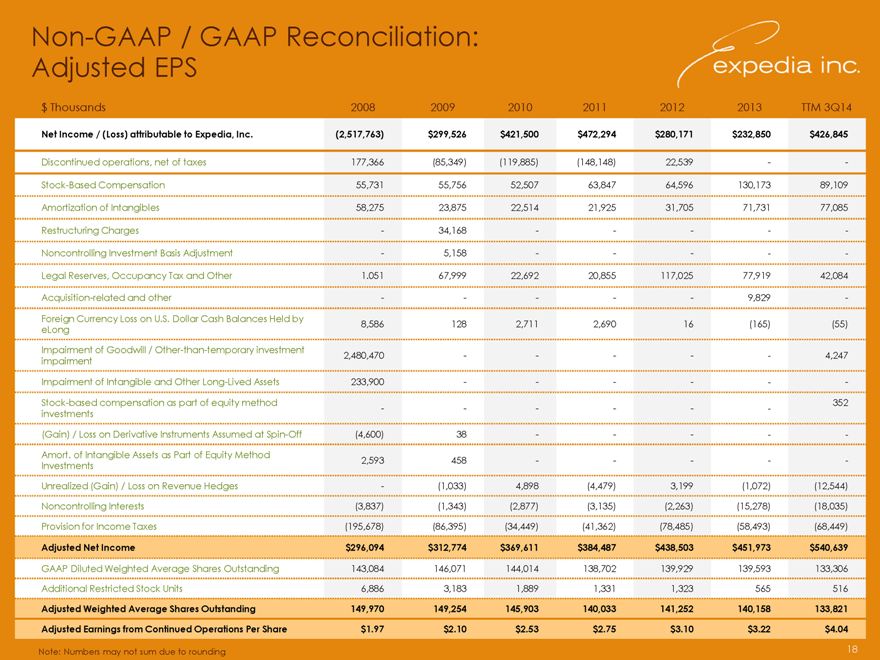
Adjusted Net Income & Adjusted EPS
| Three months ended September 30, |
Nine months ended September 30, |
|||||||||||||||
| 2014 | 2013 | 2014 | 2013 | |||||||||||||
| (In thousands) | ||||||||||||||||
| Net income attributable to Expedia, Inc. |
$ | 257,059 | $ | 170,859 | $ | 332,128 | $ | 138,133 | ||||||||
| Amortization of intangible assets |
18,519 | 18,514 | 55,275 | 49,921 | ||||||||||||
| Stock-based compensation |
22,304 | 18,039 | 68,139 | 109,203 | ||||||||||||
| Legal reserves, occupancy tax and other |
3,888 | 6,874 | 38,843 | 74,678 | ||||||||||||
| Acquisition-related and other |
— | — | — | 9,829 | ||||||||||||
| Foreign currency (gain) loss on U.S. dollar cash balances held by eLong |
272 | 49 | (16 | ) | (126 | ) | ||||||||||
| Unrealized (gain) loss on revenue hedges |
(14,914 | ) | 13,555 | (9,835 | ) | 1,637 | ||||||||||
| Stock-based compensation as part of equity method investments |
74 | 33 | 219 | 99 | ||||||||||||
| Provision for income taxes |
(26,454 | ) | (23,088 | ) | (55,612 | ) | (45,656 | ) | ||||||||
| Noncontrolling interests |
(4,738 | ) | (3,890 | ) | (14,015 | ) | (11,258 | ) | ||||||||
|
|
|
|
|
|
|
|
|
|||||||||
| Adjusted Net Income |
$ | 256,010 | $ | 200,945 | $ | 415,126 | $ | 326,460 | ||||||||
|
|
|
|
|
|
|
|
|
|||||||||
| GAAP diluted weighted average shares outstanding |
132,274 | 140,451 | 133,683 | 141,202 | ||||||||||||
| Additional dilutive securities |
230 | 461 | 246 | 644 | ||||||||||||
|
|
|
|
|
|
|
|
|
|||||||||
| Adjusted weighted average shares outstanding |
132,504 | 140,912 | 133,929 | 141,846 | ||||||||||||
|
|
|
|
|
|
|
|
|
|||||||||
| Diluted earnings per share |
$ | 1.94 | $ | 1.22 | $ | 2.48 | $ | 0.98 | ||||||||
| Adjusted earnings per share |
1.93 | 1.43 | 3.10 | 2.30 | ||||||||||||
Page 12 of 15
Free Cash Flow
| Three months ended September 30, |
Nine months ended September 30, |
Trailing twelve months ended, September 30, |
||||||||||||||||||||||
| 2014 | 2013 | 2014 | 2013 | 2014 | 2013 | |||||||||||||||||||
| (In thousands) | ||||||||||||||||||||||||
| Net cash provided by operating activities |
$ | 101,860 | $ | (224,193 | ) | $ | 1,566,802 | $ | 975,415 | $ | 1,354,587 | $ | 758,689 | |||||||||||
| Less: capital expenditures |
(82,465 | ) | (77,576 | ) | (239,678 | ) | (235,416 | ) | (312,843 | ) | (294,133 | ) | ||||||||||||
|
|
|
|
|
|
|
|
|
|
|
|
|
|||||||||||||
| Free cash flow |
$ | 19,395 | $ | (301,769 | ) | $ | 1,327,124 | $ | 739,999 | $ | 1,041,744 | $ | 464,556 | |||||||||||
|
|
|
|
|
|
|
|
|
|
|
|
|
|||||||||||||
Adjusted Expenses (cost of revenue, selling and marketing, technology and content and general and administrative expenses)
| Three months ended September 30, |
Nine months ended September 30, |
|||||||||||||||
| 2014 | 2013 | 2014 | 2013 | |||||||||||||
| (in thousands) | ||||||||||||||||
| Cost of revenue |
$ | 299,708 | $ | 276,318 | $ | 894,828 | $ | 789,506 | ||||||||
| Less: stock-based compensation |
(1,045 | ) | (887 | ) | (3,190 | ) | (2,712 | ) | ||||||||
| Less: depreciation |
(9,217 | ) | (8,519 | ) | (25,554 | ) | (25,629 | ) | ||||||||
|
|
|
|
|
|
|
|
|
|||||||||
| Adjusted cost of revenue |
$ | 289,446 | $ | 266,912 | $ | 866,084 | $ | 761,165 | ||||||||
| Selling and marketing expense |
$ | 815,800 | $ | 625,296 | $ | 2,184,115 | $ | 1,711,919 | ||||||||
| Less: stock-based compensation |
(3,643 | ) | (3,943 | ) | (13,798 | ) | (11,857 | ) | ||||||||
| Less: depreciation |
(2,086 | ) | (1,676 | ) | (5,757 | ) | (4,665 | ) | ||||||||
|
|
|
|
|
|
|
|
|
|||||||||
| Adjusted selling and marketing expense |
$ | 810,071 | $ | 619,677 | $ | 2,164,560 | $ | 1,695,397 | ||||||||
| Technology and content expense |
$ | 172,754 | $ | 143,816 | $ | 504,804 | $ | 422,781 | ||||||||
| Less: stock-based compensation |
(7,374 | ) | (5,372 | ) | (17,892 | ) | (15,459 | ) | ||||||||
| Less: depreciation |
(54,129 | ) | (40,942 | ) | (157,890 | ) | (117,312 | ) | ||||||||
|
|
|
|
|
|
|
|
|
|||||||||
| Adjusted technology and content expense |
$ | 111,251 | $ | 97,502 | $ | 329,022 | $ | 290,010 | ||||||||
| General and administrative expense |
$ | 104,999 | $ | 92,351 | $ | 306,584 | $ | 276,618 | ||||||||
| Less: stock-based compensation |
(10,242 | ) | (7,837 | ) | (33,259 | ) | (22,532 | ) | ||||||||
| Less: depreciation |
(2,037 | ) | (1,828 | ) | (5,960 | ) | (5,364 | ) | ||||||||
|
|
|
|
|
|
|
|
|
|||||||||
| Adjusted general and administrative expense |
$ | 92,720 | $ | 82,686 | $ | 267,365 | $ | 248,722 | ||||||||
Conference Call
Expedia, Inc. will webcast a conference call to discuss third quarter 2014 financial results and certain forward-looking information on Thursday, October 30, 2014 at 1:30 p.m. Pacific Time (PT). The webcast will be open to the public and available via http://ir.expediainc.com. Expedia, Inc. expects to maintain access to the webcast on the IR website for approximately three months subsequent to the initial broadcast.
Safe Harbor Statement Under the Private Securities Litigation Reform Act of 1995
This release contains “forward-looking statements” within the meaning of the Private Securities Litigation Reform Act of 1995. These statements are not guarantees of future performance. These forward-looking statements are based on management’s expectations as of October 30, 2014 and assumptions which are inherently subject to uncertainties, risks and changes in circumstances that are difficult to predict. The use of words such as “intends” and “expects,” among others, generally identify forward-looking statements. However, these words are not the exclusive means of identifying such statements. In addition, any statements that refer to expectations, projections or other characterizations of future events or circumstances are forward-looking statements and may include statements relating to future revenues, expenses, margins, profitability, net income / (loss), earnings per share and other measures of results of operations and the prospects for future growth of Expedia, Inc.’s business.
Page 13 of 15
Actual results and the timing and outcome of events may differ materially from those expressed or implied in the forward-looking statements for a variety of reasons, including, among others:
| • | an increasingly competitive global environment; |
| • | modifications to our current business models and practices or our adoption of new business models or practices in order to compete; |
| • | changes in search engine algorithms and dynamics or other traffic-generating arrangements; |
| • | declines or disruptions in the travel industry; |
| • | our failure to maintain and expand our relationships and contractual agreements with travel suppliers or travel distribution partners; |
| • | our failure to maintain and expand our brand awareness or increased costs to do so; |
| • | our failure to adapt to technological developments or industry trends; |
| • | risks relating to our operations in international markets, including China; |
| • | adverse application of existing tax or unclaimed property laws, rules or regulations or implementation of new unfavorable laws, rules or regulations; |
| • | adverse outcomes in legal proceedings to which we are a party; |
| • | our failure to comply with current laws, rules and regulations, or changes to such laws, rules and regulations; |
| • | determinations by U.S. and foreign tax authorities regarding our worldwide tax provision for income taxes; |
| • | payments related risks, including credit card fraud; |
| • | volatility in our stock price; |
| • | liquidity constraints or our inability to access the capital markets when necessary; |
| • | interruption or lack of redundancy in our information systems; |
| • | failure to retain or motivate key personnel or hire, retain and motivate qualified personnel, including senior management; |
| • | changes in control of the Company; |
| • | management and director conflicts of interest; |
| • | risks related to actions taken by our business partners and third party service providers, including failure to comply with our requirements or standards or the requirements or standards of governmental authorities, or any cessation of their operations; |
| • | risks related to the failure of counterparties to perform on financial obligations; |
| • | fluctuations in foreign exchange rates; |
| • | our failure to comply with governmental regulation and other legal obligations related to our processing, storage, use and disclosure of personal data, and liabilities related to security breaches; |
| • | risks related to our acquisitions, investments or significant commercial arrangements; |
| • | risks related to our long-term indebtedness; |
| • | our failure to effectively operate our businesses due to restrictive covenants in the agreements governing our indebtedness; |
| • | our failure to protect our intellectual property from copying or use by others, including competitors; |
as well as other risks detailed in our public filings with the SEC, including our quarterly report on Form 10-Q for the quarter ended September 30, 2014. Except as required by law, we undertake no obligation to update any forward-looking or other statements in this release, whether as a result of new information, future events or otherwise.
About Expedia, Inc.
Expedia, Inc. (NASDAQ: EXPE) is one of the world’s largest travel companies, with an extensive brand portfolio that includes leading online travel brands, such as:
| • | Expedia.com®, the world’s largest full service online travel agency with localized sites in 31 countries |
| • | Hotels.com®, the hotel specialist with localized sites in more than 60 countries |
| • | Hotwire®, a leading discount travel site that offers opaque deals in 12 countries throughout North America, Europe and Asia |
| • | Egencia®, the world’s fifth largest corporate travel management company |
| • | eLong™, a leading mobile and online travel service provider in China |
| • | Venere.com™, the online hotel reservation specialist in Europe |
Page 14 of 15
| • | trivago®, a leading online hotel metasearch company with sites in 49 countries |
| • | Expedia Local Expert®, a provider of online and in-market concierge services, activities, experiences and ground transportation in hundreds of destinations worldwide |
| • | Classic Vacations®, a top luxury travel specialist |
| • | Expedia® CruiseShipCenters®, a provider of exceptional value and expert advice for travelers booking cruises and vacations through its network of 180 franchise locations across North America |
| • | CarRentals.com™, the premier car rental booking company on the web. |
The company delivers consumers value in leisure and business travel, drives incremental demand and direct bookings to travel suppliers, and provides advertisers the opportunity to reach a highly valuable audience of in-market consumers through Expedia Media Solutions. Expedia also powers bookings for some of the world’s leading airlines and hotels, top consumer brands, high traffic websites, and thousands of active affiliates through Expedia® Affiliate Network. For corporate and industry news and views, visit us at www.expediainc.com or follow us on Twitter @expediainc.
Trademarks and logos are the property of their respective owners. © 2014 Expedia, Inc. All rights reserved. CST: 2029030-50
Contacts
| Investor Relations | Communications | |
| (425) 679-3759 | (425) 679-4317 | |
| ir@expedia.com | press@expedia.com |
Page 15 of 15