22001187FTohuirthQQuuaarrteterr FFininaanncciaial lRReessuultlsts November 1, 2017 Feb ruary 13, 2019 NYSE: CF NYSE: CF 1

Safe harbor statement All statements in this communication by CF Industries Holdings, Inc. (together with its subsidiaries, the “Company”), other than those relating to historical facts, are forward-looking statements. Forward-looking statements can generally be identified by their use of terms such as “anticipate,” “believe,” “could,” “estimate,” “expect,” “intend,” “may,” “plan,” “predict,” “project,” “will” or “would” and similar terms and phrases, including references to assumptions. Forward-looking statements are not guarantees of future performance and are subject to a number of assumptions, risks and uncertainties, many of which are beyond the Company’s control, which could cause actual results to differ materially from such statements. These statements may include, but are not limited to, statements about strategic plans and statements about future financial and operating results. Important factors that could cause actual results to differ materially from those in the forward-looking statements include, among others, the cyclical nature of the Company’s business and the agricultural sector; the global commodity nature of the Company’s fertilizer products, the impact of global supply and demand on the Company’s selling prices, and the intense global competition from other fertilizer producers; conditions in the U.S. and European agricultural industry; the volatility of natural gas prices in North America and Europe; difficulties in securing the supply and delivery of raw materials, increases in their costs or delays or interruptions in their delivery; reliance on third party providers of transportation services and equipment; the significant risks and hazards involved in producing and handling the Company’s products against which the Company may not be fully insured; the Company’s ability to manage its indebtedness; operating and financial restrictions imposed on the Company by the agreements governing the Company’s senior secured indebtedness; risks associated with the Company’s incurrence of additional indebtedness; the Company's ability to maintain compliance with covenants under the agreements governing its indebtedness; downgrades of the Company’s credit ratings; risks associated with cyber security; weather conditions; risks associated with changes in tax laws and disagreements with taxing authorities; the Company’s reliance on a limited number of key facilities; potential liabilities and expenditures related to environmental, health and safety laws and regulations and permitting requirements; future regulatory restrictions and requirements related to greenhouse gas emissions; risks associated with expansions of the Company’s business, including unanticipated adverse consequences and the significant resources that could be required; the seasonality of the fertilizer business; the impact of changing market conditions on the Company’s forward sales programs; risks involving derivatives and the effectiveness of the Company’s risk measurement and hedging activities; risks associated with the operation or management of the strategic venture with CHS Inc. (the "CHS Strategic Venture"), risks and uncertainties relating to the market prices of the fertilizer products that are the subject of the supply agreement with CHS Inc. over the life of the supply agreement and the risk that any challenges related to the CHS Strategic Venture will harm the Company's other business relationships; risks associated with the Company’s Point Lisas Nitrogen Limited joint venture; acts of terrorism and regulations to combat terrorism; risks associated with international operations; and deterioration of global market and economic conditions. More detailed information about factors that may affect the Company’s performance and could cause actual results to differ materially from those in any forward-looking statements may be found in CF Industries Holdings, Inc.’s filings with the Securities and Exchange Commission, including CF Industries Holdings, Inc.’s most recent annual and quarterly reports on Form 10-K and Form 10-Q, which are available in the Investor Relations section of the Company’s website. Forward-looking statements are given only as of the date of this presentation and the Company disclaims any obligation to update or revise the forward-looking statements, whether as a result of new information, future events or otherwise, except as required by law. 2

Note regarding non-GAAP financial measures The company reports its financial results in accordance with U.S. generally accepted accounting principles (GAAP). Management believes that EBITDA and adjusted EBITDA which are non-GAAP financial measures, provide additional meaningful information regarding the company's performance and financial strength. Non-GAAP financial measures should be viewed in addition to, and not as an alternative for, the company's reported results prepared in accordance with GAAP. In addition, because not all companies use identical calculations, EBITDA and adjusted EBITDA included in this presentation may not be comparable to similarly titled measures of other companies. Reconciliations of EBITDA and adjusted EBITDA to the most directly comparable GAAP measures are provided in the tables accompanying this presentation. EBITDA is defined as net earnings (loss) attributable to common stockholders plus interest expense - net, income taxes, and depreciation and amortization. Other adjustments include the elimination of loan fee amortization that is included in both interest and amortization, and the portion of depreciation that is included in noncontrolling interests. The company has presented EBITDA because management uses the measure to track performance and believes that it is frequently used by securities analysts, investors and other interested parties in the evaluation of companies in the industry. Adjusted EBITDA is defined as EBITDA adjusted with the selected items included in EBITDA as summarized in the tables accompanying this presentation. The company has presented adjusted EBITDA because management uses adjusted EBITDA, and believes it is useful to investors, as a supplemental financial measure in the comparison of year-over-year performance. Cover Page: Bormann Farm – Iowa 3
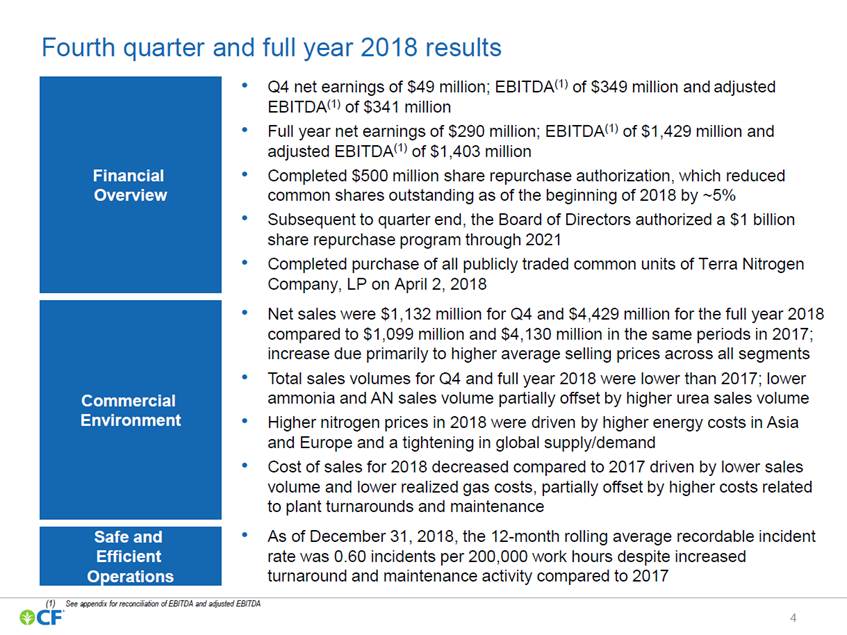
Fourth quarter and full year 2018 results Q4 net earnings of $49 million; EBITDA(1) of $349 million and adjusted EBITDA(1) of $341 million Full year net earnings of $290 million; EBITDA(1) of $1,429 million and adjusted EBITDA(1) of $1,403 million Completed $500 million share repurchase authorization, which reduced common shares outstanding as of the beginning of 2018 by ~5% Subsequent to quarter end, the Board of Directors authorized a $1 billion share repurchase program through 2021 Completed purchase of all publicly traded common units of Terra Nitrogen Company, LP on April 2, 2018 Net sales were $1,132 million for Q4 and $4,429 million for the full year 2018 compared to $1,099 million and $4,130 million in the same periods in 2017; increase due primarily to higher average selling prices across all segments Total sales volumes for Q4 and full year 2018 were lower than 2017; lower ammonia and AN sales volume partially offset by higher urea sales volume Higher nitrogen prices in 2018 were driven by higher energy costs in Asia and Europe and a tightening in global supply/demand Cost of sales for 2018 decreased compared to 2017 driven by lower sales volume and lower realized gas costs, partially offset by higher costs related to plant turnarounds and maintenance As of December 31, 2018, the 12-month rolling average recordable incident rate was 0.60 incidents per 200,000 work hours despite increased turnaround and maintenance activity compared to 2017 • • • • • • • • • • (1) See appendix for reconciliation of EBITDA and adjusted EBITDA 4 Safe and Efficient Operations Commercial Environment Financial Overview
Financial results - fourth quarter and full year 2018 465 290 358 49 common stockholders (1)(2) 234.1 233.8 233.9 230.6 outstanding (3) (13) 61 (2) natural gas derivatives (1) (3) (4) (5) Depreciation and amortization was $221 million and $888 million for the three and twelve months ended December 31, 2018, respectively, and $235 million and $883 million for the three and twelve months ended December 30, 2017, respectively Fourth quarter 2018 net earnings attributable to common stockholders and net earnings per diluted share are not directly comparable to 2017 results given the impact on 2017 from the U.S. Tax Cut and Jobs Act. However, fourth quarter 2017 EBITDA and adjusted EBITDA were not affected by the legislation, and are comparable to 2018 results See appendix for reconciliation of EBITDA and adjusted EBITDA Includes the cost of natural gas and related transportation that is included in cost of sales during the period under the first-in, first-out inventory cost method Includes realized gains and losses on natural gas derivatives settled during the period. Excludes unrealized mark-to-market gains and losses on natural gas derivatives (2) 5 In millions, except percentages, per MMBtu and EPS Q4 2018 Q4 2017 Full year 2018 Full year 2017 Net sales$1,132$1,099$4,429$4,130 Gross margin242143917434 - As percentage of net sales21.4%13.0%20.7%10.5% Net earnings attributable to Net earnings per diluted share(2)0.211.981.241.53 EBITDA(3)3492241,429856 Adjusted EBITDA(3)3412601,403969 Diluted weighted-average common shares Natural gas (per MMBtu): Natural gas costs in cost of sales(4)$3.30$3.11$3.15$3.33 Realized derivatives (gain) loss(5)(0.06)0.130.010.07 Cost of natural gas in cost of sales3.243.243.163.40 Unrealized net mark-to-market (gain) loss on

$1.5B cash from operations; $780M returned to shareholders ($780 million comprised of $280 million cash dividends, $467 million share repurchases, and $33 million of shares repurchased in 2018 which were cash settled in January 2019) Investment to sustain CF Cash & Cash Equivalents ($ millions) and grow the business 2,400 1,497 (422) 2,000 1,600 1,200 units 800 Net cash provided by Share cash activity(1) 400 - 12/31/2017 12/31/2018 (1) Comprised of distributions to noncontrolling interests of $139 million, net of other investing and financing cash activities 6 $810 million invested to sustain and grow the business and $780 million returned to shareholders 835 Cash returned to (388)shareholders CAPEX (280)$500 million of shares Purchase of TNCLP publicly repurchased in 2018 (467)less $33 million cash traded commonCash Dividends settled in January 2019 (93) 682 operating activitiesrepurchasesOther net

Superior capacity utilization compared to North American peers demonstrates significant operational advantage North America Ammonia Percent of Capacity Utilization (1) 4 yr Rolling Avg. Percent of Capacity(4) 100% • CF’s four year rolling average North American capacity utilization of 96% is significantly above the rest of North American producers whose four year rolling average is 86% • CF’s 10% greater capacity utilization yields an additional ~800K tons of ammonia annually(5) 98% 96% CF North America(2) 96% 94% 92% 90% 88% 86% 84% 82% 80% Four Years Ending 2017 Four Years Ending 2018 (1) (2) (3) (4) (5) Data taken from the Dec. 21, 2018 CRU Ammonia Database CF represents CF historical North American production and CRU’s capacity estimates for CF North America Excl. CF is calculated by removing CF’s annual reported production and capacity from the CRU data for all North American ammonia production peer group 4 yr rolling average is used to represent a typical ammonia turnaround cycle ~800k tons represents the difference between CF’s actual trailing 4 yr average ammonia production of 8.2M tons at 96% of capacity utilization and the 7.4M tons CF would have produced if operated at the 86% CRU North American benchmark excluding CF Note: CRU North American peer group includes Agrium, Austin Powder (US Nitrogen), BASF & Yara, Carbonair, CF Industries, Chevron, Coffeeville Resources, Dakota Gasification Co, Dyno Nobel, Incitec Pivot, Honeywell, Koch Industries, LSB Industries, LSB Industries/Cherokee Nitrogen, Mississippi Power, Mosiac, Nutrien, OCI, PotashCorp, RenTech Nitrogen, Sherritt International Corp, Shoreline Chemical, Simplot, Yara, Fortigen 7 86% North America Excl. CF(3)
Capital Allocation • Pursue growth within our strategic fairway, where returns exceed the risk-adjusted cost of capital Consistently return excess cash to shareholders in a timely fashion through dividends and share repurchases • • Repurchased 10.9 million shares for $500 million completing the share repurchase program authorized by the board of directors in August 2018 Subsequent to the end of the quarter, the Board of Directors authorized a new $1 billion share repurchase program through 2021 Purchased all publicly traded common units of Terra Nitrogen Company, L.P. (previous ticker: TNH) for $388 million on April 2, 2018 • • • Committed to repay remaining $500 million of notes due May 2020 on or before maturity date Commitment to investment grade metrics over the long term Long-term target gross debt: $4.0-4.5 billion, laddered maturities, cash interest expense < $200 million annually Target cash on balance sheet: $300-500 million, which along with $750 million undrawn revolver provides adequate liquidity Dividend: $1.20 per share annually 2019 capex expected to be approximately $400-450 million • • • • • 8 Capital Structure & Fixed Charges Capital allocation highlights Philosophy remains unchanged

Completion of share repurchase authorization drives per share nitrogen participation ~5% higher in 2018 CF Industries’ Nitrogen Volumes and Shares Outstanding as of Year-end 2009 – 2018 Nitrogen per share CAGR: 14.7% Million shares Outstanding (6) Annual Nitrogen Equivalent Tons per 1,000 Shares Outstanding 40 400 35 350 30 300 25 250 20 200 17 15 150 10 100 5 50 0 0 2009 2010 2011 2012 2013 2014 2015 2016 2017 2018 Production Capacity (M nutrient tons) All N production numbers based on year end figures per 10-K filings. (4) Beginning in 2016 excludes nitrogen equivalent of 1.1 million tons of urea and 0.58 million tons of UAN under CHS supply agreement and includes expansion project capacity at Donaldsonville and Port Neal; Beginning in 2018 includes incremental 15% of Verdigris production to reflect CF’s acquisition of publicly traded TNH units; Share count based on end of year shares outstanding per 10-K filings. Share count prior to 2015 based on 5-for-1 split-(1) (2) (3) Beginning in 2010 includes capacity from Terra Industries acquisition; Beginning in 2013 includes incremental 34% of Medicine Hat production to reflect CF acquisition of Viterra's interests; Beginning in 2015 includes incremental 50% interest in CF Fertilisers UK acquired from Yara; (5) (6) adjusted shares 9 (1) (2) (3) (4) (5) 2.6 6.0 6.0 6.1 6.6 6.6 7.0 8.1 8.1 8.2 37 3535 30 27 24 1819 11

CF EBITDA sensitivity table Table illustrates the resiliency of CF Industries’ business model across a broad range of industry conditions EBITDA Sensitivity to Natural Gas and Urea Prices(1)(2) $ billions CF Realized North American Natural Gas Cost ($/MMBtu) Source: CF Industries (1) The table was created by using 2018 adjusted EBITDA of $1,403 million, 2018 sales volumes of approximately 19.3 million product tons and gas consumption of approximately 340 million MMBtus. Changes in product prices and gas costs were not applied to the CHS minority interest or industrial contracts where CF Industries’ is naturally hedged against changes in product prices and gas costs. While the table above presents CF’s realized North American natural gas cost, CF Fertilisers UK’s gas cost and volumes were included in the analysis. As with North America, CF Fertilisers UK’s gas cost was sensitized in $0.25/MMBtu increments. See appendix for 2018 EBITDA reconciliation. Assumes that a $25 per ton change in urea price is equivalent to a $17.39 per ton change in UAN price, $18.47 per ton change in AN price, a $44.57 per ton change in ammonia price, and a $10.60 per ton change in the price of the Other segment. (2) (3) $25/ton urea equivalent movement implies ~$350M change in EBITDA on an annual basis 10 CF Realized Urea Equivalent Price ($/ton)(3) $2.50 $2.75 $3.00 $3.25 $3.50 $175 0.5 0.4 0.3 0.3 0.2 $200 0.8 0.8 0.7 0.6 0.6 $225 1.2 1.1 1.0 1.0 0.9 $250 1.5 1.5 1.4 1.3 1.3 $275 1.9 1.8 1.8 1.7 1.6 $300 2.2 2.2 2.1 2.0 2.0 $325 2.6 2.5 2.5 2.4 2.3 $350 2.9 2.9 2.8 2.7 2.7 $375 3.3 3.2 3.2 3.1 3.0

2019 Planning Assumptions compared to 2018 increase by 3.5 million tons during 2019 up delays given sanctions Sources: Fertecon, CRU, CFMW, Baiinfo, Fert.cn, Industry Publications, CF analysis 11 2019 CF Market Assumptions •North American corn acres planted expected to increase by 4 million to approximately 93 million acres •North American wheat acres planted expected to increase by 1 million •CF projects net global urea capacity to •Lordegan Petrochemical’s plant in Iran (1.2 million metric tons urea) is at risk of start-•Chinese exports likely 2-3 million metric tons in 2019 2019 CF Planning Assumptions •Capital expenditures in 2019 expected to be between $400 - $450 million •GAAP depreciation and amortization expected to be approximately $875 million •Interest expense of ~$230 million at current debt levels •~20% of CF’s natural gas purchases relate to sales under agreements which price products on a gas plus basis, including: •Mosaic ammonia •Orica and Nelson Brothers AN •CHS UAN and urea •2019 natural gas costs expected to be below 2018

Global market overview • Global nitrogen prices reached in-year highs early in Q4 2018 then declined due to seasonally low demand in the Northern Hemisphere and moderating energy prices in Asia and Europe As demand in the Northern Hemisphere materializes, industry fundamentals should be supportive of global nitrogen prices in the first half of 2019 • • Strong North American nitrogen demand in 1H 2019 driven by a projected 4 million acre increase in corn planting and 1 million acre increase in wheat planting compared to 2018 Limited fall ammonia applications in 2018 suggest a nitrogen deficit to be made up in 1H 2019 by application of ammonia or upgraded products CF projects net global urea capacity to increase by 3.5 million tons during 2019; 1.2 million metric tons are at risk of delay due to US Iranian sanctions Urea from Iranian producers is available at a significant discount to global prices with few regions open to purchasing from Iran due to sanctions China exported ~2.4 million metric tons in 2018; published reports suggest this volume may include re-exports of Iranian material • • • • • Longer-term, industry and energy market fundamentals are expected to continue to support the global nitrogen cost curve at higher levels Net global urea supply growth through 2022 is projected to fall short of the historical nitrogen demand annual growth rate of ~2%, further tightening the global supply/demand balance • 12 Outlook Nitrogen Supply and Demand Nitrogen Pricing

Expected net new urea capacity additions below historic global demand growth of ~2% through 2022 CF Projected Global Net Urea Capacity Additions(1) Thousand Product Metric Tons 5,000 4,500 4,000 3,500 3,000 2,500 2,000 1,500 1,000 2019 2020 2021 2022 (1)See appendix for details of the 2019-2022 projected additions and assumed closures Note: Since prior quarter the expected startup of the SOCAR plant in Azerbaijan has moved to 2019 13 Lordegan Petrochemical’s plant in Iran is at risk of start-up delays given sanctions 2% Growth

DEF loading at Donaldsonville Appendix 14

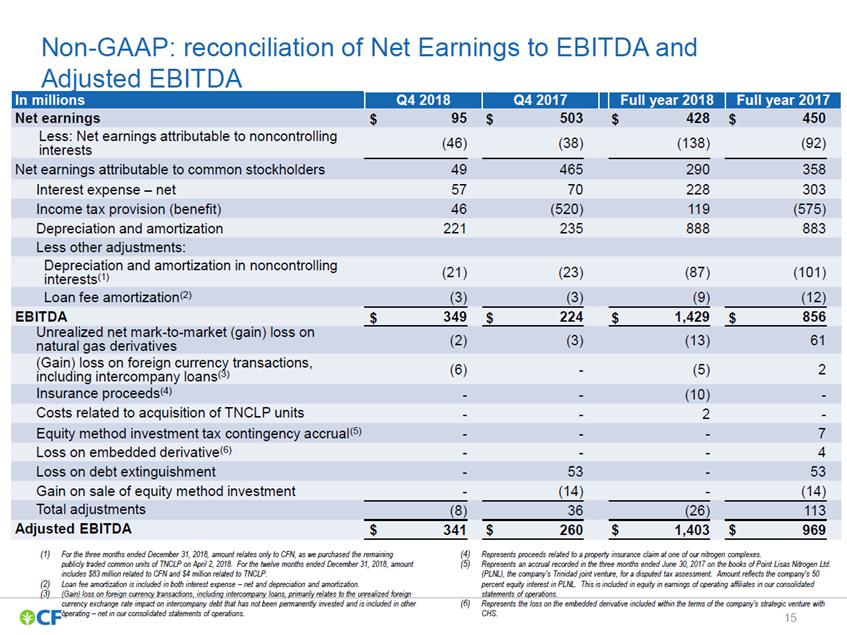
Non-GAAP: reconciliation of Net Earnings to EBITDA and Adjusted EBITDA (46) (38) (138) (92) interests (21) (23) (87) (101) interests(1) (2) (3) (13) 61 natural gas derivatives (6) - (5) 2 including intercompany loans(3) (1) (4) (5) For the three months ended December 31, 2018, amount relates only to CFN, as we purchased the remaining publicly traded common units of TNCLP on April 2, 2018. For the twelve months ended December 31, 2018, amount includes $83 million related to CFN and $4 million related to TNCLP. Loan fee amortization is included in both interest expense – net and depreciation and amortization. Represents proceeds related to a property insurance claim at one of our nitrogen complexes. Represents an accrual recorded in the three months ended June 30, 2017 on the books of Point Lisas Nitrogen Ltd. (PLNL), the company’s Trinidad joint venture, for a disputed tax assessment. Amount reflects the company’s 50 percent equity interest in PLNL. This is included in equity in earnings of operating affiliates in our consolidated (2) (3) (Gain) loss on foreign currency transactions, including intercompany loans, primarily relates to the unrealized foreign statements of operations. (6) Represents the loss on the embedded derivative included within the terms of the company’s strategic venture with currency exchange rate impact on intercompany debt that has not been permanently invested and is included in other operating – net in our consolidated statements of operations. CHS. 15 In millions Q4 2018 Q4 2017 Full year 2018 Full year 2017 Net earnings$95$503$428$450 Less: Net earnings attributable to noncontrolling Net earnings attributable to common stockholders49465290358 Interest expense – net5770228303 Income tax provision (benefit)46(520)119(575) Depreciation and amortization221235888883 Less other adjustments: Depreciation and amortization in noncontrolling Loan fee amortization(2)(3)(3)(9)(12) EBITDA$349$224$1,429$856 Unrealized net mark-to-market (gain) loss on (Gain) loss on foreign currency transactions, Insurance proceeds(4)--(10)-Costs related to acquisition of TNCLP units--2-Equity method investment tax contingency accrual(5)---7 Loss on embedded derivative(6)---4 Loss on debt extinguishment-53-53 Gain on sale of equity method investment-(14)-(14) Total adjustments(8)36(26)113 Adjusted EBITDA$341$260$1,403$969
Projected new global urea plants (2019-2022) Russia Russia China PJSC Metafrax TogliattiAzot Xiaoyi Nongmei Perm Togliatti Shanxi Natural Gas Natural Gas Coke-oven gas 580 730 300 2022 2022 2022 2,900 Subtotal 20,600 Grand Total Urea plants in permanent shutdown Brazil Brazil China China China China Petrobras S.A. (Camacari) Petrobras S.A. (Laranjeiras) Shaanxi Weihe Coal Chemical Corp Group Ltd Yangmei Shijiazhuang Zhengyuan Fertilizer Hebei Jinghua Chemical Yangmei Shenzhou Fertilizer Natural Gas Natural Gas Thermal Anthracite Lump Anthracite Lump Anthracite Lump CRU CRU Fert.cn Local Media Local Media Local Media Mar, 2018 Mar, 2018 Mar, 2018 Jan, 2018 Jan, 2018 Jan, 2018 500 600 580 600 350 300 2019 2019 2019 2019 2019 2019 (1) (2) Subtotals rounded to nearest 100k Timing of start updated since last forecast from 2018 to 2019 (3) Methodology updated to include additional assumed closures due to modeled negative profitability Sources: Fertecon, CRU, CFMW, Baiinfo, Fert.cn, Industry Publications, CF analysis 16 ChinaAdditional assumed closures due to negative profits(3)2,6202019 5,6002019 total 4,500China Total Country Company Feedstock Source Initial Report of Shutdown Capacity – K Metric Product Tons Year of Assumed Closure BruneiBrunei Fertilizer IndustriesSungai LiangNatural Gas1,2902022 Country Company City/Province Feedstock Capacity – K Metric Product Tons(1) Year of Addition Azerbaijan(2) Azerkimya (SOCAR) Sumgayit Natural Gas 660 2019 Iran Lordegan Petrochemical Lordegan Natural Gas 1,200 2019 China Yili Resource Inner Mongolia Anthracite powder 1,040 2019 China JAMG Jiangsu Thermal 520 2019 China Wulan Coal Group Inner Mongolia Thermal 1,200 2019 China Sha’anxi Heimao Coking Co. Sha’anxi Coke-oven gas 480 2019 China China National Petroleum Co. Ningxia Natural Gas 800 2019 Russia Acron Veliky Novgorod Natural Gas 210 2019 Turkmenistan Turkmenhimiya Garabogaz Natural Gas 1,160 2019 India Chambal Fertilizers Kota Natural Gas 1,340 2019 Egypt Egyptian Chemical Industries (KIMA) Aswan Natural Gas 520 2019 9,100 Subtotal India Ramagundam Andhra Pradesh Natural Gas 1,270 2020 China Qitaihe Longpeng Heilongjiang Coke-oven gas 300 2020 Uzbekistan JSC Navoiazot Navoi Natural Gas 580 2020 2,200 Subtotal China Henan Xin Lian Xin (XLX) Jiangxi Anthracite powder 600 2021 Kazakhstan Kazazot Kazazot Natural Gas 830 2021 Nigeria Dangote Group Edo State Natural Gas 1,270 2021 2,700 Subtotal
